UNITED STATES
SECURITIES AND EXCHANGE COMMISSION
Washington, D.C. 20549
FORM N-CSR
CERTIFIED SHAREHOLDER REPORT OF REGISTERED
MANAGEMENT INVESTMENT COMPANIES
|
Investment Company Act File number: 811-10405 |
|
|
Alpine Series Trust |
|
(Exact name of registrant as specified in charter) |
|
2500 Westchester Avenue, Suite 215 |
Purchase, New York 10577 |
|
(Address of principal executive offices)(Zip code) |
|
|
(Name and Address of Agent for | Copy to: |
|
|
Samuel A. Lieber | Rose DiMartino |
Alpine Woods Capital Investors, LLC | Attorney at Law |
2500 Westchester Avenue, Suite 215 | Willkie Farr & Gallagher |
Purchase, New York 10577 | 787 7th Avenue, 40th Floor |
| New York, New York 10019 |
Registrant’s telephone number, including area code: (914) 251-0880
Date of fiscal year end: October 31, 2012
Date of reporting period: November 1, 2011 – October 31, 2012
Item 1: Shareholder Report

Equity & Income Funds
Alpine Dynamic Dividend Fund
Alpine Transformations Fund
Institutional Class (ADVDX)
Institutional Class (ADTRX)
Class A (ADAVX)
Class A (ADATX)
Alpine Accelerating Dividend Fund
Alpine Foundation Fund
Institutional Class (AADDX)
Institutional Class (ADBYX)
Class A (AAADX)
Class A (ADABX)
Alpine Financial Services Fund
Alpine Ultra Short Tax Optimized Income Fund
Institutional Class (ADFSX)
Institutional Class (ATOIX)
Class A (ADAFX)
Class A (ATOAX)
Alpine Innovators Fund
Alpine Municipal Money Market Fund
Institutional Class (ADINX)
Investor Class (AMUXX)
Class A (ADIAX)
October 31,
2012
Annual Report
|
TABLE OF CONTENTS |
|
|
|
|
| |
|
|
|
9 |
| |
|
|
|
15 |
| |
|
|
|
20 |
| |
|
|
|
26 |
| |
|
|
|
30 |
| |
|
|
|
34 |
| |
|
|
|
|
| |
|
|
|
39 |
| |
|
|
|
42 |
| |
|
|
|
48 |
| |
|
|
|
76 |
| |
|
|
|
79 |
| |
|
|
|
82 |
| |
|
|
|
89 |
| |
|
|
|
104 |
| |
|
|
|
121 |
| |
|
|
|
122 |
| |
|
|
|
126 |
| |
Additional Alpine Funds are offered in the Alpine Equity Trust. These funds include:
|
|
Alpine International Real Estate Equity Fund | Alpine Global Infrastructure Fund |
|
|
Alpine Realty Income & Growth Fund | Alpine Global Consumer Growth Fund |
|
|
Alpine Cyclical Advantage Property Fund |
|
|
|
Alpine Emerging Markets Real Estate Fund |
|
Alpine’s Real Estate Funds’ investment objectives, risks, charges and expenses must be considered carefully before investing in funds of the Alpine Series Trust and Alpine Income Trust. The statutory and summary prospectuses contain this and other important information about the investment company, and it may be obtained by calling 1-888-785-5578, or visiting www.alpinefunds.com. Read it carefully before investing.
Mutual fund investing involves risk. Principal loss is possible.
|
|
| Alpine’s Investment Outlook |
| |
|
|
|
|
|
|
|
|
|
|
|
|

Dear Investors:
Two thousand and twelve has been a difficult and complex year for investors, although it has provided mostly positive returns in the capital markets. We are looking forward to 2013 with increased confidence, even though it will likely bring forth new challenges. Five years after the peak of the debt-fueled coda to the post-cold war expansion, the developed economies of the world are finally beginning to address economic imbalances derived from societal priorities and economic constructs which were set during the prior two generations. This contrasts with many emerging market countries which are just now tackling issues of social equity, government services and personal choice, making them relatively unburdened by both such history and debt.
Central bankers around the world have stabilized the global economy and now politicians and policy makers must come to grips with the realities of a rapidly globalized world, via instant communication, next-day delivery and ‘just in time’ production. Whether you are in Stockholm or Sydney, Saskatoon or Sao Paolo, we are now interconnected at unprecedented levels with consequences we may not fully understand. Our rapidly evolving world can be both exciting and scary, as well as profitable and problematic, but at Alpine we believe one can now look ahead with greater clarity to navigate both potential difficulties as well as opportunities.
Where Are We Now?
We still have to get past the “fiscal cliff”, which we hope will be concluded by the time you read this letter. This point in time signifies a potential crossroads, perhaps substantive, representing the country’s hope that our government can build upon mutual interests and address significant challenges thorough compromise. So, if the “fiscal cliff” has not been bridged by the time you read this, the stock markets may suffer more disappointment and volatility, and deeper questions could arise concerning our political process. However, we are confident that politicians realize that this era of political polarization has been costly to the economy and to their party, and if continued, will be costly to their careers. In
similar fashion, we believe the game of ‘chicken’ that is playing out in European capitals between the ‘haves’ and the ‘have nots’ will result in a Eurozone where mutual fiscal responsibility will be rewarded with financial stability. The cost, however, has already been high in terms of unemployment and the earning power of the EU as a whole. We believe that the visible risks to economic and political stability, played out in both the media and the markets over the past few years, are finally in the process of being addressed. That is not to say that we can sound the “all-clear” and achieve “smooth sailing” in future years, since many structural problems remain, and no agreements have been finalized. Nonetheless, we are optimistic that the next five years have the potential to land most of us in a better place than we are today.
Since the depths of the “Global Financial Crisis” of late 2008 into early 2009, markets and individuals have continued to focus on jobs and debt. In the U.S., unemployment in 2009 rose above 10%, approaching the peak of the 1982 recession. Today, unemployment is 7.7% and has averaged 8.2% over the past five years, similar to the 8.4% average over five years ended April, 1985. However, in the context of the prior period of ten years, from October, 1997, to October, 2007, the average unemployment rate was 4.9% compared to 6.3% over the period from 1970 to 1980, which makes this recovery feel muted. There is another contextual explanation for this weak recovery. The Federal Reserve engineered the 1980/1982 downturn, pushing 10-Year Treasury bonds to 15.84% in September, 1981. Within a year, the yield was down by almost one-third to 11% and the seeds of recovery were sown, falling to 7.51% by year five, even though the average over that period was 11.30%. From the recent peak of 5.30%, in June, 2007, rates declined by one-fifth to 4.27% in a year and to 1.69% by October 31, 2002, averaging 3.14% over this period. Notably, this level represents a proportionately greater decline than the 1981-1986 period, but the comparative impact on borrowers, lenders and savers, has been weak. As measured by GDP, the 1981-86 period produced an average of 3.4% annual growth while the past five years average is 0.7%.
1
|
Hurricane Sandy And The “Big Easy”
Hurricane Sandy hammered the northeast coast of the U.S. about seven years after Hurricane Katrina devastated New Orleans and the Gulf Coast. The surging flood waters of both Sandy and Katrina laid bare the weaknesses of our infrastructure as well as our helplessness before Mother Nature’s fury. However, large differences in the geography, existing infrastructure, the scale of the storms as well as our capacity to cope with the disasters, suggest different legacies. Sandy affected roughly 60 million people, with 8.5 million losing power, compared to about three million with Katrina. However, Sandy damaged about 305,000 homes while Katrina damaged about 1.2 million. To date, Sandy has left behind a repair bill in excess of $60 billion in New York and New Jersey alone, with total costs expected to exceed $100 billion across 16 states, compared with $125 billion for Katrina. Fundamentally, our preparedness and ability to react to the storm was decidedly different. For Sandy, pre-storm warnings and preparation were effective, and FEMA’s strong and immediate post-storm response won praise from most corners. Further, President Obama, Governors Christie (NJ) and Cuomo (NY) and NYC Mayor Bloomberg provided encouraging messages that the repairs and rebuilding will swiftly commence, so consumer confidence remains quite strong. In contrast, when Katrina struck, the slower and less adequate response caused confidence to plummet as some people questioned our government’s ability to care for and protect its citizens. In 2005, our economy was still booming, while now it is certainly weaker. Our financial situation poses constraints well beyond typical concerns over the viability and costs of building defenses against the next great potential storm. We should take heart and gain confidence as initial discussion from government officials on reconstruction efforts is not centered on band-aid-like solutions, but on investing in R&D, technical capabilities and physical infrastructure which may yield unforeseen future returns on investment.
In a similar fashion, there has been much debate over where and how much to spend on repairing and building new defenses against the next financial storm that may hit our economy. The relative effectiveness of stimulus packages since 2008 – whether they were too small or properly apportioned – have been difficult to measure in a vacuum. Unfortunately, polarized politics intruded upon what should have been a bipartisan discussion of how to design and allocate support for growing better jobs and the economy. Meanwhile, America has spent over $1.4 trillion on wars since 2001, raising our debt and starving the government of much needed funds. As a result, we are now experiencing the slowest recovery to prior peak levels of wealth since the Great Depression.
To date, the main job of stabilizing the economy has fallen on the Federal Reserve, since neither Wall Street, the public sector, nor academia have come up with a plan to restructure or replace the broken credit delivery mechanisms which have carried over from the prior period. The goal of new lending should be to stimulate growth of the money supply, which could fuel both transaction volumes and new investment. So far, however, neither banks nor corporations are taking the plunge as monetary velocity (Gross Domestic Product ÷ Money Supply) remains at 50 year lows of 1.55 which compares with 1.91 in 2007, according to Bloomberg.
Wall Street’s securitization machine can no longer practice the alchemy of utilizing short- and medium-term funding for long term assets, or a pooling of mixed-quality assets, to create a higher rating or valuation in aggregate than if valued individually. Perhaps a basic flaw in the system was that the credit delivery mechanism had also become the hub of the debt capital creation process. In its place, central bankers from around the world have sought to create debt capacity by reducing interest rates and acquiring illiquid assets or poorly performing debt of countries, corporations and even the equities of REITs (e.g., Japan), in order to provide liquidity to the marketplace. These actions by central banks also instilled confidence that there would be a bid, if not an explicit floor, underneath asset prices. Indeed, these measures, known broadly as quantitative easing (QE), have lifted equity valuations as well as high-yield bond prices in the U.S., Europe, England and Japan as central bankers seek to stave off deflationary impulses. With a nod to New Orleans, which was stabilized after Katrina by the funding of major repairs and has further benefited from direct investment to resume growth, we refer to this global action by central bankers as ‘the Big Easy.’ Liquidity continues to flow from the B.O.E. (England), B.O.J. (Japan), E.C.B. (European Central Bank), and Federal Reserve through both domestic banking systems and capital markets. It is Alpine’s view that ‘the Big Easy’ is buying time for the world’s developed economies to redesign the domestic economic and societal priorities which have been shaped by the political debate and policy initiatives over the past many years.
Next Gen Mods Needed
What worked in the 1950’s, 1960’s and 1970’s, when our structures, mechanisms or policies were put in place, may no longer be essential, desirable or viable. Prioritization is often motivated by expediency, which in this case is driven by budget constraints. The reduction in tax receipts due to reduced investment, asset deflation and unemployment hit at the same time as a rise in payouts for food relief, unemployment insurance and healthcare
2
|
costs, are exacerbating the problem. This has impacted American, European and Japanese economies alike over the past few years. For these reasons, we think that political pressures are combining with the deadline of elections, like the one we just experienced, to make governments accountable for their actions, (or lack thereof), as we prepare for the future knowing that we can no longer push these issues down the road.
Hopefully, the challenges we’re facing will provoke an honest and fundamental debate over the nature and scope of government activities, including healthcare, entitlements and pensions as well as may be what the trade-offs or benefits of budgetary actions. Europe and Japan will face the same issues – to promote competitive cost structures through labor reform and cost savings as well as to make focused investments in essential services and infrastructure. This should be considered in terms of who pays and who provides, be it from the household sector, the business sector or by way of government control or supervision. Alpine believes that the most competitive options may offer a combination of corporate and individual entrepreneurship in partnership with differing levels of cooperation and control. Furthermore, if there is to be either austerity or stimulus for any country, then it should be decided after conducting an honest debate to reset priorities and voters’ expectations.
Debt Deleveraging
Fiscal austerity or stimulus should not be considered in absolute terms. Rather, either approach should be considered relative to debt and equity levels, projected income and asset growth, the expected duration and velocity, as well as competitive factors. However, in a case like Greece – where the lender wants either to exit or reduce exposure – austerity may be the only mechanism to deleverage immediately and severely, accepting the impact of high unemployment (23.6% for Greece as of 09/30/2012) business failures and a collapse in standards of living.
Few countries have high debt-to-GDP levels like Greece, so some latitude exists as to how severe or protracted or even delayed the course of deleveraging could take. Countries capable of 4% to 6% GDP growth might be able to outgrow debt to GDP levels that are over 75%. Demographics are also a factor as countries with aging populations, like Japan, may face costs rising faster than income, which could deplete accumulated wealth over time. This is especially worrisome if those countries (like Japan) must finance very high deficits.
Greek sovereign debt solvency was the great market fear for the past three years. Now that the ECB, with backing from Germany, has been able to reassure markets that Greece will not be forced out of the EU currency, the entire region has been forced to reassess issues of national sovereignty, in light of budgetary restraints, social contracts and economic progress. These weak economies have put some pressure on European corporate earnings, which may decline further as the regional recession lingers. Fortunately, many companies have reduced debt levels like their American counterparts. Nevertheless, Alpine expects more European companies will belatedly follow the U.S. lead from 2009-2012 by issuing more equity to deleverage, as well as for selective mergers and acquisitions.
Across much of the globe, household deleveraging has been accomplished, although the U.S. still lags for structural reasons. U.S. household debt as a percentage of personal income has fallen from over 114% in September, 2009 to 97% this past June. This compares with the pre-2000 (Y2K) level of under 79%, putting us halfway there. If the declining trend in personal income actually improves, complete recovery should hasten.
In Europe and Australia, most home mortgages pay floating interest rates, so if rates fall by half, then so does the monthly carrying cost, adding to disposable income or to savings. In the U.S., fixed-rate mortgages require a refinancing process to capture lower rates. Unfortunately, some 12 million homes have mortgages that are worth more than their depreciated values, so people cannot refinance without paying down the mortgage. This ‘negative equity’ is constraining consumption and jobs mobility. Indeed this situation heightens the economic and social importance of the nascent housing recovery.
It is worth noting that total existing home sales in the U.S. are still 33% (according to National Association of Realtors) below the September, 2005 peak (just after Katrina!). National median home prices fell by over 59% when measured by a less volatile 12-month moving average, and have only recovered by 8.6% this year. although some markets such as Phoenix and parts of Southern California, are up over +20% year-over-year, in part due to aggressive institutional investors seeking to accumulate rental homes. New home sales have grown nicely off a much lower volume level, with total sales still -73% below the July, 2005 peak, as builders’ new home prices could not compete with foreclosed inventory over the past few years. Alpine believes that the
3
|
strengthening home sales market will draw more housing investment once stringent mortgage lending rules are eased, permitting entry level buyers back into the market.
Similarly, car sales have been improving. Manufacturers are projecting continued strong demand based on the historically high average age of automobiles – over 11 years old – on the road. This pattern of slowly strengthening consumption and a slowly improving jobs market should reinforce one another, although high student loan debt, and higher unemployment for those under 25, could limit the buying patterns of this important demographic in the U.S.
Your Choice: Deflation Or Inflation
The mood of the marketplace is generally influenced by bouts of excess exuberance or pervasive pessimism, typically occurring at peaks or troughs in market sentiment. If mutual fund flows are to be a guide as to market sentiment, then it is clear that the extreme risk-off mentality from 2008 through this year has continued, albeit in more muted fashion. Equity funds continued to suffer redemptions, while bond funds continued to see strong flows, although it should be noted that high-yield bonds (formerly known as “junk bonds”) have received the lion’s share of new fund flows. This pattern of reduced risk aversion is in contrast to the decade from 1996 through 2006, when approximately $1.5 trillion flowed into equity mutual funds, roughly six times the amount that was invested in bond funds. Over the last five years, approximately $400 billion has been redeemed from equity funds, while $750 billion has flowed into bond funds. Given the historic low level of bond yields and the main monetary focus of central banks on what Alpine refers to as ‘the Big Easy’, this trend could last a bit longer, until the weight of money tips the scales too far. Since quantitative easing competitively reduces yield and theoretically crowds investors out of the bond market, investor sentiment may, at a point, dramatically shift new allocations back towards equities.
While the depressive conditions will likely affect one-third (Europe and Japan) of the global economy for possibly several years, another quarter (the U.S.) of the global economy appears on the mend. Meanwhile, much of the rest of the world is increasingly focused on domestic economic issues. Food and energy are among the most basic economic needs, which are now cheaper as a result of the slow global economy.
The cyclical supply and demand imbalance of energy and resources has had a negative effect on producers of these resources. Thus, the GDP growth of major energy and
resource suppliers such as Brazil, Indonesia, Norway, Russia, Saudi Arabia, South Africa, Australia and North America have progressively slowed as the year has unfolded. On the other hand, this has been a benefit for consuming countries such as Japan, China, India, most of Europe, as well as the U.S. Since the U.S. and China will likely remain the dominant drivers of global economic activity over the next few years, we would expect this current energy pricing benefit to translate into near-term growth, which could produce a gradual expansion of demand for energy and resources. Thus, we believe the recent decline is near a cyclical trough, although growth similar to that achieved in 2005-2007 may be several years delayed.
Instead of commodities, the key future driver of emerging economies is the trend of rising global household wealth, whether measured in GDP or in household income. We believe the past decade’s trend should continue, with rising growth on the margin in Latin America, the ASEAN countries, and even Africa. Alpine sees a continued expansion and ascension of the middle class population across the world. As wages rise in tandem with both increased productivity and favorable demographics, supported by the traditional pattern of low cost production fueling industrialization, we expect greater need for new infrastructure as urbanization expands both scale and capacity. From there, basic production begins to shift toward value-added products, stimulating more middle class service jobs, supporting a growing pattern of domestic consumption. This pattern of urbanization and consumption promotes higher incomes and prices (inflation). Such a combination of enhanced productivity and supportive demographic characteristics are most prevalent in countries such as China and Brazil, while it is already relatively mature in countries such as Singapore, Hong Kong, the Czech Republic and Turkey, where per capita GDP is notably higher. In light of these trends, Alpine continues to expect the strongest GDP growth, corporate earnings growth and asset appreciation to come from the emerging markets.
Looking To The Future
We believe that the period of 2009 to 2012 has effectively been a period of diminishing uncertainty and gradual stabilization after the shock of 2008. Belatedly, this period has highlighted and accelerated the identification of economic weaknesses and some discussion of measures to improve upon the existing policies, protocols and mechanisms which organize our economic activity. In our view, it appears that 2013 and beyond will continue this period of transition. Over the next few years, we expect
4
|
the current concerns over areas of visible risk to abate as political pragmatism should lead to reform. However, there will always be unchartered problems to confront, be they in the South China Sea or Antarctic Waters, continuing conflicts in the Middle East or Africa, and we can’t yet turn our back on (Eastern) European country debt. Nonetheless, individual investors could become more risk tolerant over the next few years, and institutional investors seeking higher portfolio returns may well be forced to shift the emphasis of new investments towards both public and private equities, as well as alternative categories and emerging markets. By 2016 through the end of the decade, we may well see signs of underlying inflation because reduced levels of capital spending over the past few years may create supply shortfalls, particularly in the energy and materials sectors. Furthermore, if activity in the developed economies begins to pick up steam, it is possible that the central banks in those countries may seek to shift capital off their balance sheets, effectively recycling money into the public markets. This could keep interest rates relatively high, depending on market conditions. Thus, the potential for a steeper yield curve and continued low short-term interest rates fueling the possibility of longer-term inflation might favor an array of investments including real estate, infrastructure and banks. Alpine also believes that alternative technologies – particularly in the fields of energy, healthcare, communications and transport, as well as pollution abatement and recycling – may attract investors. However, areas such as basic science and education may not provide the potential near-term
earning power to attract private investment. Thus, there may be a role for public-private partnerships (PPP) which combine government oversight and sanctioning with private funding and entrepreneurship. We believe this could include sectors which may be deemed of national interest, such as infrastructure and security, which require significant capital outlays and oversight.
In summary, we believe that the global economy is still at the early stages of reallocating priorities, redirecting capital flows and reorienting our priorities in a manner that is conducive to job creation and economic inclusion of a broader segment of society. Investing for the future should be a national priority, from which we all have the potential to benefit as well as participate.
We wish to welcome Eleanor Hoagland to the Alpine Funds’ Board of Trustees. Eleanor was appointed to the Board in October, 2012 and has had a distinguished career in the investment business, including previously serving as the Chief Compliance Officer of the River Source Mutual Funds. She also is well-versed in risk management, having led such an effort for the Seligman Fund group. We look forward to her contributing to the betterment of shareholders.
Sincerely,

Samuel A. Lieber
President
|
|
| |
|
|
Past performance is not a guarantee of future results. The specific market, sector or investment conditions that contribute to a Fund’s performance may not be replicated in future periods. | |
Mutual fund investing involves risk. Principal loss is possible. Please refer to the individual fund letters for risks specific to each fund.
The President’s Letter and those that follow represent the opinion of the Funds’ management and are subject to change, are not guaranteed, and should not be considered investment advice. The information provided is not intended to be a forecast of future events. Views expressed may vary from those of the firm as a whole.
Please refer to the schedule of investments for Fund holding information. Fund holdings and sector allocations are subject to change and should not be considered a recommendation to buy or sell any security. Current and future portfolio holdings are subject to risk. References to other funds should not be interpreted as an offer of these securities.
5
|
|
Disclosures and Definitions |
|

Disclosure
Please refer to the schedule of investments for each fund’s holding information. Fund holdings and sector allocations are subject to change and should not be considered a recommendation to buy or sell any security. Current and future portfolio holdings are subject to risk.
Favorable tax treatment of Fund distributions may be adversely affected, changed or repealed by future changes in tax laws. Alpine may not be able to anticipate the level of dividends that companies will pay in any given timeframe.
A portion of the Fund’s distributions may be comprised of return of capital or short-term or long-term capital gains. To the extent that the distribution is from a source other than net investment income, a 19a-1 notice will be provided and is available on our website.
Neither the Fund nor any of its representatives may give tax advice. Investors should consult their tax advisor for information concerning their particular situation.
Diversification does not assure a profit or protect against loss in a declining market.
Must be preceded or accompanied by a prospectus.
Quasar Distributors, LLC, distributor.
Definitions
A Basis Point is a value equaling one one-hundredth of a percent (1/100 of 1%).
ASEAN is the Association of Southeast Nations which includes Indonesia, Malaysia, the Philippines, Singapore, Thailand, Brunei, Burma (Myanmar), Cambodia, Laos and Vietnam.
Beta – Beta measures the sensitivity of the investment to the movements of its benchmark. A beta higher than 1.0 indicates the investment has been more volatile than the benchmark and a beta of less than 1.0 indicates that the investment has been less volatile than the benchmark.
Book value is the net asset value of a company, calculated by subtracting total liabilities from total assets.
Cash flow measures the cash generating capability of a company by adding non-cash charges (e.g. depreciation) and interest expense to pretax income.
Dividend Yield (Funds) represents the trailing 12-month dividend yield aggregating all income distributions per share over the past year, divided by the period ending fund share price. It does not reflect capital gains distributions.
Dividend Yield (Companies) The yield a company pays out to its shareholders in the form of dividends. It is calculated by taking the amount of dividends paid per share over a specific period of time and dividing by the stock’s price.
Earnings or Earnings Per Share Growth is a measure of a company’s net income over a specific period, generally one year, is a key indicator for measuring a company’s success, and the driving force behind stock price appreciation.
Free cash flow is a measure of financial performance calculated as operating cash flow minus capital expenditures. Free cash flow (FCF) represents the cash that a company is able to generate after laying out the money required to maintain or expand its asset base. Free cash flow is important because it allows a company to pursue opportunities that enhance shareholder value.
Long Term Refinancing Operations, or LTRO – The European Central Bank’s long-term refinancing operation is a process by which the ECB provides financing to eurozone banks. The stated aim of the LTRO is to maintain a cushion of liquidity for banks holding illiquid assets, and thus prevent interbank lending and other loan origination from seizing up as they did in the credit squeeze of 2008.
Price/Earnings Ratio (P/E) is a valuation ratio of a company’s current share price compared to its per-share earnings. Normalized earnings – earnings metric that shows you want earnings look like smoothed out in the long run, taking into account the cyclical changes in an economy or stock.
The Custom Balanced Benchmark reflects an unmanaged portfolio (rebalanced monthly) of 60% of the S&P 500 Index, which is a market capitalization-weighted index of 500 large capitalization stocks commonly used to represent the U.S. equity market, and 40% of the Barclays Capital U.S. Aggregate Bond Index (BCAG), which is a widely recognized, unmanaged index of U.S. dollar-denominated investment-grade fixed income securities. The Fund may, however, invest up to 75% of its total assets in equity securities.
Variable Rate Demand Note (VRDN): A debt instrument that represents borrowed funds that are payable on demand and accrue interest based on a prevailing money market rate, such as the prime rate. The interest rate applicable to the borrowed funds is specified from the outset of the debt, and is typically equal to the specified money market rate plus an extra margin.
Dow Jones Industrial Average – is a price-weighted average of 30 blue-chip stocks that are generally the leaders in their industry.
Each Lipper Average represents a universe of Funds with similar invest objectives.
The NASDAQ Financial-100 Index includes 100 of the largest domestic and international financial securities listed on The NASDAQ Stock Market based on market capitalization. They include companies classified according to the Industry Classification Benchmark as
6
|
|
Disclosures and Definitions (continued) |
|
Financials, which are included within the NASDAQ Bank, NASDAQ Insurance, and NASDAQ Other Finance Indexes.
KBW Bank Index is a modified cap-weighted index consisting of 24 exchange-listed and National Market System stocks, representing national money center banks and leading regional institutions.
The S&P 500® Index is float-adjusted market capitalization-weighted index of 500 common stocks chosen for market size, liquidity, and industry group representation to represent U.S. equity performance.
The STOXX Europe 600 (Price) Index is a broad based capitalization-weighted index of European stocks designed to provide a broad yet liquid representation of companies in the European region. The equities use free float shares in the index calculation. The index was developed with a base value of 100 as of December 31, 1991. This index uses float shares.
BM&F Bovespa Index (IMOBBV) is a total return index weighted by traded volume and is comprised of the most liquid stocks traded on the Sao Paulo Stock Exchange.
Barclays Capital 1 Year Municipal Bond Index is a total return benchmark of BAA3 ratings or better designed to measure returns for tax exempt assets.
The Hang Seng Index is a free-float capitalization-weighted index of selection of companies from the Stock Exchange of Hong Kong. The components of the index are divided into four subindexes: Commerce and Industry, Finance, Utilities and Properties.
Russell 3000® Index measures the performance of the largest 3000 U.S. companies representing approximately 98% of the investable U.S. equity market.
Russell 2000® Growth Index measures the performance of the small-cap growth segment of the U.S. equity universe. It includes those Russell 2000 Index companies with higher price-to-value ratios and higher forecasted growth values
Russell 2000® Value Index measures the performance of small-cap value segment of the U.S. equity universe. It includes those Russell 2000 Index companies with lower price-to-book ratios and lower forecasted growth values.
The S&P MidCap 400® Index is a float-adjusted market capitalization-weighted index of 400 medium-capitalization domestic stocks chosen for market size, liquidity, and industry group representation.
Return on Equity is the amount of net income returned as a percentage of shareholders equity. It measures a corporation’s profitability by revealing how much profit a company generates with the money shareholders have invested.
7

|
|
| Alpine Dynamic Dividend Fund |
|
|
| Alpine Accelerating Dividend Fund |
|
|
| Alpine Financial Services Fund |
|
|
| Alpine Innovators Fund |
|
|
| Alpine Transformations Fund |
|
|
| Alpine Foundation Fund |
|
|
|
|
| |
|
|
|

|
|
|
|
|
|
|
|
|
|
|
|
|
|
Comparative Annualized Returns as of 10/31/12 (unaudited) | |||||||||||||
|
|
|
|
|
|
|
|
|
| ||||
|
| 1 Year |
| 3 Years |
| 5 Years |
| Since Inception |
| ||||
Alpine Dynamic Dividend Fund — Institutional Class |
| 4.46% |
|
| 4.36% |
|
| -9.19% |
|
| 3.19% |
|
|
S&P 500® Index |
| 15.21% |
|
| 13.21% |
|
| 0.36% |
|
| 5.58% |
|
|
Lipper Global Equity Income Funds Average(1) |
| 9.33% |
|
| 7.76% |
|
| -3.73% |
|
| 5.31% |
|
|
Lipper Global Equity Income Funds Ranking(1) |
| 61/62 |
|
| 49/50 |
|
| 31/31 |
|
| 12/12 |
|
|
Gross Expense Ratio: 1.21%(2) |
|
|
|
|
|
|
|
|
|
|
|
|
|
Net Expense Ratio: 1.21%(2) |
|
|
|
|
|
|
|
|
|
|
|
|
|
|
|
|
|
|
| ||
| (1) | The since inception return represents the annualized return for the period beginning 9/25/2003. | |
| (2) | As disclosed in the prospectus dated February 28, 2012. | |
Performance data quoted represents past performance and is not predictive of future results. Investment return and principal value of the Fund fluctuate, so that the shares, when redeemed, may be worth more or less than their original cost. Performance current to the most recent month end may be lower or higher than performance quoted and may be obtained by calling 1-888-785-5578. Performance data shown does not reflect the 1.00% redemption fee imposed on shares held for fewer than 60 days. If it did, total returns would be reduced.
Performance of Class A shares is not shown because this share class commenced operations on December 30, 2011.
The S&P 500® Index is float-adjusted market-capitalization index of 500 common stocks chosen for market size, liquidity and industry group representation to represent U.S. equity performance. The Lipper Global Equity Income Funds Average is an average of funds that by prospectus language and portfolio practice seek relatively high current income and growth of income by investing at least 65% of their portfolio in dividend-paying securities of domestic and foreign companies. Lipper Rankings for the periods shown are based on Fund total returns with dividends and distributions reinvested and do not reflect sales charges. The S&P 500® Index and the Lipper Global Equity Income Funds Average are unmanaged and do not reflect the deduction of direct fees associated with a mutual fund, such as investment adviser fees; however, the Lipper Global Equity Income Funds Average reflects fees charged by the underlying funds. The performance for the Dynamic Dividend Fund reflects the deduction of fees for these value-added services. Investors cannot directly invest in an index.
Expense Ratios reflect the ratios reported in the Fund’s most recent prospectus. The Alpine Dynamic Dividend Fund has a contractual expense waiver that continues through February 28, 2013. Where a Fund’s gross and net expense ratio are the same for the period reported, the contractual expense reimbursement level was not reached as of the end of that period. To the extent the Fund’s expenses were reduced by waivers, the Fund’s total returns were increased. In these cases, in the absence of the expense waivers, the Fund’s total returns would have been lower.
To the extent that the Fund’s historical performance resulted from gains derived from participation in initial public offerings (“IPOs”) and/or Secondary offerings, there is no guarantee that these results can be replicated in future periods or that the Fund will be able to participate to the same degree in IPO/Secondary allocations in the future.
9
|
|
Alpine Dynamic Dividend Fund (continued) |
|
|
|
|
|
|
|
|
|
|
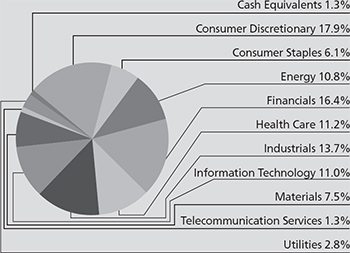
Portfolio Distributions* (unaudited) |
| Top 10 Holdings* (unaudited) |
|
| ||||
|
| 1. |
| Apple, Inc. | 2.72% |
| ||
| 2. |
| QUALCOMM, Inc. | 2.22% |
| |||
3. |
| Ensco PLC-Class A | 2.01% |
| ||||
4. |
| Comcast Corp.-Class A | 2.01% |
| ||||
5. |
| Wynn Resorts, Ltd. | 2.00% |
| ||||
6. |
| Seadrill, Ltd. | 1.98% |
| ||||
7. |
| JPMorgan Chase & Co. | 1.94% |
| ||||
8. |
| Freeport-McMoRan Copper |
|
| ||||
|
| & Gold, Inc. | 1.94% |
| ||||
9. |
| McKesson Corp. | 1.90% |
| ||||
10. |
| Och-Ziff Capital Management |
|
| ||||
|
| Group, LLC-Class A | 1.89% |
| ||||
|
|
| ||||||
* | Top 10 Holdings do not include short-term investments and percentages are based on total net assets. Portfolio Distributions percentages are based on total investments. Portfolio holdings and sector distributions are as of 10/31/12 and are subject to change. Portfolio holdings are not recommendations to buy or sell any securities. |
| ||||||
|
|
|
| |||||
|
|
Value of a $10,000 Investment (unaudited) |
|
|
|
|
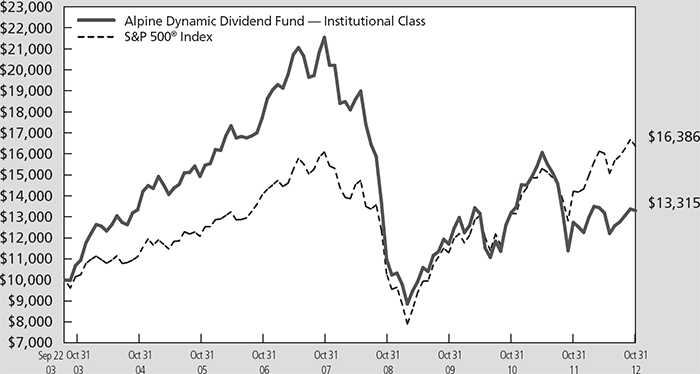
This chart represents a comparison of a hypothetical $10,000 investment in the Fund versus a similar investment in the Fund’s benchmark. The graph and the table do not reflect the deduction of taxes that a shareholder would pay on Fund distributions or the redemption of Fund shares. Investment performance reflects the waiver and recovery of certain fees, if applicable. Without the waiver and recovery of fees, the Fund’s total return would have differed.
Performance data quoted represents past performance and is not predictive of future results. Investment return and principal value of the Fund fluctuate, so that the shares, when redeemed, may be worth more or less than their original cost.
10
|
|
Alpine Dynamic Dividend Fund (continued) |
|
|
Commentary |
PERFORMANCE
In the fiscal year ended October 31, 2012, the Alpine Dynamic Dividend Fund provided a total return of 4.46%, including dividend distributions. This compares with the 15.21% return of the S&P 500® Index. All references in this letter to the Fund’s performance relate to the performance of the Fund’s Institutional Class.
The Fund’s comparative performance was negatively impacted by our investments in non-U.S. securities particularly in our smaller capitalization holdings in Brazil and China. While the United States holdings were a positive driver for performance, our non-U.S. holdings were negatively impacted by the continuing European sovereign debt crisis and concerns about economic growth and inflation in China and Brazil. This year was a period of volatility for most markets outside the U.S. – illustratively, from the end of the European Central Bank’s Long Term Refinancing Operations (LTRO) on March 1 to the end of May, the U.S. S&P 500® Index declined 4.1%, while the Brazilian Bovespa Index declined 30.7%, the STOXX Europe 600 Price Index declined 14.9% and the Hang Seng Index fell 11.7%.
In our effort to achieve our dividend income goals, we continued to pursue higher dividend-paying shares in countries outside the U.S. However, throughout fiscal 2012, we responded to the volatility in the markets and the outlook for subdued global economic growth by bringing more assets back to the United States as many U.S. companies continued to report strong earnings and cash flow. Consequently, the Fund ended fiscal 2012 with 72% of assets in U.S. based companies and 28% in companies based in 16 different countries. Following the U.S., our top five countries by weight on October 31, 2012 were the United Kingdom (4.0% of net assets), Norway (3.8% of net assets), Canada (3.2% of net assets), Hong Kong (2.4% of net assets) and Australia (2.3% of net assets). While 11% of the Fund’s assets were invested in Europe on October 31, only 1.2% was in Euro currency-denominated countries, with the rest in Norway, Sweden, Switzerland and the U.K.
Our approach during these uncertain times is to remain broadly diversified within the dividend-paying universe while actively scanning for companies that have innovation and secular growth that can drive earnings higher despite sluggish economic growth. We also search for undervalued opportunities and high quality cash flow generators that can provide upside as economic growth improves. In seeking to enhance our investment selection
process and reduce potential risks, we added to our investment management team during the fiscal year by including additional members of our research staff who had particular sector specific investment background, and changed to a new team-based approach to management of the Fund in December 2012 as set forth in the Special Note to Shareholders that follows this letter. We will continue to have analytical support teams for specific areas of investment including real estate, consumer products and services, industrial, financial services, health care, utilities, technology, infrastructure, energy, and materials.
Our dividend capture strategy, has tended to be seasonally focused in Europe in the spring. Given our uncertain outlook for the Euro region during the period, we hedged the currency exposure related to our dividend capture trades in Europe during this time. We have also continued to employ leverage in the execution of the Fund’s strategy both for investment purposes and to manage unexpected cash inflows and outflows.
TOP FIVE CONTRIBUTORS
The top five contributors to the Fund’s performance in fiscal 2012, based on contribution to total return were Comcast Corp. (63.18%), JPMorgan Chase & Co (23.62%), Wells Fargo & Co. (33.22%), CVS Caremark Corp. (28.98%), and Yum! Brands (33.27%).
|
|
|
| • | Comcast Corp. (average weight 1.45%) is the largest cable services provider in the USA and the owner of the NBC family of channels. The company’s performance for the past year was boosted by increasing market share in cable and a ratings turnaround in NBC driven by the Olympics, Sunday Night Football and the Voice. |
|
|
|
| • | JPMorgan Chase & Co (average weight 2.11%) and Wells Fargo & Co (average weight 1.93%) are two of the largest banks in the U.S. and both benefited in fiscal 2012 from a rebound in financial stocks following the European Central Bank’s LTRO. Also, better economic data in the U.S. and a stabilization of the housing market also helped propel these financial stocks from the fears of a “double dip” recession in late 2011. |
|
|
|
| • | CVS Caremark Corp. (average weight 1.33%) is the largest retail pharmacy chain in the U.S with a network of more than 7,100 retail drugstores. They are also the largest provider of pharmacy benefit management (PBM) services to health care payers. Performance was |
11
|
|
Alpine Dynamic Dividend Fund (continued) |
|
|
|
|
|
| assisted by the PBM business which benefited strongly from a dispute between Walgreens and Express Scripts and was able to grow market share as a result. |
|
|
|
| • | Yum! Brands (average weight 1.24%) operates a worldwide system of over 36,000 quick serve restaurants with their main brands being Taco Bell, Pizza Hut, and KFC. With about 75% of profits generated from international markets and substantial growth opportunities in countries like China, Yum! offers important access to the emerging consumer growth markets. |
BOTTOM FIVE CONTRIBUTORS
The bottom five contributors that had the largest adverse impact on the performance of the Fund during fiscal 2012 were primarily international holdings in PDG Realty SA (-68.26%), Daqing Dairy Holdings (-92.15%), Suncor Energy (-18.90%), and Tele2 AB (-15.50%). Also, US-based Hewlett-Packard Co. was a negative contributor (-43.04%). Unlike our top five performers, these underperformers represented relatively smaller positions in the portfolio, with four of the five (excluding PDG) having an average weight of less than 0.90% in the portfolio.
|
|
|
| • | PDG Realty SA (average weight 1.11%) is a leading residential developer in Brazil. The biggest challenge for PDG has been the execution and delivery of legacy units launched in 2007. This effort has been marked by downward pressure on operating margins and profitability (Return On Equity) while increasing cash burn and leverage. A recapitalization and recent changes in senior management could accelerate a turnaround, but these initial steps have not adequately addressed investors’ concerns and we no longer hold the position. |
|
|
|
| • | Daqing Dairy Holdings (average weight 0.54%) is an ex-state-owned enterprise that sells baby milk products in Tier 2 and Tier 3 cities in China. The company’s auditor resigned in March and the company’s shares have not traded since that time. The majority of the decline in value during the period is attributable to a 90% discount to its last traded price that we have taken due to our concerns about the company’s disclosures, issues raised by their former auditors and additional disclosures relating to the company’s operations at year end. Prior to the suspension of trading, the shares had declined by approximately 12%. |
|
|
|
| • | Hewlett Packard Co. (average weight 0.90%) produces printing and computing hardware and provides information technology services for businesses and consumers worldwide. We were incorrect in our thesis that HP’s extremely discounted valuation had already reflected the difficulties that it faced in its core businesses and that its new CEO would be the catalyst for a turnaround. The decline in personal computer demand is proving to be more secular than cyclical and prior management’s poor acquisitions and operational oversight is proving to take longer to fix than anticipated. |
|
|
|
| • | Suncor Energy (average weight 0.15%) is an integrated energy company with a focus on developing the oil sands basin in Canada. We believed the company would benefit from the rise in crude prices and its positive impact on the profitability of the oil sands region. However, as concerns of a double dip recession set in at the end of 2011, the stock sold off and we exited the position. |
|
|
|
| • | Tele 2AB (average weight 0.80%) is a telecommunications provider with operations in Scandinavia and Russia. The company’s Swedish operations were pressured by a short-lived price war and have since rebounded. The company has paid a special dividend every year since 2008. |
OUTLOOK FOR THE MARKET AND ECONOMY
The Fund was initiated in September 2003 to provide investors with a vehicle to benefit from the reduced U.S. Federal tax rates on dividends or Qualified Dividend Income (“QDI”). This tax benefit is set to expire on December 31, 2012, and there is uncertainty on the level of taxation for dividends going forward.
In summary, our goals remain clear. We intend to continue to seek to provide a high dividend that may satisfy the need for income in a low-yielding world by building a portfolio of what we believe are strong dividend payers and to also seek to grow our Net Asset Value over the long term. We thank our shareholders for your support of the Alpine Dynamic Dividend Fund and we hope for a more prosperous year in 2013.
Sincerely,
Joshua Duitz
Brian Hennessey
Co-Portfolio Managers
12
|
|
Alpine Dynamic Dividend Fund (continued) |
|
SPECIAL NOTE TO SHAREHOLDERS:
Effective December 13, 2012, the Adviser announced a new team based approach to management of the Alpine Dynamic Divided Fund and that newly appointed co-portfolio managers Joshua Duitz and Brian Hennessey, who previously served as associate portfolio managers of the Fund, will lead the new investment team and will be responsible for the day-to-day management of the Fund.
The investment team also includes experienced Alpine portfolio managers and research analysts, who will provide analysis and recommendations regarding the sectors they cover. The team includes Samuel A. Lieber (C.E.O.), Stephen A. Lieber (C.I.O.) and Bruce Ebnother (Senior Investment Risk Strategist) who will provide strategic oversight. The previous co-portfolio managers are no longer part of the investment team.
|
|
| |
Mutual Fund investing involves risk. Principal loss is possible. The Fund is subject to risks, including the following: | |
Credit Risk – Credit risk refers to the possibility that the issuer of a security will not be able to make payments of interest and principal when due. Changes in an issuer’s credit rating or the market’s perception of an issuer’s creditworthiness may also affect the value of the Fund’s investment in that issuer. The degree of credit risk depends on both the financial condition of the issuer and the terms of the obligation.
Dividend Strategy Risk – The Fund’s strategy of investing in dividend-paying stocks involves the risk that such stocks may fall out of favor with investors and underperforms the market. Companies that issue dividend paying-stocks are not required to continue to pay dividends on such stocks. Therefore, there is the possibility that such companies could reduce or eliminate the payment of dividends in the future or the anticipated acceleration of dividends could not occur.
Emerging Market Securities Risk – The risks of investing in foreign securities can be intensified in the case of investments in issuers domiciled or operating in emerging market countries. These risks include lack of liquidity and greater price volatility, greater risks of expropriation, less developed legal systems and less reliable custodial services and settlement practices.
Equity Securities Risk – The stock or other security of a company may not perform as well as expected, and may decrease in value, because of factors related to the company (such as poorer than expected earnings or certain management decisions) or to the industry in which the company is engaged (such as a reduction in the demand for products or services in a particular industry).
Foreign Currency Transactions Risk – Foreign securities are often denominated in foreign currencies. As a result, the value of the Fund’s shares is affected by changes in exchange rates. The Fund may enter into foreign currency transactions to try to manage this risk. The Fund’s ability to use foreign currency transactions successfully depends on a number of factors, including the foreign currency transactions being available at prices that are not too costly, the availability of liquid markets and the ability of the portfolio managers to accurately predict the direction of changes in currency exchange rates.
Foreign Securities Risk – Public information available concerning foreign issuers may be more limited than it would be with respect to domestic issuers. Different accounting standards may be used by foreign issuers, and foreign trading markets may not be as liquid as U.S. markets. Currency fluctuations could erase investment gains or add to investment losses. Additionally, foreign securities also involve possible imposition of withholding or confiscatory taxes and adverse political or economic developments. These risks may be greater in emerging markets.
Growth Stock Risk – Growth stocks are stocks of companies believed to have above-average potential for growth in revenue and earnings. Growth stocks typically are very sensitive to market movements because their market prices tend to reflect future expectations. When it appears those expectations will not be met, the prices of growth stocks typically fall. Growth stocks as a group may be out of favor and underperform the overall equity market while the market concentrates on undervalued stocks.
Leverage Risk – The Fund may use leverage to purchase securities. Increases and decreases in the value of the Fund’s portfolio will be magnified when the Fund uses leverage.
Management Risk – The Adviser’s judgment about the quality, relative yield or value of, or market trends affecting, a particular security or sector, or about interest rates generally, may be incorrect. The Adviser’s security selections and other investment decisions might produce losses or cause the Fund to underperform when compared to other funds with similar investment objectives and strategies.
Market Risk – The price of a security held by the Fund may fall due to changing market, economic or political conditions.
13
|
|
Alpine Dynamic Dividend Fund (continued) |
|
Micro-Capitalization Company Risk – Investments in micro-cap companies are associated with similar risks as investments in small and medium capitalization companies, but these risks may be even greater with respect to investments in micro-cap companies.
Portfolio Turnover Risk – High portfolio turnover necessarily results in greater transaction costs which may reduce Fund performance.
Qualified Dividend Tax Risk – Favorable U.S. Federal tax treatment of Fund distributions may be adversely affected, changed or repealed by future changes in tax laws. Under current law, favorable U.S. Federal tax treatment of Fund distributions as qualified dividend income will expire as of December 31, 2012 unless new legislations extending that deadline is enacted.
Small- and Medium-Capitalization Company Risk – Securities of small- or medium-capitalization companies are more likely to experience sharper swings in market values, less liquid markets, in which it may be more difficult for the Adviser to sell at times and at prices that the Adviser believes appropriate and generally are more volatile than those of larger companies.
Swaps Risk – Swap agreements are derivative instruments that can be individually negotiated and structured to address exposure to a variety of different types of investments or market factors. Depending on their structure, swap agreements may increase or decrease a Fund’s exposure to long- or short-term interest rates, foreign currency values, mortgage securities, corporate borrowing rates, or other factors such as security prices or inflation rates. A Fund also may enter into swaptions, which are options to enter into a swap agreement. Since these transactions generally do not involve the delivery of securities or other underlying assets or principal, the risk of loss with respect to swap agreements and swaptions generally is limited to the net amount of payments that the Fund is contractually obligated to make. There is also a risk of default by the other party to a swap agreement or swaption, in which case a Fund may not receive the net amount of payments that such Fund contractually is entitled to receive.
Undervalued Stock Risk – Undervalued stocks may perform differently from the market as a whole and may continue to be undervalued by the market for long periods of time. Although the Fund will not concentrate its investments in any one industry or industry groups, it may weigh its investments towards certain industries, thus increasing its exposure to factors adversely affecting issues within these industries.
Please refer to pages 6-7 for other important disclosures and definitions.
14
|
|
|
|
| |
|
|
|
|
|
|
|
|
|
|
|
|
| ||||
Comparative Annualized Returns as of 10/31/12 (unaudited) | |||||||||||||
|
|
|
|
|
|
|
|
|
| ||||
|
| 1 Year |
| 3 Years | Since Inception |
| |||||||
Alpine Accelerating Dividend Fund — Institutional Class |
| 11.28% |
|
| 11.19% |
| 12.12% |
|
| ||||
S&P 500® Index |
| 15.21% |
|
| 13.21% |
| 11.33% |
|
| ||||
Dow Jones Industrial Average |
| 12.56% |
|
| 13.48% |
| 11.16% |
|
| ||||
Lipper Equity Income Funds Average(1) |
| 13.18% |
|
| 12.42% |
| 13.24% |
|
| ||||
Lipper Equity Income Funds Ranking(1) |
| 237/303 |
|
| 180/246 |
| 174/241 |
|
| ||||
Gross Expense Ratio: 2.64%(2) |
|
|
|
|
|
|
|
|
| ||||
Net Expense Ratio: 1.35%(2) |
|
|
|
|
|
|
|
|
| ||||
|
|
|
|
|
| ||
| (1) | The since inception data represents the period beginning 11/6/2008. | |
| (2) | As disclosed in the prospectus dated February 28, 2012. | |
Performance data quoted represents past performance and is not predictive of future results. Investment return and principal value of the Fund fluctuate, so that the shares, when redeemed, may be worth more or less than their original cost. Performance current to the most recent month end may be lower or higher than performance quoted and may be obtained by calling 1-888-785-5578. Performance data shown does not reflect the 1.00% redemption fee imposed on shares held for fewer than 60 days. If it did, total returns would be reduced.
Performance of Class A shares is not shown because this share class commenced operations on December 30, 2011.
The S&P 500® Index is float-adjusted market capitalization-weighted index of 500 common stocks chosen for market size, liquidity, and industry group representation to represent U.S. equity performance. Dow Jones Industrial Average – is a price-weighted average of 30 blue-chip stocks that are generally the leaders in their industry. The Lipper Equity Income Funds Average is an average of funds that seek relatively high current income and income growth through investing 60% or more of their respective portfolios in equities. Lipper rankings for the periods shown are based on fund total returns with dividends and distributions reinvested and do not reflect sales charges. The S&P 500® Index, the Dow Jones Industrial Average, and the Lipper Equity Income Funds Average are unmanaged and do not reflect direct fees associated with a mutual fund, such as investment adviser fees; however, the Lipper Equity Income Funds Average reflects fees charged by the underlying funds. The performance for the Accelerating Dividend Fund reflects the deduction of fees for these value-added services. Investors cannot directly invest in an index.
Expense Ratios reflect the ratios reported in the Fund’s most recent prospectus. The Alpine Accelerating Dividend Fund has a contractual expense waiver that continues through February 28, 2013. Where a Fund’s gross and net expense ratio are the same for the period reported, the contractual expense reimbursement level was not reached as of the end of that period. To the extent the Fund’s expenses were reduced by waivers, the Fund’s total returns were increased. In these cases, in the absence of the expense waivers, the Fund’s total returns would have been lower.
To the extent that the Fund’s historical performance resulted from gains derived from participation in initial public offerings (“IPOs”) and/or Secondary offerings, there is no guarantee that these results can be replicated in future periods or that the Fund will be able to participate to the same degree in IPO/Secondary allocations in the future.
15
|
|
Alpine Accelerating Dividend Fund (continued) |
|
|
|
|
|
|
|
|
|
|
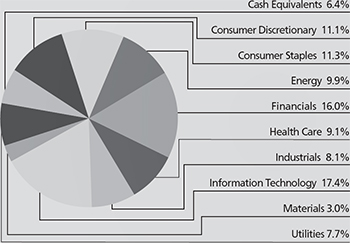
Portfolio Distributions* (unaudited) |
| Top 10 Holdings* (unaudited) |
|
| ||||
|
| 1. |
| Abbott Laboratories | 1.90% |
| ||
| 2. |
| American Tower Corp. | 1.87% |
| |||
3. |
| Anheuser-Busch InBev NV-ADR | 1.82% |
| ||||
4. |
| QUALCOMM, Inc. | 1.82% |
| ||||
5. |
| The J.M. Smucker Co. | 1.78% |
| ||||
6. |
| VF Corp. | 1.75% |
| ||||
7. |
| Apple, Inc. | 1.73% |
| ||||
8. |
| PepsiCo, Inc. | 1.72% |
| ||||
9. |
| Dick’s Sporting Goods, Inc. | 1.72% |
| ||||
10. |
| Avago Technologies, Ltd. | 1.71% |
| ||||
|
|
| ||||||
* | Top 10 Holdings do not include short-term investments and percentages are based on total net assets. Portfolio Distributions percentages are based on total investments. Portfolio holdings and sector distributions are as of 10/31/12 and are subject to change. Portfolio holdings are not recommendations to buy or sell any securities. |
| ||||||
|
|
|
| |||||
|
|
Value of a $10,000 Investment (unaudited) |
|
|
|
|
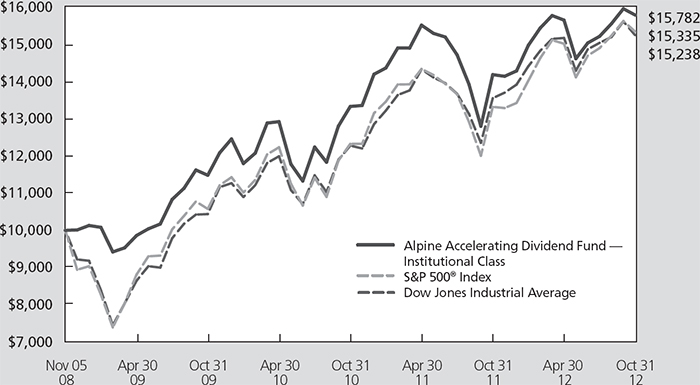
This chart represents a comparison of a hypothetical $10,000 investment in the Fund versus a similar investment in the Fund’s benchmark. The graph and the table do not reflect the deduction of taxes that a shareholder would pay on Fund distributions or the redemption of Fund shares. Investment performance reflects the waiver and recovery of certain fees, if applicable. Without the waiver and recovery of fees, the Fund’s total return would have differed.
Performance data quoted represents past performance and is not predictive of future results. Investment return and principal value of the Fund fluctuate, so that the shares, when redeemed, may be worth more or less than their original cost.
16
|
|
Alpine Accelerating Dividend Fund (continued) |
|
|
Commentary |
For the fiscal year ended October 31, 2012, the Alpine Accelerating Dividend Fund generated a total return of 11.28%. This compares with a total return of 15.21% for the S&P 500® Index for the same period. Since inception, the Alpine Accelerating Dividend Fund has generated an annualized total return of 12.12% versus an annualized return of 11.33% for the S&P 500® Index. During the last twelve months, the Fund steadily increased its monthly payout from $0.0385 to $0.0397 per share. All references in this letter to the Fund’s performance relate to the performance of the Fund’s Institutional Class.
PERFORMANCE DRIVERS
The Fund generally prefers to take a conservative investment stance with regard to portfolio construction and security selection during times of economic and geopolitical uncertainty. For example, the Fund had an average cash holding of 6.4% during the twelve months ended October 31, 2012 and a portfolio beta of less than 1.0 during the same time span. While this conservative investment posture has the potential to perform well in choppy markets, it is also likely to lag a broader market rally such as the one that unfolded during the fiscal year.
|
|
|
| • | The 6.4% average cash holding was responsible for less than 1% of the Fund’s underperformance versus the S&P 500®. Additionally, the Fund only began investing in shares of Apple Inc. once it became clear the company would begin paying regular quarterly dividends. As a result, the Fund’s underweight position in Apple was responsible for approximately 1% of the underperformance versus the S&P 500®. |
|
|
|
| • | On a sector basis, the financials had the largest impact on the absolute performance of the Fund, followed by consumer staples and industrials. Materials were the only segment to generate a negative return over the past 12 months. On a relative basis, financials generated the largest outperformance versus the S&P 500®, followed by industrials and utilities. Consumer discretionary, health care, and materials were the worst relative performers. |
PORTFOLIO ANALYSIS
The top five contributors to the Fund’s performance during the twelve months ended October 31, 2012, based on contribution to total return, were Comcast 63.61%, Anheuser-Busch InBev 53.84%, Amgen 53.84%, Visa 50.36%, and Colony Financial 48.19%.
|
|
|
| • | The strong performance in Comcast (average weight 1.64%) shares during the period was driven by solid execution in the cable business resulting in lower subscriber turnover, better pricing and strong free cash flow generation. Meanwhile, the struggling NBC Universal piece of the business benefited from the success of the London Olympics. |
|
|
|
| • | Anheuser-Busch Inbev (average weight 1.77%) posted solid numbers as management executed on its plans to improve pricing in North America through price increases on its low-end products and product innovation. In addition, the proposed acquisition of Grupo Modelo was well received by the market. |
|
|
|
| • | Amgen stock (average weight 1.41%) benefited from a combination of improving business fundamentals, a low valuation, and significant return of capital to shareholders during the fiscal year. Its legacy drugs have begun to stabilize while sales of its blockbuster, Enbrel, continue to improve. Also, management initiated a common stock dividend and executed an earnings accretive $5B share buyback. |
|
|
|
| • | Better-than-expected credit spending in the U.S. led to strong earnings for Visa (average weight 1.50%) throughout the fiscal year, enabling it to outperform its peers. Plus, the company’s efforts to mitigate the impact of new regulations resulted in a more resilient debit card business than expected. |
|
|
|
| • | Shares of Colony Financial (average weight 1.49%) enjoyed a strong rally during the fiscal year as its discount to book value diminished, key measures of the commercial real estate market improved, and its higher dividend attracted yield-hungry investors as it became evident the Fed would likely keep short-rates near zero for some time. |
|
|
|
PDG Realty (-59.89%), Hewlett-Packard (-44.09%), Pace PLC (-40.94%), Vale (-23.11%), and Hill-Rom Holdings (-16.71%) had the largest adverse impact on the performance of the Fund over the fiscal year. | ||
|
| |
| • | A string of operational challenges and cost over-runs has led to declining profitability and continued cash burn for PDG Realty (average weight 0.62%), resulting in a partial recapitalization of the company and an all new management team for this Brazilian homebuilder. We no longer expect PDG to deliver the steady increasing dividends we anticipated and have since sold the stock. |
17
|
|
Alpine Accelerating Dividend Fund (continued) |
|
|
|
|
| • | Hewlett Packard (average weight 1.17%) faced several challenges over the last 12 months. The largest of which is the looming threat of smart phones and tablets on the personal computer and printing markets. As the market deteriorated, management made several efforts to offset the revenue shortfalls with cost savings but was unable to quell investor concerns. |
|
|
|
| • | Pace (average weight 0.03%), one of the leading set-top box manufacturers for digital television, was negatively impacted by the floods in Thailand that dramatically reduced the availability and supply of hard disk drives, leading to reduced sales and lower margins. |
|
|
|
| • | Vale (average weight 0.95%) struggled through many issues during the year. Iron ore pricing was volatile as the largest consumer of iron ore, China, experienced a slowdown in demand. Management worked to curtail its spending throughout the period but had difficulty meeting expectations. |
|
|
|
| • | A dramatic slowdown in North American sales of its key patient support products dented Hill-Rom’s (average weight 1.34%) top line and pressured margins, leading to reduced earnings expectations for the company and a falling stock price. With little prospect for a near-term improvement in the hospital spending environment, we exited the position prior to the end of the fiscal year. |
SUMMARY & OUTLOOK
The Accelerating Dividend Fund seeks to invest in dividend-paying companies which have the potential to increase or accelerate their dividends in the future, based on our analysis of their growth prospects and cash flow-generating capabilities. The Fund aims to achieve a sustainable and rising stream of dividend income as well as long-term capital appreciation. We believe that
companies with strong franchises characterized by defensible margins and a solid balance sheet are best positioned to increase, and even accelerate, their dividends over time. Overall, we aim to manage the Fund conservatively by limiting our international exposure, eschewing the use of leverage, and avoiding large sector bets when possible.
As we look toward 2013, we remain cautious in our investment stance. The geopolitical environment remains unsettled and there is a great deal of uncertainty as to the strength and durability of the economic recovery underway in the U.S. and Europe. As such, even in the face of potentially higher taxes in the U.S., we believe that dividend income may become a key signpost for investors to gauge the true financial strength of companies. In a yield-challenged world, companies with track records of increasing dividends could be the winners in the equity market, in our view. As a result, we are “sticking to our knitting” – we believe a strategy that seeks to identify stocks with rising dividends as well as those with the potential to not only increase the dividend, but to do so at an accelerating pace, is well positioned to succeed in the uncertain market environment in which we currently find ourselves and to potentially outperform over time. Likewise, we think the Fund provides an opportunity for an attractive combination of current yield with the potential for increasing payouts over time.
We thank our shareholders for their support and look forward to continued success over the next year.
Sincerely,
Stephen A. Lieber
Bryan Keane
Andrew Kohl
Co-Portfolio Managers
18
|
|
Alpine Accelerating Dividend Fund (continued) |
|
|
Dividend Strategy Risk – The Fund’s strategy of investing in dividend-paying stocks involves the risk that such stocks may fall out of favor with investors and underperforms the market. Companies that issue dividend-paying-stocks are not required to continue to pay dividends on such stocks. Therefore, there is the possibility that such companies could reduce or eliminate the payment of dividends in the future or the anticipated acceleration of dividends could not occur.
Equity Securities Risk – The stock or other security of a company may not perform as well as expected, and may decrease in value, because of factors related to the company (such as poorer than expected earnings or certain management decisions) or to the industry in which the company is engaged (such as a reduction in the demand for products or services in a particular industry).
Foreign Currency Transactions Risk – Foreign securities are often denominated in foreign currencies. As a result, the value of the Fund’s shares is affected by changes in exchange rates. The Fund may enter into foreign currency transactions to try to manage this risk. The Fund’s ability to use foreign currency transactions successfully depends on a number of factors, including the foreign currency transactions being available at prices that are not too costly, the availability of liquid markets and the ability of the portfolio managers to accurately predict the direction of changes in currency exchange rates.
Foreign Securities Risk – Public information available concerning foreign issuers may be more limited than it would be with respect to domestic issuers. Different accounting standards may be used by foreign issuers, and foreign trading markets may not be as liquid as U.S. markets. Currency fluctuations could erase investment gains or add to investment losses. Additionally, foreign securities also involve possible imposition of withholding or confiscatory taxes and adverse political or economic developments. These risks may be greater in emerging markets.
Growth Stock Risk – Growth stocks typically are very sensitive to market movements because their market prices tend to reflect future expectations. When it appears those expectations will not be met, the prices of growth stocks typically fall. Growth stocks as a group may be out of favor and underperform the overall equity market while the market concentrates on undervalued stocks. Although the Fund will not concentrate its investments in any one industry or industry group, it may, like many growth funds, weight its investments toward certain industries, thus increasing its exposure to factors adversely affecting issuers within those industries.
Management Risk – The Adviser’s judgment about the quality, relative yield or value of, or market trends affecting, a particular security or sector, or about interest rates generally, may be incorrect. The Adviser’s security selections and other investment decisions might produce losses or cause the Fund to underperform when compared to other funds with similar investment objectives and strategies.
Market Risk – The price of a security held by the Fund may fall due to changing market, economic or political conditions.
Micro-Capitalization Company Risk – The Fund may invest in the stocks of micro-cap companies with capitalizations under $100 million. Investments in micro-cap companies are associated with similar risks as investments in small and medium capitalization companies, but these risks may be even greater with respect to investments in micro-cap companies. Accordingly, the stocks of micro-cap companies may be more volatile and more thinly-traded, and therefore more illiquid, than stocks of companies with larger capitalizations.
Portfolio Turnover Risk – High portfolio turnover necessarily results in greater transaction costs which may reduce Fund performance.
Small- and Medium-Capitalization Company Risk – Securities of small- or medium-capitalization companies are more likely to experience sharper swings in market values, less liquid markets, in which it may be more difficult for the Adviser to sell at times and at prices that the Adviser believes appropriate and generally are more volatile than those of larger companies.
Undervalued Stock Risk – Undervalued stocks may perform differently from the market as a whole and may continue to be undervalued by the market for long periods of time. Although the Fund will not concentrate its investments in any one industry or industry groups, it may weigh its investments towards certain industries, thus increasing its exposure to factors adversely affecting issues within these industries.
Please refer to pages 6-7 for other important disclosures and definitions.
19
|
|
|
|
| |
|
|
|
|
|
|
|
|
|
|
|
|
|
|
|
|
|
Comparative Annualized Returns as of 10/31/12 (unaudited) | |||||||||||||
|
|
|
|
|
|
|
|
|
|
|
|
|
|
|
| 1 Year |
| 3 Years |
| 5 Years |
| Since Inception |
| ||||
Alpine Financial Services Fund — Institutional Class |
| 22.95% |
|
| 8.77% |
|
| -1.60% |
|
| 4.52% |
|
|
KBW Bank Index |
| 26.36% |
|
| 7.15% |
|
| -11.58% |
|
| -7.02% |
|
|
NASDAQ Financial-100 Index |
| 17.20% |
|
| 8.52% |
|
| -3.87% |
|
| -1.00% |
|
|
S&P 500® Index |
| 15.21% |
|
| 13.21% |
|
| 0.36% |
|
| 4.46% |
|
|
Lipper Financial Services Funds Average(1) |
| 19.60% |
|
| 6.64% |
|
| -6.62% |
|
| -2.99% |
|
|
Lipper Financial Services Funds Ranking(1) |
| 20/75 |
|
| 22/69 |
|
| 12/64 |
|
| 3/52 |
|
|
Gross Expense Ratio: 1.86%(2) |
|
|
|
|
|
|
|
|
|
|
|
|
|
Net Expense Ratio: 1.45%(2) |
|
|
|
|
|
|
|
|
|
|
|
|
|
|
|
|
|
|
| ||
| (1) | The since inception data represents the period beginning 11/03/2005. | |
| (2) | As disclosed in the prospectus dated February 28, 2012. | |
Performance data quoted represents past performance and is not predictive of future results. Investment return and principal value of the Fund fluctuate, so that the shares, when redeemed, may be worth more or less than their original cost. Performance current to the most recent month end may be lower or higher than performance quoted and may be obtained by calling 1-888-785-5578. Performance data shown does not reflect the 1.00% redemption fee imposed on shares held for fewer than 60 days. If it did, total returns would be reduced.
Performance of Class A shares is not shown because this share class commenced operations on December 30, 2011.
KBW Bank Index is a modified cap-weighted index consisting of 24 exchange-listed and National Market System stocks, representing national money center banks and leading regional institutions. The NASDAQ Financial-100 Index includes 100 of the largest domestic and international financial securities listed on The NASDAQ Stock Market based on market capitalization. They include companies classified according to the Industry Classification Benchmark as Financials, which are included within the NASDAQ Bank, NASDAQ Insurance, and NASDAQ Other Finance Indexes. The S&P 500® Index is float-adjusted market capitalization-weighted index of 500 common stocks chosen for market size, liquidity, and industry group representation to represent U.S. equity performance. The Lipper Financial Services Funds Average is an average of funds whose primary objective is to invest primarily in equity securities of companies engaged in providing financial services. Lipper Rankings for the periods shown are based on fund total returns with dividends and distributions reinvested and do not reflect sales charges. The KBW Bank Index, the NASDAQ Financial-100 Index, the S&P 500® Index and the Lipper Financial Services Funds Average are unmanaged and do not reflect the deduction of direct fees associated with a mutual fund, such as investment adviser fees; however, the Lipper Financial Services Fund Average reflects fees charged by the underlying funds. The performance for the Financial Services Fund reflects the deduction of fees for these value-added services. Investors cannot directly invest in an index.
Expense Ratios reflect the ratios reported in the Fund’s most recent prospectus. The Alpine Financial Services Fund has a contractual expense waiver that continues through February 28, 2013. Where a Fund’s gross and net expense ratio are the same for the period reported, the contractual expense reimbursement level was not reached as of the end of that period. To the extent the Fund’s expenses were reduced by waivers, the Fund’s total returns were increased. In these cases, in the absence of the expense waivers, the Fund’s total returns would have been lower.
The Fund’s past performance benefitted significantly from initial public offerings (“IPOs”) of certain issuers, and there is no assurance that the Fund can replicate this performance in the future. To the extent that the Fund’s historical performance resulted from gains derived from participation in Secondary offerings, there is no guarantee that these results can be replicated or that the Fund will be able to participate to the same degree in IPO/Secondary allocations in the future.
20
|
|
Alpine Financial Services Fund (continued) |
|
|
|
|
|
|
|
|
|
|
Portfolio Distributions* (unaudited) |
| Top 10 Holdings* (unaudited) |
|
| ||||
|
| 1. |
| IntercontinentalExchange, Inc. | 3.98% |
| ||
| 2. |
| Synovus Financial Corp. | 3.64% |
| |||
3. |
| Provident Financial Holdings, Inc. | 3.57% |
| ||||
4. |
| Southern National Bancorp of |
|
| ||||
|
| Virginia, Inc. | 3.08% |
| ||||
5. |
| Citizens First Corp. | 3.06% |
| ||||
6. |
| The Blackstone Group LP | 3.00% |
| ||||
7. |
| First California Financial |
|
| ||||
|
| Group, Inc. | 2.81% |
| ||||
8. |
| Urstadt Biddle Properties, |
|
| ||||
|
| Inc.-Class A | 2.77% |
| ||||
9. |
| 1st United Bancorp, Inc. | 2.65% |
| ||||
10. |
| Green Dot Corp.-Class A | 2.59% |
| ||||
|
|
| ||||||
* | Top 10 Holdings do not include short-term investments and percentages are based on total net assets. Portfolio Distributions percentages are based on total investments. Portfolio holdings and sector distributions are as of 10/31/12 and are subject to change. Portfolio holdings are not recommendations to buy or sell any securities. |
| ||||||
|
|
|
| |||||
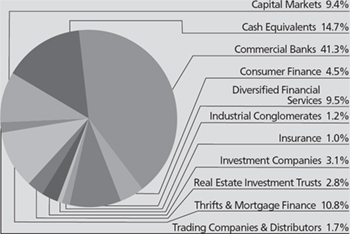
|
Value of a $10,000 Investment (unaudited) |
|
|
|
|
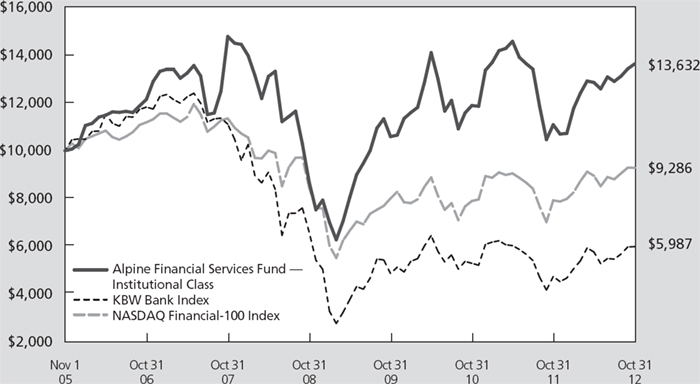
This chart represents a comparison of a hypothetical $10,000 investment in the Fund versus a similar investment in the Fund’s benchmark. The graph and the table do not reflect the deduction of taxes that a shareholder would pay on Fund distributions or the redemption of Fund shares. Investment performance reflects the waiver and recovery of certain fees, if applicable. Without the waiver and recovery of fees, the Fund’s total return would have differed.
Performance data quoted represents past performance and is not predictive of future results. Investment return and principal value of the Fund fluctuate, so that the shares, when redeemed, may be worth more or less than their original cost.
21
|
|
Alpine Financial Services Fund (continued) |
|
|
Commentary |
The Alpine Financial Services Fund generated a 22.95% total return for the fiscal year ended October 31, 2012. This compares to the Fund’s benchmarks which showed total returns of 17.20% for the NASDAQ Financial-100 Index and 26.36% for the KBW Bank Index during the same period. Since inception (11/01/2005), the Fund has generated an annualized total return of 4.52%. This compares favorably to a -1.00% annualized return for the NASDAQ Financial-100 Index and -7.02% for the KBW Bank Index during the same time period. All references in this letter to the Fund’s performance relate to the performance of the Fund’s Institutional Class.
YEAR IN REVIEW
There was much for investors to worry about during fiscal 2012. These included a mounting financial crisis in Europe, declining growth rates in emerging markets, and an uncertain Presidential election along with a “fiscal cliff” in the United States. Yet investors ignored these concerns and instead focused on the positives. Investors were relieved by the actions taken by the European Central Bank to provide European banks liquidity and support the sovereign debt of troubled European Union countries. In the U.S., signs of improvement in employment and the real estate market also aided the market’s recovery.
As for the performance of financial stocks, the main focus of investors this year was the turnaround in the U.S. real estate market. Real estate stocks were by far the best performing group in the NASDAQ Financial-100 Index, advancing 51.50%. Banks came in a distant second, rising 17.26%. Investors’ preference among bank stocks seemed to favor those with trading liquidity. This was apparent in the outperformance of the large-cap KBW Bank Index over the broader based NASDAQ Financial-100 Index. As for the Fund’s return this year, banks were the major contributing group providing a total return of 38.93%. These returns were offset by our investments in contra financial sector ETF’s. In addition to our investments in these ETF’s, we decided to maintain a large cash position in anticipation of an adverse market reaction to the concerns described above.
The Fund has participated in Initial Public Offerings (“IPOs”) both within and outside of the financial sector. The Fund’s trading in IPOs had a positive impact on the Fund’s return for the reporting period. We cannot predict whether there will be more IPOs that meet our investment standards, or that we will be able to participate and benefit from them, but we will continue to search.
We also continued to find value in the secondary offerings in the financial sector. As a result, the Fund has been an active participant in these offerings and they have contributed to the Fund’s return for the period. Similar to the IPOs, we cannot predict whether these offerings will continue to exist, but provided the market offers what we believe to be attractively-priced secondary offerings, the Fund will continue to participate in them.
CONTRIBUTING FACTORS
The top five contributors to the Fund’s performance during the fiscal year were First California Financial Group (106.12%), Provident Financial Holdings (67.13%), Synovus Financial Corp. (63.84%), Pacific Mercantile Bancorp (136.41%), and Citizens First Corporation (38.52%).
|
|
|
| • | First California Financial (average weight 4.50%) is a $1.8 billion in assets bank headquartered in Westlake Village, California. The stock rallied strongly on PacWest Bancorp’s unsolicited offer to buy the company. |
|
|
|
| • | Provident Financial Holdings (average weight 3.84%) is a thrift located in Riverside, California. The company has benefited from the demise of some their competitors and recent strength in their mortgage banking operations. |
|
|
|
| • | Synovus Financial Corp. (average weight 4.31%) is a regional bank headquartered in Columbus, Georgia. Exposure to real estate lending in the Southeast has caused credit issues for the company. An economic recovery would aid management in their efforts to resolve these credit issues. Thus the stock reacted well to current improving trends in the U.S. real estate market. |
|
|
|
| • | Pacific Mercantile (average weight 1.64%) is a $1 billion in assets bank headquartered in Costa Mesa, California. Aiding the stock performance this year was news that the company received an infusion of capital at a price above the current stock value. |
|
|
|
| • | Citizens First Corporation (average weight 3.72%) is a community bank located in Bowling Green, Kentucky. This is a small-cap bank stock which is ignored by most on Wall Street. Although fundamentally the company has performed relatively well during the recession, we believe the stock price remains inexpensive at a discount to book value, even after the advance this year. |
22
|
|
Alpine Financial Services Fund (continued) |
|
The five largest detractors to the Fund’s performance during the first half of fiscal 2012 were Direxion Daily Financial Bear (-43.91%), VTB Bank (-28.39%), Carolina Trust Bank (-17.21%), Direct Markets Holdings Corp (-97.30%), and BGC Partners (-23.98%).
|
|
|
| • | Direxion Daily Financial Bear (average weight 2.58%) is an ETF which we use at times of market swings to try to reduce the volatility of the portfolio. |
|
|
|
| • | VTB Bank (average weight 1.72%) is a Russian commercial bank. Concerns over weak operating results have put pressure on the stock’s price. |
|
|
|
| • | Carolina Trust Bank (average weight 3.05%) is located in Lincolnton, North Carolina. Although the bank has made some progress in reducing problem assets, credit costs remain elevated causing weak earnings. The stock is also illiquid and susceptible to price swings on little trading volume. |
|
|
|
| • | Direct Markets Holdings Corp., formerly Rodman and Renshaw Capital Group (average weight 0.48%), was negatively affected by the decline in capital markets activity and decided to close their broker operations. |
|
|
|
| • | BGC Partners’ (average weight 1.64%) suffered along with the rest of the brokerage industry with reduced trading volume. This caused revenue shortages which were somewhat offset by their newly purchased commercial real estate venture. |
SUMMARY & OUTLOOK
As we look over the global financial sector landscape we continue to feel the best risk/reward for economically sensitive financial stocks is the United States. We also believe the current increase in the pace of bank mergers is the beginning of a significant multi-year industry consolidation. We expect the contributing factors for this consolidation to be the industry’s challenging prospect for organic growth, director fatigue caused by years of highly stressed business conditions, and the need for small banks to grow in order to afford the burgeoning regulatory costs. During the year, several of the Fund’s holdings announced signing merger agreements. Edelman Financial Group sold to the private equity firm of Lee Equity Partners, LLC. Fidelity Bancorp in Pittsburgh, Pennsylvania announced plans to merge into Wheeling, West Virginia-based WesBanco, Inc. In South Carolina, Savannah Bancorp agreed to sell to in-state rival SCBT Financial Corporation. And a week after fiscal year end, First California Financial finalized their merger agreement with in-market PacWest Bancorp.
We will continue to search for those banks we feel would make ideal merger candidates as we believe industry consolidation will become the next financial sector investment theme.
Your continued support is much appreciated as we strive to find investment opportunities during these unusual economic and geopolitical times.
Sincerely,
Peter J. Kovalski
Stephen A. Lieber
Co-Portfolio Managers
|
|
| |
Mutual fund investing involves risk. Principal loss is possible. The Fund is subject to risks, including the following: | |
Concentration Risk – The Fund’s strategy of concentrating in companies in a specific industry means that its performance will be closely tied to the performance of a particular market segment. The Fund’s concentration in these companies may present more risks than if it were broadly diversified over numerous industries and sectors of the economy. A downturn in these companies would have a larger impact on the Fund than on a mutual fund that does not concentrate in such companies. At times, the performance of these companies will lag the performance of other industries or the broader market as a whole.
Equity Securities Risk – The stock or other security of a company may not perform as well as expected, and may decrease in value, because of factors related to the company (such as poorer than expected earnings or certain management decisions) or to the industry in which the company is engaged (such as a reduction in the demand for products or services in a particular industry).
23
|
|
Alpine Financial Services Fund (continued) |
|
Financial Services Industry Concentration Risk – The Fund is subject to the risk of concentrating investments in financial services companies, which makes it more susceptible to factors adversely affecting issuers within that industry than would a fund investing in a more diversified portfolio of securities. Economic downturns, credit losses and severe price competition can negatively affect this industry. The profitability of financial services companies is dependent on the availability and cost of capital and can fluctuate significantly when interest rates change. Financial services companies are also subject to extensive government regulation. The impact of recent legislation on any individual company or on the industry as a whole cannot be predicted.
Foreign Currency Transactions Risk – Foreign securities are often denominated in foreign currencies. As a result, the value of the Fund’s shares is affected by changes in exchange rates. The Fund may enter into foreign currency transactions to try to manage this risk. The Fund’s ability to use foreign currency transactions successfully depends on a number of factors, including the foreign currency transactions being available at prices that are not too costly, the availability of liquid markets and the ability of the portfolio managers to accurately predict the direction of changes in currency exchange rates.
Foreign Securities Risk – Public information available concerning foreign issuers may be more limited than it would be with respect to domestic issuers. Different accounting standards may be used by foreign issuers, and foreign trading markets may not be as liquid as U.S. markets. Currency fluctuations could erase investment gains or add to investment losses. Additionally, foreign securities also involve possible imposition of withholding or confiscatory taxes and adverse political or economic developments. These risks may be greater in emerging markets.
Growth Stock Risk – Growth stocks are stocks of companies believed to have above-average potential for growth in revenue and earnings. Growth stocks typically are very sensitive to market movements because their market prices tend to reflect future expectations. When it appears those expectations will not be met, the prices of growth stocks typically fall. Growth stocks as a group may be out of favor and underperform the overall equity market while the market concentrates on undervalued stocks.
Illiquid Securities Risk – Illiquid securities are securities that are not readily marketable, and include repurchase agreements maturing in more than seven days. Illiquid securities involve the risk that the securities will not be able to be sold at the time desired by the Adviser or at prices approximating the value at which the Fund is carrying the securities.
Initial Public Offerings and Secondary Risk – The Fund may invest a portion of its assets in shares of IPOs or secondary offerings of an issuer. IPOs and secondary offerings may have a magnified impact on the performance of a Fund with a small asset base. The impact of IPOs and secondary offerings on a Fund’s performance likely will decrease as the Fund’s asset size increases, which could reduce a Fund’s returns. IPOs and secondary offerings may not be consistently available to the Fund for investing. IPO and secondary offering shares frequently are volatile in price due to the absence of a prior public market, the small number of shares available for trading and limited information about the issuer. Therefore, the Fund may hold IPO and secondary offering shares for a very short period of time. This may increase the turnover of the Fund and may lead to increased expenses for the Fund, such as commissions and transaction costs. In addition, IPO and secondary offering shares can experience an immediate drop in value if the demand for the securities does not continue to support the offering price.
Leverage Risk – The Fund may use leverage to purchase securities. Increases and decreases in the value of the Fund’s portfolio will be magnified when the Fund uses leverage.
Liquidity Risk – Some securities held by the Fund may be difficult to sell, or illiquid, particularly during times of market turmoil. Illiquid securities may also be difficult to value. If the Fund is forced to sell an illiquid asset to meet redemption requests or other cash needs, the Fund may be forced to sell at a loss.
Management Risk – The Adviser’s judgment about the quality, relative yield or value of, or market trends affecting, a particular security or sector, or about interest rates generally, may be incorrect. The Adviser’s security selections and other investment decisions might produce losses or cause the Fund to underperform when compared to other funds with similar investment objectives and strategies.
Micro-Capitalization Company Risk – Investments in micro-cap companies are associated with similar risks as investments in small- and medium-capitalization companies, but these risks may be even greater with respect to investments in micro-cap companies.
Portfolio Turnover Risk – High portfolio turnover necessarily results in greater transaction costs which may reduce Fund performance.
24
|
|
Alpine Financial Services Fund (continued) |
|
Small- and Medium-Capitalization Company Risk – Securities of small- or medium-capitalization companies are more likely to experience sharper swings in market values, less liquid markets, in which it may be more difficult for the Adviser to sell at times and at prices that the Adviser believes appropriate and generally are more volatile than those of larger companies.
“Special Situation” Companies Risk – “Special situations” include a change in management or management policies, the acquisition of a significant equity position in the company by others, a merger or reorganization, or the sale of spin-off of a division or subsidiary which, if resolved favorably, would improve the value of the company’s stock. If the actual or prospective situation does not materialize as anticipated, the market price of the securities of a special situation company may decline significantly. There can be no assurance that a special situation that exists at the time of its investment will be consummated under the terms and within the time period contemplated. Investments in “special situations” companies can present greater risks than investments in companies not experiencing special situations.
Undervalued Stock Risk – Undervalued stocks may perform differently from the market as a whole and may continue to be undervalued by the market for long periods of time. Although the Fund will not concentrate its investments in any one industry or industry groups, it may weigh its investments toward certain industries, thus increasing its exposure to factors adversely affecting issues within these industries.
Please refer to pages 6-7 for other important disclosures and definitions.
25
|
|
|
|
| |
|
|
|
|
|
|
|
|
|
|
|
|
|
|
|
|
|
| |||||||||||||
Comparative Annualized Returns as of 10/31/12 (unaudited) | |||||||||||||
|
|
|
|
|
|
|
|
|
|
|
|
|
|
|
| 1 Year |
| 3 Years |
| 5 Years |
| Since Inception |
| ||||
Alpine Innovators Fund — Institutional Class |
| 8.11% |
|
| 11.70% |
|
| -3.65% |
|
| 2.85% |
|
|
Russell 3000® Index |
| 14.75% |
|
| 13.58% |
|
| 0.59% |
|
| 4.05% |
|
|
Russell 2000® Growth Index |
| 9.70% |
|
| 15.74% |
|
| 1.41% |
|
| 4.89% |
|
|
S&P 500® Index |
| 15.21% |
|
| 13.21% |
|
| 0.36% |
|
| 3.92% |
|
|
Lipper Multi-Cap Growth Funds Average(1) |
| 9.36% |
|
| 12.34% |
|
| -0.58% |
|
| 4.68% |
|
|
Lipper Multi-Cap Growth Funds Ranking(1) |
| 366/535 |
|
| 274/466 |
|
| 354/398 |
|
| 264/339 |
|
|
Gross Expense Ratio: 1.59%(2) |
|
|
|
|
|
|
|
|
|
|
|
|
|
Net Expense Ratio: 1.41%(2) |
|
|
|
|
|
|
|
|
|
|
|
|
|
|
|
|
|
|
| ||
| (1) | The since inception data represents the period beginning 7/13/2006. | |
| (2) | As disclosed in the prospectus dated February 28, 2012. | |
Performance data quoted represents past performance and is not predictive of future results. Investment return and principal value of the Fund fluctuate, so that the shares, when redeemed, may be worth more or less than their original cost. Performance current to the most recent month end may be lower or higher than performance quoted and may be obtained by calling 1-888-785-5578. Performance data shown does not reflect the 1.00% redemption fee imposed on shares held for fewer than 60 days. If it did, total returns would be reduced.
Performance of Class A shares is not shown because this share class commenced operations on December 30, 2011.
Russell 3000® Index measures the performance of the largest 3000 U.S. companies representing approximately 98% of the investable U.S. equity market. Russell 2000® Growth Index measures the performance of the small-cap growth segment of the U.S. equity universe. It includes those Russell 2000 Index companies with higher price-to-value ratios and higher forecasted growth values. The S&P 500® Index is float-adjusted market capitalization-weighted index of 500 common stocks chosen for market size, liquidity, and industry group representation to represent U.S. equity performance. The Lipper Multi-Cap Growth Funds Average — funds that, by portfolio practice, invest in a variety of market capitalization ranges without concentrating 75% of their equity assets in any one market capitalization range over an extended period of time. Multi-cap growth funds typically have an above-average price-to-earnings ratio, price-to-book ratio, and three-year sales per-share growth value, compared to the S&P SuperComposite 1500 Index. Lipper Rankings for the periods shown are based on fund total returns with dividends and distributions reinvested and do not reflect sales charges. The Russell 3000® Index, the Russell 2000® Growth Index, the S&P 500® Index and the Lipper Multi-Cap Growth Funds Average are unmanaged and do not reflect the deduction of direct fees associated with a mutual fund, such as investment advisor fees; however, the Lipper Multi-Cap Growth Funds Average reflects fees charged by the underlying funds. The performance for the Innovators Fund Reflects the deduction of fees for these value-added services. Investors cannot directly invest in an index.
Expense Ratios reflect the ratios reported in the Fund’s most recent prospectus. The Alpine Innovators Fund has a contractual expense waiver that continues through February 28, 2013. Where a Fund’s gross and net expense ratio are the period. To the extent the Fund’s expenses were reduced by waivers, the Fund’s total returns were increased. In these cases, in the absence of the expense waivers, the Fund’s total returns would have been lower.
The Fund’s past performance benefitted significantly from initial public offerings (“IPOs”) of certain issuers, and there is no assurance that the Fund can replicate this performance in the future. To the extent that the Fund’s historical performance resulted from gains derived from participation in Secondary offerings, there is no guarantee that these results can be replicated or that the Fund will be able to participate to the same degree in IPO/Secondary allocations in the future.
26
|
|
Alpine Innovators Fund (continued) |
|
|
| ||||||
Portfolio Distributions* (unaudited) |
| Top 10 Holdings* (unaudited) | |||||
|
| 1. |
| priceline.com, Inc. | 15.66 | % | |
|
| 2. |
| ANSYS, Inc. | 10.58 | % | |
| 3. |
| Intuitive Surgical, Inc. | 6.91 | % | ||
| 4. |
| Life Technologies Corp. | 4.90 | % | ||
| 5. |
| Flowserve Corp. | 4.81 | % | ||
| 6. |
| Google, Inc.-Class A | 4.33 | % | ||
| 7. |
| Bio-Reference Labs, Inc. | 4.29 | % | ||
| 8. |
| MEDNAX, Inc. | 3.77 | % | ||
| 9. |
| Copart, Inc. | 2.88 | % | ||
| 10. |
| Apple, Inc. | 2.71 | % | ||
|
|
|
| ||||
| * | Top 10 Holdings do not include short-term investments and percentages are based on total net assets. Portfolio Distributions percentages are based on total investments. Portfolio holdings and sector distributions are as of 10/31/12 and are subject to change. Portfolio holdings are not recommendations to buy or sell any securities. | |||||
|
|
|
|
|
| ||
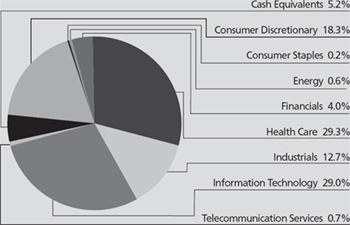
|
Value of a $10,000 Investment (unaudited) |
|
|
|
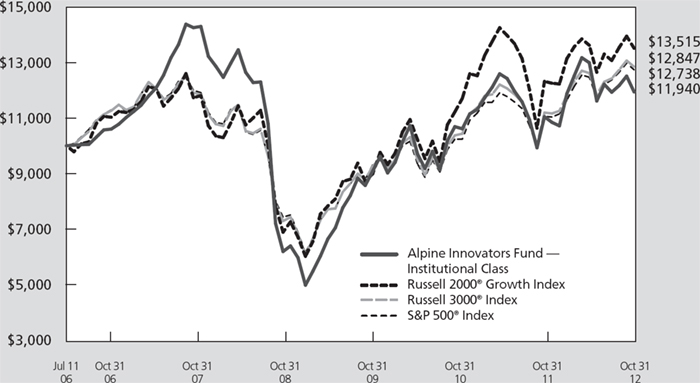
This chart represents a comparison of a hypothetical $10,000 investment in the Fund versus a similar investment in the Fund’s benchmark. The graph and the table do not reflect the deduction of taxes that a shareholder would pay on Fund distributions or the redemption of Fund shares. Investment performance reflects the waiver and recovery of certain fees, if applicable. Without the waiver and recovery of fees, the Fund’s total return would have differed.
Performance data quoted represents past performance and is not predictive of future results. Investment return and principal value of the Fund fluctuate, so that the shares, when redeemed, may be worth more or less than their original cost.
27
|
|
Alpine Innovators Fund (continued) |
|
|
Commentary |
The Alpine Innovators Fund provided an 8.11% return for the fiscal year ended October 31, 2012. This return compared with 15.21% for the S&P 500® Index. Companies which we expect to increase growth through innovative products or management strategies remained the dominant portfolio theme. All references in this letter to the Fund’s performance relate to the performance of the Fund’s Institutional Class.
2012 has been a volatile year, with the uncertainties surrounding a Presidential election, continued financial problems in Europe and a looming “fiscal cliff” in the U.S. When policy direction is unclear, corporations tend to pull back, and while 2012 started with better economic statistics and an optimistic slant, much of that faded through the summer and into the fall. We expect that as the electioneering ends, and U.S. politicians face choices no longer easily deferred, some of the uncertainty will ebb, and businesses and consumers can begin to get back to making decisions instead of sitting on their cash.
Performance in the Innovators Fund was negatively impacted by being underweight financials and energy. Because the Fund seeks innovative companies, there is a tendency to be overweight in the healthcare, information technology and consumer discretionary sectors, and 2012 was no exception. Our consumer discretionary stocks, however, underperformed in 2012. Zagg, a consumer technology company that makes accessories for Apple products, Mitek Systems, a provider of software for mobile phone banking applications and Quality Systems, a health care software provider were the stocks that most negatively impacted 2012 performance.
The leading contributors to portfolio return during this period were: Westport Innovations, Inc. up 50.27%, Ansys Inc. up 29.23%, Flowserve, Inc. up 47.83%, Intuitive Surgical, up 24.98% and Ariad Pharmaceuticals, up 85.30%. Each of these issues was a significant holding in the portfolio, with a combined average weight of 24.75%*. The five leading detractors to the performance of the portfolio were generally of minor weightings. The combined average weighting of these five holdings was 7.97%* of the portfolio. The largest adverse return, based on contribution, was -46.29% in Zagg, Inc. Mitek Systems returned -68.45%. Quality Systems was down 54.03%, Mako Surgical declined 60.76% and Flir Systems dropped 25.47%.
Among industries that we believe tend more towards innovation and innovative products, the Fund has a higher concentration in the health care (28%) and information technology (26%) sectors. We look at many different companies in many sectors, finding innovation in some unique technologies such as Westport, a company which makes natural gas engines for the municipal market in buses and garbage trucks as well as natural gas engines and components for heavy and medium-duty trucks worldwide. Flowserve, a company which makes pumps and systems for the oil and gas industry is an innovative company, creating a worldwide service network to supply customers with parts in 24 hours or less nearly across the globe.
Our three largest holdings as of October 31, 2012 are Priceline.com, Inc., which was purchased in October 2007 in order to seek to participate in the innovative opportunity for growth in its internet based priced discounting service for hotel and travel reservations, Ansys, Inc. a leader in development of computer system based engineering analysis available on a contract basis and Intuitive Surgical – first purchased in July 2007 – a leader in robotic surgery systems and supplies whose products allow less invasive and more precisely controlled surgery. Our goal is to build a portfolio of companies that we believe have a competitive advantage and offer superior growth potential due to the innovative nature of each company’s products, technology or business model.
We believe innovation may lead to dynamic investment performance even in an environment of somewhat tepid growth such as we have experienced in the last several years and that may continue as western countries try to resolve difficult demographic and fiscal issues.
Sincerely,
Stephen A. Lieber
Samuel A. Lieber
Co-Portfolio Managers
|
|
* | Average weights for each individual holding referenced were as follows: Westport Innovations Inc., 3.67%, Ansys Inc., 9.11%, Flowserve Corp., 4.01%, Intuitive Surgical Inc., 6.15%, Ariad Pharmaceuticals Inc., 1.81%, ZAGG Inc., 2.09%, Mitek Systems Inc., 1.13%, Quality Systems Inc., 1.10%, MAKO Surgical Corp., 1.07%, FLIR Systems Inc., 2.58%, and Priceline.com, 15.77%. |
28
|
|
Alpine Innovators Fund (continued) |
|
|
|
| |
Mutual fund investing involves risk. Principal loss is possible. The Fund is subject to risks, including the following: | |
Equity Securities Risk – The stock or other security of a company may not perform as well as expected, and may decrease in value, because of factors related to the company (such as poorer than expected earnings or certain management decisions) or to the industry in which the company is engaged (such as a reduction in the demand for products or services in a particular industry).
Growth Stock Risk – Growth stocks are stocks of companies believed to have above-average potential for growth in revenue and earnings. Growth stocks typically are very sensitive to market movements because their market prices tend to reflect future expectations. When it appears those expectations will not be met, the prices of growth stocks typically fall. Growth stocks as a group may be out of favor and underperform the overall equity market while the market concentrates on undervalued stocks.
Initial Public Offerings and Secondary Risk – The Fund may invest a portion of its assets in shares of IPOs or Secondary Offerings of an issuer. IPOs and Secondary Offerings may have a magnified impact on the performance of a Fund with a small asset base. The impact of IPOs and Secondary Offerings on a Fund’s performance likely will decrease as the Fund’s asset size increases, which could reduce a Fund’s returns. IPOs and Secondary Offerings may not be consistently available to the Fund for investing. IPO and Secondary Offering shares frequently are volatile in price due to the absence of a prior public market, the small number of shares available for trading and limited information about the issuer. Therefore, the Fund may hold IPO and secondary offering shares for a very short period of time. This may increase the turnover of the Fund and may lead to increased expenses for the Fund, such as commissions and transaction costs. In addition, IPO and Secondary Offering shares can experience an immediate drop in value if the demand for the securities does not continue to support the offering price.
Innovators Risk – The Adviser seeks to invest in the securities of companies that the Adviser believes have a competitive advantage and offer superior growth potential due to the innovative nature of each company’s products, technology or business model. No assurance can be made that these perceived innovations will occur, or, if they do, that they will result in the vigorous growth anticipated by the Adviser or such growth may be significantly delayed.
Leverage Risk – The Fund may use leverage to purchase securities. Increases and decreases in the value of the Fund’s portfolio will be magnified when the Fund uses leverage.
Management Risk – The Adviser’s judgment about the quality, relative yield or value of, or market trends affecting, a particular security or sector, or about interest rates generally, may be incorrect. The Adviser’s security selections and other investment decisions might produce losses or cause the Fund to underperform when compared to other funds with similar investment objectives and strategies.
Market Risk – The price of a security held by the Fund may fall due to changing market, economic or political conditions.
Micro Capitalization Company Risk – Investments in micro-cap companies are associated with similar risks as investments in small and medium capitalization companies, but these risks may be even greater with respect to investments in micro-cap companies.
Portfolio Turnover Risk – High portfolio turnover necessarily results in greater transaction costs which may reduce Fund performance.
Small- and Medium-Capitalization Company Risk – Securities of small- or medium-capitalization companies are more likely to experience sharper swings in market values, less liquid markets, in which it may be more difficult for the Adviser to sell at times and at prices that the Adviser believes appropriate and generally are more volatile than those of larger companies. Innovative companies may lack profitability which in turn may result in the lack of innovative support.
Undervalued Stock Risk – Undervalued stocks may perform differently from the market as a whole and may continue to be undervalued by the market for long periods of time. Although the Fund will not concentrate its investments in any one industry or industry groups, it may weigh its investments towards certain industries, thus increasing its exposure to factors adversely affecting issues within these industries.
Please refer to pages 6-7 for other important disclosures and definitions.
29
|
|
|
|
| |
|
|
|
|
|
|
|
|
|
|
|
|
|
|
Comparative Annualized Returns as of 10/31/12 (unaudited) | ||||||||||
|
|
|
|
|
|
|
| |||
|
| 1 Year |
| 3 Years |
| Since Inception |
| |||
Alpine Transformations Fund — Institutional Class |
| -0.17% |
|
| 15.16% |
|
| 3.51% |
|
|
Russell 3000® Index |
| 14.75% |
|
| 13.58% |
|
| 1.56% |
|
|
Russell 2000® Value Index |
| 14.47% |
|
| 13.83% |
|
| 2.60% |
|
|
S&P 500® TR (Total Return) Index |
| 15.21% |
|
| 13.21% |
|
| 1.26% |
|
|
S&P MidCap 400® Index |
| 12.11% |
|
| 15.81% |
|
| 4.26% |
|
|
Lipper Multi-Cap Growth Funds Average |
| 9.36% |
|
| 12.34% |
|
| 0.41% |
|
|
Lipper Multi-Cap Growth Funds Ranking |
| 511/535 |
|
| 75/466 |
|
| 60/401 |
|
|
Gross Expense Ratio: 1.68%(1) |
|
|
|
|
|
|
|
|
|
|
Net Expense Ratio: 1.35%(1) |
|
|
|
|
|
|
|
|
|
|
|
|
|
|
|
| ||
| (1) | As disclosed in the prospectus dated February 28, 2012. | |
Performance data quoted represents past performance and is not predictive of future results. Investment return and principal value of the Fund fluctuate, so that the shares, when redeemed, may be worth more or less than their original cost. Performance current to the most recent month end may be lower or higher than performance quoted and may be obtained by calling 1-888-785-5578. Performance data shown does not reflect the 1.00% redemption fee imposed on shares held for fewer than 60 days. If it did, total returns would be reduced.
Performance of Class A shares is not shown because this share class commenced operations on December 30, 2011.
Russell 3000® Index measures the performance of the largest 3000 U.S. companies representing approximately 98% of the investable U.S. equity market. Russell 2000® Value Index measures the performance of small-cap value segment of the U.S. equity universe. It includes those Russell 2000 Index companies with lower price-to-book ratios and lower forecasted growth values. The S&P 500® Index is float-adjusted market capitalization-weighted index of 500 common stocks chosen for market size, liquidity, and industry group representation to represent U.S. equity performance. The S&P MidCap 400® Index is a float-adjusted market capitalization-weighted index of 400 medium-capitalization domestic stocks chosen for market size, liquidity, and industry group representation. The Lipper Multi-Cap Growth Funds Average — Funds that, by portfolio practice, invest in a variety of market capitalization ranges without concentrating 75% of their equity assets in any one market capitalization range over an extended period of time. Multi-cap growth funds typically have an above-average price-to-earnings ratio, price-to-book ratio, and three-year sales per-share growth value, compared to the S&P SuperComposite 1500 Index. Lipper Rankings for the periods shown are based on fund total returns with dividends and distributions reinvested and do not reflect sales charges. The Russell 3000® Index, the Russell 2000® Value Index, the S&P 500® Index, the S&P MidCap 400® Index and the Lipper Multi-Cap Growth Funds Average are unmanaged and do not reflect the deduction of direct fees associated with a mutual fund, such as investment advisor fees; however, the Lipper Multi-Cap Growth Funds Average reflects fees charged by the underlying funds. The performance for the Transformations Fund reflects the deduction of fees for these value-added services. Investors cannot directly invest in an index.
Expense Ratios reflect the ratios reported in the Fund’s most recent prospectus. The Alpine Transformations Fund has a contractual expense waiver that continues through February 28, 2013. Where a Fund’s gross and net expense ratio are the same for the period reported, the contractual expense reimbursement level was not reached as of the end of that period. To the extent the Fund’s expenses were reduced by waivers, the Fund’s total returns were increased. In these cases, in the absence of the expense waivers, the Fund’s total returns would have been lower.
To the extent that the Fund’s historical performance resulted from gains derived from participation in initial public offerings (“IPOs”) and/or Secondary offerings, there is no guarantee that these results can be replicated in future periods or that the Fund will be able to participate to the same degree in IPO/Secondary allocations in the future.
30
|
|
Alpine Transformations Fund (continued) |
|
|
|
|
|
|
|
|
|
|
Portfolio Distributions* (unaudited) |
| Top 10 Holdings* (unaudited) |
|
| ||||
|
| 1. |
| Intuitive Surgical, Inc. | 8.78% |
| ||
| 2. |
| priceline.com, Inc. | 7.43% |
| |||
3. |
| Generac Holdings, Inc. | 4.41% |
| ||||
4. |
| Apple, Inc. | 3.86% |
| ||||
5. |
| Snap-On, Inc. | 3.76% |
| ||||
6. |
| Cummins, Inc. | 3.64% |
| ||||
7. |
| SolarWinds, Inc. | 3.28% |
| ||||
8. |
| Garmin, Ltd. | 3.08% |
| ||||
9. |
| Starbucks Corp. | 2.97% |
| ||||
10. |
| Cray, Inc. | 2.91% |
| ||||
|
|
| ||||||
* |
| Top 10 Holdings do not include short-term investments and percentages are based on total net assets. Portfolio Distributions percentages are based on total investments. Portfolio holdings and sector distributions are as of 10/31/12 and are subject to change. Portfolio holdings are not recommendations to buy or sell any securities. |
| |||||
|
|
|
| |||||
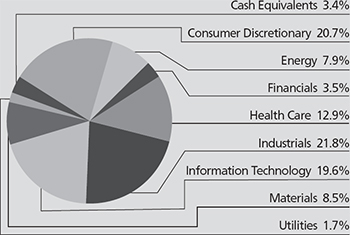
|
Value of a $10,000 Investment (unaudited) |
|
|
|
|
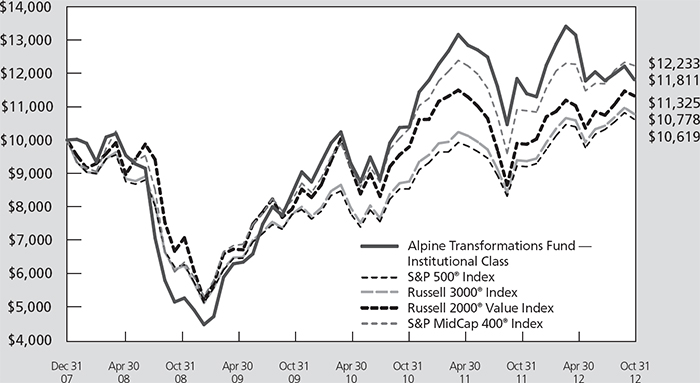
This chart represents a comparison of a hypothetical $10,000 investment in the Fund versus a similar investment in the Fund’s benchmark. The graph and the table do not reflect the deduction of taxes that a shareholder would pay on Fund distributions or the redemption of Fund shares. Investment performance reflects the waiver and recovery of certain fees, if applicable. Without the waiver and recovery of fees, the Fund’s total return would have differed.
Performance data quoted represents past performance and is not predictive of future results. Investment return and principal value of the Fund fluctuate, so that the shares, when redeemed, may be worth more or less than their original cost.
31
|
|
Alpine Transformations Fund (continued) |
|
|
Commentary |
The Alpine Transformations Fund investment result for the fiscal year 2012 was a loss of 0.17%. This compared with a gain of 15.21% for the S&P 500® Index. All references in this letter to the Fund’s performance relate to the performance of the Fund’s Institutional Class.
2012 has been a volatile year, with the uncertainties surrounding a Presidential election, continued financial problems in Europe and a looming “fiscal cliff” in the U.S. When policy direction is unclear, corporations tend to pull back and while 2012 started with better economic statistics and an optimistic slant, much of that faded through the summer and into the fall. We expect that as the electioneering ends, and U.S. politicians face choices no longer easily deferred, some of the uncertainty will ebb, and businesses and consumers can begin to get back to making decisions instead of sitting on their cash.
In 2012 the Fund was negatively impacted by its overweight positions in consumer discretionary stocks and its underweight positions in energy, financials, and materials which had a negative effect on performance. While the portfolio underperformed its benchmark, we believe that we have designed a portfolio with growth potential over the longer term.
Among the five top contributors to performance, with a combined average weight of 13.83 %* of the portfolio, the best performer was Westport Innovations, up 50.02%. Westport manufactures heavy-duty engines and system components for buses and trucks that use natural gas as a fuel. Next in performance was Intuitive Surgical Inc. which rose 24.98%. This company has been a pioneering leader in the robotic surgery equipment market which is literally transforming patient treatment in a variety of surgery procedures. The third largest contributor to performance was Generac, up 51.77%, which makes generators for the U.S. residential market. The fourth contributor to performance was Cray Inc. which provided a total return of 99.66%. This gain reflected the inauguration of new products designed with technology developed from the company’s super computers. The fifth top contributor to performance in the portfolio was Solar Winds, which was up 67.54%. Solar Winds makes network management software.
In contrast to the top five contributors, we note the negative results of the Fund’s most challenged holdings which combined for a 10.33%* total average weight of the portfolio. Tempur-Pedic fell 61.15% as a new marketing strategy caused concerns that the company was having problems with growth. Carbo Ceramics Inc. fell 49.77% as the rapid decline in the price of natural gas, as well as new entrants in their markets, led investors to question whether the company would be able to maintain its growth rate based on its ceramic proppants used in drilling in shale deposits for natural gas. Mitek
Systems Inc. was down 68.45% as its shares fell sharply when another organization sued to contest its proprietary system for bank deposit check reading utilizing “Smart” cell phones. Navistar, which had been in a downtrend, fell further after our purchase, down 41.62% after the company was forced by competitors and the EPA to abandon their truck engine technology and change their strategy. Zagg Inc fell 45.11% as the outlook for peripheral devices for consumer electronics weakened with slow PC sales. Companies in transformation often face difficulties on more than one front, and we believe that we will see some recovery from these low prices.
Our three largest holdings as of October 31, 2012 are Intuitive Surgical – purchased in October 2008 – a leader in robotic surgery systems and supplies whose products allow less invasive and more precisely controlled surgery, Priceline.com, Inc. – purchased in March 2008 – in order to seek to participate in its innovative opportunity for growth in its internet based priced discounting service for hotel and travel reservations, and Generac Holdings, Inc., which was purchased in August 2012. Generac is the largest independent manufacturer of electric generators whose business has done well with the increase in the volatility of the weather and subsequent damages to power grids, etc.
The transformation of a company can take some time, often measured in years rather than in quarters. We believe that markets can be short-sighted, especially when it comes to industries or individual companies in transition. We seek to find good companies in flux or transition, as well as those moving into new products, geographies or areas of expertise and to try to exploit this short-sightedness, and will continue to look for investment opportunities for this Fund that we believe are undervalued and have the potential for vigorous growth.
Sincerely,
Stephen A. Lieber
Sarah Hunt
Co-Portfolio Managers
* Average weights for each individual holding referenced were as follows: Westport Innovations Inc., 1.44%, Intuitive Surgical Inc., 7.46%, General Holdings Inc., 0.43%, Cray Inc., 2.00%, SolarWinds Inc., 2.49%, Tempur-Pedic International Inc.2.97%, CARBO Ceramics Inc., 2.39%, Mitek Systems Inc., 1.91%, Navistar International Corp., 1.00%, ZAGG Inc., 2.07%, Priceline.com, 6.95%, and Generac Holdings, 0.43%.
32
|
|
Alpine Transformations Fund (continued) |
|
|
|
| |
Mutual fund investing involves risk. Principal loss is possible. The Fund is subject to risks, including the following: | |
Emerging Market Securities Risk – The risks of investing in foreign securities can be intensified in the case of investments in issuers domiciled or operating in emerging market countries. These risks include lack of liquidity and greater price volatility, greater risks of expropriation, less developed legal systems and less reliable custodial services and settlement practices.
Equity Securities Risk – The stock or other security of a company may not perform as well as expected, and may decrease in value, because of factors related to the company (such as poorer than expected earnings or certain management decisions) or to the industry in which the company is engaged (such as a reduction in the demand for products or services in a particular industry).
Foreign Currency Transactions Risk – Foreign securities are often denominated in foreign currencies. As a result, the value of the Fund’s shares is affected by changes in exchange rates. The Fund may enter into foreign currency transactions to try to manage this risk. The Fund’s ability to use foreign currency transactions successfully depends on a number of factors, including the foreign currency transactions being available at prices that are not too costly, the availability of liquid markets and the ability of the portfolio managers to accurately predict the direction of changes in currency exchange rates.
Foreign Securities Risk – Public information available concerning foreign issuers may be more limited than it would be with respect to domestic issuers. Different accounting standards may be used by foreign issuers, and foreign trading markets may not be as liquid as U.S. markets. Currency fluctuations could erase investment gains or add to investment losses. Additionally, foreign securities also involve possible imposition of withholding or confiscatory taxes and adverse political or economic developments. These risks may be greater in emerging markets.
Growth Stock Risk – Growth stocks are stocks of companies believed to have above-average potential for growth in revenue and earnings. Growth stocks typically are very sensitive to market movements because their market prices tend to reflect future expectations. When it appears those expectations will not be met, the prices of growth stocks typically fall. Growth stocks as a group may be out of favor and underperform the overall equity market while the market concentrates on undervalued stocks.
Management Risk – The Adviser’s judgment about the quality, relative yield or value of, or market trends affecting, a particular security or sector, or about interest rates generally, may be incorrect. The Adviser’s security selections and other investment decisions might produce losses or cause the Fund to underperform when compared to other funds with similar investment objectives and strategies.
Market Risk – The price of a security held by the Fund may fall due to changing market, economic or political conditions.
Micro-Capitalization Company Risk – Investments in micro-cap companies are associated with similar risks as investments in small and medium capitalization companies, but these risks may be even greater with respect to investments in micro-cap companies.
Small- and Medium-Capitalization Company Risk – Securities of small- or medium-capitalization companies are more likely to experience sharper swings in market values, less liquid markets, in which it may be more difficult for the Adviser to sell at times and at prices that the Adviser believes appropriate and generally are more volatile than those of larger companies.
Special Situations Risk – “Special situations” include a change in management or management policies, the acquisition of a significant equity position in the company by others, a merger or reorganization, or the sale of spin-off of a division or subsidiary which, if resolved favorably, would improve the value of the company’s stock. If the actual or prospective situation does not materialize as anticipated, the market price of the securities of a special situation company may decline significantly. There can be no assurance that a special situation that exists at the time of its investment will be consummated under the terms and within the time period contemplated. Investments in “special situations” companies can present greater risks than investments in companies not experiencing special situations.
Transformation Risk – The Adviser seeks to invest in the securities of companies that the Adviser believes are entering or on the verge of entering a corporate transformation. No assurance can be made that these transformations will result in the vigorous growth anticipated by the Adviser or such growth may be significantly delayed.
Undervalued Stock Risk – Undervalued stocks may perform differently from the market as a whole and may continue to be undervalued by the market for long periods of time. Although the Fund will not concentrate its investments in any one industry or industry groups, it may weigh its investments towards certain industries, thus increasing its exposure to factors adversely affecting issues within these industries.
Please refer to pages 6-7 for other important disclosures and definitions.
33
|
|
|
|
| |
|
|
|
|
|
|
|
|
|
|
|
|
|
|
|
|
|
|
|
Comparative Annualized Returns as of 10/31/12 (unaudited) | |||||||||||||||
|
|
|
|
|
|
|
|
|
|
|
|
|
|
|
|
|
| 1 Year |
|
| 3 Years |
|
| 5 Years |
|
| 10 Years |
|
| Since Inception | |
Alpine Foundation Fund — Institutional Class |
| 9.95% |
|
| 10.57% |
|
| -0.08% |
|
| 5.89% |
|
| 4.64% |
|
S&P 500® Index |
| 15.21% |
|
| 13.21% |
|
| 0.36% |
|
| 6.91% |
|
| 2.92% |
|
Custom Balanced Benchmark |
| 11.29% |
|
| 10.67% |
|
| 3.19% |
|
| 6.60% |
|
| 4.42% |
|
Lipper Mixed-Asset Target Allocation Growth |
| 9.58% |
|
| 9.06% |
|
| 0.60% |
|
| 6.39% |
|
| 3.69% |
|
Lipper Mixed-Asset Target Allocation Growth |
| 243/556 |
|
| 83/523 |
|
| 311/475 |
|
| 173/257 |
|
| 47/211 |
|
Gross Expense Ratio: 1.19%(1) |
|
|
|
|
|
|
|
|
|
|
|
|
|
|
|
Net Expense Ratio: 1.19%(1) |
|
|
|
|
|
|
|
|
|
|
|
|
|
|
|
|
|
|
|
|
| ||
| (1) | As disclosed in the prospectus dated February 28, 2012. | |
Performance data quoted represents past performance and is not predictive of future results. Investment return and principal value of the Fund fluctuate, so that the shares, when redeemed, may be worth more or less than their original cost. Performance current to the most recent month end may be lower or higher than performance quoted and may be obtained by calling 1-888-785-5578. Performance data shown does not reflect the 1.00% redemption fee imposed on shares held for fewer than 60 days. If it did, total returns would be reduced.
Performance of Class A shares is not shown because this share class commenced operations on December 30, 2011.
The S&P 500® Index is float-adjusted market capitalization-weighted index of 500 common stocks chosen for market size, liquidity, and industry group representation to represent U.S. equity performance. The Custom Balanced Benchmark reflects an unmanaged portfolio (rebalanced monthly) of 60% of the S&P 500® Index, which is a market capitalization-weighted index of 500 large capitalization stocks commonly used to represent the U.S. equity market, and 40% of the Barclays Capital U.S. Aggregate Bond Index (BCAG), which is a widely recognized, unmanaged index of U.S. dollar-denominated investment-grade fixed income securities. The Fund may, however, invest up to 75% of its total assets in equity securities. The Lipper Mixed-Asset Target Allocation Growth Funds Average is an average of funds that, by portfolio practice, maintain a mix of between 60%-80% equity securities, with the remainder invested in bonds, cash, and cash equivalents. Lipper Rankings for the periods shown are based on fund total returns with dividends and distributions reinvested and do not reflect sales charges. The S&P 500® Index and the Lipper Mixed-Asset Target Allocation Growth Funds Average are unmanaged and do not reflect the deduction of direct fees associated with a mutual fund, such as investment adviser fees; however, the Lipper Mixed-Asset Target Allocation Growth Funds Average reflects fees charged by the underlying funds. The performance for the Foundation Fund reflects the deduction of fees for these value-added services. Investors cannot directly invest in an index.
Expense Ratios reflect the ratios reported in the Fund’s most recent prospectus. The Alpine Foundation Fund has a contractual expense waiver that continues through February 28, 2013. Where a Fund’s gross and net expense ratio are the same for the period reported, the contractual expense reimbursement level was not reached as of the end of that period. To the extent the Fund’s expenses were reduced by waivers, the Fund’s total returns were increased. In these cases, in the absence of the expense waivers, the Fund’s total returns would have been lower.
To the extent that the Fund’s historical performance resulted from gains derived from participation in initial public offerings (“IPOs”) and/or Secondary offerings, there is no guarantee that these results can be replicated in future periods or that the Fund will be able to participate to the same degree in IPO/Secondary allocations in the future.
34
|
|
Alpine Foundation Fund (continued) |
|
|
|
|
|
|
|
| |
Portfolio Distributions* (unaudited) |
| Top 10 Holdings* (unaudited) | |||||
|
| 1. |
| U.S. Treasury Bonds, |
|
| |
|
|
|
| 6.000%, 02/15/2026 | 13.35 | % | |
| 2. |
| U.S. Treasury Bonds, |
|
| ||
|
|
| 5.250%, 11/15/2028 | 8.52 | % | ||
| 3. |
| Simon Property Group, Inc. | 5.54 | % | ||
| 4. |
| CBL & Associates Properties, Inc. | 3.41 | % | ||
| 5. |
| International Business |
|
| ||
|
|
| Machines Corp. | 2.97 | % | ||
| 6. |
| Johnson & Johnson | 2.92 | % | ||
| 7. |
| JPMorgan Chase & Co. | 2.90 | % | ||
| 8. |
| Consol Energy, Inc. | 2.76 | % | ||
| 9. |
| General Electric Co. | 2.40 | % | ||
| 10. |
| Boston Properties, Inc. | 2.11 | % | ||
|
|
|
| ||||
| * | Top 10 Holdings do not include short-term investments and percentages are based on total net assets. Portfolio Distributions percentages are based on total investments. Portfolio holdings and sector distributions are as of 10/31/12 and are subject to change. Portfolio holdings are not recommendations to buy or sell any securities. | |||||
|
|
|
|
|
| ||
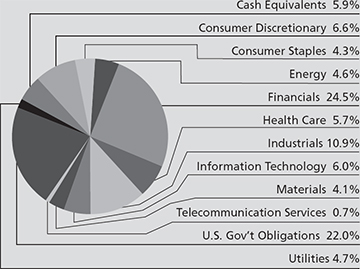
|
Value of a $10,000 Investment (unaudited) |
|
|
|
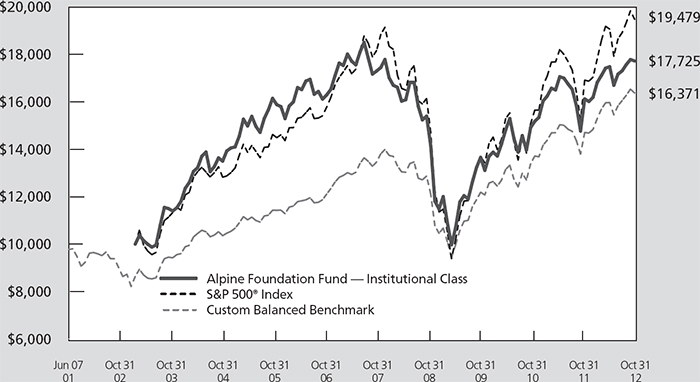
This chart represents a comparison of a hypothetical $10,000 investment in the Fund versus a similar investment in the Fund’s benchmark. The graph and the table do not reflect the deduction of taxes that a shareholder would pay on Fund distributions or the redemption of Fund shares. Investment performance reflects the waiver and recovery of certain fees, if applicable. Without the waiver and recovery of fees, the Fund’s total return would have differed.
Performance data quoted represents past performance and is not predictive of future results. Investment return and principal value of the Fund fluctuate, so that the shares, when redeemed, may be worth more or less than their original cost.
35
|
|
Alpine Foundation Fund (continued) |
|
|
Commentary |
The Alpine Foundation Fund provided a 9.95% total return for the fiscal year ended October 31, 2012. This return compared with the 11.29% return of the Custom Balanced Benchmark and the S&P 500® Index return of 15.21% for the same period. Our portfolio investments remain consistent with the original strategy of maintaining at least 25% in fixed-income investments which we achieved through U.S. government obligations or cash equivalents. All references in this letter to the Fund’s performance relate to the performance of the Fund’s Institutional Class.
We have built portfolio investment holdings which we believe offer a solid foundation to important aspects of the economy. The Fund’s portfolio has included significant holdings in the area of financial services, based on our estimate that the full recovery of growth for the United States and world economies will require sustained strength among the financial services. Holdings in this category range from the leading custodian bank for institutional investors – State Street Bank* – to well-established regional banking systems such as PNC in Pennsylvania and Valley National Bank Corp in New Jersey, to leaders in the national arena such as Bank of America, JP Morgan Chase and Wells Fargo. Among all of these holdings, JP Morgan Chase represents our largest commitment.
We believe that investments such as these will demonstrate strength in a challenged economy and have the benefit of building through innovative products and transformative management strategies.
The fixed-income holdings will continue to follow a basic strategy of utilizing United States treasury obligations. We recognize that yields will vary and therefore have reduced the size of our US Treasury bond position while taking profits – our aim will be to reestablish these investments at opportune moments in the cycle of the bond market.
The Foundation Fund was underweight the information technology, energy, consumer staples and healthcare sectors, which had a negative impact on performance. The fund was overweight in the financial sector, which was positive for performance. The stocks that had the most negative impact were Consol Energy, a coal and natural gas producer, Joy Global, a manufacturer of equipment sold to the coal mining industry, and Hewlett-Packard, the maker of computer and printing equipment.
The top contributors to performance from the equity portfolio for the year were as follows:
|
|
| Return |
CBL & Associates Properties | 52.42% |
Simon Property Group | 21.98% |
Lennar Corp. Cl A | 127.83% |
General Electric | 30.46% |
JPMorgan Chase & Co. | 23.48% |
The combined average weight for the period for these securities was 14.35%**.
The bottom contributors to performance from the equity portfolio for the year were as follows:
|
|
| Return |
Consol Energy Inc. | -16.84% |
Joy Global Inc. | -28.77% |
Hewlett-Packard Co. | -46.75% |
World Fuel Services Corp. | -12.69% |
Norfolk Southern Corp. | -14.26% |
The combined average weight for the period for these securities was 6.25%**.
The name of the Fund was changed from Alpine Dynamic Balance Fund to Alpine Foundation Fund effective January 3, 2012. This change reflected our view that the Fund should be managed with a goal of being the foundation of a diverse, conservatively managed portfolio with an emphasis on stocks to generate income as well increase in capital.
There were no changes in the fixed-income segment of the portfolio. Interest rates remain subdued as the Federal Reserve is continuing their low interest rate policies. The Federal Reserve has communicated a strategy of low interest rates for a longer period of time to help the economy return to growth.
In managing this fund, we seek to select the shares of companies which may provide unusual and consistent strength in their basic positioning and operating achievements. This is evident in the two of the top equity holdings. Simon Property Group has sustained a unique leadership position among owners and developers of shopping centers and malls sustaining earnings growth through its focus on the well to do consumer. IBM, with its established leadership position in data and information technologies was began a transformation; when these niches became mature and the company was faced with significant competition, it moved on to establish new leadership positions in related services. Thus today, IBM is a worldwide service leader in the fields of information technology and no longer the hardware leader.
We continue to believe in investing in companies which we believe offer growth potential with reasonable income potential and in fixed income securities that offer the potential for both growth and income.
Stephen A. Lieber
Portfolio Manager
|
* State Street Bank provides custody, accounting and administration to the Fund. |
** Average weights for each individual holding were as follows: CBL & Associates Properties Inc., 2.87%, Simon Property Group Inc., 5.38%, Lennar Corp. Cl A, 1.17%, General Electric Co. 2.27%, JPMorgan Chase & Co. 2.67%, Consol Energy Inc. 2.99%, Joy Global Inc. 0.68%, Hewlett-Packard Co. 0.50%, World Fuel Services Corp. 0.98%, Norfolk Southern Corp. 1.11%, State Street Bank, 1.68%, PNC Financial, 0.47%, Valley National Bank Corp., 0.60%, Bank of America Corp., 0.76%, and Wells Fargo & Co., 0.51%. |
36
|
|
Alpine Foundation Fund (continued) |
|
|
|
| |
Mutual fund investing involves risk. Principal loss is possible. The Fund is subject to risks, including the following: | |
Credit Risk – Credit risk refers to the possibility that the issuer of a security will not be able to make payments of interest and principal when due. Changes in an issuer’s credit rating or the market’s perception of an issuer’s creditworthiness may also affect the value of the Fund’s investment in that issuer.
Equity Securities Risk – The stock or other security of a company may not perform as well as expected, and may decrease in value, because of factors related to the company (such as poorer than expected earnings or certain management decisions) or to the industry in which the company is engaged (such as a reduction in the demand for products or services in a particular industry).
Fixed-Income Securities Risk – Fixed-income securities are subject to issuer risk, interest rate risk and market risk.
Government Securities Risk – U.S. government securities are obligations of, or guaranteed by, the U.S. government, its agencies or government-sponsored entities. U.S. government securities include issues by non-governmental entities (such as financial institutions) that carry direct guarantees from U.S. government agencies as part of government initiatives in response to the market crisis or otherwise. Although the U.S. government guarantees principal and interest paymentson securities issued by the U.S. government and some of its agencies, such as securities issued by the Government National Mortgage Association (Ginnie Mae), this guarantee does not apply to losses resulting from declines in the market value of these securities. Some of the U.S. government securities that the Fund may hold are not guaranteed or backed by the full faith and credit of the U.S. government, such as those issued by the Federal National Mortgage Association (Fannie Mae) and the Federal Home Loan Mortgage Corporation (Freddie Mac). Although the U.S. government has recently provided financial support to Fannie Mae and Freddie Mac, there can be no assurance that it will support these or other government-sponsored enterprises in the future.
Growth Stock Risk – Growth stocks typically are very sensitive to market movements because their market prices tend to reflect future expectations. When it appears those expectations will not be met, the prices of growth stocks typically fall. Growth stocks as a group may be out of favor and underperform the overall equity market while the market concentrates on undervalued stocks. Although the Fund will not concentrate its investments in any one industry or industry group, it may, like many growth funds, weight its investments toward certain industries, thus increasing its exposure to factors adversely affecting issuers within those industries.
Interest Rate Risk – Interest rates may rise resulting in a decrease in the value of securities held by the Fund, or may fall resulting in an increase in the value of such securities. Securities having longer maturities generally involve a greater risk of fluctuations in the value resulting from changes in interest rates.
Issuer Risk – Changes in the financial condition of the issuer of an obligation, changes in general economic conditions, or changes in economic conditions that affect the issuer may impact its actual or perceived willingness or ability to make timely payments of interest or principal.
Management Risk – The Adviser’s judgment about the quality, relative yield or value of, or market trends affecting, a particular security or sector, or about interest rates generally, may be incorrect. The Adviser’s security selections and other investment decisions might produce losses or cause the Fund to underperform when compared to other funds with similar investment objectives and strategies.
Market Risk – The price of a security held by the Fund may fall due to changing market, economic or political conditions.
Micro-Capitalization Company Risk – The Fund may invest in the stocks of micro-cap companies with capitalizations under $100 million. Investments in micro-cap companies are associated with similar risks as investments in small and medium capitalization companies, but these risks may be even greater with respect to investments in micro-cap companies. Accordingly, the stocks of micro-cap companies may be more volatile and more thinly traded, and therefore more illiquid, than stocks of companies with larger capitalizations.
Small- and Medium-Capitalization Company Risk – Securities of small- or medium-capitalization companies are more likely to experience sharper swings in market values, less liquid markets, in which it may be more difficult for the Adviser to sell at times and at prices that the Adviser believes appropriate and generally are more volatile than those of larger companies.
Undervalued Stock Risk – Undervalued stocks may perform differently from the market as a whole and may continue to be undervalued by the market for long periods of time.
Please refer to pages 6-7 for other important disclosures and definitions.
37

|
|
|
|
| Alpine Ultra Short Tax Optimized Income Fund |
|
|
|
|
| Alpine Municipal Money Market Fund |
|
|
|
|
| |
|
|
|
|
|
|
|
|
|
|
|
|
|
|
|
|
|
Comparative Annualized Returns as of 10/31/12 (unaudited) | |||||||||||||
|
| 1 Year |
| 3 Years |
| 5 Years |
| Since Inception(1) |
| ||||
Alpine Ultra Short Tax Optimized Income |
| 0.95% |
|
| 1.38% |
|
| 2.30% |
|
| 2.80% |
|
|
Alpine Ultra Short Tax Optimized Income |
| 0.71% |
|
| 1.29% |
|
| 2.23% |
|
| 2.52% |
|
|
Alpine Ultra Short Tax Optimized Income |
| 0.71% |
|
| 1.29% |
|
| 2.22% |
|
| 2.52% |
|
|
Alpine Ultra Short Tax Optimized Income |
| 0.20% |
|
| 0.95% |
|
| 1.92% |
|
| 2.34% |
|
|
Alpine Ultra Short Tax Optimized Income |
| 0.53% |
|
| 1.06% |
|
| 1.97% |
|
| 2.15% |
|
|
Alpine Ultra Short Tax Optimized Income |
| 0.53% |
|
| 1.06% |
|
| 1.97% |
|
| 2.17% |
|
|
Barclays Capital 1 Year Municipal Bond Index |
| 1.01% |
|
| 1.33% |
|
| 2.51% |
|
| 2.41% |
|
|
Lipper Short Municipal Debt Funds Average(2) |
| 2.03% |
|
| 1.94% |
|
| 2.32% |
|
| 2.17% |
|
|
Lipper Short Municipal Debt Funds |
| 73/90 |
|
| 53/78 |
|
| 34/60 |
|
| 7/43 |
|
|
Gross Expense Ratio (Institutional Class): 0.82%(3) |
|
|
|
|
|
|
|
|
|
|
|
|
|
Net Expense Ratio (Institutional Class): 0.63%(3) |
|
|
|
|
|
|
|
|
|
|
|
|
|
Gross Expense Ratio (Class A): 1.07%(3) |
|
|
|
|
|
|
|
|
|
|
|
|
|
Net Expense Ratio (Class A): 0.88%(3) |
|
|
|
|
|
|
|
|
|
|
|
|
|
|
|
|
|
|
| ||
| (1) | Institutional Class shares commenced on December 5, 2002 and Class A shares commenced on March 30, 2004. Returns for indices are since December 5, 2002. | |
| (2) | The since inception data represents the period beginning 12/31/2002. | |
| (3) | As disclosed in the prospectus dated February 28, 2012. | |
Performance data quoted represents past performance and is not predictive of future results. Investment return and principal value of the Fund fluctuate, so that the shares, when redeemed, may be worth more or less than their original cost. Performance current to the most recent month end may be lower or higher than performance quoted and may be obtained by calling 1-888-785-5578. Performance data shown does not reflect the 0.25% redemption fee imposed on shares held for fewer than 30 days. If it did, total returns would be reduced. Effective 10/12/07, Alpine Ultra Short Tax Optimized Fund - Class A began imposing a maximum sales charge of 0.50% on purchases. Performance data shown for time period beginning with dates after 10/12/07 reflect the sales charge.
Expense Ratios reflect the ratios reported in the Fund’s most recent prospectus. The Alpine Ultra Short Tax Optimized Income Fund has a contractual expense waiver that continues through February 28, 2013. Where a Fund’s gross and net expense ratio are the same for the period reported, the contractual expense reimbursement level was not reached as of the end of that period. To the extent the Fund’s expenses were reduced by waivers, the Fund’s total returns were increased. In these cases, in the absence of the expense waivers, the Fund’s total returns would have been lower. The Adviser has also voluntarily waived a portion of the expenses for the Alpine Ultra Short Tax Optimized Income Fund. To the extent the Fund’s expenses were reduced by waivers, the Fund’s total returns were increased. In these cases, in the absence of the expense waivers, the Fund’s total returns would have been lower.
The Barclays Capital 1 Year Municipal Bond Index is the 1-year (1-2) component of the Municipal Bond Index. The Barclays Capital 1 Year Municipal Bond Index is a rules-based, market-value weighted index engineered for the long-term, tax-exempt bond market. The Lipper Short Municipal Debt Funds Average is an unmanaged index that tracks funds that invest in municipal debt issues with dollar-weighted average maturities of less than three years. Lipper Rankings for the periods shown are based on fund total returns with dividends and distributions reinvested and do not reflect sales charges. The Barclays Capital 1 Year Municipal Bond Index and the Lipper Short Municipal Debt Funds Average are unmanaged and do not reflect the deduction of direct fees associated with a mutual fund, such as investment adviser fees; however, the Lipper Short Municipal Debt Funds Average reflects fees charged by the underlying funds. The performance for the Ultra Short Tax Optimized Income Fund reflects the deduction of fees for these value-added services. Investors cannot directly invest in an index.
39
|
|
|
Alpine Ultra Short Tax Optimized Income Fund (continued) |
|
|
|
|
Alpine Ultra Short Tax Optimized Income Fund vs. Peer Performance (unaudited) |
|
|
|
|
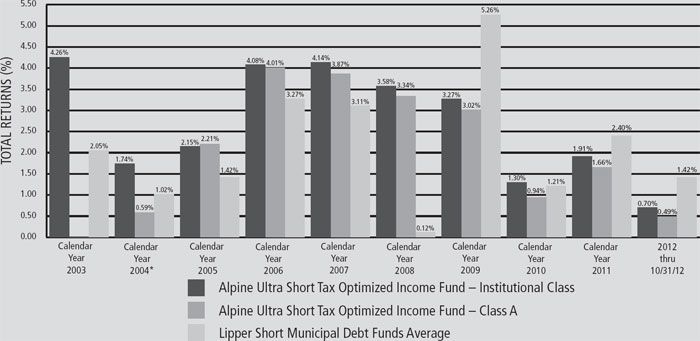
* The Advisor Class Return for 2004 is from 3/30/2004 (inception) — 12/31/2004
|
|
|
|
|
|
|
|
|
Portfolio Distributions* (unaudited) |
| Top 10 Holdings* (unaudited) |
|
| ||||
| 1. |
| California Pollution Control Finance Authority Solid Waste Revenue, Republic Services, Inc.,-Series A, 0.65%, 08/01/2023 Putable on 02/01/2013 | 7.69% |
| |||
2. |
| Illinois General Obligation Unlimited-Series B, 2.00%, 10/01/2033 Putable on 11/07/2012 | 3.64% |
| ||||
3. |
| Parish of St. James, LA Revenue, Nucor Steel Louisiana LLC Project-Series B-1, 0.50%, 11/01/2040 Putable on 11/07/2012 | 3.35% |
| ||||
4. |
| Reset Optional Certificates Trust II-R Revenue, 1.50%, 10/26/2017 Putable on 11/07/2012 | 3.30% |
| ||||
5. |
| Virginia Capital Beltway Funding Corp., Hot Lanes-Series B, 3.85%, 12/31/2047 Putable on 11/07/2012 | 3.04% |
| ||||
6. |
| New York Housing Finance Agency Revenue, Related-42nd and 10th Housing-Series A, 0.43%, 11/01/2041 Putable on 11/07/2012 | 2.96% |
| ||||
7. |
| New Jersey Economic Development Authority Revenue-Chambers Cogeneration LP, 0.60% | 2.75% |
| ||||
8. |
| Puerto Rico Infrastructure Financing Authority Revenue, Ports Authority Project-Series C, 2.75%, 12/15/2026 Putable on 06/17/2013 | 2.61% |
| ||||
9. |
| Puterto Rico Commonwealth Highway & Transportation Authority Revenue, 0.88%, 07/01/2035 Putable on 11/07/2012 | 2.07% |
| ||||
10. |
| New Jersey Economic Development Authority Revenue, Port Newark Container Terminal LLC Project-Series-B, 2.00%, 07/01/2030 Putable on 11/07/2012 | 2.00% |
| ||||
|
|
| ||||||
* |
| Portfolio holdings and sector distributions are as of 10/31/12 and are subject to change. Portfolio holdings are not recommendations to buy or sell any securities. Portfolio Distributions percentages are based on total investments and Top 10 Holdings percentages are based on total net assets. |
| |||||
|
|
|
| |||||
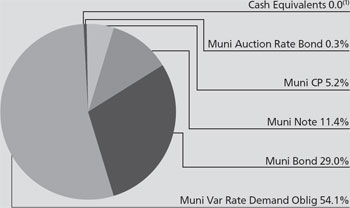
|
|
|
| ||
(1) | Amount is less than 0.05%. | |
40
|
|
|
Alpine Ultra Short Tax Optimized Income Fund (continued) |
|
|
|
|
Value of a $10,000 Investment (unaudited) |
|
|
|
|
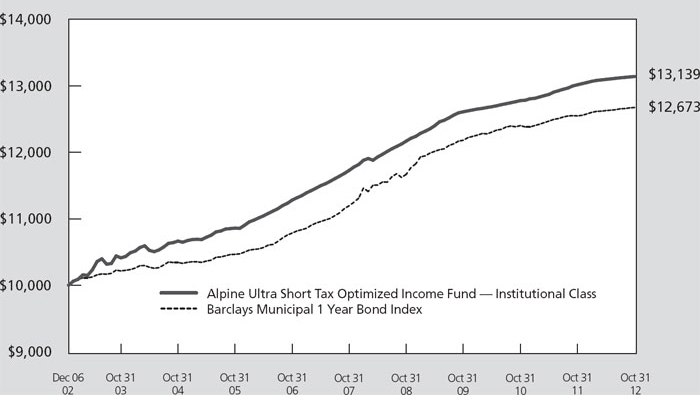
This chart represents a comparison of a hypothetical $10,000 investment in the Fund versus a similar investment in the Fund’s benchmark. The graph and the table do not reflect the deduction of taxes that a shareholder would pay on Fund distributions or the redemption of Fund shares. Investment performance reflects the waiver and recovery of certain fees, if applicable. Without the waiver and recovery of fees, the Fund’s total return would have differed.
Performance data quoted represents past performance and is not predictive of future results. Investment return and principal value of the Fund fluctuate, so that the shares, when redeemed, may be worth more or less than their original cost.
41
|
|
|
|
| |
|
|
|
|
|
|
|
|
|
|
|
|
|
|
|
|
|
Comparative Annualized Returns as of 10/31/12 (unaudited) | |||||||||||||
|
| 1 Year |
|
| 3 Years |
|
| 5 Years |
|
| Since Inception |
| |
Alpine Municipal Money Market Fund — Investor Class |
| 0.10% |
|
| 0.16% |
|
| 0.89% |
|
| 1.59% |
|
|
Lipper Tax-Exempt Money Market Funds Average(1) |
| 0.01% |
|
| 0.02% |
|
| 0.49% |
|
| 1.12% |
|
|
Lipper Tax-Exempt Money Market Funds Ranking(1) |
| 1/89 |
|
| 1/85 |
|
| 1/79 |
|
| 1/51 |
|
|
Alpine Municipal Money Market Fund — Investor Class, |
|
|
|
|
|
|
|
|
|
|
|
|
|
Net Expense Ratio: 0.53%(2) |
|
|
|
|
|
|
|
|
|
|
|
|
|
|
|
|
|
|
| ||
| (1) | The since inception data represents the period beginning 12/31/2002. | |
| (2) | As disclosed in the prospectus dated February 28, 2012. | |
| Note, the yield more closely reflects the current earnings of the money market fund than the total return. | ||
Performance data quoted represents past performance and is not predictive of future results. Performance current to the most recent month end may be lower or higher than the performance quoted and may be obtained by calling 1-888-785-5578.
The Lipper Tax-Exempt Money Market Funds Average is an average of funds that invest in high quality municipal obligations with dollar-weighted average maturities of less than 90 days. The Lipper Tax-Exempt Money Market Funds Average is unmanaged and does not reflect the deduction of direct fees associated with a mutual fund, such as investment adviser fees; however, the Lipper Tax-Exempt Money Market Funds Average reflects fees charged by the underlying funds. Lipper Rankings for the periods shown are based on fund total returns with dividends and distributions reinvested and do not reflect sales charges. The performance for the Municipal Money Market Fund reflects the deduction of fees for these value-added services. Investors cannot directly invest in an index.
Expense Ratios reflect the ratios reported in the Fund’s most recent prospectus. The Adviser has voluntarily waived a portion of the expenses for the Alpine Municipal Money Market Fund. To the extent the Fund’s expenses were reduced by waivers, the Fund’s total returns were increased. In these cases, in the absence of the expense waivers, the Fund’s total returns would have been lower.
|
|
Alpine Municipal Money Market Fund vs. Peer Performance (unaudited) |
|
|
|
|
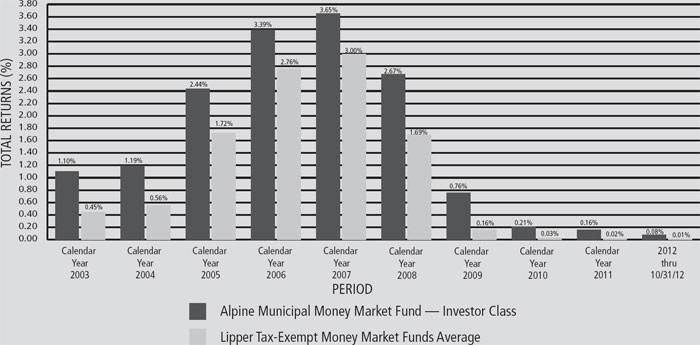
The graph and the table do not reflect the deduction of taxes that a shareholder would pay on Fund distributions or the redemption of Fund shares. Investment performance reflects the waiver of certain fees. Without the waiver of fees, the Fund’s total return would have been lower.
42
|
|
|
Alpine Municipal Money Market Fund (continued) |
|
|
|
|
|
|
|
|
|
|
|
Portfolio Distributions* (unaudited) |
| Top 10 Holdings* (unaudited) |
|
| ||||
| 1. |
| City of Chicago O’Hare International Airport, Rocs RR II-Series R-011312, 0.360%, 01/01/2016 Putable on 11/07/2012 | 6.41% |
| |||
2. |
| Texas Jefferson County Industrial Development Corp. Revenue, Jefferson Refinery LLC - Series A, 0.450%, 12/01/2040 Putable on 12/27/2012 | 3.94% |
| ||||
3. |
| Philadelphia Authority for Industrial Development, Gift of Life Donor Program, 0.200%, 12/01/2034 Putable on 11/07/2012 | 3.74% |
| ||||
4. |
| New York Dormitory Authority Revenue, Northern Westchester Hospital Association, 0.200%, 11/01/2034 Putable on 11/07/2012 | 3.57% |
| ||||
5. |
| Tennessee Hendersonville Industrial Development Board-Series A, 0.350%, 05/01/2036 Putable on 11/07/2012 | 3.28% |
| ||||
6. |
| New Jersey Hudson County Improvement Authority, Guaranteed Pooled Notes, Local Unit Loan Program-Series L-1, 2.00% 06/05/2013 | 3.12% |
| ||||
7. |
| Michigan Strategic Fund Limited Obligation Revenue, Glastender, Inc., 0.540%, 11/01/2023 Putable on 11/07/2012 | 3.07% |
| ||||
8. |
| Metropolitan Transportation Authority, NYC Dedicated Tax Fund Refunding Revenue- Subseries B-4, 0.460%, 11/01/2025 Putable on 11/07/2012 | 3.06% |
| ||||
9. |
| Michigan Strategic Fund Limited Obligation Revenue, Sacred Heart Rehabilitation Center, 0.350%, 03/01/2037 Putable on 11/07/2012 | 2.54% |
| ||||
10. |
| Texas Port Arthur Navigation District Revenue, BASF Corp., 0.370%, 04/01/2033 Putable on 11/07/2012 | 2.45% |
| ||||
|
|
| ||||||
* |
| Top 10 Holdings do not include short-term investments and percentages are based on total net assets. Portfolio Distributions percentages are based on total investments. Portfolio holdings and sector distributions are as of 10/31/12 and are subject to change. Portfolio holdings are not recommendations to buy or sell any securities. |
| |||||
|
|
|
| |||||
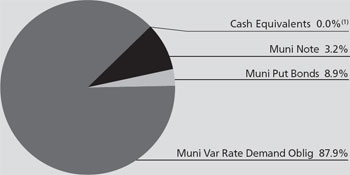
|
|
|
| ||
(1) | Amount is less than 0.05%. | |
|
|
|
| ||||||||||
| |||||||||||||
Equivalent Taxable Yields as of 10/31/12 (unaudited) | |||||||||||||
| |||||||||||||
Joint Return | Single Return | Marginal | Your Tax-Exempt Current | ||||||||||
$68,000 - 137,300 | $34,000 - 82,400 | 25% | 0.15% | ||||||||||
$137,301 - 209,250 | $82,401 - 171,850 | 28% | 0.15% | ||||||||||
$209,251 - 373,650 | $171,851 - 373,650 | 33% | 0.16% | ||||||||||
Over $373,650 | Over $373,650 | 35% | 0.17% | ||||||||||
|
|
|
| ||
The chart reflects projected 2012 marginal federal tax rates before limitations and phaseouts. Individuals should consult a tax professional to determine their actual 2012 marginal tax rate. | ||
43
|
|
Alpine Ultra Short Tax Optimized Income Fund / |
|
We are pleased to provide you with the annual report for the Alpine Income Trust for the period ending October 31, 2012. The Income Trust includes both the Alpine Ultra Short Tax Optimized Income Fund and the Alpine Municipal Money Market Fund.
PERFORMANCE SUMMARY
According to Lipper Analytical Services, the total return for the Alpine Ultra Short Tax Optimized Income Fund was 0.95% versus 2.03% for the Lipper Short Municipal Debt Funds Average.
The Alpine Municipal Money Market Fund had a total return of 0.10% versus the 0.01% return of the Lipper Tax-Exempt Money Market Funds Average. As of 10/31/12, based on total returns, Lipper Analytical Services ranked the Fund number 1 out of 89 funds in the Tax-Exempt Money Market Funds category for the one-year period. The Fund was ranked 1 out of 79 funds for the five-year period and 1 out of 51 funds since inception (calculated from December 31, 2002 through October 31, 2012).
MARKET OVERVIEW
The U.S. economy has been expanding at a modest pace in 2012 compared with what is typically seen in the years following a deep recession. Although job growth moderated in the second quarter after a strong start to the year, the economy has shown resilience in the face of a nascent recession and ongoing sovereign debt crisis in Europe, a slowdown in Chinese growth, and bouts of global market volatility. We believe growth will continue at a modest pace in the months ahead, but uncertainty about the “fiscal cliff” of federal tax increases and spending cuts scheduled to take place at the beginning of 2013 could restrain economic activity.
To help keep long-term interest rates low, the Federal Reserve announced that it would continue its maturity-extension program, which had been set to expire at the end of June, for six more months. Through this program, the Fed sold $400 billion of its short-term Treasuries and purchased an equal amount of long-term Treasuries from autumn 2011 through mid-2012. By the end of 2012, the central bank plans to exchange an additional $267 billion in short-term Treasuries for long-term government bonds. More recently, the Fed announced further easing to stimulate the U.S. economy and reduce unemployment, including plans to purchase $40 billion of mortgage-backed securities each month.
In the last six months, shorter-term municipal yields remained very low and were little changed, but longer-term muni yields declined with Treasury yields, albeit to a
lesser extent. With municipal yields higher than Treasury yields, we believe tax-free securities are an attractive investment for fixed-income investors.
Municipal issuance totaled about $314 billion in the first 10 months of 2012, according to The Bond Buyer. However, much of the year-to-date issuance reflects municipalities refinancing their debt to take advantage of low long-term interest rates rather than net new issuance. Supply is expected to increase for the remainder of the calendar year and full-year issuance is likely to approach $400 billion. One positive factor for munis is that austerity-minded state and local government leaders have been conservative about adding to indebtedness, despite prevailing low yields. Another favorable factor supporting the market is brisk demand, particularly for long-term issues.
Many states continue to face fiscal difficulties and have been forced to raise taxes and fees and cut spending to close budget deficits. We believe many states deserve high credit ratings, and we do not see a near-term threat to their ability to continue serving their outstanding debts. However, we have longer-term concerns about the states’ willingness and ability to address sizable pension obligations and other retirement benefits.
Municipal bond performance in the last six months was driven, once again, by investors’ search for higher yields in a low interest rate environment. Long-term bonds outperformed shorter-term securities, low-quality issues outpaced higher-quality munis, and revenue bonds surpassed state and local obligations (GOs). Prerefunded bonds, which are backed by U.S. Treasuries, continued to produce modest gains due to their high-quality and short-term characteristics.
ALPINE ULTRA SHORT TAX OPTIMIZED INCOME FUND
“Patience is a virtue” is the only way to describe the theme we needed to maintain in this historically and frustratingly low interest rate environment. Despite the temptation to extend the average weighted maturity of the portfolio beyond our comfort zone in order to generate more income, we instead remained focused on the two core objectives of the Fund: stability of principal and high after-tax income. This is written in the beginning of our prospectus and we do our best to maintain the integrity of the Fund as a result. It is also because of our defensive strategy that we have underperformed our peers on a total return basis but maintained a stable Net Asset Value (“NAV”). Our NAV was $10.05 on October 31, 2011 and closed at $10.05 on October 31, 2012.
44
|
|
Alpine Ultra Short Tax Optimized Income Fund / |
|
We have always tried to break down the fundamentals of the municipal marketplace into four key areas which include evaluating supply and demand, credit quality, liquidity, and the economic environment. As we mentioned earlier, despite the robust issuance of municipal securities in 2012, a good portion of the issuances were refunding bonds which did not really increase the overall supply of munis by a lot. Add into that equation an insatiable appetite from mutual funds, individuals and corporations for municipal bonds and you have the makings of an over-inflated market. Overall, while the credit quality was not significantly worse, it was not significantly better either, thus making it hard to justify paying higher prices for stagnant quality. Liquidity was, for the most part, very healthy as investors bid up almost every sector of the market in their quest to generate income and invest new proceeds. And lastly, while the economic environment was not as robust as the Fed would like, it was not, in our view, at risk for falling back into a recession either.
After taking all of this into consideration, we opted to slightly extend our average-weighted maturity from 69 days at the end of April to 74 days as of October 31, 2012. This was achieved with the purchases of one-to-three-year standard municipal bonds and revenue and general purpose put bonds. We also made select purchases of general market notes in the three-to-18 month range as they offered better yields than comparable alternatives. While Variable Rate Demand Notes (“VRDN’s”) have been a big component of the Fund for the past several years, they have started to lose their luster as many of our higher-yielding positions have either been refunded, had letter of credit changes or lost their higher yield due to demand for the product. We were able to make some select new purchases of VRDN’s where the yield increased as a result of a credit downgrade or which we believe were overlooked by other buyers, although these purchases are becoming harder to find every month. While the proportion of VRDN’s in the portfolio has decreased slightly, they will continue to comprise a meaningful portion of the Fund as they have provided above-average yield and relative stability. Lastly, while we still maintain a portion of the Fund in tax-exempt commercial paper, it has lost some of its yield appeal.
In trying to navigate through this historically low interest rate environment, it is imperative that we continue to reevaluate each type of municipal security available in the marketplace and tweak the mix in order to seek to achieve the best yield, while recognizing our desire for minimal NAV movement. It is this flexibility to adjust the mixture that we believe has served the Fund well since its inception and we will continue to maintain this strategy.
ALPINE MUNICIPAL MONEY MARKET FUND
Tax-exempt money market rates seem to have found some measure of equilibrium in the past six months. As the prospects for 0% interest rates remain likely, and with supply and demand seemingly in balance for now, the money market curve has stabilized somewhat. This curve ranges from about 15 basis points (0.15%) on overnight investments to around 22 basis points on one-year maturities. In the past six months, the curve has flattened as 1-to-90-day yields moved higher while 6 to 12-month yields were relatively unchanged. Barring a change in Fed policy, a major credit event in Europe, or a shift in supply, we expect rate movement to remain benign in the near-term. For investors, money market returns will likely remain minimal. Given this outlook, we extended our average weighted maturity to 28 days from 10 days when we last reported.
Credit quality remains a key focus in the management of the Fund. We still have a significant portion of the Fund invested in bank letter of credit enhanced VRDN’s with the remainder in high-quality general market notes and put bonds. This has not changed dramatically from our last reporting period except that we added some longer maturity notes, resulting in an increase in the yield of the Fund.
As of August 2012, the Securities and Exchange Commission (SEC) had not made further changes to the rules governing money market funds but there continues to be the potential for further regulatory action. The significant risk-limiting measures implemented by the SEC in 2010, which mandated higher liquidity requirements and reduced credit risk, have resulted in more resilient money fund products throughout the industry although we have consistently strived to avoid inappropriate risks. Liquidity and stability remain fundamental needs for shareholders, and we are focused on managing the Fund with those needs in mind.
OUTLOOK
While we have seen significant performance of municipal bonds over the last 18 months, we believe that returns in the period ahead will moderate, as the credit and economic environment for municipalities is likely to remain challenging and yields are not likely to fall significantly from current levels. Modest economic growth and improving income and sales tax revenue are providing some support for state and local governments. However, cutbacks in state support for municipalities and persisting downward pressure on property tax revenues could keep local municipal issuers vulnerable. If the economy slides back into a recession-which we are not currently predicting municipalities will face even tougher challenges.
45
|
|
Alpine Ultra Short Tax Optimized Income Fund / |
|
While we are comforted somewhat by the demonstrated ability of states to balance their budgets in tough times, we are mindful that municipal yields are at or near historic lows and that there is the potential for losses if rates rise in response to stronger economic growth or inflation. With rates at such low levels, we are guarded in the interest rate outlook and careful with any investment shift that might increase the portfolios’ interest rate sensitivity.
We will continue to conduct thorough research and evaluations before making any investment decisions. As always, we are on the lookout for attractively-valued bonds and remain mindful of the economic environment.
Sincerely,
Steven C. Shachat
Portfolio Manager
|
Mutual fund investing involves risk. Principal loss is possible. The Alpine Municipal Money Market Fund is subject to risks, including the following:
An investment in the Municipal Market Fund is not insured or guaranteed by the Federal Deposit Insurance Corporation or any other government agency. Although the Municipal Market Fund seeks to preserve the value of your investment at $1.00 per share, it is possible to lose money by investing in the Municipal Money Market Fund.
Credit Risk – The credit quality and liquidity of the Fund’s investments in municipal obligations and other debt securities may be dependent in part on the credit quality of third parties, such as banks and other financial institutions, which provide credit and liquidity enhancements to the Fund’s investments. Adverse changes in the credit quality of these third parties could cause losses to the Fund and affect its share price.
Fixed-Income Securities Risk – Fixed-income securities are subject to issuer risk, interest rate risk and market risk.
Interest Rate Risk – Interest rates may rise resulting in a decrease in the value of the securities held by the Fund, or may fall resulting in an increase in the value of such securities. Securities having longer maturities generally involve a greater risk of fluctuations in the value resulting from changes in interest rates.
Issuer Risk – Changes in the financial condition of the issuer of an obligation, changes in general economic conditions, or changes in economic conditions that affect the issuer may impact its actual or perceived willingness or ability to make timely payments of interest or principal.
Liquidity Risk – Some securities held by the Fund may be difficult to sell, or illiquid, particularly during times of market turmoil. Illiquid securities may also be difficult to value. If the Fund is forced to sell an illiquid asset to meet redemption requests or other cash needs, the Fund may be forced to sell at a loss.
Management Risk – The Adviser’s security selections and other investment decisions might produce losses or cause the Fund to underperform when compared to other funds with preservation of capital similar investment goals.
Market Risk – The price of a security held by the Fund may fall due to changing market, economic or political conditions.
Municipal Securities Concentration Risk – From time to time the Fund may invest a substantial amount of its assets in municipal securities whose interest is paid solely from revenues of similar projects. If the Fund concentrates its investments in this manner, it assumes the economic risks relating to such projects and this may have a significant impact on the Fund’s investment performance.
Municipal Securities Risk – Municipal securities risks include the ability of the issuer to repay the obligation, the relative lack of information about certain issuers of municipal securities, and the possibility of future legislative changes which could affect the market for and value of municipal securities. Certain municipal securities, including private activity bonds, are not backed by the full faith, credit and taxing power of the issuer. Additionally, if events occur after the security is acquired that impact the security’s tax-exempt status, the Fund and its shareholders could be subject to substantial tax liabilities.
Redemption Risk – The Fund may experience heavy redemptions, particularly during periods of declining or illiquid markets that could cause the Fund to liquidate its assets at inopportune times or at a loss or depressed value and that could affect the Fund’s ability to maintain a $1.00 share price. In addition, the Fund may suspend redemptions when permitted by applicable regulations.
Regulatory Risk – The SEC recently amended the rules governing money market funds. In addition, the SEC continues to review the regulation of such funds. Any further changes by the SEC or additional legislative developments may affect the Fund’s operations, investment strategies, performance and yield.
Variable Rate Demand Obligations Risk – Variable rate demand obligations are floating rate securities that combine an interest in a long-term municipal bond with a right to demand payment before maturity from a bank or other financial institution. If the bank or financial institution is unable to pay, the Fund may lose money.
46
|
|
Alpine Ultra Short Tax Optimized Income Fund / |
|
The Alpine Ultra Short Tax Optimized Fund is subject to risks, including the following:
Credit Risk – The credit quality and liquidity of the Fund’s investments in municipal obligations and other debt securities may be dependent in part on the credit quality of third parties, such as banks and other financial institutions, which provide credit and liquidity enhancements to the Fund’s investments. Adverse changes in the credit quality of these third parties could cause losses to the Fund and affect its share price.
Derivative Securities Risk – The Fund may invest in municipal derivative securities which are subject to structural risks that could cause the Fund to receive taxable income or to lose money.
Fixed-Income Securities Risk – Fixed income securities are subject to issuer risk, interest rate risk and market risk.
Interest Rate Risk – Interest rates may rise resulting in a decrease in the value of the securities held by the Fund, or may fall resulting in an increase in the value of such securities. Securities having longer maturities generally involve a greater risk of fluctuations in the value resulting from federal tax consistent changes in interest rates.
Issuer Risk – Changes in the financial condition of the issuer of an obligation, changes in general economic conditions, or changes in economic conditions that affect the issuer may impact its actual or perceived willingness or ability to make timely payments of interest or principal.
Liquidity Risk – Some securities held by the Fund may be difficult to sell, or illiquid, particularly during times of market turmoil. Illiquid securities may also be difficult to value. If the Fund is forced to sell an illiquid asset to meet redemption requests or other cash needs, the Fund may be forced to sell at a loss.
Management Risk – The Adviser’s security selections and other investment decisions might produce losses or cause the Fund to underperform when compared to other funds with similar investment goals.
Market Risk – The price of a security held by the Fund may fall due to changing market, economic or political conditions.
Mortgage Related and Asset Backed Securities Risk – These securities are subject to prepayment risk, which is the risk that the borrower will prepay some or all of the principal owed to the owner. This could reduce the Fund’s share price and its income distributions.
Municipal Securities Risk – Municipal securities include revenue bonds, general obligation bonds and municipal lease obligations. Revenue bonds include private activity bonds, which are not payable from the general revenues of the issuer. Consequently, the credit quality of private activity bonds is usually directly related to the credit standing of the corporate user of the facility involved. To the extent that the Fund’s assets are invested in private activity bonds, the Fund will be subject to the particular risks presented by the laws and economic conditions relating to such projects and bonds to a greater extent than if its assets were not so invested. Municipal securities also include moral obligation bonds, which are normally issued by special purpose public authorities. If the issuer of moral obligation bonds is unable to pay its debts from current revenues, it may draw on a reserve fund the restoration of which is a moral but not a legal obligation of the state or municipality which created the issuer. Municipal lease obligations are not guaranteed by the issuer and are generally less liquid than other securities. Municipal lease obligations also are subject to the risk that the municipality will not appropriate funds for lease payments. There may be less information available on the financial condition of issuers of municipal securities than for public corporations. The market for municipal bonds may be less liquid than for taxable bonds. This means that it may be harder to buy and sell municipal securities, especially on short notice, and municipal securities may be more difficult for the Fund to value accurately than securities of public corporations. In addition, municipal securities are subject to the risk that their tax treatment could be changed by the U.S. Congress or state legislatures, thereby affecting the value of outstanding municipal securities.
Portfolio Turnover Risk – High portfolio turnover necessarily results in greater transaction costs which may reduce Fund performance.
Tax Risk – Changes in tax laws or adverse determinations by the Internal Revenue Service may make the income from some municipal obligations taxable. Additionally, maximizing after-tax income may require trade-offs that reduce pre-tax income. The Fund’s tax-efficient strategies may reduce the taxable income of the Fund’s shareholders, but will not eliminate it. There can be no assurance that taxable distributions can always be avoided or that the Fund will achieve its investment objective.
Variable Rate Demand Obligations Risk – Variable rate demand obligations are floating rate securities that combine an interest in a long-term municipal bond with a right to demand payment before maturity from a bank or other financial institution. If the bank or financial institution is unable to pay, the Fund may lose money.
Please refer to pages 6-7 for other important disclosures and definitions.
47
|
Alpine Dynamic Dividend Fund |
Schedule of Portfolio Investments
October 31, 2012
|
|
|
|
|
|
|
|
Shares |
| Security |
| Value |
| ||
|
|
|
|
|
|
|
|
Common Stocks—95.2% |
|
|
|
| |||
Australia—2.3% |
|
|
|
| |||
| 365,600 |
| Iluka Resources, Ltd. |
| $ | 3,764,749 |
|
| 23,166 |
| QR National, Ltd. |
|
| 89,938 |
|
| 240,042 |
| Westfield Group |
|
| 2,656,211 |
|
| 479,401 |
| Westfield Retail Trust |
|
| 1,542,690 |
|
|
|
|
|
|
| ||
|
|
|
|
|
| 8,053,588 |
|
|
|
|
|
|
| ||
Brazil—0.9% |
|
|
|
| |||
| 353,100 |
| All America Latina Logistica SA |
|
| 1,606,383 |
|
| 98,000 |
| EDP-Energias do Brasil SA |
|
| 612,787 |
|
| 500,000 |
| PDG Realty SA Empreendimentos |
|
| 841,929 |
|
|
|
|
|
|
| ||
|
|
|
|
|
| 3,061,099 |
|
|
|
|
|
|
| ||
Canada—3.2% |
|
|
|
| |||
| 49,709 |
| Canadian Pacific Railway, Ltd. |
|
| 4,576,211 |
|
| 155,182 |
| Cenovus Energy, Inc. |
|
| 5,479,476 |
|
| 34,000 |
| Enbridge, Inc. |
|
| 1,352,180 |
|
|
|
|
|
|
| ||
|
|
|
|
|
| 11,407,867 |
|
|
|
|
|
|
| ||
China—0.1% |
|
|
|
| |||
| 13,591,000 |
| Daqing Dairy Holdings, |
|
| 287,601 |
|
|
|
|
|
|
| ||
France—0.2% |
|
|
|
| |||
| 17,000 |
| Vinci SA |
|
| 752,369 |
|
|
|
|
|
|
| ||
Hong Kong—2.4% |
|
|
|
| |||
| 163,691 |
| Cheung Kong Holdings, Ltd. |
|
| 2,418,387 |
|
| 102,307 |
| Sun Hung Kai Properties, Ltd. |
|
| 1,424,368 |
|
| 661,986 |
| Wharf Holdings, Ltd. |
|
| 4,544,184 |
|
|
|
|
|
|
| ||
|
|
|
|
|
| 8,386,939 |
|
|
|
|
|
|
| ||
Ireland—0.8% |
|
|
|
| |||
| 51,549 |
| Covidien PLC |
|
| 2,832,618 |
|
|
|
|
|
|
| ||
Japan—0.8% |
|
|
|
| |||
| 60,000 |
| Chiyoda Corp. |
|
| 968,057 |
|
| 17,500 |
| East Japan Railway Co. |
|
| 1,201,303 |
|
| 18,100 |
| Japan Airlines Co., Ltd. (a) |
|
| 861,581 |
|
|
|
|
|
|
| ||
|
|
|
|
|
| 3,030,941 |
|
|
|
|
|
|
| ||
Mexico—0.3% |
|
|
|
| |||
| 79,534 |
| Grupo Financiero Santander |
|
| 1,087,230 |
|
|
|
|
|
|
| ||
Netherlands—0.2% |
|
|
|
| |||
| 11,500 |
| Koninklijke Vopak NV |
|
| 800,586 |
|
|
|
|
|
|
| ||
Norway—3.8% |
|
|
|
| |||
| 165,984 |
| Golar LNG, Ltd. |
|
| 6,478,355 |
|
| 173,955 |
| Seadrill, Ltd. |
|
| 7,017,345 |
|
|
|
|
|
|
| ||
|
|
|
|
|
| 13,495,700 |
|
|
|
|
|
|
| ||
Singapore—1.6% |
|
|
|
| |||
| 171,403 |
| Avago Technologies, Ltd. |
|
| 5,661,441 |
|
|
|
|
|
|
| ||
Sweden—0.6% |
|
|
|
| |||
| 83,939 |
| Electrolux AB—Series B |
|
| 2,147,545 |
|
|
|
|
|
|
| ||
Switzerland—1.4% |
|
|
|
| |||
| 199,415 |
| Logitech International SA (a) |
|
| 1,436,782 |
|
| 57,400 |
| Novartis AG—ADR |
|
| 3,470,404 |
|
|
|
|
|
|
| ||
|
|
|
|
|
| 4,907,186 |
|
|
|
|
|
|
| ||
Turkey—0.4% |
|
|
|
| |||
| 270,500 |
| TAV Havalimanlari Holding AS |
|
| 1,343,068 |
|
|
|
|
|
|
| ||
|
|
|
|
|
|
|
|
Shares |
| Security |
| Value |
| ||
|
|
|
|
|
|
|
|
Common Stocks—continued |
|
|
|
| |||
United Kingdom—4.0% |
|
|
|
| |||
| 38,000 |
| Aggreko PLC |
| $ | 1,318,433 |
|
| 123,647 |
| Ensco PLC—Class A |
|
| 7,149,270 |
|
| 17,000 |
| Petrofac, Ltd. |
|
| 440,037 |
|
| 339,900 |
| Xstrata PLC |
|
| 5,370,494 |
|
|
|
|
|
|
| ||
|
|
|
|
|
| 14,278,234 |
|
|
|
|
|
|
| ||
United States—72.0% |
|
|
|
| |||
| 63,588 |
| Abbott Laboratories |
|
| 4,166,286 |
|
| 93,733 |
| Aetna, Inc. |
|
| 4,096,132 |
|
| 71,917 |
| American Capital Mortgage |
|
| 1,792,891 |
|
| 252,195 |
| American Eagle Outfitters, Inc. |
|
| 5,263,310 |
|
| 34,603 |
| American Tower Corp. |
|
| 2,605,260 |
|
| 19,500 |
| American Water Works Co., Inc. |
|
| 716,430 |
|
| 16,234 |
| Apple, Inc. |
|
| 9,660,853 |
|
| 67,478 |
| Ashland, Inc. |
|
| 4,801,060 |
|
| 31,056 |
| Atmos Energy Corp. |
|
| 1,117,084 |
|
| 587,910 |
| Bank of America Corp. |
|
| 5,479,321 |
|
| 43,214 |
| Cardinal Health, Inc. |
|
| 1,777,392 |
|
| 61,317 |
| Caterpillar, Inc. |
|
| 5,200,295 |
|
| 104,492 |
| CBS Corp.—Class B |
|
| 3,385,541 |
|
| 119,199 |
| Citigroup, Inc. |
|
| 4,456,851 |
|
| 31,619 |
| CME Group, Inc. |
|
| 1,768,451 |
|
| 59,000 |
| CMS Energy Corp. |
|
| 1,434,880 |
|
| 79,329 |
| Coach, Inc. |
|
| 4,446,390 |
|
| 49,568 |
| Colgate-Palmolive Co. |
|
| 5,202,657 |
|
| 190,141 |
| Comcast Corp.—Class A |
|
| 7,132,189 |
|
| 131,998 |
| Cooper Tire & Rubber Co. |
|
| 2,657,120 |
|
| 38,286 |
| Cummins, Inc. |
|
| 3,582,804 |
|
| 72,752 |
| CVS Caremark Corp. |
|
| 3,375,693 |
|
| 132,588 |
| CYS Investments, Inc. |
|
| 1,779,331 |
|
| 24,500 |
| Dick’s Sporting Goods, Inc. |
|
| 1,225,000 |
|
| 12,200 |
| Energizer Holdings, Inc. |
|
| 890,234 |
|
| 48,355 |
| Family Dollar Stores, Inc. |
|
| 3,189,496 |
|
| 109,433 |
| Foot Locker, Inc. |
|
| 3,666,005 |
|
| 176,870 |
| Freeport-McMoRan Copper & |
|
| 6,876,705 |
|
| 159,700 |
| H&E Equipment Services, Inc. |
|
| 2,430,634 |
|
| 183,492 |
| Healthcare Services Group, Inc. |
|
| 4,385,459 |
|
| 94,219 |
| HollyFrontier Corp. |
|
| 3,639,680 |
|
| 159,911 |
| Intel Corp. |
|
| 3,458,075 |
|
| 24,212 |
| International Business |
|
| 4,709,960 |
|
| 104,400 |
| Iron Mountain, Inc. |
|
| 3,612,240 |
|
| 72,385 |
| ITC Holdings Corp. |
|
| 5,763,294 |
|
| 96,544 |
| Joy Global, Inc. |
|
| 6,029,173 |
|
| 165,363 |
| JPMorgan Chase & Co. |
|
| 6,892,330 |
|
| 99,452 |
| Las Vegas Sands Corp. |
|
| 4,618,551 |
|
| 13,554 |
| M&T Bank Corp. |
|
| 1,410,971 |
|
| 59,347 |
| McDonald’s Corp. |
|
| 5,151,320 |
|
| 72,427 |
| McKesson Corp. |
|
| 6,758,163 |
|
| 55,541 |
| Microchip Technology, Inc. |
|
| 1,741,210 |
|
| 118,361 |
| Microsoft Corp. |
|
| 3,377,431 |
|
| 91,930 |
| Mondelez International, |
|
| 2,439,822 |
|
| 72,369 |
| National Oilwell Varco, Inc. |
|
| 5,333,595 |
|
| 669,744 |
| Och-Ziff Capital Management |
|
| 6,704,137 |
|
| 80,158 |
| Omnicare, Inc. |
|
| 2,767,856 |
|
| 20,440 |
| PepsiCo, Inc. |
|
| 1,415,266 |
|
| 159,749 |
| Pfizer, Inc. |
|
| 3,972,958 |
|
The accompanying notes are an integral part of these financial statements.
48
|
Alpine Dynamic Dividend Fund |
Schedule of Portfolio Investments—Continued
October 31, 2012
|
|
|
|
|
|
|
|
Shares |
| Security |
| Value |
| ||
|
|
|
|
|
|
|
|
Common Stocks—continued |
|
|
|
| |||
United States—continued |
|
|
|
| |||
| 39,761 |
| PNC Financial Services |
| $ | 2,313,692 |
|
| 134,859 |
| QUALCOMM, Inc. |
|
| 7,899,366 |
|
| 231,674 |
| Regal Entertainment |
|
| 3,558,513 |
|
| 51,572 |
| Snap-On, Inc. |
|
| 3,988,063 |
|
| 6,000 |
| SPX Corp. |
|
| 411,540 |
|
| 31,212 |
| The Boeing Co. |
|
| 2,198,573 |
|
| 20,000 |
| The Walt Disney Co. |
|
| 981,400 |
|
| 22,042 |
| Time Warner Cable, Inc. |
|
| 2,184,583 |
|
| 236,085 |
| Tronox, Ltd.—Class A |
|
| 4,813,773 |
|
| 12,580 |
| Union Pacific Corp. |
|
| 1,547,717 |
|
| 85,491 |
| UnitedHealth Group, Inc. |
|
| 4,787,496 |
|
| 24,000 |
| Validus Holdings, Ltd. |
|
| 859,200 |
|
| 99,795 |
| Verizon Communications, Inc. |
|
| 4,454,849 |
|
| 49,058 |
| Wal-Mart Stores, Inc. |
|
| 3,680,331 |
|
| 101,140 |
| Walgreen Co. |
|
| 3,563,162 |
|
| 151,137 |
| Warner Chilcott PLC—Class A |
|
| 1,750,166 |
|
| 31,470 |
| WellPoint, Inc. |
|
| 1,928,482 |
|
| 191,934 |
| Wells Fargo & Co. |
|
| 6,466,256 |
|
| 58,677 |
| Wynn Resorts, Ltd. |
|
| 7,103,438 |
|
| 51,744 |
| Yum! Brands, Inc. |
|
| 3,627,772 |
|
|
|
|
|
|
| ||
|
|
|
|
|
| 256,476,158 |
|
|
|
|
|
|
| ||
|
|
| Total Common Stocks |
|
| 338,010,170 |
|
|
|
|
| ||||
|
|
|
|
|
|
|
|
Principal |
| Security |
| Value |
| ||
|
|
|
|
|
|
|
|
Convertible Bonds—0.1% |
|
|
|
| |||
| Brazil—0.1% |
|
|
|
|
|
|
$ | 791,393 |
| PDG Realty SA Empreendimentos |
| $ | 272,753 |
|
|
|
|
|
|
| ||
|
|
| Total Convertible Bonds |
|
| 272,753 |
|
|
|
|
|
|
| ||
Short-Term Investments—1.3% |
|
|
|
| |||
| 4,822,000 |
| State Street Eurodollar |
|
| 4,822,000 |
|
|
|
|
|
|
| ||
|
|
| Total Short-Term Investments |
|
| 4,822,000 |
|
|
|
|
|
|
| ||
|
|
|
|
|
|
|
|
|
|
| Total Investments |
|
| 343,104,923 |
|
|
|
| Other Assets in Excess |
|
| 12,007,442 |
|
|
|
|
|
|
| ||
|
|
| TOTAL NET ASSETS 100.0% |
| $ | 355,112,365 |
|
|
|
|
|
|
| ||
|
|
|
| ||
| ||
Percentages are stated as a percent of net assets. | ||
| ||
(a) | Non-income producing security. | |
| ||
(b) | Illiquid security. | |
| ||
(c) | Security fair valued in accordance with procedures approved by the Board of Trustees. These securities comprised 0.1% of the Fund’s net assets. | |
| ||
(d) | Represents a zero-coupon bond. Rate shown reflects the current yield as of the report date. | |
| ||
AB—Aktiebolag is the Swedish equivalent of a corporation. | ||
| ||
ADR—American Depositary Receipt | ||
| ||
AG—Aktiengesellschaft is a German term that refers to a corporation that is limited by shares, i.e., owned by shareholders. | ||
| ||
AS—Anonim Sirketi is the Turkish term for joint stock company. | ||
| ||
NV—Naamloze Vennootschap is the Dutch term for a public limited liability corporation. | ||
| ||
PLC—Public Limited Company | ||
| ||
SA—Generally designates corporations in various countries, mostly those employing the civil law. | ||
| ||
SAB de CV—Sociedad Anonima Bursátil de Capital Variable is the Spanish equivalent to Variable Capital Company. | ||
The accompanying notes are an integral part of these financial statements.
49
|
Alpine Accelerating Dividend Fund |
Schedule of Portfolio Investments
October 31, 2012
|
|
|
|
|
|
|
|
Shares |
| Security |
| Value |
| ||
| |||||||
Common Stocks—93.5% |
|
|
|
| |||
Aerospace & Defense—1.6% |
|
|
|
| |||
| 350 |
| Ceradyne, Inc. |
| $ | 12,236 |
|
| 350 |
| United Technologies Corp. |
|
| 27,356 |
|
|
|
|
|
|
| ||
|
|
|
|
|
| 39,592 |
|
|
|
|
|
|
| ||
Beverages—3.5% |
|
|
|
| |||
| 525 |
| Anheuser-Busch InBev NV—ADR |
|
| 43,995 |
|
| 600 |
| PepsiCo, Inc. |
|
| 41,544 |
|
|
|
|
|
|
| ||
|
|
|
|
|
| 85,539 |
|
|
|
|
|
|
| ||
Biotechnology—1.3% |
|
|
|
| |||
| 350 |
| Amgen, Inc. |
|
| 30,291 |
|
|
|
|
|
|
| ||
Capital Markets—2.8% |
|
|
|
| |||
| 3,700 |
| FXCM, Inc.—Class A |
|
| 33,300 |
|
| 3,500 |
| Och-Ziff Capital Management |
|
| 35,035 |
|
|
|
|
|
|
| ||
|
|
|
|
|
| 68,335 |
|
|
|
|
|
|
| ||
Chemicals—2.2% |
|
|
|
| |||
| 300 |
| Air Products & Chemicals, Inc. |
|
| 23,259 |
|
| 750 |
| Potash Corp. of |
|
| 30,278 |
|
|
|
|
|
|
| ||
|
|
|
|
|
| 53,537 |
|
|
|
|
|
|
| ||
Commercial Banks—4.0% |
|
|
|
| |||
| 2,000 |
| Fifth Third Bancorp |
|
| 29,060 |
|
| 1,800 |
| Financial Institutions, Inc. |
|
| 34,272 |
|
| 550 |
| PNC Financial Services |
|
| 32,004 |
|
|
|
|
|
|
| ||
|
|
|
|
|
| 95,336 |
|
|
|
|
|
|
| ||
Communications Equipment—3.4% |
|
|
|
| |||
| 2,200 |
| Cisco Systems, Inc. |
|
| 37,708 |
|
| 750 |
| QUALCOMM, Inc. |
|
| 43,931 |
|
|
|
|
|
|
| ||
|
|
|
|
|
| 81,639 |
|
|
|
|
|
|
| ||
Computers & Peripherals—1.7% |
|
|
|
| |||
| 70 |
| Apple, Inc. |
|
| 41,657 |
|
|
|
|
|
|
| ||
Diversified Financial Services—2.4% |
|
|
|
| |||
| 800 |
| Citigroup, Inc. |
|
| 29,912 |
|
| 1,200 |
| The NASDAQ OMX Group, Inc. |
|
| 28,572 |
|
|
|
|
|
|
| ||
|
|
|
|
|
| 58,484 |
|
|
|
|
|
|
| ||
Energy Equipment & Services—2.6% |
|
|
|
| |||
| 600 |
| Bristow Group, Inc. |
|
| 29,952 |
|
| 470 |
| Schlumberger, Ltd. |
|
| 32,679 |
|
|
|
|
|
|
| ||
|
|
|
|
|
| 62,631 |
|
|
|
|
|
|
| ||
Food & Staples Retailing—1.6% |
|
|
|
| |||
| 1,100 |
| Walgreen Co. |
|
| 38,753 |
|
|
|
|
|
|
| ||
Food Products—3.1% |
|
|
|
| |||
| 800 |
| General Mills, Inc. |
|
| 32,064 |
|
| 500 |
| The J.M. Smucker Co. |
|
| 42,820 |
|
|
|
|
|
|
| ||
|
|
|
|
|
| 74,884 |
|
|
|
|
|
|
| ||
Gas Utilities—3.0% |
|
|
|
| |||
| 950 |
| Atmos Energy Corp. |
|
| 34,172 |
|
| 1,200 |
| UGI Corp. |
|
| 38,748 |
|
|
|
|
|
|
| ||
|
|
|
|
|
| 72,920 |
|
|
|
|
|
|
| ||
Health Care Equipment & Supplies—1.6% |
|
|
|
| |||
| 500 |
| Becton, Dickinson & Co. |
|
| 37,840 |
|
|
|
|
|
|
| ||
Health Care Providers & Services—2.8% |
|
|
|
| |||
| 700 |
| Aetna, Inc. |
|
| 30,590 |
|
| 950 |
| AmerisourceBergen Corp. |
|
| 37,468 |
|
|
|
|
|
|
| ||
|
|
|
|
|
| 68,058 |
|
|
|
|
|
|
| ||
|
|
|
|
|
|
|
|
Shares |
| Security |
| Value |
| ||
| |||||||
|
|
|
|
|
|
|
|
Common Stocks—continued |
|
|
|
| |||
Household Products—3.1% |
|
|
|
| |||
| 550 |
| Energizer Holdings, Inc. |
| $ | 40,133 |
|
| 500 |
| The Procter & Gamble Co. |
|
| 34,620 |
|
|
|
|
|
|
| ||
|
|
|
|
|
| 74,753 |
|
|
|
|
|
|
| ||
Industrial Conglomerates—1.1% |
|
|
|
| |||
| 300 |
| 3M Co. |
|
| 26,280 |
|
|
|
|
|
|
| ||
Insurance—1.0% |
|
|
|
| |||
| 1,100 |
| Montpelier Re Holdings, Ltd. |
|
| 25,157 |
|
|
|
|
|
|
| ||
IT Services—3.0% |
|
|
|
| |||
| 200 |
| International Business |
|
| 38,906 |
|
| 250 |
| Visa, Inc.-Class A |
|
| 34,690 |
|
|
|
|
|
|
| ||
|
|
|
|
|
| 73,596 |
|
|
|
|
|
|
| ||
Machinery—3.3% |
|
|
|
| |||
| 500 |
| Dover Corp. |
|
| 29,110 |
|
| 300 |
| Robbins & Myers, Inc. |
|
| 17,784 |
|
| 430 |
| Snap-On, Inc. |
|
| 33,252 |
|
|
|
|
|
|
| ||
|
|
|
|
|
| 80,146 |
|
|
|
|
|
|
| ||
Media—4.9% |
|
|
|
| |||
| 1,200 |
| CBS Corp.—Class B |
|
| 38,880 |
|
| 1,100 |
| Comcast Corp.—Class A |
|
| 41,261 |
|
| 1,400 |
| SES SA |
|
| 38,742 |
|
|
|
|
|
|
| ||
|
|
|
|
|
| 118,883 |
|
|
|
|
|
|
| ||
Metals & Mining—0.8% |
|
|
|
| |||
| 1,000 |
| Vale SA—ADR |
|
| 18,320 |
|
|
|
|
|
|
| ||
Multi-Utilities—4.7% |
|
|
|
| |||
| 1,500 |
| CMS Energy Corp. |
|
| 36,480 |
|
| 700 |
| OGE Energy Corp. |
|
| 40,306 |
|
| 1,300 |
| Xcel Energy, Inc. |
|
| 36,725 |
|
|
|
|
|
|
| ||
|
|
|
|
|
| 113,511 |
|
|
|
|
|
|
| ||
Oil, Gas & Consumable Fuels—7.3% |
|
|
|
| |||
| 300 |
| Chevron Corp. |
|
| 33,063 |
|
| 2,500 |
| Crosstex Energy LP |
|
| 38,725 |
|
| 600 |
| Devon Energy Corp. |
|
| 34,926 |
|
| 400 |
| Occidental Petroleum Corp. |
|
| 31,584 |
|
| 1,100 |
| Suncor Energy, Inc. |
|
| 36,982 |
|
|
|
|
|
|
| ||
|
|
|
|
|
| 175,280 |
|
|
|
|
|
|
| ||
Pharmaceuticals—3.5% |
|
|
|
| |||
| 700 |
| Abbott Laboratories |
|
| 45,864 |
|
| 925 |
| Teva Pharmaceutical Industries, |
|
| 37,388 |
|
|
|
|
|
|
| ||
|
|
|
|
|
| 83,252 |
|
|
|
|
|
|
| ||
Professional Services—0.9% |
|
|
|
| |||
| 900 |
| VSE Corp. |
|
| 21,285 |
|
|
|
|
|
|
| ||
Real Estate Investment Trusts—4.3% |
|
|
|
| |||
| 600 |
| American Tower Corp. |
|
| 45,174 |
|
| 1,600 |
| Colony Financial, Inc. |
|
| 32,016 |
|
| 1,200 |
| Western Asset Mortgage |
|
|
|
|
|
|
| Capital Corp. |
|
| 25,740 |
|
|
|
|
|
|
| ||
|
|
|
|
|
| 102,930 |
|
|
|
|
|
|
| ||
Road & Rail—1.1% |
|
|
|
| |||
| 1,500 |
| Marten Transport, Ltd. |
|
| 27,750 |
|
|
|
|
|
|
| ||
The accompanying notes are an integral part of these financial statements.
50
|
Alpine Accelerating Dividend Fund |
Schedule of Portfolio Investments—Continued
October 31, 2012
|
|
|
|
|
|
|
|
Shares |
| Security |
| Value |
| ||
| |||||||
|
|
|
|
|
| ||
Common Stocks—continued |
|
|
|
| |||
Semiconductors & Semiconductor Equipment—4.9% |
|
|
|
| |||
| 1,250 |
| Avago Technologies, Ltd. |
| $ | 41,287 |
|
| 1,700 |
| Intel Corp. |
|
| 36,763 |
|
| 1,250 |
| Linear Technology Corp. |
|
| 39,075 |
|
|
|
|
|
|
| ||
|
|
|
|
|
| 117,125 |
|
|
|
|
|
|
| ||
Software—4.4% |
|
|
|
| |||
| 1,400 |
| Microsoft Corp. |
|
| 39,949 |
|
| 1,250 |
| Oracle Corp. |
|
| 38,812 |
|
| 1,300 |
| Totvs SA |
|
| 26,435 |
|
|
|
|
|
|
| ||
|
|
|
|
|
| 105,196 |
|
|
|
|
|
|
| ||
Specialty Retail—3.0% |
|
|
|
| |||
| 830 |
| Dick’s Sporting Goods, Inc. |
|
| 41,500 |
|
| 950 |
| Rent-A-Center, Inc. |
|
| 31,664 |
|
|
|
|
|
|
| ||
|
|
|
|
|
| 73,164 |
|
|
|
|
|
|
| ||
Textiles, Apparel & Luxury Goods—3.1% |
|
|
|
| |||
| 360 |
| NIKE, Inc.—Class B |
|
| 32,897 |
|
| 270 |
| VF Corp. |
|
| 42,249 |
|
|
|
|
|
|
| ||
|
|
|
|
|
| 75,146 |
|
|
|
|
|
|
| ||
|
|
|
|
|
|
|
|
Shares |
| Security |
| Value |
| ||
| |||||||
|
| ||||||
Common Stocks—continued |
|
|
|
| |||
Thrifts & Mortgage Finance—1.5% |
|
|
|
| |||
| 1,500 |
| Berkshire Hills Bancorp, Inc. |
| $ | 35,220 |
|
|
|
|
|
|
| ||
|
|
| Total Common Stocks |
|
| 2,256,490 |
|
|
|
|
|
|
| ||
|
|
|
|
|
|
| |
Principal |
|
|
|
|
|
| |
|
|
|
|
|
| ||
Short-Term Investments—6.4% |
|
|
|
| |||
$ | 154,000 |
| State Street Eurodollar |
|
| 154,000 |
|
|
|
|
|
|
| ||
|
|
| Total Short-Term Investments |
|
| 154,000 |
|
|
|
|
|
|
| ||
|
|
|
|
|
|
|
|
|
|
| Total Investments |
|
| 2,410,490 |
|
|
|
| Other Assets in Excess |
|
| 1,695 |
|
|
|
|
|
|
| ||
|
|
| TOTAL NET ASSETS 100.0% |
| $ | 2,412,185 |
|
|
|
|
|
|
| ||
|
Percentages are stated as a percent of net assets.
ADR—American Depositary Receipt
NV—Naamloze Vennootschap is the Dutch term for a public limited liability corporation.
SA—Generally designates corporations in various countries, mostly those employing the civil law.
The accompanying notes are an integral part of these financial statements.
51
|
Alpine Financial Services Fund |
Schedule of Portfolio Investments
October 31, 2012
|
|
|
|
|
|
|
|
Shares |
| Security |
| Value |
| ||
| |||||||
|
|
|
|
|
|
|
|
Common Stocks—81.2% |
|
|
|
| |||
Capital Markets—9.4% |
|
|
|
| |||
| 20,000 |
| BGC Partners, Inc.—Class A |
| $ | 93,600 |
|
| 52,033 |
| Cowen Group, Inc.—Class A (a) |
|
| 132,164 |
|
| 18,500 |
| GFI Group, Inc. |
|
| 58,460 |
|
| 40,000 |
| Gleacher & Co., Inc. (a) |
|
| 28,000 |
|
| 18,000 |
| JMP Group, Inc. |
|
| 99,720 |
|
| 4,869 |
| LPL Financial Holdings, Inc. |
|
| 142,175 |
|
| 4,576 |
| Manning & Napier, Inc. |
|
| 59,534 |
|
| 2,000 |
| Och-Ziff Capital Management |
|
| 20,020 |
|
| 1,705 |
| SWS Group, Inc. (a) |
|
| 9,701 |
|
| 20,000 |
| The Blackstone Group LP |
|
| 307,200 |
|
| 1,200 |
| WisdomTree Investments, |
|
| 7,692 |
|
|
|
|
|
|
| ||
|
|
|
|
|
| 958,266 |
|
|
|
|
|
|
| ||
Commercial Banks—40.6% |
|
|
|
| |||
| 45,165 |
| 1st United Bancorp, Inc. (a) |
|
| 271,442 |
|
| 3,000 |
| American River Bankshares (a) |
|
| 22,140 |
|
| 1,000 |
| Banco Macro SA—ADR (a) |
|
| 13,510 |
|
| 48,940 |
| Bank of Commerce Holdings |
|
| 224,145 |
|
| 5,000 |
| Bank of Georgia Holdings PLC |
|
| 95,937 |
|
| 9,127 |
| Bank of Virginia (a) |
|
| 35,413 |
|
| 13,428 |
| Barclays PLC |
|
| 49,298 |
|
| 2,266 |
| BNC Bancorp |
|
| 17,856 |
|
| 91,069 |
| Carolina Trust Bank (a) |
|
| 223,119 |
|
| 12,493 |
| Centerstate Banks, Inc. |
|
| 108,314 |
|
| 2,000 |
| CIT Group, Inc. (a) |
|
| 74,440 |
|
| 36,627 |
| Citizens First Corp. (a) |
|
| 314,077 |
|
| 7,095 |
| Comerica, Inc. |
|
| 211,502 |
|
| 6,240 |
| Community National Bank of |
|
| 20,280 |
|
| 15,000 |
| CU Bancorp (a) |
|
| 193,500 |
|
| 4,000 |
| First Business Financial |
|
| 98,560 |
|
| 42,632 |
| First California Financial |
|
| 287,766 |
|
| 6,100 |
| First Trust Bank (a) |
|
| 43,920 |
|
| 1,000 |
| FirstMerit Corp. |
|
| 13,860 |
|
| 500 |
| Manhattan Bancorp (a) |
|
| 1,510 |
|
| 21,000 |
| Mitsubishi UFJ Financial |
|
| 94,964 |
|
| 10,200 |
| New Century Bancorp, Inc. (a) |
|
| 54,570 |
|
| 400 |
| North Valley Bancorp (a) |
|
| 5,568 |
|
| 2,375 |
| Old Point Financial Corp. |
|
| 26,647 |
|
| 4,000 |
| Oriental Financial Group, Inc. |
|
| 47,120 |
|
| 24,642 |
| Pacific Mercantile Bancorp (a) |
|
| 176,683 |
|
| 18,276 |
| Pacific Premier Bancorp, Inc. (a) |
|
| 205,057 |
|
| 2,500 |
| Plaza Bank (a) |
|
| 5,000 |
|
| 1,000 |
| PNC Financial Services |
|
| 58,190 |
|
| 75,000 |
| Republic First Bancorp, Inc. (a) |
|
| 159,750 |
|
| 3,120 |
| Rurban Financial Corp. (a) |
|
| 22,464 |
|
| 2,000 |
| Shore Bancshares, Inc. |
|
| 11,300 |
|
| 38,750 |
| Southern National Bancorp of |
|
| 315,425 |
|
| 3,000 |
| Sumitomo Mitsui Financial |
|
| 91,845 |
|
| 6,000 |
| Summit State Bank |
|
| 42,480 |
|
| 152,347 |
| Synovus Financial Corp. |
|
| 373,250 |
|
| 2,551 |
| Valley Commerce Bancorp (b) |
|
| 28,699 |
|
|
|
|
|
|
|
|
|
Shares |
| Security |
| Value |
| ||
| |||||||
|
|
|
|
|
|
|
|
Common Stocks—continued |
|
|
|
| |||
Commercial Banks—continued |
|
|
|
| |||
| 32,000 |
| VTB Bank OJSC-GDR (c) |
| $ | 110,272 |
|
| 1,974 |
| Yadkin Valley Financial Corp. (a) |
|
| 6,317 |
|
|
|
|
|
|
| ||
|
|
|
|
|
| 4,156,190 |
|
|
|
|
|
|
| ||
Consumer Finance—4.5% |
|
|
|
| |||
| 591 |
| Ezcorp, Inc.-Class A (a) |
|
| 11,619 |
|
| 26,000 |
| Green Dot Corp.—Class A (a) |
|
| 264,940 |
|
| 25,000 |
| Imperial Holdings, Inc. (a) |
|
| 88,000 |
|
| 9,000 |
| Netspend Holdings, Inc. (a) |
|
| 96,390 |
|
|
|
|
|
|
| ||
|
|
|
|
|
| 460,949 |
|
|
|
|
|
|
| ||
Diversified Financial Services—9.4% |
|
|
|
| |||
| 7,124 |
| BM&F Bovespa SA |
|
| 45,598 |
|
| 1,100 |
| BTG Pactual Participations, Ltd. |
|
| 17,331 |
|
| 3,325 |
| CME Group, Inc. |
|
| 185,967 |
|
| 162,000 |
| Dubai Financial Market (a) |
|
| 44,547 |
|
| 3,115 |
| IntercontinentalExchange, Inc. (a) |
|
| 408,065 |
|
| 4,000 |
| NYSE Euronext |
|
| 99,040 |
|
| 7,000 |
| The NASDAQ OMX Group, Inc. |
|
| 166,670 |
|
|
|
|
|
|
| ||
|
|
|
|
|
| 967,218 |
|
|
|
|
|
|
| ||
Industrial Conglomerates—1.2% |
|
|
|
| |||
| 6,000 |
| General Electric Co. |
|
| 126,360 |
|
|
|
|
|
|
| ||
Insurance—0.9% |
|
|
|
| |||
| 2,600 |
| Talanx AG (a) |
|
| 65,715 |
|
| 1,000 |
| The Phoenix Co., Inc. (a) |
|
| 30,140 |
|
|
|
|
|
|
| ||
|
|
|
|
|
| 95,855 |
|
|
|
|
|
|
| ||
Real Estate Investment Trusts (REITs)—2.8% |
|
|
|
| |||
| 15,000 |
| Urstadt Biddle Properties, |
|
| 284,100 |
|
|
|
|
|
|
| ||
Thrifts & Mortgage Finance—10.7% |
|
|
|
| |||
| 17,105 |
| Alliance Bancorp, Inc. of |
|
| 212,188 |
|
| 10,000 |
| Bank Mutual Corp. |
|
| 45,100 |
|
| 129,999 |
| Central Federal Corp. (a) |
|
| 196,298 |
|
| 5,895 |
| First Pactrust Bancorp, Inc. |
|
| 69,325 |
|
| 4,000 |
| Flagstar Bancorp, Inc. (a) |
|
| 55,200 |
|
| 8,823 |
| HopFed Bancorp, Inc. |
|
| 69,261 |
|
| 15,000 |
| Jefferson Bancshares, Inc. (a) |
|
| 44,400 |
|
| 24,751 |
| Provident Financial |
|
| 365,572 |
|
| 11,000 |
| Riverview Bancorp, Inc. (a) |
|
| 18,150 |
|
| 1,000 |
| TF Financial Corp. |
|
| 22,400 |
|
|
|
|
|
|
| ||
|
|
|
|
|
| 1,097,894 |
|
|
|
|
|
|
| ||
Trading Companies & Distributors—1.7% |
|
|
|
| |||
| 5,769 |
| Textainer Group Holdings, Ltd. |
|
| 174,224 |
|
|
|
|
|
|
| ||
|
|
| Total Common Stocks |
|
| 8,321,056 |
|
|
|
|
|
|
| ||
Preferred Stocks—0.4% |
|
|
|
| |||
Commercial Banks—0.4% |
|
|
|
| |||
| 13,000 |
| Banco Industrial e Comercial SA |
|
| 42,628 |
|
|
|
|
|
|
| ||
|
|
| Total Preferred Stocks |
|
| 42,628 |
|
|
|
|
|
|
| ||
Investment Companies—3.0% |
|
|
|
| |||
| 13,200 |
| Direxion Daily Financial Bear |
|
| 229,152 |
|
| 2,200 |
| ProShares UltraShort |
|
| 80,542 |
|
|
|
|
|
|
| ||
|
|
| Total Investment Companies |
|
| 309,694 |
|
|
|
|
|
|
| ||
The accompanying notes are an integral part of these financial statements.
52
|
Alpine Financial Services Fund |
Schedule of Portfolio Investments—Continued
October 31, 2012
|
|
|
|
|
|
|
|
Shares |
| Security |
| Value |
| ||
| |||||||
|
|
|
|
|
|
|
|
Rights—0.0% (d) |
|
|
|
| |||
Commercial Banks—0.0% |
|
|
|
| |||
| 9,127 |
| Bank of Virginia (a) |
| $ | 2,556 |
|
|
|
|
|
|
| ||
|
|
| Total Rights (Cost $0) |
|
| 2,556 |
|
|
|
|
|
|
| ||
|
|
|
|
|
|
|
|
Principal |
|
|
|
|
|
| |
|
|
|
|
|
| ||
Short-Term Investments—14.6% |
|
|
|
| |||
$ | 1,492,000 |
| State Street Eurodollar |
|
| 1,492,000 |
|
|
|
|
|
|
| ||
|
|
| Total Short-Term Investments |
|
| 1,492,000 |
|
|
|
|
|
|
| ||
|
|
|
|
|
|
|
|
|
|
| Total Investments |
|
| 10,167,934 |
|
|
|
| Other Assets in Excess |
|
| 80,641 |
|
|
|
|
|
|
| ||
|
|
| TOTAL NET ASSETS 100.0% |
| $ | 10,248,575 |
|
|
|
|
|
|
| ||
|
|
|
| ||
| ||
Percentages are stated as a percent of net assets. | ||
| ||
(a) | Non-income producing security. | |
| ||
(b) | Illiquid security. | |
| ||
(c) | Restricted under Rule 144A of the Securities Act of 1933. These securities may be resold in transactions exempt from registration, normally to qualified institutional buyers. These securities have been determined to be liquid under guidelines established by the Board of Trustees. Liquid securities restricted under Rule 144A comprised 1.1% of the Fund’s net assets. | |
| ||
(d) | Less than 0.05% of Net Assets. | |
| ||
ADR—American Depositary Receipt | ||
| ||
AG—Aktiengesellschaft is a German term that refers to a corporation that is limited by shares, i.e., owned by shareholders. | ||
| ||
GDR—Global Depositary Receipt | ||
| ||
OJSC—Open Joint Stock Company | ||
| ||
PLC—Public Limited Company | ||
| ||
SA—Generally designates corporations in various countries, mostly those employing the civil law. | ||
The accompanying notes are an integral part of these financial statements.
53
|
Alpine Innovators Fund |
Schedule of Portfolio Investments
October 31, 2012
|
|
|
|
|
|
|
|
Shares |
| Security |
| Value |
| ||
| |||||||
|
|
|
|
|
|
|
|
Common Stocks—96.0% |
|
|
|
| |||
Aerospace & Defense—2.0% |
|
|
|
| |||
| 10,000 |
| Aerovironment, Inc. (a) |
| $ | 219,900 |
|
|
|
|
|
|
| ||
Biotechnology—3.6% |
|
|
|
| |||
| 12,500 |
| ARIAD Pharmaceuticals, Inc. (a) |
|
| 269,375 |
|
| 5,000 |
| Myriad Genetics, Inc. (a) |
|
| 130,850 |
|
|
|
|
|
|
| ||
|
|
|
|
|
| 400,225 |
|
|
|
|
|
|
| ||
Commercial Banks—2.0% |
|
|
|
| |||
| 8,000 |
| SunTrust Banks, Inc. |
|
| 217,600 |
|
|
|
|
|
|
| ||
Commercial Services & Supplies—3.0% |
|
|
|
| |||
| 15,000 |
| Abtech Holdings, Inc. (a) |
|
| 13,500 |
|
| 11,000 |
| Copart, Inc. (a) |
|
| 316,690 |
|
|
|
|
|
|
| ||
|
|
|
|
|
| 330,190 |
|
|
|
|
|
|
| ||
Computers & Peripherals—5.0% |
|
|
|
| |||
| 500 |
| Apple, Inc. |
|
| 297,550 |
|
| 15,000 |
| Cray, Inc. (a) |
|
| 182,550 |
|
| 5,000 |
| Hewlett-Packard Co. |
|
| 69,250 |
|
|
|
|
|
|
| ||
|
|
|
|
|
| 549,350 |
|
|
|
|
|
|
| ||
Diversified Financial Services—2.0% |
|
|
|
| |||
| 4,000 |
| CME Group, Inc. |
|
| 223,720 |
|
|
|
|
|
|
| ||
Diversified Telecommunication Services—0.7% |
|
|
|
| |||
| 4,000 |
| magicJack VocalTec, Ltd. (a) |
|
| 81,400 |
|
|
|
|
|
|
| ||
Electronic Equipment, Instruments & Components—5.8% |
|
|
|
| |||
| 11,000 |
| FLIR Systems, Inc. |
|
| 213,730 |
|
| 12,434 |
| InvenSense, Inc. (a) |
|
| 139,261 |
|
| 3,000 |
| IPG Photonics Corp. (a) |
|
| 159,240 |
|
| 6,000 |
| Oxford Instruments PLC |
|
| 130,132 |
|
|
|
|
|
|
| ||
|
|
|
|
|
| 642,363 |
|
|
|
|
|
|
| ||
Energy Equipment & Services—0.6% |
|
|
|
| |||
| 25,000 |
| Electromagnetic GeoServices (a) |
|
| 54,374 |
|
| 10,833 |
| Polarcus, Ltd. (a) |
|
| 11,286 |
|
|
|
|
|
|
| ||
|
|
|
|
|
| 65,660 |
|
|
|
|
|
|
| ||
Health Care Equipment & Supplies—9.0% |
|
|
|
| |||
| 10,000 |
| Endologix, Inc. (a) |
|
| 134,600 |
|
| 1,400 |
| Intuitive Surgical, Inc. (a) |
|
| 759,108 |
|
| 5,000 |
| MAKO Surgical Corp. (a) |
|
| 75,750 |
|
| 5,000 |
| Synergetics U.S.A., Inc. (a) |
|
| 21,900 |
|
|
|
|
|
|
| ||
|
|
|
|
|
| 991,358 |
|
|
|
|
|
|
| ||
Health Care Providers & Services—8.6% |
|
|
|
| |||
| 17,000 |
| Bio-Reference Labs, Inc. (a) |
|
| 471,920 |
|
| 6,000 |
| MEDNAX, Inc. (a) |
|
| 413,880 |
|
| 5,000 |
| Metropolitan Health |
|
| 54,650 |
|
|
|
|
|
|
| ||
|
|
|
|
|
| 940,450 |
|
|
|
|
|
|
| ||
Health Care Technology—1.0% |
|
|
|
| |||
| 3,228 |
| Allscripts Healthcare |
|
| 41,706 |
|
| 4,000 |
| Quality Systems, Inc. |
|
| 69,800 |
|
|
|
|
|
|
| ||
|
|
|
|
|
| 111,506 |
|
|
|
|
|
|
| ||
Household Durables—1.6% |
|
|
|
| |||
| 25,000 |
| Zagg, Inc. (a) |
|
| 179,500 |
|
|
|
|
|
|
| ||
|
|
|
|
|
|
|
|
Shares |
| Security |
| Value |
| ||
| |||||||
|
|
|
|
|
|
|
|
Common Stocks—continued |
|
|
|
| |||
Internet & Catalog Retail—15.8% |
|
|
|
| |||
| 40 |
| Amazon.com, Inc. (a) |
| $ | 9,313 |
|
| 3,000 |
| priceline.com, Inc. (a) |
|
| 1,721,310 |
|
|
|
|
|
|
| ||
|
|
|
|
|
| 1,730,623 |
|
|
|
|
|
|
| ||
Internet Software & Services—5.3% |
|
|
|
| |||
| 700 |
| Google, Inc.—Class A (a) |
|
| 475,839 |
|
| 2,500 |
| Liquidity Services, Inc. (a) |
|
| 103,075 |
|
|
|
|
|
|
| ||
|
|
|
|
|
| 578,914 |
|
|
|
|
|
|
| ||
Leisure Equipment & Products—1.2% |
|
|
|
| |||
| 1,500 |
| Polaris Industries, Inc. |
|
| 126,750 |
|
|
|
|
|
|
| ||
Life Sciences Tools & Services—5.8% |
|
|
|
| |||
| 1,000 |
| Bio-Rad Laboratories, Inc.— |
|
| 101,350 |
|
| 11,000 |
| Life Technologies Corp. (a) |
|
| 538,010 |
|
|
|
|
|
|
| ||
|
|
|
|
|
| 639,360 |
|
|
|
|
|
|
| ||
Machinery—7.9% |
|
|
|
| |||
| 1,000 |
| Chart Industries, Inc. (a) |
|
| 70,790 |
|
| 12,500 |
| Commercial Vehicle |
|
| 94,875 |
|
| 3,900 |
| Flowserve Corp. |
|
| 528,411 |
|
| 6,000 |
| Westport Innovations, Inc. (a) |
|
| 168,360 |
|
|
|
|
|
|
| ||
|
|
|
|
|
| 862,436 |
|
|
|
|
|
|
| ||
Personal Products—0.2% |
|
|
|
| |||
| 400 |
| Herbalife, Ltd. |
|
| 20,540 |
|
|
|
|
|
|
| ||
Pharmaceuticals—1.6% |
|
|
|
| |||
| 8,000 |
| The Medicines Co. (a) |
|
| 175,360 |
|
|
|
|
|
|
| ||
Semiconductors & Semiconductor Equipment—1.7% |
|
|
|
| |||
| 6,000 |
| Veeco Instruments, Inc. (a) |
|
| 184,200 |
|
|
|
|
|
|
| ||
Software—11.6% |
|
|
|
| |||
| 16,400 |
| ANSYS, Inc. (a) |
|
| 1,162,432 |
|
| 10,000 |
| Callidus Software, Inc. (a) |
|
| 46,400 |
|
| 20,600 |
| Mitek Systems, Inc. (a) |
|
| 65,714 |
|
|
|
|
|
|
| ||
|
|
|
|
|
| 1,274,546 |
|
|
|
|
|
|
| ||
|
|
| Total Common Stocks |
|
| 10,545,951 |
|
|
|
|
|
|
| ||
|
|
|
|
|
|
|
|
Principal |
|
|
|
|
|
| |
|
|
|
|
|
| ||
Short-Term Investments—5.2% |
|
|
|
| |||
$ | 578,000 |
| State Street Eurodollar |
|
| 578,000 |
|
|
|
|
|
|
| ||
|
|
| Total Short-Term Investments |
|
| 578,000 |
|
|
|
|
|
|
| ||
|
|
|
|
|
|
|
|
|
|
| Total Investments |
|
| 11,123,951 |
|
|
|
| Liabilities in Excess of |
|
| (135,553) |
|
|
|
|
|
|
| ||
|
|
| TOTAL NET ASSETS 100.0% |
| $ | 10,988,398 |
|
|
|
|
|
|
| ||
|
|
|
| ||
| ||
Percentages are stated as a percent of net assets. | ||
| ||
(a) | Non-income producing security. | |
The accompanying notes are an integral part of these financial statements.
54
|
Alpine Transformations Fund |
Schedule of Portfolio Investments
October 31, 2012
|
|
|
|
|
|
|
|
Shares |
| Security |
| Value |
| ||
| |||||||
|
|
|
|
|
|
|
|
Common Stocks—96.0% |
|
|
|
| |||
Aerospace & Defense—1.8% |
|
|
|
| |||
| 5,000 |
| Aerovironment, Inc. (a) |
| $ | 109,950 |
|
|
|
|
|
|
| ||
Chemicals—7.6% |
|
|
|
|
| ||
| 2,500 |
| Ashland, Inc. |
|
| 177,875 |
|
| 2,500 |
| Eastman Chemical Co. |
|
| 148,100 |
|
| 13,000 |
| Flotek Industries, Inc. (a) |
|
| 144,430 |
|
|
|
|
|
|
| ||
|
|
|
|
|
| 470,405 |
|
|
|
|
|
|
| ||
Commercial Banks—1.1% |
|
|
|
| |||
| 1,991 |
| Wells Fargo & Co. |
|
| 67,077 |
|
|
|
|
|
|
| ||
Commercial Services & Supplies—0.2% |
|
|
|
| |||
| 15,000 |
| Abtech Holdings, Inc. (a) |
|
| 13,500 |
|
|
|
|
|
|
| ||
Computers & Peripherals—6.8% |
|
|
|
| |||
| 400 |
| Apple, Inc. |
|
| 238,040 |
|
| 14,758 |
| Cray, Inc. (a) |
|
| 179,605 |
|
|
|
|
|
|
| ||
|
|
|
|
|
| 417,645 |
|
|
|
|
|
|
| ||
Diversified Financial Services—1.5% |
|
|
|
| |||
| 10,000 |
| Bank of America Corp. |
|
| 93,200 |
|
|
|
|
|
|
| ||
Electrical Equipment—4.4% |
|
|
|
| |||
| 8,000 |
| Generac Holdings, Inc. |
|
| 272,000 |
|
|
|
|
|
|
| ||
Electronic Equipment, Instruments & Components—1.2% |
|
|
|
| |||
| 3,500 |
| Oxford Instruments PLC |
|
| 75,911 |
|
|
|
|
|
|
| ||
Energy Equipment & Services—5.8% |
|
|
|
| |||
| 2,000 |
| CARBO Ceramics, Inc. |
|
| 147,900 |
|
| 25,000 |
| Electromagnetic GeoServices (a) |
|
| 54,374 |
|
| 2,000 |
| National Oilwell Varco, Inc. |
|
| 147,400 |
|
| 10,833 |
| Polarcus, Ltd. (a) |
|
| 11,286 |
|
|
|
|
|
|
| ||
|
|
|
|
|
| 360,960 |
|
|
|
|
|
|
| ||
Health Care Equipment & Supplies—11.9% |
|
|
|
| |||
| 2,000 |
| Edwards Lifesciences Corp. (a) |
|
| 173,660 |
|
| 1,000 |
| Intuitive Surgical, Inc. (a) |
|
| 542,220 |
|
| 5,000 |
| Synergetics U.S.A., Inc. (a) |
|
| 21,900 |
|
|
|
|
|
|
| ||
|
|
|
|
|
| 737,780 |
|
|
|
|
|
|
| ||
Health Care Providers & Services—0.9% |
|
|
|
| |||
| 5,000 |
| Metropolitan Health |
|
| 54,650 |
|
|
|
|
|
|
| ||
Hotels, Restaurants & Leisure—3.0% |
|
|
|
| |||
| 4,000 |
| Starbucks Corp. |
|
| 183,600 |
|
|
|
|
|
|
| ||
Household Durables—6.4% |
|
|
|
| |||
| 5,000 |
| Garmin, Ltd. |
|
| 189,950 |
|
| 3,200 |
| Helen of Troy, Ltd. (a) |
|
| 96,704 |
|
| 4,000 |
| Tempur-Pedic |
|
| 105,760 |
|
|
|
|
|
|
| ||
|
|
|
|
|
| 392,414 |
|
|
|
|
|
|
| ||
Internet & Catalog Retail—7.4% |
|
|
|
| |||
| 800 |
| priceline.com, Inc. (a) |
|
| 459,016 |
|
|
|
|
|
|
| ||
Internet Software & Services—4.2% |
|
|
|
| |||
| 200 |
| Google, Inc.—Class A (a) |
|
| 135,954 |
|
| 3,000 |
| Liquidity Services, Inc. (a) |
|
| 123,690 |
|
|
|
|
|
|
| ||
|
|
|
|
|
| 259,644 |
|
|
|
|
|
|
| ||
|
|
|
|
|
|
|
|
Shares |
| Security |
| Value |
| ||
| |||||||
|
|
|
|
|
|
|
|
Common Stocks—continued |
|
|
|
| |||
Leisure Equipment & Products—2.7% |
|
|
|
| |||
| 2,000 |
| Polaris Industries, Inc. |
| $ | 169,000 |
|
|
|
|
|
|
| ||
Machinery—14.3% |
|
|
|
| |||
| 2,000 |
| Chart Industries, Inc. (a) |
|
| 141,580 |
|
| 2,400 |
| Cummins, Inc. |
|
| 224,592 |
|
| 1,500 |
| Gardner Denver, Inc. |
|
| 103,995 |
|
| 7,000 |
| Manitex International, Inc. (a) |
|
| 49,560 |
|
| 3,000 |
| Snap-On, Inc. |
|
| 231,990 |
|
| 1,000 |
| SPX Corp. |
|
| 68,590 |
|
| 10,000 |
| Wabash National Corp. (a) |
|
| 63,100 |
|
|
|
|
|
|
| ||
|
|
|
|
|
| 883,407 |
|
|
|
|
|
|
| ||
Metals & Mining—0.8% |
|
|
|
| |||
| 1,500 |
| Walter Energy, Inc. |
|
| 52,440 |
|
|
|
|
|
|
| ||
Multi-Utilities—1.7% |
|
|
|
| |||
| 10,000 |
| Just Energy Group, Inc. |
|
| 102,328 |
|
|
|
|
|
|
| ||
Oil, Gas & Consumable Fuels—2.0% |
|
|
|
| |||
| 372 |
| Apache Corp. |
|
| 30,783 |
|
| 1,500 |
| Murphy Oil Corp. |
|
| 90,000 |
|
|
|
|
|
|
| ||
|
|
|
|
|
| 120,783 |
|
|
|
|
|
|
| ||
Real Estate Investment Trusts (REITs)—0.9% |
|
|
|
| |||
| 1,102 |
| Walter Investment |
|
| 53,259 |
|
|
|
|
|
|
| ||
Software—7.3% |
|
|
|
| |||
| 15,000 |
| Callidus Software, Inc. (a) |
|
| 69,600 |
|
| 20,600 |
| Mitek Systems, Inc. (a) |
|
| 65,714 |
|
| 5,000 |
| Nuance Communications, Inc. (a) |
|
| 111,300 |
|
| 4,000 |
| SolarWinds, Inc. (a) |
|
| 202,360 |
|
|
|
|
|
|
| ||
|
|
|
|
|
| 448,974 |
|
|
|
|
|
|
| ||
Specialty Retail—1.1% |
|
|
|
| |||
| 2,000 |
| Rent-A-Center, Inc. |
|
| 66,660 |
|
|
|
|
|
|
| ||
Trading Companies & Distributors—1.0% |
|
|
|
| |||
| 1,500 |
| United Rentals, Inc. (a) |
|
| 60,990 |
|
|
|
|
|
|
| ||
|
|
| Total Common Stocks |
|
| 5,925,593 |
|
|
|
|
|
|
| ||
|
|
|
|
|
|
|
|
Principal |
|
|
|
|
|
| |
|
|
|
|
|
| ||
Short-Term Investments—3.3% |
|
|
|
| |||
$ | 206,000 |
| State Street Eurodollar |
|
| 206,000 |
|
|
|
|
|
|
| ||
|
|
| Total Short-Term Investments |
|
| 206,000 |
|
|
|
|
|
|
| ||
|
|
|
|
|
|
|
|
|
|
| Total Investments |
|
| 6,131,593 |
|
|
|
| Other Assets in Excess |
|
| 42,418 |
|
|
|
|
|
|
| ||
|
|
| TOTAL NET ASSETS 100.0% |
| $ | 6,174,011 |
|
|
|
|
|
|
| ||
|
|
|
| ||
| ||
Percentages are stated as a percent of net assets. | ||
|
| |
(a) | Non-income producing security. | |
|
| |
PLC—Public Limited Company | ||
The accompanying notes are an integral part of these financial statements.
55
|
Alpine Foundation Fund |
Schedule of Portfolio Investments
October 31, 2012
|
|
|
|
|
|
|
|
Shares |
| Security |
| Value |
| ||
| |||||||
|
|
|
|
|
|
|
|
Common Stocks—71.8% |
|
|
|
| |||
Aerospace & Defense—1.6% |
|
|
|
| |||
| 15,000 |
| The Boeing Co. |
| $ | 1,056,600 |
|
|
|
|
|
|
| ||
Auto Components—0.6% |
|
|
|
| |||
| 20,000 |
| Cooper Tire & Rubber Co. |
|
| 402,600 |
|
|
|
|
|
|
| ||
Beverages-0.6% |
|
|
|
| |||
| 5,000 |
| Anheuser-Busch InBev NV—ADR |
|
| 419,000 |
|
|
|
|
|
|
| ||
Capital Markets—1.1% |
|
|
|
| |||
| 15,900 |
| State Street Corp. |
|
| 708,663 |
|
|
|
|
|
|
| ||
Chemicals—4.1% |
|
|
|
| |||
| 15,000 |
| Ashland, Inc. |
|
| 1,067,250 |
|
| 20,000 |
| E.I. duPont de Nemours & Co. |
|
| 890,400 |
|
| 12,000 |
| Eastman Chemical Co. |
|
| 710,880 |
|
|
|
|
|
|
| ||
|
|
|
|
|
| 2,668,530 |
|
|
|
|
|
|
| ||
Commercial Banks—3.9% |
|
|
|
| |||
| 5,000 |
| PNC Financial Services Group, Inc. |
|
| 290,950 |
|
| 8,262 |
| Southside Bancshares, Inc. |
|
| 168,628 |
|
| 35,000 |
| Sun Bancorp, Inc. (a) |
|
| 108,150 |
|
| 7,293 |
| Susquehanna Bancshares, Inc. |
|
| 75,628 |
|
| 34,728 |
| Valley National Bancorp |
|
| 338,251 |
|
| 10,000 |
| Washington Trust Bancorp, Inc. |
|
| 269,900 |
|
| 44,501 |
| Webster Financial Corp. |
|
| 979,022 |
|
| 10,432 |
| Wells Fargo & Co. |
|
| 351,454 |
|
|
|
|
|
|
| ||
|
|
|
|
|
| 2,581,983 |
|
|
|
|
|
|
| ||
Commercial Services & Supplies—0.5% |
|
|
|
| |||
| 10,000 |
| Iron Mountain, Inc. |
|
| 346,000 |
|
|
|
|
|
|
| ||
Computers & Peripherals—2.1% |
|
|
|
| |||
| 2,000 |
| Apple, Inc. |
|
| 1,190,200 |
|
| 14,000 |
| Hewlett-Packard Co. |
|
| 193,900 |
|
|
|
|
|
|
| ||
|
|
|
|
|
| 1,384,100 |
|
|
|
|
|
|
| ||
Diversified Financial Services—6.0% |
|
|
|
| |||
| 63,041 |
| Bank of America Corp. |
|
| 587,542 |
|
| 14,367 |
| Citigroup, Inc. |
|
| 537,182 |
|
| 13,000 |
| CME Group, Inc. |
|
| 727,090 |
|
| 45,600 |
| JPMorgan Chase & Co. |
|
| 1,900,608 |
|
| 15,406 |
| Medallion Financial Corp. |
|
| 192,729 |
|
|
|
|
|
|
| ||
|
|
|
|
|
| 3,945,151 |
|
|
|
|
|
|
| ||
Diversified Telecommunication Services—0.7% |
|
|
|
| |||
| 66,185 |
| TeliaSonera AB |
|
| 435,752 |
|
|
|
|
|
|
| ||
Electric Utilities—3.2% |
|
|
|
| |||
| 7,400 |
| Duke Energy Corp. |
|
| 486,106 |
|
| 10,000 |
| First Energy Corp. |
|
| 457,200 |
|
| 17,800 |
| Hawaiian Electric Industries, Inc. |
|
| 460,664 |
|
| 10,400 |
| The Southern Co. |
|
| 487,136 |
|
| 6,646 |
| Unitil Corp. |
|
| 176,717 |
|
|
|
|
|
|
| ||
|
|
|
|
|
| 2,067,823 |
|
|
|
|
|
|
| ||
Electrical Equipment—2.6% |
|
|
|
| |||
| 33,750 |
| AMETEK, Inc. |
|
| 1,199,812 |
|
| 8,700 |
| Preformed Line Products Co. |
|
| 468,669 |
|
|
|
|
|
|
| ||
|
|
|
|
|
| 1,668,481 |
|
|
|
|
|
|
| ||
Electronic Equipment, Instruments & Components—0.4% |
|
|
|
| |||
| 20,000 |
| Corning, Inc. |
|
| 235,000 |
|
|
|
|
|
|
| ||
Food & Staples Retailing—2.1% |
|
|
|
| |||
| 15,000 |
| CVS Caremark Corp. |
|
| 696,000 |
|
| 20,000 |
| Walgreen Co. |
|
| 704,600 |
|
|
|
|
|
|
| ||
|
|
|
|
|
| 1,400,600 |
|
|
|
|
|
|
| ||
Food Products—0.9% |
|
|
|
| |||
| 10,000 |
| H.J. Heinz Co. |
|
| 575,100 |
|
|
|
|
|
|
| ||
|
|
|
|
|
|
|
|
Shares |
| Security |
| Value |
| ||
| |||||||
|
|
|
|
|
|
|
|
Common Stocks—continued |
|
|
|
| |||
Health Care Equipment & Supplies—1.0% |
|
|
|
| |||
| 8,600 |
| Becton, Dickinson & Co. |
| $ | 650,848 |
|
|
|
|
|
|
| ||
Health Care Providers & Services—0.6% |
|
|
|
| |||
| 4,000 |
| McKesson Corp. |
|
| 373,240 |
|
|
|
|
|
|
| ||
Hotels, Restaurants & Leisure—0.8% |
|
|
|
| |||
| 10,000 |
| Darden Restaurants, Inc. |
|
| 526,200 |
|
|
|
|
|
|
| ||
Household Durables—1.6% |
|
|
|
| |||
| 28,000 |
| Lennar Corp.—Class A |
|
| 1,049,160 |
|
|
|
|
|
|
| ||
Household Products—0.6% |
|
|
|
| |||
| 4,000 |
| Colgate-Palmolive Co. |
|
| 419,840 |
|
|
|
|
|
|
| ||
Industrial Conglomerates—2.7% |
|
|
|
| |||
| 2,500 |
| 3M Co. |
|
| 219,000 |
|
| 74,600 |
| General Electric Co. |
|
| 1,571,076 |
|
|
|
|
|
|
| ||
|
|
|
|
|
| 1,790,076 |
|
|
|
|
|
|
| ||
Insurance—0.6% |
|
|
|
| |||
| 5,000 |
| The Chubb Corp. |
|
| 384,900 |
|
|
|
|
|
|
| ||
IT Services—3.5% |
|
|
|
| |||
| 5,000 |
| Accenture PLC—Class A |
|
| 337,050 |
|
| 10,000 |
| International Business |
|
| 1,945,300 |
|
|
|
|
|
|
| ||
|
|
|
|
|
| 2,282,350 |
|
|
|
|
|
|
| ||
Machinery—1.6% |
|
|
|
| |||
| 5,000 |
| Caterpillar, Inc. |
|
| 424,050 |
|
| 9,000 |
| Joy Global, Inc. |
|
| 562,050 |
|
| 10,000 |
| Wabash National Corp. (a) |
|
| 63,100 |
|
|
|
|
|
|
| ||
|
|
|
|
|
| 1,049,200 |
|
|
|
|
|
|
| ||
Media—1.1% |
|
|
|
| |||
| 7,692 |
| CBS Corp.—Class B |
|
| 249,221 |
|
| 20,000 |
| Cinemark Holdings, Inc. |
|
| 493,800 |
|
|
|
|
|
|
| ||
|
|
|
|
|
| 743,021 |
|
|
|
|
|
|
| ||
Multi-Utilities—1.5% |
|
|
|
| |||
| 5,200 |
| Alliant Energy Corp. |
|
| 232,440 |
|
| 4,700 |
| Dominion Resources, Inc. |
|
| 248,066 |
|
| 50,000 |
| Just Energy Group, Inc. |
|
| 511,640 |
|
|
|
|
|
|
| ||
|
|
|
|
|
| 992,146 |
|
|
|
|
|
|
| ||
Multiline Retail—0.6% |
|
|
|
| |||
| 10,000 |
| Macy’s, Inc. |
|
| 380,700 |
|
|
|
|
|
|
| ||
Oil, Gas & Consumable Fuels—4.6% |
|
|
|
| |||
| 9,000 |
| Cenovus Energy, Inc. |
|
| 317,790 |
|
| 51,500 |
| CONSOL Energy, Inc. |
|
| 1,810,740 |
|
| 5,000 |
| Murphy Oil Corp. |
|
| 300,000 |
|
| 17,547 |
| World Fuel Services Corp. |
|
| 608,881 |
|
|
|
|
|
|
| ||
|
|
|
|
|
| 3,037,411 |
|
|
|
|
|
|
| ||
Pharmaceuticals—4.1% |
|
|
|
| |||
| 7,000 |
| Abbott Laboratories |
|
| 458,640 |
|
| 27,000 |
| Johnson & Johnson |
|
| 1,912,140 |
|
| 8,000 |
| Teva Pharmaceutical |
|
| 323,360 |
|
|
|
|
|
|
| ||
|
|
|
|
|
| 2,694,140 |
|
|
|
|
|
|
| ||
Real Estate Investment Trusts—12.6% |
|
|
|
| |||
| 10,000 |
| American Capital Agency Corp. |
|
| 330,200 |
|
| 13,000 |
| Boston Properties, Inc. |
|
| 1,381,900 |
|
| 100,000 |
| CBL & Associates Properties, Inc. |
|
| 2,237,000 |
|
| 13,804 |
| DDR Corp. |
|
| 212,029 |
|
| 5,669 |
| ProLogis, Inc. |
|
| 194,390 |
|
| 23,823 |
| Simon Property Group, Inc. |
|
| 3,626,099 |
|
| 20,000 |
| Two Harbors Investment Corp. |
|
| 238,600 |
|
|
|
|
|
|
| ||
|
|
|
|
|
| 8,220,218 |
|
|
|
|
|
|
| ||
The accompanying notes are an integral part of these financial statements.
56
|
Alpine Foundation Fund |
Schedule of Portfolio Investments—Continued
October 31, 2012
|
|
|
|
|
|
|
|
Shares |
| Security |
| Value |
| ||
| |||||||
|
|
|
|
|
|
|
|
Common Stocks—continued |
|
|
|
| |||
Road & Rail—0.9% |
|
|
|
| |||
| 10,000 |
| Norfolk Southern Corp. |
| $ | 613,500 |
|
|
|
|
|
|
| ||
Textiles, Apparel & Luxury Goods—1.8% |
|
|
|
| |||
| 5,000 |
| PVH Corp. |
|
| 549,950 |
|
| 4,000 |
| VF Corp. |
|
| 625,920 |
|
|
|
|
|
|
| ||
|
|
|
|
|
| 1,175,870 |
|
|
|
|
|
|
| ||
Thrifts & Mortgage Finance—0.3% |
|
|
|
| |||
| 11,500 |
| New York Community |
|
| 159,390 |
|
|
|
|
|
|
| ||
Trading Companies & Distributors—0.9% |
|
|
|
| |||
| 3,000 |
| WW Grainger, Inc. |
|
| 604,230 |
|
|
|
|
|
|
| ||
|
|
| Total Common Stocks |
|
| 47,041,823 |
|
|
|
|
|
|
| ||
|
|
|
|
|
| ||
Principal |
| Security |
| Value |
| ||
| |||||||
|
|
|
|
|
|
|
|
Bonds—21.9% |
|
|
|
| |||
U.S. Treasury Bonds—21.9% |
|
|
|
| |||
$ | 6,000,000 |
| 6.000%, 02/15/2026 |
| $ | 8,744,064 |
|
| 4,000,000 |
| 5.250%, 11/15/2028 |
|
| 5,578,124 |
|
|
|
|
|
|
| ||
|
|
|
|
|
| 14,322,188 |
|
|
|
|
|
|
| ||
|
|
| Total Bonds |
|
| 14,322,188 |
|
|
|
|
|
|
| ||
Short-Term Investments—5.8% |
|
|
|
| |||
| 3,831,000 |
| State Street Eurodollar |
|
| 3,831,000 |
|
|
|
|
|
|
| ||
|
|
| Total Short-Term Investments |
|
| 3,831,000 |
|
|
|
|
|
|
| ||
|
|
|
|
|
|
|
|
|
|
| Total Investments |
|
| 65,195,011 |
|
|
|
| Other Assets in Excess |
|
| 310,929 |
|
|
|
|
|
|
| ||
|
|
| TOTAL NET ASSETS 100.0% |
| $ | 65,505,940 |
|
|
|
|
|
|
| ||
|
|
| |
| |
Percentages are stated as a percent of net assets. | |
| |
(a) Non-income producing security. | |
| |
AB—Aktiebolag is the Swedish equivalent of a corporation. | |
| |
ADR—American Depositary Receipt | |
| |
NV—Naamloze Vennootschap is the Dutch term for a public limited liability corporation. | |
| |
PLC—Public Limited Company | |
The accompanying notes are an integral part of these financial statements.
57
|
Alpine Ultra Short Tax Optimized Income Fund |
Schedule of Portfolio Investments
October 31, 2012
|
|
|
|
|
|
|
|
Principal |
| Security |
| Value |
| ||
| |||||||
Municipal Bonds—99.6% |
|
|
|
| |||
Alabama—1.2% |
|
|
|
| |||
$ | 425,000 |
| Bessemer Board of Education, |
| $ | 426,067 |
|
| 1,150,000 |
| Madison Industrial Development |
|
| 1,150,000 |
|
| 5,750,000 |
| Mobile Downtown Redevelopment |
|
| 5,750,000 |
|
| 4,009,000 |
| State Housing Finance Authority |
|
| 4,009,000 |
|
| 8,390,000 |
| State Port Authority Docks |
|
| 8,390,000 |
|
| 2,295,000 |
| The Medical Clinic Board of the |
|
| 2,295,000 |
|
|
|
|
|
|
| ||
|
|
|
|
|
| 22,020,067 |
|
|
|
|
|
|
| ||
Arizona—2.1% |
|
|
|
| |||
| 16,200,000 |
| Cochise County Pollution Control |
|
| 16,200,486 |
|
| 4,120,000 |
| Coconino County Pollution Control |
|
| 4,178,051 |
|
| 325,000 |
| Flagstaff, Aspen Place Sawmill |
|
| 326,079 |
|
| 850,000 |
| State Health Facilities Authority |
|
| 860,633 |
|
|
|
|
|
|
|
|
|
Principal |
| Security |
| Value |
| ||
| �� |
| ||||||
Municipal Bonds—continued |
|
|
|
| |||
Arizona—continued |
|
|
|
| |||
$ | 16,790,000 |
| State Health Facilities Authority |
| $ | 16,790,000 |
|
|
|
|
|
|
| ||
|
|
|
|
|
| 38,355,249 |
|
|
|
|
|
|
| ||
Arkansas—0.6% |
|
|
|
| |||
| 4,910,000 |
| Pulaski County Public Facilities |
|
| 4,910,000 |
|
| 5,200,000 |
| State Development Finance |
|
| 5,200,000 |
|
|
|
|
|
|
| ||
|
|
|
|
|
| 10,110,000 |
|
|
|
|
|
|
| ||
California—14.0% |
|
|
|
| |||
| 5,500,000 |
| City of Los Angeles Multifamily |
|
| 5,500,000 |
|
| 11,785,000 |
| City of Stockton Health Facility |
|
| 11,785,000 |
|
| 15,450,000 |
| Los Angeles County Schools Pooled |
|
| 15,498,667 |
|
| 1,500,000 |
| Los Angeles County Schools Pooled |
|
| 1,503,765 |
|
| 6,700,000 |
| Oak Park Unified School District, |
|
| 6,715,745 |
|
| 3,650,000 |
| Palomar Pomerado Health Care— |
|
| 3,650,000 |
|
| 250,000 |
| Palomar Pomerado Health Care— |
|
| 250,000 |
|
| 2,250,000 |
| Palomar Pomerado Health Care— |
|
| 2,250,000 |
|
| 645,000 |
| Riverside County Public Financing |
|
| 650,960 |
|
The accompanying notes are an integral part of these financial statements.
58
|
Alpine Ultra Short Tax Optimized Income Fund |
Schedule of Portfolio Investments—Continued
October 31, 2012
|
|
|
|
|
|
|
|
Principal |
| Security |
| Value |
| ||
| |||||||
Municipal Bonds—continued |
|
|
|
| |||
California—continued |
|
|
|
| |||
$ | 17,610,000 |
| State Community College |
| $ | 17,757,043 |
|
| 370,000 |
| State Health Facilities Financing |
|
| 406,227 |
|
| 139,910,000 |
| State Pollution Control Finance |
|
| 139,910,000 |
|
| 3,000,000 |
| State Pollution Control Financing |
|
| 3,000,000 |
|
| 10,000,000 |
| State School Cash Reserve Program |
|
| 10,026,300 |
|
| 20,500,000 |
| Stockton Public Financing Authority |
|
| 20,500,000 |
|
|
|
| Twin Rivers Unified School District, |
|
|
|
|
| 10,000,000 |
| 3.500%, 06/01/2027 |
|
| 10,051,100 |
|
| 6,000,000 |
| 3.500%, 06/01/2035 |
|
| 6,030,660 |
|
|
|
|
|
|
| ||
|
|
|
|
|
| 255,485,467 |
|
|
|
|
|
|
| ||
Colorado—1.8% |
|
|
|
| |||
| 9,515,000 |
| Arkansas River Power Authority |
|
| 9,515,000 |
|
| 4,000,000 |
| Denver City & County Airport |
|
| 4,010,466 |
|
| 1,355,000 |
| State Health Facilities Authority |
|
| 1,365,637 |
|
| 350,000 |
| State Health Facilities Authority |
|
| 359,818 |
|
|
|
|
|
|
|
|
|
Principal |
| Security |
| Value |
| ||
| |||||||
Municipal Bonds—continued |
|
|
|
| |||
Colorado—continued |
|
|
|
| |||
$ | 17,165,000 |
| Traer Creek Metropolitan District |
| $ | 17,165,000 |
|
|
|
|
|
|
| ||
|
|
|
|
|
| 32,415,921 |
|
|
|
|
|
|
| ||
Connecticut—0.2% |
|
|
|
| |||
|
|
| City of West Haven, General |
|
|
|
|
| 550,000 |
| 4.000%, 08/01/2013 |
|
| 559,526 |
|
| 145,000 |
| 4.000%, 08/01/2014 |
|
| 150,561 |
|
| 2,050,000 |
| City of West Haven, General |
|
| 2,062,484 |
|
|
|
|
|
|
| ||
|
|
|
|
|
| 2,772,571 |
|
|
|
|
|
|
| ||
|
|
|
|
|
|
|
|
Florida—0.2% |
|
|
|
| |||
| 1,000,000 |
| Citizens Property Insurance Corp. |
|
| 1,007,290 |
|
| 250,000 |
| Cityplace Community Development |
|
| 254,975 |
|
| 1,000,000 |
| Miami-Dade County Industrial |
|
| 1,026,540 |
|
| 800,000 |
| Saint Johns County Industrial |
|
| 800,000 |
|
| 155,000 |
| State Higher Educational Facilities |
|
| 158,942 |
|
|
|
| State Higher Educational Facilities |
|
|
|
|
| 250,000 |
| 3.000%, 04/01/2013 |
|
| 252,445 |
|
| 300,000 |
| 4.000%, 04/01/2014 |
|
| 312,528 |
|
|
|
|
|
|
| ||
|
|
|
|
|
| 3,812,720 |
|
|
|
|
|
|
| ||
|
|
|
|
|
|
|
|
Georgia—2.7% |
|
|
|
| |||
| 7,005,000 |
| Albany-Dougherty County Hospital |
|
| 7,005,000 |
|
The accompanying notes are an integral part of these financial statements.
59
|
Alpine Ultra Short Tax Optimized Income Fund |
Schedule of Portfolio Investments—Continued
October 31, 2012
|
|
|
|
|
|
|
|
Principal |
| Security |
| Value |
| ||
| |||||||
| |||||||
Municipal Bonds—continued |
|
|
|
| |||
Georgia—continued |
|
|
|
| |||
$ | 11,240,000 |
| Burke County Development |
| $ | 11,304,967 |
|
| 3,875,000 |
| Burke County Development |
|
| 3,877,480 |
|
| 1,200,000 |
| Douglas County Development |
|
| 1,200,000 |
|
| 11,300,000 |
| Gwinnett County Housing |
|
| 11,300,000 |
|
| 500,000 |
| Main Street Natural Gas Inc., |
|
| 521,665 |
|
| 2,010,000 |
| Monroe County Development |
|
| 2,011,286 |
|
| 1,725,000 |
| Rome-Floyd County Development |
|
| 1,725,000 |
|
| 215,000 |
| Union City Water & Sewerage |
|
| 216,598 |
|
| 9,430,000 |
| Walker Dade & Catoosa Counties |
|
| 9,430,000 |
|
|
|
|
|
|
| ||
|
|
|
|
|
| 48,591,996 |
|
|
|
|
|
|
| ||
Hawaii—0.1% |
|
|
|
| |||
| 2,750,000 |
| State Housing Finance & |
|
| 2,750,468 |
|
|
|
|
|
|
| ||
|
|
|
|
|
|
|
|
Principal |
| Security |
| Value |
| ||
| |||||||
| |||||||
Municipal Bonds—continued |
|
|
|
| |||
Illinois—7.3% |
|
|
|
| |||
$ | 800,000 |
| Chicago Transit Authority Capital |
| $ | 819,656 |
|
| 15,800,000 |
| County of Will, Exempt Facilities |
|
| 15,800,000 |
|
| 4,400,000 |
| Springfield Airport Authority, |
|
| 4,400,000 |
|
| 2,500,000 |
| State Development Finance |
|
| 2,500,000 |
|
| 2,600,000 |
| State Finance Authority Industrial |
|
| 2,600,000 |
|
| 1,100,000 |
| State Finance Authority Revenue |
|
| 1,128,677 |
|
| 1,700,000 |
| State Finance Authority Revenue, |
|
| 1,744,319 |
|
| 10,460,000 |
| State Finance Authority Revenue, |
|
| 10,460,000 |
|
| 3,500,000 |
| State Finance Authority Solid Waste |
|
| 3,500,000 |
|
|
|
| State General Obligation |
|
|
|
|
| 20,000,000 |
| 2.000%, 02/01/2013 |
|
| 20,071,000 |
|
| 3,400,000 |
| 5.000%, 03/01/2013 |
|
| 3,449,062 |
|
| 66,300,000 |
| State General Obligation |
|
| 66,300,000 |
|
|
|
|
|
|
| ||
|
|
|
|
|
| 132,772,714 |
|
|
|
|
|
|
| ||
The accompanying notes are an integral part of these financial statements.
60
|
Alpine Ultra Short Tax Optimized Income Fund |
Schedule of Portfolio Investments—Continued
October 31, 2012
|
|
|
|
|
|
|
|
| Principal Amount |
| Security |
|
| Value |
|
| |||||||
| |||||||
Municipal Bonds—continued |
|
|
|
| |||
Indiana—6.3% |
|
|
|
| |||
$ | 1,000,000 |
| City of Indianapolis Industrial |
| $ | 1,000,000 |
|
|
|
| City of Terre Haute Sanitation |
|
|
|
|
| 1,670,000 |
| 4.000%, 01/01/2013 |
|
| 1,677,298 |
|
| 3,005,000 |
| 4.000%, 07/01/2013 |
|
| 3,060,352 |
|
| 3,065,000 |
| 4.000%, 01/01/2014 |
|
| 3,155,264 |
|
| 60,000,000 |
| Reset Optional Certificates |
|
| 60,000,000 |
|
| 18,100,000 |
| State Development Finance |
|
| 18,100,000 |
|
| 17,050,000 |
| State Development Finance |
|
| 17,050,000 |
|
| 5,000,000 |
| State Finance Authority Economic |
|
| 5,000,000 |
|
| 6,000,000 |
| State Finance Authority |
|
| 6,000,000 |
|
|
|
|
|
|
| ||
|
|
|
|
|
| 115,042,914 |
|
|
|
|
|
|
| ||
Iowa—0.9% |
|
|
|
| |||
| 1,180,000 |
| Coralville General Obligation |
|
| 1,184,826 |
|
| 10,000,000 |
| State Finance Authority Community |
|
| 10,000,000 |
|
|
|
|
|
|
|
|
|
Principal |
| Security |
| Value |
| ||
| |||||||
| |||||||
Municipal Bonds—continued |
|
|
|
| |||
Iowa—continued |
|
|
|
| |||
$ | 4,160,000 |
| State Finance Authority Community |
| $ | 4,160,000 |
|
| 1,500,000 |
| State Higher Education Loan |
|
| 1,512,645 |
|
|
|
|
|
|
| ||
|
|
|
|
|
| 16,857,471 |
|
|
|
|
|
|
| ||
|
|
|
|
|
|
|
|
Kansas—0.1% |
|
|
|
| |||
| 1,000,000 |
| City of Dodge City Industrial |
|
| 1,000,000 |
|
| 1,000,000 |
| City of Liberal Industrial |
|
| 1,000,000 |
|
|
|
|
|
|
| ||
|
|
|
|
|
| 2,000,000 |
|
|
|
|
|
|
| ||
Kentucky—0.8% |
|
|
|
| |||
| 1,500,000 |
| Kenton County Airport Board |
|
| 1,517,265 |
|
| 2,000,000 |
| Lexington-Fayette Urban County |
|
| 2,000,000 |
|
| 5,000,000 |
| Pikeville Educational Facilities |
|
| 5,069,750 |
|
| 6,500,000 |
| Pulaski County Solid Waste |
|
| 6,499,805 |
|
|
|
|
|
|
| ||
|
|
|
|
|
| 15,086,820 |
|
|
|
|
|
|
| ||
Louisiana—6.4% |
|
|
|
| |||
| 15,000,000 |
| Ascension Parish Industrial |
|
| 15,000,000 |
|
The accompanying notes are an integral part of these financial statements.
61
|
Alpine Ultra Short Tax Optimized Income Fund |
Schedule of Portfolio Investments—Continued
October 31, 2012
|
|
|
|
|
|
|
|
Principal |
| Security |
| Value |
| ||
| |||||||
| |||||||
Municipal Bonds—continued |
|
|
|
| |||
Louisiana—continued |
|
|
|
| |||
$ | 5,000,000 |
| Donaldsonville Industrial |
| $ | 5,000,000 |
|
| 500,000 |
| Jefferson Parish Hospital District |
|
| 501,160 |
|
| 4,600,000 |
| Jefferson Parish Industrial |
|
| 4,600,000 |
|
| 1,785,000 |
| North Webster Parish Industrial |
|
| 1,785,000 |
|
| 1,915,000 |
| Ouachita Parish Industrial |
|
| 1,915,000 |
|
| 61,000,000 |
| Parish of St. James Revenue, Nucor |
|
| 61,000,000 |
|
| 20,000,000 |
| Plaquemines Port Harbor & Terminal |
|
| 20,002,000 |
|
| 250,000 |
| State Citizens Property Insurance |
|
| 253,575 |
|
| 2,050,000 |
| State Housing Finance Agency |
|
| 2,050,000 |
|
| 2,740,000 |
| State Public Facilities Authority |
|
| 2,740,000 |
|
|
|
|
|
|
|
|
|
Principal |
| Security |
| Value |
| ||
| |||||||
| |||||||
Municipal Bonds—continued |
|
|
|
| |||
Louisiana—continued |
|
|
|
| |||
$ | 1,200,000 |
| State Public Facilities Authority |
| $ | 1,200,000 |
|
|
|
|
|
|
| ||
|
|
|
|
|
| 116,046,735 |
|
|
|
|
|
|
| ||
|
|
|
|
|
|
|
|
Maryland—0.1% |
|
|
|
| |||
| 1,750,000 |
| Howard County Economic |
|
| 1,750,000 |
|
| 100,000 |
| State Economic Development Corp., |
|
| 100,380 |
|
|
|
|
|
|
| ||
|
|
|
|
|
| 1,850,380 |
|
|
|
|
|
|
| ||
|
|
|
|
|
|
|
|
Massachusetts—0.1% |
|
|
|
| |||
| 2,250,000 |
| State Development Finance Agency, |
|
| 2,254,973 |
|
|
|
|
|
|
| ||
Michigan—1.3% |
|
|
|
| |||
| 1,240,000 |
| City of Detroit School District, |
|
| 1,254,806 |
|
| 1,000,000 |
| City of Detroit Sewage Disposal |
|
| 1,054,130 |
|
| 250,000 |
| Detroit Wayne County Stadium |
|
| 263,757 |
|
|
|
| State Finance Authority Revenue, |
|
|
|
|
| 500,000 |
| 4.000%, 06/01/2014 |
|
| 522,935 |
|
| 1,200,000 |
| 5.000%, 06/01/2014 |
|
| 1,273,716 |
|
| 10,355,000 |
| State Finance Authority Revenue, |
|
| 10,606,316 |
|
| 555,000 |
| State Housing Development |
|
| 555,000 |
|
| 3,000,000 |
| State Strategic Fund Limited |
|
| 3,003,240 |
|
The accompanying notes are an integral part of these financial statements.
62
|
Alpine Ultra Short Tax Optimized Income Fund |
Schedule of Portfolio Investments—Continued
October 31, 2012
|
|
|
|
|
|
|
|
Principal |
| Security |
| Value |
| ||
| |||||||
|
|
|
|
|
|
|
|
Municipal Bonds—continued | |||||||
Michigan—continued | |||||||
$ | 800,000 |
| State Strategic Fund Limited |
| $ | 800,000 |
|
|
|
| State Strategic Fund Limited |
|
|
|
|
| 1,500,000 |
| 3.200%, 08/01/2027 |
|
| 1,528,365 |
|
| 1,910,000 |
| 4.625%, 12/01/2012 |
|
| 1,915,596 |
|
|
|
|
|
|
| ||
|
|
|
|
|
| 22,777,861 |
|
|
|
|
|
|
| ||
Mississippi—0.8% | |||||||
| 3,500,000 |
| State Business Finance Corp., Gulf |
|
| 3,500,000 |
|
| 6,495,000 |
| State Business Finance Corp., |
|
| 6,495,000 |
|
| 4,920,000 |
| State Business Finance Corp., |
|
| 4,920,000 |
|
|
|
|
|
|
| ||
|
|
|
|
|
| 14,915,000 |
|
|
|
|
|
|
| ||
Missouri—0.5% | |||||||
| 7,400,000 |
| City of Brentwood Refunding |
|
| 7,400,000 |
|
| 250,000 |
| Joplin Industrial Development |
|
| 251,168 |
|
| 1,500,000 |
| State Health & Educational |
|
| 1,508,025 |
|
|
|
|
|
|
| ||
|
|
|
|
|
| 9,159,193 |
|
|
|
|
|
|
| ||
Nebraska—0.4% | |||||||
|
|
| Central Plains Energy Project, |
|
|
|
|
| 500,000 |
| 3.000%, 09/01/2013 |
|
| 507,915 |
|
| 655,000 |
| 4.000%, 09/01/2014 |
|
| 686,132 |
|
|
|
|
|
|
|
|
|
Principal |
| Security |
| Value |
| ||
| |||||||
|
|
|
|
|
|
|
|
Municipal Bonds—continued | |||||||
Nebraska—continued | |||||||
$ | 5,700,000 |
| Stanton County Industrial |
| $ | 5,700,000 |
|
|
|
|
|
|
| ||
|
|
|
|
|
| 6,894,047 |
|
|
|
|
|
|
| ||
Nevada—2.3% | |||||||
| 9,100,000 |
| Clark County Airport System |
|
| 9,100,000 |
|
| 5,350,000 |
| Clark County Airport System |
|
| 5,350,000 |
|
| 9,215,000 |
| Las Vegas Valley Water District |
|
| 9,215,000 |
|
| 17,955,000 |
| Las Vegas Valley Water District |
|
| 17,955,000 |
|
|
|
|
|
|
| ||
|
|
|
|
|
| 41,620,000 |
|
|
|
|
|
|
| ||
New Jersey—7.9% | |||||||
| 7,000,000 |
| Borough of Wood-Ridge General |
|
| 7,010,290 |
|
| 13,250,000 |
| City of Newark General |
|
| 13,280,607 |
|
| 14,000,000 |
| City of Newark Tax Anticipation |
|
| 14,009,380 |
|
| 4,000,000 |
| City of Newark, General Obligation |
|
| 4,022,920 |
|
| 4,625,000 |
| Gloucester County Improvement |
|
| 4,633,556 |
|
| 1,000,000 |
| Gloucester County Improvement |
|
| 1,002,360 |
|
The accompanying notes are an integral part of these financial statements.
63
|
Alpine Ultra Short Tax Optimized Income Fund |
Schedule of Portfolio Investments—Continued
October 31, 2012
|
|
|
|
|
|
|
|
Principal |
| Security |
| Value |
| ||
| |||||||
|
|
|
|
|
|
|
|
Municipal Bonds—continued | |||||||
New Jersey—continued | |||||||
$ | 20,000,000 |
| Hudson County Improvement |
| $ | 20,136,000 |
|
| 3,000,000 |
| State Economic Development |
|
| 3,082,080 |
|
| 9,890,000 |
| State Economic Development |
|
| 9,890,000 |
|
| 2,075,000 |
| State Economic Development |
|
| 2,075,000 |
|
| 36,300,000 |
| State Economic Development |
|
| 36,300,000 |
|
| 3,035,000 |
| State Health Care Facilities |
|
| 3,121,801 |
|
| 500,000 |
| State Health Care Facilities |
|
| 511,235 |
|
| 2,200,000 |
| State Higher Education Assistance |
|
| 2,203,146 |
|
|
|
| State Higher Education Student |
|
|
|
|
| 300,000 |
| 3.000%, 12/01/2013 |
|
| 306,159 |
|
| 500,000 |
| 4.000%, 12/01/2014 |
|
| 527,300 |
|
| 4,890,000 |
| State Housing & Mortgage Finance |
|
| 4,890,000 |
|
| 3,980,000 |
| Town of Harrison Tax Anticipation |
|
| 3,987,960 |
|
|
|
| Township of Lyndhurst Bond |
|
|
|
|
| 10,000,000 |
| 1.750%, 02/15/2013 |
|
| 10,010,000 |
|
| 3,297,500 |
| 1.750%, 03/21/2013 |
|
| 3,301,919 |
|
|
|
|
|
|
| ||
|
|
|
|
|
| 144,301,713 |
|
|
|
|
|
|
| ||
|
|
|
|
|
|
|
|
Principal |
| Security |
| Value |
| ||
| |||||||
|
|
|
|
|
|
|
|
Municipal Bonds—continued | |||||||
New York—15.4% | |||||||
$ | 3,155,000 |
| Broome County Industrial |
| $ | 3,155,000 |
|
| 1,380,000 |
| Broome County Industrial |
|
| 1,380,000 |
|
| 1,700,000 |
| City of Long Beach General |
|
| 1,711,475 |
|
| 6,200,000 |
| City of New York General |
|
| 6,200,000 |
|
| 6,515,000 |
| City of Poughkeepsie, Bond |
|
| 6,524,056 |
|
| 34,200,000 |
| Metropolitan Transportation |
|
| 34,200,000 |
|
|
|
| Nassau County Local Economic |
|
|
|
|
| 620,000 |
| 3.000%, 07/01/2013 |
|
| 628,612 |
|
| 385,000 |
| 4.000%, 07/01/2014 |
|
| 403,457 |
|
| 1,000,000 |
| Nassau County Local Economic |
|
| 1,045,920 |
|
| 17,000,000 |
| Nassau County Revenue |
|
| 17,097,240 |
|
| 6,000,000 |
| Nassau County Revenue |
|
| 6,040,200 |
|
|
|
| New York City Industrial |
|
|
|
|
| 750,000 |
| 5.000%, 07/01/2013 |
|
| 766,298 |
|
| 1,000,000 |
| 5.000%, 07/01/2014 |
|
| 1,046,250 |
|
The accompanying notes are an integral part of these financial statements.
64
|
Alpine Ultra Short Tax Optimized Income Fund |
Schedule of Portfolio Investments—Continued
October 31, 2012
|
|
|
|
|
|
|
|
Principal |
| Security |
| Value |
| ||
| |||||||
|
|
|
|
|
|
|
|
Municipal Bonds—continued | |||||||
New York—continued | |||||||
$ | 1,000,000 |
| New York City Industrial |
| $ | 1,000,000 |
|
| 6,655,000 |
| Rockland County Bond |
|
| 6,660,324 |
|
| 8,000,000 |
| Rockland County General |
|
| 8,091,120 |
|
| 10,000,000 |
| Rockland County Revenue |
|
| 10,024,100 |
|
| 6,560,000 |
| Rockland County Revenue |
|
| 6,589,323 |
|
| 15,000,000 |
| Rockland County Tax |
|
| 15,038,700 |
|
|
|
| State Dormitory Authority |
|
|
|
|
| 1,475,000 |
| 3.000%, 09/01/2013 |
|
| 1,495,797 |
|
| 1,285,000 |
| 3.000%, 09/01/2014 |
|
| 1,318,102 |
|
| 9,000,000 |
| State Environmental Facilities Corp. |
|
| 9,000,000 |
|
| 53,850,000 |
| State Housing Finance Agency |
|
| 53,850,000 |
|
| 25,000,000 |
| Suffolk County Revenue |
|
| 25,140,750 |
|
| 2,000,000 |
| Suffolk County, Bond |
|
| 2,010,780 |
|
| 5,000,000 |
| Suffolk County, Tax Anticipation |
|
| 5,058,100 |
|
| 1,250,000 |
| Town of Fishkill Bond Anticipation |
|
| 1,256,787 |
|
| 5,500,000 |
| Town of Ramapo, Bond |
|
| 5,551,315 |
|
|
|
|
|
|
|
|
|
Principal |
| Security |
| Value |
| ||
| |||||||
|
|
|
|
|
|
|
|
Municipal Bonds—continued | |||||||
New York—continued | |||||||
$ | 5,000,000 |
| Ulster County Industrial |
| $ | 5,000,000 |
|
| 13,620,000 |
| Westchester County Industrial |
|
| 13,620,000 |
|
| 28,000,000 |
| Westchester County Industrial |
|
| 28,000,000 |
|
| 500,000 |
| Westchester Tobacco Asset |
|
| 505,385 |
|
|
|
|
|
|
| ||
|
|
|
|
|
| 279,409,091 |
|
|
|
|
|
|
| ||
North Carolina—0.4% | |||||||
| 6,500,000 |
| Davidson County Industrial |
|
| 6,500,000 |
|
Ohio—1.4% | |||||||
| 3,205,000 |
| City of Marysville, Bond |
|
| 3,224,230 |
|
| 1,525,000 |
| City of Marysville, Bond |
|
| 1,534,150 |
|
| 575,000 |
| City of Warrensville Heights, Bond |
|
| 576,806 |
|
| 7,800,000 |
| Columbus Regional Airport |
|
| 7,800,000 |
|
| 400,000 |
| Lorain Port Authority Revenue, |
|
| 406,740 |
|
The accompanying notes are an integral part of these financial statements.
65
|
Alpine Ultra Short Tax Optimized Income Fund |
Schedule of Portfolio Investments—Continued
October 31, 2012
|
|
|
|
|
|
|
|
Principal |
| Security |
| Value |
| ||
| |||||||
|
|
|
|
|
|
|
|
Municipal Bonds—continued | |||||||
Ohio—1.4% | |||||||
$ | 12,000,000 |
| State Water Development |
| $ | 12,000,000 |
|
|
|
|
|
|
| ||
|
|
|
|
|
| 25,541,926 |
|
|
|
|
|
|
| ||
Oklahoma—1.4% | |||||||
| 25,000,000 |
| State Development Finance |
|
| 25,000,000 |
|
|
|
|
|
|
| ||
Oregon—0.0%* | |||||||
|
|
| Multnomah County Hospital |
|
|
|
|
| 400,000 |
| 2.000%, 12/01/2013 |
|
| 403,316 |
|
| 150,000 |
| 2.000%, 12/01/2014 |
|
| 151,340 |
|
|
|
|
|
|
| ||
|
|
|
|
|
| 554,656 |
|
|
|
|
|
|
| ||
Pennsylvania—2.2% | |||||||
| 5,260,000 |
| Allegheny County Airport |
|
| 5,260,000 |
|
| 250,000 |
| Allegheny County Higher |
|
| 254,208 |
|
| 3,000,000 |
| Bucks County Industrial |
|
| 3,016,020 |
|
| 750,000 |
| City of Philadelphia Airport |
|
| 765,157 |
|
| 345,000 |
| Delaware County Authority |
|
| 349,761 |
|
|
|
| Puttable Floating Option |
|
|
|
|
| 10,515,000 |
| 0.950%, 01/01/2020 |
|
| 10,515,000 |
|
| 5,090,000 |
| 0.980%, 01/01/2022 |
|
| 5,090,000 |
|
|
|
|
|
|
|
|
|
Principal |
| Security |
| Value |
| ||
| |||||||
|
|
|
|
|
|
|
|
Municipal Bonds—continued | |||||||
Pennsylvania—continued | |||||||
$ | 2,000,000 |
| State Economic Development |
| $ | 2,003,700 |
|
| 13,000,000 |
| State Economic Development |
|
| 12,999,740 |
|
|
|
|
|
|
| ||
|
|
|
|
|
| 40,253,586 |
|
|
|
|
|
|
| ||
Puerto Rico—9.0% | |||||||
| 8,000,000 |
| Government Development Bank |
|
| 8,251,200 |
|
| 8,725,000 |
| Government Development Bank |
|
| 9,144,498 |
|
| 2,025,000 |
| State Commonwealth Aqueduct |
|
| 2,155,309 |
|
| 745,000 |
| State Commonwealth Highway & |
|
| 769,175 |
|
|
|
| State Commonwealth Highway & |
|
|
|
|
| 19,235,000 |
| 0.880%, 07/01/2030 |
|
| 19,235,000 |
|
| 37,575,000 |
| 0.880%, 07/01/2035 |
|
| 37,575,000 |
|
| 500,000 |
| State Commonwealth Industrial |
|
| 522,810 |
|
| 4,365,000 |
| State Commonwealth Public |
|
| 4,594,032 |
|
| 8,810,000 |
| State Highway & Transportation |
|
| 8,810,000 |
|
| 47,285,000 |
| State Infrastructure Financing |
|
| 47,526,626 |
|
The accompanying notes are an integral part of these financial statements.
66
|
Alpine Ultra Short Tax Optimized Income Fund |
Schedule of Portfolio Investments—Continued
October 31, 2012
|
|
|
|
|
|
|
|
Principal |
| Security |
| Value |
| ||
| |||||||
|
|
|
|
|
|
|
|
Municipal Bonds—continued | |||||||
Puerto Rico—9.0% | |||||||
$ | 2,425,000 |
| State Public Buildings Authority |
| $ | 2,552,240 |
|
|
|
| University of Puerto Rico |
|
|
|
|
| 5,000,000 |
| 5.000%, 06/01/2014 |
|
| 5,230,150 |
|
| 5,255,000 |
| 5.000%, 06/01/2015 |
|
| 5,555,954 |
|
|
|
| University of Puerto Rico |
|
|
|
|
| 5,585,000 |
| 5.000%, 06/01/2014 |
|
| 5,842,077 |
|
| 5,335,000 |
| 5.000%, 06/01/2015 |
|
| 5,640,535 |
|
|
|
|
|
|
| ||
|
|
|
|
|
| 163,404,606 |
|
|
|
|
|
|
| ||
Rhode Island—0.1% | |||||||
| 900,000 |
| Rhode Island Health & Educational |
|
| 982,539 |
|
|
|
|
|
|
| ||
South Carolina—1.6% | |||||||
| 16,000,000 |
| Berkeley County Industrial |
|
| 16,000,000 |
|
| 3,000,000 |
| Cherokee County Industrial |
|
| 3,000,000 |
|
| 8,000,000 |
| State Jobs—Economic Development |
|
| 8,000,000 |
|
| 1,750,000 |
| State Jobs—Economic Development |
|
| 1,750,000 |
|
| 1,000,000 |
| State Jobs—Economic Development |
|
| 1,015,940 |
|
|
|
|
|
|
| ||
|
|
|
|
|
| 29,765,940 |
|
|
|
|
|
|
| ||
Tennessee—2.3% | |||||||
| 555,000 |
| City of Jackson Health Educational |
|
| 555,000 |
|
|
|
|
|
|
|
|
|
Principal |
| Security |
| Value |
| ||
| |||||||
|
|
|
|
|
|
|
|
Municipal Bonds—continued | |||||||
Tennessee—continued | |||||||
$ | 12,550,000 |
| Franklin Public Building Authority |
| $ | 12,550,000 |
|
| 17,000,000 |
| Lewisburg Industrial Development |
|
| 16,999,660 |
|
| 4,365,000 |
| Metropolitan Government Nashville |
|
| 4,365,000 |
|
|
|
| Metropolitan Government |
|
|
|
|
| 200,000 |
| 1.750%, 07/01/2013 |
|
| 200,246 |
|
| 170,000 |
| 2.000%, 07/01/2014 |
|
| 170,688 |
|
| 3,285,000 |
| Metropolitan Government |
|
| 3,285,000 |
|
| 4,450,000 |
| Metropolitan Government |
|
| 4,450,000 |
|
|
|
|
|
|
| ||
|
|
|
|
|
| 42,575,594 |
|
|
|
|
|
|
| ||
Texas—2.7% | |||||||
| 675,000 |
| City of Galveston Wharves & |
|
| 679,711 |
|
| 1,600,000 |
| Gulf Coast Waste Disposal Authority, |
|
| 1,600,000 |
|
The accompanying notes are an integral part of these financial statements.
67
|
Alpine Ultra Short Tax Optimized Income Fund |
Schedule of Portfolio Investments—Continued
October 31, 2012
|
|
|
|
|
|
|
|
Principal |
| Security |
| Value |
| ||
| |||||||
|
|
|
|
|
|
|
|
Municipal Bonds—continued | |||||||
Texas—continued | |||||||
$ | 14,555,000 |
| Harris County Cultural Education |
| $ | 14,555,000 |
|
| 3,180,000 |
| HFDC of Central Texas Inc. |
|
| 3,180,000 |
|
| 10,165,000 |
| Love Field Airport Modernization |
|
| 10,212,979 |
|
| 175,000 |
| Sabine River Industrial |
|
| 175,004 |
|
| 1,000,000 |
| State Municipal Gas Acquisition & |
|
| 1,004,820 |
|
| 13,785,000 |
| Weslaco Health Facilities |
|
| 13,785,000 |
|
| 4,310,000 |
| Weslaco Health Facilities |
|
| 4,310,000 |
|
|
|
|
|
|
| ||
|
|
|
|
|
| 49,502,514 |
|
|
|
|
|
|
| ||
Virginia—3.0% | |||||||
| 55,350,000 |
| Capital Beltway Funding Corp., |
|
| 55,350,000 |
|
Washington—1.6% | |||||||
| 21,685,000 |
| State Health Care Facilities |
|
| 21,685,000 |
|
| 6,865,000 |
| State Housing Finance Commission |
|
| 6,865,000 |
|
|
|
|
|
|
| ||
|
|
|
|
|
| 28,550,000 |
|
|
|
|
|
|
| ||
|
|
|
|
|
|
|
|
Principal |
| Security |
| Value |
| ||
| |||||||
|
|
|
|
|
|
|
|
Municipal Bonds—continued | |||||||
Wisconsin—0.2% | |||||||
$ | 3,690,000 |
| State Health & Educational |
| $ | 3,690,000 |
|
|
|
|
|
|
| ||
Wyoming—0.2% | |||||||
| 2,855,000 |
| Gillette Environmental Improvement |
|
| 2,855,000 |
|
|
|
|
|
|
| ||
|
|
| Total Municipal Bonds |
|
| 1,811,829,732 |
|
|
|
|
|
|
| ||
|
|
|
|
|
|
|
|
Shares |
|
|
|
|
|
| |
|
|
|
|
|
| ||
Money Market Funds—0.0% * | |||||||
| 65,078 |
| BlackRock Liquidity Funds: |
|
| 65,078 |
|
|
|
|
|
|
| ||
|
|
| Total Money Market Funds |
|
| 65,078 |
|
|
|
|
|
|
| ||
|
|
|
|
|
|
|
|
Principal |
|
|
|
|
|
| |
|
|
|
|
|
| ||
Short-Term Investments—5.9% | |||||||
$ | 5,000,000 |
| Chatom Industrial Development |
|
| 5,000,000 |
|
| 2,000,000 |
| Chatom Industrial Development |
|
| 2,000,000 |
|
| 23,040,000 |
| County of Carroll, Kentucky |
|
| 23,040,000 |
|
| 2,400,000 |
| County of Muhlenbreg, 0.50%, |
|
| 2,400,000 |
|
| 24,125,000 |
| Massachusetts Bay, Massachusetts |
|
| 24,125,000 |
|
| 50,000,000 |
| New Jersey Economic Development |
|
| 50,000,000 |
|
|
|
|
|
|
| ||
|
|
| Total Short-Term Investments |
|
| 106,565,000 |
|
|
|
|
|
|
| ||
| |||||||
|
|
| Total Investments |
|
| 1,918,459,810 |
|
|
|
| Liabilities in Excess of |
|
| (99,372,581 | ) |
|
|
|
|
|
| ||
|
|
| TOTAL NET ASSETS 100.0% |
| $ | 1,819,087,229 |
|
|
|
|
|
|
| ||
The accompanying notes are an integral part of these financial statements.
68
|
Alpine Ultra Short Tax Optimized Income Fund |
Schedule of Portfolio Investments—Continued
October 31, 2012
|
|
|
| ||
| ||
Percentages are stated as a percent of net assets. | ||
| ||
* | Amount is less than 0.05%. | |
| ||
(a) Variable Rate Security—The rate reported is the rate in effect as of October 31, 2012. | ||
| ||
AG—Aktiengesellschaft is a German term that refers to a corporation that is limited by shares, i.e., owned by shareholders. | ||
| ||
AMBAC—American Municipal Bond Assurance Corp. | ||
| ||
ARN—Auction Rate Note | ||
| ||
CS—Credit Support | ||
| ||
CSP—Continental Structural Plastics | ||
| ||
LIQ FAC—Liquidity Facility | ||
| ||
LOC—Letter of Credit | ||
| ||
NV—Naamloze Vennootschap is the Dutch term for a public limited liability corporation. | ||
| ||
PLC—Public Limited Company | ||
| ||
SA—Generally designates corporations in various countries, mostly those employing the civil law. | ||
| ||
SPA—Standby Purchase Agreement | ||
| ||
VRDN—Variable Rate Demand Note | ||
| ||
XLCA—XI Capital Assurance, Inc. | ||
The accompanying notes are an integral part of these financial statements.
69
|
Alpine Municipal Money Market Fund |
Schedule of Portfolio Investments
October 31, 2012
|
|
|
|
|
|
|
|
| Principal |
| Security |
| Value |
| |
| |||||||
|
|
|
|
|
|
|
|
Municipal Bonds—99.9% |
|
|
|
| |||
Alabama—2.2% |
|
|
|
| |||
$ | 5,000,000 |
| Mobile Industrial Development |
| $ | 5,000,000 |
|
|
|
|
|
|
| ||
California—0.7% |
|
|
|
| |||
| 1,500,000 |
| Pollution Control Financing |
|
| 1,500,000 |
|
|
|
|
|
|
| ||
Colorado—3.1% |
|
|
|
| |||
| 1,530,000 |
| Housing & Finance Authority |
|
| 1,530,000 |
|
| 2,940,000 |
| Housing & Finance Authority |
|
| 2,940,000 |
|
| 1,095,000 |
| Housing & Finance Authority |
|
| 1,095,000 |
|
| 1,462,000 |
| Jefferson County Industrial |
|
| 1,462,000 |
|
|
|
|
|
|
| ||
|
|
|
|
|
| 7,027,000 |
|
|
|
|
|
|
| ||
Florida—3.1% |
|
|
|
| |||
| 1,000,000 |
| Alachua County Industrial |
|
| 1,000,000 |
|
| 3,495,000 |
| Manatee County Industrial |
|
| 3,495,000 |
|
|
|
|
|
|
|
|
|
| Principal |
| Security |
| Value |
| |
| |||||||
|
|
|
|
|
|
|
|
Municipal Bonds—continued |
|
|
|
| |||
Florida—continued |
|
|
|
| |||
$ | 2,600,000 |
| Sarasota County Industrial |
| $ | 2,600,000 |
|
|
|
|
|
|
| ||
|
|
|
|
|
| 7,095,000 |
|
|
|
|
|
|
| ||
Georgia—2.6% |
|
|
|
| |||
| 4,000,000 |
| Fulton County Development |
|
| 4,000,000 |
|
| 2,050,000 |
| Walton County Industrial Building |
|
| 2,050,000 |
|
|
|
|
|
|
| ||
|
|
|
|
|
| 6,050,000 |
|
|
|
|
|
|
| ||
Illinois—17.0% |
|
|
|
| |||
| 1,000,000 |
| City of Chicago Industrial |
|
| 1,000,000 |
|
| 2,600,000 |
| City of Chicago Industrial |
|
| 2,600,000 |
|
| 14,645,000 |
| City of Chicago O’Hare |
|
| 14,645,000 |
|
| 1,120,000 |
| City of East Moline, Rock Island |
|
| 1,120,000 |
|
| 540,000 |
| Des Plaines Industrial Development |
|
| 540,000 |
|
The accompanying notes are an integral part of these financial statements.
70
|
Alpine Municipal Money Market Fund |
Schedule of Portfolio Investments—Continued
October 31, 2012
|
|
|
|
|
|
|
|
| Principal |
| Security |
| Value |
| |
| |||||||
|
|
|
|
|
|
|
|
Municipal Bonds—continued |
|
|
|
| |||
Illinois—continued |
|
|
|
| |||
$ | 1,200,000 |
| Elmhurst Industrial Development |
| $ | 1,200,000 |
|
| 1,125,000 |
| Finance Authority Industrial |
|
| 1,125,000 |
|
| 1,070,000 |
| Finance Authority Industrial |
|
| 1,070,000 |
|
| 345,000 |
| Finance Authority Industrial |
|
| 345,000 |
|
| 340,000 |
| Finance Authority Industrial |
|
| 340,000 |
|
| 1,800,000 |
| Finance Authority Industrial |
|
| 1,800,000 |
|
| 665,000 |
| Finance Authority Industrial |
|
| 665,000 |
|
| 2,000,000 |
| Phoenix Realty Special Account-U |
|
| 2,000,000 |
|
| 4,200,000 |
| State Development Financial |
|
| 4,200,000 |
|
|
|
|
|
|
|
|
|
| Principal |
| Security |
| Value |
| |
| |||||||
|
|
|
|
|
|
|
|
Municipal Bonds—continued |
|
|
|
| |||
Illinois—continued |
|
|
|
| |||
$ | 3,000,000 |
| Village of Crestwood, Cook County, |
| $ | 3,000,000 |
|
| 515,000 |
| Village of Hanover Park Industrial |
|
| 515,000 |
|
| 450,000 |
| Village of Wheeling Industrial |
|
| 450,000 |
|
| 2,350,000 |
| Village of Woodridge Du Page |
|
| 2,350,000 |
|
|
|
|
|
|
| ||
|
|
|
|
|
| 38,965,000 |
|
|
|
|
|
|
| ||
Indiana—1.2% |
|
|
|
| |||
| 685,000 |
| City of South Bend Economic |
|
| 685,000 |
|
| 1,970,000 |
| State Development Finance |
|
| 1,970,000 |
|
|
|
|
|
|
| ||
|
|
|
|
|
| 2,655,000 |
|
|
|
|
|
|
| ||
Kansas—0.5% |
|
|
|
| |||
| 1,110,000 |
| State Development Finance |
|
| 1,110,000 |
|
|
|
|
|
|
| ||
Kentucky—0.6% |
|
|
|
| |||
| 1,410,000 |
| Montgomery County Industrial |
|
| 1,410,000 |
|
|
|
|
|
|
| ||
The accompanying notes are an integral part of these financial statements.
71
|
Alpine Municipal Money Market Fund |
Schedule of Portfolio Investments—Continued
October 31, 2012
|
|
|
|
|
|
|
|
| Principal |
| Security |
| Value |
| |
| |||||||
|
|
|
|
|
|
|
|
Municipal Bonds—continued |
|
|
|
| |||
Louisiana—1.5% |
|
|
|
| |||
$ | 2,755,000 |
| Caddo-Bossier Parishes Port |
| $ | 2,755,000 |
|
| 700,000 |
| Parish of Ascension Revenue, |
|
| 700,000 |
|
|
|
|
|
|
| ||
|
|
|
|
|
| 3,455,000 |
|
|
|
|
|
|
| ||
Maryland—0.5% |
|
|
|
| |||
| 1,131,000 |
| State Industrial Development |
|
| 1,131,000 |
|
|
|
|
|
|
| ||
Michigan—9.7% |
|
|
|
| |||
| 3,000,000 |
| Detroit Sewer Disposal System |
|
| 3,000,000 |
|
| 3,065,000 |
| Kalamazoo County Economic |
|
| 3,065,000 |
|
| 200,000 |
| Lake Superior State University |
|
| 200,122 |
|
| 200,000 |
| Sterling Heights Economic |
|
| 200,000 |
|
| 1,005,000 |
| Strategic Fund Limited Obligation |
|
| 1,005,000 |
|
| 1,400,000 |
| Strategic Fund Limited Obligation |
|
| 1,400,000 |
|
|
|
|
|
|
|
|
|
| Principal |
| Security |
| Value |
| |
| |||||||
|
|
|
|
|
|
|
|
Municipal Bonds—continued |
|
|
|
| |||
Michigan—continued |
|
|
|
| |||
$ | 7,015,000 |
| Strategic Fund Limited Obligation |
| $ | 7,015,000 |
|
| 550,000 |
| Strategic Fund Limited Obligation |
|
| 550,000 |
|
| 5,800,000 |
| Strategic Fund Limited Obligation |
|
| 5,800,000 |
|
|
|
|
|
|
| ||
|
|
|
|
|
| 22,235,122 |
|
|
|
|
|
|
| ||
Minnesota—0.6% |
|
|
|
| |||
| 1,380,000 |
| Blooming Prairie Industrial |
|
| 1,380,000 |
|
|
|
|
|
|
| ||
Nevada—1.3% |
|
|
|
| |||
| 1,065,000 |
| State Housing Division Multi-Unit |
|
| 1,065,000 |
|
| 2,000,000 |
| State Housing Division Multi-Unit |
|
| 2,000,000 |
|
|
|
|
|
|
| ||
|
|
|
|
|
| 3,065,000 |
|
|
|
|
|
|
| ||
New Jersey—3.1% |
|
|
|
| |||
| 7,081,600 |
| Hudson County Improvement |
|
| 7,129,374 |
|
|
|
|
|
|
| ||
New Mexico—2.5% |
|
|
|
| |||
| 750,000 |
| Albuquerque Industrial |
|
| 750,000 |
|
| 5,000,000 |
| Santa Fe County Education Facility |
|
| 5,000,000 |
|
|
|
|
|
|
| ||
|
|
|
|
|
| 5,750,000 |
|
|
|
|
|
|
| ||
The accompanying notes are an integral part of these financial statements.
72
|
Alpine Municipal Money Market Fund |
Schedule of Portfolio Investments—Continued
October 31, 2012
|
|
|
|
|
|
|
|
Principal |
| Security |
| Value |
| ||
| |||||||
|
|
|
|
|
|
|
|
Municipal Bonds—continued |
|
|
|
| |||
New York—9.6% |
|
|
|
| |||
$ | 1,175,000 |
| City of Albany Industrial |
| $ | 1,175,000 |
|
| 1,120,000 |
| Erie County Industrial Development |
|
| 1,120,000 |
|
| 1,700,000 |
| Madison County Industrial |
|
| 1,700,000 |
|
| 7,000,000 |
| Metropolitan Transportation |
|
| 7,000,000 |
|
| 2,055,000 |
| Monroe County Industrial |
|
| 2,055,000 |
|
| 685,000 |
| New York City Industrial |
|
| 685,000 |
|
| 8,170,000 |
| State Dormitory Authority |
|
| 8,170,000 |
|
|
|
|
|
|
| ||
|
|
|
|
|
| 21,905,000 |
|
|
|
|
|
|
| ||
North Carolina—0.4% |
|
|
|
| |||
| 1,000,000 |
| Davidson County Industrial |
|
| 1,000,000 |
|
|
|
|
|
|
| ||
Ohio—2.6% |
|
|
|
| |||
| 1,735,000 |
| City of Parma Health Care |
|
| 1,735,000 |
|
|
|
|
|
|
|
|
|
Principal |
| Security |
| Value |
| ||
| |||||||
|
|
|
|
|
|
|
|
Municipal Bonds—continued |
|
|
|
| |||
Ohio—continued |
|
|
|
| |||
$ | 1,000,000 |
| Cuyahoga County Civic Facilities, |
| $ | 1,000,000 |
|
| 2,380,000 |
| Stark County Industrial |
|
| 2,380,000 |
|
| 540,000 |
| State Air Quality Development |
|
| 540,000 |
|
| 250,000 |
| State Air Quality Development |
|
| 250,000 |
|
|
|
|
|
|
| ||
|
|
|
|
|
| 5,905,000 |
|
|
|
|
|
|
| ||
Oregon—0.4% |
|
|
|
| |||
| 1,000,000 |
| State Economic Development |
|
| 1,000,000 |
|
|
|
|
|
|
| ||
Pennsylvania—8.9% |
|
|
|
| |||
| 2,200,000 |
| Beaver County Industrial |
|
| 2,200,000 |
|
| 1,640,000 |
| Higher Educational Facilities |
|
| 1,640,000 |
|
| 8,560,000 |
| Philadelphia Authority for |
|
| 8,560,000 |
|
| 2,300,000 |
| State Higher Educational Facilties |
|
| 2,300,000 |
|
The accompanying notes are an integral part of these financial statements.
73
|
Alpine Municipal Money Market Fund |
Schedule of Portfolio Investments—Continued
October 31, 2012
|
|
|
|
|
|
|
|
Principal |
| Security |
| Value |
| ||
| |||||||
|
|
|
|
|
|
|
|
Municipal Bonds—continued |
|
|
|
| |||
Pennsylvania—continued |
|
|
|
| |||
$ | 5,545,000 |
| Washington County Hospital |
| $ | 5,545,000 |
|
|
|
|
|
|
| ||
|
|
|
|
|
| 20,245,000 |
|
|
|
|
|
|
| ||
South Carolina—3.0% |
|
|
|
| |||
| 2,400,000 |
| State Jobs—Economic Development |
|
| 2,400,000 |
|
| 3,200,000 |
| State Jobs—Economic Development |
|
| 3,200,000 |
|
| 1,200,000 |
| State Jobs—Economic Development |
|
| 1,200,000 |
|
|
|
|
|
|
| ||
|
|
|
|
|
| 6,800,000 |
|
|
|
|
|
|
| ||
Tennessee—3.3% |
|
|
|
| |||
| 7,500,000 |
| Hendersonville Industrial |
|
| 7,500,000 |
|
|
|
|
|
|
| ||
Texas—9.3% |
|
|
|
| |||
| 2,600,000 |
| Dallam County Industrial |
|
| 2,600,000 |
|
| 3,250,000 |
| Fort Bend County Industrial |
|
| 3,250,000 |
|
| 870,000 |
| Jefferson County Industrial |
|
| 870,000 |
|
|
|
|
|
|
|
|
|
Principal |
| Security |
| Value |
| ||
| |||||||
|
|
|
|
|
|
|
|
Municipal Bonds—continued |
|
|
|
| |||
Texas—continued |
|
|
|
| |||
$ | 9,000,000 |
| Jefferson County Industrial |
| $ | 9,000,000 |
|
| 5,600,000 |
| Port Arthur Navigation District |
|
| 5,600,000 |
|
|
|
|
|
|
| ||
|
|
|
|
|
| 21,320,000 |
|
|
|
|
|
|
| ||
Utah—0.8% |
|
|
|
| |||
| 1,860,000 |
| City of West Jordan Industrial |
|
| 1,860,000 |
|
|
|
|
|
|
| ||
Vermont—0.1% |
|
|
|
| |||
| 245,000 |
| Economic Development Authority, |
|
| 245,000 |
|
|
|
|
|
|
| ||
Virginia—0.7% |
|
|
|
| |||
| 1,600,000 |
| City of Emporia Industrial |
|
| 1,600,000 |
|
|
|
|
|
|
| ||
Washington—4.9% |
|
|
|
| |||
| 1,140,000 |
| Economic Development Finance |
|
| 1,140,000 |
|
| 1,400,000 |
| Economic Development Finance |
|
| 1,400,000 |
|
| 1,110,000 |
| Economic Development Finance |
|
| 1,110,000 |
|
| 2,745,000 |
| Economic Development Finance |
|
| 2,745,000 |
|
The accompanying notes are an integral part of these financial statements.
74
|
Alpine Municipal Money Market Fund |
Schedule of Portfolio Investments—Continued
October 31, 2012
|
|
|
|
|
|
|
|
Principal |
| Security |
| Value |
| ||
| |||||||
|
|
|
|
|
|
|
|
Municipal Bonds—continued |
|
|
|
| |||
Washington—continued |
|
|
|
| |||
$ | 2,805,000 |
| Port Bellingham Industrial |
| $ | 2,805,000 |
|
| 1,930,000 |
| Seattle Housing Authority Revenue, |
|
| 1,930,000 |
|
|
|
|
|
|
| ||
|
|
|
|
|
| 11,130,000 |
|
|
|
|
|
|
| ||
Wisconsin—5.7% |
|
|
|
| |||
| 2,180,000 |
| City of Baraboo, Industrial |
|
| 2,180,000 |
|
| 1,000,000 |
| Mequon Industrial Development |
|
| 1,000,000 |
|
| 1,665,000 |
| Mequon Industrial Development |
|
| 1,665,000 |
|
| 500,000 |
| Milwaukee Redevelopment |
|
| 500,000 |
|
| 1,025,000 |
| Rhinelander Industrial |
|
| 1,025,000 |
|
|
|
|
|
|
|
|
|
Principal |
| Security |
| Value |
| ||
| |||||||
|
|
|
|
|
|
|
|
Municipal Bonds—continued |
|
|
|
| |||
Wisconsin—continued |
|
|
|
| |||
$ | 2,525,000 |
| State Health & Educational |
| $ | 2,525,000 |
|
| 3,020,000 |
| Village of Menomonee Falls |
|
| 3,020,000 |
|
| 1,000,000 |
| Wausau Industrial Development |
|
| 1,000,000 |
|
|
|
|
|
|
| ||
|
|
|
|
|
| 12,915,000 |
|
|
|
|
|
|
| ||
|
|
| Total Municipal Bonds |
|
| 228,382,496 |
|
|
|
|
|
|
| ||
|
|
|
|
|
|
|
|
Shares |
|
|
|
|
|
| |
| |||||||
Money Market Funds—0.0%* |
|
|
|
| |||
| 31,815 |
| BlackRock Liquidity Funds: |
|
| 31,815 |
|
|
|
|
|
|
| ||
|
|
| Total Money Market Funds |
|
| 31,815 |
|
|
|
|
|
|
| ||
|
|
|
|
|
|
|
|
|
|
| Total Investments |
|
| 228,414,311 |
|
|
|
| Other Assets in Excess |
|
| 227,229 |
|
|
|
|
|
|
| ||
|
|
| TOTAL NET ASSETS 100.0% |
| $ | 228,641,540 |
|
|
|
|
|
|
| ||
|
|
| |
| |
Percentages are stated as a percent of net assets. | |
| |
* Amount is less than 0.05%. | |
| |
(a) Variable Rate Security—The rate reported is the rate in effect as of October 31, 2012. | |
| |
CS—Credit Support | |
| |
LIQ FAC—Liquidity Facility | |
| |
LOC—Letter of Credit | |
| |
NV—Naamloze Vennootschap is the Dutch term for a public limited liability corporation. | |
| |
VRDN—Variable Rate Demand Note | |
The accompanying notes are an integral part of these financial statements.
75
|
Alpine Mutual Funds |
Statements of Assets and Liabilities
October 31, 2012
|
|
|
|
|
|
|
|
|
|
| |
|
| Dynamic |
| Accelerating |
| Financial |
| ||||
|
|
|
|
| |||||||
ASSETS: |
|
|
|
|
|
|
|
|
|
| |
Investments, at value(1) |
| $ | 343,104,923 |
| $ | 2,410,490 |
| $ | 10,167,934 |
| |
Foreign currencies, at value(2) |
|
| 5 |
|
| — |
|
| 81,283 |
| |
Cash |
|
| — |
|
| 13,475 |
|
| 215 |
| |
Receivable for investment securities sold |
|
| 8,994,750 |
|
| 4,591 |
|
| — |
| |
Dividends and interest receivable |
|
| 5,108,107 |
|
| 3,398 |
|
| 3,947 |
| |
Receivable from capital shares issued |
|
| 1,279,773 |
|
| 521 |
|
| 25,562 |
| |
Due from Adviser |
|
| — |
|
| 12,551 |
|
| — |
| |
Prepaid expenses and other assets |
|
| 70,715 |
|
| 630 |
|
| 3,554 |
| |
|
|
|
|
| |||||||
Total assets |
|
| 358,558,273 |
|
| 2,445,656 |
|
| 10,282,495 |
| |
|
|
|
|
| |||||||
|
|
|
|
|
|
|
|
|
|
| |
LIABILITIES: |
|
|
|
|
|
|
|
|
|
| |
Payable for investment securities purchased |
|
| 418,418 |
|
| 19,631 |
|
| 7,710 |
| |
Payable for distributions to shareholders |
|
| 1,556,127 |
|
| 604 |
|
| — |
| |
Payable for capital shares redeemed |
|
| 975,722 |
|
| 74 |
|
| — |
| |
Accrued expenses and other liabilities: |
|
|
|
|
|
|
|
|
|
| |
Investment advisory fees |
|
| 307,379 |
|
| 2,073 |
|
| 13,438 |
| |
Distribution fees |
|
| 536 |
|
| 251 |
|
| 479 |
| |
Other |
|
| 187,726 |
|
| 10,838 |
|
| 12,293 |
| |
|
|
|
|
| |||||||
Total liabilities |
|
| 3,445,908 |
|
| 33,471 |
|
| 33,920 |
| |
|
|
|
|
| |||||||
Net Assets |
| $ | 355,112,365 |
| $ | 2,412,185 |
| $ | 10,248,575 |
| |
|
|
|
|
| |||||||
|
|
|
|
|
|
|
|
|
|
| |
Net assets represented by: |
|
|
|
|
|
|
|
|
|
| |
Capital stock |
| $ | 1,480,867,138 |
| $ | 2,066,607 |
| $ | 13,913,312 |
| |
Accumulated net investment income (loss) |
|
| 7,059,739 |
|
| 36,612 |
|
| (1,819 | ) | |
Accumulated net realized gains (losses) from investments and foreign currency transactions |
| $ | (1,160,476,640 | ) |
| 43,079 |
|
| (1,740,360 | ) | |
Net unrealized appreciation/depreciation on: |
|
|
|
|
|
|
|
|
|
| |
Investments |
|
| 27,594,289 |
|
| 265,887 |
|
| (1,914,428 | ) | |
Foreign currency translation |
|
| 67,839 |
|
| — |
|
| (8,130 | ) | |
|
|
|
|
| |||||||
Total Net Assets |
| $ | 355,112,365 |
| $ | 2,412,185 |
| $ | 10,248,575 |
| |
|
|
|
|
| |||||||
|
|
|
|
|
|
|
|
|
|
| |
Net asset value |
|
|
|
|
|
|
|
|
|
| |
Class A Shares |
|
|
|
|
|
|
|
|
|
| |
Net assets |
| $ | 1,611,811 |
| $ | 256,817 |
| $ | 1,375,058 |
| |
Shares outstanding |
|
| 462,318 |
|
| 19,932 |
|
| 157,139 |
| |
Net asset value per share |
| $ | 3.49 |
| $ | 12.88 |
| $ | 8.75 |
| |
Maximum offering price per share (net asset value plus sales charge of 5.50% of offering price) |
| $ | 3.69 |
| $ | 13.63 |
| $ | 9.26 |
| |
Institutional Class Shares |
|
|
|
|
|
|
|
|
|
| |
Net assets |
| $ | 353,500,554 |
| $ | 2,155,368 |
| $ | 8,873,517 |
| |
Shares outstanding |
|
| 101,409,305 |
|
| 167,324 |
|
| 1,011,905 |
| |
Net asset value, offering price and redemption price per share* |
| $ | 3.49 |
| $ | 12.88 |
| $ | 8.77 |
| |
* If applicable, redemption price per share may be reduced by a redemption fee. |
|
|
|
|
|
|
|
|
|
| |
(1) Total cost of investments |
| $ | 315,510,634 |
| $ | 2,144,603 |
| $ | 12,082,362 |
| |
(2) Cost of foreign currencies |
| $ | 5 |
| $ | — |
| $ | 89,328 |
| |
The accompanying notes are an integral part of these financial statements.
76
|
Alpine Mutual Funds |
Statements of Assets and Liabilities—Continued
October 31, 2012
|
|
|
|
|
|
|
|
|
|
|
|
|
|
|
|
|
|
| Innovators |
| Transformations |
| Foundation | ||||||||||
|
|
|
| |||||||||||||
ASSETS: |
|
|
|
|
|
|
|
|
|
|
|
|
|
|
| |
Investments, at value(1) |
|
| $ | 11,123,951 |
|
|
| $ | 6,131,593 |
|
|
| $ | 65,195,011 |
| |
Foreign currencies, at value(2) |
|
|
| — |
|
|
|
| 878 |
|
|
|
| 4,397 |
| |
Cash |
|
|
| 729 |
|
|
|
| 160 |
|
|
|
| 35 |
| |
Receivable for investment securities sold |
|
|
| 33,097 |
|
|
|
| 586,707 |
|
|
|
| 109,354 |
| |
Dividends and interest receivable |
|
|
| — |
|
|
|
| 603 |
|
|
|
| 249,984 |
| |
Receivable from capital shares issued |
|
|
| 88 |
|
|
|
| 850 |
|
|
|
| 173 |
| |
Due from Adviser |
|
|
| — |
|
|
|
| 4,211 |
|
|
|
| — |
| |
Prepaid expenses and other assets |
|
|
| 1,578 |
|
|
|
| 2,740 |
|
|
|
| 10,305 |
| |
|
|
|
|
|
|
|
|
|
| |||||||
Total assets |
|
|
| 11,159,443 |
|
|
|
| 6,727,742 |
|
|
|
| 65,569,259 |
| |
|
|
|
|
|
|
|
|
|
| |||||||
|
|
|
|
|
|
|
|
|
|
|
|
|
|
|
| |
LIABILITIES: |
|
|
|
|
|
|
|
|
|
|
|
|
|
|
| |
Payable for investment securities purchased |
|
|
| 143,800 |
|
|
|
| 539,098 |
|
|
|
| — |
| |
Payable for capital shares redeemed |
|
|
| 3,530 |
|
|
|
| — |
|
|
|
| — |
| |
Accrued expenses and other liabilities: |
|
|
|
|
|
|
|
|
|
|
|
|
|
|
| |
Investment advisory fees |
|
|
| 12,208 |
|
|
|
| 5,307 |
|
|
|
| 55,939 |
| |
Distribution fees |
|
|
| 241 |
|
|
|
| 227 |
|
|
|
| 221 |
| |
Other |
|
|
| 11,266 |
|
|
|
| 9,099 |
|
|
|
| 7,159 |
| |
|
|
|
|
|
|
|
|
|
| |||||||
Total liabilities |
|
|
| 171,045 |
|
|
|
| 553,731 |
|
|
|
| 63,319 |
| |
|
|
|
|
|
|
|
|
|
| |||||||
Net Assets |
|
| $ | 10,988,398 |
|
|
| $ | 6,174,011 |
|
|
| $ | 65,505,940 |
| |
|
|
|
|
|
|
|
|
|
| |||||||
|
|
|
|
|
|
|
|
|
|
|
|
|
|
|
| |
Net assets represented by: |
|
|
|
|
|
|
|
|
|
|
|
|
|
|
| |
Capital stock |
|
| $ | 22,491,212 |
|
|
| $ | 5,280,438 |
|
|
| $ | 61,139,845 |
| |
Accumulated net investment income |
|
|
| (106,328 | ) |
|
|
| (35,046 | ) |
|
|
| 24,071 |
| |
Accumulated net realized gains (losses) from investments and foreign |
|
|
| (13,955,852 | ) |
|
|
| 42,117 |
|
|
|
| (3,916,610 | ) | |
Net unrealized appreciation/depreciation on: |
|
|
|
|
|
|
|
|
|
|
|
|
|
|
| |
Investments |
|
|
| 2,559,366 |
|
|
|
| 886,505 |
|
|
|
| 8,258,648 |
| |
Foreign currency translation |
|
|
| — |
|
|
|
| (3 | ) |
|
|
| (14 | ) | |
|
|
|
|
|
|
|
|
|
| |||||||
Total Net Assets |
|
| $ | 10,988,398 |
|
|
| $ | 6,174,011 |
|
|
| $ | 65,505,940 |
| |
|
|
|
|
|
|
|
|
|
| |||||||
|
|
|
|
|
|
|
|
|
|
|
|
|
|
|
| |
Net asset value |
|
|
|
|
|
|
|
|
|
|
|
|
|
|
| |
Class A Shares |
|
|
|
|
|
|
|
|
|
|
|
|
|
|
| |
Net assets |
|
| $ | 111,122 |
|
|
| $ | 104,267 |
|
|
| $ | 109,290 |
| |
Shares outstanding |
|
|
| 9,833 |
|
|
|
| 8,913 |
|
|
|
| 9,532 |
| |
Net asset value per share |
|
| $ | 11.30 |
|
|
| $ | 11.70 |
|
|
| $ | 11.47 |
| |
Maximum offering price per share (net asset value plus sales charge |
|
| $ | 11.96 |
|
|
| $ | 12.38 |
|
|
| $ | 12.14 |
| |
Institutional Class Shares |
|
|
|
|
|
|
|
|
|
|
|
|
|
|
| |
Net assets |
|
| $ | 10,877,276 |
|
|
| $ | 6,069,744 |
|
|
| $ | 65,396,650 |
| |
Shares outstanding |
|
|
| 960,048 |
|
|
|
| 517,570 |
|
|
|
| 5,699,878 |
| |
Net asset value, offering price and redemption price per share* |
|
| $ | 11.33 |
|
|
| $ | 11.73 |
|
|
| $ | 11.47 |
| |
* If applicable, redemption price per share may be reduced by a redemption fee. |
|
|
|
|
|
|
|
|
|
|
|
|
|
|
| |
(1) Total cost of investments |
|
| $ | 8,564,585 |
|
|
| $ | 5,245,088 |
|
|
| $ | 56,936,363 |
| |
(2) Cost of foreign currencies |
|
| $ | — |
|
|
| $ | 877 |
|
|
| $ | 4,395 |
| |
The accompanying notes are an integral part of these financial statements.
77
|
Alpine Mutual Funds |
Statements of Assets and Liabilities—Continued
October 31, 2012
|
|
|
|
|
|
|
|
|
| Ultra Short |
| Municipal |
| ||
|
|
|
| ||||
ASSETS: |
|
|
|
|
|
|
|
Investments, at value(1) |
| $ | 1,918,459,810 |
| $ | 228,414,311 |
|
Cash |
|
| — |
|
| 1,755,562 |
|
Receivable for investment securities sold |
|
| 250,000 |
|
| — |
|
Dividends and interest receivable |
|
| 7,405,304 |
|
| 181,605 |
|
Receivable from capital shares issued |
|
| 3,407,802 |
|
| 244,961 |
|
Due from Adviser |
|
| 523,975 |
|
| 57,738 |
|
Prepaid expenses and other assets |
|
| 53,845 |
|
| 12,490 |
|
|
|
|
| ||||
Total assets |
|
| 1,930,100,736 |
|
| 230,666,667 |
|
|
|
|
| ||||
|
|
|
|
|
|
|
|
LIABILITIES: |
|
|
|
|
|
|
|
Payable for investment securities purchased |
|
| 95,828,651 |
|
| 1,735,556 |
|
Payable for capital shares redeemed |
|
| 13,650,267 |
|
| 150,081 |
|
Accrued expenses and other liabilities: |
|
|
|
|
|
|
|
Investment advisory fees |
|
| 1,164,753 |
|
| 89,324 |
|
Distribution fees |
|
| 6,793 |
|
| — |
|
Other |
|
| 363,043 |
|
| 50,166 |
|
|
|
|
| ||||
Total liabilities |
|
| 111,013,507 |
|
| 2,025,127 |
|
|
|
|
| ||||
Net Assets |
| $ | 1,819,087,229 |
| $ | 228,641,540 |
|
|
|
|
| ||||
|
|
|
|
|
|
|
|
Net assets represented by: |
|
|
|
|
|
|
|
Capital stock |
| $ | 1,818,116,058 |
| $ | 228,641,540 |
|
Accumulated net investment income |
|
| 79 |
|
| — |
|
Accumulated net realized losses from investments |
|
| (67,228 | ) |
| — |
|
Net unrealized appreciation on investments |
|
| 1,038,320 |
|
| — |
|
|
|
|
| ||||
Total Net Assets |
| $ | 1,819,087,229 |
| $ | 228,641,540 |
|
|
|
|
| ||||
|
|
|
|
|
|
|
|
Net asset value |
|
|
|
|
|
|
|
Class A Shares |
|
|
|
|
|
|
|
Net assets |
| $ | 443,597,721 |
| $ | — |
|
Shares outstanding |
|
| 43,908,828 |
|
| — |
|
Net asset value per share |
| $ | 10.10 |
| $ | — |
|
Maximum offering price per share (net asset value plus sales charge of 0.50% of offering price) |
| $ | 10.15 |
| $ | — |
|
Institutional Class Shares |
|
|
|
|
|
|
|
Net assets |
| $ | 1,375,489,508 |
| $ | — |
|
Shares outstanding |
|
| 136,922,186 |
|
| — |
|
Net asset value, offering price and redemption price per share* |
| $ | 10.05 |
| $ | — |
|
Investor Class Shares |
|
|
|
|
|
|
|
Net assets |
| $ | — |
| $ | 228,641,540 |
|
Shares outstanding |
|
| — |
|
| 228,644,208 |
|
Net asset value, offering price and redemption price per share* |
| $ | — |
| $ | 1.00 |
|
* If applicable, redemption price per share may be reduced by a redemption fee. |
|
|
|
|
|
|
|
(1) Total cost of investments |
| $ | 1,917,421,490 |
| $ | 228,414,311 |
|
The accompanying notes are an integral part of these financial statements.
78
|
Alpine Mutual Funds |
Statements of Operations
For the year ended October 31, 2012
|
|
|
|
|
|
|
|
|
|
| |
|
| Dynamic |
| Accelerating |
| Financial |
| ||||
|
|
|
|
| |||||||
INVESTMENT INCOME: |
|
|
|
|
|
|
|
|
|
| |
Dividend income |
| $ | 59,212,136 |
|
| $154,711 |
| $ | 94,142 |
| |
Less: Foreign taxes withheld |
|
| (2,161,726 | ) |
| (1,027 | ) |
| (1,428 | ) | |
Interest income |
|
| — |
|
| 17 |
|
| 12 |
| |
|
|
|
|
|
| ||||||
Total investment income |
|
| 57,050,410 |
|
| 153,701 |
|
| 92,726 |
| |
|
|
|
|
|
| ||||||
|
|
|
|
|
|
|
|
|
|
| |
EXPENSES: |
|
|
|
|
|
|
|
|
|
| |
Investment advisory fee (Note 6) |
|
| 3,947,853 |
|
| 26,533 |
|
| 76,921 |
| |
Distribution fees—Class A (Note 5) |
|
| 684 |
|
| 325 |
|
| 1,079 |
| |
Transfer agent fees |
|
| 452,219 |
|
| 9,501 |
|
| 15,877 |
| |
Administration fee (Note 6) |
|
| 79,509 |
|
| 528 |
|
| 1,566 |
| |
Printing and mailing fees |
|
| 161,135 |
|
| 4,179 |
|
| 5,410 |
| |
Registration and filing fees |
|
| 39,687 |
|
| 23,792 |
|
| 23,999 |
| |
Legal fees |
|
| 125,936 |
|
| 5,510 |
|
| 2,271 |
| |
Accounting and custody fees |
|
| 40,849 |
|
| 3,326 |
|
| 5,555 |
| |
Audit and tax fees |
|
| 56,774 |
|
| 11,634 |
|
| 12,231 |
| |
Trustee fees |
|
| 63,868 |
|
| 433 |
|
| 1,027 |
| |
Interest (Note 2) |
|
| 57,149 |
|
| 109 |
|
| 1,870 |
| |
Other fees |
|
| 60,996 |
|
| 1,432 |
|
| 1,839 |
| |
|
|
|
|
|
| ||||||
Total expenses |
|
| 5,086,659 |
|
| 87,302 |
|
| 149,645 |
| |
Less: Fee waivers and/or expense reimbursements (Note 6) |
|
| — |
|
| (51,048 | ) |
| (42,851 | ) | |
|
|
|
|
|
| ||||||
Net expenses |
|
| 5,086,659 |
|
| 36,254 |
|
| 106,794 |
| |
|
|
|
|
|
| ||||||
Net investment income (loss) |
|
| 51,963,751 |
|
| 117,447 |
|
| (14,068 | ) | |
|
|
|
|
|
| ||||||
|
|
|
|
|
|
|
|
|
|
| |
REALIZED AND UNREALIZED ON INVESTMENTS AND FOREIGN CURRENCY: |
|
|
|
|
|
|
|
|
|
| |
Net realized gain (loss) on: |
|
|
|
|
|
|
|
|
|
| |
Investments |
|
| (48,983,266 | ) |
| 45,697 |
|
| 45,081 |
| |
Less: Foreign capital gains taxes |
|
| (8,969 | ) |
| (8 | ) |
| — |
| |
Foreign currency transactions |
|
| (31,786 | ) |
| (407 | ) |
| (3,648 | ) | |
|
|
|
|
|
| ||||||
Net realized gain (loss) on investments and foreign currency |
|
| (49,024,021 | ) |
| 45,282 |
|
| 41,433 |
| |
|
|
|
|
|
| ||||||
Change in net unrealized appreciation/depreciation on: |
|
|
|
|
|
|
|
|
|
| |
Investments |
|
| 12,442,961 |
|
| 162,663 |
|
| 1,484,702 |
| |
Foreign currency translations |
|
| (435,742 | ) |
| 137 |
|
| (8,059 | ) | |
|
|
|
|
|
| ||||||
Net change in unrealized appreciation/depreciation on investments and foreign currency |
|
| 12,007,219 |
|
| 162,800 |
|
| 1,476,643 |
| |
|
|
|
|
|
| ||||||
Net gain (loss) on investments and foreign currency |
|
| (37,016,802 | ) |
| 208,082 |
|
| 1,518,076 |
| |
|
|
|
|
|
| ||||||
Increase in net assets from operations |
| $ | 14,946,949 |
|
| $325,529 |
| $ | 1,504,008 |
| |
|
|
|
|
|
| ||||||
The accompanying notes are an integral part of these financial statements.
79
|
Alpine Mutual Funds |
Statements of Operations—Continued
For the year ended October 31, 2012
|
|
|
|
|
|
|
|
|
|
|
|
|
|
|
|
|
|
| Innovators |
| Transformations |
| Foundation |
| |||||||||
|
|
|
|
| ||||||||||||
INVESTMENT INCOME: |
|
|
|
|
|
|
|
|
|
|
|
|
|
|
|
|
Dividend income |
|
| $ | 32,926 |
|
|
| $ | 53,531 |
|
|
| $ | 1,474,992 |
|
|
Less: Foreign taxes withheld |
|
|
| — |
|
|
|
| (1,701 | ) |
|
|
| (15,431 | ) |
|
Interest income |
|
|
| 112 |
|
|
|
| 66 |
|
|
|
| 469,084 |
|
|
|
|
|
|
|
|
|
|
|
|
| ||||||
Total investment income |
|
|
| 33,038 |
|
|
|
| 51,896 |
|
|
|
| 1,928,645 |
|
|
|
|
|
|
|
|
|
|
|
|
| ||||||
|
|
|
|
|
|
|
|
|
|
|
|
|
|
|
|
|
EXPENSES: |
|
|
|
|
|
|
|
|
|
|
|
|
|
|
|
|
Investment advisory fee (Note 6) |
|
|
| 114,447 |
|
|
|
| 67,541 |
|
|
|
| 638,190 |
|
|
Distribution fees—Class A (Note 5) |
|
|
| 265 |
|
|
|
| 227 |
|
|
|
| 221 |
|
|
Transfer agent fees |
|
|
| 16,702 |
|
|
|
| 11,240 |
|
|
|
| 19,373 |
|
|
Administration fee (Note 6) |
|
|
| 2,289 |
|
|
|
| 1,343 |
|
|
|
| 12,684 |
|
|
Printing and mailing fees |
|
|
| 5,842 |
|
|
|
| 3,829 |
|
|
|
| 23,348 |
|
|
Registration and filing fees |
|
|
| 28,799 |
|
|
|
| 28,103 |
|
|
|
| 26,967 |
|
|
Legal fees |
|
|
| 2,762 |
|
|
|
| 2,809 |
|
|
|
| 16,306 |
|
|
Accounting and custody fees |
|
|
| 3,374 |
|
|
|
| 3,709 |
|
|
|
| 5,074 |
|
|
Audit and tax fees |
|
|
| 12,305 |
|
|
|
| 12,689 |
|
|
|
| 14,944 |
|
|
Trustee fees |
|
|
| 1,674 |
|
|
|
| 1,009 |
|
|
|
| 9,462 |
|
|
Interest (Note 2) |
|
|
| 729 |
|
|
|
| 57 |
|
|
|
| — |
|
|
Other fees |
|
|
| 2,290 |
|
|
|
| 1,734 |
|
|
|
| 8,504 |
|
|
|
|
|
|
|
|
|
|
|
|
| ||||||
Total expenses |
|
|
| 191,478 |
|
|
|
| 134,290 |
|
|
|
| 775,073 |
|
|
Less: Fee waivers and/or expense reimbursements (Note 6) |
|
|
| (35,981 | ) |
|
|
| (42,826 | ) |
|
|
| — |
|
|
|
|
|
|
|
|
|
|
|
|
| ||||||
Net expenses |
|
|
| 155,497 |
|
|
|
| 91,464 |
|
|
|
| 775,073 |
|
|
|
|
|
|
|
|
|
|
|
|
| ||||||
Net investment income (loss) |
|
|
| (122,459 | ) |
|
|
| (39,568 | ) |
|
|
| 1,153,572 |
|
|
|
|
|
|
|
|
|
|
|
|
| ||||||
|
|
|
|
|
|
|
|
|
|
|
|
|
|
|
|
|
REALIZED AND UNREALIZED ON INVESTMENTS AND FOREIGN CURRENCY: |
|
|
|
|
|
|
|
|
|
|
|
|
|
|
|
|
Net realized gain (loss) on: |
|
|
|
|
|
|
|
|
|
|
|
|
|
|
|
|
Investments |
|
|
| 20,875 |
|
|
|
| 327,441 |
|
|
|
| (3,613,947 | ) |
|
Less: Foreign capital gains taxes |
|
|
| — |
|
|
|
| — |
|
|
|
| — |
|
|
Foreign currency transactions |
|
|
| (4,288 | ) |
|
|
| (312 | ) |
|
|
| (1,028 | ) |
|
|
|
|
|
|
|
|
|
|
|
| ||||||
Net realized gain (loss) on investments and foreign currency |
|
|
| 16,587 |
|
|
|
| 327,129 |
|
|
|
| (3,614,975 | ) |
|
|
|
|
|
|
|
|
|
|
|
| ||||||
Change in unrealized appreciation/depreciation on: |
|
|
|
|
|
|
|
|
|
|
|
|
|
|
|
|
Investments |
|
|
| 925,282 |
|
|
|
| (334,488 | ) |
|
|
| 8,539,941 |
|
|
Foreign currency translations |
|
|
| — |
|
|
|
| 113 |
|
|
|
| (14 | ) |
|
|
|
|
|
|
|
|
|
|
|
| ||||||
Net change in unrealized appreciation/depreciation on investments and foreign currency |
|
|
| 925,282 |
|
|
|
| (334,375 | ) |
|
|
| 8,539,927 |
|
|
|
|
|
|
|
|
|
|
|
|
| ||||||
Net gain (loss) on investments and foreign currency |
|
|
| 941,869 |
|
|
|
| (7,246 | ) |
|
|
| 4,924,952 |
|
|
|
|
|
|
|
|
|
|
|
|
| ||||||
Increase (Decrease) in net assets from operations |
|
| $ | 819,410 |
|
|
| $ | (46,814 | ) |
|
| $ | 6,078,524 |
|
|
|
|
|
|
|
|
|
|
|
|
| ||||||
The accompanying notes are an integral part of these financial statements.
80
|
Alpine Mutual Funds |
Statements of Operations—Continued
For the year ended October 31, 2012
|
|
|
|
|
|
|
|
|
|
|
|
|
| Ultra Short |
| Municipal |
| ||||||
|
|
|
| ||||||||
INVESTMENT INCOME: |
|
|
|
|
|
|
|
|
|
|
|
Dividend income |
|
| $ | — |
|
|
| $ | — |
|
|
Less: Foreign taxes withheld |
|
|
| — |
|
|
|
| — |
|
|
Interest income |
|
|
| 28,717,872 |
|
|
|
| 1,142,790 |
|
|
|
|
|
|
|
|
|
| ||||
Total investment income |
|
|
| 28,717,872 |
|
|
|
| 1,142,790 |
|
|
|
|
|
|
|
|
|
| ||||
|
|
|
|
|
|
|
|
|
|
|
|
EXPENSES: |
|
|
|
|
|
|
|
|
|
|
|
Investment advisory fee (Note 6) |
|
|
| 13,548,188 |
|
|
|
| 1,227,372 |
|
|
Distribution fees—Class A (Note 5) |
|
|
| 1,085,232 |
|
|
|
| — |
|
|
Transfer agent fees |
|
|
| 439,948 |
|
|
|
| 44,715 |
|
|
Administration fee (Note 6) |
|
|
| 359,031 |
|
|
|
| 53,506 |
|
|
Printing and mailing fees |
|
|
| 124,255 |
|
|
|
| 26,324 |
|
|
Registration and filing fees |
|
|
| 132,548 |
|
|
|
| 46,593 |
|
|
Legal fees |
|
|
| 111,263 |
|
|
|
| 57,385 |
|
|
Accounting and custody fees |
|
|
| 190,979 |
|
|
|
| 36,486 |
|
|
Audit and tax fees |
|
|
| 38,975 |
|
|
|
| 14,642 |
|
|
Trustee fees |
|
|
| 65,854 |
|
|
|
| 11,358 |
|
|
Insurance fees |
|
|
| 53,891 |
|
|
|
| 11,061 |
|
|
Compliance fees |
|
|
| 19,958 |
|
|
|
| 3,063 |
|
|
Other fees |
|
|
| 10,481 |
|
|
|
| 1,448 |
|
|
|
|
|
|
|
|
|
| ||||
Total expenses |
|
|
| 16,180,603 |
|
|
|
| 1,533,953 |
|
|
Less: Fee waivers and/or expense reimbursements (Note 6) |
|
|
| (3,353,608 | ) |
|
|
| (655,944 | ) |
|
|
|
|
|
|
|
|
| ||||
Net expenses |
|
|
| 12,826,995 |
|
|
|
| 878,009 |
|
|
|
|
|
|
|
|
|
| ||||
Net investment income |
|
|
| 15,890,877 |
|
|
|
| 264,781 |
|
|
|
|
|
|
|
|
|
| ||||
|
|
|
|
|
|
|
|
|
|
|
|
REALIZED AND UNREALIZED ON INVESTMENTS: |
|
|
|
|
|
|
|
|
|
|
|
Net realized gain (loss) on: |
|
|
|
|
|
|
|
|
|
|
|
Investments |
|
|
| 106,992 |
|
|
|
| — |
|
|
Change in unrealized appreciation/depreciation on: |
|
|
|
|
|
|
|
|
|
|
|
Investments |
|
|
| (381,155 | ) |
|
|
| — |
|
|
|
|
|
|
|
|
|
| ||||
Net gain (loss) on investments and foreign currency |
|
|
| (274,163 | ) |
|
|
| — |
|
|
|
|
|
|
|
|
|
| ||||
Increase in net assets from operations |
|
| $ | 15,616,714 |
|
|
| $ | 264,781 |
|
|
|
|
|
|
|
|
|
| ||||
The accompanying notes are an integral part of these financial statements.
81
|
Alpine Mutual Funds |
Statements of Changes in Net Assets
|
|
|
|
|
|
|
|
|
|
|
|
|
| Dynamic Dividend Fund |
| ||||||||
|
|
| |||||||||
|
| Year Ended |
| Year Ended |
| ||||||
|
|
|
| ||||||||
OPERATIONS: |
|
|
|
|
|
|
| ||||
Net investment income |
|
| $ | 51,963,751 |
|
|
| $ | 61,748,711 |
|
|
Net realized gain (loss) on: |
|
|
|
|
|
|
|
|
|
|
|
Secruities transactions |
|
|
| (48,992,235 | ) |
|
|
| 33,657,509 |
|
|
Foreign currency transactions |
|
|
| (31,786 | ) |
|
|
| (9,000,198 | ) |
|
Swap contracts |
|
|
| — |
|
|
|
| (865,496 | ) |
|
Change in unrealized appreciation/depreciation on: |
|
|
|
|
|
|
|
|
|
|
|
Investments |
|
|
| 12,442,961 |
|
|
|
| (92,627,923 | ) |
|
Foreign currency translations |
|
|
| (435,742 | ) |
|
|
| 2,284,481 |
|
|
|
|
|
|
|
|
|
| ||||
Increase (decrease) in net assets from operations |
|
|
| 14,946,949 |
|
|
|
| (4,802,916 | ) |
|
|
|
|
|
|
|
|
| ||||
|
|
|
|
|
|
|
|
|
|
|
|
DISTRIBUTIONS TO SHAREHOLDERS: |
|
|
|
|
|
|
|
|
|
|
|
Distributions to Class A Shareholders: |
|
|
|
|
|
|
|
|
|
|
|
From net investment income |
|
|
| (51,261 | ) |
|
|
| — |
|
|
From net realized gain on investments |
|
|
| — |
|
|
|
| — |
|
|
Distributions to Institutional Class Shareholders: |
|
|
|
|
|
|
|
|
|
|
|
From net investment income |
|
|
| (53,985,717 | ) |
|
|
| (69,799,231 | ) |
|
From net realized gain on investments |
|
|
| — |
|
|
|
| — |
|
|
|
|
|
|
|
|
|
| ||||
Decrease in net assets from distributions to shareholders |
|
|
| (54,036,978 | ) |
|
|
| (69,799,231 | ) |
|
|
|
|
|
|
|
|
| ||||
|
|
|
|
|
|
|
|
|
|
|
|
CAPITAL SHARE TRANSACTIONS (NOTE 3): |
|
|
|
|
|
|
|
|
|
|
|
Net proceeds from shares sold |
|
|
| 33,652,844 |
|
|
|
| 88,626,740 |
|
|
Dividends reinvested |
|
|
| 34,379,418 |
|
|
|
| 47,602,166 |
|
|
Redemption fees |
|
|
| 39,100 |
|
|
|
| 48,509 |
|
|
Cost of shares redeemed |
|
|
| (134,334,741 | ) |
|
|
| (230,053,339 | ) |
|
|
|
|
|
|
|
|
| ||||
Decrease in net assets from capital share transactions |
|
|
| (66,263,379 | ) |
|
|
| (93,775,924 | ) |
|
|
|
|
|
|
|
|
| ||||
Total decrease in net assets |
|
|
| (105,353,408 | ) |
|
|
| (168,378,071 | ) |
|
|
|
|
|
|
|
|
| ||||
|
|
|
|
|
|
|
|
|
|
|
|
NET ASSETS: |
|
|
|
|
|
|
|
|
|
|
|
Beginning of year |
|
|
| 460,465,773 |
|
|
|
| 628,843,844 |
|
|
|
|
|
|
|
|
|
| ||||
End of year* |
|
| $ | 355,112,365 |
|
|
| $ | 460,465,773 |
|
|
|
|
|
|
|
|
|
| ||||
* Including undistributed net investment income of: |
|
| $ | 7,059,739 |
|
|
| $ | 9,151,725 |
|
|
|
|
|
|
|
|
|
| ||||
The accompanying notes are an integral part of these financial statements.
82
|
Alpine Mutual Funds |
Statements of Changes in Net Assets—Continued
|
|
|
|
|
|
|
|
|
|
|
|
|
| Accelerating Dividend Fund |
| ||||||||
|
|
| |||||||||
|
| Year Ended |
| Year Ended |
| ||||||
|
|
|
| ||||||||
OPERATIONS: |
|
|
|
|
|
|
|
|
|
|
|
Net investment income |
|
| $ | 117,447 |
|
|
| $ | 111,288 |
|
|
Net realized gain (loss) on: |
|
|
|
|
|
|
|
|
|
|
|
Secruities transactions |
|
|
| 45,689 |
|
|
|
| 195,503 |
|
|
Foreign currency transactions |
|
|
| (407 | ) |
|
|
| (1,808 | ) |
|
Change in unrealized appreciation/depreciation on: |
|
|
|
|
|
|
|
|
|
|
|
Investments |
|
|
| 162,663 |
|
|
|
| (161,355 | ) |
|
Foreign currency translations |
|
|
| 137 | �� |
|
|
| (135 | ) |
|
|
|
|
|
|
|
|
| ||||
Increase in net assets from operations |
|
|
| 325,529 |
|
|
|
| 143,493 |
|
|
|
|
|
|
|
|
|
| ||||
|
|
|
|
|
|
|
|
|
|
|
|
DISTRIBUTIONS TO SHAREHOLDERS: |
|
|
|
|
|
|
|
|
|
|
|
Distributions to Class A Shareholders: |
|
|
|
|
|
|
|
|
|
|
|
From net investment income |
|
|
| (4,787 | ) |
|
|
| — |
|
|
Distributions to Institutional Class Shareholders: |
|
|
|
|
|
|
|
|
|
|
|
From net investment income |
|
|
| (99,402 | ) |
|
|
| (118,437 | ) |
|
From net realized gain on investments |
|
|
| (197,496 | ) |
|
|
| (41,908 | ) |
|
|
|
|
|
|
|
|
| ||||
Decrease in net assets from distributions to shareholders |
|
|
| (301,685 | ) |
|
|
| (160,345 | ) |
|
|
|
|
|
|
|
|
| ||||
|
|
|
|
|
|
|
|
|
|
|
|
CAPITAL SHARE TRANSACTIONS (NOTE 3): |
|
|
|
|
|
|
|
|
|
|
|
Net proceeds from shares sold |
|
|
| 575,695 |
|
|
|
| 827,453 |
|
|
Dividends reinvested |
|
|
| 198,183 |
|
|
|
| 105,232 |
|
|
Redemption fees |
|
|
| — |
|
|
|
| 21 |
|
|
Cost of shares redeemed |
|
|
| (1,603,733 | ) |
|
|
| (91,097 | ) |
|
|
|
|
|
|
|
|
| ||||
Increase (decrease) in net assets from capital share transactions |
|
|
| (829,855 | ) |
|
|
| 841,609 |
|
|
|
|
|
|
|
|
|
| ||||
Total increase (decrease) in net assets |
|
|
| (806,011 | ) |
|
|
| 824,757 |
|
|
|
|
|
|
|
|
|
| ||||
|
|
|
|
|
|
|
|
|
|
|
|
NET ASSETS: |
|
|
|
|
|
|
|
|
|
|
|
Beginning of year |
|
|
| 3,218,196 |
|
|
|
| 2,393,439 |
|
|
|
|
|
|
|
|
|
| ||||
End of year* |
|
| $ | 2,412,185 |
|
|
| $ | 3,218,196 |
|
|
|
|
|
|
|
|
|
| ||||
* Including undistributed net investment income of: |
|
| $ | 36,612 |
|
|
| $ | 18,035 |
|
|
|
|
|
|
|
|
|
| ||||
The accompanying notes are an integral part of these financial statements.
83
|
Alpine Mutual Funds |
Statements of Changes in Net Assets—Continued
|
|
|
|
|
|
|
|
|
|
|
|
|
| Financial Services Fund |
| ||||||||
|
|
| |||||||||
|
| Year Ended |
| Year Ended |
| ||||||
|
|
|
| ||||||||
OPERATIONS: |
|
|
|
|
|
|
|
|
|
|
|
Net investment loss |
|
| $ | (14,068 | ) |
|
| $ | 24,595 |
|
|
Net realized gain (loss) on: |
|
|
|
|
|
|
|
|
|
|
|
Secruities transactions |
|
|
| 45,081 |
|
|
|
| (1,086,243 | ) |
|
Foreign currency transactions |
|
|
| (3,648 | ) |
|
|
| (1,938 | ) |
|
Change in unrealized appreciation/depreciation on: |
|
|
|
|
|
|
|
|
|
|
|
Investments |
|
|
| 1,484,702 |
|
|
|
| 649,026 |
|
|
Foreign currency translations |
|
|
| (8,059 | ) |
|
|
| (71 | ) |
|
|
|
|
|
|
|
|
| ||||
Increase (decrease) in net assets from operations |
|
|
| 1,504,008 |
|
|
|
| (414,631 | ) |
|
|
|
|
|
|
|
|
| ||||
|
|
|
|
|
|
|
|
|
|
|
|
DISTRIBUTIONS TO SHAREHOLDERS: |
|
|
|
|
|
|
|
|
|
|
|
Distributions to Institutional Class Shareholders: |
|
|
|
|
|
|
|
|
|
|
|
From net investment income |
|
|
| — |
|
|
|
| (13,114 | ) |
|
From tax return of capital |
|
|
| (13,524 | ) |
|
|
| (9,617 | ) |
|
|
|
|
|
|
|
|
| ||||
Decrease in net assets from distributions to shareholders |
|
|
| (13,524 | ) |
|
|
| (22,731 | ) |
|
|
|
|
|
|
|
|
| ||||
|
|
|
|
|
|
|
|
|
|
|
|
CAPITAL SHARE TRANSACTIONS (NOTE 3): |
|
|
|
|
|
|
|
|
|
|
|
Net proceeds from shares sold |
|
|
| 3,612,158 |
|
|
|
| 2,447,441 |
|
|
Dividends reinvested |
|
|
| 11,966 |
|
|
|
| 19,879 |
|
|
Redemption fees |
|
|
| 2,282 |
|
|
|
| 2,059 |
|
|
Cost of shares redeemed |
|
|
| (1,119,207 | ) |
|
|
| (3,498,930 | ) |
|
|
|
|
|
|
|
|
| ||||
Increase (decrease) in net assets from capital share transactions |
|
|
| 2,507,199 |
|
|
|
| (1,029,551 | ) |
|
|
|
|
|
|
|
|
| ||||
Total increase (decrease) in net assets |
|
|
| 3,997,683 |
|
|
|
| (1,466,913 | ) |
|
|
|
|
|
|
|
|
| ||||
|
|
|
|
|
|
|
|
|
|
|
|
NET ASSETS: |
|
|
|
|
|
|
|
|
|
|
|
Beginning of year |
|
|
| 6,250,892 |
|
|
|
| 7,717,805 |
|
|
|
|
|
|
|
|
|
| ||||
End of year* |
|
| $ | 10,248,575 |
|
|
| $ | 6,250,892 |
|
|
|
|
|
|
|
|
|
| ||||
* Including accumulated net investment loss of: |
|
| $ | (1,819 | ) |
|
| $ | (1,280 | ) |
|
|
|
|
|
|
|
|
| ||||
The accompanying notes are an integral part of these financial statements.
84
|
Alpine Mutual Funds |
Statements of Changes in Net Assets—Continued
|
|
|
|
|
|
|
|
|
|
|
|
|
| Innovators Fund |
| ||||||||
|
|
| |||||||||
|
| Year Ended |
| Year Ended |
| ||||||
|
|
|
| ||||||||
OPERATIONS: |
|
|
|
|
|
|
|
|
|
|
|
Net investment loss |
|
| $ | (122,459 | ) |
|
| $ | (109,854 | ) |
|
Net realized gain (loss) on: |
|
|
|
|
|
|
|
|
|
|
|
Secruities transactions |
|
|
| 20,875 |
|
|
|
| (316,996 | ) |
|
Foreign currency transactions |
|
|
| (4,288 | ) |
|
|
| — |
|
|
Change in unrealized appreciation on investments |
|
|
| 925,282 |
|
|
|
| 889,500 |
|
|
|
|
|
|
|
|
|
| ||||
Increase in net assets from operations |
|
|
| 819,410 |
|
|
|
| 462,650 |
|
|
|
|
|
|
|
|
|
| ||||
|
|
|
|
|
|
|
|
|
|
|
|
CAPITAL SHARE TRANSACTIONS (NOTE 3): |
|
|
|
|
|
|
|
|
|
|
|
Net proceeds from shares sold |
|
|
| 1,635,064 |
|
|
|
| 133,270 |
|
|
Redemption fees |
|
|
| 769 |
|
|
|
| 34 |
|
|
Cost of shares redeemed |
|
|
| (1,850,248 | ) |
|
|
| (2,059,520 | ) |
|
|
|
|
|
|
|
|
| ||||
Decrease in net assets from capital share transactions |
|
|
| (214,415 | ) |
|
|
| (1,926,216 | ) |
|
|
|
|
|
|
|
|
| ||||
Total increase (decrease) in net assets |
|
|
| 604,995 |
|
|
|
| (1,463,566 | ) |
|
|
|
|
|
|
|
|
| ||||
|
|
|
|
|
|
|
|
|
|
|
|
NET ASSETS: |
|
|
|
|
|
|
|
|
|
|
|
Beginning of year |
|
|
| 10,383,403 |
|
|
|
| 11,846,969 |
|
|
|
|
|
|
|
|
|
| ||||
End of year* |
|
| $ | 10,988,398 |
|
|
| $ | 10,383,403 |
|
|
|
|
|
|
|
|
|
| ||||
* Including accumulated net investment loss of: |
|
| $ | (106,328 | ) |
|
| $ | — |
|
|
|
|
|
|
|
|
|
| ||||
|
|
|
|
|
|
|
|
|
|
|
|
|
| Transformations Fund |
| ||||||||
|
|
| |||||||||
|
| Year Ended |
| Year Ended |
| ||||||
|
|
|
| ||||||||
OPERATIONS: |
|
|
|
|
|
|
|
|
|
|
|
Net investment loss |
|
| $ | (39,568 | ) |
|
| $ | (38,058 | ) |
|
Net realized gain (loss) on: |
|
|
|
|
|
|
|
|
|
|
|
Secruities transactions |
|
|
| 327,441 |
|
|
|
| 518,227 |
|
|
Foreign currency transactions |
|
|
| (312 | ) |
|
|
| (184 | ) |
|
Change in unrealized appreciation/depreciation on: |
|
|
|
|
|
|
|
|
|
|
|
Investments |
|
|
| (334,488 | ) |
|
|
| 230,670 |
|
|
Foreign currency translations |
|
|
| 113 |
|
|
|
| (116 | ) |
|
|
|
|
|
|
|
|
| ||||
Increase (decrease) in net assets from operations |
|
|
| (46,814 | ) |
|
|
| 710,539 |
|
|
|
|
|
|
|
|
|
| ||||
|
|
|
|
|
|
|
|
|
|
|
|
CAPITAL SHARE TRANSACTIONS (NOTE 3): |
|
|
|
|
|
|
|
|
|
|
|
Net proceeds from shares sold |
|
|
| 1,399,604 |
|
|
| $ | 1,211,025 |
|
|
Redemption fees |
|
|
| 805 |
|
|
|
| 555 |
|
|
Cost of shares redeemed |
|
|
| (1,446,510 | ) |
|
|
| (949,393 | ) |
|
|
|
|
|
|
|
|
| ||||
Increase (decrease) in net assets from capital share transactions |
|
|
| (46,101 | ) |
|
|
| 262,187 |
|
|
|
|
|
|
|
|
|
| ||||
Total increase (decrease) in net assets |
|
|
| (92,915 | ) |
|
|
| 972,726 |
|
|
|
|
|
|
|
|
|
| ||||
|
|
|
|
|
|
|
|
|
|
|
|
NET ASSETS: |
|
|
|
|
|
|
|
|
|
|
|
Beginning of year |
|
|
| 6,266,926 |
|
|
|
| 5,294,200 |
|
|
|
|
|
|
|
|
|
| ||||
End of year* |
|
| $ | 6,174,011 |
|
|
| $ | 6,266,926 |
|
|
|
|
|
|
|
|
|
| ||||
* Including accumulated net investment loss of: |
|
| $ | (35,046 | ) |
|
| $ | — |
|
|
|
|
|
|
|
|
|
| ||||
The accompanying notes are an integral part of these financial statements.
85
|
Alpine Mutual Funds |
Statements of Changes in Net Assets—Continued
|
|
|
|
|
|
|
|
|
|
|
|
|
| Foundation Fund |
| ||||||||
|
|
| |||||||||
|
| Year Ended |
| Year Ended |
| ||||||
|
|
|
| ||||||||
OPERATIONS: |
|
|
|
|
|
|
|
|
|
|
|
Net investment income |
|
| $ | 1,153,572 |
|
|
| $ | 939,172 |
|
|
Net realized gain (loss) on: |
|
|
|
|
|
|
|
|
|
|
|
Secruities transactions |
|
|
| (3,613,947 | ) |
|
|
| 1,536,745 |
|
|
Foreign currency transactions |
|
|
| (1,028 | ) |
|
|
| 2 |
|
|
Change in unrealized appreciation/depreciation on: |
|
|
|
|
|
|
|
|
|
|
|
Investments |
|
|
| 8,539,941 |
|
|
|
| 1,500,399 |
|
|
Foreign currency translations |
|
|
| (14 | ) |
|
|
| — |
|
|
|
|
|
|
|
|
|
| ||||
Increase in net assets from operations |
|
|
| 6,078,524 |
|
|
|
| 3,976,318 |
|
|
|
|
|
|
|
|
|
| ||||
|
|
|
|
|
|
|
|
|
|
|
|
DISTRIBUTIONS TO SHAREHOLDERS: |
|
|
|
|
|
|
|
|
|
|
|
Distributions to Class A Shareholders: |
|
|
|
|
|
|
|
|
|
|
|
From net investment income |
|
|
| (1,213 | ) |
|
|
| — |
|
|
Distributions to Institutional Class Shareholders: |
|
|
|
|
|
|
|
|
|
|
|
From net investment income |
|
|
| (1,083,670 | ) |
|
|
| (1,049,287 | ) |
|
|
|
|
|
|
|
|
| ||||
Decrease in net assets from distributions to shareholders |
|
|
| (1,084,883 | ) |
|
|
| (1,049,287 | ) |
|
|
|
|
|
|
|
|
| ||||
|
|
|
|
|
|
|
|
|
|
|
|
CAPITAL SHARE TRANSACTIONS (NOTE 3): |
|
|
|
|
|
|
|
|
|
|
|
Net proceeds from shares sold |
|
|
| 179,210 |
|
|
|
| 830,757 |
|
|
Dividends reinvested |
|
|
| 1,057,319 |
|
|
|
| 1,024,279 |
|
|
Redemption fees |
|
|
| — |
|
|
|
| 1,429 |
|
|
Cost of shares redeemed |
|
|
| (2,425,427 | ) |
|
|
| (6,015,870 | ) |
|
|
|
|
|
|
|
|
| ||||
Decrease in net assets from capital share transactions |
|
|
| (1,188,898 | ) |
|
|
| (4,159,405 | ) |
|
|
|
|
|
|
|
|
| ||||
Total increase (decrease) in net assets |
|
|
| 3,804,743 |
|
|
|
| (1,232,374 | ) |
|
|
|
|
|
|
|
|
| ||||
|
|
|
|
|
|
|
|
|
|
|
|
NET ASSETS: |
|
|
|
|
|
|
|
|
|
|
|
Beginning of year |
|
|
| 61,701,197 |
|
|
|
| 62,933,571 |
|
|
|
|
|
|
|
|
|
| ||||
End of year* |
|
| $ | 65,505,940 |
|
|
| $ | 61,701,197 |
|
|
|
|
|
|
|
|
|
| ||||
* Including undistributed (accumulated) net investment income (loss) of: |
|
| $ | 24,071 |
|
|
| $ | (9,347 | ) |
|
|
|
|
|
|
|
|
| ||||
The accompanying notes are an integral part of these financial statements.
86
|
Alpine Mutual Funds |
Statements of Changes in Net Assets—Continued
|
|
|
|
|
|
|
|
|
|
|
|
|
| Ultra Short |
| ||||||||
|
|
| |||||||||
|
| Year Ended |
| Year Ended |
| ||||||
|
|
|
| ||||||||
OPERATIONS: |
|
|
|
|
|
|
|
|
|
|
|
Net investment income |
|
| $ | 15,890,877 |
|
|
| $ | 25,425,034 |
|
|
Net realized gain (loss) on securities transactions |
|
|
| 106,992 |
|
|
|
| (124,756 | ) |
|
Change in unrealized (depreciation) on investments |
|
|
| (381,155 | ) |
|
|
| (296,662 | ) |
|
|
|
|
|
|
|
|
| ||||
Increase in net assets from operations |
|
|
| 15,616,714 |
|
|
|
| 25,003,616 |
|
|
|
|
|
|
|
|
|
| ||||
|
|
|
|
|
|
|
|
|
|
|
|
DISTRIBUTIONS TO SHAREHOLDERS: |
|
|
|
|
|
|
|
|
|
|
|
Distributions to Class A Shareholders: |
|
|
|
|
|
|
|
|
|
|
|
From net investment income |
|
|
| (2,909,048 | ) |
|
|
| (4,909,350 | ) |
|
From net realized gain on investments |
|
|
| — |
|
|
|
| — |
|
|
Distributions to Institutional Class Shareholders: |
|
|
|
|
|
|
|
|
|
|
|
From net investment income |
|
|
| (12,981,750 | ) |
|
|
| (20,529,866 | ) |
|
From net realized gain on investments |
|
|
| — |
|
|
|
| — |
|
|
|
|
|
|
|
|
|
| ||||
Decrease in net assets from distributions to shareholders |
|
|
| (15,890,798 | ) |
|
|
| (25,439,216 | ) |
|
|
|
|
|
|
|
|
| ||||
|
|
|
|
|
|
|
|
|
|
|
|
CAPITAL SHARE TRANSACTIONS (NOTE 3): |
|
|
|
|
|
|
|
|
|
|
|
Net proceeds from shares sold |
|
|
| 1,341,370,692 |
|
|
|
| 1,069,893,101 |
|
|
Dividends reinvested |
|
|
| 10,377,482 |
|
|
|
| 17,865,869 |
|
|
Redemption fees |
|
|
| 37,617 |
|
|
|
| 38,258 |
|
|
Cost of shares redeemed |
|
|
| (1,156,537,109 | ) |
|
|
| (902,146,730 | ) |
|
|
|
|
|
|
|
|
| ||||
Increase in net assets from capital share transactions |
|
|
| 195,248,682 |
|
|
|
| 185,650,498 |
|
|
|
|
|
|
|
|
|
| ||||
Total increase in net assets |
|
|
| 194,974,598 |
|
|
|
| 185,214,898 |
|
|
|
|
|
|
|
|
|
| ||||
|
|
|
|
|
|
|
|
|
|
|
|
NET ASSETS: |
|
|
|
|
|
|
|
|
|
|
|
Beginning of year |
|
|
| 1,624,112,631 |
|
|
|
| 1,438,897,733 |
|
|
|
|
|
|
|
|
|
| ||||
End of year* |
|
| $ | 1,819,087,229 |
|
|
| $ | 1,624,112,631 |
|
|
|
|
|
|
|
|
|
| ||||
* Including undistributed net investment income of: |
|
| $ | 79 |
|
|
| $ | — |
|
|
|
|
|
|
|
|
|
| ||||
The accompanying notes are an integral part of these financial statements.
87
|
Alpine Mutual Funds |
Statements of Changes in Net Assets—Continued
|
|
|
|
|
|
|
|
|
|
|
|
|
| Municipal Money Market Fund |
| ||||||||
|
|
| |||||||||
|
| Year Ended |
| Year Ended |
| ||||||
|
|
|
| ||||||||
OPERATIONS: |
|
|
|
|
|
|
|
|
|
|
|
Net investment income |
|
| $ | 264,781 |
|
|
| $ | 799,038 |
|
|
Net realized gain on securities transactions |
|
|
| — |
|
|
|
| 45,443 |
|
|
|
|
|
|
|
|
|
| ||||
Increase in net assets from operations |
|
|
| 264,781 |
|
|
|
| 844,481 |
|
|
|
|
|
|
|
|
|
| ||||
|
|
|
|
|
|
|
|
|
|
|
|
DISTRIBUTIONS TO SHAREHOLDERS: |
|
|
|
|
|
|
|
|
|
|
|
From net investment income |
|
|
| (264,781 | ) |
|
|
| (799,048 | ) |
|
From net realized gain on investments |
|
|
| — |
|
|
|
| (45,444 | ) |
|
|
|
|
|
|
|
|
| ||||
Decrease in net assets from distributions to shareholders |
|
|
| (264,781 | ) |
|
|
| (844,492 | ) |
|
|
|
|
|
|
|
|
| ||||
|
|
|
|
|
|
|
|
|
|
|
|
CAPITAL SHARE TRANSACTIONS (NOTE 3): |
|
|
|
|
|
|
|
|
|
|
|
Net proceeds from shares sold |
|
|
| 209,368,876 |
|
|
|
| 1,055,218,569 |
|
|
Dividends reinvested |
|
|
| 190,228 |
|
|
|
| 457,009 |
|
|
Cost of shares redeemed |
|
|
| (290,975,342 | ) |
|
|
| (1,215,786,617 | ) |
|
|
|
|
|
|
|
|
| ||||
Decrease in net assets from capital share transactions |
|
|
| (81,416,238 | ) |
|
|
| (160,111,039 | ) |
|
|
|
|
|
|
|
|
| ||||
Total decrease in net assets |
|
|
| (81,416,238 | ) |
|
|
| (160,111,050 | ) |
|
|
|
|
|
|
|
|
| ||||
|
|
|
|
|
|
|
|
|
|
|
|
NET ASSETS: |
|
|
|
|
|
|
|
|
|
|
|
Beginning of year |
|
|
| 310,057,778 |
|
|
|
| 470,168,828 |
|
|
|
|
|
|
|
|
|
| ||||
End of year* |
|
| $ | 228,641,540 |
|
|
| $ | 310,057,778 |
|
|
|
|
|
|
|
|
|
| ||||
* Including undistributed net investment income of: |
|
| $ | — |
|
|
| $ | — |
|
|
|
|
|
|
|
|
|
| ||||
The accompanying notes are an integral part of these financial statements.
88
|
Alpine Mutual Funds |
Financial Highlights
(For a share outstanding throughout the period)
|
|
|
|
|
|
|
|
| Dynamic Dividend |
| |||
|
|
| ||||
|
| Period Ended |
| |||
|
|
| ||||
Class A Shares: |
|
|
|
|
|
|
Net asset value per share, beginning of period |
|
| $ | 3.61 |
|
|
|
|
|
|
| ||
Income from investment operations: |
|
|
|
|
|
|
Net investment income |
|
|
| 0.35 |
|
|
Net realized and unrealized loss on investments |
|
|
| (0.06 | ) |
|
|
|
|
|
| ||
Total from investment operations |
|
|
| 0.29 |
|
|
|
|
|
|
| ||
Redemption fees |
|
|
| 0.00 | (b) |
|
Less distributions: |
|
|
|
|
|
|
From net investment income |
|
|
| (0.41 | ) |
|
|
|
|
|
| ||
Total distributions |
|
|
| (0.41 | ) |
|
|
|
|
|
| ||
Net asset value per share, end of period |
|
| $ | 3.49 |
|
|
|
|
|
|
| ||
Total return |
|
|
| 8.36 | %(c) |
|
Ratios/Supplemental Data |
|
|
|
|
|
|
Net Assets at end of period (000) |
|
| $ | 1,612 |
|
|
Ratio of total expenses to average net assets |
|
|
| 1.56 | %(d) |
|
Ratio of interest expense to average net assets |
|
|
| 0.01 | %(d) |
|
Ratio of expenses to average net assets excluding interest expense |
|
|
| 1.55 | %(d) |
|
Ratio of net investment income to average net assets |
|
|
| 8.02 | %(d) |
|
Portfolio turnover rate (e) |
|
|
| 258 | % |
|
|
|
|
| ||
|
| |
(a) | Class A commenced operations on December 30, 2011. | |
|
| |
(b) | The amount is less than $0.005 per share. | |
|
| |
(c) | Not annualized. | |
|
| |
(d) | Annualized. | |
|
| |
(e) | Portfolio turnover is calculated on the basis of the Fund as a whole, without distinguishing between classes of shares issued. | |
The accompanying notes are an integral part of these financial statements.
89
|
Alpine Mutual Funds |
Financial Highlights—Continued
(For a share outstanding throughout each year)
|
|
|
|
|
|
|
|
|
|
|
|
|
|
|
|
|
|
| Dynamic Dividend Fund |
| |||||||||||||
|
|
| ||||||||||||||
|
| Year Ended October 31, |
| |||||||||||||
|
|
| ||||||||||||||
|
| 2012 |
| 2011 |
| 2010 |
| 2009 |
| 2008 |
| |||||
|
|
|
|
|
|
| ||||||||||
Institutional Class Shares: |
|
|
|
|
|
|
|
|
|
|
|
|
|
|
|
|
Net asset value per share, beginning of year |
| $ | 3.84 |
| $ | 4.48 |
| $ | 4.78 |
| $ | 5.72 |
| $ | 13.32 |
|
|
|
|
|
|
|
| ||||||||||
Income from investment operations: |
|
|
|
|
|
|
|
|
|
|
|
|
|
|
|
|
Net investment income |
|
| 0.50 |
|
| 0.49 |
|
| 0.56 |
|
| 1.37 | (a) |
| 1.33 | (a) |
Net realized and unrealized gains (losses) on investments |
|
| (0.35 | ) |
| (0.59 | ) |
| 0.00 | (b) |
| (1.14 | ) |
| (7.29 | ) |
|
|
|
|
|
|
| ||||||||||
Total from investment operations |
|
| 0.15 |
|
| (0.10 | ) |
| 0.56 |
|
| 0.23 |
|
| (5.96 | ) |
|
|
|
|
|
|
| ||||||||||
Redemption fees |
|
| 0.00 | (b) |
| 0.00 | (b) |
| 0.00 | (b) |
| 0.00 | (b) |
| 0.00 | (b) |
Less distributions: |
|
|
|
|
|
|
|
|
|
|
|
|
|
|
|
|
From net investment income |
|
| (0.50 | ) |
| (0.54 | ) |
| (0.86 | ) |
| (1.17 | ) |
| (1.58 | ) |
From tax return of capital |
|
| — |
|
| — |
|
| — |
|
| — |
|
| (0.06 | ) |
|
|
|
|
|
|
| ||||||||||
Total distributions |
|
| (0.50 | ) |
| (0.54 | ) |
| (0.86 | ) |
| (1.17 | ) |
| (1.64 | ) |
|
|
|
|
|
|
| ||||||||||
Net asset value per share, end of year |
| $ | 3.49 |
| $ | 3.84 |
| $ | 4.48 |
| $ | 4.78 |
| $ | 5.72 |
|
|
|
|
|
|
|
| ||||||||||
Total return |
|
| 4.46 | % |
| (3.48 | )% |
| 12.72 | % |
| 6.64 | % |
| (49.05 | )% |
Ratios/Supplemental Data: |
|
|
|
|
|
|
|
|
|
|
|
|
|
|
|
|
Net Assets at end of year (000) |
| $ | 353,501 |
| $ | 460,466 |
| $ | 628,844 |
| $ | 572,151 |
| $ | 598,759 |
|
Ratio of total expenses to average net assets |
|
| 1.28 | % |
| 1.21 | % |
| 1.21 | % |
| 1.20 | % |
| 1.18 | % |
Ratio of interest expense to average net assets |
|
| 0.01 | % |
| 0.03 | % |
| 0.04 | % |
| 0.02 | % |
| 0.02 | % |
Ratio of expenses to average net assets excluding interest expense |
|
| 1.27 | % |
| 1.18 | % |
| 1.18 | % |
| 1.18 | % |
| 1.16 | % |
Ratio of net investment income to average net assets |
|
| 13.17 | % |
| 10.39 | % |
| 12.85 | % |
| 26.04 | % |
| 15.32 | % |
Portfolio turnover (c) |
|
| 258 | % |
| 358 | % |
| 506 | % |
| 656 | % |
| 323 | % |
|
|
|
| ||
|
| |
(a) | Net investment income per share is calculated using ending balances after consideration of adjustments for permanent book and tax differences. | |
|
| |
(b) | The amount is less than $0.005 per share. | |
|
| |
(c) | Portfolio turnover is calculated on the basis of the Fund as a whole, without distinguishing between classes of shares issued. | |
The accompanying notes are an integral part of these financial statements.
90
|
Alpine Mutual Funds |
Financial Highlights—Continued
(For a share outstanding throughout the period)
|
|
|
|
|
|
|
|
| Accelerating |
| |||
|
|
| ||||
|
| Period Ended |
| |||
|
|
| ||||
Class A Shares: |
|
|
|
|
|
|
Net asset value per share, beginning of period |
|
| $ | 12.02 |
|
|
|
|
|
|
| ||
Income from investment operations: |
|
|
|
|
|
|
Net investment income |
|
|
| 0.31 |
|
|
Net realized and unrealized gain on investments |
|
|
| 0.92 |
|
|
|
|
|
|
| ||
Total from investment operations |
|
|
| 1.23 |
|
|
|
|
|
|
| ||
Redemption fees |
|
|
| — |
|
|
Less distributions from: |
|
|
|
|
|
|
Net investment income |
|
|
| (0.37 | ) |
|
Net realized gains on investments |
|
|
| — |
|
|
|
|
|
|
| ||
Total distributions |
|
|
| (0.37 | ) |
|
|
|
|
|
| ||
Net asset value per share, end of period |
|
| $ | 12.88 |
|
|
|
|
|
|
| ||
Total return |
|
|
| 10.29 | %(b) |
|
Ratios/Supplemental Data |
|
|
|
|
|
|
Net Assets at end of period (000) |
|
| $ | 257 |
|
|
Ratio of total expenses to average net assets: |
|
|
|
|
|
|
Before waivers and/or expense reimbursements |
|
|
| 3.83 | %(c) |
|
After waivers and/or expense reimbursements |
|
|
| 1.60 | %(c) |
|
Ratio of interest expense to average net assets |
|
|
| 0.00 | %(c)(d) |
|
Ratio of expenses to average net assets excluding interest expense: |
|
|
|
|
|
|
Before waivers and/or expense reimbursements |
|
|
| 3.83 | %(c) |
|
After waivers and/or expense reimbursements |
|
|
| 1.60 | %(c) |
|
Ratio of net investment income to average net assets |
|
|
| 2.71 | %(c) |
|
Portfolio turnover rate (e) |
|
|
| 73 | % |
|
|
|
|
| ||
|
| |
(a) | Class A commenced operations on December 30, 2011. | |
|
| |
(b) | Not annualized. | |
|
| |
(c) | Annualized. | |
|
| |
(d) | The amount is less than 0.005%. | |
|
| |
(e) | Portfolio turnover is calculated on the basis of the Fund as a whole, without distinguishing between classes of shares issued. | |
The accompanying notes are an integral part of these financial statements.
91
|
Alpine Mutual Funds |
Financial Highlights—Continued
(For a share outstanding throughout each period)
|
|
|
|
|
|
|
|
|
|
|
|
|
|
|
|
|
| Accelerating Dividend Fund |
| ||||||||||||
|
|
| |||||||||||||
|
| Year Ended |
| Period Ended |
| ||||||||||
|
|
|
| ||||||||||||
|
| 2012 |
| 2011 |
| 2010 |
|
| |||||||
|
|
|
|
|
| ||||||||||
Institutional Class Shares: |
|
|
|
|
|
|
|
|
|
|
|
|
|
|
|
Net asset value per share, beginning of period |
| $ | 12.83 |
| $ | 12.80 |
| $ | 11.48 |
|
| $ | 10.00 |
|
|
|
|
|
|
|
|
|
| ||||||||
Income from investment operations: |
|
|
|
|
|
|
|
|
|
|
|
|
|
|
|
Net investment income |
|
| 0.62 |
|
| 0.51 |
|
| 0.51 |
|
|
| 0.12 | (b) |
|
Net realized and unrealized gains on investments |
|
| 0.73 |
|
| 0.32 |
|
| 1.29 |
|
|
| 1.36 |
|
|
|
|
|
|
|
|
|
| ||||||||
Total from investment operations |
|
| 1.35 |
|
| 0.83 |
|
| 1.80 |
|
|
| 1.48 |
|
|
|
|
|
|
|
|
|
| ||||||||
Redemption fees |
|
| — |
|
| 0.00 | (c) |
| 0.00 | (c) |
|
| — |
|
|
Less distributions from: |
|
|
|
|
|
|
|
|
|
|
|
|
|
|
|
Net investment income |
|
| (0.50 | ) |
| (0.58 | ) |
| (0.45 | ) |
|
| — |
|
|
Net realized gains on investments |
|
| (0.80 | ) |
| (0.22 | ) |
| (0.03 | ) |
|
| — |
|
|
|
|
|
|
|
|
|
| ||||||||
Total distributions |
|
| (1.30 | ) |
| (0.80 | ) |
| (0.48 | ) |
|
| — |
|
|
|
|
|
|
|
|
|
| ||||||||
Net asset value per share, end of period |
| $ | 12.88 |
| $ | 12.83 |
| $ | 12.80 |
|
| $ | 11.48 |
|
|
|
|
|
|
|
|
|
| ||||||||
Total return |
|
| 11.28 | % |
| 6.43 | % |
| 16.06 | % |
|
| 14.80 | %(d) |
|
Ratios/Supplemental Data: |
|
|
|
|
|
|
|
|
|
|
|
|
|
|
|
Net Assets at end of period (000) |
| $ | 2,155 |
| $ | 3,218 |
| $ | 2,393 |
|
| $ | 1,215 |
|
|
Ratio of total expenses to average net assets: |
|
|
|
|
|
|
|
|
|
|
|
|
|
|
|
Before waivers and/or expense reimbursements |
|
| 3.26 | % |
| 2.64 | % |
| 2.70 | % |
|
| 5.26 | %(e) |
|
After waivers and/or expense reimbursements |
|
| 1.35 | % |
| 1.35 | % |
| 1.35 | % |
|
| 1.35 | %(e) |
|
Ratio of interest expense to average net assets |
|
| 0.00 | %(c) |
| 0.00 | % |
| 0.00 | % |
|
| 0.00 | % |
|
Ratio of expenses to average net assets excluding interest expense: |
|
|
|
|
|
|
|
|
|
|
|
|
|
|
|
Before waivers and/or expense reimbursements |
|
| 3.26 | % |
| 2.64 | % |
| 2.70 | % |
|
| 5.26 | %(e) |
|
After waivers and/or expense reimbursements |
|
| 1.35 | % |
| 1.35 | % |
| 1.35 | % |
|
| 1.35 | %(e) |
|
Ratio of net investment income to average net assets |
|
| 4.52 | % |
| 4.09 | % |
| 4.85 | % |
|
| 1.19 | %(e) |
|
Portfolio turnover (f) |
|
| 73 | % |
| 137 | % |
| 225 | % |
|
| 104 | %(d) |
|
|
|
|
| ||
|
| |
(a) | For the period from November 5, 2008 (inception of fund) to October 31, 2009. | |
|
| |
(b) | Net investment income per share is calculated using ending balances after consideration of adjustments for permanent book and tax differences. | |
|
| |
(c) | The amount is less than $0.005 per share or 0.005%. | |
|
| |
(d) | Not annualized. | |
|
| |
(e) | Annualized. | |
|
| |
(f) | Portfolio turnover is calculated on the basis of the Fund as a whole, without distinguishing between classes of shares issued. | |
The accompanying notes are an integral part of these financial statements.
92
|
Alpine Mutual Funds |
Financial Highlights—Continued
(For a share outstanding throughout the period)
|
|
|
|
|
|
|
|
| Financial |
| |||
|
|
| ||||
|
| Period Ended |
| |||
|
|
| ||||
Class A Shares: |
|
|
|
|
|
|
Net asset value per share, beginning of period |
|
| $ | 6.90 |
|
|
|
|
|
|
| ||
Income from investment operations: |
|
|
|
|
|
|
Net investment loss |
|
|
| (0.01 | ) |
|
Net realized and unrealized gain on investments |
|
|
| 1.86 |
|
|
|
|
|
|
| ||
Total from investment operations |
|
|
| 1.85 |
|
|
|
|
|
|
| ||
Redemption fees |
|
|
| 0.00 | (b) |
|
Less distributions: |
|
|
|
|
|
|
From net investment income |
|
|
| — |
|
|
From net realized gains on investments |
|
|
| — |
|
|
From tax return of capital |
|
|
| — |
|
|
|
|
|
|
| ||
Total distributions |
|
|
| — |
|
|
|
|
|
|
| ||
Net asset value per share, end of period |
|
| $ | 8.75 |
|
|
|
|
|
|
| ||
Total return |
|
|
| 26.81 | %(c) |
|
Ratios/Supplemental Data |
|
|
|
|
|
|
Net Assets at end of period (000) |
|
| $ | 1,375 |
|
|
Ratio of total expenses to average net assets |
|
|
|
|
|
|
Before waivers and/or expense reimbursements |
|
|
| 2.05 | %(d) |
|
After waivers and/or expense reimbursements |
|
|
| 1.53 | %(d) |
|
Ratio of interest expense to average net assets |
|
|
| 0.00 | %(b)(d) |
|
Ratio of expenses to average net assets excluding interest expense: |
|
|
|
|
|
|
Before waivers and/or expense reimbursements |
|
|
| 2.05 | %(d) |
|
After waivers and/or expense reimbursements |
|
|
| 1.53 | %(d) |
|
Ratio of net investment income to average net assets |
|
|
| (0.50 | )%(d) |
|
Portfolio turnover rate (e) |
|
|
| 120 | % |
|
|
|
|
| ||
|
| |
(a) | Class A commenced operations on December 30, 2011. | |
|
| |
(b) | The amount is less than $0.005 per share or 0.005%. | |
|
| |
(c) | Not annualized. | |
|
| |
(d) | Annualized. | |
|
| |
(e) | Portfolio turnover is calculated on the basis of the Fund as a whole, without distinguishing between classes of shares issued. | |
The accompanying notes are an integral part of these financial statements.
93
|
Alpine Mutual Funds |
Financial Highlights—Continued
(For a share outstanding throughout each year)
|
|
|
|
|
|
|
|
|
|
|
|
|
|
|
|
|
|
| Financial Services Fund |
| |||||||||||||
|
|
| ||||||||||||||
|
| Year Ended October 31, |
| |||||||||||||
|
|
| ||||||||||||||
|
| 2012 |
| 2011 |
| 2010 |
| 2009 |
| 2008 |
| |||||
|
|
|
|
|
|
| ||||||||||
Institutional Class Shares: |
|
|
|
|
|
|
|
|
|
|
|
|
|
|
|
|
Net asset value per share, beginning of year |
| $ | 7.15 |
| $ | 7.69 |
| $ | 6.86 |
| $ | 6.24 |
| $ | 13.89 |
|
|
|
|
|
|
|
| ||||||||||
Income from investment operations: |
|
|
|
|
|
|
|
|
|
|
|
|
|
|
|
|
Net investment income (loss) |
|
| 0.00 | (b) |
| 0.02 |
|
| (0.01 | ) |
| 0.03 | (a) |
| 0.07 | (a) |
Net realized and unrealized gains (losses) on investments |
|
| 1.64 |
|
| (0.54 | ) |
| 0.84 |
|
| 1.10 |
|
| (4.40 | ) |
|
|
|
|
|
|
| ||||||||||
Total from investment operations |
|
| 1.64 |
|
| (0.52 | ) |
| 0.83 |
|
| 1.13 |
|
| (4.33 | ) |
|
|
|
|
|
|
| ||||||||||
Redemption fees |
|
| 0.00 | (b) |
| 0.00 | (b) |
| 0.00 | (b) |
| 0.00 | (b) |
| 0.01 |
|
Less distributions: |
|
|
|
|
|
|
|
|
|
|
|
|
|
|
|
|
From net investment income |
|
| — |
|
| (0.01 | ) |
| — |
|
| (0.10 | ) |
| — |
|
From net realized gains on investments |
|
| — |
|
| — |
|
| — |
|
| (0.41 | ) |
| (3.33 | ) |
From tax return of capital |
|
| (0.02 | ) |
| (0.01 | ) |
| — |
|
| 0.00 | (b) |
| — |
|
|
|
|
|
|
|
| ||||||||||
Total distributions |
|
| (0.02 | ) |
| (0.02 | ) |
| — |
|
| (0.51 | ) |
| (3.33 | ) |
|
|
|
|
|
|
| ||||||||||
Net asset value per share, end of year |
| $ | 8.77 |
| $ | 7.15 |
| $ | 7.69 |
| $ | 6.86 |
| $ | 6.24 |
|
|
|
|
|
|
|
| ||||||||||
Total return |
|
| 22.95 | % |
| (6.77 | )% |
| 12.26 | % |
| 21.83 | % |
| (41.16 | )% |
Ratios/Supplemental Data: |
|
|
|
|
|
|
|
|
|
|
|
|
|
|
|
|
Net Assets at end of year (000) |
| $ | 8,874 |
| $ | 6,251 |
| $ | 7,718 |
| $ | 7,895 |
| $ | 6,677 |
|
Ratio of total expenses to average net assets: |
|
|
|
|
|
|
|
|
|
|
|
|
|
|
|
|
Before waivers and/or expense reimbursements |
|
| 1.94 | % |
| 1.85 | % |
| 1.85 | % |
| 2.06 | % |
| 1.94 | % |
After waivers and/or expense reimbursements |
|
| 1.38 | % |
| 1.44 | % |
| 1.43 | % |
| 1.44 | % |
| 1.35 | % |
Ratio of interest expense to average net assets |
|
| 0.03 | % |
| 0.09 | % |
| 0.08 | % |
| 0.09 | % |
| 0.37 | % |
Ratio of expenses to average net assets excluding interest expense: |
|
|
|
|
|
|
|
|
|
|
|
|
|
|
|
|
Before waivers and/or expense reimbursements |
|
| 1.91 | % |
| 1.75 | % |
| 1.77 | % |
| 1.97 | % |
| 1.57 | % |
After waivers and/or expense reimbursements |
|
| 1.35 | % |
| 1.35 | % |
| 1.35 | % |
| 1.35 | % |
| 0.98 | % |
Ratio of net investment income to average net assets |
|
| (0.16 | )% |
| 0.30 | % |
| (0.09 | )% |
| 0.39 | % |
| 1.32 | % |
Portfolio turnover (c) |
|
| 120 | % |
| 73 | % |
| 133 | % |
| 437 | % |
| 455 | % |
|
|
|
| ||
|
| |
(a) | Net investment income per share is calculated using ending balances after consideration of adjustments for permanent book and tax differences. | |
|
| |
(b) | The amount is less than $0.005 per share. | |
|
| |
(c) | Portfolio turnover is calculated on the basis of the Fund as a whole, without distinguishing between classes of shares issued. | |
The accompanying notes are an integral part of these financial statements.
94
|
Alpine Mutual Funds |
Financial Highlights—Continued
(For a share outstanding throughout the period)
|
|
|
|
|
|
|
|
| Innovators Fund |
| |||
|
|
| ||||
|
| Period Ended |
| |||
|
|
| ||||
Class A Shares: |
|
|
|
|
|
|
Net asset value per share, beginning of period |
|
| $ | 10.17 |
|
|
|
|
|
|
| ||
Income from investment operations: |
|
|
|
|
|
|
Net investment income loss |
|
|
| (0.14 | ) |
|
Net realized and unrealized gain on investments |
|
|
| 1.27 |
|
|
|
|
|
|
| ||
Total from investment operations |
|
|
| 1.13 |
|
|
|
|
|
|
| ||
Redemption fees |
|
|
| — |
|
|
Less distributions: |
|
|
|
|
|
|
From net investment income |
|
|
| — |
|
|
From net realized gains on investments |
|
|
| — |
|
|
|
|
|
|
| ||
Total distributions |
|
|
| — |
|
|
|
|
|
|
| ||
Net asset value per share, end of period |
|
| $ | 11.30 |
|
|
|
|
|
|
| ||
Total return |
|
|
| 11.11 | %(b) |
|
Ratios/Supplemental Data |
|
|
|
|
|
|
Net Assets at end of period (000) |
|
| $ | 111 |
|
|
Ratio of total expenses to average net assets: |
|
|
|
|
|
|
Before waivers and/or expense reimbursements |
|
|
| 1.92 | %(c) |
|
After waivers and/or expense reimbursements |
|
|
| 1.60 | %(c) |
|
Ratio of net investment income to average net assets |
|
|
| (1.34 | )%(c) |
|
Portfolio turnover rate (d) |
|
|
| 29 | % |
|
|
|
|
| ||
|
| |
(a) | Class A commenced operations on December 30, 2011. | |
|
| |
(b) | Not annualized. | |
|
| |
(c) | Annualized. | |
|
| |
(d) | Portfolio turnover is calculated on the basis of the Fund as a whole, without distinguishing between classes of shares issued. | |
The accompanying notes are an integral part of these financial statements.
95
|
Alpine Mutual Funds |
Financial Highlights—Continued
(For a share outstanding throughout each year)
|
|
|
|
|
|
|
|
|
|
|
|
|
|
|
|
|
|
| Innovators Fund |
| |||||||||||||
|
|
| ||||||||||||||
|
| Year Ended October 31, |
| |||||||||||||
|
|
| ||||||||||||||
|
| 2012 |
| 2011 |
| 2010 |
| 2009 |
| 2008 |
| |||||
|
|
|
|
|
|
| ||||||||||
Institutional Class Shares: |
|
|
|
|
|
|
|
|
|
|
|
|
|
|
|
|
Net asset value per share, beginning of year |
| $ | 10.48 |
| $ | 10.14 |
| $ | 8.13 |
| $ | 6.83 |
| $ | 14.08 |
|
|
|
|
|
|
|
| ||||||||||
Income from investment operations: |
|
|
|
|
|
|
|
|
|
|
|
|
|
|
|
|
Net investment income (loss) |
|
| (0.13 | ) |
| (0.11 | ) |
| (0.10 | ) |
| — | (a) |
| (0.01 | )(a) |
Net realized and unrealized gains (losses) on investments |
|
| 0.98 |
|
| 0.45 |
|
| 2.11 |
|
| 1.30 |
|
| (6.84 | ) |
|
|
|
|
|
|
| ||||||||||
Total from investment operations |
|
| 0.85 |
|
| 0.34 |
|
| 2.01 |
|
| 1.30 |
|
| (6.85 | ) |
|
|
|
|
|
|
| ||||||||||
Redemption fees |
|
| 0.00 | (b) |
| 0.00 | (b) |
| 0.00 | (b) |
| 0.00 | (b) |
| 0.03 |
|
Less distributions: |
|
|
|
|
|
|
|
|
|
|
|
|
|
|
|
|
From net investment income |
|
| — |
|
| — |
|
| — |
|
| — |
|
| (0.02 | ) |
From net realized gains on investments |
|
| — |
|
| — |
|
| — |
|
| — |
|
| (0.41 | ) |
|
|
|
|
|
|
| ||||||||||
Total distributions |
|
| — |
|
| — |
|
| — |
|
| — |
|
| (0.43 | ) |
|
|
|
|
|
|
| ||||||||||
Net asset value per share, end of year |
| $ | 11.33 |
| $ | 10.48 |
| $ | 10.14 |
| $ | 8.13 |
| $ | 6.83 |
|
|
|
|
|
|
|
| ||||||||||
Total return |
|
| 8.11 | % |
| 3.35 | % |
| 24.72 | % |
| 19.03 | % |
| (49.95 | )% |
Ratios/Supplemental Data: |
|
|
|
|
|
|
|
|
|
|
|
|
|
|
|
|
Net Assets at end of year (000) |
| $ | 10,877 |
| $ | 10,383 |
| $ | 11,847 |
| $ | 11,108 |
| $ | 15,383 |
|
Ratio of total expenses to average net assets: |
|
|
|
|
|
|
|
|
|
|
|
|
|
|
|
|
Before waivers and/or expense reimbursements |
|
| 1.67 | % |
| 1.59 | % |
| 1.70 | % |
| 1.86 | % |
| 1.31 | % |
After waivers and/or expense reimbursements |
|
| 1.36 | % |
| 1.41 | % |
| 1.44 | % |
| 1.54 | % |
| 1.35 | % |
Ratio of interest expense to average net assets |
|
| 0.01 | % |
| 0.06 | % |
| 0.09 | % |
| 0.19 | % |
| 0.04 | % |
Ratio of expenses to average net assets excluding interest expense: |
|
|
|
|
|
|
|
|
|
|
|
|
|
|
|
|
Before waivers and/or expense reimbursements |
|
| 1.66 | % |
| 1.53 | % |
| 1.61 | % |
| 1.67 | % |
| 1.27 | % |
After waivers and/or expense reimbursements |
|
| 1.35 | % |
| 1.35 | % |
| 1.35 | % |
| 1.35 | % |
| 1.31 | % |
Ratio of net investment income to average net assets |
|
| (1.07 | )% |
| (0.97 | )% |
| (1.01 | )% |
| (0.92 | )% |
| (0.18 | )% |
Portfolio turnover (c) |
|
| 29 | % |
| 18 | % |
| 22 | % |
| 20 | % |
| 76 | % |
|
|
|
| ||
|
| |
(a) | Net investment income per share is calculated using ending balances after consideration of adjustments for permanent book and tax differences. | |
|
| |
(b) | The amount is less than $0.005 per share. | |
|
| |
(c) | Portfolio turnover is calculated on the basis of the Fund as a whole, without distinguishing between classes of shares issued. | |
The accompanying notes are an integral part of these financial statements.
96
|
Alpine Mutual Funds |
Financial Highlights—Continued
(For a share outstanding throughout the period)
|
|
|
|
|
|
|
|
| Transformations |
| |||
|
|
| ||||
|
| Period Ended |
| |||
|
|
| ||||
Class A Shares: |
|
|
|
|
|
|
Net asset value per share, beginning of period |
|
| $ | 11.22 |
|
|
|
|
|
|
| ||
Income from investment operations: |
|
|
|
|
|
|
Net investment loss |
|
|
| (0.09 | ) |
|
Net realized and unrealized gain on investments |
|
|
| 0.57 |
|
|
|
|
|
|
| ||
Total from investment operations |
|
|
| 0.48 |
|
|
|
|
|
|
| ||
Redemption fees |
|
|
| 0.00 | (b) |
|
Less distributions: |
|
|
|
|
|
|
From net investment income |
|
|
| — |
|
|
From tax return of capital |
|
|
| — |
|
|
|
|
|
|
| ||
Total distributions |
|
|
| — |
|
|
|
|
|
|
| ||
Net asset value per share, end of period |
|
| $ | 11.70 |
|
|
|
|
|
|
| ||
Total return |
|
|
| 4.28 | %(c) |
|
Ratios/Supplemental Data |
|
|
|
|
|
|
Net Assets at end of period (000) |
|
| $ | 104 |
|
|
Ratio of total expenses to average net assets: |
|
|
|
|
|
|
Before waivers and/or expense reimbursements |
|
|
| 2.27 | %(d) |
|
After waivers and/or expense reimbursements |
|
|
| 1.60 | %(d) |
|
Ratio of interest expense to average net assets |
|
|
| 0.00 | %(d) |
|
Ratio of expenses to average net assets excluding interest expense: |
|
|
|
|
|
|
Before waivers and/or expense reimbursements |
|
|
| 2.27 | %(d) |
|
After waivers and/or expense reimbursements |
|
|
| 1.60 | %(d) |
|
Ratio of net investment income to average net assets |
|
|
| (0.85 | )%(d) |
|
Portfolio turnover rate (e). |
|
|
| 63 | % |
|
|
|
|
| ||
(a) | Class A commenced operations on December 30, 2011. | |
|
| |
(b) | The amount is less than $0.005 per share. | |
|
| |
(c) | Not annualized. | |
|
| |
(d) | Annualized. | |
|
| |
(e) | Portfolio turnover is calculated on the basis of the Fund as a whole, without distinguishing between classes of shares issued. | |
The accompanying notes are an integral part of these financial statements.
97
|
Alpine Mutual Funds |
Financial Highlights—Continued
(For a share outstanding throughout each period)
|
|
|
|
|
|
|
|
|
|
|
|
|
|
|
|
|
|
|
|
| Transformations Fund |
| |||||||||||||||
|
|
| ||||||||||||||||
|
| Year Ended October 31, |
| Period |
| |||||||||||||
|
|
|
| |||||||||||||||
|
|
|
|
| ||||||||||||||
|
| 2012 |
| 2011 |
| 2010 |
| 2009 |
|
| ||||||||
|
|
|
|
|
|
|
|
| ||||||||||
Institutional Class Shares: |
|
|
|
|
|
|
|
|
|
|
|
|
|
|
|
| ||
Net asset value per share, beginning of period |
| $ | 11.75 |
| $ | 10.30 |
| $ | 7.68 |
| $ | 5.79 |
|
| $ | 10.00 |
|
|
|
|
|
|
|
|
|
|
| ||||||||||
Income from investment operations: |
|
|
|
|
|
|
|
|
|
|
|
|
|
|
|
|
|
|
Net investment income (loss) |
|
| (0.07 | ) |
| (0.07 | ) |
| (0.06 | ) |
| 0.01 | (b) |
|
| 0.03 | (b) |
|
Net realized and unrealized gains (losses) on investments |
|
| 0.05 |
|
| 1.52 |
|
| 2.68 |
|
| 1.92 |
|
|
| (4.24 | ) |
|
|
|
|
|
|
|
|
|
| ||||||||||
Total from investment operations |
|
| (0.02 | ) |
| 1.45 |
|
| 2.62 |
|
| 1.93 |
|
|
| (4.21 | ) |
|
|
|
|
|
|
|
|
|
| ||||||||||
Redemption fees |
|
| 0.00 | (c) |
| 0.00 | (c) |
| 0.00 | (c) |
| 0.00 | (c) |
|
| 0.00 | (c) |
|
Less distributions: |
|
|
|
|
|
|
|
|
|
|
|
|
|
|
|
|
|
|
From net investment income |
|
| — |
|
| — |
|
| — |
|
| (0.03 | ) |
|
| — |
|
|
From tax return of capital |
|
| — |
|
| — |
|
| — |
|
| (0.01 | ) |
|
| — |
|
|
|
|
|
|
|
|
|
|
| ||||||||||
Total distributions |
|
| — |
|
| — |
|
| — |
|
| (0.04 | ) |
|
| — |
|
|
|
|
|
|
|
|
|
|
| ||||||||||
Net asset value per share, end of period |
| $ | 11.73 |
| $ | 11.75 |
| $ | 10.30 |
| $ | 7.68 |
|
| $ | 5.79 |
|
|
|
|
|
|
|
|
|
|
| ||||||||||
Total return |
|
| (0.17 | )% |
| 14.08 | % |
| 34.11 | % |
| 33.61 | % |
|
| (42.10 | )%(d) |
|
Ratios/Supplemental Data: |
|
|
|
|
|
|
|
|
|
|
|
|
|
|
|
|
|
|
Net Assets at end of period (000) |
| $ | 6,070 |
| $ | 6,267 |
| $ | 5,294 |
| $ | 3,514 |
|
| $ | 2,649 |
|
|
Ratio of total expenses to average net assets: |
|
|
|
|
|
|
|
|
|
|
|
|
|
|
|
|
|
|
Before waivers and/or expense reimbursements |
|
| 1.98 | % |
| 1.68 | % |
| 2.17 | % |
| 2.86 | % |
|
| 2.95 | %(e) |
|
After waivers and/or expense reimbursements |
|
| 1.35 | % |
| 1.35 | % |
| 1.37 | % |
| 1.35 | % |
|
| 1.35 | %(e) |
|
Ratio of interest expense to average net assets |
|
| 0.00 | %(c) |
| 0.00 | %(c) |
| 0.02 | % |
| 0.00 | %(c) |
|
| 0.00 | % |
|
Ratio of expenses to average net assets excluding interest expense: |
|
|
|
|
|
|
|
|
|
|
|
|
|
|
|
|
|
|
Before waivers and/or expense reimbursements |
|
| 1.98 | % |
| 1.68 | % |
| 2.15 | % |
| 2.86 | % |
|
| 2.95 | %(e) |
|
After waivers and/or expense reimbursements |
|
| 1.35 | % |
| 1.35 | % |
| 1.35 | % |
| 1.35 | % |
|
| 1.35 | %(e) |
|
Ratio of net investment income to average net assets |
|
| (0.58 | )% |
| (0.60 | )% |
| (0.68 | )% |
| (0.16 | )% |
|
| 0.44 | %(e) |
|
Portfolio turnover (f) |
|
| 63 | % |
| 72 | % |
| 52 | % |
| 57 | % |
|
| 108 | %(d) |
|
|
|
|
| ||
(a) | For the period from December 31, 2007 (inception of the fund) to October 31, 2008. | |
|
| |
(b) | Net investment income per share is calculated using ending balances after consideration of adjustments for permanent book and tax differences. | |
|
| |
(c) | The amount is less than $0.005 per share or 0.005%. | |
|
| |
(d) | Not annualized. | |
|
| |
(e) | Annualized. | |
|
| |
(f) | Portfolio turnover is calculated on the basis of the Fund as a whole, without distinguishing between classes of shares issued. | |
The accompanying notes are an integral part of these financial statements.
98
|
Alpine Mutual Funds |
Financial Highlights—Continued
(For a share outstanding throughout the period)
|
|
|
|
|
|
|
|
| Foundation Fund |
| |||
|
|
| ||||
|
| Period Ended |
| |||
|
|
| ||||
Class A Shares: |
|
|
|
|
|
|
Net asset value per share, beginning of period |
|
| $ | 10.61 |
|
|
|
|
|
|
| ||
Income from investment operations: |
|
|
|
|
|
|
Net investment income |
|
|
| 0.14 |
|
|
Net realized and unrealized gain on investments |
|
|
| 0.85 |
|
|
|
|
|
|
| ||
Total from investment operations |
|
|
| 0.99 |
|
|
|
|
|
|
| ||
Redemption fees |
|
|
| — |
|
|
Less distributions: |
|
|
|
|
|
|
From net investment income |
|
|
| (0.13 | ) |
|
From net realized gains on investments. |
|
|
| — |
|
|
From tax return of capital |
|
|
| — |
|
|
|
|
|
|
| ||
Total distributions |
|
|
| (0.13 | ) |
|
|
|
|
|
| ||
Net asset value per share, end of period |
|
| $ | 11.47 |
|
|
|
|
|
|
| ||
Total return |
|
|
| 9.33 | %(b) |
|
Ratios/Supplemental Data |
|
|
|
|
|
|
Net Assets at end of period (000) |
|
| $ | 109 |
|
|
Ratio of total expenses to average net assets |
|
|
| 1.47 | %(c) |
|
Ratio of net investment income to average net assets |
|
|
| 1.49 | %(c) |
|
Portfolio turnover rate (d). |
|
|
| 36 | % |
|
|
|
|
| ||
(a) | Class A commenced operations on December 30, 2011. | |
|
| |
(b) | Not annualized. | |
|
| |
(c) | Annualized. | |
|
| |
(d) | Portfolio turnover is calculated on the basis of the Fund as a whole, without distinguishing between classes of shares issued. | |
The accompanying notes are an integral part of these financial statements.
99
|
Alpine Mutual Funds |
Financial Highlights—Continued
(For a share outstanding throughout each year)
|
|
|
|
|
|
|
|
|
|
|
|
|
|
|
|
|
|
| Foundation Fund |
| |||||||||||||
|
|
| ||||||||||||||
|
| Year Ended October 31, |
| |||||||||||||
|
|
| ||||||||||||||
|
| 2012 |
| 2011 |
| 2010 |
| 2009 |
| 2008 |
| |||||
|
|
|
|
|
|
| ||||||||||
Institutional Class Shares: |
|
|
|
|
|
|
|
|
|
|
|
|
|
|
|
|
Net asset value per share, beginning of year |
| $ | 10.61 |
| $ | 10.16 |
| $ | 8.88 |
| $ | 8.15 |
| $ | 13.55 |
|
|
|
|
|
|
|
| ||||||||||
Income from investment operations: |
|
|
|
|
|
|
|
|
|
|
|
|
|
|
|
|
Net investment income |
|
| 0.20 |
|
| 0.16 |
|
| 0.12 |
|
| 0.13 | (a) |
| 0.26 | (a) |
Net realized and unrealized gains (losses) on investments |
|
| 0.85 |
|
| 0.47 |
|
| 1.27 |
|
| 0.75 |
|
| (4.47 | ) |
|
|
|
|
|
|
| ||||||||||
Total from investment operations |
|
| 1.05 |
|
| 0.63 |
|
| 1.39 |
|
| 0.88 |
|
| (4.21 | ) |
|
|
|
|
|
|
| ||||||||||
Redemption fees |
|
| — |
|
| 0.00 | (b) |
| 0.00 | (b) |
| 0.00 | (b) |
| 0.00 | (b) |
Less distributions: |
|
|
|
|
|
|
|
|
|
|
|
|
|
|
|
|
From net investment income |
|
| (0.19 | ) |
| (0.18 | ) |
| (0.11 | ) |
| (0.13 | ) |
| (0.25 | ) |
From net realized gains on investments |
|
| — |
|
| — |
|
| — |
|
| — |
|
| (0.93 | ) |
From tax return of capital |
|
| — |
|
| — |
|
| — |
|
| (0.02 | ) |
| (0.01 | ) |
|
|
|
|
|
|
| ||||||||||
Total distributions |
|
| (0.19 | ) |
| (0.18 | ) |
| (0.11 | ) |
| (0.15 | ) |
| (1.19 | ) |
|
|
|
|
|
|
| ||||||||||
Net asset value per share, end of year |
| $ | 11.47 |
| $ | 10.61 |
| $ | 10.16 |
| $ | 8.88 |
| $ | 8.15 |
|
|
|
|
|
|
|
| ||||||||||
Total return |
|
| 9.95 | % |
| 6.19 | % |
| 15.77 | % |
| 11.03 | % |
| (33.63 | )% |
Ratios/Supplemental Data: |
|
|
|
|
|
|
|
|
|
|
|
|
|
|
|
|
Net Assets at end of year (000) |
| $ | 65,397 |
| $ | 61,701 |
| $ | 62,934 |
| $ | 55,230 |
| $ | 53,097 |
|
Ratio of total expenses to average net assets |
|
| 1.21 | % |
| 1.16 | % |
| 1.23 | % |
| 1.26 | % |
| 1.24 | % |
Ratio of interest expense to average net assets |
|
| — | % |
| — | % |
| — | % |
| 0.00 | %(b) |
| 0.90 | % |
Ratio of expenses to average net assets excluding interest expense |
|
| 1.21 | % |
| 1.16 | % |
| 1.23 | % |
| 1.26 | % |
| 1.15 | % |
Ratio of net investment income to average net assets |
|
| 1.79 | % |
| 1.46 | % |
| 1.22 | % |
| 1.65 | % |
| 2.35 | % |
Portfolio turnover (c) |
|
| 36 | % |
| 34 | % |
| 16 | % |
| 41 | % |
| 34 | % |
|
|
|
| ||
(a) | Net investment income per share is calculated using ending balances after consideration of adjustments for permanent book and tax differences. | |
|
| |
(b) | The amount is less than $0.005 per share or 0.005%. | |
|
| |
(c) | Portfolio turnover is calculated on the basis of the Fund as a whole, without distinguishing between classes of shares issued. | |
The accompanying notes are an integral part of these financial statements.
100
|
Alpine Mutual Funds |
Financial Highlights—Continued
(For a share outstanding throughout each year)
|
|
|
|
|
|
|
|
|
|
|
|
|
|
|
|
|
|
| Ultra Short Tax Optimized Income Fund |
| |||||||||||||
|
|
| ||||||||||||||
|
| Year Ended October 31, |
| |||||||||||||
|
|
| ||||||||||||||
|
| 2012 |
| 2011 |
| 2010 |
| 2009 |
| 2008 |
| |||||
|
|
|
|
|
|
| ||||||||||
Class A Shares: |
|
|
|
|
|
|
|
|
|
|
|
|
|
|
|
|
Net asset value per share, beginning of year |
| $ | 10.10 |
| $ | 10.10 |
| $ | 10.10 |
| $ | 10.05 |
| $ | 10.10 |
|
|
|
|
|
|
|
| ||||||||||
Income from investment operations: |
|
|
|
|
|
|
|
|
|
|
|
|
|
|
|
|
Net investment income |
|
| 0.07 |
|
| 0.16 |
|
| 0.10 |
|
| 0.30 | (a) |
| 0.38 | (a) |
Net realized and unrealized gain (loss) on investments |
|
| (0.00 | )(b) |
| (0.00 | )(b) |
| 0.01 |
|
| 0.04 |
|
| (0.04 | ) |
|
|
|
|
|
|
| ||||||||||
Total from investment operations |
|
| 0.07 |
|
| 0.16 |
|
| 0.11 |
|
| 0.34 |
|
| 0.34 |
|
|
|
|
|
|
|
| ||||||||||
Redemption fees |
|
| 0.00 | (b) |
| 0.00 | (b) |
| 0.00 | (b) |
| 0.00 | (b) |
| 0.00 | (b) |
Less distributions: |
|
|
|
|
|
|
|
|
|
|
|
|
|
|
|
|
From net investment income |
|
| (0.07 | ) |
| (0.16 | ) |
| (0.11 | ) |
| (0.29 | ) |
| (0.39 | ) |
|
|
|
|
|
|
| ||||||||||
Total distributions |
|
| (0.07 | ) |
| (0.16 | ) |
| (0.11 | ) |
| (0.29 | ) |
| (0.39 | ) |
|
|
|
|
|
|
| ||||||||||
Net asset value per share, end of year |
| $ | 10.10 |
| $ | 10.10 |
| $ | 10.10 |
| $ | 10.10 |
| $ | 10.05 |
|
|
|
|
|
|
|
| ||||||||||
Total return |
|
| 0.70 | % |
| 1.61 | % |
| 1.05 | % |
| 3.40 | % |
| 3.39 | % |
Ratios/Supplemental Data |
|
|
|
|
|
|
|
|
|
|
|
|
|
|
|
|
Net Assets at end of year (000) |
| $ | 443,598 |
| $ | 358,284 |
| $ | 292,565 |
| $ | 211,643 |
| $ | 11,568 |
|
Ratio of total expenses to average net assets |
|
|
|
|
|
|
|
|
|
|
|
|
|
|
|
|
Before waivers and/or expense reimbursements |
|
| 1.09 | % |
| 1.07 | % |
| 1.03 | % |
| 1.05 | % |
| 1.08 | % |
After waivers and/or expense reimbursements |
|
| 0.90 | % |
| 0.88 | % |
| 0.78 | % |
| 0.85 | % |
| 0.85 | % |
Ratio of net investment income to average net assets |
|
| 0.67 | % |
| 1.61 | % |
| 1.04 | % |
| 2.75 | % |
| 4.12 | % |
Portfolio turnover rate (c) |
|
| 192 | % |
| 174 | % |
| 19 | % |
| 16 | % |
| 129 | % |
|
|
|
| ||
(a) | Net investment income (loss) per share is calculated using ending balances after consideration of adjustments for permanent book and tax differences. | |
|
| |
(b) | The amount is less than $0.005 per share. | |
|
| |
(c) | Portfolio turnover is calculated on the basis of the Fund as a whole, without distinguishing between classes of shares issued. | |
|
| |
Effective January 3, 2012, the share class was renamed Class A. | ||
The accompanying notes are an integral part of these financial statements.
101
|
Alpine Mutual Funds |
Financial Highlights—Continued
(For a share outstanding throughout each year)
|
|
|
|
|
|
|
|
|
|
|
|
|
|
|
|
|
|
| Ultra Short Tax Optimized Income Fund |
| |||||||||||||
|
|
| ||||||||||||||
|
| Year Ended October 31, |
| |||||||||||||
|
|
| ||||||||||||||
|
| 2012 |
| 2011 |
| 2010 |
| 2009 |
| 2008 |
| |||||
|
|
|
|
|
|
| ||||||||||
Institutional Class Shares: |
|
|
|
|
|
|
|
|
|
|
|
|
|
|
|
|
Net asset value per share, beginning of year |
| $ | 10.05 |
| $ | 10.05 |
| $ | 10.05 |
| $ | 10.00 |
| $ | 10.04 |
|
|
|
|
|
|
|
| ||||||||||
Income from investment operations: |
|
|
|
|
|
|
|
|
|
|
|
|
|
|
|
|
Net investment income |
|
| 0.10 |
|
| 0.19 |
|
| 0.13 |
|
| 0.31 | (a) |
| 0.41 | (a) |
Net realized and unrealized gains (losses) on investments |
|
| (0.00 | )(b) |
| (0.00 | )(b) |
| (0.00 | )(b) |
| 0.05 |
|
| (0.04 | ) |
|
|
|
|
|
|
| ||||||||||
Total from investment operations |
|
| 0.10 |
|
| 0.19 |
|
| 0.13 |
|
| 0.36 |
|
| 0.37 |
|
|
|
|
|
|
|
| ||||||||||
Redemption fees |
|
| 0.00 | (b) |
| 0.00 | (b) |
| 0.00 | (b) |
| 0.00 | (b) |
| 0.00 | (b) |
Less distributions: |
|
|
|
|
|
|
|
|
|
|
|
|
|
|
|
|
From net investment income |
|
| (0.10 | ) |
| (0.19 | ) |
| (0.13 | ) |
| (0.31 | ) |
| (0.41 | ) |
|
|
|
|
|
|
| ||||||||||
Total distributions |
|
| (0.10 | ) |
| (0.19 | ) |
| (0.13 | ) |
| (0.31 | ) |
| (0.41 | ) |
|
|
|
|
|
|
| ||||||||||
Net asset value per share, end of year |
| $ | 10.05 |
| $ | 10.05 |
| $ | 10.05 |
| $ | 10.05 |
| $ | 10.00 |
|
|
|
|
|
|
|
| ||||||||||
Total return |
|
| 0.95 | % |
| 1.87 | % |
| 1.31 | % |
| 3.65 | % |
| 3.75 | % |
Ratios/Supplemental Data: |
|
|
|
|
|
|
|
|
|
|
|
|
|
|
|
|
Net Assets at end of year (000) |
| $ | 1,375,490 |
| $ | 1,265,829 |
| $ | 1,146,333 |
| $ | 1,462,217 |
| $ | 231,679 |
|
Ratio of total expenses to average net assets |
|
|
|
|
|
|
|
|
|
|
|
|
|
|
|
|
Before waivers and/or expense reimbursements |
|
| 0.84 | % |
| 0.82 | % |
| 0.78 | % |
| 0.80 | % |
| 0.83 | % |
After waivers and/or expense reimbursements |
|
| 0.65 | % |
| 0.63 | % |
| 0.53 | % |
| 0.60 | % |
| 0.60 | % |
Ratio of net investment income to average net assets |
|
| 0.95 | % |
| 1.86 | % |
| 1.29 | % |
| 3.00 | % |
| 4.37 | % |
Portfolio turnover (c) |
|
| 192 | % |
| 174 | % |
| 19 | % |
| 16 | % |
| 129 | % |
|
|
|
| ||
(a) | Net investment income (loss) per share is calculated using ending balances after consideration of adjustments for permanent book and tax differences. | |
|
| |
(b) | The amount is less than $0.005 per share. | |
|
| |
(c) | Portfolio turnover is calculated on the basis of the Fund as a whole, without distinguishing between classes of shares issued. | |
|
| |
Effective January 3, 2012, the share class was renamed the Institutional Class. | ||
The accompanying notes are an integral part of these financial statements.
102
|
Alpine Mutual Funds |
Financial Highlights—Continued
(For a share outstanding throughout each year)
|
|
|
|
|
|
|
|
|
|
|
|
|
|
|
|
|
|
| Municipal Money Market Fund |
| |||||||||||||
|
|
| ||||||||||||||
|
| Year Ended October 31, |
| |||||||||||||
|
|
| ||||||||||||||
|
| 2012 |
| 2011 |
| 2010 |
| 2009 |
| 2008 |
| |||||
|
|
|
|
|
|
| ||||||||||
Investor Class Shares: |
|
|
|
|
|
|
|
|
|
|
|
|
|
|
|
|
Net asset value per share, beginning of year |
| $ | 1.00 |
| $ | 1.00 |
| $ | 1.00 |
| $ | 1.00 |
| $ | 1.00 |
|
|
|
|
|
|
|
| ||||||||||
Income from investment operations: |
|
|
|
|
|
|
|
|
|
|
|
|
|
|
|
|
Net investment income |
|
| 0.00 | (a) |
| 0.00 | (a) |
| 0.00 | (a) |
| 0.01 | (b) |
| 0.03 | (b) |
|
|
|
|
|
|
| ||||||||||
Total from investment operations |
|
| 0.00 | (a) |
| 0.00 | (a) |
| 0.00 | (a) |
| 0.01 |
|
| 0.03 |
|
|
|
|
|
|
|
| ||||||||||
Less distributions: |
|
|
|
|
|
|
|
|
|
|
|
|
|
|
|
|
From net investment income |
|
| (0.00 | )(a) |
| (0.00 | )(a) |
| (0.00 | )(a) |
| (0.01 | ) |
| (0.03 | ) |
From net realized gains on investments |
|
| — |
|
| (0.00 | )(a) |
| — |
|
| — |
|
| — |
|
Tax return of capital |
|
| — |
|
| — |
|
| — |
|
| (0.00 | )(a) |
| — |
|
|
|
|
|
|
|
| ||||||||||
Total distributions |
|
| (0.00 | )(a) |
| (0.00 | )(a) |
| (0.00 | )(a) |
| (0.01 | ) |
| (0.03 | ) |
|
|
|
|
|
|
| ||||||||||
Net asset value per share, end of year |
| $ | 1.00 |
| $ | 1.00 |
| $ | 1.00 |
| $ | 1.00 |
| $ | 1.00 |
|
|
|
|
|
|
|
| ||||||||||
Total return |
|
| 0.10 | % |
| 0.18 | % |
| 0.20 | % |
| 1.03 | % |
| 2.94 | % |
Ratios/Supplemental Data: |
|
|
|
|
|
|
|
|
|
|
|
|
|
|
|
|
Net Assets at end of year (000) |
| $ | 228,642 |
| $ | 310,058 |
| $ | 470,169 |
| $ | 789,832 |
| $ | 664,401 |
|
Ratio of total expenses to average net assets |
|
|
|
|
|
|
|
|
|
|
|
|
|
|
|
|
Before waivers and/or expense reimbursements |
|
| 0.56 | % |
| 0.52 | % |
| 0.48 | % |
| 0.53 | % |
| 0.49 | % |
After waivers and/or expense reimbursements |
|
| 0.32 | % |
| 0.38 | % |
| 0.43 | % |
| 0.53 | % |
| 0.35 | % |
Ratio of interest expense to average net assets |
|
| 0.00 | % |
| 0.00 | % |
| 0.00 | % |
| 0.00 | %(a) |
| 0.00 | % |
Ratio of expenses to average net assets excluding interest expense |
|
|
|
|
|
|
|
|
|
|
|
|
|
|
|
|
Before waivers and/or expense reimbursements |
|
| 0.56 | % |
| 0.52 | % |
| 0.48 | % |
| 0.53 | % |
| 0.49 | % |
After waivers and/or expense reimbursements |
|
| 0.32 | % |
| 0.38 | % |
| 0.43 | % |
| 0.53 | % |
| 0.35 | % |
Ratio of net investment income to average net assets |
|
| 0.10 | % |
| 0.18 | % |
| 0.20 | % |
| 0.99 | % |
| 2.93 | % |
|
|
|
| ||
(a) | The amount is less than $0.005 per share or 0.005%. | |
|
| |
(b) | Net investment income per share is calculated using ending balances after consideration of adjustments for permanent book and tax differences. | |
Effective January 3, 2012, the Investor Class was renamed the Institutional Class and subsequently reverted to the Investor Class effective July 26, 2012.
The accompanying notes are an integral part of these financial statements.
103
|
Alpine Mutual Funds |
Notes to Financial Statements
October 31, 2012
|
|
1. | Organization: |
|
|
| Alpine Series Trust (the “Series Trust”) was organized in 2001 as a Delaware Statutory Trust, and is registered under the Investment Company Act of 1940, as amended (the “1940 Act”), as an open-end management investment company. Alpine Income Trust (the “Income Trust”) was organized in 2002 as a Delaware statutory trust, and is registered under the 1940 Act, as an open-end management investment company. The Alpine Dynamic Dividend Fund, Alpine Accelerating Dividend Fund, Alpine Financial Services Fund (formerly, Alpine Dynamic Financial Services Fund), Alpine Innovators Fund (formerly, Alpine Dynamic Innovators Fund), Alpine Transformations Fund (formerly, Alpine Dynamic Transformations Fund) and Alpine Foundation Fund (formerly, Alpine Dynamic Balance Fund) are six separate funds of the Series Trust. The Alpine Ultra Short Tax Optimized Income Fund and Alpine Municipal Money Market Fund are two separate funds of the Income Trust. The Alpine Dynamic Dividend Fund, Alpine Accelerating Dividend Fund, Alpine Financial Services Fund, Alpine Innovators Fund, Alpine Transformations Fund, Alpine Foundation Fund, Alpine Ultra Short Tax Optimized Income Fund and Alpine Municipal Money Market Fund (individually referred to as a “Fund” and collectively, “the Funds”) are diversified funds. Alpine Woods Capital Investors, LLC (the “Adviser”) is a Delaware limited liability company and serves as the investment manager to the Funds. |
|
|
2. | Significant Accounting Policies: |
|
|
| The following is a summary of significant accounting policies consistently followed by the Funds in the preparation of their financial statements. The policies are in conformity with accounting principles generally accepted in the United States of America (“GAAP”), which require management to make estimates and assumptions that affect amounts reported herein. Actual results could differ from those estimates. Changes in the economic environment financial markets and any other parameters used in determining these estimates could cause actual results to differ. |
|
|
| A. Valuation of Securities: |
|
|
| The net asset value (“NAV”) of shares of the Funds are calculated by dividing the value of the Funds’ net assets by the number of outstanding shares. NAV is determined each day the New York Stock Exchange (“NYSE”) is open as of the close of regular trading (normally, 4:00 p.m., Eastern time). In computing NAV, portfolio securities of the Funds are valued at their current market values determined on the basis of market quotations or if market quotations are not available or determined to be reliable, through procedures and/or guidelines established by the Board of Trustees. In computing the Funds’ net asset values, equity securities that are traded on a securities exchange in the United States are valued at the last reported sale price as of the time of valuation, or lacking any current reported sale at the time of valuation, at the mean between the most recent bid and asked quotations. Each option security traded on a securities exchange in the United States is valued at the last current reported sale price as of the time of valuation, or lacking any current reported sale at the time of valuation, the option is valued at the mid-point of the consolidated bid/ask quote for the option security. Forward currency contracts are valued based on third-party vendor quotations. Each security traded in the over-the-counter market and quoted on the NASDAQ National Market System, is valued at the NASDAQ Official Closing Price (“NOCP”), as determined by NASDAQ, or lacking an NOCP, the last current reported sale price as of the time of valuation by NASDAQ, or lacking any current reported sale on NASDAQ at the time of valuation, at the mean between the most recent bid and asked quotations. Each over-the-counter option that is not traded through the Options Clearing Corporation is valued by the counterparty, or if the counterparty’s price is not readily available then by using the Black-Scholes method. Debt securities are valued based on an evaluated mean price as furnished by pricing services approved by the Board of Trustees, which may be based on market transactions for comparable securities and various relationships between securities that are generally recognized by institutional traders, a computerized matrix system, or appraisals derived from information concerning the securities or similar securities received from recognized dealers in those securities. Short-term securities with maturities of 60 days or less are valued at amortized cost, which approximates fair value. |
|
|
| Equity securities that are principally traded in a foreign market are valued at the last current sale price at the time of valuation or lacking any current or reported sale, at the time of valuation, at the mean between the most recent bid and asked quotations as of the close of the appropriate exchange or other designated time. |
104
|
Alpine Mutual Funds |
Notes to Financial Statements—Continued
October 31, 2012
|
|
| Trading in securities on European and Far Eastern securities exchanges and over-the-counter markets is normally completed at various times before the close of business on each day on which the NYSE is open. Trading of these securities may not take place on every NYSE business day. In addition, trading may take place in various foreign markets on Saturdays or on other days when the NYSE is not open and on which the Funds’ net asset values are not calculated. As stated above, if the market prices are not readily available or not reflective of the fair value of the security, as of the close of the regular trading on the NYSE, the security will be priced at fair value following procedures approved by the Board of Trustees. |
|
|
| When market quotations are not readily available or when the valuation methods mentioned above are not reflective of a fair value of the security, the security is valued at fair value following procedures and/or guidelines approved by the Board of Trustees. The Board has approved the use of Interactive Data’s proprietary fair value pricing model to assist in determining current valuation for foreign securities traded in markets that close prior to the NYSE. When fair value pricing is employed, the value of the portfolio security used to calculate the Fund’s net asset values may differ from quoted or official closing prices. |
|
|
| As of October 31, 2012, the Dynamic Dividend Fund held a security that is fair valued, which comprised 0.1% of the Fund’s net assets. |
|
|
| The Municipal Money Market Fund values its investments at amortized cost, which approximates market value. Pursuant to Rule 2a-7 under the 1940 Act, amortized cost, as defined, is a method of valuing securities at acquisition cost, adjusted for amortization of premium or accretion of discount rather than at their value based on current market factors. |
|
|
| The Funds’ have adopted Financial Accounting Standards Board (“FASB”) Codification Topic 820 (“ASC Topic 820”). ASC Topic 820 establishes a single definition of fair value, creates a three-tier hierarchy as a framework for measuring fair value based on inputs used to value the Funds’ investments, and requires additional disclosure about fair value. The hierarchy of inputs is summarized below. |
|
|
|
|
|
|
| • | Level 1 — | quoted prices in active markets for identical investments |
|
|
|
| |
|
| • | Level 2 — | other significant observable inputs (including quoted prices for similar investments, interest rates, prepayment speeds, credit risk, etc.) |
|
|
|
| |
|
| • | Level 3 — | significant unobservable inputs (including the Fund’s own assumptions in determining the fair value of investments) |
|
|
| The inputs or methodology used for valuing securities are not necessarily an indication of the risk associated with investing in those securities. |
|
|
| The Funds use valuation techniques to measure fair value that are consistent with the market approach and/or income approach, depending on the type of security and the particular circumstance. The market approach uses prices and other relevant information generated by market transactions involving identical or comparable securities. The income approach uses valuation techniques to discount estimated future cash flows to present value. |
105
|
Alpine Mutual Funds |
Notes to Financial Statements—Continued
October 31, 2012
The following is a summary of the inputs used in valuing the Fund’s assets and liabilities carried at fair value:
|
|
|
|
|
|
|
|
|
|
|
|
|
|
|
|
| Valuation Inputs |
|
|
|
| ||||||||
|
|
|
|
|
| |||||||||
Dynamic Dividend Fund |
| Level 1 |
| Level 2 |
| Level 3 |
| Total Value |
| |||||
|
|
|
|
|
| |||||||||
Common Stocks |
|
|
|
|
|
|
|
|
|
|
|
|
| |
Australia |
| $ | 8,053,588 |
| $ | — |
| $ | — |
| $ | 8,053,588 |
| |
Brazil |
|
| 3,061,099 |
|
| — |
|
| — |
|
| 3,061,099 |
| |
Canada |
|
| 11,407,867 |
|
| — |
|
| — |
|
| 11,407,867 |
| |
China |
|
| — |
|
| — |
|
| 287,601 |
|
| 287,601 |
| |
France |
|
| 752,369 |
|
| — |
|
| — |
|
| 752,369 |
| |
Hong Kong |
|
| 8,386,939 |
|
| — |
|
| — |
|
| 8,386,939 |
| |
Ireland |
|
| 2,832,618 |
|
| — |
|
| — |
|
| 2,832,618 |
| |
Japan |
|
| 3,030,941 |
|
| — |
|
| — |
|
| 3,030,941 |
| |
Mexico |
|
| 1,087,230 |
|
| — |
|
| — |
|
| 1,087,230 |
| |
Netherlands |
|
| 800,586 |
|
| — |
|
| — |
|
| 800,586 |
| |
Norway |
|
| 13,495,700 |
|
| — |
|
| — |
|
| 13,495,700 |
| |
Singapore |
|
| 5,661,441 |
|
| — |
|
| — |
|
| 5,661,441 |
| |
Sweden |
|
| 2,147,545 |
|
| — |
|
| — |
|
| 2,147,545 |
| |
Switzerland |
|
| 4,907,186 |
|
| — |
|
| — |
|
| 4,907,186 |
| |
Turkey |
|
| 1,343,068 |
|
| — |
|
| — |
|
| 1,343,068 |
| |
United Kingdom |
|
| 14,278,234 |
|
| — |
|
| — |
|
| 14,278,234 |
| |
United States |
|
| 256,476,158 |
|
| — |
|
| — |
|
| 256,476,158 |
| |
Convertible Bonds |
|
| — |
|
| 272,753 |
|
| — |
|
| 272,753 |
| |
Short-Term Investments |
|
| — |
|
| 4,822,000 |
|
| — |
|
| 4,822,000 |
| |
|
|
|
|
|
| |||||||||
Total |
| $ | 337,722,569 |
| $ | 5,094,753 |
| $ | 287,601 |
| $ | 343,104,923 |
| |
|
|
|
|
|
| |||||||||
|
|
|
|
|
|
|
|
|
|
|
|
|
|
|
|
| Valuation Inputs |
|
|
|
| ||||||||
|
|
|
|
|
| |||||||||
Accelerating Dividend Fund * |
| Level 1 |
| Level 2 |
| Level 3 |
| Total Value |
| |||||
|
|
|
|
|
| |||||||||
Common Stocks |
| $ | 2,256,490 |
| $ | — |
| $ | — |
| $ | 2,256,490 |
| |
Short-Term Investments |
|
| — |
|
| 154,000 |
|
| — |
|
| 154,000 |
| |
|
|
|
|
|
| |||||||||
Total |
| $ | 2,256,490 |
| $ | 154,000 |
| $ | — |
| $ | 2,410,490 |
| |
|
|
|
|
|
| |||||||||
|
|
|
|
|
|
|
|
|
|
|
|
|
|
|
|
| Valuation Inputs |
|
|
|
| ||||||||
|
|
|
|
|
| |||||||||
Financial Services Fund |
| Level 1 |
| Level 2 |
| Level 3 |
| Total Value |
| |||||
|
|
|
|
|
| |||||||||
Common Stocks |
|
|
|
|
|
|
|
|
|
|
|
|
| |
Capital Markets |
| $ | 958,266 |
| $ | — |
| $ | — |
| $ | 958,266 |
| |
Commercial Banks |
|
| 4,045,918 |
|
| 110,272 |
|
| — |
|
| 4,156,190 |
| |
Consumer Finance |
|
| 460,949 |
|
| — |
|
| — |
|
| 460,949 |
| |
Diversified Financial Services |
|
| 967,218 |
|
| — |
|
| — |
|
| 967,218 |
| |
Industrial Conglomerates |
|
| 126,360 |
|
| — |
|
| — |
|
| 126,360 |
| |
Insurance |
|
| 95,855 |
|
| — |
|
| — |
|
| 95,855 |
| |
Real Estate Investment Trusts (REITs) |
|
| 284,100 |
|
| — |
|
| — |
|
| 284,100 |
| |
Thrifts & Mortgage Finance |
|
| 1,097,894 |
|
| — |
|
| — |
|
| 1,097,894 |
| |
Trading Companies & Distributors |
|
| 174,224 |
|
| — |
|
| — |
|
| 174,224 |
| |
Preferred Stocks |
|
| 42,628 |
|
| — |
|
| — |
|
| 42,628 |
| |
Investment Companies |
|
| 309,694 |
|
| — |
|
| — |
|
| 309,694 |
| |
Rights |
|
| — |
|
| 2,556 |
|
| — |
|
| 2,556 |
| |
Short-Term Investments |
|
| — |
|
| 1,492,000 |
|
| — |
|
| 1,492,000 |
| |
|
|
|
|
|
| |||||||||
Total |
| $ | 8,563,106 |
| $ | 1,604,828 |
| $ | — |
| $ | 10,167,934 |
| |
|
|
|
|
|
| |||||||||
106
|
Alpine Mutual Funds |
Notes to Financial Statements—Continued
October 31, 2012
|
|
|
|
|
|
|
|
|
|
|
|
|
|
| |
|
| Valuation Inputs |
|
|
|
| |||||||||
|
|
|
|
|
| ||||||||||
Innovators Fund * |
| Level 1 |
| Level 2 |
| Level 3 |
| Total Value |
| ||||||
|
|
|
|
|
| ||||||||||
Common Stocks |
| $ | 10,545,951 |
| $ | — |
| $ | — |
| $ | 10,545,951 |
| ||
Short-Term Investments |
|
| — |
|
| 578,000 |
|
| — |
|
| 578,000 |
| ||
|
|
|
|
|
| ||||||||||
Total |
| $ | 10,545,951 |
| $ | 578,000 |
| $ | — |
| $ | 11,123,951 |
| ||
|
|
|
|
|
| ||||||||||
|
|
|
|
|
|
|
|
|
|
|
|
|
|
| |
|
| Valuation Inputs |
|
|
|
| |||||||||
|
|
|
|
|
| ||||||||||
Transformations Fund * |
| Level 1 |
| Level _2 |
| Level 3 |
| Total Value |
| ||||||
|
|
|
|
|
| ||||||||||
Common Stocks |
| $ | 5,925,593 |
| $ | — |
| $ | — |
| $ | 5,925,593 |
| ||
Short-Term Investments |
|
| — |
|
| 206,000 |
|
| — |
|
| 206,000 |
| ||
|
|
|
|
|
| ||||||||||
Total |
| $ | 5,925,593 |
| $ | 206,000 |
| $ | — |
| $ | 6,131,593 |
| ||
|
|
|
|
|
| ||||||||||
|
|
|
|
|
|
|
|
|
|
|
|
|
|
| |
|
| Valuation Inputs |
|
|
|
| |||||||||
|
|
|
|
|
| ||||||||||
Foundation Fund * |
| Level 1 |
| Level 2 |
| Level 3 |
| Total Value |
| ||||||
|
|
|
|
|
| ||||||||||
Common Stocks |
| $ | 47,041,823 |
| $ | — |
| $ | — |
| $ | 47,041,823 |
| ||
Bonds |
|
| — |
|
| 14,322,188 |
|
| — |
|
| 14,322,188 |
| ||
Short-Term Investments |
|
| — |
|
| 3,831,000 |
|
| — |
|
| 3,831,000 |
| ||
|
|
|
|
|
| ||||||||||
Total |
| $ | 47,041,823 |
| $ | 18,153,188 |
| $ | — |
| $ | 65,195,011 |
| ||
|
|
|
|
|
| ||||||||||
|
|
|
|
|
|
|
|
|
|
| ||||
|
| Valuation Inputs |
|
|
|
| ||||||||
|
|
|
|
|
| |||||||||
Ultra Short Tax Optimized Income Fund * |
| Level 1 |
| Level 2 |
| Level 3 |
| Total Value |
| |||||
|
|
|
|
|
| |||||||||
Municipal Bonds |
| $ | — |
| $ | 1,811,829,732 |
| $ | — |
| $ | 1,811,829,732 |
| |
Money Market Funds |
|
| — |
|
| 65,078 |
|
| — |
|
| 65,078 |
| |
Short-Term Investments |
|
| — |
|
| 106,565,000 |
|
| — |
|
| 106,565,000 |
| |
|
|
|
|
|
| |||||||||
Total |
| $ | — |
| $ | 1,918,459,810 |
| $ | — |
| $ | 1,918,459,810 |
| |
|
|
|
|
|
| |||||||||
|
|
|
|
|
|
|
|
|
|
|
|
|
|
|
|
| Valuation Inputs |
|
|
|
| ||||||||
|
|
|
|
|
| |||||||||
Municipal Money Market Fund * |
| Level 1 |
| Level 2 |
| Level 3 |
| Total Value |
| |||||
|
|
|
|
|
| |||||||||
Municipal Bonds |
| $ | — |
| $ | 228,382,496 |
| $ | — |
| $ | 228,382,496 |
| |
Money Market Funds |
|
| — |
|
| 31,815 |
|
| — |
|
| 31,815 |
| |
|
|
|
|
|
| |||||||||
Total |
| $ | — |
| $ | 228,414,311 |
| $ | — |
| $ | 228,414,311 |
| |
|
|
|
|
|
| |||||||||
|
|
|
| * | For detailed country, sector, and state descriptions, see accompanying Schedule of Portfolio Investments. |
|
|
|
|
| The following table shows transfers between Level 1 and Level 2: |
|
|
|
|
|
|
|
|
|
|
|
|
|
|
|
| Transfers In* |
| Transfers Out* |
| ||||||||
|
|
|
| ||||||||||
|
| Level 1 |
| Level 2 |
| Level 1 |
| Level 2 |
| ||||
|
|
|
|
|
| ||||||||
Dynamic Dividend Fund |
| $ | 7,047,385 |
| $ | — |
| $ | — |
| $ | (7,047,385 | ) |
Accelerating Dividend Fund |
|
| 42,782 |
|
| — |
|
| — |
|
| (42,782 | ) |
Financial Services Fund |
|
| 261,877 |
|
| — |
|
| — |
|
| (261,877 | ) |
|
|
|
| * | The Funds recognize transfers between Levels based on values as of the beginning of the year. The transfers were due to the fair valuation, in accordance with procedures approved by the Board of Trustees, as of October 31, 2011 of certain securities due to developments that occurred between the time of the close of the foreign markets on which they trade and the close of regular session trading on the NYSE. No such fair valuation was required on October 31, 2012. |
107
|
Alpine Mutual Funds |
Notes to Financial Statements—Continued
October 31, 2012
Following is a reconciliation of Level 3 assets for which significant unobservable inputs were used to determine fair value:
|
|
|
|
|
|
|
|
|
| Dynamic |
| Financial |
| ||
|
|
|
| ||||
Balance as of October 31, 2011 |
| $ | — |
| $ | 251 |
|
Accrued discounts / premiums |
|
| — |
|
| — |
|
Realized loss |
|
| (265,954 | ) |
| (144,034 | ) |
Change in unrealized appreciation (depreciation) |
|
| (2,778,690 | ) |
| 149,024 |
|
Purchases |
|
| — |
|
| — |
|
Sales |
|
| (154,436 | ) |
| (5,241 | ) |
Transfers in to Level 3*,** |
|
| 3,486,681 |
|
| — |
|
Transfers out of Level 3** |
|
| — |
|
| — |
|
|
|
|
| ||||
Balance as of October 31, 2012 |
| $ | 287,601 |
| $ | — |
|
|
|
|
| ||||
Change in net unrealized appreciation (depreciation) on level 3 holdings held at year end |
| $ | (2,778,690 | ) | $ | — |
|
|
|
|
| ||||
|
|
|
| ||
* The transfer into level 3 pertains to Daqing Dairy. The company’s auditor resigned on March 21, 2012 and the company’s shares have not traded since that time. Prior to the suspension of trading, the shares had declined by approximately 12%. The majority of the decline in value during the period is attributable to a 90% discount taken due to the Fund’s concerns about the company’s disclosures, issues raised by the Daqing’s former auditors and recent disclosures related to the company’s operations. The value at October 31, 2012 includes significant unobservable inputs. Due to the uncertainty described above, the realization of the value of the position may be substantially different than the reported value. Furthermore, the value of the position may change substantially in the future as the Fund considers additional information as it becomes available. | ||
|
|
|
** The Funds recognize transfers as of the beginning of the year. | ||
|
|
|
| The following table shows the valuation techniques and significant amounts of unobservable inputs used in the fair value measurement of the Funds’ Level 3 investments, as of October 31, 2012: | |
Dynamic Dividend Fund
|
|
|
|
|
|
|
|
|
|
|
|
|
|
Asset |
|
| Fair Value at |
| Significant |
| Significant |
| Range |
| Weighted |
| Relationship |
|
|
|
|
|
|
| |||||||
Common Stocks |
| 287,601 |
| Discount on |
| Adjustment to |
| 41% |
| 41% |
| Fair Value would | |
|
|
|
|
| Depreciation |
| 8.9% |
| 8.9% |
| Fair Value would | ||
|
|
|
|
|
| Distressed Asset |
| 49% |
| 49% |
| Fair Value would | |
The significant unobservable input used in the fair value measurement of common stocks is the liquidity discounts. Other market indicators are also considered. Changes in any of those inputs would result in lower or higher fair value measurement.
B. Security Transactions and Investment Income:
Security transactions are accounted for on a trade date basis. Realized gains and losses are computed on the identified cost basis. Interest income is recorded on the accrual basis and includes accretion of discounts and amortization of premiums, where applicable. To the extent any issuer defaults or a credit event occurs that impacts the issuer, the Funds’ may halt any additional interest income accruals and consider the realizability of interest accrued up to the date of default or credit event. Dividend income is recorded on the ex-dividend date or in the case
108
|
Alpine Mutual Funds |
Notes to Financial Statements—Continued
October 31, 2012
of some foreign securities, on the date thereafter when the Funds are made aware of the dividend. Foreign income may be subject to foreign withholding taxes, which are accrued as applicable. Capital gains realized on some foreign securities are subject to foreign taxes, which are accrued as applicable. Dividends and interest from non-U.S. sources received by the Funds are generally subject to non-U.S. withholding taxes at rates ranging up to 30%. Such withholding taxes may be reduced or eliminated under the terms of applicable U.S. income tax treaties, and the Funds intend to undertake any procedural steps required to claim the benefits of such treaties.
C. Line of Credit and Custody Overdrafts:
On December 1, 2010 the Trust entered into a lending agreement with BNP Paribas through its New York branch (“BNPP NY”). Loans in aggregate, whether to cover overdrafts or for investment purposes, may not exceed the maximum amount that is permitted under the 1940 Act. The terms of the lending agreement indicate the rate to be the Fed Funds rate plus 0.95% per annum on amounts borrowed. The BNP Paribas Facility provides for secured, uncommitted lines of credit for the Funds where selected Funds assets are pledged against advances made to the Fund. Each Fund is permitted to borrow up to 33.33% of its total assets for extraordinary or emergency purposes. Additionally, the following Funds are permitted to borrow up to 10% of its total assets for investment purposes but in no case shall any Fund’s total outstanding borrowings exceed 33.33% of its total assets: Dynamic Dividend Fund, Accelerating Dividend Fund, Financial Services Fund, Innovators Fund, Transformations Fund and Foundation Fund. Either BNPP NY or the Funds may terminate this agreement upon delivery of written notice. For the year ended October 31, 2012, the average interest rate paid on outstanding borrowings under the line of credit was 1.07%, 1.09%, 1.03%, 1.02% and 1.11% for the Dynamic Dividend Fund, Accelerating Dividend Fund, Financial Services Fund, Innovators Fund and Transformations Fund, respectively. The Funds may also incur interest expense on custody overdraft charges.
|
|
|
|
|
|
|
|
|
|
|
|
|
|
|
| Dynamic |
| Accelerating |
| Financial |
| Innovators |
| ||||
|
|
|
|
|
| ||||||||
Total line of credit amount available for investment purposes at October 31, 2012 |
|
| $35,855,827 |
|
| $244,566 |
|
| $1,028,250 |
|
| $1,115,944 |
|
Line of credit outstanding at October 31, 2012 |
|
| — |
|
| — |
|
| — |
|
| — |
|
Line of credit amount unused at October 31, 2012 |
|
| 35,855,827 |
|
| 244,566 |
|
| 1,028,250 |
|
| 1,115,944 |
|
Average balance outstanding during the year |
|
| 5,261,683 |
|
| 9,881 |
|
| 178,419 |
|
| 69,958 |
|
Interest expense incurred on line of credit during the year |
|
| 57,149 |
|
| 109 |
|
| 1,870 |
|
| 729 |
|
Interest expense incurred on custody overdrafts during the year |
|
| — |
|
| — |
|
| — |
|
| — |
|
|
|
|
|
|
|
|
|
|
|
|
|
|
|
|
| Transformations |
| Foundation |
|
|
|
|
|
|
| ||
|
|
|
|
|
|
|
|
|
| ||||
Total line of credit amount available for investment purposes at October 31, 2012 |
|
| $672,774 |
|
| $6,556,926 |
|
|
|
|
|
|
|
Line of credit outstanding at October 31, 2012 |
|
| — |
|
| — |
|
|
|
|
|
|
|
Line of credit amount unused at October 31, 2012 |
|
| 672,774 |
|
| 6,556,926 |
|
|
|
|
|
|
|
Average balance outstanding during the year |
|
| 5,038 |
|
| — |
|
|
|
|
|
|
|
Interest expense incurred on line of credit during the year |
|
| 57 |
|
| — |
|
|
|
|
|
|
|
Interest expense incurred on custody overdrafts during the year |
|
| — |
|
| — |
|
|
|
|
|
|
|
D. Federal and Other Income Taxes:
It is each Fund’s policy to comply with the Federal income and excise tax requirements of the Internal Revenue Code of 1986 (the “Code”), as amended applicable to regulated investment companies and to distribute timely, all of its investment company taxable income and net realized capital gains to shareholders in accordance with the timing requirements imposed by the Code. Therefore, no federal income tax provision is recorded. Under applicable foreign
109
|
Alpine Mutual Funds |
Notes to Financial Statements—Continued
October 31, 2012
tax laws, a withholding tax may be imposed on interest, dividends, and capital gains earned on foreign investments. Where available, the Funds will file refund claims for foreign taxes withheld.
Management has analyzed the Funds’ tax positions taken on income tax returns for all open tax years and has concluded that as of October 31, 2012, no provision for income tax is required in the Funds’ financial statements. The Fund’s federal and state income and federal excise tax returns for tax years for which the applicable statutes of limitations have not expired are subject to examination by Internal Revenue Service and state departments of revenue.
GAAP requires that certain components of net assets be reclassified to reflect permanent differences between financial and tax reporting. These reclassifications have no effect on net assets or net asset values per share.
E. Distributions to Shareholders:
Each of the Dynamic Dividend, Accelerating Dividend, Financial Services, Innovators, Transformations, Foundation and Ultra Short Tax Optimized Income Funds intends to distribute all of its net investment income and net realized capital gains, if any, throughout the year to its shareholders in the form of dividends. The Municipal Money Market Fund declares and accrues dividends daily on each business day based upon the Fund’s net income, and pays dividends monthly. Distributions to shareholders are recorded at the close of business on the ex-dividend date. All dividends are automatically reinvested in full and fractional shares of the Fund at net asset value per share, unless otherwise requested.
The amounts of dividends from net investment income and of distributions from net realized gains are determined in accordance with federal income tax regulations, which may differ from GAAP. These differences are either considered temporary or permanent in nature. To the extent these differences are permanent in nature, such amounts are reclassified within the composition of net assets based on their federal tax-basis treatment; temporary differences do not require reclassification. In the event dividends and distributions to shareholders exceed net investment income and net realized gains for tax purposes they are reported as returns of capital.
F. Class Allocations:
Income, expenses (other than class specific expenses) and realized and unrealized gains and losses are allocated among the classes of the Fund based on the relative net assets of each class. Class specific expenses are allocated to the class to which they relate. Currently, class specific expenses are limited to those incurred under the Distribution Plan for Class A shares (formerly, Adviser Class shares, for the Ultra Short Tax Optimized Income Fund).
G. Foreign Currency Translation Transactions:
Each of the Dynamic Dividend, Accelerating Dividend, Financial Services and Transformations Funds may invest without limitation in foreign securities. The Innovators Fund and Foundation Fund may invest up to 20% and 15%, respectively, of the value of its net assets in foreign securities. The books and records of each Fund are maintained in U.S. dollars. Non-U.S. dollar-denominated amounts are translated into U.S. dollars as follows, with the resultant translation gains and losses recorded in the Statements of Operations:
|
|
|
| i) | market value of investment securities and other assets and liabilities at the exchange rate on the valuation date, |
|
|
|
| ii) | purchases and sales of investment securities, income and expenses at the exchange rate prevailing on the respective date of such transactions. |
H. Risk Associated with Foreign Securities and Currencies:
Investments in securities of foreign issuers carry certain risks not ordinarily associated with investments in securities of domestic issuers. Such risks include future political and economic developments and the possible imposition of exchange controls or other foreign governmental laws and restrictions. In addition, with respect to certain countries, there is a possibility of expropriation of assets, confiscatory taxation, political or social instability or diplomatic developments, which could adversely affect investments in those countries. Certain countries may also impose substantial restrictions on investments in their capital markets by foreign entities, including restrictions on investments in issuers or industries deemed sensitive to relevant national interests. These factors may limit the investment opportunities available to the Funds or result in a lack of liquidity and high price volatility with respect to securities of issuers from developing countries.
110
|
Alpine Mutual Funds |
Notes to Financial Statements—Continued
October 31, 2012
|
|
| I. Forward Currency Contracts: |
|
|
| The Funds are subject to foreign currency exchange rate risk in the normal course of pursuing their investment objective. The Funds may use forward currency contracts to gain exposure to or economically hedge against changes in the value of foreign currencies. A forward currency contract (“forward”) is an agreement between two parties to buy and sell a currency at a set price on a future date. The market value of the forward contract fluctuates with changes in forward currency exchange rates. The forward contract is marked-to-market daily and the change in market value is recorded by each Fund as unrealized appreciation or depreciation. When the forward contract is closed, a Fund records a realized gain or loss equal to the fluctuation in value during the period the forward contract was open. A Fund could be exposed to risk if a counterparty is unable to meet the terms of a forward or if the value of the currency changes unfavorably. During the year ended October 31, 2012, the Dynamic Dividend Fund entered into 24 forward currency contracts. The Funds did not hold forward currency contracts as of October 31, 2012. |
|
|
| J. Derivative Instruments and Hedging Activities: |
|
|
| FASB Codification Topic 815 requires enhanced disclosure about an entity’s derivative and hedging activities. |
|
|
| The following tables provide information about the effect of derivatives and hedging activities on the Funds’ Statements of Operations for the year ended October 31, 2012. The first table provides additional detail about the amounts and sources of gains (losses) realized on derivatives during the year. The second table provides additional information about the change in unrealized appreciation/depreciation resulting from the Funds’ derivatives and hedging activities during the year. |
|
|
| The effect of derivative instruments on the Statements of Operations for the year ended October 31, 2012: |
|
|
| Dynamic Dividend Fund |
|
|
|
|
|
|
|
|
|
Derivatives |
|
| Net Realized Gain (Loss) |
| Change in Unrealized |
| ||
|
|
|
| |||||
Forward Currency Contracts |
|
| $596,282 |
| $ | — |
| |
|
|
3. | Capital Share Transactions: |
|
|
| The Funds have an unlimited number of shares of beneficial interest, with $0.0001 par value, authorized. Transactions in shares and dollars of the Funds were as follows: |
|
|
| Dynamic Dividend Fund |
|
|
|
|
|
|
|
|
|
|
|
|
|
|
|
| Year Ended |
| Year Ended |
| ||||||||
|
|
|
| ||||||||||
|
| Shares |
| Amount |
| Shares |
| Amount |
| ||||
|
|
|
|
|
| ||||||||
Class A |
|
|
|
|
|
|
|
|
|
|
|
|
|
Shares sold |
|
| 456,050 |
| $ | 1,637,308 |
|
| N/A |
|
| N/A |
|
Shares issued in reinvestment of dividends |
|
| 6,286 |
|
| 22,331 |
|
| N/A |
|
| N/A |
|
Redemption fees |
|
| — |
|
| 5 |
|
| N/A |
|
| N/A |
|
Shares redeemed |
|
| (18 | ) |
| (64 | ) |
| N/A |
|
| N/A |
|
|
|
|
|
|
| ||||||||
Total net change |
|
| 462,318 |
| $ | 1,659,580 |
|
| N/A |
|
| N/A |
|
|
|
|
|
|
| ||||||||
Institutional Class |
|
|
|
|
|
|
|
|
|
|
|
|
|
Shares sold |
|
| 8,777,004 |
| $ | 32,015,536 |
|
| 19,505,877 |
| $ | 88,626,740 |
|
Shares issued in reinvestment of dividends |
|
| 9,535,812 |
|
| 34,357,087 |
|
| 10,480,162 |
|
| 47,602,166 |
|
Redemption fees |
|
| — |
|
| 39,095 |
|
| — |
|
| 48,509 |
|
Shares redeemed |
|
| (36,781,852 | ) |
| (134,334,677 | ) |
| (50,504,137 | ) |
| (230,053,339 | ) |
|
|
|
|
|
| ||||||||
Total net change |
|
| (18,469,036 | ) | $ | (67,922,959 | ) |
| (20,518,098 | ) | $ | (93,775,924 | ) |
|
|
|
|
|
| ||||||||
111
|
Alpine Mutual Funds |
Notes to Financial Statements—Continued
October 31, 2012
|
|
|
|
|
|
|
|
|
|
|
|
|
|
Accelerating Dividend Fund |
|
|
|
|
|
|
|
|
|
|
|
|
|
|
| Year Ended |
| Year Ended |
| ||||||||
|
|
|
| ||||||||||
|
| Shares |
| Amount |
| Shares |
| Amount |
| ||||
|
|
|
|
|
| ||||||||
Class A |
|
|
|
|
|
|
|
|
|
|
|
|
|
Shares sold |
|
| 19,671 |
| $ | 241,728 |
|
| N/A |
|
| N/A |
|
Shares issued in reinvestment of dividends |
|
| 261 |
|
| 3,324 |
|
| N/A |
|
| N/A |
|
Redemption fees |
|
| — |
|
| — |
|
| N/A |
|
| N/A |
|
Shares redeemed |
|
| — |
|
| — |
|
| N/A |
|
| N/A |
|
|
|
|
|
|
| ||||||||
Total net change |
|
| 19,932 |
| $ | 245,052 |
|
| N/A |
|
| N/A |
|
|
|
|
|
|
| ||||||||
Institutional Class |
|
|
|
|
|
|
|
|
|
|
|
|
|
Shares sold |
|
| 26,137 |
| $ | 333,967 |
|
| 62,763 |
| $ | 827,453 |
|
Shares issued in reinvestment of dividends |
|
| 15,818 |
|
| 194,859 |
|
| 7,939 |
|
| 105,232 |
|
Redemption fees |
|
| — |
|
| — |
|
| — |
|
| 21 |
|
Shares redeemed |
|
| (125,455 | ) |
| (1,603,733 | ) |
| (6,833 | ) |
| (91,097 | ) |
|
|
|
|
|
| ||||||||
Total net change |
|
| (83,500 | ) | $ | (1,074,907 | ) |
| 63,869 |
| $ | 841,609 |
|
|
|
|
|
|
| ||||||||
|
|
|
|
|
|
|
|
|
|
|
|
|
|
Financial Services Fund |
|
|
|
|
|
|
|
|
|
|
|
|
|
| |||||||||||||
|
| Year Ended |
| Year Ended |
| ||||||||
|
|
|
| ||||||||||
|
| Shares |
| Amount |
| Shares |
| Amount |
| ||||
|
|
|
|
|
| ||||||||
Class A |
|
|
|
|
|
|
|
|
|
|
|
|
|
Shares sold |
|
| 160,783 |
| $ | 1,333,401 |
|
| N/A |
|
| N/A |
|
Shares issued in reinvestment of dividends |
|
| — |
|
| — |
|
| N/A |
|
| N/A |
|
Redemption fees |
|
| — |
|
| 98 |
|
| N/A |
|
| N/A |
|
Shares redeemed |
|
| (3,644 | ) |
| (30,725 | ) |
| N/A |
|
| N/A |
|
|
|
|
|
|
| ||||||||
Total net change |
|
| 157,139 |
| $ | 1,302,774 |
|
| N/A |
|
| N/A |
|
|
|
|
|
|
| ||||||||
Institutional Class |
|
|
|
|
|
|
|
|
|
|
|
|
|
Shares sold |
|
| 277,896 |
| $ | 2,278,757 |
|
| 289,711 |
| $ | 2,447,441 |
|
Shares issued in reinvestment of dividends |
|
| 1,755 |
|
| 11,966 |
|
| 2,306 |
|
| 19,879 |
|
Redemption fees |
|
| — |
|
| 2,184 |
|
| — |
|
| 2,059 |
|
Shares redeemed |
|
| (141,591 | ) |
| (1,088,482 | ) |
| (421,671 | ) |
| (3,498,930 | ) |
|
|
|
|
|
| ||||||||
Total net change |
|
| 138,060 |
| $ | 1,204,425 |
|
| (129,654 | ) | $ | (1,029,551 | ) |
|
|
|
|
|
| ||||||||
112
|
Alpine Mutual Funds |
Notes to Financial Statements—Continued
October 31, 2012
|
|
|
|
|
|
|
|
|
|
|
|
|
|
Innovators Fund |
|
|
|
|
|
|
|
|
|
|
|
|
|
|
| Year Ended |
| Year Ended |
| ||||||||
|
|
|
| ||||||||||
|
| Shares |
| Amount |
| Shares |
| Amount |
| ||||
|
|
|
|
|
| ||||||||
Class A |
|
|
|
|
|
|
|
|
|
|
|
|
|
Shares sold |
|
| 12,839 |
| $ | 137,564 |
|
| N/A |
|
| N/A |
|
Shares issued in reinvestment of dividends |
|
| — |
|
| — |
|
| N/A |
|
| N/A |
|
Redemption fees |
|
| — |
|
| — |
|
| N/A |
|
| N/A |
|
Shares redeemed |
|
| (3,006 | ) |
| (33,972 | ) |
| N/A |
|
| N/A |
|
|
|
|
|
|
| ||||||||
Total net change |
|
| 9,833 |
| $ | 103,592 |
|
| N/A |
|
| N/A |
|
|
|
|
|
|
| ||||||||
Institutional Class |
|
|
|
|
|
|
|
|
|
|
|
|
|
Shares sold |
|
| 126,183 |
| $ | 1,497,500 |
|
| 12,473 |
| $ | 133,270 |
|
Shares issued in reinvestment of dividends |
|
| — |
|
| — |
|
| — |
|
| — |
|
Redemption fees |
|
| — |
|
| 769 |
|
| — |
|
| 34 |
|
Shares redeemed |
|
| (156,924 | ) |
| (1,816,276 | ) |
| (190,018 | ) |
| (2,059,520 | ) |
|
|
|
|
|
| ||||||||
Total net change |
|
| (30,741 | ) | $ | (318,007 | ) |
| (177,545 | ) | $ | (1,926,216 | ) |
|
|
|
|
|
| ||||||||
|
|
|
|
|
|
|
|
|
|
|
|
|
|
Transformations Fund |
|
|
|
|
|
|
|
|
|
|
|
|
|
|
| Year Ended |
| Year Ended |
| ||||||||
|
|
|
| ||||||||||
|
| Shares |
| Amount |
| Shares |
| Amount |
| ||||
|
|
|
|
|
| ||||||||
Class A |
|
|
|
|
|
|
|
|
|
|
|
|
|
Shares sold |
|
| 8,913 |
| $ | 100,000 |
|
| N/A |
|
| N/A |
|
Shares issued in reinvestment of dividends |
|
| — |
|
| — |
|
| N/A |
|
| N/A |
|
Redemption fees |
|
| — |
|
| 11 |
|
| N/A |
|
| N/A |
|
Shares redeemed |
|
| — |
|
| — |
|
| N/A |
|
| N/A |
|
|
|
|
|
|
| ||||||||
Total net change |
|
| 8,913 |
| $ | 100,011 |
|
| N/A |
|
| N/A |
|
|
|
|
|
|
| ||||||||
Institutional Class |
|
|
|
|
|
|
|
|
|
|
|
|
|
Shares sold |
|
| 104,367 |
| $ | 1,299,604 |
|
| 102,599 |
| $ | 1,211,025 |
|
Shares issued in reinvestment of dividends |
|
| — |
|
| — |
|
| — |
|
| — |
|
Redemption fees |
|
| — |
|
| 794 |
|
| — |
|
| 555 |
|
Shares redeemed |
|
| (120,219 | ) |
| (1,446,510 | ) |
| (82,972 | ) |
| (949,393 | ) |
|
|
|
|
|
| ||||||||
Total net change |
|
| (15,852 | ) | $ | (146,112 | ) |
| 19,627 |
| $ | 262,187 |
|
|
|
|
|
|
| ||||||||
113
|
Alpine Mutual Funds |
Notes to Financial Statements—Continued
October 31, 2012
|
|
|
|
|
|
|
|
|
|
|
|
|
|
Foundation Fund |
|
|
|
|
|
|
|
|
|
|
|
|
|
| |||||||||||||
|
| Year Ended |
| Year Ended |
| ||||||||
|
|
|
| ||||||||||
|
| Shares |
| Amount |
| Shares |
| Amount |
| ||||
|
|
|
|
|
| ||||||||
Class A |
|
|
|
|
|
|
|
|
|
|
|
|
|
Shares sold |
|
| 9,431 |
| $ | 100,066 |
|
| N/A |
|
| N/A |
|
Shares issued in reinvestment of dividends |
|
| 107 |
|
| 1,213 |
|
| N/A |
|
| N/A |
|
Redemption fees |
|
| — |
|
| — |
|
| N/A |
|
| N/A |
|
Shares redeemed |
|
| (6 | ) |
| (65 | ) |
| N/A |
|
| N/A |
|
|
|
|
|
|
| ||||||||
Total net change |
|
| 9,532 |
| $ | 101,214 |
|
| N/A |
|
| N/A |
|
|
|
|
|
|
| ||||||||
Institutional Class |
|
|
|
|
|
|
|
|
|
|
|
|
|
Shares sold |
|
| 7,258 |
| $ | 79,144 |
|
| 76,697 |
| $ | 830,757 |
|
Shares issued in reinvestment of dividends |
|
| 94,587 |
|
| 1,056,106 |
|
| 97,394 |
|
| 1,024,279 |
|
Redemption fees |
|
| — |
|
| — |
|
| — |
|
| 1,429 |
|
Shares redeemed |
|
| (218,815 | ) |
| (2,425,362 | ) |
| (551,645 | ) |
| (6,015,870 | ) |
|
|
|
|
|
| ||||||||
Total net change |
|
| (116,970 | ) | $ | (1,290,112 | ) |
| (377,554 | ) | $ | (4,159,405 | ) |
|
|
|
|
|
| ||||||||
|
|
|
|
|
|
|
|
|
|
|
|
|
| ||||
Ultra Short Tax Optimized Income Fund |
|
|
|
|
|
|
|
|
|
|
|
|
| ||||
| |||||||||||||||||
|
| Year Ended |
| Year Ended |
| ||||||||||||
|
|
|
| ||||||||||||||
|
| Shares |
| Amount |
| Shares |
| Amount |
| ||||||||
|
|
|
|
|
| ||||||||||||
Class A |
|
|
|
|
|
|
|
|
|
|
|
|
| ||||
Shares sold |
|
| 35,181,739 |
| $ | 355,543,788 |
|
| 22,357,186 |
| $ | 225,873,682 |
| ||||
Shares issued in reinvestment of dividends |
|
| 228,067 |
|
| 2,303,615 |
|
| 368,680 |
|
| 3,722,267 |
| ||||
Redemption fees |
|
| — |
|
| 7,888 |
|
| — |
|
| 8,343 |
| ||||
Shares redeemed |
|
| (26,962,596 | ) |
| (272,476,288 | ) |
| (16,219,123 | ) |
| (163,836,074 | ) | ||||
|
|
|
|
|
| ||||||||||||
Total net change |
|
| 8,447,210 |
| $ | 85,379,003 |
|
| 6,506,743 |
| $ | 65,768,218 |
| ||||
|
|
|
|
|
| ||||||||||||
Institutional Class |
|
|
|
|
|
|
|
|
|
|
|
|
| ||||
Shares sold |
|
| 98,084,023 |
| $ | 985,826,904 |
|
| 84,004,660 |
| $ | 844,019,419 |
| ||||
Shares issued in reinvestment of dividends |
|
| 803,370 |
|
| 8,073,867 |
|
| 1,408,984 |
|
| 14,143,602 |
| ||||
Redemption fees |
|
| — |
|
| 29,729 |
|
| — |
|
| 29,915 |
| ||||
Shares redeemed |
|
| (87,961,885 | ) |
| (884,060,821 | ) |
| (73,505,192 | ) |
| (738,310,656 | ) | ||||
|
|
|
|
|
| ||||||||||||
Total net change |
|
| 10,925,508 |
| $ | 109,869,679 |
|
| 11,908,452 |
| $ | 119,882,280 |
| ||||
|
|
|
|
|
| ||||||||||||
|
|
|
|
|
|
|
|
|
|
|
|
|
|
Municipal Money Market Fund |
|
|
|
|
|
|
|
|
|
|
|
|
|
| |||||||||||||
|
| Year Ended |
| Year Ended |
| ||||||||
|
|
|
| ||||||||||
|
| Shares |
| Amount |
| Shares |
| Amount |
| ||||
|
|
|
|
|
| ||||||||
Shares sold |
|
| 209,368,876 |
| $ | 209,368,876 |
|
| 1,055,218,570 |
| $ | 1,055,218,569 |
|
Shares issued in reinvestment of dividends |
|
| 190,228 |
|
| 190,228 |
|
| 457,009 |
|
| 457,009 |
|
Shares redeemed |
|
| (290,975,342 | ) |
| (290,975,342 | ) |
| (1,215,786,716 | ) |
| (1,215,786,617 | ) |
|
|
|
|
|
| ||||||||
Total net change |
|
| (81,416,238 | ) | $ | (81,416,238 | ) |
| (160,111,137 | ) | $ | (160,111,039 | ) |
|
|
|
|
|
| ||||||||
|
|
* | Class A commenced operations on December 30, 2011. |
** | Effective January 3, 2012, the Adviser share class was renamed to Class A and Investor share class was renamed to Institutional Class. |
*** | Effective January 3, 2012, the Investor Class was renamed the Institutional Class and subsequently reverted back to the Investor Class effective July 26, 2012. |
114
|
Alpine Mutual Funds |
Notes to Financial Statements—Continued
October 31, 2012
|
|
4. | Purchases and Sales of Securities: |
|
|
| Purchases and sales of securities (excluding short-term securities) for the year ended October 31, 2012 are as follows: |
|
|
|
|
|
|
|
|
|
| Purchases |
| Sales |
| ||
|
|
|
| ||||
Dynamic Dividend Fund |
| $ | 995,394,141 |
| $ | 1,068,038,406 |
|
Accelerating Dividend Fund |
|
| 1,825,804 |
|
| 2,724,438 |
|
Financial Services Fund |
|
| 9,001,816 |
|
| 8,722,256 |
|
Innovators Fund |
|
| 3,011,605 |
|
| 4,176,422 |
|
Transformations Fund |
|
| 4,333,698 |
|
| 3,848,449 |
|
Foundation Fund |
|
| 24,193,772 |
|
| 21,505,577 |
|
Ultra Short Tax Optimized Income Fund |
|
| 3,608,776,388 |
|
| 3,339,187,369 |
|
The Funds did not have purchases and sales of U.S. Government obligations during the year ended October 31, 2012.
|
|
5. | Distribution Plans: |
|
|
| Quasar Distributors, LLC (“Quasar”) serves as each Funds’ distributor. Certain of the Funds have adopted distribution and servicing plans (the “Plans”) for their Class A shares (in the case of the Ultra Short Tax Optimized Income Fund formerly known as the Adviser Class) as allowed by Rule 12b-1 under the 1940 Act. The Plans authorize payments by the Funds in connection with the distribution and servicing of their Class A shares at an annual rate, as determined from time to time by the Board of Trustees, of up to 0.25% of the average daily net assets of the Class A shares of the Funds. Amounts paid under the Plans by the Funds may be spent by the Funds on any activities or expenses primarily intended to result in the sale of Class A shares of the Funds, including but not limited to advertising, compensation for sales and marketing activities of financial institutions and others such as dealers and distributors, shareholder account servicing, the printing and mailing of prospectuses to other than current shareholders and the printing and mailing of sales literature. Dynamic Dividend Fund, Accelerating Dividend Fund, Financial Services Fund, Innovators Fund, Transformations Fund, Foundation Fund and Ultra Short Tax Optimized Income Fund incurred $684, $325, $1,079, $265, $227, $221 and $1,085,232, respectively, pursuant to the Plans for the year months ended October 31, 2012. |
|
|
| The Plans for the Funds may be terminated at any time by vote of the Trustees of the Trusts who are not “interested persons,” as defined by the 1940 Act, of the Trusts, or by vote of a majority of the outstanding voting shares of the respective class. |
|
|
| Alpine Woods Capital Investors, LLC (the “Adviser”) makes payments to intermediaries that provide omnibus account services, sub-accounting services and/or networking services with respect to the Funds. On February 2, 2012, the Board of Trustees approved, subject to certain limitations, the reimbursement to the Adviser by the appropriate Fund, of up to a certain percentage of such fees paid by the Adviser to intermediaries that provide omnibus account services, sub-accounting services, and/or networking services. Reimbursement of these fees are subject to review by the Board of Trustees and are included in the transfer agent fees in the Statements of Operations. |
|
|
6. | Investment Advisory Agreement and Other Affiliated Transactions: |
|
|
| The Adviser provides investment advisory services to each of the Funds. Pursuant to the advisory agreements with the Funds, the Adviser is entitled to an annual fee based on 1.00% of each Fund’s average daily net assets for the Dynamic Dividend Fund, Accelerating Dividend Fund, Financial Services Fund, Innovators Fund, Transformations Fund and Foundation Fund. The Adviser is entitled to an annual fee based on 0.75% of the Ultra Short Tax Optimized Income Fund’s average daily net assets and an annual fee based on 0.45% of the Municipal Money Market Fund’s average daily net assets. |
|
|
| The Adviser agreed to reimburse the Dynamic Dividend Fund, Accelerating Dividend Fund, Financial Services Fund, Innovators Fund, Transformations Fund and Foundation Fund to the extent necessary to ensure that ordinary operating expenses (including 12b-1 fees, but excluding interest, brokerage commissions, acquired fund fees and extraordinary expenses) do not exceed annually 1.60% of each Fund’s Class A Shares average daily net assets, and 1.35% of each Fund’s Institutional Class Shares average daily net assets. The expense cap for the Ultra Short Tax Optimized Income Fund—Class A Shares (formerly, Adviser Class) and Ultra Short Tax Optimized Income Fund— |
115
|
Alpine Mutual Funds |
Notes to Financial Statements—Continued
October 31, 2012
|
|
| Institutional Class Shares (formerly Investor Class) is 0.95% and 0.70%, respectively, at October 31, 2012. The Adviser voluntarily agreed to reimburse the Ultra Short Tax Optimized Income Fund to the extent necessary to ensure that the Fund’s total operating expenses (including 12-b1 fees, where applicable, but excluding interest, brokerage commissions and extraordinary expenses) did not exceed certain limits. The limits ranged from 0.57% to 0.65% of the Fund’s average daily net assets during the year ended October 31, 2012. The Adviser may recover expenses paid in excess of the cap on expenses for the three previous years, as long as the recovery does not cause the Fund to exceed such cap on expenses. For the year ended October 31, 2012, the Adviser waived investment advisory fees and other expenses totaling $51,048, $42,851, $35,981, $42,826 and $3,353,608 for the Accelerating Dividend Fund, Financial Services Fund, Innovators Fund, Transformations Fund and Ultra Short Tax Optimized Income Fund, respectively. The expense limitations will remain in effect for each Fund through February 28, 2013 unless and until the Board of Trustees of the Series and Income Trusts approve its modification or termination with respect to each Fund. Waived expenses subject to potential recovery by year of expiration are as follows: |
|
|
|
|
|
|
|
|
|
|
|
|
|
|
|
|
|
Year of Expiration |
| Accelerating |
| Financial |
| Innovators |
| Transformations |
| Ultra Short |
| |||||
|
|
|
|
|
| |||||||||||
10/31/2013 |
| $ | 28,493 |
| $ | 34,708 |
| $ | 29,521 |
| $ | 37,330 |
| $ | 3,894,496 |
|
10/31/2014 |
|
| 35,094 |
|
| 32,910 |
|
| 20,239 |
|
| 21,099 |
|
| 2,722,733 |
|
10/31/2015 |
|
| 51,048 |
|
| 42,851 |
|
| 35,981 |
|
| 42,826 |
|
| 3,353,608 |
|
|
|
| For the year ended October 31, 2012, the Adviser voluntarily agreed to reimburse the Municipal Money Market Fund to the extent necessary to ensure that the Fund’s total operating expenses (excluding interest, brokerage commissions and extraordinary expenses) did not exceed certain limits. The limits ranged from 0.32% to 0.54% of the Fund’s average daily net assets during the year ended October 31, 2012. For the year ended October 31, 2012 the Adviser waived investment advisory fees and other expenses totaling $655,944 for the Municipal Money Market Fund. |
|
|
| State Street Bank and Trust (“SSBT”) serves as the Funds’ Administrator pursuant to an Administration Agreement with the Funds. As compensation for its services to the Funds, SSBT receives an annual administration fee of 0.02% of total net assets on the first $5 billion and 0.015% on total net assets exceeding $5 billion, computed daily and payable monthly. |
|
|
7. | Federal Income Tax Information |
|
|
| At October 31, 2012, the components of distributable earnings on a tax basis were as follows: |
|
|
|
|
|
|
|
|
|
|
|
|
|
|
|
|
|
|
|
|
|
|
| Dynamic |
| Accelerating |
| Financial |
| Innovators Fund | ||||||||||||
|
|
|
|
| ||||||||||||||||
Undistributed ordinary income |
|
| $ | 9,139,404 |
|
|
| $ | 37,754 |
|
|
| $ | — |
|
|
| $ | — |
|
Other undistributed ordinary losses |
|
| (1,556,127 | ) |
| (604 | ) |
| — |
|
| — |
| |||||||
Undistributed long-term capital gain |
|
|
| — |
|
|
|
| 47,305 |
|
|
|
| — |
|
|
|
| — |
|
Late year ordinary loss deferral |
|
| — |
|
| — |
|
| — |
|
| (106,328 | ) | |||||||
Accumulated capital loss |
|
|
| (1,159,573,394 | ) |
|
|
| — |
|
|
|
| (1,507,566 | ) |
|
|
| (13,955,852 | ) |
Unrealized appreciation/depreciation |
|
| 26,235,344 |
|
| 261,123 |
|
| (2,157,171 | ) |
| 2,559,366 |
| |||||||
|
|
|
|
|
| |||||||||||||||
Total |
|
| $ | (1,125,754,773 | ) |
|
| $ | 345,578 |
|
|
| $ | (3,664,737 | ) |
|
| $ | (11,502,814 | ) |
|
|
| �� |
|
|
| ||||||||||||||
116
|
Alpine Mutual Funds |
Notes to Financial Statements—Continued
October 31, 2012
|
|
|
|
|
|
|
|
|
|
|
|
|
|
|
| Transformations |
| Foundation |
| Ultra Short |
| Municipal |
| ||||
|
|
|
|
|
| ||||||||
Undistributed ordinary income |
| $ | — |
| $ | 24,071 |
| $ | — |
| $ | — |
|
Undistributed tax exempt income |
|
| — |
|
| — |
|
| 79 |
|
| — |
|
Undistributed long-term capital gain |
|
| 42,117 |
|
| — |
|
| — |
|
| — |
|
Late year ordinary loss deferral |
|
| (35,046 | ) |
| — |
|
| — |
|
| — |
|
Accumulated capital loss |
|
| — |
|
| (3,916,606 | ) |
| (67,228 | ) |
| — |
|
Unrealized appreciation/depreciation |
|
| 886,502 |
|
| 8,258,630 |
|
| 1,038,320 |
|
| — |
|
|
|
|
|
|
| ||||||||
Total |
| $ | 893,573 |
| $ | 4,366,095 |
| $ | 971,171 |
| $ | — |
|
|
|
|
|
|
| ||||||||
|
|
| Tax components of distributable earnings are determined in accordance with income tax regulations which may differ from the composition of net assets reported under GAAP. Accordingly, for the year ended October 31, 2012, the effects of certain differences were reclassified as follows: |
|
|
|
|
|
|
|
|
|
|
|
|
| Capital stock |
| Accumulated |
| Accumulated |
| |||
|
|
|
| |||||||
Dynamic Dividend Fund |
| $ | 14,985 |
| $ | (18,759 | ) | $ | 3,774 |
|
Accelerating Dividend Fund |
|
| (3 | ) |
| 5,319 |
|
| (5,316 | ) |
Financial Services Fund |
|
| (25,565 | ) |
| 27,053 |
|
| (1,488 | ) |
Innovators Fund |
|
| (20,419 | ) |
| 16,131 |
|
| 4,288 |
|
Transformations Fund |
|
| (4,892 | ) |
| 4,522 |
|
| 370 |
|
Foundation Fund |
|
| 28,053 |
|
| (35,271 | ) |
| 7,218 |
|
|
|
| As of October 31, 2012, net unrealized appreciation/depreciation of investments, excluding foreign currency, based on federal tax costs was as follows: |
|
|
|
|
|
|
|
|
|
|
|
|
|
| ||
|
| Dynamic |
| Accelerating |
| Financial |
| Innovators Fund |
| ||||||
|
|
|
|
| |||||||||||
Cost of investments |
| $ | 316,937,418 |
| $ | 2,149,367 |
| $ | 12,316,975 |
| $ | 8,564,585 |
| ||
|
|
|
|
|
| ||||||||||
Gross unrealized appreciation |
|
| 38,382,693 |
|
| 302,402 |
|
| 912,841 |
|
| 3,387,671 |
| ||
Gross unrealized depreciation |
|
| (12,215,188 | ) |
| (41,279 | ) |
| (3,061,882 | ) |
| (828,305 | ) | ||
|
|
|
|
|
| ||||||||||
Net unrealized appreciation (depreciation) |
| $ | 26,167,505 |
| $ | 261,123 |
| $ | (2,149,041 | ) | $ | 2,559,366 |
| ||
|
|
|
|
|
| ||||||||||
|
|
|
|
|
|
|
|
|
|
|
|
|
|
|
| Transformations |
| Foundation |
| Ultra Short |
| Municipal |
| ||||
|
|
|
|
| |||||||||
Cost of investments |
| $ | 5,245,088 |
| $ | 56,936,367 |
| $ | 1,917,421,490 |
| $ | 228,414,311 |
|
|
|
|
|
|
| ||||||||
Gross unrealized appreciation |
|
| 1,383,369 |
|
| 13,791,900 |
|
| 1,135,256 |
|
| — |
|
Gross unrealized depreciation |
|
| (496,864 | ) |
| (5,533,256 | ) |
| (96,936 | ) |
| — |
|
|
|
|
|
|
| ||||||||
Net unrealized appreciation (depreciation) |
| $ | 886,505 |
| $ | 8,258,644 |
| $ | 1,038,320 |
| $ | — |
|
|
|
|
|
|
| ||||||||
|
|
| The tax basis of investments for tax and financial reporting purposes differs principally due to the deferral of losses on wash sales, partnership tax adjustments, and mark-to-market cost basis adjustments for investments in passive foreign investment companies (PFICs) for tax purposes. |
117
|
Alpine Mutual Funds |
Notes to Financial Statements—Continued
October 31, 2012
The tax character of distributions paid during the years ended October 31, 2012 and 2011 were as follows:
|
|
|
|
|
|
|
|
|
| 2012 |
| 2011 |
| ||
|
|
|
| ||||
Dynamic Dividend Fund |
|
|
|
|
|
|
|
Ordinary income |
| $ | 54,036,978 |
| $ | 69,799,231 |
|
Long-term capital gain |
|
| — |
|
| — |
|
|
|
|
| ||||
|
| $ | 54,036,978 |
| $ | 69,799,231 |
|
|
|
|
| ||||
|
|
|
|
|
|
|
|
Accelerating Dividend Fund |
|
|
|
|
|
|
|
Ordinary income |
| $ | 103,200 |
| $ | 118,437 |
|
Long-term capital gain |
|
| 198,485 |
|
| 41,908 |
|
|
|
|
| ||||
|
| $ | 301,685 |
| $ | 160,345 |
|
|
|
|
| ||||
|
|
|
|
|
|
|
|
Financial Services Fund |
|
|
|
|
|
|
|
Ordinary income |
| $ | — |
| $ | 13,114 |
|
Long-term capital gain |
|
| — |
|
| — |
|
Return of capital |
|
| 13,524 |
|
| 9,617 |
|
|
|
|
| ||||
|
| $ | 13,524 |
| $ | 22,731 |
|
|
|
|
| ||||
|
|
|
|
|
|
|
|
|
| 2012 |
| 2011 |
| ||
|
|
|
| ||||
Innovators Fund |
|
|
|
|
|
|
|
Ordinary income |
| $ | — |
| $ | — |
|
Long-term capital gain |
|
| — |
|
| — |
|
|
|
|
| ||||
|
| $ | — |
| $ | — |
|
|
|
|
| ||||
|
|
|
|
|
|
|
|
Transformations Fund |
|
|
|
|
|
|
|
Ordinary income |
| $ | — |
| $ | — |
|
Long-term capital gain |
|
| — |
|
| — |
|
|
|
|
| ||||
|
| $ | — |
| $ | — |
|
|
|
|
| ||||
|
|
|
|
|
|
|
|
Foundation Fund |
|
|
|
|
|
|
|
Ordinary income |
| $ | 1,084,883 |
| $ | 1,049,287 |
|
Long-term capital gain |
|
| — |
|
| — |
|
|
|
|
| ||||
|
| $ | 1,084,883 |
| $ | 1,049,287 |
|
|
|
|
| ||||
|
|
|
|
|
|
|
|
Ultra Short Tax Optimized Income Fund |
|
|
|
|
|
|
|
Ordinary income |
| $ | — |
| $ | 28,462 |
|
Exempt interest dividends |
|
| 15,890,798 |
|
| 25,410,754 |
|
|
|
|
| ||||
|
| $ | 15,890,798 |
| $ | 25,439,216 |
|
|
|
|
| ||||
|
|
|
|
|
|
|
|
Municipal Money Market Fund |
|
|
|
|
|
|
|
Ordinary income |
| $ | — |
| $ | — |
|
Exempt interest dividends |
|
| 264,781 |
|
| 799,048 |
|
Long-term capital gain |
|
| — |
|
| 45,444 |
|
|
|
|
| ||||
|
| $ | 264,781 |
| $ | 844,492 |
|
|
|
|
| ||||
118
|
Alpine Mutual Funds |
Notes to Financial Statements—Continued
October 31, 2012
During the year ended October 31, 2012, the Innovators Fund, Transformations Fund and the Ultra Short Tax Optimized Income Fund utilized $20,875, $285,429 and $106,992 of capital loss carryovers, respectively. Capital loss carryovers as of October 31, 2012 are as follows:
|
|
|
|
|
|
|
|
|
|
|
|
|
|
|
|
|
|
|
|
|
|
|
Expiration Date |
|
| Dynamic |
| Accelerating |
| Financial |
| Innovators Fund |
| ||||||||||||
|
|
|
|
|
| |||||||||||||||||
10/31/2013 |
|
| $ | — |
|
|
| $ | — |
|
|
| $ | — |
|
|
| $ | — |
|
| |
10/31/2014 |
|
| $ | — |
|
|
| $ | — |
|
|
| $ | — |
|
|
| $ | — |
|
| |
10/31/2015 |
|
| $ | 25,935,421 |
|
|
| $ | — |
|
|
| $ | — |
|
|
| $ | — |
|
| |
10/31/2016 |
|
| $ | 536,971,822 |
|
|
| $ | — |
|
|
| $ | — |
|
|
| $ | 6,395,101 |
|
| |
10/31/2017 |
|
| $ | 388,131,987 |
|
|
| $ | — |
|
|
| $ | 115,243 |
|
|
| $ | 5,637,266 |
|
| |
10/31/2018 |
|
| $ | 154,525,095 |
|
|
| $ | — |
|
|
| $ | 143,772 |
|
|
| $ | 1,581,056 |
|
| |
10/31/2019 |
|
| $ | — |
|
|
| $ | — |
|
|
| $ | 1,216,158 |
|
|
| $ | 342,429 |
|
| |
|
|
|
|
|
|
|
|
|
|
|
|
|
|
|
|
|
|
|
|
|
|
|
Expiration Date |
|
| Transformations |
| Foundation |
| Ultra Short |
| Municipal |
| ||||||||||||
|
|
|
|
|
| |||||||||||||||||
10/31/2013 |
|
| $ | — |
|
|
| $ | — |
|
|
| $ | — |
|
|
| $ | — |
|
| |
10/31/2014 |
|
| $ | — |
|
|
| $ | — |
|
|
| $ | — |
|
|
| $ | — |
|
| |
10/31/2015 |
|
| $ | — |
|
|
| $ | — |
|
|
| $ | — |
|
|
| $ | — |
|
| |
10/31/2016 |
|
| $ | — |
|
|
| $ | — |
|
|
| $ | — |
|
|
| $ | — |
|
| |
10/31/2017 |
|
| $ | — |
|
|
| $ | — |
|
|
| $ | — |
|
|
| $ | — |
|
| |
10/31/2018 |
|
| $ | — |
|
|
| $ | 353,585 |
|
|
| $ | — |
|
|
| $ | — |
|
| |
10/31/2019 |
|
| $ | — |
|
|
| $ | — |
|
|
| $ | 67,228 |
|
|
| $ | — |
|
| |
Under the Regulated Investment Company (“RIC”) Modernization Act of 2010 (the “Modernization Act”), post-enactment capital losses that are carried forward will retain their character as either short-term or long-term capital losses rather than being considered all short-term as under previous law. However, any losses incurred during those future taxable years will be required to be utilized prior to the losses incurred in pre-enactment taxable years, which carry an expiration date. As a result of this ordering rule, preenactment capital loss carryovers may be more likely to expire unused.
Capital loss carryover as of October 31, 2012 with no expiration are as follows:
|
|
|
|
|
|
|
|
|
Fund |
|
| Short Term |
| Long Term |
| ||
|
|
|
| |||||
Dynamic Dividend Fund |
| $ | 54,009,069 |
| $ | — |
| |
Financial Services Fund |
|
| — |
|
| 32,393 |
| |
Foundation Fund |
|
| — |
|
| 3,563,021 |
| |
Certain ordinary losses incurred after December 31 and within the taxable year are deemed to arise on the first day of the Funds’ next taxable year, if the Funds so elect. For the year ended October 31, 2012, the following Funds elected to defer late-year ordinary losses:
|
|
|
|
|
|
|
|
Fund |
|
| Late Year |
| |||
|
|
| |||||
Innovators Fund |
|
| $ | 106,328 |
|
| |
Transformations Fund |
|
| $ | 35,046 |
|
| |
In accordance with U.S. GAAP, the Funds have previously adopted accounting standards related to the accounting for uncertain tax positions. In accordance with this guidance, the Funds analyzed all open tax years, as defined by the Statute of Limitations, for all major jurisdiction. Open tax years are those that are open for exam by taxing authorities. Major jurisdictions for the Funds included Federal and the state of New York. As of October 31, 2012, open Federal and New York tax years include the tax years ended October 31, 2009 through 2012. The Funds have no examination in progress.
The Funds have reviewed all open tax years and major jurisdictions and concluded that there is no impact on the Funds’ net assets and no tax liability resulting from unrecognized tax benefits relating to uncertain income tax positions taken in previous years or expected to be taken on the tax return for the fiscal year-end October 31, 2012.
119
|
Alpine Mutual Funds |
Notes to Financial Statements—Continued
October 31, 2012
|
|
| Also, the Funds have recognized no interest and penalties related to uncertain tax benefits. The Funds are also not aware of any tax positions for which it is reasonably possible that the total amounts of unrecognized tax benefits will significantly change in the next twelve months. |
|
|
8. | Subsequent Events: |
|
|
| Distributions: The Dynamic Dividend Fund—Institutional Class and Class A paid a distribution from net investment income of $4,211,624 and $20,366 or $0.042 and $0.0413 per share, respectively, on November 30, 2012 to shareholders of record on November 29, 2012. The Accelerating Dividend Fund—Institutional Class and Class A paid a distribution from net investment income of $6,660 and $754 or $0.0398 and $0.0372 per share, respectively, on November 30, 2012 to shareholders of record on November 29, 2012. The Ultra Short Tax Optimized Income Fund—Class A and Institutional Class paid a distribution from net investment income of $130,590 and $683,404 or $0.00304935 and $0.00508481 per share, respectively, on November 30, 2012 to shareholders of record on November 29, 2012. |
| |
| The Accelerating Dividend Fund—Institutional Class and Class A paid a distribution from long-term capital gains of $0.24113 on December 18, 2012 to shareholders of record on December 17, 2012. The Transformations Fund—Institutional Class and Class A paid a distribution from long-term capital gains of $0.08101 on December 18, 2012 to shareholders of record on December 17, 2012. |
| |
| Portfolio Management: Effective December 13, 2012, the Adviser announced a new team based approach to management of the Alpine Dynamic Divided Fund and that newly appointed co-portfolio managers Joshua Duitz and Brian Hennessey, who previously served as associate portfolio managers of the Fund, will lead the new investment team and will be responsible for the day-to-day management of the Fund. |
| |
| The investment team also includes experienced Alpine portfolio managers and research analysts, who will provide analysis and recommendations regarding the sectors they cover. The team includes Samuel A. Lieber (C.E.O.), Stephen A. Lieber (C.I.O.) and Bruce Ebnother (Senior Investment Risk Strategist) who will provide strategic oversight. The previous co-portfolio managers are no longer part of the investment team. |
120
|
Alpine Mutual Funds |
REPORT OF INDEPENDENT REGISTERED ACCOUNTING FIRM
|
|
| To the Shareholders and Board of Trustees of |
|
|
| We have audited the accompanying statements of assets and liabilities, including the schedules of portfolio investments, of Alpine Series Trust, comprised of Alpine Dynamic Dividend Fund, Alpine Accelerating Dividend Fund, Alpine Financial Services Fund (formerly Alpine Dynamic Financial Services Fund), Alpine Innovators Fund (formerly Alpine Dynamic Innovators Fund), Alpine Transformations Fund (formerly Alpine Dynamic Transformations Fund) and Alpine Foundation Fund (formerly Alpine Dynamic Balance Fund); and Alpine Income Trust, comprised of the Alpine Ultra Short Tax Optimized Income Fund and the Alpine Municipal Money Market Fund (collectively the “Funds”) as of October 31, 2012, and the related statements of operations for the year then ended, the statements of changes in net assets for each of the two years in the period then ended, and the financial highlights for each of the periods presented. These financial statements and financial highlights are the responsibility of the Funds’ management. Our responsibility is to express an opinion on these financial statements and financial highlights based on our audits. |
|
|
| We conducted our audits in accordance with the standards of the Public Company Accounting Oversight Board (United States). Those standards require that we plan and perform the audit to obtain reasonable assurance about whether the financial statements and financial highlights are free of material misstatement. The Funds are not required to have, nor were we engaged to perform, an audit of their internal control over financial reporting. Our audits included consideration of internal control over financial reporting as a basis for designing audit procedures that are appropriate in the circumstances, but not for the purpose of expressing an opinion on the effectiveness of the Funds’ internal control over financial reporting. Accordingly, we express no such opinion. An audit also includes examining, on a test basis, evidence supporting the amounts and disclosures in the financial statements, assessing the accounting principles used and significant estimates made by management, as well as evaluating the overall financial statement presentation. Our procedures included confirmation of securities owned as of October 31, 2012, by correspondence with the custodian and brokers; where replies were not received from brokers, we performed other auditing procedures. We believe that our audits provide a reasonable basis for our opinion. |
|
|
| In our opinion, the financial statements and financial highlights referred to above present fairly, in all material respects, the financial positions of Alpine Dynamic Dividend Fund, Alpine Accelerating Dividend Fund, Alpine Financial Services Fund, Alpine Innovators Fund, Alpine Transformations Fund, and Alpine Foundation Fund of Alpine Series Trust; and Alpine Ultra Short Tax Optimized Income Fund and Alpine Municipal Money Market Fund of Alpine Income Trust, as of October 31, 2012, the results of their operations for the year then ended, the changes in their net assets for each of the two years in the period then ended, and the financial highlights for each of the periods presented, in conformity with accounting principles generally accepted in the United States of America. |
|
|
|
|
| Princeton, New Jersey |
121
|
Alpine Mutual Funds |
Information about your Funds Expenses (unaudited)
Expense Examples
October 31, 2012
Fund expenses
Example
As a shareholder of the Fund, you may incur two types of costs: (1) transaction costs, including front-end on purchase payments; and (2) ongoing costs, including management fees; service and/or distribution (12b-1) fees; and other Fund expenses. This example is intended to help you understand your ongoing costs (in dollars) of investing in the Fund and to compare these costs with the ongoing costs of investing in other mutual funds.
This example is based on an investment of $1,000 invested on May 1, 2012 and held for the six months ended October 31, 2012.
Actual Expenses
The table below titled “Based on Actual Total Return” provides information about actual account values and actual expenses. You may use the information provided in this table, together with the amount you invested, to estimate the expenses that you paid over the period. To estimate the expenses you paid on your account, divide your ending account value by $1,000 (for example, an $8,600 ending account value divided by $1,000 = 8.6), then multiply the result by the number under the heading entitled “Expenses Paid During the Period”.
Hypothetical Example for Comparison Purposes
The table below titled “Based on Hypothetical Total Return” provides information about hypothetical account values and hypothetical expenses based on the actual expense ratio and an assumed rate of return of 5.00% per year before expenses, which is not the Fund’s actual return. The hypothetical account values and expenses may not be used to estimate the actual ending account balance or expenses you paid for the period. You may use the information provided in this table to compare the ongoing costs of investing in the Fund and other funds. To do so, compare the 5.00% hypothetical example relating to the Fund with the 5.00% hypothetical examples that appear in the shareholder reports of the other funds.
Please note that the expenses shown in the table below are meant to highlight your ongoing costs only and do not reflect any transactional costs, such as front-end or back-end sales charges (loads). Therefore, the table is useful in comparing ongoing costs only, and will not help you determine the relative total costs of owning different funds. In addition, if these transaction costs were included, your costs would have been higher.
Dynamic Dividend Fund
|
|
|
|
|
|
|
|
|
|
|
|
|
|
|
|
|
|
|
|
|
|
|
|
Based on actual total return (1) | |||||||||||||||||||||||
Class |
|
| Actual Total |
| Beginning |
| Ending |
| Annualized |
| Expense |
| |||||||||||
|
|
|
|
|
|
| |||||||||||||||||
| |||||||||||||||||||||||
Class A |
| 0.72 | % |
|
| $ | 1,000.00 |
|
|
| $ | 1,007.20 |
|
| 1.60 | % |
|
| $ | 8.07 |
|
| |
|
|
|
|
|
|
|
|
|
|
|
|
|
|
|
|
|
|
|
|
|
|
| |
Institutional Class |
| 0.82 | % |
|
| $ | 1,000.00 |
|
|
| $ | 1,008.20 |
|
| 1.35 | % |
|
| $ | 6.81 |
|
| |
|
|
|
|
|
|
|
|
|
|
|
|
|
|
|
|
| |||||||
Based on hypothetical total return (1) | |||||||||||||||||||||||
Class |
|
| Hypothetical |
| Beginning |
| Ending |
| Annualized |
| Expenses |
| |||||||||||
|
|
|
|
|
|
| |||||||||||||||||
| |||||||||||||||||||||||
Class A |
| 5.00 | % |
|
| $ | 1,000.00 |
|
|
| $ | 1,017.09 |
|
| 1.60 | % |
|
| $ | 8.11 |
|
| |
|
|
|
|
|
|
|
|
|
|
|
|
|
|
|
|
|
|
|
|
|
|
| |
Institutional Class |
| 5.00 | % |
|
| $ | 1,000.00 |
|
|
| $ | 1,018.35 |
|
| 1.35 | % |
|
| $ | 6.85 |
|
| |
122
|
Alpine Mutual Funds |
Information about your Funds Expenses (unaudited)—Continued
Expense Examples
October 31, 2012
|
|
|
|
|
|
|
|
|
|
|
|
|
|
|
|
|
|
|
|
|
|
|
|
Accelerating Dividend Fund | |||||||||||||||||||||||
|
|
|
|
|
|
|
|
|
|
|
|
|
|
|
|
|
|
|
|
|
|
| |
Based on actual total return (1) | |||||||||||||||||||||||
Class |
|
| Actual Total |
| Beginning |
| Ending |
| Annualized |
| Expenses |
| |||||||||||
|
|
|
|
|
|
| |||||||||||||||||
|
|
|
|
|
|
|
|
|
|
|
|
|
|
|
|
|
|
|
|
|
|
| |
Class A |
| 0.76 | % |
|
| $ | 1,000.00 |
|
|
| $ | 1,007.60 |
|
| 1.68 | % |
|
| $ | 8.48 |
|
| |
|
|
|
|
|
|
|
|
|
|
|
|
|
|
|
|
|
|
|
|
|
|
|
|
Institutional Class |
| 0.87 | % |
|
| $ | 1,000.00 |
|
|
| $ | 1,008.70 |
|
| 1.34 | % |
|
| $ | 6.77 |
|
| |
|
|
|
|
|
|
|
|
|
|
|
|
|
|
|
|
|
|
|
|
|
|
| |
Based on hypothetical total return (1) | |||||||||||||||||||||||
|
| Hypothetical |
| Beginning |
| Ending |
| Annualized |
| Expenses |
| ||||||||||||
|
|
|
|
|
|
| |||||||||||||||||
|
|
|
|
|
|
|
|
|
|
|
|
|
|
|
|
|
|
|
|
|
|
| |
Class A |
| 5.00 | % |
|
| $ | 1,000.00 |
|
|
| $ | 1,016.69 |
|
| 1.68 | % |
|
| $ | 8.52 |
|
| |
|
|
|
|
|
|
|
|
|
|
|
|
|
|
|
|
|
|
|
|
|
|
| |
Institutional Class |
| 5.00 | % |
|
| $ | 1,000.00 |
|
|
| $ | 1,018.40 |
|
| 1.34 | % |
|
| $ | 6.80 |
|
| |
|
|
|
|
|
|
|
|
|
|
|
|
|
|
|
|
|
|
|
|
|
|
| |
Financial Services Fund | |||||||||||||||||||||||
|
|
|
|
|
|
|
|
|
|
|
|
|
|
|
|
|
|
|
|
|
|
| |
Based on actual total return (1) | |||||||||||||||||||||||
Class |
|
| Actual Total |
| Beginning |
| Ending |
| Annualized |
| Expenses |
| |||||||||||
|
|
|
|
|
|
| |||||||||||||||||
|
|
|
|
|
|
|
|
|
|
|
|
|
|
|
|
|
|
|
|
|
|
| |
Class A |
| 5.93 | % |
|
| $ | 1,000.00 |
|
|
| $ | 1,059.30 |
|
| 1.52 | % |
|
| $ | 7.87 |
|
| |
|
|
|
|
|
|
|
|
|
|
|
|
|
|
|
|
|
|
|
|
|
|
| |
Institutional Class |
| 6.05 | % |
|
| $ | 1,000.00 |
|
|
| $ | 1,060.50 |
|
| 1.36 | % |
|
| $ | 7.04 |
|
| |
|
|
|
|
|
|
|
|
|
|
|
|
|
|
|
|
|
|
|
|
|
|
| |
Based on hypothetical total return (1) | |||||||||||||||||||||||
Class |
|
| Hypothetical |
| Beginning |
| Ending |
| Annualized |
| Expenses |
| |||||||||||
|
|
|
|
|
|
| |||||||||||||||||
|
|
|
|
|
|
|
|
|
|
|
|
|
|
|
|
|
|
|
|
|
|
| |
Class A |
| 5.00 | % |
|
| $ | 1,000.00 |
|
|
| $ | 1,017.50 |
|
| 1.52 | % |
|
| $ | 7.71 |
|
| |
|
|
|
|
|
|
|
|
|
|
|
|
|
|
|
|
|
|
|
|
|
|
| |
Institutional Class |
| 5.00 | % |
|
| $ | 1,000.00 |
|
|
| $ | 1,018.30 |
|
| 1.36 | % |
|
| $ | 6.90 |
|
| |
|
|
|
|
|
|
|
|
|
|
|
|
|
|
|
|
|
|
|
|
|
|
| |
Innovators Fund | |||||||||||||||||||||||
|
|
|
|
|
|
|
|
|
|
|
|
|
|
|
|
|
|
|
|
|
|
| |
Based on actual total return (1) | |||||||||||||||||||||||
Class |
|
| Actual Total |
| Beginning |
| Ending |
| Annualized |
| Expenses |
| |||||||||||
|
|
|
|
|
|
| |||||||||||||||||
|
|
|
|
|
|
|
|
|
|
|
|
|
|
|
|
|
|
|
|
|
|
| |
Class A |
| (8.28 | )% |
|
| $ | 1,000.00 |
|
|
| $ | 917.20 |
|
| 1.61 | % |
|
| $ | 7.76 |
|
| |
|
|
|
|
|
|
|
|
|
|
|
|
|
|
|
|
|
|
|
|
|
|
| |
Institutional Class |
| (8.11 | )% |
|
| $ | 1,000.00 |
|
|
| $ | 918.90 |
|
| 1.35 | % |
|
| $ | 6.51 |
|
| |
|
|
|
|
|
|
|
|
|
|
|
|
|
|
|
|
|
|
|
|
|
|
| |
Based on hypothetical total return (1) | |||||||||||||||||||||||
Class |
|
| Hypothetical |
| Beginning |
| Ending |
| Annualized |
| Expenses |
| |||||||||||
|
|
|
|
|
|
| |||||||||||||||||
|
|
|
|
|
|
|
|
|
|
|
|
|
|
|
|
|
|
|
|
|
|
| |
Class A |
| 5.00 | % |
|
| $ | 1,000.00 |
|
|
| $ | 1,017.04 |
|
| 1.61 | % |
|
| $ | 8.16 |
|
| |
|
|
|
|
|
|
|
|
|
|
|
|
|
|
|
|
|
|
|
|
|
|
| |
Institutional Class |
| 5.00 | % |
|
| $ | 1,000.00 |
|
|
| $ | 1,018.35 |
|
| 1.35 | % |
|
| $ | 6.85 |
|
| |
123
|
Alpine Mutual Funds |
Information about your Funds Expenses (unaudited)—Continued
Expense Examples
October 31, 2012
|
|
|
|
|
|
|
|
|
|
|
|
|
|
|
|
|
|
|
|
|
|
|
|
Transformations Fund |
|
|
|
|
|
|
|
|
|
|
|
|
|
|
|
|
|
|
| ||||
|
|
|
|
|
|
|
|
|
|
|
|
|
|
|
|
|
|
|
|
|
|
|
|
Based on actual total return (1) |
|
|
|
|
|
|
|
|
|
|
|
|
|
|
|
|
|
|
| ||||
Class |
|
| Actual Total |
| Beginning |
| Ending |
| Annualized |
| Expenses |
| |||||||||||
|
|
|
|
|
|
| |||||||||||||||||
|
|
|
|
|
|
|
|
|
|
|
|
|
|
|
|
|
|
|
|
|
|
|
|
Class A |
| (10.28 | )% |
|
| $ | 1,000.00 |
|
|
| $ | 897.20 |
|
| 1.60 | % |
|
| $ | 7.63 |
|
| |
|
|
|
|
|
|
|
|
|
|
|
|
|
|
|
|
|
|
|
|
|
|
|
|
Institutional Class |
| (10.18 | )% |
|
| $ | 1,000.00 |
|
|
| $ | 898.20 |
|
| 1.35 | % |
|
| $ | 6.44 |
|
| |
|
|
|
|
|
|
|
|
|
|
|
|
|
|
|
|
|
|
|
|
|
|
|
|
Based on hypothetical total return (1) | |||||||||||||||||||||||
Class |
|
| Hypothetical |
| Beginning |
| Ending |
| Annualized |
| Expenses |
| |||||||||||
|
|
|
|
|
|
| |||||||||||||||||
|
|
|
|
|
|
|
|
|
|
|
|
|
|
|
|
|
|
|
|
|
|
|
|
Class A |
| 5.00 | % |
|
| $ | 1,000.00 |
|
|
| $ | 1,017.09 |
|
| 1.60 | % |
|
| $ | 8.11 |
|
| |
|
|
|
|
|
|
|
|
|
|
|
|
|
|
|
|
|
|
|
|
|
|
|
|
Institutional Class |
| 5.00 | % |
|
| $ | 1,000.00 |
|
|
| $ | 1,018.35 |
|
| 1.35 | % |
|
| $ | 6.85 |
|
| |
|
|
|
|
|
|
|
|
|
|
|
|
|
|
|
|
|
|
|
|
|
|
|
|
Foundation Fund | |||||||||||||||||||||||
|
|
|
|
|
|
|
|
|
|
|
|
|
|
|
|
|
|
|
|
|
|
|
|
Based on actual total return (1) | |||||||||||||||||||||||
Class |
|
| Actual Total |
| Beginning |
| Ending |
| Annualized |
| Expenses |
| |||||||||||
|
|
|
|
|
|
| |||||||||||||||||
|
|
|
|
|
|
|
|
|
|
|
|
|
|
|
|
|
|
|
|
|
|
|
|
Class A |
| 1.31 | % |
|
| $ | 1,000.00 |
|
|
| $ | 1,013.10 |
|
| 1.46 | % |
|
| $ | 7.39 |
|
| |
|
|
|
|
|
|
|
|
|
|
|
|
|
|
|
|
|
|
|
|
|
|
|
|
Institutional Class |
| 1.39 | % |
|
| $ | 1,000.00 |
|
|
| $ | 1,013.90 |
|
| 1.22 | % |
|
| $ | 6.18 |
|
| |
|
|
|
|
|
|
|
|
|
|
|
|
|
|
|
|
|
|
|
|
|
|
|
|
Based on hypothetical total return (1) | |||||||||||||||||||||||
Class |
|
| Hypothetical |
| Beginning |
| Ending |
| Annualized |
| Expenses |
| |||||||||||
|
|
|
|
|
|
| |||||||||||||||||
|
|
|
|
|
|
|
|
|
|
|
|
|
|
|
|
|
|
|
|
|
|
|
|
Class A |
| 5.00 | % |
|
| $ | 1,000.00 |
|
|
| $ | 1,017.80 |
|
| 1.46 | % |
|
| $ | 7.41 |
|
| |
|
|
|
|
|
|
|
|
|
|
|
|
|
|
|
|
|
|
|
|
|
|
|
|
Institutional Class |
| 5.00 | % |
|
| $ | 1,000.00 |
|
|
| $ | 1,019.00 |
|
| 1.22 | % |
|
| $ | 6.19 |
|
| |
|
|
|
|
|
|
|
|
|
|
|
|
|
|
|
|
|
|
|
|
|
|
|
|
Ultra Short Tax Optimized Income Fund | |||||||||||||||||||||||
|
|
|
|
|
|
|
|
|
|
|
|
|
|
|
|
|
|
|
|
|
|
|
|
Based on actual total return (1) | |||||||||||||||||||||||
Class |
|
| Actual Total |
| Beginning |
| Ending |
| Annualized |
| Expenses |
| |||||||||||
|
|
|
|
|
|
| |||||||||||||||||
|
|
|
|
|
|
|
|
|
|
|
|
|
|
|
|
|
|
|
|
|
|
|
|
Class A |
| 0.21 | % |
|
| $ | 1,000.00 |
|
|
| $ | 1,002.10 |
|
| 0.90 | % |
|
| $ | 4.53 |
|
| |
|
|
|
|
|
|
|
|
|
|
|
|
|
|
|
|
|
|
|
|
|
|
|
|
Institutional Class |
| 0.34 | % |
|
| $ | 1,000.00 |
|
|
| $ | 1,003.40 |
|
| 0.65 | % |
|
| $ | 3.27 |
|
| |
|
|
|
|
|
|
|
|
|
|
|
|
|
|
|
|
|
|
|
|
|
|
|
|
Based on hypothetical total return (1) | |||||||||||||||||||||||
Class |
|
| Hypothetical |
| Beginning |
| Ending |
| Annualized |
| Expenses |
| |||||||||||
|
|
|
|
|
|
| |||||||||||||||||
|
|
|
|
|
|
|
|
|
|
|
|
|
|
|
|
|
|
|
|
|
|
|
|
Class A |
| 5.00 | % |
|
| $ | 1,000.00 |
|
|
| $ | 1,020.61 |
|
| 0.90 | % |
|
| $ | 4.57 |
|
| |
|
|
|
|
|
|
|
|
|
|
|
|
|
|
|
|
|
|
|
|
|
|
|
|
Institutional Class |
| 5.00 | % |
|
| $ | 1,000.00 |
|
|
| $ | 1,021.87 |
|
| 0.65 | % |
|
| $ | 3.30 |
|
| |
124
|
Alpine Mutual Funds |
Information about your Funds Expenses (unaudited)—Continued
Expense Examples
October 31, 2012
|
|
|
|
|
|
|
|
|
|
|
|
|
|
|
|
|
|
|
|
|
|
|
|
Municipal Money Market Fund | |||||||||||||||||||||||
|
|
|
|
|
|
|
|
|
|
|
|
|
|
|
|
|
|
|
|
|
|
|
|
Based on actual total return (1) | |||||||||||||||||||||||
Class |
|
| Actual Total |
| Beginning |
| Ending |
| Annualized |
| Expenses |
| |||||||||||
|
|
|
|
|
|
| |||||||||||||||||
|
|
|
|
|
|
|
|
|
|
|
|
|
|
|
|
|
|
|
|
|
|
|
|
Investor Class |
| 0.05 | % |
|
| $ | 1,000.00 |
|
|
| $ | 1,000.50 |
|
| 0.32 | % |
|
| $ | 1.61 |
|
| |
|
|
|
|
|
|
|
|
|
|
|
|
|
|
|
|
|
|
|
|
|
|
|
|
Based on hypothetical total return (1) | |||||||||||||||||||||||
Class |
|
| Hypothetical |
| Beginning |
| Ending |
| Annualized |
| Expenses |
| |||||||||||
|
|
|
|
|
|
| |||||||||||||||||
|
|
|
|
|
|
|
|
|
|
|
|
|
|
|
|
|
|
|
|
|
|
|
|
Investor Class |
| 5.00 | % |
|
| $ | 1,000.00 |
|
|
| $ | 1,023.53 |
|
| 0.32 | % |
|
| $ | 1.63 |
|
| |
|
|
|
| ||
(1) | For the six months period ended October 31, 2012. | |
(2) | Assumes the reinvestment of all distributions, including returns of capital, if any, at net asset value and does not reflect the deduction of the applicable sales charge. Total return is not annualized, as it may not be representative of the total return for the year. Performance figures may reflect fee waivers and/or expense reimbursements. In the absence of fee waivers and/or expense reimbursements, the total return would have been lower. Past performance is no guarantee of future results. | |
(3) | Expenses (net of fee waivers and/or expense reimbursements) are equal to each class’ respective annualized expense ratio multiplied by the average account value over the period, multiplied by the number of days in the most recent fiscal half-year then divided by 366. | |
(4) | Hypothetical expense examples assume a 5% return over a hypothetical 184 day period. | |
125
|
Alpine Mutual Funds |
Additional Information (unaudited)
October 31, 2012
|
|
|
|
|
|
|
|
|
|
|
|
|
|
|
|
|
Independent Trustees | ||||||||||||||||
|
|
|
|
|
|
|
|
|
|
| ||||||
Name and Age |
| Position(s) |
| Term of Office |
| Principal Occupation During |
| # of |
| Other Directorships | ||||||
|
|
|
|
| ||||||||||||
|
|
|
|
|
|
|
|
|
|
| ||||||
H. Guy Leibler (58) |
| Independent Trustee |
| Indefinite, since the Trust’s inception |
| Private investor, since 2007; Vice Chair & Chief Operating Officer of L&L Acquisitions, LLC (2004-2007); President, Skidmore, Owings & Merrill LLP (2001-2004). |
| 17 |
| Chairman Emeritus, White Plains Hospital Center; Trustee, each of the Alpine Trusts. | ||||||
|
|
|
|
|
|
|
|
|
|
| ||||||
Jeffrey E. Wacksman (52) |
| Independent Trustee |
| Indefinite, since 2004 |
| Partner, Loeb, Block & Partners LLP, since 1994. |
| 17 |
| Director, International Succession Planning Association; Director, Bondi Icebergs Inc. (Women’s Sports-wear); Director, MH Properties, Inc.; Trustee, each of the Alpine Trusts. | ||||||
|
|
|
|
|
|
|
|
|
|
| ||||||
James A. Jacobson (67) |
| Independent Trustee |
| Indefinite, since July 2009 |
| Retired, since November 2008; Vice Chairman and Managing Director, Spear Leeds & Kellogg Specialists, LLC, January 2003 to November 2008. |
| 17 |
| Trustee, Allianz Global Investors Multi-Funds. Trustee, each of the Alpine Trusts. | ||||||
|
|
|
|
|
|
|
|
|
|
| ||||||
Eleanor T.M. Hoagland (61) |
| Independent Trustee |
| Indefinite, since October 2012 |
| Principal, VCS Advisory, LLC (since 2011); Chief Compliance Officer and Senior Managing Director of Magni Asset Management LLC (since 2011) and Park Fifth Capital Management LLC (since 2011) Vice President (2008-2010) and CCO (2009-2010), Ameriprise Financial Inc.; Managing Director (2000-2008) and CCO (2004-2008), J. & W. Seligman |
| 17 |
| Trustee of each of the Alpine Trusts. | ||||||
|
|
* | The term “Fund Complex” refers to the Funds in the Alpine Equity Trust, Alpine Series Trust, and Alpine Income Trust, and Alpine Global Dynamic Dividend Fund, Alpine Total Dynamic Dividend Fund, and Alpine Global Premier Properties Fund (the “Alpine Trusts”). |
126
|
Alpine Mutual Funds |
Additional Information (unaudited)—Continued
October 31, 2012
|
|
|
|
|
|
|
|
|
|
|
|
|
|
|
|
|
Interested Trustees & Officers | ||||||||||||||||
|
|
|
|
|
|
|
|
|
|
| ||||||
Name and Age |
| Position(s) |
| Term of Office |
| Principal Occupation During |
| # of |
| Other Directorships | ||||||
|
|
|
|
| ||||||||||||
|
|
|
|
|
|
|
|
|
|
| ||||||
Samuel A. Lieber* (56) |
| Interested Trustee, President and Portfolio Manager |
| Indefinite, since the Trust’s inception |
| CEO of Alpine Woods Capital Investors, LLC since November 1997. President of Alpine Trusts since 1998. |
| 17 |
| Trustee, each of the Alpine Trusts. | ||||||
|
|
|
|
|
|
|
|
|
|
| ||||||
Stephen A. Lieber*** (87) |
| Vice President and Portfolio Manager |
| Indefinite, since the Trust’s inception |
| Chief Investment Officer, Alpine Woods Capital Investors, LLC since 2003; Chairman and Senior Portfolio Manager, Saxon Woods Advisors, LLC since 1999. |
| 17 |
| None | ||||||
|
|
|
|
|
|
|
|
|
|
| ||||||
John Megyesi (52) |
| Chief Compliance Officer |
| Indefinite, since January 2009 |
| Chief Compliance Officer, Alpine Woods Capital Investors, LLC since January 2009; Vice President and Manager, Trade Surveillance, Credit Suisse Asset Management, LLC (2006-2009); Manager, Trading and Surveillance, Allianz Global Investors (2004-2006). |
| 17 |
| None | ||||||
Ronald Palmer (44) |
| Chief Financial Officer and Treasurer |
| Indefinite, since January 2010 |
| Chief Financial Officer, Alpine Woods Capital Investors, LLC since January 2010; Independent Consultant (2008-2009); Vice President, Cash Management and Foreign Exchange, Macquarie Capital Investment Management, LLC (2007-2008); Chief Operating Officer, Macquarie Fund Adviser, LLC (2004-2007). |
| 17 |
| None | ||||||
|
|
|
|
|
|
|
|
|
|
| ||||||
Andrew Pappert (32) |
| Secretary |
| Indefinite, since March 2009 |
| Director of Fund Operations, Alpine Woods Capital Investors, LLC since September 2008; Assistant Vice President, Mutual Fund Operations, Credit Suisse Asset Management, LLC (2003-2008). |
| 17 |
| None | ||||||
|
|
|
|
|
|
|
|
|
|
| ||||||
|
|
|
* |
| Denotes Trustees who are “interested persons” of the Trust or Fund under the 1940 Act. |
** |
| The term “Fund Complex” refers to the Funds in the Alpine Equity Trust, Alpine Series Trust, and Alpine Income Trust, and Alpine Global Dynamic Dividend Fund, Alpine Total Dynamic Dividend Fund, and Alpine Global Premier Properties Fund (the “Alpine Trusts”). |
*** |
| Stephen A. Lieber is the father of Samuel A. Lieber. |
|
|
|
Further information regarding the Fund’s Trustees is also available in the Funds’ Statement of Additional Information, which can be obtained without charge by calling 1-888-785-5578. | ||
127
|
Alpine Mutual Funds |
Additional Information (unaudited)—Continued
October 31, 2012
Tax Information
The Funds designated the following percentages of dividends declared from net investment income for the fiscal year ended October 31, 2012 as qualified dividend income under the Jobs & Growth Tax Relief Reconciliation Act of 2003.
|
|
Dynamic Dividend Fund | 54% |
Accelerating Dividend Fund | 40% |
Financial Services Fund | 0% |
Innovators Fund | 0% |
Transformations Fund | 0% |
Foundation Fund | 93% |
Ultra Short Tax Optimized Income Fund | 0% |
Municipal Money Market Fund | 0% |
The Funds designated the following percentages of dividends declared during the fiscal year ended October 31, 2012 as dividends qualifying for the dividends received deduction available to corporate shareholders.
|
|
Dynamic Dividend Fund | 31% |
Accelerating Dividend Fund | 35% |
Financial Services Fund | 0% |
Innovators Fund | 0% |
Transformations Fund | 0% |
Foundation Fund | 82% |
Ultra Short Tax Optimized Income Fund | 0% |
Municipal Money Market Fund | 0% |
The Funds designated the following percentages of taxable ordinary income distributions as short-term capital gain distributions under Internal Revenue Section 871(k)(2)(C).
|
|
Dynamic Dividend Fund | 0% |
Accelerating Dividend Fund | 0% |
Financial Services Fund | 0% |
Innovators Fund | 0% |
Transformations Fund | 0% |
Foundation Fund | 0% |
Ultra Short Tax Optimized Income Fund | 0% |
Municipal Money Market Fund | 0% |
The Fund designated as long-term capital gain dividend, pursuant to Internal Revenue Cose Section 852(b)(3), the amount necessary to reduce the earnings and profits of the Fund related to net capital gain to zero for the tax year ended October 31, 2012.
Availability of Proxy Voting Information
Information regarding how each Fund votes proxies relating to portfolio securities is available without charge upon request by calling toll-free at 1-888-785-5578 and on the SEC’s website at www.sec.gov. Information regarding how each Fund voted proxies relating to portfolio securities during the most recent twelve month period ended June 30 is available on the SEC’s website at www.sec.gov or by calling the toll-free number listed above.
Availability of Quarterly Portfolio Schedule
Beginning with each Fund’s fiscal quarter ended July 31, 2004, each Fund filed its complete schedule of portfolio holdings on Form N-Q with the SEC. Going forward, each Fund will file Form N-Q for the first and third quarters of each fiscal year on Form N-Q. Each Fund’s Form N-Q is available on the SEC’s website at www.sec.gov and may be reviewed and copied at the SEC’s Public Reference Room in Washington, DC. Information on the operation of the Public Reference Room may be obtained by calling 1-202-551-8090.
128
|
Alpine Mutual Funds |
Additional Information (unaudited)—Continued
October 31, 2012
Privacy Policy
The Funds collect non-public information about you from the following sources:
|
|
|
| • | information we receive about you on applications or other forms; |
| • | information you give us orally; and |
| • | information about your transactions with others or us. |
The Funds do not disclose any non-public personal information about our customers or former customers without the customer’s authorization, except as required by law or in response to inquiries from governmental authorities. The Funds restrict access to your personal and account information to those employees who need to know that information to provide products and services to you. The Funds also may disclose that information to unaffiliated third parties (such as to brokers or custodians) only as permitted by law and only as needed for us to provided agreed services to you. The Funds maintain physical, electronic and procedural safeguards to guard your non-public personal information.
In the event that you hold shares of the Funds through a financial intermediary, including, but not limited to a broker dealer, bank or trust company, the privacy policy of your financial intermediary would govern how your non-public personal information would be shared with unaffiliated third parties.
SHAREHOLDER MEETING
On June 8, 2012, the Fund held its Annual Meeting of Shareholders (the “Meeting”) for the purpose of voting on proposals below. The results stated as a percentage of the shares voted are as follows:
Proposal 1: To elect H. Guy Leibler, James A. Jacobson, Jeffrey E. Wacksman, and Samuel A. Lieber as Trustee to the Board of Trustees for an indefinite term or until his successor has been duly elected and qualified.
|
|
|
|
|
|
| Series Trust |
| Income Trust | ||
| For | Withheld |
| For | Withheld |
H. Guy Leibler | 89.99% | 10.01% |
| 99.15% | 0.85% |
James A. Jacobson | 90.14% | 9.86% |
| 99.13% | 0.87% |
Jeffrey E. Wacksman | 90.17% | 9.83% |
| 99.26% | 0.74% |
Samuel A. Lieber | 89.85% | 10.15% |
| 98.63% | 1.37% |
Proposal 2: To transact such other business as may properly come before the meeting or any adjournments or postponements thereof.
|
|
|
|
|
| Series Trust |
| Income Trust | |
| For | 85.69% |
| 80.33% |
| Against | 10.62% |
| 18.73% |
| Abstain | 3.69% |
| 0.94% |
129
|
TRUSTEES |
Samuel A. Lieber |
Eleanor T.M. Hoagland |
James A. Jacobson |
H. Guy Leibler |
Jeffrey E. Wacksman |
|
CUSTODIAN & |
ADMINISTRATOR |
State Street Bank & Trust Company |
One Lincoln Street |
Boston, MA 02111 |
|
INDEPENDENT REGISTERED |
PUBLIC ACCOUNTING FIRM |
Deloitte & Touche LLP |
500 College Road East |
Princeton, NJ 08540 |
|
FUND COUNSEL |
Wilkie Farr & Gallagher |
787 7th Avenue, 40th FL |
New York, NY 10019 |
|
DISTRIBUTOR |
Quasar Distributors, LLC |
615 East Michigan Street |
Milwaukee, WI 53202 |
|
INVESTMENT ADVISER |
Alpine Woods Capital Investors, LLC |
2500 Westchester Ave., Suite 215 |
Purchase, NY 10577 |
|
TRANSFER AGENT |
Boston Financial Data Services |
Two Heritage Drive |
North Quincy, MA 02171 |
|
|
|
SHAREHOLDER | INVESTOR INFORMATION |
|
1(888)785.5578 |
www.alpinefunds.com |
|
|
This material must be preceded or accompanied by a current prospectus. |

|
|
Item 2. | Code of Ethics. |
|
|
| (a) The Registrant, as of the end of the period covered by the report, has adopted a code of ethics that applies to the Registrant’s principal executive officer, principal financial officer, principal accounting officer or controller or persons performing similar functions. |
|
|
Item 3. | Audit Committee Financial Expert. |
|
|
| (a)(1) The Board of Trustees of the Registrant has determined that the Registrant has at least one audit committee financial expert serving on its audit committee. |
|
|
| (a)(2) The Board of Trustees has determined that James A. Jacobson and H. Guy Leibler are audit committee financial experts. Messrs. Jacobson and Leibler are “independent” as defined in paragraph (a)(2) of Item 3 to Form N-CSR. It has been determined that Mr. Jacobson qualifies as an audit committee financial expert based on his extensive experience in the financial services industry, including serving for more than 15 years as a senior executive at a New York Stock Exchange (“NYSE”) specialist firm and as a member of the NYSE Board of Directors (including terms as Vice Chair), his other board service, as well as his educational background. It has been determined that Mr. Leibler qualifies as an audit committee financial expert based on his substantial experience as a senior executive of an operating company actively supervising principal financial officers in the preparation of financial statements, other board service, as well as his educational background. |
|
|
| (a)(3) Not applicable. |
|
|
Item 4. | Principal Accountant Fees and Services. |
|
|
| (a) Audit Fees: The aggregate fees billed for each of the last two fiscal years for professional services rendered by the principal accountant for the audit of the registrant’s annual financial statements or services that are normally provided by the accountant in connection with statutory and regulatory filings or engagements for fiscal year 2011 was $108,480 and fiscal year 2012 was $89,390. |
|
|
| (b) Audit-Related Fees: The aggregate fees billed in each of the last two fiscal years for assurance and related services by the principal accountant that are reasonably related to the performance of the audit of the registrant’s financial statements and are not reported under paragraph (a) of this Item was $0 in fiscal year 2011 and $0 in fiscal year 2012. |
|
|
| (c) Tax Fees: The aggregate fees billed in each of the last two fiscal years for professional services rendered by the principal accountant for tax compliance, tax advice, and tax planning was $10,919 in fiscal year 2011 and $21,412 in fiscal year 2012. |
|
|
| (d) All Other Fees: The aggregate fees billed in each of the last two fiscal years for products and services provided by the principal accountant, other than the services reported in paragraphs (a) through (c) of this Item is $0 in fiscal year 2011 and $10,947 in fiscal year 2012. The fees were for consulting and advisory services regarding enterprise risk management. |
|
|
| (e)(1) Audit Committee Pre-Approval Policies and Procedures: All services to be performed by the Registrant’s principal auditors must be pre-approved by the Registrant’s audit committee, which may include the approval of certain services up to an amount determined by the audit committee. Any services that would exceed that amount would require additional approval of the audit committee. |
|
|
| (e)(2) No services described in paragraphs (b) through (d) were approved pursuant to paragraph (c)(7)(i)(C) of Rule 2-01 of Regulation S-X. |
|
|
| (f) Not applicable. |
|
|
| (g) The aggregate non-audit fees billed by the registrant’s accountant for services rendered to the registrant, and the registrant’s investment adviser, and any entity controlling, controlled by, or under common control with the adviser that provides ongoing services to the registrant was $0 in fiscal year 2011 and $109,474 in fiscal year 2012. |
|
|
| (h) Not applicable |
Item 5. Audit Committee of Listed Registrants.
Not applicable to registrants who are not listed issuers (as defined in Rule 10A-3 under the Securities Exchange Act of 1934).
Item 6. Investments.
Schedule of Investments is included as part of the report to shareholders filed under Item 1 of this Form.
Item 7. Disclosure of Proxy Voting Policies and Procedures for Closed-End Management Investment Companies.
Not applicable to open-end investment companies.
Item 8. Portfolio Managers of Closed-End Management Investment Companies.
Not applicable to open-end investment companies.
Item 9. Purchases of Equity Securities by Closed-End Management Investment Company and Affiliated Purchasers.
Not applicable to open-end investment companies.
Item 10. Submission of Matters to a Vote of Security Holders.
Not Applicable.
Item 11. Controls and Procedures.
|
|
(a) | The Registrant’s President and Chief Financial Officer have reviewed the Registrant’s disclosure controls and procedures (as defined in Rule 30a-3(c) under the Investment Company Act of 1940 (the “Act”)) as of a date within 90 days of the filing of this report, as required by Rule 30a-3(b) under the Act and Rules 13a-15(b) or 15d-15(b) under the Securities Exchange Act of 1934. Based on their review, such officers have concluded that the disclosure controls and procedures are effective in ensuring that information required to be disclosed in this report is appropriately recorded, processed, summarized and reported and made known to them by others within the Registrant and by the Registrant’s service provider. |
|
|
(b) | There were no changes in the Registrant’s internal control over financial reporting (as defined in Rule 30a-3(d) under the Act) that occurred during the second fiscal quarter of the period covered by this report that has materially affected, or is reasonably likely to materially affect, the Registrant’s internal control over financial reporting. |
|
|
Item 12. | Exhibits. |
|
|
| (a)(1) The Code of Ethics that applies to the Registrant’s principal executive officer and principal financial officer is attached hereto as Exhibit 12.A.1. |
|
|
| (a)(2) The certifications required by Rule 30a-2(a) of the Investment Company Act of 1940, as amended, and Section 302 of the Sarbanes-Oxley Act of 2002 are attached hereto as Ex99.Cert. |
|
|
| (a)(3) Not applicable. |
|
|
| (b) The certifications by the Registrant’s Principal Executive Officer and Principal Financial Officer, as required by Rule 30a-2(b) of the Investment Company Act of 1940, as amended, and Section 906 of the Sarbanes-Oxley Act of 2002 are attached hereto as Ex99.906Cert. |
SIGNATURES
Pursuant to the requirements of the Securities Exchange Act of 1934 and the Investment Company Act of 1940, the registrant has duly caused this report to be signed on its behalf by the undersigned, thereunto duly authorized.
|
|
|
Alpine Series Trust | ||
|
| |
By: | /s/ Samuel A. Lieber |
|
|
| |
| Samuel A. Lieber | |
| Chief Executive Officer (Principal Executive Officer) | |
|
| |
Date: | January 7, 2013 | |
Pursuant to the requirements of the Securities Exchange Act of 1934 and the Investment Company Act of 1940, this report has been signed below by the following persons on behalf of the registrant and in the capacities and on the dates indicated.
|
|
|
By: | /s/ Samuel A. Lieber | |
|
| |
| Samuel A. Lieber | |
| Chief Executive Officer (Principal Executive Officer) | |
|
| |
By: | /s/ Ronald G. Palmer, Jr. | |
|
| |
| Ronald G. Palmer, Jr. | |
| Chief Financial Officer (Principal Financial Officer) | |
|
| |
Date: | January 7, 2013 | |