UNITED STATES
SECURITIES AND EXCHANGE COMMISSION
Washington, D.C. 20549
FORM N-CSR
CERTIFIED SHAREHOLDER REPORT OF REGISTERED
MANAGEMENT INVESTMENT COMPANIES
Investment Company Act File number: 811-10405
Alpine Series Trust
(Exact name of registrant as specified in charter)
2500 Westchester Avenue, Suite 215
Purchase, New York 10577
(Address of principal executive offices)(Zip code)
(Name and Address of Agent for
Service) | Copy to: |
| | |
Samuel A. Lieber
Alpine Woods Capital Investors, LLC
2500 Westchester Avenue, Suite 215
Purchase, New York 10577 | Rose DiMartino
Attorney at Law
Willkie Farr & Gallagher
787 7th Avenue, 40th Floor
New York, New York 10019 |
Registrant’s telephone number, including area code: (914) 251-0880
Date of fiscal year end: October 31, 2013
Date of reporting period: November 1, 2012 – October 31, 2013
Item 1: Shareholder Report.
Table of Contents
Additional Alpine Funds are offered in the Alpine Equity Trust. These Funds include:
| Alpine International Real Estate Equity Fund | Alpine Global Infrastructure Fund |
| Alpine Realty Income & Growth Fund | Alpine Global Consumer Growth Fund |
| Alpine Cyclical Advantage Property Fund | |
| Alpine Emerging Markets Real Estate Fund | |
Alpine’s Real Estate Funds’ investment objectives, risks, charges and expenses must be considered carefully before investing in funds of the Alpine Equity Trust. The statutory and summary prospectuses contain this and other important information about the investment company, and it may be obtained by calling 1-888-785-5578, or visiting www.alpinefunds.com. Read it carefully before investing.
Mutual fund investing involves risk. Principal loss is possible.
Alpine’s Investment Outlook

President’s Letter
Dear Investors:
The fiscal year ended October 31, 2013 presented a difficult and complex year for investors across capital markets. However, like 2012, it has produced positive returns as economic and business momentum remain favorable. We are nearly five years past the trough of the global financial crisis which occurred from November, 2008 through early March, 2009. The positive performance of stocks since that time may appear to have moved ahead of the economic recovery in the real economy, however, this must be considered in the context of the extreme trough of valuations after the 2008 financial crisis. Generally, the price of many equities today, as measured against typical parameters such as price to earnings multiples, earnings yield relative to treasury yields, share price to cash flow, discounted cash flows, or EV/EBITDA (enterprise value divided by earnings before interest taxes depreciation and amortization), are typically less expensive than during the 2007 peak. Thus, in the context of a normalized business cycle we believe that the most relevant question becomes where are corporate earnings and overall business activity trending? Given the slow pace of recovery, Alpine believes that we are only in the middle of a protracted economic cycle.
The slow pace of recovery as measured by job creation, business capital expenditures, per capita income growth, new business formation, the pace of car and home sales, as well as retail consumption patterns amongst other components of gross domestic product (GDP), suggests that the tepid economy is far from testing the limits of capacity or productivity. This has contributed to the continued lack of material goods inflation, despite the sustained efforts of the global central bankers to provide inexpensive financial liquidity. The lack of growth is evident from the recent earnings reports of the S&P 500® Index companies, which in many cases reflected positive earnings growth with minimal or even declining top line revenue trends. Companies have wrung productivity gains through technological streamlining, enhanced production processes, cost containment and reducing
costs of capital through refinancing or restructuring debt. Increasingly, market participants are concerned that companies may be approaching the limits of such profit margin enhancements. Going forward, we believe the market’s focus may turn to macro factors underpinning the prospects for economic growth which, if positive, should stimulate incremental demand for goods and services, boost aggregate revenues, and ultimately drive returns.
The year began with the traditional economic concerns as it became increasingly evident that the more than thirty-year trend of declining interest rates was nearing an end. The tug-of-war between inflation and deflation seemed to be tilting in the direction of the former as 2012 rolled into 2013, but swung abruptly in the second calendar quarter back to worries over U.S. economic slowing due to reduced government spending as sequestration cuts were implemented. Then the Federal Reserve (Fed) upset the capital markets shortly after interest rates hit record lows at the end of April when Fed Chairman Bernanke announced a process through which the economy would be weaned off the current Quantitative Easing (QE) program, the mechanism by which the Federal Reserve is making $85 billion of monthly purchases of treasury and mortgage backed securities in order to keep interest rates low. The Fed proposed that they would ‘taper’ down QE from $85 billion to $0 in the coming year contingent on the domestic economy showing signs of recovery. Thus, two new words entered the economists’ lexicon this year: ‘sequestration’ and ‘taper’.
Due to the inability of the President and Congress to find common ground between ideology and political opportunism, there has been limited fiscal stimulus deployed towards economic recovery over the past three years. This is in stark contrast to historical precedent where economic stimulus typically extended for two to three years after a recession. Since some lawmakers, investors and economists believed that more stimulus would only inflate the existing debt position, they argued for austerity measures, which precluded more fiscal deficit spending. Sequestration came into play earlier this year as a force majeure created by Congress in
1
anticipation of their inability to come to terms with both current and future fiscal responsibilities. Most economists forecasted that the sequestration process, which indiscriminately reduced spending across the U.S. government, would impact the economy by over a half percent of GDP. In effect, Congress chose to impose the burden of deficit reduction now, rather than waiting until a future date, even if the economy might be on a more stable footing then. It is clear that uncertainty surrounding government policy has significantly dampened business investment sentiment.
In the wake of the financial crisis the Fed was left as the only entity which could provide economic stimulus in the form of cheap money. However, low interest rates alone would not been enough to stimulate economic activity because the lending operations of many domestic financial institutions were significantly impaired by the near collapse of 2008. Since the onset of the crisis the Fed has utilized numerous tools in order to repair the credit mechanism in the economy. In 2012, the Fed acknowledged the potential of a deflationary effect from diminished fiscal spending combined with restricted bank lending practices, and launched the current wave of its QE program which targeted the open-ended purchase of mortgage and treasury bonds from the banks at a profit. We believe the program almost certainly has helped to stabilize the U.S. banking system, to raise the value of financial assets, and even to stimulate modest job growth. Unfortunately, the liquidity introduced into global markets through the latest QE measures also introduced distortions into the economy including excess leverage and speculation in some segments of the capital markets. Thus in our opinion, the limitless duration of open-ended easing could not go on indefinitely without causing more problems. The market became both concerned that the taper would undermine the renewed strength of our banking system and feared the unknown potential level where unsupported interest rates might settle (presumably higher). This forced many investors holding positions in interest sensitive investments to sell, hedge or otherwise reduce much of their interest rate exposure. As a result of the sudden unwinding of these positions, prices fell sharply in May and June of this year. Bond yields, foreign sovereign yields and mortgage yields rose precipitously as the market began discounting the potential impact of Fed tapering.
The market’s knee-jerk reaction to the May taper announcement proved to be premature as the Fed, in fact, did not begin tapering in September as most expected. In fact, since the sell-off in May, the Fed has gone to great lengths to communicate its decision making parameters and to strengthen the credibility of
its forward guidance on interest rates. Indeed, in recent comments by prospective Fed Governor Janet Yellen, after the close of our Funds’ fiscal year, she emphasized that when tapering does occur it will be done in accordance with improvement in economic data and will be at a very gradual pace. Thus, bonds have rallied somewhat as we enter a new phase in the seemingly never ending dance of the capital markets.
Despite tapering concerns, which have at times had traders responding to changes in sentiment on what often seems to be a daily basis, the overall direction and tone of the markets has been positive. Indeed, the S&P 500® Index, as well as other indices, surpassed the price levels of 2007 in April of this year, establishing new highs through the end of the fiscal year. As we reported in the past, the equity markets continue to climb a ‘wall of worry’, two steps forward, one step back, looking over a shoulder both to see how far we have advanced as well as whether danger lurks in our shadow. This could be a very positive stance for investment markets, provided that the fundamentals are supportive. In this light, let us return to the story of limited top-line revenue growth as opposed to bottom-line earnings growth.
Without broad economic growth, revenue growth is dependent upon market share gains or an expanding demand for specific goods and services. For most economies to grow there has to be job creation first and foremost, followed by income growth which should be sustained by enhanced productive capacity. As we closely monitor business trends and capital flows it is becoming increasingly apparent that the world’s more robust economies, notably the developed economies of North America and Asia, are at the nascent stages of a durable recovery, even if broad growth has yet to be sustained. Specifically, the United States and Japan are showing positive, if not consistent, trends in new orders and capital investment. While such investment is not as broad based as we would like to see across different segments of the economy, automobile sales, new building starts (both commercial and residential), as well as selective capital goods hold the potential for a sustained capital goods cycle.
Outside the United States, the traditional engines of global economic growth appear to be aligning in part due to significant monetary easing utilizing QE type policies in both Japan and Great Britain as well as, to a limited degree, the Eurozone. This is providing scope for these countries domestic banking sectors to heal and for capital markets to begin re-pricing risk more favorably in terms of higher stock prices and increasing money flows moving along the capital stack toward a higher risk/ reward profile. Japan is riding the wave of ‘Abenomics’,
2
pushing both aggressive monetary loosening and increasing fiscal reforms into the economy. If both the business and consumer segments of the economy can be kick started, then markets could continue pricing in a reflation of growth expectations across the economy, which in turn could create a virtuous cycle across other countries given Japan’s oversized role in the global economy. While the overall economic picture in Europe remains difficult due to continued high unemployment and a weak banking system, particularly in Southern Europe, the economies in Germany and Great Britain continue to motor along. Emblematic of this stage of recovery in Europe is Ireland, which was arguably one of the major beneficiaries of the prior period of excess capital in the early part of last decade. Following a period of fiscal austerity and recapitalization of its banking system, there is strong evidence for recovery as property prices rise and investment capital begins to flow into new business formation ultimately leading to job growth.
With respect to the larger emerging markets we can look to continued solid growth out of China, in spite of the fact that China faces challenges of its own in terms of its banking structure and lending channels. Nonetheless, China’s current account surpluses and foreign capital reserves provide significant support for them to maintain stability as the economy continues its transformation from a pure low priced exporter towards a higher value added producer with a growing consumer base. We note that a number of trends of internet retail demand are globally led by the Chinese consumer, both in terms of the double-digit growth rate of retail sales to the single day record for sales volume ($5.75 billion of sales were recorded by Alibaba.com on November 11 of this year). We believe that the business cycle in many other emerging markets will remain a bit choppy over the first half of next year, however, to a certain extent, the developing economies have been able to take advantage of the delay in Fed tapering, to implement agendas to address the uncertain growth outlook and the expected rise in bond yields. We expect such adjustments could drive business capital expenditure to offset fading governmental economic support (be it fiscal or monetary) to set the stage for the next phase of global economic activity.
While we believe that as economies begin to pick up steam over the next two to three years there will be greater consumer demand for goods and services which may again lead to an excess rate of expansion in prices as well as activity, none of this appears to be present in traditional measures of inflation. The price of gold fell by 23.11% over the fiscal year, while silver declined by 32.03%. As uncertainties over China’s growth trajectory worked through the global economy, resource-based
countries saw their currencies decline, notably the Australian Dollar was down 8.87%, Brazilian Real down 9.33%, South African Rand down 10.73% and Indonesian Rupiah down 12.49%. It’s worth noting that Japan was able to depreciate what many believed was an overvalued Yen, leading to an 18.9% fall, which corresponded with significant monetary stimulus and Quantitative Easing in an effort to raise equity prices and jumpstart inflation in its economy. Just to emphasize that currency markets are especially sensitive to global flows of capital, it is worth noting that the largest currency declines during the fiscal year occurred in the Syrian Pound and the Iranian Rial, both of which dropped by over 50% as those countries endured the hardships of civil war and economic blockade respectively.
In summary, we believe the current data suggest that establishing a new trend in global inflation, economic activity and capital availability could be a few years away. Interest rates could remain low relative to history, with the prospect for the yield curve tilting higher over time. This implies relatively appealing prospects for equities, assuming valuations remain sensible. At this time current equity valuations appear reasonable, notwithstanding the selective exuberance of the crowd searching for “the next new thing”, be it web retailers, new energy technology or social media related stocks.
In our view other issues that the capital markets would look at favorably include Congress providing a modicum of current fiscal stimulus over the next twelve to twenty-four months via appropriate tax incentives combined with enacting a program to tackle the long term entitlement pressures before they become more corrosive in 2020. In the meantime, the prospect of reasonable earnings growth, moderate top line expansion, rising corporate capex and gradual strengthening of the employment market could lead to a more traditional balance between the corporate sector, government and public expenditures and thereby provide a sustained basis for equity total returns over the next few years.
We appreciate your interest and support.
Sincerely,

Samuel A. Lieber
President
Past performance is not a guarantee of future results. The specific market, sector or investment conditions that contribute to a Fund’s performance may not be replicated in future periods.
3
Mutual fund investing involves risk. Principal loss is possible. Please refer to individual fund letters for risks specific to that fund.
This letter and the letters that follow represent the opinions of the Funds’ management and are subject to change, are not guaranteed and should not be considered recommendations to buy or sell any security. The information provided is not intended to be, and is not, a forecast of future events, a guarantee of future results, or investment advice.
4
| Disclosures and Definitions |  |
Equity Income Disclosures –
Please refer to the Schedule of Portfolio Investments for each Fund’s holding information. Fund holdings and sector allocations are subject to change and should not be considered a recommendation to buy or sell any security.
Current and future portfolio holdings are subject to risk.
Favorable tax treatment of Fund distributions may be adversely affected, changed or repealed by future changes in tax laws. Alpine may not be able to anticipate the level of dividends that companies will pay in any given timeframe.
The Funds’ monthly distributions may consist of net investment income, net realized capital gains and / or a return of capital. If a distribution includes anything other than net investment income, the Funds will provide a notice of the best estimate of its distribution sources when distributed, which will be posted on the Funds’ website, www.alpinefunds.com A return of capital distribution does not necessarily reflect the Fund’s performance and should not be confused with “yield” or “income.” Final determination of the federal income tax characteristics of distributions paid during calendar year 2013 will be provided on U.S. Form 1099-DIV, which will be mailed to shareholders. Please consult your tax advisor for further information.
All investments involve risk. Principal loss is possible. A small portion of the S&P 500 yield may include return of capital; the 10-year Treasury yield does not include return of capital; Corporate Bonds and High Yield Bonds generally do not have return of capital; a portion of the dividend paid by REITs and REIT preferred stock may be deemed a return of capital for tax purposes in the event the company pays a dividend greater than its taxable income. A stock may trade with more or less liquidity than a bond depending on the number of shares and bonds outstanding, the size of the company, and the demand for the securities. The REIT and REIT preferred stock market are smaller than the broader equity and bond markets and often trade with less liquidity than these markets depending upon the size of the individual issue and the demand of the securities. Treasury notes are guaranteed by the U.S. government and thus they are considered to be safer than other asset classes. Tax features of a Treasury Note, Corporate Bond, Stock, High Yield Bond, REITs and REIT preferred stock may vary based on an individual circumstances. Consult a tax professional for additional information.
Neither the Fund nor any of its representatives may give tax advice. Investors should consult their tax advisor for information concerning their particular situation.
Earnings Growth and EPS Growth are not measures of the Funds’ future performance.
Diversification does not assure a profit or protect against loss in a declining market.
Must be preceded or accompanied by a prospectus.
Quasar Distributors, LLC, distributor.
Equity Income Definitions
Average Weight refers to the average weight of the holding in the portfolio during the reporting period
A Basis Point is a value equaling one one-hundredth of a percent (1/100 of 1%).
Barclays Capital High Yield Municipal Bond Index is the Muni High Yield component of the Municipal Bond Index. The Barclays Municipal Bond Index is a rules-based, market-value-weighted index engineered for the long-term tax-exempt bond market.
Beta measures the sensitivity of the investment to the movements of its benchmark. A beta higher than 1.0 indicates the investment has been more volatile than the benchmark and a beta of less than 1.0 indicates that the investment has been less volatile than the benchmark.
Big data is the term for a collection of data sets so large and complex that it becomes difficult to process using on-hand database management tools or traditional data processing applications. The challenges include capture, curation, storage, search, sharing, transfer, analysis, and visualization. The trend to larger data sets is due to the additional information derivable from analysis of a single large set of related data, as compared to separate smaller sets with the same total amount of data, allowing correlations to be found to “spot business trends, determine quality of research, prevent diseases, combat crime, and determine real-time roadway traffic conditions.”
Capex (aka Capitalization Expenditure) are funds used by a company to acquire or upgrade physical assets such as property, industrial buildings or equipment. This type of outlay is made by companies to maintain or increase the scope of their operations.
Cash flow measures the cash generating capability of a company by adding non-cash charges (e.g. depreciation) and interest expense to pretax income.
Custom Balanced Benchmark reflects an unmanaged portfolio (rebalanced monthly) of 60% of the S&P 500 Index, which is a market capitalization-weighted index of 500 large capitalization stocks commonly used to represent the U.S. equity market, and 40% of the Barclays Capital U.S. Aggregate Bond Index (BCAG), which is a widely recognized, unmanaged index of U.S. dollar-denominated investment-grade fixed income securities. The Fund may, however, invest up to 75% of its total assets in equity securities.
Earnings Growth is a measure of a company’s net income over a specific period, generally one year, is a key indicator for measuring a company’s success, and the driving force behind stock price appreciation.
Earnings Per Share Growth is a measure of a company’s net income over a specific period, generally one year, is a key indicator for measuring a company’s success, and the driving force behind stock price appreciation.
5
| Disclosures and Definitions (continued) | |
EBITDA (Earnings Before Interest, Taxes, Depreciation and Amortization) is essentially Net Income with Interest, Taxes, Depreciation, and Amortization added back to it. EBITDA can be used to analyze and compare profitability between companies and industries because it eliminates the effects of financing and accounting decisions. However, this is a non-GAAP measure that allows a greater amount of discretion as to what is (and is not) included in the calculation. This also means that companies often change the items included in their EBITDA calculation from one reporting period to the next.
EV (Enterprise Value) is a measure of a company’s value.
First Tier Security is any eligible security that: (i) is a rated security that has received a short-term rating from the requisite NRSROs in the highest short-term rating category for debt obligations (within which there may be sub-categories or gradations indicating relative standing); or (ii) is an unrated security that is of comparable quality to a security meeting the requirements for a rated security as determined by the Fund’s Board of Trustees; or (iii) is a security issued by a registered investment company that is a money market fund; or (iv) is a Government security.
Hedge involves making an investment to reduce the risk of adverse price movements in an asset. Normally, a hedge consists of taking an offsetting position in a related security, such as a futures contract.
KBW Bank Index is a modified cap-weighted index consisting of 24 exchange-listed and National Market System stocks, representing national money center banks and leading regional institutions.
Lipper Mixed-Asset Target Allocation Growth Funds Average is an average of funds that, by portfolio practice, maintain a mix of between 60%-80% equity securities, with the remainder invested in bonds, cash, and cash equivalents.
MSCI Emerging Markets Index USD is a free float-adjusted market cap weighted index that is designed to measure equity market performance in the global emerging markets. Source: MSCI. MSCI data may not be reproduced or used for any other purpose.
MSCI Europe Index is a free float-adjusted market capitalization weighted index that is designed to measure the equity market performance of the developed markets in Europe. Source: MSCI. MSCI data may not be reproduced or used for any other purpose.
MSCI All Country World Index Gross USD is a free float-adjusted market capitalization-weighted index that is designed to measure the equity market performance of developed and emerging markets. Source: MSCI. MSCI makes no express or implied warranties or representations and shall have no liability whatsoever with respect to any MSCI data contained herein. The MSCI data may not be further redistributed or used as a basis for other indices or any securities or financial products. This report is not approved, reviewed or produced by MSCI.
NASDAQ Financial-100 Index includes 100 of the largest domestic and international financial securities listed on the NASDAQ Stock Market based on market capitalization. They include companies classified according to the Industry Classification Benchmark as Financials, which are included within the NASDAQ Bank, NASDAQ Insurance, and NASDAQ Other Finance Indexes.
Price/Earnings Ratio (P/E) is a valuation ratio of a company’s current share price compared to its per-share earnings. Normalized earnings – earnings metric that shows you want earnings look like smoothed out in the long run, taking into account the cyclical changes in an economy or stock.
Russell 2000® Growth Index measures the performance of the small-cap growth segment of the U.S. equity universe. It includes those Russell 2000 Index companies with higher price-to-value ratios and higher forecasted growth values.
Russell 2000® Value Index measures the performance of small-cap value segment of the U.S. equity universe. It includes those Russell 2000 Index companies with lower price-to-book ratios and lower forecasted growth values.
Russell 3000® Index measures the performance of the largest 3000 U.S. companies representing approximately 98% of the investable U.S. equity market.
S&P MidCap 400® Index is a float-adjusted market capitalization-weighted index of 400 medium-capitalization domestic stocks chosen for market size, liquidity, and industry group representation.
S&P 500® Index is a float-adjusted, market capitalization-weighted index of 500 common stocks chosen for market size, liquidity, and industry group representation to represent U.S. equity performance.
S&P 500® Financials Index comprises those companies included in the S&P 500 that are classified as members of the GICS® financials sector.
S&P Municipal Bond Short Intermediate Index consists of bonds in the S&P Municipal Bond Index with a minimum maturity of one year and a maximum maturity of up to, but not including, eight years as measured from the Rebalancing Date.
S&P 500® Utilities Index comprises those companies included in the S&P 500 that are classified as members of the GICS® utilities sector.
Variable Rate Demand Note (VRDN): A debt instrument that represents borrowed funds that are payable on demand and accrue interest based on a prevailing money market rate, such as the prime rate. The interest rate applicable to the borrowed funds is specified from the outset of the debt, and is typically equal to the specified money market rate plus an extra margin.
Yield Curves: A line that plots interest rates of bonds with equal credit quality but various maturity dates on a specific date.
An investor cannot invest directly in an index.
6
EQUITY MANAGER REPORTS

| | Alpine Dynamic Dividend Fund |
| | |
| | Alpine Accelerating Dividend Fund |
| | |
| | Alpine Financial Services Fund |
| | |
| | Alpine Innovators Fund |
| | |
| | Alpine Transformations Fund |
| | |
| | Alpine Foundation Fund |
7
| Alpine Dynamic Dividend Fund |  |
| Comparative Annualized Returns as of 10/31/13 (unaudited) | | |
| | | 1 Year | | 3 Years | | 5 Years | | 10 Years | | Since Inception(1) | |
| Alpine Dynamic Dividend Fund — Institutional Class | | | 17.02 | % | | | 5.67 | % | | | 7.24 | % | | | 3.84 | % | | | 4.48 | % | | |
| Alpine Dynamic Dividend Fund — Class A (Without Load) | | | 16.73 | % | | | N/A | | | N/A | | | N/A | | | 13.64 | % | | |
| Alpine Dynamic Dividend Fund — Class A (With Load) | | | 10.40 | % | | | N/A | | | N/A | | | N/A | | | 10.19 | % | | |
| MSCI All Country World Index Gross USD | | | 23.89 | % | | | 10.85 | % | | | 14.00 | % | | | 8.14 | % | | | 8.32 | % | | |
| S&P 500® Index | | | 27.18 | % | | | 16.56 | % | | | 15.17 | % | | | 7.46 | % | | | 7.54 | % | | |
| Lipper Global Equity Income Funds Average(2) | | | 19.91 | % | | | 10.36 | % | | | 11.76 | % | | | 6.36 | % | | | 6.81 | % | | |
| Lipper Global Equity Income Funds Ranking(2) | | | 89/113 | | | 61/62 | | | 48/49 | | | 18/18 | | | 15/15 | | |
| Gross Expense Ratio (Institutional Class): 1.28%(3) | | | | | | | | | | | | | | | | | | | | | | |
| Net Expense Ratio (Institutional Class): 1.28%(3) | | | | | | | | | | | | | | | | | | | | | | |
| Gross Expense Ratio (Class A): 1.53%(3) | | | | | | | | | | | | | | | | | | | | | | |
| Net Expense Ratio (Class A): 1.53%(3) | | | | | | | | | | | | | | | | | | | | | | |
| | (1) | Institutional Class shares commenced on September 22, 2003 and Class A shares commenced on December 30, 2011. Returns for indices are since September 22, 2003. |
| | (2) | The since inception return represents the period beginning September 25, 2003 (Institutional Class only). |
| | (3) | As disclosed in the prospectus dated February 28, 2013. |
Performance data quoted represents past performance and is not predictive of future results. Investment return and principal value of the Fund fluctuate, so that the shares, when redeemed, may be worth more or less than their original cost. Performance current to the most recent month end may be lower or higher than performance quoted and may be obtained by calling 1-888-785-5578. Performance data shown does not reflect the 1.00% redemption fee imposed on shares held for fewer than 60 days. If it did, total returns would be reduced. Returns for the Class A shares with sales charge reflect a maximum sales charge of 5.50%. Performance for the Class A shares without sales charges does not reflect this load.
The MSCI All Country World Index Gross USD is a free float-adjusted market capitalization-weighted index that is designed to measure the equity market performance of developed and emerging markets. Source: MSCI. MSCI data may not be reproduced or used for any other purpose. The S&P 500® Index is a float-adjusted market capitalization index of 500 common stocks chosen for market size, liquidity and industry group representation to represent U.S. equity performance. The Lipper Global Equity Income Funds Average is an average of funds that by prospectus language and portfolio practice seek relatively high current income and growth of income by investing at least 65% of their portfolio in dividend-paying securities of domestic and foreign companies. Lipper rankings for the periods shown are based on fund total returns with dividends and distributions reinvested and do not reflect sales charges. The S&P 500® Index and the Lipper Global Equity Income Funds Average are unmanaged and do not reflect the deduction of direct fees associated with a mutual fund, such as investment adviser fees; however, the Lipper Global Equity Income Funds Average reflects fees charged by the underlying funds. The performance for the Alpine Dynamic Dividend Fund reflects the deduction of fees for these value-added services. Investors cannot directly invest in an index.
Expense Ratios reflect the ratios reported in the Fund’s most recent prospectus. The Alpine Dynamic Dividend Fund has a contractual expense waiver that continues through February 28, 2014. Where a Fund’s gross and net expense ratios are the same for the period reported, the contractual expense reimbursement level was not reached as of the end of that period. To the extent the Fund’s expenses were reduced by waivers, the Fund’s total returns were increased. In these cases, in the absence of the expense waivers, the Fund’s total returns would have been lower.
To the extent that the Fund’s historical performance resulted from gains derived from participation in Initial Public Offerings (“IPOs”) and/or Secondary Offerings, there is no guarantee that these results can be replicated in future periods or that the Fund will be able to participate to the same degree in IPO/Secondary Offerings in the future.
8
| Alpine Dynamic Dividend Fund (continued) | |
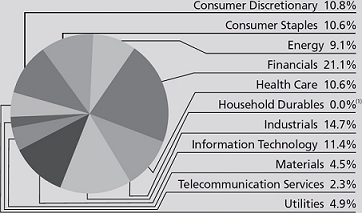
Portfolio Distributions* (unaudited)
| Top 10 Holdings* (unaudited) | |
| 1. | | Vodafone Group PLC-ADR | 2.29 | % |
| 2. | | QUALCOMM, Inc. | 1.94 | % |
| 3. | | Apple, Inc. | 1.88 | % |
| 4. | | RR Donnelley & Sons Co. | 1.80 | % |
| 5. | | Nestle SA | 1.74 | % |
| 6. | | Roche Holding AG | 1.61 | % |
| 7. | | Canadian Pacific Railway, Ltd. | 1.52 | % |
| 8. | | Corrections Corp. of America | 1.48 | % |
| 9. | | Novartis AG-ADR | 1.47 | % |
| 10. | | Avago Technologies, Ltd. | 1.47 | % |
| * | Portfolio Distributions percentages are based on total investments. Top 10 Holdings do not include short-term investments and percentages are based on total net assets. Portfolio holdings and sector distributions are as of 10/31/13 and are subject to change. Portfolio holdings are not recommendations to buy or sell any securities. |
(1) Amount is less than 0.05%.
Value of a $10,000 Investment (unaudited)
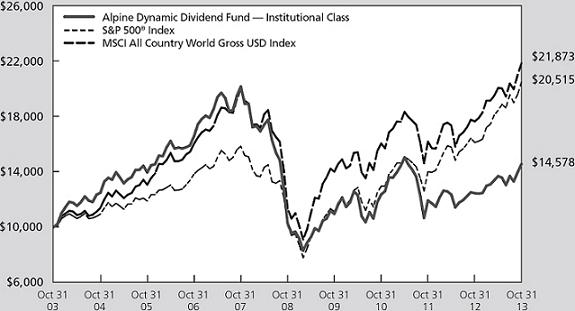
This chart represents a comparison of a hypothetical $10,000 investment in the Fund versus a similar investment in the Fund’s benchmarks. The graph and the table do not reflect the deduction of taxes that a shareholder would pay on Fund distributions or the redemption of Fund shares. Investment performance reflects the waiver and recovery of certain fees, if applicable. Without the waiver and recovery of fees, the Fund’s total return would have differed.
Performance data quoted represents past performance and is not predictive of future results. Investment return and principal value of the Fund fluctuate, so that shares, when redeemed, may be worth more or less than their original cost.
9
| Alpine Dynamic Dividend Fund (continued) | |
Commentary
For the fiscal year ended October 31, 2013, the Alpine Dynamic Dividend Fund generated a total return of 17.02% versus our benchmark, the MSCI All Country World Index Gross USD, which had a total return of 23.89%. On December 13, 2012, we were named co-portfolio managers of this Fund. From that date until October 31, 2013, the total return was 17.29% versus the benchmark return of 19.56%. All returns include reinvestment of all distributions. The Fund distributed $0.284 per share during the fiscal year. All references in this letter to the Fund’s performance relate to the Fund’s Institutional Class.
As previously announced in January 2013, we reduced the distribution rate during the period to align the Fund’s distribution rate with our assessment of the Fund’s long-term return potential as well as our projected levels of dividend income available to the Fund and to provide the Fund more flexibility to seek capital appreciation.
PERFORMANCE DRIVERS
While most major markets across the world exhibited positive returns in the 12 month period ended October 31, 2013, the dichotomy in returns between developed and emerging markets was striking, with the S&P 500® Index and the MSCI Europe Index, up 27.18% and 28.51% respectively, far outperforming the MSCI Emerging Market Index’s 6.90% return. We believe the performance of the indices themselves masked differing sensitivities to rising interest rates among different sectors: the S&P 500 Financials Index, a perceived beneficiary of rising interest rates, returned 31.91%, while the S&P 500 Utilities Index was up only 9.51% for the 12 month period.
To get a sense of the drivers of these diverging returns, it helps to examine some of the important macroeconomic events during the period. The downward pressure on global interest rates that had fueled the broad rally for high yielding securities reversed abruptly in May 2013, as there was speculation that the Federal Reserve (the “Fed”) might reduce its bond purchases. The 10 year Treasury yield rose from a low of 1.6% in early May to 3.0% by September 2013 as Fed Chairman Bernanke confirmed that the Fed would likely begin tapering its quantitative easing program by the end of the year.
Stocks have since resumed their upward climb as the Fed backed away from its earlier inclination to taper its bond-buying program. Leading indicators such as industrial production and consumer confidence surveys have continued to improve across many regions, particularly in Europe, with Chancellor Angela Merkel’s resounding
victory in German national elections providing strong support for the European unification process.
For the twelve month period, the industrials and consumer staples sectors had the greatest positive effect on the Fund’s total return on a relative basis. In the industrials sector, the Fund benefited from its exposure to companies that had a specific catalyst such as a new CEO at Canadian Pacific, and a successful debt refinancing and operational restructuring at R.R. Donnelley. In the consumer staples sector, the Fund benefited from its exposure to companies that had unique growth levers such as Walgreen’s highly accretive alliance with drug distributor AmerisourceBergen and Energizer’s successful migration from slow growth batteries to faster growing, higher gross margin personal care categories. On a relative basis, the consumer discretionary and energy sectors that had the greatest negative effect on total return. The Fund was adversely impacted by its exposure to companies in the consumer discretionary sector that were directly impacted by the hike in payroll taxes, colder-than-normal weather in the spring, and persistently high gasoline prices in the United States. In the energy sector, the Fund under-performed due primarily to its overweight to international services companies that were affected by delays in capital spending by major oil companies.
PORTFOLIO ANALYSIS
The top five contributors to the Fund’s performance for the fiscal year ending October 31, 2013 based on contribution to total return were R.R. Donnelley & Sons (100.18%), Vodafone Group Plc (51.95%), McKesson Corp (68.39%), Walgreen Company (72.44%), and Canadian Pacific Railway Ltd (55.87%).
R.R. Donnelly (average weight 1.16%) was the Fund’s top-performing stock for the year as the company delivered earnings that exceeded expectations, showing great progress in shifting its revenue mix from secularly declining segments such as Books and Directories towards growth segments including Logistics Services and Global Turnkey Solutions. R.R. Donnelly may have reached an inflection point as it has begun to show organic growth in its traditional print business. The company has also refinanced a portion of their debt at lower interest rates.
Vodafone (average weight 1.97%) is a multinational telecommunications company. The stock outperformed initially due to speculation that the company would sell its stake in Verizon Wireless to Verizon Communications. After the deal was announced, Vodafone continued to outperform due to the higher than expected price that Verizon Communications agreed to pay for the stake, and
10
| Alpine Dynamic Dividend Fund (continued) | |
due to the announcement of the large dividend that Vodafone will pay once the sale is completed. There is currently speculation that AT&T may bid for Vodafone once the Verizon Wireless sale closes in 2014.
McKesson Corp (average weight 1.46%) is a San Francisco-based pharmaceutical distributor and medical supplies wholesaler. The company is a key beneficiary of the increased volumes of pharmaceutical drugs resulting from the Affordable Care Act, and has generated consistently higher operating margins and returns on capital than its peers. We believe the stock will continue to outperform due to its accretive acquisition of European drug distributor Celesio AG, as well as the tailwind from elevated generic drug launches in 2014 and 2015.
Walgreen Company (average weight 1.34%) is the nation’s largest drugstore chain with over 8,000 mostly freestanding stores. The stock has outperformed peers partly due to its highly accretive 10 year drug distribution agreement with AmerisourceBergen announced in March 2013. Between this deal and the acquisition of Alliance Boots (Europe’s largest drug wholesaler), Walgreens effectively tripled its generic drug buying power, leading to significant cost savings.
Canadian Pacific Railway (average weight 1.54%) was a top-performing stock for the fiscal year as the new CEO Hunter Harrison’s efforts to restructure the railway began to bear fruit. The restructuring has included headcount reduction, running more efficient (longer) trains, and a fuel conservation strategy. These changes have been implemented faster than the original timetable set out by the new management team resulting in a lower operating ratio. We believe the company will be able to increase their customer base by offering better services.
The bottom five contributors to the Fund’s performance for the fiscal year ending October 31, 2013 based on contribution to total return were Subsea 7 (-18.35%), Tronox Ltd (-25.33%), Apple Inc (-9.75%), American Eagle Outfitters (-24.06%), and Petrofac Ltd (-30.73%).
Subsea 7 (average weight 0.74%) is one of three main competitors in subsea construction, one of the fastest growing segments of the oil services industry. Having earned a reputation for its strong risk management and conservative bidding practices, the market was justifiably surprised when Subsea 7 announced that the full-life project loss on its $1 billion contract with Petrobras would be up to three times higher than estimated just three months previously, wiping out as much as a third of annual operating income at the company. We no longer have a position in Subsea 7.
Tronox Ltd (average weight 0.05%) is the only vertically integrated producer of titanium dioxide (TiO2), a whitening/brightening pigment used in paints, plastics,
paper, sunscreen and food coloring with no effective substitutes. Due to an extended destocking period in China and weak end markets in Europe, the Board of Tronox decided to cancel the special dividend for which we were invested in the stock and we sold the position.
Apple (average weight 2.42%) was an underperformer as the company’s product cycle failed to impress consumers and growth came to a halt in the high end of the mobile smart phone market. In addition, Apple lacked a product in the faster growing mass market channel. Some investor activism helped the shares rebound nicely from their lows but it wasn’t enough to completely offset the earlier underperformance.
American Eagle Outfitters (average weight 1.17%) is a mall-based retailer of denim and other casual apparel and accessories aimed at young men and women ages 15-25. Following six quarters of impressive performance, the increasingly promotional environment in the teen retail space caught up with American Eagle, driving negative returns and declining margins.
Petrofac Ltd (average weight 0.52%) is an oil and gas-focused engineering, procurement and construction company with a strong reputation as a primary contractor able to execute large capital projects in a range of competencies from upstream to downstream facilities. The stock underperformed as a dearth of project awards in the increasingly competitive onshore markets led to pressure on revenues and margins. We no longer have a position in Petrofac.
In order to achieve its dividend, the Fund participated in a number of dividend capture strategies including (1) purchasing shares in the stock of a regular dividend payer before an upcoming ex-date and selling after the ex-date, (2) purchasing shares before an anticipated special dividend and selling opportunistically after the ex-date of the dividend, and (3) purchasing additional shares in stocks that the Fund already owns before the ex-date and selling the original shares after the ex-date, thus receiving a dividend on a larger position while still maintaining qualified dividend income eligibility (“QDI”) on its position. Although these strategies have resulted in higher turnover and associated transaction costs for the Fund overall the Fund’s turnover rate has decreased as we have relied less upon these strategies this year. While there is the potential for market loss on the shares that are held for a short period, we seek to use these strategies to generate additional income with limited impact on the construction of the core portfolio.
We have hedged a portion of our currency exposures to the Swiss Franc, Japanese Yen and British Pound. We have also used leverage at times both in the execution of the strategy of the Fund and to help manage significant amounts of net outflows during the fiscal year.
11
| Alpine Dynamic Dividend Fund (continued) | |
SUMMARY & OUTLOOK
We believe the Alpine Dynamic Dividend Fund has been reinvigorated in order to best pursue its investment objective: to seek high current dividend income that qualifies for the reduced U.S. Federal income tax rates created by the “Jobs and Growth Tax Relief Reconciliation Act of 2003” while also focusing on total return for long-term growth of capital. We have shifted to a team-based structure that incorporates both top-down and bottom-up stock picking. The investment team includes experienced Alpine portfolio managers and research analysts who provide analysis and recommendations on stocks within the sectors they cover. We, along with our CEO, CIO and Senior Investment Risk Strategist, comprise a committee that provides strategic oversight to the Fund and monitors sector and regional exposures, as well as quantitative and qualitative risk factors.
While we are concerned that there may be lingering effects of the U.S. government shutdown and the political squabbling over the debt ceiling, there are many bright spots in the U.S. economy. Auto sales have improved, and there has been a broad-based gain in
manufacturing activity. The energy renaissance spurred by hydraulic fracturing technologies has created a durable cost advantage for many domestic industries reliant on fossil fuels, a trend that is starting to manifest itself in rising margins. The Affordable Care Act, despite all the negative politically-charged rhetoric, has created a potential tailwind for multiple subsectors of the healthcare industry. Europe continues to stabilize with many leading economists now forecasting growth for the first time in several years. And with the valuation of stocks in many emerging markets countries at historical lows relative to their developed market counterparts, we believe there are attractive risk/reward opportunities. The Fund maintains its focus on, what we believe are high quality companies with strong balance sheets and strong potential to grow earnings and dividends amidst an uncertain macro environment.
Sincerely,
Brian Hennessey
Joshua Duitz
Co-Portfolio Managers
12
| Alpine Dynamic Dividend Fund (continued) | |
This letter represents the opinions of the Fund’s management and is subject to change, is not guaranteed and should not be considered a recommendation to buy or sell any security. The information provided is not intended to be, and is not, a forecast of future events, a guarantee of future results, or investment advice. Views expressed may vary from those of the firm as a whole. Past performance is no guarantee of future results.
Mutual fund investing involves risk. Principal loss is possible. The Fund is subject to risks, including the following:
Credit Risk – Credit risk refers to the possibility that the issuer of a security will not be able to make payments of interest and principal when due. Changes in an issuer’s credit rating or the market’s perception of an issuer’s creditworthiness may also affect the value of the Fund’s investment in that issuer. The degree of credit risk depends on both the financial condition of the issuer and the terms of the obligation.
Dividend Strategy Risk – The Fund’s strategy of investing in dividend-paying stocks involves the risk that such stocks may fall out of favor with investors and underperform the market. Companies that issue dividend paying-stocks are not required to continue to pay dividends on such stocks. Therefore, there is the possibility that such companies could reduce or eliminate the payment of dividends in the future. The Fund may hold securities for short periods of time related to the dividend payment periods and may experience loss during these periods.
Emerging Market Securities Risk – The risks of foreign investments are heightened when investing in issuers in emerging market countries. Emerging market countries tend to have economic, political and legal systems that are less fully developed and are less stable than those of more developed countries. They are often particularly sensitive to market movements because their market prices tend to reflect speculative expectations. Low trading volumes may result in a lack of liquidity and in extreme price volatility.
Equity Securities Risk – The stock or other security of a company may not perform as well as expected, and may decrease in value, because of factors related to the company (such as poorer than expected earnings or certain management decisions) or to the industry in which the company is engaged (such as a reduction in the demand for products or services in a particular industry).
Foreign Currency Transactions Risk – Foreign securities are often denominated in foreign currencies. As a result, the value of the Fund’s shares is affected by changes in exchange rates. The Fund may enter into foreign currency transactions to try to manage this risk. The Fund’s ability to use foreign currency transactions successfully depends on a number of factors, including the foreign currency transactions being available at prices that are not too costly, the availability of liquid markets and the ability of the Adviser to accurately predict the direction of changes in currency exchange rates. The Fund may enter into forward foreign currency exchange contracts in order to protect against possible losses on foreign investments resulting from adverse changes in the relationship between the U.S. dollar and foreign currencies. Although this method attempts to protect the value of the Fund’s portfolio securities against a decline in the value of a currency, it does not eliminate fluctuations in the underlying prices of the securities and while such contracts tend to minimize the risk of loss due to a decline in the value of the hedged currency, they tend to limit any potential gain which might result should the value of such currency increase.
Foreign Securities Risk – The Fund’s investments in securities of foreign issuers or issuers with significant exposure to foreign markets involve additional risk. Foreign countries in which the Fund may invest may have markets that are less liquid, less regulated and more volatile than U.S. markets. The value of the Fund’s investments may decline because of factors affecting the particular issuer as well as foreign markets and issuers generally, such as unfavorable government actions, and political or financial instability. Lack of information may also affect the value of these securities. The risks of foreign investment are heightened when investing in issuers of emerging market countries.
Growth Stock Risk – Growth stocks are stocks of companies believed to have above-average potential for growth in revenue and earnings. Growth stocks typically are very sensitive to market movements because their market prices tend to reflect future expectations. When it appears those expectations will not be met, the prices of growth stocks typically fall. Growth stocks as a group may be out of favor and underperform the overall equity market while the market concentrates on undervalued stocks.
13
| Alpine Dynamic Dividend Fund (continued) | |
Initial Public Offerings (IPO) and Secondary Offerings Risk – The Fund may invest a portion of its assets in shares of IPOs or secondary offerings of an issuer. IPOs and secondary offerings may have a magnified impact on the performance of a Fund with a small asset base. The impact of IPOs and secondary offerings on a Fund’s performance likely will decrease as the Fund’s asset size increases, which could reduce a Fund’s returns. IPOs and secondary offerings may not be consistently available to the Fund for investing. IPO and secondary offering shares frequently are volatile in price due to the absence of a prior public market, the small number of shares available for trading and limited information about the issuer. Therefore, the Fund may hold IPO and secondary offering shares for a very short period of time. This may increase the turnover of the Fund and may lead to increased expenses for the Fund, such as commissions and transaction costs. In addition, IPO and secondary offering shares can experience an immediate drop in value if the demand for the securities does not continue to support the offering price.
Leverage Risk – The Fund may use leverage to purchase securities. Increases and decreases in the value of the Fund’s portfolio will be magnified when the Fund uses leverage.
Management Risk – The Adviser’s judgment about the quality, relative yield or value of, or market trends affecting, a particular security or sector, or about interest rates generally, may be incorrect. The Adviser’s security selections and other investment decisions might produce losses or cause the Fund to underperform when compared to other funds with similar investment objectives and strategies.
Market Risk – The price of a security held by the Fund may fall due to changing market, economic or political conditions.
Micro Capitalization Company Risk – Stock prices of micro capitalization companies are significantly more volatile, and more vulnerable to adverse business and economic developments than those of larger companies. Micro capitalization companies often have narrower markets for their goods and/or services and more limited managerial and financial resources than larger, more established companies, including small or medium capitalization companies.
Portfolio Turnover Risk – High portfolio turnover necessarily results in greater transaction costs which may reduce Fund performance.
Qualified Dividend Tax Risk – Favorable U.S. federal tax treatment of Fund distributions may be adversely affected, changed or repealed by future changes in tax laws.
Small- and Medium-Capitalization Company Risk – Securities of small- or medium-capitalization companies are more likely to experience sharper swings in market values, and may be less liquid, in which case it may be more difficult for the Adviser to sell at times and at prices that the Adviser believes appropriate and generally are more volatile than those of larger companies.
Swaps Risk – Swap agreements are derivative instruments that can be individually negotiated and structured to address exposure to a variety of different types of investments or market factors. Depending on their structure, swap agreements may increase or decrease the Fund’s exposure to long- or short-term interest rates, foreign currency values, mortgage securities, corporate borrowing rates, or other factors such as security prices or inflation rates. The Fund also may enter into swaptions, which are options to enter into a swap agreement. Since these transactions generally do not involve the delivery of securities or other underlying assets or principal, the risk of loss with respect to swap agreements and swaptions generally is limited to the net amount of payments that the Fund is contractually obligated to make. There is also a risk of a default by the other party to a swap agreement or swaption, in which case the Fund may not receive the net amount of payments that the Fund contractually is entitled to receive.
Undervalued Stock Risk – The Fund may pursue strategies that may include investing in securities, which, in the opinion of the Adviser, are undervalued. The identification of investment opportunities in undervalued securities is a difficult task and there is no assurance that such opportunities will be successfully recognized or acquired. While investments in undervalued securities offer opportunities for above-average capital appreciation, these investments involve a high degree of financial risk and can result in substantial losses.
Please refer to pages 5-6 for other important disclosures and definitions.
14
| Alpine Accelerating Dividend Fund | |
| Comparative Annualized Returns as of 10/31/13 (unaudited) |
| | | 1 Year | | 3 Years | | Since Inception(1) |
| Alpine Accelerating Dividend Fund — Institutional Class | | | 25.94% | | | | 14.26% | | | | 14.76% | |
| Alpine Accelerating Dividend Fund — Class A (Without Load) | | | 25.55% | | | | N/A | | | | 19.37% | |
| Alpine Accelerating Dividend Fund — Class A (With Load) | | | 18.65% | | | | N/A | | | | 15.75% | |
| S&P 500® Index | | | 27.18% | | | | 16.56% | | | | 14.34% | |
| Dow Jones Industrial Average | | | 21.82% | | | | 14.82% | | | | 13.22% | |
| Lipper Equity Income Funds Average(2) | | | 23.47% | | | | 14.53% | | | | 15.18% | |
| Lipper Equity Income Funds Ranking(2) | | | 102/388 | | | | 165/293 | | | | 158/262 | |
| Gross Expense Ratio (Institutional Class): 3.26%(3) | | | | | | | | | | | | |
| Net Expense Ratio (Institutional Class): 1.35%(3) | | | | | | | | | | | | |
| Gross Expense Ratio (Class A): 3.51%(3) | | | | | | | | | | | | |
| Net Expense Ratio (Class A): 1.60%(3) | | | | | | | | | | | | |
| | (1) | Institutional Class shares commenced on November 5, 2008 and Class A shares commenced on December 30, 2011. Returns for indices are since November 5, 2008. |
| | (2) | The since inception data represents the period beginning November 6, 2008 (Institutional Class only). |
| | (3) | As disclosed in the prospectus dated February 28, 2013. |
Performance data quoted represents past performance and is not predictive of future results. Investment return and principal value of the Fund fluctuate, so that the shares, when redeemed, may be worth more or less than their original cost. Performance current to the most recent month end may be lower or higher than performance quoted and may be obtained by calling 1-888-785-5578. Performance data shown does not reflect the 1.00% redemption fee imposed on shares held for fewer than 60 days. If it did, total returns would be reduced. Returns for the Class A shares with sales charge reflect a maximum sales charge of 5.50%. Performance for the Class A shares without sales charges does not reflect this load.
The S&P 500® Index is a float-adjusted market capitalization-weighted index of 500 common stocks chosen for market size, liquidity, and industry group representation to represent U.S. equity performance. The Dow Jones Industrial Average is a price-weighted average of 30 blue chip stocks that are generally the leaders in their industry. The Lipper Equity Income Funds Average is an average of funds that seek relatively high current income and income growth through investing 60% or more of their respective portfolios in equities. Lipper rankings for the periods shown are based on fund total returns with dividends and distributions reinvested and do not reflect sales charges. The S&P 500® Index, the Dow Jones Industrial Average, and the Lipper Equity Income Funds Average are unmanaged and do not reflect direct fees associated with a mutual fund, such as investment adviser fees; however, the Lipper Equity Income Funds Average reflects fees charged by the underlying funds. The performance for the Alpine Accelerating Dividend Fund reflects the deduction of fees for these value-added services. Investors cannot directly invest in an index.
Expense Ratios reflect the ratios reported in the Fund’s most recent prospectus. The Alpine Accelerating Dividend Fund has a contractual expense waiver that continues through February 28, 2014. Where a Fund’s gross and net expense ratios are the same for the period reported, the contractual expense reimbursement level was not reached as of the end of that period. To the extent the Fund’s expenses were reduced by waivers, the Fund’s total returns were increased. In these cases, in the absence of the expense waivers, the Fund’s total returns would have been lower.
To the extent that the Fund’s historical performance resulted from gains derived from participation in Initial Public Offerings (“IPOs”) and/or Secondary Offerings, there is no guarantee that these results can be replicated in future periods or that the Fund will be able to participate to the same degree in IPO/Secondary Offerings in the future.
15
| Alpine Accelerating Dividend Fund (continued) | |
Portfolio Distributions* (unaudited)

Top 10 Holdings* (unaudited)
| 1. | | Apple, Inc. | 1.81 | % |
| 2. | | QUALCOMM, Inc. | 1.60 | % |
| 3. | | Dick’s Sporting Goods, Inc. | 1.60 | % |
| 4. | | GNC Holdings, Inc.-Class A | 1.56 | % |
| 5. | | PepsiCo, Inc. | 1.55 | % |
| 6. | | International Business Machines Corp. | 1.55 | % |
| 7. | | The J.M. Smucker Co. | 1.54 | % |
| 8. | | Comcast Corp.-Class A | 1.54 | % |
| 9. | | Energizer Holdings, Inc. | 1.53 | % |
| 10. | | General Mills, Inc. | 1.51 | % |
| * | Portfolio Distributions percentages are based on total investments. Top 10 Holdings do not include short-term investments and percentages are based on total net assets. Portfolio holdings and sector distributions are as of 10/31/13 and are subject to change. Portfolio holdings are not recommendations to buy or sell any securities. |
Value of a $10,000 Investment (unaudited)
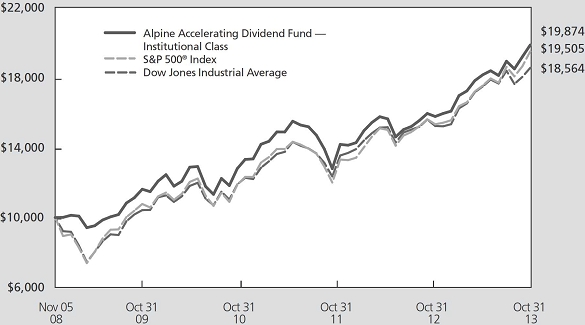
This chart represents a comparison of a hypothetical $10,000 investment in the Fund versus a similar investment in the Fund’s benchmark. The graph and the table do not reflect the deduction of taxes that a shareholder would pay on Fund distributions or the redemption of Fund shares. Investment performance reflects the waiver and recovery of certain fees, if applicable. Without the waiver and recovery of fees, the Fund’s total return would have differed.
Performance data quoted represents past performance and is not predictive of future results. Investment return and principal value of the Fund fluctuate, so that shares, when redeemed, may be worth more or less than their original cost.
16
| Alpine Accelerating Dividend Fund (continued) | | |
Commentary
For the fiscal year ended October 31, 2013, the Alpine Accelerating Dividend Fund generated a total return of 25.94%. This compares with a total return of 27.18% for the S&P 500® Index for the same period. During the last twelve months, the Fund steadily increased its monthly per share distribution from $0.0398 in November, 2012 to $0.0409 in October, 2013. All references in this letter to the Fund’s performance relate to the performance of the Fund’s Institutional Class.
PERFORMANCE DRIVERS
The Fund generally prefers to take a conservative investment stance with regard to portfolio construction and security selection during times of economic and geopolitical uncertainty. We believe the twelve months ended October 31, 2013 was such a time. For this reason, the Fund had an average cash holding of 7.7% during the fiscal year and a portfolio beta less than 1.0 during the same span.
On a sector basis, the financials had the largest impact on the absolute performance of the Fund, followed by health care and consumer discretionary. Telecommunication was the only sector to generate a negative return over the past 12 months. On a relative basis, consumer staples generated the largest outperformance versus the S&P 500®, followed by energy and industrials. Materials, consumer discretionary, and telecommunication services were the worst relative performers.
PORTFOLIO ANALYSIS
The top five contributors to the Fund’s performance during the twelve months ended October 31, 2013, based on contribution to total return were CBS (+85.03%), Walgreen (+72.71%), AmerisourceBergen (+69.72%), Nike (+69.13%), and Bristow Group (+64.36%).
| • | Demand for quality content in the digital world continues to drive CBS’ (average weight 1.57%) profit and its stock price higher. The media giant is capitalizing on its strong catalog of new and old shows by signing deals with online digital content providers. In addition, strong ratings on its broadcast network have enabled the company to generate solid increases in its advertising rates and to sign profitable re-transmission agreements with many of its affiliate stations. |
| • | Walgreens’ (average weight 1.55%) shares rebounded nicely during the fiscal year as the fundamentals in its core US pharmacy operations |
| | improved. The company also began to recognize some of the synergies from the 2012 Alliance Boots merger. Finally, midway through the year, Walgreens entered into a well-received new distribution agreement with AmerisourceBergen for branded and generic drugs. |
| • | In March 2013, AmerisourceBergen (average weight 1.40%) unveiled what it described as a “game-changing” partnership with Walgreens, including a 10 year distribution agreement for branded and generic drugs along with access to generic drugs sourced through Walgreens joint venture with Alliance Boots. In addition to the earnings accretive nature of the distribution deal, the shares enjoyed meaningful P/E multiple expansion during the fiscal year as investors began to factor in the longer term benefits of the partnership. |
| • | Nike (average weight 1.27%) remains a force in the thriving global footwear segment. The company continues to grow in the United States fueled by a strong demand for athletic wear. Sales and future orders exceeded expectations for most of the past year. Meanwhile, management has been aggressively working to right size its Chinese operations. The better-than-expected performance led to rising earnings and a higher P/E multiple for the shares. |
| • | As a leading provider of offshore helicopter services to the oil and gas industry, Bristow (average weight 1.33%) continued to pursue its goal of 10-15% annual earnings per share (EPS) growth as energy companies continue to increase spending for offshore exploration and production of oil and natural gas. In addition, in March, Bristow won a $2.5 billion search and rescue contract with the British government that could potentially add as much as $1.00 per share of earnings later this decade. |
Tower Group International (-75.03%), Oi S.A. (-26.16%), Two Harbors (-19.05%), Apple (-9.85%), and Potash Corporation of Saskatchewan (-18.05%) had the largest adverse impact on the performance of the Fund over the fiscal year.
| • | After a solid start to the year, including the consummation of a merger with a Bermuda-based reinsurer, Tower Group (average weight 0.68%) surprised the market with the announcement of a massive reserve charge that led to a ratings downgrade from The A.M. Best ratings agency, further pressuring the shares. Despite a seemingly |
17
| Alpine Accelerating Dividend Fund (continued) | | |
| | | inexpensive valuation in the aftermath of an extreme sell-off, we opted to exit the position given a lack of current financial statements and the high probability that Tower Group will eliminate its dividend. |
| • | The Brazilian telecommunications industry has struggled this year and Oi S.A.(average weight 0.09%) has been caught in the downdraft. Investors continued to sell shares of Oi as they became frustrated with the slow pace of operational improvements despite multiple years of restructuring. Even the proposed merger with Portugal Telecom hasn’t succeeded in reversing the sell-off. |
| • | Two Harbors (average weight 0.67%) shares declined during the fiscal year as its business of investing in mortgage-backed securities came under pressure as the market wrestled with the prospect of the end of the Fed’s QE3 program. As a result, mortgage REITs like Two Harbors were forced to lower their dividends. |
| • | After peaking in late November 2012, the shares of Apple (average weight 1.67%) fell as the company’s product cycle failed to impress consumers and growth came to a halt in the high end of the mobile smart phone market. In addition, Apple lacked a product in the faster growing mass market channel. Some investor activism helped the shares rebound nicely from their lows but it wasn’t enough to completely offset the earlier underperformance. |
| • | Shares of Potash Corp. (average weight 1.02%) suffered a two-day decline of nearly 25% when competitor Uralkali unexpectedly withdrew from its marketing alliance with partner Belaruskali and embarked on a new strategy favoring volume over price. Uralkali’s decision threw the potash market into turmoil and led to a sharp decline in sales of the nutrient as the market struggled to find a new equilibrium. |
SUMMARY & OUTLOOK
As we look toward 2014, we see a market environment that appears fairly similar to that of the preceding year. The United States continues to grow below trend while contending with a partisan environment in Washington D.C. and the prospect of the Federal Reserve’s tapering of QE3 at some point during the year. In Europe, growth continues to be sluggish and the specter of deflation cannot be overlooked. Indeed, the European Central Bank just cut the main refinance rate by another 25 basis points to stave off the deflationary risk and to stimulate the Euro area economies. Emerging markets (EM) appear to be undergoing a difficult transition from a world awash in liquidity to one where liquidity isn’t quite so abundant. Many EM countries could be forced to slow their economies down to balance external current account deficits and tame inflation if QE3 induced liquidity dries up should the Fed begin to taper in 2014. This macro backdrop and our view that equity market valuations are fairly robust, lead us to continue to take a conservative investment stance.
As such, the Fund seeks to continue to emphasize its focus on what we believe are quality companies with strong balance sheets that have a demonstrated track record of increasing and/or accelerating dividends. In addition, we remain on the lookout for stocks with the potential to initiate, grow, or accelerate their dividends over time. Although this strategy may lag behind the market in periods of robust returns, we believe it provides a more attractive risk/return profile over the long run. In conclusion, similar to the stocks in which we seek to invest, the Fund aims to provide a steadily rising distribution to its investors.
We thank our shareholders for their support and look forward to continued success over the next year.
Sincerely,
Bryan Keane
Andrew Kohl
Co-Portfolio Managers
18
| Alpine Accelerating Dividend Fund (continued) | | |
This letter represents the opinions of the Fund’s management and is subject to change, is not guaranteed and should not be considered a recommendation to buy or sell any security. The information provided is not intended to be, and is not, a forecast of future events, a guarantee of future results, or investment advice. Views expressed may vary from those of the firm as a whole. Past performance is no guarantee of future results.
Mutual fund investing involves risk. Principal loss is possible. The Fund is subject to risks, including the following:
Dividend Strategy Risk – The Fund’s strategy of investing in dividend-paying stocks involves the risk that such stocks may fall out of favor with investors and underperform the market. Companies that issue dividend-paying stocks are not required to continue to pay dividends on such stocks. Therefore, there is the possibility that such companies could reduce or eliminate the payment of dividends in the future or the anticipated acceleration of dividends could not occur.
Equity Securities Risk – The stock or other security of a company may not perform as well as expected, and may decrease in value, because of factors related to the company (such as poorer-than-expected earnings or certain management decisions) or to the industry in which the company is engaged (such as a reduction in the demand for products or services in a particular industry).
Foreign Currency Transactions Risk – Foreign securities are often denominated in foreign currencies. As a result, the value of the Fund’s shares is affected by changes in exchange rates. The Fund may enter into foreign currency transactions to try to manage this risk. The Fund’s ability to use foreign currency transactions successfully depends on a number of factors, including the foreign currency transactions being available at prices that are not too costly, the availability of liquid markets and the ability of the Adviser to accurately predict the direction of changes in currency exchange rates.
Foreign Securities Risk – The Fund’s investments in securities of foreign issuers or issuers with significant exposure to foreign markets involve additional risk. Foreign countries in which the Fund may invest may have markets that are less liquid, less regulated and more volatile than U.S. markets. The value of the Fund’s investments may decline because of factors affecting the particular issuer as well as foreign markets and issuers generally, such as unfavorable government actions, and political or financial instability. Lack of information may also affect the value of these securities. The risks of foreign investments are heightened when investing in issuers in emerging market countries.
Growth Stock Risk – Growth stocks typically are very sensitive to market movements because their market prices tend to reflect future expectations. When it appears those expectations will not be met, the prices of growth stocks typically fall. Growth stocks as a group may be out-of-favor and underperform the overall equity market while the market concentrates on undervalued stocks. Although the Fund will not concentrate its investments in any one industry or industry group, it may, like many growth funds, weight its investments toward certain industries, thus increasing its exposure to factors adversely affecting issuers within those industries.
Initial Public Offerings (IPO) and Secondary Offerings Risk – The Fund may invest a portion of its assets in shares of IPOs or Secondary Offerings of an issuer. IPOs and Secondary Offerings may have a magnified impact on the performance of a Fund with a small asset base. The impact of IPOs and Secondary Offerings on a Fund’s performance likely will decrease as the Fund’s asset size increases, which could reduce a Fund’s returns. IPOs and Secondary Offerings may not be consistently available to the Fund for investing. IPO and Secondary Offering shares frequently are volatile in price due to the absence of a prior public market, the small number of shares available for trading and limited information about the issuer. Therefore, the Fund may hold IPO and Secondary Offering shares for a very short period of time. This may increase the turnover of the Fund and may lead to increased expenses for the Fund, such as commissions and transaction costs. In addition, IPO and Secondary Offering shares can experience an immediate drop in value if the demand for the securities does not continue to support the offering price.
Management Risk – The Adviser’s judgment about the quality, relative yield or value of, or market trends affecting a particular security or sector, or about interest rates generally, may be incorrect. The Adviser’s security selections and other investment decisions might produce losses or cause the Fund to underperform when compared to other funds with similar investment objectives and strategies.
Market Risk – The price of a security held by the Fund may fall due to changing market, economic or political conditions.
Micro-Capitalization Company Risk – Stock prices of micro-capitalization companies are significantly more volatile, and more vulnerable to adverse business and economic developments than those of larger companies. Micro-capitalization companies often have more narrow markets for their goods and/or services and more limited managerial and financial resources than larger, more established companies, including small- or medium-capitalization companies.
Portfolio Turnover Risk – High portfolio turnover necessarily results in greater transaction costs which may reduce Fund performance.
19
| Alpine Accelerating Dividend Fund (continued) | | |
Small- and Medium-Capitalization Company Risk – Securities of small- or medium-capitalization companies are more likely to experience sharper swings in market values, and may be less liquid, in which case it may be more difficult for the Adviser to sell at times and at prices that the Adviser believes appropriate and generally are more volatile than those of larger companies.
Undervalued Stock Risk – The Fund may pursue strategies that may include investing in securities, which, in the opinion of the Adviser, are undervalued. The identification of investment opportunities in undervalued securities is a difficult task and there is no assurance that such opportunities will be successfully recognized or acquired. While investments in undervalued securities offer opportunities for above-average capital appreciation, these investments involve a high degree of financial risk and can result in substantial losses.
Please refer to pages 5-6 for other important disclosures and definitions.
20
| Alpine Financial Services Fund | |
| Comparative Annualized Returns as of 10/31/13 (unaudited) |
| | | | 1 Year | | | 3 Years | | | 5 Years | | Since Inception(1) |
| Alpine Financial Services Fund — Institutional Class | | | 38.31 | % | | | 16.61 | % | | | 16.74 | % | | | 8.25 | % | |
| Alpine Financial Services Fund — Class A (Without Load) | | | 38.06 | % | | | N/A | | | N/A | | | 35.61 | % | |
| Alpine Financial Services Fund — Class A (With Load) | | | 30.45 | % | | | N/A | | | N/A | | | 31.52 | % | |
| KBW Bank Index | | | 32.14 | % | | | 14.35 | % | | | 3.78 | % | | | -2.85 | % | |
| NASDAQ Financial-100 Total Return Index | | | 33.87 | % | | | 16.22 | % | | | 8.03 | % | | | 2.59 | % | |
| S&P 500® Index | | | 27.18 | % | | | 16.56 | % | | | 15.17 | % | | | 7.06 | % | |
| Lipper Financial Services Funds Average(2) | | | 31.19 | % | | | 14.01 | % | | | 9.81 | % | | | 0.55 | % | |
| Lipper Financial Services Funds Ranking(2) | | | 7/80 | | | 18/72 | | | 4/65 | | | 1/52 | |
| Gross Expense Ratio (Institutional Class): 1.98%(3) | | | | | | | | | | | | | | | | | |
| Net Expense Ratio (Institutional Class): 1.42%(3) | | | | | | | | | | | | | | | | | |
| Gross Expense Ratio (Class A): 2.23%(3) | | | | | | | | | | | | | | | | | |
| Net Expense Ratio (Class A): 1.67%(3) | | | | | | | | | | | | | | | | | |
| | (1) | Institutional Class shares commenced on November 1, 2005 and Class A shares commenced on December 30, 2011. Returns for indices are since November 1, 2005. |
| | (2) | The since inception data represents the period beginning November 3, 2005 (Institutional Class only). |
| | (3) | As disclosed in the prospectus dated February 28, 2013. |
Performance data quoted represents past performance and is not predictive of future results. Investment return and principal value of the Fund fluctuate, so that the shares, when redeemed, may be worth more or less than their original cost. Performance current to the most recent month end may be lower or higher than performance quoted and may be obtained by calling 1-888-785-5578. Performance data shown does not reflect the 1.00% redemption fee imposed on shares held for fewer than 60 days. If it did, total returns would be reduced. Returns for the Class A shares with sales charge reflect a maximum sales charge of 5.50%. Performance for the Class A shares without sales charges does not reflect this load.
KBW Bank Index is a modified cap-weighted index consisting of 24 exchange-listed and National Market System stocks, representing national money center banks and leading regional institutions. The NASDAQ Financial-100 Index includes 100 of the largest domestic and international financial securities listed on the NASDAQ Stock Market based on market capitalization. They include companies classified according to the Industry Classification Benchmark as Financials, which are included within the NASDAQ Bank, NASDAQ Insurance, and NASDAQ Other Finance Indexes. The S&P 500® Index is a float-adjusted market capitalization-weighted index of 500 common stocks chosen for market size, liquidity, and industry group representation to represent U.S. equity performance. The Lipper Financial Services Funds Average is an average of funds whose primary objective is to invest primarily in equity securities of companies engaged in providing financial services. Lipper rankings for the periods shown are based on fund total returns with dividends and distributions reinvested and do not reflect sales charges. The KBW Bank Index, the NASDAQ Financial-100 Index, the S&P 500® Index and the Lipper Financial Services Funds Average are unmanaged and do not reflect the deduction of direct fees associated with a mutual fund, such as investment adviser fees; however, the Lipper Financial Services Fund Average reflects fees charged by the underlying funds. The performance for the Alpine Financial Services Fund reflects the deduction of fees for these value-added services. Investors cannot directly invest in an index.
Expense Ratios reflect the ratios reported in the Fund’s most recent prospectus. The Alpine Financial Services Fund has a contractual expense waiver that continues through February 28, 2014. Where a Fund’s gross and net expense ratios are the same for the period reported, the contractual expense reimbursement level was not reached as of the end of that period. To the extent the Fund’s expenses were reduced by waivers, the Fund’s total returns were increased. In these cases, in the absence of the expense waivers, the Fund’s total returns would have been lower.
The Fund’s past performance benefitted significantly from Initial Public Offerings (“IPOs”) and Secondary Offerings of certain issuers, and there is no assurance that the Fund can replicate this performance in the future or that the Fund will be able to participate to the same degree in IPO/Secondary Offerings in the future.
21
| Alpine Financial Services Fund (continued) | |
Portfolio Distributions* (unaudited)
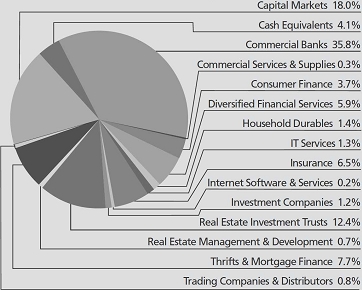
Top 10 Holdings* (unaudited)
| 1 | . | NorthStar Realty Finance Corp. | 3.98 | % |
| 2 | . | Pacific Premier Bancorp, Inc. | 3.22 | % |
| 3 | . | The Carlyle Group LP | 2.96 | % |
| 4 | . | Intercontinental Exchange, Inc. | 2.88 | % |
| 5 | . | First Business Financial Services, Inc. | 2.87 | % |
| 6 | . | Synovus Financial Corp. | 2.76 | % |
| 7 | . | BB Seguridade Participacoes SA | 2.62 | % |
| 8 | . | The Blackstone Group LP | 2.52 | % |
| 9 | . | First BanCorp | 2.35 | % |
| 10 | . | Apollo Global Management LLC-Class A | 1.93 | % |
| * | Portfolio Distributions percentages are based on total investments. Top 10 Holdings do not include short-term investments and percentages are based on total net assets. Portfolio holdings and sector distributions are as of 10/31/13 and are subject to change. Portfolio holdings are not recommendations to buy or sell any securities. |
Value of a $10,000 Investment (unaudited)
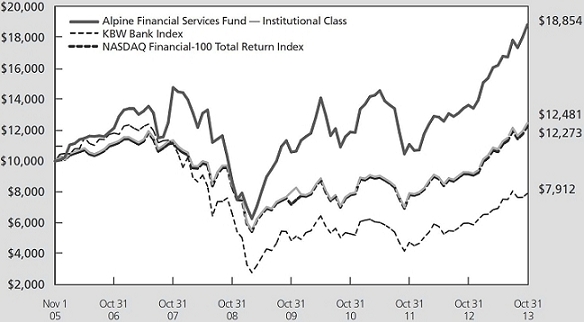
This chart represents a comparison of a hypothetical $10,000 investment in the Fund versus a similar investment in the Fund’s benchmarks. The graph and the table do not reflect the deduction of taxes that a shareholder would pay on Fund distributions or the redemption of Fund shares. Investment performance reflects the waiver and recovery of certain fees, if applicable. Without the waiver and recovery of fees, the Fund’s total return would have differed.
Performance data quoted represents past performance and is not predictive of future results. Investment return and principal value of the Fund fluctuate, so that shares, when redeemed, may be worth more or less than their original cost.
22
| Alpine Financial Services Fund (continued) | |
Commentary
The Alpine Financial Services Fund generated a 38.31% total return for the fiscal year ended October 31, 2013. This compares to the Fund’s benchmarks which showed total returns of 33.87% for the NASDAQ Financial 100 Index and 32.14% for the KBW Bank Index during the same period. Since inception (11/01/2005), the Fund has generated an annualized total return of 8.25%. This compares favorably to a 2.59% annualized return for the NASDAQ Financial 100 Index and -2.85% for the KBW Bank Index during the same time period. All references in this letter to the Fund’s performance relate to the performance of the Fund’s Institutional Class.
YEAR IN REVIEW
The U.S. equity markets delivered strong gains this fiscal year with the Dow Jones Industrial Average and S&P® 500 Indexes reaching all-time highs. Aiding market performance has been improving retail sales, job growth, and corporate earnings. The Federal Reserve’s aggressive monetary policy has also contributed to an increase of private sector funds into the capital markets. A low inflationary environment has allowed the Federal Reserve to continue this policy longer than most economists predicted. In Europe, the capital markets also staged a solid rebound as concerns over sovereign debt issues abated. The European Central Bank’s commitment to the financial stability of the Eurozone has restored some investor confidence in the region. Another outperforming market has been Japan where a new Government Administration has initiated bold policies intended to jump start the sleepy economy. Investors responded well to the news pushing stocks up significantly. Emerging markets were the one area of disappointment this past year. What was once a perceived “safe haven” during the banking crisis; these countries are now feeling the effects of the weak global economy.
Financial stocks performed well in those countries in which economic conditions are improving. This is due to the sector’s leverage to economic growth. In countries like the United States, which are beginning to experience growth, we are seeing asset quality improve as loan write-offs and loss provisioning declines. As growth rates rise, we would expect to see demand for loans and other financial services to increase. If this were to happen, financial stocks could continue to perform well relative to the overall market.
CONTRIBUTING FACTORS
The top five contributors to the Fund’s performance during the fiscal year were WidsomTree Investments Inc. (111.99%), NYSE Euronext (90.43%), Blackstone Group
L.P. (86.32%), KKR & Co. L.P. (61.44%), and First Business Financial Services, Inc. (48.23%).
| | • | WisdomTree Investments Inc. (average weight 1.81%) is an asset manager of exchange-traded funds (“ETFs”). It is achieving robust organic asset growth. A primary driver of this growth is their successful Japan Hedged Equity Fund. |
| | | |
| | • | NYSE Euronext (average weight 1.43%) is one of the largest global operators of stock exchanges. The stock jumped sharply on the announcement that IntercontinentalExchange Inc. will acquire the company. |
| | | |
| | • | Blackstone Group L.P. (average weight 2.60%) is an alternative asset management firm. Blackstone has been successful in growing their assets under management. This growth combined with an increase in performance based management fees bolstered the stock performance this year. |
| | | |
| | • | KKR & Co. L.P. (average weight 2.47%) is a private equity investment firm. The rally in equity markets has contributed to investment portfolio appreciation and increased performance based management fees. This aided in the stock outperformance. |
| | | |
| | • | First Business Financial Services, Inc. (average weight 3.24%) is a bank with $1.3 billion in assets headquartered in Madison, Wisconsin. The bank’s lean no retail branch distribution strategy has contributed an above peer return on equity. This has allowed the bank to double their cash dividend this year while also steadily growing book value. |
The five largest detractors to the Fund’s performance during the fiscal year were Direxion Daily Financial Bear (-62.05%), First BanCorp (-17.56%), ProShares UltraShort Financials (-46.08%), Pacific Mercantile Bancorp (-13.31%), and VTB Bank (-19.03%).
| | | |
| | • | Direxion Daily Financial Bear (average weight 1.00%) is an ETF which we use at times of market swings to try to reduce the daily volatility of the portfolio. |
| | | |
| | • | First BanCorp. (average weight 0.60%) is one of the major banks in Puerto Rico. The stock price was negatively affected by concerns regarding Puerto Rico’s fiscal crisis. |
| | | |
| | • | ProShares UltraShort Financial (average weight 0.50%) is an ETF which, similar to Direxion Daily Financial Bear, is used to try to reduce the daily volatility of the portfolio. |
23
| Alpine Financial Services Fund (continued) | |
| | • | Pacific Mercantile Bancorp (average weight 0.84%) is a bank with approximately $1 billion in assets headquartered in Costa Mesa, California. After being one of the Fund’s top contributors in fiscal 2012, the stock has underperformed this year as the bank transitions its business model under the direction of a new CEO. |
| | | |
| | • | VTB Bank (average weight 1.06%) is a Russian commercial bank. Concerns over weak operating results have put pressure on the stock’s performance. |
The Fund has participated in Initial Public Offerings (“IPO’s”) both within and outside of the financial sector. The Fund’s trading in IPO’s had a positive impact on the Fund’s return for the reporting period. We cannot predict whether we will be able to participate in IPO’s to the same degree or that we will be able to benefit from them, but we will continue to search for opportunities.
We also continued to find value in the Secondary Offerings in the financial sector. As a result, the Fund has been an active participant in these offerings and they have contributed to the Fund’s return for the period. Similar to the IPO’s, we cannot predict whether these offerings will continue to exist, but provided the market offers what we believe to be attractively-priced Secondary Offerings, the Fund will continue to participate in them.
We had significant net inflows to the Fund during the period and as a result, maintained large cash positions that had a detrimental effect on the Fund’s total return for the period.
SUMMARY & OUTLOOK
From a regional basis, we still prefer U.S. financial companies. We believe the slow and steady economic recovery helps offset the unknown effects of the budget debate and future Federal Reserve tapering. We are becoming more positive on Europe but still have concerns over the structural issues of the Eurozone which will take some time to work out. We are attracted to the valuations of financial stocks in the emerging markets but remain cautious. We are already seeing signs of loan
quality deterioration due to the slowing economy. The important questions to be answered are; how deep will the economic decline be and how long will it last. An acceleration of growth in the developed countries could greatly reduce the decline.
From a subsector basis, we like the exchange stocks. We believe that if the capital markets continue to perform well this could attract more investors into the markets which in turn would increase trading volumes. Another subsector that would benefit from such a trend would be the asset managers. This year the industry began to report an increase in fund flows into equity products. These inflows along with market appreciation have allowed some asset managers to report improving results. We also believe there is an investment opportunity surrounding industry consolidation. In our opinion, there is a greater need for financial companies to achieve some critical mass that will offset the rising regulatory costs, restrictions on fees charged, and higher capital requirements. While it is impossible to predict if and when a company may be acquired, we try to select companies we feel could be attractive merger candidates. During the fiscal year there were six holdings which signed merger agreements. Asset Acceptance Capital Corporation sold to Encore Capital Group. Cherokee Banking signed an agreement with Hamilton State Bancshares. First California Financial Group was purchased by PacWest Bancorp. MetroCorp Bancshares plans to merger into East West Bancorp Inc. NYSE Euronext was acquired by Intercontinental Exchange Group, Inc. And in Brazil, China Construction Bank Corp is buying a controlling stake in Banco Industrial e Commercial SA which is expected to lead to a full acquisition.
We look forward to updating you on future results and would like to thank you for your ongoing support.
Sincerely,
Peter J. Kovalski
Stephen A. Lieber
Co-Portfolio Managers
24
| Alpine Financial Services Fund (continued) | |
This letter represents the opinions of the Fund’s management and is subject to change, is not guaranteed and should not be considered recommendations to buy or sell any security. The information provided is not intended to be, and is not, a forecast of future events, a guarantee of future results, or investment advice. Views expressed may vary from those of the firm as a whole. Past performance is no guarantee of future results.
Mutual fund investing involves risk. Principal loss is possible. The Fund is subject to risks, including the following:
References to other investment products should not to be interpreted as an offer of these securities.
Concentration Risk – The Fund’s strategy of concentrating in companies in a specific industry means that its performance will be closely tied to the performance of a particular market segment. The Fund’s concentration in these companies may present more risks than if it were broadly diversified over numerous industries and sectors of the economy. A downturn in these companies would have a larger impact on the Fund than on a fund that does not concentrate in such companies. At times, the performance of these companies will lag the performance of other industries or the broader market as a whole.
Equity Securities Risk – The stock or other security of a company may not perform as well as expected, and may decrease in value, because of factors related to the company (such as poorer-than-expected earnings or certain management decisions) or to the industry in which the company is engaged (such as a reduction in the demand for products or services in a particular industry).
Financial Services Industry Concentration Risk – The Fund is subject to the risk of concentrating investments in financial services companies, which makes it more susceptible to factors adversely affecting issuers within that industry than would a fund investing in a more diversified portfolio of securities. Economic downturns, credit losses and severe price competition can negatively affect this industry. The profitability of financial services companies is dependent on the availability and cost of capital and can fluctuate significantly when interest rates change. Financial services companies are also subject to extensive government regulation. The impact of recent legislation on any individual company or on the industry as a whole cannot be predicted.
Foreign Currency Transactions Risk – Foreign securities are often denominated in foreign currencies. As a result, the value of the Fund’s shares is affected by changes in exchange rates. The Fund may enter into foreign currency transactions to try to manage this risk. The Fund’s ability to use foreign currency transactions successfully depends on a number of factors, including the foreign currency transactions being available at prices that are not too costly, the availability of liquid markets and the ability of the Adviser to accurately predict the direction of changes in currency exchange rates.
Foreign Securities Risk – The Fund’s investments in securities of foreign issuers or issuers with significant exposure to foreign markets involve additional risk. Foreign countries in which the Fund may invest may have markets that are less liquid, less regulated and more volatile than U.S. markets. The value of the Fund’s investments may decline because of factors affecting the particular issuer as well as foreign markets and issuers generally, such as unfavorable government actions, and political or financial instability. Lack of information may also affect the value of these securities. The risks of foreign investments are heightened when investing in issuers in emerging market countries.
Growth Stock Risk – Growth stocks are stocks of companies believed to have above-average potential for growth in revenue and earnings. Growth stocks typically are very sensitive to market movements because their market prices tend to reflect future expectations. When it appears those expectations will not be met, the prices of growth stocks typically fall. Growth stocks as a group may be out-of-favor and underperform the overall equity market while the market concentrates on undervalued stocks.
Initial Public Offerings (IPO) and Secondary Offerings Risk – The Fund may invest a portion of its assets in shares of IPOs or Secondary Offerings of an issuer. IPOs and Secondary Offerings may have a magnified impact on the performance of a Fund with a small asset base. The impact of IPOs and Secondary Offerings on a Fund’s performance likely will decrease as the Fund’s asset size increases, which could reduce a Fund’s returns. IPOs and Secondary Offerings may not be consistently available to the Fund for investing. IPO and Secondary Offering shares frequently are volatile in price due to the absence of a prior public market, the small number of shares available for trading and limited information about the issuer. Therefore, the Fund may hold IPO and Secondary Offering shares for a very short period of time. This may increase the turnover of the Fund and may lead to increased expenses for the Fund, such as commissions and transaction costs. In addition, IPO and Secondary Offering shares can experience an immediate drop in value if the demand for the securities does not continue to support the offering price.
Leverage Risk – The Fund may use leverage to purchase securities. Increases and decreases in the value of the Fund’s portfolio will be magnified when the Fund uses leverage.
25
| Alpine Financial Services Fund (continued) | |
Liquidity Risk – Some securities held by the Fund may be difficult to sell, or illiquid, particularly during times of market turmoil. Illiquid securities may also be difficult to value. If the Fund is forced to sell an illiquid asset to meet redemption requests or other cash needs, the Fund may be forced to sell at a loss.
Management Risk – The Adviser’s judgment about the quality, relative yield or value of, or market trends affecting a particular security or sector, or about interest rates generally, may be incorrect. The Adviser’s security selections and other investment decisions might produce losses or cause the Fund to underperform when compared to other funds with similar investment objectives and strategies.
Market Risk – The price of a security held by the Fund may fall due to changing market, economic or political conditions.
Micro-Capitalization Company Risk – Stock prices of micro-capitalization companies are significantly more volatile, and more vulnerable to adverse business and economic developments than those of larger companies. Micro-capitalization companies often have narrower markets for their goods and/or services and more limited managerial and financial resources than larger, more established companies, including small- or medium-capitalization companies.
Portfolio Turnover Risk – High portfolio turnover necessarily results in greater transaction costs which may reduce Fund performance.
Small- and Medium-Capitalization Company Risk – Securities of small- or medium-capitalization companies are more likely to experience sharper swings in market values, and may be less liquid, in which case it may be more difficult for the Adviser to sell at times and at prices that the Adviser believes appropriate and generally are more volatile than those of larger companies.
Undervalued Stock Risk – The Fund may pursue strategies that may include investing in securities, which, in the opinion of the Adviser, are undervalued. The identification of investment opportunities in undervalued securities is a difficult task and there is no assurance that such opportunities will be successfully recognized or acquired. While investments in undervalued securities offer opportunities for above-average capital appreciation, these investments involve a high degree of financial risk and can result in substantial losses.
Please refer to pages 5-6 for other important disclosures and definitions.
26
| Alpine Innovators Fund | |
| Comparative Annualized Returns as of 10/31/13 (unaudited) | | | | |
| | | 1 Year | | 3 Years | | 5 Years | | Since Inception(1) |
| Alpine Innovators Fund — Institutional Class | | 25.77% | | | 12.01% | | | 15.85% | | | 5.72% | |
| Alpine Innovators Fund — Class A (Without Load) | | 25.49% | | | N/A | | | N/A | | | 19.82% | |
| Alpine Innovators Fund — Class A (With Load) | | 18.56% | | | N/A | | | N/A | | | 16.20% | |
| Russell 3000® Index | | 28.99% | | | 16.89% | | | 15.94% | | | 7.15% | |
| Russell 2000® Growth Index | | 39.84% | | | 19.00% | | | 19.27% | | | 9.10% | |
| S&P 500® Index | | 27.18% | | | 16.56% | | | 15.17% | | | 6.83% | |
| Lipper Multi-Cap Growth Funds Average(2) | | 30.79% | | | 15.52% | | | 16.96% | | | 8.15% | |
| Lipper Multi-Cap Growth Funds Ranking(2) | | 428/523 | | | 413/454 | | | 250/398 | | | 265/308 | |
| Gross Expense Ratio (Institutional Class): 1.67%(3) | | | | | | | | | | | | |
| Net Expense Ratio (Institutional Class): 1.36%(3) | | | | | | | | | | | | |
| Gross Expense Ratio (Class A): 1.92%(3) | | | | | | | | | | | | |
| Net Expense Ratio (Class A): 1.61%(3) | | | | | | | | | | | | |
| | (1) | Institutional Class shares commenced on July 11, 2006 and Class A shares commenced on December 30, 2011. Returns for indices are since July 11, 2006. |
| | (2) | The since inception data represents the period beginning July 13, 2006 (Institutional Class only). |
| | (3) | As disclosed in the prospectus dated February 28, 2013. |
Performance data quoted represents past performance and is not predictive of future results. Investment return and principal value of the Fund fluctuate, so that the shares, when redeemed, may be worth more or less than their original cost. Performance current to the most recent month end may be lower or higher than performance quoted and may be obtained by calling 1-888-785-5578. Performance data shown does not reflect the 1.00% redemption fee imposed on shares held for fewer than 60 days. If it did, total returns would be reduced. Returns for the Class A shares with sales charge reflect a maximum sales charge of 5.50%. Performance for the Class A shares without sales charges does not reflect this load.
Russell 3000® Index measures the performance of the largest 3000 U.S. companies representing approximately 98% of the investable U.S. equity market. Russell 2000® Growth Index measures the performance of the small-cap growth segment of the U.S. equity universe. It includes those Russell 2000 Index companies with higher price-to-value ratios and higher forecasted growth values. The S&P 500® Index is a float-adjusted market capitalization-weighted index of 500 common stocks chosen for market size, liquidity, and industry group representation to represent U.S. equity performance. The Lipper Multi-Cap Growth Funds Average is an average of funds that, by portfolio practice, invest in a variety of market-capitalization ranges without concentrating 75% of their equity assets in any one market-capitalization range over an extended period of time. Multi-cap growth funds typically have an above-average price-to-earnings ratio, price-to-book ratio, and three-year sales per-share growth value, compared to the S&P SuperComposite 1500 Index. Lipper rankings for the periods shown are based on fund total returns with dividends and distributions reinvested and do not reflect sales charges. The Russell 3000® Index, the Russell 2000® Growth Index, the S&P 500® Index and the Lipper Multi-Cap Growth Funds Average are unmanaged and do not reflect the deduction of direct fees associated with a mutual fund, such as investment adviser fees; however, the Lipper Multi-Cap Growth Funds Average reflects fees charged by the underlying funds. The performance for the Alpine Innovators Fund reflects the deduction of fees for these value-added services. Investors cannot directly invest in an index.
Expense Ratios reflect the ratios reported in the Fund’s most recent prospectus. The Alpine Innovators Fund has a contractual expense waiver that continues through February 28, 2014. Where a Fund’s gross and net expense ratios are the same for the period. To the extent the Fund’s expenses were reduced by waivers, the Fund’s total returns were increased. In these cases, in the absence of the expense waivers, the Fund’s total returns would have been lower.
The Fund’s past performance benefitted significantly from Initial Public Offerings (“IPOs”) of certain issuers, and there is no assurance that the Fund can replicate this performance in the future. To the extent that the Fund’s historical performance resulted from gains derived from participation in Secondary Offerings, there is no guarantee that these results can be replicated or that the Fund will be able to participate to the same degree in IPO/Secondary Offerings in the future.
27
| Alpine Innovators Fund (continued) | |
Portfolio Distributions* (unaudited)

Top 10 Holdings* (unaudited)
| 1. | | priceline.com, Inc. | 12.8 | % |
| 2. | | ANSYS, Inc. | 9.5 | % |
| 3. | | Life Technologies Corp. | 6.7 | % |
| 4. | | Google, Inc.-Class A | 5.8 | % |
| 5. | | MEDNAX, Inc. | 5.3 | % |
| 6. | | Flowserve Corp. | 4.5 | % |
| 7. | | Westlake Chemical Corp. | 3.5 | % |
| 8. | | Apple, Inc. | 3.4 | % |
| 9. | | FLIR Systems, Inc. | 2.5 | % |
| 10. | | CME Group, Inc. | 2.4 | % |
| * | Portfolio Distributions percentages are based on total investments. Top 10 Holdings do not include short-term investments and percentages are based on total net assets. Portfolio holdings and sector distributions are as of 10/31/13 and are subject to change. Portfolio holdings are not recommendations to buy or sell any securities. |
Value of a $10,000 Investment (unaudited)
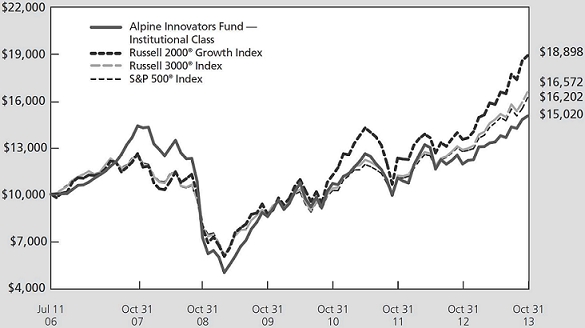
This chart represents a comparison of a hypothetical $10,000 investment in the Fund versus a similar investment in the Fund’s benchmarks. The graph and the table do not reflect the deduction of taxes that a shareholder would pay on Fund distributions or the redemption of Fund shares. Investment performance reflects the waiver and recovery of certain fees, if applicable. Without the waiver and recovery of fees, the Fund’s total return would have differed.
Performance data quoted represents past performance and is not predictive of future results. Investment return and principal value of the Fund fluctuate, so that shares, when redeemed, may be worth more or less than their original cost.
28
| Alpine Innovators Fund (continued) | | |
Commentary
The Alpine Innovators Fund provided a 25.77% return for the fiscal year ending October 31, 2013. This compared with the return of 27.18% for the S&P 500® Index and 28.99% for the Russell 3000® Index. All references in this letter to the Fund’s performance relate to the performance of the Fund’s Institutional Class.
The top five contributors to the Fund’s performance during the twelve months ended October 31, 2013, based on contribution to total return were, priceline.com (85.12%), Life Technologies Corp. (53.95%), ANSYS, Inc. (24.57%), MEDNAX, Inc. (58.05%), and Google Inc. (51.49%). Each of these leading holdings reflected our expectations of great potential through innovative product or management strategies.
Priceline.com (average weight 10.60%) provides services in the travel and related fields, offering discounts and individual negotiation through its internet system. Their motto is “search express deals” with the policy “name your own price” hotels, flights and auto rentals.
Life Technologies Corp. (average weight 6.21%), with a broad spectrum of products in life sciences ranging from molecular biology to genetic analysis to regenerative medicine and to food safety, describes itself as working “to support scientists worldwide, we offer high quality, innovative solutions – from everyday essentials to instruments – for every lab, every application.” It is a leading company in the life sciences field with $3.8 billion revenue and 10,000 employees.
ANSYS, Inc. (average weight 10.65%) provides computer-based engineering simulation early in the development process for innovative products and manufacturing processes. It has long sustained a consistent annual revenue and net income growth based on its technological leadership.
MEDNAX, Inc. (average weight 4.60%) provides physician management services to hospital based neo-natal, maternal/fetal, pediatric cardiology, pediatric intensive care specialties, and anesthesia practices. It has achieved consistent growth both through internal expansion and acquisition of related medical practices.
Google Inc. (average weight 4.90%) provides the world’s leading web-based search engine through its website.
The bottom five contributors to the performance of the Fund this year were: Ariad Pharmaceuticals Inc. (-88.01%), Zagg Inc. (-40.50%), First Internet Bank Corp. (-35.61%), Liquidity Services, Inc. (-35.31%), and Intuitive Surgical Inc. (-31.36%). The portfolio also held significant cash positions during the year as it sought investment
opportunities for the portfolio which had a negative impact on our performance.
Each of these companies was a fundamentally innovative business that encountered unexpected adversities. The most significant detractor, in terms of portfolio size, was Intuitive Surgical (average weight 2.86%). In recent months, the company saw a reduction in demand for its robotic surgical equipment and faced regulatory concerns that inadequately trained surgeons were utilizing the company’s products.
Ariad Pharmaceuticals (average weight 1.97%) was purchased as a development company with prospects for important molecularly-targeted medicines for drug resistant or difficult to treat cancers. Recently, a decision of the Food and Drug Administration caused the suspension of the marketing of the company’s cancer drug and a consequent review of its finances.
Zagg (average weight 1.07%) built a specialized business on providing protective covering for accessories for devices such as the iPad. Intense competition developed which led to lower than expected earnings.
First Internet Bank Corp. (average weight 0.31%) is an institution which operates solely via the internet, providing deposit and loan facilities. Recent increases in mortgage interest rates resulted in the company’s earnings declining below expected levels.
Liquidity Services (average weight 0.73%) is an online auction marketplace for products ranging from aerospace equipment to consumer electronics. Its sizeable business with U.S. government agencies proved negative as a result of the recent sequestration and shutdown.
We believe that the present corporate environment provides opportunities because of the availability of innovative companies and new technologies. The investment strategy of the Fund continues to embrace a broad range of relatively small companies which we believe have advanced technologies, as well as larger, well-established leaders with what, in our view, are highly innovative product lines and potentials. We believe that a continuing recovery in the economic environment in the United States and abroad is highly favorable for businesses dedicated to innovation and thus to investment which is focused on it.
Sincerely,
Stephen A. Lieber
Samuel A. Lieber
Portfolio Managers
29
| Alpine Innovators Fund (continued) | | |
This letter represents the opinions of the Fund’s management and is subject to change, is not guaranteed and should not be considered a recommendation to buy or sell any security. The information provided is not intended to be, and is not, a forecast of future events, a guarantee of future results, or investment advice. Views expressed may vary from those of the firm as a whole. Past performance is no guarantee of future results.
Mutual fund investing involves risk. Principal loss is possible. The fund is subject to risks, including the following:
Equity Securities Risk – The stock or other security of a company may not perform as well as expected, and may decrease in value, because of factors related to the company (such as poorer-than-expected earnings or certain management decisions) or to the industry in which the company is engaged (such as a reduction in the demand for products or services in a particular industry).
Growth Stock Risk – Growth stocks are stocks of companies believed to have above-average potential for growth in revenue and earnings. Growth stocks typically are very sensitive to market movements because their market prices tend to reflect future expectations. When it appears those expectations will not be met, the prices of growth stocks typically fall. Growth stocks as a group may be out of favor and underperform the overall equity market while the market concentrates on undervalued stocks.
Initial Public Offerings (IPO) and Secondary Offerings Risk – The Fund may invest a portion of its assets in shares of IPOs or Secondary Offerings of an issuer. IPOs and Secondary Offerings may have a magnified impact on the performance of a Fund with a small asset base. The impact of IPOs and Secondary Offerings on a Fund’s performance likely will decrease as the Fund’s asset size increases, which could reduce a Fund’s returns. IPOs and Secondary Offerings may not be consistently available to the Fund for investing. IPO and Secondary Offering shares frequently are volatile in price due to the absence of a prior public market, the small number of shares available for trading and limited information about the issuer. Therefore, the Fund may hold IPO and Secondary Offering shares for a very short period of time. This may increase the turnover of the Fund and may lead to increased expenses for the Fund, such as commissions and transaction costs. In addition, IPO and Secondary Offering shares can experience an immediate drop in value if the demand for the securities does not continue to support the offering price.
Innovators Risk – The Adviser seeks to invest in the securities of companies that the Adviser believes have a competitive advantage and offer superior growth potential due to the innovative nature of each company’s products, technology or business model. No assurance can be made that these perceived innovations will occur, or, if they do, that they will result in the vigorous growth anticipated by the Adviser or such growth may be significantly delayed.
Leverage Risk – The Fund may use leverage to purchase securities. Increases and decreases in the value of the Fund’s portfolio will be magnified when the Fund uses leverage.
Management Risk – The Adviser’s judgment about the quality, relative yield or value of, or market trends affecting a particular security or sector, or about interest rates generally, may be incorrect. The Adviser’s security selections and other investment decisions might produce losses or cause the Fund to underperform when compared to other funds with similar investment objectives and strategies.
Market Risk – The price of a security held by the Fund may fall due to changing market, economic or political conditions.
Micro-Capitalization Company Risk – Stock prices of micro-capitalization companies are significantly more volatile, and more vulnerable to adverse business and economic developments than those of larger companies. Micro-capitalization companies often have narrower markets for their goods and/or services and more limited managerial and financial resources than larger, more established companies, including small- or medium-capitalization companies.
Small- and Medium-Capitalization Company Risk – Securities of small- or medium-capitalization companies are more likely to experience sharper swings in market values, and may be less liquid, in which case it may be more difficult for the Adviser to sell at times and at prices that the Adviser believes appropriate and generally are more volatile than those of larger companies. Innovative companies may lack profitability, which in turn may result in the lack of innovative support.
Undervalued Stock Risk – The Fund may pursue strategies that may include investing in securities, which, in the opinion of the Adviser, are undervalued. The identification of investment opportunities in undervalued securities is a difficult task and there is no assurance that such opportunities will be successfully recognized or acquired. While investments in undervalued securities offer opportunities for above-average capital appreciation, these investments involve a high degree of financial risk and can result in substantial losses.
Please refer to pages 5-6 for other important disclosures and definitions.
30
| Alpine Transformations Fund | |
| Comparative Annualized Returns as of 10/31/13 (unaudited) |
| | | | 1 Year | | | 3 Years | | | 5 Years | | Since Inception(1) |
| Alpine Transformations Fund — Institutional Class | | | 30.09 | % | | | 14.00 | % | | | 21.56 | % | | | 7.65% | |
| Alpine Transformations Fund — Class A (Without Load) | | | 29.82 | % | | | N/A | | | N/A | | | 17.91% | |
| Alpine Transformations Fund — Class A (With Load) | | | 22.69 | % | | | N/A | | | N/A | | | 14.35% | |
| Russell 3000® Index | | | 28.99 | % | | | 16.89 | % | | | 15.94 | % | | | 5.81% | |
| Russell 2000® Value Index | | | 32.83 | % | | | 16.33 | % | | | 14.84 | % | | | 7.25% | |
| S&P 500® Index | | | 27.18 | % | | | 16.56 | % | | | 15.17 | % | | | 5.29% | |
| S&P MidCap 400® Index | | | 33.47 | % | | | 17.55 | % | | | 19.63 | % | | | 8.77% | |
| Lipper Multi-Cap Growth Funds Average(2) | | | 30.79 | % | | | 15.52 | % | | | 16.96 | % | | | 5.35% | |
| Lipper Multi-Cap Growth Funds Ranking(2) | | | 272/523 | | | 329/454 | | | 21/398 | | | 70/365 | |
| Gross Expense Ratio (Institutional Class): 1.98%(3) | | | | | | | | | | | | | | | | |
| Net Expense Ratio (Institutional Class): 1.35%(3) | | | | | | | | | | | | | | | | |
| Gross Expense Ratio (Class A): 2.23%(3) | | | | | | | | | | | | | | | | |
| Net Expense Ratio (Class A): 1.60%(3) | | | | | | | | | | | | | | | | |
| | (1) | Institutional Class shares commenced on December 31, 2007 and Class A shares commenced on December 30, 2011. Returns for indices are since December 31, 2007. |
| | (2) | Institutional Class only. |
| | (3) | As disclosed in the prospectus dated February 28, 2013. |
Performance data quoted represents past performance and is not predictive of future results. Investment return and principal value of the Fund fluctuate, so that the shares, when redeemed, may be worth more or less than their original cost. Performance current to the most recent month end may be lower or higher than performance quoted and may be obtained by calling 1-888-785-5578. Performance data shown does not reflect the 1.00% redemption fee imposed on shares held for fewer than 60 days. If it did, total returns would be reduced. Returns for the Class A shares with sales charge reflect a maximum sales charge of 5.50%. Performance for the Class A shares without sales charges does not reflect this load.
Russell 3000® Index measures the performance of the largest 3000 U.S. companies representing approximately 98% of the investable U.S. equity market. Russell 2000® Value Index measures the performance of the small-cap value segment of the U.S. equity universe. It includes those Russell 2000 Index companies with lower price-to-book ratios and lower forecasted growth values. The S&P 500® Index is a float-adjusted market capitalization-weighted index of 500 common stocks chosen for market size, liquidity, and industry group representation to represent U.S. equity performance. The S&P MidCap 400® Index is a float-adjusted market capitalization-weighted index of 400 medium-capitalization domestic stocks chosen for market size, liquidity, and industry group representation. The Lipper Multi-Cap Growth Funds Average is an average of Funds that, by portfolio practice, invest in a variety of market-capitalization ranges without concentrating 75% of their equity assets in any one market-capitalization range over an extended period of time. Multi-cap growth funds typically have an above-average price-to-earnings ratio, price-to-book ratio, and three-year sales per-share growth value, compared to the S&P SuperComposite 1500 Index. Lipper rankings for the periods shown are based on fund total returns with dividends and distributions reinvested and do not reflect sales charges. The Russell 3000® Index, the Russell 2000® Value Index, the S&P 500® Index, the S&P MidCap 400® Index and the Lipper Multi-Cap Growth Funds Average are unmanaged and do not reflect the deduction of direct fees associated with a mutual fund, such as investment adviser fees; however, the Lipper Multi-Cap Growth Funds Average reflects fees charged by the underlying funds. The performance for the Alpine Transformations Fund reflects the deduction of fees for these value-added services. Investors cannot directly invest in an index.
Expense Ratios reflect the ratios reported in the Fund’s most recent prospectus. The Alpine Transformations Fund has a contractual expense waiver that continues through February 28, 2014. Where a Fund’s gross and net expense ratios are the same for the period reported, the contractual expense reimbursement level was not reached as of the end of that period. To the extent the Fund’s expenses were reduced by waivers, the Fund’s total returns were increased. In these cases, in the absence of the expense waivers, the Fund’s total returns would have been lower.
To the extent that the Fund’s historical performance resulted from gains derived from participation in Initial Public Offerings (“IPOs”) and/or Secondary Offerings, there is no guarantee that these results can be replicated in future periods or that the Fund will be able to participate to the same degree in IPO/Secondary Offerings in the future.
31
| Alpine Transformations Fund (continued) | |
Portfolio Distributions* (unaudited)

| Top 10 Holdings* (unaudited) |
| 1. | | priceline.com, Inc. | | | 5.79 | % |
| 2. | | Apple, Inc. | | | 5.02 | % |
| 3. | | Snap-on, Inc. | | | 4.29 | % |
| 4. | | Deluxe Corp. | | | 3.23 | % |
| 5. | | Garmin, Ltd. | | | 3.21 | % |
| 6. | | RR Donnelley & Sons Co. | | | 3.06 | % |
| 7. | | Google, Inc.-Class A | | | 2.83 | % |
| 8. | | Weis Markets, Inc. | | | 2.81 | % |
| 9. | | Eastman Chemical Co. | | | 2.70 | % |
| 10. | | Flotek Industries, Inc. | | | 2.64 | % |
| * | Portfolio Distributions percentages are based on total investments. Top 10 Holdings do not include short-term investments and percentages are based on total net assets. Portfolio holdings and sector distributions are as of 10/31/13 and are subject to change. Portfolio holdings are not recommendations to buy or sell any securities. |
Value of a $10,000 Investment (unaudited)
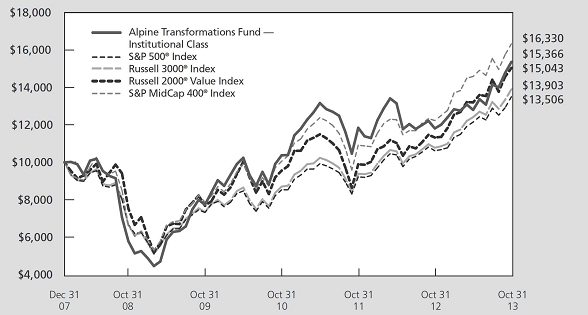
This chart represents a comparison of a hypothetical $10,000 investment in the Fund versus a similar investment in the Fund’s benchmarks. The graph and the table do not reflect the deduction of taxes that a shareholder would pay on Fund distributions or the redemption of Fund shares. Investment performance reflects the waiver and recovery of certain fees, if applicable. Without the waiver and recovery of fees, the Fund’s total return would have differed.
Performance data quoted represents past performance and is not predictive of future results. Investment return and principal value of the Fund fluctuate, so that shares, when redeemed, may be worth more or less than their original cost.
32
| Alpine Transformations Fund (continued) | | |
Commentary
The portfolio return for Alpine Transformations Fund for the fiscal year ended October 31, 2013 was 30.09% compared with the Russell 3000® Index at 28.99% and the S&P 500® Index at 27.18%. Investment results for 2013 reflect a strong equity market as well as favorable returns for the industrials, consumer discretionary and materials sectors, which were well represented in the Fund. All references to the Fund’s performance relate to the performance of the Fund’s Institutional Class.
We continue to see opportunity and attractive value driving companies that are undergoing a transformation. Companies often experience a sharp rise or decline in their investment outlook, their reputation or their position with their customer base. In this challenged economy, a company may find itself in need of transformation due to market or technology changes. Consumer preference changes can also occur and dramatically alter a company’s prospects. Changing economic conditions often cause unanticipated reactions, and we look for companies effectively managing such changes. Investments in such companies may prove to be favorable if management can execute a positive change or new management is brought in and can expand the company’s opportunities.
Among our holdings during the fiscal year, investors will find companies moving into new markets as older products lose momentum (Garmin), companies addressing new market opportunities with new applications (Cray Computers, Snap-On Tools), companies that are shifting their business portfolios (DSM, Clariant) and companies where management changes have brought better execution (Flotek, Murphy Oil). These are a few examples of the changes we look for in making investments for the Alpine Transformations Fund. We acknowledge that transformations can take some time to come to fruition, especially in challenging global economic conditions. We often hold stocks for long time frames as transformation does not always occur in a smooth, orderly fashion. The portfolio also held significant cash positions during the year as it sought investment opportunities for the portfolio.
The top five contributors to the Fund’s performance during the twelve months ended October 31, 2013, based on contribution to total return were priceline.com (85.17%); Flotek Industries (93.72%); Cray, Inc. (84.49%); R.R. Donnelley and Sons (107.58%); and Protolabs, (72.29%).
Priceline (average weight 4.98%) has continued to gain market share, open new geographies and attract consumers to its “name your own price” concept, Priceline.com continues to transform the competitive landscape with new products and services.
Flotek (average weight 3.51%) experienced financial distress after an acquisition before the financial crisis, but new management and a focus on their specialty chemicals suite of products for the oil and gas industry, was able to turn around some underperforming oil service rental tool assets this year as well as boost sales in chemicals.
Cray (average weight 3.50%), historically a producer of super computers traditionally sold to governments and universities continued its business unit expansion into commercial markets, where computers that can handle “big data” remain in demand.
R.R. Donnelly (average weight 1.90%) continued to shift their portfolio mix as they added auxiliary services around their traditional print business to offset a decline in more traditional print sales. Since sales in print have been declining for some time, investors became concerned that their dividends may not be paid and that R.R. Donnelley’s balance sheet was too stretched. However, R.R. Donnelly has maintained the dividend, paid down some debt and refinanced its balance sheet. In addition, in the second half of 2013, the traditional print business has showed positive growth.
Protolabs (average weight 2.03%) continued to expand capacity in their 3D computer-generated prototypes and parts business, expanding the types of materials used in this relatively new industry.
Solarwinds (-27.71%); Edwards Lifesciences (-24.92%); Intuitive Surgical (-31.24%); Liquidity Services (-35.31%); and Walter Energy (-67.28%) had the largest adverse impact on the performance of the Fund over the fiscal year.
Solarwinds (average weight 2.32%) is undergoing a slowdown in sales for its software company after a period of prolonged growth. This has hurt the company’s share price.
Edwards Lifesciences (average weight 2.39%) continues to have competitive issues with their heart valve product which has slowed the company’s growth.
Intuitive Surgical (average weight 2.42%) has been hurt by slower sales of their flagship Da Vinci robotic surgery tools as inquiries by regulators into doctor training and usage likely postponed some sales.
Liquidity Services (average weight 1.57%) is a company that auctions off government surplus equipment, among other businesses, and was negatively affected by both sequester and the government’s shutdown, as well as by a lack of profitability in a UK division.
33
| Alpine Transformations Fund (continued) | | |
Walter Energy (average weight 0.42%), which supplies metallurgical coal to the steel industry, has been challenged by lackluster world steel demand and a slower than expected Chinese infrastructure build.
There was some volatility in equity markets over the late spring and into the summer, as the Federal Reserve (Fed) signaled it was going to slow purchases of fixed income assets, currently running at $85 billion a month. This caused a sharp reversal in interest rates, which had been trending lower, (the 10-year U.S. Treasury bond hit a low of 1.66% before “taper talk” caused market participants holding fixed income securities to become concerned that without Fed support interest rates would rise), thus causing bond prices to fall. This also had an effect on equity markets, as concern that any removal of liquidity, which the bond buying is seen as enhancing, would challenge equity prices. The surprise in September was that after preparing markets for a change in Fed policy,
the policy was left alone, as the Fed stated that uncertain economic conditions precluded a taper of bond buying at that time. Equity markets reacted quite favorably to that development, and bond markets reversed the slide that had led to higher rates. We believe the volatility is likely to continue, as the Fed looks to exit the unusual monetary policy brought on by the financial crisis.
We continue to see opportunity and value in companies that are undergoing a transformation, whether in product portfolios, geographical reach, management changes or other major changes in the marketplace or the competitive outlook.
Sincerely,
Stephen A. Lieber
Sarah Hunt
Co-Portfolio Managers
34
| Alpine Transformations Fund (continued) | | |
This letter represents the opinions of the Fund’s management and is subject to change, is not guaranteed and should not be considered a recommendation to buy or sell any security. The information provided is not intended to be, and is not, a forecast of future events, a guarantee of future results, or investment advice. Views expressed may vary from those of the firm as a whole. Past performance is no guarantee of future results.
Mutual fund investing involves risk. Principal loss is possible. The fund is subject to risks, including the following:
Equity Securities Risk – The stock or other security of a company may not perform as well as expected, and may decrease in value, because of factors related to the company (such as poorer-than-expected earnings or certain management decisions) or to the industry in which the company is engaged (such as a reduction in the demand for products or services in a particular industry).
Foreign Securities Risk – The Fund’s investments in securities of foreign issuers or issuers with significant exposure to foreign markets involve additional risk. Foreign countries in which the Fund may invest may have markets that are less liquid, less regulated and more volatile than U.S. markets. The value of the Fund’s investments may decline because of factors affecting the particular issuer as well as foreign markets and issuers generally, such as unfavorable government actions, and political or financial instability. Lack of information may also affect the value of these securities. The risks of foreign investments are heightened when investing in issuers in emerging market countries.
Growth Stock Risk – Growth stocks are stocks of companies believed to have above-average potential for growth in revenue and earnings. Growth stocks typically are very sensitive to market movements because their market prices tend to reflect future expectations. When it appears those expectations will not be met, the prices of growth stocks typically fall. Growth stocks as a group may be out of favor and underperform the overall equity market while the market concentrates on undervalued stocks.
Initial Public Offerings (IPO) and Secondary Offerings Risk – The Fund may invest a portion of its assets in shares of IPOs or Secondary Offerings of an issuer. IPOs and Secondary Offerings may have a magnified impact on the performance of a Fund with a small asset base. The impact of IPOs and Secondary Offerings on a Fund’s performance likely will decrease as the Fund’s asset size increases, which could reduce a Fund’s returns. IPOs and Secondary Offerings may not be consistently available to the Fund for investing. IPO and Secondary Offering shares frequently are volatile in price due to the absence of a prior public market, the small number of shares available for trading and limited information about the issuer. Therefore, the Fund may hold IPO and Secondary Offering shares for a very short period of time. This may increase the turnover of the Fund and may lead to increased expenses for the Fund, such as commissions and transaction costs. In addition, IPO and Secondary Offering shares can experience an immediate drop in value if the demand for the securities does not continue to support the offering price.
Management Risk – The Adviser’s judgment about the quality, relative yield or value of, or market trends affecting a particular security or sector, or about interest rates generally, may be incorrect. The Adviser’s security selections and other investment decisions might produce losses or cause the Fund to underperform when compared to other funds with similar investment objectives and strategies.
Market Risk – The price of a security held by the Fund may fall due to changing market, economic or political conditions.
Micro-Capitalization Company Risk – Stock prices of micro-capitalization companies are significantly more volatile, and more vulnerable to adverse business and economic developments than those of larger companies. Micro-capitalization companies often have narrower markets for their goods and/or services and more limited managerial and financial resources than larger, more established companies, including small- or medium-capitalization companies.
Small- and Medium-Capitalization Company Risk – Securities of small- or medium-capitalization companies are more likely to experience sharper swings in market values, and may be less liquid, in which case it may be more difficult for the Adviser to sell at times and at prices that the Adviser believes appropriate and generally are more volatile than those of larger companies.
35
| Alpine Transformations Fund (continued) | | |
“Special Situations” Companies Risk – “Special situations” include a change in management or management policies, the acquisition of a significant equity position in the company by others, a merger or reorganization, or the sale or spin-off of a division or subsidiary which, if resolved favorably, would improve the value of the company’s stock. If the actual or prospective situation does not materialize as anticipated, the market price of the securities of a “special situation” company may decline significantly. There can be no assurance that a “special situation” that exists at the time of its investment will be consummated under the terms and within the time period contemplated. Investments in “special situations” companies can present greater risks than investments in companies not experiencing special situations.
Transformation Risk – The Adviser seeks to invest in the securities of companies that the Adviser believes are entering or on the verge of entering a corporate transformation. No assurance can be made that these transformations will result in the vigorous growth anticipated by the Adviser or such growth may be significantly delayed.
Undervalued Stock Risk – The Fund may pursue strategies that may include investing in securities, which, in the opinion of the Adviser, are undervalued. The identification of investment opportunities in undervalued securities is a difficult task and there is no assurance that such opportunities will be successfully recognized or acquired. While investments in undervalued securities offer opportunities for above-average capital appreciation, these investments involve a high degree of financial risk and can result in substantial losses.
Please refer to pages 5-6 for other important disclosures and definitions.
36
| Alpine Foundation Fund | |
| Comparative Annualized Returns as of 10/31/13 (unaudited) |
| | | | 1 Year | | | 3 Years | | | 5 Years | | | 10 Years | | Since Inception(1) |
| Alpine Foundation Fund — Institutional Class | | | 10.56 | % | | | 8.88 | % | | | 10.66 | % | | | 4.72 | % | | | 5.11% | |
| Alpine Foundation Fund — Class A (Without Load) | | | 10.20 | % | | | N/A | | | N/A | | | N/A | | | 10.67% | |
| Alpine Foundation Fund — Class A (With Load) | | | 4.12 | % | | | N/A | | | N/A | | | N/A | | | 7.30% | |
| S&P 500® Index | | | 27.18 | % | | | 16.56 | % | | | 15.17 | % | | | 7.46 | % | | | 4.69% | |
| Custom Balanced Benchmark | | | 15.17 | % | | | 11.19 | % | | | 11.83 | % | | | 6.66 | % | | | 5.25% | |
Lipper Mixed-Asset Target Allocation
Growth Funds Average(2) | | | 17.93 | % | | | 10.17 | % | | | 12.32 | % | | | 6.38 | % | | | 4.78% | |
Lipper Mixed-Asset Target Allocation
Growth Funds Ranking(2) | | | 555/561 | | | 403/509 | | | 394/470 | | | 246/269 | | | 77/194 | |
| Gross Expense Ratio (Institutional Class): 1.24%(3) | | | | | | | | | | | | | | | | | | | | |
| Net Expense Ratio (Institutional Class): 1.24%(3) | | | | | | | | | | | | | | | | | | | | |
| Gross Expense Ratio (Class A): 1.49%(3) | | | | | | | | | | | | | | | | | | | | |
| Net Expense Ratio (Class A): 1.49%(3) | | | | | | | | | | | | | | | | | | | | |
| | (1) | Institutional Class shares commenced on June 7, 2001 and Class A shares commenced on December 30, 2011. Returns for indices are since June 7, 2001. |
| | (2) | Institutional Class only. |
| | (3) | As disclosed in the prospectus dated February 28, 2013. |
Performance data quoted represents past performance and is not predictive of future results. Investment return and principal value of the Fund fluctuate, so that the shares, when redeemed, may be worth more or less than their original cost. Performance current to the most recent month end may be lower or higher than performance quoted and may be obtained by calling 1-888-785-5578. Performance data shown does not reflect the 1.00% redemption fee imposed on shares held for fewer than 60 days. If it did, total returns would be reduced. Returns for the Class A shares with sales charge reflect a maximum sales charge of 5.50%. Performance for the Class A shares without sales charges does not reflect this load.
The S&P 500® Index is a float-adjusted market capitalization-weighted index of 500 common stocks chosen for market size, liquidity, and industry group representation to represent U.S. equity performance. The Custom Balanced Benchmark reflects an unmanaged portfolio (rebalanced monthly) of 60% of the S&P 500® Index and 40% of the Barclays U.S. Aggregate Bond Index, which is a widely recognized, unmanaged index of U.S. dollar-denominated investment-grade fixed income securities. The Fund may, however, invest up to 75% of its total assets in equity securities. The Lipper Mixed-Asset Target Allocation Growth Funds Average is an average of funds that, by portfolio practice, maintain a mix of between 60%-80% equity securities, with the remainder invested in bonds, cash, and cash equivalents. Lipper rankings for the periods shown are based on fund total returns with dividends and distributions reinvested and do not reflect sales charges. The S&P 500® Index and the Lipper Mixed-Asset Target Allocation Growth Funds Average are unmanaged and do not reflect the deduction of direct fees associated with a mutual fund, such as investment adviser fees; however, the Lipper Mixed-Asset Target Allocation Growth Funds Average reflects fees charged by the underlying funds. The performance for the Alpine Foundation Fund reflects the deduction of fees for these value-added services. Investors cannot directly invest in an index.
Expense Ratios reflect the ratios reported in the Fund’s most recent prospectus. The Alpine Foundation Fund has a contractual expense waiver that continues through February 28, 2014. Where a Fund’s gross and net expense ratios are the same for the period reported, the contractual expense reimbursement level was not reached as of the end of that period. To the extent the Fund’s expenses were reduced by waivers, the Fund’s total returns were increased. In these cases, in the absence of the expense waivers, the Fund’s total returns would have been lower.
To the extent that the Fund’s historical performance resulted from gains derived from participation in Initial Public Offerings (“IPOs”) and/or Secondary Offerings, there is no guarantee that these results can be replicated in future periods or that the Fund will be able to participate to the same degree in IPO/Secondary Offerings in the future.
37
| Alpine Foundation Fund (continued) | |
Portfolio Distributions* (unaudited)

| Top 10 Holdings* (unaudited) |
| 1. | | U.S. Treasury Bonds, 6.00, 02/15/2026 | 11.2 | % |
| 2. | | U.S. Treasury Bonds, 5.25, 11/15/2028 | 7.1 | % |
| 3. | | Simon Property Group, Inc. | 5.2 | % |
| 4. | | U.S. Treasury Bonds, 3.00, 05/15/2042 | 3.7 | % |
| 5. | | Johnson & Johnson | 3.5 | % |
| 6. | | JPMorgan Chase & Co. | 3.3 | % |
| 7. | | CBL & Associates Properties, Inc. | 2.8 | % |
| 8. | | The Boeing Co. | 2.8 | % |
| 9. | | General Electric Co. | 2.7 | % |
| 10. | | International Business Machines Corp. | 2.5 | % |
| * | Portfolio Distributions percentages are based on total investments. Top 10 Holdings do not include short-term investments and percentages are based on total net assets. Portfolio holdings and sector distributions are as of 10/31/13 and are subject to change. Portfolio holdings are not recommendations to buy or sell any securities. |
| Value of a $10,000 Investment (unaudited) |
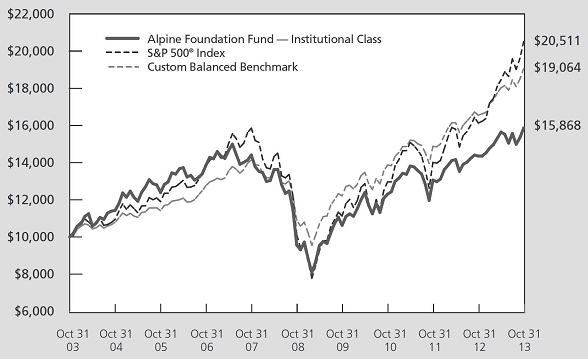 |
This chart represents a comparison of a hypothetical $10,000 investment in the Fund versus a similar investment in the Fund’s benchmarks. The graph and the table do not reflect the deduction of taxes that a shareholder would pay on Fund distributions or the redemption of Fund shares. Investment performance reflects the waiver and recovery of certain fees, if applicable. Without the waiver and recovery of fees, the Fund’s total return would have differed.
Performance data quoted represents past performance and is not predictive of future results. Investment return and principal value of the Fund fluctuate, so that shares, when redeemed, may be worth more or less than their original cost.
38
| Alpine Foundation Fund (continued) | |
Commentary
The Alpine Foundation Fund provided a 10.56% total return for the fiscal year ended October 31, 2013. This compared with 15.17% for our Custom Balanced Benchmark and 27.18% for the S&P 500® Index. All references in this letter to the Fund’s performance relate to the performance of the Fund’s Institutional Class.
Investment results for the fiscal year reflected both the rising equity market and the declining bond market, especially with respect to U.S. Treasury obligations. Treasury obligations held in the portfolio at the end of the year were slightly less than 24% of assets. These Treasury holdings provided an overall negative return of approximately 6% during the fiscal year. The portfolio also held significant cash positions during the year as it sought investment opportunities for the equity side of the portfolio.
The equity side of the portfolio was in contrast to the fixed income component. The following are the top five contributors to the performance* in the portfolio and their total return during the fiscal year.
| The Boeing Company | +89.46 | %, |
| | | |
| Johnson & Johnson | +34.98 | % |
| | | |
| JPMorganChase | +27.11 | % |
| | | |
| Walgreen Company | +72.95 | % |
| | | |
| General Electric | +28.29 | % |
We believe that portfolio performance was significantly impacted by shifting expectations with regard to the Federal Reserve’s program of buying bonds. Major sectors fell under pressure beginning in late May with the announcement of a possible reduction in the Federal Reserve’s active bond market support. This particularly affected the real estate and utility sectors. Large holdings* such as Boston Properties and Simon Property Group fell during this period, with total returns for the year being 4.45% and -0.18%, respectively.
In contrast to real estate, which was under pressure in expectation of higher interest rates, bank holdings* reflected investor optimism with respect to net interest margins in an environment of higher interest rates. The
major banks among our holdings provided substantial returns: Bank of America Corp. up 50.39%, Wells Fargo & Company up 30.37%, Citigroup up 30.61%, JPMorganChase up 27.11%, and PNC Financial Services Group up 29.57%. Smaller banks among our holdings showed varied returns ranging from 8.38% for Sun Bancorp Inc. to 47.89% for Southside Bankshares Inc.
The following are the bottom five contributors to the performance* in the portfolio and their total return during the fiscal year.
| CBL & Associates | -7.58 | % |
| | | |
| Apple Inc. | -10.10 | % |
| | | |
| Just Energy Group Inc. | -22.37 | % |
| | | |
| Alexander & Baldwin, Inc. | -18.12 | % |
| | | |
| IBM | -6.17 | % |
With the challenges in this fiscal year primarily due to the upward move of interest rates after the Federal Reserve suggested that it may reduce its bond buying program, we aimed to reduce dependence on the interest rate side. We built a base in the portfolio of varied economic growth opportunities, and anticipate that we will concentrate on those issuers who offer a combination of growth and income.
We thank our investors for their continued support.
Sincerely,
Stephen A. Lieber
Samuel A. Lieber
Portfolio Managers
| * | Average weights for each individual holding included in this letter are as follows: The Boeing Company 2.03%, Johnson & Johnson 3.22%, JPMorgan Chase 3.29%, Walgreen Co. 1.10%, General Electric 2.50%, CBL & Associates 3.22%, Apple Inc. 1.39%, Just Energy Group 0.55%, Alexander & Baldwin 0.25%, IBM 2.86%, Boston Properties 2.02%, Simon Property Group 5.56%, Bank of America Corp. 1.16%, Wells Fargo 0.58%, Citigroup 0.96%, PNC Financial Services Group 0.49%, Sun Bancorp 0.13% and Southside Bankshares 0.28%. |
39
| Alpine Foundation Fund (continued) | |
This letter represents the opinions of the Fund’s management and is subject to change, is not guaranteed and should not be considered a recommendation to buy or sell any security. The information provided is not intended to be, and is not, a forecast of future events, a guarantee of future results, or investment advice. Views expressed may vary from those of the firm as a whole. Past performance is no guarantee of future results.
Mutual fund investing involves risk. Principal loss is possible. The Fund is subject to risks, including the following:
Credit Risk – Credit risk refers to the possibility that the issuer of a security will not be able to make payments of interest and principal when due. Changes in an issuer’s credit rating or the market’s perception of an issuer’s creditworthiness may also affect the value of the Fund’s investment in that issuer.
Dividend Strategy Risk – The Fund’s strategy of investing in dividend-paying stocks involves the risk that such stocks may fall out of favor with investors and underperform the market. Companies that issue dividend-paying stocks are not required to continue to pay dividends on such stocks. Therefore, there is the possibility that such companies could reduce or eliminate the payment of dividends in the future.
Equity Securities Risk – The stock or other security of a company may not perform as well as expected, and may decrease in value, because of factors related to the company (such as poorer-than-expected earnings or certain management decisions) or to the industry in which the company is engaged (such as a reduction in the demand for products or services in a particular industry).
Fixed Income Securities Risk – Fixed income securities are subject to issuer risk, interest rate risk and market risk.
Growth Stock Risk – Growth stocks typically are very sensitive to market movements because their market prices tend to reflect future expectations. When it appears those expectations will not be met, the prices of growth stocks typically fall. Growth stocks as a group may be out-of-favor and underperform the overall equity market while the market concentrates on undervalued stocks. Although the Fund will not concentrate its investments in any one industry or industry group, it may, like many growth funds, weight its investments toward certain industries, thus increasing its exposure to factors adversely affecting issuers within those industries.
Initial Public Offerings (IPO) and Secondary Offerings Risk – The Fund may invest a portion of its assets in shares of IPOs or Secondary Offerings of an issuer. IPOs and Secondary Offerings may have a magnified impact on the performance of a Fund with a small asset base. The impact of IPOs and Secondary Offerings on a Fund’s performance likely will decrease as the Fund’s asset size increases, which could reduce a Fund’s returns. IPOs and Secondary Offerings may not be consistently available to the Fund for investing. IPO and Secondary Offering shares frequently are volatile in price due to the absence of a prior public market, the small number of shares available for trading and limited information about the issuer. Therefore, the Fund may hold IPO and Secondary Offering shares for a very short period of time. This may increase the turnover of the Fund and may lead to increased expenses for the Fund, such as commissions and transaction costs. In addition, IPO and Secondary Offering shares can experience an immediate drop in value if the demand for the securities does not continue to support the offering price.
Interest Rate Risk – Interest rates may rise resulting in a decrease in the value of securities held by the Fund, or may fall resulting in an increase in the value of such securities. Securities having longer maturities generally involve a greater risk of fluctuations in the value resulting from changes in interest rates.
Issuer Risk – Changes in the financial condition of the issuer of an obligation, changes in general economic conditions, or changes in economic conditions that affect the issuer may impact its actual or perceived willingness or ability to make timely payments of interest or principal.
Management Risk – The Adviser’s judgment about the quality, relative yield or value of, or market trends affecting a particular security or sector, or about interest rates generally, may be incorrect. The Adviser’s security selections and other investment decisions might produce losses or cause the Fund to underperform when compared to other funds with similar investment objectives and strategies.
Market Risk – The price of a security held by the Fund may fall due to changing market, economic or political conditions.
40
| Alpine Foundation Fund (continued) | |
Micro-Capitalization Company Risk – Stock prices of micro-capitalization companies are significantly more volatile, and more vulnerable to adverse business and economic developments than those of larger companies. Micro-capitalization companies often have narrower markets for their goods and/or services and more limited managerial and financial resources than larger, more established companies, including small- or medium-capitalization companies.
Small- and Medium-Capitalization Company Risk – Securities of small- or medium-capitalization companies are more likely to experience sharper swings in market values, and may be less liquid, in which case it may be more difficult for the Adviser to sell at times and at prices that the Adviser believes appropriate and generally are more volatile than those of larger companies.
“Special Situations” Companies Risk – “Special situations” include a change in management or management policies, the acquisition of a significant equity position in the company by others, a merger or reorganization, or the sale or spin-off of a division or subsidiary which, if resolved favorably, would improve the value of the company’s stock. If the actual or prospective situation does not materialize as anticipated, the market price of the securities of a “special situation” company may decline significantly. There can be no assurance that a “special situation” that exists at the time of its investment will be consummated under the terms and within the time period contemplated. Investments in “special situations” companies can present greater risks than investments in companies not experiencing special situations.
Undervalued Stock Risk – The Fund may pursue strategies that may include investing in securities, which, in the opinion of the Adviser, are undervalued. The identification of investment opportunities in undervalued securities is a difficult task and there is no assurance that such opportunities will be successfully recognized or acquired. While investments in undervalued securities offer opportunities for above-average capital appreciation, these investments involve a high degree of financial risk and can result in substantial losses.
U.S. Government Securities Risk – U.S. Government securities are obligations of, or guaranteed by, the U.S. Government, its agencies or Government-sponsored entities. U.S. Government securities include issues by non-governmental entities (like financial institutions) that carry direct guarantees from U.S. Government Agencies as part of government initiatives in response to the market crisis or otherwise. Although the U.S. Government guarantees principal and interest payments on securities issued by the U.S. Government and some of its agencies, such as securities issued by the Government National Mortgage Association (Ginnie Mae), this guarantee does not apply to losses resulting from declines in the market value of these securities. Some of the U.S. Government securities that the Fund may hold are not guaranteed or backed by the full faith and credit of the U.S. Government, such as those issued by the Federal National Mortgage Association (Fannie Mae) and the Federal Home Loan Mortgage Corporation (Freddie Mac). Although the U.S. Government has recently provided financial support to Fannie Mae and Freddie Mac, there can be no assurance that it will support these or other government-sponsored enterprises in the future.
Please refer to pages 5-6 for other important disclosures and definitions.
41
Fixed Income Manager Reports

| | Alpine Ultra Short Tax Optimized Income Fund |
| | |
| | Alpine Municipal Money Market Fund |
| | |
| | Alpine High Yield Managed Duration Municipal Fund |
42
| Alpine Ultra Short Tax Optimized Income Fund | |
Comparative Annualized Returns as of 10/31/13 (unaudited) |
| | | | 1 Year | | | 3 Years | | | 5 Years | | | 10 Years | | Since Inception(1) |
Alpine Ultra Short Tax Optimized Income Fund —
Institutional Class | | | 0.36 | % | | | 1.06 | % | | | 1.62 | % | | | 2.39 | % | | | 2.57 | % | | |
Alpine Ultra Short Tax Optimized Income Fund —
Institutional Class (Pre-liquidation, After-tax) | | | 0.13 | % | | | 0.90 | % | | | 1.52 | % | | | 2.17 | % | | | 2.30 | % | | |
Alpine Ultra Short Tax Optimized Income Fund —
Institutional Class (Post-liquidation, After-tax) | | | 0.21 | % | | | 0.91 | % | | | 1.51 | % | | | 2.20 | % | | | 2.30 | % | | |
Alpine Ultra Short Tax Optimized Income Fund —
Class A | | | 0.21 | % | | | 0.84 | % | | | 1.39 | % | | | N/A | | | 2.11 | % | | |
Alpine Ultra Short Tax Optimized Income Fund —
Class A (Pre-liquidation, After-tax) | | | 0.08 | % | | | 0.74 | % | | | 1.33 | % | | | N/A | | | 1.93 | % | | |
Alpine Ultra Short Tax Optimized Income Fund —
Class A (Post-liquidation, After-tax) | | | 0.12 | % | | | 0.75 | % | | | 1.31 | % | | | N/A | | | 1.97 | % | | |
| Barclays 1 Year Municipal Bond Index | | | 0.74 | % | | | 0.97 | % | | | 1.82 | % | | | 2.25 | % | | | 2.25 | % | | |
| Lipper Short Municipal Debt Funds Average(2) | | | 0.17 | % | | | 1.13 | % | | | 2.13 | % | | | 1.99 | % | | | 1.99 | % | | |
Lipper Short Municipal Debt Funds Ranking —
Institutional Class(2) | | | 38/88 | | | 40/83 | | | 45/64 | | | 13/49 | | | 9/42 | | |
| Gross Expense Ratio (Institutional Class): 0.84%(3) | | | | | | | | | | | | | | | | | | | | | | |
| Net Expense Ratio (Institutional Class): 0.70%(3) | | | | | | | | | | | | | | | | | | | | | | |
| Gross Expense Ratio (Class A): 1.09%(3) | | | | | | | | | | | | | | | | | | | | | | |
| Net Expense Ratio (Class A): 0.95%(3) | | | | | | | | | | | | | | | | | | | | | | |
| | (1) | Institutional Class shares commenced on December 5, 2002 and Class A shares commenced on March 30, 2004. Returns for indices are since December 5, 2002. |
| | (2) | The since inception data represents the period beginning December 31, 2002. |
| | (3) | As disclosed in the prospectus dated February 28, 2013. |
Performance data quoted represents past performance and is not predictive of future results. Investment return and principal value of the Fund fluctuate, so that the shares, when redeemed, may be worth more or less than their original cost. Performance current to the most recent month end may be lower or higher than performance quoted and may be obtained by calling 1-888-785-5578. Performance data shown does not reflect the 0.25% redemption fee imposed on shares held for fewer than 30 days. If it did, total returns would be reduced. Effective 10/12/07, Alpine Ultra Short Tax Optimized Fund - Class A began imposing a maximum sales charge of 0.50% on purchases. Performance data shown for time period beginning with dates after 10/12/07 reflect the sales charge.
The after-tax performance figures reflect a tax rate of 35% and the Medicare tax of 3.8%.
The Barclays 1 Year Municipal Bond Index is the 1-year component of the Municipal Bond Index. The Barclays 1 Year Municipal Bond Index is a rules-based, market value-weighted index engineered for the long-term, tax-exempt bond market. The Lipper Short Municipal Debt Funds Average is an unmanaged index that tracks funds that invest in municipal debt issues with dollar-weighted average maturities of less than three years. Lipper rankings for the periods shown are based on fund total returns with dividends and distributions reinvested and do not reflect sales charges. The Barclays 1 Year Municipal Bond Index and the Lipper Short Municipal Debt Funds Average are unmanaged and do not reflect the deduction of direct fees associated with a mutual fund, such as investment adviser fees; however, the Lipper Short Municipal Debt Funds Average reflects fees charged by the underlying funds. The performance for the Alpine Ultra Short Tax Optimized Income Fund reflects the deduction of fees for these value-added services. Investors cannot directly invest in an index.
Expense Ratios reflect the ratios reported in the Fund’s most recent prospectus. The Alpine Ultra Short Tax Optimized Income Fund has a contractual expense waiver that continues through February 28, 2014. Where a Fund’s gross and net expense ratios are the same for the period reported, the contractual expense reimbursement level was not reached as of the end of that period. To the extent the Fund’s expenses were reduced by waivers, the Fund’s total returns were increased. In these cases, in the absence of the expense waivers, the Fund’s total returns would have been lower. The Adviser has also voluntarily waived a portion of the expenses for the Alpine Ultra Short Tax Optimized Income Fund. To the extent the Fund’s expenses were reduced by waivers, the Fund’s total returns were increased. In these cases, in the absence of the expense waivers, the Fund’s total returns would have been lower.
43
| Alpine Ultra Short Tax Optimized Income Fund (continued) | |
Alpine Ultra Short Tax Optimized Income Fund vs. Peer Performance (unaudited)

* The Class A Return for 2004 is from 3/30/2004 (inception) — 12/31/2004
Portfolio Distributions* (unaudited)

Top 10 Holdings* (unaudited) |
| 1. | | Virginia Capital Beltway Funding Corp., Hot Lanes, 1.30%, 12/31/2047 (Putable on 11/07/2013) | | 5.68 | % |
| 2. | | Mississippi Business Finance Corp. Revenue,
PSL-North America LLC Project, 2.61%, 11/01/2032 (Putable on 11/07/2013) | | 5.49 | % |
| 3. | | Chicago Board of Education,, 0.93%, 12/01/2034 (Putable on 11/01/2013) | | 5.12 | % |
| 4. | | Indiana Reset Optional Certificates Trust II-R Revenue, 1.00%, 10/26/2017 (Putable on 11/07/2013) | | 4.84 | % |
| 5. | | Pennsylvania Emmaus General Authority Revenue, 0.30%, 12/01/2028 (Putable on 11/06/2013) | | 4.81 | % |
| 6. | | California Stockton Public Financing Authority Water Revenue, 0.75%, 10/01/2040 (Putable on 11/07/2013) | | 4.22 | % |
| 7. | | New Jersey Economic Development Authority Revenue, Port Newark Container Terminal LLC Project, 1.20%, 07/01/2030 (Putable on 11/06/2017) | | 2.93 | % |
| 8. | | Arizona Phoenix Industrial Development Authority Solid Waste Revenue, Republic Services, Inc. Project, 0.95%, 12/01/2035 (Putable on 11/01/2013) | | 2.83 | % |
| 9. | | Florida Miami-Dade County Expressway Authority Toll System Revenue, 0.78%, 05/20/2029 (Putable on 11/01/2013) | | 2.75 | % |
| 10. | | California Pollution Control Finance Authority Solid Waste Revenue, Republic Services, Inc., 0.95%, 08/01/2023 (Putable on 11/01/2013) | | 2.75 | % |
| * | Portfolio holdings and sector distributions are as of 10/31/13 and are subject to change. Portfolio holdings are not recommendations to buy or sell any securities. Portfolio Distributions percentages are based on total investments and Top 10 Holdings percentages are based on total net assets. |
| (1) Amount is less than 0.05%. |
44
| Alpine Ultra Short Tax Optimized Income Fund (continued) | |
Value of a $10,000 Investment (unaudited)

This chart represents a comparison of a hypothetical $10,000 investment in the Fund versus a similar investment in the Fund’s benchmark. The graph and the table do not reflect the deduction of taxes that a shareholder would pay on Fund distributions or the redemption of Fund shares. Investment performance reflects the waiver and recovery of certain fees, if applicable. Without the waiver and recovery of fees, the Fund’s total return would have differed.
Performance data quoted represents past performance and is not predictive of future results. Investment return and principal value of the Fund fluctuate, so that shares, when redeemed, may be worth more or less than their original cost.
45
| Alpine Municipal Money Market Fund | |
Comparative Annualized Returns as of 10/31/13 (unaudited) |
| | | 1 Year | | 3 Years | | 5 Years | | 10 Years | | Since Inception
(12/5/02) | |
| Alpine Municipal Money Market Fund — Investor Class | | | 0.04 | % | | | 0.11 | % | | | 0.31 | % | | | 1.48 | % | | | 1.45 | % | | |
| Lipper Tax-Exempt Money Market Funds Average(1) | | | 0.02 | % | | | 0.02 | % | | | 0.08 | % | | | 1.04 | % | | | 1.02 | % | | |
| Lipper Tax-Exempt Money Market Funds Ranking(1) | | | 5/86 | | | 1/85 | | | 1/77 | | | 1/58 | | | 1/50 | | |
Alpine Municipal Money Market Fund — Investor Class,
7-day effective yield (as of 10/31/13): 0.03% | | | | | | | | | | | | | | | | | | | | | | |
| Net Expense Ratio: 0.56%(2) | | | | | | | | | | | | | | | | | | | | | | |
| | (1) | The since inception data represents the period beginning 12/31/2002. |
| | (2) | As disclosed in the prospectus dated February 28, 2013. |
Note, the yield more closely reflects the current earnings of the Alpine Municipal Money Market Fund than the total return.
Performance data quoted represents past performance and does not guarantee future results. The investment return and principal value of an investment will fluctuate so that an investor’s shares, when redeemed, may be worth more or less than their original cost. Performance data current to the most recent month end may be obtained by calling 1-888-785-5578 or visiting www.AlpineFunds.com.
Income from tax-exempt funds may be subject to state and local taxes and a portion of income may be subject to the federal alternative minimum tax for certain investors.
The Lipper Tax-Exempt Money Market Funds Average is an average of funds that invest in high quality municipal obligations with dollar-weighted average maturities of less than 90 days. The Lipper Tax-Exempt Money Market Funds Average is unmanaged and does not reflect the deduction of direct fees associated with a mutual fund, such as investment adviser fees; however, the Lipper Tax-Exempt Money Market Funds Average reflects fees charged by the underlying funds. Lipper Rankings for the periods shown are based on fund total returns with dividends and distributions reinvested and do not reflect sales charges. The performance for the Alpine Municipal Money Market Fund reflects the deduction of fees for these value-added services. Investors cannot directly invest in an index.
Expense Ratios reflect the ratios reported in the Fund’s most recent prospectus. The Adviser has voluntarily waived a portion of the expenses for the Alpine Municipal Money Market Fund. To the extent the Fund’s expenses were reduced by waivers, the Fund’s total returns were increased. In these cases, in the absence of the expense waivers, the Fund’s total returns would have been lower.
Alpine Municipal Money Market Fund vs. Peer Performance (unaudited)
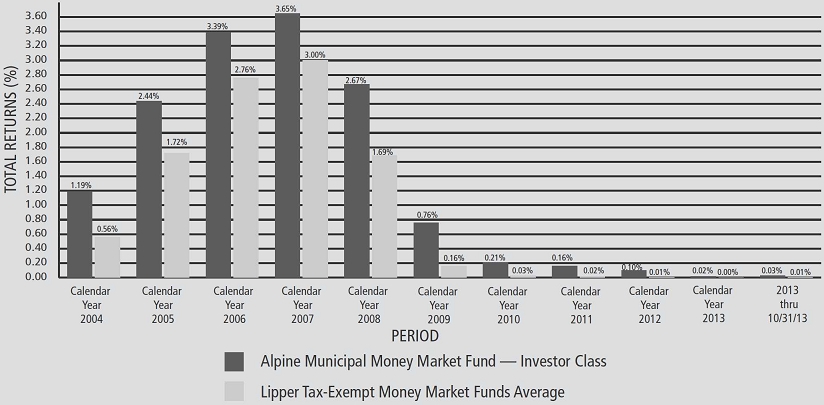
The graph and the table do not reflect the deduction of taxes that a shareholder would pay on Fund distributions or the redemption of Fund shares. Investment performance reflects the waiver of certain fees. Without the waiver of fees, the Fund’s total return would have been lower.
46
| Alpine Municipal Money Market Fund (continued) | |
Portfolio Distributions* (unaudited)
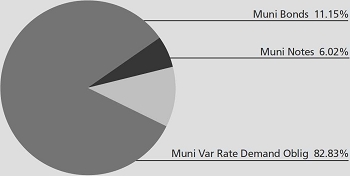
Top 10 Holdings* (unaudited)
| 1. | | Texas Jefferson County Industrial Development Corp. Revenue, Jefferson Refinery LLC, 0.45%, 12/01/2040 (Putable on 12/19/2013) | | 4.99 | % |
| 2. | | Colorado Traer Creek Metropolitan District Revenue, In the Town of Avon, 0.45%, 10/01/2021 (Putable on 11/07/2013) | | 4.85 | % |
| 3. | | Illinois Deutsche Bank Spears/Lifers Trust, Various States Gold, 0.26%, 01/01/2029 (Putable on 11/07/2013) | | 4.69 | % |
| 4. | | Tennessee Hendersonville Industrial Development Board, 0.24%, 05/01/2036 (Putable on 11/07/2013) | | 4.40 | % |
| 5. | | North Carolina Davidson County Industrial Facilities & Pollution Control Financing Authority Revenue, Dieboid, Inc., 0.38%, 06/01/2017 (Putable on 11/07/2013) | | 4.17 | % |
| 6. | | New Hampshire County of Merrimack, Tax Anticipation Notes, 1.25%, 12/27/2013 | | 4.11 | % |
| 7. | | Texas Port of Corpus Christi Authority of Nueces County, Solid Waste Disposal Revenue, Flint Hills Resources LP, West Plant Project, 0.09%, 07/01/2029 (Putable on 11/07/2013) | | 4.11 | % |
| 8. | | Michigan Strategic Fund Limited Obligation Revenue, Glastender, Inc., 0.25%, 11/01/2023 (Putable on 11/07/2013) | | 3.77 | % |
| 9. | | Texas Port Arthur Navigation District Revenue, BASF Corp., 0.23%, 04/01/2033 (Putable on 11/07/2013) | | 3.29 | % |
| 10. | | Michigan Strategic Fund Limited Obligation Revenue, Sacred Heart Rehabilitation Center, 0.24%, 03/01/2037 (Putable on 11/07/2013) | | 3.29 | % |
| * | Portfolio Distributions percentages are based on total investments. Top 10 Holdings do not include short-term investments and percentages are based on total net assets. Portfolio holdings and sector distributions are as of 10/31/13 and are subject to change. Portfolio holdings are not recommendations to buy or sell any securities. |
Equivalent Taxable Yields as of 10/31/13 (unaudited) |
| | | | | | | |
| | | | | | | Your Tax-Exempt Current |
| | | | | Marginal | | 7 Day Yield of 0.03% is |
| Joint Return | | Single Return | | Tax Rate | | Equivalent to a Taxable Yield of: |
| $72,501 - 146,400 | | $36,251 - 87,850 | | 25% | | 0.04% |
| $146,401 - 223,050 | | $87,851 - 183,250 | | 28% | | 0.04% |
| $223,051 - 398,350 | | $183,251 - 398,350 | | 33% | | 0.04% |
| $383,351 - 450,000 | | $398,351 - 400,000 | | 35% | | 0.05% |
| Over $ 450,001 | | Over $400,001 | | 39.6% | | 0.05% |
The chart reflects 2013 marginal federal tax rates before limitations and phaseouts. Individuals should consult a tax professional to determine their actual 2013 marginal tax rate.
47
| Alpine High Yield Managed Duration Municipal Fund | |
Comparative Annualized Returns as of 10/31/13 (unaudited) |
| | | Since Inception |
| | | (5/31/2013)(1) |
| Alpine High Yield Managed Duration Municipal Fund — Institutional Class | | | 0.11 | % |
| Alpine High Yield Managed Duration Municipal Fund — Class A (Without Load) | | | 0.01 | % |
| Alpine High Yield Managed Duration Municipal Fund — Class A (With Load) | | | -2.53 | % |
| S&P Municipal Bond Short Intermediate Index | | | 0.28 | % |
| Barclays Capital High Yield Municipal Bond Index | | | -7.34 | % |
| Lipper High Yield Municipal Debt Funds Average | | | -6.59 | % |
| Gross Expense Ratio (Institutional Class): 1.04%(2) | | | | |
| Net Expense Ratio (Institutional Class): 0.80%(2) | | | | |
| Gross Expense Ratio (Class A): 1.29%(2) | | | | |
| Net Expense Ratio (Class A): 1.05%(2) | | | | |
| | (1) | Not annualized. |
| | (2) | Estimate as disclosed in the prospectus dated May 30, 2013. |
Performance data quoted represents past performance and is not predictive of future results. Investment return and principal value of the Fund fluctuate, so that shares, when redeemed, may be worth more or less than their original cost. Performance current to the most recent month end may be lower or higher than the performance quoted and may be obtained by calling 1-888-785-5578. Performance data shown does not reflect the 0.75% redemption fee imposed on shares held for fewer than 60 days. If it did, total returns would be reduced. Returns for the Class A shares with sales charge reflect a maximum sales charge of 2.50%. Performance for the Class A shares without sales charges does not reflect this load.
The Barclays Capital High Yield Municipal Bond Index is the Muni High Yield component of the Municipal Bond Index. The Barclays Municipal Bond Index is a rules-based, market-value-weighted index engineered for the long-term tax-exempt bond market.
The S&P Municipal Bond Short Intermediate Index consists of bonds in the S&P Municipal Bond Index with a minimum maturity of one year and a maximum maturity of up to, but not including, eight years as measured from the Rebalancing Date.
Lipper High Yield Municipal Debt Funds Average is an unmanaged index that tracks funds that invest in funds that typically invest 50% or more of their assets in municipal debt issues rated BBB or less. Lipper rankings for the period shown is based on fund total returns with dividends and distributions reinvested and do not reflect sales charges.
Expense ratios reflect the ratios reported in the Fund’s most recent prospectus. The Alpine High Yield Managed Duration Municipal Fund has a contractual expense waiver that continues through May 30, 2014. Where a Fund’s gross and net expense ratios are the same for the period reported, the contractual expense reimbursement level was not reached as of the end of that period. To the extent the Fund’s expenses were reduced by waivers, the Fund’s total returns were increased. In these cases, in the absence of the expense waivers, the Fund’s total returns would have been lower. The Adviser has also voluntarily waived a portion of the expenses for the Alpine High Yield Managed Duration Municipal Fund. To the extent the Fund’s expenses were reduced by waivers, the Fund’s total returns were increased. In these cases, in the absence of the expense waivers, the Fund’s total returns would have been lower.
48
| Alpine High Yield Managed Duration Municipal Fund (continued) | |
Portfolio Distributions* (unaudited)
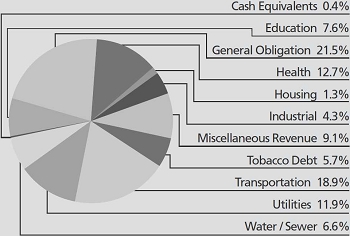
Top 10 Holdings* (unaudited) |
| 1. | | Illinois of Illinois, General Obligation Refunding Bond, 5.25%, 10/01/2015 | | 5.5 | % |
| 2. | | Virginia Capital Beltway Funding Corp., Hot Lanes, 1.30%, 12/31/2047 (Putable on 11/07/2013) | | 4.5 | % |
| 3. | | Alabama Jefferson County Ltd. Obligation School Warrants, 5.25%, 01/01/2014 | | 4.1 | % |
| 4. | | Michigan Strategic Fund Limited Obligations Revenue, Waste Management, Inc., 1.50%, 08/01/2027 (Putable on 08/01/2014) | | 2.5 | % |
| 5. | | Michigan Finance Authority, St. AID Revenue, 4.38%, 08/20/2014 | | 2.5 | % |
| 6. | | New York Rockland County, Revenue Anticipation Notes, 1.75%, 06/27/2014 | | 2.5 | % |
| 7. | | Massachusetts Port Authority Facilities Revenue, Delta Air Lines, Inc. Project, 5.00%, 01/01/2021 | | 2.2 | % |
| 8. | | New Jersey Tobacco Settlement Financing Corp. Revenue, 4.50%, 06/01/2023 | | 2.1 | % |
| 9. | | Puerto Rico Highways & Transportation Authority Revenue, 5.25%, 07/01/2015 | | 2.1 | % |
| 10. | | Tennessee Franklin Public Building Authority Revenue, Local Government Public Improvement, 0.62%, 06/01/2037 (Putable on 11/01/2013) | | 2.0 | % |
| * | Portfolio Distributions percentages are based on total investments. Top 10 Holdings do not include short-term investments and percentages are based on total net assets. Portfolio holdings and sector distributions are as of 10/31/13 and are subject to change. Portfolio holdings are not recommendations to buy or sell any securities. |
Value of a $10,000 Investment (unaudited)
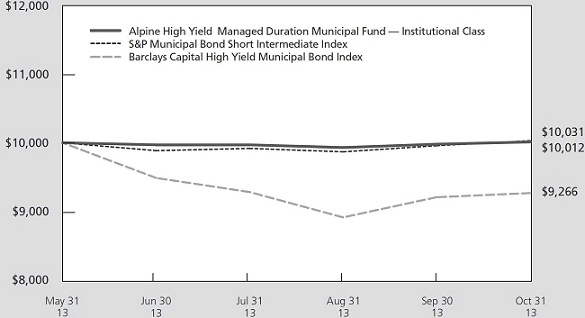
This chart represents a comparison of a hypothetical $10,000 investment in the Fund versus a similar investment in the Fund’s benchmark. The graph and the table do not reflect the deduction of taxes that a shareholder would pay on Fund distributions or the redemption of Fund shares. Investment performance reflects the waiver and recovery of certain fees, if applicable. Without the waiver and recovery of fees, the Fund’s total return would have differed.
Performance data quoted represents past performance and is not predictive of future results. Investment return and principal value of the Fund fluctuate, so that shares, when redeemed, may be worth more or less than their original cost.
49
Alpine Ultra Short Tax Optimized Income Fund /
Alpine Municipal Money Market Fund /
Alpine High Yield Managed Duration Municipal Fund | | |
We are pleased to provide you with the annual report for the Alpine Income Trust for the period ending October 31, 2013. The income trust includes the Alpine Ultra Short Tax Optimized Income Fund, the Alpine Municipal Money Market Fund and the Alpine High Yield Managed Duration Municipal Fund which incepted on May 31, 2013. All references in this letter to performance relate to the performance of the Alpine Municipal Money Market Fund’s Investor Class, and the Alpine Ultra Short Tax Optimized Income Fund’s and the Alpine High Yield Managed Duration Municipal Fund’s Institutional Class.
PERFORMANCE SUMMARY
According to Lipper Analytical Services, the total return for the Alpine Ultra Short Tax Optimized Income Fund was 0.36% versus 0.17% for the Lipper average for Short Municipal Debt Funds.
The Alpine Municipal Money Market Fund had a total return of 0.04% versus 0.02% for the Lipper average for Tax Exempt Money Market Funds.
The Alpine High Yield Managed Duration Municipal Fund had a total return of 0.11% since inception on May 31, 2013 through October 31, 2013 versus the Lipper High Yield Municipal Debt Funds average’s return of -6.59%.
MARKET OVERVIEW
During calendar year 2013, gross domestic product (GDP) in the United States continued to grow at an increasing, albeit sluggish, pace compared to 2012. The first three quarters of 2013 grew at 1.8%, 2.5% and 4.1%, respectively. The Bloomberg November Monthly Survey market forecast indicates that in 4Q13 GDP is projected to decline to 2.4%. During 2014, survey participants expect the economy to continue growing, with GDP projected to average 2.6%. We believe that these economic growth rates should translate into an overall improving credit picture in the Public Finance sector.
Fixed income markets experienced significant interest rate volatility during fiscal year ended October 31, 2013, especially during the second half of fiscal 2013. At November 1, 2012, the 10-year Treasury bond yield stood at 1.72% with moderate volatility during the first six months of the fiscal year. As of May 1, 2013, the yield was still relatively low at 1.63%, but began increasing at a brisk pace until peaking at 2.99% on September 5th, and ending the fiscal year at 2.55% on October 31st. Similar trends also occurred in the municipal market. Since May 1, 2013, municipal yields likewise rose significantly, with Bloomberg’s 10-Year U.S. Muni General Obligation AAA Curve climbing 85 basis points (bps) to 2.77% as of October, 31st or 109% of similar maturity treasury yields.
The primary driver of increasing long term Treasury rates and a steepening of the yield curve resulted from investor fears that the Federal Reserve (Fed) was close to the start of tapering its $85 billion per month, open-ended securities purchasing program known as Quantitative Easing (QE3). Fed Chairman Ben Bernanke confirmed the market’s expectation in mid-June 2013 that the Fed may begin reducing its bond purchases during its upcoming September 2013 policy meeting and could end all bond purchases by mid-2014 triggering the run up in long term rates.
Subsequent to Bernanke’s tapering announcement, fixed income and equity markets reacted with more volatility than many investors had expected. The yield on the 10-year Treasury bond spiked over 42 basis points in one week to 2.61% and equity markets responded with the Dow Jones declining 4.3% over the next three trading days. Shortly after the 10-year Treasury bond peaked at 2.99% on September 5th, the Fed decided at its mid-September policy meeting not to begin the tapering of its bond purchasing program. Since the decision, 10-year Treasury bond interest rates have moderated and have been trading in the 2.50% to 2.73% range through October 31, 2013.
During the last twelve months ended October 31, 2013, shorter term interest rates have declined at an accelerated rate over the period and are expected to remain very low for the foreseeable future. According to the Bloomberg U.S. Muni General Obligation AAA Curve, 3-month rates have declined from 11 basis points (bps) to 4 bps and 1-year rates declined from 21 bps to 11 bps. Simultaneously, longer term yields have widened due to a combination of investor fear of increasing long term rates and a strengthening U.S. economy. During the same period, the 10-year Municipal yield increased from 1.95 bps to 2.77 bps and 30-year Municipal yields increased from 3.29% to 4.25%. With short and long term rates moving in opposite directions, the yield curve has further steepened during the last six month period. Even after the Fed’s tapering of QE3 has been completed, which may not be until the third or fourth quarter of 2014, short-term federal funds interest rate increases by the Fed are not likely to occur until late 2015. Unfortunately, this expected scenario will likely result in continued historically low short-term treasury and municipal yields in 2014.
In January 2014, a new Fed Chairperson will be approved by Congress. Janet Yellen was confirmed by the Senate Banking Committee in mid-November 2013, and her nomination appears to have little competition as she goes before the full senate in January for confirmation.
50
Alpine Ultra Short Tax Optimized Income Fund /
Alpine Municipal Money Market Fund /
Alpine High Yield Managed Duration Municipal Fund | | |
Yellen is largely expected to be even more dovish than the current Fed Chair, and her main focus in 2014 will likely be deciding the timing of the phase out of the QE3 bond purchasing program.
The U.S. unemployment rate remains stubbornly high five years after the Great Recession at 7.3% in October 2013, after peaking at 10.0% in October 2009. After three and a half years, unemployment finally broke through 8% in September 2012 at 7.8% and with minor volatility has steadily declined to the current level. Despite the still current high rate of unemployment, there has been broad-based job growth in 2013 which has been driven, in part, by housing sector job gains as well as renewed hiring by states and cities. During October 2013, job gains were above the prevailing trend of 186,000 per month, with 204,000 new jobs created. The continued job recovery may improve wage gains and strengthen household income and spending. These favorable dynamics should result in increasing business investment at a more rapid pace which is expected to strengthen the overall economy as we move into 2014.
Credit quality in the Public Finance sector continued to improve during 2013. During the first three quarters of 2013, Standard & Poor’s (S&P) upgraded 706 Public Finance credits versus 331 downgrades for a favorable upgrade to downgrade ratio of 2.1 to 1. The positive rating trend is generally aligned with the slowly improving U.S. economy. However, a portion of the credit upgrades during the third quarter of 2013 were due to a revision of S&P’s rating criteria. Excluding the criteria driven upgrades, the ratio would still be quite favorable at approximately 1.8 to 1.
Calendar year to date, long term municipal bond issuance declined by 14% to $275.7 billion, which compares with volume of $319.1 billion during the same period during 2012. This volume level is well below what the majority of municipal investors expected in 2013. The reduced supply has been driven by two primary factors. First, a significant 31% drop in refunding volume occurred in 2013 with re-financings declining to $93.9 billion from $135.7 billion in 2012 as a result of increasing interest rates in the second half of the year, which made refunding transactions less economical. Second, state and local municipalities have been reining in avoidable capital expenditures in order to replenish depleted reserves as lagging property and sales tax receipts rebound from the prior recession.
ALPINE MUNICPAL MONEY MARKET FUND
Over the last six months, yields in the municipal money market have gradually moved lower inching closer to the
federal funds rate, which, as of October 31, 2013 averages, under 0.10%. Supply has decreased in this sector of the market as issuers have found it more advantageous to finance in the longer-term bond market due to the overall level of rates. Surprisingly, despite the low yield that funds continue to produce, assets in municipal money market funds are only down a small percentage for the calendar year.
Municipal money market rates range from around nine basis points for overnight maturities to 21 basis points for weekly variable rate demand notes (VRDNs). One-year notes are not much different with the average securities yielding 19 basis points. Tax-exempt commercial paper was relatively unchanged and continues to be a sought after investment for most funds although we do not currently own any. Seeing rates decline on the front end of the curve is not surprising as there continues to be crossover buying from taxable money market funds that find the credit quality, maturity and structure an appealing alternative to securities in their own market. We have continued to support the Fund by voluntarily reimbursing the Fund’s expenses to maintain a positive yield.
We continue to focus our investing on high credit quality. We again favored and continue to maintain an overweight in VRDNs, the majority of which carry additional letters of credit with the rest highly rated on their own. Banks have historically provided liquidity and letters of credit to these securities but we have seen the number of banks providing this support shrink in recent years. This has been mainly the result of banks acquiring one another and the discontinuation of this type of financing by others because it is not as profitable as it once was. Our largest bank liquidity exposures continue to be JPMorgan Chase, Wells Fargo, Bank of America and Fifth Third Bank. While VRDNs comprised 74% of our portfolio on October 31, 2013, the remainder was invested in three-month to one-year maturities of First Tier Securities. At the end of October, our average weighted maturity was 27 days.
We expect money market rates to remain at their current levels until the Fed starts to significantly reduce their bond purchasing and start raising Fed Fund rates. While we anticipate the Fed to taper in early 2014, we do not expect Fed Fund rates to rise in the near future. As a result, we will maintain the same basic portfolio composition as we have for some time now. We will also continue to closely monitor the actions of the Securities and Exchange Commission regarding changes to regulations governing money market funds. As always, we will continue to monitor the markets closely and make any adjustments
51
Alpine Ultra Short Tax Optimized Income Fund /
Alpine Municipal Money Market Fund /
Alpine High Yield Managed Duration Municipal Fund | | |
necessary in order to maintain a high-quality, diversified portfolio.
ALPINE ULTRA SHORT TAX OPTIMIZED INCOME FUND
Despite the volatility in the muni market over the past six months, yields on one-month to three-year municipal bonds moved marginally and even dropped in some cases while yields past three years moved higher. This event on the short-end was more a reflection of a flight to liquidity and lack of issuance than the back-up in rates and increase in supply that the longer-end of the market experienced. We had been anticipating that the market would back off and that is why we have been maintaining an average weighted maturity of less than 90 days for some time now. New issuance has dropped dramatically as rates have increased to three years and longer. We still feel the Fund should continue to keep duration short and liquidity higher than normal. We also continue to support the Fund by voluntarily reimbursing the Fund’s expenses beyond the Fund’s contractual expense cap.
At the end of our reporting period, we had 10% of the portfolio invested in debt issued by various issuers in Puerto Rico. Sixty percent of our Puerto Rico holdings are in weekly VRDNs that carry either a direct pay letter of credit from a major bank or are insured by Assured Guaranty with liquidity from a major financial institution. These bonds can be sold back to the designated bank at par on a weekly basis. The balance of investments in Puerto Rico will mature between December 1, 2013 and December 1, 2015. Furthermore, about 20% of those non-VRDN bonds are insured by Assured Guaranty or Nat Re. We would also like to point out that of our non-VRDN holdings, almost 73% mature between December 1, 2013 and July 1, 2014.
As for the rest of the portfolio, with yield spreads tightening in the short-end, we found it more challenging to find bonds offering attractive yields. Furthermore, if this past summer is any indication of what the New Year holds, we believe that it would be wise to maintain the course that we have been on and not venture too far out on the yield curve. Therefore, we expect to continue to focus the majority of our investing in three-month to one-year put bonds, general market notes, VRDNs and municipal bonds out to 18 months. Maintaining flexibility and liquidity will be important should the market anticipate a change in the Fed’s outlook which should finally push short-term interest rates higher.
ALPINE HIGH YIELD MANAGED DURATION MUNICIPAL FUND
The high yield municipal marketplace has historically had the greatest amount of volatility and it was for this reason that we were very cautious in building the portfolio since its inception on May 31, 2013. Specifically, we endeavored to diversify the Fund among a wide range of credits in many different sectors of the market. Furthermore, we spread our maturities out across the yield curve from one-year out to 13 years with the majority of the portfolio maturing between one-to-two years and nine-to-ten years. By taking this barbell approach, we seek to minimize the impact to the Fund should rates rise in the future while still being able to capture the extra yield on our 10-year maturities. Because the Fund commenced operations as the municipal market was going through a very volatile period, we were able to purchase securities that had retreated in price from where they were previously trading. As a result, our sector strategy, our security selection and our average weighted maturity aided in our relative returns.
Puerto Rico holdings currently constitutes 18% of the portfolio that we hold in various Puerto Rico credits, approximately 59% of that amount is insured by either Assured Guaranty or Nat Re. The majority of the remaining 41% of those bonds mature by July 1, 2014. Lastly, our uninsured exposure after July 1, 2015 adds up to one half of one percent of the portfolio. We chose this strategy as the yield on insured Puerto Rico debt in one to four years was trading at the same if not higher yields than below investment grade debt in 10 years. From our perspective, these purchases provide the Fund with yield while potentially minimizing NAV fluctuation should rates rise. We believe in the claims paying ability of these two insurers and at this time, believe that Puerto Rico will meet their debt obligations on securities maturing by their fiscal year-end regardless of whether they come to the market with new debt.
Other portfolio holdings include corporate-backed industrial revenue bonds. Corporations have been large issuers of debt in the municipal sector and what makes this market so intriguing to us is that the yield of these tax-free bonds can be the same or higher than those in the corporate bond market especially when you take into account the after-tax yield. Some of our purchases included debt issued by U.S. Steel, Delta Airlines and Continental Airlines.
We also have exposure to tobacco bonds from four different issuers. Tobacco bond prices have historically fluctuated more than other sectors of the high yield
52
Alpine Ultra Short Tax Optimized Income Fund /
Alpine Municipal Money Market Fund /
Alpine High Yield Managed Duration Municipal Fund | | |
market and this past six months was no exception. After news that a decline in consumption exceeded original projections, yields increased by over 100 basis points in some instances. While these were some of our first purchases, some were purchased after that market had already started to back off.
Lastly, we made several purchases in the health care sector, specifically in hospital revenue bonds and retirement communities. While there are many issuers that come to the market in this sector, specifically retirement communities, we focus only on the issuers who, in our opinion, appear to have the best set of credit metrics and therefore potential for success. Despite the attractive yield that these bonds offer, we remain cautious from investing beyond 10 years in these deals.
Despite the recent volatility in the market, we have sought to structure our portfolio in a manner we believe is designed to deliver yield while being sensitive to dramatic changes in interest rates. Our Fund is diversified among many issuers in many different sectors across the first 12 years of the yield curve. As the economic environment evolves and the Fund grows we will adjust the composition of the portfolio to meet the changes in the marketplace.
CONCLUSION
The past six months has seen a dramatic change in the way the municipal bond market has performed versus the past two years. From our perspective it was only a function of time before the market reversed its course as historically low rates relative to credit quality could only exist to the degree that the demand for municipal bonds continued. That changed course started in late spring and has continued throughout the year. That said, we also believe that the municipal bond market is fundamentally sound and presents an attractive investment opportunity for those seeking tax-free income.
We have been cautious in keeping our respective average weighted maturities short in all of our funds in anticipation of potentially greater volatility and higher yields. While we expect the longer end maturities to react more quickly to changes in fed policy, we anticipate shorter yields will gradually move as well. For that reason we are maintaining a high degree of flexibility with all of our portfolios so that we will be positioned to potentially take advantage of the market as it changes. We will continue to strive to meet each Fund’s objectives in the New Year as events unfold.
Sincerely,
Steven C. Shachat
Portfolio Manager
This letter represents the opinions of the Fund’s management and is subject to change, is not guaranteed and should not be considered a recommendation to buy or sell any security. The information provided is not intended to be, and is not, a forecast of future events, a guarantee of future results, or investment advice. Views expressed may vary from those of the firm as a whole. Past performance is no guarantee of future results.
An investment in the Alpine Municipal Money Market Fund is not insured or guaranteed by the Federal Deposit Insurance Corporation or any other government agency. Although the Alpine Municipal Money Market seeks to preserve the value of your investment at $1.00 per share, it is possible to lose money by investing in the Alpine Municipal Money Market Fund.
Mutual fund investing involves risk. Principal loss is possible. The Alpine Municipal Money Market Fund is subject to risks, including the following:
Credit Risk – The credit quality and liquidity of the investments in municipal obligations and other debt securities may be dependent in part on the credit quality of third parties, such as banks and other financial institutions. These third parties provide credit and liquidity enhancements to the Fund’s investments. Adverse changes in the credit quality of these third parties could cause losses to the Fund and affect its share price.
Fixed Income Securities Risk – Fixed income securities are subject to issuer risk, interest rate risk and market risk.
Interest Rate Risk – Interest rates may rise resulting in a decrease in the value of the securities held by the Fund, or may fall resulting in an increase in the value of such securities. Securities having longer maturities generally involve a greater risk of fluctuations in the value resulting from federal tax consistent changes in interest rates.
53
Alpine Ultra Short Tax Optimized Income Fund /
Alpine Municipal Money Market Fund /
Alpine High Yield Managed Duration Municipal Fund | | |
Issuer Risk – Changes in the financial condition of the issuer of an obligation, changes in general economic conditions, or changes in economic conditions that affect the issuer may impact its actual or perceived willingness or ability to make timely payments of interest or principal.
Liquidity Risk �� Some securities held by the Fund may be difficult to sell, or illiquid, particularly during times of market turmoil. Illiquid securities may also be difficult to value. If the Fund is forced to sell an illiquid asset to meet redemption requests or other cash needs, the Fund may be forced to sell at a loss.
Management Risk – The Adviser’s judgment about the quality, relative yield or value of, or market trends affecting, a particular security or sector, or about interest rates generally, may be incorrect. The Adviser’s security selections and other investment decisions might produce losses or cause the Fund to underperform when compared to other funds with similar investment objectives and strategies.
Market Risk – The price of a security held by the Fund may fall due to changing market, economic or political.
Municipal Securities Concentration Risk – From time to time, the Fund may invest a substantial amount of its assets in municipal securities whose interest is paid solely from revenues of similar projects. If the Fund concentrates its investments in this manner, it assumes the economic risks relating to such projects - this may have a significant impact on the Fund’s investment performance.
Municipal Securities Risk – Municipal securities risks include the ability of the issuer to repay the obligation, the relative lack of information about certain issuers of municipal securities, and the possibility of future legislative changes which could affect the market for, and value of, municipal securities. Certain municipal securities, including private activity bonds, are not backed by the full faith, credit and taxing power of the issuer. Additionally, if events occur after the security is acquired that impact the security’s tax-exempt status, the Fund and its shareholders could be subject to substantial tax liabilities.
Redemption Risk – The Fund may experience heavy redemptions, particularly during periods of declining or illiquid markets, that could cause the Fund to liquidate its assets at inopportune times or at a loss or depressed value. This could affect the Fund’s ability to maintain a $1.00 share price. In addition, the Fund may suspend redemptions when permitted by applicable regulations.
Regulatory Risk – The SEC recently amended the rules governing money market funds. In addition, the SEC continues to review the regulation of such funds. Any further changes by the SEC or additional legislative developments may affect the Fund’s operations, investment strategies, performance and yield.
Tax Risk – To be tax-exempt, municipal obligations generally must meet certain regulatory requirements. If any such municipal obligation fails to meet these regulatory requirements, the interest received by the Fund from its investment in such obligations and distributed to Fund shareholders will be taxable. There is no guarantee that all of the Fund’s income will remain exempt from federal or state income taxes. Income from municipal bonds held by a Fund could be declared taxable because of unfavorable changes in tax laws, adverse interpretations by the Internal Revenue Service or state tax authorities, or noncompliant conduct of a bond issuer.
Variable Rate Demand Obligations Risk – Variable rate demand obligations are floating rate securities that combine an interest in a long-term municipal bond with a right to demand payment before maturity from a bank or other financial institution. If the bank or financial institution is unable to pay, the Fund may lose money.
The Alpine Ultra Short Tax Optimized Income Fund is subject to risks, including the following:
Credit Risk – The credit quality and liquidity of the Fund’s investments in municipal obligations and other debt securities may be dependent in part on the credit quality of third parties, such as banks and other financial institutions. These third parties provide credit and liquidity enhancements to the Fund’s investments. Adverse changes in the credit quality of these third parties could cause losses to the Fund and affect its share price.
Fixed Income Securities Risk – Fixed income securities are subject to issuer risk, interest rate risk and market risk.
54
Alpine Ultra Short Tax Optimized Income Fund /
Alpine Municipal Money Market Fund /
Alpine High Yield Managed Duration Municipal Fund | | |
Interest Rate Risk – Interest rates may rise resulting in a decrease in the value of the securities held by the Fund, or may fall resulting in an increase in the value of such securities. Securities having longer maturities generally involve a greater risk of fluctuations in the value resulting from changes in interest rates.
Issuer Risk – Changes in the financial condition of the issuer of an obligation, changes in general economic conditions, or changes in economic conditions that affect the issuer may impact its actual or perceived willingness or ability to make timely payments of interest or principal.
Liquidity Risk – Some securities held by the Fund may be difficult to sell, or illiquid, particularly during times of market turmoil. Illiquid securities may also be difficult to value. If the Fund is forced to sell an illiquid asset to meet redemption requests or other cash needs, The Fund may be forced to sell at a loss.
Management Risk – The Adviser’s judgment about the quality, relative yield or value of, or market trends affecting, a particular security or sector, or about interest rates generally, may be incorrect. The Adviser’s security selections and other investment decisions might produce losses or cause the Fund to underperform when compared to other funds with similar investment objectives and strategies.
Market Risk – The price of a security held by the Fund may fall due to changing market, economic or political conditions.
Municipal Securities Concentration Risk – From time to time the Fund may invest a substantial amount of its assets in municipal securities whose interest is paid solely from revenues of similar projects. If the Fund concentrates its investments in this manner, it assumes the economic risks relating to such projects - this may have a significant impact on the Fund’s investment performance.
Municipal Securities Risk – Municipal securities risks include the ability of the issuer to repay the obligation, the relative lack of information about certain issuers of municipal securities, and the possibility of future legislative changes which could affect the market for, and value of, municipal securities. Certain municipal securities, including private activity bonds, are not backed by the full faith, credit and taxing power of the issuer. Additionally, if events occur after the security is acquired that impact the security’s tax-exempt status, the Fund and its shareholders could be subject to substantial tax liabilities.
Portfolio Turnover Risk – High portfolio turnover necessarily results in greater transaction costs which may reduce Fund performance.
Puerto Rico and U.S. Territories – Because the Fund invests in the municipal securities of U.S. territories, and currently invests in Puerto Rican municipal securities, events in Puerto Rico are likely to affect the Fund’s investments and its performance. These events may include economic or political policy changes, tax base erosion, territory constitutional limits on tax increases, budget deficits and other financial difficulties, and changes in the credit ratings assigned to Puerto Rico’s municipal issuers. As with Puerto Rican municipal securities, events in any of the other territories where the Fund is invested may affect the Fund’s investments and its performance.
Certain municipal issuers in Puerto Rico have recently experienced financial difficulties. On December 13, 2012, Moody’s downgraded the general obligation rating of Puerto Rico to Baa3 with a negative outlook. On March 13, 2013, S&P downgraded Puerto Rico’s general obligation debt to BBB-, with a negative outlook, and Fitch followed with a March 20, 2013 downgrade to BBB- with a negative outlook. These rating agencies have subsequently downgraded other Puerto Rican municipal issuers, including bonds guaranteed by the commonwealth, with the possibility of additional downgrades if negative trends continue. Downgrades could create additional strain on a commonwealth already facing existing economic stagnation and fiscal imbalances, including budget deficits and pension funding shortages. Puerto Rican financial difficulties could potentially lead to less liquidity for its bonds, wider spreads, and greater risk of default for Puerto Rican municipal securities, and consequently may affect the Fund’s investments and its performance.
Tax Risk – Changes in tax laws or adverse determinations by the Internal Revenue Service may make the income from some municipal obligations taxable. Additionally, maximizing after-tax income may require trade-offs that reduce pre-tax income. The Fund’s tax-efficient strategies may reduce the taxable income of the Fund’s shareholders, but will not eliminate it. There can be no assurance that taxable distributions can always be avoided or that the Fund will achieve its investment objective.
55
Alpine Ultra Short Tax Optimized Income Fund /
Alpine Municipal Money Market Fund /
Alpine High Yield Managed Duration Municipal Fund | | |
Variable Rate Demand Obligations Risk – Variable rate demand obligations are floating rate securities that combine an interest in a long-term municipal bond with a right to demand payment before maturity from a bank or other financial institution. If the bank or financial institution is unable to pay, the Fund may lose money.
The Alpine High Yield Managed Duration Municipal Fund is subject to risks, including the following:
Borrowing and Leverage Risk – When the Fund borrows for leverage, changes in the value of the Fund’s investments will have a larger effect on its share price than if it did not borrow. Borrowing results in interest payments to the lenders and related expenses. The costs of borrowing for investment purposes might reduce the Fund’s return if the yield on the securities purchased is less than the borrowing costs.
Credit Risk – The credit quality and liquidity of the Fund’s investments in municipal obligations and other debt securities may be dependent in part on the credit quality of third parties, such as banks and other financial institutions, which provide credit and liquidity enhancements to the Fund’s investments. Adverse changes in the credit quality of these third parties could cause losses to the Fund and affect its share price.
Debt Securities Risk – Debt securities, such as bonds, involve credit risk and interest rate risk. In general, the market price of debt securities with longer maturities will go up or down more in response to changes in interest rates than the market price of shorter term securities.
Fixed Income Securities Risk – Fixed income securities are subject to issuer risk, interest rate risk and market risk.
Interest Rate Risk – Interest rates may rise resulting in a decrease in the value of the securities held by the Fund, or may fall resulting in an increase in the value of such securities. Securities having longer maturities generally involve a greater risk of fluctuations in the value resulting from changes in interest rates. Securities having shorter maturities generally involve less risk of fluctuations in the value resulting from changes in interest rates, but generally have lower yields than securities having longer maturities. Securities having shorter maturities are also subject to reinvestment risk, which is the risk that if interest rates fall the Fund may need to invest the proceeds of redeemed securities in securities with lower interest rates.
Issuer Risk – Changes in the financial condition of the issuer of an obligation, changes in general economic conditions, or changes in economic conditions that affect the issuer may impact its actual or perceived willingness or ability to make timely payments of interest or principal.
Junk Bond Risk – Junk bonds involve a greater risk of default or price changes due to changes in the credit quality of the issuer. The values of junk bonds fluctuate more than those of high-quality bonds in response to company, political, regulatory or economic developments. Values of junk bonds can decline significantly over short periods of time.
Land-Secured or “Dirt” Bonds Risk – These special assessment or special tax bonds are issued to promote residential, commercial or industrial growth and redevelopment. They are exposed to real estate development-related risks. The bonds could default if the developments failed to progress as anticipated or if taxpayers failed to pay the assessments, fees and taxes specified in the financing plans for a project.
Liquidity Risk – Some securities held by the Fund may be difficult to sell, or illiquid, particularly during times of market turmoil. Illiquid securities may also be difficult to value. If the Fund is forced to sell an illiquid asset to meet redemption requests or other cash needs, the Fund may be forced to sell at a loss.
Management Risk – The Adviser’s judgment about the quality, relative yield or value of, or market trends affecting, a particular security or Income from municipal bonds held by a Fund could be declared taxable because of unfavorable changes in tax laws, adverse interpretations by the Internal Revenue Service or state tax authorities, or noncompliant conduct of a bond issuer.
Market Risk – The price of a security held by the Fund may fall due to changing market, economic or political conditions.
56
Alpine Ultra Short Tax Optimized Income Fund /
Alpine Municipal Money Market Fund /
Alpine High Yield Managed Duration Municipal Fund | | |
Medium- and Lower-Grade Municipal Securities Risk – Securities which are in the medium- and lower-grade categories generally offer higher yields than are offered by higher-grade securities of similar maturity, but they also generally involve more volatility and greater risks, such as greater credit risk, market risk, liquidity risk, management risk, and regulatory risk. Furthermore, many medium- and lower-grade securities are not listed for trading on any national securities exchange and many issuers of medium- and lower-grade securities choose not to have a rating assigned to their obligations by any nationally recognized statistical rating organization.
Municipal Market Volatility and Illiquidity Risk – The municipal bond market can be susceptible to unusual volatility, particularly for lower-rated and unrated securities. Liquidity can be reduced unpredictably in response to overall economic conditions or credit tightening. During times of reduced market liquidity, the Fund may not be able to readily sell bonds at the prices at which they are carried on the Fund’s books. If the Fund needed to sell large blocks of bonds to meet shareholder redemption requests or to raise cash, those sales could further reduce the bonds’ prices.
Municipal Sector Concentration Risk – From time to time the Fund may invest a substantial amount of its assets in municipal securities whose interest is paid solely from revenues of similar projects. If the Fund concentrates its investments in this manner, it assumes the economic risks relating to such projects and this may have a significant impact on the Fund’s investment performance.
Municipal Securities Risk – Municipal securities risks include the ability of the issuer to repay the obligation, the relative lack of information about certain issuers of municipal securities, and the possibility of future legislative changes which could affect the market for and value of municipal securities. Certain municipal securities, including private activity bonds, are not backed by the full faith, credit and taxing power of the issuer. Additionally, if events occur after the security is acquired that impact the security’s tax-exempt status, the Fund and its shareholders could be subject to substantial tax liabilities.
Puerto Rico and U.S. Territories – Because the Fund invests in the municipal securities of U.S. territories, and currently invests in Puerto Rican municipal securities, events in Puerto Rico are likely to affect the Fund’s investments and its performance. These events may include economic or political policy changes, tax base erosion, territory constitutional limits on tax increases, budget deficits and other financial difficulties, and changes in the credit ratings assigned to Puerto Rico’s municipal issuers. As with Puerto Rican municipal securities, events in any of the other territories where the Fund is invested may affect the Fund’s investments and its performance.
Certain municipal issuers in Puerto Rico have recently experienced financial difficulties. On December 13, 2012, Moody’s downgraded the general obligation rating of Puerto Rico to Baa3 with a negative outlook. On March 13, 2013, S&P downgraded Puerto Rico’s general obligation debt to BBB-, with a negative outlook, and Fitch followed with a March 20, 2013 downgrade to BBB- with a negative outlook. These rating agencies have subsequently downgraded other Puerto Rican municipal issuers, including bonds guaranteed by the commonwealth, with the possibility of additional downgrades if negative trends continue. Downgrades could create additional strain on a commonwealth already facing existing economic stagnation and fiscal imbalances, including budget deficits and pension funding shortages. Puerto Rican financial difficulties could potentially lead to less liquidity for its bonds, wider spreads, and greater risk of default for Puerto Rican municipal securities, and consequently may affect the Fund’s investments and its performance.
Tender Option Bonds Risk – Tender option bonds are synthetic floating-rate or variable-rate securities issued when long-term bonds are purchased in the primary or secondary market and then deposited into a trust. Tender option bonds may be considered derivatives, and may expose the Fund to the same risks as investments in derivatives, as well as risks associated with leverage, especially the risk of increased volatility.
Tobacco Related Bonds Risk – In 1998, the largest U.S. tobacco manufacturers reached an out of court agreement, known as the Master Settlement Agreement (the “MSA”), to settle claims against them by 46 states and six other U.S. jurisdictions. The tobacco manufacturers agreed to make annual payments to the government entities in exchange for the release of all litigation claims. A number of the states have sold bonds that are backed by those future payments. The Fund may invest in two types of those bonds: (i) bonds that make payments only from a state’s interest in the MSA
57
Alpine Ultra Short Tax Optimized Income Fund /
Alpine Municipal Money Market Fund /
Alpine High Yield Managed Duration Municipal Fund | | |
and (ii) bonds that make payments from both the MSA revenue and from an “appropriation pledge” by the state. An “appropriation pledge” requires the state to pass a specific periodic appropriation to make the payments and is generally not an unconditional guarantee of payment by a state. The settlement payments are based on factors, including, but not limited to, annual domestic cigarette shipments, cigarette consumption, inflation and the financial capability of participating tobacco companies. Payments could be reduced if consumption decreases, if market share is lost to non-MSA manufacturers, or if there is a negative outcome in litigation regarding the MSA.
Please refer to pages 5-6 for other important disclosures and definitions.
58
Alpine Dynamic Dividend Fund
Schedule of Portfolio Investments
October 31, 2013
| Shares | | | Security
Description | | Value | |
| | | | | | | | | |
| Common Stocks—99.0% | | | | |
| Aerospace & Defense—1.4% | | | | |
| | 43,200 | | | European Aeronautic Defence and Space Co. NV | | $ | 2,968,518 | |
| | 6,000 | | | MTU Aero Engines AG | | | 599,501 | |
| | | | | | | | 3,568,019 | |
| Airlines—1.3% | | | | |
| | 57,398 | | | Japan Airlines Co., Ltd. (a) | | | 3,344,763 | |
| | | | | | | | | |
| Auto Components—0.9% | | | | |
| | 43,000 | | | Bridgestone Corp. | | | 1,467,151 | |
| | 150,000 | | | GKN PLC | | | 884,836 | |
| | | | | | | | 2,351,987 | |
| Beverages—2.3% | | | | |
| | 19,500 | | | Anheuser-Busch InBev NV—ADR | | | 2,022,735 | |
| | 115,400 | | | Diageo PLC | | | 3,676,591 | |
| | | | | | | | 5,699,326 | |
| Capital Markets—1.6% | | | | |
| | 152,500 | | | Daiwa Securities Group, Inc. | | | 1,383,403 | |
| | 200,000 | | | Och-Ziff Capital Management Group, LLC—Class A (a) | | | 2,498,000 | |
| | | | | | | | 3,881,403 | |
| Chemicals—3.3% | | | | |
| | 143,000 | | | Clariant AG (b) | | | 2,521,629 | |
| | 38,173 | | | Croda International PLC | | | 1,490,992 | |
| | 39,600 | | | Koninklijke DSM NV | | | 2,999,654 | |
| | 6,500 | | | Linde AG | | | 1,235,110 | |
| | | | | | | | 8,247,385 | |
| Commercial Banks—6.3% | | | | |
| | 185,000 | | | Bangkok Bank PCL | | | 1,224,418 | |
| | 52,000 | | | Hana Financial Group, Inc. | | | 2,004,997 | |
| | 200,000 | | | Mitsubishi UFJ Financial Group, Inc. | | | 1,261,060 | |
| | 33,500 | | | PNC Financial Services Group, Inc. (a) | | | 2,463,255 | |
| | 1,783,581 | | | PT Bank Rakyat Indonesia Persero Tbk | | | 1,249,970 | |
| | 180,800 | | | Sberbank of Russia—ADR | | | 2,308,816 | |
| | 91,000 | | | Standard Chartered PLC | | | 2,187,910 | |
| | 14,500 | | | Sumitomo Mitsui Financial Group, Inc. | | | 695,286 | |
| | 57,100 | | | Wells Fargo & Co. (a) | | | 2,437,599 | |
| | | | | | | | 15,833,311 | |
| Commercial Services & Supplies—4.2% | | | | |
| | 100,000 | | | Corrections Corp. of America (a) | | | 3,700,000 | |
| | 79,031 | | | KAR Auction Services, Inc. | | | 2,348,801 | |
| | 242,000 | | | RR Donnelley & Sons Co. (a) | | | 4,493,940 | |
| | | | | | | | 10,542,741 | |
| Communications Equipment—3.0% | | | | |
| | 112,400 | | | Cisco Systems, Inc. (a) | | | 2,529,000 | |
| | 69,900 | | | QUALCOMM, Inc. (a) | | | 4,855,953 | |
| | | | | | | | 7,384,953 | |
| Computers & Peripherals—2.9% | | | | |
| | 9,000 | | | Apple, Inc. (a) | | | 4,701,150 | |
| | 104,000 | | | EMC Corp. | | | 2,503,280 | |
| | | | | | | | 7,204,430 | |
| Construction & Engineering—1.5% | | | | |
| | 490,813 | | | Abengoa SA—B Shares | | | 1,190,859 | |
| | 38,500 | | | Vinci SA | | | 2,469,654 | |
| | | | | | | | 3,660,513 | |
| Shares | | | Security
Description | | Value | |
| | | | | | | | | |
| Common Stocks—continued | | | | |
| Construction Materials—0.5% | | | | |
| | 16,000 | | | HeidelbergCement AG | | $ | 1,261,295 | |
| Containers & Packaging—0.7% | | | | |
| | 338,000 | | | DS Smith PLC | | | 1,639,937 | |
| Diversified Consumer Services—1.0% | | | | |
| | 417,000 | | | Anhanguera Educacional Participacoes SA | | | 2,494,331 | |
| Diversified Financial Services—1.6% | | | | |
| | 97,400 | | | Bank of America Corp. (a) | | | 1,359,704 | |
| | 55,300 | | | Citigroup, Inc. (a) | | | 2,697,534 | |
| | | | | | | | 4,057,238 | |
| Electric Utilities—1.3% | | | | |
| | 214,000 | | | EDP—Energias do Brasil SA | | | 1,222,748 | |
| | 20,400 | | | ITC Holdings Corp. (a) | | | 2,052,036 | |
| | | | | | | | 3,274,784 | |
| Energy Equipment & Services—3.0% | | | | |
| | 22,500 | | | Ensco PLC—Class A | | | 1,297,125 | |
| | 12,000 | | | Gulfmark Offshore, Inc.—Class A | | | 597,360 | |
| | 24,000 | | | National Oilwell Varco, Inc. | | | 1,948,320 | |
| | 182,000 | | | Odfjell Drilling, Ltd. (b) | | | 1,284,048 | |
| | 190,000 | | | Petroleum Geo-Services ASA | | | 2,304,365 | |
| | | | | | | | 7,431,218 | |
| Food & Staples Retailing—2.4% | | | | |
| | 21,500 | | | Costco Wholesale Corp. (a) | | | 2,537,000 | |
| | 59,000 | | | Walgreen Co. (a) | | | 3,495,160 | |
| | | | | | | | 6,032,160 | |
| Food Products—2.8% | | | | |
| | 79,400 | | | Mondelez International, Inc.—Class A (a) | | | 2,671,016 | |
| | 60,200 | | | Nestle SA | | | 4,345,732 | |
| | | | | | | | 7,016,748 | |
| Health Care Equipment & Supplies—1.9% | | | | |
| | 18,500 | | | Baxter International, Inc. | | | 1,218,595 | |
| | 54,000 | | | Covidien PLC (a) | | | 3,461,940 | |
| | | | | | | | 4,680,535 | |
| Health Care Providers & Services—3.3% | | | | |
| | 72,500 | | | HCA Holdings, Inc. (a) | | | 3,417,650 | |
| | 23,000 | | | McKesson Corp. (a) | | | 3,595,820 | |
| | 16,500 | | | UnitedHealth Group, Inc. | | | 1,126,290 | |
| | | | | | | | 8,139,760 | |
| Hotels, Restaurants & Leisure—1.0% | | | | |
| | 35,500 | | | Las Vegas Sands Corp. (a) | | | 2,492,810 | |
| | | | | | | | | |
| Household Durables—1.8% | | | | |
| | 47,000 | | | Electrolux AB—Series B | | | 1,160,485 | |
| | 45,500 | | | Lennar Corp.—Class A | | | 1,617,525 | |
| | 41,000 | | | Ryland Group, Inc. | | | 1,648,200 | |
| | | | | | | | 4,426,210 | |
| Household Products—2.1% | | | | |
| | 41,500 | | | Colgate-Palmolive Co. (a) | | | 2,686,295 | |
| | 25,400 | | | Energizer Holdings, Inc. (a) | | | 2,491,994 | |
| | | | | | | | 5,178,289 | |
| Insurance—2.9% | | | | |
| | 225,000 | | | BB Seguridade Participacoes SA | | | 2,457,704 | |
| | 58,500 | | | Validus Holdings, Ltd. (a) | | | 2,309,580 | |
| | 9,000 | | | Zurich Insurance Group AG (b) | | | 2,488,676 | |
| | | | | | | | 7,255,960 | |
The accompanying notes are an integral part of these financial statements.
59
Alpine Dynamic Dividend Fund
Schedule of Portfolio Investments—Continued
October 31, 2013
| Shares | | | Security
Description | | Value | |
| | | | | | | | | |
| Common Stocks—continued | | | | |
| IT Services—2.6% | | | | |
| | 50,000 | | | Accenture PLC—Class A (a) | | $ | 3,675,000 | |
| | 15,500 | | | International Business Machines Corp. (a) | | | 2,777,755 | |
| | | | | | | | 6,452,755 | |
| Machinery—1.7% | | | | |
| | 30,000 | | | GEA Group AG | | | 1,305,476 | |
| | 28,500 | | | Snap-on, Inc. (a) | | | 2,965,995 | |
| | | | | | | | 4,271,471 | |
| Media—4.1% | | | | |
| | 211,000 | | | British Sky Broadcasting Group PLC | | | 3,171,724 | |
| | 70,500 | | | Comcast Corp.—Class A (a) | | | 3,354,390 | |
| | 40,500 | | | Eutelsat Communications SA | | | 1,283,715 | |
| | 35,800 | | | The Walt Disney Co. (a) | | | 2,455,522 | |
| | | | | | | | 10,265,351 | |
| Multi-Utilities—1.0% | | | | |
| | 94,300 | | | CMS Energy Corp. (a) | | | 2,589,478 | |
| Multiline Retail—0.5% | | | | |
| | 5,500 | | | Kering | | | 1,249,706 | |
| Office Electronics—0.5% | | | | |
| | 126,000 | | | Xerox Corp. | | | 1,252,440 | |
| Oil, Gas & Consumable Fuels—6.2% | | | | |
| | 58,000 | | | Enbridge, Inc. (a) | | | 2,516,620 | |
| | 42,000 | | | Energy XXI Bermuda, Ltd. | | | 1,220,520 | |
| | 37,000 | | | HollyFrontier Corp. (a) | | | 1,704,220 | |
| | 16,000 | | | Marathon Petroleum Corp. | | | 1,146,560 | |
| | 20,500 | | | Murphy Oil Corp. | | | 1,236,560 | |
| | 20,500 | | | Occidental Petroleum Corp. | | | 1,969,640 | |
| | 119,000 | | | Scorpio Tankers, Inc. | | | 1,373,260 | |
| | 71,500 | | | The Williams Cos., Inc. (a) | | | 2,553,265 | |
| | 27,000 | | | Total SA | | | 1,659,380 | |
| | | | | | | | 15,380,025 | |
| Pharmaceuticals—5.4% | | | | |
| | 47,500 | | | Novartis AG—ADR (a) | | | 3,683,625 | |
| | 86,001 | | | Pfizer, Inc. | | | 2,638,511 | |
| | 14,500 | | | Roche Holding AG | | | 4,014,327 | |
| | 59,500 | | | Sanofi—ADR (a) | | | 3,182,060 | |
| | | | | | | | 13,518,523 | |
| Real Estate Investment Trusts—3.8% | | | | |
| | 29,800 | | | American Tower Corp. (a) | | | 2,364,630 | |
| | 100 | | | Nippon Building Fund, Inc. | | | 1,237,669 | |
| | 192 | | | Nippon Prologis REIT, Inc. | | | 1,913,556 | |
| | 252,000 | | | Two Harbors Investment Corp. (a) | | | 2,351,160 | |
| | 165,800 | | | Westfield Group | | | 1,695,558 | |
| | | | | | | | 9,562,573 | |
| Real Estate Management & Development—3.3% | | | | |
| | 137,000 | | | BR Malls Participacoes SA | | | 1,327,069 | |
| | 134,691 | | | Cheung Kong Holdings, Ltd. | | | 2,109,053 | |
| | 280,822 | | | Foxtons Group PLC (b) | | | 1,435,235 | |
| | 58,000 | | | Mitsui Fudosan Co., Ltd. | | | 1,908,166 | |
| | 186,200 | | | Wharf Holdings, Ltd. | | | 1,575,483 | |
| | | | | | | | 8,355,006 | |
| Shares | | | Security
Description | | Value | |
| | | | | | | |
| Common Stocks—continued | | | | |
| Road & Rail—3.3% | | | | |
| | 566,100 | | | All America Latina Logistica SA | | $ | 2,026,659 | |
| | 26,500 | | | Canadian Pacific Railway, Ltd. (a) | | | 3,791,355 | |
| | 28,400 | | | East Japan Railway Co. | | | 2,457,887 | |
| | | | | | | | 8,275,901 | |
| Semiconductors & Semiconductor Equipment—2.5% | | | | |
| | 81,000 | | | Avago Technologies, Ltd. (a) | | | 3,679,830 | |
| | 105,500 | | | Intel Corp. (a) | | | 2,577,365 | |
| | | | | | | | 6,257,195 | |
| Specialty Retail—1.5% | | | | |
| | 162,000 | | | American Eagle Outfitters, Inc. (a) | | | 2,509,380 | |
| | 60,000 | | | Pier 1 Imports, Inc. | | | 1,252,800 | |
| | | | | | | | 3,762,180 | |
| Tobacco—1.0% | | | | |
| | 46,000 | | | British American Tobacco PLC | | | 2,534,269 | |
| Trading Companies & Distributors—1.0% | | | | |
| | 48,500 | | | Wolseley PLC | | | 2,613,677 | |
| Transportation Infrastructure—1.7% | | | | |
| | 1,116,500 | | | Adani Ports and Special Economic Zone, Ltd. | | | 2,638,868 | |
| | 24,500 | | | Koninklijke Vopak NV | | | 1,508,395 | |
| | | | | | | | 4,147,263 | |
| Water Utilities—1.6% | | | | |
| | 65,200 | | | American Water Works Co., Inc. (a) | | | 2,795,124 | |
| | 114,000 | | | Cia de Saneamento Basico do Estado de Sao
Paulo—ADR | | | 1,209,540 | |
| | | | | | | | 4,004,664 | |
| Wireless Telecommunication Services—2.3% | | | | |
| | 155,400 | | | Vodafone Group PLC—ADR (a) | | | 5,721,828 | |
| | | | | Total Common Stocks
(Cost $215,672,403) | | | 247,314,411 | |
| Equity-Linked Structured Notes—0.9% | | | | |
| Multi-Utilities—0.9% | | | | |
| | 133,500 | | | Veolia Environnement SA— Morgan Stanley BV | | | 2,287,495 | |
| | | | | Total Equity-Linked Structured Notes
(Cost $1,826,800) | | | 2,287,495 | |
| | | | | | | | | |
Principal
Amount | | | | | |
| Convertible Bonds—0.0% (c) | | | | |
| Household Durables—0.0%(c) | | | | |
| | | | | | | | | |
| | 791,393 | | | PDG Realty SA Empreendimentos e Participacoes—Series 8,
0.000%, 9/19/16
(Brazilian Real) (d) | | | 7,066 | |
| | | | | Total Convertible Bonds
(Cost $283,909) | | | 7,066 | |
Total Investments
(Cost $217,783,112)—99.9% | | | 249,608,972 | |
| Other Assets in Excess of Liabilities—0.1% | | | 146,095 | |
| TOTAL NET ASSETS 100.0% | | $ | 249,755,067 | |
The accompanying notes are an integral part of these financial statements.
60
Alpine Dynamic Dividend Fund
Schedule of Portfolio Investments—Continued
October 31, 2013
Percentages are stated as a percent of net assets.
| (a) | All or a portion of the security has been designated as collateral for the line of credit. |
| (b) | Non-income producing security. |
| (c) | Less than 0.05% of Net Assets. |
| (d) | Represents a zero-coupon bond. Rate shown reflects the current yield as of the report date. |
AB—Aktiebolag is the Swedish equivalent of a corporation.
ADR—American Depositary Receipt
AG—Aktiengesellschaft is a German term that refers to a corporation that is limited by shares, i.e., owned by shareholders.
ASA—Allmennaksjeselskap is the Norwegian term for a public limited company.
BV—Besloten Vennootschap is the Dutch equivalent of a private limited liability company.
NV—Naamloze Vennootschap is the Dutch term for a public limited liability corporation.
PCL—Public Company Limited
PLC—Public Limited Company
REIT—Real Estate Investment Trust
SA—Generally designates corporations in various countries, mostly those employing the civil law
The accompanying notes are an integral part of these financial statements.
61
Alpine Accelerating Dividend Fund
Schedule of Portfolio Investments
October 31, 2013
| Shares | | | Security
Description | | Value | |
| | | | | | | |
| Common Stocks—95.4% | | | | |
| Aerospace & Defense—1.2% | | | | |
| | 500 | | | United Technologies Corp. | | $ | 53,125 | |
| Beverages—3.0% | | | | |
| | 600 | | | Anheuser-Busch InBev NV—ADR | | | 62,238 | |
| | 800 | | | PepsiCo, Inc. | | | 67,272 | |
| | | | | | | | 129,510 | |
| Biotechnology—1.5% | | | | |
| | 550 | | | Amgen, Inc. | | | 63,800 | |
| Capital Markets—1.2% | | | | |
| | 4,000 | | | Och-Ziff Capital Management Group, LLC—Class A | | | 49,960 | |
| Chemicals—1.1% | | | | |
| | 450 | | | Air Products & Chemicals, Inc. | | | 49,055 | |
| Commercial Banks—2.2% | | | | |
| | 2,000 | | | National Bank Holdings Corp.—Class A | | | 42,000 | |
| | 750 | | | PNC Financial Services Group, Inc. | | | 55,148 | |
| | | | | | | | 97,148 | |
| Commercial Services & Supplies—1.2% | | | | |
| | 1,400 | | | Corrections Corp. of America | | | 51,800 | |
| Communications Equipment—3.1% | | | | |
| | 2,800 | | | Cisco Systems, Inc. | | | 63,000 | |
| | 1,000 | | | QUALCOMM, Inc. | | | 69,470 | |
| | | | | | | | 132,470 | |
| Computers & Peripherals—3.3% | | | | |
| | 150 | | | Apple, Inc. | | | 78,352 | |
| | 2,700 | | | EMC Corp. | | | 64,989 | |
| | | | | | | | 143,341 | |
| Construction & Engineering—1.0% | | | | |
| | 3,000 | | | Aecon Group, Inc. | | | 41,577 | |
| Diversified Financial Services—1.3% | | | | |
| | 1,200 | | | Citigroup, Inc. | | | 58,536 | |
| Electrical Equipment—1.2% | | | | |
| | 1,200 | | | AZZ, Inc. | | | 53,880 | |
| Energy Equipment & Services—2.8% | | | | |
| | 750 | | | Bristow Group, Inc. | | | 60,352 | |
| | 650 | | | Schlumberger, Ltd. | | | 60,918 | |
| | | | | | | | 121,270 | |
| Food & Staples Retailing—1.5% | | | | |
| | 1,100 | | | Walgreen Co. | | | 65,164 | |
| Food Products—3.0% | | | | |
| | 1,300 | | | General Mills, Inc. | | | 65,546 | |
| | 600 | | | The J.M. Smucker Co. | | | 66,726 | |
| | | | | | | | 132,272 | |
| Gas Utilities—1.3% | | | | |
| | 1,300 | | | Atmos Energy Corp. | | | 57,551 | |
| Health Care Equipment & Supplies—1.5% | | | | |
| | 600 | | | Becton, Dickinson & Co. | | | 63,078 | |
| Health Care Providers & Services—4.4% | | | | |
| | 1,000 | | | Aetna, Inc. | | | 62,700 | |
| | 1,000 | | | AmerisourceBergen Corp. | | | 65,330 | |
| | 1,500 | | | Patterson Cos., Inc. | | | 63,765 | |
| | | | | | | | 191,795 | |
| Shares | | | Security
Description | | Value | |
| | | | | | | |
| Common Stocks—continued | | | | |
| Household Products—3.0% | | | | |
| | 675 | | | Energizer Holdings, Inc. | | $ | 66,224 | |
| | 800 | | | The Procter & Gamble Co. | | | 64,600 | |
| | | | | | | | 130,824 | |
| Industrial Conglomerates—1.3% | | | | |
| | 450 | | | 3M Co. | | | 56,633 | |
| Insurance—1.0% | | | | |
| | 1,100 | | | Validus Holdings, Ltd. | | | 43,428 | |
| Internet & Catalog Retail—1.2% | | | | |
| | 1,000 | | | HSN, Inc. | | | 52,400 | |
| IT Services—2.9% | | | | |
| | 375 | | | International Business Machines Corp. | | | 67,204 | |
| | 300 | | | Visa, Inc.—Class A | | | 59,001 | |
| | | | | | | | 126,205 | |
| Life Sciences Tools & Services—1.5% | | | | |
| | 1,250 | | | Agilent Technologies, Inc. | | | 63,450 | |
| Machinery—2.5% | | | | |
| | 600 | | | Dover Corp. | | | 55,074 | |
| | 500 | | | Snap-on, Inc. | | | 52,035 | |
| | | | | | | | 107,109 | |
| Media—4.3% | | | | |
| | 1,050 | | | CBS Corp.—Class B | | | 62,097 | |
| | 1,400 | | | Comcast Corp.—Class A | | | 66,612 | |
| | 2,050 | | | SES SA | | | 59,676 | |
| | | | | | | | 188,385 | |
| Metals & Mining—1.1% | | | | |
| | 700 | | | Kaiser Aluminum Corp. | | | 47,215 | |
| Multi-Utilities—2.5% | | | | |
| | 2,000 | | | CMS Energy Corp. | | | 54,920 | |
| | 1,900 | | | Xcel Energy, Inc. | | | 54,834 | |
| | | | | | | | 109,754 | |
| Oil, Gas & Consumable Fuels—5.7% | | | | |
| | 500 | | | Chevron Corp. | | | 59,980 | |
| | 1,000 | | | Devon Energy Corp. | | | 63,220 | |
| | 650 | | | Occidental Petroleum Corp. | | | 62,452 | |
| | 1,750 | | | Suncor Energy, Inc. | | | 63,612 | |
| | | | | | | | 249,264 | |
| Pharmaceuticals—3.6% | | | | |
| | 1,350 | | | AbbVie, Inc. | | | 65,407 | |
| | 1,100 | | | Mylan, Inc. (a) | | | 41,657 | |
| | 1,300 | | | Teva Pharmaceutical Industries, Ltd.—ADR | | | 48,217 | |
| | | | | | | | 155,281 | |
| Real Estate Investment Trusts—5.4% | | | | |
| | 700 | | | American Tower Corp. | | | 55,545 | |
| | 2,500 | | | Colony Financial, Inc. | | | 50,575 | |
| | 7,500 | | | New Residential Investment Corp. | | | 49,575 | |
| | 4,500 | | | NorthStar Realty Finance Corp. | | | 41,985 | |
| | 3,700 | | | Two Harbors Investment Corp. | | | 34,521 | |
| | | | | | | | 232,201 | |
| Real Estate Management & Development—2.2% | | | | |
| | 1,600 | | | Altisource Residential Corp. | | | 42,512 | |
| | 550 | | | Jones Lang LaSalle, Inc. | | | 52,360 | |
| | | | | | | | 94,872 | |
The accompanying notes are an integral part of these financial statements.
62
Alpine Accelerating Dividend Fund
Schedule of Portfolio Investments—Continued
October 31, 2013
| Shares | | | Security
Description | | Value | |
| | | | | | | |
| Common Stocks—continued | | | | |
| Road & Rail—1.2% | | | | |
| | 3,000 | | | Marten Transport, Ltd. | | $ | 52,920 | |
| Semiconductors & Semiconductor Equipment—4.0% | | | | |
| | 1,400 | | | Avago Technologies, Ltd. | | | 63,602 | |
| | 2,200 | | | Intel Corp. | | | 53,746 | |
| | 1,350 | | | Linear Technology Corp. | | | 55,539 | |
| | | | | | | | 172,887 | |
| Software—2.8% | | | | |
| | 1,600 | | | Microsoft Corp. | | | 56,560 | |
| | 1,900 | | | Oracle Corp. | | | 63,650 | |
| | | | | | | | 120,210 | |
| Specialty Retail—5.3% | | | | |
| | 1,300 | | | Dick’s Sporting Goods, Inc. | | | 69,173 | |
| | 1,150 | | | GNC Holdings, Inc.—Class A | | | 67,643 | |
| | 2,500 | | | Pier 1 Imports, Inc. | | | 52,200 | |
| | 1,200 | | | Rent-A-Center, Inc. | | | 41,088 | |
| | | | | | | | 230,104 | |
| Textiles, Apparel & Luxury Goods—2.8% | | | | |
| | 550 | | | Adidas AG | | | 62,788 | |
| | 270 | | | VF Corp. | | | 58,050 | |
| | | | | | | | 120,838 | |
| Shares | | | Security
Description | | Value | |
| | | | | | | |
| Common Stocks—continued | | | | |
| Thrifts & Mortgage Finance—2.8% | | | | |
| | 4,000 | | | EverBank Financial Corp. | | $ | 60,480 | |
| | 2,700 | | | Territorial Bancorp, Inc. | | | 58,887 | |
| | | | | | | | 119,367 | |
| Water Utilities—1.3% | | | | |
| | 1,300 | | | American Water Works Co., Inc. | | | 55,731 | |
| Wireless Telecommunication Services—1.2% | | | | |
| | 1,400 | | | Vodafone Group PLC—ADR | | | 51,548 | |
| | | | | Total Common Stocks
(Cost $3,427,260) | | | 4,135,958 | |
| Principal | | | | | |
| Amount | | | | | |
| Short-Term Investments—5.2% | | | | |
| $ | 226,000 | | | State Street Eurodollar Time Deposit, 0.01% | | | 226,000 | |
| | | | | Total Short-Term Investments
(Cost $226,000) | | | 226,000 | |
Total Investments
(Cost $3,653,260)—100.6% | | | 4,361,958 | |
| Liabilities in Excess of Other Assets—(0.6)% | | | (27,862 | ) |
| TOTAL NET ASSETS 100.0% | | $ | 4,334,096 | |
Percentages are stated as a percent of net assets.
(a) Non-income producing security.
ADR—American Depositary Receipt
AG—Aktiengesellschaft is a German term that refers to a corporation that is limited by shares, i.e., owned by shareholders.
NV—Naamloze Vennootschap is the Dutch term for a public limited liability corporation.
PLC—Public Limited Company
SA—Generally designates corporations in various countries, mostly those employing the civil law
The accompanying notes are an integral part of these financial statements.
63
Alpine Financial Services Fund
Schedule of Portfolio Investments
October 31, 2013
| Shares | | | Security
Description | | Value | |
| | | | | | | |
| Common Stocks—94.7% | | | | |
| Capital Markets—18.0% | | | | |
| | 12,500 | | | Apollo Global Management LLC—Class A | | $ | 403,250 | |
| | 25,000 | | | BGC Partners, Inc.—Class A | | | 133,000 | |
| | 131,000 | | | China Galaxy Securities Co., Ltd.—Class H (a) | | | 89,215 | |
| | 52,033 | | | Cowen Group, Inc.—Class A (a) | | | 206,571 | |
| | 1,651 | | | Deutsche Bank AG | | | 79,870 | |
| | 18,500 | | | GFI Group, Inc. | | | 64,195 | |
| | 4,451 | | | Gleacher & Co., Inc. (a) | | | 58,664 | |
| | 12,003 | | | JMP Group, Inc. | | | 76,939 | |
| | 17,900 | | | KKR & Co. LP | | | 392,905 | |
| | 4,869 | | | LPL Financial Holdings, Inc. | | | 198,363 | |
| | 4,443 | | | Manning & Napier, Inc. | | | 73,754 | |
| | 2,000 | | | Noah Holdings, Ltd.—ADR | | | 38,580 | |
| | 500 | | | Oaktree Capital Group LLC | | | 28,460 | |
| | 13,200 | | | Och-Ziff Capital Management Group, LLC—Class A | | | 164,868 | |
| | 1,705 | | | SWS Group, Inc. (a) | | | 9,599 | |
| | 20,000 | | | The Blackstone Group LP | | | 525,600 | |
| | 20,000 | | | The Carlyle Group LP | | | 618,400 | |
| | 1,170 | | | Virtus Investment Partners, Inc. (a) | | | 238,118 | |
| | 26,340 | | | WisdomTree Investments, Inc. (a) | | | 366,126 | |
| | | | | | | | 3,766,477 | |
| Commercial Banks—35.8% | | | | |
| | 4,150 | | | 1st Constitution Bancorp (a) | | | 41,915 | |
| | 45,165 | | | 1st United Bancorp, Inc. | | | 345,061 | |
| | 3,316 | | | American River Bankshares (a) | | | 28,783 | |
| | 5,895 | | | Banc of California, Inc. | | | 83,178 | |
| | 13,000 | | | Banco Industrial e Comercial SA | | | 43,523 | |
| | 6,000 | | | Bancorp, Inc. (a) | | | 97,020 | |
| | 46,381 | | | Bank of Commerce Holdings | | | 255,095 | |
| | 5,000 | | | Bank of Georgia Holdings PLC | | | 158,255 | |
| | 16,785 | | | Barclays PLC | | | 70,943 | |
| | 8,244 | | | BNC Bancorp | | | 108,079 | |
| | 106,783 | | | Carolina Trust Bank (a) | | | 326,222 | |
| | 12,493 | | | Centerstate Banks, Inc. | | | 123,181 | |
| | 13,000 | | | Cherokee Banking Co. (a) | | | 50,115 | |
| | 36,627 | | | Citizens First Corp. (a) | | | 324,149 | |
| | 7,095 | | | Comerica, Inc. | | | 307,213 | |
| | 6,700 | | | Community National Bank of the Lakeway Area (a)(b) | | | 19,932 | |
| | 500 | | | ConnectOne Bancorp, Inc. (a) | | | 19,005 | |
| | 9,786 | | | Cordia Bancorp, Inc. (a) | | | 41,786 | |
| | 5,000 | | | County Commerce Bank (a) | | | 79,250 | |
| | 15,000 | | | CU Bancorp (a) | | | 279,000 | |
| | 88,572 | | | First BanCorp (a) | | | 491,575 | |
| | 17,000 | | | First Business Financial Services, Inc. | | | 598,740 | |
| | 2,130 | | | First Internet Bancorp | | | 47,052 | |
| | 7,000 | | | Grupo Financiero Banorte SAB de CV—Class O | | | 44,809 | |
| | 40,000 | | | Grupo Financiero Interacciones SAB de CV | | | 187,013 | |
| | 5,000 | | | Intervest Bancshares Corp. (a) | | | 36,450 | |
| | 500 | | | Manhattan Bancorp (a) | | | 2,063 | |
| | 10,200 | | | New Century Bancorp, Inc. (a) | | | 67,422 | |
| | 25,000 | | | Nordea Bank AB | | | 320,214 | |
| | 400 | | | North Valley Bancorp (a) | | | 7,560 | |
| | 4,000 | | | OFG Bancorp | | | 59,240 | |
| | 2,375 | | | Old Point Financial Corp. | | | 30,139 | |
| Shares | | | Security
Description | | Value | |
| | | | | | | |
| Common Stocks—continued | | | | |
| Commercial Banks—continued | | | | |
| | 14,644 | | | Pacific Mercantile Bancorp (a) | | $ | 91,086 | |
| | 48,276 | | | Pacific Premier Bancorp, Inc. (a) | | | 671,519 | |
| | 2,500 | | | Plaza Bank (a)(b) | | | 8,625 | |
| | 4,000 | | | Popular, Inc. (a) | | | 101,000 | |
| | 75,000 | | | Republic First Bancorp, Inc. (a) | | | 236,250 | |
| | 3,120 | | | SB Financial Group, Inc. | | | 25,428 | |
| | 5,000 | | | Seacoast Commerce Bank (a) | | | 32,500 | |
| | 2,000 | | | Security California Bancorp (a) | | | 19,000 | |
| | 2,000 | | | Shore Bancshares, Inc. (a) | | | 18,300 | |
| | 5,000 | | | SouthCrest Financial Group, Inc. (a) | | | 28,000 | |
| | 600 | | | Southeastern Bank Financial Corp. | | | 12,540 | |
| | 38,750 | | | Southern National Bancorp of Virginia, Inc. | | | 377,812 | |
| | 5,000 | | | Sterling Bancorp | | | 58,600 | |
| | 2,000 | | | Stonegate Bank | | | 43,500 | |
| | 8,000 | | | Summit State Bank | | | 79,200 | |
| | 4,000 | | | Susquehanna Bancshares, Inc. | | | 47,140 | |
| | 177,347 | | | Synovus Financial Corp. | | | 576,378 | |
| | 1,726 | | | TCS Group Holding PLC—GDR (a) | | | 29,592 | |
| | 1,000 | | | Texas Capital Bancshares, Inc. (a) . | | | 52,050 | |
| | 2,551 | | | Valley Commerce Bancorp (b) | | | 35,459 | |
| | 29,635,132 | | | VTB Bank OJSC | | | 42,971 | |
| | 62,000 | | | VTB Bank OJSC—GDR | | | 172,298 | |
| | 658 | | | Yadkin Financial Corp. (a) | | | 10,804 | |
| | 500 | | | Zions BanCorp. | | | 14,185 | |
| | | | | | | | 7,478,219 | |
| Commercial Services & Supplies—0.3% | | | | |
| | 5,000 | | | Multiplus SA | | | 61,936 | |
| Consumer Finance—3.7% | | | | |
| | 4,158 | | | Capital One Financial Corp. | | | 285,530 | |
| | 2,000 | | | Credit Acceptance Corp. (a) | | | 236,600 | |
| | 500 | | | DFC Global Corp. (a) | | | 6,050 | |
| | 1,000 | | | Discover Financial Services | | | 51,880 | |
| | 2,591 | | | Ezcorp, Inc.—Class A (a) | | | 40,756 | |
| | 25,000 | | | Imperial Holdings, Inc. (a) | | | 146,500 | |
| | | | | | | | 767,316 | |
| Diversified Financial Services—5.9% | | | | |
| | 7,124 | | | BM&F Bovespa SA | | | 40,165 | |
| | 1,100 | | | BTG Pactual Participations, Ltd. | | | 14,716 | |
| | 3,325 | | | CME Group, Inc. | | | 246,748 | |
| | 3,115 | | | IntercontinentalExchange, Inc. (a) | | | 600,354 | |
| | 2,000 | | | NYSE Euronext | | | 88,040 | |
| | 7,000 | | | The NASDAQ OMX Group, Inc. | | | 248,010 | |
| | | | | | | | 1,238,033 | |
| Household Durables—1.4% | | | | |
| | 20,000 | | | UCP, Inc.—Class A (a) | | | 282,000 | |
| Insurance—6.5% | | | | |
| | 23,000 | | | Atlas Financial Holdings, Inc. (a) . | | | 280,830 | |
| | 50,000 | | | BB Seguridade Participacoes SA | | | 546,157 | |
| | 2,200 | | | Brasil Insurance Participacoes e Administracao SA | | | 20,034 | |
| | 51,515 | | | esure Group PLC | | | 187,087 | |
| | 9,000 | | | Health Insurance Innovations, Inc.—Class A (a) | | | 109,260 | |
| | 5,700 | | | The Phoenix Co., Inc. (a) | | | 219,849 | |
| | | | | | | | 1,363,217 | |
| Internet Software & Services—0.2% | | | | |
| | 1,000 | | | Xoom Corp. (a) | | | 29,750 | |
The accompanying notes are an integral part of these financial statements.
64
Alpine Financial Services Fund
Schedule of Portfolio Investments—Continued
October 31, 2013
| Shares | | | Security
Description | | Value | |
| | | | | | | | | |
| Common Stocks—continued | | | | |
| IT Services—1.3% | | | | |
| | 2,400 | | | EVERTEC, Inc. | | $ | 56,304 | |
| | 1,000 | | | VeriFone Systems, Inc. (a) | | | 22,660 | |
| | 1,000 | | | Visa, Inc.—Class A | | | 196,670 | |
| | | | | | | | 275,634 | |
| Real Estate Investment Trusts—12.4% | | | | |
| | 2,000 | | | American Capital Agency Corp. | | | 43,440 | |
| | 5,000 | | | American Residential Properties, Inc. (a) | | | 86,150 | |
| | 2,000 | | | Brixmor Property Group, Inc. (a) | | | 41,300 | |
| | 8,500 | | | Government Properties Income Trust | | | 207,825 | |
| | 28,125 | | | Kite Realty Group Trust | | | 180,000 | |
| | 89,048 | | | NorthStar Realty Finance Corp. | | | 830,818 | |
| | 6,500 | | | Plum Creek Timber Co., Inc. | | | 295,100 | |
| | 20,000 | | | Rexford Industrial Realty, Inc. (a) | | | 272,400 | |
| | 7,407 | | | Select Income REIT | | | 204,063 | |
| | 6,557 | | | Silver Bay Realty Trust Corp. | | | 101,371 | |
| | 7,000 | | | Weyerhaeuser Co. | | | 212,800 | |
| | 8,900 | | | Winthrop Realty Trust | | | 104,753 | |
| | | | | | | | 2,580,020 | |
| Real Estate Management & Development—0.7% | | | | |
| | 7,249 | | | Daiwa House Industry Co., Ltd. | | | 144,567 | |
| Thrifts & Mortgage Finance—7.7% | | | | |
| | 17,105 | | | Alliance Bancorp, Inc. of Pennsylvania | | | 248,022 | |
| | 2,000 | | | Astoria Financial Corp. | | | 26,420 | |
| | 10,000 | | | Bank Mutual Corp. | | | 63,600 | |
| | 2,000 | | | Cape Bancorp, Inc. | | | 18,420 | |
| | 126,234 | | | Central Federal Corp. (a) | | | 175,465 | |
| | 2,500 | | | Dime Community Bancshares, Inc. | | | 40,900 | |
| | 500 | | | First Defiance Financial Corp. | | | 12,910 | |
| | 6,000 | | | Flagstar Bancorp, Inc. (a) | | | 97,260 | |
| | 8,823 | | | HopFed Bancorp, Inc. | | | 95,730 | |
| | 15,000 | | | Jefferson Bancshares, Inc. (a) | | | 95,250 | |
| | 2,000 | | | Laporte Bancorp, Inc. | | | 21,280 | |
| | 1,000 | | | LSB Financial Corp. | | | 28,510 | |
| | 4,466 | | | Meta Financial Group, Inc. | | | 166,225 | |
| | 1,000 | | | Northwest Indiana Bancorp | | | 24,000 | |
| Shares | | | Security
Description | | Value | |
| | | | | | | |
| Common Stocks—continued | | | | |
| Thrifts & Mortgage Finance—continued | | | | |
| | 1,000 | | | Ocean Shore Holding Co. | | $ | 14,270 | |
| | 1,000 | | | Peoples Federal Bancshares, Inc. | | | 17,100 | |
| | 23,751 | | | Provident Financial Holdings, Inc. | | | 360,065 | |
| | 11,000 | | | Riverview Bancorp, Inc. (a) | | | 29,260 | |
| | 1,000 | | | Stonegate Mortgage Corp. (a) | | | 17,690 | |
| | 1,000 | | | TF Financial Corp. | | | 27,750 | |
| | 6,752 | | | United Community Financial Corp. (a) | | | 27,008 | |
| | | | | | | | 1,607,135 | |
| Trading Companies & Distributors—0.8% | | | | |
| | 4,652 | | | Fly Leasing, Ltd.—ADR | | | 66,989 | |
| | 2,769 | | | Textainer Group Holdings, Ltd. | | | 104,945 | |
| | | | | | | | 171,934 | |
| | | | | Total Common Stocks
(Cost $17,846,760) | | | 19,766,238 | |
| Investment Companies—1.2% | | | | |
| | 3,000 | | | Direxion Daily Financial Bear 3X Shares (a) | | | 78,810 | |
| | 1,000 | | | ProShares UltraShort 20+ Year Treasury (a) | | | 72,960 | |
| | 5,200 | | | ProShares UltraShort Financials (a) | | | 102,960 | |
| | | | | Total Investment Companies
(Cost $545,554) | | | 254,730 | |
| | | | | | | | | |
| Principal | | | | | |
| Amount | | | | | |
| Short-Term Investments—4.1% | | | | |
| $ | 857,000 | | | State Street Eurodollar Time Deposit, 0.01% | | | 857,000 | |
| | | | | Total Short-Term Investments
(Cost $857,000) | | | 857,000 | |
Total Investments
(Cost $19,341,730)—100.0% | | | 20,877,968 | |
| Other Assets in Excess of Liabilities—0.0% (c) | | | 1,198 | |
| TOTAL NET ASSETS 100.0% | | $ | 20,879,166 | |
Percentages are stated as a percent of net assets.
(a) Non-income producing security.
(b) Illiquid security.
(c) Amount is less than 0.05%.
AB—Aktiebolag is the Swedish equivalent of a corporation.
ADR—American Depositary Receipt
AG—Aktiengesellschaft is a German term that refers to a corporation that is limited by shares, i.e., owned by shareholders.
GDR—Global Depositary Receipt
OJSC—Open Joint Stock Company
PLC—Public Limited Company
REIT—Real Estate Investment Trust
SA—Generally designates corporations in various countries, mostly those employing the civil law
SAB de CV—Sociedad Anonima Bursátil de Capital Variable is the Spanish equivalent to Variable Capital Company.
The accompanying notes are an integral part of these financial statements.
65
Alpine Innovators Fund
Schedule of Portfolio Investments
October 31, 2013
| | | Security | | |
| Shares | | Description | | Value | |
| | | | | | | | | |
| Common Stocks—94.6% | | | | |
| Aerospace & Defense—1.1% | | | | |
| | 5,000 | | | Aerovironment, Inc. (a) | | $ | 135,550 | |
| Biotechnology—2.1% | | | | |
| | 2,000 | | | Gilead Sciences, Inc. (a) | | | 141,980 | |
| | 5,000 | | | Myriad Genetics, Inc. (a) | | | 121,900 | |
| | | | | | | | 263,880 | |
| Chemicals—3.5% | | | | |
| | 4,000 | | | Westlake Chemical Corp. | | | 429,680 | |
| Commercial Banks—3.2% | | | |
| | 6,000 | | | First Internet Bancorp | | | 132,540 | |
| | 8,000 | | | SunTrust Banks, Inc. | | | 269,120 | |
| | | | | | | | 401,660 | |
| Computers & Peripherals—5.6% | | | | |
| | 800 | | | Apple, Inc. | | | 417,880 | |
| | 6,000 | | | Synaptics, Inc. (a) | | | 279,000 | |
| | | | | | | | 696,880 | |
| Diversified Financial Services—2.4% | | | | |
| | 4,000 | | | CME Group, Inc. | | | 296,840 | |
| Electrical Equipment—0.7% | | | | |
| | 7,500 | | | Hydrogenics Corp. (a) | | | 91,575 | |
| Electronic Equipment, Instruments & Components—10.1% | | | | |
| | 11,000 | | | FLIR Systems, Inc. | | | 313,280 | |
| | 12,434 | | | InvenSense, Inc. (a) | | | 210,010 | |
| | 4,000 | | | IPG Photonics Corp. | | | 265,080 | |
| | 6,000 | | | Oxford Instruments PLC | | | 125,065 | |
| | 5,000 | | | Trimble Navigation, Ltd. (a) | | | 142,850 | |
| | 6,200 | | | Universal Display Corp. (a) | | | 197,780 | |
| | | | | | | | 1,254,065 | |
| Energy Equipment & Services—0.2% | | | | |
| | 25,000 | | | Electromagnetic GeoServices (a) | | | 28,872 | |
| Health Care Equipment & Supplies—6.2% | | | | |
| | 7,000 | | | Cardiovascular Systems, Inc. (a) | | | 212,450 | |
| | 10,000 | | | Endologix, Inc. (a) | | | 180,700 | |
| | 400 | | | Intuitive Surgical, Inc. (a) | | | 148,600 | |
| | 5,000 | | | MAKO Surgical Corp. (a) | | | 149,050 | |
| | 18,000 | | | Synergetics U.S.A., Inc. (a) | | | 74,880 | |
| | | | | | | | 765,680 | |
| Health Care Providers & Services—5.3% | | | | |
| | 6,000 | | | MEDNAX, Inc. (a) | | | 654,120 | |
| Health Care Technology—1.4% | | | | |
| | 10,000 | | | Icad, Inc. (a) | | | 89,900 | |
| | 4,000 | | | Quality Systems, Inc. | | | 91,280 | |
| | | | | | | | 181,180 | |
| Household Durables—1.9% | | | | |
| | 5,000 | | | Garmin, Ltd. | | | 233,750 | |
| | | Security | | |
| Shares | | Description | | Value | |
| | | | | | | | | |
| Common Stocks—continued | | | | |
| Internet & Catalog Retail—12.9% | | | | |
| | 40 | | | Amazon.com, Inc. (a) | | $ | 14,561 | |
| | 1,500 | | | priceline.com, Inc. (a) | | | 1,580,745 | |
| | | | | | | | 1,595,306 | |
| Internet Software & Services—5.8% | | | | |
| | 700 | | | Google, Inc.—Class A (a) | | | 721,406 | |
| IT Services—1.6% | | | | |
| | 4,000 | | | MAXIMUS, Inc. | | | 193,800 | |
| Life Sciences Tools & Services—7.7% | | | | |
| | 1,000 | | | Bio-Rad Laboratories, Inc.—Class A (a) | | | 123,520 | |
| | 11,000 | | | Life Technologies Corp. (a) | | | 828,410 | |
| | | | | | | | 951,930 | |
| Machinery—7.9% | | | | |
| | 1,000 | | | Chart Industries, Inc. (a) | | | 107,470 | |
| | 8,100 | | | Flowserve Corp. | | | 562,707 | |
| | 19,358 | | | Hexagon Composites ASA | | | 60,158 | |
| | 3,000 | | | Proto Labs, Inc. (a) | | | 251,580 | |
| | | | | | | | 981,915 | |
| Semiconductors & Semiconductor Equipment—1.4% | | | | |
| | 18,000 | | | Himax Technologies, Inc.—ADR | | | 174,420 | |
| Software—13.6% | | | | |
| | 13,400 | | | ANSYS, Inc. (a) | | | 1,171,830 | |
| | 15,000 | | | Callidus Software, Inc. (a) | | | 155,250 | |
| | 20,600 | | | Mitek Systems, Inc. (a) | | | 108,974 | |
| | 4,000 | | | Tableau Software, Inc.—Class A (a) | | | 245,840 | |
| | | | | | | | 1,681,894 | |
| | | | | Total Common Stocks
(Cost $7,740,615) | | | 11,734,403 | |
| | | | | | | |
| Principal | | | | | |
| Amount | | | | | |
| Short-Term Investments—10.3% | | | | |
| $ | 1,273,000 | | | State Street Eurodollar Time Deposit, 0.01% | | | 1,273,000 | |
| | | | | Total Short-Term Investments
(Cost $1,273,000) | | | 1,273,000 | |
Total Investments
(Cost $9,013,615)—104.9% | | | 13,007,403 | |
| Liabilities in Excess of Other Assets—(4.9)% | | | (605,335 | ) |
| TOTAL NET ASSETS 100.0% | | $ | 12,402,068 | |
Percentages are stated as a percent of net assets.
(a) Non-income producing security.
ADR—American Depositary Receipt
ASA—Allmennaksjeselskap is the Norwegian term for a public limited company.
PLC—Public Limited Company
The accompanying notes are an integral part of these financial statements.
66
Alpine Transformations Fund
Schedule of Portfolio Investments
October 31, 2013
| | | Security | | |
| Shares | | Description | | Value | |
| | | | | | | | | |
| Common Stocks—96.6% | | | | |
| Aerospace & Defense—1.5% | | | | |
| | 2,500 | | | Aerovironment, Inc. (a) | | $ | 67,775 | |
| | 2,000 | | | Erickson Air-Crane, Inc. (a) | | | 39,200 | |
| | | | | | | | 106,975 | |
| Chemicals—8.3% | | | | |
| | 10,000 | | | Clariant AG (a) | | | 176,338 | |
| | 2,500 | | | Eastman Chemical Co. | | | 196,975 | |
| | 9,000 | | | Flotek Industries, Inc. (a) | | | 192,420 | |
| | 500 | | | Koninklijke DSM NV | | | 37,874 | |
| | | | | | | | 603,607 | |
| Commercial Services & Supplies—6.3% | | | | |
| | 5,000 | | | Deluxe Corp. | | | 235,450 | |
| | 12,000 | | | RR Donnelley & Sons Co. | | | 222,840 | |
| | | | | | | | 458,290 | |
| Computers & Peripherals—9.6% | | | | |
| | 700 | | | Apple, Inc. | | | 365,645 | |
| | 7,758 | | | Cray, Inc. (a) | | | 173,469 | |
| | 3,500 | | | Synaptics, Inc. (a) | | | 162,750 | |
| | | | | | | | 701,864 | |
| Diversified Financial Services—1.9% | | | | |
| | 10,000 | | | Bank of America Corp. | | | 139,600 | |
| Electrical Equipment—0.8% | | | | |
| | 4,500 | | | Hydrogenics Corp. (a) | | | 54,945 | |
| Electronic Equipment, Instruments & Components—2.6% | | | | |
| | 3,500 | | | Oxford Instruments PLC | | | 72,955 | |
| | 3,700 | | | Universal Display Corp. (a) | | | 118,030 | |
| | | | | | | | 190,985 | |
| Energy Equipment & Services—4.4% | | | | |
| | 1,000 | | | CARBO Ceramics, Inc. | | | 125,340 | |
| | 25,000 | | | Electromagnetic GeoServices (a) | | | 28,872 | |
| | 2,000 | | | National Oilwell Varco, Inc. | | | 162,360 | |
| | | | | | | | 316,572 | |
| Food & Staples Retailing—2.8% | | | | |
| | 4,000 | | | Weis Markets, Inc. | | | 204,680 | |
| Health Care Equipment & Supplies—2.9% | | | | |
| | 2,000 | | | Edwards Lifesciences Corp. (a) | | | 130,380 | |
| | 100 | | | Intuitive Surgical, Inc. (a) | | | 37,150 | |
| | 11,000 | | | Synergetics U.S.A., Inc. (a) | | | 45,760 | |
| | | | | | | | 213,290 | |
| Household Durables—7.6% | | | | |
| | 5,000 | | | Garmin, Ltd. | | | 233,750 | |
| | 3,200 | | | Helen of Troy, Ltd. (a) | | | 149,504 | |
| | 3,000 | | | Jarden Corp. (a) | | | 166,080 | |
| | | | | | | | 549,334 | |
| Household Products—0.8% | | | | |
| | 2,000 | | | Orchids Paper Products Co. | | | 61,000 | |
| Internet & Catalog Retail—5.8% | | | | |
| | 400 | | | priceline.com, Inc. (a) | | | 421,532 | |
| Internet Software & Services—2.8% | | | | |
| | 200 | | | Google, Inc.—Class A (a) | | | 206,116 | |
| Machinery—15.6% | | | | |
| | 700 | | | Chart Industries, Inc. (a) | | | 75,229 | |
| | 2,000 | | | GEA Group AG | | | 87,031 | |
| | 14,518 | | | Hexagon Composites ASA | | | 45,117 | |
| | 1,500 | | | Ingersoll-Rand PLC | | | 101,295 | |
| | 7,000 | | | Manitex International, Inc. (a) | | | 90,510 | |
| | | Security | | |
| Shares | | Description | | Value | |
| | | | | | | | | |
| Common Stocks—continued | | | | |
| Machinery—continued | | | | |
| | 2,000 | | | Proto Labs, Inc. (a) | | $ | 167,720 | |
| | 3,000 | | | Snap-on, Inc. | | | 312,210 | |
| | 13,000 | | | Wabash National Corp. (a) | | | 151,580 | |
| | 3,000 | | | Xylem, Inc. | | | 103,500 | |
| | | | | | | | 1,134,192 | |
| Metals & Mining—1.8% | | | | |
| | 3,500 | | | Freeport-McMoRan Copper & Gold, Inc. | | | 128,660 | |
| Multi-Utilities—1.0% | | | | |
| | 10,000 | | | Just Energy Group, Inc. | | | 70,973 | |
| Office Electronics—1.6% | | | | |
| | 12,000 | | | Xerox Corp. | | | 119,280 | |
| Oil, Gas & Consumable Fuels—4.5% | | | | |
| | 372 | | | Apache Corp. | | | 33,034 | |
| | 10,000 | | | Emerald Oil, Inc. (a) | | | 87,000 | |
| | 2,500 | | | HollyFrontier Corp. | | | 115,150 | |
| | 1,500 | | | Murphy Oil Corp. | | | 90,480 | |
| | | | | | | | 325,664 | |
| Paper & Forest Products—1.8% | | | | |
| | 3,000 | | | International Paper Co. | | | 133,830 | |
| Pharmaceuticals—3.0% | | | | |
| | 3,000 | | | Mylan, Inc. (a) | | | 113,610 | |
| | 1,000 | | | Valeant Pharmaceuticals International, Inc. (a) | | | 105,720 | |
| | | | | | | | 219,330 | |
| Road & Rail—1.9% | | | | |
| | 700 | | | AMERCO | | | 141,351 | |
| Semiconductors & Semiconductor Equipment—2.2% | | | | |
| | 10,500 | | | Himax Technologies, Inc.—ADR | | | 101,745 | |
| | 20,000 | | | Vitesse Semiconductor Corp. (a) | | | 57,200 | |
| | | | | | | | 158,945 | |
| Software—3.6% | | | | |
| | 15,000 | | | Callidus Software, Inc. (a) | | | 155,250 | |
| | 20,600 | | | Mitek Systems, Inc. (a) | | | 108,974 | |
| | | | | | | | 264,224 | |
| Specialty Retail—0.2% | | | | |
| | 375 | | | Murphy U.S.A., Inc. (a) | | | 15,217 | |
| Trading Companies & Distributors—1.3% | | | | |
| | 1,500 | | | United Rentals, Inc. (a) | | | 96,885 | |
| | | | | Total Common Stocks
(Cost $5,458,721) | | | 7,037,341 | |
| | | | | | | | | |
| Principal | | | | | |
| Amount | | | | | |
| Short-Term Investments—5.5% | | | | |
| $ | 401,000 | | | State Street Eurodollar Time Deposit, 0.01% | | | 401,000 | |
| | | | | Total Short-Term Investments
(Cost $401,000) | | | 401,000 | |
Total Investments
(Cost $5,859,721)—102.1% | | | 7,438,341 | |
| Liabilities in Excess of Other Assets—(2.1)% | | | (153,159 | ) |
| TOTAL NET ASSETS 100.0% | | $ | 7,285,182 | |
The accompanying notes are an integral part of these financial statements.
67
Alpine Transformations Fund
Schedule of Portfolio Investments—Continued
October 31, 2013
Percentages are stated as a percent of net assets.
(a) Non-income producing security.
ADR—American Depositary Receipt
AG—Aktiengesellschaft is a German term that refers to a corporation that is limited by shares, i.e., owned by shareholders.
ASA—Allmennaksjeselskap is the Norwegian term for a public limited company.
NV—Naamloze Vennootschap is the Dutch term for a public limited liability corporation.
PLC—Public Limited Company
The accompanying notes are an integral part of these financial statements.
68
Alpine Foundation Fund
Schedule of Portfolio Investments
October 31, 2013
| | | Security | | |
| Shares | | Description | | Value | |
| | | | | | | | | |
| Common Stocks—69.9% | | | | |
| Aerospace & Defense—2.8% | | | | |
| | 15,000 | | | The Boeing Co. | | $ | 1,957,500 | |
| Capital Markets—0.3% | | | | |
| | 2,000 | | | Ameriprise Financial, Inc. | | | 201,080 | |
| Chemicals—3.0% | | | | |
| | 20,000 | | | E.I. du Pont de Nemours & Co. | | | 1,224,000 | |
| | 12,000 | | | Eastman Chemical Co. | | | 945,480 | |
| | | | | | | | 2,169,480 | |
| Commercial Banks—3.3% | | | | |
| | 5,000 | | | PNC Financial Services Group, Inc. | | | 367,650 | |
| | 5,000 | | | Signature Bank (a) | | | 509,100 | |
| | 8,675 | | | Southside Bancshares, Inc. | | | 236,828 | |
| | 7,293 | | | Susquehanna Bancshares, Inc. | | | 85,948 | |
| | 44,728 | | | Valley National Bancorp | | | 436,098 | |
| | 8,000 | | | Washington Trust Bancorp, Inc. | | | 263,120 | |
| | 10,432 | | | Wells Fargo & Co. | | | 445,342 | |
| | | | | | | | 2,344,086 | |
| Commercial Services & Supplies—1.3% | | | | |
| | 20,000 | | | Deluxe Corp. | | | 941,800 | |
| Computers & Peripherals—1.7% | | | | |
| | 2,000 | | | Apple, Inc. | | | 1,044,700 | |
| | 7,000 | | | Hewlett-Packard Co. | | | 170,590 | |
| | | | | | | | 1,215,290 | |
| Consumer Finance—0.5% | | | | |
| | 5,000 | | | Capital One Financial Corp. | | | 343,350 | |
| Diversified Financial Services—7.0% | | | | |
| | 63,041 | | | Bank of America Corp. | | | 880,053 | |
| | 14,367 | | | Citigroup, Inc. | | | 700,822 | |
| | 10,000 | | | CME Group, Inc. | | | 742,100 | |
| | 45,600 | | | JPMorgan Chase & Co. | | | 2,350,224 | |
| | 20,406 | | | Medallion Financial Corp. | | | 309,763 | |
| | | | | | | | 4,982,962 | |
| Diversified Telecommunication Services—0.8% | | | | |
| | 66,185 | | | TeliaSonera AB | | | 548,473 | |
| Electric Utilities—2.5% | | | | |
| | 9,900 | | | American Electric Power Co., Inc. | | | 463,716 | |
| | 5,000 | | | Duke Energy Corp. | | | 358,650 | |
| | 13,000 | | | FirstEnergy Corp. | | | 492,310 | |
| | 17,800 | | | Hawaiian Electric Industries, Inc. | | | 472,946 | |
| | | | | | | | 1,787,622 | |
| Electrical Equipment—0.5% | | | | |
| | 4,300 | | | Preformed Line Products Co. | | | 361,286 | |
| Food & Staples Retailing—4.1% | | | | |
| | 15,000 | | | CVS Caremark Corp. | | | 933,900 | |
| | 25,000 | | | Safeway, Inc. | | | 872,500 | |
| | 15,000 | | | Walgreen Co. | | | 888,600 | |
| | 5,000 | | | Weis Markets, Inc. | | | 255,850 | |
| | | | | | | | 2,950,850 | |
| Gas Utilities—0.3% | | | | |
| | 5,400 | | | Northwest Natural Gas Co. | | | 234,522 | |
| Health Care Equipment & Supplies—1.8% | | | | |
| | 8,600 | | | Becton, Dickinson & Co. | | | 904,118 | |
| | 4,000 | | | Zimmer Holdings, Inc. | | | 349,880 | |
| | | | | | | | 1,253,998 | |
| Health Care Providers & Services—0.9% | | | | |
| | 4,000 | | | McKesson Corp. | | | 625,360 | |
| Household Durables—1.4% | | | | |
| | 28,000 | | | Lennar Corp.—Class A | | | 995,400 | |
| Shares | | Security
Description | | Value | |
| | | | | |
| Common Stocks—continued | | |
| Household Products—1.8% | | | | |
| | 8,000 | | | Colgate-Palmolive Co. | | $ | 517,840 | |
| | 10,000 | | | Orchids Paper Products Co. | | | 305,000 | |
| | 6,000 | | | The Procter & Gamble Co. | | | 484,500 | |
| | | | | | | | 1,307,340 | |
| Industrial Conglomerates—2.7% | | | | |
| | 74,600 | | | General Electric Co. | | | 1,950,044 | |
| Insurance—1.2% | | | | |
| | 5,000 | | | The Chubb Corp. | | | 460,400 | |
| | 10,000 | | | Validus Holdings, Ltd. | | | 394,800 | |
| | | | | | | | 855,200 | |
| IT Services—3.0% | | | | |
| | 5,000 | | | Accenture PLC—Class A | | | 367,500 | |
| | 10,000 | | | International Business Machines Corp. | | | 1,792,100 | |
| | | | | | | | 2,159,600 | |
| Machinery—0.8% | | | | |
| | 5,000 | | | Caterpillar, Inc. | | | 416,800 | |
| | 10,000 | | | Wabash National Corp. (a) | | | 116,600 | |
| | | | | | | | 533,400 | |
| Media—1.6% | | | | |
| | 7,692 | | | CBS Corp.—Class B | | | 454,905 | |
| | 20,000 | | | Cinemark Holdings, Inc. | | | 656,200 | |
| | | | | | | | 1,111,105 | |
| Multi-Utilities—0.9% | | | | |
| | 50,000 | | | Just Energy Group, Inc. | | | 354,865 | |
| | 10,000 | | | NiSource, Inc. | | | 315,200 | |
| | | | | | | | 670,065 | |
| Office Electronics—0.8% | | | | |
| | 55,000 | | | Xerox Corp. | | | 546,700 | |
| Oil, Gas & Consumable Fuels—1.4% | | | | |
| | 5,000 | | | Murphy Oil Corp. | | | 301,600 | |
| | 17,547 | | | World Fuel Services Corp. | | | 669,418 | |
| | | | | | | | 971,018 | |
| Pharmaceuticals—4.8% | | | | |
| | 7,000 | | | Abbott Laboratories | | | 255,850 | |
| | 7,000 | | | AbbVie, Inc. | | | 339,150 | |
| | 27,000 | | | Johnson & Johnson | | | 2,500,470 | |
| | 8,000 | | | Teva Pharmaceutical Industries, Ltd.—ADR | | | 296,720 | |
| | | | | | | | 3,392,190 | |
| Real Estate Investment Trusts—12.6% | | | | |
| | 10,000 | | | American Capital Agency Corp. | | | 217,200 | |
| | 4,000 | | | American Tower Corp. | | | 317,400 | |
| | 13,000 | | | Boston Properties, Inc. | | | 1,345,500 | |
| | 100,000 | | | CBL & Associates Properties, Inc. | | | 1,981,000 | |
| | 13,804 | | | DDR Corp. | | | 233,978 | |
| | 20,000 | | | Digital Realty Trust, Inc. | | | 953,200 | |
| | 5,669 | | | Prologis, Inc. | | | 226,476 | |
| | 976 | | | Silver Bay Realty Trust Corp. | | | 15,089 | |
| | 23,823 | | | Simon Property Group, Inc. | | | 3,681,845 | |
| | | | | | | | 8,971,688 | |
| Real Estate Management & Development—0.8% | | | | |
| | 15,000 | | | Alexander & Baldwin, Inc. (a) | | | 555,000 | |
| Road & Rail—0.7% | | | | |
| | 2,500 | | | AMERCO | | | 504,825 | |
The accompanying notes are an integral part of these financial statements.
69
Alpine Foundation Fund
Schedule of Portfolio Investments—Continued
October 31, 2013
| | Security | | |
| Shares | | Description | | Value | |
| | | | | | | | | |
| Common Stocks—continued | | | | |
| Specialty Retail—0.9% | | | | |
| | 5,000 | | | Brown Shoe Co., Inc. | | $ | 112,200 | |
| | 1,250 | | | Murphy U.S.A., Inc. (a) | | | 50,725 | |
| | 9,000 | | | Williams-Sonoma, Inc. | | | 471,960 | |
| | | | | | | | 634,885 | |
| Textiles, Apparel & Luxury Goods—2.1% | | | | |
| | 5,000 | | | PVH Corp. | | | 622,850 | |
| | 4,000 | | | VF Corp. | | | 860,000 | |
| | | | | | | | 1,482,850 | |
| Thrifts & Mortgage Finance—0.3% | | | | |
| | 15,000 | | | People’s United Financial, Inc. | | | 216,450 | |
| Trading Companies & Distributors—1.3% | | | | |
| | 1,500 | | | Watsco, Inc. | | | 142,935 | |
| | 3,000 | | | WW Grainger, Inc. | | | 806,910 | |
| | | | | | | | 949,845 | |
| | | | | Total Common Stocks
(Cost $40,033,707) | | | 49,725,264 | |
| Principal | | Security | | |
| Amount | | Description | | Value | |
| | | | | | | | | |
| Bonds—22.0% | | | | |
| U.S. Treasury Bonds—22.0% | | | | |
| $ | 6,000,000 | | | 6.000%, 02/15/2026 | | $ | 7,980,000 | |
| | 4,000,000 | | | 5.250%, 11/15/2028 | | | 5,036,876 | |
| | 3,000,000 | | | 3.000%, 05/15/2042 | | | 2,659,686 | |
| | | | | | | | 15,676,562 | |
| | | | | Total Bonds
(Cost $14,814,104) | | | 15,676,562 | |
| Short-Term Investments—3.3% | | | | |
| | 2,343,000 | | | State Street Eurodollar Time Deposit, 0.01% | | | 2,343,000 | |
| | | | | Total Short-Term Investments
(Cost $2,343,000) | | | 2,343,000 | |
Total Investments
(Cost $57,190,811)—95.2% | | | 67,744,826 | |
| Other Assets in Excess of Liabilities—4.8% | | | 3,393,375 | |
| TOTAL NET ASSETS 100.0% | | $ | 71,138,201 | |
Percentages are stated as a percent of net assets.
(a) Non-income producing security.
AB—Aktiebolag is the Swedish equivalent of a corporation.
ADR—American Depositary Receipt
PLC—Public Limited Company
The accompanying notes are an integral part of these financial statements.
70
Alpine Ultra Short Tax Optimized Income Fund
Schedule of Portfolio Investments
October 31, 2013
| Principal | | Security | | |
| Amount | | Description | | Value | |
| | | | | | | | | |
| Municipal Bonds—104.1% | | | | |
| Alabama—3.4% | | | | |
| $ | 8,000,000 | | | Chatom Industrial Development Board Gulf Opportunity Zone Revenue, Powersouth Energy Cooperative—Series A, VRDN
0.550%, 11/15/2038
(Putable on 11/15/2013) (a) | | $ | 8,000,000 | |
| | 2,000,000 | | | Chatom Industrial Development Board Pollution Control Revenue, Electric—Series C, VRDN
0.550%, 12/01/2024
(Putable on 12/01/2013) (a) | | | 2,000,080 | |
| | 2,650,000 | | | Health Care Authority for Baptist
Health—Series B, VRDN
0.750%, 11/15/2037
(Putable on 11/01/2013) (a) | | | 2,650,000 | |
| | 10,000,000 | | | Health Care Authority for Baptist
Health Revenue—Series B, VRDN
0.500%, 11/01/2042
(Putable on 11/07/2013) (a) | | | 10,000,000 | |
| | 5,575,000 | | | Mobile Downtown Redevelopment Authority Revenue, Lafayette Plaza Hotel Project—Series A, VRDN (LOC: Regions Bank)
0.600%, 05/01/2032
(Putable on 11/07/2013) (a) | | | 5,575,000 | |
| | 3,952,000 | | | State Housing Finance Authority Revenue, Multi-Family Housing Revenue, Phoenix Apartments Project—Series A, VRDN (LOC: Regions Bank)
0.720%, 01/01/2036
(Putable on 11/07/2013) (a) | | | 3,952,000 | |
| | 8,345,000 | | | State Port Authority Docks Facilities Revenue, VRDN (CS: NATL-RE)
0.560%, 10/01/2024
(Putable on 11/07/2013) (a) | | | 8,345,000 | |
| | 1,765,000 | | | The Medical Clinic Board of the City of Gulf Shores Revenue, Colonial Pinnacle MOB Project, VRDN (LOC: Regions Bank)
0.550%, 07/01/2034
(Putable on 11/07/2013) (a) | | | 1,765,000 | |
| | | | | | | | 42,287,080 | |
| Arizona—6.9% | | | | |
| | 17,900,000 | | | Cochise County Pollution Control Corp. Revenue, Arizona Electric Power Cooperative, Inc. Project, VRDN
(CS: National Rural Utilities Corp.)
0.650%, 09/01/2024
(Putable on 03/01/2014) (a) | | | 17,901,611 | |
| | 9,775,000 | | | Maricopa County Pollution Control Corp. Pollution Control Revenue, Palo Verde Project— Series A, VRDN
(CS: Arizona Public Service Co.)
6.000%, 05/01/2029
(Putable on 05/01/2014) (a) | | | 10,027,391 | |
| Principal | | Security | | |
| Amount | | Description | | Value | |
| | | | | | | | | |
| Municipal Bonds—continued | | | | |
| Arizona—continued | | | | |
| $ | 35,000,000 | | | Phoenix Industrial Development Authority Solid Waste Revenue, Republic Services, Inc. Project, VRDN
0.950%, 12/01/2035
(Putable on 11/01/2013) (a) | | $ | 35,000,000 | |
| | 850,000 | | | State Health Facilities Authority Hospital System Revenue, Phoenix Children’s Hospital, Series A
(CS: Phoenix Children’s Hospital)
2.000%, 02/01/2015 | | | 855,814 | |
| | 16,520,000 | | | State Health Facilities Authority Revenue, The Terraces, VRDN (LOC: Sovereign Bank N.A.)
0.780%, 12/01/2037
(Putable on 11/07/2013) (a) | | | 16,520,000 | |
| | 5,140,000 | | | Yavapai County Industrial Development Authority Solid Waste Disposal Revenue, Waste Management, Inc. Project, Series A-2, VRDN
0.850%, 03/01/2028
(Putable on 03/03/2014) (a) | | | 5,145,037 | |
| | | | | | | | 85,449,853 | |
| Arkansas—0.4% | | | | |
| | 4,635,000 | | | Pulaski County Public Facilities Board Revenue, Anthony School, VRDN (LOC: Regions Bank)
0.600%, 06/01/2033
(Putable on 11/07/2013) (a) | | | 4,635,000 | |
| California—9.9% | | | | |
| | 425,000 | | | ABAG Finance Authority for Nonprofit Corp. Revenue, Eskaton Properties, Inc.
2.000%, 11/15/2013 | | | 425,136 | |
| | | | | ABAG Finance Authority for Nonprofit Corp., Episcopal Senior Communities—Series B | | | | |
| | 670,000 | | | 2.000%, 07/01/2014 | | | 673,658 | |
| | 820,000 | | | 3.000%, 07/01/2015 | | | 838,401 | |
| | 5,270,000 | | | City of Los Angeles Multifamily Housing Revenue, Masselin Manor Project—Series J, VRDN (LOC: Bank of America N.A.)
0.990%, 07/01/2015
(Putable on 11/07/2013) (a) | | | 5,270,000 | |
| | 6,000,000 | | | County of Sacramento, Certificates of Participation
5.000%, 02/01/2014 | | | 6,060,360 | |
| | 7,075,000 | | | Palomar Pomerado Health Care— Series A, ARN
(CS: Assured Guaranty Municipal)
0.850%, 11/01/2036
(Putable on 11/05/2013) (a) | | | 7,075,000 | |
| | 1,600,000 | | | Palomar Pomerado Health Care— Series B, ARN
(CS: Assured Guaranty Municipal)
0.900%, 11/01/2036
(Putable on 11/06/2013) (a) | | | 1,600,000 | |
The accompanying notes are an integral part of these financial statements.
71
Alpine Ultra Short Tax Optimized Income Fund
Schedule of Portfolio Investments—Continued
October 31, 2013
Principal
Amount | | | Security
Description | | Value | |
| | | | | | | |
| Municipal Bonds—continued | | | | |
| California—continued | | | | |
| $ | 4,600,000 | | | Palomar Pomerado Health Care— Series C, ARN
(CS: Assured Guaranty Municipal)
0.900%, 11/01/2036
(Putable on 11/07/2013) (a) | | $ | 4,600,000 | |
| | 370,000 | | | State Health Facilities Financing Authority Revenue, Children’s Hospital of Los Angeles—Series A
5.000%, 11/15/2015 | | | 389,303 | |
| | 34,000,000 | | | State Pollution Control Finance Authority Solid Waste Revenue, Republic Services, Inc.—Series A, VRDN
(CS: Republic Services, Inc.)
0.950%, 08/01/2023
(Putable on 11/01/2013) (a) | | | 34,000,000 | |
| | 2,000,000 | | | State Pollution Control Financing Authority, Solid Waste Disposal Revenue—Series A, VRDN
(CS: Waste Management, Inc.)
0.850%, 11/01/2038
(Putable on 05/01/2014) (a) | | | 2,000,880 | |
| | 3,000,000 | | | State Pollution Control Financing Authority, Solid Waste Disposal Revenue, P & D Dairy and Poso Creek Family Dairy, LLC Project, VRDN (LOC: Bank of the West)
1.280%, 05/01/2028
(Putable on 11/07/2013) (a) | | | 3,000,000 | |
| | 870,000 | | | State Statewide Communities Development Authority Industrial Development Revenue—Series A, VRDN
1.650%, 06/01/2020
(Putable on 11/06/2013) (a) | | | 870,000 | |
| | 1,935,000 | | | State Statewide Communities Development Authority, Ltd. Obligation Revenue, Bakersfield Reassessment District
2.000%, 09/02/2014 | | | 1,938,928 | |
| | | | | State Statewide Communities Development Authority Revenue, Episcopal Communities & Services | | | | |
| | 540,000 | | | 2.000%, 05/15/2014 | | | 541,469 | |
| | 545,000 | | | 3.000%, 05/15/2015 | | | 555,802 | |
| | 52,325,000 | | | Stockton Public Financing Authority Water Revenue, Delta Water Supply Project—Series A, VRDN (LOC: Union Bank)
0.750%, 10/01/2040
(Putable on 11/07/2013) (a) | | | 52,325,000 | |
| | | | | | | | 122,163,937 | |
| Colorado—0.9% | | | | |
| | 9,460,000 | | | Arkansas River Power Authority Power Revenue, VRDN
(CS: XLCA, LIQ FAC: Dexia Credit)
0.510%, 10/01/2026
(Putable on 11/07/2013) (a) | | | 9,460,000 | |
| | 1,355,000 | | | State Health Facilities Authority Revenue, Covenant Retirement Communities, Inc.—Series C
2.000%, 12/01/2013 | | | 1,355,542 | |
Principal
Amount | | | Security
Description | | | Value | |
| | | | | | | | |
| Municipal Bonds—continued | | | | |
| Colorado—continued | | | | |
| $ | 350,000 | | | State Health Facilities Authority Revenue, National Jewish Health Project
4.000%, 01/01/2014 | | $ | 351,134 | |
| | | | | | | | 11,166,676 | |
| Connecticut—0.2% | | | | |
| | 1,890,000 | | | City of New Haven, General Obligation Bond—Series B
2.000%, 09/01/2014 | | | 1,901,548 | |
| | 145,000 | | | City of West Haven, General Obligation Bond
4.000%, 08/01/2014 | | | 147,081 | |
| | | | | | | | 2,048,629 | |
| Delaware—0.0%* | | | | |
| | 300,000 | | | Delaware Health Facilities Authority Revenue, Nanticoke Memorial Hospital Project
4.000%, 07/01/2014 | | | 304,080 | |
| Florida—5.7% | | | | |
| | 250,000 | | | City of Tampa Hospital Refunding Revenue, H. Lee Moffitt Cancer Center Project—Series B
3.000%, 07/01/2014 | | | 253,272 | |
| | 34,075,000 | | | Miami-Dade County Expressway Authority Toll System Revenue, Series DCL-2012-005, VRDN
(CS: AMBAC)
0.778%, 05/20/2029
(Putable on 11/01/2013) (a) | | | 34,075,000 | |
| | 1,000,000 | | | Miami-Dade County Industrial Development Authority Revenue, Waste Management, Inc., VRDN (CS: Waste Management, Inc.)
2.625%, 08/01/2023
(Putable on 08/01/2014) (a) | | | 1,013,560 | |
| | 400,000 | | | Palm Beach County Health Facilities Authority Revenue, Jupiter Medical Center, Inc. Project— Series A (CS: Jupiter Medical Center Obligation Group)
2.000%, 11/01/2013 | | | 400,000 | |
| | 33,290,000 | | | Puttable Floating Option Tax-Exempt Receipts, Certificate of Participation, Series 4615, VRDN
(CS: Dexia Credit Local; LIQ FAC: Dexia Credit Local)
0.480%, 08/01/2029
(Putable on 11/07/2013) (a) | | | 33,290,000 | |
| | 700,000 | | | Saint Johns County Industrial Development Authority, Coastal Health Care Investor, VRDN (LOC: SunTrust Bank)
2.750%, 12/01/2016
(Putable on 11/07/2013) (a) | | | 700,000 | |
| | 155,000 | | | State Higher Educational Facilities Financial Authority Revenue, Nova Southeastern University
Project—Series A
(CS: Nova Southeastern University)
3.000%, 04/01/2014 | | | 156,245 | |
The accompanying notes are an integral part of these financial statements.
72
Alpine Ultra Short Tax Optimized Income Fund
Schedule of Portfolio Investments—Continued
October 31, 2013
Principal
Amount | | | Security
Description | | Value | |
| | | | | | | |
| Municipal Bonds—continued | | | | |
| Florida—continued | | | | |
| $ | 300,000 | | | State Higher Educational Facilities Financing Authority Revenue, The University of Tampa Project— Series A
4.000%, 04/01/2014 | | $ | 302,820 | |
| | | | | | | | 70,190,897 | |
| Georgia—1.0% | | | | |
| | 1,100,000 | | | Douglas County Development Authority Revenue, Electrical Fiber Systems, VRDN (LOC: Regions Bank)
0.810%, 12/01/2021
(Putable on 11/07/2013) (a) | | | 1,100,000 | |
| | 500,000 | | | Main Street Natural Gas, Inc., Gas Project Revenue—Series B
5.000%, 03/15/2014 | | | 506,965 | |
| | 1,600,000 | | | Rome-Floyd County Development Authority Revenue, Steel King Industries, Inc., VRDN (LOC: Bank of Montreal)
0.730%, 07/01/2020
(Putable on 11/07/2013) (a) | | | 1,600,000 | |
| | 9,430,000 | | | Walker Dade & Catoosa Counties Hospital Authority, Anticipation Certificates, Hutcheson Medical, VRDN (LOC: Regions Bank)
0.550%, 10/01/2028
(Putable on 11/07/2013) (a) | | | 9,430,000 | |
| | | | | | | | 12,636,965 | |
| Guam—0.1% | | | | |
| | 100,000 | | | International Airport Authority Revenue—Series A
3.000%, 10/01/2014 | | | 101,488 | |
| | 150,000 | | | International Airport Authority Revenue—Series B
3.000%, 10/01/2014 | | | 152,232 | |
| | 500,000 | | | International Airport Authority Revenue—Series C
3.000%, 10/01/2014 | | | 504,685 | |
| | | | | | | | 758,405 | |
| Hawaii—0.6% | | | | |
| | 5,000,000 | | | State Health System Corp. Maui Regional System Revenue, Bond Anticipation Notes, Series 2013
2.250%, 02/01/2015 | | | 5,001,100 | |
| | 2,750,000 | | | State Housing Finance & Development Corp., Multifamily Housing Revenue, Wilikina Apartments
Project—Series B
1.000%, 06/01/2014 | | | 2,750,632 | |
| | | | | | | | 7,751,732 | |
| Illinois—5.7% | | | | |
| | 63,470,000 | | | Chicago Board of Education,— Series—DCL-2012-001, VRDN (LOC: Dexia Credit Local)
0.928%, 12/01/2034
(Putable on 11/01/2013) (a) | | | 63,470,000 | |
Principal
Amount | | | Security
Description | | Value | |
| | | | | | | |
| Municipal Bonds—continued | | | | |
| Illinois—continued | | | | |
| $ | 4,400,000 | | | Springfield Airport Authority, Allied-Signal, Inc., VRDN (CS: Honeywell Int.)
5.000%, 09/01/2018
(Putable on 11/06/2013) (a) | | $ | 4,400,000 | |
| | 2,350,000 | | | State Development Finance Authority Industrial Development Revenue, Durex Industries Project, VRDN (LOC: RBS Citizens N.A.)
0.570%, 12/01/2023
(Putable on 11/06/2013) (a) | | | 2,350,000 | |
| | | | | | | | 70,220,000 | |
| Indiana—5.7% | | | | |
| | 1,000,000 | | | City of Indianapolis Industrial Development Revenue, Joint Clutch Service, VRDN (LOC: PNC Bank N.A.)
1.070%, 12/01/2014
(Putable on 11/07/2013) (a) | | | 1,000,000 | |
| | 3,065,000 | | | City of Terre Haute Sanitation District
4.000%, 01/01/2014 | | | 3,075,819 | |
| | 59,915,000 | | | Reset Optional Certificates Trust II-R Revenue, VRDN (LIQ FAC; Guaranty Agreement: CitiGroup Financial)
1.000%, 10/26/2017
(Putable on 11/07/2013) | | | 59,915,000 | |
| | 6,435,000 | | | State Finance Authority Environmental Improvement Revenue, Mittal Steel U.S.A., Inc., Project, VRDN (LOC: Bano Bilbao Vizcaya)
0.550%, 08/01/2030
(Putable on 11/07/2013) (a) | | | 6,435,000 | |
| | | | | | | | 70,425,819 | |
| Iowa—0.1% | | | | |
| | 1,200,000 | | | State Higher Education Loan Authority Revenue, University Dubuque—Series A
(CS: University Of Dubuque)
3.000%, 05/15/2014 | | | 1,213,572 | |
| Kansas—0.2% | | | | |
| | 1,000,000 | | | City of Dodge City Industrial Development Revenue, Farmland National Beef Packing Co., L.P. Project, VRDN (LOC: Rabobank Int.)
1.280%, 03/01/2027
(Putable on 11/07/2013) (a) | | | 1,000,000 | |
| | 1,000,000 | | | City of Liberal Industrial Development Revenue, Farmland National Beef Packing Co., L.P. Project, VRDN (LOC: Rabobank Int.)
1.280%, 02/01/2029
(Putable on 11/07/2013) (a) | | | 1,000,000 | |
| | | | | | | | 2,000,000 | |
| Kentucky—0.6% | | | | |
| | 2,000,000 | | | Lexington-Fayette Urban County Government Revenue, Richmond Place Associates, L.P Project, VRDN (LOC: Bank of America N.A.)
0.650%, 04/01/2015
(Putable on 04/01/2014) (a) | | | 2,000,000 | |
The accompanying notes are an integral part of these financial statements.
73
Alpine Ultra Short Tax Optimized Income Fund
Schedule of Portfolio Investments—Continued
October 31, 2013
Principal
Amount | | | Security
Description | | Value | |
| | | | | | | |
| Municipal Bonds—continued | | | | |
| Kentucky—continued | | | | |
| $ | 6,000,000 | | | Pulaski County Solid Waste Disposal Revenue, National Rural Utilities—East Kentucky Power— Series B, VRDN (CS: National Rural Utilities Corp.)
0.650%, 08/15/2023
(Putable on 02/15/2014) (a) | | $ | 6,000,480 | |
| | | | | | | | 8,000,480 | |
| Louisiana—2.2% | | | | |
| | 1,630,000 | | | North Webster Parish Industrial Development Revenue, CSP Project, VRDN (LOC: Regions Bank)
2.300%, 09/01/2021
(Putable on 11/07/2013) (a) | | | 1,630,000 | |
| | 1,520,000 | | | Ouachita Parish Industrial Development Board, Garrett Manufacturing LLC, VRDN (LOC: Regions Bank)
0.810%, 12/01/2016
(Putable on 11/07/2013) (a) | | | 1,520,000 | |
| | 18,500,000 | | | Plaquemines Port Harbor & Terminal District Revenue, International Marine Terminal Project—Series A, VRDN (LOC: Wells Fargo Bank N.A.)
1.000%, 03/15/2025
(Putable on 03/17/2014) (a) | | | 18,504,625 | |
| | 250,000 | | | State Citizens Property Insurance Corp. Assessment Revenue,
2.000%, 06/01/2014 | | | 251,480 | |
| | 2,050,000 | | | State Housing Finance Agency Revenue, Multifamily Housing Restoration—Series A, VRDN (LOC: Regions Bank)
0.750%, 12/01/2032
(Putable on 11/07/2013) (a) | | | 2,050,000 | |
| | 2,625,000 | | | State Public Facilities Authority Revenue, Equipment & Capital Facilities Pooled—Loan B, VRDN (CS: Capital One; LOC: Hibernia National Bank)
0.640%, 07/01/2033
(Putable on 11/07/2013) (a) | | | 2,625,000 | |
| | 865,000 | | | State Public Facilities Authority Revenue, Equipment & Capital Facilities Pooled—Series B, VRDN (CS: Capital One; LOC: Hibernia National Bank)
0.640%, 07/01/2033
(Putable on 11/07/2013) (a) | | | 865,000 | |
| | | | | | | | 27,446,105 | |
| Maine—0.8% | | | | |
| | 9,985,000 | | | State Health & Higher Educational Facilities Authority Revenue,— Series H, VRDN (CS: Mercy Hospital; SPA: Wells Fargo Bank N.A.)
0.300%, 07/01/2036
(Putable on 11/06/2013) (a) | | | 9,985,000 | |
Principal
Amount | | | Security
Description | | Value | |
| | | | | | | |
| Municipal Bonds—continued | | | | |
| Maryland—0.0%* | | | | |
| $ | 250,000 | | | Maryland Economic Development Corp. Student Housing Revenue, Morgan State University Project
3.000%, 07/01/2014 | | $ | 251,128 | |
| Massachusetts—0.5% | | | | |
| | 1,000,000 | | | State Development Finance Agency, Waste Management, Inc.—Series B, VRDN
(CS: Waste Management, Inc.)
2.125%, 12/01/2029
(Putable on 12/01/2015) (a) | | | 1,012,290 | |
| | 5,179,336 | | | State Housing Finance Agency Revenue,—Series 2970, VRDN
0.980%, 07/01/2025
(Putable on 11/07/2013) (a) | | | 5,179,336 | |
| | | | | | | | 6,191,626 | |
| Michigan—1.9% | | | | |
| | 1,000,000 | | | City of Detroit Sewage Disposal System
Revenue—Series A
5.000%, 07/01/2014 | | | 1,001,920 | |
| | | | | | | | | |
| | 7,900,000 | | | City of Detroit Sewage Disposal System Revenue, Senior Lien— Series 1182, VRDN (LOC: RaboBank Nederland)
1.080%, 07/01/2029
(Putable on 11/07/2013) (a) | | | 7,900,000 | |
| | 300,000 | | | City of Detroit Sewage Disposal System Revenue, Senior Lien— Series A
5.000%, 07/01/2015 | | | 300,105 | |
| | 250,000 | | | Detroit Wayne County Stadium Authority Revenue, Wayne County Limited Tax General Obligation
5.000%, 10/01/2014 | | | 256,875 | |
| | 1,000,000 | | | State Finance Authority Revenue, Crittenton Hospital Medical
Center—Series A
4.000%, 06/01/2014 | | | 1,016,200 | |
| | | | | State Finance Authority Revenue, Detroit School District | | | | |
| | 500,000 | | | 4.000%, 06/01/2014 | | | 509,290 | |
| | 1,200,000 | | | 5.000%, 06/01/2014 | | | 1,229,124 | |
| | 10,000,000 | | | State Finance Authority, State Aid Revenue Notes—Series C
4.375%, 08/20/2014 | | | 10,040,100 | |
| | 2,000,000 | | | State Strategic Fund Limited Obligations Revenue, Waste Management, Inc.
1.500%, 08/01/2027
(Putable on 08/01/2014) (a) | | | 2,010,580 | |
| | | | | | | | 24,264,194 | |
| Mississippi—6.4% | | | | |
| | 68,000,000 | | | State Business Finance Corp. Revenue, PSL-North America LLC Project—Series A, VRDN
(CS: PSL-North America LLC)
2.610%, 11/01/2032
(Putable on 11/07/2013) (a) | | | 68,000,000 | |
The accompanying notes are an integral part of these financial statements.
74
Alpine Ultra Short Tax Optimized Income Fund
Schedule of Portfolio Investments—Continued
October 31, 2013
Principal
Amount | | | Security
Description | | Value | |
| | | | | | | |
| Municipal Bonds—continued | | | | |
| Mississippi—continued | | | | |
| $ | 6,495,000 | | | State Business Finance Corp., Hattiesburg Clinic Professional Association Project, VRDN (LOC: Regions Bank)
0.550%, 11/01/2026
(Putable on 11/07/2013) (a) | | $ | 6,495,000 | |
| | 4,680,000 | | | State Business Finance Corp., Tri-State Truck Center, Inc. Project, VRDN (LOC: Regions Bank)
0.600%, 03/01/2033
(Putable on 11/07/2013) (a) | | | 4,680,000 | |
| | | | | | | | 79,175,000 | |
| Missouri—0.1% | | | | |
| | 1,245,000 | | | State Health & Educational Facilities Authority Health Facilities Revenue, Freeman Health System
5.000%, 02/15/2015 | | | 1,291,688 | |
| Nebraska—0.1% | | | | |
| | 655,000 | | | Central Plains Energy Project, Gas Project Revenue (Project No. 3)
4.000%, 09/01/2014 | | | 671,866 | |
| New Hampshire—0.1% | | | | |
| | 1,000,000 | | | State Health & Education Facilities Authority Revenue, Catholic Medical Center
4.000%, 07/01/2014 | | | 1,017,620 | |
| New Jersey—5.8% | | | | |
| | 5,000,000 | | | City of Newark, General Obligation Bond—Series D
2.000%, 12/11/2013 | | | 5,003,700 | |
| | 4,500,000 | | | City of Newark, General Obligation Notes—Series B
1.500%, 06/26/2014 | | | 4,516,515 | |
| | 1,000,000 | | | City of Newark, School Promissory Notes—Series C
1.500%, 06/26/2014 | | | 1,003,670 | |
| | 1,080,000 | | | City of Newark, Special Emergency Notes—Series G
2.000%, 12/11/2013 | | | 1,081,339 | |
| | 6,000,000 | | | City of Newark, Tax Anticipation Notes—Series A
1.500%, 02/20/2014 | | | 6,002,580 | |
| | 9,795,000 | | | State Economic Development Authority Revenue, Arbor Glen of Bridgewater Project, VRDN (LOC: Sovereign Bank N.A.)
0.760%, 05/15/2033
(Putable on 11/07/2013) (a) | | | 9,795,000 | |
| | 36,300,000 | | | State Economic Development Authority Revenue, Port Newark Container Terminal LLC Project— Series—B, VRDN (LOC: Sovereign Bank N.A.)
1.200%, 07/01/2030
(Putable on 11/06/2017) (a) | | | 36,300,000 | |
| | 480,000 | | | State Health Care Facilities Financing Authority Revenue, Barnabas Health—Series A
4.000%, 07/01/2015 | | | 496,742 | |
Principal
Amount | | | Security
Description | | Value | |
| | | | | | | |
| Municipal Bonds—continued | | | | |
| New Jersey—continued | | | | |
| $ | 1,290,000 | | | State Health Care Facilities Financing Authority Revenue, Palisades Medical Center Obligation Group (CS: Palisades Medical Center Obligation Group)
4.000%, 07/01/2014 | | $ | 1,306,693 | |
| | | | | State Higher Education Student Assistance Authority Senior Student Loan Revenue—Series-1A | | | | |
| | 300,000 | | | 3.000%, 12/01/2013 | | | 300,585 | |
| | 500,000 | | | 4.000%, 12/01/2014 | | | 517,320 | |
| | 2,225,800 | | | Township of Irvington, General Obligation Notes
2.250%, 06/20/2014 | | | 2,232,878 | |
| | 3,320,000 | | | Township of Lyndhurst, Bond Anticipation Notes
1.750%, 03/20/2014 | | | 3,330,358 | |
| | 425,000 | | | Trenton Parking Authority Revenue, City Guaranteed— Series A (CS: Assured Guaranty)
1.500%, 04/01/2014 | | | 425,961 | |
| | | | | | | | 72,313,341 | |
| New York—10.8% | | | | |
| | 3,020,000 | | | City of Long Beach General Obligation Bond
3.000%, 12/20/2013 | | | 3,023,382 | |
| | 6,110,000 | | | City of Poughkeepsie, Bond Anticipation Notes—Series C
1.875%, 04/22/2014 | | | 6,133,646 | |
| | | | | City of Yonkers General Obligation Bond—Series A | | | | |
| | 500,000 | | | 2.000%, 07/01/2014 | | | 504,475 | |
| | 1,530,000 | | | 4.000%, 07/01/2015 | | | 1,606,194 | |
| | | | | City of Yonkers General Obligation Bond—Series C | | | | |
| | 1,000,000 | | | 2.000%, 08/15/2014 | | | 1,010,690 | |
| | 1,000,000 | | | 4.000%, 08/15/2015 | | | 1,053,260 | |
| | 385,000 | | | Nassau County Local Economic Assistance Corp. Revenue, South Nassau Communities Hospital Project
4.000%, 07/01/2014 | | | 393,012 | |
| | 1,000,000 | | | Nassau County Local Economic Assistance Corp. Revenue, Winthrop University Hospital Association Project
4.000%, 07/01/2014 | | | 1,019,610 | |
| | 1,000,000 | | | New York City Industrial Development Agency Airport Facilities Revenue, TrIPs Obligated Group—Series A
5.000%, 07/01/2014 | | | 1,019,880 | |
| | 14,825,000 | | | New York City Municipal Water Finance Authority, Water and Sewer System, Second General Resolution Revenue Bonds— Series AA-2, VRDN (SPA: Dexia Credit Local)
0.400%, 06/15/2032
(Putable on 11/01/2013) (a) | | | 14,825,000 | |
The accompanying notes are an integral part of these financial statements.
75
Alpine Ultra Short Tax Optimized Income Fund
Schedule of Portfolio Investments—Continued
October 31, 2013
| Principal | | | Security | | | |
| Amount | | | Description | | Value | |
| | | | | | | |
| Municipal Bonds—continued | | | | |
| New York—continued | | | | |
| $ | 9,750,000 | | | New York City Transitional Finance Authority Revenue, Future Tax Secured Bond—Series 2A, VRDN
0.400%, 11/01/2022
(Putable on 11/01/2013) (a) | | $ | 9,750,000 | |
| | 8,100,000 | | | New York City Transitional Finance Authority Revenue, Future Tax Secured Bond—Series A-3, VRDN (SPA: Dexia Credit Local)
0.400%, 08/01/2022
(Putable on 11/01/2013) (a) | | | 8,100,000 | |
| | 3,734,732 | | | Prattsburgh Central School District, Bond Anticipation Notes
1.000%, 06/27/2014 | | | 3,735,180 | |
| | 175,000 | | | Rockland County, Bond Anticipation Notes—Series A
2.000%, 04/09/2014 | | | 175,159 | |
| | 2,350,000 | | | Rockland County, Bond Anticipation Notes—Series B
2.000%, 06/05/2014 | | | 2,357,168 | |
| | 2,000,000 | | | Rockland County, Bond Anticipation Notes—Series C
2.250%, 04/09/2014 | | | 2,004,740 | |
| | 1,000,000 | | | Rockland County, Bond Anticipation Notes—Series D
2.500%, 04/09/2014 | | | 1,004,550 | |
| | 500,000 | | | Rockland County, General Obligation Bond—Series B
3.000%, 12/15/2014 | | | 512,310 | |
| | 31,500,000 | | | Rockland County, Revenue Anticipation Notes—Series B
1.750%, 06/27/2014 | | | 31,504,095 | |
| | 18,000,000 | | | Rockland County, Tax Anticipation Notes
2.250%, 03/14/2014 | | | 18,052,200 | |
| | 1,285,000 | | | State Dormitory Authority Revenue, Long Island University
3.000%, 09/01/2014 | | | 1,305,020 | |
| | 2,500,000 | | | Town of Oyster Bay, Bond Anticipation Notes—Series B
5.000%, 08/08/2014 | | | 2,581,325 | |
| | 7,000,000 | | | Town of Oyster Bay, Budget Notes—Series A
1.250%, 12/13/2013 | | | 7,007,070 | |
| | 10,000,000 | | | Town of Ramapo, Bond Anticipation Notes
4.700%, 05/28/2014 | | | 10,066,600 | |
| | 4,250,000 | | | Ulster County Industrial Development Agency, Civic Facility Revenue, Kingston Regional Senior Living Corp.—Woodland Pond At New Paltz Project—Series C, VRDN (LOC: Sovereign Bank N.A.)
0.760%, 09/15/2037
(Putable on 11/07/2013) (a) | | | 4,250,000 | |
| | 500,000 | | | Westchester Tobacco Asset Securitization Corp.
(CS: Westchester Tobacco)
5.000%, 06/01/2026 | | | 483,670 | |
| | | | | | | | 133,478,236 | |
| Principal | | | Security | | | |
| Amount | | | Description | | Value | |
| | | | | | | |
| Municipal Bonds—continued | | | | |
| North Carolina—0.6% | | | | |
| $ | 7,000,000 | | | State Capital Facilities Finance Agency, Solid Waste Disposal Revenue, Republic Services, Inc. Project—Series B, VRDN
(CS: Republic Services, Inc.)
0.900%, 12/01/2020
(Putable on 12/02/2013) (a) | | $ | 7,000,210 | |
| Ohio—2.8% | | | | |
| | 1,415,000 | | | City of Marysville, Tax Increment Financing Revenue Notes, City Gate Development (LOC: Fifth Third Bank)
2.250%, 08/27/2014 | | | 1,423,674 | |
| | 3,005,000 | | | City of Marysville, Tax Increment Financing Revenue Notes, Coleman’s Crossing Development (LOC: Fifth Third Bank)
2.250%, 08/27/2014 | | | 3,023,421 | |
| | 7,490,000 | | | Columbus Regional Airport Authority Revenue, West Bay Apartments Project, VRDN (LOC: Sovereign Bank N.A.)
0.830%, 12/01/2034
(Putable on 11/07/2013) (a) | | | 7,490,000 | |
| | 5,800,000 | | | Coventry Local School District
1.750%, 01/15/2014 | | | 5,809,454 | |
| | 475,000 | | | Fairfield County Hospital Facilities Revenue, Fairfield Medical Center Project
(CS: Fairfield Medical Center)
3.000%, 06/15/2014 | | | 479,460 | |
| | 400,000 | | | Lorain Port Authority Revenue, Bond Anticipation Notes, Land Reutilization Project
2.500%, 11/06/2013 | | | 400,100 | |
| | 7,000,000 | | | State Air Quality Development Authority Revenue, Columbus Southern Power Co.—Series A
(CS: FirstEnergy Generation Corp.)
5.700%, 02/01/2014 | | | 7,074,410 | |
| | 9,000,000 | | | State Water Development Authority, Solid Waste Revenue, VRDN
(CS: Waste Management, Inc.)
2.250%, 11/01/2022
(Putable on 11/02/2015) (a) | | | 9,096,660 | |
| | | | | | | | 34,797,179 | |
| Oklahoma—0.0%* | | | | |
| | 250,000 | | | Comanche County Hospital Authority Revenue,—Series A
4.000%, 07/01/2014 | | | 253,070 | |
| Oregon—0.0%* | | | | |
| | | | | Multnomah County Hospital Facilities Authority Revenue, Terwilliger Plaza, Inc. | | | | |
| | 400,000 | | | 2.000%, 12/01/2013 | | | 400,180 | |
| | 150,000 | | | 2.000%, 12/01/2014 | | | 150,332 | |
| | | | | | | | 550,512 | |
The accompanying notes are an integral part of these financial statements.
76
Alpine Ultra Short Tax Optimized Income Fund
Schedule of Portfolio Investments—Continued
October 31, 2013
| Principal | | | Security | | | |
| Amount | | | Description | | Value | |
| | | | | | | |
| Municipal Bonds—continued | | | | |
| Pennsylvania—7.0% | | | | |
| $ | 5,235,000 | | | Allegheny County Airport Authority Revenue, VRDN (CS: NATL-RE)
0.560%, 01/01/2021
(Putable on 11/07/2013) (a) | | $ | 5,235,000 | |
| | 59,600,000 | | | Emmaus General Authority Revenue, VRDN (SPA: Wells Fargo Bank N.A.)
0.300%, 12/01/2028
(Putable on 11/06/2013) (a) | | | 59,600,000 | |
| | 270,000 | | | Northampton County Industrial Development Authority Revenue, Morningstar Senior Living, Inc. Project
2.400%, 07/01/2014 | | | 269,978 | |
| | 5,085,000 | | | Puttable Floating Option Tax- Exempt Receipts Revenue, Allegheny County Airport Authority, VRDN (CS: NATL-RE)
0.490%, 01/01/2022
(Putable on 11/07/2013) (a) | | | 5,085,000 | |
| | 2,000,000 | | | State Economic Development Financing Authority Revenue, Waste Management, Inc., VRDN (CS: Waste Management, Inc.)
1.750%, 12/01/2033
(Putable on 12/01/2015) (a) | | | 2,009,340 | |
| | 15,000,000 | | | State Economic Development Financing Authority Solid Waste Disposal Revenue, Waste Management, Inc., VRDN
0.950%, 08/01/2045
(Putable on 11/01/2013) (a) | | | 15,000,000 | |
| | | | | | | | 87,199,318 | |
| Puerto Rico—10.2% | | | | |
| | 8,000,000 | | | Government Development Bank for Puerto Rico Revenue (CS: NATL-RE)
4.750%, 12/01/2015 | | | 7,899,040 | |
| | 2,825,000 | | | Government Development Bank for Puerto Rico Revenue, Commonwealth Development Bank—Series B
5.000%, 12/01/2013 | | | 2,830,028 | |
| | | | | Puerto Rico Industrial Tourist Educational Medical & Environmental Control Facilities Financing Authority Revenue, Universidad Sacred Heart Project | | | | |
| | 250,000 | | | 3.000%, 10/01/2014 | | | 246,833 | |
| | 250,000 | | | 4.000%, 10/01/2015 | | | 247,913 | |
| | 4,905,000 | | | Puerto Rico Public Buildings Authority Revenue, Government Facilities—Series M
(CS: Commonwealth of Puerto Rico)
5.750%, 07/01/2014 | | | 4,897,103 | |
| | 2,370,000 | | | Puttable Floating Option Tax-Exempt Receipts, VRDN (LOC: Dexia Credit Local)
0.640%, 07/01/2030
(Putable on 11/07/2013) (a) | | | 2,370,000 | |
| Principal | | | Security | | | |
| Amount | | | Description | | Value | |
| | | | | | | |
| Municipal Bonds—continued | | | | |
| Puerto Rico—continued | | | | |
| $ | 10,020,000 | | | Puttable Floating Option Tax-Exempt Receipts,— Series 4147, VRDN (SPA: Dexia Credit Local)
0.640%, 07/01/2033
(Putable on 11/07/2013) (a) | | $ | 10,020,000 | |
| | 29,020,000 | | | State Commonwealth Highway & Transportation Authority Revenue, VRDN (CS: NATL-RE)
0.640%, 07/01/2035
(Putable on 11/07/2013) (a) | | | 29,020,000 | |
| | 500,000 | | | State Commonwealth Industrial Tourist Educational Medical & Environmental Control Facilities Financing Authority Revenue, International American University Project
4.000%, 10/01/2014 | | | 507,160 | |
| | | | | State Commonwealth Public Improvement Refunding, General Obligation Bonds— Series A (CS: NATL-RE) | | | | |
| | 4,365,000 | | | 5.250%, 07/01/2014 | | | 4,346,929 | |
| | 725,000 | | | 5.500%, 07/01/2014 | | | 726,145 | |
| | 14,915,000 | | | State Commonwealth Public Improvement, General Obligation Bonds—Series A-2, VRDN (SPA: JPMorgan Chase Bank NA)
1.250%, 07/01/2029
(Putable on 11/07/2013) (a) | | | 14,915,000 | |
| | 750,000 | | | State Commonwealth, General Obligation Bonds
6.500%, 07/01/2014 | | | 752,827 | |
| | 900,000 | | | State Electric Power Authority Power Revenue—Series JJ
5.250%, 07/01/2014 | | | 899,991 | |
| | 3,800,000 | | | State Electric Power Authority Power Revenue—Series WW
5.250%, 07/01/2014 | | | 3,784,268 | |
| | 8,790,000 | | | State Highway & Transportation Authority Transportation Revenue, VRDN
(CS: CIFG)
0.670%, 07/01/2041
(Putable on 11/07/2013) (a) | | | 8,790,000 | |
| | 11,120,000 | | | State Highways & Transportation Authority Revenue,—Series 2148, VRDN (LOC: Government Development Bank for Puerto Rico)
1.230%, 07/01/2041
(Putable on 11/07/2013) (a) | | | 11,120,000 | |
| | 4,000,000 | | | State Infrastructure Financing Authority Revenue, Ports Authority Project—Series C, VRDN (LOC: Government Development Bank for Puerto Rico)
3.000%, 12/15/2026
(Putable on 12/15/2013) (a) | | | 3,980,720 | |
| | 1,000,000 | | | State Municipal Finance Agency Revenue—Series B
5.000%, 07/01/2014 | | | 1,003,520 | |
The accompanying notes are an integral part of these financial statements.
77
Alpine Ultra Short Tax Optimized Income Fund
Schedule of Portfolio Investments—Continued
October 31, 2013
| Principal | | | Security | | | |
| Amount | | | Description | | Value | |
| | | | | | | |
| Municipal Bonds—continued | | | | |
| Puerto Rico—continued | | | | |
| $ | 2,425,000 | | | State Public Buildings Authority Revenue, Government Facilities—Series H
(CS: FGIC, Commonwealth of Puerto Rico)
5.250%, 07/01/2014 | | $ | 2,413,433 | |
| | 5,000,000 | | | University of Puerto Rico Revenue—Series P
5.000%, 06/01/2014 | | | 4,950,350 | |
| | | | | University of Puerto Rico Revenue—Series Q | | | | |
| | 5,585,000 | | | 5.000%, 06/01/2014 | | | 5,529,541 | |
| | 4,835,000 | | | 5.000%, 06/01/2015 | | | 4,695,897 | |
| | | | | | | | 125,946,698 | |
| Rhode Island—0.1% | | | | |
| | 900,000 | | | Rhode Island Health & Educational Building Corp. Revenue, Hospital Financing Revenue, Lifespan Obligated Group Issue—Series A
(CS: Assured Guaranty Municipal)
5.000%, 05/15/2015 | | | 958,419 | |
| South Carolina—0.1% | | | | |
| | 1,000,000 | | | State Jobs-Economic Development Authority Industrial Revenue, Waste Management Project, VRDN (CS: Waste Management, Inc.)
2.250%, 11/01/2016
(Putable on 11/01/2013) | | | 1,000,000 | |
| Tennessee—3.1% | | | | |
| | 555,000 | | | City of Jackson Health Educational & Housing Facility Board Multifamily Revenue, Creekside Apartments Project, VRDN (LOC: First Tennessee Bank)
2.000%, 12/01/2017 (a)
(Putable on 12/01/2013) | | | 555,000 | |
| | 7,950,000 | | | Franklin Public Building Authority Revenue, Local Government Public Improvement— Series-101-A-1, VRDN (SPA: DEPFA Bank PLC)
0.620%, 06/01/2037
(Putable on 11/01/2013) | | | 7,950,000 | |
| | 17,000,000 | | | Lewisburg Industrial Development Board Solid Waste Disposal Revenue, Waste Management, Inc. of Tennessee Project, VRDN (CS: Waste Management, Inc.)
0.950%, 07/02/2035
(Putable on 11/01/2013) (a) | | | 17,000,000 | |
| | 170,000 | | | Metropolitan Government Nashville & Davidson County Health & Educational Facilities Board Revenue, The Blakeford at Green Hills,
2.000%, 07/01/2014 | | | 170,717 | |
| Principal | | | Security | | | |
| Amount | | | Description | | Value | |
| | | | | | | |
| Municipal Bonds—continued | | | | |
| Tennessee—continued | | | | |
| $ | 2,830,000 | | | Metropolitan Government Nashville & Davidson County Health & Educational Facilities Board Revenue, Wedgewood—Series A, VRDN (LOC: Regions Bank)
0.750%, 06/01/2034
(Putable on 11/01/2013) (a) | | $ | 2,830,000 | |
| | 6,000,000 | | | Metropolitan Government Nashville & Davidson County Industrial Development Board Exempt Revenue, Waste Management, Inc. of Tennessee Project
1.500%, 08/01/2031
(Putable on 08/01/2014) (a) | | | 6,031,740 | |
| | 4,250,000 | | | Metropolitan Government Nashville & Davidson County Industrial Development Board Revenue, Rodgers Welch Venture, VRDN (LOC: Regions Bank)
2.230%, 12/01/2014
(Putable on 11/05/2013) (a) | | | 4,250,000 | |
| | | | | | | | 38,787,457 | |
| Texas—4.1% | | | | |
| | 9,000,000 | | | Mission Economic Development Corp. Solid Waste Disposal Revenue, Republic Services, Inc., VRDN
0.950%, 01/01/2026
(Putable on 11/01/2013) (a) | | | 9,000,000 | |
| | 10,000,000 | | | Mission Economic Development Corp. Solid Waste Disposal Revenue, Waste Management, Inc. (CS: Waste Management, Inc.)
1.500%, 08/01/2020
(Putable on 08/01/2014) (a) | | | 10,052,900 | |
| | | | | State Municipal Gas Acquisition & Supply Corp. III Gas Supply Revenue,—Series 2012
(CS: Bank of New York Mellon Trust Co.) | | | | |
| | 1,500,000 | | | 3.000%, 12/15/2013 | | | 1,503,210 | |
| | 1,500,000 | | | 5.000%, 12/15/2014 | | | 1,558,290 | |
| | 2,000,000 | | | 5.000%, 12/15/2015 | | | 2,138,840 | |
| | 9,000,000 | | | Texas Transportation Commission Turnpike System Revenue,— Series B, VRDN
1.250%, 08/15/2042
(Putable on 02/15/2015) (a) | | | 9,025,020 | |
| | 13,190,000 | | | Weslaco Health Facilities Development Corp., Knapp Medical Center—Series A, VRDN (LOC: Compass Bank)
0.730%, 06/01/2038
(Putable on 11/07/2013) (a) | | | 13,190,000 | |
| | 4,155,000 | | | Weslaco Health Facilities Development Corp., Knapp Medical Center—Series B, VRDN (LOC: Compass Bank)
0.730%, 06/01/2031
(Putable on 11/07/2013) (a) | | | 4,155,000 | |
| | | | | | | | 50,623,260 | |
The accompanying notes are an integral part of these financial statements.
78
Alpine Ultra Short Tax Optimized Income Fund
Schedule of Portfolio Investments—Continued
October 31, 2013
| Principal | | | Security | | | |
| Amount | | | Description | | Value | |
| | | | | | | |
| Municipal Bonds—continued | | | | |
| Virginia—5.8% | | | | |
| $ | 70,350,000 | | | Capital Beltway Funding Corp., Hot Lanes—Series B, VRDN (LOC: Banco Espirito Santo SA)
1.300%, 12/31/2047
(Putable on 11/07/2013) | | $ | 70,350,000 | |
| | 1,000,000 | | | Gloucester County Industrial Development Authority Solid Waste Disposal Revenue, Waste Management, Inc., VRDN (CS: Waste Management, Inc.)
5.125%, 09/01/2038
(Putable on 05/01/2014) (a) | | | 1,021,260 | |
| | | | | | | | 71,371,260 | |
| Wyoming—0.2% | | | | |
| | 2,855,000 | | | Gillette Environmental Improvement Revenue, Black Hills Power and Light Co.—Series A, VRDN (CS: Black Hills Power and Light Co.)
0.750%, 06/01/2024
(Putable on 11/06/2013) (a) | | | 2,855,000 | |
| | | | | Total Municipal Bonds
(Cost $1,289,637,214) | | | 1,288,681,312 | |
| | | | Security | | | |
| Shares | | | Description | | Value | |
| | | | | | | | |
| Money Market Funds—0.0% (b) | | | | |
| 69,171 | | | BlackRock Liquidity Funds:
MuniCash Portfolio, 0.01% | | $ | 69,171 | |
| | | | Total Money Market Funds
(Cost $69,171) | | | 69,171 | |
| | | | | | | | |
Total Investments
(Cost $1,289,706,385)—104.1% | | | 1,288,750,483 | |
| Liabilities in Excess of Other Assets—(4.1)% | | | (50,264,252 | ) |
| TOTAL NET ASSETS 100.0% | | $ | 1,238,486,231 | |
Percentages are stated as a percent of net assets.
(a) Variable Rate Security—The rate reported is the rate in effect as of October 31, 2013.
(b) Amount is less than 0.05%.
AMBAC—American Municipal Bond Assurance Corp.
ARN—Auction Rate Note
CS—Credit Support
CSP—Continental Structural Plastics
FGIC—Federal Guaranty Insurance Co.
LIQ FAC—Liquidity Facility
LOC—Letter of Credit
NA—North America
PLC—Public Limited Company
SA—Generally designates corporations in various countries, mostly those employing the civil law
SPA—Standby Purchase Agreement
VRDN—Variable Rate Demand Note
XLCA—XI Capital Assurance, Inc.
The accompanying notes are an integral part of these financial statements.
79
Alpine Municipal Money Market Fund
Schedule of Portfolio Investments
October 31, 2013
| Principal | | | Security | | | |
| Amount | | | Description | | Value | |
| | | | | | | | | |
| Municipal Bonds—100.0% | | | | |
| California—1.7% | | | | |
| $ | 350,000 | | | Los Angeles Regional Airports Improvement Corp. Lease Revenue, Los Angeles International Airport, VRDN (LOC: Societe Generale)
0.450%, 12/01/2015
(Putable on 11/07/2013) (a) | | $ | 350,000 | |
| | 2,565,000 | | | Pollution Control Financing Authority Solid Waste Disposal Revenue, Alameda County Industries AR, Inc. Project, VRDN (LOC: Bank of West)
0.240%, 06/01/2037
(Putable on 11/07/2013) (a) | | | 2,565,000 | |
| | | | | | | | 2,915,000 | |
| Colorado—11.5% | | | | |
| | 1,505,000 | | | Housing & Finance Authority Economic Development Revenue, Corey Building LLC—Series A, VRDN (LOC: Wells Fargo Bank N.A.)
0.230%, 02/01/2029
(Putable on 11/07/2013) (a) | | | 1,505,000 | |
| | 2,790,000 | | | Housing & Finance Authority Economic Development Revenue, Monaco LLC—Series A, VRDN (LOC: UMB Bank N.A.)
0.230%, 12/01/2027
(Putable on 11/07/2013) (a) | | | 2,790,000 | |
| | 2,150,000 | | | Housing & Finance Authority Economic Development Revenue, Pacific Instruments Project, VRDN (LOC: Wells Fargo Bank N.A.)
0.280%, 08/01/2020
(Putable on 11/07/2013) (a) | | | 2,150,000 | |
| | 2,295,000 | | | Housing & Finance Authority Economic Development Revenue, Popiel Properties LLC Project— Series A, VRDN (LOC: UMB Bank N.A.)
0.330%, 12/01/2029
(Putable on 11/07/2013) (a) | | | 2,295,000 | |
| | 1,005,000 | | | Housing & Finance Authority Economic Development Revenue, Top Shop—Series A, VRDN (LOC: JPMorgan Chase Bank)
0.430%, 09/01/2035
(Putable on 11/07/2013) (a) | | | 1,005,000 | |
| | 1,352,000 | | | Jefferson County Industrial Development Revenue, Epi—Center LLC, VRDN (LOC: JPMorgan Chase Bank)
0.430%, 12/01/2025
(Putable on 11/07/2013) (a) | | | 1,352,000 | |
| | 200,000 | | | Midcities Metropolitan District No. 1 Special Revenue—Series B, VRDN (LOC: BNP Paribas)
0.230%, 12/01/2031
(Putable on 11/07/2013) (a) | | | 200,000 | |
| Principal | | | Security | | | |
| Amount | | | Description | | Value | |
| | | | | | | | | |
| Municipal Bonds—continued | | | | |
| Colorado—continued | | | | |
| $ | 8,260,000 | | | Traer Creek Metropolitan District Revenue, In the Town of Avon, VRDN (LOC: BNP Paribas)
0.450%, 10/01/2021
(Putable on 11/07/2013) (a) | | $ | 8,260,000 | |
| | | | | | | | 19,557,000 | |
| Florida—3.9% | | | | |
| | 750,000 | | | Broward County Housing Finance Authority Multi Revenue, Sailboat Bend Artist Lofts Project, VRDN (LOC: Citibank N.A.)
0.320%, 04/15/2038
(Putable on 11/07/2013) (a) | | | 750,000 | |
| | 3,435,000 | | | Manatee County Industrial Development Revenue, Gaemmerler U.S. Corp., VRDN (LOC: Wells Fargo Bank N.A.)
0.280%, 10/01/2035
(Putable on 11/07/2013) (a) | | | 3,435,000 | |
| | 2,400,000 | | | Sarasota County Industrial Development Revenue, Tervis Tumbler Co., VRDN (LOC: Bank of America N.A.)
0.340%, 11/01/2024
(Putable on 11/07/2013) (a) | | | 2,400,000 | |
| | | | | | | | 6,585,000 | |
| Illinois—10.7% | | | | |
| | 1,120,000 | | | City of East Moline, Rock Island County Industrial Development Revenue, Elliott Aviation, VRDN (LOC: U.S. Bank N.A.)
0.210%, 12/01/2019
(Putable on 11/07/2013) (a) | | | 1,120,000 | |
| | 500,000 | | | Des Plaines Industrial Development Revenue, MMP Properties LLC, VRDN (LOC: JPMorgan Chase Bank)
0.350%, 10/01/2018
(Putable on 11/07/2013) (a) | | | 500,000 | |
| | 8,000,000 | | | City of Chicago, Deutsche Bank Spears/Lifers Trust, Various States Gold—Series DBE—494, VRDN
(CS: Deutche Bank AG)
0.260%, 01/01/2029
(Putable on 11/07/2013) (a) | | | 8,000,000 | |
| | 1,100,000 | | | Elmhurst Industrial Development Revenue, John Sakash Co., Inc. Project, VRDN (LOC: Bank of America N.A.)
0.340%, 02/01/2025
(Putable on 11/07/2013) (a) | | | 1,100,000 | |
| | 1,000,000 | | | Finance Authority Industrial Development Revenue, 2500 DevelGroup LLC—Series A, VRDN (LOC: JPMorgan Chase Bank)
0.350%, 01/01/2021
(Putable on 11/07/2013) (a) | | | 1,000,000 | |
The accompanying notes are an integral part of these financial statements.
80
Alpine Municipal Money Market Fund
Schedule of Portfolio Investments—Continued
October 31, 2013
| Principal | | | Security | | | |
| Amount | | | Description | | Value | |
| | | | | | | | | |
| Municipal Bonds—continued | | | | |
| Illinois—continued | | | | |
| $ | 955,000 | | | Finance Authority Industrial Development Revenue, Alpha Beta Press, Inc.—Series A, VRDN (LOC: JPMorgan Chase Bank)
0.350%, 06/01/2020
(Putable on 11/07/2013) (a) | | $ | 955,000 | |
| | 345,000 | | | Finance Authority Industrial Development Revenue, Church Road Partnership, VRDN (LOC: JPMorgan Chase Bank)
0.350%, 10/01/2017
(Putable on 11/07/2013) (a) | | | 345,000 | |
| | 1,875,000 | | | Finance Authority Industrial Development Revenue, Industrial Steel Construction, Inc., VRDN (LOC: JPMorgan Chase Bank)
0.350%, 07/15/2023
(Putable on 11/07/2013) (a) | | | 1,875,000 | |
| | 535,000 | | | Finance Authority Industrial Development Revenue, Merug LLC—Series B, VRDN (LOC: JPMorgan Chase Bank)
0.350%, 12/01/2018
(Putable on 11/07/2013) (a) | | | 535,000 | |
| | 200,000 | | | State Development Finance Authority Industrial Development Revenue, Durex Industries Project, VRDN (LOC: RBS Citizens N.A.)
0.570%, 12/01/2023
(Putable on 11/07/2013) (a) | | | 200,000 | |
| | 335,000 | | | Village of Hanover Park Industrial Development Revenue, Spectra-Tech, Inc. Project, VRDN (LOC: BMO Harris Bank N.A.)
0.530%, 08/01/2017
(Putable on 11/07/2013) (a) | | | 335,000 | |
| | 2,250,000 | | | Village of Woodridge Du Page Will & Cook Counties Industrial Development Revenue, Home Run Inn Frozen Food, VRDN (LOC: JPMorgan Chase Bank)
0.350%, 10/01/2025
(Putable on 11/07/2013) (a) | | | 2,250,000 | |
| | | | | | | | 18,215,000 | |
| Indiana—4.4% | | | | |
| | 605,000 | | | City of South Bend Economic Development Revenue, Dynamic R.E.H.C., Inc. Project, VRDN (LOC: KeyBank N.A.)
0.700%, 09/01/2020
(Putable on 11/07/2013) (a) | | | 605,000 | |
| | 5,000,000 | | | Posey County Economic Development Revenue, Midwest Fertilizer Corp. Project—Series A
(CS: Midwest Fertilizer Corp.)
0.550%, 07/01/2046
(Putable on 04/10/2014) (a) | | | 5,000,000 | |
| Principal | | | Security | | | |
| Amount | | | Description | | Value | |
| | | | | | | | | |
| Municipal Bonds—continued | | | | |
| Indiana—continued | | | | |
| $ | 1,970,000 | | | State Development Finance Authority Development Revenue, TTP, Inc. Project, VRDN (LOC: Bank of America N.A.)
0.300%, 02/01/2026
(Putable on 11/07/2013) (a) | | $ | 1,970,000 | |
| | | | | | | | 7,575,000 | |
| Louisiana—2.4% | | | | |
| | 2,635,000 | | | Caddo-Bossier Parishes Port Commission Revenue, Oakley Louisiana, Inc., VRDN (LOC: Bank of America N.A.)
0.460%, 01/01/2028
(Putable on 11/07/2013) (a) | | | 2,635,000 | |
| | 1,500,000 | | | Plaquemines Port Harbor & Terminal District Revenue, International Marine Terminal Project—Series A (LOC: Wells Fargo Bank N.A.)
1.000%, 03/15/2025
(Putable on 03/17/2014) (a) | | | 1,500,000 | |
| | | | | | | | 4,135,000 | |
| Michigan—8.6% | | | | |
| | 200,000 | | | Sterling Heights Economic Development Corp. Revenue, Kunath Enterprises LLC, VRDN (LOC: JPMorgan Chase Bank)
0.550%, 02/01/2016
(Putable on 11/07/2013) (a) | | | 200,000 | |
| | 790,000 | | | Strategic Fund Limited Obligation Revenue, Dawnbreakers LLC, VRDN (LOC: Fifth Third Bank)
0.240%, 05/01/2018
(Putable on 11/07/2013) (a) | | | 790,000 | |
| | 1,400,000 | | | Strategic Fund Limited Obligation Revenue, Envelope Printery, Inc., VRDN (LOC: Fifth Third Bank)
0.260%, 03/01/2027
(Putable on 11/07/2013) (a) | | | 1,400,000 | |
| | 6,430,000 | | | Strategic Fund Limited Obligation Revenue, Glastender, Inc., VRDN (LOC: JPMorgan Chase Bank)
0.250%, 11/01/2023
(Putable on 11/07/2013) (a) | | | 6,430,000 | |
| | 5,600,000 | | | Strategic Fund Limited Obligation Revenue, Sacred Heart Rehabilitation Center, VRDN (LOC: Fifth Third Bank)
0.240%, 03/01/2037
(Putable on 11/07/2013) (a) | | | 5,600,000 | |
| | 300,000 | | | Strategic Fund Limited Obligations Revenue, Warren Screw Products, Inc., VRDN (LOC: JPMorgan Chase Bank)
0.550%, 09/01/2016
(Putable on 11/07/2013) (a) | | | 300,000 | |
| | | | | | | | 14,720,000 | |
The accompanying notes are an integral part of these financial statements.
81
Alpine Municipal Money Market Fund
Schedule of Portfolio Investments—Continued
October 31, 2013
| Principal | | | Security | | | |
| Amount | | | Description | | Value | |
| | | | | | | |
| Municipal Bonds—continued | | | | |
| New Hampshire—4.1% | | | | |
| $ | 7,000,000 | | | County of Merrimack, Tax Anticipation Notes
(CS: Merrimack County)
1.250%, 12/27/2013 | | $ | 7,008,591 | |
| New Jersey—1.8% | | | | |
| | 3,000,000 | | | Hudson County Improvement Authority, Guaranteed Pooled Notes—Series Q-1
(CS: Hudson County, NJ)
2.000%, 07/25/2014 | | | 3,029,318 | |
| New Mexico—3.3% | | | | |
| | 565,000 | | | Albuquerque Industrial Development Revenue, Karsten Co.—Series A, VRDN (LOC: U.S. Bank N.A.)
0.220%, 12/01/2017
(Putable on 11/07/2013) (a) | | | 565,000 | |
| | 5,000,000 | | | Santa Fe County Education Facility Revenue, Archdioceses of Santa Fe School Project—Series A, VRDN (LOC: U.S. Bank N.A.)
0.230%, 06/01/2028
(Putable on 11/07/2013) (a) | | | 5,000,000 | |
| | | | | | | | 5,565,000 | |
| New York—0.9% | | | | |
| | 915,000 | | | Erie County Industrial Development Agency Revenue, Heritage Centers Project, VRDN (LOC: KeyBank N.A.)
0.240%, 09/01/2018
(Putable on 11/07/2013) (a) | | | 915,000 | |
| | 560,000 | | | New York City Industrial Development Agency, Allway Tools, Inc., VRDN (LOC: CitiBank N.A.)
0.380%, 08/01/2017
(Putable on 11/07/2013) (a) | | | 560,000 | |
| | | | | | | | 1,475,000 | |
| North Carolina—4.2% | | | | |
| | 7,100,000 | | | Davidson County Industrial Facilities & Pollution Control Financing Authority Revenue, Dieboid, Inc., VRDN (LOC: Bank of America N.A.)
0.380%, 06/01/2017
(Putable on 11/07/2013) (a) | | | 7,100,000 | |
| Ohio—2.4% | | | | |
| | 200,000 | | | City of Marysville, Tax Increment Financing Revenue, City Gate Development (LOC: Fifth Third Bank)
2.250%, 08/27/2014 | | | 201,209 | |
| | 1,735,000 | | | City of Parma Health Care Facilities Revenue, Catholic Charities Facilities Corp., VRDN (LOC: RBS Citizens N.A.)
0.300%, 10/01/2029
(Putable on 11/07/2013) (a) | | | 1,735,000 | |
| Principal | | | Security | | | |
| Amount | | | Description | | Value | |
| | | | | | | | | |
| Municipal Bonds—continued | | | | |
| Ohio—continued | | | | |
| $ | 2,090,000 | | | Stark County Industrial Development Authority, H-P Products, Inc., VRDN (LOC: KeyBank N.A.)
0.240%, 06/01/2018
(Putable on 11/07/2013) (a) | | $ | 2,090,000 | |
| | | | | | | | 4,026,209 | |
| Pennsylvania—3.6% | | | | |
| | 2,200,000 | | | Beaver County Industrial Development Authority, BASF Corp., VRDN
(CS: BASF Corp.)
0.230%, 09/01/2032
(Putable on 11/07/2013) (a) | | | 2,200,000 | |
| | 4,000,000 | | | Washington County Hospital Authority Revenue, Washington Hospital—Series A (LOC: PNC Bank N.A.)
0.500%, 07/01/2037
(Putable on 07/01/2014) (a) | | | 4,000,000 | |
| | | | | | | | 6,200,000 | |
| South Carolina—1.4% | | | | |
| | 2,400,000 | | | State Jobs—Economic Development Authority, Dorris Properties LLC Project, VRDN (LOC: TD Bank N.A.)
0.170%, 07/01/2032
(Putable on 11/07/2013) (a) | | | 2,400,000 | |
| Tennessee—5.6% | | | | |
| | 7,500,000 | | | Hendersonville Industrial Development Board— Series A, VRDN (LOC: Fifth Third Bank)
0.240%, 05/01/2036
(Putable on 11/07/2013) (a) | | | 7,500,000 | |
| | 2,100,000 | | | Union City Industrial Development Board, Industrial Development Revenue, Kohler Co. Project, VRDN (LOC: Wells Fargo Bank N.A.)
0.280%, 10/01/2020
(Putable on 11/07/2013) (a) | | | 2,100,000 | |
| | | | | | | | 9,600,000 | |
| Texas—15.8% | | | | |
| | 2,600,000 | | | Dallam County Industrial Development Corp., Rick & Janice Van Ryan, VRDN (LOC: Wells Fargo Bank N.A.)
0.280%, 07/01/2037
(Putable on 11/07/2013) (a) | | | 2,600,000 | |
| | 3,250,000 | | | Fort Bend County Industrial Development Corp., Aaron Rents, Inc., VRDN (LOC: Wells Fargo Bank N.A.)
0.280%, 01/01/2026
(Putable on 11/07/2013) (a) | | | 3,250,000 | |
The accompanying notes are an integral part of these financial statements.
82
Alpine Municipal Money Market Fund
Schedule of Portfolio Investments—Continued
October 31, 2013
| Principal | | | Security | | | |
| Amount | | | Description | | Value | |
| | | | | | | |
| Municipal Bonds—continued | | | | |
| Texas—continued | | | | |
| $ | 8,500,000 | | | Jefferson County Industrial Development Corp. Revenue, Jefferson Refinery LLC—Series A
(CS: Branch Bank & Trust, Jefferson Refinery LLC)
0.450%, 12/01/2040
(Putable on 12/19/2013) (a) | | $ | 8,500,000 | |
| | 5,600,000 | | | Port Arthur Navigation District Revenue, BASF Corp., VRDN (CS: BASF Corp.)
0.230%, 04/01/2033
(Putable on 11/07/2013) (a) | | | 5,600,000 | |
| | 7,000,000 | | | Port of Corpus Christi Authority of Nueces County, Solid Waste Disposal Revenue, Flint Hills Resources LP, West Plant Project—Series A, VRDN (CS: Flint Hills Resources LP)
0.090%, 07/01/2029
(Putable on 11/07/2013) (a) | | | 7,000,000 | |
| | | | | | | | 26,950,000 | |
| Utah—1.1% | | | | |
| | 1,860,000 | | | City of West Jordan Industrial Development Revenue, PenCo Products, Inc., VRDN (LOC: KeyBank N.A.)
0.570%, 04/01/2019
(Putable on 11/07/2013) (a) | | | 1,860,000 | |
| Washington—6.3% | | | | |
| | 920,000 | | | Economic Development Finance Authority, Art & Theresa Mensonides—Series I, VRDN (LOC: Wells Fargo Bank N.A.)
0.280%, 10/01/2016
(Putable on 11/07/2013) (a) | | | 920,000 | |
| | 1,400,000 | | | Economic Development Finance Authority, Belina Interiors, Inc.—Series E, VRDN (LOC: KeyBank N.A.)
1.000%, 08/01/2033
(Putable on 11/07/2013) (a) | | | 1,400,000 | |
| | 1,110,000 | | | Economic Development Finance Authority, Belina Interiors, Inc.—Series F, VRDN (LOC: KeyBank N.A.)
1.000%, 11/01/2023
(Putable on 11/07/2013) (a) | | | 1,110,000 | |
| | 2,745,000 | | | Economic Development Finance Authority, Wesmar Co., Inc. Project—Series F, VRDN (LOC: U.S. Bank N.A.)
0.230%, 07/01/2032
(Putable on 11/07/2013) (a) | | | 2,745,000 | |
| | 2,680,000 | | | Port Bellingham Industrial Development Corp., Wood Stone Corp., VRDN (LOC: KeyBank N.A.)
0.240%, 02/01/2027
(Putable on 11/07/2013) (a) | | | 2,680,000 | |
| Principal | | | Security | | | |
| Amount | | | Description | | Value | |
| | | | | | | |
| Municipal Bonds—continued | | | | |
| Washington—continued | | | | |
| $ | 1,900,000 | | | Seattle Housing Authority Revenue, Douglas Apartments, VRDN (LOC: KeyBank N.A.)
0.230%, 06/01/2040
(Putable on 11/07/2013) (a) | | $ | 1,900,000 | |
| | | | | | | | 10,755,000 | |
| Wisconsin—6.3% | | | | |
| | 2,645,000 | | | City of Baraboo, Industrial Development Revenue, Series 2007, Teel Plastics, Inc., Project, VRDN (LOC: BMO Harris Bank N.A.)
0.430%, 11/01/2042
(Putable on 11/07/2013) (a) | | | 2,645,000 | |
| | 1,000,000 | | | Mequon Industrial Development Revenue, Gateway Plastics, Inc.—Series A, VRDN (LOC: JPMorgan Chase Bank)
0.350%, 08/01/2026
(Putable on 11/07/2013) (a) | | | 1,000,000 | |
| | 1,695,000 | | | Mequon Industrial Development Revenue, SPI Lighting, VRDN (LOC: BMO Harris Bank N.A.)
0.430%, 12/01/2023
(Putable on 11/07/2013) (a) | | | 1,695,000 | |
| | 500,000 | | | Milwaukee Redevelopment Authority, Kubin Nicholson Corp. Project—Series A, VRDN (LOC: BMO Harris Bank N.A.)
0.430%, 08/01/2020
(Putable on 11/07/2013) (a) | | | 500,000 | |
| | 925,000 | | | Rhinelander Industrial Development Revenue, Super Diesel/SDI Properties, VRDN (LOC: JPMorgan Chase Bank)
0.390%, 07/01/2021
(Putable on 11/07/2013) (a) | | | 925,000 | |
| | 2,925,000 | | | Village of Menomonee Falls Industrial Development Revenue, AJ Die-Namics Project, VRDN (LOC: BMO Harris Bank N.A.)
0.430%, 11/01/2036
(Putable on 11/07/2013) (a) | | | 2,925,000 | |
| | 1,000,000 | | | Wausau Industrial Development Revenue, Apogee Enterprises, Inc., VRDN (LOC: Comerica Bank)
0.260%, 03/01/2022
(Putable on 11/07/2013) (a) | | | 1,000,000 | |
| | | | | | | | 10,690,000 | |
| Total Municipal Bonds (Cost $170,361,118) | | | 170,361,118 | |
The accompanying notes are an integral part of these financial statements.
83
Alpine Municipal Money Market Fund
Schedule of Portfolio Investments—Continued
October 31, 2013
| | | | Security | | | |
| Shares | | | Description | | Value | |
| | | | | | | | | |
| Money Market Funds—0.0% (b) | | | | |
| | 47,645 | | | BlackRock Liquidity Funds:
MuniCash Portfolio, 0.01% | | $ | 47,645 | |
| | | | | Total Money Market Funds
(Cost $47,645) | | | 47,645 | |
Total Investments
(Cost $170,408,763)—100.0% | | | 170,408,763 | |
| Other Assets in Excess of Liabilities—0.0% (b) | | | 4,081 | |
| TOTAL NET ASSETS 100.0% | | $ | 170,412,844 | |
Percentages are stated as a percent of net assets.
| (a) | Variable Rate Security—The rate reported is the rate in effect as of October 31, 2013. |
| (b) | Amount is less than 0.05%. |
AG—Aktiengesellschaft is a German term that refers to a corporation that is limited by shares, i.e., owned by shareholders.
CS—Credit Support
LOC—Letter of Credit
VRDN—Variable Rate Demand Note
The accompanying notes are an integral part of these financial statements.
84
Alpine High Yield Managed Duration Municipal Fund
Schedule of Portfolio Investments
October 31, 2013
| Principal | | Security | | | |
| Amount | | Description | | Value | |
| | | | | | | | | |
| Municipal Bonds—95.9% | | | | |
| Alabama—5.3% | | | | |
| | | | | Jefferson County Ltd. Obligation School Warrants—Series A | | | | |
| $ | 820,000 | | | 5.250%, 01/01/2014 | | $ | 820,008 | |
| | 250,000 | | | 5.250%, 01/01/2017 | | | 250,335 | |
| | | | | | | | 1,070,343 | |
| California—1.5% | | | | |
| | 300,000 | | | Foothill-Eastern Transportation Corridor Agency Revenue, Capital Appreciation
5.850%, 01/15/2023 | | | 303,822 | |
| Colorado—1.2% | | | | |
| | 250,000 | | | Colorado Health Facilities Authority Revenue, Covenant Retirement Communities, Inc.—Series B
3.150%, 12/01/2018 | | | 247,565 | |
| Florida—2.2% | | | | |
| | 200,000 | | | City of Atlantic Beach, Health Care Facilities Revenue—Series A
5.000%, 11/15/2021 | | | 211,364 | |
| | 200,000 | | | City Of Tampa, Solid Waste System Revenue
(CS: Assured Guaranty Municipal)
5.000%, 10/01/2020 | | | 221,880 | |
| | | | | | | | 433,244 | |
| Guam—1.3% | | | | |
| | 250,000 | | | State International Airport Authority Revenue—Series C
5.000%, 10/01/2021 | | | 263,328 | |
| Illinois—9.3% | | | | |
| | 155,000 | | | Chicago Board of Education, Dedicated Revenues
(CS: Assured Guaranty Municipal)
5.000%, 12/01/2022 | | | 159,475 | |
| | 210,000 | | | City of Chicago—Series A
4.000%, 01/01/2020 | | | 211,672 | |
| | 150,000 | | | City of Chicago, Projects—Series A
4.000%, 01/01/2019 | | | 154,360 | |
| | 50,000 | | | State of Illinois, General Obligation Refunding Bond
5.000%, 08/01/2021 | | | 54,301 | |
| | 1,090,000 | | | State of Illinois, General Obligation Refunding Bond—Series A (CS: NATL-RE)
5.250%, 10/01/2015 | | | 1,093,717 | |
| | 180,000 | | | Stephenson County Revenue (CS: AMBAC)
4.500%, 12/01/2020 | | | 178,596 | |
| | | | | | | | 1,852,121 | |
| Iowa—1.7% | | | | |
| | 350,000 | | | Iowa Finance Authority, Midwestern Disaster Area Revenue
(CS: Iowa Fertilizer Co.)
5.000%, 12/01/2019 | | | 339,126 | |
| Kansas—1.5% | | | | |
| | 300,000 | | | Overland Park Development Corp. Revenue, Second Tier Convention Center Hotel—Series B
5.125%, 01/01/2022 | | | 303,066 | |
| Principal | | | Security | | | |
| Amount | | | Description | | Value | |
| | | | | | | |
| Municipal Bonds—continued | | | | |
| Louisiana—1.2% | | | | |
| $ | 250,000 | | | Parish of State Charles, Gulf Opportunity Zone Revenue (CS: Valero Energy Corp.)
4.000%, 12/01/2040
(Putable on 06/01/2022) | | $ | 249,060 | |
| Massachusetts—3.2% | | | | |
| | 200,000 | | | State Development Finance Agency Revenue—Series B-3
4.000%, 11/15/2017 | | | 200,268 | |
| | 450,000 | | | State Port Authority Facilities Revenue, Delta Air Lines, Inc. Project—Series A (CS: Delta Air Lines, Inc.)
5.000%, 01/01/2021 | | | 440,968 | |
| | | | | | | | 641,236 | |
| Michigan—8.8% | | | | |
| | | | | City of Detroit, Sewage Disposal System Revenue—Series B (CS: NATL-RE) | | | | |
| | 150,000 | | | 5.000%, 07/01/2014 | | | 150,096 | |
| | 50,000 | | | 5.000%, 07/01/2015 | | | 50,036 | |
| | 50,000 | | | 5.500%, 07/01/2015 | | | 50,587 | |
| | 100,000 | | | City of Detroit, Water Supply System Revenue—Series A (CS: NATL-RE)
6.000%, 07/01/2015 | | | 101,960 | |
| | 500,000 | | | State Finance Authority, St. AID Revenue—Series C
4.375%, 08/20/2014 | | | 502,005 | |
| | 500,000 | | | State Strategic Fund Limited Obligations Revenue, Waste Management, Inc.
1.500%, 08/01/2027
(Putable on 08/01/2014) (a) | | | 502,645 | |
| | 200,000 | | | State Strategic Fund Revenue, United Methodist Retirement Communities, Inc. Project
(CS: United Methodist Retirement Communities, Inc.)
5.125%, 11/15/2025 | | | 196,738 | |
| | 250,000 | | | State Tobacco Settlement Finance Authority Revenue—Series A
5.125%, 06/01/2022 | | | 210,407 | |
| | | | | | | | 1,764,474 | |
| Minnesota—3.2% | | | | |
| | 345,000 | | | City of Minneapolis, Health Care Facilities Refunding Revenue Bonds, Providence Project—Series A
(CS: Senior Care Providence)
5.500%, 10/01/2014 | | | 346,552 | |
| | 300,000 | | | City of Oak Park Heights, Nursing Home Revenue, Boutwells Landing Care Center Project
(CS: VSSA Care Center LLC)
4.000%, 02/01/2020 | | | 300,642 | |
| | | | | | | | 647,194 | |
The accompanying notes are an integral part of these financial statements.
85
Alpine High Yield Managed Duration Municipal Fund
Schedule of Portfolio Investments—Continued
October 31, 2013
Principal
Amount | | | Security
Description | | Value | |
| | | | | | | |
| Municipal Bonds—continued | | | |
| New Jersey—3.4% | | | | |
| $ | 450,000 | | | Tobacco Settlement Financing Corp. Revenue—Series A
4.500%, 06/01/2023 | | $ | 419,697 | |
| | 250,000 | | | Township of Irvington, General Obligation Notes
2.250%, 06/20/2014 | | | 250,795 | |
| | | | | | | | 670,492 | |
| New York—4.8% | | | | |
| | 140,000 | | | New York City Industrial Development Agency Revenue, American Airlines, Inc.
(CS: American Airlines, Inc.)
7.500%, 08/01/2016 | | | 147,886 | |
| | 500,000 | | | Rockland County, Revenue Anticipation Notes—Series B 1.750%, 06/27/2014 | | | 500,065 | |
| | 300,000 | | | State Dormitory Authority Revenue, Orange Regional Medical Center (CS: Orange Regional Medical Center)
6.000%, 12/01/2016 | | | 303,498 | |
| | | | | | | | 951,449 | |
| Ohio—3.1% | | | | |
| | 250,000 | | | Buckeye Tobacco Settlement Financing Authority Revenue—Series A
5.125%, 06/01/2024 | | | 213,538 | |
| | 250,000 | | | City of Cleveland, Airport Special Revenue, Continental Airlines, Inc. (CS: Continental Airlines, Inc.)
5.700%, 12/01/2019 | | | 245,100 | |
| | 200,000 | | | State Air Quality Development Authority Revenue, AK Steel Corp. Project (CS: AK Steel Corp.)
6.750%, 06/01/2024 | | | 161,386 | |
| | | | | | | | 620,024 | |
| Oklahoma—2.7% | | | | |
| | 400,000 | | | Tulsa Airports Improvement Trust Revenue, American Airlines, Inc. (CS: AMR Corp.)
6.250%, 06/01/2020 | | | 390,860 | |
| | 140,000 | | | Tulsa Industrial Authority Revenue—Series A
(CS: NATL-RE)
6.000%, 10/01/2016 | | | 149,054 | |
| | | | | | | | 539,914 | |
| Pennsylvania—1.8% | | | | |
| | 50,000 | | | Allegheny County Industrial Development Authority Revenue, Environmental Improvement Revenue Bonds (CS: US Steel Corp.)
6.500%, 05/01/2017 | | | 52,553 | |
| | 100,000 | | | City of Philadelphia, Gas Works Revenue, Ninth Series
4.000%, 08/01/2014 | | | 102,269 | |
Principal
Amount | | | Security
Description | | Value | |
| | | | | | | |
| Municipal Bonds—continued | | | |
| Pennsylvania—continued | | | | |
| $ | 200,000 | | | State Economic Development Financing Authority Revenue, Colver Project—Series F
(CS: Inter-Power/Ahlcon Partner)
5.000%, 12/01/2015 | | $ | 200,812 | |
| | | | | | | | 355,634 | |
| Puerto Rico—17.8% | | | | |
| | 100,000 | | | Commonwealth of Puerto Rico, General Obligation Bonds (CS: NATL-RE)
6.000%, 07/01/2015 | | | 100,930 | |
| | | | | Commonwealth of Puerto Rico, General Obligation Bonds—Series A (CS: NATL-RE) | | | | |
| | 300,000 | | | 5.000%, 07/01/2017 | | | 297,318 | |
| | 225,000 | | | 5.500%, 07/01/2016 | | | 224,872 | |
| | 285,000 | | | Government Development Bank for Puerto Rico Revenue (CS: NATL-RE)
4.750%, 12/01/2015
(Putable on 12/01/2013) | | | 281,403 | |
| | 200,000 | | | Puerto Rico Electric Power Authority Revenue—Series ZZ
5.000%, 07/01/2014 | | | 198,856 | |
| | 200,000 | | | Puerto Rico Electric Power Authority Revenue—Series OO
(CS: NATL-RE)
5.000%, 07/01/2014 | | | 199,680 | |
| | 430,000 | | | Puerto Rico Highways & Transportation Authority Revenue
5.250%, 07/01/2015 | | | 418,644 | |
| | 280,000 | | | Puerto Rico Highways & Transportation Authority Revenue, Unrefunded (CS: NATL-RE)
5.500%, 07/01/2015 | | | 280,134 | |
| | 270,000 | | | Puerto Rico Infrastructure Financing Authority Special Tax Revenue—Series C
5.500%, 07/01/2014 | | | 269,309 | |
| | 100,000 | | | Puerto Rico Municipal Finance Agency—Series A
(CS: Assured Guaranty Municipal)
5.250%, 08/01/2014 | | | 100,051 | |
| | 120,000 | | | Puerto Rico Public Buildings Authority Revenue, Government Facilities—Series C
5.750%, 07/01/2018 | | | 108,623 | |
| | 20,000 | | | Puerto Rico Public Buildings Authority Revenue, Government Facilities—Series M
(CS: Commonwealth of Puerto Rico)
5.750%, 07/01/2014 | | | 19,968 | |
| | 75,000 | | | Commonwealth of Puerto Rico Public Improvement Refunding, General Obligation Bonds—Series A
(CS: NATL-RE)
5.500%, 07/01/2014 | | | 75,119 | |
The accompanying notes are an integral part of these financial statements.
86
Alpine High Yield Managed Duration Municipal Fund
Schedule of Portfolio Investments—Continued
October 31, 2013
| Shares | | | Security
Description | | Value | |
| | | | | | | |
| Municipal Bonds—continued | | | | |
| Puerto Rico—continued | | | | |
| $ | 250,000 | | | Commonwealth of Puerto Rico, General Obligation Bonds
6.500%, 07/01/2014 | | $ | 250,942 | |
| | 180,000 | | | Puerto Rico Electric Power Authority Power Revenue—Series JJ (CS: NATL-RE)
5.250%, 07/01/2014 | | | 179,998 | |
| | 200,000 | | | Puerto Rico Electric Power Authority Power Revenue—Series WW
5.250%, 07/01/2014 | | | 199,172 | |
| | 360,000 | | | Puerto Rico Municipal Finance Agency Revenue—Series B (CS: Assured Guaranty Municipal)
5.000%, 07/01/2014 | | | 361,267 | |
| | | | | | | | 3,566,286 | |
| Rhode Island—1.2% | | | | |
| | 250,000 | | | Tobacco Settlement Financing Corp. Revenue—Series 2002-A, Class A
6.000%, 06/01/2023 | | | 250,037 | |
| South Carolina—0.4% | | | | |
| | 65,000 | | | State Jobs—Economic Development Authority Revenue (CS: Palmetto Health)
5.000%, 08/01/2019 | | | 71,194 | |
| Tennessee—3.9% | | | | |
| | 400,000 | | | Franklin Public Building Authority Revenue, Local Government Public Improvement—Series- 101-A-1, VRDN (SPA: DEPFA Bank PLC)
0.620%, 06/01/2037
(Putable on 11/01/2013) | | | 400,000 | |
| | 345,000 | | | Tennessee Energy Acquisition Corp. Revenue—Series A 5.250%, 09/01/2018 | | | 382,208 | |
| | | | | | | | 782,208 | |
| Texas—4.1% | | | | |
| | 250,000 | | | City of Houston Airport System Revenue, Special Facilities Continental Airlines—Series B
(CS: Continental Airlines)
6.125%, 07/15/2017 | | | 249,995 | |
| | 200,000 | | | Harris County Cultural Education Facilities Finance Corp. Revenue, Willow Winds Project—Series A
(CS: Willow Winds, Inc.)
5.000%, 10/01/2023 | | | 200,766 | |
| | | | | SA Energy Acquisition Public Facility Corp. Revenue, Gas Supply Revenue
(CS: Goldman Sachs & Co.) | | | | |
| | 80,000 | | | 5.500%, 08/01/2022 | | | 88,522 | |
| | 50,000 | | | 5.500%, 08/01/2023 | | | 54,813 | |
| | 200,000 | | | State Municipal Gas Acquisition & Supply Corp. I Revenue, Sr. Lien—Series D
6.250%, 12/15/2026 | | | 234,804 | |
| | | | | | | | 828,900 | |
| Shares | | | Security
Description | | Value | |
| | | | | | | |
| Municipal Bonds—continued | | | |
| Utah—1.4% | | | | |
| $ | 275,000 | | | Utah County Environmental Improvement Revenue, US Corp. Project (CS: US Steel Corp.)
5.375%, 11/01/2015 | | $ | 279,791 | |
| Vermont—2.0% | | | | |
| | 400,000 | | | State Student Assistance Corp. Education Loan Revenue—Series A
3.000%, 06/15/2019 | | | 399,376 | |
| Virginia—5.8% | | | | |
| | 900,000 | | | Capital Beltway Funding Corp., Hot Lanes—Series B, VRDN (LOC: Banco Espirito Santo SA)
1.300%, 12/31/2047
(Putable on 11/07/2013) (a) | | | 900,000 | |
| | 250,000 | | | State Housing Development Authority Revenue—Series A
4.500%, 01/01/2018 | | | 251,000 | |
| | | | | | | | 1,151,000 | |
| Washington—1.2% | | | | |
| | 250,000 | | | State Housing Finance Commission Revenue, Presbyterian Retirement Communities Northwest Project
(CS: Presbyterian Retirement)
5.000%, 01/01/2023 | | | 247,633 | |
| Wisconsin—1.9% | | | | |
| | 250,000 | | | Public Finance Authority Revenue, Roseman University Of Health Sciences Project
(CS: Roseman University Of Health Science)
5.000%, 04/01/2022 | | | 255,322 | |
| | 115,000 | | | State Health & Educational Facilities Authority Revenue, Beaver Dam Community Hospitals, Inc.—Series A
(CS: Beaver Dam Community Hospitals, Inc.)
2.000%, 08/15/2014 | | | 115,220 | |
| | | | | | | | 370,542 | |
| | | | | Total Municipal Bonds
(Cost $19,300,697) | | | 19,199,059 | |
| | | | | | | | | |
Principal
Amount | | | | | | |
| Short-Term Investments—0.4% | | | | |
| $ | 73,682 | | | Federated Municipal Obligation Fund, 0.01% | | | 73,682 | |
| | | | | Total Short-Term Investments
(Cost $73,682) | | | 73,682 | |
Total Investments
(Cost $19,374,379)—96.3% | | | 19,272,741 | |
| Other Assets in Excess of Liabilities—3.7% | | | 742,642 | |
| TOTAL NET ASSETS 100.0% | | $ | 20,015,383 | |
The accompanying notes are an integral part of these financial statements.
87
Alpine High Yield Managed Duration Municipal Fund
Schedule of Portfolio Investments—Continued
October 31, 2013
Percentages are stated as a percent of net assets.
(a) Variable Rate Security—The rate reported is the rate in effect as of October 31, 2013.
CS—Credit Support
LOC—Letter of Credit
PLC—Public Limited Company
SA—Generally designates corporations in various countries, mostly those employing the civil law
SPA—Standby Purchase Agreement
VRDN—Variable Rate Demand Note
The accompanying notes are an integral part of these financial statements.
88
Alpine Mutual Funds
Statements of Assets and Liabilities
October 31, 2013
| | | Dynamic
Dividend
Fund | | | Accelerating
Dividend
Fund | | | Financial
Services
Fund | |
| ASSETS: | | | | | | | | | | | | | | | |
| Investments, at value(1) | | | $ | 249,608,972 | | | | $ | 4,361,958 | | | | $ | 20,877,968 | |
| Foreign currencies, at value(2) | | | | 375,349 | | | | | — | | | | | 15 | |
| Cash | | | | — | | | | | 475 | | | | | 137 | |
| Receivable from investment securities sold | | | | 13,863,647 | | | | | 13,192 | | | | | 358,890 | |
| Dividends and interest receivable | | | | 1,030,349 | | | | | 3,483 | | | | | 12,765 | |
| Receivable from capital shares issued | | | | 56,927 | | | | | 200 | | | | | 168,551 | |
| Unrealized appreciation on forward currency contracts | | | | 15,947 | | | | | — | | | | | — | |
| Due from Adviser | | | | 22,557 | | | | | 19,439 | | | | | 16,850 | |
| Prepaid expenses and other assets | | | | 46,108 | | | | | 529 | | | | | 756 | |
| Total assets | | | | 265,019,856 | | | | | 4,399,276 | | | | | 21,435,932 | |
| | | | | | | | | | | | | | | | |
| LIABILITIES: | | | | | | | | | | | | | | | |
| Payable for investment securities purchased | | | | 2,231,223 | | | | | 28,717 | | | | | 523,149 | |
| Payable for distributions to shareholders | | | | 419,675 | | | | | 2,320 | | | | | — | |
| Unrealized depreciation on forward currency contracts | | | | 212,750 | | | | | — | | | | | — | |
| Payable for capital shares redeemed | | | | 492,571 | | | | | 118 | | | | | 73 | |
| Accrued expenses and other liabilities: | | | | | | | | | | | | | | | |
| Investment advisory fees | | | | 212,640 | | | | | 6,518 | | | | | 7,254 | |
| Line of credit | | | | 11,413,127 | | | | | — | | | | | — | |
| Distribution fees | | | | 3,217 | | | | | 786 | | | | | 2,013 | |
| Other | | | | 279,586 | | | | | 26,721 | | | | | 24,277 | |
| Total liabilities | | | | 15,264,789 | | | | | 65,180 | | | | | 556,766 | |
| Net Assets | | | $ | 249,755,067 | | | | $ | 4,334,096 | | | | $ | 20,879,166 | |
| | | | | | | | | | | | | | | | |
| Net assets represented by: | | | | | | | | | | | | | | | |
| Paid-in-capital | | | $ | 1,353,971,656 | | | | $ | 3,445,838 | | | | $ | 19,718,962 | |
| Accumulated net investment income | | | | 832,973 | | | | | 17,527 | | | | | (40,019 | ) |
| Accumulated net realized gain (loss) from investments and foreign currency transactions | | | | (1,136,683,352 | ) | | | | 162,018 | | | | | (336,033 | ) |
| Net unrealized appreciation(depreciation) on: | | | | | | | | | | | | | | | |
| Investments | | | | 31,825,860 | | | | | 708,698 | | | | | 1,536,238 | |
| Foreign currency translations | | | | (192,070 | ) | | | | 15 | | | | | 18 | |
| Net Assets | | | $ | 249,755,067 | | | | $ | 4,334,096 | | | | $ | 20,879,166 | |
| | | | | | | | | | | | | | | | |
| Net asset value | | | | | | | | | | | | | | | |
| Class A | | | | | | | | | | | | | | | |
| Net assets | | | $ | 2,479,452 | | | | $ | 916,554 | | | | $ | 7,318,433 | |
| Shares outstanding | | | | 657,045 | | | | | 60,361 | | | | | 605,930 | |
| Net asset value per share | | | $ | 3.77 | | | | $ | 15.18 | | | | $ | 12.08 | |
| Maximum offering price per share (net asset value plus sales charge of 5.50% of offering price) | | | $ | 3.99 | | | | $ | 16.06 | | | | $ | 12.78 | |
| Institutional Class | | | | | | | | | | | | | | | |
| Net assets | | | $ | 247,275,615 | | | | $ | 3,417,542 | | | | $ | 13,560,733 | |
| Shares outstanding | | | | 65,590,388 | | | | | 224,977 | | | | | 1,117,952 | |
| Net asset value, offering price and redemption price per share* | | | $ | 3.77 | | | | $ | 15.19 | | | | $ | 12.13 | |
| * If applicable, redemption price per share may be reduced by a redemption fee. | | | | | | | | | | | | | | | |
| (1) Total cost of investments | | | $ | 217,783,112 | | | | $ | 3,653,260 | | | | $ | 19,341,730 | |
| (2) Cost of foreign currencies | | | $ | 377,162 | | | | $ | — | | | | $ | 15 | |
The accompanying notes are an integral part of these financial statements.
89
Alpine Mutual Funds
Statements of Assets and Liabilities—Continued
October 31, 2013
| | | Innovators | | | Transformations | | | Foundation | |
| | | Fund | | | Fund | | | Fund | |
| ASSETS: | | | | | | | | | | | | | | | |
| Investments, at value(1) | | | $ | 13,007,403 | | | | $ | 7,438,341 | | | | $ | 67,744,826 | |
| Foreign currencies, at value(2) | | | | — | | | | | 569 | | | | | 2,853 | |
| Cash | | | | 292 | | | | | 584 | | | | | 660 | |
| Receivable from investment securities sold | | | | 368,940 | | | | | 242,092 | | | | | 3,767,286 | |
| Dividends and interest receivable | | | | — | | | | | 2,983 | | | | | 250,740 | |
| Receivable from capital shares issued | | | | 324 | | | | | — | | | | | — | |
| Due from Adviser | | | | 6,194 | | | | | 11,630 | | | | | — | |
| Prepaid expenses and other assets | | | | 1,007 | | | | | 580 | | | | | 4,567 | |
| Total assets | | | | 13,384,160 | | | | | 7,696,779 | | | | | 71,770,932 | |
| | | | | | | | | | | | | | | | |
| LIABILITIES: | | | | | | | | | | | | | | | |
| Payable for investment securities purchased | | | | 953,083 | | | | | 384,169 | | | | | 520,355 | |
| Payable for capital shares redeemed | | | | — | | | | | 3,762 | | | | | 5,005 | |
| Accrued expenses and other liabilities: | | | | | | | | | | | | | | | |
| Investment advisory fees | | | | — | | | | | — | | | | | 59,782 | |
| Distribution fees | | | | 576 | | | | | 520 | | | | | 509 | |
| Other | | | | 28,433 | | | | | 23,146 | | | | | 47,080 | |
| Total liabilities | | | | 982,092 | | | | | 411,597 | | | | | 632,731 | |
| Net Assets | | | $ | 12,402,068 | | | | $ | 7,285,182 | | | | $ | 71,138,201 | |
| | | | | | | | | | | | | | | | |
| Net assets represented by: | | | | | | | | | | | | | | | |
| Paid-in-capital | | | $ | 21,111,915 | | | | $ | 4,692,287 | | | | $ | 60,968,352 | |
| Accumulated net investment income (distributions in excess of net investment income) | | | | (102,645 | ) | | | | — | | | | | 45,359 | |
| Accumulated net realized gain (loss) from investments and foreign currency transactions | | | | (12,600,990 | ) | | | | 1,014,276 | | | | | (429,519 | ) |
| Net unrealized appreciation/(depreciation) on: | | | | | | | | | | | | | | | |
| Investments | | | | 3,993,788 | | | | | 1,578,620 | | | | | 10,554,015 | |
| Foreign currency translations | | | | — | | | | | (1 | ) | | | | (6 | ) |
| Net Assets | | | $ | 12,402,068 | | | | $ | 7,285,182 | | | | $ | 71,138,201 | |
| | | | | | | | | | | | | | | | |
| Net asset value | | | | | | | | | | | | | | | |
| Class A | | | | | | | | | | | | | | | |
| Net assets | | | $ | 139,421 | | | | $ | 135,347 | | | | $ | 120,488 | |
| Shares outstanding | | | | 9,833 | | | | | 8,971 | | | | | 9,654 | |
| Net asset value per share | | | $ | 14.18 | | | | $ | 15.09 | | | | $ | 12.48 | |
| Maximum offering price per share (net asset value plus sales charge of 5.50% of offering price) | | | $ | 15.01 | | | | $ | 15.97 | | | | $ | 13.21 | |
| Institutional Class | | | | | | | | | | | | | | | |
| Net assets | | | $ | 12,262,647 | | | | $ | 7,149,835 | | | | $ | 71,017,713 | |
| Shares outstanding | | | | 860,288 | | | | | 471,576 | | | | | 5,686,146 | |
| Net asset value, offering price and redemption price per share* | | | $ | 14.25 | | | | $ | 15.16 | | | | $ | 12.49 | |
| * If applicable, redemption price per share may be reduced by a redemption fee. | | | | | | | | | | | | | | | |
| (1) Total cost of investments | | | $ | 9,013,615 | | | | $ | 5,859,721 | | | | $ | 57,190,811 | |
| (2) Cost of foreign currencies | | | $ | — | | | | $ | 566 | | | | $ | 2,837 | |
The accompanying notes are an integral part of these financial statements.
90
Alpine Mutual Funds
Statements of Assets and Liabilities—Continued
October 31, 2013
| | | Ultra Short | | | | | | | |
| | | Tax Optimized | | | Municipal | | | High Yield | |
| | | Income | | | Money Market | | | Managed Duration | |
| | | Fund | | | Fund | | | Municipal Fund | |
| ASSETS: | | | | | | | | | | | | | | | |
| Investments, at value(1) | | | $ | 1,288,750,483 | | | | $ | 170,408,763 | | | | $ | 19,272,741 | |
| Cash | | | | — | | | | | 6 | | | | | — | |
| Receivable from investment securities sold | | | | 100,000 | | | | | — | | | | | 901,396 | |
| Dividends and interest receivable | | | | 4,600,467 | | | | | 94,467 | | | | | 266,537 | |
| Receivable from capital shares issued | | | | 968,971 | | | | | 11,138 | | | | | — | |
| Due from Adviser | | | | 635,528 | | | | | 39,760 | | | | | 26,986 | |
| Prepaid expenses and other assets | | | | 43,369 | | | | | 10,210 | | | | | 469 | |
| Total assets | | | | 1,295,098,818 | | | | | 170,564,344 | | | | | 20,468,129 | |
| | | | | | | | | | | | | | | | |
| LIABILITIES: | | | | | | | | | | | | | | | |
| Payable for investment securities purchased | | | | 32,100,000 | | | | | — | | | | | 382,855 | |
| Payable to custodian | | | | 3,241 | | | | | — | | | | | — | |
| Payable for capital shares redeemed | | | | 22,874,557 | | | | | 30,016 | | | | | — | |
| Accrued expenses and other liabilities: | | | | | | | | | | | | | | | |
| Investment advisory fees | | | | 819,127 | | | | | 66,332 | | | | | 12,711 | |
| Distribution fees | | | | 89,842 | | | | | — | | | | | 104 | |
| Other | | | | 725,820 | | | | | 55,152 | | | | | 57,076 | |
| Total liabilities | | | | 56,612,587 | | | | | 151,500 | | | | | 452,746 | |
| Net Assets | | | $ | 1,238,486,231 | | | | $ | 170,412,844 | | | | $ | 20,015,383 | |
| | | | | | | | | | | | | | | | |
| Net assets represented by: | | | | | | | | | | | | | | | |
| Paid-in-capital | | | $ | 1,239,930,437 | | | | $ | 170,412,844 | | | | $ | 20,122,360 | |
| Distributions in excess of net investment income | | | | — | | | | | — | | | | | — | |
| Accumulated net realized loss from investments | | | | (488,304 | ) | | | | — | | | | | (5,339 | ) |
| Net unrealized depreciation on: | | | | | | | | | | | | | | | |
| Investments | | | | (955,902 | ) | | | | — | | | | | (101,638 | ) |
| Net Assets | | | $ | 1,238,486,231 | | | | $ | 170,412,844 | | | | $ | 20,015,383 | |
| | | | | | | | | | | | | | | | |
| Net asset value | | | | | | | | | | | | | | | |
| Class A | | | | | | | | | | | | | | | |
| Net assets | | | $ | 305,192,654 | | | | $ | — | | | | $ | 99,983 | |
| Shares outstanding | | | | 30,259,904 | | | | | — | | | | | 10,052 | |
| Net asset value per share | | | $ | 10.09 | | | | $ | — | | | | $ | 9.95 | |
| Maximum offering price per share (net asset value plus sales charge of 0.50%, -, 2.50%, respectively, of offering price) | | | $ | 10.14 | | | | $ | — | | | | $ | 10.21 | |
| Institutional Class | | | | | | | | | | | | | | | |
| Net assets | | | $ | 933,293,577 | | | | $ | — | | | | $ | 19,915,400 | |
| Shares outstanding | | | | 93,061,780 | | | | | — | | | | | 2,002,266 | |
| Net asset value, offering price and redemption price per share* | | | $ | 10.03 | | | | $ | — | | | | $ | 9.95 | |
| Investor Class | | | | | | | | | | | | | | | |
| Net Assets | | | $ | — | | | | $ | 170,412,844 | | | | $ | — | |
| Shares outstanding | | | | — | | | | | 170,415,512 | | | | | — | |
| Net asset value, offering price and redemption price per share | | | $ | — | | | | $ | 1.00 | | | | $ | — | |
| * If applicable, redemption price per share may be reduced by a redemption fee. | | | | | | | | | | | | | | | |
| (1) Total cost of investments | | | $ | 1,289,706,385 | | | | $ | 170,408,763 | | | | $ | 19,374,379 | |
The accompanying notes are an integral part of these financial statements.
91
Alpine Mutual Funds
Statements of Operations
For the year ended October 31, 2013
| | | Dynamic | | | Accelerating | | | Financial | |
| | | Dividend | | | Dividend | | | Services | |
| | | Fund | | | Fund | | | Fund | |
| INVESTMENT INCOME: | | | | | | | | | | | | | | | |
| Dividend income | | | $ | 21,177,520 | | | | $ | 176,253 | | | | $ | 187,572 | |
| Less: Foreign taxes withheld | | | | (735,216 | ) | | | | (4,372 | ) | | | | (1,635 | ) |
| Interest income | | | | 503 | | | | | 26 | | | | | 142 | |
| Total investment income | | | | 20,442,807 | | | | | 171,907 | | | | | 186,079 | |
| | | | | | | | | | | | | | | | |
| EXPENSES: | | | | | | | | | | | | | | | |
| Investment advisory fee (Note 6) | | | | 2,857,762 | | | | | 32,480 | | | | | 159,871 | |
| Transfer agent fees | | | | 528,323 | | | | | 9,658 | | | | | 23,848 | |
| Distribution fees—Class A (Note 5) | | | | 4,933 | | | | | 1,414 | | | | | 11,737 | |
| Audit and tax fees | | | | 144,747 | | | | | 14,683 | | | | | 17,754 | |
| Administration fee (Note 6) | | | | 58,548 | | | | | 650 | | | | | 3,223 | |
| Registration and filing fees | | | | 33,268 | | | | | 44,912 | | | | | 45,564 | |
| Accounting and custody fees | | | | 58,220 | | | | | 4,106 | | | | | 8,096 | |
| Printing and mailing fees | | | | 88,154 | | | | | 345 | | | | | 2,409 | |
| Legal fees | | | | 105,360 | | | | | 1,237 | | | | | 5,240 | |
| Trustee fees | | | | 72,102 | | | | | 637 | | | | | 2,994 | |
| Interest (Note 2) | | | | 77,152 | | | | | 32 | | | | | 1,269 | |
| Other fees | | | | 55,482 | | | | | 2,708 | | | | | 5,189 | |
| Total expenses | | | | 4,084,051 | | | | | 112,862 | | | | | 287,194 | |
| Less: Fee waivers and/or expense reimbursements (Note 6) | | | | (144,069 | ) | | | | (67,570 | ) | | | | (58,369 | ) |
| Net expenses | | | | 3,939,982 | | | | | 45,292 | | | | | 228,825 | |
| Net investment income (loss) | | | | 16,502,825 | | | | | 126,615 | | | | | (42,746 | ) |
| | | | | | | | | | | | | | | | |
NET REALIZED AND UNREALIZED ON INVESTMENTS
AND FOREIGN CURRENCY: | | | | | | | | | | | | | | | |
| Net realized gain (loss) from: | | | | | | | | | | | | | | | |
| Investments | | | | 25,360,454 | | | | | 164,582 | | | | | 1,429,369 | |
| Foreign currency transactions | | | | (1,017,948 | ) | | | | 112 | | | | | (9,724 | ) |
| Net realized gain from investments and foreign currency | | | | 24,342,506 | | | | | 164,694 | | | | | 1,419,645 | |
| Change in net unrealized appreciation/(depreciation) on: | | | | | | | | | | | | | | | |
| Investments | | | | 4,231,571 | | | | | 442,811 | | | | | 3,450,666 | |
| Foreign currency translations | | | | (259,908 | ) | | | | 15 | | | | | 8,148 | |
| Change in net unrealized appreciation on investments and foreign currency | | | | 3,971,663 | | | | | 442,826 | | | | | 3,458,814 | |
| Net gain on investments and foreign currency | | | | 28,314,169 | | | | | 607,520 | | | | | 4,878,459 | |
| Increase in net assets from operations | | | $ | 44,816,994 | | | | $ | 734,135 | | | | $ | 4,835,713 | |
The accompanying notes are an integral part of these financial statements.
92
Alpine Mutual Funds
Statements of Operations—Continued
For the year ended October 31, 2013
| | | Innovators | | | Transformations | | | Foundation | |
| | | Fund | | | Fund | | | Fund | |
| INVESTMENT INCOME: | | | | | | | | | | | | | | | |
| Dividend income | | | $ | 44,589 | | | | $ | 84,588 | | | | $ | 1,325,884 | |
| Less: Foreign taxes withheld | | | | — | | | | | (1,542 | ) | | | | (14,574 | ) |
| Interest income | | | | 166 | | | | | 69 | | | | | 542,208 | |
| Total investment income | | | | 44,755 | | | | | 83,115 | | | | | 1,853,518 | |
| | | | | | | | | | | | | | | | |
| EXPENSES: | | | | | | | | | | | | | | | |
| Investment advisory fee (Note 6) | | | | 116,695 | | | | | 65,552 | | | | | 683,853 | |
| Transfer agent fees | | | | 18,165 | | | | | 9,889 | | | | | 18,930 | |
| Distribution fees—Class A (Note 5) | | | | 313 | | | | | 293 | | | | | 288 | |
| Audit and tax fees | | | | 17,751 | | | | | 16,007 | | | | | 40,281 | |
| Administration fee (Note 5) | | | | 2,333 | | | | | 1,311 | | | | | 13,677 | |
| Registration and filing fees | | | | 36,463 | | | | | 38,627 | | | | | 40,229 | |
| Accounting and custody fees | | | | 4,460 | | | | | 4,236 | | | | | 9,578 | |
| Printing and mailing fees | | | | 3,418 | | | | | 2,866 | | | | | 23,162 | |
| Legal fees | | | | 4,774 | | | | | 2,701 | | | | | 18,222 | |
| Trustee fees | | | | 2,604 | | | | | 1,459 | | | | | 15,371 | |
| Other fees | | | | 3,509 | | | | | 3,904 | | | | | 12,630 | |
| Total expenses | | | | 210,485 | | | | | 146,845 | | | | | 876,221 | |
| Less: Fee waivers and/or expense reimbursements (Note 6) | | | | (52,638 | ) | | | | (58,060 | ) | | | | —- | |
| Net expenses | | | | 157,847 | | | | | 88,785 | | | | | 876,221 | |
| Net investment income (loss) | | | | (113,092 | ) | | | | (5,670 | ) | | | | 977,297 | |
| | | | | | | | | | | | | | | | |
NET REALIZED AND UNREALIZED ON INVESTMENTS
AND FOREIGN CURRENCY: | | | | | | | | | | | | | | | |
| Net realized gain (loss) from: | | | | | | | | | | | | | | | |
| Investments | | | | 1,354,497 | | | | | 1,055,030 | | | | | 3,555,893 | |
| Foreign currency transactions | | | | (10 | ) | | | | (38 | ) | | | | 242 | |
| Net realized gain from investments and foreign currency | | | | 1,354,487 | | | | | 1,054,992 | | | | | 3,556,135 | |
| Change in net unrealized appreciation on: | | | | | | | | | | | | | | | |
| Investments | | | | 1,434,422 | | | | | 692,115 | | | | | 2,295,367 | |
| Foreign currency translations | | | | — | | | | | 2 | | | | | 8 | |
Change in net unrealized appreciation on
investments and foreign currency | | | | 1,434,422 | | | | | 692,117 | | | | | 2,295,375 | |
| Net gain on investments and foreign currency | | | | 2,788,909 | | | | | 1,747,109 | | | | | 5,851,510 | |
| Increase in net assets from operations | | | $ | 2,675,817 | | | | $ | 1,741,439 | | | | $ | 6,828,807 | |
The accompanying notes are an integral part of these financial statements.
93
Alpine Mutual Funds
Statements of Operations—Continued
For the period ended October 31, 2013
| | | Ultra Short
Tax Optimized
Income
Fund | | Municipal
Money Market
Fund | | High Yield
Managed Duration
Municipal Fund |
| INVESTMENT INCOME: | | | | | | | | | | | | | | | |
| Interest income | | | $ | 17,269,472 | | | | $ | 701,211 | | | | $ | 184,073 | |
| Total investment income | | | | 17,269,472 | | | | | 701,211 | | | | | 184,073 | |
| | | | | | | | | | | | | | | | |
| EXPENSES: | | | | | | | | | | | | | | | |
| Investment advisory fee (Note 6) | | | | 11,173,604 | | | | | 873,168 | | | | | 62,647 | |
| Transfer agent fees | | | | 996,832 | | | | | 38,639 | | | | | 4,865 | |
| Distribution fees—Class A (Note 5) | | | | 921,568 | | | | | — | | | | | 104 | |
| Audit and tax fees | | | | 136,127 | | | | | 33,573 | | | | | 20,817 | |
| Administration fee (Note 6) | | | | 297,962 | | | | | 38,702 | | | | | 1,671 | |
| Registration and filing fees | | | | 91,974 | | | | | 31,539 | | | | | 18,875 | |
| Accounting and custody fees | | | | 171,927 | | | | | 31,720 | | | | | 3,788 | |
| Printing and mailing fees | | | | 144,688 | | | | | 13,673 | | | | | 15,000 | |
| Legal fees | | | | 82,749 | | | | | 9,411 | | | | | 6,899 | |
| Trustee fees | | | | 83,976 | | | | | 10,322 | | | | | 474 | |
| Insurance fees | | | | 78,352 | | | | | 12,262 | | | | | — | |
| Compliance fees | | | | 33,939 | | | | | 4,398 | | | | | — | |
| Other fees | | | | 3,787 | | | | | 1,629 | | | | | 3,269 | |
| Total expenses | | | | 14,217,485 | | | | | 1,099,036 | | | | | 138,409 | |
| Less: Fee waivers and/or expense reimbursements (Note 6) | | | | (4,236,779 | ) | | | | (484,382 | ) | | | | (76,676 | ) |
| Net expenses | | | | 9,980,706 | | | | | 614,654 | | | | | 61,733 | |
| Net investment income | | | | 7,288,766 | | | | | 86,557 | | | | | 122,340 | |
| | | | | | | | | | | | | | | | |
| NET REALIZED AND UNREALIZED ON INVESTMENTS: | | | | | | | | | | | | | | | |
| Net realized loss from: | | | | | | | | | | | | | | | |
| Investments | | | | (421,076 | ) | | | | — | | | | | (5,339 | ) |
| Net realized loss from investments | | | | (421,076 | ) | | | | — | | | | | (5,339 | ) |
| Change in net unrealized depreciation on: | | | | | | | | | | | | | | | |
| Investments | | | | (1,994,222 | ) | | | | — | | | | | (101,638 | ) |
| Net loss on investments | | | | (2,415,298 | ) | | | | — | | | | | (106,977 | ) |
| Increase in net assets from operations | | | $ | 4,873,468 | | | | $ | 86,557 | | | | $ | 15,363 | |
The accompanying notes are an integral part of these financial statements.
94
Alpine Mutual Funds
Statements of Changes in Net Assets
| | | Dynamic Dividend Fund |
| | | Year Ended
October 31, 2013 | | Year Ended
October 31, 2012 |
| OPERATIONS: | | | | | | | | | | |
| Net investment income | | | $ | 16,502,825 | | | | $ | 51,963,751 | |
| Net realized gain (loss) from: | | | | | | | | | | |
| Investments | | | | 25,360,454 | | | | | (48,992,235 | ) |
| Foreign currency transactions | | | | (1,017,948 | ) | | | | (31,786 | ) |
| Change in net unrealized appreciation/(depreciation) on: | | | | | | | | | | |
| Investments | | | | 4,231,571 | | | | | 12,442,961 | |
| Foreign currency translations | | | | (259,908 | ) | | | | (435,742 | ) |
| Increase in net assets from operations | | | | 44,816,994 | | | | | 14,946,949 | |
| | | | | | | | | | | |
| DISTRIBUTIONS TO SHAREHOLDERS: | | | | | | | | | | |
| Distributions to Class A Shareholders: | | | | | | | | | | |
| From net investment income | | | | (151,338 | ) | | | | (51,261 | ) |
| Distributions to Institutional Class Shareholders: | | | | | | | | | | |
| From net investment income | | | | (23,127,472 | ) | | | | (53,985,717 | ) |
| Decrease in net assets from distributions to shareholders | | | | (23,278,810 | ) | | | | (54,036,978 | ) |
| | | | | | | | | | | |
| CAPITAL SHARE TRANSACTIONS (NOTE 3): | | | | | | | | | | |
| Net proceeds from shares sold | | | | 17,991,750 | | | | | 33,652,844 | |
| Dividends reinvested | | | | 15,480,325 | | | | | 34,379,418 | |
| Redemption fees | | | | 33,269 | | | | | 39,100 | |
| Cost of shares redeemed | | | | (160,400,826 | ) | | | | (134,334,741 | ) |
| Decrease in net assets from capital share transactions | | | | (126,895,482 | ) | | | | (66,263,379 | ) |
| Net decrease in net assets | | | | (105,357,298 | ) | | | | (105,353,408 | ) |
| | | | | | | | | | | |
| NET ASSETS: | | | | | | | | | | |
| Beginning of year | | | | 355,112,365 | | | | | 460,465,773 | |
| End of year* | | | $ | 249,755,067 | | | | $ | 355,112,365 | |
| * Including undistributed net investment income of: | | | $ | 832,973 | | | | $ | 7,059,739 | |
The accompanying notes are an integral part of these financial statements.
95
Alpine Mutual Funds
Statements of Changes in Net Assets—Continued
| | | Accelerating Dividend Fund |
| | | Year Ended
October 31, 2013 | | Year Ended
October 31, 2012 |
| OPERATIONS: | | | | | | | | | | |
| Net investment income | | | $ | 126,615 | | | | $ | 117,447 | |
| Net realized gain (loss) from: | | | | | | | | | | |
| Investments | | | | 164,582 | | | | | 45,689 | |
| Foreign currency transactions | | | | 112 | | | | | (407 | ) |
| Change in net unrealized appreciation on: | | | | | | | | | | |
| Investments | | | | 442,811 | | | | | 162,663 | |
| Foreign currency translations | | | | 15 | | | | | 137 | |
| Increase in net assets from operations | | | | 734,135 | | | | | 325,529 | |
| | | | | | | | | | | |
| DISTRIBUTIONS TO SHAREHOLDERS: | | | | | | | | | | |
| Distributions to Class A Shareholders: | | | | | | | | | | |
| From net investment income | | | | (22,139 | ) | | | | (4,787 | ) |
| From net realized gain on investments | | | | (4,715 | ) | | | | — | |
| Distributions to Institutional Class Shareholders: | | | | | | | | | | |
| From net investment income | | | | (122,021 | ) | | | | (99,402 | ) |
| From net realized gain on investments | | | | (42,591 | ) | | | | (197,496 | ) |
| Decrease in net assets from distributions to shareholders | | | | (191,466 | ) | | | | (301,685 | ) |
| | | | | | | | | | | |
| CAPITAL SHARE TRANSACTIONS (NOTE 3): | | | | | | | | | | |
| Net proceeds from shares sold | | | | 2,288,600 | | | | | 575,695 | |
| Dividends reinvested | | | | 170,647 | | | | | 198,183 | |
| Redemption fees | | | | 7,462 | | | | | — | |
| Cost of shares redeemed | | | | (1,087,467 | ) | | | | (1,603,733 | ) |
| Increase (decrease) in net assets from capital share transactions | | | | 1,379,242 | | | | | (829,855 | ) |
| Net increase (decrease) in net assets | | | | 1,921,911 | | | | | (806,011 | ) |
| | | | | | | | | | | |
| NET ASSETS: | | | | | | | | | | |
| Beginning of year | | | | 2,412,185 | | | | | 3,218,196 | |
| End of year* | | | $ | 4,334,096 | | | | $ | 2,412,185 | |
| * Including undistributed net investment income of: | | | $ | 17,527 | | | | $ | 36,612 | |
The accompanying notes are an integral part of these financial statements.
96
Alpine Mutual Funds
Statements of Changes in Net Assets—Continued
| | | Financial Services Fund |
| | | Year Ended
October 31, 2013 | | Year Ended
October 31, 2012 |
| OPERATIONS: | | | | | | | | | | |
| Net investment income (loss) | | | $ | (42,746 | ) | | | $ | (14,068 | ) |
| Net realized gain (loss) from: | | | | | | | | | | |
| Investments | | | | 1,429,369 | | | | | 45,081 | |
| Foreign currency transactions | | | | (9,724 | ) | | | | (3,648 | ) |
| Change in net unrealized appreciation/(depreciation) on: | | | | | | | | | | |
| Investments | | | | 3,450,666 | | | | | 1,484,702 | |
| Foreign currency translations | | | | 8,148 | | | | | (8,059 | ) |
| Increase in net assets from operations | | | | 4,835,713 | | | | | 1,504,008 | |
| | | | | | | | | | | |
| DISTRIBUTIONS TO SHAREHOLDERS: | | | | | | | | | | |
| From tax return of capital | | | | — | | | | | (13,524 | ) |
| Decrease in net assets from distributions to shareholders | | | | — | | | | | (13,524 | ) |
| | | | | | | | | | | |
| CAPITAL SHARE TRANSACTIONS (NOTE 3): | | | | | | | | | | |
| Net proceeds from shares sold | | | | 13,458,721 | | | | | 3,612,158 | |
| Dividends reinvested | | | | — | | | | | 11,966 | |
| Redemption fees | | | | 33,010 | | | | | 2,282 | |
| Cost of shares redeemed | | | | (7,696,853 | ) | | | | (1,119,207 | ) |
| Increase in net assets from capital share transactions | | | | 5,794,878 | | | | | 2,507,199 | |
| Net increase in net assets | | | | 10,630,591 | | | | | 3,997,683 | |
| | | | | | | | | | | |
| NET ASSETS: | | | | | | | | | | |
| Beginning of year | | | | 10,248,575 | | | | | 6,250,892 | |
| End of year* | | | $ | 20,879,166 | | | | $ | 10,248,575 | |
| * Including accumulated net investment loss of: | | | $ | (40,019 | ) | | | $ | (1,819 | ) |
The accompanying notes are an integral part of these financial statements.
97
Alpine Mutual Funds
Statements of Changes in Net Assets—Continued
| | | Innovators Fund |
| | | Year Ended
October 31, 2013 | | Year Ended
October 31, 2012 |
| OPERATIONS: | | | | | | | | | | |
| Net investment loss | | | $ | (113,092 | ) | | | $ | (122,459 | ) |
| Net realized gain (loss) from: | | | | | | | | | | |
| Investments | | | | 1,354,497 | | | | | 20,875 | |
| Foreign currency transactions | | | | (10 | ) | | | | (4,288 | ) |
| Change in unrealized appreciation on investments | | | | 1,434,422 | | | | | 925,282 | |
| Increase in net assets from operations | | | | 2,675,817 | | | | | 819,410 | |
| | | | | | | | | | | |
| CAPITAL SHARE TRANSACTIONS (NOTE 3): | | | | | | | | | | |
| Net proceeds from shares sold | | | | 211,505 | | | | | 1,635,064 | |
| Redemption fees | | | | 302 | | | | | 769 | |
| Cost of shares redeemed | | | | (1,473,954 | ) | | | | (1,850,248 | ) |
| Decrease in net assets from capital share transactions | | | | (1,262,147 | ) | | | | (214,415 | ) |
| Net increase in net assets | | | | 1,413,670 | | | | | 604,995 | |
| | | | | | | | | | | |
| NET ASSETS: | | | | | | | | | | |
| Beginning of year | | | | 10,988,398 | | | | | 10,383,403 | |
| End of year* | | | $ | 12,402,068 | | | | $ | 10,988,398 | |
| * Including accumulated net investment loss of: | | | $ | (102,645 | ) | | | $ | (106,328 | ) |
The accompanying notes are an integral part of these financial statements.
98
Alpine Mutual Funds
Statements of Changes in Net Assets—Continued
| | | Transformations Fund |
| | | Year Ended
October 31, 2013 | | Year Ended
October 31, 2012 |
| OPERATIONS: | | | | | | | | | | |
| Net investment loss | | | $ | (5,670 | ) | | | $ | (39,568 | ) |
| Net realized gain (loss) from: | | | | | | | | | | |
| Investments | | | | 1,055,030 | | | | | 327,441 | |
| Foreign currency transactions | | | | (38 | ) | | | | (312 | ) |
| Change in unrealized appreciation/(depreciation) on: | | | | | | | | | | |
| Investments | | | | 692,115 | | | | | (334,488 | ) |
| Foreign currency translations | | | | 2 | | | | | 113 | |
| Increase (decrease) in net assets from operations | | | | 1,741,439 | | | | | (46,814 | ) |
| | | | | | | | | | | |
| DISTRIBUTIONS TO SHAREHOLDERS: | | | | | | | | | | |
| Distributions to Class A Shareholders: | | | | | | | | | | |
| From net realized gain on investments | | | | (722 | ) | | | | — | |
| Distributions to Institutional Class Shareholders: | | | | | | | | | | |
| From net realized gains on investments | | | | (41,395 | ) | | | | — | |
| Decrease in net assets from distributions to shareholders | | | | (42,117 | ) | | | | — | |
| | | | | | | | | | | |
| CAPITAL SHARE TRANSACTIONS (NOTE 3): | | | | | | | | | | |
| Net proceeds from shares sold | | | | 85,651 | | | | | 1,399,604 | |
| Dividends reinvested | | | | 41,872 | | | | | — | |
| Redemption fees | | | | 754 | | | | | 805 | |
| Cost of shares redeemed | | | | (716,428 | ) | | | | (1,446,510 | ) |
| Decrease in net assets from capital share transactions | | | | (588,151 | ) | | | | (46,101 | ) |
| Net increase (decrease) in net assets | | | | 1,111,171 | | | | | (92,915 | ) |
| | | | | | | | | | | |
| NET ASSETS: | | | | | | | | | | |
| Beginning of year | | | | 6,174,011 | | | | | 6,266,926 | |
| End of year* | | | $ | 7,285,182 | | | | $ | 6,174,011 | |
| * Including accumulated net investment loss of: | | | $ | — | | | | $ | (35,046 | ) |
The accompanying notes are an integral part of these financial statements.
99
Alpine Mutual Funds
Statements of Changes in Net Assets—Continued
| | | Foundation Fund |
| | | Year Ended
October 31, 2013 | | Year Ended
October 31, 2012 |
| OPERATIONS: | | | | | | | | | | |
| Net investment income | | | $ | 977,297 | | | | $ | 1,153,572 | |
| Net realized gain (loss) from: | | | | | | | | | | |
| Investments | | | | 3,555,893 | | | | | (3,613,947 | ) |
| Foreign currency transactions | | | | 242 | | | | | (1,028 | ) |
| Change in net unrealized appreciation/(depreciation) on: | | | | | | | | | | |
| Investments | | | | 2,295,367 | | | | | 8,539,941 | |
| Foreign currency translations | | | | 8 | | | | | (14 | ) |
| Increase in net assets from operations | | | | 6,828,807 | | | | | 6,078,524 | |
| | | | | | | | | | | |
| DISTRIBUTIONS TO SHAREHOLDERS: | | | | | | | | | | |
| Distributions to Class A Shareholders: | | | | | | | | | | |
| From net investment income | | | | (1,443 | ) | | | | (1,213 | ) |
| Distributions to Institutional Class Shareholders: | | | | | | | | | | |
| From net investment income | | | | (1,023,608 | ) | | | | (1,083,670 | ) |
| Decrease in net assets from distributions to shareholders | | | | (1,025,051 | ) | | | | (1,084,883 | ) |
| | | | | | | | | | | |
| CAPITAL SHARE TRANSACTIONS (NOTE 3): | | | | | | | | | | |
| Net proceeds from shares sold | | | | 80,791 | | | | | 179,210 | |
| Dividends reinvested | | | | 1,001,145 | | | | | 1,057,319 | |
| Redemption fees | | | | 24 | | | | | — | |
| Cost of shares redeemed | | | | (1,253,455 | ) | | | | (2,425,427 | ) |
| Decrease in net assets from capital share transactions | | | | (171,495 | ) | | | | (1,188,898 | ) |
| Net increase in net assets | | | | 5,632,261 | | | | | 3,804,743 | |
| | | | | | | | | | | |
| NET ASSETS: | | | | | | | | | | |
| Beginning of year | | | | 65,505,940 | | | | | 61,701,197 | |
| End of year* | | | $ | 71,138,201 | | | | $ | 65,505,940 | |
| * Including undistributed net investment income of: | | | $ | 45,359 | | | | $ | 24,071 | |
The accompanying notes are an integral part of these financial statements.
100
Alpine Mutual Funds
Statements of Changes in Net Assets—Continued
| | | Ultra Short
Tax Optimized Income Fund |
| | | Year Ended
October 31, 2013 | | Year Ended
October 31, 2012 |
| OPERATIONS: | | | | | | | | | | |
| Net investment income | | | $ | 7,288,766 | | | | $ | 15,890,877 | |
| Net realized gain (loss) from investments | | | | (421,076 | ) | | | | 106,992 | |
| Change in unrealized (depreciation) on investments | | | | (1,994,222 | ) | | | | (381,155 | ) |
| Increase in net assets from operations | | | | 4,873,468 | | | | | 15,616,714 | |
| | | | | | | | | | | |
| DISTRIBUTIONS TO SHAREHOLDERS: | | | | | | | | | | |
| Distributions to Class A Shareholders: | | | | | | | | | | |
| From net investment income | | | | (1,119,016 | ) | | | | (2,909,048 | ) |
| Distributions to Institutional Class Shareholders: | | | | | | | | | | |
| From net investment income | | | | (6,172,993 | ) | | | | (12,981,750 | ) |
| Decrease in net assets from distributions to shareholders | | | | (7,292,009 | ) | | | | (15,890,798 | ) |
| | | | | | | | | | | |
| CAPITAL SHARE TRANSACTIONS (NOTE 3): | | | | | | | | | | |
| Net proceeds from shares sold | | | | 646,453,903 | | | | | 1,341,370,692 | |
| Dividends reinvested | | | | 5,415,059 | | | | | 10,377,482 | |
| Redemption fees | | | | 41,661 | | | | | 37,617 | |
| Cost of shares redeemed | | | | (1,230,093,080 | ) | | | | (1,156,537,109 | ) |
| Increase (decrease) in net assets from capital share transactions | | | | (578,182,457 | ) | | | | 195,248,682 | |
| Net increase (decrease) in net assets | | | | (580,600,998 | ) | | | | 194,974,598 | |
| | | | | | | | | | | |
| NET ASSETS: | | | | | | | | | | |
| Beginning of year | | | | 1,819,087,229 | | | | | 1,624,112,631 | |
| End of year* | | | $ | 1,238,486,231 | | | | $ | 1,819,087,229 | |
| * Including undistributed (accumulated) net investment income (loss) of: | | | $ | — | | | | $ | 79 | |
The accompanying notes are an integral part of these financial statements.
101
Alpine Mutual Funds
Statements of Changes in Net Assets—Continued
| | | Municipal Money Market Fund |
| | | Year Ended
October 31, 2013 | | Year Ended
October 31, 2012 |
| OPERATIONS: | | | | | | | | | | |
| Net investment income | | | $ | 86,557 | | | | $ | 264,781 | |
| Increase in net assets from operations | | | | 86,557 | | | | | 264,781 | |
| | | | | | | | | | | |
| DISTRIBUTIONS TO SHAREHOLDERS: | | | | | | | | | | |
| From net investment income | | | | (86,557 | ) | | | | (264,781 | ) |
| Decrease in net assets from distributions to shareholders | | | | (86,557 | ) | | | | (264,781 | ) |
| | | | | | | | | | | |
| CAPITAL SHARE TRANSACTIONS (NOTE 3): | | | | | | | | | | |
| Net proceeds from shares sold | | | | 145,994,821 | | | | | 209,368,876 | |
| Dividends reinvested | | | | 65,951 | | | | | 190,228 | |
| Cost of shares redeemed | | | | (204,289,468 | ) | | | | (290,975,342 | ) |
| Decrease in net assets from capital share transactions | | | | (58,228,696 | ) | | | | (81,416,238 | ) |
| Total decrease in net assets | | | | (58,228,696 | ) | | | | (81,416,238 | ) |
| | | | | | | | | | | |
| NET ASSETS: | | | | | | | | | | |
| Beginning of year | | | | 228,641,540 | | | | | 310,057,778 | |
| End of year* | | | $ | 170,412,844 | | | | $ | 228,641,540 | |
| * Including undistributed net investment income of: | | | $ | — | | | | $ | — | |
The accompanying notes are an integral part of these financial statements.
102
Alpine Mutual Funds
Statements of Changes in Net Assets—Continued
| | | High Yield
Managed Duration
Municipal Fund |
| | | Period Ended
October 31, 2013 (a) |
| OPERATIONS: | | | | | |
| Net investment income | | | $ | 122,340 | |
| Net realized loss from investments | | | | (5,339 | ) |
| Change in unrealized depreciation on investments | | | | (101,638 | ) |
| Increase in net assets from operations | | | | 15,363 | |
| | | | | | |
| DISTRIBUTIONS TO SHAREHOLDERS: | | | | | |
| Distributions to Class A Shareholders: | | | | | |
| From net investment income | | | | (508 | ) |
| Distributions to Institutional Class Shareholders: | | | | | |
| From net investment income | | | | (121,832 | ) |
| Decrease in net assets from distributions to shareholders | | | | (122,340 | ) |
| | | | | | |
| CAPITAL SHARE TRANSACTIONS (NOTE 3): | | | | | |
| Net proceeds from shares sold | | | | 20,000,020 | |
| Dividends reinvested | | | | 122,340 | |
| Increase in net assets from capital share transactions | | | | 20,122,360 | |
| Total increase in net assets | | | | 20,015,383 | |
| | | | | | |
| NET ASSETS: | | | | | |
| End of period* | | | $ | 20,015,383 | |
| * Including undistributed net investment income of: | | | $ | — | |
(a) Commenced operations on June 3, 2013.
The accompanying notes are an integral part of these financial statements.
103
Alpine Mutual Funds
Financial Highlights
(For a share outstanding throughout each period)
| | | Dynamic Dividend Fund |
| | | Year
Ended
October 31,
2013 | | Period
Ended
October 31,
2012 (a) |
| Class A Shares: | | | | | | | | | | |
| Net asset value per share, beginning of period | | | $ | 3.49 | | | | $ | 3.61 | |
| Income from investment operations: | | | | | | | | | | |
| Net investment income | | | | 0.23 | | | | | 0.35 | |
| Net realized and unrealized gain (loss) on investments | | | | 0.33 | | | | | (0.06 | ) |
| Total from investment operations | | | | 0.56 | | | | | 0.29 | |
| Redemption fees | | | | 0.00 | (b) | | | | 0.00 | (b) |
| Less distributions: | | | | | | | | | | |
| From net investment income | | | | (0.28 | ) | | | | (0.41 | ) |
| Total distributions | | | | (0.28 | ) | | | | (0.41 | ) |
| Net asset value per share, end of period | | | $ | 3.77 | | | | $ | 3.49 | |
| Total return | | | | 16.73 | % | | | | 8.36 | %(c) |
| Ratios/Supplemental Data | | | | | | | | | | |
| Net Assets at end of period (000) | | | $ | 2,479 | | | | $ | 1,612 | |
| Ratio of total expenses to average net assets: | | | | | | | | | | |
| Before waivers and/or expense reimbursements (d) | | | | 1.68 | % | | | | 1.56 | %(e) |
| After waivers and/or expense reimbursements (f) | | | | 1.63 | % | | | | — | % |
| Ratio of net investment income to average net assets | | | | 5.38 | % | | | | 8.02 | %(e) |
| Portfolio turnover (g) | | | | 197 | % | | | | 258 | % |
| (a) | Class A commenced operations on December 30, 2011. |
| (b) | The amount is less than $0.005 per share. |
| (c) | Not annualized. |
| (d) | Ratio of total expenses to average net assets excluding interest expense before waivers and/or expense reimbursements was 1.65% for the year ended October 31, 2013, and 1.55% for the period ended October 31, 2012. |
| (e) | Annualized. |
| (f) | Ratio of total expenses to average net assets excluding interest expense after waivers and/or expense reimbursements was 1.60% for the year ended October 31, 2013. |
| (g) | Portfolio turnover is calculated on the basis of the Fund as a whole, without distinguishing between classes of shares issued. |
The accompanying notes are an integral part of these financial statements.
104
Alpine Mutual Funds
Financial Highlights—Continued
(For a share outstanding throughout each year)
| | | Dynamic Dividend Fund | |
| | | Year Ended October 31, | |
| | | 2013 | | | 2012 | | | 2011 | | | 2010 | | | 2009 | |
| Institutional Class: | | | | | | | | | | | | | | | | | | | | |
| Net asset value per share, beginning of year | | $ | 3.49 | | | $ | 3.84 | | | $ | 4.48 | | | $ | 4.78 | | | $ | 5.72 | |
| Income from investment operations: | | | | | | | | | | | | | | | | | | | | |
| Net investment income | | | 0.22 | | | | 0.50 | | | | 0.49 | | | | 0.56 | | | | 1.37 | (a) |
| Net realized and unrealized gain (loss) on investments | | | 0.34 | | | | (0.35 | ) | | | (0.59 | ) | | | 0.00 | (b) | | | (1.14 | ) |
| Total from investment operations | | | 0.56 | | | | 0.15 | | | | (0.10 | ) | | | 0.56 | | | | 0.23 | |
| Redemption fees | | | 0.00 | (b) | | | 0.00 | (b) | | | 0.00 | (b) | | | 0.00 | (b) | | | 0.00 | (b) |
| Less distributions: | | | | | | | | | | | | | | | | | | | | |
| From net investment income | | | (0.28 | ) | | | (0.50 | ) | | | (0.54 | ) | | | (0.86 | ) | | | (1.17 | ) |
| Total distributions | | | (0.28 | ) | | | (0.50 | ) | | | (0.54 | ) | | | (0.86 | ) | | | (1.17 | ) |
| Net asset value per share, end of year | | $ | 3.77 | | | $ | 3.49 | | | $ | 3.84 | | | $ | 4.48 | | | $ | 4.78 | |
| Total return | | | 17.02 | % | | | 4.46 | % | | | (3.48 | )% | | | 12.72 | % | | | 6.64 | % |
| Ratios/Supplemental Data: | | | | | | | | | | | | | | | | | | | | |
| Net Assets at end of year (000) | | $ | 247,276 | | | $ | 353,501 | | | $ | 460,466 | | | $ | 628,844 | | | $ | 572,151 | |
| Ratio of total expenses to average net assets: | | | | | | | | | | | | | | | | | | | | |
| Before waivers and/or expense reimbursements (c) | | | 1.43 | % | | | 1.28 | % | | | 1.21 | % | | | 1.21 | % | | | 1.20 | % |
| After waivers and/or expense reimbursements (d) | | | 1.38 | % | | | — | % | | | — | % | | | — | % | | | — | % |
| Ratio of net investment income to average net assets | | | 5.78 | % | | | 13.17 | % | | | 10.39 | % | | | 12.85 | % | | | 26.04 | % |
| Portfolio turnover (e) | | | 197 | % | | | 258 | % | | | 358 | % | | | 506 | % | | | 656 | % |
| (a) | Net investment income per share is calculated using ending balances after consideration of adjustments for permanent book and tax differences. |
| (b) | The amount is less than $0.005. |
| (c) | Ratio of total expenses to average net assets excluding interest expense before waivers and/or expense reimbursements was 1.40%, 1.27%, 1.18%, 1.18% and 1.18% for the years ended October 31, 2013, 2012, 2011, 2010 and 2009, respectively. |
| (d) | Ratio of total expenses to average net assets excluding interest expense after waivers and/or expense reimbursements was 1.35% for the year ended October 31, 2013. |
| (e) | Portfolio turnover is calculated on the basis of the Fund as a whole, without distinguishing between classes of shares issued. |
The accompanying notes are an integral part of these financial statements.
105
Alpine Mutual Funds
Financial Highlights—Continued
(For a share outstanding throughout each period)
| | | Accelerating Dividend Fund |
| | | Year
Ended
October 31,
2013 | | Period
Ended
October 31,
2012 (a) |
| Class A Shares: | | | | | | | | | | |
| Net asset value per share, beginning of period | | | $ | 12.88 | | | | $ | 12.02 | |
| Income from investment operations: | | | | | | | | | | |
| Net investment income | | | | 0.63 | | | | | 0.31 | |
| Net realized and unrealized gain on investments | | | | 2.48 | | | | | 0.92 | |
| Total from investment operations | | | | 3.11 | | | | | 1.23 | |
| Redemption fees | | | | 0.04 | | | | | — | |
| Less distributions: | | | | | | | | | | |
| Net investment income | | | | (0.61 | ) | | | | (0.37 | ) |
| Net realized gains on investments | | | | (0.24 | ) | | | | — | |
| Total distributions | | | | (0.85 | ) | | | | (0.37 | ) |
| Net asset value per share, end of period | | | $ | 15.18 | | | | $ | 12.88 | |
| Total return | | | | 25.55 | % | | | | 10.29 | %(b) |
| Ratios/Supplemental Data | | | | | | | | | | |
| Net Assets at end of period (000) | | | $ | 917 | | | | $ | 257 | |
| Ratio of total expenses to average net assets: | | | | | | | | | | |
| Before waivers and/or expense reimbursements (c) | | | | 3.68 | % | | | | 3.83 | %(d) |
| After waivers and/or expense reimbursements (e) | | | | 1.60 | % | | | | 1.60 | %(d) |
| Ratio of net investment income to average net assets | | | | 3.72 | % | | | | 2.71 | %(d) |
| Portfolio turnover (f) | | | | 86 | % | | | | 73 | % |
| (a) | Class A commenced operations on December 30, 2011. |
| (b) | Not annualized. |
| (c) | Ratio of total expenses to average net assets excluding interest expense before waivers and/or expense reimbursement was 3.68% for the year ended October 31, 2013, and 3.83% for the period ended October 31, 2012. |
| (d) | Annualized. |
| (e) | Ratio of total expenses to average net assets excluding interest expense after waivers and/or expense reimbursement was 1.60% for the year ended October 31, 2013, and 1.60% for the period ended October 31, 2012. |
| (f) | Portfolio turnover is calculated on the basis of the Fund as a whole, without distinguishing between classes of shares issued. |
The accompanying notes are an integral part of these financial statements.
106
Alpine Mutual Funds
Financial Highlights—Continued
(For a share outstanding throughout each period)
| | | Accelerating Dividend Fund |
| | | Year Ended
October 31, | | Period Ended
October 31, |
| | | 2013 | | 2012 | | 2011 | | 2010 | | 2009 (a) |
| Institutional Class: | | | | | | | | | | | | | | | | | | | | | | | | | |
| Net asset value per share, beginning of period | | | $ | 12.88 | | | | $ | 12.83 | | | | $ | 12.80 | | | | $ | 11.48 | | | | $ | 10.00 | |
| Income from investment operations: | | | | | | | | | | | | | | | | | | | | | | | | | |
| Net investment income | | | | 0.51 | | | | | 0.62 | | | | | 0.51 | | | | | 0.51 | | | | | 0.12 | (b) |
| Net realized and unrealized gain on investments | | | | 2.65 | | | | | 0.73 | | | | | 0.32 | | | | | 1.29 | | | | | 1.36 | |
| Total from investment operations | | | | 3.16 | | | | | 1.35 | | | | | 0.83 | | | | | 1.80 | | | | | 1.48 | |
| Redemption fees | | | | 0.03 | | | | | — | | | | | 0.00 | (c) | | | | 0.00 | (c) | | | | 0.00 | |
| Less distributions: | | | | | | | | | | | | | | | | | | | | | | | | | |
| Net investment income | | | | (0.64 | ) | | | | (0.50 | ) | | | | (0.58 | ) | | | | (0.45 | ) | | | | — | |
| Net realized gains on investments | | | | (0.24 | ) | | | | (0.80 | ) | | | | (0.22 | ) | | | | (0.03 | ) | | | | — | |
| Total distributions | | | | (0.88 | ) | | | | (1.30 | ) | | | | (0.80 | ) | | | | (0.48 | ) | | | | — | |
| Net asset value per share, end of period | | | $ | 15.19 | | | | $ | 12.88 | | | | $ | 12.83 | | | | $ | 12.80 | | | | $ | 11.48 | |
| Total return | | | | 25.94 | % | | | | 11.28 | % | | | | 6.43 | % | | | | 16.06 | % | | | | 14.80 | %(d) |
| Ratios/Supplemental Data: | | | | | | | | | | | | | | | | | | | | | | | | | |
| Net Assets at end of period (000) | | | $ | 3,418 | | | | $ | 2,155 | | | | $ | 3,218 | | | | $ | 2,393 | | | | $ | 1,215 | |
| Ratio of total expenses to average net assets: | | | | | | | | | | | | | | | | | | | | | | | | | |
| Before waivers and/or expense reimbursements (e) | | | | 3.43 | % | | | | 3.26 | % | | | | 2.64 | % | | | | 2.70 | % | | | | 5.26 | %(g) |
| After waivers and/or expense reimbursements (f) | | | | 1.35 | % | | | | 1.35 | % | | | | 1.35 | % | | | | 1.35 | % | | | | 1.35 | %(g) |
| Ratio of net investment income to average net assets | | | | 3.94 | % | | | | 4.52 | % | | | | 4.09 | % | | | | 4.85 | % | | | | 1.19 | %(g) |
| Portfolio turnover (h) | | | | 86 | % | | | | 73 | % | | | | 137 | % | | | | 225 | % | | | | 104 | %(d) |
| (a) | For the period from November 5, 2008 (inception of fund) to October 31, 2009. |
| (b) | Net investment income per share is calculated using ending balances after consideration of adjustments for permanent book and tax differences. |
| (c) | The amount is less than $0.005 per share. |
| (d) | Not annualized. |
| (e) | Ratio of total expenses to average net assets excluding interest expense before waivers and/or expense reimbursement was 3.43%, 3.26%, 2.64%, and 2.70% for the years ended October 31, 2013, 2012, 2011 and 2010, respectively, and 5.26% for the period ended October 31, 2009. |
| (f) | Ratio of total expenses to average net assets excluding interest expense after waivers and/or expense reimbursement was 1.35%,1.35%, 1.35%, 1.35% for the years ended October 31, 2013, 2012, 2011 and 2010, respectively, and 1.35% for the period ended October 31, 2009. |
| (g) | Annualized. |
| (h) | Portfolio turnover is calculated on the basis of the Fund as a whole, without distinguishing between classes of shares issued. |
The accompanying notes are an integral part of these financial statements.
107
Alpine Mutual Funds
Financial Highlights—Continued
(For a share outstanding throughout each period)
| | | Financial Services Fund |
| | | Year
Ended
October 31,
2013 | | Period
Ended
October 31,
2012 (a) |
| Class A Shares: | | | | | | | | | | |
| Net asset value per share, beginning of period | | | $ | 8.75 | | | | $ | 6.90 | |
| Income from investment operations: | | | | | | | | | | |
| Net investment loss | | | | (0.04 | ) | | | | (0.01 | ) |
| Net realized and unrealized gain on investments | | | | 3.35 | | | | | 1.86 | |
| Total from investment operations | | | | 3.31 | | | | | 1.85 | |
| Redemption fees | | | | 0.02 | | | | | 0.00 | (b) |
| Less distributions: | | | | | | | | | | |
| From net realized gains on investments | | | | — | | | | | — | |
| Tax return of capital | | | | — | | | | | — | |
| Total distributions | | | | — | | | | | — | |
| Net asset value per share, end of period | | | $ | 12.08 | | | | $ | 8.75 | |
| Total return | | | | 38.06 | % | | | | 26.81 | %(c) |
| Ratios/Supplemental Data | | | | | | | | | | |
| Net Assets at end of period (000) | | | $ | 7,318 | | | | $ | 1,375 | |
| Ratio of total expenses to average net assets: | | | | | | | | | | |
| Before waivers and/or expense reimbursements (e) | | | | 1.97 | % | | | | 2.05 | %(d) |
| After waivers and/or expense reimbursements (f) | | | | 1.61 | % | | | | 1.53 | %(d) |
| Ratio of net investment loss to average net assets | | | | (0.44 | )% | | | | (0.50 | )%(d) |
| Portfolio turnover (g) | | | | 108 | % | | | | 120 | % |
| (a) | Class A commenced operations on December 30, 2011. |
| (b) | The amount is less than $0.005. |
| (c) | Not annualized. |
| (d) | Annualized. |
| (e) | Ratio of total expenses to average net assets excluding interest expense before waivers and/or expense reimbursement was 1.96% for the year ended October 31, 2013, and 2.05% for the period ended October 31, 2012. |
| (f) | Ratio of total expenses to average net assets excluding interest expense after waivers and/or expense reimbursement was 1.60% for the year ended October 31, 2013, and 1.53% for the period ended October 31, 2012. |
| (g) | Portfolio turnover is calculated on the basis of the Fund as a whole, without distinguishing between classes of shares issued. |
The accompanying notes are an integral part of these financial statements.
108
Alpine Mutual Funds
Financial Highlights—Continued
(For a share outstanding throughout each year)
| | | Financial Services Fund | |
| | | Year Ended October 31, | |
| | | 2013 | | | 2012 | | 2011 | | 2010 | | 2009 | |
| Institutional Class: | | | | | | | | | | | | | | | | | | | | | | | | | |
| Net asset value per share, beginning of year | | | $ | 8.77 | | | | $ | 7.15 | | | | $ | 7.69 | | | | $ | 6.86 | | | | $ | 6.24 | |
| Income from investment operations: | | | | | | | | | | | | | | | | | | | | | | | | | |
| Net investment income (loss) | | | | (0.02 | ) | | | | 0.00 | (b) | | | | 0.02 | | | | | (0.01 | ) | | | | 0.03 | (a) |
| Net realized and unrealized gain (loss) on investments | | | | 3.36 | | | | | 1.64 | | | | | (0.54 | ) | | | | 0.84 | | | | | 1.10 | |
| Total from investment operations | | | | 3.34 | | | | | 1.64 | | | | | (0.52 | ) | | | | 0.83 | | | | | 1.13 | |
| Redemption fees | | | | 0.02 | | | | | 0.00 | (b) | | | | 0.00 | (b) | | | | 0.00 | (b) | | | | 0.00 | (b) |
| Less distributions: | | | | | | | | | | | | | | | | | | | | | | | | | |
| From net investment income | | | | — | | | | | — | | | | | (0.01 | ) | | | | — | | | | | (0.10 | ) |
| From net realized gains on investments | | | | — | | | | | — | | | | | — | | | | | — | | | | | (0.41 | ) |
| Tax return of capital | | | | — | | | | | (0.02 | ) | | | | (0.01 | ) | | | | — | | | | | 0.00 | (b) |
| Total distributions | | | | — | | | | | (0.02 | ) | | | | (0.02 | ) | | | | — | | | | | (0.51 | ) |
| Net asset value per share, end of year | | | $ | 12.13 | | | | $ | 8.77 | | | | $ | 7.15 | | | | $ | 7.69 | | | | $ | 6.86 | |
| Total return | | | | 38.31 | % | | | | 22.95 | % | | | | (6.77 | )% | | | | 12.26 | % | | | | 21.83 | % |
| Ratios/Supplemental Data: | | | | | | | | | | | | | | | | | | | | | | | | | |
| Net Assets at end of year (000) | | | $ | 13,561 | | | | $ | 8,874 | | | | $ | 6,251 | | | | $ | 7,718 | | | | $ | 7,895 | |
| Ratio of total expenses to average net assets: | | | | | | | | | | | | | | | | | | | | | | | | | |
| Before waivers and/or expense reimbursements (c) | | | | 1.72 | % | | | | 1.94 | % | | | | 1.85 | % | | | | 1.85 | % | | | | 2.06 | % |
| After waivers and/or expense reimbursements (d) | | | | 1.36 | % | | | | 1.38 | % | | | | 1.44 | % | | | | 1.43 | % | | | | 1.44 | % |
| Ratio of net investment income (loss) to average net assets | | | | (0.20 | )% | | | | (0.16 | )% | | | | 0.30 | % | | | | (0.09 | )% | | | | 0.39 | % |
| Portfolio turnover (e) | | | | 108 | % | | | | 120 | % | | | | 73 | % | | | | 133 | % | | | | 437 | % |
| (a) | Net investment income (loss) per share is calculated using ending balances after consideration of adjustments for permanent book and tax differences. |
| (b) | The amount is less than $0.005. |
| (c) | Ratio of total expenses to average net assets excluding interest expense before waivers and/or expense reimbursement was 1.71%, 1.91%, 1.75%, 1.77% and 1.97% for the years ended October 31, 2013, 2012, 2011, 2010 and 2009, respectively. |
| (d) | Ratio of total expenses to average net assets excluding interest expense after waivers and/or expense reimbursement was 1.35%, 1.35%, 1.35%, 1.35% and 1.35% for the years ended October 31, 2013, 2012, 2011, 2010 and 2009, respectively. |
| (e) | Portfolio turnover is calculated on the basis of the Fund as a whole, without distinguishing between classes of shares issued. |
The accompanying notes are an integral part of these financial statements.
109
Alpine Mutual Funds
Financial Highlights—Continued
(For a share outstanding throughout each period)
| | | Innovators Fund |
| | | Year
Ended
October 31,
2013 | | Period
Ended
October 31,
2012 (a) |
| Class A Shares: | | | | | | | | | | |
| Net asset value per share, beginning of period | | | $ | 11.30 | | | | $ | 10.17 | |
| Income from investment operations: | | | | | | | | | | |
| Net investment loss | | | | (0.16 | ) | | | | (0.14 | ) |
| Net realized and unrealized gain on investments | | | | 3.04 | | | | | 1.27 | |
| Total from investment operations | | | | 2.88 | | | | | 1.13 | |
| Redemption fees | | | | 0.00 | (b) | | | | — | |
| Net asset value per share, end of period | | | $ | 14.18 | | | | $ | 11.30 | |
| Total return | | | | 25.49 | % | | | | 11.11 | %(c) |
| Ratios/Supplemental Data | | | | | | | | | | |
| Net Assets at end of period (000) | | | $ | 139 | | | | $ | 111 | |
| Ratio of total expenses to average net assets: | | | | | | | | | | |
| Before waivers and/or expense reimbursements | | | | 2.05 | % | | | | 1.92 | %(d) |
| After waivers and/or expense reimbursements | | | | 1.60 | % | | | | 1.60 | %(d) |
| Ratio of net investment loss to average net assets | | | | (1.22 | )% | | | | (1.34 | )%(d) |
| Portfolio turnover (e) | | | | 39 | % | | | | 29 | % |
| (a) | Class A commenced operations on December 30, 2011. |
| (b) | The amount is less than $0.005. |
| (c) | Not Annualized. |
| (d) | Annualized. |
| (e) | Portfolio turnover is calculated on the basis of the Fund as a whole, without distinguishing between classes of shares issued. |
The accompanying notes are an integral part of these financial statements.
110
Alpine Mutual Funds
Financial Highlights—Continued
(For a share outstanding throughout each year)
| | | Innovators Fund | |
| | | Year Ended October 31, | |
| | | 2013 | | | 2012 | | | 2011 | | | 2010 | | | 2009 | |
| Institutional Class: | | | | | | | | | | | | | | | | | | | | |
| Net asset value per share, beginning of year | | $ | 11.33 | | | $ | 10.48 | | | $ | 10.14 | | | $ | 8.13 | | | $ | 6.83 | |
| Income from investment operations: | | | | | | | | | | | | | | | | | | | | |
| Net investment loss | | | (0.14 | ) | | | (0.13 | ) | | | (0.11 | ) | | | (0.10 | ) | | | — | (a) |
| Net realized and unrealized gain on investments | | | 3.06 | | | | 0.98 | | | | 0.45 | | | | 2.11 | | | | 1.30 | |
| Total from investment operations | | | 2.92 | | | | 0.85 | | | | 0.34 | | | | 2.01 | | | | 1.30 | |
| Redemption fees | | | 0.00 | (b) | | | 0.00 | (b) | | | 0.00 | (b) | | | 0.00 | (b) | | | 0.00 | (b) |
| Net asset value per share, end of year | | $ | 14.25 | | | $ | 11.33 | | | $ | 10.48 | | | $ | 10.14 | | | $ | 8.13 | |
| Total return | | | 25.77 | % | | | 8.11 | % | | | 3.35 | % | | | 24.72 | % | | | 19.03 | % |
| Ratios/Supplemental Data: | | | | | | | | | | | | | | | | | | | | |
| Net Assets at end of year (000) | | $ | 12,263 | | | $ | 10,877 | | | $ | 10,383 | | | $ | 11,847 | | | $ | 11,108 | |
| Ratio of total expenses to average net assets | | | | | | | | | | | | | | | | | | | | |
| Before waivers and/or expense reimbursements (c) | | | 1.80 | % | | | 1.67 | % | | | 1.59 | % | | | 1.70 | % | | | 1.86 | % |
| After waivers and/or expense reimbursements (d) | | | 1.35 | % | | | 1.36 | % | | | 1.41 | % | | | 1.44 | % | | | 1.54 | % |
| Ratio of net investment loss to average net assets | | | (0.97 | )% | | | (1.07 | )% | | | (0.97 | )% | | | (1.01 | )% | | | (0.92 | )% |
| Portfolio turnover (e) | | | 39 | % | | | 29 | % | | | 18 | % | | | 22 | % | | | 20 | % |
| (a) | Net investment loss per share is calculated using ending balances after consideration of adjustments for permanent book and tax differences. |
| (b) | The amount is less than $0.005. |
| (c) | Ratio of total expenses to average net assets excluding interest expense before waivers and/or expense reimbursement was 1.80%, 1.66%, 1.53%, 1.61%, 1.67% for the years ended October 31, 2013, 2012, 2011, 2010 and 2009, respectively. |
| (d) | Ratio of total expenses to average net assets excluding interest expense after waivers and/or expense reimbursement was 1.35%, 1.35%, 1.35%, 1.35% and 1.35% for the years ended October 31, 2013, 2012, 2011, 2010 and 2009, respectively. |
| (e) | Portfolio turnover is calculated on the basis of the Fund as a whole, without distinguishing between classes of shares issued. |
The accompanying notes are an integral part of these financial statements.
111
Alpine Mutual Funds
Financial Highlights—Continued
(For a share outstanding throughout each period)
| | | Transformations Fund |
| | | Year
Ended
October 31,
2013 | | Period
Ended
October 31,
2012 (a) |
| Class A Shares: | | | | | | | | | | |
| Net asset value per share, beginning of period | | | $ | 11.70 | | | | $ | 11.22 | |
| Income from investment operations: | | | | | | | | | | |
| Net investment loss | | | | (0.04 | ) | | | | (0.09 | ) |
| Net realized and unrealized gain on investments | | | | 3.51 | | | | | 0.57 | |
| Total from investment operations | | | | 3.47 | | | | | 0.48 | |
| Redemption fees | | | | 0.00 | (b) | | | | 0.00 | (b) |
| Less distributions: | | | | | | | | | | |
| From net realized gains on investments | | | | (0.08 | ) | | | | — | |
| Tax return of capital | | | | — | | | | | — | |
| Total distributions | | | | (0.08 | ) | | | | — | |
| Net asset value per share, end of period | | | $ | 15.09 | | | | $ | 11.70 | |
| Total return | | | | 29.82 | % | | | | 4.28 | %(c) |
| Ratios/Supplemental Data | | | | | | | | | | |
| Net Assets at end of period (000) | | | $ | 135 | | | | $ | 104 | |
| Ratio of total expenses to average net assets: | | | | | | | | | | |
| Before waivers and/or expense reimbursements (e) | | | | 2.49 | % | | | | 2.27 | %(d) |
| After waivers and/or expense reimbursements (f) | | | | 1.60 | % | | | | 1.60 | %(d) |
| Ratio of net investment loss to average net assets | | | | (0.33 | )% | | | | (0.85 | )%(d) |
| Portfolio turnover (g) | | | | 61 | % | | | | 63 | % |
| (a) | Class A commenced operations on December 30, 2011. |
| (b) | The amount is less than $0.005. |
| (c) | Not annualized. |
| (d) | Annualized. |
| (e) | Ratio of total expenses to average net assets excluding interest expense before waivers and/or expense reimbursement was 2.49% for the year ended October 31, 2013, and 2.27% for the period ended October 31, 2012. |
| (f) | Ratio of total expenses to average net assets excluding interest expense after waivers and/or expense reimbursement was 1.60% for the year ended October 31, 2013, and 1.60% for the period ended October 31, 2012. |
| (g) | Portfolio turnover is calculated on the basis of the Fund as a whole, without distinguishing between classes of shares issued. |
The accompanying notes are an integral part of these financial statements.
112
Alpine Mutual Funds
Financial Highlights—Continued
(For a share outstanding throughout each year)
| | | Transformations Fund | |
| | | Year Ended October 31, | |
| | | 2013 | | | 2012 | | | 2011 | | | 2010 | | | 2009 | |
| Institutional Class: | | | | | | | | | | | | | | | | | | | | | | | | | |
| Net asset value per share, beginning of year | | | $ | 11.73 | | | | $ | 11.75 | | | | $ | 10.30 | | | | $ | 7.68 | | | | $ | 5.79 | |
| Income from investment operations: | | | | | | | | | | | | | | | | | | | | | | | | | |
| Net investment income (loss) | | | | (0.02 | ) | | | | (0.07 | ) | | | | (0.07 | ) | | | | (0.06 | ) | | | | 0.01 | (a) |
| Net realized and unrealized gain on investments | | | | 3.53 | | | | | 0.05 | | | | | 1.52 | | | | | 2.68 | | | | | 1.92 | |
| Total from investment operations | | | | 3.51 | | | | | (0.02 | ) | | | | 1.45 | | | | | 2.62 | | | | | 1.93 | |
| Redemption fees | | | | 0.00 | (b) | | | | 0.00 | (b) | | | | 0.00 | (b) | | | | 0.00 | (b) | | | | 0.00 | (b) |
| Less distributions: | | | | | | | | | | | | | | | | | | | | | | | | | |
| Net investment income | | | | — | | | | | — | | | | | — | | | | | — | | | | | (0.03 | ) |
| Net realized gains on investments | | | | (.08 | ) | | | | — | | | | | — | | | | | — | | | | | — | |
| Tax return of capital | | | | — | | | | | — | | | | | — | | | | | — | | | | | (0.01 | ) |
| Total distributions | | | | (.08 | ) | | | | — | | | | | — | | | | | — | | | | | (0.04 | ) |
| Net asset value per share, end of year | | | $ | 15.16 | | | | $ | 11.73 | | | | $ | 11.75 | | | | $ | 10.30 | | | | $ | 7.68 | |
| Total return | | | | 30.09 | % | | | | (0.17 | )% | | | | 14.08 | % | | | | 34.11 | % | | | | 33.61 | % |
| Ratios/Supplemental Data: | | | | | | | | | | | | | | | | | | | | | | | | | |
| Net Assets at end of year (000) | | | $ | 7,150 | | | | $ | 6,070 | | | | $ | 6,267 | | | | $ | 5,294 | | | | $ | 3,514 | |
| Ratio of total expenses to average net assets: | | | | | | | | | | | | | | | | | | | | | | | | | |
| Before waivers and/or expense reimbursements (c) | | | | 2.24 | % | | | | 1.98 | % | | | | 1.68 | % | | | | 2.17 | % | | | | 2.86 | % |
| After waivers and/or expense reimbursements (d) | | | | 1.35 | % | | | | 1.35 | % | | | | 1.35 | % | | | | 1.37 | % | | | | 1.35 | % |
| Ratio of net investment loss to average net assets | | | | (0.08 | )% | | | | (0.58 | )% | | | | (0.60 | )% | | | | (0.68 | )% | | | | (0.16 | )% |
| Portfolio turnover (e) | | | | 61 | % | | | | 63 | % | | | | 72 | % | | | | 52 | % | | | | 57 | % |
| (a) | Net investment income (loss) per share is calculated using ending balances after consideration of adjustments for permanent book and tax differences. |
| (b) | The amount is less than $0.005 per share. |
| (c) | Ratio of total expenses to average net assets excluding interest expense before waivers and/or expense reimbursement was 2.24%, 1.98%, 1.68%, 2.15%, and 2.86% for the years ended October 31, 2013, 2012, 2011, 2010 and 2009, respectively. |
| (d) | Ratio of total expenses to average net assets excluding interest expense after waivers and/or expense reimbursement was 1.35%, 1.35%, 1.35%, 1.35% and 1.35% for the years ended October 31, 2013, 2012, 2011, 2010 and 2009, respectively. |
| (e) | Portfolio turnover is calculated on the basis of the Fund as a whole, without distinguishing between classes of shares issued. |
The accompanying notes are an integral part of these financial statements.
113
Alpine Mutual Funds
Financial Highlights—Continued
(For a share outstanding throughout each period)
| | | Foundation Fund |
| | | Year
Ended
October 31,
2013 | | Period
Ended
October 31,
2012 (a) |
| Class A Shares: | | | | | | | | | | |
| Net asset value per share, beginning of period | | | $ | 11.47 | | | | $ | 10.61 | |
| Income from investment operations: | | | | | | | | | | |
| Net investment income | | | | 0.14 | | | | | 0.14 | |
| Net realized and unrealized gain on investments | | | | 1.02 | | | | | 0.85 | |
| Total from investment operations | | | | 1.16 | | | | | 0.99 | |
| Redemption fees | | | | — | | | | | — | |
| Less distributions: | | | | | | | | | | |
| From net investment income | | | | (0.15 | ) | | | | (0.13 | ) |
| Tax return of capital | | | | — | | | | | — | |
| Total distributions | | | | (0.15 | ) | | | | (0.13 | ) |
| Net asset value per share, end of period | | | $ | 12.48 | | | | $ | 11.47 | |
| Total return | | | | 10.20 | % | | | | 9.33 | %(b) |
| Ratios/Supplemental Data | | | | | | | | | | |
| Net Assets at end of period (000) | | | $ | 120 | | | | $ | 109 | |
| Ratio of total expenses to average net assets | | | | 1.53 | % | | | | 1.47 | %(c) |
| Ratio of net investment income to average net assets | | | | 1.18 | % | | | | 1.49 | %(c) |
| Portfolio turnover (d) | | | | 28 | % | | | | 36 | % |
| (a) | Class A commenced operations on December 30, 2011. |
| (b) | Not annualized. |
| (c) | Annualized. |
| (d) | Portfolio turnover is calculated on the basis of the Fund as a whole, without distinguishing between classes of shares issued. |
The accompanying notes are an integral part of these financial statements.
114
Alpine Mutual Funds
Financial Highlights—Continued
(For a share outstanding throughout each year)
| | | Foundation Fund | |
| | | Year Ended October 31, | |
| | | 2013 | | | 2012 | | | 2011 | | | 2010 | | | 2009 | |
| Institutional Class: | | | | | | | | | | | | | | | | | | | | | | | | | |
| Net asset value per share, beginning of year | | | $ | 11.47 | | | | $ | 10.61 | | | | $ | 10.16 | | | | $ | 8.88 | | | | $ | 8.15 | |
| Income from investment operations: | | | | | | | | | | | | | | | | | | | | | | | | | |
| Net investment income | | | | 0.17 | | | | | 0.20 | | | | | 0.16 | | | | | 0.12 | | | | | 0.13 | (a) |
| Net realized and unrealized gain on investments | | | | 1.03 | | | | | 0.85 | | | | | 0.47 | | | | | 1.27 | | | | | 0.75 | |
| Total from investment operations | | | | 1.20 | | | | | 1.05 | | | | | 0.63 | | | | | 1.39 | | | | | 0.88 | |
| Redemption fees | | | | 0.00 | (b) | | | | — | | | | | 0.00 | (b) | | | | 0.00 | (b) | | | | 0.00 | (b) |
| Less distributions: | | | | | | | | | | | | | | | | | | | | | | | | | |
| From net investment income | | | | (0.18 | ) | | | | (0.19 | ) | | | | (0.18 | ) | | | | (0.11 | ) | | | | (0.13 | ) |
| Tax return of capital | | | | — | | | | | — | | | | | — | | | | | — | | | | | (0.02 | ) |
| Total distributions | | | | (0.18 | ) | | | | (0.19 | ) | | | | (0.18 | ) | | | | (0.11 | ) | | | | (0.15 | ) |
| Net asset value per share, end of year | | | $ | 12.49 | | | | $ | 11.47 | | | | $ | 10.61 | | | | $ | 10.16 | | | | $ | 8.88 | |
| Total return | | | | 10.56 | % | | | | 9.95 | % | | | | 6.19 | % | | | | 15.77 | % | | | | 11.03 | % |
| Ratios/Supplemental Data: | | | | | | | | | | | | | | | | | | | | | | | | | |
| Net Assets at end of year (000) | | | $ | 71,018 | | | | $ | 65,397 | | | | $ | 61,701 | | | | $ | 62,934 | | | | $ | 55,230 | |
| Ratio of total expenses to average net assets (c) | | | | 1.28 | % | | | | 1.21 | % | | | | 1.16 | % | | | | 1.23 | % | | | | 1.26 | % |
| Ratio of net investment income to average net assets | | | | 1.43 | % | | | | 1.79 | % | | | | 1.46 | % | | | | 1.22 | % | | | | 1.65 | % |
| Portfolio turnover (d) | | | | 28 | % | | | | 36 | % | | | | 34 | % | | | | 16 | % | | | | 41 | % |
| (a) | Net investment income per share is calculated using ending balances after consideration of adjustments for permanent book and tax differences. |
| (b) | The amount is less than $0.005 per share. |
| (c) | Ratio of total expenses to average net assets excluding interest expense after waivers and/or expense reimbursements was 1.28%, 1.21%, 1.16%, 1.23% and 1.26% for the years ended October 31, 2013, 2012, 2011, 2010 and 2009, respectively. |
| (d) | Portfolio turnover is calculated on the basis of the Fund as a whole, without distinguishing between classes of shares issued. |
The accompanying notes are an integral part of these financial statements.
115
Alpine Mutual Funds
Financial Highlights—Continued
(For a share outstanding throughout each year)
| | | Ultra Short Tax Optimized Income Fund | |
| | | Year Ended October 31, | |
| | | 2013 | | | 2012 | | | 2011 | | | 2010 | | | 2009 | |
| Class A Shares: | | | | | | | | | | | | | | | | | | | | |
| Net asset value per share, beginning of year | | $ | 10.10 | | | $ | 10.10 | | | | $10.10 | | | $ | 10.10 | | | $ | 10.05 | |
| Income from investment operations: | | | | | | | | | | | | | | | | | | | | |
| Net investment income | | | 0.03 | | | | 0.07 | | | | 0.16 | | | | 0.10 | | | | 0.30 | (a) |
| Net realized and unrealized gain (loss) on investments | | | (0.01 | ) | | | 0.00 | (b) | | | 0.00 | (b) | | | 0.01 | | | | 0.04 | |
| Total from investment operations | | | 0.02 | | | | 0.07 | | | | 0.16 | | | | 0.11 | | | | 0.34 | |
| Redemption fees | | | 0.00 | (b) | | | 0.00 | (b) | | | 0.00 | (b) | | | 0.00 | (b) | | | 0.00 | (b) |
| Less distributions: | | | | | | | | | | | | | | | | | | | | |
| From net investment income | | | (0.03 | ) | | | (0.07 | ) | | | (0.16 | ) | | | (0.11 | ) | | | (0.29 | ) |
| Total distributions | | | (0.03 | ) | | | (0.07 | ) | | | (0.16 | ) | | | (0.11 | ) | | | (0.29 | ) |
| Net asset value per share, end of year | | $ | 10.09 | | | $ | 10.10 | | | $ | 10.10 | | | $ | 10.10 | | | $ | 10.10 | |
| Total return | | | 0.21 | % | | | 0.70 | % | | | 1.61 | % | | | 1.05 | % | | | 3.40 | % |
| Ratios/Supplemental Data | | | | | | | | | | | | | | | | | | | | |
| Net Assets at end of year (000) | | $ | 305,193 | | | $ | 443,598 | | | $ | 358,284 | | | $ | 292,565 | | | $ | 211,643 | |
| Ratio of total expenses to average net assets: | | | | | | | | | | | | | | | | | | | | |
| Before waivers and/or expense reimbursements | | | 1.14 | % | | | 1.09 | % | | | 1.07 | % | | | 1.03 | % | | | 1.05 | % |
| After waivers and/or expense reimbursements | | | 0.86 | % | | | 0.90 | % | | | 0.88 | % | | | 0.78 | % | | | 0.85 | % |
| Ratio of net investment income to average net assets | | | 0.30 | % | | | 0.67 | % | | | 1.61 | % | | | 1.04 | % | | | 2.75 | % |
| Portfolio turnover (c) | | | 185 | % | | | 192 | % | | | 174 | % | | | 19 | % | | | 16 | % |
| (a) | Net investment income per share is calculated using ending balances after consideration of adjustments for permanent book and tax differences. |
| (b) | The amount is less than $0.005. |
| (c) | Portfolio turnover is calculated on the basis of the Fund as a whole, without distinguishing between classes of shares issued. Effective January 3, 2012, the share class was renamed Class A. |
The accompanying notes are an integral part of these financial statements.
116
Alpine Mutual Funds
Financial Highlights—Continued
(For a share outstanding throughout each year)
| | | Ultra Short Tax Optimized Income Fund | |
| | | Year Ended October 31, | |
| | | 2013 | | | 2012 | | | 2011 | | | 2010 | | | 2009 | |
| Institutional Class: | | | | | | | | | | | | | | | | | | | | |
| Net asset value per share, beginning of year | | $ | 10.05 | | | $ | 10.05 | | | $ | 10.05 | | | $ | 10.05 | | | $ | 10.00 | |
| Income from investment operations: | | | | | | | | | | | | | | | | | | | | |
| Net investment income | | | 0.06 | | | | 0.10 | | | | 0.19 | | | | 0.13 | | | | 0.31 | (a) |
| Net realized and unrealized gain (loss) on investments | | | (0.02 | ) | | | 0.00 | (b) | | | 0.00 | (b) | | | 0.00 | (b) | | | 0.05 | |
| Total from investment operations | | | 0.04 | | | | 0.10 | | | | 0.19 | | | | 0.13 | | | | 0.36 | |
| Redemption fees | | | 0.00 | (b) | | | 0.00 | (b) | | | 0.00 | (b) | | | 0.00 | (b) | | | 0.00 | (b) |
| Less distributions: | | | | | | | | | | | | | | | | | | | | |
| From net investment income | | | (0.06 | ) | | | (0.10 | ) | | | (0.19 | ) | | | (0.13 | ) | | | (0.31 | ) |
| Total distributions | | | (0.06 | ) | | | (0.10 | ) | | | (0.19 | ) | | | (0.13 | ) | | | (0.31 | ) |
| Net asset value per share, end of year | | $ | 10.03 | | | $ | 10.05 | | | $ | 10.05 | | | $ | 10.05 | | | $ | 10.05 | |
| Total return | | | 0.36 | % | | | 0.95 | % | | | 1.87 | % | | | 1.31 | % | | | 3.65 | % |
| Ratios/Supplemental Data: | | | | | | | | | | | | | | | | | | | | |
| Net Assets at end of year (000) | | $ | 933,294 | | | $ | 1,375,490 | | | $ | 1,265,829 | | | $ | 1,146,333 | | | $ | 1,462,217 | |
| Ratio of total expenses to average net assets: | | | | | | | | | | | | | | | | | | | | |
| Before waivers and/or expense reimbursements | | | 0.89 | % | | | 0.84 | % | | | 0.82 | % | | | 0.78 | % | | | 0.80 | % |
| After waivers and/or expense reimbursements | | | 0.61 | % | | | 0.65 | % | | | 0.63 | % | | | 0.53 | % | | | 0.60 | % |
| Ratio of net investment income to average net assets | | | 0.55 | % | | | 0.95 | % | | | 1.86 | % | | | 1.29 | % | | | 3.00 | % |
| Portfolio turnover (c) | | | 185 | % | | | 192 | % | | | 174 | % | | | 19 | % | | | 16 | % |
| (a) | Net investment income per share is calculated using ending balances after consideration of adjustments for permanent book and tax differences. |
| (b) | The amount is less than $0.005. |
| (c) | Portfolio turnover is calculated on the basis of the Fund as a whole, without distinguishing between classes of shares issued. Effective January 3, 2012, the share class was renamed Institutional Class. |
The accompanying notes are an integral part of these financial statements.
117
Alpine Mutual Funds
Financial Highlights—Continued
(For a share outstanding throughout each year)
| | | Municipal Money Market Fund | |
| | | Year Ended October 31, | |
| | | 2013 | | | 2012 | | | 2011 | | | 2010 | | | 2009 | |
| Investor Class: | | | | | | | | | | | | | | | | | | | | |
| Net asset value per share, beginning of year | | $ | 1.00 | | | $ | 1.00 | | | $ | 1.00 | | | $ | 1.00 | | | $ | 1.00 | |
| Income from investment operations: | | | | | | | | | | | | | | | | | | | | |
| Net investment income | | | 0.00 | (a) | | | 0.00 | (a) | | | 0.00 | (a) | | | 0.00 | (a) | | | 0.01 | (b) |
| Total from investment operations | | | 0.00 | (a) | | | 0.00 | (a) | | | 0.00 | (a) | | | 0.00 | (a) | | | 0.01 | |
| Less distributions: | | | | | | | | | | | | | | | | | | | | |
| From net investment income | | | (0.00 | )(a) | | | (0.00 | )(a) | | | (0.00 | )(a) | | | (0.00 | )(a) | | | (0.01 | ) |
| From net realized gains on investments | | | — | | | | — | | | | (0.00 | )(a) | | | — | | | | — | |
| Tax return of capital | | | — | | | | — | | | | — | | | | — | | | | 0.00 | (a) |
| Total distributions | | | (0.00 | )(a) | | | (0.00 | )(a) | | | (0.00 | )(a) | | | (0.00 | )(a) | | | (0.01 | ) |
| Net asset value per share, end of year | | $ | 1.00 | | | $ | 1.00 | | | $ | 1.00 | | | $ | 1.00 | | | $ | 1.00 | |
| Total return | | | 0.04 | % | | | 0.10 | % | | | 0.18 | % | | | 0.20 | % | | | 1.03 | % |
| Ratios/Supplemental Data: | | | | | | | | | | | | | | | | | | | | |
| Net Assets at end of year (000) | | $ | 170,413 | | | $ | 228,642 | | | $ | 310,058 | | | $ | 470,169 | | | $ | 789,832 | |
| Ratio of total expenses to average net assets | | | | | | | | | | | | | | | | | | | | |
| Before waivers and/or expense reimbursements (c) | | | 0.57 | % | | | 0.56 | % | | | 0.52 | % | | | 0.48 | % | | | 0.53 | % |
| After waivers and/or expense reimbursements (d) | | | 0.32 | % | | | 0.32 | % | | | 0.38 | % | | | 0.43 | % | | | 0.53 | % |
| Ratio of net investment income to average net assets | | | 0.04 | % | | | 0.10 | % | | | 0.18 | % | | | 0.20 | % | | | 0.99 | % |
| (a) | The amount is less than $0.005 per share. |
| | |
| (b) | Net investment income per share is calculated using ending balances after consideration of adjustments for permanent book and tax differences. |
| | |
| (c) | Ratio of total expenses to average net assets excluding interest expense before waivers and/or expense reimbursements was 0.57%, 0.56%, 0.52%, 0.48% and 0.53% for the years ended October 31, 2013, 2012, 2011, 2010 and 2009, respectively. |
| | |
| (d) | Ratio of total expenses to average net assets excluding interest expense after waivers and/or expense reimbursements was 0.32%, 0.32%, 0.38%, 0.43% and 0.53% for the years ended October 31, 2013, 2012, 2011, 2010 and 2009, respectively. |
| | |
| | Effective January 3, 2012, the Investor Class was renamed the Institutional Class and subsequently reverted to the Investor Class effective July 26, 2012. |
The accompanying notes are an integral part of these financial statements.
118
Alpine Mutual Funds
Financial Highlights—Continued
(For a share outstanding throughout each period)
| | | High Yield Managed
Duration Municipal
Fund |
| | | Period Ended
October 31, 2013 (a) |
| Class A Shares: | | | | | |
| Income from investment operations: | | | | | |
| Net asset value per share, beginning of period | | | $ | 10.00 | |
| Net investment income | | | | 0.05 | |
| Net realized and unrealized loss on investments | | | | (0.05 | ) |
| Total from investment operations | | | | 0.00 | |
| Redemption fees | | | | — | |
| Less distributions: | | | | | |
| Net investment income | | | | (0.05 | ) |
| Total distributions | | | | (0.05 | ) |
| Net asset value per share, end of period | | | $ | 9.95 | |
| Total return | | | | 0.01 | %(b) |
| Ratios/Supplemental Data | | | | | |
| Net Assets at end of period (000) | | | $ | 100 | |
| Ratio of total expenses to average net assets: | | | | | |
| Before waivers and/or expense reimbursements | | | | 1.91 | %(c) |
| After waivers and/or expense reimbursements | | | | 0.99 | %(c) |
| Ratio of net investment income to average net assets | | | | 1.21 | %(c) |
| Portfolio turnover (d) | | | | 117 | % |
| (a) | Class A commenced operations on June 3, 2013. |
| | |
| (b) | Not annualized. |
| | |
| (c) | Annualized. |
| | |
| (d) | Portfolio turnover is calculated on the basis of the Fund as a whole, without distinguishing between classes of shares issued. |
The accompanying notes are an integral part of these financial statements.
119
Alpine Mutual Funds
Financial Highlights—Continued
(For a share outstanding throughout each period)
| | | High Yield Managed
Duration Municipal
Fund |
| | | Period Ended
October 31, 2013 (a) |
| Institutional Class: | | | | | |
| Income from investment operations: | | | | | |
| Net asset value per share, beginning of period | | | $ | 10.00 | |
| Net investment income | | | | 0.06 | |
| Net realized and unrealized loss on investments | | | | (0.05 | ) |
| Total from investment operations | | | | 0.01 | |
| Redemption fees | | | | 0.00 | |
| Less distributions: | | | | | |
| Net investment income | | | | (0.06 | ) |
| Total distributions | | | | (0.06 | ) |
| Net asset value per share, end of period | | | $ | 9.95 | |
| Total return | | | | 0.11 | %(b) |
| Ratios/Supplemental Data: | | | | | |
| Net Assets at end of period (000) | | | $ | 19,915 | |
| Ratio of total expenses to average net assets: | | | | | |
| Before waivers and/or expense reimbursements | | | | 1.66 | %(c) |
| After waivers and/or expense reimbursements | | | | 0.74 | %(c) |
| Ratio of net investment income to average net assets | | | | 1.47 | %(c) |
| Portfolio turnover(d) | | | | 117 | % |
| (a) | Institutional Class commenced operations on June 3, 2013. |
| | |
| (b) | Not annualized. |
| | |
| (c) | Annualized. |
| | |
| (d) | Portfolio turnover is calculated on the basis of the Fund as a whole, without distinguishing between classes of shares issued. |
The accompanying notes are an integral part of these financial statements.
120
Alpine Mutual Funds
Notes to Financial Statements
October 31, 2013
| 1. | Organization: |
| | |
| | Alpine Series Trust (the “Series Trust”) was organized in 2001 as a Delaware Statutory Trust, and is registered under the Investment Company Act of 1940, as amended (the “1940 Act”), as an open-end management investment company. Alpine Income Trust (the “Income Trust”) was organized in 2002 as a Delaware Statutory Trust, and is registered under the 1940 Act, as an open-end management investment company. The Alpine Dynamic Dividend Fund, Alpine Accelerating Dividend Fund, Alpine Financial Services Fund, Alpine Innovators Fund, Alpine Transformations Fund and Alpine Foundation Fund are six separate funds of the Series Trust. The Alpine Ultra Short Tax Optimized Income Fund, Alpine Municipal Money Market Fund and Alpine High Yield Managed Duration Municipal Fund are three separate funds of the Income Trust. The Alpine Dynamic Dividend Fund, Alpine Accelerating Dividend Fund, Alpine Financial Services Fund, Alpine Innovators Fund, Alpine Transformations Fund, Alpine Foundation Fund, Alpine Municipal Money Market Fund, Alpine Ultra Short Tax Optimized Income Fund and Alpine High Yield Managed Duration Municipal Fund (individually referred to as a “Fund” and collectively, “the Funds”) are diversified funds. Alpine Woods Capital Investors, LLC (the “Adviser”) is a Delaware limited liability company and serves as the investment manager to the Funds. Alpine High Yield Managed Duration Municipal Fund commenced operations on June 3, 2013. |
| |
| 2. | Significant Accounting Policies: |
| | |
| | The following is a summary of significant accounting policies consistently followed by the Funds in the preparation of their financial statements. The policies are in conformity with accounting principles generally accepted in the United States of America (“GAAP”), which require management to make estimates and assumptions that affect amounts reported herein. Actual results could differ from those estimates. Changes in the economic environment, financial markets and any other parameters used in determining these estimates could cause actual results to differ. |
| |
| | A. Valuation of Securities: |
| | |
| | The net asset value (“NAV”) of shares of the Funds are calculated by dividing the value of the Funds’ net assets by the number of outstanding shares. NAV is determined each day the New York Stock Exchange (“NYSE”) is open as of the close of regular trading (normally, 4:00 p.m., Eastern time). In computing NAV, portfolio securities of the Funds are valued at their current market values determined on the basis of market quotations or if market quotations are not available or determined to be unreliable, through procedures and/or guidelines established by the Board of Trustees (“Board”). In computing the Funds’ NAV, equity securities that are traded on a securities exchange in the United States, except for option securities, are valued at the last reported sale price as of the time of valuation, or lacking any current reported sale at the time of valuation, at the mean between the most recent bid and asked quotations, or if market quotations are not available or determined to be unreliable, through procedures and/or guidelines established by the Board. Each option security traded on a securities exchange in the United States is valued at the last current reported sale price as of the time of valuation, or lacking any current reported sale at the time of valuation, the option is valued at the mid-point of the consolidated bid/ask quote for the option security. Municipal Investments are valued on the basis of prices provided by pricing services. In determining the value of a particular investment, pricing services may use certain information with respect to transactions in such investments, quotations from dealers, pricing matrices, market transactions in comparable investments and information with respect to various relationships between investments. Forward currency contracts are valued based on third-party vendor quotations. Each security traded in the over-the-counter market and quoted on the NASDAQ National Market System, is valued at the NASDAQ Official Closing Price (“NOCP”), as determined by NASDAQ, or lacking an NOCP, the last current reported sale price as of the time of valuation by NASDAQ, or lacking any current reported sale on NASDAQ at the time of valuation, at the mean between the most recent bid and asked quotations. Each over-the-counter option that is not traded through the Options Clearing Corporation is valued by the counterparty, or if the counterparty’s price is not readily available, then by using the Black-Scholes method. Debt securities are valued based on an evaluated mean price as furnished by pricing services approved by the Board, which may be based on market transactions for comparable securities and various relationships between securities that are generally recognized by institutional traders, a computerized matrix system, or appraisals derived from information concerning the securities or similar securities received from recognized dealers in those securities. Each other security traded over-the-counter is valued at the mean between the most recent bid and asked quotations. Short-term securities with maturities of 60 days or less are valued at amortized cost, which approximates fair value. |
121
Alpine Mutual Funds
Notes to Financial Statements—Continued
October 31, 2013
Equity securities that are principally traded in a foreign market are valued at the last current sale price at the time of valuation or lacking any current or reported sale, at the time of valuation, at the mean between the most recent bid and asked quotations as of the close of the appropriate exchange or other designated time. Trading in securities on European and Far Eastern securities exchanges and over-the-counter markets is normally completed at various times before the close of business on each day on which the NYSE is open. Trading of these securities may not take place on every NYSE business day. In addition, trading may take place in various foreign markets on Saturdays or on other days when the NYSE is not open and on which the Funds’ NAVs are not calculated. As stated above, if the market prices are not readily available or not reflective of the fair value of the security, as of the close of the regular trading on the NYSE, the security will be priced at fair value following procedures approved by the Board.
When market quotations are not readily available or when the valuation methods mentioned above are not reflective of a fair value of the security, the security is valued at fair value following procedures and/or guidelines approved by the Board. The Funds may also use fair value pricing, if the value of a security it holds is, pursuant to the Board guidelines, materially affected by events occurring before the Funds’ pricing time but after the close of the primary market or market transactions for comparable securities and various relationships between securities that are generally recognized by institutional traders, a computerized matrix system, or appraisals derived from information concerning the securities or similar securities received from recognized dealers in those securities. The Board has approved the use of a third-party pricing vendor’s proprietary fair value pricing model to assist in determining current valuation for foreign securities traded in markets that close prior to the NYSE. When fair value pricing is employed, the value of the portfolio security used to calculate the Funds’ NAVs may differ from quoted or official closing prices.
Fair Value Measurement:
In accordance with GAAP, the Funds use a three-tier hierarchy to establish classification of fair value measurements for disclosure purposes. Inputs refer broadly to the assumptions that market participants would use in pricing the asset or liability, including assumptions about risk. Inputs may be observable or unobservable. Observable inputs are inputs that reflect the assumptions market participants would use in pricing the asset or liability that are developed based on market data obtained from sources independent of the reporting entity. Unobservable inputs are inputs that reflect the reporting entities’ own assumptions about the assumptions market participants would use in pricing the asset or liability that are developed based on the best information available.
| · | Level 1 — | Quoted prices in active markets for identical investments. |
| · | Level 2 — | Other significant observable inputs (including quoted prices for similar instruments, interest rates, prepayment speeds, credit risk, yield curves, default rates, etc.). |
| · | Level 3 — | Significant unobservable inputs (including the Funds’ own assumptions in determining the fair value of investments). |
The availability of observable inputs can vary from security to security and is affected by a wide variety of factors, including, for example, the type of security, whether the security is new and not yet established in the marketplace, the liquidity of markets, and other characteristics particular to the security. To the extent that valuation is based on models or inputs that are less observable or unobservable in the market, the determination of fair value requires more judgment. Accordingly, the degree of judgment exercised in determining fair value is greatest for instruments categorized in Level 3.
The inputs used to measure fair value may fall into different levels of the fair value hierarchy. In such cases, for disclosure purposes, the level in the fair value hierarchy within which the fair value measurement falls in its entirety, is determined based on the lowest level input that is significant to the fair value measurement in its entirety.
Various inputs are used in determining the value of the Funds’ investments as of the reporting period end. The designated input levels are not necessarily an indication of the risk or liquidity associated with these investments. These inputs are categorized in the following hierarchy under GAAP.
The Funds use valuation techniques to measure fair value that are consistent with the market approach and/or income approach, depending on the type of security and the particular circumstance. The market approach uses prices and other relevant information generated by market transactions involving identical or comparable securities. The income approach uses valuation techniques to discount estimated future cash flows to present value.
122
Alpine Mutual Funds
Notes to Financial Statements—Continued
October 31, 2013
The following is a summary of the inputs used to value the Funds’ assets and liabilities carried at fair value as of October 31, 2013:
| | | Valuation Inputs | | | | |
| Dynamic Dividend Fund* | | Level 1 | | | Level 2 | | | Level 3 | | | Total Value | |
| Common Stocks | | | | | | | | | | | | | | | | |
| Consumer Discretionary | | $ | 27,042,575 | | | $ | — | | | $ | — | | | $ | 27,042,575 | |
| Consumer Staples | | | 26,460,792 | | | | — | | | | — | | | | 26,460,792 | |
| Energy | | | 22,811,243 | | | | — | | | | — | | | | 22,811,243 | |
| Financials | | | 47,721,073 | | | | 1,224,418 | | | | — | | | | 48,945,491 | |
| Health Care | | | 26,338,818 | | | | — | | | | — | | | | 26,338,818 | |
| Industrials | | | 36,724,348 | | | | — | | | | — | | | | 36,724,348 | |
| Information Technology | | | 28,551,773 | | | | — | | | | — | | | | 28,551,773 | |
| Materials | | | 11,148,617 | | | | — | | | | — | | | | 11,148,617 | |
| Real Estate Investment Trust | | | 3,700,000 | | | | — | | | | — | | | | 3,700,000 | |
| Telecommunication Services | | | 5,721,828 | | | | — | | | | — | | | | 5,721,828 | |
| Utilities | | | 9,868,926 | | | | — | | | | — | | | | 9,868,926 | |
| Equity-Linked Structured Notes | | | — | | | | 2,287,495 | | | | — | | | | 2,287,495 | |
| Convertible Bonds | | | — | | | | 7,066 | | | | — | | | | 7,066 | |
| Total | | $ | 246,089,993 | | | $ | 3,518,979 | | | $ | — | | | $ | 249,608,972 | |
| | | Valuation Inputs | | | | |
| Other Financial Instruments | | Level 1 | | | Level 2 | | | Level 3 | | | Total Value | |
| Assets | | | | | | | | | | | | | | | | |
| Forward Currency Contracts | | $ | — | | | $ | 15,947 | | | $ | — | | | $ | 15,947 | |
| Liabilities | | | | | | | | | | | | | | | | |
| Forward Currency Contracts | | | — | | | | (212,750 | ) | | | — | | | | (212,750 | ) |
| Total | | $ | — | | | $ | (196,803 | ) | | $ | — | | | $ | (196,803 | ) |
| | | Valuation Inputs | | | | |
| Accelerating Dividend Fund* | | Level 1 | | | Level 2 | | | Level 3 | | | Total Value | |
| Common Stocks | | $ | 4,135,958 | | | $ | — | | | $ | — | | | $ | 4,135,958 | |
| Short-Term Investment | | | — | | | | 226,000 | | | | — | | | | 226,000 | |
| Total | | $ | 4,135,958 | | | $ | 226,000 | | | $ | — | | | $ | 4,361,958 | |
123
Alpine Mutual Funds
Notes to Financial Statements—Continued
October 31, 2013
| | | Valuation Inputs | | | | |
| Financial Services Fund* | | Level 1 | | | Level 2 | | | Level 3 | | | Total Value | |
| Common Stocks | | | | | | | | | | | | | | | | |
| Capital Markets | | $ | 3,766,477 | | | $ | — | | | $ | — | | | $ | 3,766,477 | |
| Commercial Banks | | | 7,233,358 | | | | 244,861 | | | | — | | | | 7,478,219 | |
| Commercial Services & Supplies | | | 61,936 | | | | — | | | | — | | | | 61,936 | |
| Consumer Finance | | | 767,316 | | | | — | | | | — | | | | 767,316 | |
| Diversified Financial Services | | | 1,238,033 | | | | — | | | | — | | | | 1,238,033 | |
| Household Durables | | | 282,000 | | | | — | | | | — | | | | 282,000 | |
| IT Services | | | 275,634 | | | | — | | | | — | | | | 275,634 | |
| Insurance | | | 1,363,217 | | | | — | | | | — | | | | 1,363,217 | |
| Internet Software & Services | | | 29,750 | | | | — | | | | — | | | | 29,750 | |
| Real Estate Investment Trusts | | | 2,580,020 | | | | — | | | | — | | | | 2,580,020 | |
| Real Estate Management & Development | | | 144,567 | | | | — | | | | — | | | | 144,567 | |
| Thrifts & Mortgage Finance | | | 1,607,135 | | | | — | | | | — | | | | 1,607,135 | |
| Trading Companies & Distributors | | | 171,934 | | | | — | | | | — | | | | 171,934 | |
| Investment Companies | | | 254,730 | | | | — | | | | — | | | | 254,730 | |
| Short-Term Investment | | | — | | | | 857,000 | | | | — | | | | 857,000 | |
| Total | | $ | 19,776,107 | | | $ | 1,101,861 | | | $ | — | | | $ | 20,877,968 | |
| | | Valuation Inputs | | | | |
| Innovators Fund* | | Level 1 | | | Level 2 | | | Level 3 | | | Total Value | |
| Common Stocks | | $ | 11,734,403 | | | $ | — | | | $ | — | | | $ | 11,734,403 | |
| Short-Term Investment | | | — | | | | 1,273,000 | | | | — | | | | 1,273,000 | |
| Total | | $ | 11,734,403 | | | $ | 1,273,000 | | | $ | — | | | $ | 13,007,403 | |
| | | Valuation Inputs | | | | |
| Transformations Fund* | | Level 1 | | | Level 2 | | | Level 3 | | | Total Value | |
| Common Stocks | | $ | 7,037,341 | | | $ | — | | | $ | — | | | $ | 7,037,341 | |
| Short-Term Investment | | | — | | | | 401,000 | | | | — | | | | 401,000 | |
| Total | | $ | 7,037,341 | | | $ | 401,000 | | | $ | — | | | $ | 7,438,341 | |
| | | Valuation Inputs | | | | |
| Foundation Fund* | | Level 1 | | | Level 2 | | | Level 3 | | | Total Value | |
| Common Stocks | | $ | 49,725,264 | | | $ | — | | | $ | — | | | $ | 49,725,264 | |
| Bonds | | | — | | | | 15,676,562 | | | | — | | | | 15,676,562 | |
| Short-Term Investment | | | — | | | | 2,343,000 | | | | — | | | | 2,343,000 | |
| Total | | $ | 49,725,264 | | | $ | 18,019,562 | | | $ | — | | | $ | 67,744,826 | |
| | | Valuation Inputs | | | | |
| Ultra Short Tax Optimized Income Fund* | | Level 1 | | | Level 2 | | | Level 3 | | | Total Value | |
| Municipal Bonds | | $ | — | | | $ | 1,288,681,312 | | | $ | — | | | $ | 1,288,681,312 | |
| Money Market Fund | | | — | | | | 69,171 | | | | — | | | | 69,171 | |
| Total | | $ | — | | | $ | 1,288,750,483 | | | $ | — | | | $ | 1,288,750,483 | |
124
Alpine Mutual Funds
Notes to Financial Statements—Continued
October 31, 2013
| | | Valuation Inputs | | | | |
| Municipal Money Market Fund* | | Level 1 | | | Level 2 | | | Level 3 | | | Total Value | |
| Municipal Bonds | | $ | — | | | $ | 170,361,118 | | | $ | — | | | $ | 170,361,118 | |
| Money Market Fund | | | — | | | | 47,645 | | | | — | | | | 47,645 | |
| Total | | $ | — | | | $ | 170,408,763 | | | $ | — | | | $ | 170,408,763 | |
| | | Valuation Inputs | | | | |
| High Yield Managed Duration Municipal Fund* | | Level 1 | | | Level 2 | | | Level 3 | | | Total Value | |
| Municipal Bonds | | $ | — | | | $ | 19,199,059 | | | $ | — | | | $ | 19,199,059 | |
| Short-Term Investment | | | — | | | | 73,682 | | | | — | | | | 73,682 | |
| Total | | $ | — | | | $ | 19,272,741 | | | $ | — | | | $ | 19,272,741 | |
* For detailed country, sector, and state descriptions, see accompanying Schedule of Portfolio Investments.
For the year ended October 31, 2013 (period ended October 31, 2013, for High Yield Managed Duration Municipal Fund), there were no transfers between Level 1, Level 2 and Level 3.
The following is a reconciliation of Level 3 assets for which significant unobservable inputs were used to determine fair value:
| | | Dynamic
Dividend
Fund | |
| Balance as of October 31, 2012 | | $ | 287,601 | |
| Realized gain (loss) | | | (5,816,757 | ) |
| Change in unrealized appreciation* | | | 5,701,472 | |
| Purchases | | | — | |
| Sales | | | (172,316 | ) |
| Transfers in to Level 3** | | | — | |
| Transfers out of Level 3** | | | — | |
| Balance as of October 31, 2013 | | | — | |
| | | | | |
Change in net unrealized appreciation/(depreciation) on
Level 3 holdings held at year end | | | — | |
| * | Statements of Operations Location: Change in net unrealized appreciation/(depreciation) on investments |
| ** | The Funds recognize transfers as of the beginning of the year. |
B. Security Transactions and Investment Income:
Security transactions are accounted for on a trade date basis. Realized gains and losses are computed on the identified cost basis. Dividend income is recorded on the ex-dividend date or in the case of some foreign securities, on the date thereafter when the Funds are made aware of the dividend. Interest income is recorded on the accrual basis and includes accretion of discounts and amortization of premiums, where applicable. To the extent any issuer defaults or a credit event occurs that impacts the issuer, the Funds may halt any additional interest income accruals and consider the realizability of interest accrued up to the date of default or credit event.
C. Line of Credit and Custody Overdrafts:
On December 1, 2010, each of the Series Trust and Income Trust entered into a lending agreement with BNP Paribas through its New York branch (“BNPP NY”). Loans in aggregate, whether to cover overdrafts or for investment purposes, may not exceed the maximum amount that is permitted under the 1940 Act. The terms of the lending agreement indicate the rate to be the Fed Funds rate plus 0.95% per annum on amounts borrowed. The BNP Paribas Facility provides for secured, uncommitted lines of credit for the Funds where selected Funds’ are pledged against advances made to the respective Fund. Each Fund is permitted to borrow up to 33.33% of its total assets for extraordinary or emergency purposes. Additionally, each of the following Funds is permitted to borrow up to 10% of its total assets for investment purposes but in no case shall any Fund’s total outstanding borrowings exceed 33.33%
125
Alpine Mutual Funds
Notes to Financial Statements—Continued
October 31, 2013
of their respective total assets. Either BNPP NY or the Funds may terminate this agreement upon delivery of written notice. For the year ended October 31, 2013 (period ended October 31, 2013, for High Yield Managed Duration Municipal Fund), the average interest rate paid on outstanding borrowings under the line of credit was 1.06%, 1.05% and 1.04% for the Dynamic Dividend Fund, Accelerating Dividend Fund and Financial Services Fund respectively. The Funds may also incur interest expense on custody overdraft charges.
| | | Dynamic
Dividend
Fund | | | Accelerating
Dividend
Fund | | | Financial
Services
Fund | | | Innovators
Fund | |
Total line of credit amount available for investment purposes at
October 31, 2013 | | | 26,501,986 | | | | 439,928 | | | | 2,143,593 | | | | 1,338,334 | |
| Line of credit outstanding at October 31, 2013 | | | 11,413,127 | | | | — | | | | — | | | | — | |
| Line of credit amount unused at October 31, 2013 | | | 15,088,859 | | | | 439,928 | | | | 2,143,593 | | | | 1,338,334 | |
| Average balance outstanding during the year | | | 7,148,058 | | | | 2,984 | | | | 119,971 | | | | — | |
| Maximum balance outstanding during the year | | | 24,754,891 | | | | 377,295 | | | | 1,965,973 | | | | — | |
| Interest expense incurred on line of credit during the year | | | 77,152 | | | | 32 | | | | 1,269 | | | | — | |
| Interest expense incurred on custody overdrafts during the year | | | 466 | | | | 21 | | | | 13 | | | | — | |
| | | Transformations
Fund | | | Foundation
Fund | | | Municipal
Money
Market | | | High Yield
Managed
Duration
Municipal Fund | |
| Total line of credit amount available for investment purposes at October 31, 2013 | | | 769,595 | | | | 7,177,093 | | | | 17,056,434 | | | | 2,046,813 | |
| Line of credit outstanding at October 31, 2013 | | | — | | | | — | | | | — | | | | — | |
| Line of credit amount unused at October 31, 2013 | | | 769,595 | | | | 7,177,093 | | | | 17,056,434 | | | | 2,046,813 | |
| Average balance outstanding during the year | | | — | | | | — | | | | — | | | | — | |
| Maximum balance outstanding during the year | | | — | | | | — | | | | — | | | | — | |
| Interest expense incurred on line of credit during the year | | | — | | | | — | | | | — | | | | — | |
| Interest expense incurred on custody overdrafts during the year | | | — | | | | 3 | | | | 549 | | | | 35 | |
The line of credit outstanding as of October 31, 2013 approximates its fair value and would be categorized at Level 2.
D. Federal and Other Income Taxes:
It is each Fund’s policy to comply with the Federal income and excise tax requirements of the Internal Revenue Code of 1986 (the “Code”), as amended, applicable to regulated investment companies and to distribute timely, all of its investment company taxable income and net realized capital gains to shareholders in accordance with the timing requirements imposed by the Code. Therefore, no Federal income tax provision is required. Capital gains realized on some foreign securities are subject to foreign taxes. Dividends and interest from non-U.S. sources received by the Funds are generally subject to non-U.S. withholding taxes at rates ranging up to 30%. Such capital gains and withholding taxes, which are accrued as applicable, may be reduced or eliminated under the terms of applicable U.S. income tax treaties, and the Funds intend to undertake procedural steps to claim the benefits of such treaties. Where available, the Funds will file refund claims for foreign taxes withheld.
Management has analyzed the Funds’ tax positions taken on income tax returns for all open tax years and has concluded that as of October 31, 2013, no provision for income tax is required in the Funds’ financial statements. The Funds’ Federal and state income and Federal excise tax returns for tax years for which the applicable statutes of limitations have not expired are subject to examination by the Internal Revenue Service and state departments of revenue. As of October 31, 2013, open Federal and New York tax years include the tax years ended October 31, 2010 through 2013.
GAAP requires that certain components of net assets be reclassified to reflect permanent differences between financial and tax reporting. These reclassifications have no effect on net assets or net asset values per share.
126
Alpine Mutual Funds
Notes to Financial Statements—Continued
October 31, 2013
E. Distributions to Shareholders:
Each of the Dynamic Dividend, Accelerating Dividend, Financial Services, Innovators, Transformations, Foundation, Ultra Short Tax Optimized Income, and High Yield Managed Duration Municipal Funds intends to distribute all of its net investment income and net realized capital gains, if any, throughout the year to its shareholders in the form of dividends. The Municipal Money Market Fund declares and accrues dividends daily on each business day based upon the Fund’s net income, and pays dividends monthly. Distributions to shareholders are recorded at the close of business on the ex-dividend date. All dividends are automatically reinvested in full and fractional shares of the respective Funds at net asset value per share, unless otherwise requested.
The amounts of dividends from net investment income and of distributions from net realized gains are determined in accordance with Federal income tax regulations, which may differ from GAAP. These differences are either considered temporary or permanent in nature. To the extent these differences are permanent in nature, such amounts are reclassified within the composition of net assets based on their Federal tax-basis treatment; temporary differences do not require reclassification. In the event dividends and distributions to shareholders exceed net investment income and net realized gains for tax purposes, they are reported as returns of capital.
F. Class Allocations:
Income, expenses (other than class specific expenses) and realized and unrealized gains and losses are allocated among the classes of the Funds based on the relative net assets of each class. Class specific expenses are allocated to the class to which they relate. Currently, class specific expenses are limited to those incurred under the Distribution Plan for Class A shares (formerly Adviser Class shares for the Ultra Short Tax Optimized Income Fund).
G. Foreign Currency Translation Transactions:
Each of the Dynamic Dividend, Accelerating Dividend, Financial Services and Transformations Funds may invest without limitation in foreign securities. The Innovators Fund and Foundation Fund may invest up to 20% and 15%, respectively, of the value of its net assets in foreign securities. The books and records of each Fund are maintained in U.S. dollars. Non-U.S. dollar-denominated amounts are translated into U.S. dollars as follows, with the resultant translation gains and losses recorded in the Statements of Operations:
| i) | market value of investment securities and other assets and liabilities at the exchange rate on the valuation date, |
| | |
| ii) | purchases and sales of investment securities, income and expenses at the exchange rate prevailing on the respective date of such transactions. |
H. Risks Associated with Foreign Securities and Currencies:
Investments in securities of foreign issuers carry certain risks not ordinarily associated with investments in securities of domestic issuers. Such risks include future political and economic developments and the possible imposition of exchange controls or other foreign governmental laws and restrictions. In addition, with respect to certain countries, there is a possibility of expropriation of assets, confiscatory taxation, political or social instability or diplomatic developments, which could adversely affect investments in those countries.
Certain countries may also impose substantial restrictions on investments in their capital markets by foreign entities, including restrictions on investments in issuers or industries deemed sensitive to relevant national interests. These factors may limit the investment opportunities available to the Funds are or result in a lack of liquidity and high price volatility with respect to securities of issuers from developing countries.
I. Equity-Linked Structured Notes:
The Funds may invest in equity-linked structured notes. Equity-linked structured notes are securities which are specially designed to combine the characteristics of one or more underlying securities and their equity derivatives in a single note form. The return and/or yield or income component may be based on the performance of the underlying equity securities, and equity index, and/or option positions. Equity-linked structured notes are typically offered in limited transactions by financial institutions in either registered or non-registered form. An investment in equity-linked structured notes creates exposure to the credit risk of the issuing financial institution, as well as to the market risk of the underlying securities. There is no guaranteed return of principal with these securities and the appreciation potential of these securities may be limited by a maximum payment or call right. In certain cases, equity-linked structured notes may be more volatile and less liquid than less complex securities or other types of fixed-income securities. Such securities may exhibit price behavior that does not correlate with other fixed-income securities.
127
Alpine Mutual Funds
Notes to Financial Statements—Continued
October 31, 2013
The Dynamic Dividend Fund held 1 equity-linked structured note at October 31, 2013.
J. Forward Currency Contracts:
The Funds are subject to foreign currency exchange rate risk in the normal course of pursuing their investment objectives. The Funds may use forward currency contracts to gain exposure to or economically hedge against changes in the value of foreign currencies. A forward currency contract (“forward”) is an agreement between two parties to buy and sell a currency at a set price on a future date. The market value of the forward contract fluctuates with changes in forward currency exchange rates. The forward contract is marked-to-market daily and the change in market value is recorded by each Fund as unrealized appreciation or depreciation. When the forward contract is closed, a Fund records a realized gain or loss equal to the fluctuation in value during the period the forward contract was open. A Fund could be exposed to risk if a counterparty is unable to meet the terms of a forward or if the value of the currency changes unfavorably. During the year ended October 31, 2013, the Dynamic Dividend Fund entered into 6 forward currency contracts.
The following forward currency contracts were held at October 31, 2013:
Dynamic Dividend Fund
| Description | | Settlement
Date | | Currency | | Settlement
Value | | | Current
Value | | | Unrealized
Gain/(Loss) | |
| Contracts Sold: | | | | | | | | | | | | | | | | | |
| Swiss Franc | | 12/17/13 | | 8,950,000 CHF | | $ | 9,675,048 | | | $ | 9,867,395 | | | | $ | (192,347 | ) |
| British Pound | | 12/17/13 | | 1,600,000 GBP | | | 2,544,208 | | | | 2,564,611 | | | | | (20,403 | ) |
| Japanese Yen | | 01/29/14 | | 805,000,000 JPY | | | 8,207,334 | | | | 8,191,387 | | | | | 15,947 | |
| | | | | | | | | | | $ | 20,623,393 | | | | $ | (196,803 | ) |
K. Derivative Instruments and Hedging Activities:
The following tables provide information about the effect of derivatives and hedging activities on the Funds’ Statements of Assets and Liabilities and Statements of Operations as of and for the year ended October 31, 2013. The first table provides additional detail about the amounts and sources of unrealized appreciation/depreciation on derivatives at the end of the period. The second table provides additional information about the amounts and sources of net realized gain (loss) and the change in unrealized appreciation/depreciation resulting from the Funds’ derivatives and hedging activities during the period.
The effect of derivative instruments on the Statements of Assets and Liabilities as of October 31, 2013:
Dynamic Dividend Fund
| Derivatives | | Statement of Assets
and Liabilities Location | | Unrealized
Appreciation/(Depreciation) |
| Foreign exchange risk | | Unrealized appreciation on forward currency contracts | | | $ | 15,947 | |
| Foreign exchange risk | | Unrealized depreciation on forward currency contracts | | | | (212,750 | ) |
| Total | | | | | $ | (196,803 | ) |
The effect of derivative instruments on the Statements of Operations for the year ended October 31, 2013:
Dynamic Dividend Fund
| Derivatives | | Statement of
Operations Location | | Net Realized Loss | | Change in Net
Unrealized Depreciation |
| Foreign exchange risk | | Net realized gain (loss) from foreign currency transactions / | | | | | | | | |
| | | Change in net unrealized appreciation/(depreciation) on foreign currency translations | | $ | (756,261 | ) | | $ | (196,803 | ) |
128
Alpine Mutual Funds
Notes to Financial Statements—Continued
October 31, 2013
L. Redemption Fees:
The Funds of the Alpine Series Trust impose a redemption fee of 1% of the total redemption amount on all Fund shares redeemed or exchanged within 60 days of buying them, either by purchase or exchange. This fee is assessed and retained by the Funds for the benefit of the remaining shareholders. The redemption fee is accounted for as an increase to paid-in-capital. The Alpine Ultra Short Tax Optimized Income Fund and Alpine High Yield Managed Duration Municipal Fund of the Alpine Income Trust, impose a 0.25% redemption fee for shares redeemed or exchanged within 30 days of buying them and 0.75% redemption fee for shares redeemed or exchanged within 60 days of buying them respectively of the total redemption amount on all Fund shares redeemed or exchanged. This fee is assessed and retained by the Funds for the benefit of the remaining shareholders. The redemption fee is accounted for as an increase to paid-in-capital. There is no redemption fee assessed on the Alpine Municipal Money Market Fund redemptions.
| 3. | Capital Share Transactions: |
| | |
| | The Funds have an unlimited number of shares of beneficial interest, with $0.0001 par value, authorized. Transactions in shares and dollars of the Funds were as follows: |
Dynamic Dividend Fund
| | | Year Ended
October 31, 2013 | | | Year Ended
October 31, 2012* | |
| | | Shares | | | Amount | | | Shares | | | Amount | |
| Class A | | | | | | | | | | | | | | | | |
| Shares sold | | | 438,000 | | | $ | 1,581,034 | | | | 456,050 | | | $ | 1,637,308 | |
| Shares issued in reinvestment of dividends | | | 16,275 | | | | 57,807 | | | | 6,286 | | | | 22,331 | |
| Redemption fees | | | — | | | | 271 | | | | — | | | | 5 | |
| Shares redeemed | | | (259,548 | ) | | | (953,912 | ) | | | (18 | ) | | | (64 | ) |
| Total net change | | | 194,727 | | | $ | 685,200 | | | | 462,318 | | | $ | 1,659,580 | |
| | | | | | | | | | | | | | | | | |
| Institutional Class | | | | | | | | | | | | | | | | |
| Shares sold | | | 4,626,855 | | | $ | 16,410,716 | | | | 8,777,004 | | | $ | 32,015,536 | |
| Shares issued in reinvestment of dividends | | | 4,374,413 | | | | 15,422,518 | | | | 9,535,812 | | | | 34,357,087 | |
| Redemption fees | | | — | | | | 32,998 | | | | — | | | | 39,095 | |
| Shares redeemed | | | (44,820,185 | ) | | | (159,446,914 | ) | | | (36,781,852 | ) | | | (134,334,677 | ) |
| Total net change | | | (35,818,917 | ) | | $ | (127,580,682 | ) | | | (18,469,036 | ) | | $ | (67,922,959 | ) |
Accelerating Dividend Fund
| | | Year Ended
October 31, 2013 | | | Year Ended
October 31, 2012* | |
| | | Shares | | | Amount | | | Shares | | | Amount | |
| Class A | | | | | | | | | | | | | | | | |
| Shares sold | | | 43,398 | | | $ | 607,223 | | | | 19,671 | | | $ | 241,728 | |
| Shares issued in reinvestment of dividends | | | 920 | | | | 12,580 | | | | 261 | | | | 3,324 | |
| Redemption fees | | | — | | | | 1,502 | | | | — | | | | — | |
| Shares redeemed | | | (3,889 | ) | | | (54,858 | ) | | | — | | | | — | |
| Total net change | | | 40,429 | | | $ | 566,447 | | | | 19,932 | | | $ | 245,052 | |
| | | | | | | | | | | | | | | | | |
| Institutional Class | | | | | | | | | | | | | | | | |
| Shares sold | | | 115,324 | | | $ | 1,681,377 | | | | 26,137 | | | $ | 333,967 | |
| Shares issued in reinvestment of dividends | | | 11,768 | | | | 158,067 | | | | 15,818 | | | | 194,859 | |
| Redemption fees | | | — | | | | 5,960 | | | | — | | | | — | |
| Shares redeemed | | | (69,439 | ) | | | (1,032,609 | ) | | | (125,455 | ) | | | (1,603,733 | ) |
| Total net change | | | 57,653 | | | $ | 812,795 | | | | (83,500 | ) | | $ | (1,074,907 | ) |
129
Alpine Mutual Funds
Notes to Financial Statements—Continued
October 31, 2013
Financial Services Fund
| | | Year Ended
October 31, 2013 | | | Year Ended
October 31, 2012* | |
| | | Shares | | | Amount | | | Shares | | | Amount | |
| Class A | | | | | | | | | | | | |
| Shares sold | | | 630,668 | | | $ | 6,630,199 | | | | 160,783 | | | $ | 1,333,401 | |
| Shares issued in reinvestment of dividends | | | — | | | | — | | | | — | | | | — | |
| Redemption fees | | | — | | | | 9,309 | | | | — | | | | 98 | |
| Shares redeemed | | | (181,877 | ) | | | (2,017,493 | ) | | | (3,644 | ) | | | (30,725 | ) |
| Total net change | | | 448,791 | | | $ | 4,622,015 | | | | 157,139 | | | $ | 1,302,774 | |
| | | | | | | | | | | | | | | | | |
| Institutional Class | | | | | | | | | | | | | | | | |
| Shares sold | | | 670,949 | | | $ | 6,828,522 | | | | 277,896 | | | $ | 2,278,757 | |
| Shares issued in reinvestment of dividends | | | — | | | | — | | | | 1,755 | | | | 11,966 | |
| Redemption fees | | | — | | | | 23,701 | | | | — | | | | 2,184 | |
| Shares redeemed | | | (564,902 | ) | | | (5,679,360 | ) | | | (141,591 | ) | | | (1,088,482 | ) |
| Total net change | | | 106,047 | | | $ | 1,172,863 | | | | 138,060 | | | $ | 1,204,425 | |
Innovators Fund
| | | Year Ended
October 31, 2013 | | | Year Ended
October 31, 2012* | |
| | | Shares | | | Amount | | | Shares | | | Amount | |
| Class A | | | | | | | | | | | | | | | | |
| Shares sold | | | — | | | $ | — | | | | 12,839 | | | $ | 137,564 | |
| Shares issued in reinvestment of dividends | | | — | | | | — | | | | — | | | | — | |
| Redemption fees | | | — | | | | — | | | | — | | | | — | |
| Shares redeemed | | | — | | | | — | | | | (3,006 | ) | | | (33,972 | ) |
| Total net change | | | — | | | $ | — | | | | 9,833 | | | $ | 103,592 | |
| | | | | | | | | | | | | | | | | |
| Institutional Class | | | | | | | | | | | | | | | | |
| Shares sold | | | 17,099 | | | $ | 211,505 | | | | 126,183 | | | $ | 1,497,500 | |
| Shares issued in reinvestment of dividends | | | — | | | | — | | | | — | | | | — | |
| Redemption fees | | | — | | | | 302 | | | | — | | | | 769 | |
| Shares redeemed | | | (116,859 | ) | | | (1,473,954 | ) | | | (156,924 | ) | | | (1,816,276 | ) |
| Total net change | | | (99,760 | ) | | $ | (1,262,147 | ) | | | (30,741 | ) | | $ | (318,007 | ) |
Transformations Fund
| | | Year Ended
October 31, 2013 | | | Year Ended
October 31, 2012* | |
| | | Shares | | | Amount | | | Shares | | | Amount | |
| Class A | | | | | | | | | | | | | | | | |
| Shares sold | | | — | | | $ | — | | | | 8,913 | | | $ | 100,000 | |
| Shares issued in reinvestment of dividends | | | 58 | | | | 722 | | | | — | | | | — | |
| Redemption fees | | | — | | | | — | | | | — | | | | 11 | |
| Shares redeemed | | | — | | | | — | | | | — | | | | — | |
| Total net change | | | 58 | | | $ | 722 | | | | 8,913 | | | $ | 100,011 | |
130
Alpine Mutual Funds
Notes to Financial Statements—Continued
October 31, 2013
| | | Year Ended
October 31, 2013 | | | Year Ended
October 31, 2012 | |
| | | Shares | | | Amount | | | Shares | | | Amount | |
| Institutional Class | | | | | | | | | | | | | | | | |
| Shares sold | | | 6,493 | | | $ | 85,651 | | | | 104,367 | | | $ | 1,299,604 | |
| Shares issued in reinvestment of dividends | | | 3,340 | | | | 41,150 | | | | — | | | | — | |
| Redemption fees | | | — | | | | 754 | | | | — | | | | 794 | |
| Shares redeemed | | | (55,827 | ) | | | (716,428 | ) | | | (120,219 | ) | | | (1,446,510 | ) |
| Total net change | | | (45,994 | ) | | $ | (588,873 | ) | | | (15,852 | ) | | $ | (146,112 | ) |
Foundation Fund
| | | Year Ended
October 31, 2013 | | | Year Ended
October 31, 2012* | |
| | | Shares | | | Amount | | | Shares | | | Amount | |
| Class A | | | | | | | | | | | | | | | | |
| Shares sold | | | — | | | $ | — | | | | 9,431 | | | $ | 100,066 | |
| Shares issued in reinvestment of dividends | | | 122 | | | | 1,443 | | | | 107 | | | | 1,213 | |
| Redemption fees | | | — | | | | — | | | | — | | | | — | |
| Shares redeemed | | | — | | | | — | | | | (6 | ) | | | (65 | ) |
| Total net change | | | 122 | | | $ | 1,443 | | | | 9,532 | | | $ | 101,214 | |
| | | | | | | | | | | | | | | | | |
| Institutional Class | | | | | | | | | | | | | | | | |
| Shares sold | | | 6,872 | | | $ | 80,791 | | | | 7,258 | | | $ | 79,144 | |
| Shares issued in reinvestment of dividends | | | 84,305 | | | | 999,702 | | | | 94,587 | | | | 1,056,106 | |
| Redemption fees | | | — | | | | 24 | | | | — | | | | — | |
| Shares redeemed | | | (104,909 | ) | | | (1,253,455 | ) | | | (218,815 | ) | | | (2,425,362 | ) |
| Total net change | | | (13,732 | ) | | $ | (172,938 | ) | | | (116,970 | ) | | $ | (1,290,112 | ) |
Ultra Short Tax Optimized Income Fund
| | | Year Ended
October 31, 2013 | | | Year Ended
October 31, 2012** | |
| | | Shares | | | Amount | | | Shares | | | Amount | |
| Class A | | | | | | | | | | | | | | | | |
| Shares sold | | | 12,132,904 | | | $ | 122,515,170 | | | | 35,181,739 | | | $ | 355,543,788 | |
| Shares issued in reinvestment of dividends | | | 95,577 | | | | 965,011 | | | | 228,067 | | | | 2,303,615 | |
| Redemption fees | | | — | | | | 10,441 | | | | — | | | | 7,888 | |
| Shares redeemed | | | (25,877,405 | ) | | | (261,305,015 | ) | | | (26,962,596 | ) | | | (272,476,288 | ) |
| Total net change | | | (13,648,924 | ) | | $ | (137,814,393 | ) | | | 8,447,210 | | | $ | 85,379,003 | |
| | | | | | | | | | | | | | | | | |
| Institutional Class | | | | | | | | | | | | | | | | |
| Shares sold | | | 52,181,272 | | | $ | 523,938,733 | | | | 98,084,023 | | | $ | 985,826,904 | |
| Shares issued in reinvestment of dividends | | | 443,294 | | | | 4,450,048 | | | | 803,370 | | | | 8,073,867 | |
| Redemption fees | | | — | | | | 31,220 | | | | — | | | | 29,729 | |
| Shares redeemed | | | (96,484,972 | ) | | | (968,788,065 | ) | | | (87,961,885 | ) | | | (884,060,821 | ) |
| Total net change | | | (43,860,406 | ) | | $ | (440,368,064 | ) | | | 10,925,508 | | | $ | 109,869,679 | |
131
Alpine Mutual Funds
Notes to Financial Statements—Continued
October 31, 2013
Municipal Money Market Fund
| | | Year Ended
October 31, 2013 | | | Year Ended
October 31, 2012*** | |
| | | Shares | | | Amount | | | Shares | | | Amount | |
| Investor Class | | | | | | | | | | | | | | | | |
| Shares sold | | | 145,994,821 | | | $ | 145,994,821 | | | | 209,368,876 | | | $ | 209,368,876 | |
| Shares issued in reinvestment of dividends | | | 65,951 | | | | 65,951 | | | | 190,228 | | | | 190,228 | |
| Redemption fees | | | — | | | | — | | | | — | | | | — | |
| Shares redeemed | | | (204,289,468 | ) | | | (204,289,468 | ) | | | (290,975,342 | ) | | | (290,975,342 | ) |
| Total net change | | | (58,228,696 | ) | | $ | (58,228,696 | ) | | | (81,416,238 | ) | | $ | (81,416,238 | ) |
High Yield Managed Duration Municipal Fund
| | | Period Ended
October 31, 2013**** | | | | | | | | | |
| | | Shares | | | Amount | | | | | | | | | |
| Class A | | | | | | | | | | | | | | | | |
| Shares sold | | | 10,001 | | | $ | 100,010 | | | | | | | | | |
| Shares issued in reinvestment of dividends | | | 51 | | | | 508 | | | | | | | | | |
| Redemption fees | | | — | | | | — | | | | | | | | | |
| Shares redeemed | | | — | | | | — | | | | | | | | | |
| Total net change | | | 10,052 | | | $ | 100,518 | | | | | | | | | |
| | | | | | | | | | | | | | | | | |
| Institutional Class | | | | | | | | | | | | | | | | |
| Shares sold | | | 1,990,001 | | | $ | 19,900,010 | | | | | | | | | |
| Shares issued in reinvestment of dividends | | | 12,265 | | | | 121,832 | | | | | | | | | |
| Redemption fees | | | — | | | | — | | | | | | | | | |
| Shares redeemed | | | — | | | | — | | | | | | | | | |
| Total net change | | | 2,002,266 | | | $ | 20,021,842 | | | | | | | | | |
| * | Class A commenced operations on December 30, 2011. |
| ** | Effective January 3, 2012, the Adviser share class was renamed to Class A and Investor share class was renamed to Institutional Class. |
| *** | Effective January 3, 2012, the Investor Class was renamed the Institutional Class and subsequently reverted back to the Investor Class effective July 26, 2012. |
| **** | Class A and Institutional Class commenced operations on June 3, 2013. |
| | |
| 4. | Purchase and Sales of Securities: |
Purchases and sales of securities (excluding short-term securities) for the year ended October 31, 2013 (period ended October 31, 2013, for High Yield Managed Duration Municipal Fund) are as follows:
| | | | Non-U.S. Government | |
| | | Purchases | | | Sales | |
| Dynamic Dividend Fund | | $ | 558,162,840 | | | $ | 670,746,148 | |
| Accelerating Dividend Fund | | | 3,924,217 | | | | 2,573,406 | |
| Financial Services Fund | | | 22,359,428 | | | | 15,743,112 | |
| Innovators Fund | | | 3,971,786 | | | | 5,572,255 | |
| Transformations Fund | | | 3,600,888 | | | | 4,234,992 | |
| Foundation Fund | | | 14,441,859 | | | | 19,138,478 | |
| Ultra Short Tax Optimized Income Fund | | | 2,468,738,753 | | | | 2,843,927,892 | |
| High Yield Managed Duration Municipal Fund | | | 32,099,240 | | | | 15,175,000 | |
132
Alpine Mutual Funds
Notes to Financial Statements—Continued
October 31, 2013
Purchases and sales of U.S. Government Obligations (excluding short-term securities) for the year ended October 31, 2013 are as follows:
| | | | Purchases | | | Sales | |
| Foundation Fund | | | $3,026,250 | | | $— | |
| 5. | Distribution Plans: |
| | |
| | Quasar Distributors, LLC (“Quasar”) serves as each Funds’ distributor. Certain of the Funds have adopted distribution and servicing plans (the “Plans”) for their Class A shares (in the case of the Ultra Short Tax Optimized Income Fund formerly known as the Adviser Class) as allowed by Rule 12b-1 under the 1940 Act. The Plans authorize payments by the Funds in connection with the distribution and servicing of their Class A shares at an annual rate, as determined from time to time by the Board, of up to 0.25% of the average daily net assets of the Class A shares of the Funds. Amounts paid under the Plans by the Funds may be spent by the Funds on any activities or expenses primarily intended to result in the sale of Class A shares of the Funds, including but not limited to advertising, compensation for sales and marketing activities of financial institutions and others such as dealers and distributors, shareholder account servicing, the printing and mailing of prospectuses to other than current shareholders and the printing and mailing of sales literature. Dynamic Dividend Fund, Accelerating Dividend Fund, Financial Services Fund, Innovators Fund, Transformations Fund, Foundation Fund, Ultra Short Tax Optimized Income Fund and High Yield Managed Duration Municipal Fund incurred $4,933, $1,414, $11,737, $313, $293, $288, $921,568 and $104, respectively, pursuant to the Plans for the year ended October 31, 2013 (period ended October 31, 2013 for High Yield Managed Duration Municipal Fund). |
| | |
| | The Plans for the Funds may be terminated at any time by vote of the Trustees of the Trusts who are not “interested persons,” as defined by the 1940 Act, of the Trusts, or by vote of a majority of the outstanding voting shares of the respective class. |
| | |
| 6. | Investment Advisory Agreement and Other Affiliated Transactions: |
| | |
| | The Adviser provides investment advisory services to each of the Funds. Pursuant to the advisory agreements with the Funds, the Adviser is entitled to an annual fee based on 1.00% of each Fund’s average daily net assets for the Dynamic Dividend Fund, Accelerating Dividend Fund, Financial Services Fund, Innovators Fund, Transformations Fund and Foundation Fund. The Adviser is entitled to an annual fee based on 0.75% of the Ultra Short Tax Optimized Income Funds and High Yield Managed Duration Municipal Fund average daily net assets and an annual fee based on 0.45% of the Municipal Money Market Fund’s average daily net assets. The Adviser agreed to reimburse the Dynamic Dividend Fund, Accelerating Dividend Fund, Financial Services Fund, Innovators Fund, Transformations Fund and Foundation Fund to the extent necessary to ensure that ordinary operating expenses (including 12b-1 fees, where applicable, but excluding interest, brokerage commissions, acquired fund fees and extraordinary expenses) do not exceed annually 1.60% of each Fund’s Class A Shares average daily net assets, and 1.35% of each Fund’s Institutional Class Shares average daily net assets. The contractual expense cap for the Ultra Short Tax Optimized Income Fund Class A Shares (formerly, Adviser Class) and Ultra Short Tax Optimized Income Fund- Institutional Class Shares (formerly Investor Class) is 0.95% and 0.70%, respectively, at October 31, 2013. Additionally, the Adviser voluntarily agreed to reimburse the Ultra Short Tax Optimized Income Fund to the extent necessary to ensure that the Fund’s total operating expenses (including 12-b1 fees, where applicable, but excluding interest, brokerage commissions and extraordinary expenses) did not exceed certain limits. The limits ranged from 0.55% to 0.65% of the Fund’s average daily net assets during the year ended October 31, 2013. The Adviser may recover expenses paid in excess of the cap on expenses for the three previous years, as long as the recovery does not cause the Fund to exceed such cap on expenses. For the year ended October 31, 2013 (period ended October 31, 2013 for High Yield Managed Duration Municipal Fund), the Adviser waived investment advisory fees and other expenses totaling $144,069, $67,570, $58,369, $52,638, $58,060, $4,236,779 and $76,676 for the Dynamic Dividend Fund, Accelerating Dividend Fund, Financial Services Fund, Innovators Fund, Transformations Fund, Ultra Short Tax Optimized Income Fund and High Yield Managed Duration Municipal Fund, respectively. The expense limitations will remain in effect for each Fund through February 28, 2014 unless and until the Board of the Series and Income Trusts approves its modification or termination with respect to each Fund. Waived expenses subject to potential recovery by year of expiration are as follows: |
133
Alpine Mutual Funds
Notes to Financial Statements—Continued
October 31, 2013
| Year of Expiration | | Dynamic
Dividend
Fund | | Accelerating
Dividend
Fund | | Financial
Services
Fund | | Innovators
Fund | | Transformations
Fund | | Ultra Short
Tax Optimized
Income
Fund | | High-Yield
Managed
Duration
Municipal Fund |
| 10/31/2014 | | $ | — | | | $ | 35,094 | | | $ | 32,910 | | | $ | 20,239 | | | | $21,099 | | | $ | 2,722,733 | | | $ | — | |
| 10/31/2015 | | | — | | | | 51,048 | | | | 42,851 | | | | 35,981 | | | | 42,826 | | | | 3,353,608 | | | | — | |
| 10/31/2016 | | | 144,069 | | | | 67,570 | | | | 58,369 | | | | 52,638 | | | | 58,060 | | | | 4,236,779 | | | | 76,676 | |
| | | For the year ended October 31, 2013, the Adviser voluntarily agreed to reimburse the Municipal Money Market Fund to the extent necessary to ensure that the Fund’s total operating expenses (excluding interest, brokerage commissions and extraordinary expenses) did not exceed certain limits. The limits ranged from 0.27% to 0.34% of the Fund’s average daily net assets during the year ended October 31, 2013. For the year ended October 31, 2013 the Adviser waived investment advisory fees and other expenses totaling $484,382 for the Municipal Money Market Fund. |
| | The Adviser makes payments to intermediaries that provide omnibus account services, sub-accounting services and/or networking services with respect to the Funds. On February 2, 2012, the Board approved, subject to certain limitations, the reimbursement to the Adviser by the appropriate Fund, of up to a certain percentage of such fees paid by the Adviser to intermediaries that provide omnibus account services, sub-accounting services, and/or networking services. Reimbursement of these fees are subject to review by the Board and are included in the transfer agent fees in the Statements of Operations. The Dynamic Dividend Fund, Accelerating Dividend Fund, Financial Services Fund, Innovators Fund, Transformations Fund, Foundation Fund, Ultra Short Tax Optimized Income Fund and Municipal Money Market Fund incurred $334,515, $421, $9,268, $4,767, $45, $1,705, $905,693 and $232, respectively, in reimbursements to the Adviser. |
| | State Street Bank and Trust Company (“SSBT”) serves as the Funds’ Administrator pursuant to an Administration Agreement with the Funds. As compensation for its services to the Funds, SSBT receives an annual administration fee of 0.02% of total net assets on the first $5 billion and 0.015% on total net assets exceeding $5 billion, computed daily and payable monthly. |
| | During the year ended October 31, 2013, the Funds engaged in purchase and sale transactions with funds that have a common investment adviser (or affiliated investment advisers), common Directors/Trustees and/or common Officers. These purchase and sale transactions complied with Rule 17a-7 under the 1940 Act and were as follows: |
| | | | Purchases | | | | Sales | |
| Dynamic Dividend Fund | | | $26,794,088 | | | | $10,907,009 | |
| Ultra Short Tax Optimized Income Fund | | | — | | | | 25,405,000 | |
| Municipal Money Market Fund | | | 25,405,000 | | | | — | |
| 7. | Federal Income Tax Information: |
| At October 31, 2013, the components of distributable earnings on a tax basis were as follows: |
| | | Dynamic
Dividend Fund | | | Accelerating
Dividend Fund | | | Financial
Services Fund | | | Innovators Fund | |
| Undistributed ordinary income | | $ | 2,178,139 | | | $ | 30,978 | | | $ | — | | | $ | — | |
| Other undistributed ordinary losses | | | (419,675 | ) | | | (2,320 | ) | | | — | | | | — | |
| Undistributed tax exempt income | | | — | | | | — | | | | — | | | | — | |
| Undistributed long-term capital gain | | | — | | | | 156,623 | | | | — | | | | — | |
| Late year ordinary loss deferral | | | — | | | | — | | | | (21,120 | ) | | | (102,645 | ) |
| Accumulated capital loss | | | (1,136,305,939 | ) | | | — | | | | (79,726 | ) | | | (12,600,990 | ) |
| Unrealized appreciation/(depreciation) | | | 30,330,887 | | | | 702,977 | | | | 1,261,050 | | | | 3,993,788 | |
| Total | | $ | (1,104,216,588 | ) | | $ | 888,258 | | | $ | 1,160,204 | | | $ | (8,709,847 | ) |
134
Alpine Mutual Funds
Notes to Financial Statements—Continued
October 31, 2013
| | | Transformations
Fund | | | Foundation
Fund | | | Ultra Short
Tax Optimized
Income Fund | | | High Yield
Managed
Duration
Municipal Fund | |
| Undistributed ordinary income | | $ | 294,884 | | | $ | 45,359 | | | $ | — | | | $ | — | |
| Other undistributed ordinary losses | | | — | | | | — | | | | — | | | | — | |
| Undistributed tax exempt income | | | — | | | | — | | | | — | | | | — | |
| Undistributed long-term capital gain | | | 719,392 | | | | — | | | | — | | | | — | |
| Late year ordinary loss deferral | | | — | | | | — | | | | — | | | | — | |
| Accumulated capital loss | | | — | | | | (429,515 | ) | | | (488,304 | ) | | | (5,339 | ) |
| Unrealized appreciation/(depreciation) | | | 1,578,619 | | | | 10,554,005 | | | | (955,902 | ) | | | (101,638 | ) |
| Total | | $ | 2,592,895 | | | $ | 10,169,849 | | | $ | (1,444,206 | ) | | $ | (106,977 | ) |
| | | Municipal
Money
Market Fund | | | | | | | | | | |
| Undistributed ordinary income | | $ | — | | | | | | | | | | | | | |
| Other undistributed ordinary losses | | | — | | | | | | | | | | | | | |
| Undistributed tax exempt income | | | — | | | | | | | | | | | | | |
| Undistributed long-term capital gain | | | — | | | | | | | | | | | | | |
| Late year ordinary loss deferral | | | — | | | | | | | | | | | | | |
| Accumulated capital loss | | | — | | | | | | | | | | | | | |
| Unrealized appreciation/(depreciation) | | | — | | | | | | | | | | | | | |
| Total | | $ | — | | | | | | | | | | | | | |
Tax components of distributable earnings are determined in accordance with income tax regulations which may differ from the composition of net assets reported under GAAP. Accordingly, for the year ended October 31, 2013, the effects of certain differences were reclassified as follows:
| Fund | | Capital Stock | | Accumulated
net investment
income (loss) | | Accumulated
net realized
gains (losses) | | | |
| Dynamic Dividend Fund | | $ | — | | | $ | 549,218 | | | $ | (549,218 | ) | | | | |
| Accelerating Dividend Fund | | | (11 | ) | | | (1,540 | ) | | | 1,551 | | | | | |
| Financial Services Fund | | | 10,772 | | | | 4,546 | | | | (15,318 | ) | | | | |
| Innovators Fund | | | (117,150 | ) | | | 116,775 | | | | 375 | | | | | |
| Transformations Fund | | | — | | | | 40,716 | | | | (40,716 | ) | | | | |
| Foundation Fund | | | 2 | | | | 69,042 | | | | (69,044 | ) | | | | |
| Ultra Short Tax Optimized Income Fund | | | (3,164 | ) | | | 3,164 | | | | — | | | | | |
As of October 31, 2013, net unrealized appreciation/(depreciation) of investments, excluding foreign currency, based on Federal tax costs was as follows:
| | | Dynamic
Dividend Fund | | | Accelerating
Dividend Fund | | | Financial
Services Fund | | | Innovators Fund | |
| Cost of investments | | $ | 219,035,006 | | | $ | 3,658,997 | | | $ | 19,616,947 | | | $ | 9,013,615 | |
| Gross unrealized appreciation | | | 37,224,213 | | | | 722,727 | | | | 3,314,840 | | | | 4,324,287 | |
| Gross unrealized depreciation | | | (6,650,247 | ) | | | (19,766 | ) | | | (2,059,419 | ) | | | (330,499 | ) |
| Net unrealized appreciation (depreciation) | | $ | 30,573,966 | | | $ | 702,961 | | | $ | 1,255,421 | | | $ | 3,993,788 | |
135
Alpine Mutual Funds
Notes to Financial Statements—Continued
October 31, 2013
| | | Transformations
Fund | | | Foundation
Fund | | | Ultra Short
Tax Optimized
Income Fund | | | Municipal
Money
Market Fund | |
| Cost of investments | | $ | 5,859,721 | | | $ | 57,190,815 | | | $ | 1,289,706,385 | | | $ | 170,408,763 | |
| Gross unrealized appreciation | | | 1,740,295 | | | | 15,543,104 | | | | 418,191 | | | | | |
| Gross unrealized depreciation | | | (161,675 | ) | | | (4,989,093 | ) | | | (1,374,093 | ) | | | — | |
| Net unrealized appreciation (depreciation) | | $ | 1,578,620 | | | $ | 10,554,011 | | | $ | (955,902 | ) | | $ | — | |
| | | High Yield
Managed
Duration
Municipal Fund | | | | | | | | | | |
| Cost of investments | | $ | 19,374,379 | | | | | | | | | | | | | |
| Gross unrealized appreciation | | | 82,702 | | | | | | | | | | | | | |
| Gross unrealized depreciation | | | (184,340 | ) | | | | | | | | | | | | |
| Net unrealized appreciation (depreciation) | | $ | (101,638 | ) | | | | | | | | | | | | |
The tax basis of investments for tax and financial reporting purposes differs principally due to the deferral of losses on wash sales, partnership tax adjustments, and mark-to-market cost basis adjustments for investments in passive foreign investment companies (PFICs) for tax purposes.
The tax character of distributions paid during the years ended October 31, 2013 and 2012 were as follows:
| | | 2013 | | | 2012 | |
| Dynamic Dividend Fund | | | | | | | | |
| Ordinary income | | $ | 23,278,810 | | | $ | 54,036,978 | |
| Long-term capital gain | | | — | | | | — | |
| | | $ | 23,278,810 | | | $ | 54,036,978 | |
| Accelerating Dividend Fund | | | | | | | | |
| Ordinary income | | $ | 144,160 | | | $ | 103,200 | |
| Long-term capital gain | | | 47,306 | | | | 198,485 | |
| | | $ | 191,466 | | | $ | 301,685 | |
| Financial Services Fund | | | | | | | | |
| Ordinary income | | $ | — | | | $ | — | |
| Long-term capital gain | | | — | | | | — | |
| Return of capital | | | — | | | | 13,524 | |
| | | $ | — | | | $ | 13,524 | |
| Innovators Fund | | | | | | | | |
| Ordinary income | | $ | — | | | $ | — | |
| Long-term capital gain | | | — | | | | — | |
| | | $ | — | | | $ | — | |
| Transformations Fund | | | | | | | | |
| Ordinary income | | $ | — | | | $ | — | |
| Long-term capital gain | | | 42,117 | | | | — | |
| | | $ | 42,117 | | | $ | — | |
136
Alpine Mutual Funds
Notes to Financial Statements—Continued
October 31, 2013
| Foundation Fund | | | | | | | | |
| Ordinary income | | $ | 1,025,051 | | | $ | 1,084,883 | |
| Long-term capital gain | | | — | | | | — | |
| | | $ | 1,025,051 | | | $ | 1,084,883 | |
| Ultra Short Tax Optimized Income Fund | | | | | | | | |
| Ordinary income | | $ | — | | | $ | — | |
| Exempt interest dividends | | | 7,292,009 | | | | 15,890,798 | |
| | | $ | 7,292,009 | | | $ | 15,890,798 | |
| Municipal Money Market Fund | | | | | | | | |
| Ordinary income | | $ | — | | | $ | — | |
| Exempt interest dividends | | | 86,557 | | | | 264,781 | |
| | | $ | 86,557 | | | $ | 264,781 | |
| High Yield Managed Duration Municipal Fund | | | | | | | | |
| Ordinary income | | $ | 1,661 | | | | | |
| Exempt interest dividends | | | 120,679 | | | | | |
| | | $ | 122,340 | | | | | |
During the year ended October 31, 2013, the Dynamic Dividend Fund, Financial Services Fund, Innovators Fund and Foundation Fund utilized $21,879,285, $1,427,852, $1,354,862 and $3,553,121 of capital loss carryovers, respectively. Capital loss carryovers as of October 31, 2013 are as follows:
| Expiration Date | | Dynamic
Dividend Fund | | Accelerating
Dividend Fund | | Financial
Services Fund | | Innovators Fund | | Transformations
Fund |
| 10/31/2013 | | $ | — | | | $ | — | | | $ | — | | | $ | — | | | $ | — | |
| 10/31/2014 | | $ | — | | | $ | — | | | $ | — | | | $ | — | | | $ | — | |
| 10/31/2015 | | $ | 25,935,421 | | | $ | — | | | $ | — | | | $ | — | | | $ | — | |
| 10/31/2016 | | $ | 536,971,822 | | | $ | — | | | $ | — | | | $ | 5,040,239 | | | $ | — | |
| 10/31/2017 | | $ | 388,131,987 | | | $ | — | | | $ | — | | | $ | 5,637,266 | | | $ | — | |
| 10/31/2018 | | $ | 154,525,095 | | | $ | — | | | $ | — | | | $ | 1,581,056 | | | $ | — | |
| 10/31/2019 | | $ | — | | | $ | — | | | $ | 79,726 | | | $ | 342,429 | | | $ | — | |
| | | | | | | | | | | | | | | | | | | | | |
| Expiration Date | | Foundation
Fund | | Ultra Short
Tax Optimized
Income Fund | | Municipal
Money
Market Fund | | High Yield
Managed
Duration
Municipal Fund | | |
| 10/31/2014 | | $ | — | | | $ | — | | | $ | — | | | $ | — | | | | | |
| 10/31/2015 | | $ | — | | | $ | — | | | $ | — | | | $ | — | | | | | |
| 10/31/2016 | | $ | — | | | $ | — | | | $ | — | | | $ | — | | | | | |
| 10/31/2017 | | $ | — | | | $ | — | | | $ | — | | | $ | — | | | | | |
| 10/31/2018 | | $ | 353,585 | | | $ | — | | | $ | — | | | $ | — | | | | | |
| 10/31/2019 | | $ | — | | | $ | 67,228 | | | $ | — | | | $ | — | | | | | |
Under the Regulated Investment Company (“RIC”) Modernization Act of 2010 (“the Modernization Act”), post-enactment capital losses that are carried forward will retain their character as either short-term or long-term capital losses rather than being considered all short-term as under previous law. However, any losses incurred during those future taxable years will be required to be utilized prior to the losses incurred in pre-enactment taxable years, which carry an expiration date. As a result of this ordering rule, pre-enactment capital loss carryovers may be more likely to expire unused. Capital loss carryover as of October 31, 2013 with no expiration are as follows:
137
Alpine Mutual Funds
Notes to Financial Statements—Continued
October 31, 2013
| Fund | | | Short Term | | | Long Term | | | |
| Dynamic Dividend Fund | | | $30,741,614 | | | $ | — | | | | | |
| Foundation Fund | | | — | | | | 75,930 | | | | | |
| Ultra Short Tax Optimized Income Fund | | | 368,096 | | | | 52,980 | | | | | |
| High Yield Managed Duration Municipal Fund | | | 5,339 | | | | — | | | | | |
Certain ordinary losses incurred after December 31 and within the taxable year are deemed to arise on the first day of the Funds’ next taxable year, if the Funds so elect. For the year ended October 31, 2013, the following Funds elected to defer late-year ordinary losses:
| Fund | | | Late Year
Ordinary Losses | | | | | | | |
| Financial Services Fund | | | $21,120 | | | | | | | | | |
| Innovators Fund | | | 102,645 | | | | | | | | | |
In accordance with U.S. GAAP, the Funds have previously adopted accounting standards related to the accounting for uncertain tax positions. In accordance with this guidance, the Funds analyzed all open tax years, as defined by the Statute of Limitations, for all major jurisdictions. Open tax years are those that are open for exam by taxing authorities. Major jurisdictions for the Funds included Federal and the state of New York.
The Funds have reviewed all open tax years and major jurisdictions and concluded that there is no impact on the Funds’ net assets and no tax liability resulting from unrecognized tax benefits relating to uncertain income tax positions taken in previous years or expected to be taken on the tax return for the fiscal year-end October 31, 2013. Also, the Funds have recognized no interest and penalties related to uncertain tax benefits. The Funds are also not aware of any tax positions for which it is reasonably possible that the total amounts of unrecognized tax benefits will significantly change in the next twelve months.
| 8. | Recent Accounting Pronouncement: |
On December 16, 2011, the Financial Accounting Standards Board (“FASB”) issued Accounting Standards Update No. 2011-11, “Disclosures about Offsetting Assets and Liabilities” (“ASU 2011-11”), as clarified with ASU 2013-01 “Clarifying the Scope of Disclosures about Offsetting Assets and Liabilities” issued in January 2013. ASU 2011-11 amends FASB Accounting Standards Codification Topic 210, specifically requiring an entity to disclose information about offsetting and related arrangements and the effect those arrangements have on the financial position. ASU 2011-11 is effective in annual reporting beginning on or after January 1, 2013, and for interim periods within those annual reporting periods. Management is currently evaluating the implications of these changes and their impact on the financial statements.
Distributions: The Dynamic Dividend Fund — Institutional Class and Class A paid a distribution from net investment income of $0.02 and $0.0193 per share, respectively, on November 29, 2013 to shareholders of record on November 27, 2013. The Accelerating Dividend Fund — Institutional Class and Class A paid a distribution from net investment income of $0.0410 and $0.0379 per share, respectively, on November 29, 2013 to shareholders of record on November 27, 2013. The Ultra Short Tax Optimized Income Fund — Class A and Institutional Class paid a distribution from net investment income of $0.00301826 and $0.00511973 per share, respectively, on November 29, 2013 to shareholders of record on November 27, 2013. The High Yield Managed Duration Municipal Fund — Class A and Institutional Class paid a distribution from net investment income of $0.02558171 and $0.02762878 per share, respectively, on November 29, 2013 to shareholders of record on November 27, 2013.
The Accelerating Dividend Fund — Institutional Class and Class A paid a distribution from short-term capital gains of $0.0356 and from long-term capital gains of $0.5537 on December 6, 2013 to shareholders of record on December 5, 2013. The Transformations Fund — Institutional Class and Class A paid a distribution from short-term capital gains of $0.6133 and from long-term capital gains of $1.4960 on December 6, 2013 to shareholders of record on December 5, 2013.
138
Alpine Mutual Funds
Report of Independent Registered Public Accounting Firm
To the Shareholders and Board of Trustees of
Alpine Series Trust and Alpine Income Trust:
We have audited the accompanying statements of assets and liabilities, including the schedules of portfolio investments, of Alpine Series Trust, comprised of Alpine Dynamic Dividend Fund, Alpine Accelerating Dividend Fund, Alpine Financial Services Fund, Alpine Innovators Fund, Alpine Transformations Fund and Alpine Foundation Fund; and Alpine Income Trust, comprised of Alpine Ultra Short Tax Optimized Income Fund, Alpine Municipal Money Market Fund and Alpine High Yield Managed Duration Municipal Fund (collectively the “Funds”) as of October 31, 2013, and the related statements of operations, statements of changes in net assets, and the financial highlights for each of the periods presented. These financial statements and financial highlights are the responsibility of the Funds’ management. Our responsibility is to express an opinion on these financial statements and financial highlights based on our audits.
We conducted our audits in accordance with the standards of the Public Company Accounting Oversight Board (United States). Those standards require that we plan and perform the audit to obtain reasonable assurance about whether the financial statements and financial highlights are free of material misstatement. The Funds are not required to have, nor were we engaged to perform, an audit of their internal control over financial reporting. Our audits included consideration of internal control over financial reporting as a basis for designing audit procedures that are appropriate in the circumstances, but not for the purpose of expressing an opinion on the effectiveness of the Funds’ internal control over financial reporting. Accordingly, we express no such opinion. An audit also includes examining, on a test basis, evidence supporting the amounts and disclosures in the financial statements, assessing the accounting principles used and significant estimates made by management, as well as evaluating the overall financial statement presentation. Our procedures included confirmation of securities owned as of October 31, 2013, by correspondence with the custodian and brokers; where replies were not received from brokers, we performed other auditing procedures. We believe that our audits provide a reasonable basis for our opinion.
In our opinion, the financial statements and financial highlights referred to above present fairly, in all material respects, the financial positions of Alpine Dynamic Dividend Fund, Alpine Accelerating Dividend Fund, Alpine Financial Services Fund, Alpine Innovators Fund, Alpine Transformations Fund and Alpine Foundation Fund of Alpine Series Trust; and Alpine Ultra Short Tax Optimized Income Fund, Alpine Municipal Money Market Fund and Alpine High Yield Managed Duration Municipal Fund of Alpine Income Trust, as of October 31, 2013, and the results of their operations, the changes in their net assets, and the financial highlights for each of the periods presented, in conformity with accounting principles generally accepted in the United States of America.

Princeton, New Jersey
December 30, 2013
139
Alpine Mutual Funds
Information about your Funds Expenses (Unaudited)
October 31, 2013
Fund expenses (unaudited)
Example
As a shareholder of the Fund, you may incur two types of costs: (1) transaction costs, including front-end on purchase payments; and (2) ongoing costs, including management fees; service and/or distribution (12b-1) fees; and other Fund expenses. This example is intended to help you understand your ongoing costs (in dollars) of investing in the Fund and to compare these costs with the ongoing costs of investing in other mutual funds.
This example is based on an investment of $1,000 invested on May 1, 2013 and held for the six months ended October 31, 2013.
Actual Expenses
The table below titled “Based on Actual Total Return” provides information about actual account values and actual expenses. You may use the information provided in this table, together with the amount you invested, to estimate the expenses that you paid over the period. To estimate the expenses you paid on your account, divide your ending account value by $1,000 (for example, an $8,600 ending account value divided by $1,000 = 8.6), then multiply the result by the number under the heading entitled “Expenses Paid During the Period”.
Hypothetical Example for Comparison Purposes
The table below titled “Based on Hypothetical Total Return” provides information about hypothetical account values and hypothetical expenses based on the actual expense ratio and an assumed rate of return of 5.00% per year before expenses, which is not the Fund’s actual return. The hypothetical account values and expenses may not be used to estimate the actual ending account balance or expenses you paid for the period. You may use the information provided in this table to compare the ongoing costs of investing in the Fund and other funds. To do so, compare the 5.00% hypothetical example relating to the Fund with the 5.00% hypothetical examples that appear in the shareholder reports of the other funds.
Please note that the expenses shown in the table below are meant to highlight your ongoing costs only and do not reflect any transactional costs, such as front-end or back-end sales charges (loads). Therefore, the table is useful in comparing ongoing costs only, and will not help you determine the relative total costs of owning different funds. In addition, if these transaction costs were included, your costs would have been higher.
Dynamic Dividend Fund
Based on actual total return (1)
| Class | | Actual Total
Return Without
Sales Charges (2) | | Beginning
Account Value | | Ending
Account Value | | Annualized
Expense
Ratio | | Expenses
Paid During
the Period (3) |
| | | | | | | | | | | | | | | | | | | | | |
| Class A | | | 6.36 | % | | $ | 1,000.00 | | | $ | 1,063.60 | | | | 1.63 | % | | $ | 8.48 | |
| | | | | | | | | | | | | | | | | | | | | |
| Institutional | | | 6.50 | % | | $ | 1,000.00 | | | $ | 1,065.00 | | | | 1.39 | % | | $ | 7.23 | |
Based on hypothetical total return (1)
| Class | | Hypothetical
Annualized
Total Return | | Beginning
Account Value | | Ending
Account Value | | Annualized
Expense
Ratio | | Expenses
Paid During
the Period (4) |
| | | | | | | | | | | | | | | | | | | | | |
| Class A | | | 5.00 | % | | $ | 1,000.00 | | | $ | 1,016.99 | | | | 1.63 | % | | $ | 8.29 | |
| | | | | | | | | | | | | | | | | | | | | |
| Institutional | | | 5.00 | % | | $ | 1,000.00 | | | $ | 1,018.20 | | | | 1.39 | % | | $ | 7.07 | |
140
Alpine Mutual Funds
Information about your Funds Expenses (Unaudited)—Continued
October 31, 2013
Accelerating Dividend Fund
Based on actual total return (1)
| Class | | Actual Total
Return Without
Sales Charges (2) | | Beginning
Account Value | | Ending
Account Value | | Annualized
Expense
Ratio | | Expenses
Paid During
the Period (3) |
| | | | | | | | | | | | | | | | | | | | | |
| Class A | | | 9.20 | % | | $ | 1,000.00 | | | $ | 1,092.00 | | | | 1.60 | % | | $ | 8.44 | |
| | | | | | | | | | | | | | | | | | | | | |
| Institutional | | | 9.40 | % | | $ | 1,000.00 | | | $ | 1,094.00 | | | | 1.35 | % | | $ | 7.13 | |
| | | | | | | | | | | | | | | | | | | | | |
| Based on hypothetical total return (1) | | | | | | | | | | | | | |
| | | | | | | | | | | | | | | | | | | | | |
| Class | | Hypothetical
Annualized
Total Return | | Beginning
Account Value | | Ending
Account Value | | Annualized
Expense
Ratio | | Expenses
Paid During
the Period (4) |
| | | | | | | | | | | | | | | | | | | | | |
| Class A | | | 5.00 | % | | $ | 1,000.00 | | | $ | 1,017.14 | | | | 1.60 | % | | $ | 8.13 | |
| | | | | | | | | | | | | | | | | | | | | |
| Institutional | | | 5.00 | % | | $ | 1,000.00 | | | $ | 1,018.40 | | | | 1.35 | % | | $ | 6.87 | |
| | | | | | | | | | | | | | | | | | | | | |
| Financial Services Fund | | | | | | | | | | | | | | | |
| | | | | | | | | | | | | | | | | | | | | |
| Based on actual total return (1) | | | | | | | | | | | | | | | |
| | | | | | | | | | | | | | | | | | | | | |
| Class | | Actual Total
Return Without
Sales Charges (2) | | Beginning
Account Value | | Ending
Account Value | | Annualized
Expense
Ratio | | Expenses
Paid During
the Period (3) |
| | | | | | | | | | | | | | | | | | | | | |
| Class A | | | 16.15 | % | | $ | 1,000.00 | | | $ | 1,161.50 | | | | 1.61 | % | | $ | 8.77 | |
| | | | | | | | | | | | | | | | | | | | | |
| Institutional | | | 16.30 | % | | $ | 1,000.00 | | | $ | 1,163.00 | | | | 1.36 | % | | $ | 7.41 | |
| | | | | | | | | | | | | | | | | | | | | |
| Based on hypothetical total return (1) | | | | | |
| | | | | | | | | | | |
| Class | | Hypothetical
Annualized
Total Return | | Beginning
Account Value | | Ending
Account Value | | Annualized
Expense
Ratio | | Expenses
Paid During
the Period (4) |
| | | | | | | | | | | | | | | | | | | | | |
| Class A | | | 5.00 | % | | $ | 1,000.00 | | | $ | 1,017.09 | | | | 1.61 | % | | $ | 8.19 | |
| | | | | | | | | | | | | | | | | | | | | |
| Institutional | | | 5.00 | % | | $ | 1,000.00 | | | $ | 1,018.35 | | | | 1.36 | % | | $ | 6.92 | |
| | | | | | | | | | | | | | | | | | | | | |
| Innovators Fund | | | | | | | | | | | | | | | | | | | | |
| | | | | | | | | | | | | | | | | | | | | |
| Based on actual total return (1) | | | | | | | | | | | | | | | |
| | | | | | | | | | | | | | | | | | | | | |
| Class | | Actual Total
Return Without
Sales Charges (2) | | Beginning
Account Value | | Ending
Account Value | | Annualized
Expense
Ratio | | Expenses
Paid During
the Period (3) |
| | | | | | | | | | | | | | | | | | | | | |
| Class A | | | 12.36 | % | | $ | 1,000.00 | | | $ | 1,123.60 | | | | 1.60 | % | | $ | 8.56 | |
| | | | | | | | | | | | | | | | | | | | | |
| Institutional | | | 12.47 | % | | $ | 1,000.00 | | | $ | 1,124.70 | | | | 1.35 | % | | $ | 7.23 | |
| | | | | | | | | | | | | | | | | | | | | |
| Based on hypothetical total return (1) | | | | | | | | | | | | | | | |
| | | | | | | | | | | | | | | | | | | | | |
| Class | | Hypothetical
Annualized
Total Return | | Beginning
Account Value | | Ending
Account Value | | Annualized
Expense
Ratio | | Expenses
Paid During
the Period (4) |
| | | | | | | | | | | | | | | | | | | | | |
| Class A | | | 5.00 | % | | $ | 1,000.00 | | | $ | 1,017.14 | | | | 1.60 | % | | $ | 8.13 | |
| | | | | | | | | | | | | | | | | | | | | |
| Institutional | | | 5.00 | % | | $ | 1,000.00 | | | $ | 1,018.40 | | | | 1.35 | % | | $ | 6.87 | |
141
Alpine Mutual Funds
Information about your Funds Expenses (Unaudited)—Continued
October 31, 2013
Transformations Fund
Based on actual total return (1)
| Class | | Actual Total
Return Without
Sales Charges (2) | | Beginning
Account Value | | Ending
Account Value | | Annualized
Expense
Ratio | | Expenses
Paid During
the Period (3) |
| | | | | | | | | | | | | | | | | | | | | |
| Class A | | | 13.29 | % | | $ | 1,000.00 | | | $ | 1,132.90 | | | | 1.60 | % | | $ | 8.60 | |
| | | | | | | | | | | | | | | | | | | | | |
| Institutional | | | 20.03 | % | | $ | 1,000.00 | | | $ | 1,200.30 | | | | 1.35 | % | | $ | 7.49 | |
| | | | | | | | | | | | | | | | | | | | | |
| Based on hypothetical total return (1) | | | | | | | | | | | | | | | |
| | | | | | | | | | | | | | | | | | | | | |
| Class | | Hypothetical
Annualized
Total Return | | Beginning
Account Value | | Ending
Account Value | | Annualized
Expense
Ratio | | Expenses
Paid During
the Period (4) |
| | | | | | | | | | | | | | | | | | | | | |
| Class A | | | 5.00 | % | | $ | 1,000.00 | | | $ | 1,017.14 | | | | 1.60 | % | | $ | 8.13 | |
| | | | | | | | | | | | | | | | | | | | | |
| Institutional | | | 5.00 | % | | $ | 1,000.00 | | | $ | 1,018.40 | | | | 1.35 | % | | $ | 6.87 | |
| | | | | | | | | | | | | | | | | | | | | |
| Foundation Fund | | | | | | | | | | | | | | | |
| | | | | | | | | | | | | | | | | | | | | |
| Based on actual total return (1) | | | | | | | | | | | | | | | |
| | | | | | | | | | | | | | | | | | | | | |
| Class | | Actual Total
Return Without
Sales Charges (2) | | Beginning
Account Value | | Ending
Account Value | | Annualized
Expense
Ratio | | Expenses
Paid During
the Period (3) |
| | | | | | | �� | | | | | | | | | | | | | | |
| Class A | | | 1.32 | % | | $ | 1,000.00 | | | $ | 1,013.20 | | | | 1.58 | % | | $ | 8.02 | |
| | | | | | | | | | | | | | | | | | | | | |
| Institutional | | | 1.44 | % | | $ | 1,000.00 | | | $ | 1,014.40 | | | | 1.33 | % | | $ | 6.75 | |
| | | | | | | | | | | | | | | | | | | | | |
| Based on hypothetical total return (1) | | | | | | | | | | | | | | | |
| | | | | | | | | | | | | | | | | | | | | |
| Class | | Hypothetical
Annualized
Total Return | | Beginning
Account Value | | Ending
Account Value | | Annualized
Expense
Ratio | | Expenses
Paid During
the Period (4) |
| | | | | | | | | | | | | | | | | | | | | |
| Class A | | | 5.00 | % | | $ | 1,000.00 | | | $ | 1,017.24 | | | | 1.58 | % | | $ | 8.03 | |
| | | | | | | | | | | | | | | | | | | | | |
| Institutional | | | 5.00 | % | | $ | 1,000.00 | | | $ | 1,018.50 | | | | 1.33 | % | | $ | 6.77 | |
| | | | | | | | | | | | | |
| Ultra Short Tax Optimized Income | | | | | | | | | | | | |
| | | | | | | | | | | | | |
| Based on actual total return (1) | | | | | | | | | | | | |
| | | | | | | | | | | | | |
| Class | | Actual Total
Return Without
Sales Charges (2) | | Beginning
Account Value | | Ending
Account Value | | Annualized
Expense
Ratio | | Expenses
Paid During
the Period (3) |
| | | | | | | | | | | | | | | | | | | | | |
| Class A | | | 0.04 | % | | $ | 1,000.00 | | | $ | 1,000.40 | | | | 0.81 | % | | $ | 4.08 | |
| | | | | | | | | | | | | | | | | | | | | |
| Institutional | | | 0.17 | % | | $ | 1,000.00 | | | $ | 1,001.70 | | | | 0.57 | % | | $ | 2.88 | |
| | | | | | | | | | | | | | | | | | | | | |
| Based on hypothetical total return (1) | | | | | | | | | | | | | | | |
| | | | | | | | | | | | | | | | | | | | | |
| Class | | Hypothetical
Annualized
Total Return | | Beginning
Account Value | | Ending
Account Value | | Annualized
Expense
Ratio | | Expenses
Paid During
the Period (4) |
| | | | | | | | | | | | | | | | | | | | | |
| Class A | | | 5.00 | % | | $ | 1,000.00 | | | $ | 1,021.12 | | | | 0.81 | % | | $ | 4.13 | |
| | | | | | | | | | | | | | | | | | | | | |
| Institutional | | | 5.00 | % | | $ | 1,000.00 | | | $ | 1,022.33 | | | | 0.57 | % | | $ | 2.91 | |
142
Alpine Mutual Funds
Information about your Funds Expenses (Unaudited)—Continued
October 31, 2013
Municipal Money Market Fund
Based on actual total return (1)
| Class | | Actual Total
Return Without
Sales Charges (2) | | Beginning
Account Value | | Ending
Account Value | | Annualized
Expense
Ratio | | Expenses
Paid During
the Period (3) |
| | | | | | | | | | | | | | | | | | | | | |
| Investor | | | 0.02 | % | | $ | 1,000.00 | | | $ | 1,000.20 | | | | 0.32 | % | | $ | 1.61 | |
| | | | | | | | | | | | | | | | | | | | | |
| Based on hypothetical total return (1) | | | | | | | | | | | | |
| | | | | | | | | | | | | |
| Class | | Hypothetical
Annualized
Total Return | | Beginning
Account Value | | Ending
Account Value | | Annualized
Expense
Ratio | | Expenses
Paid During
the Period (4) |
| | | | | | | | | | | | | | | | | | | | | |
| Investor | | | 5.00 | % | | $ | 1,000.00 | | | $ | 1,023.59 | | | | 0.32 | % | | $ | 1.63 | |
| | | | | | | | | | | | | | | | | | | | | |
| High Yield Managed Duration Municipal Fund | | | | | | | | | | | | |
| | | | | | | | | | | | | | | | | | | | | |
| Based on actual total return (1) | | | | | | | | | | | | |
| | | | | | | | | | | | | |
| Class | | Actual Total
Return Without
Sales Charges (2) | | Beginning
Account Value | | Ending
Account Value | | Annualized
Expense
Ratio | | Expenses
Paid During
the Period (5) |
| | | | | | | | | | | | | | | | | | | | | |
| Class A | | | 0.01 | % | | $ | 1,000.00 | | | $ | 1,000.10 | | | | 0.99 | % | | $ | 4.15 | |
| | | | | | | | | | | | | | | | | | | | | |
| Institutional | | | 0.11 | % | | $ | 1,000.00 | | | $ | 1,001.10 | | | | 0.74 | % | | $ | 3.10 | |
| | | | | | | | | | | | | | | | | | | | | |
| Based on hypothetical total return (1) | | | | | | | | | | | | |
| | | | | | | | | | | | | |
| Class | | Hypothetical
Annualized
Total Return | | Beginning Account Value | | Ending
Account Value | | Annualized
Expense
Ratio | | Expenses
Paid During
the Period (6) |
| | | | | | | | | | | | | | | | | | | | | |
| Class A | | | 5.00 | % | | $ | 1,000.00 | | | $ | 1,016.81 | | | | 0.99 | % | | $ | 4.18 | |
| | | | | | | | | | | | | | | | | | | | | |
| Institutional | | | 5.00 | % | | $ | 1,000.00 | | | $ | 1,017.87 | | | | 0.74 | % | | $ | 3.13 | |
| (1) | For the six months ended October 31, 2013. |
| (2) | Assumes the reinvestment of all distributions, including returns of capital, if any, at net asset value and does not reflect the deduction of the applicable sales charge. Total return is not annualized, as it may not be representative of the total return for the year. Performance figures may reflect fee waivers and/or expense reimbursements. In the absence of fee waivers and/or expense reimbursements, the total return would have been lower. Past performance is no guarantee of future results. |
| (3) | Expenses (net of fee waivers and/or expense reimbursements) are equal to each class’ respective annualized expense ratio multiplied by the average account value over the period, multiplied by the number of days in the most recent fiscal half-year then divided by 365. |
| (4) | Hypothetical expense examples assume a 5% return over a hypothetical 184 day period. |
| (5) | For the period June 3, 2013 (commencement of operations) through October 31, 2013. Expense is calculated using the Class’s annualized net expense ratio, multiplied by the average account value over the period, multiplied by 153 days in the period, divided by 365 days in the year. |
| (6) | Hypothetical expenses if the fund had been in existence from May 1, 2013 are calculated using average account value over the period, multiplied by 184 days in the period, divided by 365 days in the year. |
143
Alpine Mutual Funds
Additional Information (Unaudited)
October 31, 2013
Independent Trustees
| Name and Age | | Position(s)
Held with
the Trust | | Term of Office
and Length of
Time Served | | Principal Occupation During
Past Five Years | | # of
Portfolios in
Fund
Complex* | | Other Directorships
Held by Trustee |
| H. Guy Leibler (59) | | Independent
Trustee | | Indefinite,
since the
Trust’s
inception | | Private investor, since 2007; Vice Chair & Chief Operating Officer of L&L Acquisitions, LLC (2004-2007); President, Skidmore, Owings & Merrill LLP (2001-2004). | | 18 | | Chairman Emeritus, White Plains Hospital Center; Trustee, each of the Alpine Trusts. |
| Jeffrey E. Wacksman (53) | | Independent
Trustee | | Indefinite,
since 2004 | | Partner, Loeb, Block & Partners LLP, since 1994. | | 18 | | Director, International Succession Planning Association; Director, Bondi Icebergs Inc. (Women’s Sportswear); Director, MH Properties, Inc.; Trustee, each of the Alpine Trusts. |
| James A. Jacobson (68) | | Independent
Trustee | | Indefinite,
since July
2009 | | Retired, since November 2008; Vice Chairman and Managing Director, Spear Leeds & Kellogg Specialists, LLC, January 2003 to November 2008. | | 18 | | Trustee, Allianz Global Investors Multi-Funds. Trustee, each of the Alpine Trusts. |
| Eleanor T.M. Hoagland (62) | | Independent
Trustee | | Indefinite,
since October
2012 | | Principal, VCS Advisory, LLC (since 2011); Chief Compliance Officer and Senior Managing Director of Magni Asset Management LLC (since 2011) and Park Fifth Capital Management LLC (2011-2013); Vice President (2008-2010) and CCO (2009-2010), Ameriprise Financial Inc.; Managing Director (2000-2008) and CCO (2004-2008), J. & W. Seligman & Co. Incorporated. | | 18 | | Trustee of each of the Alpine Trusts. |
| * | The term “Fund Complex” refers to the Funds in the Alpine Equity Trust, Alpine Series Trust, and Alpine Income Trust, and Alpine Global Dynamic Dividend Fund, Alpine Total Dynamic Dividend Fund, and Alpine Global Premier Properties Fund (the “Alpine Trusts”). |
144
Alpine Mutual Funds
Additional Information (Unaudited)—Continued
October 31, 2013
Interested Trustees & Officers
| Name and Age | | Position(s)
Held with
the Trust | | Term of Office
and Length of
Time Served | | Principal Occupation During
Past Five Years | | # of
Portfolios in
Fund
Complex** | | Other Directorships
Held by Trustee |
| Samuel A. Lieber* (57) | | Interested Trustee, President and Portfolio Manager | | Indefinite,
since the
Trust’s
inception | | CEO of Alpine Woods Capital Investors, LLC since November 1997. President of Alpine Trusts since 1998. | | 18 | | Trustee, each of the Alpine Trusts. |
| Stephen A. Lieber*** (88) | | Vice President
and Portfolio Manager | | Indefinite,
since the
Trust’s
inception | | Chief Investment Officer, Alpine Woods Capital Investors, LLC since 2003; Chairman and Senior Portfolio Manager, Saxon Woods Advisors, LLC since 1999. | | 18 | | None |
| Kenneth Corrado (49) | | Chief Compliance Officer | | Indefinite, since July 2013 | | Chief Compliance Officer, Alpine Woods Capital Investors, LLC since July 2013; Independent Compliance Consultant (2012-2013); Vice President and Deputy Chief Compliance Officer, Artio Global Management, LLC (2007-2012); Vice President and Chief Compliance Officer, BNY Asset Management (2000-2007), Compliance Officer, Prudential Insurance Company of America (1995-2000), Operations Manager, Prudential Insurance Company of America (1988-1995). | | 18 | | None |
| Ronald Palmer (45) | | Chief Financial Officer and Treasurer | | Indefinite,
since January
2010 | | Chief Financial Officer, Alpine Woods Capital Investors, LLC since January 2010; Independent Consultant (2008-2009); Vice President, Cash Management and Foreign Exchange, Macquarie Capital Investment Management, LLC (2007-2008); Chief Operating Officer, Macquarie Fund Adviser, LLC (2004-2007). | | 18 | | None |
| Andrew Pappert (33) | | Secretary | | Indefinite,
since March
2009 | | Director of Fund Operations, Alpine Woods Capital Investors, LLC since September 2008; Assistant Vice President, Mutual Fund Operations, Credit Suisse Asset Management, LLC (2003-2008). | | 18 | | None |
| * | | Denotes Trustees who are “interested persons” of the Trust or Fund under the 1940 Act. |
| ** | | The term “Fund Complex” refers to the Funds in the Alpine Equity Trust, Alpine Series Trust, and Alpine Income Trust, and Alpine Global Dynamic Dividend Fund, Alpine Total Dynamic Dividend Fund, and Alpine Global Premier Properties Fund (the “Alpine Trusts”). |
| *** | | Stephen A. Lieber is the father of Samuel A. Lieber. |
Further information regarding the Funds’ Trustees is also available in the Funds’ Statement of Additional Information, which can be obtained without charge by calling 1-888-785-5578.
145
Alpine Mutual Funds
Additional Information (unaudited)—Continued
October 31, 2013
Tax Information
The Funds designated the following percentages of dividends declared from net investment income for the fiscal year ended October 31, 2013 as qualified dividend income under the Jobs & Growth Tax Relief Reconciliation Act of 2003.
| Dynamic Dividend Fund | 67 | % |
| Accelerating Dividend Fund | 37 | % |
| Financial Services Fund | 0 | % |
| Innovators Fund | 0 | % |
| Transformations Fund | 0 | % |
| Foundation Fund | 99 | % |
| Ultra Short Tax Optimized Income Fund | 100 | % |
| Municipal Money Market Fund | 0 | % |
| High Yield Managed Duration Municipal Fund | 0 | % |
The Funds designated the following percentages of dividends declared during the fiscal year ended October 31, 2012 as dividends qualifying for the dividends received deduction available to corporate shareholders.
| Dynamic Dividend Fund | 30 | % |
| Accelerating Dividend Fund | 46 | % |
| Financial Services Fund | 0 | % |
| Innovators Fund | 0 | % |
| Transformations Fund | 0 | % |
| Foundation Fund | 90 | % |
| Ultra Short Tax Optimized Income Fund | 0 | % |
| Municipal Money Market Fund | 0 | % |
| High Yield Managed Duration Municipal Fund | 0 | % |
The Funds designated the following percentages of taxable ordinary income distributions as short-term capital gain distributions under Internal Revenue Section 871(k)(2)(C).
| Dynamic Dividend Fund | 0 | % |
| Accelerating Dividend Fund | 0 | % |
| Financial Services Fund | 0 | % |
| Innovators Fund | 0 | % |
| Transformations Fund | 0 | % |
| Foundation Fund | 0 | % |
| Ultra Short Tax Optimized Income Fund | 0 | % |
| Municipal Money Market Fund | 0 | % |
| High Yield Managed Duration Municipal Fund | 0 | % |
The Fund designated as long-term capital gain dividend, pursuant to Internal Revenue Code Section 852(b)(3), the amount necessary to reduce the earnings and profits of the Fund related to net capital gain to zero for the tax year ended October 31, 2013.
Availability of Proxy Voting Information
Information regarding how each Fund votes proxies relating to portfolio securities is available without charge upon request by calling toll-free at 1-888-785-5578 and on the SEC’s website at www.sec.gov. Information regarding how each Fund voted proxies relating to portfolio securities during the most recent twelve month period ended June 30 is available on the SEC’s website at www.sec.gov or by calling the toll-free number listed above.
Availability of Quarterly Portfolio Schedule
Beginning with each Fund’s fiscal quarter ended July 31, 2004, each Fund filed its complete schedule of portfolio holdings on Form N-Q with the SEC. Going forward, each Fund will file Form N-Q for the first and third quarters of each fiscal year on Form N-Q. Each Fund’s Form N-Q is available on the SEC’s website at www.sec.gov and may be reviewed and copied at the SEC’s Public Reference Room in Washington, DC. Information on the operation of the Public Reference Room may be obtained by calling 1-202-551-8090.
146
Alpine Mutual Funds
Additional Information (unaudited)—Continued
October 31, 2013
Approval of Investment Management and Advisory Agreement for New Series
At a meeting held on December 18-19, 2012, the Board of Trustees (the “Board”) of the Alpine Income Trust (the “Trust”) approved the Investment Advisory Agreement (the “Advisory Agreement”) with Alpine Woods Capital Investors, LLC (the “Adviser”) on behalf of the newly organized Alpine High Yield Managed Duration Municipal Fund (“New Fund”).
Prior to this approval, the Adviser provided materials to the Board for its evaluation (“15(c) materials”). The trustees who are not “interested persons” of the Trust or the Adviser (the “Independent Trustees”) were advised by independent legal counsel with respect to these and other relevant matters. Discussed below are certain of the factors considered by the Board in approving the Advisory Agreement with respect to the New Fund. This discussion is not intended to be all-inclusive. The Board reviewed a variety of factors and considered information about the New Fund as well as information received on an ongoing basis at Board and committee meetings. The approval determination was made on the basis of each trustee’s business judgment after consideration of all the information taken as a whole. Individual trustees may have given different weight to certain factors and assigned various degrees of materiality to information received in connection with the contract review process.
In evaluating the Advisory Agreement with respect to the New Fund, the Board, including the Independent Trustees, considered the following factors among others:
Nature, Extent and Quality of Services. The Board considered the general nature, extent, and quality of services provided to the existing series of the Trust, and those expected to be provided to the New Fund, by the Adviser. The Board evaluated the Adviser’s experience in serving as manager of mutual funds, and considered the benefits to shareholders of investing in a fund complex that is served by an organization which also serves other pooled investment vehicles and registered investment companies. The Board also considered the ability of the Advisor to provide appropriate levels of support and resources to the Trust.
The Board considered the background and experience of the Adviser’s Senior Management, including those individuals responsible for the investment, operations and compliance with respect to the New Fund’s investments, and the responsibilities of the investment, operations and compliance personnel with respect to the Trust. They also considered the resources, operational structures and practices of the Adviser in managing the New Fund’s portfolio, in monitoring and securing the New Fund’s compliance with investment objectives and policies and with applicable laws and regulations. Drawing upon all the materials provided throughout the year, including the 15(c) Materials, and their knowledge of the business of the Adviser and the past performance of the lead portfolio manager for the New Fund, the Independent Trustees, took into account the Adviser’s experience and resources in approving the Advisory Agreement.
Investment Performance. The Board noted that the New Fund had no investment performance track record since it had not yet commenced operations. The Board considered the prior investment performance of the existing series of the Trust, including those series currently managed by the New Fund’s proposed portfolio managers. The Board concluded that the Adviser would provide acceptable investment management services to the New Fund.
Advisory Fees and Profitability. The Board considered information prepared by the Adviser comparing the proposed fees and expenses of the New Fund to the average fees and expenses of other mutual funds with similar investment policies.
The Board considered that the Adviser committed to reducing its investment advisory fee or paying the operating expenses of the New Fund for certain periods in order to maintain the overall expense ratio of the New Fund at competitive levels and that the Adviser would enter into a contractual expense limitation agreement with respect to the New Fund. The Board considered that the Adviser would propose an expense limitation agreement prior to the New Fund going effective. Based on these various considerations, the Board concluded that the proposed contractual management fee of the New Fund under the Advisory Agreement was fair and bore a reasonable relationship to the services to be rendered.
147
Alpine Mutual Funds
Additional Information (unaudited)—Continued
October 31, 2013
Expenses. The Board noted that the Adviser would enter into a contractual expense limitation agreement, which would maintain the overall expense ratio of the New Fund at a competitive level. The Board approved the Advisory Agreement contingent upon an acceptable expense limitation agreement being approved prior to the New Fund commencing operations.(1)
Based upon the considerations discussed above and other considerations, the Board, including the Independent Trustees, approved the Advisory Agreement with respect to the New Fund.
(1) On May 28, 2013, the Board considered and approved the Adviser’s contractual agreement to waive its fees and/or reimburse expenses of the Fund so that total annual fund operating expenses (including 12b-1 fees, where applicable, but excluding interest, brokerage commissions, acquired fund fees and expenses and extraordinary expenses) would not exceed annually 1.05% of the average net assets of Class A shares and 0.80% of the average net assets of the Institutional Class shares. The Fund commenced operations on June 3, 2013.
Privacy Policy
The Funds collect non-public information about you from the following sources:
| | · | information we receive about you on applications or other forms; |
| | · | information you give us orally; and |
| | · | information about your transactions with others or us. |
The Funds do not disclose any non-public personal information about our customers or former customers without the customer’s authorization, except as required by law or in response to inquiries from governmental authorities. The Funds restrict access to your personal and account information to those employees who need to know that information to provide products and services to you. The Funds also may disclose that information to unaffiliated third parties (such as to brokers or custodians) only as permitted by law and only as needed for us to provided agreed services to you. The Funds maintain physical, electronic and procedural safeguards to guard your non-public personal information.
In the event that you hold shares of the Funds through a financial intermediary, including, but not limited to a broker dealer, bank or trust company, the privacy policy of your financial intermediary would govern how your non-public personal information would be shared with unaffiliated third parties.
148
trustees
Samuel A. Lieber
Eleanor T.M. Hoagland
James A. Jacobson
H. Guy Leibler
Jeffrey E.Wacksman
custodian &
administrator
State Street Bank & Trust Company
One Lincoln Street
Boston, MA 02111
independent registered
public accounting firm
Deloitte & Touche LLP
500 College Road East
Princeton, NJ 08540
fund counsel
Willkie Farr & Gallagher LLP
787 7th Avenue
New York, NY 10019
distributor
Quasar Distributors, LLC
615 East Michigan Street
Milwaukee,WI 53202
INVESTMENT Adviser
Alpine Woods Capital Investors, LLC
2500 Westchester Ave., Suite 215
Purchase, NY 10577
transfer agent
Boston Financial Data Services
Two Heritage Drive
North Quincy, MA 02171

shareholder | investor information
1(888)785.5578
www.alpinefunds.com
This material must be preceded or accompanied by a current prospectus.
Item 2. Code of Ethics.
| | |
| | (a) The Registrant, as of the end of the period covered by the report, has adopted a code of ethics that applies to the Registrant’s principal executive officer, principal financial officer, principal accounting officer or controller or persons performing similar functions. |
| | |
| | (b) Not applicable. |
| | |
| | (c) There have been no amendments, during the period covered by this report, to a provision of the code of ethics that applies to the Registrant’s principal executive officer, principal financial officer, principal accounting officer or controller, or persons performing similar functions and that relates to any element of the code of ethics described in Item 2(b) of Form N-CSR. |
| | |
| | (d) The Registrant has not granted any waivers, including an implicit waiver, from a provision of the code of ethics that applies to the registrant’s principal executive officer, principal financial officer, principal accounting officer or controller, or persons performing similar functions that relates to any element of the code of ethics described in Item 2(b) of Form N-CSR. |
| | |
| | (e) Not applicable. |
| | |
| | (f) The Registrant’s Code of Ethics is attached as Exhibit 12(A)(1) hereto. |
Item 3. Audit Committee Financial Expert.
(a)(1) The Board of Trustees of the Registrant has determined that the Registrant has at least one audit committee financial expert serving on its audit committee.
(a)(2) The Board of Trustees has determined that James A. Jacobson and H. Guy Leibler are audit committee financial experts. Messrs. Jacobson and Leibler are “independent” as defined in paragraph (a)(2) of Item 3 to Form N-CSR. It has been determined that Mr. Jacobson qualifies as an audit committee financial expert based on his extensive experience in the financial services industry, including serving for more than 15 years as a senior executive at a New York Stock Exchange (“NYSE”) specialist firm and as a member of the NYSE Board of Directors (including terms as Vice Chair), his other board service, as well as his educational background. It has been determined that Mr. Leibler qualifies as an audit committee financial expert based on his substantial experience as a senior executive of an operating company actively supervising principal financial officers in the preparation of financial statements, other board service, as well as his educational background.
(a)(3) Not applicable.
Item 4. Principal Accountant Fees and Services.
(a) Audit Fees: The aggregate fees billed for each of the last two fiscal years for professional services rendered by the principal accountant for the audit of the registrant’s annual financial statements or services that are normally provided by the accountant in connection with statutory and regulatory filings or engagements fiscal year 2012 was $89,390 and for fiscal year 2013 was $158,760.
(b) Audit-Related Fees: The aggregate fees billed in each of the last two fiscal years for assurance and related services by the principal accountant that are reasonably related to the performance of the audit of the registrant’s financial statements and are not reported under paragraph (a) of this Item was $0 in fiscal year 2012 and $0 in fiscal year 2013.
(c) Tax Fees: The aggregate fees billed in each of the last two fiscal years for professional services rendered by the principal accountant for tax compliance, tax advice, and tax planning was $21,412 in fiscal year 2012 and $12,956 in fiscal year 2013.
(d) All Other Fees: The aggregate fees billed in each of the last two fiscal years for products and services provided by the principal accountant, other than the services reported in paragraphs (a) through (c) of this Item is $10,947 in fiscal year 2012 and $19,029 in fiscal year 2013. The fees were for consulting and advisory services regarding enterprise risk management.
(e)(1) Audit Committee Pre-Approval Policies and Procedures: All services to be performed by the Registrant’s principal auditors must be pre-approved by the Registrant’s audit committee, which may include the approval of certain services up to an amount determined by the audit committee. Any services that would exceed that amount would require additional approval of the audit committee.
(e)(2) No services described in paragraphs (b) through (d) were approved pursuant to paragraph (c)(7)(i)(C) of Rule 2-01 of Regulation S-X.
(f) Not applicable.
(g) The aggregate non-audit fees billed by the registrant’s accountant for services rendered to the registrant, and the registrant’s investment adviser, and any entity controlling, controlled by, or under common control with the adviser that provides ongoing services to the registrant was $109,474 in fiscal year 2012 and $190,297 in fiscal year 2013. The fees were for consulting and advisory services regarding enterprise risk management.
(h) Not applicable
Item 5. Audit Committee of Listed Registrants.
Not applicable to registrants who are not listed issuers (as defined in Rule 10A-3 under the Securities Exchange Act of 1934).
Item 6. Investments.
Schedule of Investments is included as part of the report to shareholders filed under Item 1 of this Form.
Item 7. Disclosure of Proxy Voting Policies and Procedures for Closed-End Management Investment Companies.
Not applicable to open-end investment companies.
Item 8. Portfolio Managers of Closed-End Management Investment Companies.
Not applicable to open-end investment companies.
Item 9. Purchases of Equity Securities by Closed-End Management Investment Company and Affiliated Purchasers.
Not applicable to open-end investment companies.
Item 10. Submission of Matters to a Vote of Security Holders.
Not Applicable.
Item 11. Controls and Procedures.
| (a) | The Registrant’s principal executive officer and principal financial officer have evaluated the Registrant’s disclosure controls and procedures (as defined in Rule 30a-3(c) under the Investment Company Act of 1940, as amended) within 90 days of this filing and have concluded that the registrant’s disclosure controls and procedures were effective, as of that date. |
| (b) | There were no changes in the Registrant’s internal control over financial reporting (as defined in Rule 30a-3(d) under the Act) that occurred during the second fiscal quarter of the period covered by this report that has materially affected, or is reasonably likely to materially affect, the Registrant’s internal control over financial reporting. |
Item 12. Exhibits.
(a)(1) The Code of Ethics that applies to the Registrant’s principal executive officer and principal financial officer is attached hereto as Exhibit 12.A.1.
(a)(2) The certifications required by Rule 30a-2(a) of the Investment Company Act of 1940, as amended, and Section 302 of the Sarbanes-Oxley Act of 2002 are attached hereto as Ex99.Cert.
(a)(3) Not applicable.
(b) The certifications by the Registrant’s Principal Executive Officer and Principal Financial Officer, as required by Rule 30a-2(b) of the Investment Company Act of 1940, as amended, and Section 906 of the Sarbanes-Oxley Act of 2002 are attached hereto as Ex99.906Cert.
SIGNATURES
Pursuant to the requirements of the Securities Exchange Act of 1934 and the Investment Company Act of 1940, the registrant has duly caused this report to be signed on its behalf by the undersigned, thereunto duly authorized.
Alpine Series Trust
| By: | /s/ Samuel A. Lieber | |
| | Samuel A. Lieber | |
| | Chief Executive Officer (Principal Executive Officer) |
Date: January 7, 2014
Pursuant to the requirements of the Securities Exchange Act of 1934 and the Investment Company Act of 1940, this report has been signed below by the following persons on behalf of the registrant and in the capacities and on the dates indicated.
| By: | /s/ Samuel A. Lieber | |
| | Samuel A. Lieber | |
| | Chief Executive Officer (Principal Executive Officer) | |
| | | |
| By: | /s/ Ronald G. Palmer, Jr. | |
| | Ronald G. Palmer, Jr. | |
| | Chief Financial Officer (Principal Financial Officer) | |
Date: January 7, 2014