UNITED STATES
SECURITIES AND EXCHANGE COMMISSION
Washington, D.C. 20549
FORM N-CSR
CERTIFIED SHAREHOLDER REPORT OF REGISTERED
MANAGEMENT INVESTMENT COMPANIES
Investment Company Act file number: 811-10405
Alpine Series Trust
(Exact name of registrant as specified in charter)
2500 Westchester Avenue, Suite 215
Purchase, New York 10577
(Address of principal executive offices)(Zip code)
(Name and Address of Agent for
Service) | Copy to: |
| | |
Samuel A. Lieber
Alpine Woods Capital Investors, LLC
2500 Westchester Avenue, Suite 215
Purchase, New York 10577 | Rose DiMartino
Attorney at Law
Willkie Farr & Gallagher
787 7th Avenue, 40th Floor
New York, New York 10019 |
Registrant’s telephone number, including area code: (914) 251-0880
Date of fiscal year end: October 31
Date of reporting period: November 1, 2015 - October 31, 2016
Item 1: Shareholder Report

Table of Contents
| Additional Alpine Funds are offered in the Alpine Equity Trust. These Funds include: |
| |
| Alpine International Real Estate Equity Fund | Alpine Emerging Markets Real Estate Fund |
| Alpine Realty Income & Growth Fund | Alpine Global Infrastructure Fund |
| | Alpine Global Realty Growth & Income Fund |
Alpine’s Real Estate Funds’ investment objectives, risks, charges and expenses must be considered carefully before investing in funds of the Alpine Equity Trust. The statutory and summary prospectuses contain this and other important information about the investment company, and it may be obtained by calling 1-888-785-5578, or visiting www.alpinefunds.com. Read it carefully before investing.
Mutual fund investing involves risk. Principal loss is possible.
Alpine’s Investment Outlook

Dear Shareholders:
The fiscal year ended October 31, 2016 showed many of characteristics typical of an extended period of economic transition, as reflected through the capital markets. Uncertainty whether the slow growth, low inflation world economy would begin to trend toward growth or descend to deflation has made business cautious about spending for expansion. It has tempered even limited action by the Federal Reserve to normalize interest rates over the past few years. Thus, the collapse of commodity prices early in the year and Britain’s “Brexit” vote significantly influenced short term capital market trends during the year, but then markets returned to trend.
SEA CHANGE
However, after the fiscal year, we experienced a dramatic sea change in the aftermath of the U.S. presidential election of 2016, which for better or for worse, has created the prospect for a significant reshuffling of expectations. Initially, the markets have to rely upon campaign rhetoric, which may be unrealistic in terms of future enactment or execution of new policies. That said, we have adjusted our investment framework from the expectation of lower interest rates and slower growth for longer periods of time to the possibility of moderately stronger growth and a stronger dollar with higher interest rates due to potentially higher future domestic inflation. For reasons we will discuss in the following paragraphs, we believe this can be positive for the stock market, negative for bonds and positive for the U.S. dollar over the next six to eighteen months, albeit, with likely heightened bouts of volatility. Over time, as the process of negotiating the implications and feasibility of these new policies unfolds, the impact on market direction will be more precise. Longer term, the risk of significantly higher interest rates might have a negative impact on both capital markets and the economy. However, for now, one does not have to pay the piper to play, as the positive headline of reform outweighs the possible pain of change.
President-elect Trump actually lost the popular vote by 46.2% to Secretary Clinton’s 48.1%, yet he has made it very clear that he is going to push his agenda as if he has a mandate for change. We see proposed cabinet members who in many cases share his view and also share his lack of governmental experience. We believe that the President-elect sees this as providing a fresh perspective from which to restructure the various cabinet level departments ranging from education, labor, energy, Housing and Urban Development (HUD), Health and Human Services (HHS), the Environmental Protection Agency (EPA), transportation,
among others. In a fundamental sense, he is seeking a potential structural reform of government processes and regulations which have shaped our daily lives for the past 30-50 years. While this could have profound consequences, both positive and negative, we believe the scale and scope of these departments of government will require a long learning curve for many of the inexperienced cabinet bosses, which suggests that any potential reform might take years to enact. Nonetheless, we believe that potential structural adjustments to our economy may have very long lasting effects which are not at this time understood.
“FISCAL STIMULUS”
What is very clear to investors is that the ongoing gradual cyclical recovery from the Great Financial Collapse of 2008-2009 has the potential to be jumpstarted by the first meaningful fiscal stimulus since 2009, as Republican alignment promises the end of political gridlock between the Executive and Congress, enabling fiscal spending to grow again. Specifically, via tax cuts, focused primarily on corporations based on their domestic/international production and sales activities appears to be a major form of implementing the stimulus. In essence, this is intended to support domestic production and inhibit off-shore production, which is then sold into the U.S. While this structural shift in taxation is designed to promote growth in new productive capacity, it is very much a federal fiscal redistribution of taxes, which will have an uncertain impact on job growth. In effect, by lowering domestic tax rates from the high of 38% to potentially around 20%, many smaller U.S. companies should experience growth in after-tax earnings of between 20-25% by 2018. Other possible offsets may scale back perhaps 5-10% of these potential gains for some companies. However, multi-national companies with significant earnings in manufacturing abroad may not be as fortunate as they may already be paying very low tax rates. That is why estimates for the average U.S. corporate tax rate is around 23% as opposed to the aforementioned 38% rate. So overall, various estimates of earnings for the S&P 500® Index is for between 8-15%.
The net effect is that the stock market may start to revalue many companies with a higher current price/earnings ratio in anticipation of the following calendar year than they do currently. This could be very positive for not only longer term earnings and dividend payout ratios, but share prices as well. However, there will likely be losers as well as winners. Companies which have been able to use a multinational structure to shelter much of their taxable income may be disadvantaged. That said, those companies with
1
significant retained earnings abroad may be able to bring cash back at a reduced tax rate, which might be redeployed in job creating or shareholder friendly ways, such as expenditures on plant and equipment, special dividends and perhaps even share buybacks. Thus, the new tax regime for corporations could have a positive impact for many companies. Companies optimized for the existing array of tax deductions, which might be eliminated or modified may have to restructure their business model, potentially leading to significant changes in how they use debt and equity in their capital structure.
“RISING INTEREST RATES”
While we have experienced 35 years of falling interest rates since Paul Volker led the Federal Reserve in breaking the back of inflationary expectations, it has been three and a half years since Ben Bernanke began warning the market that he would taper the quantitative easing program, which supported asset prices in recent years. Ironically, it was financial assets and financially sensitive stocks that benefited most from such easing and yet it also sustained fears of a deflationary spiral as the natural buyers of many of these financial instruments (such as bonds, loans, utility and real estate investment trust (REIT) stocks) chased the spiraling yields downward, effectively reducing their expected returns. Indeed, this has created a serious problem for very long term investors, such as pension funds and insurance companies, even though interest rates have only just begun to rise in the U.S. The prospects for another Fed Funds increase in December and possibly two or three in 2017 seem to be partly baked into market expectations. Although possible, longer term rate hikes are not.
“SPECTER OF INFLATION”
If the majority of Mr. Trump’s tax plan becomes reality, we would expect to see already historically low levels of unemployment gradually lead to rising wages by 2018, and if the fiscal stimulus is further boosted by significant infrastructure spending which could start to flow by then, the potential for an inflationary surge into 2019 is possible. Needless to say, we will monitor such impacts, but it remains a fundamental concern that the markets may price in a return to longer term inflation if budget deficits continue to grow or accelerate to the downside. As we said at the beginning, we have experienced a sea change in expectations of how our government is run. We do not know how developed President-elect Trump’s thinking is on major matters of state or how they might evolve with experience. However, we do know that his fundamental business model encourages affiliates or associates to design and manage operations. Coordination will be key as large decentralized organizations can be tripped up by the complexities of managing an enterprise, which is anything but an island in the world. Trade policies which encourage ties that bind, such as the North American Free Trade Agreement (NAFTA), lead to mutual investment and support, whereas punitive barriers to trade may lead to retaliation or unilateral alliances which bypass our economy. Such scenarios could interrupt the free flow of goods, services and investment capital upon which our
economy, indeed the global economy, is primarily based. If this happens, we believe it would undo much of the positive benefit President-elect Trump seeks from his structural reforms. Thus, we believe that the markets will be watching his tweets on pins and needles, creating a potentially volatile environment over the near to medium term until long term policies become clarified. Even though the social, civil and even cultural impact of a Trump presidency may be in question for roughly half of the population, it appears that the short term economic program could jumpstart the American economy, which might even speed up the global recovery some eight years after the greatest recession of our lifetime.
“FOCUS ON FUNDAMENTALS”
The U.S. equity market has rebounded strongly post-election in anticipation of this possibility, despite uncertainty of its ultimate shape, but markets will adapt to new information as it becomes available over the following quarters. Another notable aspect of these potential tax and structural changes is that the market focus has shifted from macro-prudential (Central Bank) policy, which stimulated momentum investments and indeed has refocused on basic measures of business performance, profitability and growth at a reasonable price. As our investment approach is rooted in fundamentals, such as cash flow, replacement cost, and value creation through return on invested capital, Alpine is very pleased to see this change. We believe this may favor our investment methodology, which has historically led us to manage our funds with high active share as opposed to closely following indices.
We believe that our funds are well adapted to the current environment and we will continue to address them as economic and business conditions require. Thank you for your support and interest.
Sincerely,

Samuel A. Lieber
President
Past performance is not a guarantee of future results. The specific market, sector or investment conditions that contribute to a Fund’s performance may not be replicated in future periods.
Mutual fund investing involves risk. Principal loss is possible. Please refer to individual letters for risks specific to that Fund.
This letter and the letters that follow represent the opinions of the Funds’ management and are subject to change, are not guaranteed and should not be considered recommendations to buy or sell any security. The information provided is not intended to be, and is not, a forecast of future events, a guarantee of results, or investment advice.
2
| Disclosures and Definitions |  |
Please refer to the Schedule of Portfolio Investments for each Fund’s holding information. Fund holdings and sector allocations are subject to change and should not be considered a recommendation to buy or sell any security.
Favorable tax treatment of Fund distributions may be adversely affected, changed or repealed by future changes in tax laws. Alpine may not be able to anticipate the level of dividends that companies will pay in any given timeframe.
The Funds’ monthly distributions may consist of net investment income, net realized capital gains and/or a return of capital. If a distribution includes anything other than net investment income, the Funds will provide a notice of the best estimate of its distribution sources when distributed, which will be posted on the Funds’ website: www.alpinefunds.com, or can be obtained by calling 1-800-617-7616. We estimate that 9.8% of the distributions Alpine Dynamic Dividend Fund paid were through a return of capital. The other Funds in the Alpine Series Trust and the Income Trust did not pay any distributions during the fiscal annual period ending October 31, 2016 through a return of capital. A return of capital distribution does not necessarily reflect the Funds’ performance and should not be confused with “yield” or “income.” Final determination of the Federal income tax characteristics of distributions paid during the calendar year will be provided on U.S. Form 1099-DIV, which will be mailed to shareholders. Please consult your tax advisor for further information.
All investments involve risk. Principal loss is possible. A small portion of the S&P 500 yield may include return of capital; the 10-year Treasury yield does not include return of capital; Corporate bonds and High Yield Bonds generally do not have return of capital; a portion of the dividend paid by REITs and REIT preferred stock may be deemed a return of capital for tax purposes in the event the company pays a dividend greater than its taxable income. A stock may trade with more or less liquidity than a bond depending on the number of shares and bonds outstanding, the size of the company, and the demand for the securities. The REIT and REIT preferred stock market are smaller than the broader equity and bond markets and often trade with less liquidity than these markets depending upon the size of the individual issue and the demand of the securities. Treasury notes are guaranteed by the U.S. Government and thus they are considered to be safer than other asset classes. Tax features of a Treasury Note, Corporate bond, Stock, High Yield bond, REITs and REIT preferred stock may vary based on an individual circumstances. Consult a tax professional for additional information. Neither the Fund nor any of its representatives may give tax advice.
Investors should consult their tax advisor for information concerning their particular situation.
Standard & Poor’s Financial Services LLC (S&P) is a financial services company, a division of McGraw Hill Financial that publishes financial research and analysis on stocks and bonds. S&P is considered one of the Big Three credit-rating agencies, which also include Moody’s Investor Service and Fitch Ratings.
Ratings reflect the higher of the ratings of Standards & Poor’s Corporation; Moody’s Investors Service, Inc. or Fitch, Inc. Ratings are relative, subjective and not absolute standards of quality, represent the opinions of the independent Nationally Recognized Statistical Rating Organizations (NRSRO), and are adjusted to the Standards and Poors scale shown. Ratings are measured using a scale that typically ranges from AAA (highest) to D (lowest). The security’s credit rating does not eliminate risk. Additional information on ratings methodologies are available by visiting the NRSRO websites; www.standardandpoors.com, www.moodys.com, and www.fitchratings.com. S&P incorporates a broad number of credit areas of each entity/municipality when assigning a bond rating to an entity’s debt instrument, including: (a) financial position, which encompasses liquidity metrics, cash reserves, non-liquid assets, liabilities, and other financial metrics; (b) debt position, which includes long and short-term bonded debt and other privately-placed notes/bonds, leases and other off-balance sheet liabilities; (c) pension and Other Post-Employment Benefits (OPEB); (d) socio-economic indices; and (e) the aptitude and sophistication of management.
Earnings Growth and EPS Growth are not measures of the Funds’ future performance.
Diversification does not assure a profit or protect against loss in a declining market.
Must be preceded or accompanied by a prospectus.
Quasar Distributors, LLC, distributor.
Definitions
Active Share is a measure of the percentage of stock holdings in a manager’s portfolio that differ from the benchmark index.
Alpha – A measure of performance vs. a benchmark on a risk-adjusted basis. A positive alpha of 1.0 means the portfolio has outperformed its benchmark index by 1%. Correspondingly, a similar negative alpha would indicate an underperformance of 1%.
Basis Point is a value equaling one one-hundredth of a percent (1/100 of 1%).
3
| Disclosures and Definitions (Continued) | |
Bloomberg Barclays Municipal Bond: High Yield (non-Investment Grade) Index is the Muni High Yield component of the Barclays Municipal Bond Index. The Barclays Municipal Bond Index is a rules-based, market-value-weighted index engineered for the long-term tax-exempt bond market.
Bloomberg Barclays Municipal Bond: 1 Year (1-2) Index is a total return benchmark of BAA3 ratings or better designed to measure returns for tax exempt assets.
BVAL AAA Benchmark Yield Curve is derived from the estimated yields for bonds with the highest possible ratings in the muni market. The highest rating for Moody’s is Aaa, while S&P and Fitch are both AAA
BVAL Muni Benchmark 10 Year Index is the baseline curve for BVAL tax-exempt munis at the ten year spot on the curve. It is populated with high quality U.S. municipal bonds with an average rating of AAA from Moody’s and S&P. The yield curve is built using non-parametric fit of market data obtained from the Municipal Securities Rulemaking Board, new issues calendars and other proprietary contributed prices.
BVAL Muni Benchmark 1T Index is the baseline curve for BVAL tax-exempt munis at the one year spot on the curve. It is populated with high quality U.S. municipal bonds with an average rating of AAA from Moody’s and S&P. The yield curve is built using non-parametric fit of market data obtained from the Municipal Securities Rulemaking Board, new issues calendars and other proprietary contributed prices.
BVAL Muni Benchmark 6M Index is the baseline curve for BVAL tax-exempt munis at the six month spot on the curve. It is populated with high quality U.S. municipal bonds with an average rating of AAA from Moody’s and S&P. The yield curve is built using non-parametric fit of market data obtained from the Municipal Securities Rulemaking Board, new issues calendars and other proprietary contributed prices.
Chicago Board Options Exchange SPX Volatility Index (VIX Index) reflects a market estimate of future volatility, based on the weighted average of the implied volatilities for a wide range of strikes.
Distribution Yield is calculated by taking the most recent distribution, annualizing it, and dividing by the NAV of the Fund at the period end.
Duration is a commonly used measure of the potential volatility of the price of a debt securities, prior to maturity. Securities with a longer duration generally have more volatile prices than securities of comparable quality with a shorter duration.
Effective Duration is a duration calculation for bonds with embedded options. Effective duration takes into account that expected cash flows will fluctuate as interest rates change. Please note, duration measures the sensitivity of price (the value of principal) of a fixed-income investment to a change in interest rates.
Fed Funds Rate in the U.S. is the interest rate at which depository institutions lend reserve balances to other depository institutions overnight on an uncollateralized basis.
Free cash flow is a measure of financial performance calculated as operating cash flow minus capital expenditures. Free cash flow (FCF) represents the cash that a company is able to generate after laying out the money required to maintain or expand its asset base. Free cash flow is important because it allows a company to pursue opportunities that enhance shareholder value.
Free Cash Flow Yield (FCFY) is an indicator that compares free cash flow and market cap. It is a representation of the income (free cash flow) created by an investment. A yield of 12 percent means that a company is generating 12 percent of its Market Capitalization in free cash flow yearly.
Ibovespa Index is a total return index weighted by traded volume and is comprised of the most liquid stocks traded on the Sao Paulo Stock Exchange.
The Institute of Supply Management (ISM) Manufacturing Purchasing Managers Index (PMI) Report on Business is based on data compiled from monthly replies to questions asked of purchasing and supply executives in over 400 industrial companies.
KBW Nasdaq Bank Index is designed to track the performance of the leading banks and thrifts that are publicly-traded in the U.S. The Index includes 24 banking stocks representing the large U.S. national money centers, regional banks and thrift institutions.
Markit Eurozone Manufacturing PMI measures the performance of the manufacturing sector and is derived from a survey of 600 industrial companies.
MSCI All Country World Index is a total return, free-float adjusted market capitalization weighted index that captures large and mid-cap representation across 24 Developed and 21 Emerging Markets countries. With 2,483 constituents, the index covers approximately 85% of the global investable equity opportunity set. Net total return indices reinvest dividends after the deduction of withholding taxes, using (for international indices) a tax rate applicable to non-resident institutional investors who do not benefit from double taxation treaties.
4
| | |
MSCI Europe Index is a free float-adjusted market capitalization weighted index that is designed to measure the equity market performance of the developed markets in Europe.
Source: MSCI. MSCI makes no express or implied warranties or representations and shall have no liability whatsoever with respect to any MSCI data contained herein. The MSCI data may not be further redistributed or used as a basis for other indices or any securities or financial products. This report is not approved, reviewed or produced by MSCI.
NASDAQ Financial 100 Total Return Index is a total return index that includes 100 of the largest domestic and international financial securities listed on The NASDAQ Stock Market based on market capitalization. They include companies classified according to the Industry Classification Benchmark as Financials, which are included within the NASDAQ Bank, NASDAQ Insurance, and NASDAQ Other Finance Indexes.
Net asset value (NAV) is the value of an entity’s assets minus the value of its liabilities, often in relation to open-end or mutual funds, since shares of such funds registered with the U.S. Securities and Exchange Commission are redeemed at their net asset value.
Price/Earnings Ratio (P/E) is a valuation ratio of a company’s current share price compared to its per-share earnings. Normalized earnings—earnings metric that shows you want earnings look like smoothed out in the long run, taking into account the cyclical changes in an economy or stock.
Russell 2000® Index measures the performance of the small-cap segment of the U.S. equity universe and includes approximately 2000 of the smallest securities based on a combination of their market cap and current index membership.
Russell 2000 Financial Services Index serves as a benchmark for all financial services sector small cap stocks in the US specifically those with the Russell 2000® Index.
Source: FTSE Russell Indexes. “FTSE®”, “Russell®”, “MTS®”, “FTSE TMX®” and “FTSE Russell” and other service marks and trademarks related to the FTSE or Russell indexes are trademarks of the London Stock Exchange Group companies and are used by FTSE, MTS, FTSE TMX and Russell under license.
S&P 500® Index is a total return, float-adjusted market capitalization-weighted index of 500 common stocks chosen for market size, liquidity, and industry group representation to represent U.S. equity performance. Total return indexes include reinvestments of all dividends.
S&P 500® Utilities Index comprises those companies included in the S&P 500® that are classified as members of the GICS utilities sector.
S&P 500® Telecommunications Services Index comprises those companies included in the S&P 500® that are classified as members of the GICS telecommunications services sector.
S&P Municipal Bond Short Intermediate Index consists of bonds in the S&P Municipal Bond Index with a min maturity of 1 year and a max of 8 years.
The S&P 500® Index, S&P Biotechnology Index, S&P 500® Telecommunications Services Index, S&P 500® Utilities Index and the S&P Municipal Bond Short Intermediate Index (the “Indices”) are products of S&P Dow Jones Indices LLC and have been licensed for use by Alpine Woods Capital Investors, LLC. Copyright © 2015 by S&P Dow Jones Indices LLC. All rights reserved. Redistribution or reproductions in whole or in part are prohibited without written the permission of S&P Dow Jones Indices LLC. S&P Dow Jones Indices LLC, its affiliates, and third party licensors make no representation or warranty, express or implied, with respect to the Index and none of such parties shall have any liability for any errors, omissions, or interruptions in the Index or the data included therein.
Tangible book value is what an investor would expect to receive if the company liquidated all of its assets. For example, the tangible book value of company “XYZ” would be the liquidation value of all of its assets combined if they were valued on the accounting books today, including all land, capital, inventory, etc.
U.S. Revenue BVAL BBB Benchmark Yield Curve is derived from the estimated yields for bonds rated in the BBB range. For Moody’s, this range includes ratings of Baa1, Baa2, and Baa3. For S&P, this includes ratings of BBB+, BBB, and BBB-.
Weighted Average Maturity is the average time it takes for securities in a portfolio to mature, weighted in proportion to the dollar amount that is invested in the portfolio. Weighted average maturity (WAM) measures the sensitivity of fixed-income portfolios to interest rate changes. Portfolios with longer WAMs are more sensitive to changes in interest rates because the longer a bond is held, the greater the opportunity for interest rates to move up or down and affect the performance of the bonds in the portfolio.
An investor cannot invest directly in an index.
5
Equity Manager Reports

| | Alpine Dynamic Dividend Fund |
| | |
| | Alpine Rising Dividend Fund |
| | |
| | Alpine Financial Services Fund |
| | |
| | Alpine Small Cap Fund |
6
| Alpine Dynamic Dividend Fund |  |
| Comparative Annualized Returns as of 10/31/16 (Unaudited) | |
| | | 1 Year | | 3 Years | | 5 Years | | 10 Years | | Since Inception(1) | |
| Alpine Dynamic Dividend Fund — Institutional Class | | 0.18% | | 3.90% | | 6.52% | | -0.14% | | 4.35% | |
| Alpine Dynamic Dividend Fund — Class A (Without Load) | | -0.06% | | 3.65% | | N/A | | N/A | | 7.33% | |
| Alpine Dynamic Dividend Fund — Class A (With Load) | | -5.63% | | 1.71% | | N/A | | N/A | | 6.09% | |
| MSCI All Country World Index | | 2.05% | | 3.21% | | 8.03% | | 3.78% | | 6.75% | |
| Lipper Global Equity Income Funds Average(2) | | 1.83% | | 2.07% | | 6.71% | | 2.90% | | 6.12% | |
| Lipper Global Equity Income Funds Ranking(2) | | 117/170 | | 23/145 | | 53/94 | | 41/41 | | 32/32 | |
| Gross Expense Ratio (Institutional Class): 1.27%(3) | | | | | | | | | | | |
| Net Expense Ratio (Institutional Class): 1.27%(3) | | | | | | | | | | | |
| Gross Expense Ratio (Class A): 1.52%(3) | | | | | | | | | | | |
| Net Expense Ratio (Class A): 1.52%(3) | | | | | | | | | | | |
| | | | | | | | | | | | |
| | (1) | Institutional Class shares commenced on September 22, 2003 and Class A shares commenced on December 30, 2011. Returns for indices are since September 22, 2003. |
| | (2) | The since inception return represents the period beginning September 25, 2003 (Institutional Class only). |
| | (3) | As disclosed in the prospectus dated February 29, 2016 as supplemented April 4, 2016. |
Performance data quoted represents past performance and is not predictive of future results. Investment return and principal value of the Fund fluctuate, so that the shares, when redeemed, may be worth more or less than their original cost. Performance current to the most recent month end may be lower or higher than performance quoted and may be obtained by calling 1-888-785-5578. Performance data shown does not reflect the 1.00% redemption fee imposed on shares held for fewer than 60 days. If it did, total returns would be reduced. Returns for the Class A shares with sales charge reflect a maximum sales charge of 5.50%. Performance for the Class A shares without sales charges does not reflect this load.
MSCI All Country World Index is a total return, free-float adjusted market capitalization weighted index that captures large- and mid-cap representation across 24 developed and 21 emerging markets countries. With 2,483 constituents, the index covers approximately 85% of the global investable equity opportunity set. Net total return indices reinvest dividends after the deduction of withholding taxes, using (for international indices) a tax rate applicable to non-resident institutional investors who do not benefit from double taxation treaties. (Source: MSCI.) MSCI data may not be reproduced or used for any other purpose. MSCI provides no warranties, has not prepared or approved this report, and has no liability hereunder. Lipper Analytical Services, Inc. is an independent mutual fund research and rating service. The Lipper Global Equity Income Funds Average is an average of funds that by prospectus language and portfolio practice seek relatively high current income and growth of income by investing at least 65% of their portfolio in dividend-paying securities of domestic and foreign companies. The highest rank is 1 and the lowest is based on the total number of funds ranked in the category. Lipper rankings for the periods shown are based on fund total returns with dividends and distributions reinvested and do not reflect sales charges. The Lipper Global Equity Income Funds Average are unmanaged and do not reflect the deduction of direct fees associated with a mutual fund, such as investment adviser fees; however, the Lipper Global Equity Income Funds Average reflects fees charged by the underlying funds. The performance for the Alpine Dynamic Dividend Fund reflects the deduction of fees for these value-added services. Investors cannot directly invest in an index.
Expense Ratios reflect the ratios reported in the Fund’s most recent prospectus (as supplemented). The Alpine Dynamic Dividend Fund has a contractual expense waiver that continues through April 1, 2017. Where a Fund’s gross and net expense ratios are the same for the period reported, the contractual expense reimbursement level was not reached as of the end of that period. To the extent the Fund’s expenses were reduced by waivers, the Fund’s total returns were increased. In these cases, in the absence of the expense waivers, the Fund’s total returns would have been lower.
To the extent that the Fund’s historical performance resulted from gains derived from participation in Initial Public Offerings (“IPOs”) and/or Secondary Offerings, there is no guarantee that these results can be replicated in future periods or that the Fund will be able to participate to the same degree in IPO/Secondary Offerings in the future.
7
| Alpine Dynamic Dividend Fund (Continued) | |
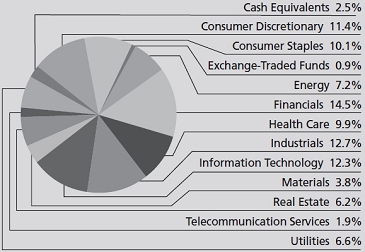
Portfolio Distributions* (Unaudited)
| Top 10 Holdings* (Unaudited) |
| 1. | | Apple, Inc. | 1.83 | % |
| 2. | | CVS Health Corp. | 1.49 | % |
| 3. | | CMS Energy Corp. | 1.48 | % |
| 4. | | NextEra Energy, Inc. | 1.40 | % |
| 5. | | American Tower Corp. | 1.36 | % |
| 6. | | Svenska Cellulosa AB SCA-B Shares | 1.35 | % |
| 7. | | Banco Bilbao Vizcaya Argentaria SA | 1.33 | % |
| 8. | | Ferrovial SA | 1.30 | % |
| 9. | | The Home Depot, Inc. | 1.24 | % |
| 10. | | B/E Aerospace, Inc. | 1.19 | % |
| * | Portfolio Distributions percentages are based on total net investments. Top 10 Holdings do not include short-term investments and percentages are based on total net assets. Portfolio holdings sector distributions are as of 10/31/16 and are subject to change. Portfolio holdings are not recommendations to buy or sell any securities. |
Value of a $1,000,000 Investment (Unaudited)
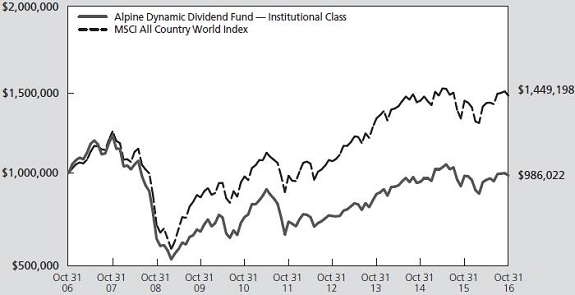
This chart represents a comparison of a hypothetical $1,000,000 investment in the Fund versus a similar investment in the Fund’s benchmark. The graph and the table do not reflect the deduction of taxes that a shareholder would pay on Fund distributions or the redemption of Fund shares. Investment performance reflects the waiver and recovery of certain fees, if applicable. Without the waiver and recovery of fees, the Fund’s total return would have differed.
Performance data quoted represents past performance and is not predictive of future results. Investment return and principal value of the Fund fluctuate, so that shares, when redeemed, may be worth more or less than their original cost.
8
| Alpine Dynamic Dividend Fund (Continued) | |
Commentary
Dear Shareholders:
For the fiscal year ended October 31, 2016, the Alpine Dynamic Dividend Fund generated a total return of 0.18% versus its benchmark, the MSCI All Country World Index, which had a total return of 2.05%. All returns include reinvestment of all distributions. The Fund distributed $0.24 per share during the period. All references in this letter to the Fund’s performance relate to the Fund’s Institutional Class.
PERFORMANCE DRIVERS
Global equities staged an impressive, albeit modest rally during the 12-month period ended October 31, 2016, climbing the proverbial “wall of worry.” It was far from a smooth ride, however, with the S&P 500® Index down 11% in the first 6 weeks of calendar year 2016 as concerns of a U.S. recession combined with a softening of macroeconomic indicators overseas. After recovering from this setback, global stocks faced a new challenge with the surprising outcome of the “Brexit” referendum, in which citizens of the United Kingdom voted in favor of leaving the European Union. While this also led to a brief panic-inspired selloff, investors once again generally shifted from risk aversion to risk seeking behavior as central banks banded together across the world to drive down interest rates and provide liquidity. While the volatility subsided, with the Chicago Board Options Exchange Volatility Index (VIX) declining from a peak of 28 in February to a trough of 11 in August 2016, investors were quite selective in where they chose to direct their funds. Stocks of regulated utilities and telecom services companies, known as “bond proxies” because their high dividend yields attract investors seeking income, performed quite well, with the S&P 500 Utilities Index up 17.11% and the S&P 500 Telecom Services Index up 10.75% for the 12-month period. Money flowed freely into emerging market stocks as well, with the Ibovespa Brasil Sau Paulo Stock Exchange Index up 71.85% in U.S. dollar terms, fueled in part by the prospect of a political regime change as a result of the impeachment of President Dilma Rousseff. Across the Atlantic, Europe struggled amidst fears that Brexit-inspired political change may put further pressure on the cohesion of the European Union. The MSCI Europe Index consequently declined by 6.68% in U.S. dollar terms.
On a sector basis, information technology, utilities and industrials had the greatest positive effect on the absolute total return of the Fund. The health care, financials, and consumer discretionary sectors had the greatest negative effect on the absolute performance of the Fund. On a relative basis, the utilities sector generated the largest outperformance versus the MSCI All Country World Index, followed by real estate and information technology sectors. The consumer
discretionary, financials, and consumer staples sectors were the worst relative performers during the period.
PORTFOLIO ANALYSIS
The top five contributors to the Fund’s performance for the fiscal year ending October 31, 2016 based on contribution to total return were Rumo Logistica Operadora Multimodal S.A., Cosan Logistica S.A., Broadcom Ltd., Applied Materials, and Four Corners Property Trust.
| | • | Rumo Logistica Operadora Mulitimodal (“Rumo”) SA is a railway concession operator in Brazil. The stock outperformed after it raised $2.6 billion Reals ($705 million USD) through an equity stock offering. This allowed the company to significantly reduce its leverage and alleviate liquidity concerns, leading to a significant rerating of the stock. |
| | | |
| | • | Cosan Logistica is a holding company whose sole asset is shares of Rumo (see above), hence the shares correlate strongly with Rumo. The stock currently trades at a significant discount to its net asset value. |
| | | |
| | • | Semiconductor manufacturer Broadcom Ltd. continued to impress investors, realizing its synergy targets ahead of schedule following the first full quarter after the Avago/Broadcom merger. The company also benefited from significantly increased dollar content in the recently launched iPhone 7, which benefited from competitor Samsung’s Galaxy Note 7 challenges. |
| | | |
| | • | Applied Materials, which supplies wafer fabrication equipment to the semiconductor industry, benefited from a surge in orders for equipment used to build logic semiconductors, dynamic random-access memory (DRAM) devices, and NAND flash memory. The company is especially well positioned for the shift towards higher resolution, thinner, less power consuming, foldable, stretchable displays in smartphones. |
| | | |
| | • | Four Corners Property Trust is a real estate investment trust (“REIT”) that was formed in a tax-free spin-off from restaurant owner and operator Darden Restaurants in November 2015. The portfolio consists of over 25% of Darden’s 1,500, restaurants with brands including Olive Garden and Longhorn Steakhouse, the vast majority of which are leased to Darden. The company paid a special dividend of $8.12 per share in January 2016 as part of the REIT conversion process whereby a company must distribute all earnings and profits accumulated prior to achieving REIT status. The stock performed well as investors were attracted to its high quality portfolio with one of the highest internal growth rates across the net lease sector. |
9
| Alpine Dynamic Dividend Fund (Continued) | |
The bottom five contributors to the Fund’s performance for the fiscal year ending October 31, 2016 based on contribution to total return were The Williams Companies, Adani Ports & Special Economic Zone Ltd., Nokia Oyj, ITV plc, and Teva Pharmaceutical Industries.
| | • | The Williams Companies is a midstream company with an extensive network of natural gas and natural gas liquids infrastructure. The company’s underlying fundamentals deteriorated due to declining olefin fiber margins and the financial distress of a key customer, Chesapeake Energy, which suffered from its exposure to declining natural gas prices. Investors also soured on the merger between Energy Transfer Equity and Williams, implying that the low price paid for Williams suggested a bearish statement regarding midstream valuations. The Fund has since exited the position. |
| | | |
| | • | Adani Ports and Special Economic Zone Ltd. (“Adani Ports”) is an Indian port operator. The stock underperformed as investors became concerned with the company’s corporate governance and leverage, with an increase in loans to other Adani companies. Fundamentally, port volumes at Adani Ports continue to be strong relative to other global port operators. The Fund no longer has a position in the stock. |
| | | |
| | • | Nokia Oyj is a Finnish manufacturer of network equipment to telecom operators. The stock under-performed as the outlook for the communications service provider market worsened, particularly in mobile infrastructure, as large Long Term Evolution (LTE) rollouts slowed down. Investors were also concerned by the unexpected departure of the company’s well respected chief financial officer. The company has continued to execute well as it integrates Alcatel-Lucent, but the macro environment will likely remain challenging into 2017. |
| | | |
| | • | ITV is a media company located in the United Kingdom. The company owns a commercial television network and develops content for use on its and others’ channels. ITV’s stock underperformed due largely to a combination of the “Brexit” vote and a decline in advertising revenue. The latter is arguably an industry trend as firms are shifting their advertising budgets away from television towards other venues such as video and the internet. The Fund has since exited the position |
| | | |
| | • | Teva Pharmaceutical is the world’s largest generic drug manufacturer and has a branded pharmaceutical business. The company underperformed for two reasons in 2016. First, generic drug sales softened in 2016 due to consolidation of drug purchasing organizations and increased rates of generic drug approvals at the FDA, putting pressure on generic drug prices. Second, Teva’s U.S. multiple sclerosis franchise was hit the second half of 2016, as the company failed to fend off patent challenges on their new 40mg formulation of Copaxone. |
We have hedged a portion of our currency exposures to the Euro, the Japanese Yen and the British Pound. We have also used leverage at times both in the execution of the strategy of the Fund and to help manage net outflows during the fiscal year.
SUMMARY & OUTLOOK
As we look towards the balance of 2016, we see reasons for cautious optimism. While President-elect Donald Trump is arguably a controversial figure, Republican control of both branches of Congress could secure him a mandate to deliver on his market-friendly economic proposals of cutting taxes, reducing non-entitlement and non-military spending, and increasing military and infrastructure spending. And the backdrop leading into Trump’s inauguration is tilting in a positive direction. After five consecutive quarters of year-on-year earnings declines, the S&P 500 posted a year-over-year increase in earnings for the third quarter of 2016. In addition, the ISM Manufacturing PMI has spent 7 out of the last 8 months above 50, suggesting increased economic activity.
Europe also appears to be on the mend with the Markit Eurozone Manufacturing PMI remaining comfortably above 50 for all of calendar 2015 and 2016 through October 31st. Macroeconomic data suggest that the U.K.’s decision to leave the European Union is at least at the outset having less of an impact on European economies than was first feared. Even so, it is early days with the Pound down over 18% versus the U.S. dollar from June highs to October 2016 lows, and this deterioration in buying power is likely to be revealed in the months ahead. In late 2016, Italy will have a vote on constitutional reform. In 2017, France, the Netherlands and Germany will hold elections. Each event has the potential to dramatically alter the course of the “European project.”
The Asia-Pacific region has been more mixed. China continues to juggle the competing demands of economic rebalancing and a growth slowdown. The Japanese economy continues to chug along and the Bank of Japan’s decision to normalize the yield curve as part of their ongoing quantitative easing policy has had an arguably positive impact on sentiment in the region.
Finally, Brazil’s stock market is having a banner year as investors look forward to the potential for meaningful political change. While there there are still numerous headwinds, with fiscal deficits and lingering inflation concerns, investor confidence appears to have increased.
Beyond the macroeconomic environment, the Fund continues to emphasize its focus on high quality companies with strong balance sheets and a willingness to reward shareholders with dividends.
Sincerely,
Brian Hennessey
Joshua E. Duitz
Portfolio Managers
10
| Alpine Dynamic Dividend Fund (Continued) | |
This letter represents the opinions of the Fund’s management and is subject to change, is not guaranteed and should not be considered a recommendation to buy or sell any security. The information provided is not intended to be, and is not, a forecast of future events, a guarantee of future results, or investment advice. Views expressed may vary from those of the firm as a whole.
Past performance is no guarantee of future results.
Mutual fund investing involves risk. Principal loss is possible. The Fund is subject to risks, including the following:
Credit Risk – Credit risk refers to the possibility that the issuer of a security will not be able to make payments of interest and principal when due. Changes in an issuer’s credit rating or the market’s perception of an issuer’s creditworthiness may also affect the value of the Fund’s investment in that issuer. The degree of credit risk depends on both the financial condition of the issuer and the terms of the obligation.
Currency Risk – The value of investments in securities denominated in foreign currencies increases or decreases as the rates of exchange between those currencies and the U.S. dollar change. Currency conversion costs and currency fluctuations could erase investment gains or add to investment losses. Currency exchange rates can be volatile, and are affected by factors such as general economic conditions, the actions of the U.S. and foreign governments or central banks, the imposition of currency controls and speculation.
Cybersecurity Risk – Cybersecurity incidents may allow an unauthorized party to gain access to Fund assets, customer data (including private shareholder information), or proprietary information, or cause the Fund, the Adviser and/or its service providers (including, but not limited to, Fund accountants, custodians, sub-custodians, transfer agents and financial intermediaries) to suffer data breaches, data corruption or lose operational functionality.
Dividend Strategy Risk – There is no guarantee that the issuers of the stocks held by the fund will declare dividends in the future or that, if dividends are declared, they will remain at their current levels or increase over time. The fund’s emphasis on dividend-paying stocks could cause the fund to underperform similar funds that invest without consideration of a company’s track record of paying dividends or ability to pay dividends in the future. Dividend-paying stocks may not participate in a broad market advance to the same degree as other stocks, and a sharp rise in interest rates or economic downturn could cause a company to unexpectedly reduce or eliminate its dividend. The Fund may hold securities for short periods of time related to the dividend payment periods and may experience loss during these periods.
Equity Securities Risk – The stock or other security of a company may not perform as well as expected, and may decrease in value, because of factors related to the company (such as poorer than expected earnings or certain management decisions) or to the industry in which the company is engaged (such as a reduction in the demand for products or services in a particular industry).
Foreign and Emerging Market Securities Risk – The Fund’s investments in securities of foreign issuers or issuers with significant exposure to foreign markets involve additional risk. Foreign countries in which the Fund may invest may have markets that are less liquid, less regulated and more volatile than U.S. markets. The value of the Fund’s investments may decline because of factors affecting the particular issuer as well as foreign markets and issuers generally, such as unfavorable or unsuccessful government actions, reduction of government or central bank support and political or financial instability. Lack of information may also affect the value of these securities. To the extent the Fund focuses its investments in a single country or only a few countries in a particular geographic region, economic, political, regulatory or other conditions affecting such country or region may have a greater impact on Fund performance relative to a more geographically diversified fund. The risks of foreign investments are heightened when investing in issuers in emerging market countries. Emerging market countries tend to have economic, political and legal systems that are less fully developed and are less stable than those of more developed countries. They are often particularly sensitive to market movements because their market prices tend to reflect speculative expectations. Low trading volumes may result in a lack of liquidity and in extreme price volatility.
Foreign Currency Transactions Risk – Foreign securities are often denominated in foreign currencies. As a result, the value of the Fund’s shares is affected by changes in exchange rates. The Fund may enter into foreign currency transactions to try to manage this risk. The Fund’s ability to use foreign currency transactions successfully depends on a number of factors, including the foreign currency transactions being available at prices that are not too costly, the availability of liquid markets and the ability of the Adviser to accurately predict the direction of changes in currency exchange rates. The Fund may enter into forward foreign currency exchange contracts in order to protect against possible losses on foreign investments resulting from adverse changes in the relationship between the U.S. dollar and foreign currencies. Although this method attempts to protect the value of the Fund’s portfolio securities against a decline in the value of a currency, it does not eliminate fluctuations in the underlying prices of the securities and while such contracts tend to minimize the risk of loss due to a decline in the value of the hedged currency, they tend to limit any potential gain which might result should the value of such currency increase.
11
| Alpine Dynamic Dividend Fund (Continued) | |
Growth Stock Risk – Growth stocks typically are very sensitive to market movements because their market prices tend to reflect future expectations. When it appears those expectations will not be met, the prices of growth stocks typically fall. Growth stocks as a group may be out of favor and underperform the overall equity market while the market concentrates on undervalued stocks.
Initial Public Offerings and Secondary Offerings Risk – The Fund may invest a portion of its assets in shares of IPOs or secondary offerings of an issuer. IPOs and secondary offerings may have a magnified impact on the performance of a fund with a small asset base. The impact of IPOs and secondary offerings on the Fund’s performance likely will decrease as the Fund’s asset size increases, which could reduce the Fund’s returns. IPOs and secondary offerings may not be consistently available to the Fund for investing. IPO and secondary offering shares frequently are volatile in price due to the absence of a prior public market, the small number of shares available for trading and limited information about the issuer. Therefore, the Fund may hold IPO and secondary offering shares for a very short period of time. This may increase the turnover of the Fund and may lead to increased expenses for the Fund, such as commissions and transaction costs. In addition, IPO and secondary offering shares can experience an immediate drop in value if the demand for the securities does not continue to support the offering price.
Leverage Risk – The Fund may use leverage to purchase securities. Increases and decreases in the value of the Fund’s portfolio will be magnified when the Fund uses leverage.
Liquidity Risk – Some assets held by the Fund may be impossible or difficult to sell, particularly during times of market turmoil. These illiquid assets may also be difficult to value. If the Fund is forced to sell an illiquid asset to meet redemption requests or other cash needs, the Fund may be forced to sell at a loss.
Management Risk – The Adviser’s judgment about the quality, relative yield or value of, or market trends affecting, a particular security or sector, or about interest rates generally, may be incorrect. The Adviser’s security selections and other investment decisions might produce losses or cause the Fund to underperform when compared to other funds with similar investment objectives and strategies.
Market Risk – The price of a security held by the Fund may fall due to changing market, economic or political conditions.
Portfolio Turnover Risk – High portfolio turnover necessarily results in greater transaction costs which may reduce Fund performance.
Qualified Dividend Tax Risk – Favorable U.S. federal tax treatment of Fund distributions may be adversely affected, changed or repealed by future changes in tax laws.
Small and Medium Capitalization Company Risk – Securities of small or medium capitalization companies are more likely to experience sharper swings in market values, less liquid markets, in which it may be more difficult for the Adviser to sell at times and at prices that the Adviser believes appropriate and generally are more volatile than those of larger companies.
Swaps Risk – Swap agreements are derivative instruments that can be individually negotiated and structured to address exposure to a variety of different types of investments or market factors. Depending on their structure, swap agreements may increase or decrease the Fund’s exposure to long- or short-term interest rates, foreign currency values, mortgage securities, corporate borrowing rates, or other factors such as security prices or inflation rates. The Fund also may enter into swaptions, which are options to enter into a swap agreement. Since these transactions generally do not involve the delivery of securities or other underlying assets or principal, the risk of loss with respect to swap agreements and swaptions generally is limited to the net amount of payments that the Fund is contractually obligated to make. There is also a risk of a default by the other party to a swap agreement or swaption, in which case the Fund may not receive the net amount of payments that the Fund contractually is entitled to receive.
Undervalued Stock Risk – The Fund may pursue strategies that may include investing in securities, which, in the opinion of the Adviser, are undervalued. The identification of investment opportunities in undervalued securities is a difficult task and there is no assurance that such opportunities will be successfully recognized or acquired. While investments in undervalued securities offer opportunities for above-average capital appreciation, these investments involve a high degree of financial risk and can result in substantial losses.
Please refer to pages 3-5 for other important disclosures and definitions.
12
| Alpine Rising Dividend Fund(1) | |
| Comparative Annualized Returns as of 10/31/16 (Unaudited) |
| | | 1 Year | | 3 Years | | 5 Years | | Since Inception(2) | |
| Alpine Rising Dividend Fund — Institutional Class | | 1.86% | | 5.31% | | 10.36% | | 11.12% | |
| Alpine Rising Dividend Fund — Class A (Without Load) | | 1.59% | | 5.08% | | N/A | | 10.29% | |
| Alpine Rising Dividend Fund — Class A (With Load) | | -4.02% | | 3.12% | | N/A | | 9.01% | |
| S&P 500® Index | | 4.51% | | 8.84% | | 13.57% | | 12.24% | |
| Dow Jones Industrial Average | | 5.49% | | 7.91% | | 11.50% | | 11.20% | |
| Lipper Equity Income Funds Average(3) | | 4.70% | | 5.66% | | 10.55% | | 11.58% | |
| Lipper Equity Income Funds Ranking(3) | | 400/508 | | 261/434 | | 187/312 | | 169/252 | |
| Gross Expense Ratio (Institutional Class): 1.94%(4) | | | | | | | | | |
| Net Expense Ratio (Institutional Class): 1.26%(4) | | | | | | | | | |
| Gross Expense Ratio (Class A): 2.19%(4) | | | | | | | | | |
| Net Expense Ratio (Class A): 1.51%(4) | | | | | | | | | |
| | (1) | Effective September 9, 2015 the Fund’s name was changed from the Alpine Accelerating Dividend Fund to Alpine Rising Dividend Fund. |
| | (2) | Institutional Class shares commenced on November 5, 2008 and Class A shares commenced on December 30, 2011. Returns for indices are since November 5, 2008. |
| | (3) | The since inception data represents the period beginning November 6, 2008 (Institutional Class only). |
| | (4) | As disclosed in the prospectus dated February 29, 2016 as supplemented April 4, 2016. |
Performance data quoted represents past performance and is not predictive of future results. Investment return and principal value of the Fund fluctuate, so that the shares, when redeemed, may be worth more or less than their original cost. Performance current to the most recent month end may be lower or higher than performance quoted and may be obtained by calling 1-888-785-5578. Performance data shown does not reflect the 1.00% redemption fee imposed on shares held for fewer than 60 days. If it did, total returns would be reduced. Returns for the Class A shares with sales charge reflect a maximum sales charge of 5.50%. Performance for the Class A shares without sales charges does not reflect this load.
S&P 500® Index is a total return, float-adjusted market capitalization-weighted index of 500 common stocks chosen for market size, liquidity, and industry group representation to represent U.S. equity performance. Total return indexes include reinvestments of all dividends. The Dow Jones Industrial Average is a price-weighted average of 30 blue chip stocks that are generally the leaders in their industry. Lipper Analytical Services, Inc. is an independent mutual fund research and rating service. The Lipper Equity Income Funds Average is an average of funds that seek relatively high current income and income growth through investing 60% or more of their respective portfolios in equities. The highest rank is 1 and the lowest is based on the total number of funds ranked in the category. Lipper rankings for the periods shown are based on fund total returns with dividends and distributions reinvested and do not reflect sales charges. The S&P 500® Index, the Dow Jones Industrial Average, and the Lipper Equity Income Funds Average are unmanaged and do not reflect direct fees associated with a mutual fund, such as investment adviser fees; however, the Lipper Equity Income Funds Average reflects fees charged by the underlying funds. The performance for the Alpine Rising Dividend Fund reflects the deduction of fees for these value-added services. Investors cannot directly invest in an index.
Expense Ratios reflect the ratios reported in the Fund’s most recent prospectus (as supplemented). The Alpine Rising Dividend Fund has a contractual expense waiver that continues through April 1, 2017. Where a Fund’s gross and net expense ratios are the same for the period reported, the contractual expense reimbursement level was not reached as of the end of that period. To the extent the Fund’s expenses were reduced by waivers, the Fund’s total returns were increased. In these cases, in the absence of the expense waivers, the Fund’s total returns would have been lower.
To the extent that the Fund’s historical performance resulted from gains derived from participation in Initial Public Offerings (“IPOs”) and/or Secondary Offerings, there is no guarantee that these results can be replicated in future periods or that the Fund will be able to participate to the same degree in IPO/Secondary Offerings in the future.
13
| Alpine Rising Dividend Fund (Continued) | |
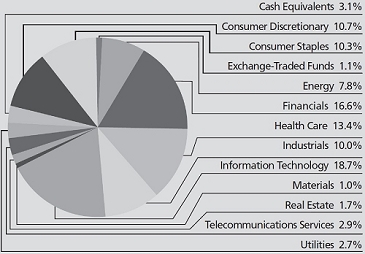
Portfolio Distributions* (Unaudited)
| Top 10 Holdings* (Unaudited) | |
| 1. | | Apple, Inc. | | 2.65% |
| 2. | | Pfizer, Inc. | | 2.22% |
| 3. | | CVS Health Corp. | | 1.97% |
| 4. | | Johnson & Johnson | | 1.97% |
| 5. | | Raytheon Co. | | 1.92% |
| 6. | | Microsoft Corp. | | 1.82% |
| 7. | | The Hartford Financial Services Group, Inc. | | 1.75% |
| 8. | | JPMorgan Chase & Co. | | 1.70% |
| 9. | | Amgen, Inc. | | 1.65% |
| 10. | | Walgreens Boots Alliance, Inc. | | 1.64% |
| * | Portfolio Distributions percentages are based on total net investments. Top 10 Holdings do not include short-term investments and percentages are based on total net assets. Portfolio holdings sector distributions are as of 10/31/16 and are subject to change. Portfolio holdings are not recommendations to buy or sell any securities. |
Value of a $1,000,000 Investment (Unaudited)
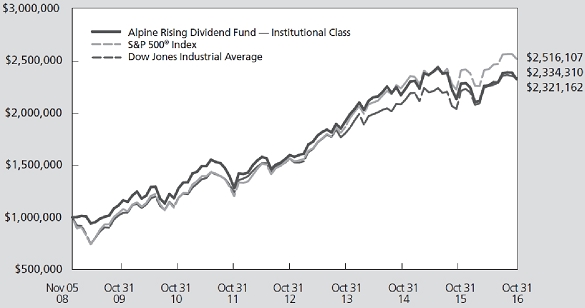
This chart represents a comparison of a hypothetical $1,000,000 investment in the Fund versus a similar investment in the Fund’s benchmarks. The graph and the table do not reflect the deduction of taxes that a shareholder would pay on Fund distributions or the redemption of Fund shares. Investment performance reflects the waiver and recovery of certain fees, if applicable. Without the waiver and recovery of fees, the Fund’s total return would have differed.
Performance data quoted represents past performance and is not predictive of future results. Investment return and principal value of the Fund fluctuate, so that shares, when redeemed, may be worth more or less than their original cost.
14
| Alpine Rising Dividend Fund (Continued) | |
Commentary
Dear Shareholders:
For the twelve months ended October 31, 2016, the Alpine Rising Dividend Fund generated a total return of 1.86% compared to the S&P 500® Index total return of 4.51% for the same period. The Fund distributed $0.526 per share during the fiscal year. All references in this letter to the Fund’s performance relate to the performance of the Fund’s Institutional Class.
PERFORMANCE DRIVERS
After a difficult start to the fiscal year, during which time the S&P 500 declined more than 12% from October 31, 2015 to the February 11, 2016 trough, markets regained their footing and rallied, nearly uninterrupted, into fiscal year end. The one brief sell-off during the fiscal year came at the end of June in the wake of the surprising outcome of the “Brexit” referendum, in which citizens UK voted in favor of leaving the European Union. The sell-off was short-lived, however, and the market resumed its upward climb only days after the vote. In the face of unprecedented central bank accommodation, government bond yields decreased (and thus prices increased) across the globe, and dipped into negative territory in Japan and much of continental Europe. In the U.S., the yield on 10-year Treasury bond declined from 2.14% on October 31, 2015 to 1.83% on October 31, 2016, and reached as low as 1.36% in the aftermath of Brexit.
On a sector basis, information technology, industrials, and utilities had the largest positive impact on the absolute performance of the Fund. The health care, materials, and consumer discretionary sectors had the largest negative impact. On a relative basis, industrials, telecommunication services, and utilities generated the largest outperformance versus the S&P 500, while consumer staples, health care, and materials were the worst relative performers.
PORTFOLIO ANALYSIS
The top five contributors to the Fund’s performance during the twelve months ended October 31, 2016, based on contribution to total return were Applied Materials, Qualcomm, CBS, Raytheon, and Johnson & Johnson.
| | • | Shares of Applied Materials benefitted from better earnings and orders for its wafer fab equipment, as its semiconductor customers competed to produce chips with the latest technology and China began ramping up its domestic chip manufacturing industry. In addition, the company enjoyed strong |
| | | |
| | | orders in its display segment as mobile phone manufacturers transition to OLED screens for the next generation handsets. |
| | | |
| | • | Early signs of better than expected sales of Apple’s latest iPhone, success in negotiating licensing deals with Chinese handset manufacturers, and the announced acquisition of NXP Semiconductors drove the outperformance of Qualcomm shares. |
| | | |
| | • | Defense contractor Raytheon was a positive contributor as its steady growth and bookings from new international contracts helped the shares in a period of heightened geo-political tensions around the globe. |
| | | |
| | • | CBS Corp. contributed positively to the Fund as advertising revenues performed better than expected and its programming strength continued. The Company also named its long-time CEO, Les Moonves, to the additional role of Chairman, settling a long speculated transition from founder Sumner Redstone. |
| | | |
| | • | Diversified healthcare company Johnson & Johnson was also a positive contributor to the Fund for the period as a good earnings report and full year outlook for the company drove the shares. |
| | | |
| Gilead Sciences, Western Digital, Prudential Financial, Teva Pharmaceutical Industries, and Citigroup had the largest adverse impact on the performance of the Fund over the fiscal year. |
| | | |
| | • | Gilead reported results that were slightly disappointing as pricing competition negatively impacted sales of its largest selling drug franchise that treats the hepatitis C virus (HCV). We believe the shares have overreacted to the downside, offer a compelling value, and continue to hold them in the Fund. |
| | | |
| | • | Shares of disk drive maker Western Digital suffered due to a weak PC market, a withdrawn investment of $3.8 billion from Unisplendour of China, and the perception that the price it paid in the acquisition of rival SanDisk was too high. We sold our entire position later in the fiscal year. |
| | | |
| | • | Prudential Financial results suffered from a continuously low interest rate environment. We grew increasingly concerned that a turnaround in its results was farther off than we had hoped and the shares were subsequently sold in their entirety. |
15
| Alpine Rising Dividend Fund (Continued) | |
| | • | Shares of Teva Pharmaceutical Industries sold off given the ill-timed and over-priced acquisition of Allergan’s generic drug franchise and negative legal developments related to its Copaxone multiple sclerosis franchise. We felt these fears became increasingly warranted through the year and difficult to overcome for the stock so we sold our position later in the fiscal year. |
| | | |
| | • | Citigroup shares sold off in the early part of the calendar year after offering disappointing expense guidance for 2016 and concerns related to its above average energy sector and emerging markets exposures. We think Citigroup shares offer good value at these price levels and that these concerns are more than reflected in the current share price and continue to hold them. |
SUMMARY & OUTLOOK
The fiscal year ended much the way it began, with investors once again anticipating a rate hike from the Federal Reserve. In December 2015, the Fed raised its target funds rate for the first time since the onset of the financial crisis. While there were numerous “head fakes” during the course of 2016 when it appeared that the Fed would act a second time, the market is now pricing in a more than an 85% probability that the Fed raises rates
another 25 basis points at the December 2016 meeting with further hikes on the table in 2017. The first hike in 2015, in combination with weak economic data in China and plunging crude oil prices, sent global equity markets into a sharp sell-off. Although history is unlikely to repeat itself exactly, we are positioning the Fund to help navigate choppy markets should subsequent rate hikes usher in another period of increased volatility. Additionally, markets must also contend with the prospect of tapering in Europe as the European Central Banks’s latest quantitative easing program nears its planned end in March 2017. Market valuation measures that have returned to near cycle highs in spite of lackluster earnings growth is also a reason for concern.
While we continue to be prudently cautious, we believe opportunities will continue to present themselves to purchase stocks of companies with a history and consistency of raising their dividends, as we believe these companies have the potential to outperform through a market cycle. We aim to make these stocks with a record of continuous dividend increases the foundation of the Fund.
Sincerely,
Andrew Kohl
Mark Spellman
Portfolio Managers
This letter represents the opinions of the Fund’s management and is subject to change, is not guaranteed and should not be considered a recommendation to buy or sell any security. The information provided is not intended to be, and is not, a forecast of future events, a guarantee of future results, or investment advice. Views expressed may vary from those of the firm as a whole.
Past performance is no guarantee of future results.
Mutual fund investing involves risk. Principal loss is possible. The Fund is subject to risks, including the following:
Currency Risk – The value of investments in securities denominated in foreign currencies increases or decreases as the rates of exchange between those currencies and the U.S. dollar change. Currency conversion costs and currency fluctuations could erase investment gains or add to investment losses. Currency exchange rates can be volatile, and are affected by factors such as general economic conditions, the actions of the U.S. and foreign governments or central banks, the imposition of currency controls and speculation.
Cybersecurity Risk – Cybersecurity incidents may allow an unauthorized party to gain access to Fund assets, customer data (including private shareholder information), or proprietary information, or cause the Fund, the Adviser and/or its service providers (including, but not limited to, Fund accountants, custodians, sub-custodians, transfer agents and financial intermediaries) to suffer data breaches, data corruption or lose operational functionality.
Dividend Strategy Risk – There is no guarantee that the issuers of the stocks held by the fund will declare dividends in the future or that, if dividends are declared, they will remain at their current levels or increase over time. The fund’s emphasis on dividend-paying stocks could cause the fund to underperform similar funds that invest without consideration of a company’s track record of paying dividends or ability to pay dividends in the future. Dividend-paying stocks may not participate in a broad market advance to the same degree as other stocks, and a sharp rise in interest rates or economic downturn could cause a company to unexpectedly reduce or eliminate its dividend. The Fund may hold securities for short periods of time related to the dividend payment periods and may experience losses during these periods.
16
| Alpine Rising Dividend Fund (Continued) | |
Equity Securities Risk – The stock or other security of a company may not perform as well as expected, and may decrease in value, because of factors related to the company (such as poorer than expected earnings or certain management decisions) or to the industry in which the company is engaged (such as a reduction in the demand for products or services in a particular industry).
Foreign Currency Transactions Risk – Foreign securities are often denominated in foreign currencies. As a result, the value of the Fund’s shares is affected by changes in exchange rates. The Fund may enter into foreign currency transactions to try to manage this risk. The Fund’s ability to use foreign currency transactions successfully depends on a number of factors, including the foreign currency transactions being available at prices that are not too costly, the availability of liquid markets and the ability of the Adviser to accurately predict the direction of changes in currency exchange rates.
Foreign Securities Risk – The Fund’s investments in securities of foreign issuers or issuers with significant exposure to foreign markets involve additional risk. Foreign countries in which the Fund may invest may have markets that are less liquid, less regulated and more volatile than U.S. markets. The value of the Fund’s investments may decline because of factors affecting the particular issuer as well as foreign markets and issuers generally, such as unfavorable or unsuccessful government actions, reduction of government or central bank support, and political or financial instability. Lack of information may also affect the value of these securities. To the extent the Fund focuses its investments in a single country or only a few countries in a particular geographic region, economic, political, regulatory, or other conditions affecting such country or region may have a greater impact on Fund performance relative to a more geographically diversified fund. The risks of foreign investments are heightened when investing in issuers of emerging market countries.
Growth Stock Risk – Growth stocks typically are very sensitive to market movements because their market prices tend to reflect future expectations. When it appears those expectations will not be met, the prices of growth stocks typically fall. Growth stocks as a group may be out of favor and underperform the overall equity market while the market concentrates on undervalued stocks. Although the Fund will not concentrate its investments in any one industry or industry group, it may, like many growth funds, weight its investments toward certain industries, thus increasing its exposure to factors adversely affecting issuers within those industries.
Initial Public Offerings and Secondary Offerings Risk – The Fund may invest a portion of its assets in shares of IPOs or secondary offerings of an issuer. IPOs and secondary offerings may have a magnified impact on the performance of a fund with a small asset base. The impact of IPOs and secondary offerings on the Fund’s performance likely will decrease as the Fund’s asset size increases, which could reduce the Fund’s returns. IPOs and secondary offerings may not be consistently available to the Fund for investing. IPO and secondary offering shares frequently are volatile in price due to the absence of a prior public market, the small number of shares available for trading and limited information about the issuer. Therefore, the Fund may hold IPO and secondary offering shares for a very short period of time. This may increase the turnover of the Fund and may lead to increased expenses for the Fund, such as commissions and transaction costs. In addition, IPO and secondary offering shares can experience an immediate drop in value if the demand for the securities does not continue to support the offering price.
Liquidity Risk – Some assets held by the Fund may be impossible or difficult to sell, particularly during times of market turmoil. These illiquid assets may also be difficult to value. If the Fund is forced to sell an illiquid asset to meet redemption requests or other cash needs, the Fund may be forced to sell at a loss.
Management Risk – The Adviser’s judgment about the quality, relative yield or value of, or market trends affecting, a particular security or sector, or about interest rates generally, may be incorrect. The Adviser’s security selections and other investment decisions might produce losses or cause the Fund to underperform when compared to other funds with similar investment objectives and strategies.
Market Risk – The price of a security held by the Fund may fall due to changing market, economic or political conditions.
Micro Capitalization Company Risk – Stock prices of micro capitalization companies are significantly more volatile, and more vulnerable to adverse business and economic developments than those of larger companies. Micro capitalization companies often have narrower markets for their goods and/or services and more limited managerial and financial resources than larger, more established companies, including small or medium capitalization companies.
Portfolio Turnover Risk – High portfolio turnover necessarily results in greater transaction costs which may reduce Fund performance.
17
| Alpine Rising Dividend Fund (Continued) | |
Small and Medium Capitalization Company Risk – Securities of small or medium capitalization companies are more likely to experience sharper swings in market values, less liquid markets, in which it may be more difficult for the Adviser to sell at times and at prices that the Adviser believes appropriate and generally are more volatile than those of larger companies.
Undervalued Stock Risk – The Fund may pursue strategies that may include investing in securities, which, in the opinion of the Adviser, are undervalued. The identification of investment opportunities in undervalued securities is a difficult task and there is no assurance that such opportunities will be successfully recognized or acquired. While investments in undervalued securities offer opportunities for above-average capital appreciation, these investments involve a high degree of financial risk and can result in substantial losses.
Please refer to pages 3-5 for other important disclosures and definitions.
18
| Alpine Financial Services Fund | |
| Comparative Annualized Returns as of 10/31/16 (Unaudited) | |
| | | 1 Year | | 3 Years | | 5 Years | | 10 Years | | Since Inception(1) | |
| Alpine Financial Services Fund — Institutional Class | | 5.97% | | 4.72% | | 14.32% | | 5.95% | | 7.27% | |
| Alpine Financial Services Fund — Class A (Without Load) | | 5.72% | | 4.45% | | N/A | | N/A | | 15.34% | |
| Alpine Financial Services Fund — Class A (With Load) | | -0.09% | | 2.51% | | N/A | | N/A | | 14.00% | |
| Russell 2000® Financial Services Index | | 8.26% | | 8.18% | | 14.58% | | 3.73% | | 5.08% | |
| KBW Nasdaq Bank Index | | 5.00% | | 7.31% | | 15.57% | | -1.86% | | -0.19% | |
| NASDAQ Financial 100 Total Return Index | | 6.30% | | 8.34% | | 14.78% | | 3.49% | | 4.13% | |
| Lipper Financial Services Funds Average(2) | | 3.25% | | 5.95% | | 13.15% | | 0.56% | | 1.81% | |
| Lipper Financial Services Funds Ranking(2) | | 25/88 | | 49/75 | | 28/69 | | 3/56 | | 2/48 | |
| Gross Expense Ratio (Institutional Class): 2.07%(3) | | | | | | | | | | | |
| Net Expense Ratio (Institutional Class): 1.50%(3) | | | | | | | | | | | |
| Gross Expense Ratio (Class A): 2.32%(3) | | | | | | | | | | | |
| Net Expense Ratio (Class A): 1.75%(3) | | | | | | | | | | | |
| | (1) | Institutional Class shares commenced on November 1, 2005 and Class A shares commenced on December 30, 2011. Returns for indices are since November 1, 2005. |
| | (2) | The since inception data represents the period beginning November 1, 2005 (Institutional Class only). |
| | (3) | As disclosed in the prospectus dated February 29, 2016 as supplemented April 4, 2016. |
Performance data quoted represents past performance and is not predictive of future results. Investment return and principal value of the Fund fluctuate, so that the shares, when redeemed, may be worth more or less than their original cost. Performance current to the most recent month end may be lower or higher than performance quoted and may be obtained by calling 1-888-785-5578. Performance data shown does not reflect the 1.00% redemption fee imposed on shares held for fewer than 60 days. If it did, total returns would be reduced. Returns for the Class A shares with sales charge reflect a maximum sales charge of 5.50%. Performance for the Class A shares without sales charges does not reflect this load.
Russell 2000® Financial Services Index serves as a benchmark for all financial services sector small cap stocks in the U.S., specifically those with the Russell 2000® Index. KBW Nasdaq Bank Index is designed to track the performance of the leading banks and thrifts that are publicly-traded in the U.S. The Index includes 24 banking stocks representing the large U.S. national money centers, regional banks and thrift institutions. NASDAQ Financial 100 Total Return Index is a total return index that includes 100 of the largest domestic and international financial securities listed on The NASDAQ Stock Market based on market capitalization. They include companies classified according to the Industry Classification Benchmark as Financials, which are included within the NASDAQ Bank, NASDAQ Insurance, and NASDAQ Other Finance Indexes. S&P 500® Index is a total return, float-adjusted market capitalization-weighted index of 500 common stocks chosen for market size, liquidity, and industry group representation to represent U.S. equity performance. Total return indexes include reinvestments of all dividends. Lipper Analytical Services, Inc. is an independent mutual fund research and rating service. The Lipper Financial Services Funds Average is an average of funds whose primary objective is to invest primarily in equity securities of companies engaged in providing financial services. The highest rank is 1 and the lowest is based on the total number of funds ranked in the category. Lipper rankings for the periods shown are based on fund total returns with dividends and distributions reinvested and do not reflect sales charges. The Russell 2000® Financial Services Index, KBW Nasdaq Bank Index, the NASDAQ Financial 100 Total Return Index, the S&P 500® Index and the Lipper Financial Services Funds Average are unmanaged and do not reflect the deduction of direct fees associated with a mutual fund, such as investment adviser fees; however, the Lipper Financial Services Fund Average reflects fees charged by the underlying funds. The performance for the Alpine Financial Services Fund reflects the deduction of fees for these value-added services. Investors cannot directly invest in an index.
Expense Ratios reflect the ratios reported in the Fund’s most recent prospectus (as supplemented). The Alpine Financial Services Fund has a contractual expense waiver that continues through April 1, 2017. Where a Fund’s gross and net expense ratios are the same for the period reported, the contractual expense reimbursement level was not reached as of the end of that period. To the extent the Fund’s expenses were reduced by waivers, the Fund’s total returns were increased. In these cases, in the absence of the expense waivers, the Fund’s total returns would have been lower.
The Fund’s past performance benefitted significantly from Initial Public Offerings (“IPOs”) and Secondary Offerings of certain issuers, and there is no assurance that the Fund can replicate this performance in the future or that the Fund will be able to participate to the same degree in IPO/Secondary Offerings in the future.
19
| Alpine Financial Services Fund (Continued) | |
Portfolio Distributions* (Unaudited)
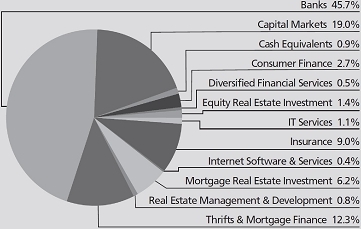
| Top 10 Holdings* (Unaudited) | |
| 1. | | Citizens Financial Group, Inc. | | 2.27% |
| 2. | | Bank of America Corp. | | 2.13% |
| 3. | | KeyCorp | | 2.03% |
| 4. | | United Community Banks, Inc. | | 2.01% |
| 5. | | OceanFirst Financial Corp. | | 1.86% |
| 6. | | First Merchants Corp. | | 1.82% |
| 7. | | Bryn Mawr Bank Corp. | | 1.80% |
| 8. | | The Blackstone Group LP | | 1.80% |
| 9. | | American International Group, Inc. | | 1.77% |
| 10. | | FCB Financial Holdings, Inc.- Class A | | 1.74% |
| * | Portfolio Distributions percentages are based on total net investments. Top 10 Holdings do not include short-term investments and percentages are based on total net assets. Portfolio holdings sector distributions are as of 10/31/16 and are subject to change. Portfolio holdings are not recommendations to buy or sell any securities. |
Value of a $1,000,000 Investment (Unaudited)
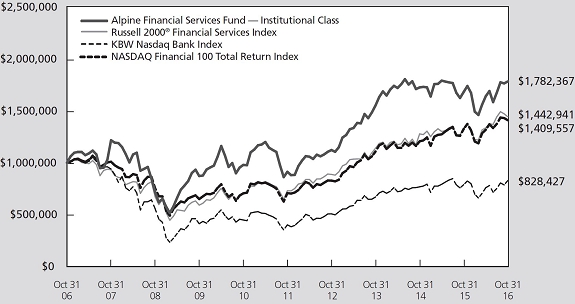
This chart represents a comparison of a hypothetical $1,000,000 investment in the Fund versus a similar investment in the Fund’s benchmarks. The graph and the table do not reflect the deduction of taxes that a shareholder would pay on Fund distributions or the redemption of Fund shares. Investment performance reflects the waiver and recovery of certain fees, if applicable. Without the waiver and recovery of fees, the Fund’s total return would have differed.
Performance data quoted represents past performance and is not predictive of future results. Investment return and principal value of the Fund fluctuate, so that shares, when redeemed, may be worth more or less than their original cost.
20
| Alpine Financial Services Fund (Continued) | |
Commentary
Dear Shareholders:
The Alpine Financial Services Fund generated a 5.97% total return for the fiscal year ended October 31, 2016. This compares to the Fund’s benchmarks that showed total returns of 8.26% for the Russell 2000® Financial Services Index, 5.00% for the KBW Bank Index, and 6.30% for the NASDAQ Financial 100 Total Return Index during the same period. All references in this letter to the Fund’s performance relate to the performance for the Fund’s Institutional Class.
YEAR IN REVIEW
The fiscal year ended October 31, 2016 was a challenging period for the financials sector. Investors had to contend with the first rate hike by the Federal Reserve since the onset of the financial crisis, plunging crude oil prices, aggressive monetary policy actions by the Bank of Japan and European Central Bank, the surprising outcome of the “Brexit” referendum, in which citizens of the United Kingdom voted in favor of leaving the European Union, and the run-up to the U.S. presidential election.
In December 2015, The Federal Reserve (Fed) raised its target rate by 0.25%, ushering in a new tightening cycle for the first time since the 2004-2006 cycle. Despite the beneficial impact of higher rates on banks’ net interest margin, the financial sector actually peaked on the day of the Fed meeting. Together with a string of weak economic data from China and plunging crude oil prices, the Fed rate hike created fear of a global slowdown or possible recession. Banks with above average exposure to energy lending, were particularly hard hit during the ensuing sell off that reached its bottom for the fiscal year in February, 2016.
In the Spring, shares of companies in the financials sector began rallying off the lows as crude oil rebounded and global growth prospects stabilized until the surprising outcome of the Brexit vote at the end of June. The Brexit-induced sell-off in stock markets was sharp but short lived, as a decrease in government bond yields (and thus an increase in prices) in the aftermath of the vote reignited risk taking and the so-called “search for yield” in equities. Government bond yields in many European countries and in Japan reached unprecedented negative levels, leaving investors with little choice but to invest in equities.
As the Fall approached, investors once again turned their attention to the Fed and began worrying about a December rate hike. In addition, the upcoming U.S. presidential election injected some volatility into the
market as a stream of shocking headlines swung sentiment back and forth between Mrs. Clinton and Mr. Trump. Ultimately, the surprising election of Donald Trump as the 45th President of the United States sparked a rally few people could have predicted. Bank stocks were the main beneficiary, as investors began pricing in a combination of lower taxes, higher interest rates, and the potential for less onerous regulation.
PORTFOLIO ANALYSIS
The top five stocks contributing to the Fund’s performance during the twelve months ended October 31, 2016 were Resource America, Bank of America, KeyCorp, PJT Partners, and EverBank Financial.
| • | The Fund opportunistically purchased shares of Resource America, an alternative asset manager, near the end of December 2015 after a more than 50% sell-off from the end of October. The company’s stock fell out of favor with investors as sales of its investment products were expected to be adversely impacted by the recently released fiduciary standards rule promulgated by the U.S. Department of Labor. Shortly after the Fund bought the stock, famed hedge fund investor Leon Cooperman disclosed a nearly 13% stake in the company via a Form 13D filing with the U.S. Securities and Exchange Commission. Subsequently, the company announced it would review its strategic alternatives, a process that culminated in a sale of the company at a favorable price. |
| | |
| • | The Fund purchased shares of Bank of America in the immediate aftermath of Brexit, which created an attractive buying opportunity. Subsequently, Bank of America reported strong second and third quarter results that propelled the stock price of the company higher. The bank appears to be well positioned to benefit from higher interest rates should the Federal Reserve continue raising rates at future Federal Open Market Committee meetings. |
| | |
| • | KeyCorp stock languished after announcing the acquisition of First Niagara at the end of 2015. The Fund began accumulating shares of KeyCorp in March 2016, as we felt that investors were overly penalizing the bank for tangible book value dilution created in the merger. The shares have staged a strong turnaround since the February lows as management displays increasing conviction about potential cost synergies of the deal and reported solid third quarter results. |
21
| Alpine Financial Services Fund (Continued) | |
| • | The Fund purchased shares of PJT Partners in the wake of the Andrew Casperson scandal that created an attractive entry point given our view that the financial and reputational damage to the firm would be limited. In additional, we believe PJT Partners is a unique growth story in the independent financial advisory market with a strong mix of businesses. |
| | |
| • | Florida-based EverBank Financial announced an agreement to be acquired by TIAA for $19.50 per share in cash, a 25% premium to the price before rumors of a deal began circulating. |
The five largest detractors from the Fund’s performance during the twelve months ended October 31, 2016 were Mitsubishi UFJ Financial Group, LPL Financial Holdings, Lazard, Mizuho Financial Group, and Sumitomo Mitsui Financial Group.
| • | Three of the five largest detractors from the Fund’s performance were Japanese mega-banks: Mitsubishi UFJ Financial Group, Mizuho Financial Group, and Sumitomo Mitsui Financial Group. All three banks suffered a sharp sell-off from the middle of November 2015 to the middle of February 2016. The catalyst for the sell-off was the Bank of Japan’s (BOJ) surprise decision to implement a negative interest rate policy framework in an effort to jumpstart the economy and raise inflation expectations. The market had been expecting the BOJ to embark on more quantitative easing as opposed to taking interest rates into negative territory. The earnings outlook for Japanese banks took a hit as a result of the BOJ’s actions. |
| | |
| • | Shares of LPL Financial Holdings, an independent broker-dealer for retail investors, suffered a sell-off triggered by its high financial leverage, the expected adverse impact of the U.S. Department of Labor’s fiduciary standards rule to the company as compared to its competitors, and leverage to higher interest rates. In addition, a disappointing fourth quarter report in February 2016 reinforced the negative sentiment around the company’s stock. |
| | |
| • | Lazard, an independent financial advisory firm, saw its shares come under pressure early in the year as its asset management segment’s large exposure to emerging markets equities was perceived as a negative by investors. The surprise result of the Brexit vote in June created additional pressure for the stock as investors expected a slowdown in mergers and acquisitions in the aftermath of the referendum. |
We have hedged a portion of our currency exposures to the Euro, Japanese Yen, and British Pound in an effort to reduce our net currency exposure.
SUMMARY & OUTLOOK
The election of Mr. Donald Trump as the 45th President of the United States has led to a dramatic rally in bank stocks to start the current fiscal year. While we appreciate the potential levers to higher earnings as a result of some of Mr. Trump’s economic proposals, we cannot help but view the rally with a certain degree of skepticism. Mr. Trump has pledged to dismantle the Dodd-Frank Wall Street Reform and Consumer Protection Act and relax regulation on smaller banks. He has promised to cut the corporate tax rate. His plans to boost infrastructure and defense spending have been perceived by the market as inflationary, which has led to a significant widening of the yield curve and increased the odds of a more aggressive Fed tightening cycle. All of these things should be beneficial to bank earnings. Many are also favorable for non-bank financials like asset managers and life insurers.
Still, Mr. Trump’s proposals must make their way through both houses of Congress before becoming law. In addition, his populist campaign promises to renegotiate trade deals, implement tariffs, curtail immigration, and deport millions of illegal aliens could spark a global recession in a worst case scenario. At the moment, the market appears to be pricing in the good from his proposals, but little of the risk, in our view. With this in mind, we are positioning the fund conservatively. We have built up cash levels somewhat as we trim the biggest winners from the post-election rally, and we are focused on identifying and investing in financial equities with stock specific catalysts, such as mergers and acquisitions, cost reductions, capital return, above average growth, or turnaround potential.
Sincerely,
Andrew Kohl
Portfolio Manager
22
| Alpine Financial Services Fund (Continued) | |
This letter represents the opinions of the Fund’s management and is subject to change, is not guaranteed and should not be considered a recommendation to buy or sell any security. The information provided is not intended to be, and is not, a forecast of future events, a guarantee of future results, or investment advice. Views expressed may vary from those of the firm as a whole.
Past performance is no guarantee of future results.
Mutual fund investing involves risk. Principal loss is possible. The Fund is subject to risks, including the following:
Concentration Risk – The Fund’s strategy of concentrating in companies in a specific industry means that its performance will be closely tied to the performance of a particular market segment. The Fund’s concentration in these companies may present more risks than if it were broadly diversified over numerous industries and sectors of the economy. A downturn in these companies would have a larger impact on the Fund than on a mutual fund that does not concentrate in such companies. At times, the performance of these companies will lag the performance of other industries or the broader market as a whole.
Currency Risk – The value of investments in securities denominated in foreign currencies increases or decreases as the rates of exchange between those currencies and the U.S. dollar change. Currency conversion costs and currency fluctuations could erase investment gains or add to investment losses. Currency exchange rates can be volatile, and are affected by factors such as general economic conditions, the actions of the U.S. and foreign governments or central banks, the imposition of currency controls and speculation.
Cybersecurity Risk – Cybersecurity incidents may allow an unauthorized party to gain access to Fund assets, customer data (including private shareholder information), or proprietary information, or cause the Fund, the Adviser and/or its service providers (including, but not limited to, Fund accountants, custodians, sub-custodians, transfer agents and financial intermediaries) to suffer data breaches, data corruption or lose operational functionality.
Equity Securities Risk – The stock or other security of a company may not perform as well as expected, and may decrease in value, because of factors related to the company (such as poorer than expected earnings or certain management decisions) or to the industry in which the company is engaged (such as a reduction in the demand for products or services in a particular industry).
Financial Services Industry Concentration Risk – The Fund is subject to the risk of concentrating investments in financial services companies, which makes it more susceptible to factors adversely affecting issuers within that industry than would a fund investing in a more diversified portfolio of securities. Economic downturns, credit losses, and severe price competition can negatively affect this industry. The profitability of financial services companies is dependent on the availability and cost of capital and can fluctuate significantly when interest rates change. Financial services companies are also subject to extensive government regulation. The impact of recent legislation on any individual company or on the industry as a whole cannot be predicted.
Foreign Currency Transactions Risk – Foreign securities are often denominated in foreign currencies. As a result, the value of the Fund’s shares is affected by changes in exchange rates. The Fund may enter into foreign currency transactions to try to manage this risk. The Fund’s ability to use foreign currency transactions successfully depends on a number of factors, including the foreign currency transactions being available at prices that are not too costly, the availability of liquid markets and the ability of the Adviser to accurately predict the direction of changes in currency exchange rates.
Foreign Securities Risk – The Fund’s investments in securities of foreign issuers or issuers with significant exposure to foreign markets involve additional risk. Foreign countries in which the Fund may invest may have markets that are less liquid, less regulated and more volatile than U.S. markets. The value of the Fund’s investments may decline because of factors affecting the particular issuer as well as foreign markets and issuers generally, such as unfavorable or unsuccessful government actions, reduction of government or central bank support, and political or financial instability. Lack of information may also affect the value of these securities. To the extent the Fund focuses its investments in a single country or only a few countries in a particular geographic region, economic, political, regulatory, or other conditions affecting such country or region may have a greater impact on Fund performance relative to a more geographically diversified fund. The risks of foreign investments are heightened when investing in issuers of emerging market countries.
23
| Alpine Financial Services Fund (Continued) | |
Growth Stock Risk – Growth stocks typically are very sensitive to market movements because their market prices tend to reflect future expectations. When it appears those expectations will not be met, the prices of growth stocks typically fall. Growth stocks as a group may be out of favor and underperform the overall equity market while the market concentrates on undervalued stocks.
Initial Public Offerings and Secondary Offerings Risk – The Fund may invest a portion of its assets in shares of IPOs or secondary offerings of an issuer. IPOs and secondary offerings may have a magnified impact on the performance of a fund with a small asset base. The impact of IPOs and secondary offerings on the Fund’s performance likely will decrease as the Fund’s asset size increases, which could reduce the Fund’s returns. IPOs and secondary offerings may not be consistently available to the Fund for investing. IPO and secondary offering shares frequently are volatile in price due to the absence of a prior public market, the small number of shares available for trading and limited information about the issuer. Therefore, the Fund may hold IPO and secondary offering shares for a very short period of time. This may increase the turnover of the Fund and may lead to increased expenses for the Fund, such as commissions and transaction costs. In addition, IPO and secondary offering shares can experience an immediate drop in value if the demand for the securities does not continue to support the offering price.
Leverage Risk – The Fund may use leverage to purchase securities. Increases and decreases in the value of the Fund’s portfolio will be magnified when the Fund uses leverage.
Liquidity Risk – Some assets held by the Fund may be impossible or difficult to sell, particularly during times of market turmoil. These illiquid assets may also be difficult to value. If the Fund is forced to sell an illiquid asset to meet redemption requests or other cash needs, the Fund may be forced to sell at a loss.
Management Risk – The Adviser’s judgment about the quality, relative yield or value of, or market trends affecting, a particular security or sector, or about interest rates generally, may be incorrect. The Adviser’s security selections and other investment decisions might produce losses or cause the Fund to underperform when compared to other funds with similar investment objectives and strategies.
Market Risk – The price of a security held by the Fund may fall due to changing market, economic or political conditions.
Micro Capitalization Company Risk – Stock prices of micro capitalization companies are significantly more volatile, and more vulnerable to adverse business and economic developments than those of larger companies. Micro capitalization companies often have narrower markets for their goods and/or services and more limited managerial and financial resources than larger, more established companies, including small or medium capitalization companies.
Portfolio Turnover Risk – High portfolio turnover necessarily results in greater transaction costs which may reduce Fund performance.
Small and Medium Capitalization Company Risk – Securities of small or medium capitalization companies are more likely to experience sharper swings in market values, less liquid markets, in which it may be more difficult for the Adviser to sell at times and at prices that the Adviser believes appropriate and generally are more volatile than those of larger companies.
Undervalued Stock Risk – The Fund may pursue strategies that may include investing in securities, which, in the opinion of the Adviser, are undervalued. The identification of investment opportunities in undervalued securities is a difficult task and there is no assurance that such opportunities will be successfully recognized or acquired. While investments in undervalued securities offer opportunities for above-average capital appreciation, these investments involve a high degree of financial risk and can result in substantial losses.
Please refer to pages 3-5 for other important disclosures and definitions.
24
| Alpine Small Cap Fund(1) | |
| Comparative Annualized Returns as of 10/31/16 (Unaudited) | |
| | | 1 Year | | 3 Years | | 5 Years | | 10 Years | | Since Inception(2) | |
| Alpine Small Cap Fund — Institutional Class | | 7.73% | | 3.70% | | 8.68% | | 4.97% | | 5.13% | |
| Alpine Small Cap Fund — Class A (Without Load) | | 7.47% | | 3.43% | | N/A | | N/A | | 9.37% | |
| Alpine Small Cap Fund — Class A (With Load) | | 1.55% | | 1.49% | | N/A | | N/A | | 8.10% | |
| Russell 2000® Index | | 4.11% | | 4.12% | | 11.51% | | 5.96% | | 6.62% | |
| Russell 3000® Index | | 4.24% | | 8.13% | | 13.35% | | 6.76% | | 7.44% | |
| Russell 2000® Growth Index | | -0.49% | | 3.70% | | 11.34% | | 6.92% | | 7.50% | |
| S&P 500® Index | | 4.51% | | 8.84% | | 13.57% | | 6.70% | | 7.41% | |
| Lipper Small-Cap Growth Funds Average(3) | | -0.37% | | 2.31% | | 10.06% | | 6.43% | | 7.10% | |
| Lipper Small-Cap Growth Funds Ranking(3) | | 23/555 | | 153/495 | | 343/440 | | 263/317 | | 282/312 | |
| Gross Expense Ratio (Institutional Class): 1.90%(4) | | | | | | | | | | | |
| Net Expense Ratio (Institutional Class): 1.25%(4) | | | | | | | | | | | |
| Gross Expense Ratio (Class A): 2.15%(4) | | | | | | | | | | | |
| Net Expense Ratio (Class A): 1.50%(4) | | | | | | | | | | | |
| | (1) | Effective March 31, 2014 the Fund’s name, strategy and portfolio managers were changed. The investment objective remains the same. The Fund was formerly known as Alpine Innovators Fund. |
| | (2) | Institutional Class shares commenced on July 11, 2006 and Class A shares commenced on December 30, 2011. Returns for indices are since July 11, 2006. |
| | (3) | The since inception data represents the period beginning July 13, 2006 (Institutional Class only). |
| | (4) | As disclosed in the prospectus dated February 29, 2016 as supplemented April 4, 2016. |
Performance data quoted represents past performance and is not predictive of future results. Investment return and principal value of the Fund fluctuate, so that the shares, when redeemed, may be worth more or less than their original cost. Performance current to the most recent month end may be lower or higher than performance quoted and may be obtained by calling 1-888-785-5578. Performance data shown does not reflect the 1.00% redemption fee imposed on shares held for fewer than 60 days. If it did, total returns would be reduced. Returns for the Class A shares with sales charge reflect a maximum sales charge of 5.50%. Performance for the Class A shares without sales charges does not reflect this load.
Russell 2000® Index measures the performance of the small-cap segment of the U.S. equity universe and includes approximately 2000 of the smallest securities based on a combination of their market cap and current index membership. Russell 3000® Index measures the performance of the largest 3000 U.S. companies representing approximately 98% of the investable U.S. equity market. Russell 2000(r) Growth Index measures the performance of the small-cap growth segment of the U.S. equity universe. It includes those Russell 2000 Index companies with higher price-to-value ratios and higher forecasted growth values. Source: FTSE Russell Indexes. “FTSE®”, “Russell®”, “MTS®”, “FTSE TMX®” and “FTSE Russell” and other service marks and trademarks related to the FTSE or Russell indexes are trademarks of the London Stock Exchange Group companies and are used by FTSE, MTS, FTSE TMX and Russell under license. S&P 500® Index is a total return, float-adjusted market capitalization-weighted index of 500 common stocks chosen for market size, liquidity, and industry group representation to represent U.S. equity performance. Lipper Analytical Services, Inc. is an independent mutual fund research and rating service. The Lipper Small-Cap Growth Funds Average is an average of funds that by portfolio practice, invest at least 75% of their equity asssets in companies with market capitalizations below Lipper’s USDE small-cap ceiling. The highest rank is 1 and the lowest is based on the total number of funds ranked in the category. Rankings for the periods shown are based on Fund total returns with dividends and distributions reinvested and do not reflect sales charges. The Russell 2000® Index, the Russell 3000® Index, the Russell 2000® Growth Index, the S&P 500® Index and the Lipper Small-Cap Growth Funds Average are unmanaged and do not reflect the deduction of direct fees associated with a mutual fund, such as investment adviser fees; however, the Lipper Small-Cap Growth Funds Average reflects fees charged by the underlying funds. The performance for the Alpine Small Cap Fund reflects the deduction of fees for these value-added services. Investors cannot directly invest in an index. Total return indexes include reinvestments of all dividends.
Expense Ratios reflect the ratios reported in the Fund’s most recent prospectus (as supplemented). The Alpine Small Cap Fund has a contractual expense waiver that continues through April 1, 2017. Where a Fund’s gross and net expense ratios are the same for the period, the contractual expense reimbursement level was not reached as of the end of that period. To the extent the Fund’s expenses were reduced by waivers, the Fund’s total returns were increased. In these cases, in the absence of the expense waivers, the Fund’s total returns would have been lower.
The Fund’s past performance benefitted significantly from Initial Public Offerings (“IPOs”) of certain issuers, and there is no assurance that the Fund can replicate this performance in the future. To the extent that the Fund’s historical performance resulted from gains derived from participation in Secondary Offerings, there is no guarantee that these results can be replicated or that the Fund will be able to participate to the same degree in IPO/Secondary Offerings in the future.
25
| Alpine Small Cap Fund (Continued) | |
Portfolio Distributions* (Unaudited)
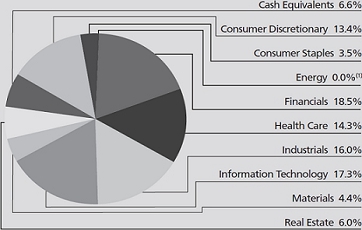
| Top 10 Holdings* (Unaudited) |
| 1. | | Dycom Industries, Inc. | | 4.20% |
| 2. | | Nexstar Broadcasting Group, Inc.-Class A | | 3.78% |
| 3. | | ICU Medical, Inc. | | 3.76% |
| 4. | | Live Nation Entertainment, Inc. | | 3.58% |
| 5. | | Nomad Foods, Ltd. | | 3.54% |
| 6. | | Kennedy-Wilson Holdings, Inc. | | 3.50% |
| 7. | | Essent Group, Ltd. | | 3.49% |
| 8. | | Patrick Industries, Inc. | | 3.47% |
| 9. | | Meta Financial Group, Inc. | | 3.27% |
| 10. | | INC Research Holdings, Inc.- Class A | | 3.20% |
| * | Portfolio Distributions percentages are based on total net investments. Top 10 Holdings do not include short-term investments and percentages are based on total net assets. Portfolio holdings sector distributions are as of 10/31/16 and are subject to change. Portfolio holdings are not recommendations to buy or sell any securities. |
| | |
| (1) | Amount is less than 0.05%. |
Value of a $1,000,000 Investment (Unaudited)
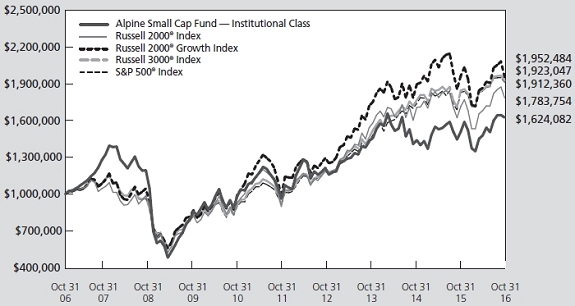
This chart represents a comparison of a hypothetical $1,000,000 investment in the Fund versus a similar investment in the Fund’s benchmarks. The graph and the table do not reflect the deduction of taxes that a shareholder would pay on Fund distributions or the redemption of Fund shares. Investment performance reflects the waiver and recovery of certain fees, if applicable. Without the waiver and recovery of fees, the Fund’s total return would have differed.
Performance data quoted represents past performance and is not predictive of future results. Investment return and principal value of the Fund fluctuate, so that shares, when redeemed, may be worth more or less than their original cost.
26
| Alpine Small Cap Fund (Continued) |
|
Commentary
Dear Shareholders:
The small cap strategy calls for 80% of the Fund’s net assets to be invested in small capitalization companies. The Russell 2000® Index is the primary benchmark for the Fund.
The Fund’s strategy is to find and invest in small cap companies with sustainable competitive business models and managements that focus on creating shareholder value and who are strong capital allocators. Further, we continue to purchase companies with secular growth drivers that we believe will allow them to grow faster than Gross Domestic Product (GDP). We also look to purchase companies with strong free cash flow yields. We believe this strategy can allow for strong relative performance versus the Russell 2000 over a market cycle.
The portfolio return for the Fund for the fiscal year ended October 31, 2016 was 7.73% compared with the Russell 2000® Index which was up 4.11%. All references to the Fund’s performance relate to the performance of the Fund’s Institutional Class.
The top five stocks contributing to the Fund’s total return during the fiscal year ended October 31, 2016 were Patrick Industries, Meta Financial Group, Cardtronics, Fair Isaac, and Fleetmatics Group.
| | • | Patrick Industries is a manufacturer of recreation vehicle components. Customer demand has been strong. The company has also benefited from strategic acquisitions. |
| | | |
| | • | Meta Financial Group has been gaining market share in the growing prepaid card market. |
| | | |
| | • | Cardtronics has been growing global market share in the non-bank site ATM market. |
| | | |
| | • | Fair Isaac has been successful in expanding product offerings to the financial services market. |
| | | |
| | • | Fleetmatics Group provides fleet management solutions to increase customer productivity and was acquired during the fiscal year. |
PRA Group, Liberty Tax, Altisource Residential, Advisory Board, and Kennedy-Wilson had the largest adverse impact on the performance of the Fund over the fiscal year ended October 31, 2016.
| | • | PRA Group encountered heavy regulatory burdens which added significant unexpected costs to the business. |
| | | |
| | • | Liberty Tax, a large paid tax preparer, encountered limited new office growth which negatively impacted the business. |
| | • | Altisource Residential is transitioning to an operator of single family residential homes. The market has been concerned about the strength of the business model. |
| | | |
| | • | Advisory Board encountered an unanticipated slowdown in customer demand. |
| | | |
| | • | Kennedy-Wilson has a meaningful investment in the United Kingdom real estate market which was negatively impacted by the Brexit vote. |
The Russell 2000® Index had a difficult start to the fiscal year, steadily declining into the early second fiscal quarter. This decline was driven by concerns about the general economy and anticipated interest rate increases by the Federal Reserve. As these concerns abated, the Russell 2000® had a mid-single digit return for the fiscal year.
The volatility was fueled by concerns about the Federal Reserve’s anticipated increase in the Fed Funds rate. Further, even with unprecedented easy money policies by the central banks around the world, economic growth remained slow in most of the world’s developed economies. We expect the interest rate environment to remain relatively benign. This backdrop, in combination with the modest economic growth we have been experiencing, should be a positive environment for small cap stocks. In addition, President-elect Trump’s expected fiscal and regulatory policies could potentially help the growth prospects of companies in the small cap market segment. We continue to find what we believe are attractive businesses at attractive valuations relative to their growth or free cash flow yield.
The Fund’s small cap strategy has been considerably more volatile because it invests in far fewer stocks than the 2000 in the index. We believe that this strategy can allow us to outperform the market over a full equity market cycle. However, this strategy will likely experience increased volatility over shorter periods of time as well. We continue to find securities for the Fund with what we view as attractive businesses with attractive valuations. Small cap securities also tend to have less investment coverage, which can create market inefficiencies. We believe that our performance versus the Russell 2000 should be rewarded by identifying and purchasing these stocks for the portfolio over a longer period.
Sincerely,
Michael T. Smith
Portfolio Manager
27
| Alpine Small Cap Fund (Continued) |
|
This letter represents the opinions of the Fund’s management and is subject to change, is not guaranteed and should not be considered a recommendation to buy or sell any security. The information provided is not intended to be, and is not, a forecast of future events, a guarantee of future results, or investment advice. Views expressed may vary from those of the firm as a whole.
Past performance is no guarantee of future results.
Mutual fund investing involves risk. Principal loss is possible. The Fund is subject to risks, including the following:
Currency Risk – The value of investments in securities denominated in foreign currencies increases or decreases as the rates of exchange between those currencies and the U.S. dollar change. Currency conversion costs and currency fluctuations could erase investment gains or add to investment losses. Currency exchange rates can be volatile, and are affected by factors such as general economic conditions, the actions of the U.S. and foreign governments or central banks, the imposition of currency controls and speculation.
Cybersecurity Risk – Cybersecurity incidents may allow an unauthorized party to gain access to Fund assets, customer data (including private shareholder information), or proprietary information, or cause the Fund, the Adviser and/or its service providers (including, but not limited to, Fund accountants, custodians, sub-custodians, transfer agents and financial intermediaries) to suffer data breaches, data corruption or lose operational functionality.
Equity Securities Risk – The stock or other security of a company may not perform as well as expected, and may decrease in value, because of factors related to the company (such as poorer than expected earnings or certain management decisions) or to the industry in which the company is engaged (such as a reduction in the demand for products or services in a particular industry).
Foreign Currency Transactions Risk – Foreign securities are often denominated in foreign currencies. As a result, the value of the Fund’s shares is affected by changes in exchange rates. The Fund may enter into foreign currency transactions to try to manage this risk. The Fund’s ability to use foreign currency transactions successfully depends on a number of factors, including the foreign currency transactions being available at prices that are not too costly, the availability of liquid markets and the ability of the Adviser to accurately predict the direction of changes in currency exchange rates.
Foreign Securities Risk – The Fund’s investments in securities of foreign issuers or issuers with significant exposure to foreign markets involve additional risk. Foreign countries in which the Fund may invest may have markets that are less liquid, less regulated and more volatile than U.S. markets. The value of the Fund’s investments may decline because of factors affecting the particular issuer as well as foreign markets and issuers generally, such as unfavorable or unsuccessful government actions, reduction of government or central bank support and political or financial instability. Lack of information may also affect the value of these securities. To the extent the Fund focuses its investments in a single country or only a few countries in a particular geographic region, economic, political, regulatory or other conditions affecting such country or region may have a greater impact on Fund performance relative to a more geographically diversified fund. The risks of foreign investments are heightened when investing in issuers in emerging market countries.
Growth Stock Risk – Growth stocks typically are very sensitive to market movements because their market prices tend to reflect future expectations. When it appears those expectations will not be met, the prices of growth stocks typically fall. Growth stocks as a group may be out of favor and underperform the overall equity market while the market concentrates on undervalued stocks.
Initial Public Offerings and Secondary Offerings Risk – The Fund may invest a portion of its assets in shares of IPOs or secondary offerings of an issuer. IPOs and secondary offerings may have a magnified impact on the performance of a fund with a small asset base. The impact of IPOs and secondary offerings on the Fund’s performance likely will decrease as the Fund’s asset size increases, which could reduce the Fund’s returns. IPOs and secondary offerings may not be consistently available to the Fund for investing. IPO and secondary offering shares frequently are volatile in price due to the absence of a prior public market, the small number of shares available for trading and limited information about the issuer. Therefore, the Fund may hold IPO and secondary offering shares for a very short period of time. This may increase the turnover of the Fund and may lead to increased expenses for the Fund, such as commissions and transaction costs. In addition, IPO and secondary offering shares can experience an immediate drop in value if the demand for the securities does not continue to support the offering price.
28
| Alpine Small Cap Fund (Continued) |
|
Leverage Risk – The Fund may use leverage to purchase securities. Increases and decreases in the value of the Fund’s portfolio will be magnified when the Fund uses leverage.
Liquidity Risk – Some assets held by the Fund may be impossible or difficult to sell, particularly during times of market turmoil. These illiquid assets may also be difficult to value. If the Fund is forced to sell an illiquid asset to meet redemption requests or other cash needs, the Fund may be forced to sell at a loss.
Management Risk – The Adviser’s judgment about the quality, relative yield or value of, or market trends affecting, a particular security or sector, or about interest rates generally, may be incorrect. The Adviser’s security selections and other investment decisions might produce losses or cause the Fund to underperform when compared to other funds with similar investment objectives and strategies.
Market Risk – The price of a security held by the Fund may fall due to changing market, economic or political conditions.
Real Estate Investment Trusts (“REITs”) Risk – REITs’ share prices may decline because of adverse developments affecting the real estate industry including changes in interest rates. The returns from REITs may trail returns from the overall market. Additionally, there is always a risk that a given REIT will fail to qualify for favorable tax treatment.
Small Capitalization Company Risk – Securities of small capitalization companies are more likely to experience sharper swings in market values, less liquid markets, in which it may be more difficult for the Adviser to sell at times and at prices that the Adviser believes appropriate and generally are more volatile than those of larger companies.
Undervalued Stock Risk – The Fund may pursue strategies that may include investing in securities, which, in the opinion of the Adviser, are undervalued. The identification of investment opportunities in undervalued securities is a difficult task and there is no assurance that such opportunities will be successfully recognized or acquired. While investments in undervalued securities offer opportunities for above-average capital appreciation, these investments involve a high degree of financial risk and can result in substantial losses. By combining both growth and value styles, the Adviser seeks to diversify these risks and lower the volatility, but there is no assurance that this strategy will achieve that result.
Please refer to pages 3-5 for other important disclosures and definitions.
29
Fixed Income Manager Reports

| | Alpine Ultra Short Municipal Income Fund |
| | |
| | Alpine High Yield Managed Duration Municipal Fund |
30
| Alpine Ultra Short Municipal Income Fund | |
| Comparative Annualized Returns as of 10/31/16 (Unaudited) | |
| | | 1 Year | | 3 Years | | 5 Years | | 10 Years | | Since Inception(1) | |
| Alpine Ultra Short Municipal Income Fund — Institutional Class | | 0.64% | | 0.60% | | 0.62% | | 1.76% | | 2.14% | |
| Alpine Ultra Short Municipal Income Fund — Class A (With Load) | | -0.20% | | 0.15% | | 0.27% | | 1.45% | | 1.64% | |
| Bloomberg Barclays Municipal Bond: 1 Year (1-2) Index | | 0.40% | | 0.62% | | 0.72% | | 1.89% | | 1.90% | |
| Lipper Short Municipal Debt Funds Average(2) | | 0.59% | | 0.70% | | 0.94% | | 1.67% | | 1.73% | |
| Lipper Short Municipal Debt Funds Ranking — Institutional Class(2) | | 49/108 | | 59/95 | | 63/83 | | 25/49 | | 10/35 | |
| Gross Expense Ratio (Institutional Class): 0.68%(3) | | | | | | | | | | | |
| Net Expense Ratio (Institutional Class): 0.45%(3) | | | | | | | | | | | |
| Gross Expense Ratio (Class A): 0.93%(3) | | | | | | | | | | | |
| Net Expense Ratio (Class A): 0.70%(3) | | | | | | | | | | | |
| | (1) | Institutional Class shares commenced on December 5, 2002 and Class A shares commenced on March 30, 2004. Returns for indices are since December 5, 2002. |
| | (2) | The since inception data represents the period beginning December 31, 2002. |
| | (3) | As disclosed in the prospectus dated February 29, 2016 as supplemented April 4, 2016. |
Performance data quoted represents past performance and is not predictive of future results. Investment return and principal value of the Fund fluctuate, so that the shares, when redeemed, may be worth more or less than their original cost. Performance current to the most recent month end may be lower or higher than performance quoted and may be obtained by calling 1-888-785-5578. Performance data shown does not reflect the 0.25% redemption fee imposed on shares held for fewer than 30 days. If it did, total returns would be reduced. Effective 10/12/07, Alpine Ultra Short Municipal Income Fund—Class A began imposing a maximum sales charge of 0.50% on purchases. Performance data shown for time period beginning with dates after October 12, 2007 reflect the sales charge.
Bloomberg Barclays Municipal Bond: 1 Year (1-2) Index is a total return benchmark of BAA3 ratings or better designed to measure returns for tax exempt assets. Lipper Analytical Services, Inc. is an independent mutual fund research and rating service. The Lipper Short Municipal Debt Funds Average is an unmanaged index that tracks funds that invest in municipal debt issues with dollar-weighted average maturities of less than three years. The highest rank is 1 and the lowest is based on the total number of funds ranked in the category. Lipper rankings for the periods shown are based on fund total returns with dividends and distributions reinvested and do not reflect sales charges. The Bloomberg Barclays Municipal Bond: 1 Year (1-2) Index and the Lipper Short Municipal Debt Funds Average are unmanaged and do not reflect the deduction of direct fees associated with a mutual fund, such as investment adviser fees; however, the Lipper Short Municipal Debt Funds Average reflects fees charged by the underlying funds. The performance for the Alpine Ultra Short Municipal Income Fund reflects the deduction of fees for these value-added services. Investors cannot directly invest in an index.
Expense Ratios reflect the ratios reported in the Fund’s most recent prospectus (as amended). The Alpine Ultra Short Municipal Income Fund has a contractual expense waiver that continues through April 1, 2017. Where a Fund’s gross and net expense ratios are the same for the period reported, the contractual expense reimbursement level was not reached as of the end of that period. To the extent the Fund’s expenses were reduced by waivers, the Fund’s total returns were increased. In these cases, in the absence of the expense waivers, the Fund’s total returns would have been lower. The Adviser has also voluntarily waived a portion of the expenses for the Alpine Ultra Short Municipal Income Fund. To the extent the Fund’s expenses were reduced by waivers, the Fund’s total returns were increased. In these cases, in the absence of the expense waivers, the Fund’s total returns would have been lower.
31
| Alpine Ultra Short Municipal Income Fund (Continued) | |
Portfolio Distributions* (Unaudited)
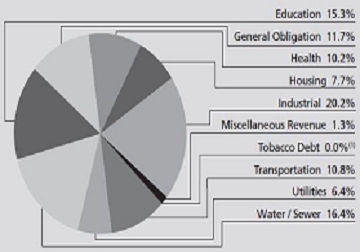
| Top 10 Holdings* (Unaudited) | | |
| 1. | | Mississippi Business Finance Corp., PSL-North America LLC Project, 3.22%, 11/01/2032 (Putable on 11/03/2016) | 5.66 | % |
| 2. | | Indiana Finance Authority, Multifamily HSG Revenue, 1.03%, 10/26/2017 (Putable on 11/03/2016) | 5.29 | % |
| 3. | | Chicago Board of Education, 1.28%, 12/01/2034 (Putable on 11/03/2016) | 4.36 | % |
| 4. | | Phoenix Industrial Development Authority, Solid Waste Revenue, Republic Services, Inc. Project, 0.75%, 12/01/2035 (Putable on 11/01/2016) | 3.69 | % |
| 5. | | Florida Development Finance Corp., Healthcare Facilities Revenue, UF Health-Jacksonville Project, 1.10%, 02/01/2029 (Putable on 11/03/2016) | 2.44 | % |
| 6. | | New Jersey Economic Development Authority, Port Newark Container Terminal LLC Project, 0.80%, 07/01/2030 (Putable on 11/02/2016) | 2.36 | % |
| 7. | | West Virginia Economic Development Authority, Appalachian Power Co., 0.91%, 02/01/2036 (Putable on 11/03/2016) | 2.16 | % |
| 8. | | Plaquemines Port Harbor & Terminal District Revenue, International Marine Terminal Project, 0.85%, 03/15/2025 (Putable on 03/15/2017) | 1.80 | % |
| 9. | | Hertford County Industrial Facilities & Pollution Control Financing Authority, Nucor Corp. Project, 0.90%, 11/01/2033 (Putable on 11/02/2016) | 1.70 | % |
| 10. | | Delaware New County Castle Revenue, Airport Facility, FlightSafety International, Inc. Project., 0.63%, 06/01/2022 (Putable on 11/03/2016) | 1.60 | % |
| * | Portfolio holdings and sector distributions are as of 10/31/16 and are subject to change. Portfolio holdings are not recommendations to buy or sell any securities. Portfolio Distributions percentages are based on total investments and Top 10 Holdings percentages are based on total net assets. |
| | |
| (1) | Amount is less than 0.05%. |
| | |
| | |
32
| Alpine Ultra Short Municipal Income Fund (Continued) | |
Value of a $250,000 Investment (Unaudited)
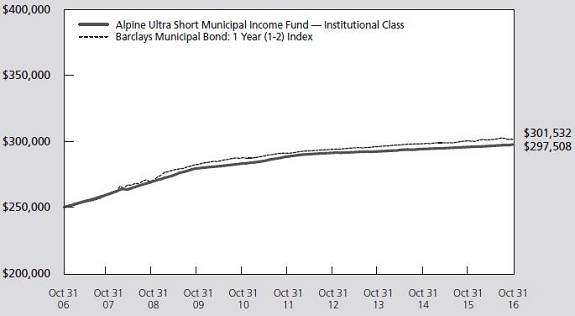
This chart represents a comparison of a hypothetical $250,000 investment in the Fund versus a similar investment in the Fund’s benchmark. The graph and the table do not reflect the deduction of taxes that a shareholder would pay on Fund distributions or the redemption of Fund shares. Investment performance reflects the waiver and recovery of certain fees, if applicable. Without the waiver and recovery of fees, the Fund’s total return would have differed.
Performance data quoted represents past performance and is not predictive of future results. Investment return and principal value of the Fund fluctuate, so that shares, when redeemed, may be worth more or less than their original cost.
Credit Quality Allocation (As of 10/31/2016)
| | | |
| AAA | | 1.06% |
| AA | | 17.8% |
| A | | 32.1% |
| BBB | | 23.0% |
| Not Rated | | 26.4% |
Bond Credit Quality-Reflects the higher of the ratings of Standards & Poor’s Corporation; Moody’s Investors Service, Inc. or Fitch, Inc. Ratings are relative, subjective and not absolute standards of quality, represent the opinions of the independent Nationally Recognized Statistical Rating Organizations (NRSRO), and are adjusted to the Standards and Poors scale shown. Ratings are measured using a scale that typically ranges from AAA (highest) to D (lowest). The security’s credit rating does not eliminate risk. The table excludes equity securities, cash and cash equivalents. For more information about securities ratings, please see the Fund’s Statement of Additional Information. Additional information on ratings methodologies are available by visiting the NRSRO websites; www.standardandpoors.com, www.moodys.com, and www.fitchratings.com.
33
| Alpine High Yield Managed Duration Municipal Fund | |
| Comparative Annualized Returns as of 10/31/16 (Unaudited) | |
| | | 1 Year | | 3 Years | | Since
Inception(1) | |
| Alpine High Yield Managed Duration Municipal Fund — Institutional Class | | 3.84% | | 4.92% | | 4.34% | |
| Alpine High Yield Managed Duration Municipal Fund — Class A (Without Load) | | 3.58% | | 4.68% | | 4.09% | |
| Alpine High Yield Managed Duration Municipal Fund — Class A (With Load) | | 1.03% | | 3.78% | | 3.31% | |
| S&P Municipal Bond Short Intermediate Index | | 1.86% | | 2.19% | | 2.00% | |
| Bloomberg Barclays Municipal Bond: High Yield (Non-Investment Grade) Index | | 8.61% | | 7.38% | | 4.08% | |
| Lipper High Yield Municipal Debt Funds Average(2) | | 6.60% | | 7.60% | | 4.50% | |
| Lipper High Yield Municipal Debt Funds Ranking(2) | | 153/159 | | 130/131 | | 67/125 | |
| Gross Expense Ratio (Institutional Class): 1.02%(3) | | | | | | | |
| Net Expense Ratio (Institutional Class): 0.67%(3) | | | | | | | |
| Gross Expense Ratio (Class A): 1.27%(3) | | | | | | | |
| Net Expense Ratio (Class A): 0.92%(3) | | | | | | | |
| | (1) | High Yield Managed Duration Municipal Fund commenced on May 31, 2013. Returns for indices are since May 31, 2013. |
| | (2) | The since inception data represents the period beginning May 31, 2013. |
| | (3) | As disclosed in the prospectus dated February 29, 2016 as supplemented April 4, 2016. |
Performance data quoted represents past performance and is not predictive of future results. Investment return and principal value of the Fund fluctuate, so that shares, when redeemed, may be worth more or less than their original cost. Performance current to the most recent month end may be lower or higher than the performance quoted and may be obtained by calling 1-888-785-5578. Performance data shown does not reflect the 0.75% redemption fee imposed on shares held for fewer than 60 days. If it did, total returns would be reduced. Returns for the Class A shares with sales charge reflect a maximum sales charge of 2.50%. Performance for the Class A shares without sales charges does not reflect this load.
The S&P Municipal Bond Short Intermediate Index consists of bonds in the S&P Municipal Bond Index with a minimum maturity of one year and a maximum maturity of up to, but not including, eight years as measured from the Rebalancing Date. The Bloomberg Barclays Municipal Bond: High Yield (non-Investment Grade) Index is the Municipal High Yield component of the Bloomberg Barclays Municipal Bond Index. The Bloomberg Barclays Municipal Bond Index is a rules-based, market-value-weighted index engineered for the long-term tax-exempt bond market. Lipper Analytical Services, Inc. is an independent mutual fund research and rating service. The Lipper High Yield Municipal Debt Funds Average is an unmanaged index that tracks funds that invest in funds that typically invest 50% or more of their assets in municipal debt issues rated BBB or less. The highest rank is 1 and the lowest is based on the total number of funds ranked in the category. Lipper rankings for the period shown are based on fund total returns with dividends and distributions reinvested and do not reflect sales charges. The Bloomberg Barclays Municipal Bond: High Yield (non-Investment Grade) Index and the Lipper High Yield Municipal Debt Funds Average are unmanaged and do not reflect the deduction of direct fees associated with a mutual fund, such as investment adviser fees; however, the Lipper High Yield Municipal Debt Funds Average reflects fees charged by the underlying funds. The performance for the Alpine High Yield Managed Duration Municipal Fund reflects the deduction of fees for these value-added services. Investors cannot directly invest in an index.
Expense ratios reflect the ratios reported in the Fund’s most recent prospectus (as amended). The Alpine High Yield Managed Duration Municipal Fund has a contractual expense waiver that continues through April 1, 2017. Where a Fund’s gross and net expense ratios are the same for the period reported, the contractual expense reimbursement level was not reached as of the end of that period. To the extent the Fund’s expenses were reduced by waivers, the Fund’s total returns were increased. In these cases, in the absence of the expense waivers, the Fund’s total returns would have been lower. The Adviser has also voluntarily waived a portion of the expenses for the Alpine High Yield Managed Duration Municipal Fund. To the extent the Fund’s expenses were reduced by waivers, the Fund’s total returns were increased. In these cases, in the absence of the expense waivers, the Fund’s total returns would have been lower.
34
| Alpine High Yield Managed Duration Municipal Fund (Continued) | |
Portfolio Distributions* (Unaudited)
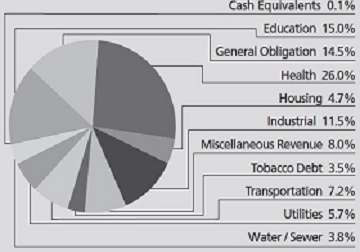
Top 10 Holdings* (unaudited)
| 1. | | Delaware New County Castle Revenue, Airport Facility, FlightSafety International, Inc. Project., 0.63%, 06/01/2022 (Putable on 11/03/2016) | 2.80% | |
| 2. | | Mississippi Business Finance Corp., PSL-North America LLC Project, 3.22%, 11/01/2032 (Putable on 11/03/2016) | 2.65% | |
| 3. | | Walker County, Tax Anticipation Notes General Obligation, 4.25%, 12/30/2016 | 2.64% | |
| 4. | | Minnesota Housing Finance Agency, Residential Housing, 0.65%, 07/01/2038 (Putable on 11/03/2016) | 2.25% | |
| 5. | | Commonwealth of Puerto Rico, 5.50%, 07/01/2020 | 1.90% | |
| 6. | | Sevier County Public Building Authority, Local Government Public Improvement, 2.68%, 06/01/2026 (Putable on 11/03/2016) | 1.70% | |
| 7. | | New York City Municipal Water Finance Authority, Water and Sewer System, 0.73%, 06/15/2032 (Putable on 11/01/2016) | 1.64% | |
| 8. | | Allegheny County Industrial Development Authority, Environmental Improvement Revenue, United States Steel Corp., 5.50%, 11/01/2016 | 1.53% | |
| 9. | | Jefferson County Ltd. Obligation School Warrants, 4.75%, 01/01/2025 | 1.52% | |
| 10. | | Palomar Pomerado Health Care, 1.73%, 11/01/2036 (Putable on 11/02/2016) | 1.43% | |
| * | Portfolio Distributions percentages are based on total net investments. Top 10 Holdings do not include short-term investments and percentages are based on total net assets. Portfolio holdings sector distributions are as of 10/31/16 and are subject to change. Portfolio holdings are not recommendations to buy or sell any securities. |
| | |
Value of a $250,000 Investment (Unaudited)
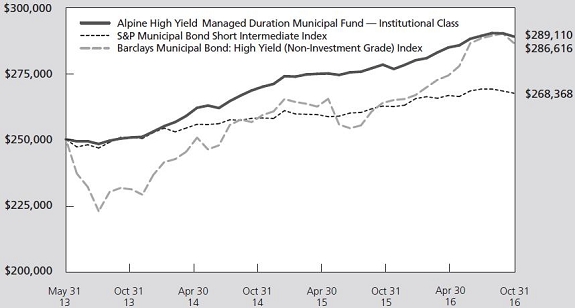
This chart represents a comparison of a hypothetical $250,000 investment in the Fund versus a similar investment in the Fund’s benchmark. The graph and the table do not reflect the deduction of taxes that a shareholder would pay on Fund distributions or the redemption of Fund shares. Investment performance reflects the waiver and recovery of certain fees, if applicable. Without the waiver and recovery of fees, the Fund’s total return would have differed.
Performance data quoted represents past performance and is not predictive of future results. Investment return and principal value of the Fund fluctuate, so that shares, when redeemed, may be worth more or less than their original cost.
35
| Alpine High Yield Managed Duration Municipal Fund (Continued) | |
Credit Quality Allocation (As of 10/31/2016)
| | |
| AAA | 0.3% |
| AA | 20.3% |
| A | 12.1% |
| BBB | 15.3% |
| BB | 13.7% |
| B | 7.3% |
| Not Rated | 31.0% |
Bond Credit Quality-Reflects the higher of the ratings of Standards & Poor’s Corporation; Moody’s Investors Service, Inc. or Fitch, Inc. Ratings are relative, subjective and not absolute standards of quality, represent the opinions of the independent Nationally Recognized Statistical Rating Organizations (NRSRO), and are adjusted to the Standards and Poors scale shown. Ratings are measured using a scale that typically ranges from AAA (highest) to D (lowest). The security’s credit rating does not eliminate risk. The table excludes equity securities, cash and cash equivalents. For more information about securities ratings, please see the Fund’s Statement of Additional Information. Additional information on ratings methodologies are available by visiting the NRSRO websites; www.standardandpoors.com, www.moodys.com, and www.fitchratings.com.
36
Alpine Ultra Short Municipal Income Fund /
Alpine High Yield Managed Duration Municipal Fund | |
Commentary
Dear Shareholders:
During the fiscal year ended October 31, 2016, fixed income markets continued to experience significant interest rate volatility. On November 2, 2015, the yield on the 10-year Treasury bond was 2.17%, and with volatility throughout the fiscal year, ended the period down 34 basis points at 1.83% as of October 31, 2016. Market participants were surprised with a significant rally in the Treasury and Municipal markets during January and the first half of February 2016, despite the Federal Reserve (the Fed) raising the Fed Funds rate by 25 basis points in December 2015. The rally was primarily driven by notable market demand outstripping the supply of available bonds in both markets. During the fiscal year, 10-year Treasury bond yields fell to a low of 1.36% on July 8, 2016 after a strong five-week Treasury bond rally forced yields down 49 basis points. The yield decline primarily resulted from investors taking cues from Fed Chair Janet Yellen leading market participants to believe additional Fed Funds rate hikes were further away than expected. Additionally, investor fears of slowing global economic growth and its potential negative impact on the United States’ economy further drew investors into the Treasury market.
At the September 21, 2016 Fed meeting, the board left interest rates unchanged, but for the first time since 2014, three officials dissented in favor of increasing. As of October 31, 2016, the market implied probability of a Fed rate hike at the December meeting jumped to 71.4% from 59.3% the month prior according to Fed Funds Futures as the likelihood of an interest rate increase before the end of 2016 becomes more apparent.
The Municipal yield curve continued to flatten throughout the fiscal year. Ten-year Municipal bond yields moved with their Treasury counterpart, as the BVAL Muni Benchmark 10-Year Index decreased 34 basis points from 2.09% on November 2, 2015 to 1.75% by October 31, 2016, and prices increased commensurately. Over the period, starkly juxtaposed to the interest rate movements for bonds with longer maturities, the BVAL Muni Benchmark 1T Index and BVAL Muni Benchmark 6M Index saw their yields increase. The 1 year benchmark increased 50 basis points from 0.26% on November 2, 2015 to 0.76% on October 31, 2016, and the 6 month benchmark increased 60 basis points from 0.11% on November 2, 2015 to 0.71% on October 31, 2016. The Municipal market selloff for bonds with shorter maturities was primarily driven by outflows at municipal money market funds due to money market fund reform and by strong issuance of tax-exempt securities over the period.
Long term municipal bond issuance for the first ten months of calendar year 2016 increased 12.0% to $392.7 billion compared with volume of $350.7 billion during the same period during 2015. The increase in issuance was driven primarily by new issue activity versus refunding issuance, which each increased 20.9% and 6.9%, respectively, according to the latest Securities Industry and Financial Markets Association (SIFMA) U.S. Municipal issuance statistics.
ALPINE ULTRA SHORT MUNICIPAL INCOME FUND
Performance Review
Alpine Ultra Short Municipal Income Fund Institutional Class total return was 0.64%, which exceeded the Bloomberg Barclay’s Municipal Bond: 1 Year (1-2) Index (the “Benchmark”) return of 0.40% for the fiscal year ended October 31, 2016. All references in this letter to the Fund’s performance relate to the performance of the Fund’s Institutional Class.
Performance Highlights
The effective average maturity of the portfolio at fiscal year-end was 65 days, which stayed relatively unchanged from the average maturity of 63 days at the end of the previous fiscal year. Given market volatility for short maturity municipal bonds, this low average maturity compared to the Benchmark’s 1.4 years allowed the Fund to maintain a relatively stable net asset value (NAV). In addition, we were able to shift the strategy’s asset mix, adding to its exposure in municipal variable rate demand obligations (VRDO), from 46.9% at the beginning of the period to 55.5% to end the period, in order to take advantage of more attractive yields in the municipal market and prepare the Fund for increased market volatility headed into the end of 2016.
The majority of Fund performance can be attributed to solid A-rated securities in the portfolio followed by the Fund’s holdings in BBB-rated securities. As credit spreads tightened through much of the first half of the fiscal year, the value added by a lower investment grade securities, was significantly diminished. The second half of the fiscal year was a reversal of this tightening, as the yield curve flattened and higher grade securities became less attractive relative to previous fiscal year end when compared to lower investment grade securities. Despite credit spreads widening out over the second half of the fiscal year, we do not expect to reverse our objective of increasing the credit quality of the Fund. It is our view that credit spreads still have room to widen, and that as
37
Alpine Ultra Short Municipal Income Fund /
Alpine High Yield Managed Duration Municipal Fund | |
municipal yields increase, higher grade securities would be better suited to our performance objectives.
Over the year, the municipal bonds with shorter maturities saw the highest levels of volatility since 2010. Much of this volatility was, in our opinion, due to the structural changes that took place as a result of money market fund reform. Money market funds lost almost half of their assets over the period due to withdrawals. Regulation that forced money market funds to move to a floating NAV and, in certain circumstances, impose gates and fees on withdrawals caused assets to leave and, as a result, yields of short maturity municipal bonds increased. As the yield on the BVAL Muni Benchmark 6M Index increased from 0.11% on October 30, 2015 to 0.71% on October 31, 2016, there was very little movement in the Fund’s NAV during the same period. A major contributor to the stability of the Fund over the quarter was the holdings of variable rate demand notes, which comprised 55.5% of the portfolio as these trade at par and do not fluctuate in value.
While we continue to invest in three- to twelve-month put bonds and municipal note deals, we have lowered our exposure to these securities by 7.5% over the fiscal year as we have increased our VRDO positions. The largest holdings in these types of securities continue to be from Republic Services and Waste Management. Both issuers offer attractive yields and have been of improving credit quality over the past few years.
As of fiscal year end, our holdings of obligations issued by the Commonwealth of Puerto Rico represent less than 1% of the Fund, and all of our exposure benefits from insurance from either Assured Guaranty or National Public Financial Guarantee Corporation. Both of the monoline insurers are of high quality that fall in the Standard and Poor’s ‘AA’ ratings category and are well capitalized for our maturity profile of 2017 or less. Given the attractiveness in yields of these names and the relative low volatility, the Fund may choose to maintain or increase exposure to these positions as they mature.
Conclusion
A developing Fed policy and the uncertainty surrounding a new Trump administration, coupled with structural changes due to money market fund reform, in our opinion, continue to make the markets a volatile place on the short end of the Municipal bond yield curve. For this reason, we remain cautious in our investment approach going forward. In addition to maintaining a high level of liquidity, we intend to stay underweight duration as compared to the benchmark and continue to increase the credit quality of the portfolio. Furthermore, with credit
concerns in Illinois, New Jersey and Pennsylvania, we continue to monitor the markets closely and invest in ways that seek to minimize the impact to NAV while at the same time endeavoring to provide our investors with a high level of tax-exempt income.
Alpine High Yield Managed Duration Municipal Fund
Performance Review
Alpine High Yield Managed Duration Municipal had a total return of 3.84% for the fiscal year ended October 31, 2016. For the same period, the Fund outperformed the S&P Municipal Bond Short-Intermediate Index, which returned 1.86%, but underperformed the Bloomberg Barclay’s Municipal Bond: High Yield (non-investment grade) Index, which returned 8.61%. All references in this letter to the Fund’s performance relate to the performance for the Fund’s Institutional Class.
Performance Highlights
During the fiscal year, the Fund’s weighted average maturity slightly increased from 4.65 years to 4.75 years and our effective duration increased from 2.27 years to 2.96 years. Both our duration and average weighted maturity are significantly shorter than the Bloomberg Barclay’s High Yield Municipal Index. We maintained our barbell strategy this fiscal year and currently expect to maintain this Fund structure in the subsequent year. We believe this strategy should allow Alpine to deliver an attractive income stream while helping to minimize duration risk in this currently volatile market.
Positive contributors to total return this fiscal year included the education, general obligation, and health care sectors, specifically continuing care retirement communities (CCRCs) and senior living bonds within the health care category. We continued to look for CCRC securities that had call provisions that allow us to receive some or all of our principal back prior to maturity. The Fund’s exposure to the natural gas sector also had a positive impact on Fund performance. Tobacco bonds also continued to enhance performance during the period. During 2016, these bonds have been one of the most attractive areas of the high yield sector because investors are attracted to both their high level of liquidity and relatively high yield. Despite strong performance, we have been cautious when adding to our existing position, since historically the sector has a tendency to be volatile and has become more expensive throughout this year.
Less significant contributors to total return this year included obligations from the utility sector, specifically the energy industry, as well as the corporate backed
38
Alpine Ultra Short Municipal Income Fund /
Alpine High Yield Managed Duration Municipal Fund | |
municipal bonds sector. The corporate backed securities carry the same tax exempt qualities as state and local backed bonds but are guaranteed by the corporation issuing the bonds. During the latter part of the fiscal year, we reduced our exposure to the energy industry in order to invest in more favorable sectors, including the CCRC/senior living and the general obligation sectors.
Our exposure to bonds from the Commonwealth of Puerto Rico increased during the year to 5.9% of the portfolio as of October 31, 2016 from 4.6% on November 1, 2015. We continue to find value in some Standard and Poor’s ‘AA’ rated securities enhanced by bond insurance from financially healthy bond insurers. Importantly, all of the Fund’s current holdings from this territory are fully insured by Assured Guaranty or National Public Financial Guarantee Corporation, both of which have very strong financial claims paying reserves in our opinion. Additionally, all Puerto Rico bonds owned by the Fund were paid on time and in full by the respective aforementioned bond insurers during the year. This is important, since beginning on July 1, 2016, Puerto Rico began defaulting on its constitutionally guaranteed debt as well as several other revenue streams. The Fund’s positions are inside of five years and we are confident both abovementioned bond insurers can continue to pay bondholders in full and on time until Puerto Rico’s debt is restructured inside or outside of the courts.
Conclusion
Subsequent to the end of the Fund’s fiscal year, the results of the U.S. presidential election were unexpected by most investors. In response, fixed income markets sold off considerably in the seven business days following the election on concerns of higher inflation as a result of stronger than expected fiscal stimulus from a Trump administration as well as other concerns that the new administration may implement. Over this period,
municipal high grade yields have increased 49 basis points to 2.22% at the 10-year spot on the BVAL Muni AAA Benchmark Yield Curve versus a 55 basis point increase to 3.47% at the 10-year spot on the U.S. Revenue BBB BVAL Yield Curve. It is not clear whether the recent rate increases will remain elevated at these levels since these rate adjustments have occurred prior to any significant expenditure details or specific revisions to existing federal programs.
The new Trump administration combined with strong market sentiment that expects a Fed Funds increase in December 2016 of 25 basis points leads management to believe that the market will remain volatile across the Municipal bond yield curve. For this reason, we remain cautious in our investment approach during the next few months. We expect to maintain a relatively healthy level of liquidity and anticipate staying underweight duration as compared to the benchmark, while continuing to increase the credit quality of the portfolio. We believe credit selection will be a key component to providing alpha to investors.
We have continued credit concerns in pockets of the municipal market, including budgetary stress and large unfunded pension obligation issues for the State of Illinois, City of Chicago and Commonwealth of Puerto Rico. Management is closely monitoring the developments in these areas as well as specifics from the new Trump administration and in the capital markets in general. Management will continue to invest with a focus on providing investors with a high level of tax exempt income while striving to protect NAV volatility.
Sincerely,
Jonathan Mondillo
Mark Taylor
Portfolio Managers
This letter represents the opinions of the Fund’s management and is subject to change, is not guaranteed and should not be considered a recommendation to buy or sell any security. The information provided is not intended to be, and is not, a forecast of future events, a guarantee of future results, or investment advice. Views expressed may vary from those of the firm as a whole.
Past performance is no guarantee of future results.
Mutual fund investing involves risk. Principal loss is possible.
The Alpine Ultra Short Municipal Income Fund is subject to risks, including the following:
Credit Risk – The credit quality and liquidity of the Fund’s investments in municipal obligations and other debt securities may be dependent in part on the credit quality of third parties, such as banks and other financial institutions, which provide credit and liquidity enhancements to the Fund’s investments. Adverse changes in the credit quality of these third parties could cause losses to the Fund and affect its share price.
39
Alpine Ultra Short Municipal Income Fund /
Alpine High Yield Managed Duration Municipal Fund | |
Cybersecurity Risk – Cybersecurity incidents may allow an unauthorized party to gain access to Fund assets, customer data (including private shareholder information), or proprietary information, or cause the Fund, the Adviser and/or its service providers (including, but not limited to, Fund accountants, custodians, sub-custodians, transfer agents and financial intermediaries) to suffer data breaches, data corruption or lose operational functionality.
Fixed Income Securities Risk – Fixed income securities are subject to issuer risk, interest rate risk and market risk.
Interest Rate Risk – Interest rates may rise resulting in a decrease in the value of the securities held by the Fund, or may fall resulting in an increase in the value of such securities. Securities having longer maturities generally involve a greater risk of fluctuations in the value resulting from changes in interest rates. Securities having shorter maturities generally involve less risk of fluctuation in value resulting from changes in interest rates, but generally have yields lower than securities having longer maturities. Securities having shorter maturities are also subject to reinvestment risk, which is the risk that if interest rates fall the Fund may need to invest the proceeds of redeemed securities in securities with lower interest rates.
Issuer Risk – Changes in the financial condition of the issuer of an obligation, changes in general economic conditions, or changes in economic conditions that affect the issuer may impact its actual or perceived willingness or ability to make timely payments of interest or principal.
Liquidity Risk – Some assets held by the Fund may be impossible or difficult to sell, particularly during times of market turmoil. These illiquid assets may also be difficult to value. Markets may become illiquid when, for instance, there are few, if any, interested buyers or sellers or when dealers are unwilling or unable to make a market for certain securities. If the Fund is forced to sell an illiquid asset to meet redemption requests or other cash needs, the Fund may be forced to sell at a loss.
Management Risk – The Adviser’s judgment about the quality, relative yield or value of, or market trends affecting, a particular security or sector, or about interest rates generally, may be incorrect. The Adviser’s security selections and other investment decisions might produce losses or cause the Fund to underperform when compared to other funds with similar investment objectives and strategies.
Market Risk – General market conditions, such as real or perceived adverse economic or political conditions, inflation, changes in interest rates, lack of liquidity in the bond markets or adverse investor sentiment could cause the value of your investment in the fund, or its yield, to decline.
Municipal Securities Concentration Risk – From time to time the Fund may invest a substantial amount of its assets in municipal securities whose interest is paid solely from revenues of similar projects. If the Fund concentrates its investments in this manner, it assumes the economic risks relating to such projects and this may have a significant impact on the Fund’s investment performance.
Municipal Securities Risk – Municipal securities risks include the ability of the issuer to repay the obligation, the relative lack of information about certain issuers of municipal securities, and the possibility of future legislative changes which could affect the market for and value of municipal securities. Certain municipal securities, including private activity bonds, are not backed by the full faith, credit and taxing power of the issuer. Additionally, if events occur after the security is acquired that impact the security’s tax-exempt status, the Fund and its shareholders could be subject to substantial tax liabilities.
Operational Risk – Your ability to transact with the Fund or the valuation of your investment may be negatively impacted because of the operational risks arising from factors such as processing errors and human errors, inadequate or failed internal or external processes, failures in systems and technology, changes in personnel, and errors caused by third party service providers or trading counterparties. It is not possible to identify all of the operational risks that may affect the Fund or to develop processes and controls that completely eliminate or mitigate the occurrence of such failures. The Fund and its shareholders could be negatively impacted as a result.
Portfolio Turnover Risk – High portfolio turnover necessarily results in greater transaction costs which may reduce Fund performance.
40
Alpine Ultra Short Municipal Income Fund /
Alpine High Yield Managed Duration Municipal Fund | |
Redemption Risk – The Fund may experience heavy redemptions that could cause the Fund to liquidate its assets at inopportune times or at a loss or depressed value, which could cause the value of your investment to decline.
Tax Risk – Changes in tax laws or adverse determinations by the Internal Revenue Service may make the income from some municipal obligations taxable. Additionally, maximizing after-tax income may require trade-offs that reduce pre-tax income. The Fund’s tax-efficient strategies may reduce the taxable income of the Fund’s shareholders, but will not eliminate it. There can be no assurance that taxable distributions can always be avoided or that the Fund will achieve its investment objective.
Variable Rate Demand Obligations Risk – Variable rate demand obligations (“VRDOs”) are floating rate securities that combine an interest in a long term municipal bond with a right to demand payment before maturity from a bank or other financial institution. If the bank or financial institution is unable to pay, the Fund may lose money. In addition, the interest rates on variable rate demand obligations are short-term and may, for example, be reset daily, weekly or monthly. During periods of declining interest rates, the Fund’s yield on a VRDO will decrease and its shareholders will forego the opportunity for capital appreciation. During periods of rising interest rates, however, the Fund’s yield on a VRDO will increase and the Fund’s shareholders will have a reduced risk of capital depreciation.
Yield Risk – The amount of income received by the Fund will go up or down depending on day-to-day variations in short-term interest rates, and when interest rates are very low the Fund’s expenses could absorb all or a significant portion of the fund’s income. If interest rates increase, the Fund’s yield may not increase proportionately. For example, the Adviser may discontinue any temporary voluntary fee limitation or recoup amounts previously waived and/or reimbursed.
The Alpine High Yield Managed Duration Municipal Fund is subject to risks, including the following:
Borrowing and Leverage Risk – When the Fund borrows for leverage, changes in the value of the Fund’s investments will have a larger effect on its share price than if it did not borrow. Borrowing results in interest payments to the lenders and related expenses. The costs of borrowing for investment purposes might reduce the Fund’s return if the yield on the securities purchased is less than the borrowing costs. The Fund may also have to sell assets at inopportune times to satisfy its obligations. The use of leverage is considered to be a speculative investment practice and may result in the loss of a substantial amount, and possibly all, of the Fund’s assets.
Credit Risk – The credit quality and liquidity of the Fund’s investments in municipal obligations and other debt securities may be dependent in part on the credit quality of third parties, such as banks and other financial institutions, which provide credit and liquidity enhancements to the Fund’s investments. Adverse changes in the credit quality of these third parties could cause losses to the Fund and affect its share price.
Cybersecurity Risk – Cybersecurity incidents may allow an unauthorized party to gain access to Fund assets, customer data (including private shareholder information), or proprietary information, or cause the Fund, the Adviser and/or its service providers (including, but not limited to, Fund accountants, custodians, sub-custodians, transfer agents and financial intermediaries) to suffer data breaches, data corruption or lose operational functionality.
Debt Securities Risk – Debt securities, such as bonds, involve credit risk and interest rate risk. In general, the market price of debt securities with longer maturities will go up or down more in response to changes in interest rates than the market price of shorter term securities.
Fixed Income Securities Risk – Fixed income securities are subject to issuer risk, interest rate risk and market risk.
Interest Rate Risk – Interest rates may rise resulting in a decrease in the value of the securities held by the Fund, or may fall resulting in an increase in the value of such securities. Securities having longer maturities generally involve a greater risk of fluctuations in the value resulting from changes in interest rates. Securities having shorter maturities generally involve less risk of fluctuations in the value resulting from changes in interest rates, but generally have lower yields than securities having longer maturities. Securities having shorter maturities are also subject to reinvestment risk, which is the risk that if interest rates fall the Fund may need to invest the proceeds of redeemed securities in securities with lower interest rates.
41
Alpine Ultra Short Municipal Income Fund /
Alpine High Yield Managed Duration Municipal Fund | |
Issuer Risk – Changes in the financial condition of the issuer of an obligation, changes in general economic conditions, or changes in economic conditions that affect the issuer may impact its actual or perceived willingness or ability to make timely payments of interest or principal.
Junk Bond Risk – Junk bonds involve a greater risk of default or price changes due to changes in the credit quality of the issuer. The values of junk bonds fluctuate more than those of high-quality bonds in response to company, political, regulatory or economic developments. Values of junk bonds can decline significantly over short periods of time.
Land-Secured or “Dirt” Bonds Risk – These special assessment or special tax bonds are issued to promote residential, commercial or industrial growth and redevelopment. They are exposed to real estate development-related risks. The bonds could default if the developments failed to progress as anticipated or if taxpayers failed to pay the assessments, fees and taxes specified in the financing plans for a project.
Liquidity Risk – Some assets held by the Fund may be impossible or difficult to sell, particularly during times of market turmoil. These illiquid assets may also be difficult to value. Markets may become illiquid when, for instance, there are few, if any, interested buyers or sellers or when dealers are unwilling or unable to make a market for certain securities. If the Fund is forced to sell an illiquid asset to meet redemption requests or other cash needs, the Fund may be forced to sell at a loss
Management Risk – The Adviser’s judgment about the quality, relative yield or value of, or market trends affecting, a particular security or sector, or about interest rates generally, may be incorrect. The Adviser’s security selections and other investment decisions might produce losses or cause the Fund to underperform when compared to other funds with similar investment goals.
Market Risk – General market conditions, such as real or perceived adverse economic or political conditions, inflation, changes in interest rates, lack of liquidity in the bond markets or adverse investor sentiment could cause the value of your investment in the fund, or its yield, to decline.
Medium- and Lower-Grade Municipal Securities Risk – Securities which are in the medium- and lower-grade categories generally offer higher yields than are offered by higher-grade securities of similar maturity, but they also generally involve more volatility and greater risks, such as greater credit risk, market risk, liquidity risk, management risk, and regulatory risk. Furthermore, many medium- and lower-grade securities are not listed for trading on any national securities exchange and many issuers of medium- and lower-grade securities choose not to have a rating assigned to their obligations by any nationally recognized statistical rating organization.
Municipal Market Volatility and Illiquidity Risk – The municipal bond market can be susceptible to unusual volatility, particularly for lower-rated and unrated securities. Liquidity can be reduced unpredictably in response to overall economic conditions or credit tightening. During times of reduced market liquidity, the Fund may not be able to readily sell bonds at the prices at which they are carried on the Fund’s books. If the Fund needed to sell large blocks of bonds to meet shareholder redemption requests or to raise cash, those sales could further reduce the bonds’ prices.
Municipal Sector Concentration Risk – From time to time the Fund may invest a substantial amount of its assets in municipal securities whose interest is paid solely from revenues of similar projects. If the Fund concentrates its investments in this manner, it assumes the economic risks relating to such projects and this may have a significant impact on the Fund’s investment performance.
Municipal Securities Risk – Municipal securities risks include the ability of the issuer to repay the obligation, the relative lack of information about certain issuers of municipal securities, and the possibility of future legislative changes which could affect the market for and value of municipal securities. Certain municipal securities, including private activity bonds, are not backed by the full faith, credit and taxing power of the issuer. Additionally, if events occur after the security is acquired that impact the security’s tax-exempt status, the Fund and its shareholders could be subject to substantial tax liabilities.
Puerto Rico and U.S. Territories Risk – Because the Fund invests in the municipal securities of U.S. territories, and currently invests in Puerto Rican municipal securities, events in Puerto Rico are likely to affect the Fund’s investments and its performance. These events may include economic or political policy changes, tax base erosion, territory constitutional limits on tax increases, budget deficits and other financial difficulties, and changes in the credit ratings assigned to
42
Alpine Ultra Short Municipal Income Fund /
Alpine High Yield Managed Duration Municipal Fund | |
Puerto Rico’s municipal issuers. As with Puerto Rican municipal securities, events in any of the other territories where the Fund is invested may affect the Fund’s investments and its performance.
Redemption Risk – The Fund may experience heavy redemptions that could cause the Fund to liquidate its assets at inopportune times or at a loss or depressed value, which could cause the value of your investment to decline.
Tax Risk – To be tax-exempt, municipal obligations generally must meet certain regulatory requirements. If any such municipal obligation fails to meet these regulatory requirements, the interest received by the Fund from its investment in such obligations and distributed to Fund shareholders will be taxable. There is no guarantee that all of the Fund’s income will remain exempt from federal or state income taxes. Income from municipal bonds held by a Fund could be declared taxable because of unfavorable changes in tax laws, adverse interpretations by the Internal Revenue Service or state tax authorities, or noncompliant conduct of a bond issuer.
Tender Option Bonds Risk – Tender option bonds are synthetic floating-rate or variable-rate securities issued when long-term bonds are purchased in the primary or secondary market and then deposited into a trust. Tender option bonds may be considered derivatives, and may expose the Fund to the same risks as investments in derivatives, as well as risks associated with leverage, especially the risk of increased volatility.
Tobacco Related Bonds Risk – In 1998, the largest U.S. tobacco manufacturers reached an out of court agreement, known as the Master Settlement Agreement (the “MSA”), to settle claims against them by 46 states and six other U.S. jurisdictions. The tobacco manufacturers agreed to make annual payments to the government entities in exchange for the release of all litigation claims. A number of the states have sold bonds that are backed by those future payments. The Fund may invest in two types of those bonds: (i) bonds that make payments only from a state’s interest in the MSA and (ii) bonds that make payments from both the MSA revenue and from an “appropriation pledge” by the state. An “appropriation pledge” requires the state to pass a specific periodic appropriation to make the payments and is generally not an unconditional guarantee of payment by a state. The settlement payments are based on factors, including, but not limited to, annual domestic cigarette shipments, cigarette consumption, inflation and the financial capability of participating tobacco companies. Payments could be reduced if consumption decreases, if market share is lost to non-MSA manufacturers, or if there is a negative outcome in litigation regarding the MSA.
Please refer to pages 3-5 for other important disclosures and definitions.
43
Alpine Dynamic Dividend Fund
Schedule of Portfolio Investments
October 31, 2016
| Shares | | | Security
Description | | Value | |
| | | | | |
| Common Stocks—96.9% | | | | |
| Aerospace & Defense—2.3% | | | | |
| | 31,000 | | | B/E Aerospace, Inc. | | $ | 1,845,120 | |
| | 11,500 | | | Orbital ATK, Inc. | | | 855,140 | |
| | 6,100 | | | Raytheon Co. | | | 833,321 | |
| | | | | | | | 3,533,581 | |
| Air Freight & Logistics—1.2% | | | | |
| | 10,500 | | | FedEx Corp. | | | 1,830,360 | |
| Airlines—1.5% | | | | |
| | 41,600 | | | Delta Air Lines, Inc. | | | 1,737,632 | |
| | 22,000 | | | Japan Airlines Co., Ltd. | | | 649,490 | |
| | | | | | | | 2,387,122 | |
| Auto Components—1.0% | | | | |
| | 11,500 | | | Delphi Automotive PLC | | | 748,305 | |
| | 201,000 | | | GKN PLC | | | 785,309 | |
| | | | | | | | 1,533,614 | |
| Banks—8.6% | | | | |
| | 285,765 | | | Banco Bilbao Vizcaya Argentaria SA | | | 2,063,510 | |
| | 107,000 | | | Bank of America Corp. | | | 1,765,500 | |
| | 27,000 | | | Citigroup, Inc. | | | 1,327,050 | |
| | 70,000 | | | Citizens Financial Group, Inc. | | | 1,843,800 | |
| | 35,000 | | | Hana Financial Group, Inc. | | | 1,003,277 | |
| | 174,000 | | | Mitsubishi UFJ Financial Group, Inc. | | | 903,599 | |
| | 162,500 | | | Regions Financial Corp. | | | 1,740,375 | |
| | 17,700 | | | The PNC Financial Services Group, Inc. | | | 1,692,120 | |
| | 23,400 | | | Wells Fargo & Co. | | | 1,076,634 | |
| | | | | | | | 13,415,865 | |
| Beverages—0.7% | | | | |
| | 9,200 | | | Anheuser-Busch InBev NV-SP ADR | | | 1,062,508 | |
| Biotechnology—0.7% | | | | |
| | 6,300 | | | Shire PLC-ADR | | | 1,062,432 | |
| Capital Markets—3.2% | | | | |
| | 49,000 | | | Azimut Holding SpA | | | 786,406 | |
| | 15,000 | | | Evercore Partners, Inc.-Class A | | | 806,250 | |
| | 23,500 | | | Federated Investors, Inc.-Class B | | | 634,500 | |
| | 115,000 | | | Mediobanca SpA | | | 842,661 | |
| | 54,500 | | | OM Asset Management PLC | | | 766,815 | |
| | 43,000 | | | The Blackstone Group LP | | | 1,076,290 | |
| | | | | | | | 4,912,922 | |
| Chemicals—1.6% | | | | |
| | 69,000 | | | Clariant AG | | | 1,142,853 | |
| | 18,500 | | | Symrise AG | | | 1,269,477 | |
| | | | | | | | 2,412,330 | |
| Commercial Services & Supplies-0.8% | | | | |
| | 31,500 | | | ISS A/S | | | 1,238,466 | |
| Communications Equipment—2.1% | | | | |
| | 29,000 | | | Cisco Systems, Inc. | | | 889,720 | |
| | 18,900 | | | Harris Corp. | | | 1,686,069 | |
| | 145,000 | | | Nokia OYJ | | | 647,519 | |
| | | | | | | | 3,223,308 | |
| Construction & Engineering—3.0% | | | | |
| | 47,375 | | | Bouygues SA | | | 1,544,836 | |
| | 932,500 | | | China Railway Construction Corp., Ltd.-Class H | | | 1,168,698 | |
| | 103,663 | | | Ferrovial SA | | | 2,017,036 | |
| | | | | | | | 4,730,570 | |
| Consumer Finance—1.2% | | | | |
| | 16,000 | | | Discover Financial Services | | | 901,280 | |
| | 34,000 | | | Synchrony Financial | | | 972,060 | |
| | | | | | | | 1,873,340 | |
| Shares | | | Security
Description | | Value | |
| | | | | |
| Common Stocks—continued | | | | |
| Diversified Telecommunication Services—0.7% | | | | |
| | 222,500 | | | Bharti Infratel, Ltd. | | $ | 1,155,368 | |
| Electric Utilities—1.4% | | | | |
| | 17,000 | | | NextEra Energy, Inc. | | | 2,176,000 | |
| Electronic Equipment, Instruments & Components—1.1% | | | | |
| | 27,000 | | | TE Connectivity, Ltd. | | | 1,697,490 | |
| Energy Equipment & Services—0.3% | | | | |
| | 5,500 | | | Schlumberger, Ltd. | | | 430,265 | |
| Equity Real Estate Investment—5.3% | | | | |
| | 18,000 | | | American Tower Corp. | | | 2,109,420 | |
| | 16,000 | | | CyrusOne, Inc. | | | 713,760 | |
| | 1,700 | | | LaSalle Logiport REIT | | | 1,804,234 | |
| | 646,000 | | | Prologis Property Mexico SA de CV | | | 1,086,863 | |
| | 38,000 | | | The Geo Group, Inc. | | | 910,480 | |
| | 113,000 | | | Westfield Corp. | | | 765,036 | |
| | 26,000 | | | Weyerhaeuser Co. | | | 778,180 | |
| | | | | | | | 8,167,973 | |
| Food & Staples Retailing—2.8% | | | | |
| | 27,500 | | | CVS Health Corp. | | | 2,312,750 | |
| | 27,900 | | | Seven & i Holdings Co., Ltd. | | | 1,166,069 | |
| | 25,500 | | | The Kroger Co. | | | 789,990 | |
| | | | | | | | 4,268,809 | |
| Food Products—4.7% | | | | |
| | 76,000 | | | BRF SA-ADR | | | 1,270,720 | |
| | 36,000 | | | Mondelez International, Inc.-Class A | | | 1,617,840 | |
| | 23,500 | | | Nestle SA | | | 1,703,931 | |
| | 70,500 | | | Nomad Foods, Ltd. (a) | | | 866,445 | |
| | 20,500 | | | The Kraft Heinz Co. | | | 1,823,475 | |
| | | | | | | | 7,282,411 | |
| Gas Utilities—0.4% | | | | |
| | 126,727 | | | Infraestructura Energetica Nova SAB de CV | | | 559,849 | |
| Health Care Equipment & Supplies—1.9% | | | | |
| | 20,500 | | | Medtronic PLC | | | 1,681,410 | |
| | 12,600 | | | Zimmer Biomet Holdings, Inc. | | | 1,328,040 | |
| | | | | | | | 3,009,450 | |
| Health Care Providers & Services—2.7% | | | | |
| | 13,100 | | | HCA Holdings, Inc. (a) | | | 1,002,543 | |
| | 9,191 | | | McKesson Corp. | | | 1,168,819 | |
| | 7,000 | | | UnitedHealth Group, Inc. | | | 989,310 | |
| | 8,800 | | | Universal Health Services, Inc.-Class B | | | 1,062,248 | |
| | | | | | | | 4,222,920 | |
| Hotels, Restaurants & Leisure—0.9% | | | | |
| | 36,000 | | | Aramark | | | 1,340,280 | |
| Household Durables—2.9% | | | | |
| | 31,000 | | | Lennar Corp.-Class A | | | 1,292,390 | |
| | 36,000 | | | Newell Brands, Inc. | | | 1,728,720 | |
| | 9,600 | | | Whirlpool Corp. | | | 1,438,272 | |
| | | | | | | | 4,459,382 | |
| Household Products—1.3% | | | | |
| | 74,000 | | | Svenska Cellulosa AB SCA-B Shares | | | 2,096,577 | |
| Independent Power and Renewables—2.3% | | | | |
| | 45,619 | | | Atlantica Yield PLC | | | 820,230 | |
| | 105,500 | | | NRG Yield, Inc.-Class A | | | 1,554,015 | |
| | 51,000 | | | Pattern Energy Group, Inc. | | | 1,139,850 | |
| | | | | | | | 3,514,095 | |
The accompanying notes are an integral part of these financial statements.
44
Alpine Dynamic Dividend Fund
Schedule of Portfolio Investments—Continued
October 31, 2016
| Shares | | | Security
Description | | Value | |
| | | | | |
| Common Stocks—continued | | | | |
| Insurance—0.9% | | | | |
| | 8,700 | | | Allianz SE | | $ | 1,356,161 | |
| Internet Software & Services-0.6% | | | | |
| | 1,200 | | | Alphabet, Inc.-Class C (a) | | | 941,448 | |
| IT Services—0.5% | | | | |
| | 34,000 | | | CSRA, Inc. | | | 853,060 | |
| Life Sciences Tools & Services—1.0% | | | | |
| | 11,000 | | | Thermo Fisher Scientific, Inc. | | | 1,617,330 | |
| Machinery—1.6% | | | | |
| | 894,950 | | | CRRC Corp., Ltd.-Class H | | | 812,379 | |
| | 10,500 | | | Snap-on, Inc. | | | 1,618,050 | |
| | | | | | | | 2,430,429 | |
| Media—1.9% | | | | |
| | 19,500 | | | Comcast Corp.-Class A | | | 1,205,490 | |
| | 265,193 | | | NOS SGPS SA | | | 1,761,832 | |
| | 1 | | | UBM PLC | | | 9 | |
| | | | | | | | 2,967,331 | |
| Metals & Mining—0.5% | | | | |
| | 40,000 | | | Nippon Steel & Sumitomo | | | | |
| | | | | Metal Corp. | | | 792,791 | |
| Mortgage Real Estate Investment—0.6% | | | | |
| | 52,000 | | | Colony Capital, Inc.-Class A | | | 988,520 | |
| Multi-Utilities—2.6% | | | | |
| | 54,500 | | | CMS Energy Corp. | | | 2,297,175 | |
| | 76,500 | | | Veolia Environnement SA | | | 1,669,480 | |
| | | | | | | | 3,966,655 | |
| Multiline Retail—0.8% | | | | |
| | 17,500 | | | Dollar General Corp. | | | 1,209,075 | |
| Oil, Gas & Consumable Fuels—7.0% | | | | |
| | 20,654 | | | Anadarko Petroleum Corp. | | | 1,227,674 | |
| | 46,000 | | | BP PLC-SP ADR | | | 1,635,300 | |
| | 12,000 | | | Chevron Corp. | | | 1,257,000 | |
| | 34,000 | | | Enbridge, Inc. | | | 1,467,780 | |
| | 9,500 | | | EOG Resources, Inc. | | | 858,990 | |
| | 75,500 | | | Kinder Morgan, Inc. | | | 1,542,465 | |
| | 26,500 | | | Marathon Petroleum Corp. | | | 1,155,135 | |
| | 29,000 | | | SemGroup Corp.-Class A | | | 935,250 | |
| | 8,500 | | | Tesoro Corp. | | | 722,245 | |
| | | | | | | | 10,801,839 | |
| Paper & Forest Products—1.7% | | | | |
| | 137,000 | | | Stora Enso OYJ-R Shares | | | 1,295,625 | |
| | 61,000 | | | UPM-Kymmene OYJ | | | 1,419,611 | |
| | | | | | | | 2,715,236 | |
| Personal Products—0.7% | | | | |
| | 26,000 | | | Unilever NV | | | 1,089,715 | |
| Pharmaceuticals—3.5% | | | | |
| | 40,000 | | | AstraZeneca PLC-SP ADR | | | 1,132,800 | |
| | 21,300 | | | Novartis AG-SP ADR | | | 1,512,726 | |
| | 15,500 | | | Novo Nordisk A/S-SP ADR | | | 550,870 | |
| | 33,000 | | | Pfizer, Inc. | | | 1,046,430 | |
| | 28,800 | | | Teva Pharmaceutical Industries, Ltd.-SP ADR | | | 1,230,912 | |
| | | | | | | | 5,473,738 | |
| Real Estate Management & Development—1.0% | | | | |
| | 65,000 | | | Mitsui Fudosan Co., Ltd. | | | 1,481,668 | |
| Shares | | | Security
Description | | Value | |
| | | | | |
| Common Stocks—continued | | | | |
| Road & Rail—2.3% | | | | |
| | 10,700 | | | Canadian Pacific Railway, Ltd. | | $ | 1,529,672 | |
| | 1,003,935 | | | Cosan Logistica SA (a) | | | 1,550,564 | |
| | 215,000 | | | Rumo Logistica Operadora Multimodal SA (a) | | | 480,921 | |
| | | | | | | | 3,561,157 | |
| Semiconductors & Semiconductor Equipment—3.8% | | | | |
| | 48,500 | | | Applied Materials, Inc. | | | 1,410,380 | |
| | 10,700 | | | Broadcom, Ltd. | | | 1,821,996 | |
| | 43,500 | | | Intel Corp. | | | 1,516,845 | |
| | 32,000 | | | SK Hynix, Inc. | | | 1,146,602 | |
| | | | | | | | 5,895,823 | |
| Software—0.9% | | | | |
| | 9,919 | | | Dell Technologies, Inc.— VMware, Inc.-Class V (a) | | | 486,924 | |
| | 16,000 | | | Microsoft Corp. | | | 958,720 | |
| | | | | | | | 1,445,644 | |
| Specialty Retail—3.5% | | | | |
| | 16,100 | | | Dick’s Sporting Goods, Inc. | | | 895,965 | |
| | 18,000 | | | Foot Locker, Inc. | | | 1,201,860 | |
| | 15,800 | | | The Home Depot, Inc. | | | 1,927,758 | |
| | 19,100 | | | TJX Cos., Inc. | | | 1,408,625 | |
| | | | | | | | 5,434,208 | |
| Technology, Hardware, Storage & Peripherals—3.3% | | | | |
| | 25,000 | | | Apple, Inc. | | | 2,838,500 | |
| | 525 | | | Samsung Electronics Co., Ltd. | | | 751,999 | |
| | 26,500 | | | Western Digital Corp. | | | 1,548,660 | |
| | | | | | | | 5,139,159 | |
| Textiles, Apparel & Luxury Goods—0.5% | | | | |
| | 9,000 | | | Carter’s, Inc. | | | 777,060 | |
| Wireless Telecommunication Services—1.1% | | | | |
| | 627,500 | | | Vodafone Group PLC | | | 1,726,600 | |
| | | | | Total Common Stocks
(Cost $141,014,778) | | | 150,261,934 | |
| Exchange-Traded Funds—1.0% | | | | |
| | 26,000 | | | SPDR S&P Biotech Fund | | | 1,459,900 | |
| | | | | Total Exchange-Traded Funds
(Cost $1,601,605) | | | 1,459,900 | |
| Rights—0.0% (b) | | | | |
| Construction & Engineering—0.0% (b) | | | | |
| | 103,663 | | | Ferrovial SA Expiration: November 18, 2016 | | | 44,381 | |
| | | | | Total Rights
(Cost $46,459) | | | 44,381 | |
| | | | | | | | | |
| Principal | | | | | | | |
| Amount | | | | | | | |
| Short-Term Investments—2.5% | | | | |
| $ | 3,918,000 | | | State Street Eurodollar Time Deposit, 0.01% | | | 3,918,000 | |
| | | | | Total Short-Term Investments
(Cost $3,918,000) | | | 3,918,000 | |
Total Investments
(Cost $146,580,842) (c)—100.4% | | | 155,684,215 | |
| Liabilities in Excess of Other Assets—(0.4)% | | | (619,944 | ) |
| TOTAL NET ASSETS 100.0% | | $ | 155,064,271 | |
The accompanying notes are an integral part of these financial statements.
45
Alpine Dynamic Dividend Fund
Schedule of Portfolio Investments—Continued
October 31, 2016
Percentages are stated as a percent of net assets.
| (a) | Non-income producing security. |
| (b) | Amount is less than 0.05%. |
| (c) | See Note 7 for the cost of investments for federal tax purposes. |
AB—Aktiebolag is the Swedish equivalent of a corporation.
ADR—American Depositary Receipt
AG—Aktiengesellschaft is a German term that refers to a corporation that is limited by shares, i.e., owned by shareholders.
A/S—Aktieselskab is the Danish term for a stock-based corporation.
NV—Naamloze Vennootschap is the Dutch term for a public limited liability corporation.
PLC—Public Limited Company
REIT—Real Estate Investment Trust
SA—Generally designates corporations in various countries, mostly those employing the civil law.
SA de CV-Sociedad Anonima de Capital Variable is the Spanish equivalent to Variable Capital Company.
SAB de CV-Sociedad Anonima Bursátil de Capital Variable is the Spanish equivalent to Variable Capital Company.
SCA—Societe en Commandite par actions is the French equivalent of a limited partnership.
SE—SE Regulation. A European Company which can operate on a Europe-wide basis and be governed by Community law directly applicable in all Member States.
SP ADR—Sponsored American Depositary Receipt
SpA—Societa’ Per Azioni is an Italian shared company.
The accompanying notes are an integral part of these financial statements.
46
Alpine Rising Dividend Fund
Schedule of Portfolio Investments
October 31, 2016
| Shares | | | Security
Description | | Value | |
| | | | | |
| Common Stocks—95.6% | | | | |
| Aerospace & Defense—2.7% | | | | |
| | 15,000 | | | Hexcel Corp. | | $ | 682,350 | |
| | 12,000 | | | Raytheon Co. | | | 1,639,320 | |
| | | | | | | | 2,321,670 | |
| Air Freight & Logistics—1.6% | | | | |
| | 8,000 | | | FedEx Corp. | | | 1,394,560 | |
| Auto Components—0.9% | | | | |
| | 19,500 | | | Magna International, Inc. | | | 800,475 | |
| Banks—7.0% | | | | |
| | 61,000 | | | Bank of America Corp. | | | 1,006,500 | |
| | 13,000 | | | Citigroup, Inc. | | | 638,950 | |
| | 50,000 | | | Citizens Financial Group, Inc. | | | 1,317,000 | |
| | 21,000 | | | JPMorgan Chase & Co. | | | 1,454,460 | |
| | 7,000 | | | Signature Bank (a) | | | 843,920 | |
| | 7,500 | | | The PNC Financial Services Group, Inc. | | | 717,000 | |
| | | | | | | | 5,977,830 | |
| Beverages—1.3% | | | | |
| | 10,000 | | | PepsiCo, Inc. | | | 1,072,000 | |
| Biotechnology—3.0% | | | | |
| | 10,000 | | | Amgen, Inc. | | | 1,411,600 | |
| | 16,000 | | | Gilead Sciences, Inc. | | | 1,178,080 | |
| | | | | | | | 2,589,680 | |
| Capital Markets—3.5% | | | | |
| | 7,000 | | | CME Group, Inc. | | | 700,700 | |
| | 30,000 | | | KKR & Co. LP | | | 425,700 | |
| | 30,000 | | | Legg Mason, Inc. | | | 861,600 | |
| | 25,000 | | | NorthStar Asset Management Group, Inc. | | | 342,500 | |
| | 15,000 | | | Oaktree Capital Group LLC | | | 624,000 | |
| | | | | | | | 2,954,500 | |
| Chemicals—1.0% | | | | |
| | 6,500 | | | Air Products & Chemicals, Inc. | | | 867,230 | |
| Commercial Services & Supplies—1.2% | | | | |
| | 17,000 | | | Deluxe Corp. | | | 1,040,400 | |
| Communications Equipment—1.2% | | | | |
| | 39,000 | | | Juniper Networks, Inc. | | | 1,027,260 | |
| Consumer Finance—1.8% | | | | |
| | 12,000 | | | Discover Financial Services | | | 675,960 | |
| | 30,000 | | | Synchrony Financial | | | 857,700 | |
| | | | | | | | 1,533,660 | |
| Diversified Telecommunication Services—2.9% | | | | |
| | 32,000 | | | AT&T, Inc. | | | 1,177,280 | |
| | 27,000 | | | Verizon Communications, Inc. | | | 1,298,700 | |
| | | | | | | | 2,475,980 | |
| Electric Utilities—1.6% | | | | |
| | 5,500 | | | NextEra Energy, Inc. | | | 704,000 | |
| | 9,000 | | | Pinnacle West Capital Corp. | | | 685,170 | |
| | | | | | | | 1,389,170 | |
| Electronic Equipment, Instruments & Components—1.4% | | | | |
| | 19,000 | | | TE Connectivity, Ltd. | | | 1,194,530 | |
| Energy Equipment & Services—1.1% | | | | |
| | 12,000 | | | Schlumberger, Ltd. | | | 938,760 | |
| Equity Real Estate Investment—1.7% | | | | |
| | 3,000 | | | Boston Properties, Inc. | | | 361,440 | |
| | 16,000 | | | Colony Starwood Homes | | | 464,160 | |
| | 3,500 | | | Simon Property Group, Inc. | | | 650,860 | |
| | | | | | | | 1,476,460 | |
| Shares | | | Security
Description | | Value | |
| | | | | |
| Common Stocks—continued | | | | |
| Food & Staples Retailing—5.9% | | | | |
| | 7,500 | | | Casey’s General Stores, Inc. | | $ | 847,425 | |
| | 20,000 | | | CVS Health Corp. | | | 1,682,000 | |
| | 50,000 | | | Safeway, Inc. (a)(b) | | | 23,933 | |
| | 35,000 | | | The Kroger Co. | | | 1,084,300 | |
| | 17,000 | | | Walgreens Boots Alliance, Inc. | | | 1,406,410 | |
| | | | | | | | 5,044,068 | |
| Food Products—2.0% | | | | |
| | 25,000 | | | ConAgra Foods, Inc. | | | 1,204,500 | |
| | 10,000 | | | Pinnacle Foods, Inc. | | | 514,200 | |
| | | | | | | | 1,718,700 | |
| Health Care Equipment & Supplies—4.0% | | | | |
| | 28,000 | | | Abbott Laboratories | | | 1,098,720 | |
| | 6,000 | | | Becton, Dickinson & Co. | | | 1,007,460 | |
| | 12,000 | | | Zimmer Biomet Holdings, Inc. | | | 1,264,800 | |
| | | | | | | | 3,370,980 | |
| Health Care Providers & Services—1.0% | | | | |
| | 8,000 | | | Aetna, Inc. | | | 858,800 | |
| Hotels, Restaurants & Leisure—2.1% | | | | |
| | 72,000 | | | ClubCorp Holdings, Inc. | | | 831,600 | |
| | 43,000 | | | Hilton Worldwide Holdings, Inc. | | | 971,800 | |
| | | | | | | | 1,803,400 | |
| Household Durables—0.8% | | | | |
| | 9,000 | | | Harman International Industries, Inc. | | | 717,390 | |
| Household Products—1.1% | | | | |
| | 10,500 | | | The Procter & Gamble Co. | | | 911,400 | |
| Insurance—2.9% | | | | |
| | 21,000 | | | MetLife, Inc. | | | 986,160 | |
| | 34,000 | | | The Hartford Financial Services Group, Inc. | | | 1,499,740 | |
| | | | | | | | 2,485,900 | |
| Internet Software & Services—2.3% | | | | |
| | 1,250 | | | Alphabet, Inc.-Class A (a) | | | 1,012,375 | |
| | 1,250 | | | Alphabet, Inc.-Class C (a) | | | 980,675 | |
| | | | | | | | 1,993,050 | |
| IT Services—1.4% | | | | |
| | 48,000 | | | CSRA, Inc. | | | 1,204,320 | |
| Machinery—2.3% | | | | |
| | 15,000 | | | Ingersoll-Rand PLC | | | 1,009,350 | |
| | 6,000 | | | Snap-on, Inc. | | | 924,600 | |
| | | | | | | | 1,933,950 | |
| Media—3.9% | | | | |
| | 22,000 | | | CBS Corp.-Class B | | | 1,245,640 | |
| | 18,000 | | | Cinemark Holdings, Inc. | | | 716,400 | |
| | 22,300 | | | Comcast Corp.-Class A | | | 1,378,586 | |
| | | | | | | | 3,340,626 | |
| Mortgage Real Estate Investment—0.6% | | | | |
| | 25,000 | | | Colony Capital, Inc.-Class A | | | 475,250 | |
| Multi-Utilities—1.1% | | | | |
| | 11,000 | | | CMS Energy Corp. | | | 463,650 | |
| | 8,000 | | | WEC Energy Group, Inc. | | | 477,760 | |
| | | | | | | | 941,410 | |
The accompanying notes are an integral part of these financial statements.
47
Alpine Rising Dividend Fund
Schedule of Portfolio Investments—Continued
October 31, 2016
| Shares | | | Security
Description | | Value | |
| | | | | |
| Common Stocks—continued | | | | |
| Oil, Gas & Consumable Fuels—6.7% | | | | |
| | 35,000 | | | BP PLC-SP ADR | | $ | 1,244,250 | |
| | 16,000 | | | ConocoPhillips | | | 695,200 | |
| | 12,000 | | | Enbridge, Inc. | | | 518,040 | |
| | 14,500 | | | Exxon Mobil Corp. | | | 1,208,140 | |
| | 23,000 | | | Marathon Petroleum Corp. | | | 1,002,570 | |
| | 14,000 | | | Occidental Petroleum Corp. | | | 1,020,740 | |
| | | | | | | | 5,688,940 | |
| Pharmaceuticals—5.4% | | | | |
| | 5,000 | | | Allergan PLC (a) | | | 1,044,700 | |
| | 14,500 | | | Johnson & Johnson | | | 1,681,855 | |
| | 60,000 | | | Pfizer, Inc. | | | 1,902,600 | |
| | | | | | | | 4,629,155 | |
| Road & Rail—2.1% | | | |
| | 2,300 | | | AMERCO | | | 741,497 | |
| | 35,000 | | | CSX Corp. | | | 1,067,850 | |
| | | | | | | | 1,809,347 | |
| Semiconductors & Semiconductor Equipment—5.7% | | | | |
| | 31,000 | | | Applied Materials, Inc. | | | 901,480 | |
| | 7,500 | | | Broadcom, Ltd. | | | 1,277,100 | |
| | 38,000 | | | Intel Corp. | | | 1,325,060 | |
| | 20,000 | | | QUALCOMM, Inc. | | | 1,374,400 | |
| | | | | | | | 4,878,040 | |
| Software—4.0% | | | |
| | 26,000 | | | Microsoft Corp. | | | 1,557,920 | |
| | 34,000 | | | Oracle Corp. | | | 1,306,280 | |
| | 22,000 | | | Symantec Corp. | | | 550,660 | |
| | | | | | | | 3,414,860 | |
| Shares | | | Security
Description | | Value | |
| | | | | |
| Common Stocks—continued | | | | |
| Specialty Retail—2.9% | | | | |
| | 32,000 | | | GameStop Corp.-Class A | | $ | 769,600 | |
| | 13,000 | | | Lowe’s Cos., Inc. | | | 866,450 | |
| | 11,500 | | | TJX Cos., Inc. | | | 848,125 | |
| | | | | | | | 2,484,175 | |
| Technology, Hardware, Storage & Peripherals—2.7% | | | | |
| | 20,000 | | | Apple, Inc. | | | 2,270,800 | |
| Thrifts & Mortgage Finance—0.8% | | | | |
| | 37,000 | | | EverBank Financial Corp. | | | 714,470 | |
| | | | | Total Common Stocks
(Cost $70,656,964) | | | 81,743,196 | |
| Exchange-Traded Funds—1.1% | | | | |
| | 20,000 | | | Technology Select Sector SPDR Fund | | | 948,400 | |
| | | | | Total Exchange-Traded Funds
(Cost $946,304) | | | 948,400 | |
| | | | | | | | | |
Principal
Amount | | | | | | | |
| Short-Term Investments—3.1% | | | | |
| $ | 2,681,000 | | | State Street Eurodollar Time Deposit, 0.01% | | | 2,681,000 | |
| | | | | Total Short-Term Investments
(Cost $2,681,000) | | | 2,681,000 | |
Total Investments
(Cost $74,284,268) (c)—99.8% | | | 85,372,596 | |
| Other Assets in Excess of Liabilities-0.2% | | | 168,641 | |
| TOTAL NET ASSETS 100.0% | | $ | 85,541,237 | |
Percentages are stated as a percent of net assets.
(a) Non-income producing security.
(b) Security fair valued in accordance with procedures approved by the Board of Trustees. These securities comprised less than 0.05% of the Fund’s net assets.
(c) See Note 7 for the cost of investments for federal tax purposes.
PLC—Public Limited Company
SP ADR—Sponsored American Depositary Receipt
The accompanying notes are an integral part of these financial statements.
48
Alpine Financial Services Fund
Schedule of Portfolio Investments
October 31, 2016
| Shares | | | Security
Description | | Value | |
| | | | | | | |
| Common Stocks—97.9% | | | |
| Banks—45.2% | | | |
| | 2,500 | | | 1st Constitution Bancorp | | $ | 33,750 | |
| | 18,000 | | | Bank of America Corp. | | | 297,000 | |
| | 10,000 | | | Bank of Commerce Holdings | | | 73,000 | |
| | 3,500 | | | Bank of the Ozarks, Inc. | | | 129,360 | |
| | 1,500 | | | Bankwell Financial Group, Inc. | | | 36,990 | |
| | 6,500 | | | BNC Bancorp | | | 161,850 | |
| | 8,000 | | | Bryn Mawr Bank Corp. | | | 251,200 | |
| | 5,000 | | | Carolina Trust Bancshares, Inc. (a) | | | 30,525 | |
| | 10,000 | | | CenterState Banks, Inc. | | | 186,800 | |
| | 1,500 | | | CIT Group, Inc. | | | 54,495 | |
| | 3,000 | | | Citigroup, Inc. | | | 147,450 | |
| | 12,000 | | | Citizens Financial Group, Inc. | | | 316,080 | |
| | 1,500 | | | Citizens First Corp. | | | 25,410 | |
| | 4,000 | | | Comerica, Inc. | | | 208,360 | |
| | 4,000 | | | ConnectOne Bancorp, Inc. | | | 73,400 | |
| | 3,000 | | | CU Bancorp (a) | | | 70,500 | |
| | 5,500 | | | East West Bancorp, Inc. | | | 217,305 | |
| | 6,500 | | | FCB Financial Holdings, Inc.-Class A (a) | | | 242,450 | |
| | 1,500 | | | First Business Financial Services, Inc. | | | 28,275 | |
| | 9,000 | | | First Merchants Corp. | | | 253,350 | |
| | 4,000 | | | FNB Corp. | | | 52,280 | |
| | 4,500 | | | Great Western Bancorp, Inc. | | | 145,080 | |
| | 4,500 | | | Green Bancorp, Inc. (a) | | | 46,575 | |
| | 2,500 | | | IBERIABANK Corp. | | | 164,125 | |
| | 2,500 | | | Investar Holding Corp. | | | 40,625 | |
| | 20,000 | | | KeyCorp | | | 282,400 | |
| | 5,000 | | | Pacific Mercantile Bancorp (a) | | | 28,000 | |
| | 4,500 | | | Pacific Premier Bancorp, Inc. (a) | | | 116,325 | |
| | 2,000 | | | Popular, Inc. | | | 72,600 | |
| | 5,000 | | | Preferred Bank | | | 189,600 | |
| | 9,000 | | | Republic First Bancorp, Inc. (a) | | | 35,550 | |
| | 2,500 | | | SB Financial Group, Inc. | | | 31,925 | |
| | 3,500 | | | Shore Bancshares, Inc. | | | 44,695 | |
| | 3,500 | | | Southern National Bancorp of Virginia, Inc. | | | 45,920 | |
| | 12,000 | | | Sterling Bancorp | | | 216,000 | |
| | 4,000 | | | Stonegate Bank | | | 138,560 | |
| | 2,000 | | | Summit State Bank | | | 26,400 | |
| | 1,000 | | | SVB Financial Group (a) | | | 122,270 | |
| | 4,500 | | | Synovus Financial Corp. | | | 148,815 | |
| | 11,500 | | | TCF Financial Corp. | | | 164,450 | |
| | 1,500 | | | The PNC Financial Services Group, Inc. | | | 143,400 | |
| | 13,000 | | | United Community Banks, Inc. | | | 280,410 | |
| | 12,000 | | | Valley National Bancorp | | | 118,320 | |
| | 1,500 | | | Washington Trust Bancorp, Inc. | | | 68,850 | |
| | 5,000 | | | Webster Financial Corp. | | | 202,000 | |
| | 4,500 | | | Western Alliance Bancorp (a) | | | 168,120 | |
| | 6,000 | | | Yadkin Financial Corp. | | | 166,440 | |
| | 6,000 | | | Zions BanCorp. | | | 193,260 | |
| | | | | | | | 6,290,545 | |
| Capital Markets—18.7% | | | |
| | 1,300 | | | Affiliated Managers Group, Inc. (a) | | | 172,458 | |
| | 11,000 | | | Ares Capital Corp. | | | 168,300 | |
| | 4,600 | | | Bats Global Markets, Inc. | | | 135,286 | |
| | 17,000 | | | BGC Partners, Inc.-Class A | | | 146,030 | |
| Shares | | | Security
Description | | Value | |
| | | | | | | |
| Common Stocks—continued | | | |
| Capital Markets—continued | | | |
| | 3,000 | | | Evercore Partners, Inc.-Class A | | $ | 161,250 | |
| | 10,500 | | | Garrison Capital, Inc. | | | 101,220 | |
| | 700 | | | Intercontinental Exchange, Inc. | | | 189,273 | |
| | 15,000 | | | KKR & Co. LP | | | 212,850 | |
| | 6,000 | | | Legg Mason, Inc. | | | 172,320 | |
| | 15,000 | | | NorthStar Asset Management Group, Inc. | | | 205,500 | |
| | 9,000 | | | OM Asset Management PLC | | | 126,630 | |
| | 10,000 | | | Oppenheimer Holdings, Inc.-Class A | | | 140,000 | |
| | 5,000 | | | PJT Partners, Inc.-Class A | | | 137,700 | |
| | 10,000 | | | The Blackstone Group LP | | | 250,300 | |
| | 7,000 | | | The Charles Schwab Corp. | | | 221,900 | |
| | 6,500 | | | TriplePoint Venture Growth BDC Corp. | | | 69,615 | |
| | | | | | | | 2,610,632 | |
| Consumer Finance—2.7% | | | |
| | 5,000 | | | Ally Financial, Inc. | | | 90,350 | |
| | 2,500 | | | Discover Financial Services | | | 140,825 | |
| | 5,000 | | | Synchrony Financial | | | 142,950 | |
| | | | | | | | 374,125 | |
| Diversified Financial Services—0.5% | | | |
| | 13,000 | | | Tiptree Financial, Inc.-Class A | | | 75,400 | |
| Equity Real Estate Investment—1.4% | | | |
| | 4,000 | | | Colony Starwood Homes | | | 116,040 | |
| | 8,000 | | | New York REIT, Inc. | | | 75,360 | |
| | | | | | | | 191,400 | |
| Insurance—8.9% | | | |
| | 4,000 | | | American International Group, Inc. | | | 246,800 | |
| | 2,500 | | | CNA Financial Corp. | | | 91,425 | |
| | 6,000 | | | FNF Group | | | 215,460 | |
| | 14,000 | | | Hallmark Financial Services, Inc. (a) | | | 145,040 | |
| | 6,000 | | | Heritage Insurance Holdings, Inc. | | | 70,740 | |
| | 3,000 | | | MetLife, Inc. | | | 140,880 | |
| | 1,800 | | | The Hanover Insurance Group, Inc. | | | 137,142 | |
| | 2,500 | | | The Hartford Financial Services Group, Inc. | | | 110,275 | |
| | 3,500 | | | Universal Insurance Holdings, Inc. | | | 74,550 | |
| | | | | | | | 1,232,312 | |
| Internet Software & Services—0.4% | | | |
| | 7,000 | | | Bankrate, Inc. (a) | | | 54,600 | |
| IT Services—1.1% | | | |
| | 1,000 | | | Fidelity National Information Services, Inc. | | | 73,920 | |
| | 6,000 | | | First Data Corp.-Class A (a) | | | 83,940 | |
| | | | | | | | 157,860 | |
| Mortgage Real Estate Investment—6.1% | | | |
| | 14,000 | | | Altisource Residential Corp. | | | 140,980 | |
| | 17,000 | | | Anworth Mortgage Asset Corp. | | | 83,470 | |
| | 2,500 | | | Blackstone Mortgage Trust, Inc.-Class A | | | 75,500 | |
| | 8,000 | | | Colony Capital, Inc.-Class A | | | 152,080 | |
| | 13,000 | | | Five Oaks Investment Corp. | | | 67,860 | |
| | 7,000 | | | Owens Realty Mortgage, Inc. | | | 127,750 | |
The accompanying notes are an integral part of these financial statements.
49
Alpine Financial Services Fund
Schedule of Portfolio Investments—Continued
October 31, 2016
| Shares | | | Security
Description | | Value | |
| | | | | | | |
| Common Stocks—continued | | | |
| Mortgage Real Estate Investment—continued | | | |
| | 5,000 | | | PennyMac Mortgage Investment Trust | | $ | 76,100 | |
| | 5,500 | | | Starwood Property Trust, Inc. | | | 122,320 | |
| | | | | | | | 846,060 | |
| Real Estate Management & Development—0.7% | | | |
| | 5,000 | | | Kennedy-Wilson Holdings, Inc. | | | 103,000 | |
| Thrifts & Mortgage Finance—12.2% | | | |
| | 6,000 | | | Atlantic Coast Financial Corp. (a) | | | 38,520 | |
| | 2,500 | | | BankUnited, Inc. | | | 72,850 | |
| | 2,500 | | | Berkshire Hills Bancorp, Inc. | | | 73,875 | |
| | 8,000 | | | Brookline Bancorp, Inc. | | | 102,400 | |
| | 25,000 | | | Central Federal Corp. (a) | | | 36,375 | |
| | 8,000 | | | EverBank Financial Corp. | | | 154,480 | |
| | 3,000 | | | HopFed Bancorp, Inc. | | | 34,140 | |
| | 12,500 | | | Impac Mortgage Holdings, Inc. (a) | | | 198,125 | |
| | 25,000 | | | NMI Holdings, Inc.-Class A (a) | | | 191,250 | |
| | 12,500 | | | OceanFirst Financial Corp. | | | 258,500 | |
| | 10,000 | | | PennyMac Financial Services, Inc.-Class A (a) | | | 171,000 | |
| Shares | | | Security
Description | | Value | |
| | | | | | | |
| Common Stocks—continued | | | |
| Thrifts & Mortgage Finance—continued | | | |
| | 2,000 | | | Provident Financial Holdings, Inc. | | $ | 38,160 | |
| | 8,000 | | | Radian Group, Inc. | | | 108,720 | |
| | 7,000 | | | Riverview Bancorp, Inc. | | | 36,610 | |
| | 7,500 | | | Walker & Dunlop, Inc. (a) | | | 180,525 | |
| | | | | | | | 1,695,530 | |
| | | | | Total Common Stocks (Cost $11,000,782) | | | 13,631,464 | |
| | | | | | | | | |
Principal
Amount | | | | | | | |
| Short -Term Investments—0.9% | | | |
| $ | 126,000 | | | State Street Eurodollar Time Deposit, 0.01% | | | 126,000 | |
| | | | | Total Short-Term Investments (Cost $126,000) | | | 126,000 | |
| Total Investments (Cost $11,126,782) (b)—98.8% | | 13,757,464 | |
| Other Assets in Excess of Liabilities-1.2% | | 167,558 | |
| TOTAL NET ASSETS 100.0% | $ | 13,925,022 | |
Percentages are stated as a percent of net assets.
| (a) | Non-income producing security. |
| (b) | See Note 8 for the cost of investments for federal tax purposes. |
| PLC—Public Limited Company |
The accompanying notes are an integral part of these financial statements.
50
Alpine Small Cap Fund
Schedule of Portfolio Investments
October 31, 2016
| Shares | | | Security
Description | | Value | |
| | | | | | | |
| Common Stocks—94.2% | | | |
| Aerospace & Defense—2.1% | | | |
| | 4,541 | | | HEICO Corp.-Class A | | $ | 272,460 | |
| Air Freight & Logistics—2.5% | | | |
| | 9,018 | | | Hub Group, Inc.-Class A (a) | | | 328,706 | |
| Banks—2.7% | | | |
| | 10,866 | | | Enterprise Financial Services Corp. | | | 359,665 | |
| Biotechnology—2.4% | | | |
| | 3,284 | | | Ligand Pharmaceuticals, Inc. (a) | | | 314,377 | |
| Building Products—3.5% | | | |
| | 7,997 | | | Patrick Industries, Inc. (a) | | | 458,628 | |
| Chemicals—2.1% | | | |
| | 57,745 | | | AgroFresh Solutions, Inc. (a) | | | 271,402 | |
| Communications Equipment—2.5% | | | |
| | 11,823 | | | ARRIS International PLC (a) | | | 328,443 | |
| Construction & Engineering—4.2% | | | |
| | 7,207 | | | Dycom Industries, Inc. (a) | | | 554,435 | |
| Construction Materials—2.4% | | | |
| | 6,340 | | | U.S. Concrete, Inc. (a) | | | 316,366 | |
| Consumer Finance—1.5% | | | |
| | 6,055 | | | PRA Group, Inc. (a) | | | 193,155 | |
| Electrical Equipment—2.8% | | | |
| | 23,776 | | | Babcock & Wilcox Enterprises, Inc. (a) | | | 374,234 | |
| Electronic Equipment, Instruments & Components—2.3% | | | |
| | 2,148 | | | Littelfuse, Inc. | | | 299,646 | |
| Energy Equipment & Services—0.0% (b) | | | |
| | 84 | | | Matrix Service Co. (a) | | | 1,487 | |
| Equity Real Estate Investment—2.5% | | | |
| | 7,910 | | | Education Realty Trust, Inc. | | | 336,887 | |
| Food Products—3.5% | | | |
| | 38,025 | | | Nomad Foods, Ltd. (a) | | | 467,327 | |
| Health Care Equipment & Supplies—5.8% | | | |
| | 3,559 | | | ICU Medical, Inc. (a) | | | 495,769 | |
| | 6,956 | | | Natus Medical, Inc. (a) | | | 273,718 | |
| | | | | | | | 769,487 | |
| Health Care Providers & Services—3.0% | | | |
| | 10,595 | | | National Research Corp.-Class B | | | 393,710 | |
| Hotels, Restaurants & Leisure—3.2% | | | |
| | 7,884 | | | Popeyes Louisiana Kitchen, Inc. (a) | | | 420,848 | |
| Insurance—5.7% | | | |
| | 17,025 | | | Greenlight Capital Re, Ltd.- Class A (a) | | | 338,797 | |
| | 7,600 | | | Primerica, Inc. | | | 415,720 | |
| | | | | | | | 754,517 | |
| Shares | | | Security
Description | | Value | |
| | | | | | | |
| Common Stocks—continued | | | |
| Internet Software & Services—3.0% | | | |
| | 5,617 | | | j2 Global, Inc. | | $ | 399,650 | |
| IT Services—5.1% | | | |
| | 6,930 | | | Cardtronics PLC-Class A (a) | | | 346,500 | �� |
| | 6,282 | | | MAXIMUS, Inc. | | | 327,041 | |
| | | | | | | | 673,541 | |
| Life Sciences Tools & Services—3.2% | | | |
| | 9,229 | | | INC Research Holdings, Inc.- Class A (a) | | | 421,765 | |
| Machinery—1.1% | | | |
| | 3,169 | | | ESCO Technologies, Inc. | | | 141,179 | |
| Media—7.3% | | | |
| | 17,058 | | | Live Nation Entertainment, Inc. (a) | | | 471,995 | |
| | 10,222 | | | Nexstar Broadcasting Group, Inc.-Class A | | | 498,833 | |
| | | | | | | | 970,828 | |
| Mortgage Real Estate Investment—2.0% | | | |
| | 25,897 | | | Altisource Residential Corp. | | | 260,783 | |
| Real Estate Management & Development—3.5% | | | |
| | 22,460 | | | Kennedy-Wilson Holdings, Inc. | | | 462,676 | |
| Software—4.6% | | | |
| | 2,601 | | | Fair Isaac Corp. | | | 313,889 | |
| | 14,232 | | | The Descartes Systems Group, Inc. (a) | | | 296,025 | |
| | | | | | | | 609,914 | |
| Specialty Retail—2.9% | | | |
| | 4,536 | | | Lithia Motors, Inc., Class A | | | 389,098 | |
| Thrifts & Mortgage Finance—6.8% | | | |
| | 17,449 | | | Essent Group, Ltd. (a) | | | 461,352 | |
| | 5,886 | | | Meta Financial Group, Inc. | | | 431,149 | |
| | | | | | | | 892,501 | |
| | | | | Total Common Stocks
(Cost $11,631,432) | | | 12,437,715 | |
| | | | | | | | | |
Principal
Amount | | | | | | | |
| Short-Term Investments—6.7% | | | |
| $ | 882,000 | | | State Street Eurodollar Time Deposit, 0.01% | | | 882,000 | |
| | | | | Total Short-Term Investments
(Cost $882,000) | | | 882,000 | |
| Total Investments (Cost $12,513,432) (c)—100.9% | | 13,319,715 | |
| Liabilities in Excess of Other Assets—(0.9)% | | (119,071 | ) |
| TOTAL NET ASSETS 100.0% | $ | 13,200,644 | |
Percentages are stated as a percent of net assets.
| (a) | Non-income producing security. |
| (b) | Amount is less than 0.05%. |
| (c) | See Note 8 for the cost of investments for federal tax purposes. |
| PLC—Public Limited Company |
The accompanying notes are an integral part of these financial statements.
51
Alpine Ultra Short Municipal Income Fund
Schedule of Portfolio Investments
October 31, 2016
Principal
Amount | | | Security
Description | | Value | |
| | | | | | | |
| Municipal Bonds—102.1% | | | |
| Alabama—3.5% | | | |
| $ | 3,781,000 | | | Alabama Housing Finance Authority, Multi-Family Housing, Phoenix Apartments Project—Series A (LOC: Regions Bank)
1.050%, 01/01/2036
(Putable on 11/03/2016) (a) | | $ | 3,781,000 | |
| | 7,030,000 | | | Chatom Industrial Development Board Gulf Opportunity Zone Revenue, National Rural Utilities Finance—Series A
0.875%, 11/15/2038
(Putable on 11/15/2016) (a) | | | 7,029,719 | |
| | 2,000,000 | | | Chatom Industrial Development Board Pollution Control Revenue, National Rural Utilities Finance—Series C
0.875%, 12/01/2024
(Putable on 12/01/2016) (a) | | | 1,999,780 | |
| | 1,550,000 | | | Chatom Industrial Development Board Revenue, National Rural Utilities Finance—Series A
0.875%, 08/01/2037
(Putable on 11/01/2016) (a) | | | 1,549,271 | |
| | 100,000 | | | Health Care Authority for Baptist Health Revenue—Series B
(CS: Assured Guaranty Municipal)
0.850%, 11/15/2037
(Putable on 11/04/2016) (a) | | | 100,000 | |
| | 17,000,000 | | | Health Care Authority for Baptist Health Revenue—Series B
0.900%, 11/01/2042
(putable on 11/03/2016) (a) | | | 17,000,000 | |
| | 7,300,000 | | | Tuscaloosa County Industrial Development Authority
0.850%, 09/01/2020
(Putable on 11/02/2016) (a) | | | 7,300,000 | |
| | | | | | | | 38,759,770 | |
| Arizona—5.0% | | | |
| | 14,100,000 | | | Cochise County Pollution Control Corp. Revenue, Arizona Electric Power Cooperative, Inc. Project
0.950%, 09/01/2024
(Putable on 03/01/2017) (a) | | | 14,097,180 | |
| | 41,000,000 | | | Phoenix Industrial Development Authority, Solid Waste Revenue, Republic Services, Inc. Project
0.750%, 12/01/2035
(Putable on 11/01/2016) (a) | | | 41,000,000 | |
| | | | | | | | 55,097,180 | |
| Arkansas—0.8% | | | |
| | 500,000 | | | Baxter County, Regional Medical Center—Series A
5.000%, 09/01/2017 | | | 514,545 | |
| | 8,500,000 | | | City of Blytheville Revenue, Nucor Corp. Project
0.900%, 01/02/2033
(Putable on 11/02/2016) (a) | | | 8,500,000 | |
| | | | | | | | 9,014,545 | |
Principal
Amount | | | Security
Description | | Value | |
| | | | | | | |
| Municipal Bonds—continued | | | |
| California—4.7% | | | |
| $ | 5,000,000 | | | California Pollution Control Financing Authority, Solid Waste Disposal Revenue, Waste Management, Inc. Project— Series A
1.050%, 11/01/2038
(Putable on 05/01/2017) (a) | | $ | 5,001,000 | |
| | 3,500,000 | | | California Pollution Control Financing Authority, Solid Waste Disposal Revenue, Waste Management, Inc. Project— Series A
1.650%, 07/01/2031
(Putable on 05/01/2017) (a) | | | 3,504,655 | |
| | 540,000 | | | California Statewide Communities Development Authority Industrial Development RevenueSpratling- Cranor Properties LLC—Series A
(LOC: City National Bank)
1.650%, 06/01/2020
(Putable on 11/02/2016) (a) | | | 540,000 | |
| | 14,700,000 | | | Palomar Pomerado Health Care—Series A, ARN
(CS: Assured Guaranty Municipal)
1.740%, 11/01/2036
(Putable on 11/01/2016) (a) | | | 14,700,000 | |
| | 15,025,000 | | | Palomar Pomerado Health Care—Series B, ARN
(CS: Assured Guaranty Municipal)
1.730%, 11/01/2036
(Putable on 11/02/2016) (a) | | | 15,025,000 | |
| | 12,950,000 | | | Palomar Pomerado Health Care—Series C, ARN
(CS: Assured Guaranty Municipal)
1.750%, 11/01/2036
(Putable on 11/03/2016) (a) | | | 12,950,000 | |
| | 640,000 | | | Riverside County Industrial Development Authority, Universal Forest Products
(LOC: JPMorgan Chase Bank NA)
0.750%, 08/01/2029
(Putable on 11/03/2016) (a) | | | 640,000 | |
| | | | | | | | 52,360,655 | |
| Colorado—0.0% (b) | | | |
| | 550,000 | | | Colorado Health Facilities Authority, Covenant Retire Community Obligation
2.000%, 12/01/2016 | | | 550,435 | |
| Connecticut—2.2% | | | |
| | 3,465,000 | | | City of New Britain, Bond Anticipation Notes
2.000%, 03/23/2017 | | | 3,481,078 | |
| | 15,000,000 | | | Hartford County Metropolitan District, Bond Anticipation Notes
2.000%, 12/01/2016 | | | 15,012,900 | |
| | 5,600,000 | | | State of Connecticut, General Obligation—Series B
4.000%, 05/15/2018 | | | 5,852,336 | |
| | | | | | | | 24,346,314 | |
The accompanying notes are an integral part of these financial statements.
52
Alpine Ultra Short Municipal Income Fund
Schedule of Portfolio Investments—Continued
October 31, 2016
Principal
Amount | | | Security
Description | | Value | |
| | | | | | | |
| Municipal Bonds—continued | | | |
| Delaware—1.6% | | | |
| $ | 17,810,000 | | | Delaware New County Castle Revenue, Airport Facility, FlightSafety International, Inc. Project.—Series 2002
(CS: Berkshire Hathaway, Inc.)
0.630%, 06/01/2022
(Putable on 11/03/2016) (a) | | $ | 17,810,000 | |
| District of Columbia—0.7% | | | |
| | 7,500,000 | | | Washington Metropolitan Area
Transit Authority—Series A
4.000%, 07/01/2017 | | | 7,661,400 | |
| Florida—4.8% | | | |
| | 300,000 | | | City of Tallahassee Revenue, Tallahassee Memorial Healthcare, Inc. Project— Series A
5.000%, 12/01/2016 | | | 300,933 | |
| | 27,100,000 | | | Florida Development Finance Corp., Healthcare Facilities Revenue, UF Health-Jacksonville Project—Series B
1.100%, 02/01/2029
(Putable on 11/03/2016) (a) | | | 27,100,000 | |
| | 5,000,000 | | | Liberty County, Industrial Development, Georgia Pacific Corp. Project
0.830%, 10/01/2028
(Putable on 11/03/2016) (a) | | | 5,000,000 | |
| | 11,355,000 | | | Miami-Dade County Expressway Authority Toll System Revenue—Series DCL-2012-005
(CS: AMBAC; LOC: Dexia Credit Local)
1.130%, (MUNIPSA*1 + 50.000 bps) 05/20/2029
(Putable on 11/03/2016) (a)(c) | | | 11,355,000 | |
| | 10,000,000 | | | Miami-Dade County, School Board
1.020%, 05/01/2037
(Putable on 11/03/2016) (a)(c) | | | 10,000,000 | |
| | | | | | | | 53,755,933 | |
| Georgia—0.5% | | | |
| | 650,000 | | | Bartow County Development
Authority, Georgia Power Company Plant
2.375%, 09/01/2029
(Putable on 08/10/2017) (a) | | | 656,025 | |
| | 800,000 | | | Douglas County Development Authority, Electrical Fiber Systems Project
(LOC: Regions Bank)
1.140%, 12/01/2021
(Putable on 11/03/2016) (a) | | | 800,000 | |
| | 4,000,000 | | | Fulton County Development Authority Industrial Development, Leggett & Platt, Inc.Series A,
1.030%, 06/01/2027
(Putable on 11/02/2016) (a) | | | 4,000,000 | |
| | | | | | | | 5,456,025 | |
Principal
Amount | | | Security
Description | | Value | |
| | | | | | | |
| Municipal Bonds—continued | | | |
| Illinois-6.2% | | | |
| $ | 48,470,000 | | | Chicago Board of Education— Series-DCL-2012-001
(LOC: Dexia Credit Local)
1.284%, 12/01/2034
(Putable on 11/03/2016) (a)(c) | | $ | 48,470,000 | |
| | 2,285,000 | | | Chicago Board of Education,
General Obligation—Series B
(CS: Assured Guaranty Municipal)
5.000%, 12/01/2016 | | | 2,292,700 | |
| | 3,000,000 | | | Chicago Midway International Airport, Second Lien—Series C-2
0.630%, 01/01/2035
(Putable on 11/03/2016) (a) | | | 3,000,000 | |
| | 200,000 | | | City of Chicago
5.500%, 01/01/2017 | | | 201,250 | |
| | 1,250,000 | | | City of Chicago IL Wastewater Transmission Revenue, Second Lien—Series C
4.000%, 01/01/2017 | | | 1,255,575 | |
| | 140,000 | | | Cook County, High School District No. 202, Evanston Township
4.000%, 12/01/2016 | | | 140,370 | |
| | 130,000 | | | Illinois Finance Authority Industrial Development Revenue, Church Road Partnership
(LOC: JPMorgan Chase Bank)
0.880%, 10/01/2017
(Putable on 11/03/2016) (a) | | | 130,000 | |
| | 210,000 | | | Joilet Park District, General Obligation—Series A
3.000%, 02/01/2017 | | | 211,067 | |
| | 4,400,000 | | | Springfield Airport Authority, Allied-Signal, Inc. Project
1.120%, 09/01/2018
(Putable on 11/02/2016) (a) | | | 4,400,000 | |
| | 2,550,000 | | | State of Illinois, General Obligation
5.000%, 01/01/2018 | | | 2,558,797 | |
| | 2,250,000 | | | Town of Cicero, General Obligation—Series A
4.000%, 01/01/2017 | | | 2,261,183 | |
| | 2,120,000 | | | Upper Illinois River Valley Development, Cathy Asta Enterprises
0.750%, 08/01/2033
(Putable on 11/03/2016) (a) | | | 2,120,000 | |
| | 65,000 | | | Village of Hanover Park Industrial Development Revenue, Spectra-Tech, Inc. Project
(LOC: BMO Harris Bank N.A.)
1.250%, 08/01/2017
(Putable on 11/03/2016) (a) | | | 65,000 | |
| | 500,000 | | | Village of Oak Lawn,
General Obligation
(CS: Assured Guaranty Municipal)
2.500%, 12/01/2016 | | | 500,690 | |
| | 955,000 | | | Will-Kankakee Regional
Development, Triton
Manufacturing Co., Inc. Project
1.250%, 08/01/2025
(Putable on 11/02/2016) (a) | | | 955,000 | |
| | | | | | | | 68,561,632 | |
The accompanying notes are an integral part of these financial statements.
53
Alpine Ultra Short Municipal Income Fund
Schedule of Portfolio Investments—Continued
October 31, 2016
Principal
Amount | | | Security
Description | | Value | |
| | | | | | | |
| Municipal Bonds—continued | | | |
| Indiana—7.5% | | | |
| $ | 320,000 | | | City of South Bend Economic Development Revenue, Dynamic R.E.H.C., Inc. Project (LOC: KeyBank N.A.)
0.790%, 09/01/2020
(Putable on 11/02/2016) (a) | | $ | 320,000 | |
| | 6,880,000 | | | Elkhart County Revenue
(CS: Pedcor Ivnts-2000-xli LP)
0.830%, 01/01/2035
(Putable on 11/03/2016) (a) | | | 6,880,000 | |
| | 400,000 | | | Gary Chicago International Airport Authority
5.000%, 02/01/2017 | | | 403,172 | |
| | 1,500,000 | | | Indiana Finance Authority Economic Development, Republic Services, Inc. Project—Series A
0.850%, 05/01/2034
(Putable on 12/01/2016) (a) | | | 1,499,985 | |
| | 11,385,000 | | | Indiana Finance Authority, Environmental Improvement Revenue, Mittal Steel U.S.A., Inc. Project
(LOC: Banco Bilbao Vizcaya Argentaria)
0.790%, 08/01/2030
(Putable on 11/02/2016) (a) | | | 11,385,000 | |
| | 58,825,000 | | | Indiana Finance Authority, Multifamily HSG Revenue (LIQ FAC: CitiGroup)
1.030%, 10/26/2017
(Putable on 11/03/2016) (a) | | | 58,825,000 | |
| | 3,715,000 | | | Indiana Health Facility Financing Authority, Ascension Health—Series CR-A-1
5.000%, 10/01/2027
(Putable on 06/01/2017) (a) | | | 3,804,754 | |
| | | | | | | | 83,117,911 | |
| Iowa—1.3% | | | |
| | 1,090,000 | | | Iowa Finance Authority, Pella Regional Health Center Project
5.000%, 12/01/2017 | | | 1,093,390 | |
| | 1,250,000 | | | Iowa Higher Education Loan Authority, Anticipation Notes, Private Education Working Capital
2.500%, 05/11/2017 | | | 1,259,237 | |
| | 12,000,000 | | | State Finance Authority Midwestern Disaster Area Economic Development, CJ Bio America Inc. Project (LOC: Korea Development Bank)
0.880%, 04/01/2022
(Putable on 11/03/2016) (a) | | | 12,000,000 | |
| | | | | | | | 14,352,627 | |
| Kansas—0.2% | | | |
| | 1,000,000 | | | City of Dodge City Industrial Development Revenue, Farmland National Beef Packing Co., L.P. Project (LOC: Rabobank Int.)
1.100%, 03/01/2027
(Putable on 11/03/2016) (a) | | | 1,000,000 | |
Principal
Amount | | | Security
Description | | Value | |
| | | | | | | |
| Municipal Bonds—continued | | | |
| Kansas—continued | | | |
| $ | 1,000,000 | | | City of Liberal KS Industrial Development Revenue, Farmland National Beef Packing Co., L.P. Project (LOC: Rabobank Int.)
1.150%, 02/01/2029
(Putable on 11/03/2016) (a) | | $ | 1,000,000 | |
| | | | | | | | 2,000,000 | |
| Kentucky—0.4% | | | |
| | 500,000 | | | Kenton County Airport Board, Special Facilities , FlightSafety International, Inc. Project—Series A
(CS: Berkshire Hathaway, Inc.)
0.630%, 06/01/2021
(Putable on 11/03/2016) (a) | | | 500,000 | |
| | 4,500,000 | | | Pulaski County Solid Waste Disposal Revenue, National Rural Utilities-East Kentucky Power—Series B
0.950%, 08/15/2023
(Putable on 02/15/2017) (a) | | | 4,498,335 | |
| | | | | | | | 4,998,335 | |
| Louisiana—5.8% | | | |
| | 2,240,000 | | | Caddo-Bossier Parishes Port Commission, Oakley Louisiana, Inc. (LOC: Bank of America N.A.)
0.750%, 01/01/2028
(Putable on 11/03/2016) (a) | | | 2,240,000 | |
| | 14,200,000 | | | East Baton Rouge Parish Industrial Development Board, Solid Waste Disposal, Georgia Pacific Corp. Project
0.800%, 06/01/2029
(Putable on 11/02/2016) (a)(c) | | | 14,200,000 | |
| | 4,600,000 | | | Jefferson Parish Industrial Development Board, Sara Lee Corp. Project
0.900%, 06/01/2024
(Putable on 11/01/2016) (a) | | | 4,600,000 | |
| | 430,000 | | | Louisiana Public Facilities Authority, Equipment & Capital Facilities Pooled—Series B
(LOC: Capital One Bank NA)
1.040%, 07/01/2033
(Putable on 11/03/2016) (a) | | | 430,000 | |
| | 2,000,000 | | | New Orleans Aviation Board—Series B2
5.000%, 01/01/2017 | | | 2,013,300 | |
| | 1,105,000 | | | North Webster Parish Industrial Development Revenue, CSP Project
(LOC: Regions Bank)
2.640%, 09/01/2021
(Putable on 11/03/2016) (a) | | | 1,105,000 | |
| | 230,000 | | | Ouachita Parish Industrial Development Board, Garrett Manufacturing LLC
(LOC: Regions Bank)
1.140%, 12/01/2016
(Putable on 11/03/2016) (a) | | | 230,000 | |
The accompanying notes are an integral part of these financial statements.
54
Alpine Ultra Short Municipal Income Fund
Schedule of Portfolio Investments—Continued
October 31, 2016
Principal
Amount | | | Security
Description | | Value | |
| | | | | | | |
| Municipal Bonds—continued | | | |
| Louisiana—continued | | | |
| $ | 6,900,000 | | | Parish of Ascension, BASF Corp. Project
0.750%, 12/01/2027
(Putable on 11/02/2016) (a) | | $ | 6,900,000 | |
| | 12,300,000 | | | Parish of Ascension, Variable Rate Demand Revenue, BASF Corp.
0.750%, 03/01/2025
(Putable on 11/02/2016) (a) | | | 12,300,000 | |
| | 20,000,000 | | | Plaquemines Port Harbor & Terminal District Revenue, International Marine Terminal Project—Series A (LOC: Wells Fargo Bank N.A.)
0.850%, 03/15/2025
(Putable on 03/15/2017) (a) | | | 20,000,000 | |
| | | | | | | | 64,018,300 | |
| Maryland—2.3% | | | |
| | 395,000 | | | Maryland Economic Development Corp., Bindagraphics, Inc. Facilities
1.130%, 09/01/2017
(Putable on 11/04/2016) (a) | | | 395,000 | |
| | 625,000 | | | Maryland Economic Development Corp., Bindagraphics, Inc. Project
1.240%, 07/01/2021
(Putable on 11/03/2016) (a) | | | 625,000 | |
| | 330,000 | | | Maryland Economic Development Corp., Games Lithographing Co. Facilities
1.130%, 05/01/2017
(Putable on 11/04/2016) (a) | | | 330,000 | |
| | 7,125,000 | | | Maryland Economic Development Corp., Linemark Printing Project
1.130%, 12/01/2033
(Putable on 11/04/2016) (a) | | | 7,125,000 | |
| | 1,090,000 | | | Maryland Economic Development Corp., Redrock LLC Facilities
1.130%, 11/01/2022
(Putable on 11/04/2016) (a) | | | 1,090,000 | |
| | 13,900,000 | | | Maryland Industrial Development Financing Authority, Various Refunding Occidental Petroleum Corp.
0.790%, 03/01/2030
(Putable on 11/02/2016) (a) | | | 13,900,000 | |
| | 2,570,000 | | | Washington County, Conservit, Inc. Facilities
1.130%, 02/01/2023
(Putable on 11/04/2016) (a) | | | 2,570,000 | |
| | | | | | | | 26,035,000 | |
| Michigan—0.5% | | | |
| | 6,000,000 | | | City of Detroit MI Water Supply System—Series F
5.000%, 07/01/2033 | | | 6,008,100 | |
Principal
Amount | | | Security
Description | | Value | |
| | | | | | | |
| Municipal Bonds—continued | | | |
| Michigan—0.5% | | | |
| $ | 125,000 | | | Michigan Finance Authority, Refunding College for Studies
3.000%, 12/01/2016 | | $ | 125,190 | |
| | | | | | | | 6,133,290 | |
| Minnesota—0.1% | | | |
| | 1,150,000 | | | Minnesota Housing Finance Agency, Residential Housing—Series S (SPA: Wells Fargo Bank NA)
0.650%, 07/01/2038
(Putable on 11/03/2016) (a) | | | 1,150,000 | |
| Mississippi—6.6% | | | |
| | 6,495,000 | | | Mississippi Business Finance Corp., Hattiesburg Clinic Professional Association Project
(LOC: Regions Bank)
0.950%, 11/01/2026
(Putable on 11/03/2016) (a) | | | 6,495,000 | |
| | 63,000,000 | | | Mississippi Business Finance Corp., PSL-North America LLC Project—Series A
(LOC: ICICI Bank)
3.220%, 11/01/2032
(Putable on 11/03/2016) (a) | | | 63,000,000 | |
| | 3,960,000 | | | Mississippi Business Finance Corp., Tri-State Truck Center, Inc. Project
(LOC: Regions Bank)
0.950%, 03/01/2033
(Putable on 11/03/2016) (a) | | | 3,960,000 | |
| | | | | | | | 73,455,000 | |
| Missouri—0.0% (b) | | | |
| | 300,000 | | | Missouri Development Finance Board, Independence Centerpoint Project—Series B
3.000%, 04/01/2017 | | | 302,280 | |
| | 200,000 | | | Missouri Development Finance Board, Independence Events Center Project—Series A
3.000%, 04/01/2017 | | | 201,520 | |
| | | | | | | | 503,800 | |
| New Hampshire—0.1% | | | |
| | 995,000 | | | New Hampshire Business Finance Authority, Pennichuck Water Works, Inc. Project—Series A
4.000%, 01/01/2017 | | | 999,209 | |
| New Jersey—8.9% | | | |
| | 7,338,619 | | | Borough of Keansburg, Bond Anticipation Notes, General Obligation
2.000%, 06/22/2017 | | | 7,386,467 | |
| | 13,295,000 | | | Borough of Keansburg, Bond Anticipation Notes, General Obligation
2.000%, 08/02/2017 | | | 13,390,325 | |
| | 4,632,928 | | | Borough of Union Beach, Bond Anticipation Notes
2.000%, 03/01/2017 | | | 4,648,726 | |
The accompanying notes are an integral part of these financial statements.
55
Alpine Ultra Short Municipal Income Fund
Schedule of Portfolio Investments—Continued
October 31, 2016
Principal
Amount | | | Security
Description | | Value | |
| | | | | | | |
| Municipal Bonds—continued | | | |
| New Jersey—continued | | | |
| $ | 500,000 | | | Casino Reinvestment Development Authority—Series D
4.000%, 11/01/2016 | | $ | 500,000 | |
| | 2,189,765 | | | City of Linwood, Bond Anticipation Notes, General Obligation
2.000%, 07/27/2017 | | | 2,204,283 | |
| | 8,799,000 | | | City of Newark, General Obligation
2.500%, 12/06/2016 | | | 8,805,687 | |
| | 1,270,000 | | | New Jersey Economic Development Authority—Series H
1.530%, (MUNIPSA*1 +90.000 bps) 02/01/2017
(Putable on 11/03/2016) (a)
| | 1,270,241 | |
| | 2,000,000 | | | New Jersey Economic Development Authority—Series K
1.360%, (MUNIPSA*1 +73.000 bps) 02/01/2017
(Putable on 11/03/2016) (a) | | 2,000,200 | |
| | 26,300,000 | | | New Jersey Economic Development Authority, Port Newark Container Terminal LLC Project—Series B (LOC: Sovereign Bank N.A.)
0.800%, 07/01/2030
(Putable on 11/02/2016) (a) | | | 26,300,000 | |
| | 4,200,000 | | | New Jersey Higher Education Student Assistance Authority, AMT-Student Loan Recovery—Series 1A
5.000%, 12/01/2016 | | | 4,213,608 | |
| | 5,000,000 | | | New Jersey Transportation Trust Fund Authority, Transportation System—Series A
5.000%, 12/15/2017 | | | 5,210,050 | |
| | 6,341,400 | | | Township of Irvington, General Obligation
3.000%, 06/16/2017 | | | 6,364,737 | |
| | 16,452,622 | | | Township of Toms River, Bond Anticipation Notes, General Obligation
2.000%, 06/21/2017 | | | 16,586,053 | |
| | | | | | | | 98,880,377 | |
| New York—13.0% | | | |
| | 7,000,000 | | | Alden Central School District, Bond Anticipation Notes, General Obligation (CS: State Aid Withholding)
2.000%, 06/21/2017 | | | 7,047,740 | |
| | 5,500,000 | | | Binghamton City School District, Bond Anticipation Notes, General Obligation (CS: State Aid Withholding)
1.500%, 06/30/2017 | | | 5,518,700 | |
| | 8,350,000 | | | City of Dunkirk, Bond Anticipation Notes
2.000%, 03/23/2017 | | | 8,382,481 | |
| | 6,930,361 | | | City of Glen Cove, Bond Anticipation Notes—Series B
2.000%, 09/13/2017 | | | 6,963,350 | |
| | 596,000 | | | County of Rockland, Bond Anticipation Notes—Series A
2.000%, 12/01/2016 | | | 596,542 | |
Principal
Amount | | | Security
Description | | Value | |
| | | | | | | |
| Municipal Bonds—continued | | | |
| New York—continued | | | |
| $ | 7,000,000 | | | County of Rockland, Tax Anticipation Notes
2.000%, 03/16/2017 | | $ | 7,029,820 | |
| | 3,600,000 | | | Dunkirk City School District, Bond Anticipation Notes, General Obligation (CS: State Aid Withholding)
2.000%, 07/26/2017 | | | 3,626,424 | |
| | 2,500,000 | | | East Greenbush Central School District, Bond Anticipation Notes, General Obligation—Series B
2.000%, 02/10/2017 | | | 2,507,550 | |
| | 13,000,000 | | | Fonda-Fultonville Central School District, Bond Anticipation Notes, General Obligation
2.000%, 08/04/2017 | | | 13,095,420 | |
| | 1,000,000 | | | Forestville Central School District, Bond Anticipation Notes, General Obligation (CS: State Aid Withholding)
2.000%, 06/07/2017 | | | 1,005,980 | |
| | 10,195,000 | | | Herkimer Central School District, Bond Anticipation Notes
2.000%, 08/11/2017 | | 10,262,185 | |
| | 5,110,000 | | | Jamestown City School District, General Obligation (CS: State Aid Withholding)
2.000%, 06/22/2017 | | | 5,148,632 | |
| | 6,825,000 | | | Lackawanna City School District, Bond Anticipation Notes
2.000%, 03/02/2017 | | 6,845,953 | |
| | 10,000,000 | | | Nassau County, Revenue Anticipation Notes, General Obligation—Series A
2.000%, 12/07/20161 | | | 10,011,700 | |
| | 5,000,000 | | | Nassau Health Care Corp., Revenue Anticipation Notes
2.000%, 01/17/2017 | | | 5,006,500 | |
| | 640,000 | | | New York City Housing Development Corp.—Series E-1-A
0.750%, 11/01/2016 | | | 640,000 | |
| | 1,300,000 | | | New York City Industrial Development Agency, Novelty Crystal Corp. Project.
1.180%, 12/01/2034
(Putable on 11/03/2016) (a) | | | 1,300,000 | |
| | 150,000 | | | New York City Industrial Development Agency, Allway Tools, Inc. (LOC: Citibank N.A.)
1.130%, 08/01/2017
(Putable on 11/03/2016) (a) | | | 150,000 | |
| | 660,000 | | | New York City Industrial Development Agency, Allway Tools, Inc. (LOC: Citibank N.A.)
1.130%, 08/01/2020
(Putable on 11/03/2016) (a) | | | 660,000 | |
The accompanying notes are an integral part of these financial statements.
56
Alpine Ultra Short Municipal Income Fund
Schedule of Portfolio Investments—Continued
October 31, 2016
Principal
Amount | | | Security
Description | | Value | |
| | | | | | | |
| Municipal Bonds—continued | | | |
| New York—continued | | | |
| $ | 12,500,000 | | | New York Environmental Facilities Corp. Solid Waste Disposal Revenue, Waste Management, Inc. Project—Series 2012
0.700%, 05/01/2030
(Putable on 11/01/2016) (a) | | $ | 12,500,000 | |
| | 200,000 | | | New York State Housing Finance Agency, HSG-605 West 42nd Street Owner LLC
0.720%, 05/01/2048
(Putable on 11/01/2016) (a) | | | 200,000 | |
| | 4,715,000 | | | Port Authority of New York & New Jersey—Series 188
5.000%, 05/01/2017 | | | 4,811,563 | |
| | 2,120,000 | | | Rockland County, General Obligation
5.000%, 03/01/2017 | | | 2,146,648 | |
| | 1,125,000 | | | Rockland County, General Obligation—Series A (CS: AGM)
5.000%, 03/01/2017 | | | 1,139,636 | |
| | 4,000,000 | | | Salmon River Central School District, Anticipation Notes, General Obligation (CS: State Aid Withholding)
2.000%, 06/16/2017 | | | 4,020,880 | |
| | 3,000,000 | | | Town of Oyster Bay, Bond Anticipation Notes, General Obligation—Series A
2.750%, 02/03/2017 | | | 3,001,290 | |
| | 6,257,000 | | | Town of Salina, Bond Anticipation Notes, General Obligation
2.000%, 06/16/2017 | | | 6,299,485 | |
| | 13,757,000 | | | Utica School District, Bond Anticipation Notes, General Obligation (CS: State Aid Withholding)
2.000%, 07/21/2017 | | | 13,817,256 | |
| | 300,000 | | | Westchester Tobacco Asset Securitization Corp.
5.000%, 06/01/2026 | | | 305,145 | |
| | | | | | | | 144,040,880 | |
| North Carolina—3.8% | | | |
| | 18,900,000 | | | Hertford County Industrial Facilities & Pollution Control Financing Authority, Nucor Corp. Project—Series A
0.900%, 11/01/2033
(Putable on 11/02/2016) (a) | | | 18,900,000 | |
| | 13,100,000 | | | Hertford County Industrial Facilities & Pollution Control Financing Authority, Nucor Corp. Project—Series B
0.880%, 11/01/2033
(Putable on 11/02/2016) (a) | | | 13,100,000 | |
Principal
Amount | | | Security
Description | | Value | |
| | | | | | | |
| Municipal Bonds—continued | | | |
| North Carolina—continued | | | |
| $ | 10,000,000 | | | North Carolina Capital Facilities Finance Agency, Solid Waste Disposal Revenue, Republic Services, Inc. Project—Series B
0.850%, 12/01/2020
(Putable on 12/01/2016) (a) | | $ | 9,999,900 | |
| | | | | | | | 41,999,900 | |
| Ohio—1.1% | | | |
| | 2,700,000 | | | State of Ohio Revenue, Universal Forest Products (LOC: JPMorgan Chase Bank NA)
0.800%, 10/01/2020
(Putable on 11/03/2016) (a) | | | 2,700,000 | |
| | 9,000,000 | | | State of Ohio, University Hospital Health
0.760%, 01/15/2045
(Putable on 11/01/2016) (a) | | | 9,000,000 | |
| | | | | | | | 11,700,000 | |
| Oregon—2.0% | | | |
| | 250,000 | | | City of Forest Grove, Pacific University
3.000%, 05/01/2017 | | | 252,050 | |
| | 4,325,000 | | | Gilliam County, Solid Waste Disposal Revenue, Waste Management, Inc. Project—Series A
1.200%, 08/01/2025
(Putable on 05/01/2017) (a)(c) | | | 4,327,292 | |
| | 2,000,000 | | | State of Oregon Housing & Community Services Department Revenue, Holiday Garden Apartments Project—Series D
0.800%, 08/01/2018
(Putable on 02/01/2017) (a) | | | 1,998,960 | |
| | 15,550,000 | | | State of Oregon, Adjustable Refunding, Georgia-Pacific Corp. Project
0.800%, 12/01/2025
(Putable on 11/02/2016) (a) | | | 15,550,000 | |
| | | | | | | | 22,128,302 | |
| Pennsylvania—3.5% | | | |
| | 4,000,000 | | | Cumberland County, Municipal Authority, AICUP Financing Program, Messiah College
3.000%, 05/01/2044
(Putable on 05/01/2017) (a) | | | 4,033,000 | |
| | 290,000 | | | Cumberland County, Municipal Authority, Diakon Lutheran Social Ministries
4.000%, 01/01/2017 | | | 291,273 | |
| | 10,000,000 | | | Dallastown Area School District
1.584%, (MUNIPSA*0.1 +
150.000 bps) 04/14/2017 (a) | | | 10,026,300 | |
| | 165,000 | | | East Hempfield Township Industrial Development Authority, Willow Valley Communities
1.000%, 12/01/2016 | | | 164,990 | |
| | 9,900,000 | | | Emmaus General Authority (SPA: Wells Fargo Bank N.A.)
0.650%, 12/01/2028
(Putable on 11/02/2016) (a) | | 9,900,000 | |
The accompanying notes are an integral part of these financial statements.
57
Alpine Ultra Short Municipal Income Fund
Schedule of Portfolio Investments—Continued
October 31, 2016
Principal
Amount | | | Security
Description | | Value | |
| | | | | | | |
| Municipal Bonds—continued | | | |
| Pennsylvania—continued | | | |
| $ | 815,000 | | | Franklin County Industrial Development Authority, Precast System LLC Project—Series A
1.130%, 11/01/2021
(Putable on 11/04/2016) (a) | | $ | 815,000 | |
| | 480,000 | | | Lancaster Industrial Development Authority, Henry Molded Products—Series C
1.130%, 02/01/2020
(Putable on 11/03/2016) (a) | | | 480,000 | |
| | 4,000,000 | | | Pennsylvania Economic Development Financing Authority, Solid Waste Disposal Revenue, Waste Management, Inc.
0.700%, 08/01/2045
(Putable on 11/01/2016) (a) | | | 4,000,000 | |
| | 6,270,000 | | | Pennsylvania Higher Educational Facilities Authority, VAR-AICUP Financing Program
3.000%, 05/01/2033
(Putable on 05/01/2017) (a) | | | 6,329,189 | |
| | 1,300,000 | | | Pennsylvania Higher Educational Facilities Authority, Variable AICUP Financing Program—Series T2
1.000%, 05/01/2030
(Putable on 05/01/2017) (a) | | | 1,299,493 | |
| | 730,000 | | | York County Industrial Development Authority, Riach Family, Ltd. Partners Project
1.130%, 03/01/2020
(Putable on 11/04/2016) (a) | | | 730,000 | |
| | 480,000 | | | York County Industrial Development Authority, York Sheet Metal Project
1.240%, 08/01/2018 | | | 480,000 | |
| | | | | | | | 38,549,245 | |
| Puerto Rico—0.7% | | | |
| | 2,590,000 | | | Commonwealth of Puerto Rico, Public Improvement Bonds (CS: Assured Guaranty Municipal)
5.500%, 07/01/2017 | | | 2,659,826 | |
| | 500,000 | | | Commonwealth of Puerto Rico, Public Improvement Bonds—Series A (CS: Assured Guaranty Municipal)
5.000%, 07/01/2017 | | | 512,130 | |
| | 670,000 | | | Commonwealth of Puerto Rico, Public Improvement Bonds—Series A (CS: NATL-RE)
5.500%, 07/01/2017 | | | 685,531 | |
| | 1,580,000 | | | Puerto Rico Electric Power Authority—Series LL (CS: NATL-RE)
5.500%, 07/01/2017 | | | 1,616,087 | |
| | 250,000 | | | Puerto Rico Electric Power Authority—Series SS (CS: NATL-RE)
5.000%, 07/01/2017 | | | 251,845 | |
Principal
Amount | | | Security
Description | | Value | |
| | | | | | | |
| Municipal Bonds—continued | | | |
| Puerto Rico—continued | | | |
| $ | 1,465,000 | | | Puerto Rico Highways & Transportation Authority—Series AA (CS: NATL-RE)
5.500%, 07/01/2017 | | $ | 1,498,461 | |
| | 1,100,000 | | | Puerto Rico Highways & Transportation Authority—Series E (CS: Assured Guaranty Municipal)
5.500%, 07/01/2017 | | | 1,129,656 | |
| | | | | | | | 8,353,536 | |
| Rhode Island—0.0% (b) | | | |
| | 500,000 | | | Providence Redevelopment Agency Revenue—Series A
3.000%, 04/01/2017 | | | 503,120 | |
| Tennessee—1.6% | | | |
| | 14,000,000 | | | Lewisburg Industrial Development Board Solid Waste Disposal Revenue, Waste Management, Inc. of Tennessee Project
0.700%, 07/02/2035
(Putable on 11/01/2016) (a) | | | 14,000,000 | |
| | 2,820,000 | | | Sevier County Public Building Authority, Local Government Public Improvement (CS: AMBAC, LOC: KBC Bank NV)
2.680%, 06/01/2026
(Putable on 11/03/2016) (a) | | | 2,820,000 | |
| | 1,050,000 | | | Tennessee State School Bond Authority, Refunding higher Educational Facilities—Series C
5.000%, 05/01/2017 | | | 1,057,707 | |
| | | | | | | | 17,877,707 | |
| Texas—7.0% | | | |
| | 15,000,000 | | | Calhoun County Navigation Industrial Development Authority, British Petroleum Co.
0.730%, 01/01/2024
(Putable on 11/02/2016) (a) | | | 15,000,000 | |
| | 2,635,000 | | | City of Wichita Falls TX Water & Sewer System
2.000%, 08/01/2017 | | | 2,655,843 | |
| | 2,000,000 | | | Dallas Independent School District, Multi-Modal School Building—Series B-1
3.000%, 02/15/2036
(Putable on 02/15/2017) (a) | | | 2,012,860 | |
| | 4,680,000 | | | Dallas Independent School District, Multi-Modal School Building—Series B-2
4.000%, 02/15/2036
(Putable on 02/15/2018) (a) | | | 4,856,062 | |
| | 220,000 | | | Mesquite Health Facility Development Corp., Christian Care Centers, Inc.
1.400%, 02/15/2017 | | | 219,910 | |
The accompanying notes are an integral part of these financial statements.
58
Alpine Ultra Short Municipal Income Fund
Schedule of Portfolio Investments—Continued
October 31, 2016
| Shares | | | Security
Description | | Value | |
| | | | | | | |
| Municipal Bonds—continued | | | |
| Texas—7.0% | | | |
| $ | 7,500,000 | | | Mission Economic Development Corp. Solid Waste Disposal Revenue, Republic Services, Inc. Project
0.750%, 01/01/2026
(Putable on 11/01/2016) (a) | | $ | 7,500,000 | |
| | 180,000 | | | New Hope Cultural Education Facilities Corp., Cardinal Bay, Inc. Village On The Park—Series B
3.000%, 07/01/2017 | | | 181,708 | |
| | 170,000 | | | New Hope Cultural Education Facilities Corp., Cardinal Bay, Inc. Village On The Park—Series B
3.000%, 07/01/2018 | | | 173,266 | |
| | 130,000 | | | New Hope Cultural Education F acilities Corp., Cardinal Bay, Inc. Village On The Park—Series C
3.000%, 07/01/2017 | | | 130,335 | |
| | 125,000 | | | New Hope Cultural Education Facilities Corp., Cardinal Bay, Inc. Village On The Park—Series C
3.000%, 07/01/2018 | | | 125,360 | |
| | 4,900,000 | | | Port of Corpus Christi Authority of Nueces County, Flint Hills Resources LP, Project
0.710%, 01/01/2032
(Putable on 11/02/2016) (a) | | | 4,900,000 | |
| | 16,540,000 | | | Port of Corpus Christi Authority of Nueces County, Solid Waste Disposal, Flint Hills Resources LP, West Plant Project—Series A
0.700%, 07/01/2029
(Putable on 11/02/2016) (a)(c) | | | 16,540,000 | |
| | 4,200,000 | | | Port of Port Arthur Navigation District, Motiva Enterprises—Series B
0.730%, 12/01/2039
(Putable on 11/01/2016) (a) | | | 4,200,000 | |
| | 12,500,000 | | | Port of Port Arthur Texas Navigation District, Environmental Facilities, Motiva Enterprises—Series E
0.730%, 11/01/2040
(Putable on 11/01/2016) (a) | | 12,500,000 | |
| | 4,200,000 | | | Port of Port Arthur Texas Navigation District, Motiva Enterprises LLC—Series A
0.730%, 12/01/2039
(Putable on 11/01/2016) (a) | | | 4,200,000 | |
| | 2,600,000 | | | Texas Public Finance Authority, Texas Southern University
2.000%, 05/01/2017 | | | 2,610,868 | |
| | | | | | | | 77,806,212 | |
| Vermont—1.2% | | | |
| | 2,500,000 | | | Vermont Housing Finance Agency—Series A (SPA: TD Bank N.A.)
0.750%, 05/01/2029
(Putable on 11/03/2016) (a) | | | 2,500,000 | |
| Shares | | | Security
Description | | Value | |
| | | | | | | |
| Municipal Bonds—continued | | | |
| Vermont—continued | | | |
| $ | 11,000,000 | | | Vermont Housing Finance Agency, Multiple Purpose—Series C (SPA: Bank of New York Mellon; INS. Assured Guaranty)
0.680%, 11/01/2037
(Putable on 11/02/2016) (a) | | $ | 11,000,000 | |
| | | | | | | | 13,500,000 | |
| Virginia—1.2% | | | |
| | 13,700,000 | | | Campbell County Industrial Development Authority, Solid Waste Disposal Facility Revenue, Georgia Pacific Corp. Project
0.800%, 12/01/2019
(Putable on 11/02/2016) (a)(c) | | | 13,700,000 | |
| Washington—0.2% | | | |
| | 1,400,000 | | | Washington Economic Development Finance Authority, Belina Interiors, Inc.—Series E (LOC: KeyBank N.A.)
1.080%, 08/01/2033
(Putable on 11/03/2016) (a) | | | 1,400,000 | |
| | 1,090,000 | | | Washington Economic Development Finance Authority, Belina Interiors, Inc.—Series F (LOC: KeyBank N.A.)
1.080%, 11/01/2023
(Putable on 11/03/2016) (a) | | | 1,090,000 | |
| | | | | | | | 2,490,000 | |
| West Virginia—2.2% | | | |
| | 24,000,000 | | | West Virginia Economic Development Authority, Appalachian Power Co.—Series A
0.910%, 02/01/2036
(Putable on 11/03/2016) (a) | | | 24,000,000 | |
| Wisconsin—0.6% | | | | |
| | 2,165,000 | | | City of Baraboo, Industrial Development Revenue, Series 2007, Teel Plastics, Inc. Project (LOC: BMO Harris Bank N.A.)
1.250%, 11/01/2042
(Putable on 11/03/2016) (a) | | | 2,165,000 | |
| | 1,675,000 | | | Mequon Industrial Development Revenue, SPI Lighting (LOC: BMO Harris Bank N.A.)
1.250%, 12/01/2023
(Putable on 11/03/2016) (a) | | | 1,675,000 | |
| | 475,000 | | | Milwaukee Redevelopment Authority, Kubin Nicholson Corp. Project—Series A
(LOC: BMO Harris Bank N.A.)
1.250%, 08/01/2020
(Putable on 11/03/2016) (a) | | | 475,000 | |
| | 2,610,000 | | | Village of Menomonee Falls Industrial Development Revenue, AJ Die-Namics Project (LOC: BMO Harris Bank N.A.)
1.250%, 11/01/2036
(Putable on 11/03/2016) (a) | | | 2,610,000 | |
The accompanying notes are an integral part of these financial statements.
59
Alpine Ultra Short Municipal Income Fund
Schedule of Portfolio Investments—Continued
October 31, 2016
Principal
Amount | | | Security
Description | | Value | |
| | | | | | | |
| Municipal Bonds—continued | | |
| Wisconsin—continued | | | |
| $ | 250,000 | | | Wisconsin State Health & Educational Facilities, Community Care, Inc. (LOC: Bank Of Montreal)
1.250%, 09/01/2032
(Putable on 11/03/2016) (a) | | $ | 250,000 | |
| | | | | | | | 7,175,000 | |
| Wyoming-0.3% | | | |
| | 2,855,000 | | | Gillette Environmental Improvement Revenue, Black Hills Power and Light Co.—Series A
0.790%, 06/01/2024
(Putable on 11/02/2016) (a) | | | 2,855,000 | |
| | | | | Total Municipal Bonds
(Cost $1,135,702,918) | | | 1,135,696,640 | |
| Shares | | | Security
Description | | Value | |
| | | | | | | |
| Money Market Funds—0.0% (b) | | | |
| $ | 51,029 | | | BlackRock Liquidity Funds MuniCash Portfolio, Institutional Shares, 0.46% | | $ | 51,029 | |
| | | | | Total Money Market Funds
(Cost $51,034) | | | 51,029 | |
Total Investments
(Cost $1,135,753,952) (d)—102.1% | | 1,135,747,669 | |
| Liabilities in Excess of Other Assets—(2.1)% | | (23,645,555 | ) |
| TOTAL NET ASSETS 100.0% | $ | 1,112,102,114 | |
Percentages are stated as a percent of net assets.
| (a) | Variable Rate Security—The rate reported is the rate in effect as of October 31, 2016. |
| (b) | Amount is less than 0.05%. |
| (c) | Restricted under Rule 144A of the Securities Act of 1933. These securities may be resold in transactions exempt from registration, normally to qualified institutional buyers. These securities have been determined to be liquid under guidelines established by the Board of Trustees. Liquid securities restricted under Rule 144A comprised 10.7% of the Fund’s net assets. |
| (d) | See Note 7 for the cost of investments for federal tax purposes. |
AGM—Assured Guaranty Municipal Corp.
AMBAC—American Municipal Bond Assurance Corp.
ARN—Auction Rate Note
CS—Credit Support
CSP—Continental Structural Plastics
LIQ FAC—Liquidity Facility
LOC—Line of Credit
MUNIPSA—SIFMA Municipal Swap Index Yield Analysis
NA—North America
NATL—RE-Reinsurance provided by National Public Finance Guarantee Corp.
SPA—Standby Purchase Agreement
The accompanying notes are an integral part of these financial statements.
60
Alpine High Yield Managed Duration Municipal Fund
Schedule of Portfolio Investments
October 31, 2016
Principal
Amount | | | Security
Description | | Value | |
| | | | | | | | | |
| Municipal Bonds-103.8% | | | | |
| Alabama—3.8% | | | | |
| $ | 750,000 | | | Alabama Industrial Development Solid Waste Disposal Revenue (CS: OfficeMax, Inc.)
6.450%, 12/01/2023 | | $ | 751,252 | |
| | 500,000 | | | Alabama Special Care Facilities Financing Authority-Birmingham Revenue, Methodist Homes for the Aging—Series 2015-1
5.250%, 06/01/2025 | | | 561,205 | |
| | 45,000 | | | City of Jemison AL Water & Sewer—Series A
3.000%, 03/01/2017 | | | 45,096 | |
| | 50,000 | | | City of Jemison AL Water & Sewer—Series A
3.000%, 03/01/2018 | | | 50,311 | |
| | 50,000 | | | City of Jemison AL Water & Sewer—Series A
3.000%, 03/01/2019 | | | 50,302 | |
| | 50,000 | | | City of Jemison AL Water & Sewer—Series A
3.000%, 03/01/2020 | | | 50,204 | |
| | 50,000 | | | City of Jemison AL Water & Sewer—Series A
3.000%, 03/01/2021 | | | 50,019 | |
| | 290,000 | | | City of Jemison AL Water & Sewer—Series A
3.500%, 03/01/2026 | | | 288,390 | |
| | 850,000 | | | Health Care Authority for Baptist Health Revenue—Series D
5.000%, 11/15/2021 | | | 852,915 | |
| | 2,855,000 | | | Jefferson County Ltd. Obligation School Warrants—Series A
4.750%, 01/01/2025 | | | 2,878,953 | |
| | 250,000 | | | Jefferson County Ltd. Obligation School Warrants—Series A
5.250%, 01/01/2017 | | | 253,817 | |
| | 160,000 | | | Jefferson County, Capital Improvement Warrants—Series A (CS: NATL-RE)
5.000%, 04/01/2023 | | | 162,946 | |
| | 65,000 | | | Jemison Public Building Authority, Municipal Projects—Series B
3.000%, 03/01/2017 | | | 65,176 | |
| | 65,000 | | | Jemison Public Building Authority, Municipal Projects—Series B
3.000%, 03/01/2018 | | | 65,625 | |
| | 70,000 | | | Jemison Public Building Authority, Municipal Projects—Series B
3.000%, 03/01/2019 | | | 70,912 | |
| | 70,000 | | | Jemison Public Building Authority, Municipal Projects—Series B
3.000%, 03/01/2020 | | | 70,885 | |
| | 70,000 | | | Jemison Public Building Authority, Municipal Projects—Series B
3.000%, 03/01/2021 | | | 70,708 | |
| | 400,000 | | | Jemison Public Building Authority, Municipal Projects—Series B
3.500%, 03/01/2026 | | | 406,788 | |
Principal
Amount | | | Security
Description | | Value | |
| | | | | | | | | |
| Municipal Bonds—continued | | | | |
| Alabama—continued | | | | |
| $ | 445,000 | | | Selma Industrial Development Board Revenue, Zilkha Biomass Selma LLC Project
7.500%, 05/01/2025 (a) | | $ | 445,552 | |
| | | | | | | | 7,191,056 | |
| Arizona—2.9% | | | | |
| | 640,000 | | | Glendale Industrial Development Authority; Glencroft Retirementbligation
4.250%, 11/15/2026 | | | 628,704 | |
| | 225,000 | | | Industrial Development Authority of the City of Phoenix Revenue, Freedom Academy, Inc. (CS: Freedom Academy, Inc.)
3.875%, 07/01/2021 (a) | | | 225,706 | |
| | 725,000 | | | La Paz County Industrial Development Authority Revenue, Charter School Solutions- Harmony Public School Project—Series A
5.000%, 02/15/2021 (a) | | | 791,685 | |
| | 500,000 | | | La Paz County Industrial Development Authority Revenue, Charter School Solutions-Harmony Public School Project—Series A
5.000%, 02/15/2026 (a) | | | 565,760 | |
| | 500,000 | | | Maricopa County Industrial Development, Paradise Schools Project
2.875%, 07/01/2021 (a) | | | 499,445 | |
| | 1,250,000 | | | Maricopa County Industrial Development, Paradise Schools Project
4.000%, 07/01/2026 (a) | | | 1,286,325 | |
| | 1,000,000 | | | Mohave County Industrial Development Authority, Prison LLC Expansion Project (CS: Mohave Prison LLC)
8.000%, 05/01/2025 | | | 1,000,000 | |
| | 200,000 | | | Phoenix Industrial Development Authority, AZ GFF Tiyan LLC (Guam annual appropriation)
5.000%, 02/01/2018 | | | 204,830 | |
| | 175,000 | | | Phoenix Industrial Development Authority, Basis School, Inc.
3.000%, 07/01/2020 (a) | | | 176,815 | |
| | 145,000 | | | Phoenix Industrial Development Authority, Legacy Traditional Schools Project—Series A
4.750%, 07/01/2019 (a) | | | 151,244 | |
| | | | | | | | 5,530,514 | |
| California—6.4% | | | | |
| | 250,000 | | | California Municipal Finance Authority, Julian Charter School Project—Series A
5.000%, 03/01/2025 (a) | | | 259,465 | |
| | 2,500,000 | | | California School Finance Authority, Ocean Charter School
6.000%, 01/01/2019 (a) | | | 2,500,250 | |
The accompanying notes are an integral part of these financial statements.
61
Alpine High Yield Managed Duration Municipal Fund
Schedule of Portfolio Investments—Continued
October 31, 2016
Principal
Amount | | | Security
Description | | Value | |
| | | | | | | | | |
| Municipal Bonds—continued | | | | |
| California—continued | | | | |
| $ | 450,000 | | | City of Roseville, HP Campus Oaks, Community Facilities District
4.000%, 09/01/2026 | | $ | 452,893 | |
| | 180,000 | | | Inland Empire Tobacco Securitization Authority, Tobacco Settlement—Series A
4.625%, 06/01/2021 | | | 180,826 | |
| | 140,000 | | | Inland Empire Tobacco Securitization Authority, Tobacco Settlement—Series A
5.000%, 06/01/2021 | | | 140,676 | |
| | 1,175,000 | | | Palomar Pomerado Health Care—Series A, ARN (CS: Assured Guaranty Municipal)
1.740%, 11/01/2036
(Putable on 11/01/2016) (b) | | | 1,175,000 | |
| | 2,700,000 | | | Palomar Pomerado Health Care—Series B, ARN (CS: Assured Guaranty Municipal)
1.730%, 11/01/2036
(Putable on 11/02/2016) (b) | | | 2,700,000 | |
| | 1,250,000 | | | Palomar Pomerado Health Care—Series C, ARN (CS: Assured Guaranty Municipal)
1.750%, 11/01/2036
(Putable on 11/03/2016) (b) | | | 1,250,000 | |
| | 2,520,000 | | | Riverside County Industrial Development Authority, Universal Forest Products (LOC: JPMorgan Chase Bank NA)
0.750%, 08/01/2029
(Putable on 11/03/2016) (b) | | | 2,520,000 | |
| | 985,000 | | | Tobacco Securitization Authority of Northern California Revenue—Series A-2
5.400%, 06/01/2027 | | | 996,259 | |
| | | | | | | | 12,175,369 | |
| Colorado—1.5% | | | | |
| | 110,000 | | | Colorado Health Facilities Authority, Covenant Retirement Communities, Inc.—Series B
3.150%, 12/01/2018 | | | 110,152 | |
| | 1,265,000 | | | Colorado Housing & Finance Authority Economic Development, Pacific Instruments Project (LOC: Wells Fargo Bank N.A.)
0.800%, 08/01/2020
(Putable on 11/03/2016) (b) | | | 1,265,000 | |
| | 805,000 | | | Denver Convention Center Hotel Authority
5.000%, 12/01/2024 | | | 949,208 | |
| | 500,000 | | | Lambertson Farms Metropolitan District No. 1, General Obligation
5.000%, 12/15/2025 | | | 505,510 | |
| | | | | | | | 2,829,870 | |
Principal
Amount | | | Security
Description | | Value | |
| | | | | | | | | |
| Municipal Bonds—continued | | | | |
| Connecticut—1.6% | | | | |
| $ | 1,000,000 | | | Connecticut State Health & Educational Facility, Church Home Of Hartford, Inc. Project (CS: Church Home of Hartford)
2.875%, 09/01/2020 (a) | | $ | 1,004,340 | |
| | 1,400,000 | | | Connecticut State Health & Educational Facility, Church Home Of Hartford, Inc. Project—Series B-1 (CS: Church Home of Hartford)
3.250%, 09/01/2021 (a) | | | 1,414,518 | |
| | 500,000 | | | Mohegan Tribe of Indians of Connecticut Revenue—Series C
4.750%, 02/01/2020 (a) | | | 501,725 | |
| | | | | | | | 2,920,583 | |
| Delaware—2.8% | | | | |
| | 5,300,000 | | | Delaware New County Castle Revenue, Airport Facility, FlightSafety International, Inc. Project.—Series 2002 (CS: Berkshire Hathaway, Inc.)
0.630%, 06/01/2022
(Putable on 11/03/2016) (b) | | | 5,300,000 | |
| District of Columbia—0.5% | | | | |
| | 250,000 | | | District of Columbia Revenue, National Law Enforcement Officers Memorial Fund, Inc.—Series B
5.750%, 07/01/2025 | | | 250,593 | |
| | 475,000 | | | District of Columbia, Howard University—Series A
5.250%, 10/01/2022 | | | 511,912 | |
| | 240,000 | | | District of Columbia, Methodist Home
4.500%, 01/01/2025 | | | 244,752 | |
| | | | | | | | 1,007,257 | |
| Florida—1.7% | | | | |
| | 250,000 | | | Capital Trust Agency, Inc. Revenue, First Mortgage Revenue-Silver Creek St. Augustine Project—Series A
6.500%, 01/01/2024 | | | 214,540 | |
| | 170,000 | | | Capital Trust Agency, Inc. Revenue, River City Education Services, Inc. Project—Series A
4.625%, 02/01/2025 | | | 173,317 | |
| | 100,000 | | | Celebration Pointe Community Development District No.1, Special Assessment Revenue
4.750%, 05/01/2024 | | | 103,180 | |
| | 200,000 | | | City of Atlantic Beach, Health Care Facilities Revenue Naval CCRC—Series A
5.000%, 11/15/2021 | | | 226,440 | |
| | 200,000 | | | City Of Tampa, Solid Waste System Revenue
5.000%, 10/01/2020 | | | 223,822 | |
The accompanying notes are an integral part of these financial statements.
62
Alpine High Yield Managed Duration Municipal Fund
Schedule of Portfolio Investments—Continued
October 31, 2016
Principal
Amount | | | Security
Description | | Value | |
| | | | | | | | | |
| Municipal Bonds—continued | | | | |
| Florida—continued | | | | |
| $ | 300,000 | | | Collier County Industrial Development Authority CCRC, Arlington of Naples Project—Series B-1
6.875%, 05/15/2021 (a) | | $ | 301,398 | |
| | 340,000 | | | Florida Development Finance Corp. Revenue, Tuscan Isle Champions Gate Project—Series A6.000%,
06/01/2030 (a) | | | 347,681 | |
| | 100,000 | | | Florida Development Finance Corp., Educational Facilities Revenue Bonds, Miami Arts Charter School Project—Series A
5.000%, 06/15/2024 (a) | | | 102,412 | |
| | 700,000 | | | Liberty County, Industrial Development, Georgia Pacific Corp. Project
0.830%, 10/01/2028
(Putable on 11/03/2016) (b) | | | 700,000 | |
| | 290,000 | | | State Development Finance Corp. Revenue, Tuscan Isle Obligated Group—Series A
6.500%, 06/01/2025 (a) | | | 307,820 | |
| | 75,000 | | | Village Community Development District #11, Special Assessment Revenue
3.250%, 05/01/2019 | | | 75,220 | |
| | 500,000 | | | Village Community Development District #12, Special Assessment Revenue
2.875%, 05/01/2021 | | | 497,805 | |
| | | | | | | | 3,273,635 | |
| Georgia—3.2% | | | | |
| | 997,000 | | | Georgia Local Government, Certificate Participation—Series A
4.750%, 06/01/2028 | | | 1,111,755 | |
| | 5,000,000 | | | Walker County, Tax Anticipation Notes General Obligation
4.250%, 12/30/2016 | | | 4,998,750 | |
| | | | | | | | 6,110,505 | |
| Guam—0.4% | | | | |
| | 250,000 | | | Guam International Airport Authority—Series C
5.000%, 10/01/2021 | | | 277,555 | |
| | 200,000 | | | Territory of Guam—Series A
2.000%, 12/01/2016 | | | 200,148 | |
| | 200,000 | | | Territory of Guam—Series A
5.000%, 12/01/2017 | | | 207,608 | |
| | | | | | | | 685,311 | |
| Idaho—0.7% | | | | |
| | 120,000 | | | Idaho Health Facilities Authority, The Terraces Boise Project—Series B-2
6.000%, 10/01/2021 | | | 120,152 | |
Principal
Amount | | | Security
Description | | Value | |
| | | | | | | | | |
| Municipal Bonds—continued | | | | |
| Idaho—continued | | | | |
| $ | 900,000 | | | Idaho Housing & Finance Association; Idaho Arts Charter School—Series A
4.000%, 12/01/2026 | | $ | 948,483 | |
| | 200,000 | | | Idaho Housing & Finance Association; Victory Charter School—Series A
4.000%, 07/01/2026 | | | 210,816 | |
| | | | | | | | 1,279,451 | |
| Illinois—6.9% | | | | |
| | 100,000 | | | Chicago Board of Education—Series A
5.500%, 12/01/2018 | | | 103,241 | |
| | 155,000 | | | Chicago Board of Education, Dedicated Revenues (CS: Assured Guaranty Municipal)
5.000%, 12/01/2022 | | | 158,791 | |
| | 225,000 | | | Chicago Board of Education, General Obligation—Series A (CS: NATL-RE)
5.000%, 12/01/2020 | | | 227,855 | |
| | 100,000 | | | Chicago Board of Education, General Obligation—Series A (CS: NATL-RE)
5.000%, 12/01/2021 | | | 100,333 | |
| | 75,000 | | | Chicago Board of Education, General Obligation—Series A (CS: NATL-RE)
5.250%, 12/01/2018 | | | 79,337 | |
| | 725,000 | | | Chicago Board of Education, General Obligation—Series A (CS: NATL-RE)
5.250%, 12/01/2019 | | | 731,075 | |
| | 500,000 | | | Chicago Board of Education, General Obligation—Series B (CS: Assured Guaranty Municipal)
5.000%, 12/01/2016 | | | 501,685 | |
| | 200,000 | | | Chicago Board of Education, Refunding—Series G 4.630%, (MUNIPSA*1 +
400,000 bps) 03/01/2032
(Putable on 11/03/2016) (b) | | | 199,840 | |
| | 150,000 | | | City of Chicago—Series A
4.000%, 01/01/2019 | | | 151,356 | |
| | 210,000 | | | City of Chicago—Series A
4.000%, 01/01/2020 | | | 211,176 | |
| | 100,000 | | | City of Chicago, General Obligation (CS: AMBAC)
5.000%, 12/01/2024 | | | 100,238 | |
| | 135,000 | | | City of Chicago, General Obligation—Series A
5.000%, 01/01/2018 | | | 137,696 | |
| | 10,000 | | | City of Chicago, General Obligation—Series A (CS: Assured Guaranty Municipal)
5.000%, 01/01/2023 | | | 10,034 | |
The accompanying notes are an integral part of these financial statements.
63
Alpine High Yield Managed Duration Municipal Fund
Schedule of Portfolio Investments—Continued
October 31, 2016
Principal
Amount | | | Security
Description | | Value | |
| | | | | | | | | |
| Municipal Bonds—continued | | | | |
| Illinois—continued | | | | |
| $ | 70,000 | | | City of Chicago, General Obligation—Series B (CS: Assured Guaranty Municipal)
5.000%, 01/01/2018 | | $ | 71,242 | |
| | 40,000 | | | City of Chicago, General Obligation—Series B (CS: Assured Guaranty Municipal)
5.000%, 01/01/2026 | | | 40,138 | |
| | 1,000,000 | | | City of Chicago, General Obligation—Series B (CS: Assured Guaranty Municipal)
5.000%, 01/01/2027 | | | 1,012,930 | |
| | 600,000 | | | Cook County School District No. 144, Prairie Hills—Series A
4.000%, 12/01/2033 | | | 616,830 | |
| | 310,000 | | | Illinois Finance Authority Educational Facility Revenue, Senior Rogers Park Montessori School Project
5.000%, 02/01/2024 | | | 321,827 | |
| | 685,000 | | | Illinois Finance Authority Revenue, Refunding Christian Homes (CS: Christian Homes, Inc. Obligation)
5.000%, 05/15/2031 | | | 766,494 | |
| | 440,000 | | | Illinois Finance Authority, Belmont School Project
4.500%, 12/01/2020 (a) | | | 447,194 | |
| | 350,000 | | | Illinois Finance, Riverside Health System
4.000%, 11/15/2034 | | | 363,493 | |
| | 635,000 | | | Macon & De Witt Counties Community Unit School District No. 2 Maroa-Forsyth, General Obligation
4.500%, 10/01/2018 | | | 643,217 | |
| | 150,000 | | | Southwestern Development Authority, Memorial Group, Inc.
5.750%, 11/01/2019 | | | 165,888 | |
| | 745,000 | | | State of Illinois, General Obligation (INS. Assured Guaranty)
4.000%, 02/01/2030 | | | 746,833 | |
| | 740,000 | | | State of Illinois, General Obligation
5.000%, 02/01/2020 | | | 790,128 | |
| | 700,000 | | | State of Illinois, General Obligation (CS: AMBAC)
5.000%, 04/01/2021 | | | 702,415 | |
| | 100,000 | | | State of Illinois, General Obligation (CS: AMBAC)
5.000%, 11/01/2024 | | | 100,345 | |
| | 380,000 | | | State of Illinois, General Obligation—Series A
5.000%, 03/01/2017 | | | 381,227 | |
Principal
Amount | | | Security
Description | | Value | |
| | | | | | | | | |
| Municipal Bonds—continued | | | | |
| Illinois—continued | | | | |
| $ | 50,000 | | | State of Illinois, General Obligation Refunding Bond
5.000%, 08/01/2021 | | $ | 54,459 | |
| | 180,000 | | | Stephenson County Revenue (CS: AMBAC)
4.500%, 12/01/2020 | | | 185,749 | |
| | 900,000 | | | United City of Yorkville, Special Service NO. 04-104-MPI Grande Reserve Project
6.375%, 03/01/2034 | | | 891,558 | |
| | 1,540,000 | | | Upper Illinois River Valley Development, Cathy Asta Enterprises
0.750%, 08/01/2033
(Putable on 11/03/2016) (b) | | | 1,540,000 | |
| | 245,000 | | | Village of Willow Springs—Series A
4.500%, 12/15/2022 | | | 244,978 | |
| | 285,000 | | | Village of Willow Springs—Series C
4.450%, 12/15/2021 | | | 284,974 | |
| | | | | | | | 13,084,576 | |
| Indiana—1.7% | | | | |
| | 100,000 | | | City of Anderson, Economic Development Revenue, Anderson University Project
5.000%, 10/01/2024 | | | 100,418 | |
| | 1,000,000 | | | City of Indianapolis Indiana Economic Development Refunding, Brookhaven At County Line Apartments Project.—Series A
6.250%, 07/01/2043 | | | 1,110,610 | |
| | 235,000 | | | City of Valparaiso Exempt Facilities Revenue, Pratt Paper LLC Project
5.875%, 01/01/2024 | | | 271,759 | |
| | 1,425,000 | | | Indiana Finance Authority Revenue, Private Activity OH River Bridge—Series B (CS: Wvb East End Partners LLC)
5.000%, 01/01/2019 | | | 1,433,892 | |
| | 225,000 | | | Indiana Finance Authority, King’s Daughters Hospital & Health Services
5.000%, 08/15/2020 | | | 247,860 | |
| | 50,000 | | | Indiana Finance Authority, United States Steel Corp.
6.000%, 12/01/2019 | | | 50,305 | |
| | | | | | | | 3,214,844 | |
| Iowa—0.2% | | | | |
| | 430,000 | | | Iowa Higher Education Loan Authority, Wartburg College Project
2.500%, 10/01/2020 | | | 428,723 | |
| Kansas—1.9% | | | | |
| | 1,040,000 | | | Kansas Independent College Finance Authority, Anticipation Notes, Bethany College—Series A
6.950%, 05/01/2017 (a) | | | 1,043,942 | |
The accompanying notes are an integral part of these financial statements.
64
Alpine High Yield Managed Duration Municipal Fund
Schedule of Portfolio Investments—Continued
October 31, 2016
Principal
Amount | | | Security
Description | | Value | |
| | | | | | | | | |
| Municipal Bonds—continued | | | | |
| Kansas—continued | | | | |
| $ | 200,000 | | | Kansas Independent College Finance Authority, Anticipation Notes, Bethel College—Series D
4.050%, 05/01/2017 | | $ | 200,822 | |
| | 1,600,000 | | | Kansas Independent College Finance Authority, Anticipation Notes, Ottawa University—Series C
4.900%, 05/01/2017 | | | 1,606,352 | |
| | 235,000 | | | Overland Park Development Corp. Revenue, Second Tier Convention Center Hotel—Series B (CS: AMBAC)
5.125%, 01/01/2022 | | | 236,003 | |
| | 520,000 | | | Wichita Airport Authority, FlightSafety International, Inc.— Series A (CS: Berkshire Hathaway, Inc.)
0.630%, 11/01/2031
(Putable on 11/03/2016) (b) | | | 520,000 | |
| | | | | | | | 3,607,119 | |
| Kentucky—2.0% | | | | |
| | 700,000 | | | Kenton County Airport Board, Special Facilities , FlightSafety International, Inc. Project—Series A (CS: Berkshire Hathaway, Inc.)
0.630%, 06/01/2021
(Putable on 11/03/2016) (b) | | | 700,000 | |
| | 1,000,000 | | | Kentucky Economic Development Finance Authority, Baptist Life Community Project—Series S
5.500%, 11/15/2027 | | | 1,008,550 | |
| | 500,000 | | | Kentucky Economic Development Finance Authority, Temps-85, Masonic Home Independent
3.250%, 05/15/2022 | | | 499,240 | |
| | 1,500,000 | | | Ohio County Revenue, Big Rivers Electric Project—Series A (CS: Big Rivers Electric Corp.)
6.000%, 07/15/2031 | | | 1,582,590 | |
| | | | | | | | 3,790,380 | |
| Louisiana—0.3% | | | | |
| | 250,000 | | | Louisiana Local Government Environmental Facilities & Community Development Authority, St James Place of Baton Rouge—Series A
5.500%, 11/15/2025 | | | 266,920 | |
| | 250,000 | | | Parish of St. Charles, Gulf Opportunity Zone Revenue, Valero Energy Corp.
4.000%, 12/01/2040
(Putable on 06/01/2022) (b) | | | 275,153 | |
| | | | | | | | 542,073 | |
| Maryland—1.4% | | | | |
| | 110,000 | | | Anne Arundel County, Consolidated Special Taxing District Bonds, Villages at Two Rivers Project
4.200%, 07/01/2024 | | | 113,265 | |
Principal
Amount | | | Security
Description | | Value | |
| | | | | | | | | |
| Municipal Bonds—continued | | | | |
| Maryland—continued | | | | |
| $ | 500,000 | | | City of Westminster, Lutheran Village at Miller’s Grant, Inc.—Series C
4.375%, 07/01/2021 | | $ | 515,170 | |
| | 500,000 | | | City of Westminster, Lutheran Village at Miller’s Grant, Inc.—Series D
3.875%, 07/01/2019 | | | 509,170 | |
| | 1,445,000 | | | Maryland Economic Development Corp., CNX Marine Terminal, Inc.
5.750%, 09/01/2025 | | | 1,465,331 | |
| | | | | | | | 2,602,936 | |
| Massachusetts—1.2% | | | | |
| | 1,500,000 | | | Massachusetts Development Finance Agency, UMass Boston Student Housing Project; Provident Commonwealth Education Resource
5.000%, 10/01/2024 | | | 1,769,550 | |
| | 450,000 | | | Massachusetts Port Authority Facilities Revenue, Delta Air Lines, Inc. Project—Series A (CS: AMBAC)
5.000%, 01/01/2021 | | | 455,836 | |
| | 30,000 | | | Massachusetts Port Authority Facilities Revenue, Delta Air Lines, Inc. Project—Series A (CS: AMBAC)
5.500%, 01/01/2017 | | | 30,116 | |
| | 50,000 | | | Massachusetts Port Authority Facilities Revenue, Delta Air Lines, Inc. Project—Series A (CS: AMBAC)
5.500%, 01/01/2022 | | | 50,143 | |
| | | | | | | | 2,305,645 | |
| Michigan—2.6% | | | | |
| | 500,000 | | | Calhoun County Hospital Finance Authority Refunding Bonds, Oaklawn Hospital
5.000%, 02/15/2024 | | | 561,145 | |
| | 115,000 | | | Charyl Stockwell Academy Revenue
4.875%, 10/01/2023 | | | 116,646 | |
| | 385,000 | | | Jackson College Dormitories, College Housing Revenue
5.000%, 05/01/2021 | | | 400,731 | |
| | 1,000,000 | | | Michigan Municipal Bond Authority, Local Government Public Improvement—Series A (CS: AMBAC)
5.000%, 12/01/2018 | | | 1,014,150 | |
| | 1,255,000 | | | Michigan State Hospital Finance, Henry Ford Health System—Series A
5.250%, 11/15/2046 | | | 1,256,945 | |
| | 790,000 | | | Michigan Strategic Fund Revenue, Genesee Power Station Project
7.500%, 01/01/2021 | | | 784,344 | |
The accompanying notes are an integral part of these financial statements.
65
Alpine High Yield Managed Duration Municipal Fund
Schedule of Portfolio Investments—Continued
October 31, 2016
Principal
Amount | | | Security
Description | | Value | |
| | | | | | | | | |
| Municipal Bonds—continued | | | | |
| Michigan—continued | | | | |
| $ | 200,000 | | | Michigan Strategic Fund Revenue, United Methodist Retirement Communities, Inc. Project
5.125%, 11/15/2025 | | $ | 206,006 | |
| | 615,000 | | | Michigan Tobacco Settlement Finance
Authority—Series A
5.125%, 06/01/2022 | | | 608,665 | |
| | | | | | | | 4,948,632 | |
| Minnesota—3.2% | | | | |
| | 540,000 | | | City of Blaine Revenue, Crest V iew Senior Community Project—Series A
5.125%, 07/01/2025 | | | 567,119 | |
| | 145,000 | | | City of Hugo, Charter School Lease Revenue, Noble Academy Project—Series A
4.000%, 07/01/2020 | | | 152,093 | |
| | 200,000 | | | City of International Falls Revenue, Boise Cascade Corp. Project (CS: Officemax, Inc.)
5.650%, 12/01/2022 | | | 200,754 | |
| | 300,000 | | | City of Oak Park Heights, Nursing Home Revenue, Boutwells Landing Care Center Project
4.000%, 02/01/2020 | | | 310,515 | |
| | 4,245,000 | | | Minnesota Housing Finance Agency, Residential Housing—Series S (SPA: Wells Fargo Bank NA)
0.650%, 07/01/2038
(Putable on 11/03/2016) (b) | | | 4,245,000 | |
| | 495,000 | | | Rice County Revenue, St. Mary’s School—Series A
5.000%, 08/01/2022 (a) | | | 532,427 | |
| | | | | | | | 6,007,908 | |
| Mississippi—3.0% | | | | |
| | 570,000 | | | Mississippi Business Finance Corp., Northrop Grumman Ship System
4.550%, 12/01/2028 | | | 571,134 | |
| | 5,000,000 | | | Mississippi Business Finance Corp., PSL-North America LLC Project—Series A (LOC: ICICI Bank)
3.220%, 11/01/2032
(Putable on 11/03/2016) (b) | | | 5,000,000 | |
| | | | | | | | 5,571,134 | |
| Missouri—1.5% | | | | |
| | 250,000 | | | Saint Louis County Industrial Development Authority, Nazareth Living Center—Series B
3.850%, 08/15/2020 | | | 250,125 | |
| | 555,000 | | | Saint Louis County Missouri Industrial Development Authority Refunding And Improvement; Ranken-Jordan Pediatric Sp
4.000%, 11/15/2021 | | | 583,660 | |
Principal
Amount | | | Security
Description | | Value | |
| | | | | | | | | |
| Municipal Bonds—continued | | | | |
| Missouri—continued | | | | |
| $ | 625,000 | | | Saint Louis County Missouri Industrial Development Authority Refunding And Improvement; Ranken-Jordan Pediatric Sp
5.000%, 11/15/2022 | | $ | 689,881 | |
| | 350,000 | | | Saint Louis County Missouri Industrial Development Authority Refunding And Improvement; Ranken-Jordan Pediatric Sp
5.000%, 11/15/2023 | | | 388,000 | |
| | 1,000,000 | | | State Louis County Industrial Development Authority, St. Andrews Resources for Seniors Obligated Group—Series B
3.125%, 12/01/2019 | | | 1,001,990 | |
| | | | | | | | 2,913,656 | |
| Nevada—0.1% | | | | |
| | 250,000 | | | City of North Las Vegas, Refunding Bonds, Water and Sewer System—Series B (CS: AMBAC)
4.000%, 08/01/2017 | | | 250,088 | |
| New Hampshire—0.1% |
| | 250,000 | | | New Hampshire Business Finance Authority, Casella Waste Systems, Inc. Project
4.000%, 04/01/2029
(Putable on 10/01/2019) (a)(b) | | | 246,283 | |
| New Jersey—1.8% | | | | |
| | 415,000 | | | Atlantic City Municipal Utilities Authority, Refunding Water System—Series 2007 (CS: AMBAC)
4.000%, 06/01/2018 | | | 414,361 | |
| | 540,000 | | | New Jersey Economic Development Authority Revenue, Continental Airlines, Inc. Project (CS: United Airlines, Inc.)
4.875%, 09/15/2019 | | | 571,163 | |
| | 100,000 | | | New Jersey Economic Development Authority, Charter School Revenue, Greater Brunswick Charter School Project—Series A
4.750%, 08/01/2024 (a) | | | 104,135 | |
| | 500,000 | | | New Jersey Economic Development Authority, Lions Gate Project—Series 2014
4.375%, 01/01/2024 | | | 529,110 | |
| | 125,000 | | | New Jersey Economic Development Authority, Private Activity—The Goethals Bridge Replacement Project
5.250%, 01/01/2025 | | | 145,271 | |
The accompanying notes are an integral part of these financial statements.
66
Alpine High Yield Managed Duration Municipal Fund
Schedule of Portfolio Investments—Continued
October 31, 2016
| Shares | | | Security
Description | | Value | |
| | | | | | | | | |
| Municipal Bonds—continued | | | | |
| New Jersey—contimnued | | | | |
| $ | 55,000 | | | New Jersey Economic Development Authority, United Airlines, Inc. Project
5.500%, 04/01/2028 | | $ | 55,193 | |
| | 420,000 | | | New Jersey Tobacco Settlement Financing Corp. Revenue—Series A
4.500%, 06/01/2023 | | | 427,535 | |
| | 1,000,000 | | | New Jersey Transportation Trust Fund Authority, FED Highway Reimbursement Notes
5.000%, 06/15/2024 | | | 1,044,210 | |
| | 5,000 | | | Tobacco Settlement Financing Corp. Revenue—Series 1-A
4.625%, 06/01/2026 | | | 5,021 | |
| | | | | | | | 3,295,999 | |
| New Mexico—0.0% (c) | | | | |
| | 40,000 | | | City of Albuquerque, Karsten Co.—Series A (LOC: U.S. Bank N.A.)
3.000%, 12/01/2017
(Putable on 11/03/2016) (b) | | | 40,000 | |
| | 15,000 | | | City of Albuquerque, Karsten Co.—Series B
3.000%, 12/01/2017
(Putable on 11/03/2016) (b) | | | 15,000 | |
| | | | | | | | 55,000 | |
| New York—9.8% | | | | |
| | 1,680,000 | | | City of Poughkeepsie, Bond Anticipation Notes, General Obligation—Series A
3.750%, 05/07/2017 | | | 1,686,552 | |
| | 1,150,000 | | | Nassau County Tobacco Settlement Corp. Revenue, Asset Brookfield—Series A-2
5.250%, 06/01/2026
(Putable on 05/31/2026) | | | 1,150,518 | |
| | 3,100,000 | | | New York City Municipal Water Finance Authority, Water and Sewer System (SPA: Dexia Credit Local)
0.730%, 06/15/2032
(Putable on 11/01/2016) (b) | | | 3,100,000 | |
| | 300,000 | | | New York State Dormitory Authority, Orange Regional Medical Center
6.000%, 12/01/2016 | | | 301,152 | |
| | 445,000 | | | New York State Dormitory Authority, Touro College And University—Series A
4.000%, 01/01/2023 | | | 468,567 | |
| | 15,000 | | | New York State Dormitory Authority, Yeshiva University (CS: Yeshiva University)
5.000%, 09/01/2017 | | | 15,420 | |
| | 440,000 | | | New York State Dormitory Authority, Yeshiva University—Series A
5.000%, 11/01/2018 | | | 465,629 | |
| Shares | | | Security
Description | | Value | |
| | | | | | | | | |
| Municipal Bonds—continued | | | | |
| New York—continued | | | | |
| $ | 95,000 | | | New York State Dormitory Authority, Yeshiva University—Series A (CS: Yeshiva University)
5.000%, 11/01/2019 | | $ | 101,160 | |
| | 1,600,000 | | | New York State Housing Finance Agency, HSG-605 West 42nd Street Owner LLC
0.720%, 05/01/2048
(Putable on 11/01/2016) (b) | | | 1,600,000 | |
| | 500,000 | | | New York Transportation Development Corp., American Airlines, Inc.
5.000%, 08/01/2018 | | | 525,705 | |
| | 1,000,000 | | | New York Transportation Development Corp., American Airlines, Inc.
5.000%, 08/01/2020 | | | 1,096,870 | |
| | 500,000 | | | New York Transportation Development Corp., American Airlines, Inc.
5.000%, 08/01/2031 | | | 535,205 | |
| | 100,000 | | | Onondaga Civic Development Corp., St Joseph’s Hospital Health Center Project—Series A
4.625%, 07/01/2022 | | | 109,605 | |
| | 100,000 | | | Onondaga Civic Development Corp., St Joseph’s Hospital Health Center Project—Series A
5.000%, 07/01/2019 | | | 107,870 | |
| | 115,000 | | | Suffolk Tobacco Asset Securitization Corp., General Obligation—Series A
5.000%, 06/01/2018 | | | 120,422 | |
| | 2,000,000 | | | Town of Oyster Bay, Bond Anticipation Notes General Obligation—Series C
4.000%, 06/01/2018 | | | 2,015,180 | |
| | 1,075,000 | | | Town of Oyster Bay, Bond Anticipation Notes, General Obligation—Series A
2.750%, 02/03/2017 | | | 1,075,462 | |
| | 675,000 | | | Town of Oyster Bay, General Obligation Public Improvement
3.000%, 08/15/2017 | | | 672,536 | |
| | 975,000 | | | Town of Oyster Bay, General Obligation Public Improvement—Series A
3.500%, 03/15/2017 | | | 975,653 | |
| | 300,000 | | | TSASC, Inc.—Series 1
5.000%, 06/01/2026 | | | 300,459 | |
| | 2,000,000 | | | Village of Johnson City, Bond Anticipation Notes
3.750%, 10/05/2017 | | | 2,014,680 | |
| | | | | | | | 18,438,645 | |
The accompanying notes are an integral part of these financial statements.
67
Alpine High Yield Managed Duration Municipal Fund
Schedule of Portfolio Investments—Continued
October 31, 2016
| Shares | | | Security
Description | | Value | |
| | | | | | | | | |
| Municipal Bonds—continued | | | | |
| North Carolina—0.2% | | | | |
| $ | 300,000 | | | Guilford County Industrial Facilities & Pollution Control Financing Authority, Industrial Development (LOC: Commerce Bank N.A.)
0.750%, 03/01/2022
(Putable on 11/03/2016) (b) | | $ | 300,000 | |
| North Dakota—0.4% | | | | |
| | 300,000 | | | City of Bowman, Southwest Healthcare Services Project, Revenue Anticipation Notes—Series A
2.500%, 02/15/2017 | | | 300,009 | |
| | 500,000 | | | City of Hazen Revenue, Sakakawea Medical Center Project
2.500%, 07/01/2017 | | | 499,990 | |
| | | | | | | | 799,999 | |
| Ohio—2.1% | | | | |
| | 910,000 | | | Buckeye Tobacco Settlement Financing Authority—Series A
5.125%, 06/01/2024 | | | 859,914 | |
| | 2,150,000 | | | Buckeye Tobacco Settlement Financing Authority—Series A-2
5.375%, 06/01/2024 | | | 2,071,546 | |
| | 400,000 | | | City of Cleveland, Airport Special Revenue, United Airlines, Inc.
5.375%, 09/15/2027 | | | 401,308 | |
| | 255,000 | | | Licking County Revenue, Kendal Granville Obligation Group—Series B
3.750%, 07/01/2020 | | | 255,273 | |
| | 200,000 | | | Ohio Air Quality Development Authority, AK Steel Corp. Project
6.750%, 06/01/2024 | | | 174,830 | |
| | 265,000 | | | Southeastern Ohio Port Authority, Memorial Health System
5.000%, 12/01/2016 | | | 265,596 | |
| | | | | | | | 4,028,467 | |
| Oklahoma—1.6% (c) | | | | |
| | 1,510,000 | | | Payne County Economic Development Authority, Epworth Living At The Ranch-SE (CS: White Woods Retirement)
4.750%, 11/01/2023 | | | 1,516,538 | |
| | 1,500,000 | | | Payne County Economic Development Authority, Epworth Living At The Ranch-SE (CS: White Woods Retirement)
5.250%, 11/01/2024 | | | 1,507,680 | |
| | | | | | | | 3,024,218 | |
| Oregon—0.1% | | | | |
| | 60,000 | | | Hospital Facilities Authority of Multnomah County Oregon, Mirabella At South Waterfront
Project—Series A
5.000%, 10/01/2019 | | | 63,676 | |
| Shares | | | Security
Description | | Value | |
| | | | | | | | | |
| Municipal Bonds—continued | | | | |
| Oregon—continued | | | | |
| $ | 100,000 | | | Hospital Facilities Authority of Multnomah County Oregon, Mirabella At South Waterfront
Project—Series A
5.000%, 10/01/2024 | | $ | 115,897 | |
| | | | | | | | 179,573 | |
| Pennsylvania—8.5% | | | | |
| | 2,890,000 | | | Allegheny County Industrial Development Authority, Environmental Improvement Revenue, United States Steel Corp.
5.500%, 11/01/2016 | | | 2,890,000 | |
| | 1,750,000 | | | Allegheny County Industrial Development Authority, Environmental Improvement Revenue, United States Steel Corp.
6.500%, 05/01/2017 | | | 1,766,485 | |
| | 325,000 | | | Chester County Health & Education Facilities Authority, Simpson Senior Services Project
5.000%, 12/01/2025 | | | 351,842 | |
| | 505,000 | | | Delaware County Authority Revenue, Eastern University (CS: Eastern University)
4.000%, 10/01/2019 | | | 515,711 | |
| | 1,605,000 | | | Delaware County Authority Revenue, Eastern University
5.000%, 10/01/2027 | | | 1,650,373 | |
| | 1,500,000 | | | Delaware County Industrial Development Authority, Chester Charter School Arts Project—Series A
5.000%, 06/01/2031 (a) | | | 1,517,010 | |
| | 560,000 | | | Emmaus General Authority (SPA: Wells
Fargo Bank N.A.)
0.650%, 12/01/2028
(Putable on 11/02/2016) (b) | | | 560,000 | |
| | 100,000 | | | Indiana County Hospital Authority, Regional Medical Center—Series A
5.000%, 06/01/2023 | | | 113,839 | |
| | 235,000 | | | Lancaster Industrial Development Authority, Davco Family—Series A (SPA: Fulton Bank)
1.000%, 01/15/2023
(Putable on 11/03/2016) (b) | | | 235,000 | |
| | 330,000 | | | Moon Industrial Development Authority, Baptist Homes Society Obligation
5.000%, 07/01/2020 | | | 350,120 | |
| | 1,400,000 | | | Pennsylvania Economic Development Financing Authority, Colver Project
5.000%, 12/01/2037
(Putable on 09/01/2020) (b) | | | 1,440,642 | |
The accompanying notes are an integral part of these financial statements.
68
Alpine High Yield Managed Duration Municipal Fund
Schedule of Portfolio Investments—Continued
October 31, 2016
| Shares | | | Security
Description | | Value | |
| | | | | | | | | |
| Municipal Bonds—continued | | | | |
| Pennsylvania—continued | | | | |
| $ | 695,000 | | | Philadelphia Authority for Industrial Development Revenue, Discovery Charter School Project (CS: Discovery Charter School)
5.000%, 04/01/2022 | | $ | 687,195 | |
| | 800,000 | | | Philadelphia Authority for Industrial Development Revenue, Kipp Philadelphia Charter School Project—Series A (CS: Kipp Philadelphia Charter)
4.000%, 04/01/2026 | | | 813,176 | |
| | 70,000 | | | Philadelphia Authority for Industrial Development, Discovery Charter School Project
4.000%, 04/01/2017 | | | 69,631 | |
| | 380,000 | | | Philadelphia Hospitals & Higher Education Facilities Authority, Refunding-Temple University Health System—Series B
5.500%, 07/01/2026 | | | 386,434 | |
| | 2,000,000 | | | Philadelphia School District—Series F
5.000%, 09/01/2024 | | | 2,304,500 | |
| | 135,000 | | | Pottsville Hospital Authority, Schuylkill Health System Project
5.250%, 07/01/2033 (a) | | | 145,048 | |
| | 200,000 | | | Pottsville Hospital Facilities Authority, Schuylkill Health System Project
5.750%, 07/01/2022 | | | 240,424 | |
| | | | | | | | 16,037,430 | |
| Puerto Rico—5.9% | | | | |
| | 210,000 | | | Commonwealth of Puerto Rico (CS: Assured Guaranty Municipal)
5.500%, 07/01/2018 | | | 220,181 | |
| | 3,290,000 | | | Commonwealth of Puerto Rico—Series A
(CS: NATL-RE)
5.500%, 07/01/2020 | | | 3,591,792 | |
| | 1,030,000 | | | Commonwealth of Puerto Rico, General Obligation Bonds—Series A (CS: NATL-RE)
5.500%, 07/01/2020 | | | 1,124,472 | |
| | 115,000 | | | Commonwealth of Puerto Rico, Public Improvement Bonds (CS: Assured Guaranty Municipal)
5.500%, 07/01/2019 | | | 123,057 | |
| | 760,000 | | | Commonwealth of Puerto Rico, Public Improvement Bonds—Series A (CS: Assured Guaranty Municipal)
5.000%, 07/01/2017 | | | 778,438 | |
| | 265,000 | | | Commonwealth of Puerto Rico, Public Improvement Bonds—Series A (CS: NATL-RE)
5.500%, 07/01/2018 | | | 278,958 | |
| Shares | | | Security
Description | | Value | |
| | | | | | | | | |
| Municipal Bonds—continued |
| Puerto Rico—continued | | | | |
| $ | 885,000 | | | Commonwealth of Puerto Rico, Public Improvement Bonds—Series A
5.500%, 07/01/2019 | | $ | 948,419 | |
| | 220,000 | | | Commonwealth of Puerto Rico, Public Improvement Bonds—Series A (CS: NATL-RE)
5.500%, 07/01/2019 | | | 235,765 | |
| | 125,000 | | | Commonwealth of Puerto Rico, Public Improvement Bonds—Series A
5.500%, 07/01/2021 | | | 138,321 | |
| | 100,000 | | | Puerto Rico Electric Power Authority—Series A (CS: Assured Guaranty Municipal)
5.000%, 08/01/2020 | | | 102,794 | |
| | 200,000 | | | Puerto Rico Electric Power Authority—Series LL (CS: NATL-RE)
5.500%, 07/01/2017 | | | 204,568 | |
| | 265,000 | | | Puerto Rico Electric Power Authority—Series NN
5.250%, 07/01/2019 | | | 282,299 | |
| | 205,000 | | | Puerto Rico Electric Power Authority—Series PP
5.000%, 07/01/2023 | | | 207,601 | |
| | 260,000 | | | Puerto Rico Electric Power Authority—Series SS
5.000%, 07/01/2022 | | | 263,513 | |
| | 235,000 | | | Puerto Rico Electric Power Authority—Series SS
4.000%, 07/01/2019 | | | 235,284 | |
| | 155,000 | | | Puerto Rico Electric Power Authority—Series SS (CS: NATL-RE)
5.000%, 07/01/2020 | | | 157,472 | |
| | 335,000 | | | Puerto Rico Electric Power Authority—Series UU
4.500%, 07/01/2018 | | | 347,214 | |
| | 250,000 | | | Puerto Rico Electric Power Authority—Series UU (CS: Assured Guaranty Municipal)
5.000%, 07/01/2020 | | | 255,730 | |
| | 350,000 | | | Puerto Rico Highways & Transportation Authority—Series E (CS: Assured Guaranty Municipal)
5.500%, 07/01/2017 | | | 359,436 | |
| | 200,000 | | | Puerto Rico Highways & Transportation
Authority—Series E
5.500%, 07/01/2023 | | | 222,444 | |
| | 500,000 | | | Puerto Rico Municipal Finance Agency—Series C
5.250%, 08/01/2017 | | | 514,250 | |
The accompanying notes are an integral part of these financial statements.
69
Alpine High Yield Managed Duration Municipal Fund
Schedule of Portfolio Investments—Continued
October 31, 2016
| Shares | | | Security
Description | | Value | |
| | | | | | | | | |
| Municipal Bonds—continued | | | | |
| Puerto Rico—continued | | | | |
| $ | 500,000 | | | Puerto Rico Public Buildings Authority—Series F (INS. Assured Guaranty)
5.250%, 07/01/2019 | | $ | 531,845 | |
| | | | | | | | 11,123,853 | |
| Rhode Island—0.8% | | | | |
| | 680,000 | | | Rhode Island Health & Educational Building Corp., Care New England
5.000%, 09/01/2022 | | | 747,612 | |
| | 500,000 | | | Rhode Island Health & Educational Building Corp., Care New England
5.000%, 09/01/2023 | | | 551,885 | |
| | 100,000 | | | Rhode Island Health & Educational Building Corp., Hospital Financing- Care New England—Series A
5.000%, 09/01/2021 | | | 117,463 | |
| | | | | | | | 1,416,960 | |
| South Carolina—0.1% | | | | |
| | 85,000 | | | Clarendon Hospital District, General Obligation
4.250%, 04/01/2017 | | | 86,221 | |
| | 85,000 | | | Clarendon Hospital District, General Obligation
4.500%, 04/01/2018 | | | 89,281 | |
| | 65,000 | | | South Carolina Jobs-Economic | | | | |
| | | | | Development Authority, | | | | |
| | | | | Palmetto Health | | | | |
| | | | | 5.000%, 08/01/2019 | | | 70,873 | |
| | | | | | | | 246,375 | |
| Tennessee—3.1% | | | | |
| | 3,220,000 | | | Sevier County Public Building Authority, Local Government Public Improvement (CS: AMBAC, LOC: KBC Bank NV)
2.680%, 06/01/2026
(Putable on 11/03/2016) (b) | | | 3,220,000 | |
| | 1,000,000 | | | Shelby County Health Educational & Housing Facilities Board, Trezevant Manor Project—Series A
5.000%, 09/01/2024 | | | 1,102,600 | |
| | 1,000,000 | | | Shelby County Health Educational & Housing Facilities Board, Trezevant Manor Project—Series A
5.000%, 09/01/2025 | | | 1,105,820 | |
| | 345,000 | | | Tennessee Energy Acquisition Corp. Revenue—Series A (CS: Goldman Sachs & Co.)
5.250%, 09/01/2018 | | | 369,398 | |
| | | | | | | | 5,797,818 | |
| Texas—11.8% | | | | |
| | 650,000 | | | Arlington Higher Education Finance Corp. Revenue, Newman International Academy—Series A
4.375%, 08/15/2026 | | | 653,822 | |
| Shares | | | Security
Description | | Value | |
| | | | | | | | | |
| Municipal Bonds—continued | | | | |
| Texas—continued | | | | |
| $ | 500,000 | | | Bexar County Health Facilities Development Corp., Army Retirement Residence Foundation Project.
4.000%, 07/15/2031 | | $ | 511,290 | |
| | 300,000 | | | Bexar County Health Facilities Development Corp., Army Retirement Residence Foundation Project.
5.000%, 07/15/2023 | | | 345,594 | |
| | 150,000 | | | Bexar County Health Facilities Development Corp., Army Retirement Residence Foundation Project.
5.000%, 07/15/2024 | | | 173,609 | |
| | 275,000 | | | Bexar County Health Facilities Development Corp., Army Retirement Residence Foundation Project.
5.000%, 07/15/2025 | | | 320,031 | |
| | 250,000 | | | Bexar County Health Facilities Development Corp., Army Retirement Residence Foundation Project.
5.000%, 07/15/2026 | | | 292,260 | |
| | 500,000 | | | Board of Managers Joint Guadalupe County-City of Seguin Hospital Revenue
5.000%, 12/01/2021 | | | 553,465 | |
| | 150,000 | | | City of Houston Airport System, United Airlines, Inc.—Series C
5.000%, 07/15/2020 | | | 164,169 | |
| | 200,000 | | | City of Houston Airport System, United Airlines, Inc. Terminal E Project
4.500%, 07/01/2020 | | | 215,908 | |
| | 215,000 | | | City of Rowlett, Bayside Public Improvement District
4.900%, 09/15/2024 | | | 215,823 | |
| | 75,000 | | | Decatur Hospital Authority, Wise Regional Health System.—Series A
5.000%, 09/01/2023 | | | 83,267 | |
| | 50,000 | | | Gulf Coast Waste Disposal Authority, U.S. Steel Corp. Project
5.750%, 09/01/2017 | | | 50,391 | |
| | 895,000 | | | Harris County Cultural Education Facilities Finance Corp., First Mortgage Brazos Presbyterian Homes
5.000%, 01/01/2027 | | | 1,009,381 | |
| | 155,000 | | | Harris County Cultural Education Facilities Finance Corp., Willow Winds Project—Series A
5.000%, 10/01/2023 | | | 174,108 | |
| | 500,000 | | | Mission Economic Development Corp. Revenue, Senior Lien Natgasoline Project—Series B
5.750%, 10/01/2031 (a) | | | 530,310 | |
The accompanying notes are an integral part of these financial statements.
70
Alpine High Yield Managed Duration Municipal Fund
Schedule of Portfolio Investments—Continued
October 31, 2016
| Shares | | | Security
Description | | Value | |
| | | | | | | | | |
| Municipal Bonds—continued | | | | |
| Texas—continued | | | | |
| $ | 675,000 | | | New Hope Cultural Education Facilities Corp., Cardinal Bay, Inc. Village On The Park—Series B
4.000%, 07/01/2025 | | $ | 722,932 | |
| | 500,000 | | | New Hope Cultural Education Facilities Corp., Cardinal Bay, Inc. Village On The Park—Series B
4.000%, 07/01/2026 | | | 534,715 | |
| | 500,000 | | | New Hope Cultural Education Facilities Corp., Cardinal Bay, Inc. Village On The Park—Series B
4.000%, 07/01/2031 | | | 525,350 | |
| | 255,000 | | | New Hope Cultural Education Facilities Corp., Cardinal Bay, Inc. Village On The Park—Series C
4.000%, 07/01/2019 | | | 260,549 | |
| | 275,000 | | | New Hope Cultural Education Facilities Corp., Cardinal Bay, Inc. Village On The Park—Series C
4.000%, 07/01/2021 | | | 279,909 | |
| | 300,000 | | | New Hope Cultural Education Facilities Corp., Cardinal Bay, Inc. Village On The Park—Series C
5.000%, 07/01/2023 | | | 317,376 | |
| | 330,000 | | | New Hope Cultural Education Facilities Corp., Cardinal Bay, Inc. Village On The Park—Series C
5.000%, 07/01/2025 | | | 347,269 | |
| | 300,000 | | | New Hope Cultural Education Facilities Corp., Cardinal Bay, Inc. Village On The Park—Series C
5.000%, 07/01/2031 | | | 317,172 | |
| | 350,000 | | | New Hope Cultural Education Facilities Corp., Cardinal Bay, Inc. Village On The Park—Series C
5.250%, 07/01/2036 | | | 374,041 | |
| | 150,000 | | | New Hope Cultural Education Facilities Corp., Cardinal Bay, Inc. Village On The Park—Series D
6.000%, 07/01/2026 | | | 150,141 | |
| | 1,000,000 | | | New Hope Cultural Education Facilities Finance Corp., TEMPS-80 MRC Senior Living Project
3.250%, 11/15/2022 | | | 996,730 | |
| | 1,200,000 | | | Port Beaumont Navigation District Revenue, Jefferson Energy Co. Project (CS: Jefferson Railport LLC; SPA: See Notes)
7.250%, 02/01/2036
(Putable on 02/13/2020) (a)(b) | | | 1,257,348 | |
| | 1,960,000 | | | Port of Corpus Christi Authority of Nueces County, Solid Waste Disposal, Flint Hills Resources LP, West Plant Project—Series A
0.700%, 07/01/2029
(Putable on 11/02/2016) (a)(b) | | | 1,960,000 | |
| Shares | | | Security
Description | | Value | |
| | | | | | | | | |
| Municipal Bonds—continued | | | | |
| Texas—continued | | | | |
| $ | 700,000 | | | Port of Port Arthur Navigation District, Motiva Enterprises LLC—Series B
0.730%, 04/01/2040
(Putable on 11/01/2016) (b) | | $ | 700,000 | |
| | 600,000 | | | Pottsboro Higher Education Finance Corp.—Series A (CS: Imagine International Academy N TX)
3.875%, 08/15/2026 | | | 589,656 | |
| | 100,000 | | | Red River Health Facilities Development Corp. Revenue, TEMPS-MRC Crossings Project—Series B-1
6.125%, 11/15/2020 | | | 100,276 | |
| | 80,000 | | | SA Energy Acquisition Public Facility Corp. Revenue, Gas Supply Revenue (CS: Goldman Sachs & Co.)
5.500%, 08/01/2022 | | | 94,644 | |
| | 50,000 | | | SA Energy Acquisition Public Facility Corp. Revenue, Gas Supply Revenue (CS: Goldman Sachs & Co.)
5.500%, 08/01/2023 | | | 59,976 | |
| | 2,000,000 | | | Tarrant County Cultural Education Facilities Finance Corp. Air Force Villages Obligated Group Project
4.000%, 05/15/2027 | | | 2,046,820 | |
| | 500,000 | | | Tarrant County Cultural Education Facilities Finance Corp. Revenue, Buckingham Senior Living Project
3.875%, 11/15/2020 | | | 504,865 | |
| | 1,500,000 | | | Texas Municipal Gas Acquisition & Supply Corp. I, Sr. Lien—Series D
2.020%, 12/15/2026
(Putable on 12/15/2016) | | | 1,398,375 | |
| | 1,700,000 | | | Texas Municipal Gas Acquisition & Supply Corp. I, Sr. Lien—Series D (CS: Merrill Lynch)
6.250%, 12/15/2026 | | | 2,058,173 | |
| | 100,000 | | | Texas Public Finance Authority, Refunding, Southern University Financing System
5.000%, 11/01/2021 | | | 115,116 | |
| | 1,250,000 | | | Texas Public Finance Authority, Texas Southern University
4.000%, 05/01/2030 | | | 1,350,462 | |
| | | | | | | | 22,355,323 | |
| Vermont—0.2% | | | | |
| | 385,000 | | | Vermont Student Assistance Corp. Education Loan Revenue—Series A
3.000%, 06/15/2019 | | | 390,817 | |
| Virgin Islands—0.4% | | | | |
| | 485,000 | | | Virgin Islands Public Finance Authority, Matching Fund Loan Note—Series A
5.000%, 10/01/2020 | | | 490,810 | |
The accompanying notes are an integral part of these financial statements.
71
Alpine High Yield Managed Duration Municipal Fund
Schedule of Portfolio Investments—Continued
October 31, 2016
| Shares | | | Security
Description | | Value | |
| | | | | | | | | |
| Municipal Bonds—continued | | | | |
| Virgin Islands—0.4% | | | | |
| $ | 200,000 | | | Virgin Islands Public Finance, Gross Receipts Taxes Loan Note— Series A
5.000%, 10/01/2032 | | $ | 226,024 | |
| | | | | | | | 716,834 | |
| Washington—4.0% | | | | |
| | 245,000 | | | Klickitat County Public Hospital District No. 2, Skyline Hospital
5.750%, 12/01/2017 | | | 248,472 | |
| | 1,500,000 | | | Skagit County Public Hospital District No 1 Refunding Bonds & Improvement, Skagit Regional Health
4.000%, 12/01/2024 | | | 1,618,035 | |
| | 195,000 | | | Washington Housing Finance Commission, Rockwood Retirement Communities Project—Series B-1
5.875%, 01/01/2021 (a) | | | 195,332 | |
| | 800,000 | | | Washington Housing Finance Commission, TEMPS 65-Heron’s Key Senior Living
4.875%, 01/01/2022 (a) | | | 812,408 | |
| | 100,000 | | | Washington State Housing Finance Commission
5.000%, 01/01/2023 (a) | | | 105,289 | |
| | 80,000 | | | Washington State Housing Finance Commission
5.000%, 01/01/2023 | | | 88,795 | |
| | 1,500,000 | | | Washington State Housing Finance Commission, Bayview Manor Homes—Series B
2.800%, 07/01/2021 (a) | | | 1,500,060 | |
| | 1,480,000 | | | Washington State Housing Finance Commission, Mirabella
6.000%, 10/01/2022 | | | 1,670,032 | |
| | 530,000 | | | Washington State Housing Finance Commission, Single Family Program—Series 1A-R
4.000%, 12/01/2025 | | | 559,653 | |
| | 485,000 | | | Washington State Housing Finance Commission, Wesley Homes at Lea Hill Project
3.200%, 07/01/2021 (a) | | | 482,075 | |
| Shares | | | Security
Description | | Value | |
| | | | | | | | | |
| Municipal Bonds—continued | | | | |
| Washington—continued | | | | |
| $ | 250,000 | | | Washington State Housing Finance Commission, Wesley Homes at Lea Hill Project
3.750%, 07/01/2026 (a) | | $ | 246,205 | |
| | | | | | | | 7,526,356 | |
| West Virginia—1.0% | | | | |
| | 300,000 | | | Fayette County Commission Solid Waste Disposal Facility, Georgia Pacific Corp.
0.800%, 05/01/2018
(Putable on 11/02/2016) (a)(b) | | | 300,000 | |
| | 600,000 | | | Ohio County WV
1.750%, 06/01/2018 | | | 596,490 | |
| | 1,000,000 | | | Ohio County WV Special District Excise Tax Revenue—Series B
4.375%, 03/01/2035 | | | 1,011,070 | |
| | | | | | | | 1,907,560 | |
| Wisconsin—0.4% | | | | |
| | 315,000 | | | Public Finance Authority Revenue, Glenridge Palmer Ranch—Series A
7.000%, 06/01/2020 | | | 348,352 | |
| | 200,000 | | | Public Finance Authority, Church Home Of Hartford
5.000%, 09/01/2025 (a) | | | 226,992 | |
| | 180,000 | | | Wisconsin Public Finance Authority, Roseman University of Health Sciences Project
5.000%, 04/01/2022 | | | 192,674 | |
| | | | | | | | 768,018 | |
| | | | | Total Municipal Bonds
(Cost $194,863,187) | | | 196,226,793 | |
| | | | | | | | | |
| Shares | | | | | | | |
| Money Market Funds—0.1% | | | | |
| | 97,408 | | | BlackRock Liquidity Funds MuniCash Portfolio, Institutional Shares, 0.46% | | | 97,523 | |
| | 114 | | | Federated Municipal Obligation Fund, Wealth Shares, 0.64% | | | 114 | |
| | | | | Total Money Market Funds
(Cost $97,523) | | | 97,637 | |
| Total Investments (Cost $194,960,719) (d)—103.9% | | | 196,324,316 | |
| Liabilities in Excess of Other Assets—(3.9)% | | | (7,318,986 | ) |
| TOTAL NET ASSETS 100.0% | | $ | 189,005,330 | |
The accompanying notes are an integral part of these financial statements.
72
Alpine High Yield Managed Duration Municipal Fund
Schedule of Portfolio Investments—Continued
October 31, 2016
Percentages are stated as a percent of net assets.
(a) Restricted under Rule 144A of the Securities Act of 1933. These securities may be resold in transactions exempt from registration, normally to qualified institutional buyers. These securities have been determined to be liquid under guidelines established by the Board of Trustees. Liquid securities restricted under Rule 144A comprised 11.9% of the Fund’s net assets.
(b) Variable Rate Security - The rate reported is the rate in effect as of October 31, 2016.
(c) Amount is less than 0.05%.
(d) See Note 7 for the cost of investments for federal tax purposes.
AMBAC—American Municipal Bond Assurance Corp.
ARN—Auction Rate Note
CS—Credit Support
LOC—Line of Credit
MUNIPSA—SIFMA Municipal Swap Index Yield Analysis
NA—North America
NATL—RE-Reinsurance provided by National Public Finance Guarantee Corp.
SPA—Standby Purchase Agreement
The accompanying notes are an integral part of these financial statements.
73
Alpine Mutual Funds
Statements of Assets and Liabilities
October 31, 2016
| | | Dynamic
Dividend
Fund | | | Rising
Dividend
Fund | | | Financial
Services
Fund | |
| ASSETS: | | | | | | | | | | | | |
| Investments, at value(1) | | $ | 155,684,215 | | | $ | 85,372,596 | | | $ | 13,757,464 | |
| Foreign currencies, at value(2) | | | — | | | | — | | | | 553 | |
| Cash | | | 444,781 | | | | 931 | | | | 820 | |
| Receivable from investment securities sold | | | 724,587 | | | | 2,980,306 | | | | 292,795 | |
| Dividends and interest receivable | | | 238,849 | | | | 226,008 | | | | 1,222 | |
| Tax reclaim receivable | | | 203,860 | | | | 113 | | | | 6,253 | |
| Receivable from capital shares issued | | | 21,118 | | | | 1,260 | | | | 74,159 | |
| Unrealized appreciation on forward currency contracts | | | 464,160 | | | | — | | | | — | |
| Due from Adviser | | | 258 | | | | — | | | | — | |
| Prepaid expenses and other assets | | | 3,018 | | | | 4,244 | | | | 324 | |
| Total assets | | | 157,784,846 | | | | 88,585,458 | | | | 14,133,590 | |
| | | | | | | | | | | | | |
| LIABILITIES: | | | | | | | | | | | | |
| Payable for investment securities purchased | | | 1,908,545 | | | | 2,917,350 | | | | 135,632 | |
| Payable for distributions to shareholders | | | 244,226 | | | | — | | | | — | |
| Payable for capital shares redeemed | | | 224,887 | | | | — | | | | 7,348 | |
| Accrued expenses and other liabilities: | | | | | | | | | | | | |
| Investment advisory fees (Note 6) | | | 133,324 | | | | 74,036 | | | | 17,304 | |
| Distribution fees (Note 5) | | | 8,289 | | | | 17,187 | | | | 3,331 | |
| Trustee fees (Note 6) | | | 3,788 | | | | 2,089 | | | | 362 | |
| Other | | | 197,516 | | | | 33,559 | | | | 44,591 | |
| Total liabilities | | | 2,720,575 | | | | 3,044,221 | | | | 208,568 | |
| Net Assets | | $ | 155,064,271 | | | $ | 85,541,237 | | | $ | 13,925,022 | |
| | | | | | | | | | | | | |
| NET ASSETS REPRESENTED BY: | | | | | | | | | | | | |
| Paid-in-capital | | $ | 707,968,602 | | | $ | 74,047,334 | | | $ | 11,570,977 | |
| Undistributed (distributions in excess of) net investment income | | | (517,335 | ) | | | 600,016 | | | | 7,885 | |
| Accumulated net realized loss from investments and foreign currency transactions | | | (561,932,752 | ) | | | (194,413 | ) | | | (283,828 | ) |
| Net unrealized appreciation/(depreciation) on: | | | | | | | | | | | | |
| Investments | | | 9,103,373 | | | | 11,088,328 | | | | 2,630,681 | |
| Foreign currency translations | | | 442,383 | | | | (28 | ) | | | (693 | ) |
| Net Assets | | $ | 155,064,271 | | | $ | 85,541,237 | | | $ | 13,925,022 | |
| | | | | | | | | | | | | |
| Net asset value | | | | | | | | | | | | |
| Institutional Class | | | | | | | | | | | | |
| Net assets | | $ | 151,199,739 | | | $ | 84,271,194 | | | $ | 11,985,308 | |
| Shares outstanding | | | 43,350,013 | | | | 5,732,758 | | | | 883,978 | |
| Net asset value, offering price and redemption price per share* | | $ | 3.49 | | | $ | 14.70 | | | $ | 13.56 | |
| Class A | | | | | | | | | | | | |
| Net assets | | $ | 3,864,532 | | | $ | 1,270,043 | | | $ | 1,939,714 | |
| Shares outstanding | | | 1,106,871 | | | | 86,380 | | | | 144,161 | |
| Net asset value per share | | $ | 3.49 | | | $ | 14.70 | | | $ | 13.46 | |
| Maximum offering price per share (net asset value plus sales charge of 5.50% of offering price) | | $ | 3.69 | | | $ | 15.56 | | | $ | 14.24 | |
| * If applicable, redemption price per share may be reduced by a redemption fee. | | | | | | | | | | | | |
| (1) Total cost of investments | | $ | 146,580,842 | | | $ | 74,284,268 | | | $ | 11,126,782 | |
| (2) Total cost of foreign currencies | | $ | — | | | $ | — | | | $ | 931 | |
The accompanying notes are an integral part of these financial statements.
74
Alpine Mutual Funds
Statements of Assets and Liabilities—Continued
October 31, 2016
| | | Small Cap
Fund | | | Ultra Short
Municipal
Income
Fund | | | High Yield
Managed Duration
Municipal Fund |
| ASSETS: | | | | | | | | | | | | | |
| Investments, at value(1) | | $ | 13,319,715 | | | $ | 1,135,747,669 | | | | $ | 196,324,316 | |
| Cash | | | 654 | | | | — | | | | | — | |
| Receivable from investment securities sold | | | 50,905 | | | | — | | | | | 5,245,313 | |
| Dividends and interest receivable | | | 3,006 | | | | 4,107,088 | | | | | 2,062,864 | |
| Receivable from capital shares issued | | | 1,403 | | | | 13,282,266 | | | | | 1,110,763 | |
| Due from Adviser | | | 3,880 | | | | 211,316 | | | | | 73,624 | |
| Prepaid expenses and other assets | | | 295 | | | | 24,333 | | | | | 4,009 | |
| Total assets | | | 13,379,858 | | | | 1,153,372,672 | | | | | 204,820,889 | |
| | | | | | | | | | | | | | |
| LIABILITIES: | | | | | | | | | | | | | |
| Payable for investment securities purchased | | | 99,539 | | | | 38,758,609 | | | | | 15,352,179 | |
| Payable for distributions to shareholders | | | — | | | | — | | | | | 139,471 | |
| Payable for capital shares redeemed | | | 43,464 | | | | 1,225,498 | | | | | 112,754 | |
| Accrued expenses and other liabilities: | | | | | | | | | | | | | |
| Investment advisory fees (Note 6) | | | 11,483 | | | | 462,793 | | | | | 102,221 | |
| Distribution fees (Note 5) | | | 1,785 | | | | 89,425 | | | | | 42,569 | |
| Trustee fees (Note 6) | | | 297 | | | | 24,151 | | | | | 2,931 | |
| Other | | | 22,646 | | | | 710,082 | | | | | 63,434 | |
| Total liabilities | | | 179,214 | | | | 41,270,558 | | | | | 15,815,559 | |
| Net Assets | | $ | 13,200,644 | | | $ | 1,112,102,114 | | | | $ | 189,005,330 | |
| | | | | | | | | | | | | | |
| NET ASSETS REPRESENTED BY: | | | | | | | | | | | | | |
| Paid-in-capital | | $ | 20,247,352 | | | $ | 1,112,654,951 | | | | $ | 188,561,887 | |
| Undistributed (distributions in excess of) net investment income | | | (68,771 | ) | | | (12 | ) | | | | 262 | |
| Accumulated net realized loss from investments and foreign currency transactions | | | (7,784,220 | ) | | | (546,542 | ) | | | | (920,416 | ) |
| Net unrealized appreciation/(depreciation) on: | | | | | | | | | | | | | |
| Investments | | | 806,283 | | | | (6,283 | ) | | | | 1,363,597 | |
| Net Assets | | $ | 13,200,644 | | | $ | 1,112,102,114 | | | | $ | 189,005,330 | |
| | | | | | | | | | | | | | |
| Net asset value | | | | | | | | | | | | | |
| Institutional Class | | | | | | | | | | | | | |
| Net assets | | $ | 12,596,422 | | | $ | 905,843,445 | | | | $ | 153,300,102 | |
| Shares outstanding | | | 792,876 | | | | 90,255,088 | | | | | 14,830,130 | |
| Net asset value, offering price and redemption price per share* | | $ | 15.89 | | | $ | 10.04 | | | | $ | 10.34 | |
| Class A | | | | | | | | | | | | | |
| Net assets | | $ | 604,222 | | | $ | 206,258,669 | | | | $ | 35,705,228 | |
| Shares outstanding | | | 38,523 | | | | 20,434,586 | | | | | 3,454,354 | |
| Net asset value per share | | $ | 15.68 | | | $ | 10.09 | | | | $ | 10.34 | |
| Maximum offering price per share (net asset value plus sales charge of 5.50%, 0.50% and 2.50%, respectively, of offering price) | | $ | 16.59 | | | $ | 10.14 | | | | $ | 10.61 | |
| * If applicable, redemption price per share may be reduced by a redemption fee. | | | | | | | | | | | | | |
| (1) Total cost of investments | | $ | 12,513,432 | | | $ | 1,135,753,952 | | | | $ | 194,960,719 | |
The accompanying notes are an integral part of these financial statements.
75
Alpine Mutual Funds
Statements of Operations
For the year ended October 31, 2016
| | | Dynamic
Dividend
Fund | | | Rising
Dividend
Fund | | | Financial
Services
Fund | |
| INVESTMENT INCOME: | | | | | | | | | | | | |
| Dividend income | | $ | 12,207,386 | | | $ | 4,864,354 | | | $ | 325,694 | |
| Less: Foreign taxes withheld | | | (245,189 | ) | | | (21,735 | ) | | | (651 | ) |
| Interest and other income (Note 9) | | | 265,745 | | | | 220 | | | | 98 | |
| Total investment income | | | 12,227,942 | | | | 4,842,839 | | | | 325,141 | |
| | | | | | | | | | | | | |
| EXPENSES: | | | | | | | | | | | | |
| Investment advisory fee (Note 6) | | | 1,650,845 | | | | 892,623 | | | | 179,919 | |
| Transfer agent fees | | | 246,982 | | | | 27,683 | | | | 35,847 | |
| Distribution fees - Class A (Note 5) | | | 8,429 | | | | 3,910 | | | | 8,601 | |
| Administration fee (Note 6) | | | 38,196 | | | | 20,794 | | | | 4,149 | |
| Registration and filing fees | | | 28,412 | | | | 21,038 | | | | 28,442 | |
| Audit and tax fees | | | 43,075 | | | | 39,239 | | | | 28,738 | |
| Accounting and custody fees | | | 45,394 | | | | 11,608 | | | | 5,662 | |
| Trustee fees (Note 6) | | | 21,908 | | | | 11,741 | | | | 2,501 | |
| Printing and mailing fees | | | 18,227 | | | | 8,823 | | | | 948 | |
| Legal fees | | | 2,880 | | | | 2,425 | | | | 1,107 | |
| Compliance fees (Note 6) | | | 45 | | | | 3,653 | | | | 683 | |
| Interest (Note 2) | | | 17,481 | | | | 142 | | | | 1,326 | |
| Other fees | | | 46,910 | | | | 9,534 | | | | 5,021 | |
| Total expenses | | | 2,168,784 | | | | 1,053,213 | | | | 302,944 | |
| Less: Fee waivers and/or expense reimbursements (Note 6) | | | (12,047 | ) | | | — | | | | (59,030 | ) |
| Net expenses | | | 2,156,737 | | | | 1,053,213 | | | | 243,914 | |
| Net investment income | | | 10,071,205 | | | | 3,789,626 | | | | 81,227 | |
| | | | | | | | | | | | | |
| NET REALIZED AND UNREALIZED GAIN/(LOSS) ON INVESTMENTS AND FOREIGN CURRENCY: | | | | | | | | | | | | |
| Net realized gain/(loss) from: | | | | | | | | | | | | |
| Investments | | | (9,197,039 | ) | | | (165,039 | ) | | | 318,200 | |
| Foreign currency transactions | | | 680,883 | | | | 4,127 | | | | (36,438 | ) |
| Written options contracts | | | — | | | | 35,626 | | | | — | |
| Net realized gain/(loss) from investments and foreign currency | | | (8,516,156 | ) | | | (125,286 | ) | | | 281,762 | |
| Change in net unrealized depreciation on: | | | | | | | | | | | | |
| Investments | | | (2,058,550 | ) | | | (1,998,406 | ) | | | (530,789 | ) |
| Foreign currency translations | | | (77,584 | ) | | | (33 | ) | | | (499 | ) |
| Written options contracts | | | — | | | | (13,026 | ) | | | — | |
| Change in net unrealized depreciation on investments and foreign currency | | | (2,136,134 | ) | | | (2,011,465 | ) | | | (531,288 | ) |
| Net loss on investments and foreign currency | | | (10,652,290 | ) | | | (2,136,751 | ) | | | (249,526 | ) |
| Increase (decrease) in net assets from operations | | $ | (581,085 | ) | | $ | 1,652,875 | | | $ | (168,299 | ) |
The accompanying notes are an integral part of these financial statements.
76
Alpine Mutual Funds
Statements of Operations—Continued
For the year ended October 31, 2016
| | | Small Cap
Fund | | | Ultra Short
Municipal
Income
Fund | | | High Yield
Managed Duration
Municipal Fund |
| INVESTMENT INCOME: | | | | | | | | | | | | | |
| Dividend income | | $ | 80,226 | | | $ | — | | | | $ | — | |
| Interest income | | | 94 | | | | 11,016,486 | | | | | 4,446,018 | |
| Total investment income | | | 80,320 | | | | 11,016,486 | | | | | 4,446,018 | |
| | | | | | | | | | | | | | |
| EXPENSES: | | | | | | | | | | | | | |
| Investment advisory fee (Note 6) | | | 129,848 | | | | 6,125,581 | | | | | 759,453 | |
| Transfer agent fees | | | 14,052 | | | | 558,548 | | | | | 63,087 | |
| Distribution fees - Class A (Note 5) | | | 2,285 | | | | 511,941 | | | | | 60,390 | |
| Administration fee (Note 6) | | | 2,947 | | | | 232,176 | | | | | 25,132 | |
| Registration and filing fees | | | 27,992 | | | | 110,561 | | | | | 65,480 | |
| Audit and tax fees | | | 27,736 | | | | 96,549 | | | | | 28,802 | |
| Accounting and custody fees | | | 2,101 | | | | 110,610 | | | | | 10,182 | |
| Trustee fees (Note 6) | | | 1,705 | | | | 134,651 | | | | | 12,968 | |
| Printing and mailing fees | | | 3,091 | | | | 54,691 | | | | | — | |
| Legal fees | | | 264 | | | | 50,827 | | | | | 4,191 | |
| Compliance fees (Note 6) | | | 476 | | | | 43,426 | | | | | 4,883 | |
| Interest (Note 2) | | | — | | | | — | | | | | 1,500 | |
| Other fees | | | 1,404 | | | | 80,468 | | | | | 5,470 | |
| Total expenses | | | 213,901 | | | | 8,110,029 | | | | | 1,041,538 | |
| Less: Fee waivers and/or expense reimbursements (Note 6) | | | (43,985 | ) | | | (3,156,071 | ) | | | | (216,236 | ) |
| Net expenses | | | 169,916 | | | | 4,953,958 | | | | | 825,302 | |
| Net investment income (loss) | | | (89,596 | ) | | | 6,062,528 | | | | | 3,620,716 | |
| | | | | | | | | | | | | | |
| NET REALIZED AND UNREALIZED GAIN/(LOSS) ON INVESTMENTS: | | | | | | | | | | | | | |
| Net realized gain/(loss) from: | | | | | | | | | | | | | |
| Investments | | | 158,814 | | | | (272,143 | ) | | | | (917,105 | ) |
| Net realized gain/(loss) from investments | | | 158,814 | | | | (272,143 | ) | | | | (917,105 | ) |
| Change in net unrealized appreciation/(depreciation) on: | | | | | | | | | | | | | |
| Investments | | | 850,880 | | | | (104,135 | ) | | | | 789,473 | |
| Net gain/(loss) on investments | | | 1,009,694 | | | | (376,278 | ) | | | | (127,632 | ) |
| Increase in net assets from operations | | $ | 920,098 | | | $ | 5,686,250 | | | | $ | 3,493,084 | |
The accompanying notes are an integral part of these financial statements.
77
Alpine Mutual Funds
Statements of Changes in Net Assets
| | | Dynamic Dividend Fund |
| | | Year Ended
October 31, 2016 | | Year Ended
October 31, 2015 |
| OPERATIONS: | | | | | | | | | | |
| Net investment income | | | $ | 10,071,205 | | | | $ | 12,676,067 | |
| Net realized gain (loss) from: | | | | | | | | | | |
| Investments | | | | (9,197,039 | ) | | | | 2,094,877 | |
| Foreign currency transactions | | | | 680,883 | | | | | 5,177,818 | |
| Change in net unrealized depreciation on: | | | | | | | | | | |
| Investments | | | | (2,058,550 | ) | | | | (9,954,704 | ) |
| Foreign currency translations | | | | (77,584 | ) | | | | (2,274,026 | ) |
| Increase (decrease) in net assets from operations | | | | (581,085 | ) | | | | 7,720,032 | |
| | | | | | | | | | | |
| DISTRIBUTIONS TO SHAREHOLDERS: | | | | | | | | | | |
| Distributions to Institutional Class Shareholders: | | | | | | | | | | |
| From net investment income | | | | 9,917,678 | | | | | (12,083,554 | ) |
| From tax return of capital | | | | 1,078,120 | | | | | — | |
| Distributions to Class A Shareholders: | | | | | | | | | | |
| From net investment income | | | | 202,757 | | | | | (244,816 | ) |
| From tax return of capital | | | | 22,041 | | | | | — | |
| Decrease in net assets from distributions to shareholders | | | | (11,220,596 | ) | | | | (12,328,370 | ) |
| | | | | | | | | | | |
| CAPITAL SHARE TRANSACTIONS (NOTE 3): | | | | | | | | | | |
| Net proceeds from shares sold | | | | 6,886,618 | | | | | 14,993,760 | |
| Dividends reinvested | | | | 7,975,592 | | | | | 8,502,088 | |
| Redemption fees (Note 2) | | | | 2,641 | | | | | 2,198 | |
| Cost of shares redeemed | | | | (34,048,040 | ) | | | | (47,494,989 | ) |
| Decrease in net assets from capital share transactions | | | | (19,183,189 | ) | | | | (23,996,943 | ) |
| Net decrease in net assets | | | | (30,984,870 | ) | | | | (28,605,281 | ) |
| | | | | | | | | | | |
| NET ASSETS: | | | | | | | | | | |
| Beginning of year | | | | 186,049,141 | | | | | 214,654,422 | |
| End of year* | | | $ | 155,064,271 | | | | $ | 186,049,141 | |
| * Including distributions in excess of net investment of: | | | $ | (517,335 | ) | | | $ | (353,948 | ) |
The accompanying notes are an integral part of these financial statements.
78
Alpine Mutual Funds
Statements of Changes in Net Assets—Continued
| | | Rising Dividend Fund |
| | | Year Ended
October 31, 2016 | | Year Ended
October 31, 2015 |
| OPERATIONS: | | | | | | | | | | |
| Net investment income | | | $ | 3,789,626 | | | | $ | 206,199 | |
| Net realized gain (loss) from: | | | | | | | | | | |
| Investments | | | | (165,039 | ) | | | | 506,148 | |
| Written options contracts | | | | 35,626 | | | | | — | |
| Foreign currency transactions | | | | 4,127 | | | | | 882 | |
| Change in net unrealized appreciation/(depreciation) on: | | | | | | | | | | |
| Investments | | | | (1,998,406 | ) | | | | (657,874 | ) |
| Foreign currency translations | | | | (33 | ) | | | | 75 | |
| Written options contracts | | | | (13,026 | ) | | | | 13,026 | |
| Increase in net assets from operations | | | | 1,652,875 | | | | | 68,456 | |
| | | | | | | | | | | |
| DISTRIBUTIONS TO SHAREHOLDERS: | | | | | | | | | | |
| Distributions to Institutional Class Shareholders: | | | | | | | | | | |
| From net investment income | | | | (3,121,087 | ) | | | | (170,683 | ) |
| From net realized gain on investments | | | | (574,673 | ) | | | | (199,861 | ) |
| Distributions to Class A Shareholders: | | | | | | | | | | |
| From net investment income | | | | (57,954 | ) | | | | (59,375 | ) |
| From net realized gain on investments | | | | (15,062 | ) | | | | (84,793 | ) |
| Decrease in net assets from distributions to shareholders | | | | (3,768,776 | ) | | | | (514,712 | ) |
| | | | | | | | | | | |
| CAPITAL SHARE TRANSACTIONS (NOTE 3): | | | | | | | | | | |
| Net proceeds from shares sold | | | | 826,270 | | | | | 3,356,210 | |
| Proceeds from shares sold - Merger | | | | — | | | | | 85,240,165 | |
| Dividends reinvested | | | | 3,721,938 | | | | | 468,937 | |
| Redemption fees (Note 2) | | | | 73 | | | | | — | |
| Cost of shares redeemed | | | | (9,374,860 | ) | | | | (1,485,856 | ) |
| Increase (decrease) in net assets from capital share transactions | | | | (4,826,579 | ) | | | | 87,579,456 | |
| Net increase (decrease) in net assets | | | | (6,942,480 | ) | | | | 87,133,200 | |
| | | | | | | | | | | |
| NET ASSETS: | | | | | | | | | | |
| Beginning of year | | | | 92,483,717 | | | | | 5,350,517 | |
| End of year* | | | $ | 85,541,237 | | | | $ | 92,483,717 | |
| * Including undistributed net investment income of: | | | $ | 600,016 | | | | $ | 10,950 | |
The accompanying notes are an integral part of these financial statements.
79
Alpine Mutual Funds
Statements of Changes in Net Assets—Continued
| | | Financial Services Fund |
| | | Year Ended
October 31, 2016 | | Year Ended
October 31, 2015 |
| OPERATIONS: | | | | | | | | | | |
| Net investment income | | | $ | 81,227 | | | | $ | 165,951 | |
| Net realized gain (loss) from: | | | | | | | | | | |
| Investments | | | | 318,200 | | | | | (16,039 | ) |
| Foreign currency transactions | | | | (36,438 | ) | | | | (41,924 | ) |
| Change in net unrealized appreciation/(depreciation) on: | | | | | | | | | | |
| Investments | | | | (530,789 | ) | | | | (896,534 | ) |
| Foreign currency translations | | | | (499 | ) | | | | 187 | |
| Decrease in net assets from operations | | | | (168,299 | ) | | | | (788,359 | ) |
| | | | | | | | | | | |
| DISTRIBUTIONS TO SHAREHOLDERS: | | | | | | | | | | |
| Distributions to Institutional Class Shareholders: | | | | | | | | | | |
| From net investment income | | | | (285,431 | ) | | | | (15,838 | ) |
| From net realized gain on investments | | | | — | | | | | (291,458 | ) |
| Distributions to Class A Shareholders: | | | | | | | | | | |
| From net investment income | | | | (70,527 | ) | | | | (4,306 | ) |
| From net realized gain on investments | | | | — | | | | | (79,233 | ) |
| Decrease in net assets from distributions to shareholders | | | | (355,958 | ) | | | | (390,835 | ) |
| | | | | | | | | | | |
| CAPITAL SHARE TRANSACTIONS (NOTE 3): | | | | | | | | | | |
| Net proceeds from shares sold | | | | 1,890,651 | | | | | 5,873,328 | |
| Dividends reinvested | | | | 207,008 | | | | | 218,645 | |
| Redemption fees (Note 2) | | | | 261 | | | | | 2,385 | |
| Cost of shares redeemed | | | | (12,943,797 | ) | | | | (15,882,712 | ) |
| Decrease in net assets from capital share transactions | | | | (10,845,877 | ) | | | | (9,788,354 | ) |
| Net decrease in net assets | | | | (11,370,134 | ) | | | | (10,967,548 | ) |
| | | | | | | | | | | |
| NET ASSETS: | | | | | | | | | | |
| Beginning of year | | | | 25,295,156 | | | | | 36,262,704 | |
| End of year* | | | $ | 13,925,022 | | | | $ | 25,295,156 | |
| * Including undistributed net investment income of: | | | $ | 7,885 | | | | $ | 225,763 | |
The accompanying notes are an integral part of these financial statements.
80
Alpine Mutual Funds
Statements of Changes in Net Assets—Continued
| | | Small Cap Fund |
| | | Year Ended
October 31, 2016 | | Year Ended
October 31, 2015 |
| OPERATIONS: | | | | | | | | | | |
| Net investment loss | | | $ | (89,596 | ) | | | $ | (52,056 | ) |
| Net realized gain (loss) from: | | | | | | | | | | |
| Investments | | | | 158,814 | | | | | (227,094 | ) |
| Foreign currency transactions | | | | — | | | | | 77 | |
| Change in net unrealized appreciation on: | | | | | | | | | | |
| Investments | | | | 850,880 | | | | | 926,881 | |
| Foreign currency translations | | | | — | | | | | 9 | |
| Increase in net assets from operations | | | | 920,098 | | | | | 647,817 | |
| | | | | | | | | | | |
| CAPITAL SHARE TRANSACTIONS (NOTE 3): | | | | | | | | | | |
| Net proceeds from shares sold | | | | 416,047 | | | | | 913,271 | |
| Redemption fees (Note 2) | | | | 2 | | | | | 892 | |
| Cost of shares redeemed | | | | (1,964,185 | ) | | | | (2,544,087 | ) |
| Decrease in net assets from capital share transactions | | | | (1,548,136 | ) | | | | (1,629,924 | ) |
| Net decrease in net assets | | | | (628,038 | ) | | | | (982,107 | ) |
| | | | | | | | | | | |
| NET ASSETS: | | | | | | | | | | |
| Beginning of year | | | | 13,828,682 | | | | | 14,810,789 | |
| End of year* | | | $ | 13,200,644 | | | | $ | 13,828,682 | |
| * Including distributions in excess of net investment of: | | | $ | (68,771 | ) | | | $ | (62,343 | ) |
The accompanying notes are an integral part of these financial statements.
81
Alpine Mutual Funds
Statements of Changes in Net Assets—Continued
| | | Ultra Short Municipal Income Fund |
| | | Year Ended
October 31, 2016 | | Year Ended
October 31, 2015 |
| OPERATIONS: | | | | | | | | | | |
| Net investment income | | | $ | 6,062,528 | | | | $ | 4,629,271 | |
| Net realized gain (loss) from investments | | | | (272,143 | ) | | | | 149,302 | |
| Change in net unrealized (depreciation) on investments | | | | (104,135 | ) | | | | (14,807 | ) |
| Increase in net assets from operations | | | | 5,686,250 | | | | | 4,763,766 | |
| | | | | | | | | | | |
| DISTRIBUTIONS TO SHAREHOLDERS: | | | | | | | | | | |
| Distributions to Institutional Class Shareholders: | | | | | | | | | | |
| From net investment income | | | | (5,257,029 | ) | | | | (4,076,167 | ) |
| Distributions to Class A Shareholders: | | | | | | | | | | |
| From net investment income | | | | (805,490 | ) | | | | (553,131 | ) |
| Decrease in net assets from distributions to shareholders | | | | (6,062,519 | ) | | | | (4,629,298 | ) |
| | | | | | | | | | | |
| CAPITAL SHARE TRANSACTIONS (NOTE 3): | | | | | | | | | | |
| Net proceeds from shares sold | | | | 703,408,017 | | | | | 366,438,670 | |
| Dividends reinvested | | | | 4,837,618 | | | | | 3,637,200 | |
| Redemption fees (Note 2) | | | | 21,792 | | | | | 16,215 | |
| Cost of shares redeemed | | | | (571,569,245 | ) | | | | (473,550,338 | ) |
| Increase (decrease) in net assets from capital share transactions | | | | 136,698,182 | | | | | (103,458,253 | ) |
| Net increase (decrease) in net assets | | | | 136,321,913 | | | | | (103,323,785 | ) |
| NET ASSETS: | | | | | | | | | | |
| Beginning of year | | | | 975,780,201 | | | | | 1,079,103,986 | |
| End of year* | | | $ | 1,112,102,114 | | | | $ | 975,780,201 | |
| * Including accumulated net investment loss of: | | | $ | (12 | ) | | | $ | (21 | ) |
The accompanying notes are an integral part of these financial statements.
82
Alpine Mutual Funds
Statements of Changes in Net Assets—Continued
| | | High Yield Managed
Duration Municipal Fund |
| | | Year Ended
October 31, 2016 | | Year Ended
October 31, 2015 |
| OPERATIONS: | | | | | | | | | | |
| Net investment income | | | $ | 3,620,716 | | | | $ | 1,364,631 | |
| Net realized loss from investments | | | | (917,105 | ) | | | | (3,311 | ) |
| Change in net unrealized appreciation/(depreciation) on investments | | | | 789,473 | | | | | (47,109 | ) |
| Increase in net assets from operations | | | | 3,493,084 | | | | | 1,314,211 | |
| | | | | | | | | | | |
| DISTRIBUTIONS TO SHAREHOLDERS: | | | | | | | | | | |
| Distributions to Institutional Class Shareholders: | | | | | | | | | | |
| From net investment income | | | | (2,887,562 | ) | | | | (1,240,090 | ) |
| From net realized gain on investments | | | | — | | | | | (14,739 | ) |
| Distributions to Class A Shareholders: | | | | | | | | | | |
| From net investment income | | | | (733,144 | ) | | | | (124,386 | ) |
| From net realized gain on investments | | | | — | | | | | (1,479 | ) |
| Decrease in net assets from distributions to shareholders | | | | (3,620,706 | ) | | | | (1,380,694 | ) |
| | | | | | | | | | | |
| CAPITAL SHARE TRANSACTIONS (NOTE 3): | | | | | | | | | | |
| Net proceeds from shares sold | | | | 156,983,773 | | | | | 35,898,673 | |
| Dividends reinvested | | | | 2,564,687 | | | | | 1,136,399 | |
| Redemption fees (Note 2) | | | | 27,563 | | | | | 4,830 | |
| Cost of shares redeemed | | | | (28,873,503 | ) | | | | (4,216,056 | ) |
| Increase in net assets from capital share transactions | | | | 130,702,520 | | | | | 32,823,846 | |
| Net increase in net assets | | | | 130,574,898 | | | | | 32,757,363 | |
| | | | | | | | | | | |
| NET ASSETS: | | | | | | | | | | |
| Beginning of year | | | | 58,430,432 | | | | | 25,673,069 | |
| End of year* | | | $ | 189,005,330 | | | | $ | 58,430,432 | |
| * Including undistributed net investment income of: | | | $ | 262 | | | | $ | 252 | |
The accompanying notes are an integral part of these financial statements.
83
Alpine Mutual Funds
Financial Highlights
(For a share outstanding throughout each year)
| | | | Dynamic Dividend Fund | |
| | | | Years Ended October 31, | |
| | | | 2016 | | | | 2015† | | | | 2014† | | | | 2013† | | | | 2012† | |
| Institutional Class: | | | | | | | | | | | | | | | | | | | | | | | | | |
| Net asset value per share, beginning of year | | | $ | 3.73 | | | | $ | 3.83 | | | | $ | 3.77 | | | | $ | 3.49 | | | | $ | 3.84 | |
| Income from investment operations: | | | | | | | | | | | | | | | | | | | | | | | | | |
| Net investment income | | | | 0.21 | | | | | 0.25 | | | | | 0.21 | | | | | 0.22 | | | | | 0.50 | |
| Net realized and unrealized gain (loss) | | | | (0.21 | ) | | | | (0.11 | ) | | | | 0.09 | | | | | 0.34 | | | | | (0.35 | ) |
| Total from investment operations | | | | 0.00 | | | | | 0.14 | | | | | 0.30 | | | | | 0.56 | | | | | 0.15 | |
| Redemption fees | | | | 0.00 | (a) | | | | 0.00 | (a) | | | | 0.00 | (a) | | | | 0.00 | (a) | | | | 0.00 | (a) |
| Less distributions: | | | | | | | | | | | | | | | | | | | | | | | | | |
| From net investment income | | | | (0.22 | ) | | | | (0.24 | ) | | | | (0.24 | ) | | | | (0.28 | ) | | | | (0.50 | ) |
| From net realized gains | | | | — | | | | | (0.00 | )(a) | | | | — | | | | | — | | | | | — | |
| Tax return of capital | | | | (0.02 | ) | | | | — | | | | | — | | | | | — | | | | | — | |
| Total distributions | | | | (0.24 | ) | | | | (0.24 | ) | | | | (0.24 | ) | | | | (0.28 | ) | | | | (0.50 | ) |
| Net asset value per share, end of year | | | $ | 3.49 | | | | $ | 3.73 | | | | $ | 3.83 | | | | $ | 3.77 | | | | $ | 3.49 | |
| Total return | | | | 0.18 | % | | | | 3.59 | % | | | | 8.09 | % | | | | 17.02 | % | | | | 4.46 | % |
| Ratios/Supplemental Data: | | | | | | | | | | | | | | | | | | | | | | | | | |
| Net Assets at end of year (000) | | | $ | 151,200 | | | | $ | 182,039 | | | | $ | 210,436 | | | | $ | 247,276 | | | | $ | 353,501 | |
| Ratio of total expenses to average net assets: | | | | | | | | | | | | | | | | | | | | | | | | | |
| Before waivers and/or expense reimbursements (b) | | | | 1.31 | % | | | | 1.27 | % | | | | 1.44 | % | | | | 1.43 | % | | | | 1.28 | % |
| After waivers and/or expense reimbursements (c) | | | | 1.30 | % | | | | 1.27 | % | | | | 1.38 | % | | | | 1.38 | % | | | | — | % |
| Ratio of net investment income to average net assets | | | | 6.13 | % | | | | 6.28 | % | | | | 5.30 | % | | | | 5.78 | % | | | | 13.17 | % |
| Portfolio turnover (d) | | | | 88 | % | | | | 111 | % | | | | 81 | % | | | | 197 | % | | | | 258 | % |
| † | Beginning with the year ended October 31, 2015, the Fund was audited by Ernst & Young LLP. The previous years were audited by another independent registered public accounting firm. |
| (a) | The amount is less than $0.005 per share. |
| (b) | Ratio of total expenses to average net assets excluding interest expense before waivers and/or expense reimbursements was 1.30%, 1.24%, 1.41%, 1.40% and 1.27% for the years ended October 31, 2016, 2015, 2014, 2013 and 2012, respectively. |
| (c) | Ratio of total expenses to average net assets excluding interest expense after waivers and/or expense reimbursements was 1.29%, 1.24%, 1.35%, 1.35% and 0.00% for the years ended October 31, 2016, 2015, 2014, 2013 and 2012, respectively. |
| (d) | Portfolio turnover is calculated on the basis of the Fund as a whole, without distinguishing between classes of shares issued. |
The accompanying notes are an integral part of these financial statements.
84
Alpine Mutual Funds
Financial Highlights—Continued
(For a share outstanding throughout each year or period)
| | | Dynamic Dividend Fund | |
| | | Years Ended October 31, | | Period
Ended
October 31, | |
| | | 2016 | | | 2015† | | | 2014† | | | 2013† | | | 2012†(a) | |
| Class A: | | | | | | | | | | | | | | | | | | | | | | | | | |
| Net asset value per share, beginning of period | | | $ | 3.73 | | | | $ | 3.83 | | | | $ | 3.77 | | | | $ | 3.49 | | | | $ | 3.61 | |
| Income from investment operations: | | | | | | | | | | | | | | | | | | | | | | | | | |
| Net investment income | | | | 0.18 | | | | | 0.24 | | | | | 0.17 | | | | | 0.23 | | | | | 0.35 | |
| Net realized and unrealized gain (loss) | | | | (0.19 | ) | | | | (0.11 | ) | | | | 0.12 | | | | | 0.33 | | | | | (0.06 | ) |
| Total from investment operations | | | | (0.01 | ) | | | | 0.13 | | | | | 0.29 | | | | | 0.56 | | | | | 0.29 | |
| Redemption fees | | | | 0.00 | (b) | | | | 0.00 | (b) | | | | 0.00 | (b) | | | | 0.00 | (b) | | | | 0.00 | (b) |
| Less distributions: | | | | | | | | | | | | | | | | | | | | | | | | | |
| From net investment income | | | | (0.21 | ) | | | | (0.23 | ) | | | | (0.23 | ) | | | | (0.28 | ) | | | | (0.41 | ) |
| From net realized gains | | | | — | | | | | (0.00 | )(b) | | | | — | | | | | — | | | | | — | |
| Tax return of capital | | | | (0.02 | ) | | | | — | | | | | — | | | | | — | | | | | — | |
| Total distributions | | | | (0.23 | ) | | | | (0.23 | ) | | | | (0.23 | ) | | | | (0.28 | ) | | | | (0.41 | ) |
| Net asset value per share, end of period | | | $ | 3.49 | | | | $ | 3.73 | | | | $ | 3.83 | | | | $ | 3.77 | | | | $ | 3.49 | |
| Total return (c) | | | | (0.06 | )% | | | | 3.34 | % | | | | 7.83 | % | | | | 16.73 | % | | | | 8.36 | %(d) |
| Ratios/Supplemental Data | | | | | | | | | | | | | | | | | | | | | | | | | |
| Net Assets at end of period (000) | | | $ | 3,865 | | | | $ | 4,010 | | | | $ | 4,219 | | | | $ | 2,479 | | | | $ | 1,612 | |
| Ratio of total expenses to average net assets: | | | | | | | | | | | | | | | | | | | | | | | | | |
| Before waivers and/or expense reimbursements (e) | | | | 1.56 | % | | | | 1.52 | % | | | | 1.69 | % | | | | 1.68 | % | | | | 1.56 | %(f) |
| After waivers and/or expense reimbursements (g) | | | | 1.55 | % | | | | 1.52 | % | | | | 1.63 | % | | | | 1.63 | % | | | | — | % |
| Ratio of net investment income to average net assets | | | | 5.02 | % | | | | 5.95 | % | | | | 4.51 | % | | | | 5.38 | % | | | | 8.02 | %(f) |
| Portfolio turnover (h) | | | | 88 | % | | | | 111 | % | | | | 81 | % | | | | 197 | % | | | | 258 | % |
| † | Beginning with the year ended October 31, 2015, the Fund was audited by Ernst & Young LLP. The previous years were audited by another independent registered public accounting firm. |
| (a) | Class A commenced operations on December 30, 2011. |
| (b) | The amount is less than $0.005 per share. |
| (c) | Total returns would be reduced if a sales or redemption charge was taken into account. |
| (d) | Not annualized. |
| (e) | Ratio of total expenses to average net assets excluding interest expense before waivers and/or expense reimbursements was 1.55%, 1.49%, 1.66% and 1.65% for the years ended October 31, 2016, 2015, 2014 and 2013, respectively, and 1.55% for the period ended October 31, 2012. |
| (f) | Annualized. |
| (g) | Ratio of total expenses to average net assets excluding interest expense after waivers and/or expense reimbursements was 1.54%, 1.49%, 1.60% and 1.60% for the years ended October 31, 2016, 2015, 2014 and 2013, respectively, and 0.00% for the period ended October 31, 2012. |
| (h) | Portfolio turnover is calculated on the basis of the Fund as a whole, without distinguishing between classes of shares issued. |
The accompanying notes are an integral part of these financial statements.
85
Alpine Mutual Funds
Financial Highlights—Continued
(For a share outstanding throughout each year)
| | | Rising Dividend Fund | |
| | | Years Ended October 31, | |
| | | 2016 | | | 2015† | | | 2014† | | | 2013† | | | 2012† | |
| Institutional Class: | | | | | | | | | | | | | | | | | | | | | | | | | |
| Net asset value per share, beginning of year | | | $ | 15.05 | | | | $ | 15.88 | | | | $ | 15.19 | | | | $ | 12.88 | | | | $ | 12.83 | |
| Income from investment operations: | | | | | | | | | | | | | | | | | | | | | | | | | |
| Net investment income | | | | 0.63 | | | | | 0.38 | | | | | 0.49 | | | | | 0.51 | | | | | 0.62 | |
| Net realized and unrealized gain (loss) | | | | (0.35 | ) | | | | (0.02 | ) | | | | 1.29 | | | | | 2.65 | | | | | 0.73 | |
| Total from investment operations | | | | 0.28 | | | | | 0.36 | | | | | 1.78 | | | | | 3.16 | | | | | 1.35 | |
| Redemption fees | | | | 0.00 | (a) | | | | — | | | | | 0.01 | | | | | 0.03 | | | | | — | |
| Less distributions: | | | | | | | | | | | | | | | | | | | | | | | | | |
| From net investment income | | | | (0.53 | ) | | | | (0.50 | ) | | | | (0.51 | ) | | | | (0.64 | ) | | | | (0.50 | ) |
| From net realized gains | | | | (0.10 | ) | | | | (0.69 | ) | | | | (0.59 | ) | | | | (0.24 | ) | | | | (0.80 | ) |
| Total distributions | | | | (0.63 | ) | | | | (1.19 | ) | | | | (1.10 | ) | | | | (0.88 | ) | | | | (1.30 | ) |
| Net asset value per share, end of year | | | $ | 14.70 | | | | $ | 15.05 | | | | $ | 15.88 | | | | $ | 15.19 | | | | $ | 12.88 | |
| Total return | | | | 1.86 | % | | | | 2.16 | % | | | | 12.25 | % | | | | 25.94 | % | | | | 11.28 | % |
| Ratios/Supplemental Data: | | | | | | | | | | | | | | | | | | | | | | | | | |
| Net Assets at end of year (000) | | | $ | 84,271 | | | | $ | 90,126 | | | | $ | 4,486 | | | | $ | 3,418 | | | | $ | 2,155 | |
| Ratio of total expenses to average net assets: | | | | | | | | | | | | | | | | | | | | | | | | | |
| Before waivers and/or expense reimbursements (b) | | | | 1.18 | % | | | | 1.93 | % | | | | 2.25 | % | | | | 3.43 | % | | | | 3.26 | % |
| After waivers and/or expense reimbursements (c) | | | | 1.18 | % | | | | 1.35 | % | | | | 1.35 | % | | | | 1.35 | % | | | | 1.35 | % |
| Ratio of net investment income to average net assets | | | | 4.24 | % | | | | 2.14 | % | | | | 3.33 | % | | | | 3.94 | % | | | | 4.52 | % |
| Portfolio turnover (d) | | | | 93 | % | | | | 97 | % | | | | 78 | % | | | | 86 | % | | | | 73 | % |
| † | Beginning with the year ended October 31, 2015, the Fund was audited by Ernst & Young LLP. The previous years were audited by another independent registered public accounting firm. |
| (a) | The amount is less than $0.005 per share. |
| (b) | Ratio of total expenses to average net assets excluding interest expense before waivers and/or expense reimbursements was 1.18%, 1.93%, 2.25%, 3.43% and 3.26% for the years ended October 31, 2016, 2015, 2014, 2013 and 2012, respectively. |
| (c) | Ratio of total expenses to average net assets excluding interest expense after waivers and/or expense reimbursements was 1.18%, 1.35%, 1.35%, 1.35% and 1.35% for the years ended October 31, 2016, 2015, 2014, 2013 and 2012, respectively. |
| (d) | Portfolio turnover is calculated on the basis of the Fund as a whole, without distinguishing between classes of shares issued. |
The accompanying notes are an integral part of these financial statements.
86
Alpine Mutual Funds
Financial Highlights—Continued
(For a share outstanding throughout each year or period)
| | | Rising Dividend Fund | |
| | | Years Ended October 31, | | | Period
Ended
October 31, | |
| | | 2016 | | | 2015† | | | 2014† | | | 2013† | | | 2012†(a) | |
| Class A: | | | | | | | | | | | | | | | | | | | | | | | | | |
| Net asset value per share, beginning of period | | | $ | 15.05 | | | | $ | 15.88 | | | | $ | 15.18 | | | | $ | 12.88 | | | | $ | 12.02 | |
| Income from investment operations: | | | | | | | | | | | | | | | | | | | | | | | | | |
| Net investment income | | | | 0.68 | | | | | 0.43 | | | | | 0.38 | | | | | 0.63 | | | | | 0.31 | |
| Net realized and unrealized gain (loss) | | | | (0.44 | ) | | | | (0.10 | ) | | | | 1.37 | | | | | 2.48 | | | | | 0.92 | |
| Total from investment operations | | | | 0.24 | | | | | 0.33 | | | | | 1.75 | | | | | 3.11 | | | | | 1.23 | |
| Redemption fees | | | | 0.00 | (b) | | | | — | | | | | 0.01 | | | | | 0.04 | | | | | — | |
| Less distributions: | | | | | | | | | | | | | | | | | | | | | | | | | |
| From net investment income | | | | (0.49 | ) | | | | (0.47 | ) | | | | (0.47 | ) | | | | (0.61 | ) | | | | (0.37 | ) |
| From net realized gains | | | | (0.10 | ) | | | | (0.69 | ) | | | | (0.59 | ) | | | | (0.24 | ) | | | | — | |
| Total distributions | | | | (0.59 | ) | | | | (1.16 | ) | | | | (1.06 | ) | | | | (0.85 | ) | | | | (0.37 | ) |
| Net asset value per share, end of period | | | $ | 14.70 | | | | $ | 15.05 | | | | $ | 15.88 | | | | $ | 15.18 | | | | $ | 12.88 | |
| Total return (c) | | | | 1.59 | % | | | | 1.93 | % | | | | 12.04 | % | | | | 25.55 | % | | | | 10.29 | %(d) |
| Ratios/Supplemental Data | | | | | | | | | | | | | | | | | | | | | | | | | |
| Net Assets at end of period (000) | | | $ | 1,270 | | | | $ | 2,358 | | | | $ | 865 | | | | $ | 917 | | | | $ | 257 | |
| Ratio of total expenses to average net assets: | | | | | | | | | | | | | | | | | | | | | | | | | |
| Before waivers and/or expense reimbursements (e) | | | | 1.41 | % | | | | 2.18 | % | | | | 2.50 | % | | | | 3.68 | % | | | | 3.83 | %(f) |
| After waivers and/or expense reimbursements (g) | | | | 1.41 | % | | | | 1.60 | % | | | | 1.60 | % | | | | 1.60 | % | | | | 1.60 | %(f) |
| Ratio of net investment income to average net assets | | | | 4.46 | % | | | | 2.65 | % | | | | 2.41 | % | | | | 3.72 | % | | | | 2.71 | %(f) |
| Portfolio turnover (h) | | | | 93 | % | | | | 97 | % | | | | 78 | % | | | | 86 | % | | | | 73 | % |
| † | Beginning with the year ended October 31, 2015, the Fund was audited by Ernst & Young LLP. The previous years were audited by another independent registered public accounting firm. |
| (a) | Class A commenced operations on December 30, 2011. |
| (b) | The amount is less than $0.005 per share. |
| (c) | Total returns would be reduced if a sales or redemption charge was taken into account. |
| (d) | Not annualized. |
| (e) | Ratio of total expenses to average net assets excluding interest expense before waivers and/or expense reimbursements was 1.41%, 2.18%, 2.50% and 3.68% for the years ended October 31, 2016, 2015, 2014 and 2013, respectively, and 3.83% for the period ended October 31, 2012. |
| (f) | Annualized. |
| (g) | Ratio of total expenses to average net assets excluding interest expense after waivers and/or expense reimbursements was 1.41%, 1.60%, 1.60% and 1.60% for the years ended October 31, 2016, 2015, 2014 and 2013, respectively, and 1.60% for the period ended October 31, 2012. |
| (h) | Portfolio turnover is calculated on the basis of the Fund as a whole, without distinguishing between classes of shares issued. |
The accompanying notes are an integral part of these financial statements.
87
Alpine Mutual Funds
Financial Highlights—Continued
(For a share outstanding throughout each year)
| | | Financial Services Fund | |
| | | Years Ended October 31, | |
| | | 2016 | | | 2015† | | | 2014† | | | 2013† | | | 2012† | |
| Institutional Class: | | | | | | | | | | | | | | | | | | | | | | | | | |
| Net asset value per share, beginning of year | | | $ | 12.99 | | | | $ | 13.48 | | | | $ | 12.13 | | | | $ | 8.77 | | | | $ | 7.15 | |
| Income from investment operations: | | | | | | | | | | | | | | | | | | | | | | | | | |
| Net investment income (loss) | | | | 0.05 | | | | | 0.10 | | | | | (0.01 | ) | | | | (0.02 | ) | | | | (0.00 | )(a) |
| Net realized and unrealized gain (loss) | | | | 0.71 | | | | | (0.43 | ) | | | | 1.36 | | | | | 3.36 | | | | | 1.64 | |
| Total from investment operations | | | | 0.76 | | | | | (0.33 | ) | | | | 1.35 | | | | | 3.34 | | | | | 1.64 | |
| Redemption fees | | | | 0.00 | (a) | | | | 0.00 | (a) | | | | 0.00 | (a) | | | | 0.02 | | | | | 0.00 | (a) |
| Less distributions: | | | | | | | | | | | | | | | | | | | | | | | | | |
| From net investment income | | | | (0.19 | ) | | | | (0.16 | ) | | | | (0.00 | )(a) | | | | — | | | | | — | |
| From net realized gains | | | | — | | | | | (0.00 | )(a) | | | | — | | | | | — | | | | | — | |
| Tax return of capital | | | | — | | | | | — | | | | | — | | | | | — | | | | | (0.02 | ) |
| Total distributions | | | | (0.19 | ) | | | | (0.16 | ) | | | | — | | | | | — | | | | | (0.02 | ) |
| Net asset value per share, end of year | | | $ | 13.56 | | | | $ | 12.99 | | | | $ | 13.48 | | | | $ | 12.13 | | | | $ | 8.77 | |
| Total return | | | | 5.97 | % | | | | (2.51 | )% | | | | 11.16 | % | | | | 38.31 | % | | | | 22.95 | % |
| Ratios/Supplemental Data: | | | | | | | | | | | | | | | | | | | | | | | | | |
| Net Assets at end of year (000) | | | $ | 11,985 | | | | $ | 19,452 | | | | $ | 27,995 | | | | $ | 13,561 | | | | $ | 8,874 | |
| Ratio of total expenses to average net assets: | | | | | | | | | | | | | | | | | | | | | | | | | |
| Before waivers and/or expense reimbursements (b) | | | | 1.63 | % | | | | 1.86 | % | | | | 1.36 | % | | | | 1.72 | % | | | | 1.94 | % |
| After waivers and/or expense reimbursements (c) | | | | 1.30 | % | | | | 1.38 | % | | | | 1.36 | % | | | | 1.36 | % | | | | 1.38 | % |
| Ratio of net investment income (loss) to average net assets | | | | 0.49 | % | | | | 0.63 | % | | | | (0.08 | )% | | | | (0.20 | )% | | | | (0.16 | )% |
| Portfolio turnover (d) | | | | 93 | % | | | | 80 | % | | | | 131 | % | | | | 108 | % | | | | 120 | % |
| † | Beginning with the year ended October 31, 2015, the Fund was audited by Ernst & Young LLP. The previous years were audited by another independent registered public accounting firm. |
| (a) | The amount is less than $0.005 per share. |
| (b) | Ratio of total expenses to average net assets excluding interest expense before waivers and/or expense reimbursements was 1.63%, 1.82%, 1.33%, 1.71% and 1.91% for the years ended October 31, 2016, 2015, 2014, 2013 and 2012, respectively. |
| (c) | Ratio of total expenses to average net assets excluding interest expense after waivers and/or expense reimbursements was 1.30%, 1.35%, 1.33%, 1.35% and 1.35% for the years ended October 31, 2016, 2015, 2014, 2013 and 2012, respectively. |
| (d) | Portfolio turnover is calculated on the basis of the Fund as a whole, without distinguishing between classes of shares issued. |
The accompanying notes are an integral part of these financial statements.
88
Alpine Mutual Funds
Financial Highlights—Continued
(For a share outstanding throughout each year or period)
| | | Financial Services Fund | |
| | | Years Ended October 31, | | | Period
Ended
October 31, | |
| | | 2016 | | | 2015† | | | 2014† | | | 2013† | | | 2012†(a) | |
| Class A: | | | | | | | | | | | | | | | | | | | | | | | | | |
| Net asset value per share, beginning of period | | | $ | 12.89 | | | | $ | 13.39 | | | | $ | 12.08 | | | | $ | 8.75 | | | | $ | 6.90 | |
| Income from investment operations: | | | | | | | | | | | | | | | | | | | | | | | | | |
| Net investment income (loss) | | | | (0.19 | ) | | | | 0.04 | | | | | (0.06 | ) | | | | (0.04 | ) | | | | (0.01 | ) |
| Net realized and unrealized gain (loss) | | | | 0.92 | | | | | (0.40 | ) | | | | 1.37 | | | | | 3.35 | | | | | 1.86 | |
| Total from investment operations | | | | 0.73 | | | | | (0.36 | ) | | | | 1.31 | | | | | 3.31 | | | | | 1.85 | |
| Redemption fees | | | | 0.00 | (b) | | | | 0.00 | (b) | | | | 0.00 | (b) | | | | 0.02 | | | | | 0.00 | (b) |
| Less distributions: | | | | | | | | | | | | | | | | | | | | | | | | | |
| From net investment income | | | | (0.16 | ) | | | | (0.14 | ) | | | | — | | | | | — | | | | | — | |
| From net realized gains | | | | — | | | | | (0.00 | )(b) | | | | — | | | | | — | | | | | — | |
| Total distributions | | | | (0.16 | ) | | | | (0.14 | ) | | | | — | | | | | — | | | | | — | |
| Net asset value per share, end of period | | | $ | 13.46 | | | | $ | 12.89 | | | | $ | 13.39 | | | | $ | 12.08 | | | | $ | 8.75 | |
| Total return (c) | | | | 5.72 | % | | | | (2.75 | )% | | | | 10.84 | % | | | | 38.06 | % | | | | 26.81 | %(d) |
| Ratios/Supplemental Data | | | | | | | | | | | | | | | | | | | | | | | | | |
| Net Assets at end of period (000) | | | $ | 1,940 | | | | $ | 5,844 | | | | $ | 8,268 | | | | $ | 7,318 | | | | $ | 1,375 | |
| Ratio of total expenses to average net assets: | | | | | | | | | | | | | | | | | | | | | | | | | |
| Before waivers and/or expense reimbursements (e) | | | | 1.89 | % | | | | 2.10 | % | | | | 1.61 | % | | | | 1.97 | % | | | | 2.05 | %(f) |
| After waivers and/or expense reimbursements (g) | | | | 1.56 | % | | | | 1.63 | % | | | | 1.61 | % | | | | 1.61 | % | | | | 1.53 | %(f) |
| Ratio of net investment income (loss) to average net assets | | | | 0.28 | % | | | | 0.36 | % | | | | (0.36 | )% | | | | (0.44 | )% | | | | (0.50 | )%(f) |
| Portfolio turnover (h) | | | | 93 | % | | | | 80 | % | | | | 131 | % | | | | 108 | % | | | | 120 | % |
| † | Beginning with the year ended October 31, 2015, the Fund was audited by Ernst & Young LLP. The previous years were audited by another independent registered public accounting firm. |
| (a) | Class A commenced operations on December 30, 2011. |
| (b) | The amount is less than $0.005 per share. |
| (c) | Total returns would be reduced if a sales or redemption charge was taken into account. |
| (d) | Not annualized. |
| (e) | Ratio of total expenses to average net assets excluding interest expense before waivers and/or expense reimbursements was 1.88%, 2.07%, 1.61% and 1.96% for the years ended October 31, 2016, 2015, 2014 and 2013, respectively, and 2.05% for the period ended October 31, 2012. |
| (f) | Annualized. |
| (g) | Ratio of total expenses to average net assets excluding interest expense after waivers and/or expense reimbursements was 1.56%, 1.60%, 1.61% and 1.60% for the years ended October 31, 2016, 2015, 2014 and 2013, respectively, and 1.53% for the period ended October 31, 2012. |
| (h) | Portfolio turnover is calculated on the basis of the Fund as a whole, without distinguishing between classes of shares issued. |
The accompanying notes are an integral part of these financial statements.
89
Alpine Mutual Funds
Financial Highlights—Continued
(For a share outstanding throughout each year)
| | | Small Cap Fund | |
| | | Years Ended October 31, | |
| | | 2016 | | | 2015† | | | 2014† | | | 2013† | | | 2012† | |
| Institutional Class: | | | | | | | | | | | | | | | | | | | | | | | | | |
| Net asset value per share, beginning of year | | | $ | 14.75 | | | | $ | 14.08 | | | | $ | 14.25 | | | | $ | 11.33 | | | | $ | 10.48 | |
| Income from investment operations: | | | | | | | | | | | | | | | | | | | | | | | | | |
| Net investment loss | | | | (0.11 | ) | | | | (0.06 | ) | | | | (0.09 | ) | | | | (0.14 | ) | | | | (0.13 | ) |
| Net realized and unrealized gain (loss) | | | | 1.25 | | | | | 0.73 | | | | | (0.08 | ) | | | | 3.06 | | | | | 0.98 | |
| Total from investment operations | | | | 1.14 | | | | | 0.67 | | | | | (0.17 | ) | | | | 2.92 | | | | | 0.85 | |
| Redemption fees | | | | 0.00 | (a) | | | | 0.00 | (a) | | | | 0.00 | (a) | | | | 0.00 | (a) | | | | 0.00 | (a) |
| Net asset value per share, end of year | | | $ | 15.89 | | | | $ | 14.75 | | | | $ | 14.08 | | | | $ | 14.25 | | | | $ | 11.33 | |
| Total return | | | | 7.73 | % | | | | 4.76 | % | | | | (1.19 | )% | | | | 25.77 | % | | | | 8.11 | % |
| Ratios/Supplemental Data: | | | | | | | | | | | | | | | | | | | | | | | | | |
| Net Assets at end of year (000) | | | $ | 12,596 | | | | $ | 12,673 | | | | $ | 13,589 | | | | $ | 12,263 | | | | $ | 10,877 | |
| Ratio of total expenses to average net assets: | | | | | | | | | | | | | | | | | | | | | | | | | |
| Before waivers and/or expense reimbursements (b) | | | | 1.63 | % | | | | 1.90 | % | | | | 1.62 | % | | | | 1.80 | % | | | | 1.67 | % |
| After waivers and/or expense reimbursements (c) | | | | 1.29 | % | | | | 1.35 | % | | | | 1.35 | % | | | | 1.35 | % | | | | 1.36 | % |
| Ratio of net investment loss to average net assets | | | | (0.68 | )% | | | | (0.35 | )% | | | | (0.73 | )% | | | | (0.97 | )% | | | | (1.07 | )% |
| Portfolio turnover (d) | | | | 85 | % | | | | 96 | % | | | | 171 | % | | | | 39 | % | | | | 29 | % |
| † | Beginning with the year ended October 31, 2015, the Fund was audited by Ernst & Young LLP. The previous years were audited by another independent registered public accounting firm. |
| (a) | The amount is less than $0.005 per share. |
| (b) | Ratio of total expenses to average net assets excluding interest expense before waivers and/or expense reimbursements was 1.63%, 1.90%, 1.62%, 1.80% and 1.66% for the years ended October 31, 2016, 2015, 2014, 2013 and 2012, respectively. |
| (c) | Ratio of total expenses to average net assets excluding interest expense after waivers and/or expense reimbursements was 1.29%, 1.35%, 1.35%, 1.35% and 1.35% for the years ended October 31, 2016, 2015, 2014, 2013 and 2012, respectively. |
| (d) | Portfolio turnover is calculated on the basis of the Fund as a whole, without distinguishing between classes of shares issued. |
The accompanying notes are an integral part of these financial statements.
90
Alpine Mutual Funds
Financial Highlights—Continued
(For a share outstanding throughout each year or period)
| | | Small Cap Fund | |
| | | Years Ended October 31, | | | Period
Ended
October 31, | |
| | | 2016 | | | 2015† | | | 2014† | | | 2013† | | | 2012†(a) | |
| Class A: | | | | | | | | | | | | | | | | | | | | | | | | | |
| Net asset value per share, beginning of period | | | $ | 14.60 | | | | $ | 13.98 | | | | $ | 14.18 | | | | $ | 11.30 | | | | $ | 10.17 | |
| Income from investment operations: | | | | | | | | | | | | | | | | | | | | | | | | | |
| Net investment income (loss) | | | | (0.24 | ) | | | | (0.09 | ) | | | | 0.07 | | | | | (0.16 | ) | | | | (0.14 | ) |
| Net realized and unrealized gain (loss) | | | | 1.32 | | | | | 0.71 | | | | | (0.27 | ) | | | | 3.04 | | | | | 1.27 | |
| Total from investment operations | | | | 1.08 | | | | | 0.62 | | | | | (0.20 | ) | | | | 2.88 | | | | | 1.13 | |
| Redemption fees | | | | 0.00 | (b) | | | | 0.00 | (b) | | | | 0.00 | (b) | | | | 0.00 | (b) | | | | — | |
| Net asset value per share, end of period | | | $ | 15.68 | | | | $ | 14.60 | | | | $ | 13.98 | | | | $ | 14.18 | | | | $ | 11.30 | |
| Total return (c) | | | | 7.40 | %(d) | | | | 4.43 | % | | | | (1.41 | )% | | | | 25.49 | % | | | | 11.11 | %(e) |
| Ratios/Supplemental Data | | | | | | | | | | | | | | | | | | | | | | | | | |
| Net Assets at end of period (000) | | | $ | 604 | | | | $ | 1,155 | | | | $ | 1,221 | | | | $ | 139 | | | | $ | 111 | |
| Ratio of total expenses to average net assets: | | | | | | | | | | | | | | | | | | | | | | | | | |
| Before waivers and/or expense reimbursements (f) | | | | 1.88 | % | | | | 2.15 | % | | | | 1.87 | % | | | | 2.05 | % | | | | 1.92 | %(g) |
| After waivers and/or expense reimbursements (h) | | | | 1.54 | % | | | | 1.60 | % | | | | 1.60 | % | | | | 1.60 | % | | | | 1.60 | %(g) |
| Ratio of net investment loss to average net assets | | | | (0.88 | )% | | | | (0.59 | )% | | | | (0.92 | )% | | | | (1.22 | )% | | | | (1.34 | )%(g) |
| Portfolio turnover (i) | | | | 85 | % | | | | 96 | % | | | | 171 | % | | | | 39 | % | | | | 29 | % |
| † | Beginning with the year ended October 31, 2015, the Fund was audited by Ernst & Young LLP. The previous years were audited by another independent registered public accounting firm. |
| (a) | Class A commenced operations on December 30, 2011. |
| (b) | The amount is less than $0.005 per share. |
| (c) | Total returns would be reduced if a sales or redemption charge was taken into account. |
| (d) | Generally accepted accounting principles require adjustments to be made to the net assets of the Fund at period end for financial reporting purposes, and as such, the net asset values for shareholder transactions and the returns based on those net asset values may differ from the net asset values and returns reported in the management’s discussion of Fund performance. |
| (e) | Not annualized. |
| (f) | Ratio of total expenses to average net assets excluding interest expense before waivers and/or expense reimbursements was 1.88%, 2.15%, 1.87% and 2.05% for the years ended October 31, 2016, 2015, 2014 and 2013, respectively, and 1.92% for the period ended October 31, 2012. |
| (g) | Annualized. |
| (h) | Ratio of total expenses to average net assets excluding interest expense after waivers and/or expense reimbursements was 1.54%, 1.60%, 1.60% and 1.60% for the years ended October 31, 2016, 2015, 2014 and 2013, respectively, and 1.60% for the period ended October 31, 2012. |
| (i) | Portfolio turnover is calculated on the basis of the Fund as a whole, without distinguishing between classes of shares issued. |
The accompanying notes are an integral part of these financial statements.
91
Alpine Mutual Funds
Financial Highlights—Continued
(For a share outstanding throughout each year)
| | | Ultra Short Municipal Income Fund | |
| | | Years Ended October 31, | |
| | | 2016 | | | 2015† | | | 2014† | | | 2013† | | | 2012† | |
| Institutional Class: (a) | | | | | | | | | | | | | | | | | | | | | | | | | |
| Net asset value per share, beginning of year | | | $ | 10.04 | | | | $ | 10.04 | | | | $ | 10.03 | | | | $ | 10.05 | | | | $ | 10.05 | |
| Income from investment operations: | | | | | | | | | | | | | | | | | | | | | | | | | |
| Net investment income | | | | 0.06 | | | | | 0.05 | | | | | 0.05 | | | | | 0.06 | | | | | 0.10 | |
| Net realized and unrealized gain (loss) | | | | (0.00 | )(b) | | | | 0.00 | (b) | | | | 0.01 | | | | | (0.02 | ) | | | | 0.00 | (b) |
| Total from investment operations | | | | 0.06 | | | | | 0.05 | | | | | 0.06 | | | | | 0.04 | | | | | 0.10 | |
| Redemption fees | | | | 0.00 | (b) | | | | 0.00 | (b) | | | | 0.00 | (b) | | | | 0.00 | (b) | | | | 0.00 | (b) |
| Less distributions: | | | | | | | | | | | | | | | | | | | | | | | | | |
| From net investment income | | | | (0.06 | ) | | | | (0.05 | ) | | | | (0.05 | ) | | | | (0.06 | ) | | | | (0.10 | ) |
| From net realized gains | | | | — | | | | | (0.00 | )(b) | | | | — | | | | | — | | | | | — | |
| Total distributions | | | | (0.06 | ) | | | | (0.05 | ) | | | | (0.05 | ) | | | | (0.06 | ) | | | | (0.10 | ) |
| Net asset value per share, end of year | | | $ | 10.04 | | | | $ | 10.04 | | | | $ | 10.04 | | | | $ | 10.03 | | | | $ | 10.05 | |
| Total return | | | | 0.64 | % | | | | 0.52 | % | | | | 0.63 | % | | | | 0.36 | % | | | | 0.95 | % |
| Ratios/Supplemental Data: | | | | | | | | | | | | | | | | | | | | | | | | | |
| Net Assets at end of year (000) | | | $ | 905,843 | | | | $ | 772,308 | | | | $ | 831,505 | | | | $ | 933,294 | | | | $ | 1,375,490 | |
| Ratio of total expenses to average net assets: | | | | | | | | | | | | | | | | | | | | | | | | | |
| Before waivers and/or expense reimbursements | | | | 0.74 | % | | | | 0.93 | % | | | | 0.90 | % | | | | 0.89 | % | | | | 0.84 | % |
| After waivers and/or expense reimbursements | | | | 0.43 | % | | | | 0.50 | % | | | | 0.53 | % | | | | 0.61 | % | | | | 0.65 | % |
| Ratio of net investment income to average net assets | | | | 0.64 | % | | | | 0.51 | % | | | | 0.53 | % | | | | 0.55 | % | | | | 0.95 | % |
| Portfolio turnover (c) | | | | 143 | % | | | | 155 | % | | | | 168 | % | | | | 185 | % | | | | 192 | % |
| † | Beginning with the year ended October 31, 2015, the Fund was audited by Ernst & Young LLP. The previous years were audited by another independent registered public accounting firm. |
| (a) | Effective January 3, 2012, the share class was renamed Institutional Class. |
| (b) | The amount is less than $0.005 per share. |
| (c) | Portfolio turnover is calculated on the basis of the Fund as a whole, without distinguishing between classes of shares issued. |
The accompanying notes are an integral part of these financial statements.
92
Alpine Mutual Funds
Financial Highlights—Continued
(For a share outstanding throughout each year)
| | | Ultra Short Municipal Income Fund | |
| | | Years Ended October 31, | |
| | | 2016 | | | 2015† | | | 2014† | | | 2013† | | | 2012† | |
| Class A: (a) | | | | | | | | | | | | | | | | | | | | | | | | | |
| Net asset value per share, beginning of year | | | $ | 10.10 | | | | $ | 10.10 | | | | $ | 10.09 | | | | $ | 10.10 | | | | $ | 10.10 | |
| Income from investment operations: | | | | | | | | | | | | | | | | | | | | | | | | | |
| Net investment income | | | | 0.04 | | | | | 0.03 | | | | | 0.03 | | | | | 0.03 | | | | | 0.07 | |
| Net realized and unrealized gain (loss) | | | | (0.01 | ) | | | | 0.00 | (b) | | | | 0.01 | | | | | (0.01 | ) | | | | 0.00 | (b) |
| Total from investment operations | | | | 0.03 | | | | | 0.03 | | | | | 0.04 | | | | | 0.02 | | | | | 0.07 | |
| Redemption fees | | | | 0.00 | (b) | | | | 0.00 | (b) | | | | 0.00 | (b) | | | | 0.00 | (b) | | | | 0.00 | (b) |
| Less distributions: | | | | | | | | | | | | | | | | | | | | | | | | | |
| From net investment income | | | | (0.04 | ) | | | | (0.03 | ) | | | | (0.03 | ) | | | | (0.03 | ) | | | | (0.07 | ) |
| From net realized gains | | | | — | | | | | (0.00 | )(b) | | | | — | | | | | — | | | | | — | |
| Total distributions | | | | (0.04 | ) | | | | (0.03 | ) | | | | (0.03 | ) | | | | (0.03 | ) | | | | (0.07 | ) |
| Net asset value per share, end of year | | | $ | 10.09 | | | | $ | 10.10 | | | | $ | 10.10 | | | | $ | 10.09 | | | | $ | 10.10 | |
| Total return (c) | | | | 0.29 | % | | | | 0.26 | % | | | | 0.38 | % | | | | 0.21 | % | | | | 0.70 | % |
| Ratios/Supplemental Data | | | | | | | | | | | | | | | | | | | | | | | | | |
| Net Assets at end of year (000) | | | $ | 206,259 | | | | $ | 203,472 | | | | $ | 247,599 | | | | $ | 305,193 | | | | $ | 443,598 | |
| Ratio of total expenses to average net assets: | | | | | | | | | | | | | | | | | | | | | | | | | |
| Before waivers and/or expense reimbursements | | | | 0.99 | % | | | | 1.18 | % | | | | 1.15 | % | | | | 1.14 | % | | | | 1.09 | % |
| After waivers and/or expense reimbursements | | | | 0.68 | % | | | | 0.75 | % | | | | 0.78 | % | | | | 0.86 | % | | | | 0.90 | % |
| Ratio of net investment income to average net assets | | | | 0.39 | % | | | | 0.26 | % | | | | 0.28 | % | | | | 0.30 | % | | | | 0.67 | % |
| Portfolio turnover (d) | | | | 143 | % | | | | 155 | % | | | | 168 | % | | | | 185 | % | | | | 192 | % |
| † | Beginning with the year ended October 31, 2015, the Fund was audited by Ernst & Young LLP. The previous years were audited by another independent registered public accounting firm. |
| (a) | Effective January 3, 2012, the share class was renamed Class A. |
| (b) | The amount is less than $0.005 per share. |
| (c) | Total returns would be reduced if a sales or redemption charge was taken into account. |
| (d) | Portfolio turnover is calculated on the basis of the Fund as a whole, without distinguishing between classes of shares issued. |
The accompanying notes are an integral part of these financial statements.
93
Alpine Mutual Funds
Financial Highlights—Continued
(For a share outstanding throughout each year or period)
| | | High Yield Managed Duration Municipal Fund | |
| | | Years Ended October 31, | | | Period
Ended
October 31, | |
| | | 2016 | | | 2015† | | | 2014† | | | 2013†(a) | |
| Institutional Class: | | | | | | | | | | | | | | | | | | | | |
| Net asset value per share, beginning of period | | | $ | 10.29 | | | | $ | 10.29 | | | | $ | 9.95 | | | | $ | 10.00 | |
| Income from investment operations: | | | | | | | | | | | | | | | | | | | | |
| Net investment income | | | | 0.34 | | | | | 0.36 | | | | | 0.37 | | | | | 0.06 | |
| Net realized and unrealized gain (loss) | | | | 0.05 | | | | | (0.00 | )(b) | | | | 0.34 | | | | | (0.05 | ) |
| Total from investment operations | | | | 0.39 | | | | | 0.36 | | | | | 0.71 | | | | | 0.01 | |
| Redemption fees | | | | 0.00 | (b) | | | | — | | | | | — | | | | | — | |
| Less distributions: | | | | | | | | | | | | | | | | | | | | |
| From net investment income | | | | (0.34 | ) | | | | (0.36 | ) | | | | (0.37 | ) | | | | (0.06 | ) |
| From net realized gains | | | | — | | | | | (0.00 | )(b) | | | | — | | | | | — | |
| Total distributions | | | | (0.34 | ) | | | | (0.36 | ) | | | | (0.37 | ) | | | | (0.06 | ) |
| Net asset value per share, end of period | | | $ | 10.34 | | | | $ | 10.29 | | | | $ | 10.29 | | | | $ | 9.95 | |
| Total return | | | | 3.84 | % | | | | 3.65 | % | | | | 7.32 | % | | | | 0.11 | %(c) |
| Ratios/Supplemental Data: | | | | | | | | | | | | | | | | | | | | |
| Net Assets at end of period (000) | | | $ | 153,300 | | | | $ | 48,261 | | | | $ | 25,566 | | | | $ | 19,915 | |
| Ratio of total expenses to average net assets: | | | | | | | | | | | | | | | | | | | | |
| Before waivers and/or expense reimbursements (d) | | | | 0.88 | % | | | | 1.12 | % | | | | 1.30 | % | | | | 1.66 | %(e) |
| After waivers and/or expense reimbursements (f) | | | | 0.68 | % | | | | 0.82 | % | | | | 0.81 | % | | | | 0.74 | %(e) |
| Ratio of net investment income to average net assets | | | | 3.28 | % | | | | 3.49 | % | | | | 3.75 | % | | | | 1.47 | %(e) |
| Portfolio turnover (g) | | | | 132 | % | | | | 58 | % | | | | 62 | % | | | | 117 | % |
| † | Beginning with the year ended October 31, 2015, the Fund was audited by Ernst & Young LLP. The previous years were audited by another independent registered public accounting firm. |
| (a) | Institutional Class commenced operations on June 3, 2013. |
| (b) | The amount is less than $0.005 per share. |
| (c) | Not annualized. |
| (d) | Ratio of total expenses to average net assets excluding interest expense before waivers and/or expense reimbursements was 0.88%, 1.12%, and 1.30% for the years ended October 31, 2016, 2015 and 2014, respectively, and 1.66% for the period ended October 31, 2013. |
| (e) | Annualized. |
| (f) | Ratio of total expenses to average net assets excluding interest expense after waivers and/or expense reimbursements was 0.68%, 0.80% and 0.80% for the years ended October 31, 2016, 2015 and 2014, respectively, and 0.74% for the period ended October 31, 2013. |
| (g) | Portfolio turnover is calculated on the basis of the Fund as a whole, without distinguishing between classes of shares issued. |
The accompanying notes are an integral part of these financial statements.
94
Alpine Mutual Funds
Financial Highlights—Continued
(For a share outstanding throughout each year or period)
| | | High Yield Managed Duration Municipal Fund | |
| | | Years Ended October 31, | | | Period
Ended
October 31, | |
| | | 2016 | | | 2015† | | | 2014† | | | 2013†(a) | |
| Class A: | | | | | | | | | | | | | | | | | | | | |
| Net asset value per share, beginning of period | | | $ | 10.29 | | | | $ | 10.29 | | | | $ | 9.95 | | | | $ | 10.00 | |
| Income from investment operations: | | | | | | | | | | | | | | | | | | | | |
| Net investment income | | | | 0.32 | | | | | 0.34 | | | | | 0.35 | | | | | 0.05 | |
| Net realized and unrealized gain (loss) | | | | 0.04 | | | | | 0.00 | (b) | | | | 0.34 | | | | | (0.05 | ) |
| Total from investment operations | | | | 0.36 | | | | | 0.34 | | | | | 0.69 | | | | | 0.00 | |
| Redemption fees | | | | 0.00 | (b) | | | | — | | | | | — | | | | | — | |
| Less distributions: | | | | | | | | | | | | | | | | | | | | |
| From net investment income | | | | (0.31 | ) | | | | (0.34 | ) | | | | (0.35 | ) | | | | (0.05 | ) |
| From net realized gains | | | | — | | | | | (0.00 | )(b) | | | | — | | | | | — | |
| Total distributions | | | | (0.31 | ) | | | | (0.34 | ) | | | | (0.35 | ) | | | | (0.05 | ) |
| Net asset value per share, end of period | | | $ | 10.34 | | | | $ | 10.29 | | | | $ | 10.29 | | | | $ | 9.95 | |
| Total return (c) | | | | 3.58 | % | | | | 3.42 | % | | | | 7.08 | % | | | | 0.01 | %(d) |
| Ratios/Supplemental Data | | | | | | | | | | | | | | | | | | | | |
| Net Assets at end of period (000) | | | $ | 35,705 | | | | $ | 10,170 | | | | $ | 107 | | | | $ | 100 | |
| Ratio of total expenses to average net assets: | | | | | | | | | | | | | | | | | | | | |
| Before waivers and/or expense reimbursements (e) | | | | 1.12 | % | | | | 1.37 | % | | | | 1.55 | % | | | | 1.91 | %(f) |
| After waivers and/or expense reimbursements (g) | | | | 0.93 | % | | | | 1.07 | % | | | | 1.06 | % | | | | 0.99 | %(f) |
| Ratio of net investment income to average net assets | | | | 3.03 | % | | | | 3.16 | % | | | | 3.49 | % | | | | 1.21 | %(f) |
| Portfolio turnover (h) | | | | 132 | % | | | | 58 | % | | | | 62 | % | | | | 117 | % |
| † | Beginning with the year ended October 31, 2015, the Fund was audited by Ernst & Young LLP. The previous years were audited by another independent registered public accounting firm. |
| (a) | Class A commenced operations on June 3, 2013. |
| (b) | The amount is less than $0.005 per share. |
| (c) | Total returns would be reduced if a sales or redemption charge was taken into account. |
| (d) | Not annualized. |
| (e) | Ratio of total expenses to average net assets excluding interest expense before waivers and/or expense reimbursements was 1.12%, 1.37% and 1.55% for the years ended October 31, 2016, 2015 and 2014, respectively, and 1.91% for the period ended October 31, 2013. |
| (f) | Annualized. |
| (g) | Ratio of total expenses to average net assets excluding interest expense after waivers and/or expense reimbursements was 0.93%, 1.05% and 1.05% for the years ended October 31, 2016, 2015 and 2014, respectively, and 0.99% for the period ended October 31, 2013. |
| (h) | Portfolio turnover is calculated on the basis of the Fund as a whole, without distinguishing between classes of shares issued. |
The accompanying notes are an integral part of these financial statements.
95
Alpine Mutual Funds
Notes to Financial Statements
October 31, 2016
| 1. | Organization: |
| | |
| | Alpine Series Trust (the “Series Trust”) was organized in 2001 as a Delaware statutory trust, and is registered under the Investment Company Act of 1940, as amended (the “1940 Act”), as an open-end management investment company. Alpine Income Trust (the “Income Trust”) was organized in 2002 as a Delaware statutory trust and is registered under the 1940 Act as an open-end management investment company. The Alpine Dynamic Dividend Fund, Alpine Rising Dividend Fund, Alpine Financial Services Fund and Alpine Small Cap Fund are four separate series of the Series Trust. The Alpine Ultra Short Municipal Income Fund and Alpine High Yield Managed Duration Municipal Fund are two separate series of the Income Trust. The Alpine Dynamic Dividend Fund, Alpine Rising Dividend Fund, Alpine Financial Services Fund, Alpine Small Cap Fund, Alpine Ultra Short Municipal Income Fund and Alpine High Yield Managed Duration Municipal Fund (individually referred to as a “Fund” and collectively, “the Funds”) are diversified funds. Alpine Dynamic Dividend Fund seeks high current dividend income that qualifies for the reduced U.S. federal income tax rates created by the “Jobs and Growth Tax Relief Reconciliation Act of 2003,” while also focusing on total return for long-term growth of capital. Alpine Rising Dividend Fund seeks income. Long-term growth of capital is a secondary objective. Alpine Financial Services Fund seeks long-term growth of capital and consistent above average total returns as compared to those typical of investments made in public equities. Alpine Small Cap Fund seeks capital appreciation. Alpine Ultra Short Municipal Income Fund seeks high after-tax current income consistent with preservation of capital. Alpine High Yield Managed Duration Municipal Fund seeks a high level of current income exempt from federal income tax. |
| | |
| | Alpine Woods Capital Investors, LLC (the “Adviser”) is a Delaware limited liability company and serves as the investment manager to the Funds. The Funds offer Institutional Class and Class A shares. Institutional Class shares are sold without a sales charge. Class A shares have an initial sales charge, which may be waived under certain conditions as described in the Funds’ prospectus. Class A shares may be subject to contingent deferred sales charges (“CDSC”) for certain redemptions where no initial sales charge was paid at the time of purchase. All shares of the Funds have equal rights and privileges. Each share of a Fund is entitled to one vote on all matters as to which shares are entitled to vote, to participate equally with other shares in dividends and distributions declared by the Funds and on liquidation to their proportionate share of the assets remaining after satisfaction of outstanding liabilities, except that Class A shares bear certain expenses related to the distribution fee of such shares. Each class has exclusive voting rights with respect to the distribution fee of such class. Each class has exclusive voting rights with respect to matters relating to its shareholders servicing and distribution expenditures. |
| | |
| | The Funds are each an investment company and accordingly follow the investment company accounting and reporting guidance of the Financial Accounting Standards Board (“FASB”) Accounting Standards Codification Topic (“ASC”) 946 Financial Services - Investment Companies. |
| | |
| 2. | Significant Accounting Policies: |
| | |
| | The following is a summary of significant accounting policies consistently followed by the Funds in the preparation of their financial statements. The policies are in conformity with accounting principles generally accepted in the United States of America (“GAAP”), which require management to make estimates and assumptions that affect amounts reported herein. Actual results could differ from those estimates. Changes in the economic environment, financial markets and any other parameters used in determining these estimates could cause actual results to differ. |
| | |
| | A. Valuation of Securities: |
| | |
| | The net asset value (“NAV”) of shares of the Funds are calculated by dividing the value of the Funds’ net assets by the number of outstanding shares. NAV is determined each day the New York Stock Exchange (“NYSE”) is open as of the close of regular trading (normally, 4:00 p.m., Eastern Time). In computing NAV, portfolio securities of the Funds are valued at their current fair values determined on the basis of market quotations or if market quotations are not readily available or determined to be unreliable, through procedures and/or guidelines established by the Board. In computing the Funds’ NAV, equity securities that are traded on a securities exchange in the United States, except for those listed on NASDAQ Global Market, NASDAQ Global Select Market and NASDAQ Capital Market exchanges (collectively, “NASDAQ”) and option securities are valued at the last reported sale price as of the time of valuation. Securities traded on NASDAQ will be valued at the NASDAQ Official Closing Prices (“NOCP”). If, on a particular day, an exchange traded or NASDAQ security does not trade, then the mean between the most recent quoted bid and asked prices will be used. For equity investments traded on more than one exchange, the last reported sale price on |
96
Alpine Mutual Funds
Notes to Financial Statements—Continued
October 31, 2016
| | the exchange where the stock is primarily traded is used. Equity-linked structured notes are valued by referencing the last reported sale or settlement price of the underlying security on the day of valuation. Foreign exchange adjustments are applied to the last reported price to convert the underlying security’s trading currency to the equity-linked structured note’s settlement currency. Each option security traded on a securities exchange in the United States is valued at the last current reported sales price as of the time of valuation if the last current reported sales price falls within the consolidated bid/ask quote. If the last current reported sale price does not fall within the consolidated bid/ask quote, the security is valued at the mid-point of the consolidated bid/ask quote for the option security. Forward currency contracts are valued based on third-party vendor quotations. Each security traded in the over-the-counter market and quoted on the NASDAQ National Market System is valued at the NOCP, as determined by NASDAQ, or lacking an NOCP, the last current reported sale price as of the time of valuation by NASDAQ, or lacking any current reported sale on NASDAQ at the time of valuation, at the mean between the most recent bid and asked quotations. Each over-the-counter option that is not traded through the Options Clearing Corporation is valued by the counterparty of the option, or if the counterparty’s price is not readily available, then by using the Black-Scholes method. Debt and short-term securities are valued based on an evaluated bid price as furnished by pricing services approved by the Board, which may be based on market transactions for comparable securities and various relationships between securities that are generally recognized by institutional traders, a computerized matrix system, or appraisals derived from information concerning the securities or similar securities received from recognized dealers in those securities. Each other security traded over-the-counter is valued at the mean between the most recent bid and asked quotations. |
| | |
| | Securities that are principally traded in a foreign market are valued at the last current sale price at the time of valuation or lacking any current or reported sale, at the time of valuation, at the mean between the most recent bid and asked quotations as of the close of the appropriate exchange or other designated time. Trading in securities on European and Far Eastern securities exchanges and over-the-counter markets is normally completed at various times before the close of business on each day on which the NYSE is open. Trading of these securities may not take place on every NYSE business day. In addition, trading may take place in various foreign markets on Saturdays or on other days when the NYSE is not open and on which the Funds’ NAVs are not calculated. |
| | |
| | When market quotations are not readily available or when the valuation methods mentioned above are not reflective of a fair value of the security, the security is valued at fair value following procedures and/or guidelines approved by the Board. The Funds may also use fair value pricing, if the value of a security it holds is, pursuant to the Board guidelines, materially affected by events occurring before the Funds’ NAVs are calculated but after the close of the primary market or market transactions for comparable securities and various relationships between securities that are generally recognized by institutional traders, a computerized matrix system, or appraisals derived from information concerning the securities or similar securities received from recognized dealers in those securities. The Board has approved the use of a third-party pricing vendor’s proprietary fair value pricing model to assist in determining current valuation for foreign equities and OTC derivatives traded in markets that close prior to the NYSE. When fair value pricing is employed, the value of the portfolio security used to calculate the Funds’ NAVs may differ from quoted or official closing prices. The Fund may also fair value a security if the Fund or Adviser believes that the market price is stale. Other types of securities that the Funds may hold for which fair value pricing might be required include illiquid securities including restricted securities and private placements for which there is no public market. |
| | |
| | For securities valued by the Funds, valuation techniques are used to measure fair value that are consistent with the market approach and/or income approach, depending on the type of security and the particular circumstance. The market approach uses prices and other relevant information generated by market transactions involving comparable securities. The income approach uses valuation techniques to discount estimated future cash flows to present value. |
| | |
| | The Board of Trustees adopted procedures which utilize fair value procedures when any assets for which reliable market quotations are not readily available or for which the Funds’ pricing service does not provide a valuation or provides a valuation that in the judgment of the Adviser does not represent fair value. The Board of Trustees has established a Valuation Committee which is responsible for: (1) monitoring the valuation of Fund securities and other investments; and (2) as required, when the Board of Trustees is not in session, reviewing and approving the fair value of illiquid and other holdings after consideration of all relevant factors, which determinations are reported to the Board of Trustees. |
97
Alpine Mutual Funds
Notes to Financial Statements—Continued
October 31, 2016
Fair Value Measurement:
In accordance with FASB ASC, “Fair Value Measurement” (“ASC 820”), defines fair value as the value that the Funds would receive to sell an investment or pay to transfer a liability in a timely transaction with an independent buyer in the principal market, or in the absence of a principal market the most advantageous market for the investment or liability. ASC 820 uses a three-tier hierarchy to establish classification of fair value measurements for disclosure purposes. Inputs refer broadly to the assumptions that market participants would use in pricing the asset or liability, including assumptions about risk. Inputs may be observable or unobservable. Observable inputs are inputs that reflect the assumptions market participants would use in pricing the asset or liability that are developed based on market data obtained from sources independent of the reporting entity. Unobservable inputs are inputs that reflect the reporting entities’ own assumptions about the assumptions market participants would use in pricing the asset or liability that are developed based on the best information available.
| | • | Level 1 — | Unadjusted quoted prices in active markets for identical investments. |
| | | | |
| | • | Level 2 — | Other significant observable inputs (including quoted prices for similar instruments, interest rates, prepayment speeds, credit risk, yield curves, default rates, etc.). |
| | | | |
| | • | Level 3 — | Significant unobservable inputs (including the Funds’ own assumptions in determining the fair value of investments). |
The availability of observable inputs can vary from security to security and is affected by a wide variety of factors, including, for example, the type of security, whether the security is new and not yet established in the marketplace, the liquidity of markets, and other characteristics particular to the security. To the extent that valuation is based on models or inputs that are less observable or unobservable in the market, the determination of fair value requires more judgment. Accordingly, the degree of judgment exercised in determining fair value is greatest for instruments categorized in Level 3.
The inputs used to measure fair value may fall into different levels of the fair value hierarchy. In such cases, for disclosure purposes, the level in the fair value hierarchy within which the fair value measurement falls, is determined based on the lowest level input that is significant to the fair value measurement in its entirety.
Various inputs are used in determining the value of the Funds’ investments as of the reporting period end. The designated input levels are not necessarily an indication of the risk or liquidity associated with these investments. These inputs are categorized in the following hierarchy under ASC 820.
The following is a summary of the inputs used to value the Funds’ assets and liabilities carried at fair value as of October 31, 2016:
| | | Valuation Inputs | | | | |
| Dynamic Dividend Fund* | | Level 1 | | | Level 2 | | | Level 3 | | | Total Value | |
| Common Stocks | | $ | 150,261,934 | | | $ | — | | | $ | — | | | $ | 150,261,934 | |
| Exchange-Traded Funds | | | 1,459,900 | | | | — | | | | — | | | | 1,459,900 | |
| Rights | | | — | | | | 44,381 | | | | — | | | | 44,381 | |
| Short-Term Investments | | | — | | | | 3,918,000 | | | | — | | | | 3,918,000 | |
| Total | | $ | 151,721,834 | | | $ | 3,962,381 | | | $ | — | | | $ | 155,684,215 | |
| | | Valuation Inputs | | | | | |
| Other Financial Instruments | | | Level 1 | | | | Level 2 | | | | Level 3 | | | | Total Value | |
| Assets | | | | | | | | | | | | | | | | |
| Forward Currency Contracts | | $ | — | | | $ | 464,160 | | | $ | — | | | $ | 464,160 | |
| Total | | $ | — | | | $ | 464,160 | | | $ | — | | | $ | 464,160 | |
98
Alpine Mutual Funds
Notes to Financial Statements—Continued
October 31, 2016
| | | Valuation Inputs | | | | |
| Rising Dividend Fund * | | Level 1 | | | Level 2 | | | Level 3 | | | Total Value | |
| Common Stocks | | | | | | | | | | | | | | | | |
| Aerospace & Defense | | $ | 2,321,670 | | | $ | — | | | $ | — | | | $ | 2,321,670 | |
| Air Freight & Logistics | | | 1,394,560 | | | | — | | | | — | | | | 1,394,560 | |
| Auto Components | | | 800,475 | | | | — | | | | — | | | | 800,475 | |
| Banks | | | 5,977,830 | | | | — | | | | — | | | | 5,977,830 | |
| Beverages | | | 1,072,000 | | | | — | | | | — | | | | 1,072,000 | |
| Biotechnology | | | 2,589,680 | | | | — | | | | — | | | | 2,589,680 | |
| Capital Markets | | | 2,954,500 | | | | — | | | | — | | | | 2,954,500 | |
| Chemicals | | | 867,230 | | | | — | | | | — | | | | 867,230 | |
| Commercial Services & Supplies | | | 1,040,400 | | | | — | | | | — | | | | 1,040,400 | |
| Communications Equipment | | | 1,027,260 | | | | — | | | | — | | | | 1,027,260 | |
| Consumer Finance | | | 1,533,660 | | | | — | | | | — | | | | 1,533,660 | |
| Diversified Telecommunication Services | | | 2,475,980 | | | | — | | | | — | | | | 2,475,980 | |
| Electric Utilities | | | 1,389,170 | | | | — | | | | — | | | | 1,389,170 | |
| Electronic Equipment, Instruments & Components | | | 1,194,530 | | | | — | | | | — | | | | 1,194,530 | |
| Energy Equipment & Services | | | 938,760 | | | | — | | | | — | | | | 938,760 | |
| Equity Real Estate Investment | | | 1,476,460 | | | | — | | | | — | | | | 1,476,460 | |
| Food & Staples Retailing | | | 5,020,135 | | | | — | | | | 23,933 | | | | 5,044,068 | |
| Food Products | | | 1,718,700 | | | | — | | | | — | | | | 1,718,700 | |
| Health Care Equipment & Supplies | | | 3,370,980 | | | | — | | | | — | | | | 3,370,980 | |
| Health Care Providers & Services | | | 858,800 | | | | — | | | | — | | | | 858,800 | |
| Hotels, Restaurants & Leisure | | | 1,803,400 | | | | — | | | | — | | | | 1,803,400 | |
| Household Durables | | | 717,390 | | | | — | | | | — | | | | 717,390 | |
| Household Products | | | 911,400 | | | | — | | | | — | | | | 911,400 | |
| IT Services | | | 1,204,320 | | | | — | | | | — | | | | 1,204,320 | |
| Insurance | | | 2,485,900 | | | | — | | | | — | | | | 2,485,900 | |
| Internet Software & Services | | | 1,993,050 | | | | — | | | | — | | | | 1,993,050 | |
| Machinery | | | 1,933,950 | | | | — | | | | — | | | | 1,933,950 | |
| Media | | | 3,340,626 | | | | — | | | | — | | | | 3,340,626 | |
| Mortgage Real Estate Investment | | | 475,250 | | | | — | | | | — | | | | 475,250 | |
| Multi-Utilities | | | 941,410 | | | | — | | | | — | | | | 941,410 | |
| Oil, Gas & Consumable Fuels | | | 5,688,940 | | | | — | | | | — | | | | 5,688,940 | |
| Pharmaceuticals | | | 4,629,155 | | | | — | | | | — | | | | 4,629,155 | |
| Road & Rail | | | 1,809,347 | | | | — | | | | — | | | | 1,809,347 | |
| Semiconductors & Semiconductor Equipment | | | 4,878,040 | | | | — | | | | — | | | | 4,878,040 | |
| Software | | | 3,414,860 | | | | — | | | | — | | | | 3,414,860 | |
| Specialty Retail | | | 2,484,175 | | | | — | | | | — | | | | 2,484,175 | |
| Technology, Hardware, Storage & Peripherals | | | 2,270,800 | | | | — | | | | — | | | | 2,270,800 | |
| Thrifts & Mortgage Finance | | | 714,470 | | | | — | | | | — | | | | 714,470 | |
| Exchange-Traded Fund | | | 948,400 | | | | — | | | | — | | | | 948,400 | |
| Short-Term Investment | | | — | | | | 2,681,000 | | | | — | | | | 2,681,000 | |
| Total | | $ | 82,667,663 | | | $ | 2,681,000 | | | $ | 23,933 | | | $ | 85,372,596 | |
99
Alpine Mutual Funds
Notes to Financial Statements—Continued
October 31, 2016
| | | Valuation Inputs | | | | |
| Financial Services Fund* | | Level 1 | | | Level 2 | | | Level 3 | | | Total Value | |
| Common Stocks | | $ | 13,631,464 | | | $ | — | | | $ | — | | | $ | 13,631,464 | |
| Short-Term Investments | | | — | | | | 126,000 | | | | — | | | | 126,000 | |
| Total | | $ | 13,631,464 | | | $ | 126,000 | | | $ | — | | | $ | 13,757,464 | |
| | | Valuation Inputs | | | | | |
| Small Cap Fund* | | Level 1 | | | Level 2 | | | Level 3 | | | Total Value | |
| Common Stocks | | $ | 12,437,715 | | | $ | — | | | $ | — | | | $ | 12,437,715 | |
| Short-Term Investments | | | — | | | | 882,000 | | | | — | | | | 882,000 | |
| Total | | $ | 12,437,715 | | | $ | 882,000 | | | $ | — | | | $ | 13,319,715 | |
| | | Valuation Inputs | | | | | |
| Ultra Short Municipal Income Fund* | | Level 1 | | | Level 2 | | | Level 3 | | | Total Value | |
| Municipal Bonds | | $ | — | | | $ | 1,135,696,640 | | | $ | — | | | $ | 1,135,696,640 | |
| Money Market Funds | | | — | | | | 51,029 | | | | — | | | | 51,029 | |
| Total | | $ | — | | | $ | 1,135,747,669 | | | $ | — | | | $ | 1,135,747,669 | |
| | | Valuation Inputs | | | | | |
| High Yield Managed Duration Municipal Fund* | | Level 1 | | | Level 2 | | | Level 3 | | | Total Value | |
| Municipal Bonds | | $ | — | | | $ | 196,226,793 | | | $ | — | | | $ | 196,226,793 | |
| Money Market Funds | | | — | | | | 97,523 | | | | — | | | | 97,523 | |
| Total | | $ | — | | | $ | 196,324,316 | | | $ | — | | | $ | 196,324,316 | |
* For detailed sector, country and state descriptions, see accompanying Schedule of Portfolio Investments.
For the year ended October 31, 2016, there were no transfers between Level 1, Level 2 and Level 3. The Funds recognize transfers as of the beginning of the year.
The following is a reconciliation of Level 3 assets for which significant unobservable inputs were used to determine fair value:
| | | Rising
Dividend
Fund | |
| Balance as of October 31, 2015 | | $ | 23,933 | |
| Realized gain (loss) | | | — | |
| Change in unrealized depreciation* | | | — | |
| Purchases | | | — | |
| Sales | | | — | |
| Transfers in to Level 3 | | | — | |
| Transfers out of Level 3 | | | — | |
| Balance as of October 31, 2016 | | $ | 23,933 | |
| Change in net unrealized appreciation/(depreciation) on Level 3 assets held at year end | | $ | — | |
* Statements of Operations Location: Change in net unrealized appreciation/(depreciation) on investments.
100
Alpine Mutual Funds
Notes to Financial Statements—Continued
October 31, 2016
B. Security Transactions and Investment Income:
Security transactions are accounted for on a trade date basis. Realized gains and losses are computed on the identified cost basis. Dividend income is recorded on the ex-dividend date or in the case of some foreign securities, on the date thereafter when the Funds are made aware of the dividend. Upon notification from issuers, some of the dividend income received from a real estate investment trust may be redesignated as a reduction of cost of the related investment and/or realized gain. Interest income is recorded on the accrual basis and includes accretion of discounts and amortization of premiums, where applicable. To the extent any issuer defaults or a credit event occurs that impacts the issuer, the Funds may halt any additional interest income accruals and consider the realizability of interest accrued up to the date of default or credit event.
C. Line of Credit and Custody Overdrafts:
On December 1, 2010, each of the Series Trust and Income Trust entered into a lending agreement with BNP Paribas through its New York branch (“BNPP NY”) on behalf of each of the Funds. Loans in aggregate, whether to cover overdrafts or for investment purposes, may not exceed the maximum amount that is permitted under the 1940 Act. The terms of the lending agreement indicate the rate to be the Federal Funds rate plus 0.95% per annum on amounts borrowed. The BNPP NY facility provides secured, uncommitted lines of credit for the Funds where selected Funds’ assets are pledged against advances made to the respective Fund. Each Fund has granted a security interest in all pledged assets used as collateral to the BNPP NY facility. Each Fund is permitted to borrow up to 33.33% of its total assets for extraordinary or emergency purposes. Additionally, each of the following Funds is permitted to borrow up to 10% of its total assets for investment purposes but in no case shall any Fund’s total outstanding borrowings exceed 33.33% of their respective total assets. Either BNPP NY or the Funds may terminate this agreement upon delivery of written notice. For the year ended October 31, 2016, the average interest rate paid on outstanding borrowings under the line of credit was 1.38%, 1.47%, 1.39% and 1.41% for the Dynamic Dividend Fund, Rising Dividend Fund, Financial Services Fund and High Yield Managed Duration Municipal Fund, respectively. The Funds may also incur interest expense on custody overdraft charges.
| | | Dynamic
Dividend
Fund | | | Rising
Dividend
Fund | | | Financial
Services
Fund | | | Small Cap
Fund | |
| Total line of credit amount available for investment purposes at October 31, 2016 | | $ | 15,778,485 | | | $ | 8,858,546 | | | $ | 1,413,359 | | | $ | 1,337,986 | |
| Line of credit outstanding at October 31, 2016 | | | — | | | | — | | | | — | | | | — | |
| Line of credit amount unused at October 31, 2016 | | | 15,778,485 | | | | 8,858,546 | | | | 1,413,359 | | | | 1,337,986 | |
| Average balance outstanding during the period | | | 1,244,392 | | | | 9,511 | | | | 94,126 | | | | — | |
| Maximum balance outstanding during the period | | | 11,941,995 | | | | 1,226,479 | | | | 2,094,819 | | | | — | |
| Interest expense incurred on line of credit during the period | | | 17,481 | | | | 142 | | | | 1,326 | | | | — | |
| Interest expense incurred on custody overdrafts during the period | | | — | | | | — | | | | 37 | | | | — | |
| | | Ultra Short
Municipal
Income Fund | | | High Yield
Managed
Duration
Municipal Fund | | | | | | | | | |
| Total line of credit amount available for investment purposes at October 31, 2016 | | $ | — | | | $ | 20,482,089 | | | | | | | | | |
| Line of credit outstanding at October 31, 2016 | | | — | | | | — | | | | | | | | | |
| Line of credit amount unused at October 31, 2016 | | | — | | | | 20,482,089 | | | | | | | | | |
| Average balance outstanding during the period | | | — | | | | 104,598 | | | | | | | | | |
| Maximum balance outstanding during the period | | | — | | | | 5,384,222 | | | | | | | | | |
| Interest expense incurred on line of credit during the period | | | — | | | | 1,500 | | | | | | | | | |
| Interest expense incurred on custody overdrafts during the period | | | 1,351 | | | | 123 | | | | | | | | | |
101
Alpine Mutual Funds
Notes to Financial Statements—Continued
October 31, 2016
D. Federal and Other Income Taxes:
It is each Fund’s policy to comply with the Federal income and excise tax requirements of the Internal Revenue Code of 1986 (the “Code”), as amended, applicable to regulated investment companies and to timely distribute all of its investment company taxable income and net realized capital gains to shareholders in accordance with the timing requirements imposed by the Code. Therefore, no Federal income tax provision is required. Capital gains realized on some foreign securities are subject to foreign taxes. Dividends and interest from non-U.S. sources received by the Funds are generally subject to non-U.S. withholding taxes at rates ranging up to 30%. Such capital gains and withholding taxes, which are accrued as applicable, may be reduced or eliminated under the terms of applicable U.S. income tax treaties, and the Funds intend to undertake procedural steps to claim the benefits of such treaties. Where available, the Funds will file refund claims for foreign taxes withheld.
FASB ASC 740-10 “Income Taxes” - Overall sets forth a minimum threshold for financial statement recognition of the benefit of a tax position taken or expected to be taken in a tax return. Management has analyzed the Funds’ tax positions taken on income tax returns for all open tax years and has concluded that as of October 31, 2016, no provision for income tax is required in the Funds’ financial statements. The Funds’ Federal and state income and Federal excise tax returns for tax years for which the applicable statutes of limitations have not expired are subject to examination by the Internal Revenue Service and state departments of revenue. As of October 31, 2016, open Federal and New York tax years include the tax years ended October 31, 2013 through 2016. Also, the Funds have recognized no interest and penalties related to uncertain tax benefits. The Funds are also not aware of any tax positions for which it is reasonably possible that the total amounts of unrecognized tax benefits will significantly change in the next twelve months.
Foreign taxes withheld, if any, represent amounts withheld by foreign tax authorities, net of refunds recoverable. Foreign capital gains on certain foreign securities may be subject to foreign taxes, which are accrued as applicable. As of October 31, 2016, there were no outstanding balances of accrued capital gains taxes for the Funds.
E. Distributions to Shareholders:
Each Fund intends to distribute all of its net investment income and net realized capital gains, if any, throughout the year to its shareholders in the form of dividends. Distributions to shareholders are recorded at the close of business on the ex-dividend date. All dividends are automatically reinvested in full and fractional shares of the respective Funds at net asset value per share, unless otherwise requested.
The amounts of dividends from net investment income and of distributions from net realized gains are determined in accordance with Federal income tax regulations, which may differ from GAAP. These differences are either considered temporary or permanent in nature. To the extent these differences are permanent in nature, such amounts are reclassified within the composition of net assets based on their Federal tax-basis treatment; temporary differences do not require reclassification. In the event dividends and distributions to shareholders exceed net investment income and net realized gains for tax purposes, they are reported as returns of capital.
F. Class Allocations:
Income, expenses (other than class specific expenses) and realized and unrealized gains and losses are allocated among the classes of the Funds based on the relative net assets of each class. Class specific expenses are allocated to the class to which they relate. Currently, class specific distribution expenses are limited to those incurred under the Distribution Plan for Class A shares (See Note 5).
G. Foreign Currency Translation Transactions:
Each of the Dynamic Dividend Fund, Rising Dividend Fund and Financial Services Fund may invest without limitation in foreign securities. The Small Cap Fund may invest up to 30% of the value of its net assets in foreign securities. The Funds do not isolate the portion of each portfolio invested in foreign securities of their net realized and unrealized gains and losses on investments resulting from changes in foreign exchange rates from the impact arising from changes in market process. Such fluctuations are included with net realized and unrealized gain or loss from investments. Net realized foreign currency transaction gains and losses arise from sales of foreign currencies, currency gains or losses realized between the trade and settlement dates on securities transactions, and the differences between the amounts of dividends, interest and foreign withholding taxes recorded on the Funds’ books and the U.S. dollar equivalent of the amounts actually received or paid. Net unrealized foreign currency translations gains and losses arise from changes in the value of assets and liabilities, other than investments in securities, resulting from
102
Alpine Mutual Funds
Notes to Financial Statements—Continued
October 31, 2016
changes in the exchange rates. The books and records of each Fund are maintained in U.S. dollars. Non-U.S. dollar-denominated amounts are translated into U.S. dollars as follows, with the resultant translations gains and losses recorded in the Statements of Operations.
| | i) | fair value of investment securities and other assets and liabilities at the exchange rate on the valuation date. |
| | | |
| | ii) | purchases and sales of investment securities, income and expenses at the exchange rate prevailing on the respective date of such transactions. |
H. Risks Associated with Foreign Securities and Currencies:
Investments in securities of foreign issuers carry certain risks not ordinarily associated with investments in securities of domestic issuers. Such risks include future political and economic developments and the possible imposition of exchange controls or other foreign governmental laws and restrictions. In addition, with respect to certain countries, there is a possibility of expropriation of assets, confiscatory taxation, political or social instability or diplomatic developments, which could adversely affect investments in those countries. Generally, when the U.S. dollar rises in value against a foreign currency, the Funds’ investments denominated in that currency will lose value because that currency is worth fewer U.S. dollars; the opposite effect occurs if the U.S. dollar falls in relative value.
Certain countries may also impose substantial restrictions on investments in their capital markets by foreign entities, including restrictions on investments in issuers or industries deemed sensitive to relevant national interests. These factors may limit the investment opportunities available to the Funds or result in a lack of liquidity and high price volatility with respect to securities of issuers from developing countries.
I. Equity-Linked Structured Notes:
The Funds may invest in equity-linked structured notes. Equity-linked structured notes are securities which are specially designed to combine the characteristics of one or more underlying securities and their equity derivatives in a single note form. The return and/or yield or income component may be based on the performance of the underlying equity securities, and equity index, and/or option positions. Equity-linked structured notes are typically offered in limited transactions by financial institutions in either registered or non-registered form. An investment in equity-linked structured notes creates exposure to the credit risk of the issuing financial institution, as well as to the market risk of the underlying securities. There is no guaranteed return of principal with these securities and the appreciation potential of these securities may be limited by a maximum payment or call right. In certain cases, equity-linked structured notes may be more volatile and less liquid than complex securities or other types of fixed-income securities. Such securities may exhibit price behavior that does not correlate with other fixed-income securities. The Funds did not hold equity-linked structured notes as of October 31, 2016.
J. Options:
The Funds may engage in option transactions and in doing so achieve similar objectives to what they would achieve through the sale or purchase of individual securities. A call option, upon payment of a premium, gives the purchaser of the option the right to buy, and the seller of the option the obligation to sell, the underlying security, index or other instrument at the exercise price. A put option gives the purchaser of the option, upon payment of a premium, the right to sell, and the seller the obligation to buy, the underlying security, index, or other instrument at the exercise price.
To seek to offset some of the risk of a potential decline in value of certain long positions, the Funds may also purchase put options on individual securities. The Funds may also seek to generate income from option premiums by writing (selling) options on a portion of the equity securities in the Funds’ portfolio.
When a Fund purchases an option, it pays a premium and an amount equal to that premium is recorded as an asset. When a Fund writes an option, it receives a premium and an amount equal to that premium is recorded as a liability. The asset or liability is adjusted daily to reflect the current market value of the option. If an option expires unexercised, the Fund realizes a gain or loss to the extent of the premium received or paid. If an option is exercised, the premium received or paid is recorded as an adjustment to the proceeds from the sale or the cost basis of the purchase. The difference between the premium and the amount received or paid on a closing purchase or sale transaction is also treated as a realized gain or loss. The cost of securities acquired through the exercise of call options is increased by premiums paid. The proceeds from securities sold through the exercise of put options are decreased by the premiums paid. Gain or loss on written options and purchased options is presented separately as net realized
103
Alpine Mutual Funds
Notes to Financial Statements—Continued
October 31, 2016
gain or loss on written options and net realized gain or loss on purchased options, respectively. There were no options contracts held as of October 31, 2016.
Written options transactions for the year ended October 31, 2016 were as follows in the Rising Dividend Fund:
| | | Number of
Contracts | | Premiums
Received | |
| Written Options, outstanding as of October 31, 2015 | | | 240 | | | $ | 14,226 | |
| Options written | | | 180 | | | | 29,518 | |
| Options exercised | | | 25 | | | | (3,174 | ) |
| Options expired | | | (210 | ) | | | (20,135 | ) |
| Options bought back | | | (235 | ) | | | (20,435 | ) |
| Written Options, outstanding as of October 31, 2016 | | | — | | | $ | — | |
K. Forward Currency Contracts:
The Funds are subject to foreign currency exchange rate risk in the normal course of pursuing their investment objectives. The Funds may use forward currency contracts to gain exposure to or economically hedge against changes in the value of foreign currencies. A forward currency contract (“forward”) is an agreement between two parties to buy and sell a currency at a set price on a future date. The market value of the forward contract fluctuates with changes in forward currency exchange rates. The forward contract is marked-to-market daily and the change in market value is recorded by each Fund as unrealized appreciation or depreciation. When the forward contract is closed, a Fund records a realized gain or loss equal to the fluctuation in value during the period the forward contract was open. A Fund could be exposed to risk if a counterparty is unable to meet the terms of a forward or if the value of the currency changes unfavorably. The Funds’ forward contracts are not subject to an enforceable master netting agreement or similar agreement. The Dynamic Dividend Fund and the Financial Services Fund entered into forward currency contracts during the reporting period to economically hedge against changes in the value of foreign currencies. During the year ended October 31, 2016, the Dynamic Dividend Fund and Financial Services Fund entered into twelve and nineteen forward contracts, respectively. The average monthly principal amount for forward contracts held by the Dynamic Dividend Fund and Financial Services Fund throughout the period was $13,221,731 and $1,366,025, respectively. This is based on amounts held as of each month-end throughout the fiscal year.
The following forward currency contracts were held as of October 31, 2016:
Dynamic Dividend Fund
| Description | | Counterparty | | Settlement
Date | | Currency | | Settlement
Value | | | Current
Value | | | Unrealized
Appreciation | |
| Contracts Sold: | | | | | | | | | | | | | | | | | |
| Euro | | State Street Bank
and Trust Company | | 12/07/16 | | 7,000,000 EUR | | $ | 8,038,100 | | | $ | 7,695,578 | | | $ | 342,522 | |
| Japanese Yen | | State Street Bank
and Trust Company | | 12/07/16 | | 320,000,000 JPY | | | 3,176,841 | | | | 3,055,203 | | | | 121,638 | |
| | | | | | | | | | | | | $ | 10,750,781 | | | $ | 464,160 | |
L. Derivative Instruments:
The following tables provide information about the effect of derivatives on the Funds’ Statements of Assets and Liabilities and Statements of Operations as of and for the year ended October 31, 2016. The first table provides additional detail about the amounts and sources of unrealized appreciation/(depreciation) on derivatives at the end of the period. The second table provides additional information about the amounts and sources of net realized gain/(loss) and the change in net unrealized appreciation/(depreciation) resulting from the Funds’ derivatives during the year.
104
Alpine Mutual Funds
Notes to Financial Statements—Continued
October 31, 2016
The effect of derivative instruments in the Statements of Assets and Liabilities as of October 31, 2016:
| Dynamic Dividend Fund | | | | | | |
| | | Statements of Assets | | Unrealized |
| Derivatives | | and Liabilities Location | | Appreciation |
| Forward Currency Contracts | | | | | | | |
| Foreign exchange risk | | Unrealized appreciation on forward currency contracts | | | $ | 464,160 | |
The effect of derivative instruments in the Statements of Operations for the year ended October 31, 2016:
| Dynamic Dividend Fund | | | | | | | |
| | | Statements of | | Net Realized | | Change in Net |
| Derivatives | | Operations Location | | Gain | | Unrealized Depreciation |
| Forward Currency Contracts | | | | | | | | |
| Foreign exchange risk | | Net realized gain/(loss) from foreign currency transactions | | $ | 815,289 | | | | | |
| Foreign exchange risk | | Change in net unrealized appreciation/(depreciation) on foreign currency translations | | | | | | $ | (108,643 | ) |
| | | | | | | | | |
| Rising Dividend Fund | | | | | | | | |
| | | Statements of | | Net Realized | | Change in Net Unrealized |
| Derivatives | | Operations Location | | Gain/(Loss) | | Appreciation/(Depreciation) |
| Options Contracts | | | | | | | | | | |
| Equity risk | | Net realized gain/(loss) from investments | | $ | (111,024 | ) | | | | |
| Equity risk | | Change in net unrealized appreciation/(depreciation) on investments | | | | | | $ | 48,401 | |
| Equity risk | | Net realized gain/(loss) from written options contracts | | $ | 35,626 | | | | | |
| Equity risk | | Change in net unrealized appreciation/(depreciation) on written options contracts | | | | | | $ | (13,026 | ) |
| | | | | | | | | | | |
| Financial Services Fund | | | | | | | | | | |
| | | Statements of | | Net Realized | | Change in Net |
| Derivatives | | Operations Location | | Loss | | Unrealized Depreciation |
| Forward Currency Contracts | | | | | | | | |
| Foreign exchange risk | | Net realized gain/(loss) from foreign currency transactions | | $ | (27,702 | ) | | | | |
| Foreign exchange risk | | Change in net unrealized appreciation/(depreciation) on foreign currency translations | | | | | | $ | (2,420 | ) |
M. Redemption Fees:
The Funds of the Series Trust impose a redemption fee of 1% of the total redemption amount on all Fund shares redeemed or exchanged within 60 days of buying them, either by purchase or exchange. This fee is assessed and retained by the Funds for the benefit of the remaining shareholders. The redemption fee is accounted for as an increase to paid-in-capital. The Alpine Ultra Short Municipal Income Fund imposes a 0.25% redemption fee for shares redeemed or exchanged within 30 days of buying them and the High Yield Managed Duration Municipal Fund imposes a 0.75% redemption fee for shares redeemed or exchanged within 60 days of buying them, of the total redemption amount on all Fund shares redeemed or exchanged. This fee is assessed and retained by the Funds for the benefit of the remaining shareholders. The redemption fee is accounted for as an increase to paid-in-capital.
105
Alpine Mutual Funds
Notes to Financial Statements—Continued
October 31, 2016
| 3. | Capital Share Transactions: |
The Funds have an unlimited number of shares of beneficial interest, with $0.001 par value, authorized. Transactions in shares and dollars of the Funds were as follows:
Dynamic Dividend Fund
| | | Year Ended | | | Year Ended | |
| | | October 31, 2016 | | | October 31, 2015 | |
| | | Shares | | | Amount | | | Shares | | | Amount | |
| Institutional Class | | | | | | | | | | | | | | | | |
| Shares sold | | | 1,486,955 | | | $ | 5,166,679 | | | | 3,466,999 | | | $ | 13,621,647 | |
| Shares issued in reinvestment of dividends | | | 2,243,462 | | | | 7,864,987 | | | | 2,162,374 | | | | 8,384,107 | |
| Redemption fees | | | — | | | | 2,584 | | | | — | | | | 2,152 | |
| Shares redeemed | | | (9,246,176 | ) | | | (32,274,678 | ) | | | (11,756,955 | ) | | | (45,912,677 | ) |
| Total net change | | | (5,515,759 | ) | | $ | (19,240,428 | ) | | | (6,127,582 | ) | | $ | (23,904,771 | ) |
| | | | | | | | | | | | | | | | | |
| Class A | | | | | | | | | | | | | | | | |
| Shares sold | | | 500,144 | | | $ | 1,719,939 | | | | 347,585 | | | $ | 1,372,113 | |
| Shares issued in reinvestment of dividends | | | 31,513 | | | | 110,605 | | | | 30,404 | | | | 117,981 | |
| Redemption fees | | | — | | | | 57 | | | | — | | | | 46 | |
| Shares redeemed | | | (500,200 | ) | | | (1,773,362 | ) | | | (404,030 | ) | | | (1,582,312 | ) |
| Total net change | | | 31,457 | | | $ | 57,239 | | | | (26,041 | ) | | $ | (92,172 | ) |
| Rising Dividend Fund | | | | | | | | | | | | |
| | | | | | | | | | | | | |
| | | Year Ended | | | Year Ended | |
| | | October 31, 2016 | | | October 31, 2015 | |
| | | Shares | | | Amount | | | Shares | | | Amount | |
| Institutional Class | | | | | | | | | | | | | | | | |
| Shares sold | | | 53,207 | | | $ | 758,478 | | | | 118,489 | | | $ | 1,905,372 | |
| Proceeds from shares issued in connection with the tax-free transfer of assets from Alpine Transformations Fund (Note 8) | | | — | | | | — | | | | 507,899 | | | | 7,643,926 | |
| Proceeds from shares issued in connection with the tax-free transfer of assets from Alpine Equity Income Fund (Note 8) | | | — | | | | — | | | | 5,123,760 | | | | 77,113,107 | |
| Shares issued in reinvestment of dividends | | | 248,227 | | | | 3,665,092 | | | | 22,856 | | | | 357,891 | |
| Redemption fees | | | — | | | | 72 | | | | — | | | | — | |
| Shares redeemed | | | (555,655 | ) | | | (8,220,628 | ) | | | (68,404 | ) | | | (1,092,652 | ) |
| Total net change | | | (254,221 | ) | | $ | (3,796,986 | ) | | | 5,704,600 | | | $ | (85,927,644 | ) |
| | | | | | | | | | | | | | | | | |
| Class A | | | | | | | | | | | | | | | | |
| Shares sold | | | 4,425 | | | $ | 67,792 | | | | 89,014 | | | $ | 1,450,838 | |
| Proceeds from shares issued in connection with the tax-free transfer of assets from Alpine Transformations Fund (Note 8) | | | — | | | | — | | | | 10,346 | | | | 155,703 | |
| Proceeds from shares issued in connection with the tax-free transfer of assets from Alpine Equity Income Fund (Note 8) | | | — | | | | — | | | | 21,756 | | | | 327,429 | |
| Shares issued in reinvestment of dividends | | | 3,857 | | | | 56,846 | | | | 7,101 | | | | 111,046 | |
| Redemption fees | | | — | | | | 1 | | | | — | | | | — | |
| Shares redeemed | | | (78,595 | ) | | | (1,154,232 | ) | | | (25,995 | ) | | | (393,204 | ) |
| Total net change | | | (70,313 | ) | | $ | (1,029,593 | ) | | | 102,222 | | | $ | (1,651,812 | ) |
106
Alpine Mutual Funds
Notes to Financial Statements—Continued
October 31, 2016
| Financial Services Fund | | | | | | | | | | | | |
| | | Year Ended | | | Year Ended | |
| | | October 31, 2016 | | | October 31, 2015 | |
| | | Shares | | | Amount | | | Shares | | | Amount | |
| Institutional Class | | | | | | | | | | | | | | | | |
| Shares sold | | | 135,507 | | | $ | 1,673,566 | | | | 369,389 | | | $ | 4,998,497 | |
| Shares issued in reinvestment of dividends | | | 13,575 | | | | 172,672 | | | | 12,761 | | | | 171,655 | |
| Redemption fees | | | — | | | | 203 | | | | — | | | | 1,836 | |
| Shares redeemed | | | (762,779 | ) | | | (9,193,716 | ) | | | (962,004 | ) | | | (12,790,683 | ) |
| Total net change | | | (613,697 | ) | | $ | (7,347,275 | ) | | | (579,854 | ) | | $ | (7,618,695 | ) |
| | | | | | | | | | | | | | | | | |
| Class A | | | | | | | | | | | | | | | | |
| Shares sold | | | 18,462 | | | $ | 217,085 | | | | 66,509 | | | $ | 874,831 | |
| Shares issued in reinvestment of dividends | | | 2,714 | | | | 34,336 | | | | 3,511 | | | | 46,990 | |
| Redemption fees | | | — | | | | 58 | | | | — | | | | 549 | |
| Shares redeemed | | | (330,395 | ) | | | (3,750,081 | ) | | | (234,275 | ) | | | (3,092,029 | ) |
| Total net change | | | (309,219 | ) | | $ | (3,498,602 | ) | | | (164,255 | ) | | $ | (2,169,659 | ) |
| Small Cap Fund | | | | | | | | | | | | |
| | | Year Ended | | | Year Ended | |
| | | October 31, 2016 | | | October 31, 2015 | |
| | | Shares | | | Amount | | | Shares | | | Amount | |
| Institutional Class | | | | | | | | | | | | | | | | |
| Shares sold | | | 27,831 | | | $ | 407,257 | | | | 33,543 | | | $ | 472,343 | |
| Shares issued in reinvestment of dividends | | | — | | | | — | | | | — | | | | — | |
| Redemption fees | | | — | | | | 2 | | | | — | | | | 822 | |
| Shares redeemed | | | (93,944 | ) | | | (1,358,321 | ) | | | (139,381 | ) | | | (1,991,521 | ) |
| Total net change | | | (66,113 | ) | | $ | (951,062 | ) | | | (105,838 | ) | | $ | (1,518,356 | ) |
| | | | | | | | | | | | | | | | | |
| Class A | | | | | | | | | | | | | | | | |
| Shares sold | | | 604 | | | $ | 8,790 | | | | 30,976 | | | $ | 440,928 | |
| Shares issued in reinvestment of dividends | | | — | | | | — | | | | — | | | | — | |
| Redemption fees | | | — | | | | — | | | | — | | | | 70 | |
| Shares redeemed | | | (41,197 | ) | | | (605,864 | ) | | | (39,243 | ) | | | (552,566 | ) |
| Total net change | | | (40,593 | ) | | $ | (597,074 | ) | | | (8,267 | ) | | $ | (111,568 | ) |
107
Alpine Mutual Funds
Notes to Financial Statements—Continued
October 31, 2016
| Ultra Short Municipal Income Fund |
| | | Year Ended | | | Year Ended | |
| | | October 31, 2016 | | | October 31, 2015 | |
| | | Shares | | | Amount | | | Shares | | | Amount | |
| Institutional Class | | | | | | | | | | | | | | | | |
| Shares sold | | | 57,341,218 | | | $ | 575,628,307 | | | | 27,287,282 | | | $ | 273,964,312 | |
| Shares issued in reinvestment of dividends | | | 416,008 | | | | 4,176,278 | | | | 315,186 | | | | 3,164,465 | |
| Redemption fees | | | — | | | | 17,574 | | | | — | | | | 12,623 | |
| Shares redeemed | | | (44,425,596 | ) | | | (445,984,747 | ) | | | (33,510,389 | ) | | | (336,444,301 | ) |
| Total net change | | | 13,331,630 | | | $ | 133,837,412 | | | | (5,907,921 | ) | | $ | (59,302,901 | ) |
| | | | | | | | | | | | | | | | | |
| Class A | | | | | | | | | | | | | | | | |
| Shares sold | | | 12,653,132 | | | $ | 127,779,710 | | | | 9,158,022 | | | $ | 92,474,358 | |
| Shares issued in reinvestment of dividends | | | 65,499 | | | | 661,340 | | | | 46,820 | | | | 472,735 | |
| Redemption fees | | | — | | | | 4,218 | | | | — | | | | 3,592 | |
| Shares redeemed | | | (12,436,462 | ) | | | (125,584,498 | ) | | | (13,577,730 | ) | | | (137,106,037 | ) |
| Total net change | | | 282,169 | | | $ | 2,860,770 | | | | (4,372,888 | ) | | $ | (44,155,352 | ) |
| High Yield Managed Duration Municipal Fund |
| | | Year Ended | | | Year Ended | |
| | | October 31, 2016 | | | October 31, 2015 | |
| | | Shares | | | Amount | | | Shares | | | Amount | |
| Institutional Class | | | | | | | | | | | | | | | | |
| Shares sold | | | 12,248,523 | | | $ | 127,050,001 | | | | 2,437,080 | | | $ | 25,137,443 | |
| Shares issued in reinvestment of dividends | | | 198,535 | | | | 2,055,480 | | | | 103,944 | | | | 1,071,225 | |
| Redemption fees | | | — | | | | 21,666 | | | | — | | | | 4,190 | |
| Shares redeemed | | | (2,306,308 | ) | | | (23,920,920 | ) | | | (336,237 | ) | | | (3,457,415 | ) |
| Total net change | | | 10,140,750 | | | $ | 105,206,227 | | | | 2,204,787 | | | $ | 22,755,443 | |
| | | | | | | | | | | | | | | | | |
| Class A | | | | | | | | | | | | | | | | |
| Shares sold | | | 2,893,642 | | | $ | 29,933,772 | | | | 1,045,193 | | | $ | 10,761,230 | |
| Shares issued in reinvestment of dividends | | | 49,097 | | | | 509,207 | | | | 6,339 | | | | 65,174 | |
| Redemption fees | | | — | | | | 5,897 | | | | — | | | | 640 | |
| Shares redeemed | | | (476,576 | ) | | | (4,952,583 | ) | | | (73,749 | ) | | | (758,641 | ) |
| Total net change | | | 2,466,163 | | | $ | 25,496,293 | | | | 977,783 | | | $ | 10,068,403 | |
| 4. | Purchases and Sales of Securities: |
Purchases and sales of securities (excluding short-term securities) for the year ended October 31, 2016 are as follows:
| | | Purchases | | | Sales | |
| Dynamic Dividend Fund | | $ | 142,896,306 | | | $ | 155,403,550 | |
| Rising Dividend Fund | | | 79,892,646 | | | | 84,250,454 | |
| Financial Services Fund | | | 16,688,834 | | | | 26,357,997 | |
| Small Cap Fund | | | 10,469,638 | | | | 12,254,366 | |
| Ultra Short Municipal Income Fund | | | 1,479,765,848 | | | | 1,313,754,415 | |
| High Yield Managed Duration Municipal Fund | | | 273,226,692 | | | | 139,639,051 | |
The Funds did not have purchases and sales of U.S. Government Obligations during the year ended October 31, 2016.
108
Alpine Mutual Funds
Notes to Financial Statements—Continued
October 31, 2016
Quasar Distributors, LLC (“Quasar”) serves as each Fund’s distributor. Each of the Funds have adopted a distribution and servicing plan (the “Plan”) for their Class A shares as allowed by Rule 12b-1 under the 1940 Act. The Plan authorizes payments by the Funds in connection with the distribution and servicing of their Class A shares at an annual rate, as determined from time to time by the Board, of up to 0.25% of the average daily net assets of the Class A shares of the Funds. Amounts paid under the Plan by the Funds may be spent by the Funds on any activities or expenses primarily intended to result in the sale of Class A shares of the Funds, including but not limited to advertising, compensation for sales and marketing activities of financial institutions and others such as dealers and distributors, shareholder account servicing, the printing and mailing of prospectuses to other than current shareholders and the printing and mailing of sales literature. Dynamic Dividend Fund, Rising Dividend Fund, Financial Services Fund, Small Cap Fund, Ultra Short Municipal Income Fund and High Yield Managed Duration Municipal Fund incurred $8,429, $3,910, $8,601, $2,285, $511,941 and $60,390, respectively, pursuant to the Plan for the year ended October 31, 2016.
The Plan for the Funds may be terminated at any time by a majority vote of the Trustees of the Trusts who are not “interested persons,” as defined by the 1940 Act, or by vote of a majority of the outstanding voting shares of the respective Fund.
| 6. | Investment Advisory Agreement, Administration Agreement and Other Affiliated Transactions: |
The Adviser provides investment advisory services to each of the Funds. Pursuant to the advisory agreements with the Funds, the Adviser is entitled to an annual fee based on 1.00% of each Fund’s average daily net assets for the Dynamic Dividend Fund (until March 31, 2016), Rising Dividend Fund (until March 31, 2016), Financial Services Fund and Small Cap Fund. From April 1, 2016 to April 1, 2017, the Adviser shall waive 0.05% of the Small Cap Fund’s Advisory Fee at an annualized rate. Fees waived pursuant to this 0.05% waiver are not subject to recoupment by the Adviser discussed below. Effective April 1, 2016, the Adviser is entitled to an annual fee based on each Fund’s average daily net asset for the Dynamic Dividend Fund and Rising Dividend Fund, in accordance with the following schedule:
| First $250 million | | 1.00 | % |
| Over $250 million | | 0.95 | % |
The Adviser was entitled to an annual fee based on 0.75% of each of the Fund’s average net assets for the Ultra Short Municipal Income Fund and High Yield Managed Duration Municipal Fund until March 31, 2016.
Effective April 1, 2016, the Adviser is entitled to an annual fee based on the Ultra Short Municipal Income Fund’s average daily net assets, in accordance with the following schedule:
| First $2.5 billion | 0.50 | % |
| Over $2.5 billion | 0.45 | % |
Effective April 1, 2016, the Adviser is entitled to an annual fee based on the High Yield Managed Duration Municipal Fund’s average daily net assets, in accordance with the following schedule:
| First $250 million | 0.65 | % |
| Over $250 million | 0.60 | % |
The Adviser agreed to waive fees and/or reimburse the Dynamic Dividend Fund, Rising Dividend Fund, Financial Services Fund and Small Cap Fund to the extent necessary to ensure that ordinary operating expenses (including 12b-1 fees, but excluding interest, brokerage commissions, acquired fund fees and extraordinary expenses) do not exceed annually 1.60% of each Fund’s Class A shares average daily net assets, and 1.35% of each Fund’s Institutional Class shares average daily net assets (until March 31, 2016). Effective April 1, 2016, the Adviser agreed to waive fees and/or reimburse the Dynamic Dividend Fund, Rising Dividend Fund, Financial Services Fund and Small Cap Fund to the extent necessary to ensure that ordinary operating expenses (including 12b-1 fees, but excluding interest, brokerage commissions, acquired fund fees and extraordinary expenses) do not exceed annually 1.50% of each Fund’s Class A shares average daily net assets and 1.25% of each Fund’s Institutional Class shares average daily net assets. The contractual expense cap for the Ultra Short Municipal Income Fund Class A shares and Institutional Class shares is 0.95% and 0.70% (until March 31, 2016). Effective April 1, 2016, the Adviser agreed to waive fees and/or reimburse the Ultra Short Municipal Income Fund to the extent necessary to ensure that ordinary operating expenses (including
109
Alpine Mutual Funds
Notes to Financial Statements—Continued
October 31, 2016
12b-1 fees, but excluding interest, brokerage commissions, acquired fund fees and extraordinary expenses) do not exceed annually 0.70%, respectively, of the Fund’s Class A shares average daily net assets and 0.45% of the Fund’s Institutional Class shares average daily net assets. The contractual expense cap for High Yield Managed Duration Municipal Fund Class A shares and Institutional Class shares is 1.05% and 0.80%, respectively (until March 31, 2016). Effective April 1, 2016, the Adviser agreed to waive fees and/or reimburse the High Yield Managed Duration Municipal Fund to the extent necessary to ensure that ordinary operating expenses (including 12b-1 fees, but excluding interest, brokerage commissions, acquired fund fees and extraordinary expenses) do not exceed annually 0.90% of the Fund’s Class A shares average daily net assets and 0.65% of the Fund’s Institutional Class shares average daily net assets. For the year ended October 31, 2016, the Adviser waived investment advisory fees and other expenses totaling $12,047, $59,030, $43,985, $3,156,071 and $216,236 for the Dynamic Dividend Fund, Financial Services Fund, Small Cap Fund, Ultra Short Municipal Income Fund and High Yield Managed Duration Municipal Fund, respectively. The expense limitations will remain in effect for each Fund through April 1, 2017 unless and until the Board of the Series and Income Trusts approve its modification or termination with respect to each Fund. The Adviser may recover expenses paid in excess of the cap on expenses for the three previous years, as long as the recovery does not cause the Fund to exceed such cap on expenses. Waived expenses subject to potential recovery by year of expiration are as follows:
| | | | | | | | | | | Ultra Short | | High Yield |
| | | Dynamic | | Rising | | Financial | | | | | Municipal | | Managed |
| | | Dividend | | Dividend | | Services | | Small Cap | | Income | | Duration |
| Years of Expiration | | Fund | | Fund | | Fund | | Fund | | Fund | | Municipal Fund |
| 10/31/2017 | | $ | 146,717 | | | $ | 44,557 | | | $ | — | | | $ | 37,668 | | | $ | 2,325,098 | | | $ | 106,330 | |
| 10/31/2018 | | | — | | | | 55,991 | | | | 137,078 | | | | 77,751 | | | | 2,283,138 | | | | 115,543 | |
| 10/31/2019 | | | 12,047 | | | | — | | | | 59,030 | | | | 40,153 | | | | 1,983,569 | | | | 205,015 | |
For the year ended October 31, 2016, the Adviser voluntarily agreed to reimburse the Ultra Short Municipal Income Fund to the extent necessary to ensure that the Fund’s total operating expenses (including 12b-1 fees, where applicable, but excluding interest, brokerage commissions and extraordinary expenses) were within the range 0.65%-0.75% and 0.40%-0.50% of the average daily net assets of the Class A shares and Institutional Class shares, respectively, during the year ended October 31, 2016.
The Adviser makes payments to intermediaries that provide omnibus account services, sub-accounting services and/or networking services with respect to the Funds. On February 2, 2012, the Board approved, subject to certain limitations, the reimbursement to the Adviser by the appropriate Fund, of up to a certain percentage of such fees paid by the Adviser to intermediaries that provide omnibus account services, sub-accounting services, and/or networking services. Reimbursement of these fees are subject to review by the Board and are included in the transfer agent fees in the Statements of Operations. For the year ended October 31, 2016, the Dynamic Dividend Fund, Rising Dividend Fund, Financial Services Fund, Small Cap Fund, Ultra Short Municipal Income Fund and High Yield Managed Duration Municipal Fund incurred $151,308, $1,296, $33,343, $5,827, $491,845 and $220, respectively, in reimbursements to the Adviser.
State Street Bank and Trust Company (“SSBT”) serves as the fund accounting agent and custodian. The custodian is responsible for the safekeeping of the assets of the Funds and the fund accounting agent is responsible for calculating the Funds’ NAVs. SSBT, as the Funds’ custodian and fund accounting agent, is paid on the basis of net assets and transaction costs of the Funds. SSBT also serves as the administrator for the Series Trust and Income Trust. SSBT, as the Funds’ administrator, is paid on the basis of net assets of the Funds which are allocated among the series of the Series Trust and Income Trust, on the basis of relative net assets.
Boston Financial Data Services, Inc. (“BFDS”) serves as the transfer agent to the Equity Trust. BFDS is paid on the basis of net assets, per account fees and certain transaction costs.
110
Alpine Mutual Funds
Notes to Financial Statements—Continued
October 31, 2016
During the year ended October 31, 2016, the Funds engaged in purchase and sale transactions with funds that have a common investment adviser (or affiliated investment advisers), common Directors/Trustees and/or common Officers. These purchase and sale transactions complied with Rule 17a-7 under the 1940 Act and were as follows:
| | | Purchases | | | Sales | |
| Ultra Short Municipal Income Fund | | $ | — | | | $ | 5,572,941 | |
| High Yield Managed Duration Municipal Fund | | | 5,572,941 | | | | — | |
Certain officers and trustees of the Funds are also officers and/or trustees of the Adviser. No interested trustee, who is deemed an interested person due to current or former service with Adviser or an affiliate of Adviser, receives compensation from the Funds.
| 7. | Federal Income Tax Information: |
GAAP requires that certain components of net assets be reclassified to reflect permanent differences between financial and tax reporting. These reclassifications have no effect on net assets or net asset values per share of the Funds.
As of October 31, 2016, the components of distributable earnings on a tax basis were as follows:
| | | Dynamic
Dividend Fund | | Rising Dividend
Fund | |
Financial
Services Fund |
| Undistributed ordinary income | | | $ | — | | | | $ | 600,016 | | | | $ | 7,928 | |
| Undistributed tax exempt income | | | | — | | | | | — | | | | | — | |
| Undistributed long-term capital gain | | | | — | | | | | — | | | | | 27,776 | |
| Accumulated capital loss | | | | (560,644,359 | ) | | | | (150,415 | ) | | | | — | |
| Unrealized appreciation/(depreciation) | | | | 7,984,250 | | | | | 11,044,302 | | | | | 2,318,341 | |
| Total | | | $ | (552,660,109 | ) | | | $ | 11,493,903 | | | | $ | 2,354,045 | |
| | | | | | | | | | | | | | | | |
| | | | | | | High Yield |
| | | | | Ultra Short | | Managed |
| | | Small Cap Fund | | Municipal
Income Fund | | Duration
Municipal Fund |
| Undistributed tax exempt income | | | $ | — | | | | $ | 145,696 | | | | $ | 139,733 | |
| Late year ordinary loss deferral | | | | (68,771 | ) | | | | — | | | | | — | |
| Accumulated capital loss | | | | (7,778,434 | ) | | | | (546,542 | ) | | | | (920,416 | ) |
| Unrealized appreciation/(depreciation) | | | | 800,498 | | | | | (6,283 | ) | | | | 1,363,597 | |
| Total | | | $ | (7,046,707 | ) | | | $ | (407,129 | ) | | | $ | 582,914 | |
Tax components of distributable earnings are determined in accordance with income tax regulations which may differ from the composition of net assets reported under GAAP. These permanent differences are primarily due to the differing treatment of gains (losses) related to foreign currency transactions, basis adjustments on certain equity securities designated as passive foreign investment companies, acquired capital loss carryforwards and distribution redesignations. Accordingly, for the year ended October 31, 2016, the effects of certain differences were reclassified as follows:
| | | | | | | Accumulated | | Accumulated |
| Fund | | Capital stock | | net investment
income (loss) | | net realized
gains (losses) |
| Dynamic Dividend Fund | | | $ | (536,971,766 | ) | | | $ | (114,157 | ) | | | $ | 537,085,923 | |
| Rising Dividend Fund | | | | 14 | | | | | (21,519 | ) | | | | 21,505 | |
| Financial Services Fund | | | | 7,523 | | | | | 56,853 | | | | | (64,376 | ) |
| Small Cap Fund | | | | (191,165 | ) | | | | 83,168 | | | | | 107,997 | |
111
Alpine Mutual Funds
Notes to Financial Statements—Continued
October 31, 2016
As of October 31, 2016, net unrealized appreciation/(depreciation) of investments, excluding foreign currency, based on Federal tax costs was as follows:
| | | | | | | Gross | | Gross | | Net unrealized |
| Fund | | Cost of
investments | | unrealized
appreciation | | unrealized
depreciation | | appreciation/
(depreciation) |
| Dynamic Dividend Fund | | | $ | 147,678,861 | | | | $ | 16,734,813 | | | | $ | (8,729,459 | ) | | | $ | 8,005,354 | |
| Rising Dividend Fund | | | | 74,328,266 | | | | | 11,808,211 | | | | | (763,881 | ) | | | | 11,044,330 | |
| Financial Services Fund | | | | 11,438,440 | | | | | 2,349,410 | | | | | (30,386 | ) | | | | 2,319,024 | |
| Small Cap Fund | | | | 12,519,217 | | | | | 1,603,158 | | | | | (817,460 | ) | | | | 785,698 | |
| Ultra Short Municipal Income Fund | | | | 1,135,753,952 | | | | | 130,365 | | | | | (136,648 | ) | | | | (6,283 | ) |
| High Yield Managed Duration Municipal Fund | | | | 194,960,719 | | | | | 1,882,733 | | | | | (519,135 | ) | | | | 1,363,598 | |
The tax basis of investments for tax and financial reporting purposes differs principally due to the deferral of losses on wash sales, partnership tax adjustments, and mark-to-market cost basis adjustments for investments in passive foreign investment companies (PFICs) for tax purposes.
The tax character of distributions paid during the years ended October 31, 2016 and 2015 were as follows:
| | | 2016 | | | 2015 | |
| Dynamic Dividend Fund | | | | | | | | |
| Ordinary income | | $ | 10,120,435 | | | $ | 12,328,370 | |
| Long-term capital gain | | | — | | | | — | |
| Return of capital | | | 1,100,161 | | | | | |
| Total | | $ | 11,220,596 | | | $ | 12,328,370 | |
| Rising Dividend Fund | | | | | | | | |
| Ordinary income | | $ | 3,179,041 | | | $ | 230,058 | |
| Long-term capital gain | | | 589,735 | | | | 284,654 | |
| Total | | $ | 3,768,776 | | | $ | 514,712 | |
| Financial Services Fund | | | | | | | | |
| Ordinary income | | $ | 355,958 | | | $ | 390,835 | |
| Long-term capital gain | | | — | | | | — | |
| Total | | $ | 355,958 | | | $ | 390,835 | |
| Small Cap Fund | | | | | | | | |
| Long-term capital gain | | $ | — | | | $ | — | |
| Total | | $ | — | | | $ | — | |
| Ultra Short Municipal Income Fund | | | | | | | | |
| Ordinary income | | $ | 861 | | | | | |
| Exempt interest dividends | | | 6,061,658 | | | $ | 4,685 | |
| Long-term capital gain | | | — | | | | 4,624,613 | |
| Total | | $ | 6,062,519 | | | $ | 4,629,298 | |
| High Yield Managed Duration Municipal Fund | | | | | | | | |
| Ordinary income | | $ | 113,462 | | | $ | 34,949 | |
| Exempt interest dividends | | | 3,507,244 | | | | 1,345,745 | |
| Long-term capital gain | | | — | | | | — | |
| Total | | $ | 3,620,706 | | | $ | 1,380,694 | |
112
Alpine Mutual Funds
Notes to Financial Statements—Continued
October 31, 2016
During the year ended October 31, 2016, the Financial Services Fund and Small Cap Fund utilized $181,543 and $126,133 of capital loss carryovers, respectively. Capital loss carryovers as of October 31, 2016 are as follows:
| Expiration Date | | Dynamic
Dividend Fund | | Rising
Dividend Fund | | Financial
Services Fund |
| 10/31/2017 | | $ | 388,131,987 | | | $ | — | | | $ | — | |
| 10/31/2018 | | $ | 154,525,095 | | | $ | — | | | $ | — | |
| 10/31/2019 | | $ | — | | | $ | — | | | $ | — | |
| | | | | | | | | | | | | |
| | | | | | | | | | | High Yield |
| | | | | | | Ultra Short | | Managed |
| Expiration Date | | Small Cap
Fund | | Municipal
Income Fund | | Duration
Municipal Fund |
| 10/31/2017 | | $ | 5,637,266 | | | $ | — | | | $ | — | |
| 10/31/2018 | | $ | 1,581,056 | | | $ | — | | | $ | — | |
| 10/31/2019 | | $ | 342,429 | | | $ | 67,228 | | | $ | — | |
During the year ended October 31, 2016, the Dynamic Dividend Fund and Small Cap Fund had $536,971,822 and $113,385 of expired capital loss carryovers, respectively.
Under the Regulated Investment Company (“RIC”) Modernization Act of 2010 (“the Modernization Act”), post-enactment capital losses that are carried forward will retain their character as either short-term or long-term capital losses rather than being considered all short-term as under previous law. However, any losses incurred during those future taxable years will be required to be utilized prior to the losses incurred in pre-enactment taxable years, which carry an expiration date. As a result of this ordering rule, pre-enactment capital loss carryovers may be more likely to expire unused. Capital loss carryover as of October 31, 2016 with no expiration are as follows:
| Fund | | Short Term | | | Long Term | |
| Dynamic Dividend Fund | | $ | 15,425,258 | | | $ | 2,562,019 | |
| Rising Dividend Fund | | $ | 150,415 | | | $ | — | |
| Small Cap Fund | | $ | 217,683 | | | $ | — | |
| Ultra Short Municipal Income Fund | | $ | 443,488 | | | $ | 35,826 | |
| High Yield Managed Duration Municipal Fund | | $ | 703,551 | | | $ | 216,865 | |
Certain ordinary losses incurred after December 31 and within the taxable year are deemed to arise on the first day of the Funds’ next taxable year, if the Funds so elect. For the year ended October 31, 2016, the following Funds elected to defer late-year ordinary losses:
| | Late Year |
| Fund | Ordinary Losses |
| Small Cap Fund | $ (68,771) |
113
Alpine Mutual Funds
Notes to Financial Statements—Continued
October 31, 2016
At a meeting held on July 31, 2015, the Board, unanimously approved the tax free reorganization of the Alpine Transformations Fund and the Alpine Equity Income Fund (the “Target Funds”) into the Alpine Accelerating Dividend Fund (the “Acquiring Fund”), a separate series of the Trust. On September 9, 2015, the Acquiring Fund was renamed Alpine Rising Dividend Fund and on October 23, 2015, acquired all of the net assets of the Target Funds in a tax-free exchange of shares pursuant to an Agreement and Plan of Reorganization approved by the Target Funds shareholders. The purpose of the transaction was to combine two portfolios with comparable investment objectives and strategies.
| Alpine | | | | Shares Issued by | | |
| Transformations | | Shares Prior to | | the Acquiring | | Net Assets Prior |
| Fund | | Reorganization | | Fund | | to Reorganization |
| Institutional Class | | | 664,477 | | | | 507,899 | | | $ | 7,643,926 | |
| Class A | | | 13,727 | | | | 10,346 | | | $ | 155,703 | |
| | | | | | | | | | | | | |
| Alpine | | | | | | Shares Issued by | | |
| Equity Income | | Shares Prior to | | the Acquiring | | Net Assets Prior |
| Fund | | Reorganization | | Fund | | to Reorganization |
| Institutional Class | | | 6,042,454 | | | | 5,123,760 | | | $ | 77,113,107 | |
| Class A | | | 25,724 | | | | 21,756 | | | $ | 327,429 | |
The appreciation of the Transformations Fund and Equity Income Fund were $779,528 and $12,159,650, respectively, as of the date of the reorganization. The combined net assets of the Acquiring Fund immediately after the reorganization were $92,462,283.
Assuming the reorganization had been completed on November 1, 2014, the beginning of the reporting period of the Acquiring Fund, the Acquiring Fund’s pro forma results of operations for the period ended October 31, 2015, were as follows:
| Net Investment Income (Loss) | | $ | 1,329,773 | |
| Net Realized and Unrealized Gains/Losses onInvestments and Foreign Currency Transactions | | $ | (603,933 | ) |
| Net Increase/Decrease in Net Assets resulting from Operations | | $ | 725,840 | |
Because the combined investment portfolios have been managed as a single integrated portfolio since the reorganization was completed, it is not practicable to separate the amounts of revenue and earnings of the Target Funds that have been included in the Acquiring Fund’s Statement of Operations as of October 31, 2015.
Other income of $265,972 is recognized by the Fund as a result of a class action settlement related to improper foreign exchange contract transactions conducted by Dynamic Dividend Fund’s former Custodian.
Distributions: The Dynamic Dividend Fund - Institutional Class and Class A shares paid a distribution from net investment income of $968,837 and $20,881 or $0.02 and $0.0193 per share, respectively, on November 30, 2016 to shareholders of record on November 29, 2016.
The Small Cap Fund—Institutional Class and Class A paid a distribution from long-term capital gains of $27,843 on December 16, 2016 to shareholders of record on December 15, 2016.
114
Alpine Mutual Funds
Report of Independent Registered Public Accounting Firm
To the Shareholders and Board of Trustees of
Alpine Series Trust and Alpine Income Trust:
We have audited the accompanying statements of assets and liabilities, including the portfolios of investments, of Alpine Series Trust (comprising, respectively, Alpine Dynamic Dividend Fund, Alpine Rising Dividend Fund, Alpine Financial Services Fund and Alpine Small Cap Fund); and Alpine Income Trust (comprising, respectively, Alpine High Yield Managed Duration Municipal Fund and Alpine Ultra Short Municipal Income Fund) (collectively the “Funds”) as of October 31, 2016, and the related statement of operations for the year then ended, and the statements of changes in net assets and the financial highlights for each of the two years in the period then ended. These financial statements and financial highlights are the responsibility of the Funds’ management. Our responsibility is to express an opinion on these financial statements and financial highlights based on our audits. The financial highlights for the periods ended prior to November 1, 2014 were audited by another independent registered public accounting firm whose report, dated December 29, 2014, expressed an unqualified opinion on those financial statements and financial highlights.
We conducted our audits in accordance with the standards of the Public Company Accounting Oversight Board (United States). Those standards require that we plan and perform the audit to obtain reasonable assurance about whether the financial statements and financial highlights are free of material misstatement. We were not engaged to perform an audit of the Funds’ internal control over financial reporting. Our audits included consideration of internal control over financial reporting as a basis for designing audit procedures that are appropriate in the circumstances, but not for the purpose of expressing an opinion on the effectiveness of the Funds’ internal control over financial reporting. Accordingly, we express no such opinion. An audit also includes examining, on a test basis, evidence supporting the amounts and disclosures in the financial statements and financial highlights, assessing the accounting principles used and significant estimates made by management, and evaluating the overall financial statement presentation. Our procedures included confirmation of securities owned as of October 31, 2016, by correspondence with the custodian and others or by other appropriate auditing procedures where replies from others were not received. We believe that our audits provide a reasonable basis for our opinion.
In our opinion, the financial statements and financial highlights referred to above present fairly, in all material respects, the financial position of each of the respective portfolios comprising Alpine Series Trust and Alpine Income Trust at October 31, 2016, the results of their operations for the year then ended, the changes in their net assets and the financial highlights for each of the two years in the period then ended in conformity with U.S. generally accepted accounting principles.

New York, NY
December 22, 2016
115
Alpine Mutual Funds
Information about your Funds’ Expenses
October 31, 2016
Fund expenses (Unaudited)
Example
As a shareholder of the Fund, you may incur two types of costs: (1) transaction costs, including front-end on purchase payments; and (2) ongoing costs, including management fees; service and/or distribution (12b-1) fees; and other Fund expenses. This example is intended to help you understand your ongoing costs (in dollars) of investing in the Fund and to compare these costs with the ongoing costs of investing in other mutual funds. This example is based on an investment of $1,000 invested on May 1, 2016 and held for the six months ended October 31, 2016.
Actual Expenses
The table below titled “Based on Actual Total Return” provides information about actual account values and actual expenses. You may use the information provided in this table, together with the amount you invested, to estimate the expenses that you paid over the period. To estimate the expenses you paid on your account, divide your ending account value by $1,000 (for example, an $8,600 ending account value divided by $1,000 = 8.6), then multiply the result by the number under the heading entitled “Expenses Paid During the Period”.
Hypothetical Example for Comparison Purposes
The table below titled “Based on Hypothetical Total Return” provides information about hypothetical account values and hypothetical expenses based on the actual expense ratio and an assumed rate of return of 5.00% per year before expenses, which is not the Fund’s actual return. The hypothetical account values and expenses may not be used to estimate the actual ending account balance or expenses you paid for the period. You may use the information provided in this table to compare the ongoing costs of investing in the Fund and other funds. To do so, compare the 5.00% hypothetical example relating to the Fund with the 5.00% hypothetical examples that appear in the shareholder reports of the other funds.
Please note that the expenses shown in the table below are meant to highlight your ongoing costs only and do not reflect any transactional costs, such as front-end or back-end sales charges (loads). Therefore, the table is useful in comparing ongoing costs only, and will not help you determine the relative total costs of owning different funds. In addition, if these transaction costs were included, your costs would have been higher.
Dynamic Dividend Fund
Based on actual total return(1)
| Class | | Actual Total
Return Without
Sales Charges(2) | | Beginning
Account Value | | Ending
Account Value | | Annualized
Expense
Ratio | | Expenses
Paid During
the Period(3) |
| | | | | | | | | | | |
| Institutional | | | 2.57 | % | | $ | 1,000.00 | | | $ | 1,025.70 | | | | 1.25 | % | | $ | 6.36 | |
| | | | | | | | | | | | | | | | | | | | | |
| Class A | | | 2.44 | % | | $ | 1,000.00 | | | $ | 1,024.40 | | | | 1.51 | % | | $ | 7.68 | |
| | | | | | | | | | | | | | | | | | | | | |
| Based on hypothetical total return(1) |
| |
| Class | | Hypothetical
Annualized
Total Return | | Beginning
Account Value | | Ending
Account Value | | Annualized
Expense
Ratio | | Expenses
Paid During
the Period(4) |
| | | | | | | | | | | |
| Institutional | | | 5.00 | % | | $ | 1,000.00 | | | $ | 1,018.85 | | | | 1.25 | % | | $ | 6.34 | |
| | | | | | | | | | | | | | | | | | | | | |
| Class A | | | 5.00 | % | | $ | 1,000.00 | | | $ | 1,017.55 | | | | 1.51 | % | | $ | 7.66 | |
116
Alpine Mutual Funds
Information about your Funds’ Expenses—Continued
October 31, 2016
Rising Dividend Fund
Based on actual total return(1)
| Class | | Actual Total
Return Without
Sales Charges(2) | | Beginning
Account Value | | Ending
Account Value | | Annualized
Expense
Ratio | | Expenses
Paid During
the Period(3) |
| | | | | | | | | | | |
| Institutional | | | 2.56 | % | | $ | 1,000.00 | | | $ | 1,025.60 | | | | 1.18 | % | | $ | 6.01 | |
| | | | | | | | | | | | | | | | | | | | | |
| Class A | | | 2.48 | % | | $ | 1,000.00 | | | $ | 1,024.80 | | | | 1.38 | % | | $ | 7.02 | |
| | | | | | | | | | | | | | | | | | | | | |
| Based on hypothetical total return(1) |
| |
| Class | | Hypothetical
Annualized
Total Return | | Beginning
Account Value | | Ending
Account Value | | Annualized
Expense
Ratio | | Expenses
Paid During
the Period(4) |
| | | | | | | | | | | |
| Institutional | | | 5.00 | % | | $ | 1,000.00 | | | $ | 1,019.20 | | | | 1.18 | % | | $ | 5.99 | |
| | | | | | | | | | | | | | | | | | | | | |
| Class A | | | 5.00 | % | | $ | 1,000.00 | | | $ | 1,018.20 | | | | 1.38 | % | | $ | 7.00 | |
| | | | | | | | | | | | | | | | | | | | | |
| Financial Services Fund |
| | | | | | | | | | | | | | | | | | | | | |
| Based on actual total return(1) |
| |
| Class | | Actual Total
Return Without
Sales Charges(2) | | Beginning
Account Value | | Ending
Account Value | | Annualized
Expense
Ratio | | Expenses
Paid During
the Period(3) |
| | | | | | | | | | | |
| Institutional | | | 8.65 | % | | $ | 1,000.00 | | | $ | 1,086.50 | | | | 1.25 | % | | $ | 6.56 | |
| | | | | | | | | | | | | | | | | | | | | |
| Class A | | | 8.55 | % | | $ | 1,000.00 | | | $ | 1,085.50 | | | | 1.50 | % | | $ | 7.86 | |
| | | | | | | | | | | | | | | | | | | | | |
| Based on hypothetical total return(1) |
| |
| Class | | Hypothetical
Annualized
Total Return | | Beginning
Account Value | | Ending
Account Value | | Annualized
Expense
Ratio | | Expenses
Paid During
the Period(4) |
| | | | | | | | | | | |
| Institutional | | | 5.00 | % | | $ | 1,000.00 | | | $ | 1,018.85 | | | | 1.25 | % | | $ | 6.34 | |
| | | | | | | | | | | | | | | | | | | | | |
| Class A | | | 5.00 | % | | $ | 1,000.00 | | | $ | 1,017.60 | | | | 1.50 | % | | $ | 7.61 | |
| | | | | | | | | | | | | | | | | | | | | |
| Small Cap Fund |
| | | | | | | | | | | | | | | | | | | | | |
| Based on actual total return(1) |
| |
| Class | | Actual Total
Return Without
Sales Charges(2) | | Beginning
Account Value | | Ending
Account Value | Annualized
Expense
Ratio | | Expenses
Paid During
the Period(3) |
| | | | | | | | | | |
| Institutional | | | 9.89 | % | | $ | 1,000.00 | | | $ | 1,098.90 | | | | 1.25 | % | | $ | 6.59 | |
| | | | | | | | | | | | | | | | | | | | | |
| Class A | | | 9.80 | % | | $ | 1,000.00 | | | $ | 1,098.00 | | | | 1.49 | % | | $ | 7.86 | |
| | | | | | | | | | | | | | | | | | | | | |
| Based on hypothetical total return(1) |
| |
| Class | | Hypothetical
Annualized
Total Return | | Beginning
Account Value | | Ending
Account Value | | Annualized
Expense
Ratio | | Expenses
Paid During
the Period(4) |
| | | | | | | | | | | |
| Institutional | | | 5.00 | % | | $ | 1,000.00 | | | $ | 1,018.85 | | | | 1.25 | % | | $ | 6.34 | |
| | | | | | | | | | | | | | | | | | | | | |
| Class A | | | 5.00 | % | | $ | 1,000.00 | | | $ | 1,017.65 | | | | 1.49 | % | | $ | 7.56 | |
117
Alpine Mutual Funds
Information about your Funds’ Expenses—Continued
October 31, 2015
Ultra Short Municipal Income Fund
Based on actual total return(1)
| Class | | Actual Total
Return Without
Sales Charges(2) | | Beginning
Account Value | | Ending
Account Value | | Annualized
Expense
Ratio | | Expenses
Paid During
the Period(3) |
| | | | | | | | | | | |
| Institutional | | | 0.37 | % | | $ | 1,000.00 | | | $ | 1,003.70 | | | | 0.41 | % | | $ | 2.07 | |
| | | | | | | | | | | | | | | | | | | | | |
| Class A | | | 0.15 | % | | $ | 1,000.00 | | | $ | 1,001.50 | | | | 0.66 | % | | $ | 3.32 | |
| | | | | | | | | | | | | | | | | | | | | |
| Based on hypothetical total return(1) |
| Class | | Hypothetical
Annualized
Total Return | | Beginning
Account Value | | Ending
Account Value | | Annualized
Expense
Ratio | | Expenses
Paid During
the Period(4) |
| | | | | | | | | | | |
| Institutional | | | 5.00 | % | | $ | 1,000.00 | | | $ | 1,023.08 | | | | 0.41 | % | | $ | 2.08 | |
| | | | | | | | | | | | | | | | | | | | | |
| Class A | | | 5.00 | % | | $ | 1,000.00 | | | $ | 1,021.82 | | | | 0.66 | % | | $ | 3.35 | |
| | | | | | | | | | | | | | | | | | | | | |
| High Yield Managed Duration Municipal Fund |
| | | | | | | | | | | | | | | | | | | | | |
| Based on actual total return(1) |
| Class | | Actual Total
Return Without
Sales Charges(2) | | Beginning
Account Value | | Ending
Account Value | | Annualized
Expense
Ratio | | Expenses
Paid During
the Period(3) |
| | | | | | | | | | | |
| Institutional | | | 1.46 | % | | $ | 1,000.00 | | | $ | 1,014.60 | | | | 0.65 | % | | $ | 3.29 | |
| | | | | | | | | | | | | | | | | | | | | |
| Class A | | | 1.33 | % | | $ | 1,000.00 | | | $ | 1,013.30 | | | | 0.90 | % | | $ | 4.55 | |
| | | | | | | | | | | | | | | | | | | | | |
| Based on hypothetical total return(1) |
| | | | | | | | | | | | | | | | | | | | | |
| Class | | Hypothetical
Annualized
Total Return | | Beginning
Account Value | | Ending
Account Value | | Annualized
Expense
Ratio | | Expenses
Paid During
the Period(4) |
| | | | | | | | | | | |
| Institutional | | | 5.00 | % | | $ | 1,000.00 | | | $ | 1,021.87 | | | | 0.65 | % | | $ | 3.30 | |
| | | | | | | | | | | | | | | | | | | | | |
| Class A | | | 5.00 | % | | $ | 1,000.00 | | | $ | 1,020.61 | | | | 0.90 | % | | $ | 4.57 | |
| (1) | For the six months ended October 31, 2016. |
| (2) | Assumes the reinvestment of all distributions, including returns of capital, if any, at net asset value and does not reflect the deduction of the applicable sales charge. Total return is not annualized, as it may not be representative of the total return for the year. Performance figures may reflect fee waivers and/or expense reimbursements. In the absence of fee waivers and/or expense reimbursements, the total return would have been lower. Past performance is no guarantee of future results. |
| (3) | Expenses (net of fee waivers and/or expense reimbursements) are equal to each class’ respective annualized expense ratio multiplied by the average account value over the period, multiplied by the number of days in the most recent fiscal half-year then divided by 366. |
| (4) | Hypothetical expense examples assume a 5% return over a hypothetical 184 day period. |
118
Alpine Mutual Funds
Additional Information (Unaudited)
October 31, 2016
The Fund’s Statement of Additional Information includes additional information about Trust Trustees and is available, without charge and upon request, by visiting www.alpinefunds.com.
Independent Trustees
| | | | | | | | | | | |
Name, Address
and Year of Birth | | Position(s)
Held with
the Trusts | | Term of Office
and Length of
Time Served | | Principal Occupation During
Past Five Years | | Number of
Portfolios in
Fund Complex* | | Other Directorships
Held by Trustee |
H. Guy Leibler
(1954) | | Independent Trustee | | Indefinite, since the Trust’s inception | | President, Simone Healthcare development (since 2013); Private investor (since 2007). | | 14 | | Chairman Emeritus, White Plains Hospital Center (1988 to Present); Trustee of each of the Alpine Trusts (1996 to Present).** |
Jeffrey E. Wacksman
(1960) | | Independent Trustee | | Indefinite, since 2004 | | Partner, Loeb, Block & Partners LLP (law firm) (since 1994). | | 14 | | Director, International Succession Planning Association (2008 to present); Director, Bondi Icebergs Inc. (women’s sports-wear) (1994 to present); Director, MH Properties, Inc. (a real estate holding company) (since 1996); Trustee of each of the Alpine Trusts.** |
Eleanor T.M. Hoagland
(1951) | | Independent Trustee | | Indefinite, since October 2012 | | Principal, VCS Advisory, LLC (since 2011); Chief Compliance Officer and Senior Managing Director of Magni Asset Management LLC since 2011) and Park Fifth Capital Management LLC (2011-2013). | | 14 | | Trustee of each of the Alpine Trusts.** |
119
Alpine Mutual Funds
Additional Information (Unaudited)—Continued
October 31, 2016
Interested Trustee & Officers
| | | | | | | | | | | |
Name, Address
and Year of Birth | | Position(s)
Held with
the Trusts | | Term of Office
and Length of
Time Served | | Principal Occupation During
Past Five Years | | Number of
Portfolios in
Fund Complex* | | Other Directorships
Held by Trustee |
Samuel A. Lieber***
(1956) | | Interested Trustee and President | | Indefinite, since the Trust’s inception | | Chief Executive Officer, Alpine Woods Capital Investors, LLC (since 1997); President of Alpine Trusts (since 1998). | | 14 | | Trustee of each of the Alpine Trusts.** |
Stephen A. Lieber****
(1925) | | Vice President | | Indefinite, since the Trust’s inception | | Chairman and Senior Portfolio Manager, Saxon Woods Advisors, LLC (since 1999). | | 14 | | N/A |
Kenneth Corrado
(1964) | | Chief Compliance Officer | | Indefinite, since July 2013 | | Chief Compliance Officer, Alpine Woods Capital Investors, LLC (since July 2013); Independent Compliance Consultant (2012 to 2013); Vice President and Deputy Chief Compliance Officer, Artio Global Management, LLC (2007 to 2012). | | 14 | | N/A |
Ronald G. Palmer, Jr.
(1968) | | Chief Financial Officer | | Indefinite, since 2010 | | Chief Financial Officer, Alpine Woods Capital Investors, LLC (since January 2010). | | 14 | | N/A |
Joe C. Caruso
(1971) | | Treasurer | | Indefinite, since July 2013 | | Fund Accountant, Alpine Woods Capital Investors, LLC (since 2011); Independent Tax Consultant (2010 to 2011); Assistant Vice President Global Fund Services, Deutsche Bank AG (2009 to 2010) | | 14 | | N/A |
Andrew Pappert
(1980) | | Secretary | | Indefinite, since 2009 | | Director of Fund Operations, Alpine Woods Capital Investors, LLC (since September 2008). | | 14 | | N/A |
| * | | The term “Fund Complex” refers to the Funds in the Alpine Equity Trust, Alpine Series Trust, Alpine Income Trust, Alpine Global Dynamic Dividend Fund, Alpine Total Dynamic Dividend Fund and Alpine Global Premier Properties Fund (the “Alpine Trusts”). As of October 31, 2016, Alpine Woods Capital Investors, LLC manages fourteen portfolios within the six investment companies that comprise the Alpine Trusts. The Alpine Equity Trust, Alpine Series Trust and Alpine Income Trust are each registered as an open-end management investment company. The Alpine Global Dynamic Dividend Fund, Alpine Total Dynamic Dividend Fund and Alpine Global Premier Properties Fund are each registered as a closed-end management investment company. As of October 31, 2016, the Trustees oversee fourteen portfolios within the six Alpine Trusts. |
| | | |
| ** | | The Trustees are members of the Board of Trustees for each of the Alpine Equity Trust, Alpine Income Trust, Alpine Series Trust, Alpine Global Dynamic Dividend Fund, Alpine Total Dynamic Dividend Fund and Alpine Global Premier Properties Fund (the “Alpine Trusts”). Shareholders may contact the Trustee at c/o Alpine Woods Capital Investors, LLC, 2500 Westchester Ave., Suite 215, Purchase NY, 10577. Each Trust’s Statement of Additional Information (“SAI”) includes additional information about the Trustees and is available, without charge, by calling 1-888-785-5578. |
| | | |
| *** | | Denotes Trustees who are “interested persons” of the Trust or Fund under the 1940 Act. |
| | | |
| **** | | Stephen A. Lieber is the father of Samuel A. Lieber. |
120
Alpine Mutual Funds
Additional Information (Unaudited)—Continued
October 31, 2016
Tax Information
The Funds designated the following percentages of dividends declared from net investment income for the fiscal year ended October 31, 2016 as qualified dividend income under the Jobs & Growth Tax Relief Reconciliation Act of 2003.
| Dynamic Dividend Fund | | 80 | % |
| Rising Dividend Fund | | 57 | % |
| Financial Services Fund | | 100 | % |
| Small Cap Fund | | 0 | % |
| Ultra Short Municipal Income Fund | | 0 | % |
| High Yield Managed Duration Municipal Fund | | 0 | % |
The Funds designated the following percentages of dividends declared during the fiscal year ended October 31, 2016 as dividends qualifying for the dividends received deduction available to corporate shareholders.
| Dynamic Dividend Fund | | 32 | % |
| Rising Dividend Fund | | 51 | % |
| Financial Services Fund | | 100 | % |
| Small Cap Fund | | 0 | % |
| Ultra Short Municipal Income Fund | | 0 | % |
| High Yield Managed Duration Municipal Fund | | 0 | % |
The Funds designated the following percentages of taxable ordinary income distributions as short-term capital gain distributions under Internal Revenue Section 871(k)(2)(C).
| Dynamic Dividend Fund | | 0 | % |
| Rising Dividend Fund | | 0 | % |
| Financial Services Fund | | 0 | % |
| Small Cap Fund | | 0 | % |
| Ultra Short Municipal Income Fund | | 0 | % |
| High Yield Managed Duration Municipal Fund | | 0 | % |
The Fund designated as long-term capital gain dividend, pursuant to Internal Revenue Code Section 852(b)(3), the amount necessary to reduce the earnings and profits of the Fund related to net capital gain to zero for the tax year ended October 31, 2016.
Availability of Proxy Voting Information
The policies and procedures used in determining how to vote proxies relating to portfolio securities are available without a charge, upon request, by contacting the Funds at 1(800) 617.7616 and on the SEC’s web site at http://www.sec.gov.
Information regarding how the Funds voted proxies relating to portfolio securities during the most recent twelve-month period ended June 30 is available without charge, upon request, by contacting the Fund at 1(800) 617.7616 and on the SEC’s web site at http://www.sec.gov.
Availability of Quarterly Portfolio Schedule
Beginning with each Fund’s fiscal quarter ended July 31, 2004, each Fund filed its complete schedule of portfolio holdings on Form N-Q with the SEC. Going forward, each Fund will file Form N-Q for the first and third quarters of each fiscal year on Form N-Q. Each Fund’s Form N-Q is available on the SEC’s website at www.sec.gov and may be reviewed and copied at the SEC’s Public Reference Room in Washington, DC. Information on the operation of the Public Reference Room may be obtained by calling 1-202-551-8090.
121
Alpine Mutual Funds
Additional Information (Unaudited)—Continued
October 31, 2016
Privacy Policy
The Funds collect non-public information about you from the following sources:
| • | information we receive about you on applications or other forms; |
| • | information you give us orally; and |
| • | information about your transactions with others or us. |
The Funds do not disclose any non-public personal information about our customers or former customers without the customer’s authorization, except as required by law or in response to inquiries from governmental authorities. The Funds restrict access to your personal and account information to those employees who need to know that information to provide products and services to you. The Funds also may disclose that information to unaffiliated third parties (such as to brokers or custodians) only as permitted by law and only as needed for us to provided agreed services to you. The Funds maintain physical, electronic and procedural safeguards to guard your non-public personal information.
In the event that you hold shares of the Funds through a financial intermediary, including, but not limited to a broker dealer, bank or trust company, the privacy policy of your financial intermediary would govern how your non-public personal information would be shared with unaffiliated third parties.
122
TRUSTEES
Samuel A. Lieber
Eleanor T.M. Hoagland
H. Guy Leibler
Jeffrey E.Wacksman
CUSTODIAN &
ADMINISTRATOR
State Street Bank & Trust Company
One Lincoln Street
Boston, MA 02111
INDEPENDENT REGISTERED
PUBLIC ACCOUNTING FIRM
Ernst & Young
5 Times Square
New York, NY 10019
FUND COUNSEL
Willkie Farr & Gallagher LLP
787 7th Avenue
New York, NY 10019
DISTRIBUTOR
Quasar Distributors, LLC
615 East Michigan Street
Milwaukee,WI 53202
INVESTMENT ADVISER
Alpine Woods Capital Investors, LLC
2500 Westchester Ave., Suite 215
Purchase, NY 10577
TRANSFER AGENT
Boston Financial Data Services
2000 Crown Colony Drive
Quincy, MA 02169

SHAREHOLDER | INVESTOR INFORMATION
1(888)785.5578
www.alpinefunds.com
This material must be preceded or accompanied by a current prospectus.
Item 2. Code of Ethics
| (a) | The Registrant, as of the end of the period covered by the report, has adopted a code of ethics that applies to the Registrant’s principal executive officer, principal financial officer, principal accounting officer or controller or persons performing similar functions. |
| (c) | There have been no amendments, during the period covered by this report, to a provision of the code of ethics that applies to the Registrant’s principal executive officer, principal financial officer, principal accounting officer or controller, or persons performing similar functions and that relates to any element of the code of ethics described in Item 2(b) of Form N-CSR. |
| (d) | The Registrant has not granted any waivers, including an implicit waiver, from a provision of the code of ethics that applies to the Registrant’s principal executive officer, principal financial officer, principal accounting officer or controller, or persons performing similar functions that relates to any element of the code of ethics described in Item 2(b) of Form N-CSR. |
| (f) | The Registrant’s Code of Ethics is attached as EX-99.CODE ETH hereto. |
Item 3. Audit Committee Financial Expert
| (a)(1) | The Board of Trustees of the Registrant has determined that the Registrant has at least one audit committee financial expert serving on its audit committee. |
| (a)(2) | The Board of Trustees has determined that H. Guy Leibler is an audit committee financial expert. Mr. Leibler is “independent” as defined in paragraph (a)(2) of Item 3 to Form N-CSR. It has been determined that Mr. Leibler qualifies as an audit committee financial expert based on his substantial experience as a senior executive of an operating company actively supervising principal financial officers in the preparation of financial statements, other board service, as well as his educational background. |
Item 4. Principal Accountant Fees and Services
| (a) | Audit Fees: The aggregate fees billed for each of the last two fiscal years for professional services rendered by the principal accountant for the audit of the Registrant’s annual financial statements or services that are normally provided by the accountant in |
connection with statutory and regulatory filings or engagements fiscal year 2015 was $123,770 and for fiscal year 2016 was $104,854.
| (b) | Audit-Related Fees: The aggregate fees billed in each of the last two fiscal years for assurance and related services by the principal accountant that are reasonably related to the performance of the audit of the Registrant’s financial statements and are not reported under paragraph (a) of this Item was $542 in fiscal year 2015 and $0 in fiscal year 2016. The fees in fiscal year 2015 were for professional services for auditor transition. |
| (c) | Tax Fees: The aggregate fees billed in each of the last two fiscal years for professional services rendered by the principal accountant for tax compliance, tax advice, and tax planning was $29,043 in fiscal year 2015 and was $46,038 in fiscal year 2016. Services for which fees in the Tax Fees category are billed include the principle accountant’s review of the registrant’s U.S. federal income tax returns and the required state corporate income tax returns, as well as the principal accountant’s review of excise tax distribution calculations. |
| (d) | All Other Fees: The aggregate fees billed in each of the last two fiscal years for products and services provided by the principal accountant, other than the services reported in paragraphs (a) through (c) of this Item was $0 in fiscal year 2015 and $0 in fiscal year 2016. |
| (e)(1) | Audit Committee Pre-Approval Policies and Procedures: All services to be performed by the Registrant’s principal auditors must be pre-approved by the Registrant’s audit committee, which may include the approval of certain services up to an amount determined by the audit committee. Any services that would exceed that amount would require additional approval of the audit committee. |
| (e)(2) | No services described in paragraphs (b) through (d) were approved pursuant to paragraph (c)(7)(i)(C) of Rule 2-01 of Regulation S-X. |
| (g) | The aggregate non-audit fees billed by the Registrant’s accountant for services rendered to the Registrant, and the Registrant’s investment adviser, and any entity controlling, controlled by, or under common control with the adviser that provides ongoing services to the Registrant was $0 in fiscal year 2015 and $0 in fiscal year 2016. |
| (h) | Not applicable. There were no non-audit services rendered to the Registrant in the fiscal year 2016. |
Item 5. Audit Committee of Listed Registrants
Not applicable to registrants who are not listed issuers (as defined in Rule 10A-3 under the Securities Exchange Act of 1934).
Item 6. Schedule of Investments
| (a) | Schedule of Investments is included as part of Item 1 of the Form N-CSR. |
Item 7. Disclosure of Proxy Voting Policies and Procedures for Closed-End Management Investment Companies.
Not applicable to open-end investment management companies.
Item 8. Portfolio Managers of Closed-End Management Investment Companies.
Not applicable to open-end investment management companies.
Item 9. Purchases of Equity Securities by Closed-End Management Investment Company and Affiliated Purchasers.
Not applicable to open-end investment management companies.
Item 10. Submission of Matters to a Vote of Security Holders.
There were no material changes to the procedures by which shareholders may recommend nominees to the Registrant’s Board of Trustees.
Item 11. Controls and Procedures.
| (a) | The Registrant’s principal executive officer and principal financial officer have evaluated the registrant’s disclosure controls and procedures (as defined in Rule 30a-3(c) under the Investment Company Act of 1940, as amended) within 90 days of this filing and have concluded that the Registrant’s disclosure controls and procedures were effective, as of that date. |
| (b) | There was no change in the Registrant’s internal control over financial reporting (as defined in Rule 30a-3(d) under the Investment Company Act of 1940, as amended) during the second fiscal quarter of the period covered by this report that has materially affected, or is reasonably likely to materially affect, the Registrant’s internal control over financial reporting. |
Item 12. Exhibits
| (a)(1) | The Code of Ethics that applies to the Registrant’s principal executive officer and principal financial officer is attached hereto as Exhibit EX-99.CODE ETH. |
| (a)(2) | The certifications required by Rule 30a-2(a) of the Investment Company Act of 1940, as amended, and Section 302 of the Sarbanes-Oxley Act of 2002 are attached hereto as Ex-99.Cert. |
| (b) | The certifications by the Registrant’s Principal Executive Officer and Principal Financial Officer, as required by Rule 30a-2(b) of the Investment Company Act of 1940, as amended, and Section 906 of the Sarbanes-Oxley Act of 2002 are attached hereto as Ex-99.906Cert. |
SIGNATURES
Pursuant to the requirements of the Securities Exchange Act of 1934 and the Investment Company Act of 1940, the registrant has duly caused this report to be signed on its behalf by the undersigned, thereunto duly authorized.
Alpine Series Trust
| By: | /s/ Samuel A. Lieber | |
| | Samuel A. Lieber | |
| | Chief Executive Officer (Principal Executive Officer) |
| | | |
| Date: | December 30, 2016 | |
Pursuant to the requirements of the Securities Exchange Act of 1934 and the Investment Company Act of 1940, this report has been signed below by the following persons on behalf of the registrant and in the capacities and on the dates indicated.
| By: | /s/ Samuel A. Lieber | |
| | Samuel A. Lieber | |
| | Chief Executive Officer (Principal Executive Officer) |
| | | |
| By: | /s/ Ronald G. Palmer, Jr. | |
| | Ronald G. Palmer, Jr. | |
| | Chief Financial Officer (Principal Financial Officer) |
| | | |
| Date: | December 30, 2016 | |