Exhibit (c)(11) Project Augusta Discussion Materials April 25, 2024

Executive Summary • Martin Resources Management Corporation (“MRMC”) is considering a potential buyout of the limited partnership units not owned by MRMC (83.9% of the total L.P. units) of Martin Midstream Partners L.P. (“MMLP” or the “Partnership”) • MRMC has retained Wells Fargo Securities, LLC (“WFS”) as its financial advisor and Baker Botts LLP (“Baker Botts”) as its legal advisor • MMLP’s Conflicts Committee has retained Houlihan Lokey as its financial advisor and Potter Anderson and Munsch Hardt as its legal advisors • Total value of MMLP units to be purchased is $85.3 million based on closing price of $2.60 per MMLP unit as of 4/23/2024 • Transaction would be a merger of a new wholly-owned subsidiary of MRMC into MMLP • Consideration paid to MMLP unitholders will be all cash • MRMC management expects to fund the transaction via an upsized ABL facility at the MRMC level, as well as a potential term loan • WFS and Regions Bank (“Regions”) are seeking internal approval to fully underwrite the upsized ABL facility • MRMC Management will update the Board as financing plan is finalized • Upon finalizing the financing plan, MRMC management will seek Board approval for the price and terms of an initial offer • Submission of a proposal to MMLP will trigger the need to amend Schedule 13D filings for MRMC and Ruben Martin and disclose the offer letter as an attachment • Transaction is expected to take approximately 17 – 24 weeks to complete • Five-year financial forecast and other MMLP estimates or assumptions contained herein have been prepared by management and have been approved by MRMC for use by WFS in providing financial analysis to MRMC in connection with the transaction 2
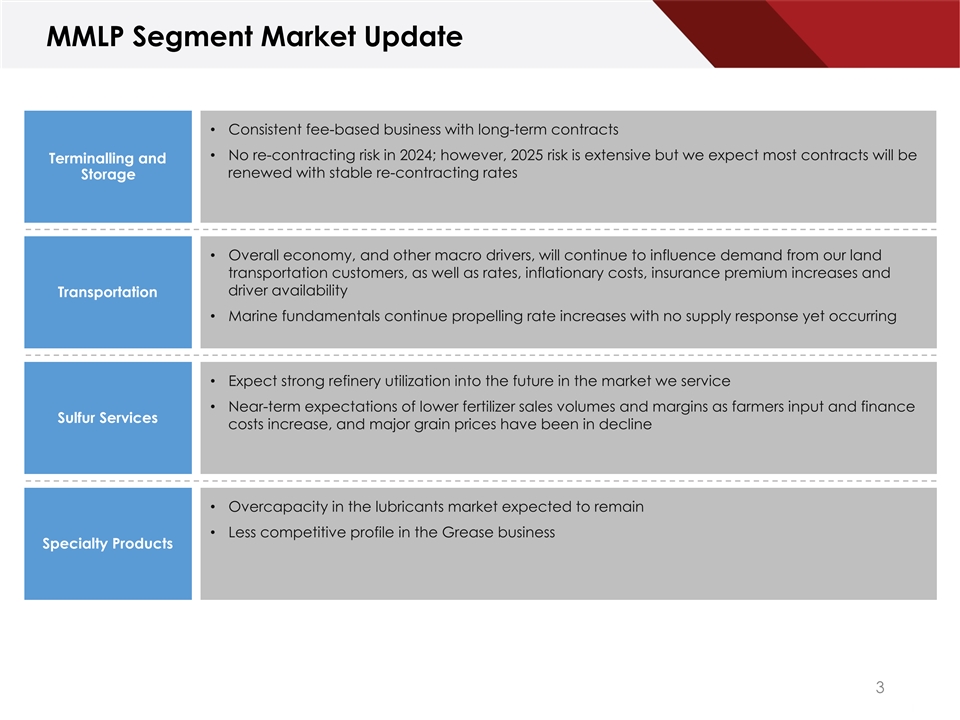
MMLP Segment Market Update • Consistent fee-based business with long-term contracts • No re-contracting risk in 2024; however, 2025 risk is extensive but we expect most contracts will be Terminalling and renewed with stable re-contracting rates Storage • Overall economy, and other macro drivers, will continue to influence demand from our land transportation customers, as well as rates, inflationary costs, insurance premium increases and driver availability Transportation • Marine fundamentals continue propelling rate increases with no supply response yet occurring • Expect strong refinery utilization into the future in the market we service • Near-term expectations of lower fertilizer sales volumes and margins as farmers input and finance Sulfur Services costs increase, and major grain prices have been in decline • Overcapacity in the lubricants market expected to remain • Less competitive profile in the Grease business Specialty Products 3

Financing Discussion Strategy MRMC Transaction Financing ($ in MM) • MRMC management is currently in discussions with Wells Fargo and Regions regarding financing for the Premium At Market 5% 10% 15% 20% purchase of MMLP Unit Price as of 4/23/2024 $2.60 $2.73 $2.86 $2.99 $3.12 • An amended and upsized ABL facility could provide up Non-MRMC Units (fully diluted) 32.8 32.8 32.8 32.8 32.8 to $200MM of financing MMLP Buyout $85.3 $89.5 $93.8 $98.1 $102.3 • However, the amount of collateral available to Transaction Costs $8.3 $8.3 $8.3 $8.3 $8.3 secure the facility is currently being evaluated and will determine potential availability under the facility Total Cash Needed $93.6 $97.8 $102.1 $106.3 $110.6 • In addition to the ABL, a Term Loan facility is being contemplated to facilitate the buyout of MMLP and ensure sufficient pro forma liquidity • Management will update the MRMC Board as the financing package is finalized • No proposal will be made prior to ensuring availability of financing 4 Source: MRMC / MMLP Management, FactSet | Market data as of 4/23/2024
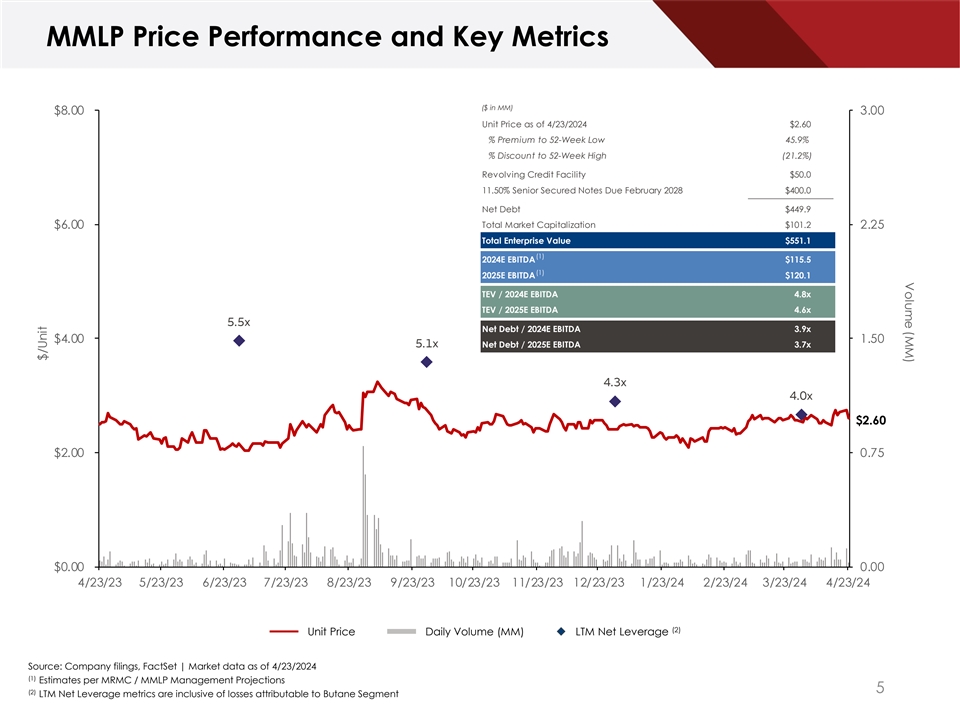
Volume (MM) MMLP Price Performance and Key Metrics ($ in MM) $8.00 3.00 Unit Price as of 4/23/2024 $2.60 % Premium to 52-Week Low 45.9% % Discount to 52-Week High (21.2%) Revolving Credit Facility $50.0 11.50% Senior Secured Notes Due February 2028 $400.0 Net Debt $449.9 Total Market Capitalization $101.2 $6.00 2.25 Total Enterprise Value $551.1 (1) 2024E EBITDA $115.5 (1) 2025E EBITDA $120.1 TEV / 2024E EBITDA 4.8x TEV / 2025E EBITDA 4.6x 5.5x Net Debt / 2024E EBITDA 3.9x $4.00 1.50 5.1x Net Debt / 2025E EBITDA 3.7x 4.3x 4.0x $2.60 $2.00 0.75 $0.00 0.00 4/23/23 5/23/23 6/23/23 7/23/23 8/23/23 9/23/23 10/23/23 11/23/23 12/23/23 1/23/24 2/23/24 3/23/24 4/23/24 (2) Unit Price Daily Volume (MM) LTM Net Leverage Source: Company filings, FactSet | Market data as of 4/23/2024 (1) Estimates per MRMC / MMLP Management Projections 5 (2) LTM Net Leverage metrics are inclusive of losses attributable to Butane Segment $/Unit

MMLP Units Traded Analysis | (% of Total Volume) 3 Months 6 Months 3 Month Summary Statistics 6 Month Summary Statistics 100% 100% Total Volume (MM) 2.850 Total Volume (MM) 7.179 % Float 10.1% % Float 25.5% Avg. Daily Trading Volume (MM) 0.045 Avg. Daily Trading Volume (MM) 0.057 Mean $2.47 Mean $2.47 75% 75% VWAP $2.50 VWAP $2.49 59.7% 48.5% 46.6% 50% 50% 27.9% 25% 25% 12.4% 4.9% 0.0% 0.0% 0.0% 0.0% 0.0% 0.0% 0% 0% $2.00 - $2.25 $2.25 - $2.50 $2.50 - $2.75 $2.75 - $3.00 $3.00 - $3.25 $3.25 - $3.50 $2.00 - $2.25 $2.25 - $2.50 $2.50 - $2.75 $2.75 - $3.00 $3.00 - $3.25 $3.25 - $3.50 12 Months 18 Months 12 Month Summary Statistics 18 Month Summary Statistics 100% 100% Total Volume (MM) 16.924 Total Volume (MM) 24.965 % Float 60.1% % Float 88.7% Avg. Daily Trading Volume (MM) 0.067 Avg. Daily Trading Volume (MM) 0.066 75% Mean $2.46 75% Mean $2.63 VWAP $2.56 VWAP $2.70 50% 50% 39.6% 26.8% 25.0% 25% 25% 16.9% 12.8% 12.6% 10.0% 8.7% 8.6% 6.8% 0.0% 0.0% 0% 0% $2.00 - $2.25 $2.25 - $2.50 $2.50 - $2.75 $2.75 - $3.00 $3.00 - $3.25 $3.25 - $3.50 $2.00 - $2.25 $2.25 - $2.50 $2.50 - $2.75 $2.75 - $3.00 $3.00 - $3.25 $3.25 - $3.50 6 Source: Company filings, FactSet | Market data as of 4/23/2024
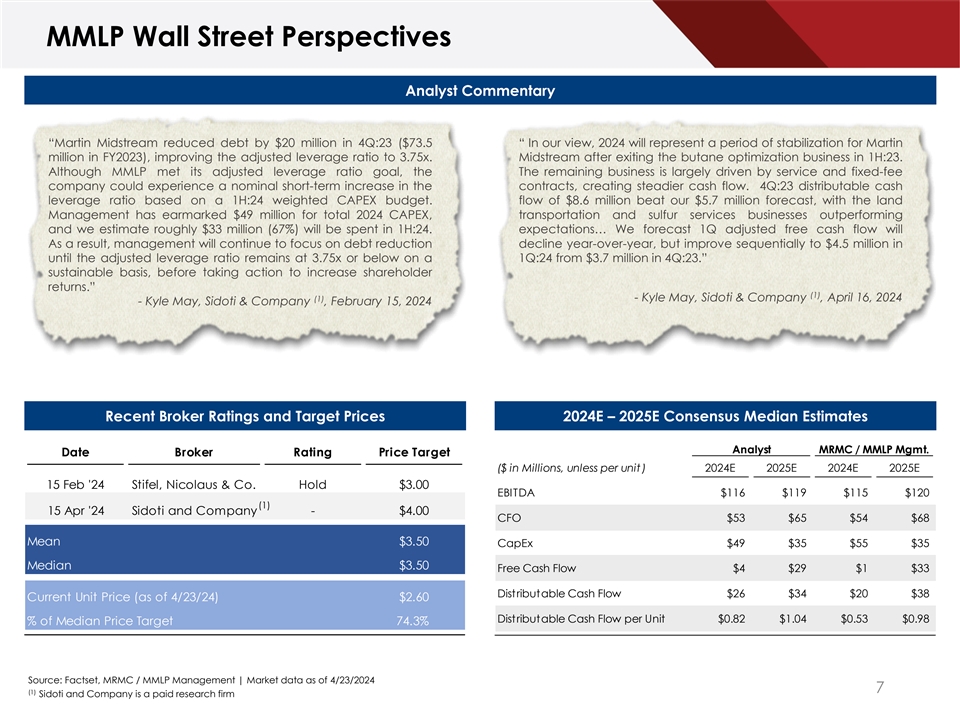
MMLP Wall Street Perspectives Analyst Commentary “Martin Midstream reduced debt by $20 million in 4Q:23 ($73.5 “ In our view, 2024 will represent a period of stabilization for Martin million in FY2023), improving the adjusted leverage ratio to 3.75x. Midstream after exiting the butane optimization business in 1H:23. Although MMLP met its adjusted leverage ratio goal, the The remaining business is largely driven by service and fixed-fee company could experience a nominal short-term increase in the contracts, creating steadier cash flow. 4Q:23 distributable cash leverage ratio based on a 1H:24 weighted CAPEX budget. flow of $8.6 million beat our $5.7 million forecast, with the land Management has earmarked $49 million for total 2024 CAPEX, transportation and sulfur services businesses outperforming and we estimate roughly $33 million (67%) will be spent in 1H:24. expectations… We forecast 1Q adjusted free cash flow will As a result, management will continue to focus on debt reduction decline year-over-year, but improve sequentially to $4.5 million in until the adjusted leverage ratio remains at 3.75x or below on a 1Q:24 from $3.7 million in 4Q:23.” sustainable basis, before taking action to increase shareholder returns.” (1) (1) - Kyle May, Sidoti & Company , April 16, 2024 - Kyle May, Sidoti & Company , February 15, 2024 Recent Broker Ratings and Target Prices 2024E – 2025E Consensus Median Estimates Analyst MRMC / MMLP Mgmt. Date Broker Rating Price Target ($ in Millions, unless per unit ) 2024E 2025E 2024E 2025E 15 Feb '24 Stifel, Nicolaus & Co. Hold $3.00 EBITDA $116 $119 $115 $120 (1) 15 Apr '24 Sidoti and Company - $4.00 CFO $53 $65 $54 $68 Mean $3.50 CapEx $49 $35 $55 $35 Median $3.50 Free Cash Flow $4 $29 $1 $33 Distributable Cash Flow $26 $34 $20 $38 Current Unit Price (as of 4/23/24) $2.60 Distributable Cash Flow per Unit $0.82 $1.04 $0.53 $0.98 % of Median Price Target 74.3% Source: Factset, MRMC / MMLP Management | Market data as of 4/23/2024 7 (1) Sidoti and Company is a paid research firm
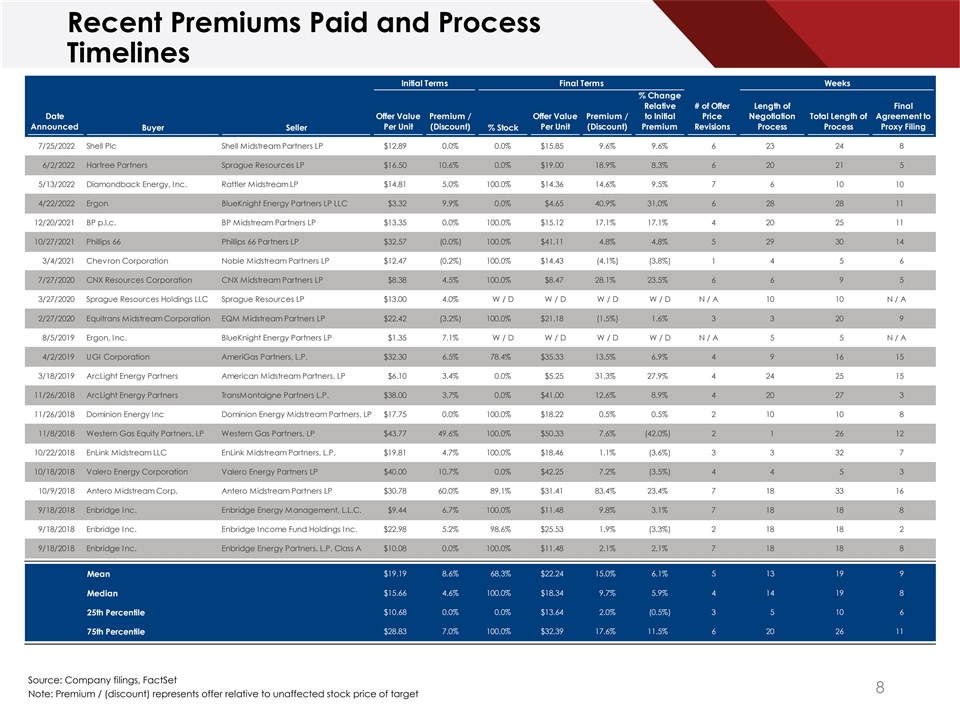
Recent Premiums Paid and Process Timelines Initial Terms Final Terms Weeks Diversified Specialty Services Midstream Business Strategically Located Along the Gulf Coast with % Change Relative # of Offer Length of Final Operations in Four Key Business Segments Date Offer Value Premium / Offer Value Premium / to Initial Price Negotiation Total Length of Agreement to Announced Per Unit (Discount) Per Unit (Discount) Premium Revisions Process Process Proxy Filing Buyer Seller % Stock 7/25/2022 Shell Plc Shell Midstream Partners LP $12.89 0.0% 0.0% $15.85 9.6% 9.6% 6 23 24 8 6/2/2022 Hartree Partners Sprague Resources LP $16.50 10.6% 0.0% $19.00 18.9% 8.3% 6 20 21 5 5/13/2022 Diamondback Energy, Inc. Rattler Midstream LP $14.81 5.0% 100.0% $14.36 14.6% 9.5% 7 6 10 10 4/22/2022 Ergon BlueKnight Energy Partners LP LLC $3.32 9.9% 0.0% $4.65 40.9% 31.0% 6 28 28 11 12/20/2021 BP p.l.c. BP Midstream Partners LP $13.35 0.0% 100.0% $15.12 17.1% 17.1% 4 20 25 11 10/27/2021 Phillips 66 Phillips 66 Partners LP $32.57 (0.0%) 100.0% $41.11 4.8% 4.8% 5 29 30 14 3/4/2021 Chevron Corporation Noble Midstream Partners LP $12.47 (0.2%) 100.0% $14.43 (4.1%) (3.8%) 1 4 5 6 7/27/2020 CNX Resources Corporation CNX Midstream Partners LP $8.38 4.5% 100.0% $8.47 28.1% 23.5% 6 6 9 5 3/27/2020 Sprague Resources Holdings LLC Sprague Resources LP $13.00 4.0% W / D W / D W / D W / D N / A 10 10 N / A 2/27/2020 Equitrans Midstream Corporation EQM Midstream Partners LP $22.42 (3.2%) 100.0% $21.18 (1.5%) 1.6% 3 3 20 9 8/5/2019 Ergon, Inc. BlueKnight Energy Partners LP $1.35 7.1% W / D W / D W / D W / D N / A 5 5 N / A 4/2/2019 UGI Corporation AmeriGas Partners, L.P. $32.30 6.5% 78.4% $35.33 13.5% 6.9% 4 9 16 15 3/18/2019 ArcLight Energy Partners American Midstream Partners, LP $6.10 3.4% 0.0% $5.25 31.3% 27.9% 4 24 25 15 11/26/2018 ArcLight Energy Partners TransMontaigne Partners L.P. $38.00 3.7% 0.0% $41.00 12.6% 8.9% 4 20 27 3 11/26/2018 Dominion Energy Inc Dominion Energy Midstream Partners, LP $17.75 0.0% 100.0% $18.22 0.5% 0.5% 2 10 10 8 11/8/2018 Western Gas Equity Partners, LP Western Gas Partners, LP $43.77 49.6% 100.0% $50.33 7.6% (42.0%) 2 1 26 12 10/22/2018 EnLink Midstream LLC EnLink Midstream Partners, L.P. $19.81 4.7% 100.0% $18.46 1.1% (3.6%) 3 3 32 7 10/18/2018 Valero Energy Corporation Valero Energy Partners LP $40.00 10.7% 0.0% $42.25 7.2% (3.5%) 4 4 5 3 10/9/2018 Antero Midstream Corp. Antero Midstream Partners LP $30.78 60.0% 89.1% $31.41 83.4% 23.4% 7 18 33 16 9/18/2018 Enbridge Inc. Enbridge Energy Management, L.L.C. $9.44 6.7% 100.0% $11.48 9.8% 3.1% 7 18 18 8 9/18/2018 Enbridge Inc. Enbridge Income Fund Holdings Inc. $22.98 5.2% 98.6% $25.53 1.9% (3.3%) 2 18 18 2 9/18/2018 Enbridge Inc. Enbridge Energy Partners, L.P. Class A $10.08 0.0% 100.0% $11.48 2.1% 2.1% 7 18 18 8 Mean $19.19 8.6% 68.3% $22.24 15.0% 6.1% 5 13 19 9 Median $15.66 4.6% 100.0% $18.34 9.7% 5.9% 4 14 19 8 $10.68 0.0% 0.0% $13.64 2.0% (0.5%) 3 5 10 6 25th Percentile 75th Percentile $28.83 7.0% 100.0% $32.39 17.6% 11.5% 6 20 26 11 Source: Company filings, FactSet 8 Note: Premium / (discount) represents offer relative to unaffected stock price of target

MMLP Projected Financial Summary (1) EBITDA ($MM) DCF ($MM) Transportation Services Terminalling & Storage Sulfur Services Specialty Products Unallocated SG&A $62.5 $120.1 $119.9 $119.1 $118.1 $115.5 $23.0 $22.8 $22.7 $22.5 $22.1 $42.0 $38.2 $35.1 $27.5 $35.0 $36.1 $36.5 $36.8 $37.3 $20.5 $37.7 $38.1 $38.7 $39.9 $44.4 $40.9 $39.6 $37.1 $36.5 2024 2025 2026 2027 2028 ($16.8) ($15.9) ($16.6) ($16.8) ($16.7) 2024 2025 2026 2027 2028 (1) (2) Capital Expenditures ($MM) Free Cash Flow Before Debt Repayment ($MM) Growth Capex Maintenance Capex $55.5 $48.0 $41.6 $21.6 $38.6 $37.5 $35.5 $32.6 $10.8 $29.7 $5.9 $12.6 $15.1 $24.7 $33.9 $30.8 $29.6 $24.9 $23.5 $0.6 2024 2025 2026 2027 2028 2024 2025 2026 2027 2028 Source: MRMC / MMLP Management 9 (1) Analysis assumes 11.5% Senior Notes due 2027 are refinanced at maturity at illustrative interest rate of 8.5% (2) Calculated as DCF less Growth Capex, plus Proceeds from Asset Sales

Preliminary MMLP Discounted Cash Flow Analysis ($ in MM, except per unit amounts) Q2 - Q4 2024 FY 2025P FY 2026P FY 2027P FY 2028P Terminal Value MMLP EBITDA $85 $120 $120 $118 $119 (-) Cash Taxes (3) (5) (5) (5) (5) (-) Maintenance Capex (23) (30) (31) (25) (23) (-) Changes in Working Capital 4 1 (0) (13) (0) (-) Phantom Stock (0) 1 (1) 0 0 (+) Proceeds from Asset Sales 2 0 0 0 1 (-) Growth Capex (15) (6) (11) (13) (15) Unlevered Free Cash Flow $49 $82 $72 $63 $76 Terminal Multiple 4.5x Terminal EBITDA $119 Implied Perpetuity Growth Rate (3.2%) PV of Unlevered Cash Flows at 10.5% Discount Rate $272 PV of Terminal Value at 10.5% Discount Rate $333 Enterprise Value $606 (-) Net Debt Balance (as of 4/1/2024) ($450) Total Equity Value $156 Total Diluted Units Outstanding (MM) 38.91 Implied Unit Price $4.00 Implied 2024E EBITDA Multiple 5.2x Implied 2025E EBITDA Multiple 5.0x Implied Unit Price Sensitivity Terminal Multiple 4.5x 5.0x 5.5x 6.0x 6.5x 8.5% $5.05 $6.09 $7.12 $8.16 $9.20 9.5% $4.50 $5.50 $6.49 $7.48 $8.48 10.5% $4.00 $4.95 $5.91 $6.86 $7.81 11.5% $3.49 $4.40 $5.31 $6.22 $7.14 12.5% $3.02 $3.89 $4.77 $5.64 $6.51 Source: MRMC / MMLP Management Projections, FactSet 10 Note: Assumes transaction effective date of 4/1/2024 Discount Rate
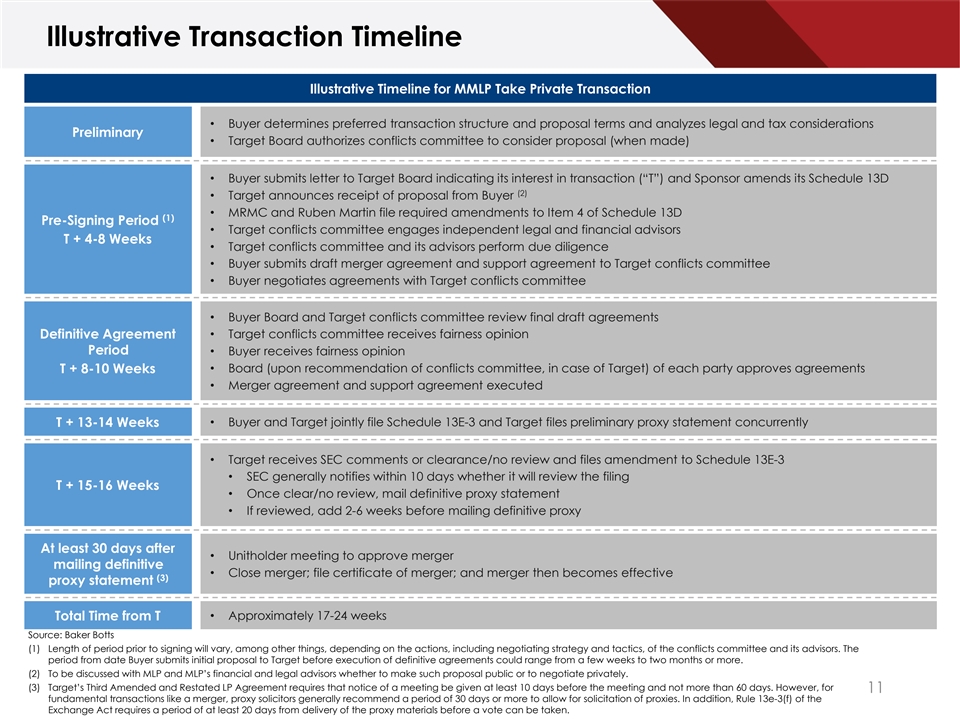
Illustrative Transaction Timeline Illustrative Timeline for MMLP Take Private Transaction • Buyer determines preferred transaction structure and proposal terms and analyzes legal and tax considerations Preliminary • Target Board authorizes conflicts committee to consider proposal (when made) • Buyer submits letter to Target Board indicating its interest in transaction (“T”) and Sponsor amends its Schedule 13D (2) • Target announces receipt of proposal from Buyer • MRMC and Ruben Martin file required amendments to Item 4 of Schedule 13D (1) Pre-Signing Period • Target conflicts committee engages independent legal and financial advisors T + 4-8 Weeks • Target conflicts committee and its advisors perform due diligence • Buyer submits draft merger agreement and support agreement to Target conflicts committee • Buyer negotiates agreements with Target conflicts committee • Buyer Board and Target conflicts committee review final draft agreements Definitive Agreement • Target conflicts committee receives fairness opinion Period • Buyer receives fairness opinion T + 8-10 Weeks • Board (upon recommendation of conflicts committee, in case of Target) of each party approves agreements • Merger agreement and support agreement executed T + 13-14 Weeks • Buyer and Target jointly file Schedule 13E-3 and Target files preliminary proxy statement concurrently • Target receives SEC comments or clearance/no review and files amendment to Schedule 13E-3 • SEC generally notifies within 10 days whether it will review the filing T + 15-16 Weeks • Once clear/no review, mail definitive proxy statement • If reviewed, add 2-6 weeks before mailing definitive proxy At least 30 days after • Unitholder meeting to approve merger mailing definitive • Close merger; file certificate of merger; and merger then becomes effective (3) proxy statement • Approximately 17-24 weeks Total Time from T Source: Baker Botts (1) Length of period prior to signing will vary, among other things, depending on the actions, including negotiating strategy and tactics, of the conflicts committee and its advisors. The period from date Buyer submits initial proposal to Target before execution of definitive agreements could range from a few weeks to two months or more. (2) To be discussed with MLP and MLP’s financial and legal advisors whether to make such proposal public or to negotiate privately. (3) Target’s Third Amended and Restated LP Agreement requires that notice of a meeting be given at least 10 days before the meeting and not more than 60 days. However, for 11 fundamental transactions like a merger, proxy solicitors generally recommend a period of 30 days or more to allow for solicitation of proxies. In addition, Rule 13e-3(f) of the Exchange Act requires a period of at least 20 days from delivery of the proxy materials before a vote can be taken.
