
PRELIMINARY AND CONFIDENTIAL SUBJECT TO MATERIAL REVISION FOR DISCUSSION PURPOSES ONLY July 1, 2024 Exhibit (c)(4) Project Augusta Discussion Materials for the Conflicts Committee Strictly Confidential. Not for Distribution.

EXECUTIVE SUMMARY 3 01 9 PRELIMINARY FINANCIAL ANALYSES 02 20 PRELIMINARY PREMIUMS PAID DATA 03 23 APPENDIX 04 24 Additional Response Considerations 35 Public Market Observations 42 Weighted Average Cost of Capital 49 Preliminary Selected Benchmarking Data 58 DISCLAIMER 05

EXECUTIVE SUMMARY 01 01 CONFIDENTIAL – PRELIMINARY – SUBJECT TO FURTHER REVIEW
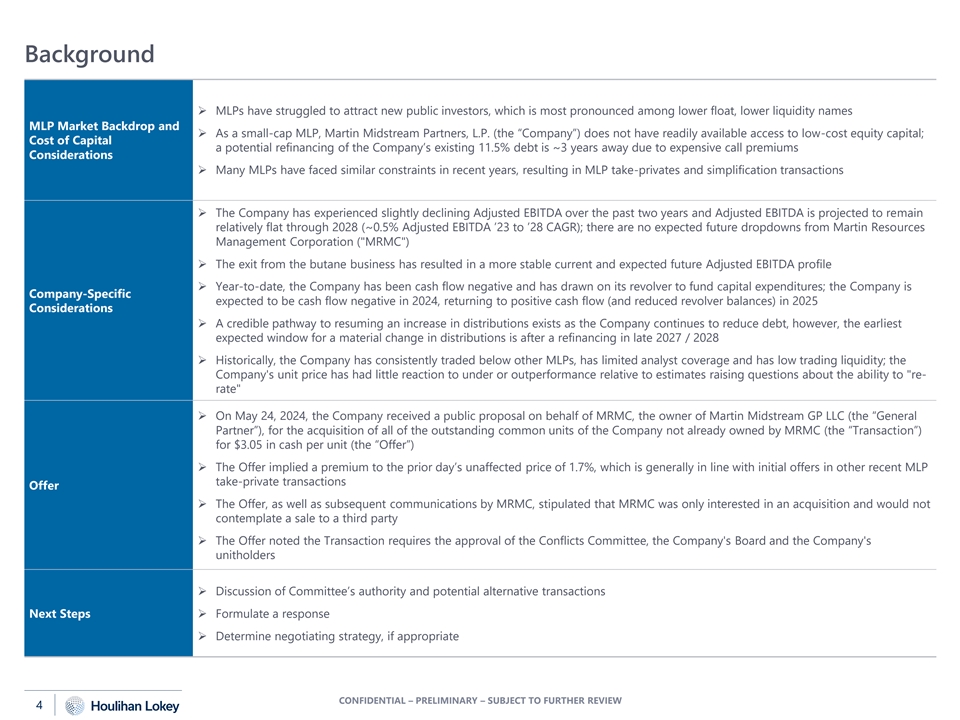
Background ➢ MLPs have struggled to attract new public investors, which is most pronounced among lower float, lower liquidity names MLP Market Backdrop and ➢ As a small-cap MLP, Martin Midstream Partners, L.P. (the “Company”) does not have readily available access to low-cost equity capital; Cost of Capital a potential refinancing of the Company’s existing 11.5% debt is ~3 years away due to expensive call premiums Considerations ➢ Many MLPs have faced similar constraints in recent years, resulting in MLP take-privates and simplification transactions ➢ The Company has experienced slightly declining Adjusted EBITDA over the past two years and Adjusted EBITDA is projected to remain relatively flat through 2028 (~0.5% Adjusted EBITDA ’23 to ’28 CAGR); there are no expected future dropdowns from Martin Resources Management Corporation ( MRMC ) ➢ The exit from the butane business has resulted in a more stable current and expected future Adjusted EBITDA profile ➢ Year-to-date, the Company has been cash flow negative and has drawn on its revolver to fund capital expenditures; the Company is Company-Specific expected to be cash flow negative in 2024, returning to positive cash flow (and reduced revolver balances) in 2025 Considerations ➢ A credible pathway to resuming an increase in distributions exists as the Company continues to reduce debt, however, the earliest expected window for a material change in distributions is after a refinancing in late 2027 / 2028 ➢ Historically, the Company has consistently traded below other MLPs, has limited analyst coverage and has low trading liquidity; the Company's unit price has had little reaction to under or outperformance relative to estimates raising questions about the ability to re- rate ➢ On May 24, 2024, the Company received a public proposal on behalf of MRMC, the owner of Martin Midstream GP LLC (the “General Partner”), for the acquisition of all of the outstanding common units of the Company not already owned by MRMC (the “Transaction”) for $3.05 in cash per unit (the “Offer”) ➢ The Offer implied a premium to the prior day’s unaffected price of 1.7%, which is generally in line with initial offers in other recent MLP take-private transactions Offer ➢ The Offer, as well as subsequent communications by MRMC, stipulated that MRMC was only interested in an acquisition and would not contemplate a sale to a third party ➢ The Offer noted the Transaction requires the approval of the Conflicts Committee, the Company's Board and the Company's unitholders ➢ Discussion of Committee’s authority and potential alternative transactions Next Steps➢ Formulate a response ➢ Determine negotiating strategy, if appropriate CONFIDENTIAL – PRELIMINARY – SUBJECT TO FURTHER REVIEW 4

Overview of the Proposed Transaction ➢ MRMC Parties ➢ Martin Midstream Partners, L.P. ➢ MRMC proposes to acquire 100% of the common units owned by unitholders Summary➢ $3.05 in cash per unit (the “Consideration”) ➢ The Company will merge with a wholly owned subsidiary of MRMC, and the Company will no longer remain public ➢ Approval of the Board of Directors of MRMC ➢ Approval of the Conflicts Committee Timing and Approvals ➢ Approval of the Board of Directors of Martin Midstream GP LLC ➢ Approval of the Company's unitholders [majority of all common units] ➢ MRMC has no interest at this time in selling any of its or its subsidiaries' interests in the Company or the General Partner or pursuing other strategic alternatives involving the Company or the General Partner ➢ MRMC anticipates financing the merger consideration with cash on hand and borrowings under its existing and additional Other credit facilities ➢ No financing condition expected, as is customary ➢ 13E-3 Transaction Source: Offer. CONFIDENTIAL – PRELIMINARY – SUBJECT TO FURTHER REVIEW 5
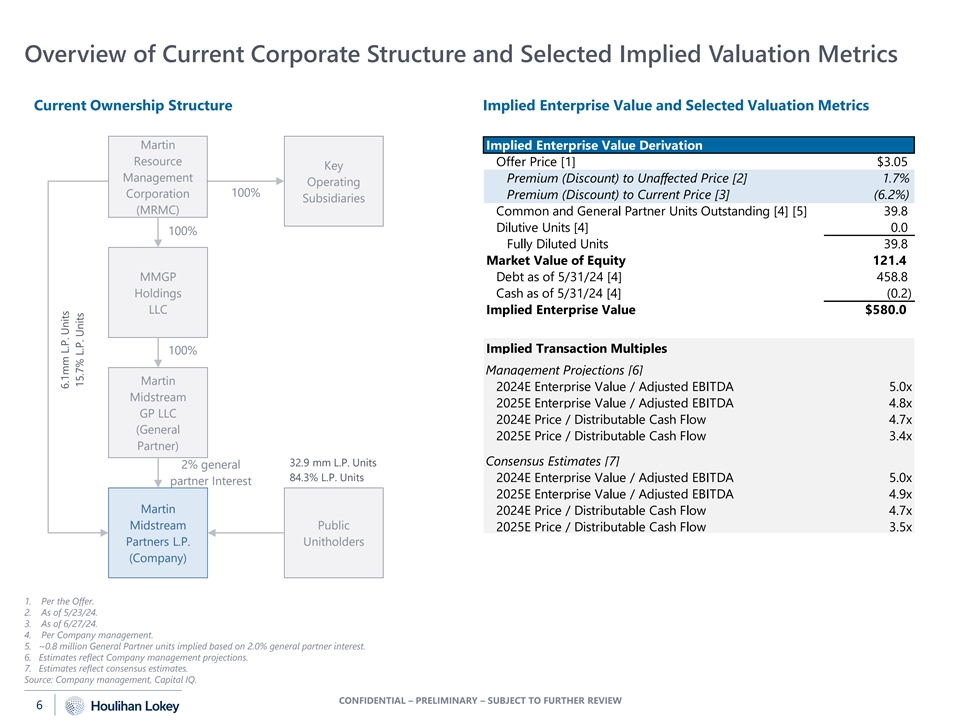
Overview of Current Corporate Structure and Selected Implied Valuation Metrics Current Ownership Structure Implied Enterprise Value and Selected Valuation Metrics Martin Implied Enterprise Value Derivation Resource Offer Price [1] $3.05 Key Management Premium (Discount) to Unaffected Price [2] 1.7% Operating 100% Corporation Premium (Discount) to Current Price [3] (6.2%) Subsidiaries (MRMC) Common and General Partner Units Outstanding [4] [5] 39.8 Dilutive Units [4] 0.0 100% Fully Diluted Units 39.8 Market Value of Equity 121.4 MMGP Debt as of 5/31/24 [4] 458.8 Holdings Cash as of 5/31/24 [4] (0.2) LLC Implied Enterprise Value $580.0 Implied Transaction Multiples 100% Management Projections [6] Martin 2024E Enterprise Value / Adjusted EBITDA 5.0x Midstream 2025E Enterprise Value / Adjusted EBITDA 4.8x GP LLC 2024E Price / Distributable Cash Flow 4.7x (General 2025E Price / Distributable Cash Flow 3.4x Partner) Consensus Estimates [7] 32.9 mm L.P. Units 2% general 84.3% L.P. Units 2024E Enterprise Value / Adjusted EBITDA 5.0x partner Interest 2025E Enterprise Value / Adjusted EBITDA 4.9x Martin 2024E Price / Distributable Cash Flow 4.7x Midstream Public 2025E Price / Distributable Cash Flow 3.5x Partners L.P. Unitholders (Company) 1. Per the Offer. 2. As of 5/23/24. 3. As of 6/27/24. 4. Per Company management. 5. ~0.8 million General Partner units implied based on 2.0% general partner interest. 6. Estimates reflect Company management projections. 7. Estimates reflect consensus estimates. Source: Company management, Capital IQ. CONFIDENTIAL – PRELIMINARY – SUBJECT TO FURTHER REVIEW 6 6.1mm L.P. Units 15.7% L.P. Units
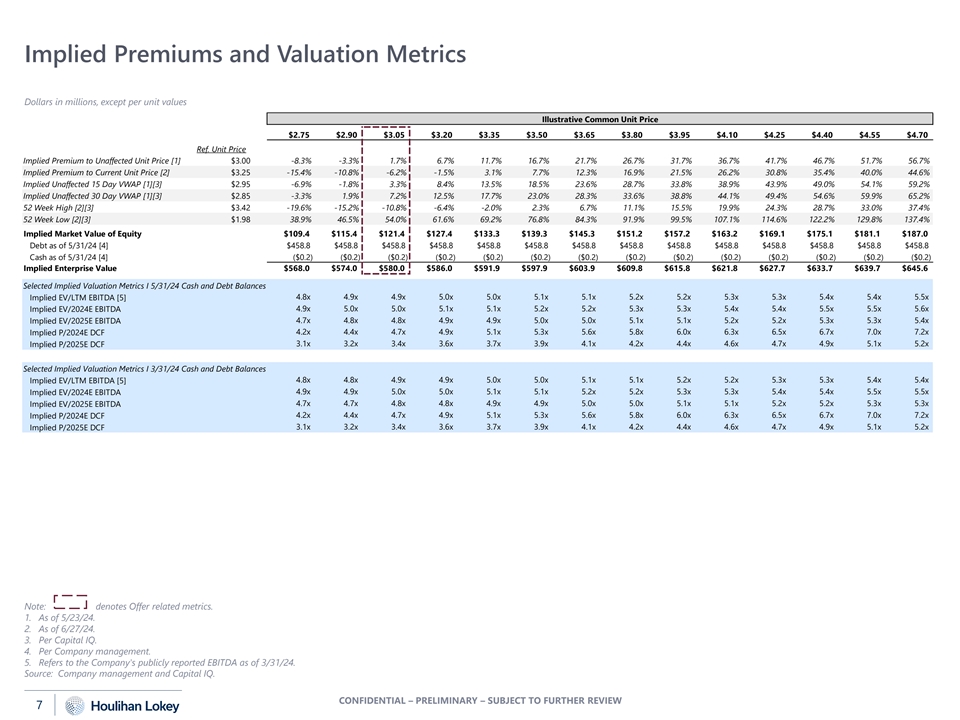
Implied Premiums and Valuation Metrics Dollars in millions, except per unit values Illustrative Common Unit Price $2.75 $2.90 $3.05 $3.20 $3.35 $3.50 $3.65 $3.80 $3.95 $4.10 $4.25 $4.40 $4.55 $4.70 Ref. Unit Price Implied Premium to Unaffected Unit Price [1] $3.00 -8.3% -3.3% 1.7% 6.7% 11.7% 16.7% 21.7% 26.7% 31.7% 36.7% 41.7% 46.7% 51.7% 56.7% Implied Premium to Current Unit Price [2] $3.25 -15.4% -10.8% -6.2% -1.5% 3.1% 7.7% 12.3% 16.9% 21.5% 26.2% 30.8% 35.4% 40.0% 44.6% Implied Unaffected 15 Day VWAP [1][3] $2.95 -6.9% -1.8% 3.3% 8.4% 13.5% 18.5% 23.6% 28.7% 33.8% 38.9% 43.9% 49.0% 54.1% 59.2% Implied Unaffected 30 Day VWAP [1][3] $2.85 -3.3% 1.9% 7.2% 12.5% 17.7% 23.0% 28.3% 33.6% 38.8% 44.1% 49.4% 54.6% 59.9% 65.2% 52 Week High [2][3] $3.42 -19.6% -15.2% -10.8% -6.4% -2.0% 2.3% 6.7% 11.1% 15.5% 19.9% 24.3% 28.7% 33.0% 37.4% 52 Week Low [2][3] $1.98 38.9% 46.5% 54.0% 61.6% 69.2% 76.8% 84.3% 91.9% 99.5% 107.1% 114.6% 122.2% 129.8% 137.4% Implied Market Value of Equity $109.4 $115.4 $121.4 $127.4 $133.3 $139.3 $145.3 $151.2 $157.2 $163.2 $169.1 $175.1 $181.1 $187.0 Debt as of 5/31/24 [4] $458.8 $458.8 $458.8 $458.8 $458.8 $458.8 $458.8 $458.8 $458.8 $458.8 $458.8 $458.8 $458.8 $458.8 Cash as of 5/31/24 [4] ($0.2) ($0.2) ($0.2) ($0.2) ($0.2) ($0.2) ($0.2) ($0.2) ($0.2) ($0.2) ($0.2) ($0.2) ($0.2) ($0.2) Implied Enterprise Value $568.0 $574.0 $580.0 $586.0 $591.9 $597.9 $603.9 $609.8 $615.8 $621.8 $627.7 $633.7 $639.7 $645.6 Selected Implied Valuation Metrics I 5/31/24 Cash and Debt Balances Implied EV/LTM EBITDA [5] 4.8x 4.9x 4.9x 5.0x 5.0x 5.1x 5.1x 5.2x 5.2x 5.3x 5.3x 5.4x 5.4x 5.5x Implied EV/2024E EBITDA 4.9x 5.0x 5.0x 5.1x 5.1x 5.2x 5.2x 5.3x 5.3x 5.4x 5.4x 5.5x 5.5x 5.6x 4.7x 4.8x 4.8x 4.9x 4.9x 5.0x 5.0x 5.1x 5.1x 5.2x 5.2x 5.3x 5.3x 5.4x Implied EV/2025E EBITDA 4.2x 4.4x 4.7x 4.9x 5.1x 5.3x 5.6x 5.8x 6.0x 6.3x 6.5x 6.7x 7.0x 7.2x Implied P/2024E DCF 3.1x 3.2x 3.4x 3.6x 3.7x 3.9x 4.1x 4.2x 4.4x 4.6x 4.7x 4.9x 5.1x 5.2x Implied P/2025E DCF Selected Implied Valuation Metrics I 3/31/24 Cash and Debt Balances 4.8x 4.8x 4.9x 4.9x 5.0x 5.0x 5.1x 5.1x 5.2x 5.2x 5.3x 5.3x 5.4x 5.4x Implied EV/LTM EBITDA [5] 4.9x 4.9x 5.0x 5.0x 5.1x 5.1x 5.2x 5.2x 5.3x 5.3x 5.4x 5.4x 5.5x 5.5x Implied EV/2024E EBITDA Implied EV/2025E EBITDA 4.7x 4.7x 4.8x 4.8x 4.9x 4.9x 5.0x 5.0x 5.1x 5.1x 5.2x 5.2x 5.3x 5.3x Implied P/2024E DCF 4.2x 4.4x 4.7x 4.9x 5.1x 5.3x 5.6x 5.8x 6.0x 6.3x 6.5x 6.7x 7.0x 7.2x 3.1x 3.2x 3.4x 3.6x 3.7x 3.9x 4.1x 4.2x 4.4x 4.6x 4.7x 4.9x 5.1x 5.2x Implied P/2025E DCF Note: denotes Offer related metrics. 1. As of 5/23/24. 2. As of 6/27/24. 3. Per Capital IQ. 4. Per Company management. 5. Refers to the Company's publicly reported EBITDA as of 3/31/24. Source: Company management and Capital IQ. CONFIDENTIAL – PRELIMINARY – SUBJECT TO FURTHER REVIEW 7
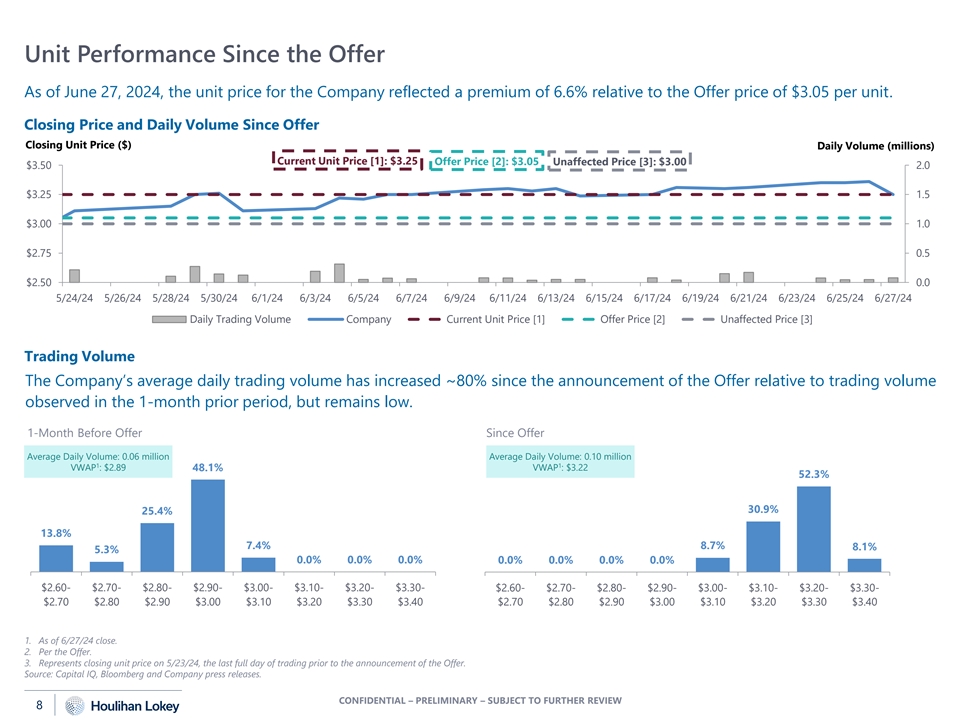
Unit Performance Since the Offer As of June 27, 2024, the unit price for the Company reflected a premium of 6.6% relative to the Offer price of $3.05 per unit. Closing Price and Daily Volume Since Offer Closing Unit Price ($) Daily Volume (millions) Current Unit Price [1]: $3.25 Offer Price [2]: $3.05 Unaffected Price [3]: $3.00 $3.50 2.0 $3.25 1.5 $3.00 1.0 $2.75 0.5 $2.50 0.0 5/24/24 5/26/24 5/28/24 5/30/24 6/1/24 6/3/24 6/5/24 6/7/24 6/9/24 6/11/24 6/13/24 6/15/24 6/17/24 6/19/24 6/21/24 6/23/24 6/25/24 6/27/24 Daily Trading Volume Company Current Unit Price [1] Offer Price [2] Unaffected Price [3] Trading Volume The Company’s average daily trading volume has increased ~80% since the announcement of the Offer relative to trading volume observed in the 1-month prior period, but remains low. 1-Month Before Offer Since Offer Average Daily Volume: 0.06 million Average Daily Volume: 0.10 million 1 1 VWAP : $2.89 VWAP : $3.22 48.1% 52.3% 30.9% 25.4% 13.8% 7.4% 8.7% 8.1% 5.3% 0.0% 0.0% 0.0% 0.0% 0.0% 0.0% 0.0% $2.60- $2.70- $2.80- $2.90- $3.00- $3.10- $3.20- $3.30- $2.60- $2.70- $2.80- $2.90- $3.00- $3.10- $3.20- $3.30- $2.70 $2.80 $2.90 $3.00 $3.10 $3.20 $3.30 $3.40 $2.70 $2.80 $2.90 $3.00 $3.10 $3.20 $3.30 $3.40 1. As of 6/27/24 close. 2. Per the Offer. 3. Represents closing unit price on 5/23/24, the last full day of trading prior to the announcement of the Offer. Source: Capital IQ, Bloomberg and Company press releases. CONFIDENTIAL – PRELIMINARY – SUBJECT TO FURTHER REVIEW 8

PRELIMINARY FINANCIAL ANALYSES 02 02 CONFIDENTIAL – PRELIMINARY – SUBJECT TO FURTHER REVIEW
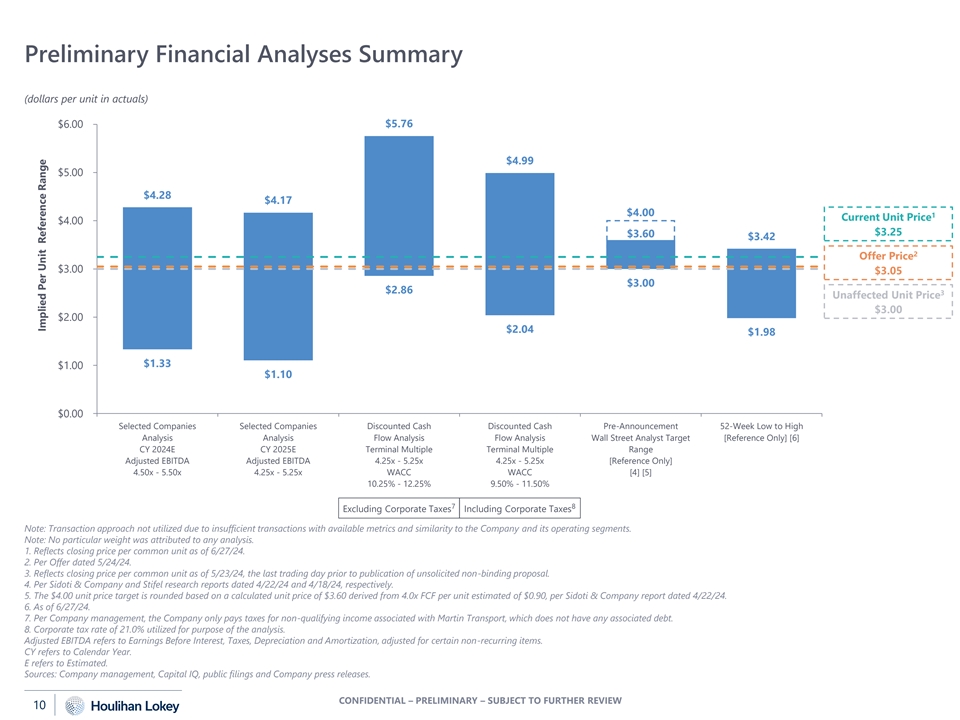
Preliminary Financial Analyses Summary (dollars per unit in actuals) $6.00 $5.76 $4.99 $5.00 $4.28 $4.17 $4.00 1 Current Unit Price $4.00 $3.25 $3.60 $3.42 2 Offer Price $3.00 $3.05 $3.00 $2.86 3 Unaffected Unit Price $3.00 $2.00 $2.04 $1.98 $1.33 $1.00 $1.10 $0.00 Selected Companies Selected Companies Discounted Cash Discounted Cash Pre-Announcement 52-Week Low to High Analysis Analysis Flow Analysis Flow Analysis Wall Street Analyst Target [Reference Only] [6] CY 2024E CY 2025E Terminal Multiple Terminal Multiple Range Adjusted EBITDA Adjusted EBITDA 4.25x - 5.25x 4.25x - 5.25x [Reference Only] 4.50x - 5.50x 4.25x - 5.25x WACC WACC [4] [5] 10.25% - 12.25% 9.50% - 11.50% 7 8 Excluding Corporate Taxes Including Corporate Taxes Note: Transaction approach not utilized due to insufficient transactions with available metrics and similarity to the Company and its operating segments. Note: No particular weight was attributed to any analysis. 1. Reflects closing price per common unit as of 6/27/24. 2. Per Offer dated 5/24/24. 3. Reflects closing price per common unit as of 5/23/24, the last trading day prior to publication of unsolicited non-binding proposal. 4. Per Sidoti & Company and Stifel research reports dated 4/22/24 and 4/18/24, respectively. 5. The $4.00 unit price target is rounded based on a calculated unit price of $3.60 derived from 4.0x FCF per unit estimated of $0.90, per Sidoti & Company report dated 4/22/24. 6. As of 6/27/24. 7. Per Company management, the Company only pays taxes for non-qualifying income associated with Martin Transport, which does not have any associated debt. 8. Corporate tax rate of 21.0% utilized for purpose of the analysis. Adjusted EBITDA refers to Earnings Before Interest, Taxes, Depreciation and Amortization, adjusted for certain non-recurring items. CY refers to Calendar Year. E refers to Estimated. Sources: Company management, Capital IQ, public filings and Company press releases. CONFIDENTIAL – PRELIMINARY – SUBJECT TO FURTHER REVIEW 10 Implied Per Unit Reference Range

Preliminary Financial Analyses Summary (cont.) (dollars and units in millions, except per unit values) Excluding Corporate Taxes [1] Including Corporate Taxes [2] Selected Companies Selected Companies Discounted Cash Discounted Cash Analysis Analysis Flow Analysis Flow Analysis CY 2024E CY 2025E Terminal Multiple Terminal Multiple Adjusted EBITDA Adjusted EBITDA 4.25x -- 5.25x 4.25x -- 5.25x Discount Rate Discount Rate Corresponding Base Amount $115.3 $119.9 10.25% -- 12.25% 9.50% -- 11.50% Selected Multiples Range 4.50x -- 5.50x 4.25x -- 5.25x Implied Enterprise Value Reference Range $518.8 -- $634.1 $509.7 -- $629.7 $579.5 -- $692.9 $547.0 -- $662.4 Cash and Cash Equivalents as of 5/31/24 [3] 0.2 -- 0.2 0.2 -- 0.2 0.2 -- 0.2 0.2 -- 0.2 Implied Total Enterprise Value Reference Range $519.0 -- $634.3 $509.9 -- $629.9 $579.7 -- $693.1 $547.2 -- $662.6 Total Debt as of 5/31/24 [3] (458.5) -- (458.5) (458.5) -- (458.5) (458.5) -- (458.5) (458.5) -- (458.5) Implied Total Equity Value Reference Range Pre-Contingent Liability $60.5 -- $175.8 $51.4 -- $171.4 $121.2 -- $234.6 $88.7 -- $204.1 Contingent Liability [4] (7.5) -- (5.5) (7.5) -- (5.5) (7.5) -- (5.5) (7.5) -- (5.5) Implied Total Equity Value Reference Range $53.0 -- $170.3 $43.9 -- $165.9 $113.7 -- $229.1 $81.2 -- $198.6 Units Outstanding [5] 39.8 -- 39.8 39.8 -- 39.8 39.8 -- 39.8 39.8 -- 39.8 Implied Per Unit Reference Range $1.33 -- $4.28 $1.10 -- $4.17 $2.86 -- $5.76 $2.04 -- $4.99 1. Per Company management, the Company only pays taxes for non-qualifying income associated with Martin Transport, which does not have any associated debt. 2. Corporate tax rate of 21.0% utilized for purpose of the analysis. 3. Per Company management. 4. Refers to the Company's potential financial exposure associated with certain litigation related matters and potential insurance claims related to the oil spill that occurred on 6/15/24 and Marine bridge incident that occurred on 5/15/24, per Company management. 5. Represents ~39.0 million common units and ~0.8 million units to account for the General Partner's 2% economic interest, per Company management. Adjusted EBITDA refers to Earnings Before Interest, Taxes, Depreciation and Amortization, adjusted for certain non-recurring items. CY refers to Calendar Year. E refers to Estimated. Source: Company management. CONFIDENTIAL – PRELIMINARY – SUBJECT TO FURTHER REVIEW 11
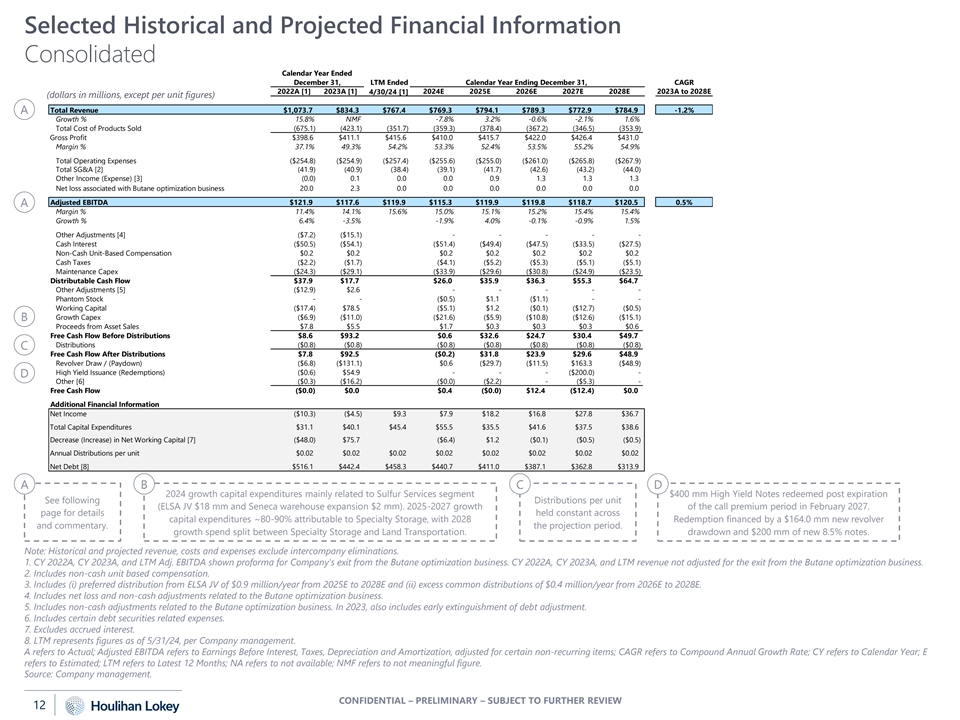
Selected Historical and Projected Financial Information Consolidated Calendar Year Ended December 31, LTM Ended Calendar Year Ending December 31, CAGR 2022A [1] 2023A [1] 4/30/24 [1] 2024E 2025E 2026E 2027E 2028E 2023A to 2028E (dollars in millions, except per unit figures) Total Revenue $1,073.7 $834.3 $767.4 $769.3 $794.1 $789.3 $772.9 $784.9 -1.2% A Growth % 15.8% NMF -7.8% 3.2% -0.6% -2.1% 1.6% Total Cost of Products Sold (675.1) (423.1) (351.7) (359.3) (378.4) (367.2) (346.5) (353.9) Gross Profit $398.6 $411.1 $415.6 $410.0 $415.7 $422.0 $426.4 $431.0 Margin % 37.1% 49.3% 54.2% 53.3% 52.4% 53.5% 55.2% 54.9% Total Operating Expenses ($254.8) ($254.9) ($257.4) ($255.6) ($255.0) ($261.0) ($265.8) ($267.9) Total SG&A [2] (41.9) (40.9) (38.4) (39.1) (41.7) (42.6) (43.2) (44.0) Other Income (Expense) [3] (0.0) 0.1 0.0 0.0 0.9 1.3 1.3 1.3 Net loss associated with Butane optimization business 20.0 2.3 0.0 0.0 0.0 0.0 0.0 0.0 Adjusted EBITDA $121.9 $117.6 $119.9 $115.3 $119.9 $119.8 $118.7 $120.5 0.5% A Margin % 11.4% 14.1% 15.6% 15.0% 15.1% 15.2% 15.4% 15.4% Growth % 6.4% -3.5% -1.9% 4.0% -0.1% -0.9% 1.5% Other Adjustments [4] ($7.2) ($15.1) - - - - - Cash Interest ($50.5) ($54.1) ($51.4) ($49.4) ($47.5) ($33.5) ($27.5) Non-Cash Unit-Based Compensation $0.2 $0.2 $0.2 $0.2 $0.2 $0.2 $0.2 Cash Taxes ($2.2) ($1.7) ($4.1) ($5.2) ($5.3) ($5.1) ($5.1) Maintenance Capex ($24.3) ($29.1) ($33.9) ($29.6) ($30.8) ($24.9) ($23.5) Distributable Cash Flow $37.9 $17.7 $26.0 $35.9 $36.3 $55.3 $64.7 Other Adjustments [5] ($12.9) $2.6 - - - - - Phantom Stock - - ($0.5) $1.1 ($1.1) - - Working Capital ($17.4) $78.5 ($5.1) $1.2 ($0.1) ($12.7) ($0.5) Growth Capex ($6.9) ($11.0) ($21.6) ($5.9) ($10.8) ($12.6) ($15.1) B Proceeds from Asset Sales $7.8 $5.5 $1.7 $0.3 $0.3 $0.3 $0.6 Free Cash Flow Before Distributions $8.6 $93.2 $0.6 $32.6 $24.7 $30.4 $49.7 Distributions ($0.8) ($0.8) ($0.8) ($0.8) ($0.8) ($0.8) ($0.8) C Free Cash Flow After Distributions $7.8 $92.5 ($0.2) $31.8 $23.9 $29.6 $48.9 Revolver Draw / (Paydown) ($6.8) ($131.1) $0.6 ($29.7) ($11.5) $163.3 ($48.9) High Yield Issuance (Redemptions) ($0.6) $54.9 - - - ($200.0) - D Other [6] ($0.3) ($16.2) ($0.0) ($2.2) - ($5.3) - Free Cash Flow ($0.0) $0.0 $0.4 ($0.0) $12.4 ($12.4) $0.0 Additional Financial Information Net Income ($10.3) ($4.5) $9.3 $7.9 $18.2 $16.8 $27.8 $36.7 Total Capital Expenditures $31.1 $40.1 $45.4 $55.5 $35.5 $41.6 $37.5 $38.6 Decrease (Increase) in Net Working Capital [7] ($48.0) $75.7 ($6.4) $1.2 ($0.1) ($0.5) ($0.5) Annual Distributions per unit $0.02 $0.02 $0.02 $0.02 $0.02 $0.02 $0.02 $0.02 Net Debt [8] $516.1 $442.4 $458.3 $440.7 $411.0 $387.1 $362.8 $313.9 A B C D 2024 growth capital expenditures mainly related to Sulfur Services segment $400 mm High Yield Notes redeemed post expiration See following Distributions per unit (ELSA JV $18 mm and Seneca warehouse expansion $2 mm). 2025-2027 growth of the call premium period in February 2027. page for details held constant across capital expenditures ~80-90% attributable to Specialty Storage, with 2028 Redemption financed by a $164.0 mm new revolver and commentary. the projection period. growth spend split between Specialty Storage and Land Transportation. drawdown and $200 mm of new 8.5% notes. Note: Historical and projected revenue, costs and expenses exclude intercompany eliminations. 1. CY 2022A, CY 2023A, and LTM Adj. EBITDA shown proforma for Company's exit from the Butane optimization business. CY 2022A, CY 2023A, and LTM revenue not adjusted for the exit from the Butane optimization business. 2. Includes non-cash unit based compensation. 3. Includes (i) preferred distribution from ELSA JV of $0.9 million/year from 2025E to 2028E and (ii) excess common distributions of $0.4 million/year from 2026E to 2028E. 4. Includes net loss and non-cash adjustments related to the Butane optimization business. 5. Includes non-cash adjustments related to the Butane optimization business. In 2023, also includes early extinguishment of debt adjustment. 6. Includes certain debt securities related expenses. 7. Excludes accrued interest. 8. LTM represents figures as of 5/31/24, per Company management. A refers to Actual; Adjusted EBITDA refers to Earnings Before Interest, Taxes, Depreciation and Amortization, adjusted for certain non-recurring items; CAGR refers to Compound Annual Growth Rate; CY refers to Calendar Year; E refers to Estimated; LTM refers to Latest 12 Months; NA refers to not available; NMF refers to not meaningful figure. Source: Company management. CONFIDENTIAL – PRELIMINARY – SUBJECT TO FURTHER REVIEW 12
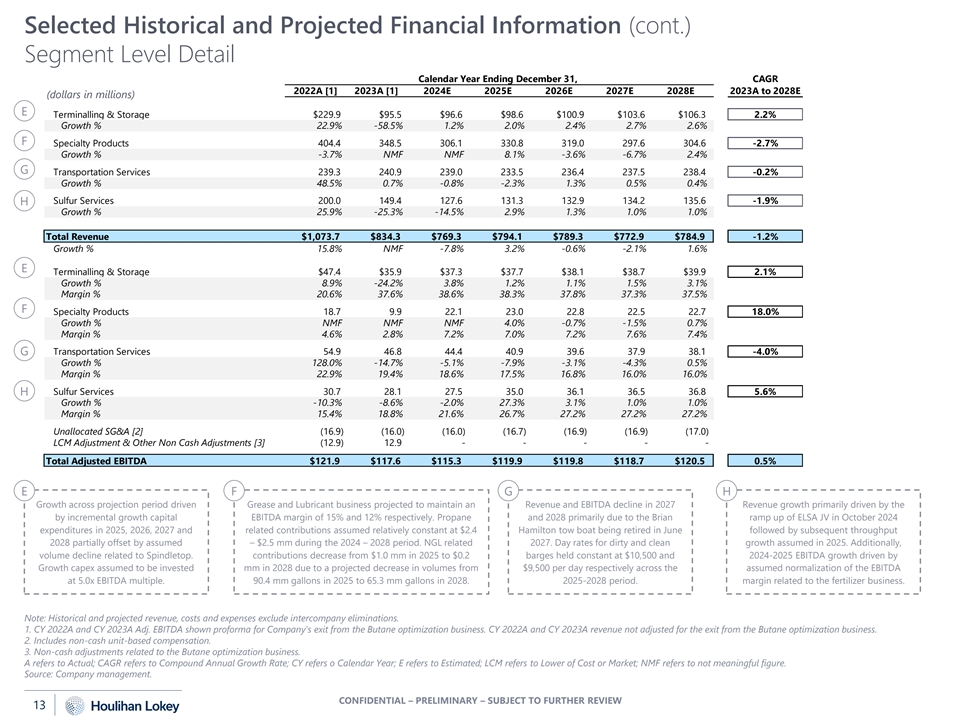
Selected Historical and Projected Financial Information (cont.) Segment Level Detail Calendar Year Ending December 31, CAGR 2022A [1] 2023A [1] 2024E 2025E 2026E 2027E 2028E 2023A to 2028E (dollars in millions) E Terminalling & Storage $229.9 $95.5 $96.6 $98.6 $100.9 $103.6 $106.3 2.2% Growth % 22.9% -58.5% 1.2% 2.0% 2.4% 2.7% 2.6% F Specialty Products 404.4 348.5 306.1 330.8 319.0 297.6 304.6 -2.7% Growth % -3.7% NMF NMF 8.1% -3.6% -6.7% 2.4% G Transportation Services 239.3 240.9 239.0 233.5 236.4 237.5 238.4 -0.2% Growth % 48.5% 0.7% -0.8% -2.3% 1.3% 0.5% 0.4% Sulfur Services 200.0 149.4 127.6 131.3 132.9 134.2 135.6 -1.9% H Growth % 25.9% -25.3% -14.5% 2.9% 1.3% 1.0% 1.0% Total Revenue $1,073.7 $834.3 $769.3 $794.1 $789.3 $772.9 $784.9 -1.2% Growth % 15.8% NMF -7.8% 3.2% -0.6% -2.1% 1.6% E Terminalling & Storage $47.4 $35.9 $37.3 $37.7 $38.1 $38.7 $39.9 2.1% Growth % 8.9% -24.2% 3.8% 1.2% 1.1% 1.5% 3.1% Margin % 20.6% 37.6% 38.6% 38.3% 37.8% 37.3% 37.5% F Specialty Products 18.7 9.9 22.1 23.0 22.8 22.5 22.7 18.0% Growth % NMF NMF NMF 4.0% -0.7% -1.5% 0.7% Margin % 4.6% 2.8% 7.2% 7.0% 7.2% 7.6% 7.4% Transportation Services 54.9 46.8 44.4 40.9 39.6 37.9 38.1 -4.0% G Growth % 128.0% -14.7% -5.1% -7.9% -3.1% -4.3% 0.5% Margin % 22.9% 19.4% 18.6% 17.5% 16.8% 16.0% 16.0% Sulfur Services 30.7 28.1 27.5 35.0 36.1 36.5 36.8 5.6% H Growth % -10.3% -8.6% -2.0% 27.3% 3.1% 1.0% 1.0% Margin % 15.4% 18.8% 21.6% 26.7% 27.2% 27.2% 27.2% Unallocated SG&A [2] (16.9) (16.0) (16.0) (16.7) (16.9) (16.9) (17.0) LCM Adjustment & Other Non Cash Adjustments [3] (12.9) 12.9 - - - - - Total Adjusted EBITDA $121.9 $117.6 $115.3 $119.9 $119.8 $118.7 $120.5 0.5% E F G H Growth across projection period driven Grease and Lubricant business projected to maintain an Revenue and EBITDA decline in 2027 Revenue growth primarily driven by the by incremental growth capital EBITDA margin of 15% and 12% respectively. Propane and 2028 primarily due to the Brian ramp up of ELSA JV in October 2024 expenditures in 2025, 2026, 2027 and related contributions assumed relatively constant at $2.4 Hamilton tow boat being retired in June followed by subsequent throughput 2028 partially offset by assumed – $2.5 mm during the 2024 – 2028 period. NGL related 2027. Day rates for dirty and clean growth assumed in 2025. Additionally, volume decline related to Spindletop. contributions decrease from $1.0 mm in 2025 to $0.2 barges held constant at $10,500 and 2024-2025 EBITDA growth driven by Growth capex assumed to be invested mm in 2028 due to a projected decrease in volumes from $9,500 per day respectively across the assumed normalization of the EBITDA at 5.0x EBITDA multiple. 90.4 mm gallons in 2025 to 65.3 mm gallons in 2028. 2025-2028 period. margin related to the fertilizer business. Note: Historical and projected revenue, costs and expenses exclude intercompany eliminations. 1. CY 2022A and CY 2023A Adj. EBITDA shown proforma for Company's exit from the Butane optimization business. CY 2022A and CY 2023A revenue not adjusted for the exit from the Butane optimization business. 2. Includes non-cash unit-based compensation. 3. Non-cash adjustments related to the Butane optimization business. A refers to Actual; CAGR refers to Compound Annual Growth Rate; CY refers o Calendar Year; E refers to Estimated; LCM refers to Lower of Cost or Market; NMF refers to not meaningful figure. Source: Company management. CONFIDENTIAL – PRELIMINARY – SUBJECT TO FURTHER REVIEW 13
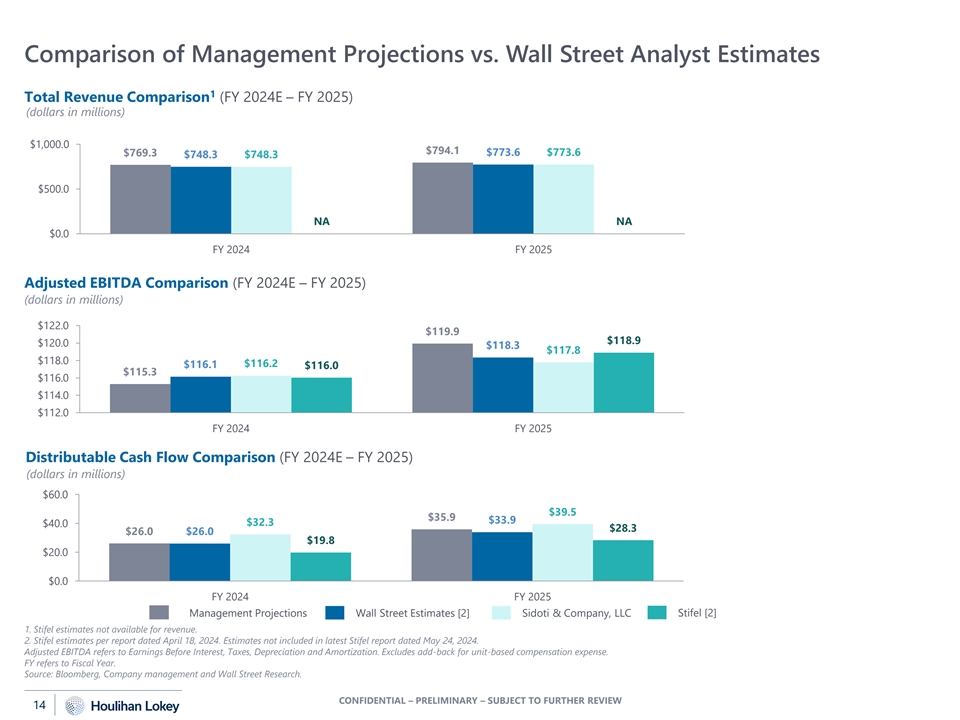
Comparison of Management Projections vs. Wall Street Analyst Estimates 1 Total Revenue Comparison (FY 2024E – FY 2025) (dollars in millions) $1,000.0 $794.1 $769.3 $773.6 $773.6 $748.3 $748.3 $500.0 NA NA $0.0 FY 2024 FY 2025 Adjusted EBITDA Comparison (FY 2024E – FY 2025) (dollars in millions) $122.0 $119.9 $118.9 $120.0 $118.3 $117.8 $118.0 $116.1 $116.2 $116.0 $115.3 $116.0 $114.0 $112.0 FY 2024 FY 2025 Distributable Cash Flow Comparison (FY 2024E – FY 2025) (dollars in millions) $60.0 $39.5 $35.9 $33.9 $40.0 $32.3 $28.3 $26.0 $26.0 $19.8 $20.0 $0.0 FY 2024 FY 2025 Management Projections Wall Street Estimates [2] Sidoti & Company, LLC Stifel [2] 1. Stifel estimates not available for revenue. 2. Stifel estimates per report dated April 18, 2024. Estimates not included in latest Stifel report dated May 24, 2024. Adjusted EBITDA refers to Earnings Before Interest, Taxes, Depreciation and Amortization. Excludes add-back for unit-based compensation expense. FY refers to Fiscal Year. Source: Bloomberg, Company management and Wall Street Research. CONFIDENTIAL – PRELIMINARY – SUBJECT TO FURTHER REVIEW 14
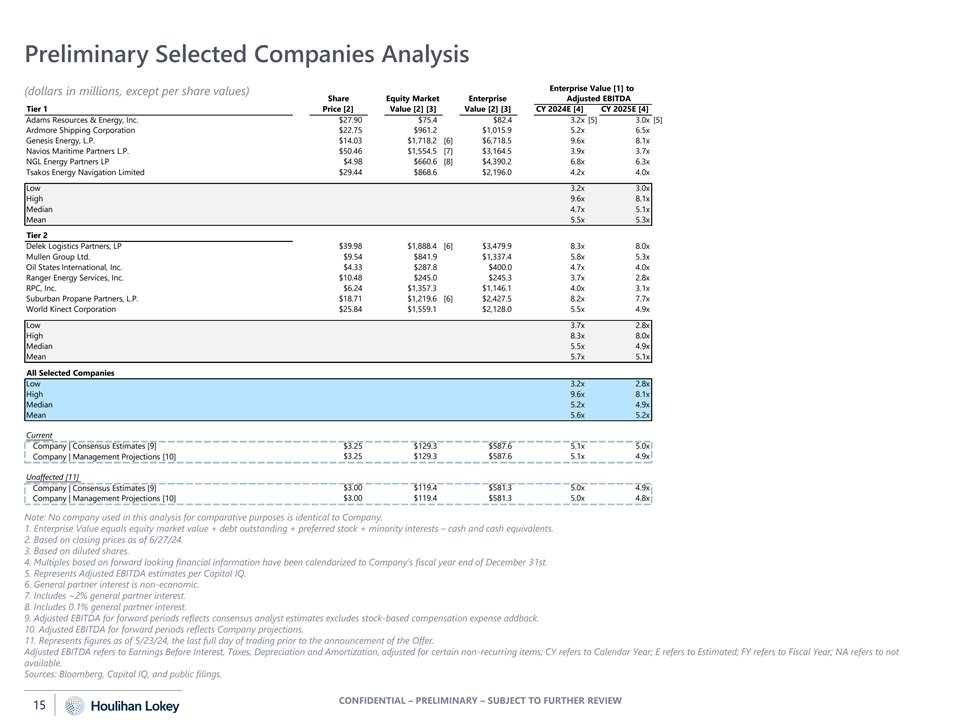
Preliminary Selected Companies Analysis Enterprise Value [1] to (dollars in millions, except per share values) Share Equity Market Enterprise Adjusted EBITDA Tier 1 Price [2] Value [2] [3] Value [2] [3] CY 2024E [4] CY 2025E [4] Adams Resources & Energy, Inc. $27.90 $75.4 $82.4 3.2x [5] 3.0x [5] Ardmore Shipping Corporation $22.75 $961.2 $1,015.9 5.2x 6.5x Genesis Energy, L.P. $14.03 $1,718.2 [6] $6,718.5 9.6x 8.1x Navios Maritime Partners L.P. $50.46 $1,554.5 [7] $3,164.5 3.9x 3.7x NGL Energy Partners LP $4.98 $660.6 [8] $4,390.2 6.8x 6.3x Tsakos Energy Navigation Limited $29.44 $868.6 $2,196.0 4.2x 4.0x Low 3.2x 3.0x High 9.6x 8.1x Median 4.7x 5.1x Mean 5.5x 5.3x Tier 2 Delek Logistics Partners, LP $39.98 $1,888.4 [6] $3,479.9 8.3x 8.0x Mullen Group Ltd. $9.54 $841.9 $1,337.4 5.8x 5.3x Oil States International, Inc. $4.33 $287.8 $400.0 4.7x 4.0x Ranger Energy Services, Inc. $10.48 $245.0 $245.3 3.7x 2.8x RPC, Inc. $6.24 $1,357.3 $1,146.1 4.0x 3.1x Suburban Propane Partners, L.P. $18.71 $1,219.6 [6] $2,427.5 8.2x 7.7x World Kinect Corporation $25.84 $1,559.1 $2,128.0 5.5x 4.9x Low 3.7x 2.8x High 8.3x 8.0x Median 5.5x 4.9x Mean 5.7x 5.1x All Selected Companies Low 3.2x 2.8x High 9.6x 8.1x Median 5.2x 4.9x Mean 5.6x 5.2x Current Company | Consensus Estimates [9] $3.25 $129.3 $587.6 5.1x 5.0x $3.25 $129.3 $587.6 5.1x 4.9x Company | Management Projections [10] Unaffected [11] Company | Consensus Estimates [9] $3.00 $119.4 $581.3 5.0x 4.9x Company | Management Projections [10] $3.00 $119.4 $581.3 5.0x 4.8x Note: No company used in this analysis for comparative purposes is identical to Company. 1. Enterprise Value equals equity market value + debt outstanding + preferred stock + minority interests – cash and cash equivalents. 2. Based on closing prices as of 6/27/24. 3. Based on diluted shares. 4. Multiples based on forward looking financial information have been calendarized to Company’s fiscal year end of December 31st. 5. Represents Adjusted EBITDA estimates per Capital IQ. 6. General partner interest is non-economic. 7. Includes ~2% general partner interest. 8. Includes 0.1% general partner interest. 9. Adjusted EBITDA for forward periods reflects consensus analyst estimates excludes stock-based compensation expense addback. 10. Adjusted EBITDA for forward periods reflects Company projections. 11. Represents figures as of 5/23/24, the last full day of trading prior to the announcement of the Offer. Adjusted EBITDA refers to Earnings Before Interest, Taxes, Depreciation and Amortization, adjusted for certain non-recurring items; CY refers to Calendar Year; E refers to Estimated; FY refers to Fiscal Year; NA refers to not available. Sources: Bloomberg, Capital IQ, and public filings. CONFIDENTIAL – PRELIMINARY – SUBJECT TO FURTHER REVIEW 15
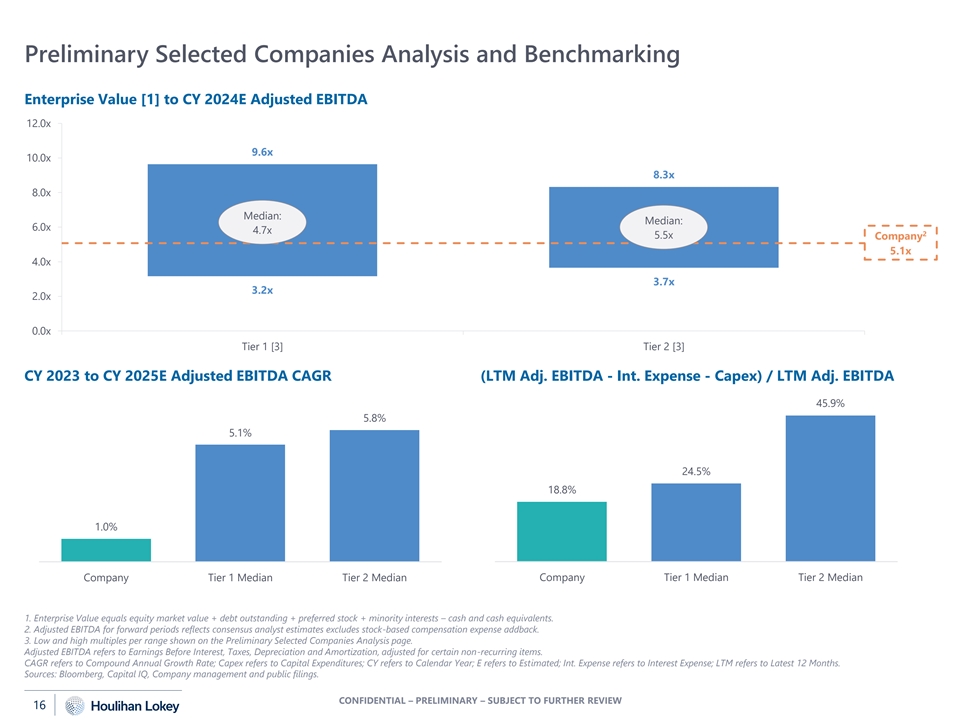
Preliminary Selected Companies Analysis and Benchmarking Enterprise Value [1] to CY 2024E Adjusted EBITDA 12.0x 9.6x 10.0x 8.3x 8.0x Median: Median: 6.0x 4.7x 2 5.5x Company 5.1x 4.0x 3.7x 3.2x 2.0x 0.0x Tier 1 [3] Tier 2 [3] CY 2023 to CY 2025E Adjusted EBITDA CAGR (LTM Adj. EBITDA - Int. Expense - Capex) / LTM Adj. EBITDA 45.9% 5.8% 5.1% 24.5% 18.8% 1.0% Company Tier 1 Median Tier 2 Median Company Tier 1 Median Tier 2 Median 1. Enterprise Value equals equity market value + debt outstanding + preferred stock + minority interests – cash and cash equivalents. 2. Adjusted EBITDA for forward periods reflects consensus analyst estimates excludes stock-based compensation expense addback. 3. Low and high multiples per range shown on the Preliminary Selected Companies Analysis page. Adjusted EBITDA refers to Earnings Before Interest, Taxes, Depreciation and Amortization, adjusted for certain non-recurring items. CAGR refers to Compound Annual Growth Rate; Capex refers to Capital Expenditures; CY refers to Calendar Year; E refers to Estimated; Int. Expense refers to Interest Expense; LTM refers to Latest 12 Months. Sources: Bloomberg, Capital IQ, Company management and public filings. CONFIDENTIAL – PRELIMINARY – SUBJECT TO FURTHER REVIEW 16
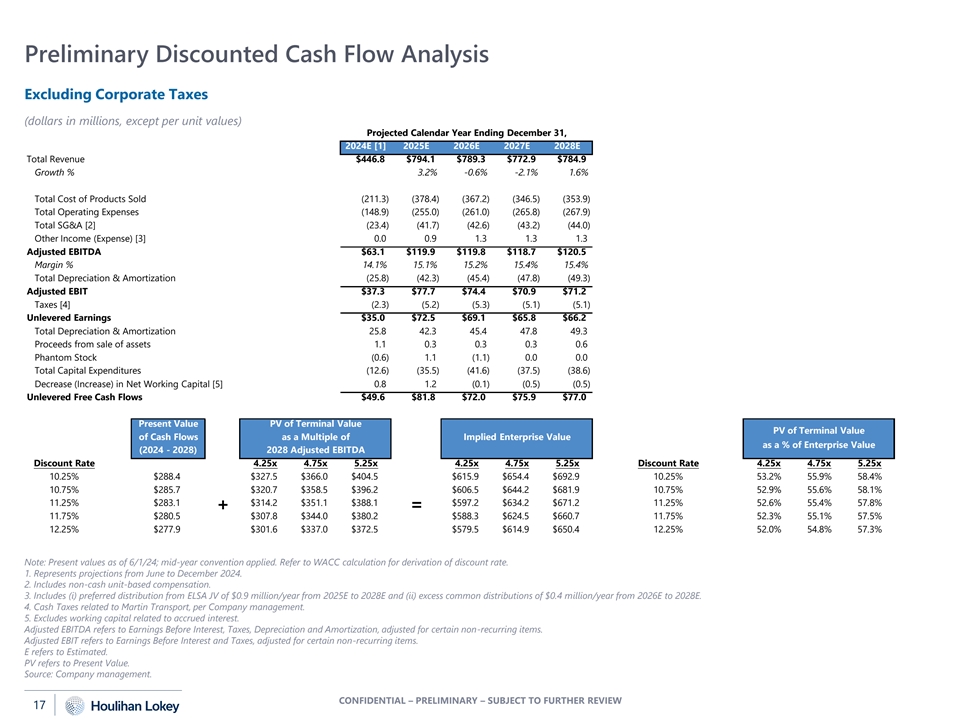
Preliminary Discounted Cash Flow Analysis Excluding Corporate Taxes (dollars in millions, except per unit values) Projected Calendar Year Ending December 31, 2024E [1] 2025E 2026E 2027E 2028E Total Revenue $446.8 $794.1 $789.3 $772.9 $784.9 Growth % 3.2% -0.6% -2.1% 1.6% Total Cost of Products Sold (211.3) (378.4) (367.2) (346.5) (353.9) Total Operating Expenses (148.9) (255.0) (261.0) (265.8) (267.9) Total SG&A [2] (23.4) (41.7) (42.6) (43.2) (44.0) Other Income (Expense) [3] 0.0 0.9 1.3 1.3 1.3 Adjusted EBITDA $63.1 $119.9 $119.8 $118.7 $120.5 Margin % 14.1% 15.1% 15.2% 15.4% 15.4% Total Depreciation & Amortization (25.8) (42.3) (45.4) (47.8) (49.3) Adjusted EBIT $37.3 $77.7 $74.4 $70.9 $71.2 Taxes [4] (2.3) (5.2) (5.3) (5.1) (5.1) Unlevered Earnings $35.0 $72.5 $69.1 $65.8 $66.2 Total Depreciation & Amortization 25.8 42.3 45.4 47.8 49.3 Proceeds from sale of assets 1.1 0.3 0.3 0.3 0.6 Phantom Stock (0.6) 1.1 (1.1) 0.0 0.0 Total Capital Expenditures (12.6) (35.5) (41.6) (37.5) (38.6) Decrease (Increase) in Net Working Capital [5] 0.8 1.2 (0.1) (0.5) (0.5) Unlevered Free Cash Flows $49.6 $81.8 $72.0 $75.9 $77.0 Present Value PV of Terminal Value PV of Terminal Value of Cash Flows as a Multiple of Implied Enterprise Value as a % of Enterprise Value (2024 - 2028) 2028 Adjusted EBITDA Discount Rate 4.25x 4.75x 5.25x 4.25x 4.75x 5.25x Discount Rate 4.25x 4.75x 5.25x 10.25% $288.4 $327.5 $366.0 $404.5 $615.9 $654.4 $692.9 10.25% 53.2% 55.9% 58.4% 10.75% $285.7 $320.7 $358.5 $396.2 $606.5 $644.2 $681.9 10.75% 52.9% 55.6% 58.1% 11.25% $283.1 $314.2 $351.1 $388.1 $597.2 $634.2 $671.2 11.25% 52.6% 55.4% 57.8% + = 11.75% $280.5 $307.8 $344.0 $380.2 $588.3 $624.5 $660.7 11.75% 52.3% 55.1% 57.5% 12.25% $277.9 $301.6 $337.0 $372.5 $579.5 $614.9 $650.4 12.25% 52.0% 54.8% 57.3% Note: Present values as of 6/1/24; mid-year convention applied. Refer to WACC calculation for derivation of discount rate. 1. Represents projections from June to December 2024. 2. Includes non-cash unit-based compensation. 3. Includes (i) preferred distribution from ELSA JV of $0.9 million/year from 2025E to 2028E and (ii) excess common distributions of $0.4 million/year from 2026E to 2028E. 4. Cash Taxes related to Martin Transport, per Company management. 5. Excludes working capital related to accrued interest. Adjusted EBITDA refers to Earnings Before Interest, Taxes, Depreciation and Amortization, adjusted for certain non-recurring items. Adjusted EBIT refers to Earnings Before Interest and Taxes, adjusted for certain non-recurring items. E refers to Estimated. PV refers to Present Value. Source: Company management. CONFIDENTIAL – PRELIMINARY – SUBJECT TO FURTHER REVIEW 17

Preliminary Discounted Cash Flow Analysis (cont.) Including Corporate Taxes (dollars in millions, except per unit values) Projected Calendar Year Ending December 31, 2024E [1] 2025E 2026E 2027E 2028E Total Revenue $446.8 $794.1 $789.3 $772.9 $784.9 Growth % 3.2% -0.6% -2.1% 1.6% Total Cost of Products Sold (211.3) (378.4) (367.2) (346.5) (353.9) Total Operating Expenses (148.9) (255.0) (261.0) (265.8) (267.9) Total SG&A [2] (23.4) (41.7) (42.6) (43.2) (44.0) Other Income (Expense) [3] 0.0 0.9 1.3 1.3 1.3 Adjusted EBITDA $63.1 $119.9 $119.8 $118.7 $120.5 Margin % 14.1% 15.1% 15.2% 15.4% 15.4% Total Depreciation & Amortization (25.8) (42.3) (45.4) (47.8) (49.3) Adjusted EBIT $37.3 $77.7 $74.4 $70.9 $71.2 Taxes [4] (9.0) (18.8) (18.3) (17.6) (17.5) Unlevered Earnings $28.3 $58.9 $56.1 $53.3 $53.7 Total Depreciation & Amortization 25.8 42.3 45.4 47.8 49.3 Proceeds from sale of assets 1.1 0.3 0.3 0.3 0.6 Phantom Stock (0.6) 1.1 (1.1) 0.0 0.0 Total Capital Expenditures (12.6) (35.5) (41.6) (37.5) (38.6) Decrease (Increase) in Net Working Capital [5] 0.8 1.2 (0.1) (0.5) (0.5) Unlevered Free Cash Flows $43.0 $68.2 $59.0 $63.4 $64.5 Present Value PV of Terminal Value PV of Terminal Value of Cash Flows as a Multiple of Implied Enterprise Value as a % of Enterprise Value (2024 - 2028) 2028 Adjusted EBITDA Discount Rate 4.25x 4.75x 5.25x 4.25x 4.75x 5.25x Discount Rate 4.25x 4.75x 5.25x 9.50% $245.0 $337.9 $377.6 $417.4 $582.9 $622.6 $662.4 9.50% 58.0% 60.6% 63.0% 10.00% $242.7 $330.9 $369.8 $408.7 $573.6 $612.5 $651.5 10.00% 57.7% 60.4% 62.7% 10.50% $240.4 $324.1 $362.2 $400.3 $564.5 $602.7 $640.8 10.50% 57.4% 60.1% 62.5% + = 11.00% $238.2 $317.4 $354.8 $392.1 $555.7 $593.0 $630.3 11.00% 57.1% 59.8% 62.2% 11.50% $236.0 $311.0 $347.6 $384.1 $547.0 $583.6 $620.2 11.50% 56.9% 59.6% 61.9% Note: Present values as of 6/1/24; mid-year convention applied. Refer to WACC calculation for derivation of discount rate. 1. Represents projections from June to December 2024. 2. Includes non-cash unit-based compensation. 3. Includes (i) preferred distribution from ELSA JV of $0.9 million/year from 2025E to 2028E and (ii) excess common distributions of $0.4 million/year from 2026E to 2028E. 4. Cash Taxes related to Martin Transport, per Company management, plus 21% Corporate Tax on pretax income not attributed to Martin Transport. Terminal period taxes based on 2028E effective rate. 5. Excludes working capital related to accrued interest. Adjusted EBITDA refers to Earnings Before Interest, Taxes, Depreciation and Amortization, adjusted for certain non-recurring items. Adjusted EBIT refers to Earnings Before Interest and Taxes, adjusted for certain non-recurring items. E refers to Estimated. PV refers to Present Value. Source: Company management. CONFIDENTIAL – PRELIMINARY – SUBJECT TO FURTHER REVIEW 18
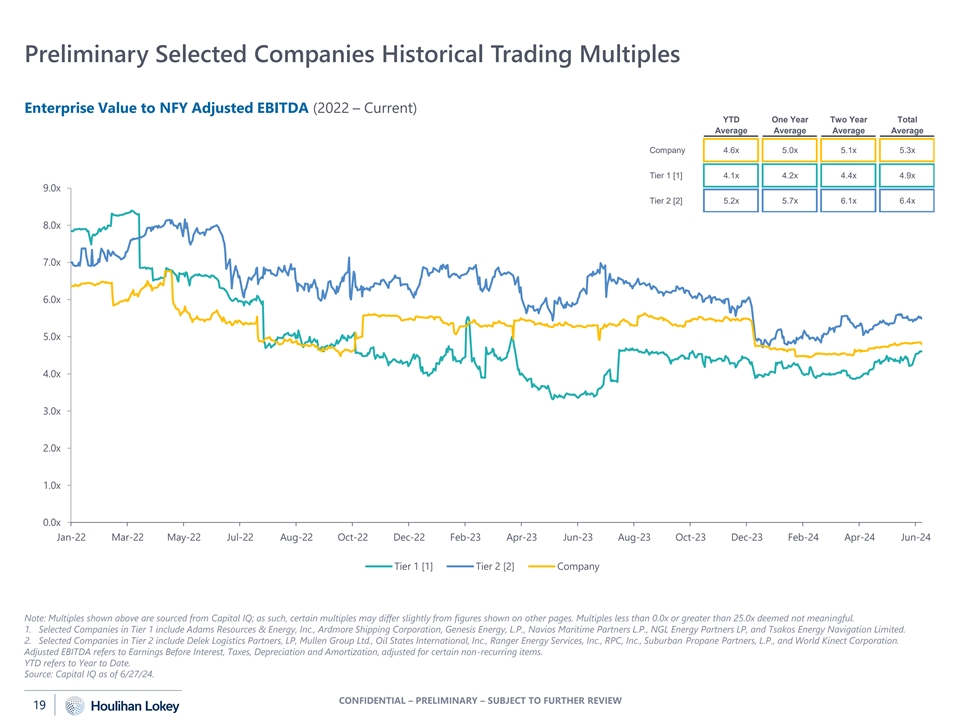
Preliminary Selected Companies Historical Trading Multiples Enterprise Value to NFY Adjusted EBITDA (2022 – Current) YTD One Year Two Year Total Average Average Average Average Company 4.6x 5.0x 5.1x 5.3x Tier 1 [1] 4.1x 4.2x 4.4x 4.9x 9.0x Tier 2 [2] 5.2x 5.7x 6.1x 6.4x 8.0x 7.0x 6.0x 5.0x 4.0x 3.0x 2.0x 1.0x 0.0x Jan-22 Mar-22 May-22 Jul-22 Aug-22 Oct-22 Dec-22 Feb-23 Apr-23 Jun-23 Aug-23 Oct-23 Dec-23 Feb-24 Apr-24 Jun-24 Tier 1 [1] Tier 2 [2] Company Note: Multiples shown above are sourced from Capital IQ; as such, certain multiples may differ slightly from figures shown on other pages. Multiples less than 0.0x or greater than 25.0x deemed not meaningful. 1. Selected Companies in Tier 1 include Adams Resources & Energy, Inc., Ardmore Shipping Corporation, Genesis Energy, L.P., Navios Maritime Partners L.P., NGL Energy Partners LP, and Tsakos Energy Navigation Limited. 2. Selected Companies in Tier 2 include Delek Logistics Partners, LP, Mullen Group Ltd., Oil States International, Inc., Ranger Energy Services, Inc., RPC, Inc., Suburban Propane Partners, L.P., and World Kinect Corporation. Adjusted EBITDA refers to Earnings Before Interest, Taxes, Depreciation and Amortization, adjusted for certain non-recurring items. YTD refers to Year to Date. Source: Capital IQ as of 6/27/24. CONFIDENTIAL – PRELIMINARY – SUBJECT TO FURTHER REVIEW 19
PRELIMINARY PREMIUMS PAID DATA 04 03 CONFIDENTIAL – PRELIMINARY – SUBJECT TO FURTHER REVIEW
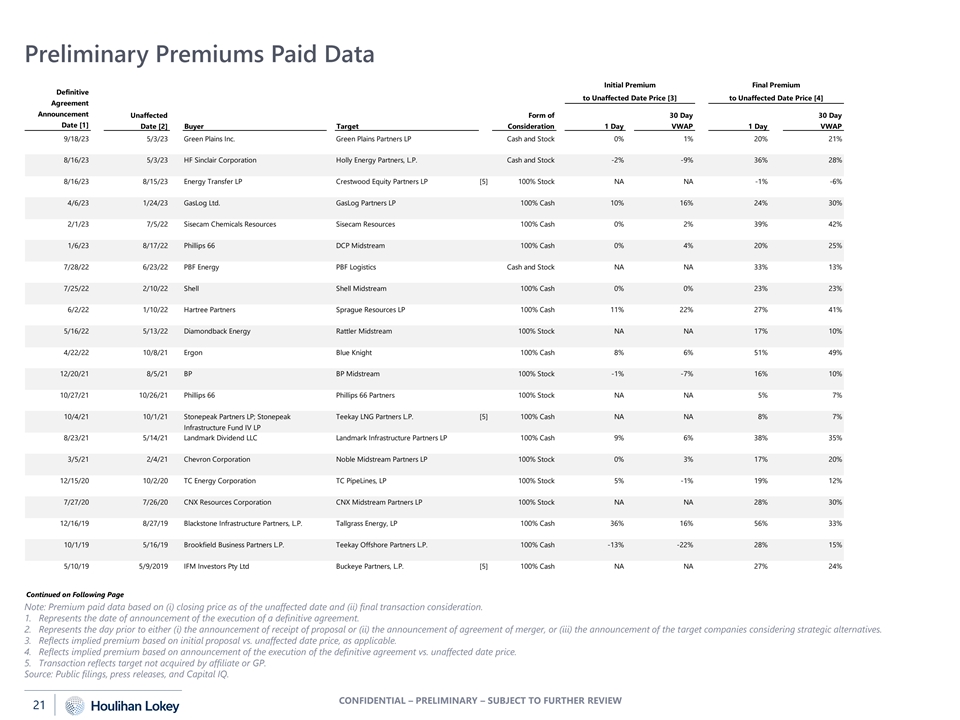
Preliminary Premiums Paid Data Initial Premium Final Premium Definitive to Unaffected Date Price [3] to Unaffected Date Price [4] Agreement Announcement Unaffected Form of 30 Day 30 Day Date [1] Date [2] Buyer Target Consideration 1 Day VWAP 1 Day VWAP 9/18/23 5/3/23 Green Plains Inc. Green Plains Partners LP Cash and Stock 0% 1% 20% 21% 8/16/23 5/3/23 HF Sinclair Corporation Holly Energy Partners, L.P. Cash and Stock -2% -9% 36% 28% 8/16/23 8/15/23 Energy Transfer LP Crestwood Equity Partners LP [5] 100% Stock NA NA -1% -6% 4/6/23 1/24/23 GasLog Ltd. GasLog Partners LP 100% Cash 10% 16% 24% 30% 2/1/23 7/5/22 Sisecam Chemicals Resources Sisecam Resources 100% Cash 0% 2% 39% 42% 1/6/23 8/17/22 Phillips 66 DCP Midstream 100% Cash 0% 4% 20% 25% 7/28/22 6/23/22 PBF Energy PBF Logistics Cash and Stock NA NA 33% 13% 7/25/22 2/10/22 Shell Shell Midstream 100% Cash 0% 0% 23% 23% 6/2/22 1/10/22 Hartree Partners Sprague Resources LP 100% Cash 11% 22% 27% 41% 5/16/22 5/13/22 Diamondback Energy Rattler Midstream 100% Stock NA NA 17% 10% 4/22/22 10/8/21 Ergon Blue Knight 100% Cash 8% 6% 51% 49% 12/20/21 8/5/21 BP BP Midstream 100% Stock -1% -7% 16% 10% 10/27/21 10/26/21 Phillips 66 Phillips 66 Partners 100% Stock NA NA 5% 7% 10/4/21 10/1/21 Stonepeak Partners LP; Stonepeak Teekay LNG Partners L.P. [5] 100% Cash NA NA 8% 7% Infrastructure Fund IV LP 8/23/21 5/14/21 Landmark Dividend LLC Landmark Infrastructure Partners LP 100% Cash 9% 6% 38% 35% 3/5/21 2/4/21 Chevron Corporation Noble Midstream Partners LP 100% Stock 0% 3% 17% 20% 12/15/20 10/2/20 TC Energy Corporation TC PipeLines, LP 100% Stock 5% -1% 19% 12% 7/27/20 7/26/20 CNX Resources Corporation CNX Midstream Partners LP 100% Stock NA NA 28% 30% 12/16/19 8/27/19 Blackstone Infrastructure Partners, L.P. Tallgrass Energy, LP 100% Cash 36% 16% 56% 33% 10/1/19 5/16/19 Brookfield Business Partners L.P. Teekay Offshore Partners L.P. 100% Cash -13% -22% 28% 15% 5/10/19 5/9/2019 IFM Investors Pty Ltd Buckeye Partners, L.P. [5] 100% Cash NA NA 27% 24% Continued on Following Page Note: Premium paid data based on (i) closing price as of the unaffected date and (ii) final transaction consideration. 1. Represents the date of announcement of the execution of a definitive agreement. 2. Represents the day prior to either (i) the announcement of receipt of proposal or (ii) the announcement of agreement of merger, or (iii) the announcement of the target companies considering strategic alternatives. 3. Reflects implied premium based on initial proposal vs. unaffected date price, as applicable. 4. Reflects implied premium based on announcement of the execution of the definitive agreement vs. unaffected date price. 5. Transaction reflects target not acquired by affiliate or GP. Source: Public filings, press releases, and Capital IQ. CONFIDENTIAL – PRELIMINARY – SUBJECT TO FURTHER REVIEW 21
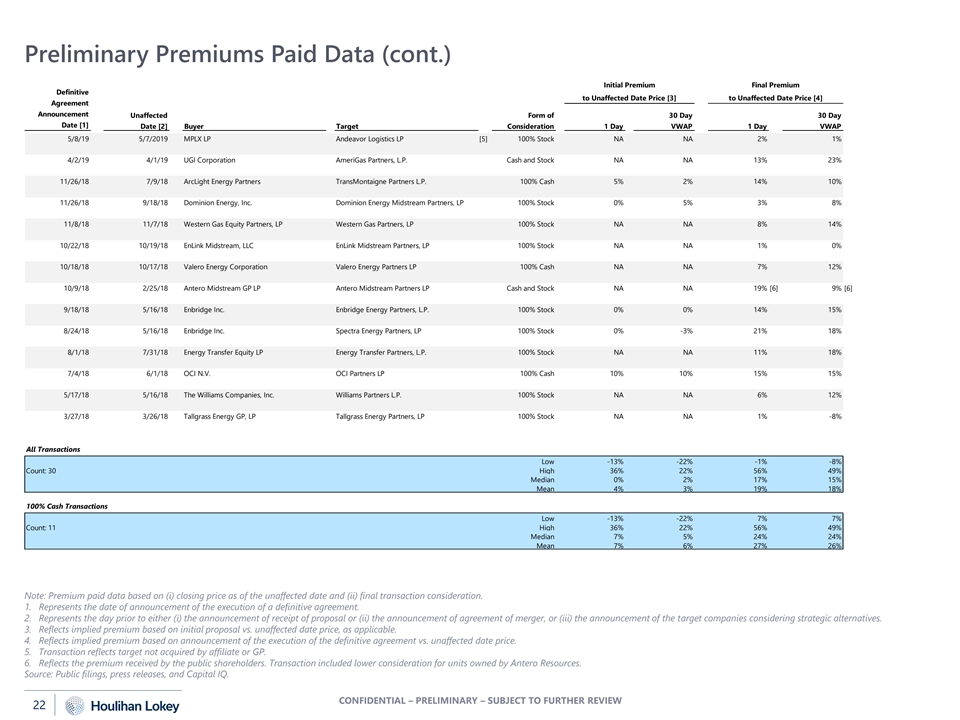
Preliminary Premiums Paid Data (cont.) Initial Premium Final Premium Definitive to Unaffected Date Price [3] to Unaffected Date Price [4] Agreement Announcement Unaffected Form of 30 Day 30 Day Date [1] Date [2] Buyer Target Consideration 1 Day VWAP 1 Day VWAP 5/8/19 5/7/2019 MPLX LP Andeavor Logistics LP [5] 100% Stock NA NA 2% 1% 4/2/19 4/1/19 UGI Corporation AmeriGas Partners, L.P. Cash and Stock NA NA 13% 23% 11/26/18 7/9/18 ArcLight Energy Partners TransMontaigne Partners L.P. 100% Cash 5% 2% 14% 10% 11/26/18 9/18/18 Dominion Energy, Inc. Dominion Energy Midstream Partners, LP 100% Stock 0% 5% 3% 8% 11/8/18 11/7/18 Western Gas Equity Partners, LP Western Gas Partners, LP 100% Stock NA NA 8% 14% 10/22/18 10/19/18 EnLink Midstream, LLC EnLink Midstream Partners, LP 100% Stock NA NA 1% 0% 10/18/18 10/17/18 Valero Energy Corporation Valero Energy Partners LP 100% Cash NA NA 7% 12% 10/9/18 2/25/18 Antero Midstream GP LP Antero Midstream Partners LP Cash and Stock NA NA 19% [6] 9% [6] 9/18/18 5/16/18 Enbridge Inc. Enbridge Energy Partners, L.P. 100% Stock 0% 0% 14% 15% 8/24/18 5/16/18 Enbridge Inc. Spectra Energy Partners, LP 100% Stock 0% -3% 21% 18% 8/1/18 7/31/18 Energy Transfer Equity LP Energy Transfer Partners, L.P. 100% Stock NA NA 11% 18% 7/4/18 6/1/18 OCI N.V. OCI Partners LP 100% Cash 10% 10% 15% 15% 5/17/18 5/16/18 The Williams Companies, Inc. Williams Partners L.P. 100% Stock NA NA 6% 12% 3/27/18 3/26/18 Tallgrass Energy GP, LP Tallgrass Energy Partners, LP 100% Stock NA NA 1% -8% All Transactions Low -13% -22% -1% -8% Count: 30 High 36% 22% 56% 49% Median 0% 2% 17% 15% Mean 4% 3% 19% 18% 100% Cash Transactions Low -13% -22% 7% 7% Count: 11 High 36% 22% 56% 49% Median 7% 5% 24% 24% Mean 7% 6% 27% 26% Note: Premium paid data based on (i) closing price as of the unaffected date and (ii) final transaction consideration. 1. Represents the date of announcement of the execution of a definitive agreement. 2. Represents the day prior to either (i) the announcement of receipt of proposal or (ii) the announcement of agreement of merger, or (iii) the announcement of the target companies considering strategic alternatives. 3. Reflects implied premium based on initial proposal vs. unaffected date price, as applicable. 4. Reflects implied premium based on announcement of the execution of the definitive agreement vs. unaffected date price. 5. Transaction reflects target not acquired by affiliate or GP. 6. Reflects the premium received by the public shareholders. Transaction included lower consideration for units owned by Antero Resources. Source: Public filings, press releases, and Capital IQ. CONFIDENTIAL – PRELIMINARY – SUBJECT TO FURTHER REVIEW 22
APPENDIX 06 04 CONFIDENTIAL – PRELIMINARY – SUBJECT TO FURTHER REVIEW

APPENDIX Additional Response Considerations 07 04 CONFIDENTIAL – PRELIMINARY – SUBJECT TO FURTHER REVIEW

Unit Trading Activity Prior to the Offer Closing Unit Price (dollars in actuals) Closing Unit Price 1-Month VWAP: $2.89 3-Month VWAP: $2.69 6-Month VWAP: $2.55 1-Year VWAP: $2.57 3-Year VWAP: $3.17 5-Year VWAP: $2.81 $7.00 $6.00 5/24/24: Offer Announced $5.00 $4.00 $3.00 $2.00 $1.00 $0.00 May-19 May-20 May-21 May-22 May-23 May-24 Note: VWAPs shown are as of 5/23/24. VWAP refers to Volume Weighted Average Price. Source: Bloomberg as of 6/27/24. CONFIDENTIAL – PRELIMINARY – SUBJECT TO FURTHER REVIEW 25
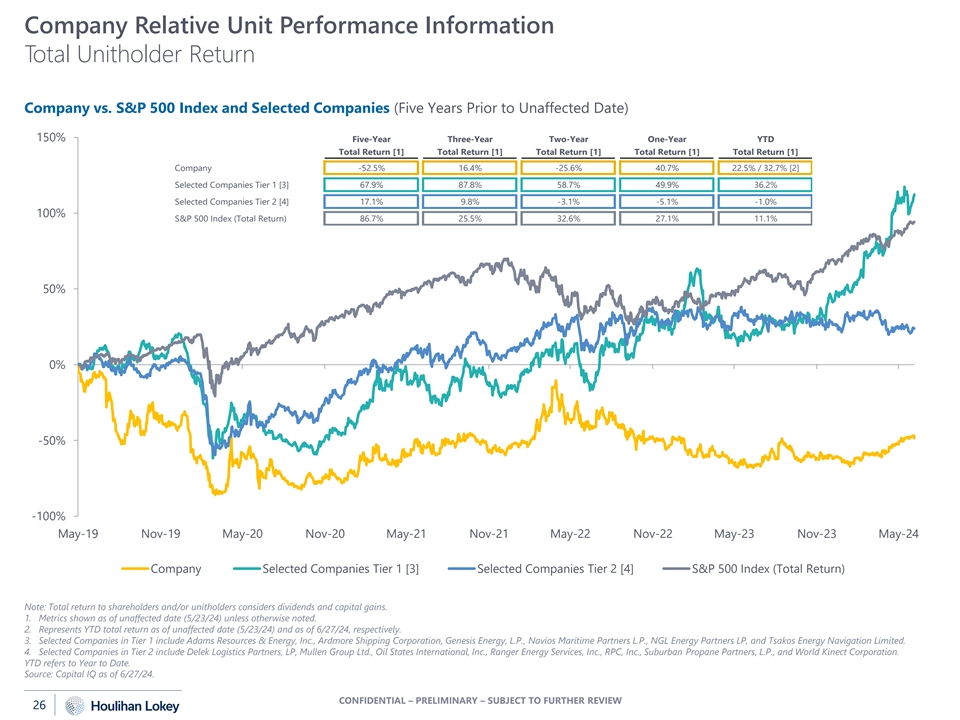
Company Relative Unit Performance Information Total Unitholder Return Company vs. S&P 500 Index and Selected Companies (Five Years Prior to Unaffected Date) 150% Five-Year Three-Year Two-Year One-Year YTD Total Return [1] Total Return [1] Total Return [1] Total Return [1] Total Return [1] Company -52.5% 16.4% -25.6% 40.7% 22.5% / 32.7% [2] Selected Companies Tier 1 [3] 67.9% 87.8% 58.7% 49.9% 36.2% Selected Companies Tier 2 [4] 17.1% 9.8% -3.1% -5.1% -1.0% 100% S&P 500 Index (Total Return) 86.7% 25.5% 32.6% 27.1% 11.1% 50% 0% -50% -100% May-19 Nov-19 May-20 Nov-20 May-21 Nov-21 May-22 Nov-22 May-23 Nov-23 May-24 Company Selected Companies Tier 1 [3] Selected Companies Tier 2 [4] S&P 500 Index (Total Return) Note: Total return to shareholders and/or unitholders considers dividends and capital gains. 1. Metrics shown as of unaffected date (5/23/24) unless otherwise noted. 2. Represents YTD total return as of unaffected date (5/23/24) and as of 6/27/24, respectively. 3. Selected Companies in Tier 1 include Adams Resources & Energy, Inc., Ardmore Shipping Corporation, Genesis Energy, L.P., Navios Maritime Partners L.P., NGL Energy Partners LP, and Tsakos Energy Navigation Limited. 4. Selected Companies in Tier 2 include Delek Logistics Partners, LP, Mullen Group Ltd., Oil States International, Inc., Ranger Energy Services, Inc., RPC, Inc., Suburban Propane Partners, L.P., and World Kinect Corporation. YTD refers to Year to Date. Source: Capital IQ as of 6/27/24. CONFIDENTIAL – PRELIMINARY – SUBJECT TO FURTHER REVIEW 26

Recent Unit Price Performance Daily Volume (millions) Closing Unit Price ($) $4.00 1.6 Current Unit Price [1]: $3.25 $3.50 1.4 $3.00 1.2 $2.50 1.0 Q4 $2.00 Q1 0.8 Q2 Q1 FY 22 FY 23 Q3 FY 23 FY 24 Q4 FY 23 $1.50 0.6 FY 23 2 ▲ 0.9% 2 2 ▼ 2.0% 2 ▲ 0.0% ▲ 3.4% 2 $1.00 0.4 ▲ 0.4% 2 ▼ 0.5% $0.50 0.2 $0.00 0.0 1/1/23 3/1/23 5/1/23 7/1/23 9/1/23 11/1/23 1/1/24 3/1/24 5/1/24 Daily Trading Volume Company Current Unit Price [1] 90-Day Average Daily Trading Volume (in millions) [3] 0.1 % of Total Units Outstanding 0.3% 90-Day Average Daily Trading Value (in millions) [3] $0.3 % of Market Value of Equity 0.3% Number of Analysts Covering the Company [4] 2 Total Public Float [5] [6] 28.2 Comparison of Reported Financials and Wall Street Estimates % of Total Units Outstanding 70.9% (dollars in millions) Fiscal Year Ended December 31, 2022 2023 2024 Q4 Q1 Q2 Q3 Q4 Q1 Total Adjusted Total Adjusted Total Adjusted Total Adjusted Total Adjusted Total Adjusted Revenue EBITDA Revenue EBITDA Revenue EBITDA Revenue EBITDA Revenue EBITDA Revenue EBITDA Consensus Wall Street Estimate [7] NA $23.2 NA $32.5 NA $33.0 NA $26.2 $178.0 $25.6 $199.0 $31.3 Reported Financials $243.4 $17.8 $244.5 $30.6 [8] $195.6 $31.8 [8] $176.7 $26.2 $181.1 $29.2 $180.8 $30.4 % Difference NA -23.4% NA -6.0% NA -3.6% NA -0.1% 1.7% 14.1% -9.1% -2.7% 1. As of 6/27/24 close. 2. Refers to percentage change between closing unit price directly prior to reported earnings and closing unit price on subsequent trading day, per Capital IQ. 3. Per Capital IQ. 4. Per Bloomberg. 5. Per public filings. 6. Represents common units outstanding. Does not reflect unit acquisitions or disposals not publicly disclosed as of 6/27/24. 7. Refers to consensus Bloomberg and Wall Street analyst estimates for relevant financial metric directly prior to reported earnings. 8. The reported Adjusted EBITDA figures for Q1 2023 and Q2 2023 are shown pro forma for the Company’s exit from the Butane optimization business. Source: Capital IQ, Bloomberg and Company press releases. CONFIDENTIAL – PRELIMINARY – SUBJECT TO FURTHER REVIEW 27
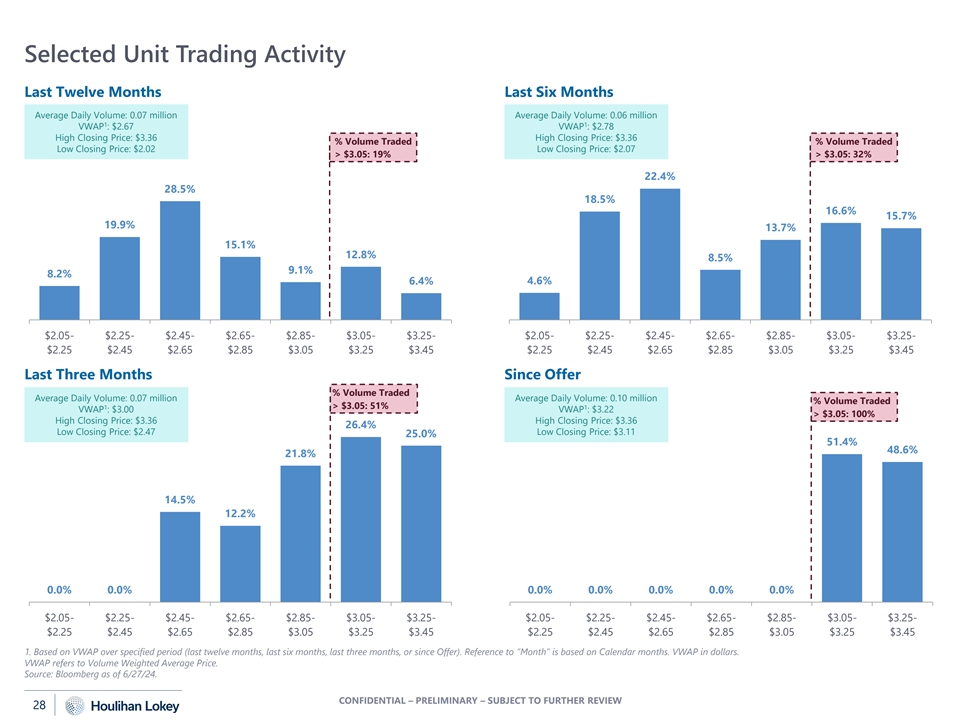
Selected Unit Trading Activity Last Twelve Months Last Six Months Average Daily Volume: 0.07 million Average Daily Volume: 0.06 million 1 1 VWAP : $2.67 VWAP : $2.78 High Closing Price: $3.36 High Closing Price: $3.36 % Volume Traded % Volume Traded Low Closing Price: $2.02 Low Closing Price: $2.07 > $3.05: 19% > $3.05: 32% 22.4% 28.5% 18.5% 16.6% 15.7% 19.9% 13.7% 15.1% 12.8% 8.5% 9.1% 8.2% 4.6% 6.4% $2.05- $2.25- $2.45- $2.65- $2.85- $3.05- $3.25- $2.05- $2.25- $2.45- $2.65- $2.85- $3.05- $3.25- $2.25 $2.45 $2.65 $2.85 $3.05 $3.25 $3.45 $2.25 $2.45 $2.65 $2.85 $3.05 $3.25 $3.45 Last Three Months Since Offer % Volume Traded Average Daily Volume: 0.07 million Average Daily Volume: 0.10 million % Volume Traded 1 > $3.05: 51% 1 VWAP : $3.00 VWAP : $3.22 > $3.05: 100% High Closing Price: $3.36 High Closing Price: $3.36 26.4% Low Closing Price: $2.47 Low Closing Price: $3.11 25.0% 51.4% 48.6% 21.8% 14.5% 12.2% 0.0% 0.0% 0.0% 0.0% 0.0% 0.0% 0.0% $2.05- $2.25- $2.45- $2.65- $2.85- $3.05- $3.25- $2.05- $2.25- $2.45- $2.65- $2.85- $3.05- $3.25- $2.25 $2.45 $2.65 $2.85 $3.05 $3.25 $3.45 $2.25 $2.45 $2.65 $2.85 $3.05 $3.25 $3.45 1. Based on VWAP over specified period (last twelve months, last six months, last three months, or since Offer). Reference to “Month” is based on Calendar months. VWAP in dollars. VWAP refers to Volume Weighted Average Price. Source: Bloomberg as of 6/27/24. CONFIDENTIAL – PRELIMINARY – SUBJECT TO FURTHER REVIEW 28
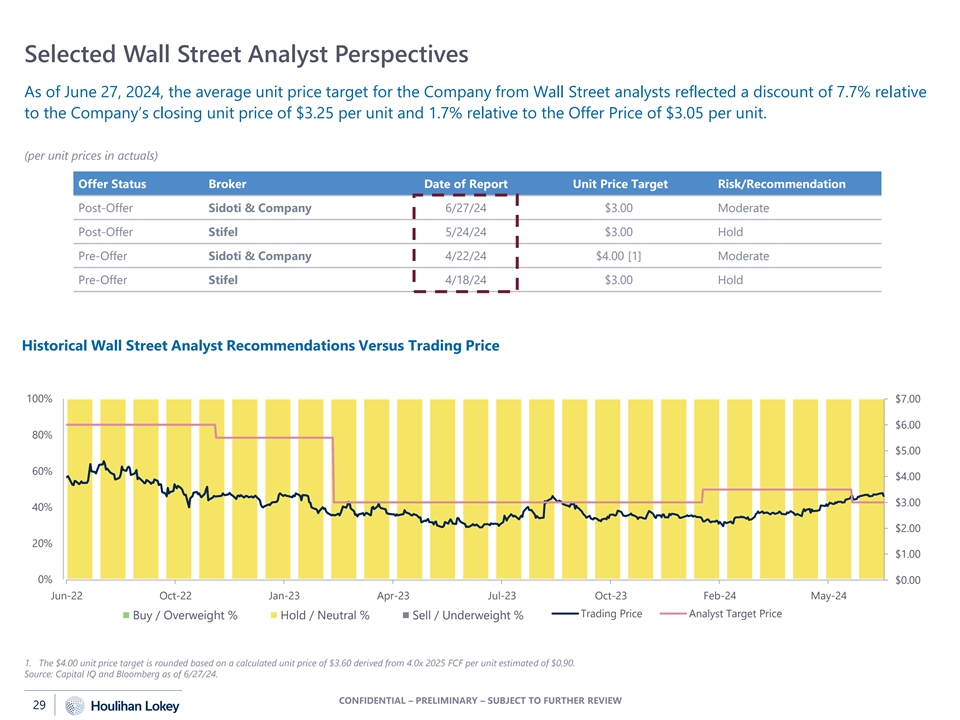
Selected Wall Street Analyst Perspectives As of June 27, 2024, the average unit price target for the Company from Wall Street analysts reflected a discount of 7.7% relative to the Company’s closing unit price of $3.25 per unit and 1.7% relative to the Offer Price of $3.05 per unit. (per unit prices in actuals) Offer Status Broker Date of Report Unit Price Target Risk/Recommendation Post-Offer Sidoti & Company 6/27/24 $3.00 Moderate Post-Offer Stifel 5/24/24 $3.00 Hold Pre-Offer Sidoti & Company 4/22/24 $4.00 [1] Moderate Pre-Offer Stifel 4/18/24 $3.00 Hold Historical Wall Street Analyst Recommendations Versus Trading Price 100% $7.00 $6.00 80% $5.00 60% $4.00 $3.00 40% $2.00 20% $1.00 0% $0.00 Jun-22 Oct-22 Jan-23 Apr-23 Jul-23 Oct-23 Feb-24 May-24 Trading Price Analyst Target Price Buy / Overweight % Hold / Neutral % Sell / Underweight % 1. The $4.00 unit price target is rounded based on a calculated unit price of $3.60 derived from 4.0x 2025 FCF per unit estimated of $0.90. Source: Capital IQ and Bloomberg as of 6/27/24. CONFIDENTIAL – PRELIMINARY – SUBJECT TO FURTHER REVIEW 29
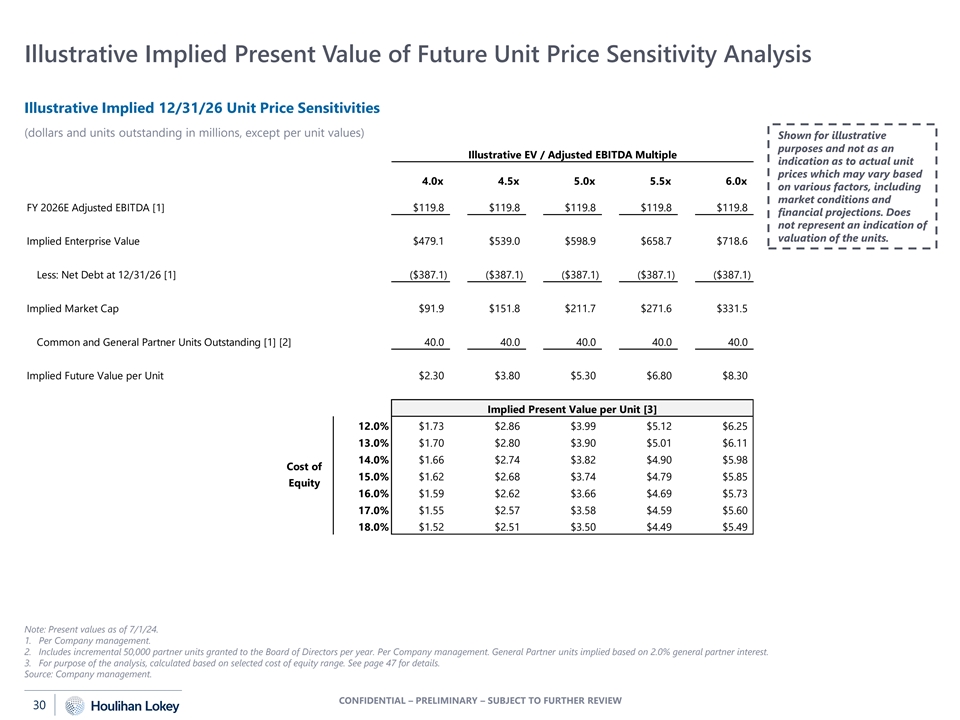
Illustrative Implied Present Value of Future Unit Price Sensitivity Analysis Illustrative Implied 12/31/26 Unit Price Sensitivities (dollars and units outstanding in millions, except per unit values) Shown for illustrative purposes and not as an Illustrative EV / Adjusted EBITDA Multiple indication as to actual unit prices which may vary based 4.0x 4.5x 5.0x 5.5x 6.0x on various factors, including market conditions and FY 2026E Adjusted EBITDA [1] $119.8 $119.8 $119.8 $119.8 $119.8 financial projections. Does not represent an indication of valuation of the units. Implied Enterprise Value $479.1 $539.0 $598.9 $658.7 $718.6 Less: Net Debt at 12/31/26 [1] ($387.1) ($387.1) ($387.1) ($387.1) ($387.1) Implied Market Cap $91.9 $151.8 $211.7 $271.6 $331.5 Common and General Partner Units Outstanding [1] [2] 40.0 40.0 40.0 40.0 40.0 Implied Future Value per Unit $2.30 $3.80 $5.30 $6.80 $8.30 Implied Present Value per Unit [3] 12.0% $1.73 $2.86 $3.99 $5.12 $6.25 13.0% $1.70 $2.80 $3.90 $5.01 $6.11 14.0% $1.66 $2.74 $3.82 $4.90 $5.98 Cost of 15.0% $1.62 $2.68 $3.74 $4.79 $5.85 Equity 16.0% $1.59 $2.62 $3.66 $4.69 $5.73 17.0% $1.55 $2.57 $3.58 $4.59 $5.60 18.0% $1.52 $2.51 $3.50 $4.49 $5.49 Note: Present values as of 7/1/24. 1. Per Company management. 2. Includes incremental 50,000 partner units granted to the Board of Directors per year. Per Company management. General Partner units implied based on 2.0% general partner interest. 3. For purpose of the analysis, calculated based on selected cost of equity range. See page 47 for details. Source: Company management. CONFIDENTIAL – PRELIMINARY – SUBJECT TO FURTHER REVIEW 30

Illustrative Present Value of Future Distributions The below assumes (for illustrative purposes only) that following de-levering to below 3x Net Debt / LTM EBITDA, the Company initiates distributions in FY 2028, ramping up to a level consistent with a 1.6x distribution coverage ratio in 2031, based on discussions with Company management. Implied present values are based on a terminal distribution coverage ratio range of ~1.3x to ~2.0x and selected cost of equity range of 12-18%. 2024E [1] 2025E 2026E 2027E 2028E 2029E 2030E 2031E (dollars and units outstanding in millions, except per unit values) Distributable Cash [2] [a] $13.0 $35.9 $36.3 $55.3 $64.7 $64.7 $64.7 $64.7 Free Cash Flow Before Distributions [2] $0.3 $32.6 $24.7 $30.4 $49.7 $49.7 $49.7 $49.7 Illustrative Distibutions [3] [b] ($0.4) ($0.8) ($0.8) ($0.8) ($10.0) ($20.0) ($30.0) ($40.0) Implied Distribution per Unit ($0.01) ($0.02) ($0.02) ($0.02) ($0.25) ($0.50) ($0.75) ($0.99) Implied Distribution Coverage Ratio [4] [a]/[b] 32.7x 45.0x 45.7x 69.5x 6.5x 3.2x 2.2x 1.6x Implied Distribution Ratio [5] [b]/[a] 0.0x 0.0x 0.0x 0.0x 0.2x 0.3x 0.5x 0.6x Total Units (millions) [6] 39.8 39.9 40.0 40.0 40.1 40.1 40.2 40.2 Credit-Related Metrics Beginning Cash $0.1 $0.5 $0.5 $12.9 $0.5 $0.5 $30.2 $49.8 Change in Cash 0.2 (0.0) 12.4 (12.4) 0.0 29.7 19.7 9.7 Ending Cash $0.5 $0.5 $12.9 $0.5 $0.5 $30.2 $49.8 $59.5 Total Debt [7] $441.2 $411.5 $400.0 $363.3 $323.7 $323.7 $323.7 $323.7 Net Debt / Adjusted EBITDA [8] 3.8x 3.4x 3.2x 3.1x 2.7x 2.4x 2.3x 2.2x Free Cash Flow Before Distributions Coverage Ratio [9] 0.8x 41.0x 31.0x 38.2x 5.0x 2.5x 1.7x 1.2x Liquidity [10] $109.3 $139.0 $162.9 $37.2 $76.8 $106.5 $126.2 $135.9 • Additional liquidity may be necessary to potentially Implied Present Value of Distributions Per Unit [11] refinance the Company’s debt 2031 Terminal Distribution Coverage Ratio in the future 2.05x 1.90x 1.75x 1.60x 1.45x 1.30x 1.00x represents the upper bound Implied Terminal Free Cash Flow Before Distributions Coverage Ratio [9] 1.57x 1.46x 1.34x 1.23x 1.11x 1.00x to theoretical distributions • Distribution coverage ratios Implied Terminal Distribution $31.5 $34.0 $37.0 $40.4 $44.6 $49.8 of MLPs have trended higher in recent years, generally Implied Distribution per Unit $0.78 $0.85 $0.92 $1.01 $1.11 $1.24 Shown for illustrative purposes between ~1.5x and ~2.0x 12.0% $4.29 $4.52 $4.79 $5.12 $5.51 $5.99 and not as an indication as to 13.0% $3.83 $4.03 $4.27 $4.55 $4.89 $5.31 • MLPs frequently have actual unit prices which may significant latitude on the 14.0% $3.44 $3.62 $3.82 $4.07 $4.37 $4.73 vary based on various factors, Cost of definitions of capital 15.0% $3.11 $3.26 $3.45 $3.66 $3.92 $4.24 including market conditions Equity expenditures and other items 16.0% $2.82 $2.96 $3.12 $3.31 $3.54 $3.82 and financial projections. Does used to calculate distributable 17.0% $2.58 $2.70 $2.84 $3.01 $3.21 $3.46 not reflect an indication of cash 18.0% $2.36 $2.47 $2.59 $2.74 $2.92 $3.15 valuation of the units. See the following page for footnotes. CONFIDENTIAL – PRELIMINARY – SUBJECT TO FURTHER REVIEW 31
Illustrative Present Value of Future Distributions (cont.) Note: Present values as of 7/1/24; mid-year convention applied. 1. Reflects stub period as of 7/1/24. 2. Held constant after 2028E. 3. For purpose of the illustrative analysis, assumes total distribution amounts of $10 mm, $20 mm, $30 mm and $40 mm for each of 2028E, 2029E, 2030E and 2031E respectively. 4. Defined as Distributable Cash Flow divided by total Distributions in a given year. 5. Defined as total Distributions divided by Distributable Cash Flow in a given year. 6. Includes incremental 50,000 partner units granted to the Board of Directors per year. Per Company management. 0.8 million General Partner units implied based on 2.0% general partner interest. 7. For purpose of the illustrative analysis, (i) 2028 Free Cash Flow After Distributions is assumed to be utilized to pay down the revolver and (ii) the revolver balance is held constant after 2028. 8. For purpose of the illustrative analysis, the Company's adjusted EBITDA is assumed to be held constant after 2028. 9. Defined as Free Cash Flow Before Distributions divided by total Distributions in a given year. 10. Assumes $150 mm of total credit facility availability from 2024 till January 2027 and $200 mm thereafter. Per Company management. 11. For purpose of the illustrative analysis, utilizes terminal perpetual growth rate of 0%. Source: Company management. CONFIDENTIAL – PRELIMINARY – SUBJECT TO FURTHER REVIEW 32
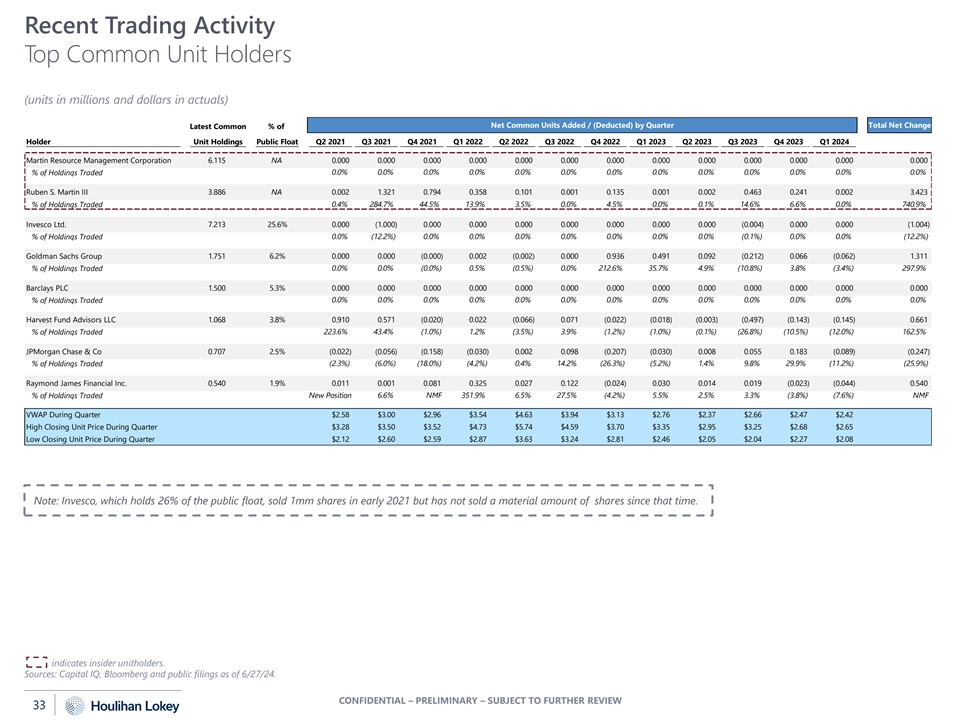
Recent Trading Activity Top Common Unit Holders (units in millions and dollars in actuals) Net Common Units Added / (Deducted) by Quarter Total Net Change Latest Common % of Holder Unit Holdings Public Float Q2 2021 Q3 2021 Q4 2021 Q1 2022 Q2 2022 Q3 2022 Q4 2022 Q1 2023 Q2 2023 Q3 2023 Q4 2023 Q1 2024 Martin Resource Management Corporation 6.115 NA 0.000 0.000 0.000 0.000 0.000 0.000 0.000 0.000 0.000 0.000 0.000 0.000 0.000 0.0% 0.0% 0.0% 0.0% 0.0% 0.0% 0.0% 0.0% 0.0% 0.0% 0.0% 0.0% 0.0% % of Holdings Traded Ruben S. Martin III 3.886 NA 0.002 1.321 0.794 0.358 0.101 0.001 0.135 0.001 0.002 0.463 0.241 0.002 3.423 0.4% 284.7% 44.5% 13.9% 3.5% 0.0% 4.5% 0.0% 0.1% 14.6% 6.6% 0.0% 740.9% % of Holdings Traded Invesco Ltd. 7.213 25.6% 0.000 (1.000) 0.000 0.000 0.000 0.000 0.000 0.000 0.000 (0.004) 0.000 0.000 (1.004) 0.0% (12.2%) 0.0% 0.0% 0.0% 0.0% 0.0% 0.0% 0.0% (0.1%) 0.0% 0.0% (12.2%) % of Holdings Traded Goldman Sachs Group 1.751 6.2% 0.000 0.000 (0.000) 0.002 (0.002) 0.000 0.936 0.491 0.092 (0.212) 0.066 (0.062) 1.311 0.0% 0.0% (0.0%) 0.5% (0.5%) 0.0% 212.6% 35.7% 4.9% (10.8%) 3.8% (3.4%) 297.9% % of Holdings Traded Barclays PLC 1.500 5.3% 0.000 0.000 0.000 0.000 0.000 0.000 0.000 0.000 0.000 0.000 0.000 0.000 0.000 % of Holdings Traded 0.0% 0.0% 0.0% 0.0% 0.0% 0.0% 0.0% 0.0% 0.0% 0.0% 0.0% 0.0% 0.0% Harvest Fund Advisors LLC 1.068 3.8% 0.910 0.571 (0.020) 0.022 (0.066) 0.071 (0.022) (0.018) (0.003) (0.497) (0.143) (0.145) 0.661 % of Holdings Traded 223.6% 43.4% (1.0%) 1.2% (3.5%) 3.9% (1.2%) (1.0%) (0.1%) (26.8%) (10.5%) (12.0%) 162.5% JPMorgan Chase & Co 0.707 2.5% (0.022) (0.056) (0.158) (0.030) 0.002 0.098 (0.207) (0.030) 0.008 0.055 0.183 (0.089) (0.247) % of Holdings Traded (2.3%) (6.0%) (18.0%) (4.2%) 0.4% 14.2% (26.3%) (5.2%) 1.4% 9.8% 29.9% (11.2%) (25.9%) Raymond James Financial Inc. 0.540 1.9% 0.011 0.001 0.081 0.325 0.027 0.122 (0.024) 0.030 0.014 0.019 (0.023) (0.044) 0.540 % of Holdings Traded New Position 6.6% NMF 351.9% 6.5% 27.5% (4.2%) 5.5% 2.5% 3.3% (3.8%) (7.6%) NMF VWAP During Quarter $2.58 $3.00 $2.96 $3.54 $4.63 $3.94 $3.13 $2.76 $2.37 $2.66 $2.47 $2.42 High Closing Unit Price During Quarter $3.28 $3.50 $3.52 $4.73 $5.74 $4.59 $3.70 $3.35 $2.95 $3.25 $2.68 $2.65 Low Closing Unit Price During Quarter $2.12 $2.60 $2.59 $2.87 $3.63 $3.24 $2.81 $2.46 $2.05 $2.04 $2.27 $2.08 Note: Invesco, which holds 26% of the public float, sold 1mm shares in early 2021 but has not sold a material amount of shares since that time. indicates insider unitholders. Sources: Capital IQ, Bloomberg and public filings as of 6/27/24. CONFIDENTIAL – PRELIMINARY – SUBJECT TO FURTHER REVIEW 33
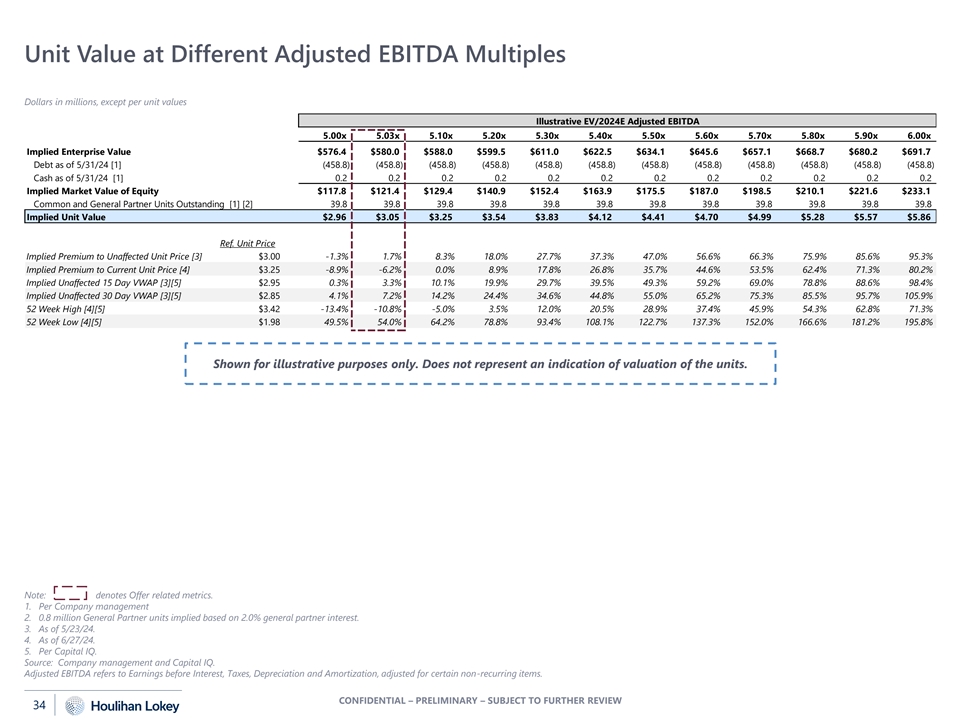
Unit Value at Different Adjusted EBITDA Multiples Dollars in millions, except per unit values Illustrative EV/2024E Adjusted EBITDA 5.00x 5.03x 5.10x 5.20x 5.30x 5.40x 5.50x 5.60x 5.70x 5.80x 5.90x 6.00x Implied Enterprise Value $576.4 $580.0 $588.0 $599.5 $611.0 $622.5 $634.1 $645.6 $657.1 $668.7 $680.2 $691.7 Debt as of 5/31/24 [1] (458.8) (458.8) (458.8) (458.8) (458.8) (458.8) (458.8) (458.8) (458.8) (458.8) (458.8) (458.8) Cash as of 5/31/24 [1] 0.2 0.2 0.2 0.2 0.2 0.2 0.2 0.2 0.2 0.2 0.2 0.2 Implied Market Value of Equity $117.8 $121.4 $129.4 $140.9 $152.4 $163.9 $175.5 $187.0 $198.5 $210.1 $221.6 $233.1 Common and General Partner Units Outstanding [1] [2] 39.8 39.8 39.8 39.8 39.8 39.8 39.8 39.8 39.8 39.8 39.8 39.8 Implied Unit Value $2.96 $3.05 $3.25 $3.54 $3.83 $4.12 $4.41 $4.70 $4.99 $5.28 $5.57 $5.86 Ref. Unit Price Implied Premium to Unaffected Unit Price [3] $3.00 -1.3% 1.7% 8.3% 18.0% 27.7% 37.3% 47.0% 56.6% 66.3% 75.9% 85.6% 95.3% Implied Premium to Current Unit Price [4] $3.25 -8.9% -6.2% 0.0% 8.9% 17.8% 26.8% 35.7% 44.6% 53.5% 62.4% 71.3% 80.2% Implied Unaffected 15 Day VWAP [3][5] $2.95 0.3% 3.3% 10.1% 19.9% 29.7% 39.5% 49.3% 59.2% 69.0% 78.8% 88.6% 98.4% Implied Unaffected 30 Day VWAP [3][5] $2.85 4.1% 7.2% 14.2% 24.4% 34.6% 44.8% 55.0% 65.2% 75.3% 85.5% 95.7% 105.9% 52 Week High [4][5] $3.42 -13.4% -10.8% -5.0% 3.5% 12.0% 20.5% 28.9% 37.4% 45.9% 54.3% 62.8% 71.3% 52 Week Low [4][5] $1.98 49.5% 54.0% 64.2% 78.8% 93.4% 108.1% 122.7% 137.3% 152.0% 166.6% 181.2% 195.8% Shown for illustrative purposes only. Does not represent an indication of valuation of the units. Note: denotes Offer related metrics. 1. Per Company management 2. 0.8 million General Partner units implied based on 2.0% general partner interest. 3. As of 5/23/24. 4. As of 6/27/24. 5. Per Capital IQ. Source: Company management and Capital IQ. Adjusted EBITDA refers to Earnings before Interest, Taxes, Depreciation and Amortization, adjusted for certain non-recurring items. CONFIDENTIAL – PRELIMINARY – SUBJECT TO FURTHER REVIEW 34

APPENDIX Public Market Observations 05 04 CONFIDENTIAL – PRELIMINARY – SUBJECT TO FURTHER REVIEW
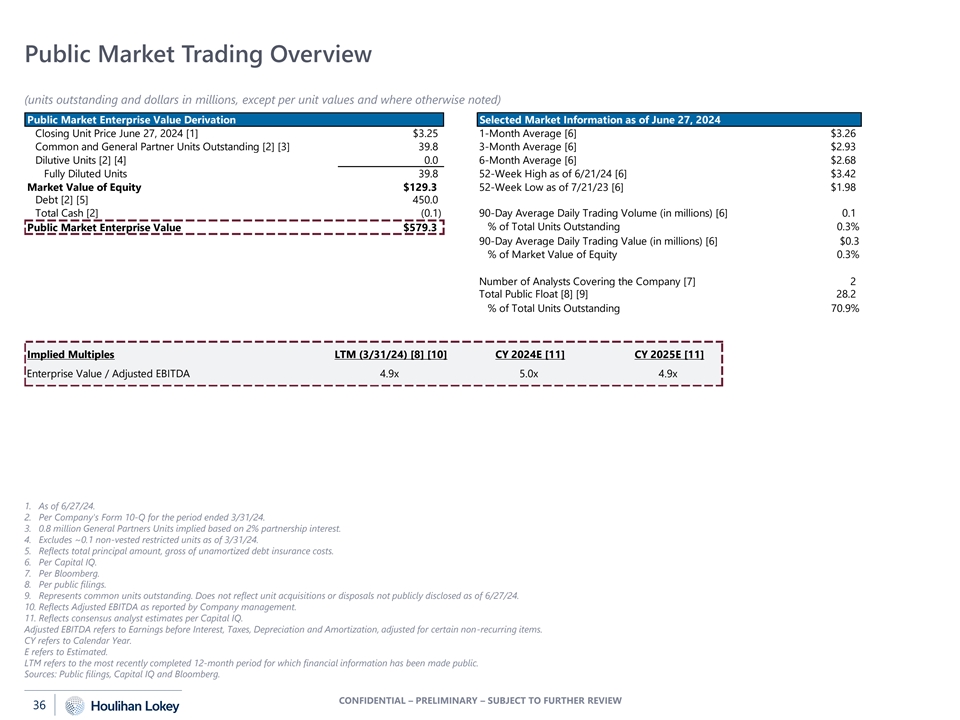
Public Market Trading Overview (units outstanding and dollars in millions, except per unit values and where otherwise noted) Public Market Enterprise Value Derivation Selected Market Information as of June 27, 2024 Closing Unit Price June 27, 2024 [1] $3.25 1-Month Average [6] $3.26 Common and General Partner Units Outstanding [2] [3] 39.8 3-Month Average [6] $2.93 Dilutive Units [2] [4] 0.0 6-Month Average [6] $2.68 Fully Diluted Units 39.8 52-Week High as of 6/21/24 [6] $3.42 Market Value of Equity $129.3 52-Week Low as of 7/21/23 [6] $1.98 Debt [2] [5] 450.0 Total Cash [2] (0.1) 90-Day Average Daily Trading Volume (in millions) [6] 0.1 % of Total Units Outstanding 0.3% Public Market Enterprise Value $579.3 90-Day Average Daily Trading Value (in millions) [6] $0.3 % of Market Value of Equity 0.3% Number of Analysts Covering the Company [7] 2 Total Public Float [8] [9] 28.2 % of Total Units Outstanding 70.9% Implied Multiples LTM (3/31/24) [8] [10] CY 2024E [11] CY 2025E [11] CY 2025E [11] Enterprise Value / Adjusted EBITDA 4.9x 5.0x 4.9x #VALUE! 1. As of 6/27/24. 2. Per Company's Form 10-Q for the period ended 3/31/24. 3. 0.8 million General Partners Units implied based on 2% partnership interest. 4. Excludes ~0.1 non-vested restricted units as of 3/31/24. 5. Reflects total principal amount, gross of unamortized debt insurance costs. 6. Per Capital IQ. 7. Per Bloomberg. 8. Per public filings. 9. Represents common units outstanding. Does not reflect unit acquisitions or disposals not publicly disclosed as of 6/27/24. 10. Reflects Adjusted EBITDA as reported by Company management. 11. Reflects consensus analyst estimates per Capital IQ. Adjusted EBITDA refers to Earnings before Interest, Taxes, Depreciation and Amortization, adjusted for certain non-recurring items. CY refers to Calendar Year. E refers to Estimated. LTM refers to the most recently completed 12-month period for which financial information has been made public. Sources: Public filings, Capital IQ and Bloomberg. CONFIDENTIAL – PRELIMINARY – SUBJECT TO FURTHER REVIEW 36
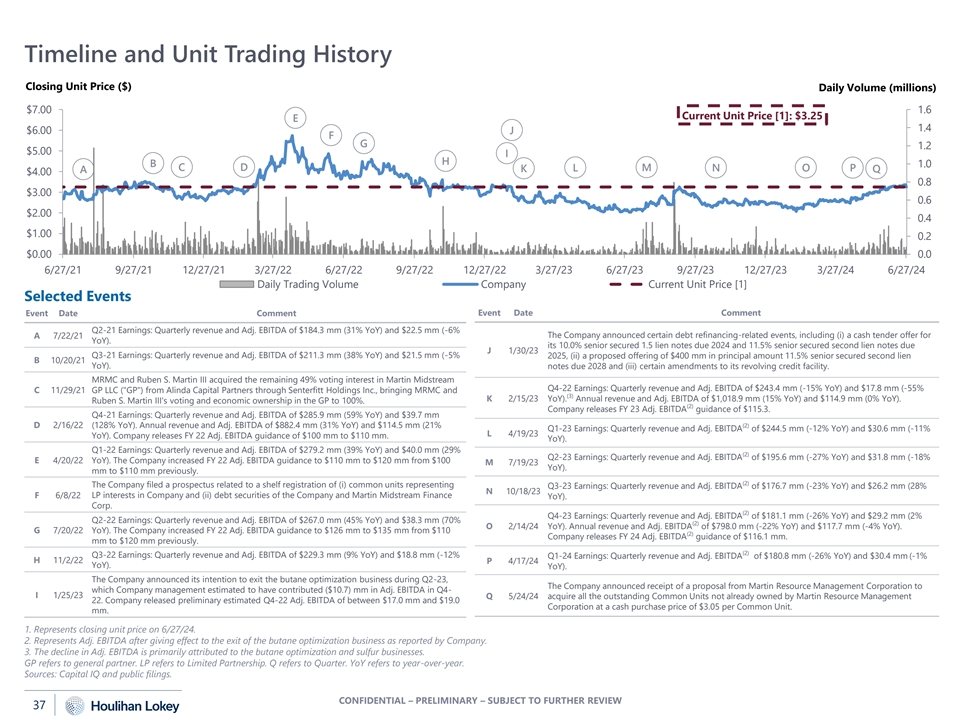
Timeline and Unit Trading History Closing Unit Price ($) Daily Volume (millions) $7.00 1.6 Current Unit Price [1]: $3.25 E 1.4 $6.00 J F G 1.2 $5.00 I H B 1.0 C D K L M N O P Q A $4.00 0.8 $3.00 0.6 $2.00 0.4 $1.00 0.2 $0.00 0.0 6/27/21 9/27/21 12/27/21 3/27/22 6/27/22 9/27/22 12/27/22 3/27/23 6/27/23 9/27/23 12/27/23 3/27/24 6/27/24 Daily Trading Volume Company Current Unit Price [1] Selected Events Event Date Comment Event Date Comment Q2-21 Earnings: Quarterly revenue and Adj. EBITDA of $184.3 mm (31% YoY) and $22.5 mm (-6% A 7/22/21 The Company announced certain debt refinancing-related events, including (i) a cash tender offer for YoY). its 10.0% senior secured 1.5 lien notes due 2024 and 11.5% senior secured second lien notes due J 1/30/23 Q3-21 Earnings: Quarterly revenue and Adj. EBITDA of $211.3 mm (38% YoY) and $21.5 mm (-5% 2025, (ii) a proposed offering of $400 mm in principal amount 11.5% senior secured second lien B 10/20/21 YoY). notes due 2028 and (iii) certain amendments to its revolving credit facility. MRMC and Ruben S. Martin III acquired the remaining 49% voting interest in Martin Midstream Q4-22 Earnings: Quarterly revenue and Adj. EBITDA of $243.4 mm (-15% YoY) and $17.8 mm (-55% C 11/29/21 GP LLC ( GP ) from Alinda Capital Partners through Senterfitt Holdings Inc., bringing MRMC and (3) K 2/15/23 YoY). Annual revenue and Adj. EBITDA of $1,018.9 mm (15% YoY) and $114.9 mm (0% YoY). Ruben S. Martin III's voting and economic ownership in the GP to 100%. (2) Company releases FY 23 Adj. EBITDA guidance of $115.3. Q4-21 Earnings: Quarterly revenue and Adj. EBITDA of $285.9 mm (59% YoY) and $39.7 mm D 2/16/22 (128% YoY). Annual revenue and Adj. EBITDA of $882.4 mm (31% YoY) and $114.5 mm (21% (2) Q1-23 Earnings: Quarterly revenue and Adj. EBITDA of $244.5 mm (-12% YoY) and $30.6 mm (-11% L 4/19/23 YoY). Company releases FY 22 Adj. EBITDA guidance of $100 mm to $110 mm. YoY). Q1-22 Earnings: Quarterly revenue and Adj. EBITDA of $279.2 mm (39% YoY) and $40.0 mm (29% (2) Q2-23 Earnings: Quarterly revenue and Adj. EBITDA of $195.6 mm (-27% YoY) and $31.8 mm (-18% E 4/20/22 YoY). The Company increased FY 22 Adj. EBITDA guidance to $110 mm to $120 mm from $100 M 7/19/23 YoY). mm to $110 mm previously. (2) The Company filed a prospectus related to a shelf registration of (i) common units representing Q3-23 Earnings: Quarterly revenue and Adj. EBITDA of $176.7 mm (-23% YoY) and $26.2 mm (28% N 10/18/23 F 6/8/22 LP interests in Company and (ii) debt securities of the Company and Martin Midstream Finance YoY). Corp. (2) Q4-23 Earnings: Quarterly revenue and Adj. EBITDA of $181.1 mm (-26% YoY) and $29.2 mm (2% Q2-22 Earnings: Quarterly revenue and Adj. EBITDA of $267.0 mm (45% YoY) and $38.3 mm (70% (2) O 2/14/24 YoY). Annual revenue and Adj. EBITDA of $798.0 mm (-22% YoY) and $117.7 mm (-4% YoY). G 7/20/22 YoY). The Company increased FY 22 Adj. EBITDA guidance to $126 mm to $135 mm from $110 (2) Company releases FY 24 Adj. EBITDA guidance of $116.1 mm. mm to $120 mm previously. (2) Q3-22 Earnings: Quarterly revenue and Adj. EBITDA of $229.3 mm (9% YoY) and $18.8 mm (-12% Q1-24 Earnings: Quarterly revenue and Adj. EBITDA of $180.8 mm (-26% YoY) and $30.4 mm (-1% H 11/2/22 P 4/17/24 YoY). YoY). The Company announced its intention to exit the butane optimization business during Q2-23, The Company announced receipt of a proposal from Martin Resource Management Corporation to which Company management estimated to have contributed ($10.7) mm in Adj. EBITDA in Q4- I 1/25/23 Q 5/24/24 acquire all the outstanding Common Units not already owned by Martin Resource Management 22. Company released preliminary estimated Q4-22 Adj. EBITDA of between $17.0 mm and $19.0 Corporation at a cash purchase price of $3.05 per Common Unit. mm. 1. Represents closing unit price on 6/27/24. 2. Represents Adj. EBITDA after giving effect to the exit of the butane optimization business as reported by Company. 3. The decline in Adj. EBITDA is primarily attributed to the butane optimization and sulfur businesses. GP refers to general partner. LP refers to Limited Partnership. Q refers to Quarter. YoY refers to year-over-year. Sources: Capital IQ and public filings. CONFIDENTIAL – PRELIMINARY – SUBJECT TO FURTHER REVIEW 37

Selected Float and Trading Data 1 Average Daily Volume / Common Units or Shares Outstanding 2.5% 1.6% 1.0% 0.9% Median: 0.7% 0.7% 0.7% 0.6% Median: 0.5% 0.3% 0.3% 0.3% 0.2% 0.2% 0.2% 0.2% Company ASC TNP NMM GEL NGL AE OIS WKC RES RNGR SPH DKL MTL 1 2 Average Daily Volume / Public Float 2.7% 1.9% 1.8% 1.3% Median: 1.0% 1.0% 1.0% 1.0% 0.9% Median: 0.7% 0.4% 0.4% 0.3% 0.3% 0.2% 0.2% Company ASC TNP NMM GEL NGL AE OIS RES RNGR WKC DKL SPH MTL Tier 1 Tier 2 1. Based on 90-day average trading volume as of 6/27/24. 2. Company float excludes units held by Ruben S. Martin III, C. Scott Massey, Robert D. Bondurant and other insiders. AE refers to Adams Resources & Energy, Inc., ASC refers to Ardmore Shipping Corporation, DKL Delek Logistics Partners, LP, GEL refers to Genesis Energy, L.P., MTL Mullen Group Ltd., NMM refers to Navios Maritime Partners L.P., NGL refers to NGL Energy Partners LP, OIS refers to Oil States International, Inc., RNGR refers to Ranger Energy Services, Inc., RES refers to RPC, Inc., SPH refers to Suburban Propane Partners, L.P., TNP refers to Tsakos Energy Navigation Limited, and WKC refers to World Kinect Corporation. Source: Capital IQ as of 6/27/24. CONFIDENTIAL – PRELIMINARY – SUBJECT TO FURTHER REVIEW 38
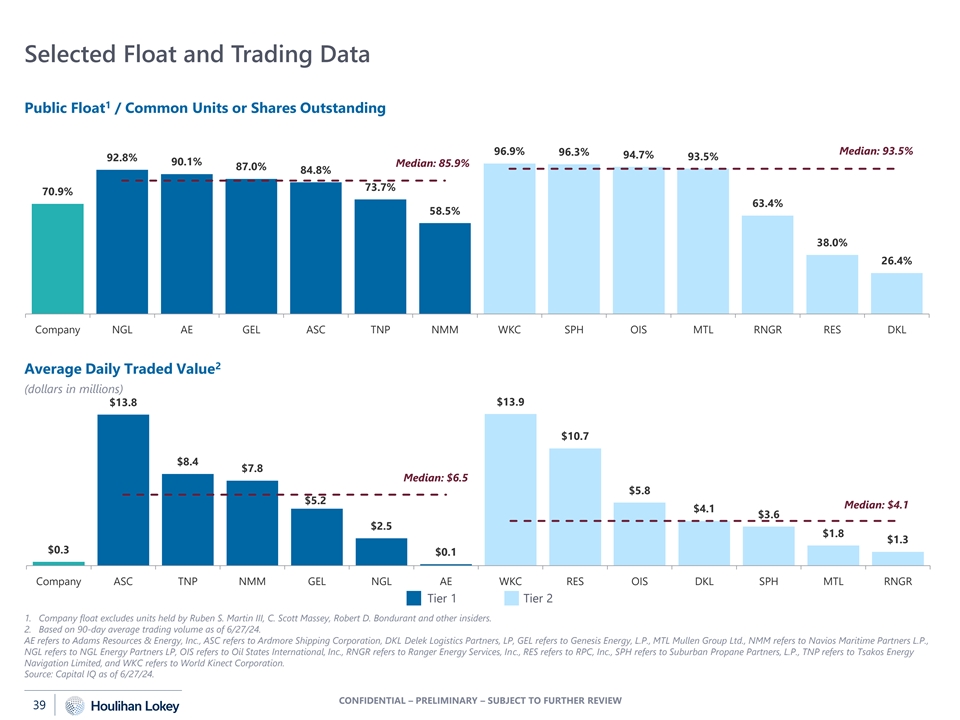
Selected Float and Trading Data 1 Public Float / Common Units or Shares Outstanding 96.9% Median: 93.5% 96.3% 94.7% 93.5% 92.8% 90.1% Median: 85.9% 87.0% 84.8% 73.7% 70.9% 63.4% 58.5% 38.0% 26.4% Company NGL AE GEL ASC TNP NMM WKC SPH OIS MTL RNGR RES DKL 2 Average Daily Traded Value (dollars in millions) $13.9 $13.8 $10.7 $8.4 $7.8 Median: $6.5 $5.8 $5.2 Median: $4.1 $4.1 $3.6 $2.5 $1.8 $1.3 $0.3 $0.1 Company ASC TNP NMM GEL NGL AE WKC RES OIS DKL SPH MTL RNGR Tier 1 Tier 2 1. Company float excludes units held by Ruben S. Martin III, C. Scott Massey, Robert D. Bondurant and other insiders. 2. Based on 90-day average trading volume as of 6/27/24. AE refers to Adams Resources & Energy, Inc., ASC refers to Ardmore Shipping Corporation, DKL Delek Logistics Partners, LP, GEL refers to Genesis Energy, L.P., MTL Mullen Group Ltd., NMM refers to Navios Maritime Partners L.P., NGL refers to NGL Energy Partners LP, OIS refers to Oil States International, Inc., RNGR refers to Ranger Energy Services, Inc., RES refers to RPC, Inc., SPH refers to Suburban Propane Partners, L.P., TNP refers to Tsakos Energy Navigation Limited, and WKC refers to World Kinect Corporation. Source: Capital IQ as of 6/27/24. CONFIDENTIAL – PRELIMINARY – SUBJECT TO FURTHER REVIEW 39
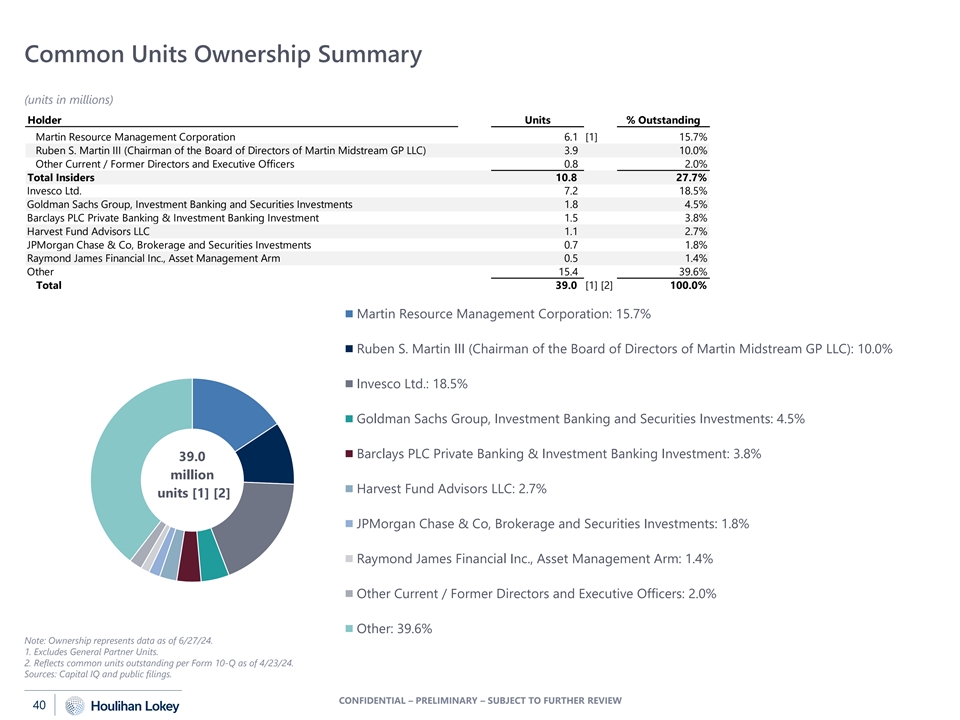
Common Units Ownership Summary (units in millions) Holder Units % Outstanding Martin Resource Management Corporation 6.1 [1] 15.7% Ruben S. Martin III (Chairman of the Board of Directors of Martin Midstream GP LLC) 3.9 10.0% Other Current / Former Directors and Executive Officers 0.8 2.0% Total Insiders 10.8 27.7% Invesco Ltd. 7.2 18.5% Goldman Sachs Group, Investment Banking and Securities Investments 1.8 4.5% Barclays PLC Private Banking & Investment Banking Investment 1.5 3.8% Harvest Fund Advisors LLC 1.1 2.7% JPMorgan Chase & Co, Brokerage and Securities Investments 0.7 1.8% Raymond James Financial Inc., Asset Management Arm 0.5 1.4% Other 15.4 39.6% Total 39.0 [1] [2] 100.0% Martin Resource Management Corporation: 15.7% Ruben S. Martin III (Chairman of the Board of Directors of Martin Midstream GP LLC): 10.0% Invesco Ltd.: 18.5% Goldman Sachs Group, Investment Banking and Securities Investments: 4.5% Barclays PLC Private Banking & Investment Banking Investment: 3.8% 39.0 million Harvest Fund Advisors LLC: 2.7% units [1] [2] JPMorgan Chase & Co, Brokerage and Securities Investments: 1.8% Raymond James Financial Inc., Asset Management Arm: 1.4% Other Current / Former Directors and Executive Officers: 2.0% Other: 39.6% Note: Ownership represents data as of 6/27/24. 1. Excludes General Partner Units. 2. Reflects common units outstanding per Form 10-Q as of 4/23/24. Sources: Capital IQ and public filings. CONFIDENTIAL – PRELIMINARY – SUBJECT TO FURTHER REVIEW 40

Selected Wall Street Analyst Commentary (unit prices in actuals) Date of Report & Analyst Comments Recommendation “We suspect investors are jockeying for a boost to the initial offer of $3.05 per unit before the deal closes given the stock has closed above this price since the announcement.” 6/27/24 Sidoti & “Recently, MMLP incurred what we consider to be two minor environmental incidents. On May 15, multiple media sources reported that a barge owned by MMLP collided with the Pelican Island Bridge near Galveston, Company (Risk: Moderate/ $3.00) TX. Earlier this week, MMLP reported a crude oil pipeline spill of approximately 2,000 barrels near the Smackover refinery in Arkansas. While these issues are unfortunate, we do not see either, or both collectively, having a meaningful effect on MMLP.” “MMLP has historically traded at a discount to peers, given its capital structure, elevated leverage, and minimal growth; we believe the offer reflects that discount. In our view, the parent company is the natural acquirer and we do not foresee a competing offer from another company, considering the nature of 5/28/24 Sidoti & MMLP’s business and assets.” Company (Risk: Moderate/ $3.00) “MMLP units are up 14% in the last month and 30% year-to-date. In our view, the strong performance likely reflects balance sheet improvement and potential for additional shareholder returns, as did our prior price target.” “Given MRMC is the logical buyer, we would not anticipate any other bidders to come into play and would not expect a material change to the buyout offer. That said, given MMLP's investment in the DSM Semichem JV 5/24/24 Stifel and longer-term prospects associated with the JV, we believe this could drive incremental value for MMLP (Hold / $3.00) unitholders. Overall, given MMLP's core assets were not mainstream midstream assets, and it was a micro-cap company, we believe the assets fit best in private hands.” “Our $4 price target is based on 4x our revised 2025 FCF per share estimate of $0.90 (from $0.92). MMLP 4/22/24 Sidoti & shares trade at a discount to other small-cap energy companies. We contend the valuation gap fails to Company (Risk: Moderate/ $4.00) reflect the repositioning of the company.” “MMLP… not[ed] upside potential for additional customers to utilize the ELSA produced by the JV. [While] potential upside does exist due to the reshoring trend and chip production expansion in the US, we view it as a longer-term opportunity. At this time, we are maintaining our Hold rating and our $3.00 target 4/18/24 Stifel price.” (Hold / $3.00) “MMLP is trading at 4.8x EV/LP EBITDA. Our 5.0x target multiple applied against our LP EBITDA estimate results in a $3.00 target price.” Source: Wall Street Research. CONFIDENTIAL – PRELIMINARY – SUBJECT TO FURTHER REVIEW 41 Prior to Offer Subsequent to Offer
APPENDIX Weighted Average Cost of Capital 06 04 CONFIDENTIAL – PRELIMINARY – SUBJECT TO FURTHER REVIEW
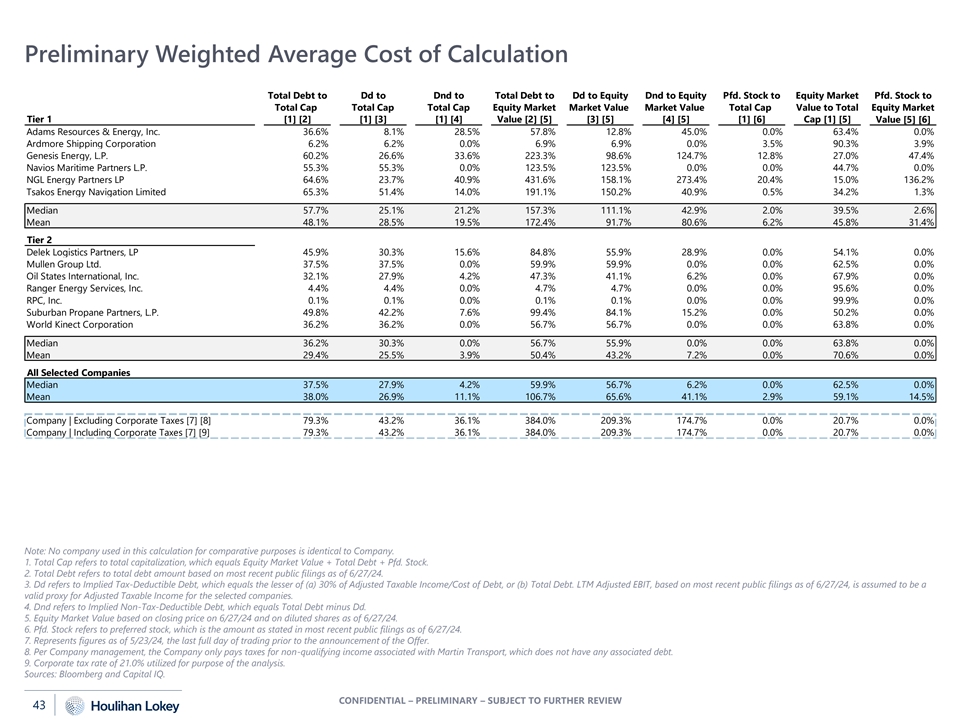
Preliminary Weighted Average Cost of Calculation Total Debt to Dd to Dnd to Total Debt to Dd to Equity Dnd to Equity Pfd. Stock to Equity Market Pfd. Stock to Total Cap Total Cap Total Cap Equity Market Market Value Market Value Total Cap Value to Total Equity Market Tier 1 [1] [2] [1] [3] [1] [4] Value [2] [5] [3] [5] [4] [5] [1] [6] Cap [1] [5] Value [5] [6] Adams Resources & Energy, Inc. 36.6% 8.1% 28.5% 57.8% 12.8% 45.0% 0.0% 63.4% 0.0% Ardmore Shipping Corporation 6.2% 6.2% 0.0% 6.9% 6.9% 0.0% 3.5% 90.3% 3.9% Genesis Energy, L.P. 60.2% 26.6% 33.6% 223.3% 98.6% 124.7% 12.8% 27.0% 47.4% Navios Maritime Partners L.P. 55.3% 55.3% 0.0% 123.5% 123.5% 0.0% 0.0% 44.7% 0.0% NGL Energy Partners LP 64.6% 23.7% 40.9% 431.6% 158.1% 273.4% 20.4% 15.0% 136.2% Tsakos Energy Navigation Limited 65.3% 51.4% 14.0% 191.1% 150.2% 40.9% 0.5% 34.2% 1.3% Median 57.7% 25.1% 21.2% 157.3% 111.1% 42.9% 2.0% 39.5% 2.6% Mean 48.1% 28.5% 19.5% 172.4% 91.7% 80.6% 6.2% 45.8% 31.4% Tier 2 Delek Logistics Partners, LP 45.9% 30.3% 15.6% 84.8% 55.9% 28.9% 0.0% 54.1% 0.0% Mullen Group Ltd. 37.5% 37.5% 0.0% 59.9% 59.9% 0.0% 0.0% 62.5% 0.0% Oil States International, Inc. 32.1% 27.9% 4.2% 47.3% 41.1% 6.2% 0.0% 67.9% 0.0% Ranger Energy Services, Inc. 4.4% 4.4% 0.0% 4.7% 4.7% 0.0% 0.0% 95.6% 0.0% RPC, Inc. 0.1% 0.1% 0.0% 0.1% 0.1% 0.0% 0.0% 99.9% 0.0% Suburban Propane Partners, L.P. 49.8% 42.2% 7.6% 99.4% 84.1% 15.2% 0.0% 50.2% 0.0% World Kinect Corporation 36.2% 36.2% 0.0% 56.7% 56.7% 0.0% 0.0% 63.8% 0.0% Median 36.2% 30.3% 0.0% 56.7% 55.9% 0.0% 0.0% 63.8% 0.0% Mean 29.4% 25.5% 3.9% 50.4% 43.2% 7.2% 0.0% 70.6% 0.0% All Selected Companies Median 37.5% 27.9% 4.2% 59.9% 56.7% 6.2% 0.0% 62.5% 0.0% Mean 38.0% 26.9% 11.1% 106.7% 65.6% 41.1% 2.9% 59.1% 14.5% Company | Excluding Corporate Taxes [7] [8] 79.3% 43.2% 36.1% 384.0% 209.3% 174.7% 0.0% 20.7% 0.0% Company | Including Corporate Taxes [7] [9] 79.3% 43.2% 36.1% 384.0% 209.3% 174.7% 0.0% 20.7% 0.0% Note: No company used in this calculation for comparative purposes is identical to Company. 1. Total Cap refers to total capitalization, which equals Equity Market Value + Total Debt + Pfd. Stock. 2. Total Debt refers to total debt amount based on most recent public filings as of 6/27/24. 3. Dd refers to Implied Tax-Deductible Debt, which equals the lesser of (a) 30% of Adjusted Taxable Income/Cost of Debt, or (b) Total Debt. LTM Adjusted EBIT, based on most recent public filings as of 6/27/24, is assumed to be a valid proxy for Adjusted Taxable Income for the selected companies. 4. Dnd refers to Implied Non-Tax-Deductible Debt, which equals Total Debt minus Dd. 5. Equity Market Value based on closing price on 6/27/24 and on diluted shares as of 6/27/24. 6. Pfd. Stock refers to preferred stock, which is the amount as stated in most recent public filings as of 6/27/24. 7. Represents figures as of 5/23/24, the last full day of trading prior to the announcement of the Offer. 8. Per Company management, the Company only pays taxes for non-qualifying income associated with Martin Transport, which does not have any associated debt. 9. Corporate tax rate of 21.0% utilized for purpose of the analysis. Sources: Bloomberg and Capital IQ. CONFIDENTIAL – PRELIMINARY – SUBJECT TO FURTHER REVIEW 43

Preliminary Weighted Average Cost of Calculation (cont.) Levered Unlevered Equity Risk Size Cost of Cost of Cost of Pfd. Tier 1 Beta [1] Beta [2] Premium [3] Premium [4] Equity [5] Debt [6] Stock [7] WACC Adams Resources & Energy, Inc. 0.88 0.57 5.75% 4.70% 14.3% 6.5% NA 11.4% Ardmore Shipping Corporation 0.84 0.76 5.75% 1.14% 10.5% 8.4% 8.5% 10.3% Genesis Energy, L.P. 1.38 0.37 5.75% 1.39% 13.8% 7.4% [8] 11.2% 9.6% Navios Maritime Partners L.P. 1.34 0.60 5.75% 1.39% 13.6% 7.1% NA 10.0% NGL Energy Partners LP 1.02 0.15 5.75% 1.14% 11.6% 8.6% 10.2% 9.4% Tsakos Energy Navigation Limited 1.09 0.37 5.75% 1.14% 12.0% 6.7% 9.4% 8.5% Median 1.06 0.47 12.8% 7.2% 9.8% 9.8% Mean 1.09 0.47 12.6% 7.4% 9.8% 9.9% Tier 2 8.2% [8] Delek Logistics Partners, LP 0.97 0.53 5.75% 1.21% 11.3% NA 9.9% Mullen Group Ltd. 1.01 0.70 5.75% 1.14% 11.5% 3.9% NA 8.6% Oil States International, Inc. 1.64 1.11 5.75% 1.99% 15.9% 5.6% NA 12.6% Ranger Energy Services, Inc. 0.50 0.49 5.75% 1.99% 9.4% 6.1% NA 9.3% RPC, Inc. 0.74 0.74 5.75% 1.39% 10.2% 8.4% NA 10.2% Suburban Propane Partners, L.P. 0.79 0.40 5.75% 1.39% 10.5% 5.6% NA 8.1% World Kinect Corporation 0.87 0.60 5.75% 1.39% 10.9% 5.6% NA 9.0% Median 0.87 0.60 10.9% 5.6% NA 9.3% Mean 0.93 0.65 11.4% 6.2% NA 9.7% All Selected Companies Median 0.97 0.57 11.5% 6.7% 9.8% 9.6% Mean 1.01 0.57 12.0% 6.8% 9.8% 9.8% Company | Excluding Corporate Taxes [9] [10] 0.73 0.15 5.75% 4.70% 13.6% 8.4% [8] NA 9.5% Company | Including Corporate Taxes [9] [11] 0.73 0.17 5.75% 4.70% 13.6% 8.4% [8] NA 8.7% Note: No company used in this calculation for comparative purposes is identical to Company. 1. Based on actual levered beta per Bloomberg 5-year weekly as of 6/27/24. 2. Unlevered Beta = Levered Beta/(1 + ((1 – tax rate) * Dd to Equity Market Value) + (Dnd to Equity Market Value) + (Pfd. Stock to Equity Market Value)). 3. Based on review of studies measuring the historical returns between stocks and bonds, theoretical models such as supply-side and demand-side models and other materials. 4. Kroll Cost of Capital Navigator ( Navigator ). 5. Cost of Equity = Risk-Free Rate of Return + (Levered Beta * Equity Risk Premium) + Size Premium. Risk-Free Rate of Return as of 6/27/24, based on 20-year U.S. Treasury Bond Yield. 6. Based on selected company weighted average interest rate per most recent public filings as of 6/27/24. 7. Based on selected company weighted average preferred dividend per most recent public filings 6/27/24. 8. Cost of debt incorporated market based yield for certain securities. 9. Represents figures as of 5/23/24, the last full day of trading prior to the announcement of the Offer. 10. Per Company management, the Company only pays taxes for non-qualifying income associated with Martin Transport, which does not have any associated debt. 11. Corporate tax rate of 21.0% utilized for purpose of the analysis. NA refers to not available. Sources: Bloomberg and Capital IQ. CONFIDENTIAL – PRELIMINARY – SUBJECT TO FURTHER REVIEW 44

Preliminary Weighted Average Cost of Calculation (cont.) Excluding Corporate Taxes (dollars in millions) Market Capital Structure Cost of Equity for Assumptions Assumptions Computed WACC Risk-Free Rate of Return [1] 4.53% Company Adjusted Taxable Income [5] $119.9 Selected Unlevered Beta [11] 0.57 Equity Risk Premium [2] 5.75% Company Total Debt [6] $458.5 Computed Levered Beta [12] 0.91 Size Premium [3] 4.70% Company Dd [7] $458.5 Cost of Equity [13] 14.4% Tax Rate [4] 0.00% Company Dnd [8] $0.0 Total Debt to Total Capitalization [9] 37.5% Dd to Total Capitalization [10] 37.5% Dnd to Total Capitalization [10] 0.0% Total Debt to Equity Market Value 59.9% Dd to Equity Market Value [10] 59.9% Dnd to Equity Market Value [10] 0.0% Preferred Stock to Total Capitalization [9] 0.0% Equity Market Value to Total Capitalization [9] 62.5% Preferred Stock to Equity Market Value 0.0% Cost of Debt [9] 6.7% Cost of Preferred Stock [9] 0.0% Computed Weighted Average Cost of Capital 11.5% Selected Weighted Average Cost of Capital Range - Excluding Corporate Taxes 10.25% -- 12.25% Note: Calculated weighted average cost of capital supports a discount rate range of 10.5% to 12.5%, which would have the impact of decreasing the discounted cash flow per unit reference range by $0.11 to $0.14. 1. Risk-Free Rate of Return as of 6/27/24, based on 20-year U.S. Treasury Bond Yield. 2. Based on a review of studies measuring the historical returns between stocks and bonds, theoretical models such as supply side and demand side models and other materials. 3. Navigator. 4. Per Company management, the Company only pays taxes for non-qualifying income associated with Martin Transport, which does not have any associated debt. 5. Company LTM Adjusted EBITDA is assumed to be a valid proxy for Company Adjusted Taxable Income. 6. Company Total Debt refers to total debt amount of Company as of 5/31/24. 7. Company Dd refers to Implied Tax-Deductible Debt of Company, which equals the lesser of (a) 30% of Company Adjusted Taxable Income/Cost of Debt, or (b) Company Total Debt. Based on Capital Structure Assumptions. 8. Company Dnd refers to Implied Non-Tax-Deductible Debt of Company, which equals Company Total Debt minus Company Dd. 9. Based on review of corresponding metrics of selected companies listed on pages 43-44. 10. Based on Company's Dd and Dnd and the Capital Structure Assumptions regarding Total Debt to Total Capitalization and Equity Market Value to Total Capitalization. 11. Based on review of selected companies’ unlevered betas listed on Weighted Average Cost of Capital Calculation page. 12. Computed Levered Beta = Selected Unlevered Beta * (1 + ((1 – Tax Rate) * Dd to Equity Market Value) + (Dnd to Equity Market Value) + (Preferred Stock to Equity Market Value)). Based on Market and Capital Structure Assumptions. 13. Cost of Equity = Risk-Free Rate of Return + (Computed Levered Beta * Equity Risk Premium) + Size Premium. Based on Market Assumptions. Sources: Bloomberg and Capital IQ. CONFIDENTIAL – PRELIMINARY – SUBJECT TO FURTHER REVIEW 45
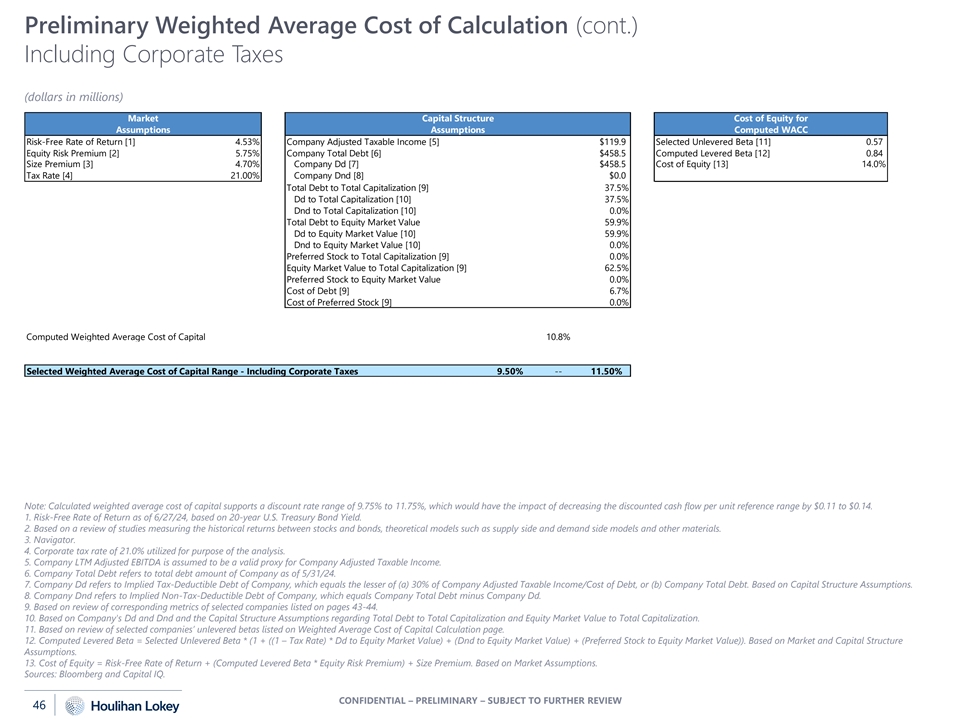
Preliminary Weighted Average Cost of Calculation (cont.) Including Corporate Taxes (dollars in millions) Market Capital Structure Cost of Equity for Assumptions Assumptions Computed WACC Risk-Free Rate of Return [1] 4.53% Company Adjusted Taxable Income [5] $119.9 Selected Unlevered Beta [11] 0.57 Equity Risk Premium [2] 5.75% Company Total Debt [6] $458.5 Computed Levered Beta [12] 0.84 Size Premium [3] 4.70% Company Dd [7] $458.5 Cost of Equity [13] 14.0% Tax Rate [4] 21.00% Company Dnd [8] $0.0 Total Debt to Total Capitalization [9] 37.5% Dd to Total Capitalization [10] 37.5% Dnd to Total Capitalization [10] 0.0% Total Debt to Equity Market Value 59.9% Dd to Equity Market Value [10] 59.9% Dnd to Equity Market Value [10] 0.0% Preferred Stock to Total Capitalization [9] 0.0% Equity Market Value to Total Capitalization [9] 62.5% Preferred Stock to Equity Market Value 0.0% Cost of Debt [9] 6.7% Cost of Preferred Stock [9] 0.0% Computed Weighted Average Cost of Capital 10.8% Selected Weighted Average Cost of Capital Range - Including Corporate Taxes 9.50% -- 11.50% Note: Calculated weighted average cost of capital supports a discount rate range of 9.75% to 11.75%, which would have the impact of decreasing the discounted cash flow per unit reference range by $0.11 to $0.14. 1. Risk-Free Rate of Return as of 6/27/24, based on 20-year U.S. Treasury Bond Yield. 2. Based on a review of studies measuring the historical returns between stocks and bonds, theoretical models such as supply side and demand side models and other materials. 3. Navigator. 4. Corporate tax rate of 21.0% utilized for purpose of the analysis. 5. Company LTM Adjusted EBITDA is assumed to be a valid proxy for Company Adjusted Taxable Income. 6. Company Total Debt refers to total debt amount of Company as of 5/31/24. 7. Company Dd refers to Implied Tax-Deductible Debt of Company, which equals the lesser of (a) 30% of Company Adjusted Taxable Income/Cost of Debt, or (b) Company Total Debt. Based on Capital Structure Assumptions. 8. Company Dnd refers to Implied Non-Tax-Deductible Debt of Company, which equals Company Total Debt minus Company Dd. 9. Based on review of corresponding metrics of selected companies listed on pages 43-44. 10. Based on Company's Dd and Dnd and the Capital Structure Assumptions regarding Total Debt to Total Capitalization and Equity Market Value to Total Capitalization. 11. Based on review of selected companies’ unlevered betas listed on Weighted Average Cost of Capital Calculation page. 12. Computed Levered Beta = Selected Unlevered Beta * (1 + ((1 – Tax Rate) * Dd to Equity Market Value) + (Dnd to Equity Market Value) + (Preferred Stock to Equity Market Value)). Based on Market and Capital Structure Assumptions. 13. Cost of Equity = Risk-Free Rate of Return + (Computed Levered Beta * Equity Risk Premium) + Size Premium. Based on Market Assumptions. Sources: Bloomberg and Capital IQ. CONFIDENTIAL – PRELIMINARY – SUBJECT TO FURTHER REVIEW 46
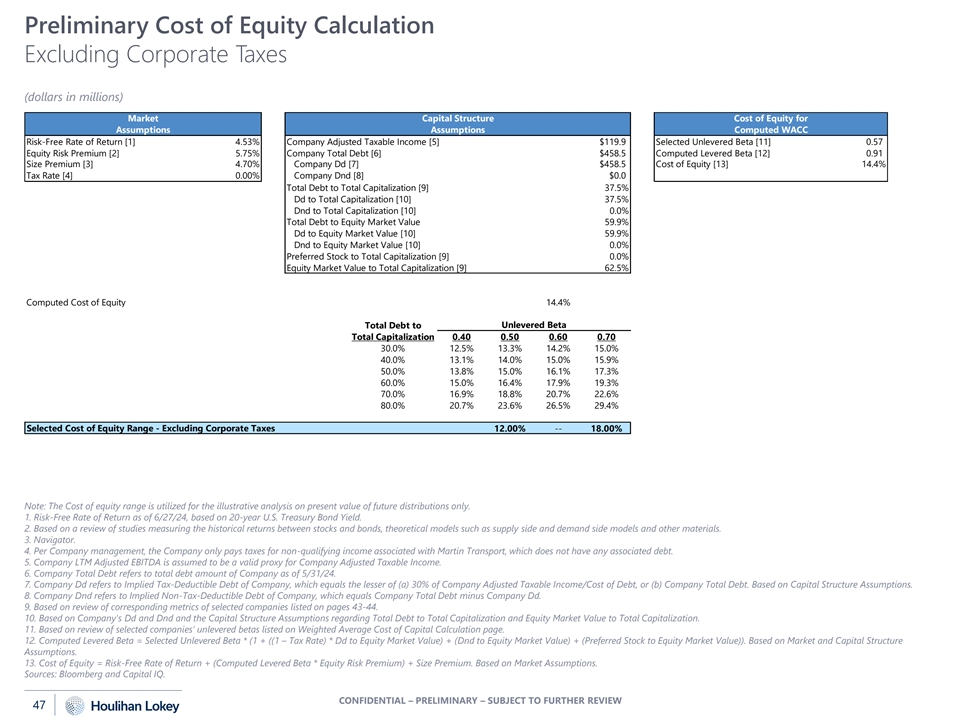
Preliminary Cost of Equity Calculation Excluding Corporate Taxes (dollars in millions) Market Capital Structure Cost of Equity for Assumptions Assumptions Computed WACC Risk-Free Rate of Return [1] 4.53% Company Adjusted Taxable Income [5] $119.9 Selected Unlevered Beta [11] 0.57 Equity Risk Premium [2] 5.75% Company Total Debt [6] $458.5 Computed Levered Beta [12] 0.91 Size Premium [3] 4.70% Company Dd [7] $458.5 Cost of Equity [13] 14.4% Tax Rate [4] 0.00% Company Dnd [8] $0.0 Total Debt to Total Capitalization [9] 37.5% Dd to Total Capitalization [10] 37.5% Dnd to Total Capitalization [10] 0.0% Total Debt to Equity Market Value 59.9% Dd to Equity Market Value [10] 59.9% Dnd to Equity Market Value [10] 0.0% Preferred Stock to Total Capitalization [9] 0.0% Equity Market Value to Total Capitalization [9] 62.5% Computed Cost of Equity 14.4% Unlevered Beta Total Debt to Total Capitalization 0.40 0.50 0.60 0.70 30.0% 12.5% 13.3% 14.2% 15.0% 40.0% 13.1% 14.0% 15.0% 15.9% 50.0% 13.8% 15.0% 16.1% 17.3% 60.0% 15.0% 16.4% 17.9% 19.3% 70.0% 16.9% 18.8% 20.7% 22.6% 80.0% 20.7% 23.6% 26.5% 29.4% Selected Cost of Equity Range - Excluding Corporate Taxes 12.00% -- 18.00% Note: The Cost of equity range is utilized for the illustrative analysis on present value of future distributions only. 1. Risk-Free Rate of Return as of 6/27/24, based on 20-year U.S. Treasury Bond Yield. 2. Based on a review of studies measuring the historical returns between stocks and bonds, theoretical models such as supply side and demand side models and other materials. 3. Navigator. 4. Per Company management, the Company only pays taxes for non-qualifying income associated with Martin Transport, which does not have any associated debt. 5. Company LTM Adjusted EBITDA is assumed to be a valid proxy for Company Adjusted Taxable Income. 6. Company Total Debt refers to total debt amount of Company as of 5/31/24. 7. Company Dd refers to Implied Tax-Deductible Debt of Company, which equals the lesser of (a) 30% of Company Adjusted Taxable Income/Cost of Debt, or (b) Company Total Debt. Based on Capital Structure Assumptions. 8. Company Dnd refers to Implied Non-Tax-Deductible Debt of Company, which equals Company Total Debt minus Company Dd. 9. Based on review of corresponding metrics of selected companies listed on pages 43-44. 10. Based on Company's Dd and Dnd and the Capital Structure Assumptions regarding Total Debt to Total Capitalization and Equity Market Value to Total Capitalization. 11. Based on review of selected companies’ unlevered betas listed on Weighted Average Cost of Capital Calculation page. 12. Computed Levered Beta = Selected Unlevered Beta * (1 + ((1 – Tax Rate) * Dd to Equity Market Value) + (Dnd to Equity Market Value) + (Preferred Stock to Equity Market Value)). Based on Market and Capital Structure Assumptions. 13. Cost of Equity = Risk-Free Rate of Return + (Computed Levered Beta * Equity Risk Premium) + Size Premium. Based on Market Assumptions. Sources: Bloomberg and Capital IQ. CONFIDENTIAL – PRELIMINARY – SUBJECT TO FURTHER REVIEW 47

Preliminary Cost of Equity Calculation (cont.) Including Corporate Taxes (dollars in millions) Market Capital Structure Cost of Equity for Assumptions Assumptions Computed WACC Risk-Free Rate of Return [1] 4.53% Company Adjusted Taxable Income [5] $119.9 Selected Unlevered Beta [11] 0.57 Equity Risk Premium [2] 5.75% Company Total Debt [6] $458.5 Computed Levered Beta [12] 0.84 Size Premium [3] 4.70% Company Dd [7] $458.5 Cost of Equity [13] 14.0% Tax Rate [4] 21.00% Company Dnd [8] $0.0 Total Debt to Total Capitalization [9] 37.5% Dd to Total Capitalization [10] 37.5% Dnd to Total Capitalization [10] 0.0% Total Debt to Equity Market Value 59.9% Dd to Equity Market Value [10] 59.9% Dnd to Equity Market Value [10] 0.0% Preferred Stock to Total Capitalization [9] 0.0% Equity Market Value to Total Capitalization [9] 62.5% Computed Cost of Equity 14.0% Unlevered Beta Total Debt to Total Capitalization 0.40 0.50 0.60 0.70 30.0% 12.3% 13.1% 13.8% 14.6% 40.0% 12.7% 13.6% 14.5% 15.4% 50.0% 13.3% 14.4% 15.4% 16.4% 60.0% 14.3% 15.5% 16.8% 18.0% 70.0% 15.8% 17.4% 19.0% 20.7% 80.0% 18.8% 21.2% 23.6% 26.0% Selected Cost of Equity Range - Including Corporate Taxes 12.00% -- 18.00% Note: The Cost of equity range is utilized for the illustrative analysis on present value of future distributions only. 1. Risk-Free Rate of Return as of 6/27/24, based on 20-year U.S. Treasury Bond Yield. 2. Based on a review of studies measuring the historical returns between stocks and bonds, theoretical models such as supply side and demand side models and other materials. 3. Navigator. 4. Corporate tax rate of 21.0% utilized for purpose of the analysis. 5. Company LTM Adjusted EBITDA is assumed to be a valid proxy for Company Adjusted Taxable Income. 6. Company Total Debt refers to total debt amount of Company as of 5/31/24. 7. Company Dd refers to Implied Tax-Deductible Debt of Company, which equals the lesser of (a) 30% of Company Adjusted Taxable Income/Cost of Debt, or (b) Company Total Debt. Based on Capital Structure Assumptions. 8. Company Dnd refers to Implied Non-Tax-Deductible Debt of Company, which equals Company Total Debt minus Company Dd. 9. Based on review of corresponding metrics of selected companies listed on pages 43-44. 10. Based on Company's Dd and Dnd and the Capital Structure Assumptions regarding Total Debt to Total Capitalization and Equity Market Value to Total Capitalization. 11. Based on review of selected companies’ unlevered betas listed on Weighted Average Cost of Capital Calculation page. 12. Computed Levered Beta = Selected Unlevered Beta * (1 + ((1 – Tax Rate) * Dd to Equity Market Value) + (Dnd to Equity Market Value) + (Preferred Stock to Equity Market Value)). Based on Market and Capital Structure Assumptions. 13. Cost of Equity = Risk-Free Rate of Return + (Computed Levered Beta * Equity Risk Premium) + Size Premium. Based on Market Assumptions. Sources: Bloomberg and Capital IQ. CONFIDENTIAL – PRELIMINARY – SUBJECT TO FURTHER REVIEW 48

APPENDIX Preliminary Selected Benchmarking Data 06 04 CONFIDENTIAL – PRELIMINARY – SUBJECT TO FURTHER REVIEW

Preliminary Selected Benchmarking Data LTM Adjusted EBITDA 0 0 0 0 0 0 0 0 0 0 0 0 0 0 (dollars in millions) $756.4 $740.4 $610.1 Median: $512.9 $415.8 $393.5 $385.5 $304.6 Median: $258.3 $258.3 $219.4 $153.7 $119.9 $81.9 $75.2 $29.3 Company [1] NMM GEL NGL TNP ASC AE DKL WKC RES SPH MTL OIS RNGR Enterprise Value [2] 0 0 0 0 0 0 0 0 0 0 0 0 0 0 (dollars in millions) $6,718.5 $4,390.2 $3,479.9 $3,164.5 Median: $2,680.2 $2,196.0 $2,427.5 $2,128.0 Median: $1,337.4 $1,337.4 $1,146.1 $1,015.9 $581.3 $400.0 $245.3 $82.4 Company [3] GEL NGL NMM TNP ASC AE DKL SPH WKC MTL RES OIS RNGR Tier 1 Tier 2 Note: No company shown for comparative purposes is identical to the Company. 1. LTM Adjusted EBITDA shown proforma for the Company's exit from the Butane optimization business. 2. Based on public trading prices of common stock as of 6/27/24, plus debt and general partner units, if any. 3. Represents figures as of 5/23/24, the last full day of trading prior to the announcement of the Offer. AE refers to Adams Resources & Energy, Inc., ASC refers to Ardmore Shipping Corporation, DKL Delek Logistics Partners, LP, GEL refers to Genesis Energy, L.P., MTL Mullen Group Ltd., NMM refers to Navios Maritime Partners L.P., NGL refers to NGL Energy Partners LP, OIS refers to Oil States International, Inc., RNGR refers to Ranger Energy Services, Inc., RES refers to RPC, Inc., SPH refers to Suburban Propane Partners, L.P., TNP refers to Tsakos Energy Navigation Limited, and WKC refers to World Kinect Corporation. Adjusted EBITDA refers to Earnings Before Interest, Taxes, Depreciation and Amortization, adjusted for certain non-recurring items; LTM refers to Latest 12 Months. Sources: Bloomberg, Capital IQ, Company management and public filings. CONFIDENTIAL – PRELIMINARY – SUBJECT TO FURTHER REVIEW 50
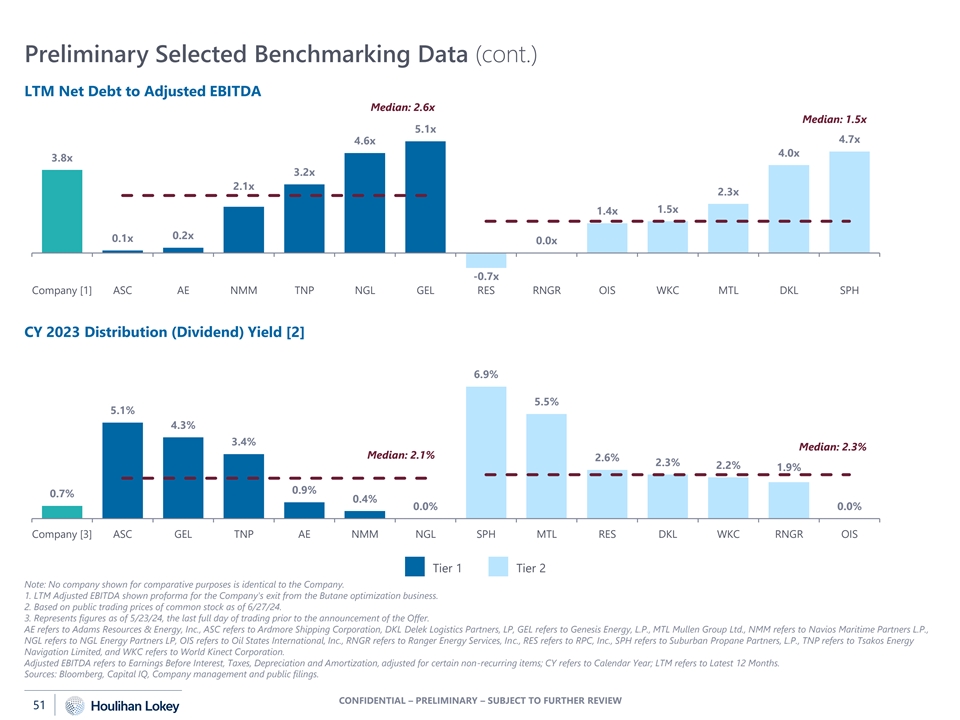
Preliminary Selected Benchmarking Data (cont.) LTM Net Debt to Adjusted EBITDA Median: 2.6x 0 0 0 0 0 0 0 0 0 0 0 0 0 0 Median: 1.5x 5.1x 4.7x 4.6x 4.0x 3.8x 3.2x 2.1x 2.3x 1.5x 1.4x 0.2x 0.1x 0.0x -0.7x Company [1] ASC AE NMM TNP NGL GEL RES RNGR OIS WKC MTL DKL SPH CY 2023 Distribution (Dividend) Yield [2] 0 0 0 0 0 0 0 0 0 0 0 0 0 0 6.9% 5.5% 5.1% 4.3% 3.4% Median: 2.3% Median: 2.1% 2.6% 2.3% 2.2% 1.9% 0.9% 0.7% 0.4% 0.0% 0.0% Company [3] ASC GEL TNP AE NMM NGL SPH MTL RES DKL WKC RNGR OIS Tier 1 Tier 2 Note: No company shown for comparative purposes is identical to the Company. 1. LTM Adjusted EBITDA shown proforma for the Company's exit from the Butane optimization business. 2. Based on public trading prices of common stock as of 6/27/24. 3. Represents figures as of 5/23/24, the last full day of trading prior to the announcement of the Offer. AE refers to Adams Resources & Energy, Inc., ASC refers to Ardmore Shipping Corporation, DKL Delek Logistics Partners, LP, GEL refers to Genesis Energy, L.P., MTL Mullen Group Ltd., NMM refers to Navios Maritime Partners L.P., NGL refers to NGL Energy Partners LP, OIS refers to Oil States International, Inc., RNGR refers to Ranger Energy Services, Inc., RES refers to RPC, Inc., SPH refers to Suburban Propane Partners, L.P., TNP refers to Tsakos Energy Navigation Limited, and WKC refers to World Kinect Corporation. Adjusted EBITDA refers to Earnings Before Interest, Taxes, Depreciation and Amortization, adjusted for certain non-recurring items; CY refers to Calendar Year; LTM refers to Latest 12 Months. Sources: Bloomberg, Capital IQ, Company management and public filings. CONFIDENTIAL – PRELIMINARY – SUBJECT TO FURTHER REVIEW 51

Preliminary Selected Benchmarking Data (cont.) Projected CY 2023 to CY 2024E Distribution (Dividend) Growth 0 0 0 0 0 0 0 0 0 0 0 0 0 0 19.1% 16.5% 11.3% Median: 5.7% Median: 0.6% 1.1% 0.0% 0.0% 0.0% NA NA 0.0% 0.0% NA NA NMF Company TNP ASC GEL NMM AE NGL WKC MTL RES SPH OIS RNGR DKL Projected CY 2024E to CY 2025E Distribution (Dividend) Growth 0 0 0 0 0 0 0 0 0 0 0 0 0 0 6.4% 5.8% 3.8% Median: 2.7% 2.7% Median: 0.7% 1.3% NA NA 0.0% 0.0% 0.0% 0.0% NA NA -5.6% Company GEL ASC NMM TNP AE NGL WKC DKL MTL RES SPH OIS RNGR Tier 1 Tier 2 Note: No company shown for comparative purposes is identical to the Company. AE refers to Adams Resources & Energy, Inc., ASC refers to Ardmore Shipping Corporation, DKL Delek Logistics Partners, LP, GEL refers to Genesis Energy, L.P., MTL Mullen Group Ltd., NMM refers to Navios Maritime Partners L.P., NGL refers to NGL Energy Partners LP, OIS refers to Oil States International, Inc., RNGR refers to Ranger Energy Services, Inc., RES refers to RPC, Inc., SPH refers to Suburban Propane Partners, L.P., TNP refers to Tsakos Energy Navigation Limited, and WKC refers to World Kinect Corporation. CY refers to Calendar Year. E refers to Estimated. NA refers to Not Available. NMF refers to not meaningful figure. Sources: Bloomberg, Capital IQ, Company management and public filings. CONFIDENTIAL – PRELIMINARY – SUBJECT TO FURTHER REVIEW 52
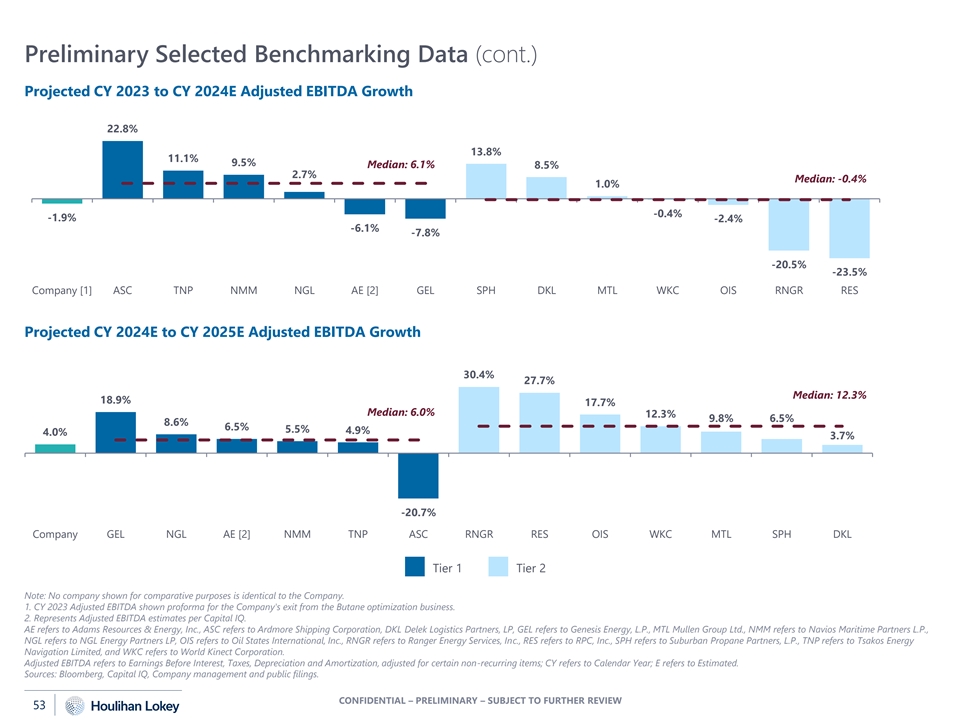
Preliminary Selected Benchmarking Data (cont.) Projected CY 2023 to CY 2024E Adjusted EBITDA Growth 0 0 0 0 0 0 0 0 0 0 0 0 0 0 22.8% 13.8% 11.1% 9.5% Median: 6.1% 8.5% 2.7% Median: -0.4% 1.0% -0.4% -1.9% -2.4% -6.1% -7.8% -20.5% -23.5% Company [1] ASC TNP NMM NGL AE [2] GEL SPH DKL MTL WKC OIS RNGR RES Projected CY 2024E to CY 2025E Adjusted EBITDA Growth 0 0 0 0 0 0 0 0 0 0 0 0 0 0 30.4% 27.7% Median: 12.3% 18.9% 17.7% Median: 6.0% 12.3% 9.8% 6.5% 8.6% 6.5% 5.5% 4.9% 4.0% 3.7% -20.7% Company GEL NGL AE [2] NMM TNP ASC RNGR RES OIS WKC MTL SPH DKL Tier 1 Tier 2 Note: No company shown for comparative purposes is identical to the Company. 1. CY 2023 Adjusted EBITDA shown proforma for the Company's exit from the Butane optimization business. 2. Represents Adjusted EBITDA estimates per Capital IQ. AE refers to Adams Resources & Energy, Inc., ASC refers to Ardmore Shipping Corporation, DKL Delek Logistics Partners, LP, GEL refers to Genesis Energy, L.P., MTL Mullen Group Ltd., NMM refers to Navios Maritime Partners L.P., NGL refers to NGL Energy Partners LP, OIS refers to Oil States International, Inc., RNGR refers to Ranger Energy Services, Inc., RES refers to RPC, Inc., SPH refers to Suburban Propane Partners, L.P., TNP refers to Tsakos Energy Navigation Limited, and WKC refers to World Kinect Corporation. Adjusted EBITDA refers to Earnings Before Interest, Taxes, Depreciation and Amortization, adjusted for certain non-recurring items; CY refers to Calendar Year; E refers to Estimated. Sources: Bloomberg, Capital IQ, Company management and public filings. CONFIDENTIAL – PRELIMINARY – SUBJECT TO FURTHER REVIEW 53

Preliminary Selected Benchmarking Data (cont.) Projected CY 2025E to CY 2026E Adjusted EBITDA Growth 0 0 0 0 0 0 0 0 0 0 0 0 0 0 Median: 3.8% 9.7% 8.6% 8.8% Median: 0.4% 4.1% 3.5% NA NA 2.7% NA NA NA -0.1% -7.8% -22.5% Company TNP GEL NMM ASC NGL AE WKC MTL SPH DKL RES RNGR OIS CY 2023 Adjusted EBITDA to CY 2023 Revenue 0 0 0 0 0 0 0 0 0 0 0 0 0 0 57.2% 52.9% 40.3% Median: 32.0% 37.7% Median: 15.7% 23.1% 23.8% 18.6% 15.7% 14.1% 11.2% 13.3% 8.5% 1.0% 0.8% Company [1] NMM TNP ASC GEL NGL AE DKL RES SPH MTL RNGR OIS WKC Tier 1 Tier 2 Note: No company shown for comparative purposes is identical to the Company. 1. CY 2023 Adjusted EBITDA shown proforma for the Company's exit from the Butane optimization business. AE refers to Adams Resources & Energy, Inc., ASC refers to Ardmore Shipping Corporation, DKL Delek Logistics Partners, LP, GEL refers to Genesis Energy, L.P., MTL Mullen Group Ltd., NMM refers to Navios Maritime Partners L.P., NGL refers to NGL Energy Partners LP, OIS refers to Oil States International, Inc., RNGR refers to Ranger Energy Services, Inc., RES refers to RPC, Inc., SPH refers to Suburban Propane Partners, L.P., TNP refers to Tsakos Energy Navigation Limited, and WKC refers to World Kinect Corporation. Adjusted EBITDA refers to Earnings Before Interest, Taxes, Depreciation and Amortization, adjusted for certain non-recurring items; CY refers to Calendar Year; E refers to Estimated. Sources: Bloomberg, Capital IQ, Company management and public filings. CONFIDENTIAL – PRELIMINARY – SUBJECT TO FURTHER REVIEW 54
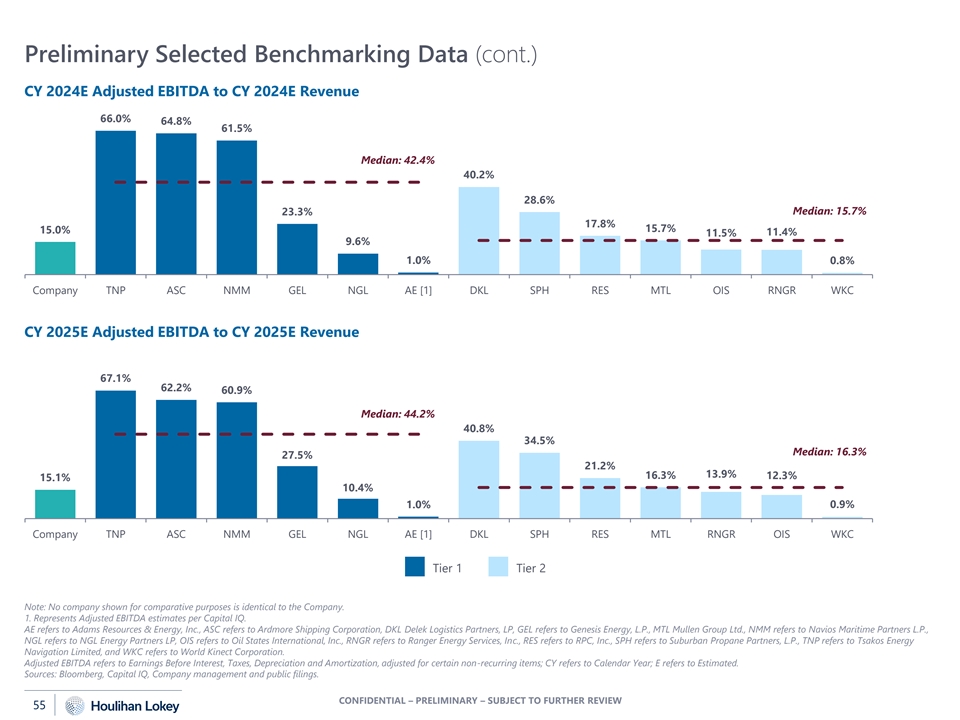
Preliminary Selected Benchmarking Data (cont.) CY 2024E Adjusted EBITDA to CY 2024E Revenue 0 0 0 0 0 0 0 0 0 0 0 0 0 0 66.0% 64.8% 61.5% Median: 42.4% 40.2% 28.6% Median: 15.7% 23.3% 17.8% 15.7% 15.0% 11.4% 11.5% 9.6% 1.0% 0.8% Company TNP ASC NMM GEL NGL AE [1] DKL SPH RES MTL OIS RNGR WKC CY 2025E Adjusted EBITDA to CY 2025E Revenue 0 0 0 0 0 0 0 0 0 0 0 0 0 0 67.1% 62.2% 60.9% Median: 44.2% 40.8% 34.5% Median: 16.3% 27.5% 21.2% 13.9% 16.3% 12.3% 15.1% 10.4% 1.0% 0.9% Company TNP ASC NMM GEL NGL AE [1] DKL SPH RES MTL RNGR OIS WKC Tier 1 Tier 2 Note: No company shown for comparative purposes is identical to the Company. 1. Represents Adjusted EBITDA estimates per Capital IQ. AE refers to Adams Resources & Energy, Inc., ASC refers to Ardmore Shipping Corporation, DKL Delek Logistics Partners, LP, GEL refers to Genesis Energy, L.P., MTL Mullen Group Ltd., NMM refers to Navios Maritime Partners L.P., NGL refers to NGL Energy Partners LP, OIS refers to Oil States International, Inc., RNGR refers to Ranger Energy Services, Inc., RES refers to RPC, Inc., SPH refers to Suburban Propane Partners, L.P., TNP refers to Tsakos Energy Navigation Limited, and WKC refers to World Kinect Corporation. Adjusted EBITDA refers to Earnings Before Interest, Taxes, Depreciation and Amortization, adjusted for certain non-recurring items; CY refers to Calendar Year; E refers to Estimated. Sources: Bloomberg, Capital IQ, Company management and public filings. CONFIDENTIAL – PRELIMINARY – SUBJECT TO FURTHER REVIEW 55
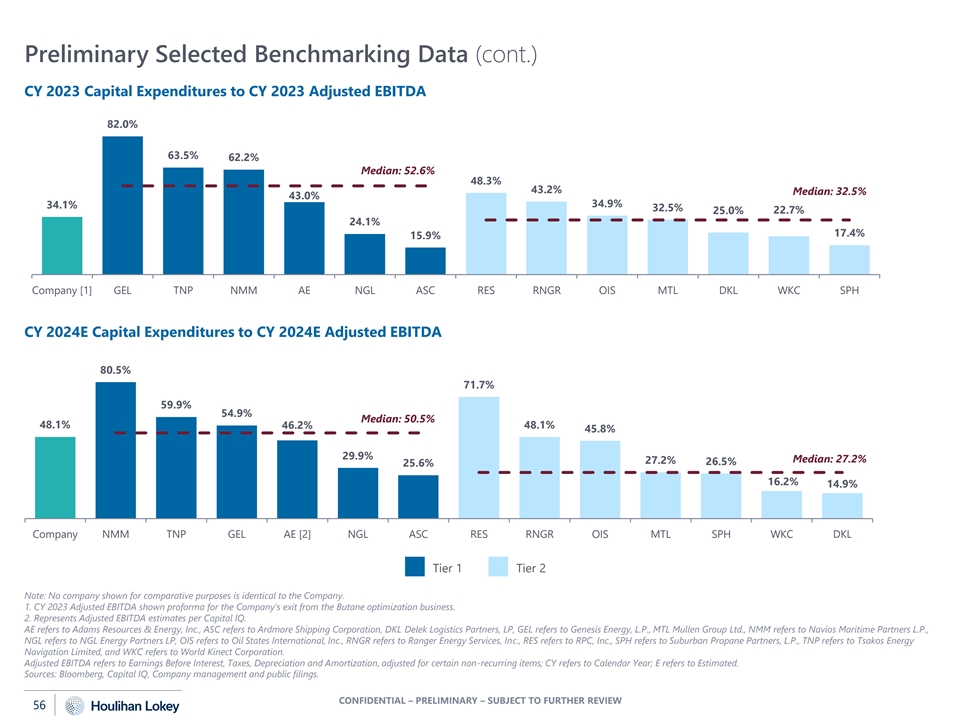
Preliminary Selected Benchmarking Data (cont.) CY 2023 Capital Expenditures to CY 2023 Adjusted EBITDA 0 0 0 0 0 0 0 0 0 0 0 0 0 0 82.0% 63.5% 62.2% Median: 52.6% 48.3% 43.2% Median: 32.5% 43.0% 34.9% 34.1% 32.5% 22.7% 25.0% 24.1% 17.4% 15.9% Company [1] GEL TNP NMM AE NGL ASC RES RNGR OIS MTL DKL WKC SPH CY 2024E Capital Expenditures to CY 2024E Adjusted EBITDA 0 0 0 0 0 0 0 0 0 0 0 0 0 0 80.5% 71.7% 59.9% 54.9% Median: 50.5% 48.1% 46.2% 48.1% 45.8% 29.9% Median: 27.2% 27.2% 26.5% 25.6% 16.2% 14.9% Company NMM TNP GEL AE [2] NGL ASC RES RNGR OIS MTL SPH WKC DKL Tier 1 Tier 2 Note: No company shown for comparative purposes is identical to the Company. 1. CY 2023 Adjusted EBITDA shown proforma for the Company's exit from the Butane optimization business. 2. Represents Adjusted EBITDA estimates per Capital IQ. AE refers to Adams Resources & Energy, Inc., ASC refers to Ardmore Shipping Corporation, DKL Delek Logistics Partners, LP, GEL refers to Genesis Energy, L.P., MTL Mullen Group Ltd., NMM refers to Navios Maritime Partners L.P., NGL refers to NGL Energy Partners LP, OIS refers to Oil States International, Inc., RNGR refers to Ranger Energy Services, Inc., RES refers to RPC, Inc., SPH refers to Suburban Propane Partners, L.P., TNP refers to Tsakos Energy Navigation Limited, and WKC refers to World Kinect Corporation. Adjusted EBITDA refers to Earnings Before Interest, Taxes, Depreciation and Amortization, adjusted for certain non-recurring items; CY refers to Calendar Year; E refers to Estimated. Sources: Bloomberg, Capital IQ, Company management and public filings. CONFIDENTIAL – PRELIMINARY – SUBJECT TO FURTHER REVIEW 56
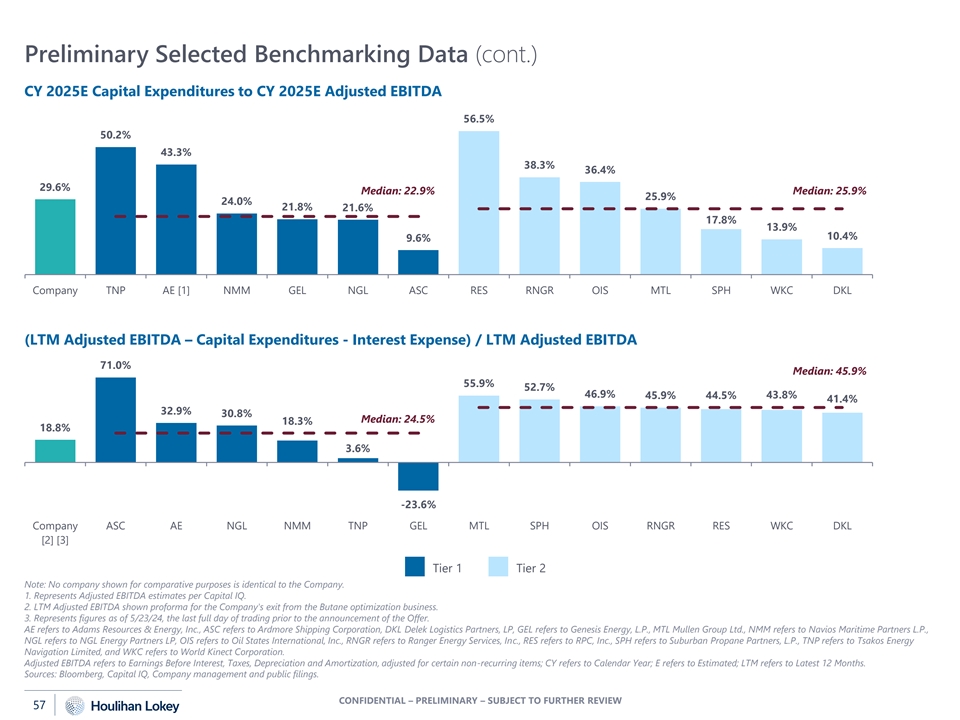
Preliminary Selected Benchmarking Data (cont.) CY 2025E Capital Expenditures to CY 2025E Adjusted EBITDA 0 0 0 0 0 0 0 0 0 0 0 0 0 0 56.5% 50.2% 43.3% 38.3% 36.4% 29.6% Median: 22.9% Median: 25.9% 25.9% 24.0% 21.8% 21.6% 17.8% 13.9% 10.4% 9.6% Company TNP AE [1] NMM GEL NGL ASC RES RNGR OIS MTL SPH WKC DKL (LTM Adjusted EBITDA – Capital Expenditures - Interest Expense) / LTM Adjusted EBITDA 0 0 0 0 0 0 0 0 0 0 0 0 0 0 71.0% Median: 45.9% 55.9% 52.7% 46.9% 45.9% 44.5% 43.8% 41.4% 32.9% 30.8% Median: 24.5% 18.3% 18.8% 3.6% -23.6% Company ASC AE NGL NMM TNP GEL MTL SPH OIS RNGR RES WKC DKL [2] [3] Tier 1 Tier 2 Note: No company shown for comparative purposes is identical to the Company. 1. Represents Adjusted EBITDA estimates per Capital IQ. 2. LTM Adjusted EBITDA shown proforma for the Company's exit from the Butane optimization business. 3. Represents figures as of 5/23/24, the last full day of trading prior to the announcement of the Offer. AE refers to Adams Resources & Energy, Inc., ASC refers to Ardmore Shipping Corporation, DKL Delek Logistics Partners, LP, GEL refers to Genesis Energy, L.P., MTL Mullen Group Ltd., NMM refers to Navios Maritime Partners L.P., NGL refers to NGL Energy Partners LP, OIS refers to Oil States International, Inc., RNGR refers to Ranger Energy Services, Inc., RES refers to RPC, Inc., SPH refers to Suburban Propane Partners, L.P., TNP refers to Tsakos Energy Navigation Limited, and WKC refers to World Kinect Corporation. Adjusted EBITDA refers to Earnings Before Interest, Taxes, Depreciation and Amortization, adjusted for certain non-recurring items; CY refers to Calendar Year; E refers to Estimated; LTM refers to Latest 12 Months. Sources: Bloomberg, Capital IQ, Company management and public filings. CONFIDENTIAL – PRELIMINARY – SUBJECT TO FURTHER REVIEW 57

DISCLAIMER 07 05 CONFIDENTIAL – PRELIMINARY – SUBJECT TO FURTHER REVIEW

Disclaimer This presentation, and any supplemental information (written or oral) or other documents provided in connection therewith (collectively, the “materials”), have been developed by and are proprietary of Houlihan Lokey and are provided solely for the information of the Conflicts Committee (the “Committee”) of the Board of Directors (the “Board”) of Martin Midstream GP LLC (the “Company”), to whom such materials are directly addressed and delivered by Houlihan Lokey in connection with the Committee’s consideration of a potential transaction (the “Transaction”) involving the Company. This presentation is incomplete without reference to, and should be considered in conjunction with, any supplemental information provided by and discussions with Houlihan Lokey in connection therewith. Any defined terms used herein shall have the meanings set forth herein, even if such defined terms have been given different meanings elsewhere in the materials. The materials are for discussion purposes only. Houlihan Lokey expressly disclaims any and all liability, whether direct or indirect, in contract or tort or otherwise, to any person in connection with the materials. The materials were prepared for specific persons familiar with the business and affairs of the Company for use in a specific context and were not prepared with a view to public disclosure or to conform with any disclosure standards under any state, federal or international securities laws or other laws, rules or regulations, and none of the Committee, the Company or Houlihan Lokey takes any responsibility for the use of the materials by persons other than the Committee. The materials are provided on a confidential basis solely for the information of the Committee and may not be disclosed, summarized, reproduced, disseminated or quoted or otherwise referred to, in whole or in part, without Houlihan Lokey’s express prior written consent. The materials may not be relied upon by any other person or for any purpose other than as specifically contemplated by a written agreement with Houlihan Lokey. Notwithstanding any other provision herein, the Company (and each employee, representative or other agent of the Company) may disclose to any and all persons without limitation of any kind, the tax treatment and tax structure of any transaction and all materials of any kind (including opinions or other tax analyses, if any) that are provided to the Company relating to such tax treatment and structure. However, any information relating to the tax treatment and tax structure shall remain confidential (and the foregoing sentence shall not apply) to the extent necessary to enable any person to comply with securities laws. For this purpose, the tax treatment of a transaction is the purported or claimed U.S. income or franchise tax treatment of the transaction and the tax structure of a transaction is any fact that may be relevant to understanding the purported or claimed U.S. income or franchise tax treatment of the transaction. If the Company plans to disclose information pursuant to the first sentence of this paragraph, the Company shall inform those to whom it discloses any such information that they may not rely upon such information for any purpose without Houlihan Lokey’s prior written consent. Houlihan Lokey is not an expert on, and nothing contained in the materials should be construed as advice with regard to, legal, accounting, regulatory, insurance, tax or other specialist matters. Houlihan Lokey’s role in reviewing any information was limited solely to performing such a review as it deemed necessary to support its own advice and analysis and was not on behalf of the Committee. The materials necessarily are based on financial, economic, market and other conditions as in effect on, and the information available to Houlihan Lokey as of, the date of the materials. Although subsequent developments may affect the contents of the materials, Houlihan Lokey has not undertaken, and is under no obligation, to update, revise or reaffirm the materials, except as may be expressly contemplated by Houlihan Lokey’s engagement letter. The materials are not intended to provide the sole basis for evaluation of the Transaction and do not purport to contain all information that may be required. The materials do not address the underlying business decision of the Company or any other party to proceed with or effect the Transaction, or the relative merits of the Transaction as compared to any alternative business strategies or transactions that might be available for the Company or any other party. The materials do not constitute any opinion, nor do the materials constitute a recommendation to the Board, the Committee, the Company, any security holder of the Company or any other party as to how to vote or act with respect to any matter relating to the Transaction or otherwise or whether to buy or sell any assets or securities of any company. Houlihan Lokey’s only opinion is the opinion, if any, that is actually delivered to the Committee. In preparing the materials Houlihan Lokey has acted as an independent contractor and nothing in the materials is intended to create or shall be construed as creating a fiduciary or other relationship between Houlihan Lokey and any party. The materials may not reflect information known to other professionals in other business areas of Houlihan Lokey and its affiliates. The preparation of the materials was a complex process involving quantitative and qualitative judgments and determinations with respect to the financial, comparative and other analytic methods employed and the adaption and application of these methods to the unique facts and circumstances presented and, therefore, is not readily susceptible to partial analysis or summary description. Furthermore, Houlihan Lokey did not attribute any particular weight to any analysis or factor considered by it, but rather made qualitative judgments as to the significance and relevance of each analysis and factor. Each analytical technique has inherent strengths and weaknesses, and the nature of the available information may further affect the value of particular techniques. Accordingly, the analyses contained in the materials must be considered as a whole. Selecting portions of the analyses, analytic methods and factors without considering all analyses and factors could create a misleading or incomplete view. The materials reflect judgments and assumptions with regard to industry performance, general business, economic, regulatory, market and financial conditions and other matters, many of which are beyond the control of the participants in the Transaction. Any estimates of value contained in the materials are not necessarily indicative of actual value or predictive of future results or values, which may be significantly more or less favorable. Any analyses relating to the value of assets, businesses or securities do not purport to be appraisals or to reflect the prices at which any assets, businesses or securities may actually be sold. The materials do not constitute a valuation opinion or credit rating. In preparing the materials, Houlihan Lokey has not conducted any physical inspection or independent appraisal or evaluation of any of the assets, properties or liabilities (contingent or otherwise) of the Company or any other party and has no obligation to evaluate the solvency of the Company or any other party under any law. CONFIDENTIAL – PRELIMINARY – SUBJECT TO FURTHER REVIEW

Disclaimer All budgets, projections, estimates, financial analyses, reports and other information with respect to operations (including, without limitation, estimates of potential cost savings and synergies) reflected in the materials have been prepared by management of the relevant party or are derived from such budgets, projections, estimates, financial analyses, reports and other information or from other sources, which involve numerous and significant subjective determinations made by management of the relevant party and/or which such management has reviewed and found reasonable. The budgets, projections and estimates (including, without limitation, estimates of potential cost savings and synergies) contained in the materials may or may not be achieved and differences between projected results and those actually achieved may be material. Houlihan Lokey has relied upon representations made by management of the Company and other participants in the Transaction that such budgets, projections and estimates have been reasonably prepared in good faith on bases reflecting the best currently available estimates and judgments of such management (or, with respect to information obtained from public sources, represent reasonable estimates), and Houlihan Lokey expresses no opinion with respect to such budgets, projections or estimates or the assumptions on which they are based. The scope of the financial analysis contained herein is based on discussions with the Committee (including, without limitation, regarding the methodologies to be utilized), and Houlihan Lokey does not make any representation, express or implied, as to the sufficiency or adequacy of such financial analysis or the scope thereof for any particular purpose. Houlihan Lokey has assumed and relied upon the accuracy and completeness of the financial and other information provided to, discussed with or reviewed by it without (and without assuming responsibility for) independent verification of such information, makes no representation or warranty (express or implied) in respect of the accuracy or completeness of such information and has further relied upon the assurances of the Company and other participants in the Transaction that they are not aware of any facts or circumstances that would make such information inaccurate or misleading. In addition, Houlihan Lokey has relied upon and assumed, without independent verification, that there has been no change in the business, assets, liabilities, financial condition, results of operations, cash flows or prospects of the Company or any other participant in the Transaction since the respective dates of the most recent financial statements and other information, financial or otherwise, provided to, discussed with or reviewed by Houlihan Lokey that would be material to its analyses, and that the final forms of any draft documents reviewed by Houlihan Lokey will not differ in any material respect from such draft documents. The materials are not an offer to sell or a solicitation of an indication of interest to purchase any security, option, commodity, future, loan or currency. The materials do not constitute a commitment by Houlihan Lokey or any of its affiliates to underwrite, subscribe for or place any securities, to extend or arrange credit, or to provide any other services. In the ordinary course of business, certain of Houlihan Lokey’s affiliates and employees, as well as investment funds in which they may have financial interests or with which they may co-invest, may acquire, hold or sell, long or short positions, or trade or otherwise effect transactions, in debt, equity, and other securities and financial instruments (including loans and other obligations) of, or investments in, the Company, any Transaction counterparty, any other Transaction participant, any other financially interested party with respect to any transaction, other entities or parties that are mentioned in the materials, or any of the foregoing entities’ or parties’ respective affiliates, subsidiaries, investment funds, portfolio companies and representatives (collectively, the “Interested Parties”), or any currency or commodity that may be involved in the Transaction. Houlihan Lokey provides mergers and acquisitions, restructuring and other advisory and consulting services to clients, which may have in the past included, or may currently or in the future include, one or more Interested Parties, for which services Houlihan Lokey has received, and may receive, compensation. Although Houlihan Lokey in the course of such activities and relationships or otherwise may have acquired, or may in the future acquire, information about one or more Interested Parties or the Transaction, or that otherwise may be of interest to the Board, the Committee, or the Company, Houlihan Lokey shall have no obligation to, and may not be contractually permitted to, disclose such information, or the fact that Houlihan Lokey is in possession of such information, to the Board, the Committee, or the Company or to use such information on behalf of the Board, the Committee, or the Company. Houlihan Lokey’s personnel may make statements or provide advice that is contrary to information contained in the materials. CONFIDENTIAL – PRELIMINARY – SUBJECT TO FURTHER REVIEW

CORPORATE FINANCE FINANCIAL RESTRUCTURING FINANCIAL AND VALUATION ADVISORY HL.com