Exhibit (c)(12) Project Augusta Discussion Materials May 24, 2024
Executive Summary • Wells Fargo Securities, LLC (“WFS”) is pleased to provide the following materials to the Board of Directors (the “Board”) of Martin Resources Management Corporation (“MRMC”) regarding the potential buyout of the limited partnership units not owned by MRMC (84.3% of the total L.P. units) of Martin Midstream Partners L.P. (“MMLP” or the “Partnership”) • The total value of MMLP units to be purchased is $98.7 million based on closing price of $3.00 per MMLP unit as of 5/23/2024 • Consideration paid to MMLP unitholders would be all cash • The current price per MMLP unit represents a 3.0% premium to the 30-day VWAP ($2.91 per MMLP unit) and represents a 17.1% premium to the 90-trading day closing average ($2.56 per MMLP unit) • MRMC management expects to fund the transaction via an upsized ABL facility at the MRMC level, as well as a new Term Loan facility at the MRMC level • WFS and Regions Bank (“Regions”) have received “green light” internal approvals to fully underwrite the upsized ABL facility and new Term Loan, subject to acceptable definitive documentation and completion of satisfactory due diligence • MRMC Management is seeking Board approval for the initial offer • Submission of a proposal to MMLP will trigger the need to amend Schedule 13D filings for MRMC and Ruben Martin and disclose the offer letter as an attachment Source: FactSet 2
MRMC Strategic Rationale • The appeal of the Master Limited Partnership (“MLP”) structure has diminished with investors • MLPs are experiencing upward pressure to increase distributions / yields in order to stay competitive with interest rate sensitive securities • Additionally, Corporate tax rate cuts have reduced the key tax advantage that MLPs once had over Corporations • As a result, many MLPs have converted to Corporations or have been acquired or absorbed by their General Partner (approximately 35 MLPs today vs 124 in 2015) • MMLP’s relatively small Market Capitalization further limits institutional interest (MMLP has the smallest market capitalization of all remaining Midstream Energy MLPs) • This inadequate trading volume of MMLP Units has resulted in insufficient liquidity for investors, and MMLP Units continue to trade at a discount to peers even as financial results have improved • MMLP’s potential growth opportunities going forward are outside of MLP qualifying income sources 3
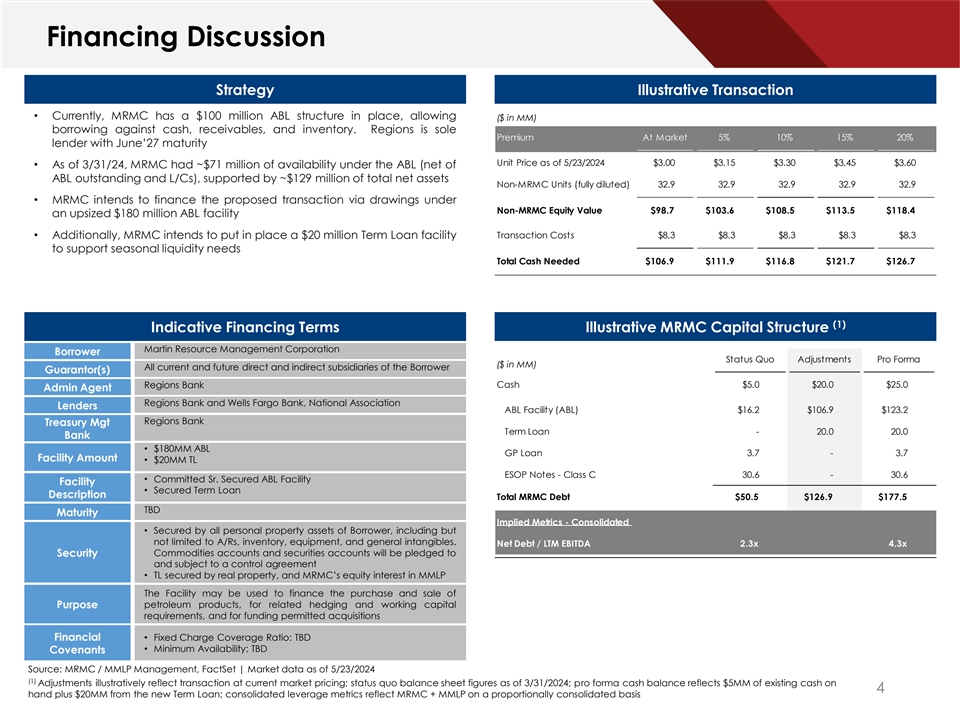
Financing Discussion Strategy Illustrative Transaction • Currently, MRMC has a $100 million ABL structure in place, allowing ($ in MM) borrowing against cash, receivables, and inventory. Regions is sole Premium At Market 5% 10% 15% 20% lender with June’27 maturity Unit Price as of 5/23/2024 $3.00 $3.15 $3.30 $3.45 $3.60 • As of 3/31/24, MRMC had ~$71 million of availability under the ABL (net of ABL outstanding and L/Cs), supported by ~$129 million of total net assets Non-MRMC Units (fully diluted) 32.9 32.9 32.9 32.9 32.9 • MRMC intends to finance the proposed transaction via drawings under Non-MRMC Equity Value $98.7 $103.6 $108.5 $113.5 $118.4 an upsized $180 million ABL facility • Additionally, MRMC intends to put in place a $20 million Term Loan facility Transaction Costs $8.3 $8.3 $8.3 $8.3 $8.3 to support seasonal liquidity needs Total Cash Needed $106.9 $111.9 $116.8 $121.7 $126.7 (1) Indicative Financing Terms Illustrative MRMC Capital Structure Martin Resource Management Corporation Borrower Status Quo Adjustments Pro Forma ($ in MM) All current and future direct and indirect subsidiaries of the Borrower Guarantor(s) Regions Bank Cash $5.0 $20.0 $25.0 Admin Agent Regions Bank and Wells Fargo Bank, National Association Lenders ABL Facility (ABL) $16.2 $106.9 $123.2 Regions Bank Treasury Mgt Term Loan - 20.0 20.0 Bank • $180MM ABL GP Loan 3.7 - 3.7 Facility Amount • $20MM TL ESOP Notes - Class C 30.6 - 30.6 • Committed Sr. Secured ABL Facility Facility • Secured Term Loan Description Total MRMC Debt $50.5 $126.9 $177.5 TBD Maturity Implied Metrics - Consolidated • Secured by all personal property assets of Borrower, including but not limited to A/Rs, inventory, equipment, and general intangibles. Net Debt / LTM EBITDA 2.3x 4.3x Commodities accounts and securities accounts will be pledged to Security and subject to a control agreement • TL secured by real property, and MRMC’s equity interest in MMLP The Facility may be used to finance the purchase and sale of Purpose petroleum products, for related hedging and working capital requirements, and for funding permitted acquisitions Financial • Fixed Charge Coverage Ratio: TBD • Minimum Availability: TBD Covenants Source: MRMC / MMLP Management, FactSet | Market data as of 5/23/2024 (1) Adjustments illustratively reflect transaction at current market pricing; status quo balance sheet figures as of 3/31/2024; pro forma cash balance reflects $5MM of existing cash on 4 hand plus $20MM from the new Term Loan; consolidated leverage metrics reflect MRMC + MMLP on a proportionally consolidated basis
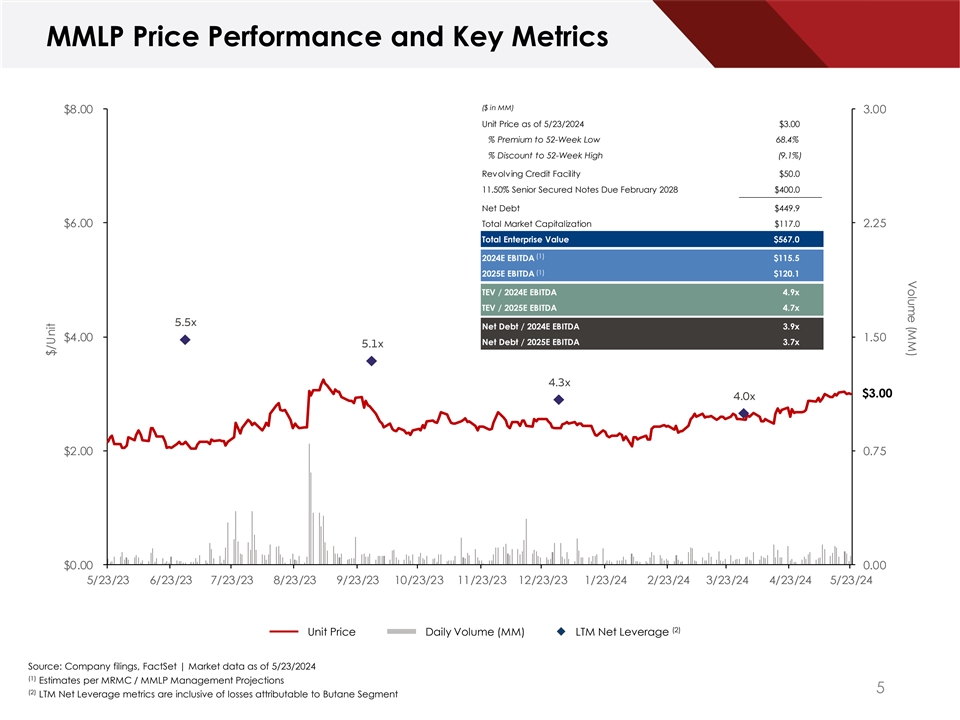
Volume (MM) MMLP Price Performance and Key Metrics ($ in MM) $8.00 3.00 Unit Price as of 5/23/2024 $3.00 % Premium to 52-Week Low 68.4% % Discount to 52-Week High (9.1%) Revolving Credit Facility $50.0 11.50% Senior Secured Notes Due February 2028 $400.0 Net Debt $449.9 Total Market Capitalization $117.0 $6.00 2.25 Total Enterprise Value $567.0 (1) 2024E EBITDA $115.5 (1) 2025E EBITDA $120.1 TEV / 2024E EBITDA 4.9x TEV / 2025E EBITDA 4.7x 5.5x Net Debt / 2024E EBITDA 3.9x $4.00 1.50 Net Debt / 2025E EBITDA 3.7x 5.1x 4.3x $3.00 4.0x $2.00 0.75 $0.00 0.00 5/23/23 6/23/23 7/23/23 8/23/23 9/23/23 10/23/23 11/23/23 12/23/23 1/23/24 2/23/24 3/23/24 4/23/24 5/23/24 (2) Unit Price Daily Volume (MM) LTM Net Leverage Source: Company filings, FactSet | Market data as of 5/23/2024 (1) Estimates per MRMC / MMLP Management Projections 5 (2) LTM Net Leverage metrics are inclusive of losses attributable to Butane Segment $/Unit
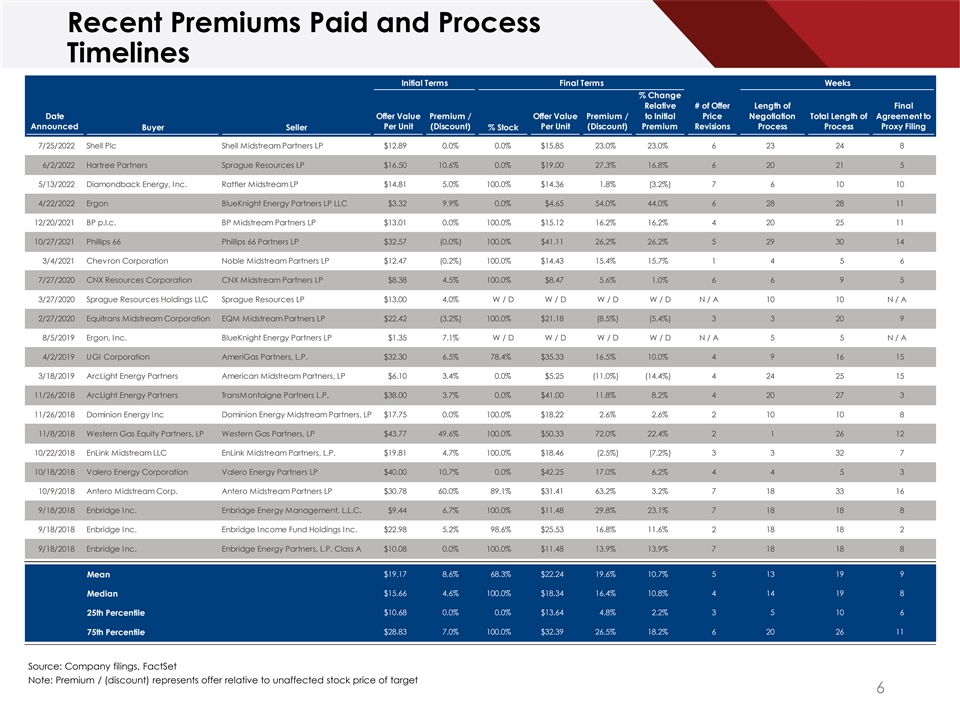
Recent Premiums Paid and Process Timelines Initial Terms Final Terms Weeks Diversified Specialty Services Midstream Business Strategically Located Along the Gulf Coast with % Change Relative # of Offer Length of Final Operations in Four Key Business Segments Date Offer Value Premium / Offer Value Premium / to Initial Price Negotiation Total Length of Agreement to Announced Per Unit (Discount) Per Unit (Discount) Premium Revisions Process Process Proxy Filing Buyer Seller % Stock 7/25/2022 Shell Plc Shell Midstream Partners LP $12.89 0.0% 0.0% $15.85 23.0% 23.0% 6 23 24 8 6/2/2022 Hartree Partners Sprague Resources LP $16.50 10.6% 0.0% $19.00 27.3% 16.8% 6 20 21 5 5/13/2022 Diamondback Energy, Inc. Rattler Midstream LP $14.81 5.0% 100.0% $14.36 1.8% (3.2%) 7 6 10 10 4/22/2022 Ergon BlueKnight Energy Partners LP LLC $3.32 9.9% 0.0% $4.65 54.0% 44.0% 6 28 28 11 12/20/2021 BP p.l.c. BP Midstream Partners LP $13.01 0.0% 100.0% $15.12 16.2% 16.2% 4 20 25 11 10/27/2021 Phillips 66 Phillips 66 Partners LP $32.57 (0.0%) 100.0% $41.11 26.2% 26.2% 5 29 30 14 3/4/2021 Chevron Corporation Noble Midstream Partners LP $12.47 (0.2%) 100.0% $14.43 15.4% 15.7% 1 4 5 6 7/27/2020 CNX Resources Corporation CNX Midstream Partners LP $8.38 4.5% 100.0% $8.47 5.6% 1.0% 6 6 9 5 3/27/2020 Sprague Resources Holdings LLC Sprague Resources LP $13.00 4.0% W / D W / D W / D W / D N / A 10 10 N / A 2/27/2020 Equitrans Midstream Corporation EQM Midstream Partners LP $22.42 (3.2%) 100.0% $21.18 (8.5%) (5.4%) 3 3 20 9 8/5/2019 Ergon, Inc. BlueKnight Energy Partners LP $1.35 7.1% W / D W / D W / D W / D N / A 5 5 N / A 4/2/2019 UGI Corporation AmeriGas Partners, L.P. $32.30 6.5% 78.4% $35.33 16.5% 10.0% 4 9 16 15 3/18/2019 ArcLight Energy Partners American Midstream Partners, LP $6.10 3.4% 0.0% $5.25 (11.0%) (14.4%) 4 24 25 15 11/26/2018 ArcLight Energy Partners TransMontaigne Partners L.P. $38.00 3.7% 0.0% $41.00 11.8% 8.2% 4 20 27 3 11/26/2018 Dominion Energy Inc Dominion Energy Midstream Partners, LP $17.75 0.0% 100.0% $18.22 2.6% 2.6% 2 10 10 8 11/8/2018 Western Gas Equity Partners, LP Western Gas Partners, LP $43.77 49.6% 100.0% $50.33 72.0% 22.4% 2 1 26 12 10/22/2018 EnLink Midstream LLC EnLink Midstream Partners, L.P. $19.81 4.7% 100.0% $18.46 (2.5%) (7.2%) 3 3 32 7 10/18/2018 Valero Energy Corporation Valero Energy Partners LP $40.00 10.7% 0.0% $42.25 17.0% 6.2% 4 4 5 3 10/9/2018 Antero Midstream Corp. Antero Midstream Partners LP $30.78 60.0% 89.1% $31.41 63.2% 3.2% 7 18 33 16 9/18/2018 Enbridge Inc. Enbridge Energy Management, L.L.C. $9.44 6.7% 100.0% $11.48 29.8% 23.1% 7 18 18 8 9/18/2018 Enbridge Inc. Enbridge Income Fund Holdings Inc. $22.98 5.2% 98.6% $25.53 16.8% 11.6% 2 18 18 2 9/18/2018 Enbridge Inc. Enbridge Energy Partners, L.P. Class A $10.08 0.0% 100.0% $11.48 13.9% 13.9% 7 18 18 8 Mean $19.17 8.6% 68.3% $22.24 19.6% 10.7% 5 13 19 9 $15.66 4.6% 100.0% $18.34 16.4% 10.8% 4 14 19 8 Median 25th Percentile $10.68 0.0% 0.0% $13.64 4.8% 2.2% 3 5 10 6 75th Percentile $28.83 7.0% 100.0% $32.39 26.5% 18.2% 6 20 26 11 Source: Company filings, FactSet Note: Premium / (discount) represents offer relative to unaffected stock price of target 6

Illustrative Transaction Timeline Illustrative Timeline for MMLP Take Private Transaction • Buyer determines preferred transaction structure and proposal terms and analyzes legal and tax considerations Preliminary • Target Board authorizes conflicts committee to consider proposal (when made) • Buyer submits letter to Target Board indicating its interest in transaction (“T”) and Sponsor amends its Schedule 13D • Target announces receipt of proposal from Buyer • MRMC and Ruben Martin file required amendments to Item 4 of Schedule 13D (1) Pre-Signing Period • Target conflicts committee engages independent legal and financial advisors T + 4-8 Weeks • Target conflicts committee and its advisors perform due diligence • Buyer submits draft merger agreement and support agreement to Target conflicts committee • Buyer negotiates agreements with Target conflicts committee • Buyer Board and Target conflicts committee review final draft agreements Definitive Agreement • Target conflicts committee receives fairness opinion Period • Buyer receives fairness opinion T + 8-10 Weeks• Board (upon recommendation of conflicts committee, in case of Target) of each party approves agreements • Merger agreement and support agreement executed T + 13-14 Weeks• Buyer and Target jointly file Schedule 13E-3 and Target files preliminary proxy statement concurrently • Target receives SEC comments or clearance/no review and files amendment to Schedule 13E-3 • SEC generally notifies within 10 days whether it will review the filing T + 15-16 Weeks • Once clear/no review, mail definitive proxy statement • If reviewed, add 2-6 weeks before mailing definitive proxy At least 30 days after • Unitholder meeting to approve merger mailing definitive • Close merger; file certificate of merger; and merger then becomes effective (2) proxy statement • Approximately 17-24 weeks Total Time from T Source: Baker Botts (1) Length of period prior to signing will vary, among other things, depending on the actions, including negotiating strategy and tactics, of the conflicts committee and its advisors. The period from date Buyer submits initial proposal to Target before execution of definitive agreements could range from a few weeks to two months or more. (2) Target’s Third Amended and Restated LP Agreement requires that notice of a meeting be given at least 10 days before the meeting and not more than 60 days. However, for 7 fundamental transactions like a merger, proxy solicitors generally recommend a period of 30 days or more to allow for solicitation of proxies. In addition, Rule 13e-3(f) of the Exchange Act requires a period of at least 20 days from delivery of the proxy materials before a vote can be taken.

Updates to Board Materials • The materials include the following updates from the materials presented to the Board on April 25, 2024: • An overview of the updated financing strategy and indicative financing terms • The financing strategy herein reflects the currently contemplated financing structure, which includes an upsized $180 million ABL facility and a $20 million Term Loan facility • The ABL facility and Term Loan facility will be at the MRMC level • Market data have been updated to reflect pricing as of May 23, 2024 • The MMLP fully diluted units outstanding has been updated to reflect the additional 86,280 of Restricted Units that were issued in Q1 2024; this increases the total MMLP fully diluted units outstanding from 38,914,806 to 39,001,086 • In the analysis of recent premiums paid and process timelines, the ‘Final Terms Premium / (Discount)’ figures have been revised to reflect the final offer relative to the unaffected stock price of the target • In the prior version of the materials, the ‘Final Terms Premium / (Discount)’ figures reflected a percentage relative to the stock price of the target immediately prior to the final offer 8

Appendix 9
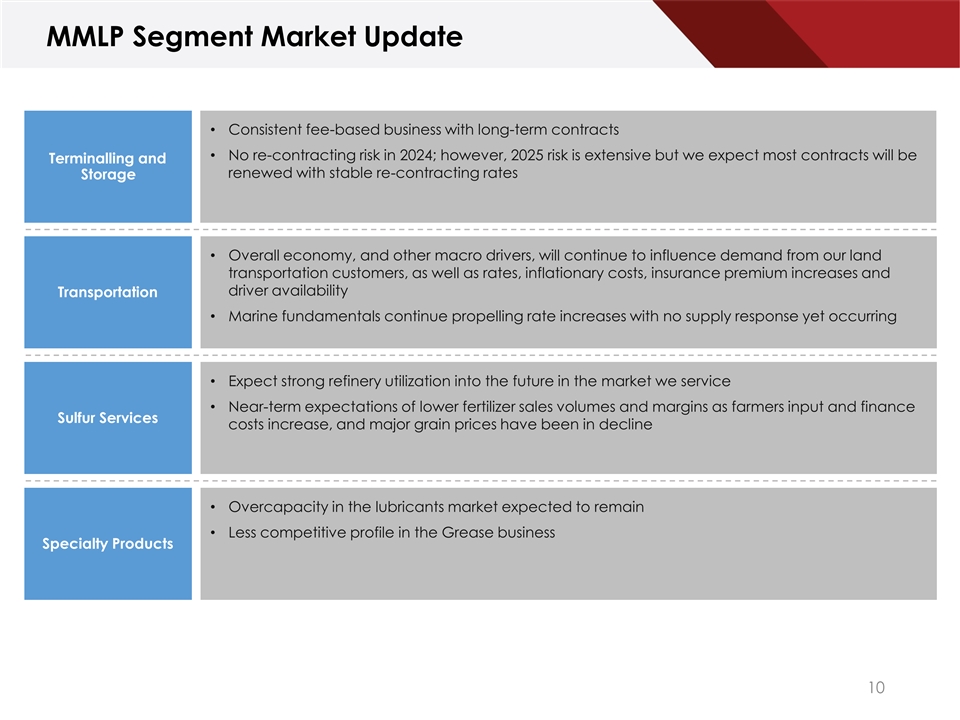
MMLP Segment Market Update • Consistent fee-based business with long-term contracts • No re-contracting risk in 2024; however, 2025 risk is extensive but we expect most contracts will be Terminalling and renewed with stable re-contracting rates Storage • Overall economy, and other macro drivers, will continue to influence demand from our land transportation customers, as well as rates, inflationary costs, insurance premium increases and driver availability Transportation • Marine fundamentals continue propelling rate increases with no supply response yet occurring • Expect strong refinery utilization into the future in the market we service • Near-term expectations of lower fertilizer sales volumes and margins as farmers input and finance Sulfur Services costs increase, and major grain prices have been in decline • Overcapacity in the lubricants market expected to remain • Less competitive profile in the Grease business Specialty Products 10

MMLP Units Traded Analysis | (% of Total Volume) 3 Months 6 Months 3 Month Summary Statistics 6 Month S 3u M mma onthry Statistics 6 Month 100% Total Volume (MM) 3.436 100% Total Volume (MM) 7.329 % Float 12.2% % Float 26.0% Avg. Daily Trading Volume (MM) 0.054 Avg. Daily Trading Volume (MM) 0.058 Mean $2.67 Mean $2.54 VWAP $2.71 VWAP $2.56 75% 75% 55.1% 50% 50% 40.0% 39.4% 29.1% 25% 25% 13.6% 11.2% 4.6% 4.8% 2.2% 0.0% 0.0% 0.0% 0% 0% $2.00 - $2.25 $2.25 - $2.50 $2.50 - $2.75 $2.75 - $3.00 $3.00 - $3.25 $3.25 - $3.50 $2.00 - $2.25 $2.25 - $2.50 $2.50 - $2.75 $2.75 - $3.00 $3.00 - $3.25 $3.25 - $3.50 12 Months 18 Months 12 Month Summary Statistics 18 Month 1S 2u M mma onthry Statistics 18 Month 100% 100% Total Volume (MM) 17.533 Total Volume (MM) 23.731 % Float 62.3% % Float 84.3% Avg. Daily Trading Volume (MM) 0.069 Avg. Daily Trading Volume (MM) 0.063 Mean $2.50 Mean $2.60 75% 75% VWAP $2.59 VWAP $2.66 50% 50% 36.2% 26.7% 23.5% 25% 25% 17.4% 15.3% 13.1% 11.9% 11.3% 9.7% 8.8% 0.0% 0.0% 0% 0% $2.00 - $2.25 $2.25 - $2.50 $2.50 - $2.75 $2.75 - $3.00 $3.00 - $3.25 $3.25 - $3.50 $2.00 - $2.25 $2.25 - $2.50 $2.50 - $2.75 $2.75 - $3.00 $3.00 - $3.25 $3.25 - $3.50 11 Source: Company filings, FactSet | Market data as of 5/23/2024

MMLP Projected Financial Summary (1) EBITDA ($MM) Distributable Cash Flow ($MM) Transportation Services Terminalling & Storage Sulfur Services Specialty Products Unallocated SG&A $62.5 $120.1 $119.9 $119.1 $118.1 $115.5 $23.0 $22.8 $22.7 $22.5 $22.1 $42.0 $38.2 $35.1 $27.5 $35.0 $36.1 $36.5 $36.8 $37.3 $20.5 $37.7 $38.1 $38.7 $39.9 $44.4 $40.9 $39.6 $37.1 $36.5 2024 2025 2026 2027 2028 ($16.8) ($15.9) ($16.6) ($16.8) ($16.7) 2024 2025 2026 2027 2028 (1) (2) Capital Expenditures ($MM) Free Cash Flow Before Debt Repayment ($MM) Growth Capex Maintenance Capex $55.5 $48.0 $41.6 $21.6 $38.6 $37.5 $35.5 $32.6 $10.8 $29.7 $5.9 $12.6 $15.1 $24.7 $33.9 $30.8 $29.6 $24.9 $23.5 $0.6 2024 2025 2026 2027 2028 2024 2025 2026 2027 2028 Source: MRMC / MMLP Management 12 (1) Analysis assumes 11.5% Senior Notes due 2027 are refinanced at maturity at illustrative interest rate of 8.5% (2) Calculated as DCF less Growth Capex, plus Proceeds from Asset Sales

Preliminary MMLP Discounted Cash Flow Analysis ($ in MM, except per unit amounts) Q2 - Q4 2024 FY 2025P FY 2026P FY 2027P FY 2028P Terminal Value MMLP EBITDA $85 $120 $120 $118 $119 (-) Cash Taxes (3) (5) (5) (5) (5) (-) Maintenance Capex (23) (30) (31) (25) (23) (-) Changes in Working Capital 4 1 (0) (13) (0) (-) Phantom Stock (0) 1 (1) 0 0 (+) Proceeds from Asset Sales 2 0 0 0 1 (-) Growth Capex (15) (6) (11) (13) (15) Unlevered Free Cash Flow $49 $82 $72 $63 $76 Terminal Multiple 4.5x Terminal EBITDA $119 Implied Perpetuity Growth Rate (3.2%) PV of Unlevered Cash Flows at 10.5% Discount Rate $272 PV of Terminal Value at 10.5% Discount Rate $333 Enterprise Value $606 (-) Net Debt Balance (as of 4/1/2024) ($450) Total Equity Value $156 Total Diluted Units Outstanding (MM) 39.00 Implied Unit Price $3.99 Implied 2024E EBITDA Multiple 5.2x Implied 2025E EBITDA Multiple 5.0x Implied Unit Price Sensitivity Terminal Multiple Perpetuity Growth Rate 4.5x 5.0x 5.5x 6.0x 6.5x 8.5% $5.04 $6.07 $7.11 $8.14 $9.18 9.5% $4.49 $5.48 $6.48 $7.47 $8.46 10.5% $3.99 $4.94 $5.89 $6.84 $7.79 11.5% $3.48 $4.39 $5.30 $6.21 $7.12 12.5% $3.01 $3.88 $4.76 $5.63 $6.50 Source: MRMC / MMLP Management Projections, FactSet 13 Note: Assumes transaction effective date of 4/1/2024 Discount Rate
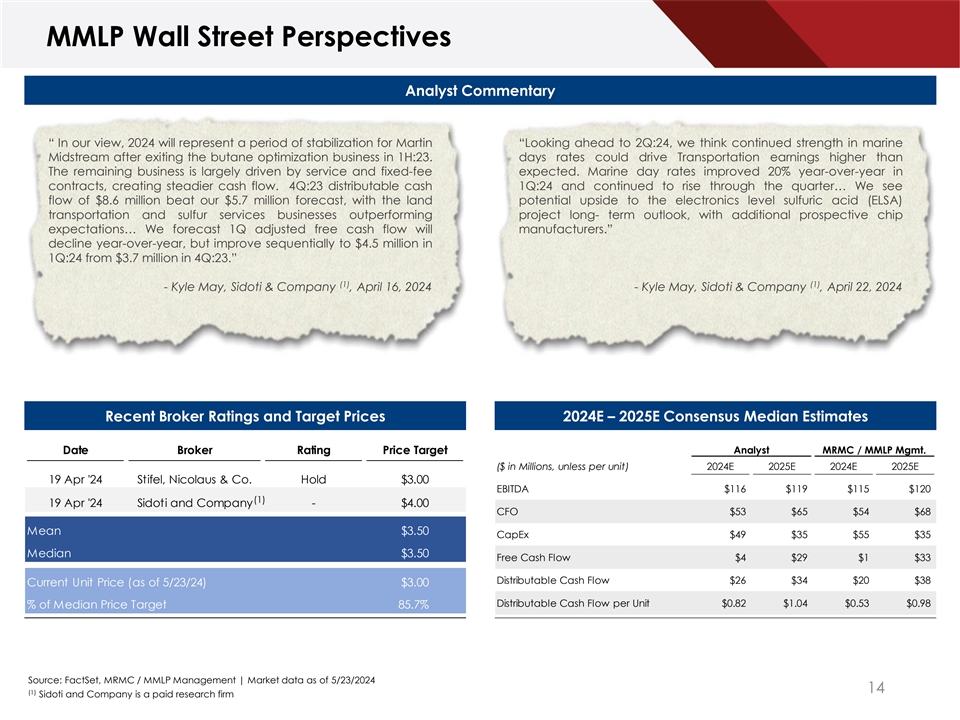
MMLP Wall Street Perspectives Analyst Commentary “ In our view, 2024 will represent a period of stabilization for Martin “Looking ahead to 2Q:24, we think continued strength in marine Midstream after exiting the butane optimization business in 1H:23. days rates could drive Transportation earnings higher than The remaining business is largely driven by service and fixed-fee expected. Marine day rates improved 20% year-over-year in contracts, creating steadier cash flow. 4Q:23 distributable cash 1Q:24 and continued to rise through the quarter… We see flow of $8.6 million beat our $5.7 million forecast, with the land potential upside to the electronics level sulfuric acid (ELSA) transportation and sulfur services businesses outperforming project long- term outlook, with additional prospective chip expectations… We forecast 1Q adjusted free cash flow will manufacturers.” decline year-over-year, but improve sequentially to $4.5 million in 1Q:24 from $3.7 million in 4Q:23.” (1) (1) - Kyle May, Sidoti & Company , April 16, 2024 - Kyle May, Sidoti & Company , April 22, 2024 Recent Broker Ratings and Target Prices 2024E – 2025E Consensus Median Estimates Analyst MRMC / MMLP Mgmt. Date Broker Rating Price Target ($ in Millions, unless per unit) 2024E 2025E 2024E 2025E 19 Apr '24 Stifel, Nicolaus & Co. Hold $3.00 EBITDA $116 $119 $115 $120 (1) 19 Apr '24 Sidoti and Company - $4.00 CFO $53 $65 $54 $68 Mean $3.50 CapEx $49 $35 $55 $35 Median $3.50 Free Cash Flow $4 $29 $1 $33 Distributable Cash Flow $26 $34 $20 $38 Current Unit Price (as of 5/23/24) $3.00 Distributable Cash Flow per Unit $0.82 $1.04 $0.53 $0.98 % of Median Price Target 85.7% Source: FactSet, MRMC / MMLP Management | Market data as of 5/23/2024 14 (1) Sidoti and Company is a paid research firm