We expect the U.S. economy may experience solid but potentially tepid growth in 2010 as two key engines of growth remain sluggish. One is that overall consumption in the U.S. is expected to remain weak as a result of the continued deleveraging of the average U.S. household from the credit binge of the mid 2000’s. Secondly, small businesses are being hindered by rising taxes and healthcare costs and tight credit conditions from the still fragile U.S. banking system. Consequently, it looks like employment growth will remain subdued and the unemployment rate may remain stubbornly high relative to traditional economic recoveries and in comparison to the 4.7% rate that the U.S. experienced in January 2008. The U.S. government has made tremendous efforts to avert a financial meltdown, but in the end, the key to revitalizing household cash flows and driving sustainable economic growth must be centered on solutions for housing and unemployment.
Within the context of this potentially tepid growth outlook in the U.S., it is likely that inflation will remain subdued through 2010, which is positive for equity valuations. There is still a significant output gap in the U.S. with excess capacity in the labor market, industrial utilization, and rental properties which make up the majority of the inflation rate. We do anticipate upward pressure on commodity and energy prices in 2010 based on tighter supply-demand fundamentals driven by stronger global growth and we continue to look for opportunities to invest in these areas. So even if the Fed begins to raise rates in 2010 from its historically low level of 0.25 basis points, we expect the overall interest rate environment should remain accommodative throughout 2010 and this should be positive for the U.S. equity markets. Early in an economic recovery it is traditional for long rates to rise as money comes out of treasuries and into higher risk alternatives.
We are more optimistic about the outlook for economic growth outside of the U.S. and we continue to look for a combination of growth and income opportunities for our investors that have the potential to capitalize on this growth. We believe the two biggest drivers for our positive outlook are coming from the strong economic outlooks in China and Brazil. China is expected to maintain its substantial stimulus spending program and Brazil has benefitted from strong consumer growth and the infrastructure buildouts heading into the Soccer World Cup games in 2014 and the summer Olympics in 2016. Therefore, we expect that global companies that are exposed to the emerging market consumers, commodities, and energy could be outperformers in 2010. In addition, U.S. companies that have exposure to these strong global markets should also outperform as the dollar is expected to remain relatively weak and these companies have also benefitted from cost cutting efforts and strong margin leverage on rising revenues.
We are aware that there are still many identifiable risks to a solid global growth outlook in 2010 that need to be balanced and monitored. We believe one of the key risks for low inflation and sustainable economic growth is a policy mistake by Central Banks that withdraws the current accommodative monetary actions too soon. For example, we will be closely watching the impact on the credit markets when the U.S. Fed begins to withdrawal its quantitative easing programs, such as the expected wind down of the buying of mortgages in early 2010. This could result in an unwarranted rise in mortgage rates amidst an expected wave of continued foreclosures in 2010 and could further damage our still fragile financial system. Another risk is that that European Central Bank’s deep-rooted fears of inflation may result in actions to raise rates too quickly which would put pressure on banks in the weaker areas of Europe, such as Poland, Spain, Ireland or Greece. Lastly, if China moves to restrict bank lending and thereby slowing its growth, that could be a risk for equities.
We Will Maintain Our Balanced Approach In 2010
The volatility over the past 18 months in global equity markets has provided challenges and opportunities. Our goal is to keep our portfolio balanced and maintain our “barbell” approach to our stock selections. What we mean is that a portion of the portfolio will continue to be invested in more defensive companies with a history of strong and sustainable earnings and cash flow growth with the potential for increasing dividends. These are companies in sectors like healthcare, consumer staples, telecom, and utilities where earnings and dividend growth should be more resilient in economic downturns. On the other end of the barbell, we are searching for attractive value opportunities in some strong companies in the more cyclical sectors like energy, materials, consumer discretionary and industrials where prices had been punished during the economic downturn and where we believe long term growth prospects are still attractive.
We are on watch for continued headline risks particularly in the financial sector in first half 2010 as the recent problems in Dubai, Greece and Spain remind of us lingering debt issues and still inflated global asset valuations. However, we remain optimistic that these risks can be contained and that global economic growth will continue to improve in 2010. In addition, we are hopeful that 2010 will be an attractive environment for ADVDX’s investment strategy as fundamental investors focus on high quality and attractive dividend payers. With real global interest rates still close to zero, we would expect capital to search for sustainable yield opportunities in equities which was the case coming out of the bear market in the mid-70’s.
In summary, we see both catalysts and risks in 2010. Our approach during these uncertain times is to remain broadly diversified within the dividend-paying universe
| |
Alpine Dynamic Dividend Fund | 
|
| | |
while actively scanning the globe for undervalued opportunities and high quality cash flow generators. We are confident that we should be able to continue to distribute attractive dividend payouts by capitalizing on our research driven approach to identifying value opportunities as well as through our active management of the portfolio. We are hopeful that equities will continue to be an attractive asset class relative to bonds and cash in 2010 and that ADVDX will continue to offer strong capital appreciation and total return potential for our investors.
Thank you for your support of ADVDX and we look forward to a prosperous and peaceful year in 2010 and beyond.
Sincerely,
Jill K. Evans and Kevin Shacknofsky
Co-Portfolio Managers
Diversification does not assure a profit or protect against loss in a declining market.
Please refer to the schedule of portfolio investments for fund holding information. Fund holdings and sector allocations are subject to change and should not be considered a recommendation to buy or sell any security. Current and future portfolio holdings are subject to risk.
Investing in small and mid cap stocks involves additional risks such as limited liquidity and greater volatility as compared to large cap stocks. Investing in foreign securities tends to involve greater volatility and political, economic and currency risks and differences in accounting methods.
Neither the Fund nor any of its representatives may give tax advice. Investors should consult their tax advisor for information concerning their particular situation.
Free cash flow: Cash not required for operations or for reinvestment. Often defined as earnings before interest (often obtained from the operating income line on the income statement) less capital expenditures less the change in working capital.
Earnings per share (EPS): Calculated by taking the total earnings divided by the number of shares outstanding.
Earnings Growth is a measure of a company’s net income over a specific period, generally one year, is a key indicator for measuring a company’s success, and the driving force behind stock price appreciation.
Dividend Yield: The yield a company pays out to its shareholders in the form of dividends. It is calculated by taking the amount of dividends paid per share over a specific period of time and dividing by the stock’s price.
A basis point is one hundredth of a percentage point (0.01%).
Beta measures the volatility of the fund, as compared to that of the overall market. The Market’s beta is set at 1.00; a beta higher than 1.00 is considered to be more volatile than the market, while a beta lower than 1.00 is considered to be less volatile.
Book value: net asset value of a company, calculated by subtracting total liabilities from total assets.
Euro Stoxx 50 Index is The Dow Jones EURO STOXX 50 Index, Europe’s leading Blue-chip index for the Eurozone, provides a Blue-chip representation of supersector leaders in the Eurozone. The index covers 50 stocks from 12 Eurozone countries: Austria, Belgium, Finland, France, Germany, Greece, Ireland, Italy, Luxembourg, the Netherlands, Portugal and Spain.
The Dow Jones EURO STOXX 50 Index is licensed to financial institutions to serve as underlying for a wide range of investment products such as Exchange Traded Funds (ETF), Futures and Options, and structured products worldwide.
S&P 500 Financial Select Sector Index: Standard and Poor’s 500 Financials Index is a capitalization-weighted index. The parent index is S&P 500. This is a GICS Level 1 Sector group. One cannot invest directly in an index.
14
| |
Alpine Accelerating Dividend Fund | 
|
|
| | | | | | | | | | |
Comparative Annualized Returns as of 10/31/09 (Unaudited) |
| | | | | | | | | | |
| | 3 Months (1) | | 6 Months (1) | | Since Inception
(11/05/2008) (1) | |
|
|
|
|
|
|
|
|
Alpine Accelerating Dividend Fund | | 6.00 | % | | 16.43 | % | | 14.80 | % | |
|
|
|
|
|
|
|
|
|
|
|
S&P 500 Index | | 5.48 | % | | 20.04 | % | | 11.58 | % | |
|
|
|
|
|
|
|
|
|
|
|
Dow Jones Industrial Average | | 6.65 | % | | 20.73 | % | | 9.81 | % | |
|
|
|
|
|
|
|
|
|
|
|
Lipper Equity Income Funds Average(2) | | 5.41 | % | | 20.26 | % | | 16.48 | % | |
|
|
|
|
|
|
|
|
|
|
|
Gross Expense Ratio: 3.41%(3) | | | | | | | | | | |
|
|
|
|
|
|
|
|
|
|
|
Net Expense Ratio: 1.41%(3) | | | | | | | | | | |
| | | | | | | | | | | |
|
(1) Not annualized. |
(2) The since inception return and represents the annualized return for the period beginning 11/6/2008. |
(3) As disclosed in the prospectus dated February 27, 2009. |
Performance data quoted represents past performance and is not predictive of future results. Investment return and principal value of the Fund fluctuate, so that the shares, when redeemed, may be worth more or less than their original cost. Performance current to the most recent month end may be lower or higher than performance quoted and may be obtained by calling 1-888-785-5578. Performance data shown does not reflect the 1.00% redemption fee imposed on shares held for fewer than 2 months. If it did, total returns would be reduced.
The S&P 500 Index is designed to measure performance of the broad domestic economy through changes in the aggregate market value of 500 stocks representing all major industries. The Dow Jones Industrial Average is a price weighted average of 30 actively traded shares of large cap U.S. industrial corporations. The Lipper Equity Income Funds Average is an average of Funds that seek relatively high current income and income growth through investing 60% or more of their respective portfolios in equities. The S&P 500 Index, the Dow Jones Industrial Average, and the Lipper Equity Income Funds Average are unmanaged and do not reflect fees associated with a mutual fund, such as investment adviser fees. The performance for the Accelerating Dividend Fund reflects the deduction of fees for these value-added services. Investors cannot directly invest in an index.
The adviser contractually agreed to waive a portion of its fees and to absorb certain fund expenses. This arrangement will remain in effect unless the Board of Trustees approves its modification or termination.
To the extent that the Fund’s historical performance resulted from gains derived from participation in initial public offerings (“IPOs”) and/or secondary offerings, there is no guarantee that these results can be replicated in future periods or that the Fund will be able to participate to the same degree in IPO/Secondary offerings in the future.
|
|
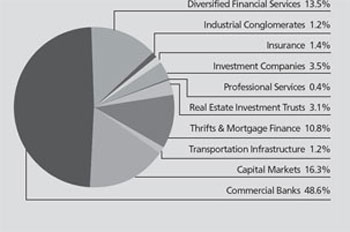
Portfolio Distributions* (Unaudited) |
| | | | | |
|
Top 10 Holdings* (Unaudited) |
1. | | Alcon, Inc. | | 4.11% | |
2. | | Sigma-Aldrich Corp. | | 3.42% | |
3. | | Chubb Corp. | | 3.20% | |
4. | | Chevron Corp. | | 3.15% | |
5. | | Kimberly-Clark Corp. | | 2.77% | |
6. | | Sonoco Products Co. | | 2.75% | |
7. | | Sysco Corp. | | 2.72% | |
8. | | El Paso Pipeline Partners LP | | 2.54% | |
9. | | United Technologies Corp. | | 2.53% | |
10. | | Burlington Northern
Santa Fe Corporation | | 2.48% | |
| | |
| |
* | Portfolio holdings and sector distributions are as of 10/31/09 and are subject to change. Portfolio holdings are not recommendations to buy or sell any securities. Top 10 Holdings do not include short-term investments. Portfolio Distributions percentages are based on total investments and Top 10 Holdings percentages are based on total net assets. |
|
15
| |
Alpine Accelerating Dividend Fund |
|
| | |
|
|
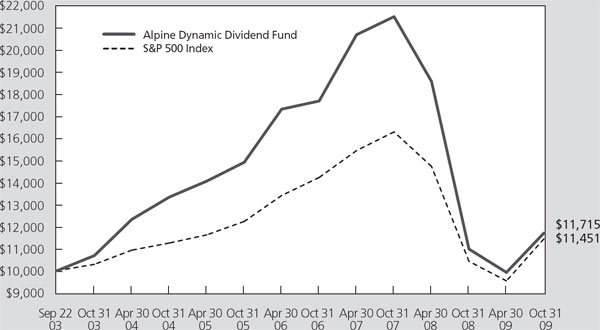
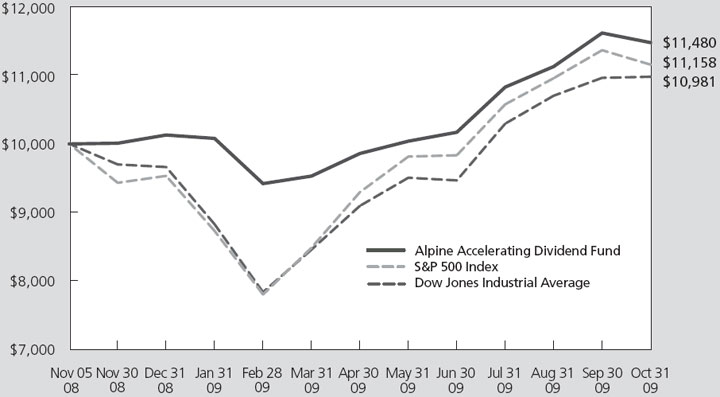
Value of a $10,000 Investment (Unaudited) |
|
|
|
This chart represents a comparison of a hypothetical $10,000 investment in the Fund versus a similar investment in the Fund’s benchmark. The graph and the table do not reflect the deduction of taxes that a shareholder would pay on Fund distributions or the redemption of Fund shares. Investment performance reflects the waiver and recovery of certain fees. Without the waiver and recovery of fees, the Fund’s total return would have differed.
Dear Investor:
We completed our first year of operation with the Alpine Accelerating Dividend Fund, initially launched on November 5, 2008. Since inception through the period ending October 31, 2009, the Fund produced a total return of 14.80%. This compares favorably with a total return of 11.58% for the Standard & Poor’s 500 Average and 9.81% for the Dow Jones Industrial Average for the same period.
The objective of the Accelerating Dividend Fund is to invest in dividend-paying companies which we feel have the potential to accelerate their dividends in the future, based on our analysis of their growth prospects and cash flow generating capabilities. The Fund aims to achieve a sustainable and rising stream of dividend income as well as long-term capital appreciation. We believe dividend acceleration is best sustained by companies with consistent sales or service growth, defensible margins and a strong balance sheet and liquidity profile.
While a limited universe of companies have provided increasing dividends for a sustained period of time, even fewer have demonstrated sustained dividend
acceleration. We use a selective screening process to identify companies with this potential. We feel that in the long-run, these companies provide better risk-adjusted returns for investors while simultaneously providing a buffer against dramatic declines in the stock market and excessive volatility. It is important to recognize that these companies may not outperform the broader market in all environments. For example, when markets rebound off their troughs, more speculative, higher-beta stocks tend to outperform as companies with riskier financial profiles that possessed a higher probability of financial distress recover off their dramatically low valuations. However, when viewed over a longer investment horizon and through a full economic cycle, we feel that companies with more conservative balance sheets and credit profiles should ultimately outperform, especially on a risk-adjusted basis. This point is clearly demonstrated in a recent Wall Street Journal article – “Dividend Payers Return to the Fore” (November 21, 2009 page B1). The article references an analysis from Standard & Poor’s which shows that in the past 10 years, dividend-paying stocks have outperformed non-dividend-paying stocks in every year except for 2003 and 2009. Both of these represented rebound years following bear
16
| |
Alpine Accelerating Dividend Fund |
|
| | |
markets where higher-beta, more speculative stocks outperformed.
Growing, or even sustaining, dividends in the recent environment was extremely difficult, as evidenced by a record number of dividend cuts experienced from companies across various sectors. Even dividend stalwarts such as General Electric, Pfizer and US Bancorp, who have a long and proud history of dividend increases were forced to cut their dividends significantly earlier this year. Strikingly, based on the S&P Dividend Aristocrats, 8 companies that have consistently increased their dividends each year for at least 25 years were forced to slash their dividends this year.
Illustrative of companies we deem capable of meeting these standards are the top performing holdings in the brief history of this Fund. The following are the top performers from inception through October 31, 2009: Suntrust Banks +69%, Alcon +63%, Occidental Petroleum Corp +38%, Sigma Aldrich +37%, J&J Snack Foods +34% and JM Smucker Co +33%. In addition, Burlington Northern Corp, in which we had a 10% gain as of October 31, subsequently announced its sale to Berkshire Hathaway, Inc. on November 3 for a 23% premium to its previous closing price. Burlington, which was a top 10 holding of the fund, has a history of dividend acceleration as well as the ability to generate strong operating cash flow even during a deep recessionary environment. These companies are not concentrated in any one particular area, but conversely represent a broad cross-section of numerous industries including financials, oil and gas, chemicals and consumer products. On the other hand, several companies in our portfolio posted disappointing results: Regions Financial -12%, Accenture -10%, WGL Holdings - -9%, CPFL Energia -8% and Exelon Corp -7%.
Regions Financial is a large regional bank headquartered in Alabama with a Southeast concentration in its loan portfolio. The bank was included in the group of 19 large banks that were stress tested by the Fed earlier this year and raised the requisite amount of capital dictated by the stress tests. From a long term value perspective, we continue to feel that Regions offers compelling return potential while the downside risks have likely been mitigated through the regulatory assessment and resultant capital increases. However, we recognize that similar to other US regional banks, the recovery timeline is not short and expect earnings to be below normal operating levels for several years. While Regions was forced to virtually eliminate their dividend earlier this year in order to preserve capital, we expect future dividend increases to be concurrent with a reduction in loan loss provisioning and recovery in earnings.
Accenture, a historical dividend accelerator with a strong balance sheet, is a provider of management and
technology consulting services to corporations. We believe that the Company may continue to benefit from global corporate demand for outsourcing solutions and more efficient use of IT technology to enhance productivity and reduce cost. As a result, we feel that Accenture’s business model and financial results will prove to be more resilient in a slow economy. WGL and Exelon are US utility companies and CPFL Energia is a Brazilian utility. Although utilities underperformed the broader market (S&P 500) through October 31, we believe that the sector was positioned for a rebound as investors reduce risk appetite and rotate into more defensive names. Utilities have historically provided attractive dividend yields and cash flow characteristics, and, as discussed below, represent a meaningful part of our portfolio.
Three of our largest industry groups and corresponding percent of portfolio are Oil and Gas – 8.4%, Electric Utilities – 7.9% and Healthcare Equipment and Supplies – 7.7%. We feel that our investments in the energy sector should benefit from the significant infrastructure spending domestically as well as in the emerging markets (i.e, China, Brazil). The utility sector may provide very attractive dividend yields and a conservative corporate profile. Despite a challenged dividend environment, utilities’ steady revenue streams should support the continuation of high dividend payouts. The healthcare equipment companies in our portfolio have solid balance sheets and a history of strong cash flow generation. We feel that they have the capability to increase their dividend even through a continued weak economy, and are also more insulated than pharmaceuticals to the risks associated with the impending healthcare legislation. It is our intention to continue to look for investments that meet our criteria without assuming excessive risk by overly concentrating in one particular sector or geographic region.
We aim to be selective in identifying companies that we feel are best positioned to maintain their historical dividend trajectories by deploying a three-pronged approach. First, we look for companies that internally generate enough free cash flow from their core operations to support their dividends and even fund share repurchases. Second, we monitor the ratio of cash flow to adjusted net income to indentify companies whose core earnings (adjusted for depreciation and amortization) are running in-line with the amount of cash flow from operations. Third, we favor companies with stronger liquidity profiles and an ability to service their debt even under adverse profitability scenarios. We seek companies with more unencumbered balance sheets which retain flexibility in recessions enabling them to avoid franchise-destroying actions, such as forced divestitures of strategic assets. Companies with fortress balance sheets should be better positioned to take advantage of market opportunities and enhance
17
| |
Alpine Accelerating Dividend Fund |
|
| | |
their franchise at the expense of competitors by acquiring assets at the bottom, rather than the top, of the cycle.
Despite the strong rebound in equity markets this year and evidence of the resumption of economic growth in the US, we remain cautious on the economy and feel that the recovery will be tepid with speed-bumps along the way. The consumer and corporate deleveraging process will likely continue for several years as the aggregate leverage in our system remains very elevated relative to historical standards. While the pace of labor cuts appears to be decreasing as evidenced by the recent decline in initial unemployment claims, unemployment has continued to climb due to a lack of private sector hiring. It will likely take years for us to recover these lost jobs – by the Fed’s own estimates it will take until 2012 to bring the unemployment rate back down to 8%, a level we have not seen since 1984! Massive government support of the real estate sector through Fannie, Freddie, the FHA and tax credits has increased transaction flow and put a floor on prices, but the market has not demonstrated an ability to stand on its own without stimulus. Finally, emerging markets such as China, which have contributed enormously to the recovery of commodity prices and global trade this year, must ensure that capital flows and local stimulus do not create speculative bubbles that can derail their recoveries. These forces, coupled with an increasing consumer savings rate, will remain a headwind to a potential recovery in the near-term.
There are reasons to be optimistic. Our financial institutions have been repairing their balance sheets and should emerge from this crisis as better-capitalized and more prudent risk managers. Emerging markets such as China, Brazil and India have demonstrated their ability to decouple from OECD (The Organization for Economic Co-operation and Development) economies and will likely be the leading contributors to global economic growth. In addition, the rapid pace of innovation should continue to create growth, jobs and attractive opportunities for returns. Given the logic of a cautious macro-economic stance, we remain optimistic that companies which meet the high standards of dividend growth and strong liquidity, basic to this strategy, should better withstand a protracted difficult recovery phase while providing attractive capital growth opportunities for investors.
We firmly believe that our strategy should provide investors with attractive risk-adjusted returns through the cycle, and thank our shareholders for their confidence in our management during these unprecedented and volatile market conditions.
Sincerely,
Stephen A. Lieber
David Burg
Co-Portfolio Managers
|
|
Past performance is not a guarantee of future results. |
|
Please refer to the schedule of portfolio investments for fund holding information. Fund holdings and/or sector allocations are subject to change at any time and are not recommendations to buy or sell any security. Current and future holdings are subject to risk. |
|
Investing in small and mid cap stocks involves additional risks such as limited liquidity and greater volatility as compared to large cap stocks. Investing in foreign securities tends to involve greater volatility and political, economic and currency risks and differences in accounting methods. |
|
Cash flow measures the cash generating capability of a company by adding non-cash charges (e.g. depreciation) and interest expense to pretax income. |
|
Beta measures the volatility of the fund, as compared to that of the overall market. The Market’s beta is set at 1.00; a beta higher than 1.00 is considered to be more volatile than the market, while a beta lower than 1.00 is considered to be less volatile. |
18
| |
Alpine Dynamic Financial Services Fund |
|
|
| | | | | | | | | | | | | |
|
Comparative Annualized Returns as of 10/31/09 (Unaudited) |
| | 6 Months (1) | | 1 Year | | 3 Years | | Since Inception
(11/1/2005) | |
|
|
|
|
|
|
|
|
|
|
|
|
|
|
Alpine Dynamic Financial Services Fund | | 31.48 | % | | 21.83 | % | | -4.46 | % | | 1.45 | % | |
|
|
|
|
|
|
|
|
|
|
|
|
|
|
NASDAQ 100 Financial Index | | 9.37 | % | | -13.85 | % | | -13.28 | % | | -7.58 | % | |
|
|
|
|
|
|
|
|
|
|
|
|
|
|
PHLX/KBW Bank Index | | 29.50 | % | | -25.96 | % | | -25.48 | % | | -16.37 | % | |
|
|
|
|
|
|
|
|
|
|
|
|
|
|
S&P 500 Index | | 20.04 | % | | 9.80 | % | | -7.02 | % | | -1.58 | % | |
|
|
|
|
|
|
|
|
|
|
|
|
|
|
Lipper Financial Services Funds Average(2) | | 25.21 | % | | -2.14 | % | | -18.48 | % | | -11.12 | % | |
|
|
|
|
|
|
|
|
|
|
|
|
|
|
Lipper Financial Services Funds Ranking(2) | | N/A | | | 7/84 | | | 3/69 | | | 3/59 | | |
|
|
|
|
|
|
|
|
|
|
|
|
|
|
Gross Expense Ratio: 2.19%(3) | | | | | | | | | | | | | |
|
|
|
|
|
|
|
|
|
|
|
|
|
|
Net Expense Ratio: 1.97%(3) | | | | | | | | | | | | | |
|
| |
(1) | Not annualized. FINRA does not recognize rankings for less than one year. |
(2) | The since inception return and ranking represents the annualized return for the period beginning 11/3/2005. |
(3) | As disclosed in the prospectus dated February 27, 2009. |
Performance data quoted represents past performance and is not predictive of future results. Investment return and principal value of the Fund fluctuate, so that the shares, when redeemed, may be worth more or less than their original cost. Performance current to the most recent month end may be lower or higher than performance quoted and may be obtained by calling 1-888-785-5578. Performance data shown does not reflect the 1.00% redemption fee imposed on shares held for fewer than 2 months. If it did, total returns would be reduced.
The NASDAQ 100 Financial Index is a capitalization-weighted index of the 100 largest financial companies, as well as foreign issues, including American Depository Receipts (ADRs), traded on the NASDAQ National Market System (NASDAQ/NMS) and SmallCap Market. The PHLX/KBW Bank Index is a modified cap-weighted index consisting of 24 exchange-listed and National Market System stocks, representing national money center banks and leading regional institutions. The S&P 500 Index is designed to measure performance of the broad domestic economy through changes in the aggregate market value of 500 stocks representing all major industries. The Lipper Financial Services Funds Average is an average of funds whose primary objective is to invest primarily in equity securities of companies engaged in providing financial services. Lipper Rankings for the periods shown are based on Fund total returns with dividends and distributions reinvested and do not reflect sales charges. The NASDAQ 100 Financial Index, the PHLX/KBW Bank Index, the S&P 500 Index and the Lipper Financial Services Funds Average are unmanaged and do not reflect the deduction of fees associated with a mutual fund, such as investment adviser fees. The performance for the Dynamic Financial Services Fund reflects the deduction of fees for these value-added services. Investors cannot directly invest in an index.
The adviser contractually agreed to waive a portion of its fees and to absorb certain fund expenses. This arrangement will remain in effect unless the Board of Trustees approves its modification or termination.
The Fund’s past performance benefitted significantly from initial public offerings (“IPOs”) of certain issuers, and there is no assurance that the Fund can replicate this performance in the future. To the extent that the Fund’s historical performance resulted from gains derived from participation in Secondary offerings, there is no guarantee that these results can be replicated or that the Fund will be able to participate to the same degree in IPO and Secondary offerings in the future.
| |
|
| |
Portfolio Distributions* (Unaudited) | Top 10 Holdings* (Unaudited) |
| | | |
1. | United Western Bancorp, Inc. | | 6.04% |
2. | The Bancorp, Inc. | | 5.81% |
3. | IntercontinentalExchange, Inc. | | 5.48% |
4. | Banco do Estado do Rio Grande | | |
| do Sul SA | | 4.55% |
5. | Metro Bancorp, Inc. | | 4.50% |
6. | Synovus Financial Corp. | | 3.98% |
7. | Blackstone Group LP | | 3.40% |
8. | Alliance Bancorp, Inc. | | |
| of Pennsylvania | | 3.31% |
9. | American Capital Agency Corp. | | 3.29% |
10. | 1st United Bancorp, Inc. | | 3.23% |
| | |
| |
* | Portfolio holdings and sector distributions are as of 10/31/09 and are subject to change. Portfolio holdings are not recommendations to buy or sell any securities. Top 10 Holdings do not include short-term investments. Portfolio Distributions percentages are based on total investments and Top 10 Holdings percentages are based on total net assets.
|
19
| |
Alpine Dynamic Financial Services Fund |
|
| | |
|
| |
|
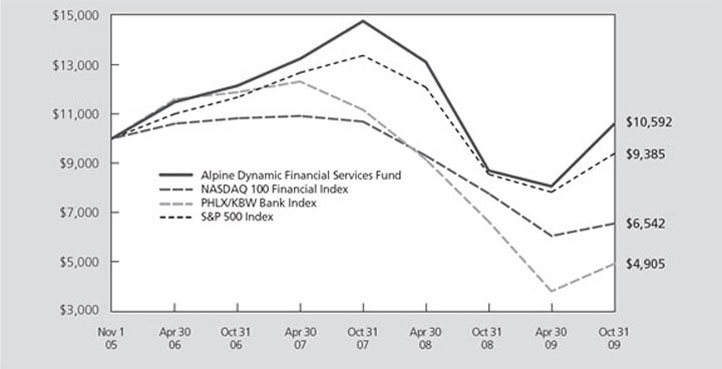
Value of a $10,000 Investment (Unaudited) |
|
|
This chart represents a comparison of a hypothetical $10,000 investment in the Fund versus a similar investment in the Fund’s benchmark. The graph and the table do not reflect the deduction of taxes that a shareholder would pay on Fund distributions or the redemption of Fund shares. Investment performance reflects the waiver and recovery of certain fees. Without the waiver and recovery of fees, the Fund’s total return would have differed.
Dear Investor:
Alpine Dynamic Financial Services Fund generated a 21.83% total return for the fiscal year ended October 31, 2009. This compares favorably to the Fund’s benchmarks which showed total returns of -13.85% for the NASDAQ 100 Financial Index and the PHLX/KBW Bank Index of -25.96% during the same period.
While the Fund’s performance in fiscal 2009 was materially better than the prior year, the market proved equally challenging. At the beginning of fiscal 2008, the outlook for the financial industry was slowly deteriorating due to the problems in residential real estate. The pace at which the industry’s fundamentals were deteriorating dramatically accelerated after the demise of Bear Stearns Co. and through the end of the fiscal year 2008. The speed, depth, and breadth of the decline made it difficult to find investments which would not be significantly affected by market conditions. Equity market volatility continued into fiscal 2009. The year started in the depths of the global financial crisis. With the capital funding markets seized up, governments around the world were forced to infuse capital and liquidity into their bank system in
order to restore order and confidence back to the capital markets. Although governments and their central banks around the world did what they could through fiscal and monetary policies to stabilize the situation, the outlook for the financial industry continued to deteriorate. In the first quarter of calendar 2009, there was talk by politicians both in the US and abroad about potentially nationalizing their large banks. At this point investor sentiment toward the banking industry was at its lowest. The ability for banks to raise much needed capital from the private sector was impossible. Then, in early March, two banks that were considered potential nationalization candidates, Bank of America and Citicorp, both disclosed improving operating trends in the March quarter. This marked the nadir for the bank indexes as hedge funds scrambled to cover their short positions and portfolio managers, who as a group were significantly underweight financials at the beginning of the year, were quickly increasing their sector allocation on the news. Investor confidence has continued to improve through the remainder of the fiscal year as earnings for some of the large financial companies beat consensus estimates and recent economic data point to less contraction than originally
20
| |
Alpine Dynamic Financial Services Fund |
|
| | |
anticipated. This improved outlook is attributable to a high level of Government intervention which includes fiscal spending and targeted stimulus programs. In addition, the housing market data has also begun to improve thanks in part to the Federal Reserve’s program of purchasing mortgages and Agency securities and the Government’s first time home ownership program.
The challenge of fiscal 2009 was the rapid change in investor sentiment toward the capital markets and the financial sector. This year was truly a tale of two markets. The first period was represented by risk aversion, a strong dollar, weak commodity prices, and extreme consumer and investor pessimism. During this period financial stocks were among the worst performing sectors. The second period was in complete contrast with risk taking, weak dollar, strong commodity prices, and improving consumer and investor sentiment. During this period financial stocks were among the best performing sectors. The quickness in the change of investor sentiment and the strength of the rally in financial stocks has caused an adjustment in our investment tactics. With the fundamentals of the industry weak, the outlook uncertain, and no established long term trend, we became more short term focused. Profits were taken if a market rally caused an investment to advance meaningfully in a short period of time in order to protect against a possible quick reversal.
A common characteristic of sector funds is the concentration risk of the industry the fund invests in. We try to reduce this risk by diversifying our investments into different subsectors within the financial industry, and different business models within those subsectors, as well as different geographical markets. This is done with the belief that as some subsectors underperform the group there will be other subsectors outperforming. This was the case in fiscal 2009. The Fund’s best performing holdings were the foreign financial companies. The Brazilian companies were by far the strongest. Banco Panamericano had a total return of 204%, Banco Estado Rio Grande Sul’s total return was 183%, and BM&F Bovespa’s total return was 146%. Another area of outperformance this fiscal year was asset management companies. Within this subsector, the stocks of the alternative investment managers had the best returns. Our holding of Och-Ziff Capital Management generated a total return of 166%, Fortress Investment Group a 103% total return, and Blackstone Group a 62% total return. The next best performing subsector was the security brokerage firms. Among this group our holdings of the niche firms like MF Global, GFI Group, and JMP Group generated the best returns.
On the downside, the worst performing subsector was the domestic banks. A number of the underperforming holdings were banks in the Southeast with exposure to Florida. The sharp decline in the State’s real estate market negatively affected the performance of banks
such as, Bank of Florida Corporation (-76%), Superior Bancorp (-61%), and The South Financial Group (-86%).
The improved investor sentiment toward financials has allowed one important condition needed to resolve the banking crisis to appear. That condition is the opening of the capital markets to equity issuance by banks. In order for the industry to address their problem assets and repay Government TARP money much capital is needed from the private sector. Starting in the summer there has been a wave of banks recapitalizing their balance sheets. These equity raises have been of two types. A defensive offering in which a bank uses the proceeds to rebuild their low capital base and increase their loan loss reserve and an offensive offering in which a bank uses the proceeds to repay TARP money and build excess capital to make acquisitions. We expect both of these types of equity issuances to continue into 2010. The Fund has participated in many of these offerings. We believe the defensive offerings help diminish the overriding concern of capital adequacy while the offensive offerings prove a potential catalyst if the issuing banks are successful in acquiring failed institutions. As a result of our participating in these offerings, the commercial banks category has increased as a percentage of the portfolio distribution over last year end. Two of our largest holdings, The Bancorp Inc. and United Western Bancorp, were purchased in these offerings.
As the industry cleanses itself of weaker institutions, rational pricing of loans and deposits has been returning. Loan underwriting standards are once again prudent. Risk is now being priced into loans while debt coverage and collateral requirements are stricter. We would expect the vintage of loans being underwritten today should perform very well over their life. On the funding side of the balance sheet, the exit of many troubled banks with liquidity problems has dramatically reduced the outlying special Certificate of Deposit (CD) rate promotions. In addition, the bank regulators are beginning to rein in troubled banks from offering CD rates that are way above the prevailing local market rates. Also helping the funding side of the balance sheet is the liquidity that is coming back to the wholesale money market which is reducing the cost of short term borrowing. These factors have allowed the net interest margin for many banks to increase in the third quarter. We believe margins could improve further in the coming quarters as maturing CDs continue to reprice lower and new loans are being underwritten with interest rate floors above their indexed rate. The balance sheets of some banks are also positioned to see widening margins in a rising interest rate environment. Thus, any movement up in rates after the Federal Reserve completes their mortgage purchase program could benefit these banks.
We believe that banks may continue to strengthen their capital ratios. This is being done through the issuance of additional capital and reducing the size of their balance
21
| |
Alpine Dynamic Financial Services Fund |
|
| | |
sheet. Banks have been reducing the thin margin, wholesale side of their balance sheet. These tend to be liquid securities funded with short term borrowings. The banks are also weeding out their loan portfolios accounts with weakening financials and clients which have no other bank products than their loan. Bankers are marketing for relationship customers who want to do all their banking business with them. These accounts are more profitable and tend to stay with a bank longer than rate shoppers.
Our concern with the banking industry is the continuing deterioration of credit quality. We expect loan charge-offs will continue to remain elevated for another year. While residential real estate appears to be stabilizing, the lingering effect of the recession is exerting stress on commercial real estate. This is the main worry and focus of bank examiners. The regulators are requiring banks with commercial real estate concentration to reduce their exposure. Another unknown is the potential for new banking regulation which may hinder the industry’s profitability. We understand that the regulators are
already requiring many banks to maintain capital ratios well in excess of the well-capitalized guidelines.
Longer term, we see the banking industry emerging out of the current recession a stronger and more disciplined industry. As the economy recovers and the credit cycle turns upward, we expect that banks will find themselves with excess capital and loan loss reserves as they did in the early 1990s. This could lead to acceleration in healthy bank mergers and stock buybacks. We look for signs of increasing consumption and private investment as early indicators to a sustained economic recovery.
While we believe 2010 holds some challenges for banks, the industry is in much better shape than it was a year ago. We wish to thank you for your continued support as we pass through these unusual times.
Sincerely,
Peter J. Kovalski
Portfolio Manager
The fund primarily invests in equity securities of financial services companies and will be affected by risk factors particular to this industry such as regulation, monetary and fiscal policies and interest rates, as well as general market risks. The fund invests in smaller companies, which involve additional risks such as liquidity and greater volatility. The fund invests in foreign securities which involve greater volatility and political, economic and currency risks and differences in accounting methods.
There is no assurance the fund will achieve its investment objective.
Please refer to the schedule of portfolio investments for fund holding information. Fund holdings and/or sector allocations are subject to change at any time and are not recommendations to buy or sell any security. Current and future portfolio holdings are subject to risk.
Diversification does not assure a profit or protect against loss in a declining market.
22
| |
Alpine Dynamic Innovators Fund |
|
|
| | | | | | | | | | |
| |
Comparative Annualized Returns as of 10/31/09 (Unaudited) | | | | | |
| | | | | | | | | | |
| | 6 Months (1) | | 1 Year | | 3 Years | | Since Inception
(07/11/2006) | |
|
|
|
|
|
|
|
|
|
|
|
Alpine Dynamic Innovators Fund | | 42.38 | % | | 19.03% | | -5.99% | | -4.57% | |
|
|
|
|
|
|
|
|
|
|
|
Russell 2000 Total Return Growth Index | | 15.70 | % | | 11.34% | | -6.88% | | -4.28% | |
|
|
|
|
|
|
|
|
|
|
|
S&P 500 Index | | 20.04 | % | | 9.80% | | -7.02% | | -3.96% | |
|
|
|
|
|
|
|
|
|
|
|
Lipper Small-Cap Growth Funds Average(2) | | 16.74 | % | | 13.12% | | -7.54% | | -4.47% | |
|
|
|
|
|
|
|
|
|
|
|
Lipper Small-Cap Growth Funds Ranking(2) | | N/A | | | 140/557 | | 144/475 | | 258/465 | |
|
|
|
|
|
|
|
|
|
|
|
Gross Expense Ratio: 1.38%(3) | | | | | | | | | | |
|
|
|
|
|
|
|
|
|
|
|
Net Expense Ratio: 1.42%(3) | | | | | | | | | | |
| |
(1) Not annualized. FINRA does not recognize rankings for less than one year.
(2) The since inception return and ranking represents the annualized return for the period beginning 7/13/2006.
(3) As disclosed in the prospectus dated February 27, 2009.
Performance data quoted represents past performance and is not predictive of future results. Investment return and principal value of the Fund fluctuate, so that the shares, when redeemed, may be worth more or less than their original cost. Performance current to the most recent month end may be lower or higher than performance quoted and may be obtained by calling 1-888-785-5578. Performance data shown does not reflect the 1.00% redemption fee imposed on shares held for fewer than 2 months. If it did, total returns would be reduced.
The Russell 2000 Total Return Growth Index is constructed to provide a comprehensive and unbiased barometer of the small-cap growth market. Based on ongoing empirical research of investment manager behavior, the methodology used to determine growth probability approximates the aggregate small-cap growth manager’s opportunity set. The S&P 500 Index is designed to measure performance of the broad domestic economy through changes in the aggregate market value of 500 stocks representing all major industries. The S&P 500 Index is unmanaged and does not reflect the deduction of fees associated with a mutual fund, such as investment advisory fees. The Lipper Small-Cap Growth Funds Average is an average of Funds that, by portfolio practice, invest at least 75% of their equity assets in companies with market capitalizations (on a three year weighted basis) less than 250% of the dollar-weighted median of the smallest 500 of the middle 1,000 securities of the S&P SuperComposite 1500 Index. Lipper Rankings for the periods shown are based on Fund total returns with dividends and distributions reinvested and do not reflect sales charges. The Russell 2000 Total Return Growth Index, S&P 500 Index and the Lipper Small-Cap Growth Funds Average are unmanaged and do not reflect the deduction of fees associated with a mutual fund, such as investment adviser fees. The performance for the Dynamic Innovators Fund reflects the deduction of fees for these value-added services. Investors cannot directly invest in an index.
The adviser contractually agreed to waive a portion of its fees and to absorb certain fund expenses. This arrangement will remain in effect unless the Board of Trustees approves its modification or termination.
|
The Fund’s past performance benefitted significantly from initial public offerings (“IPOs”) of certain issuers, and there is no assurance that the Fund can replicate this performance in the future. To the extent that the Fund’s historical performance resulted from gains derived from participation in Secondary offerings, there is no guarantee that these results can be replicated or that the Fund will be able to participate to the same degree in IPO and Secondary offerings in the future. |
|
| |
Portfolio Distributions* (Unaudited)
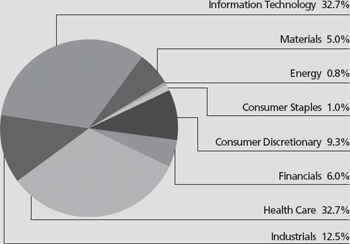
Top 10 Holdings* (Unaudited)
| | | | | |
1. | | Itron, Inc. | | 7.03% | |
2. | | ANSYS, Inc. | | 5.99% | |
3. | | Priceline.com, Inc. | | 5.68% | |
4. | | FLIR Systems, Inc. | | 5.26% | |
5. | | Alcon, Inc. | | 5.14% | |
6. | | Logitech International SA | | 5.05% | |
7. | | Air Products & Chemicals, Inc. | | 4.86% | |
8. | | Life Technologies Corp. | | 4.67% | |
9. | | inVentiv Health, Inc. | | 4.28% | |
10. | | PowerSecure International, Inc. | | 4.27% | |
| | |
| |
* | Portfolio holdings and sector distributions are as of 10/31/09 and are subject to change. Portfolio holdings are not recommendations to buy or sell any securities. Top 10 Holdings do not include short-term investments. Portfolio Distributions percentages are based on total investments and Top 10 Holdings percentages are based on total net assets. |
23
| |
Alpine Dynamic Innovators Fund |
|
| | |
|
| |
|
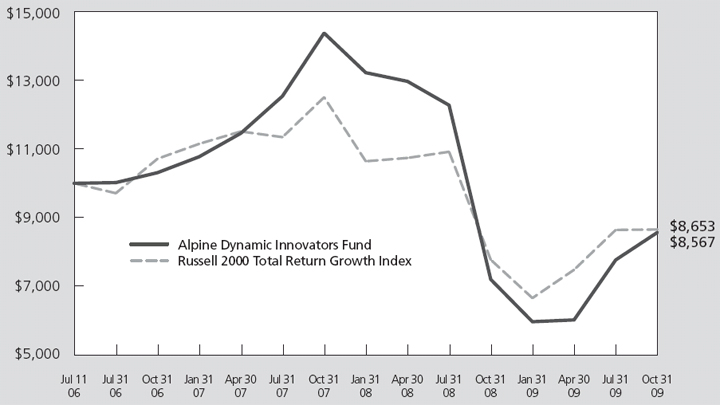
Value of a $10,000 Investment (Unaudited) |
|
|
|
|
This chart represents a comparison of a hypothetical $10,000 investment in the Fund versus a similar investment in the Fund’s benchmark. The graph and the table do not reflect the deduction of taxes that a shareholder would pay on Fund distributions or the redemption of Fund shares. Investment performance reflects the waiver and recovery of certain fees. Without the waiver and recovery of fees, the Fund’s total return would have differed.
Dear Investor:
The Alpine Dynamic Innovators Fund provided a 19.03% return for the fiscal year ended October 31, 2009. This compares with the 9.80% return of the Standard & Poor’s 500 Average and 11.34% for the Russell 2000 Total Return Growth Index for the same period.
Since inception of the Fund on July 11, 2006, cumulative performance is -4.57% compared with the -3.96% for the Standard & Poor’s 500 Index and -4.28% for the Russell 2000 Total Return Growth Index.
The Fund has returned to the positive results experienced in its first calendar year, 2007, which produced a 35% gain in net asset value per share. While past performance is not a guarantee of future results, we believe that the initial results suggest that the concept of concentrating on innovation has now been proven. We seek demonstrated technological leadership, new disruptive technologies, introduction of new and better products and innovative business models. The negative results of the following year, 2008, certainly challenged this Fund’s portfolio as so many others. It is very reassuring that sizeable gains in shares of many
companies with innovative opportunities provided significant outperformance in fiscal 2009.
The leadership of the Fund’s investment performance in this fiscal year were shares in a group of companies with successful innovative business activities or strategies. The top ten among the Fund’s forty-three holdings produced gains ranging from 65% to 209% during this fiscal year.
First in percentage return was Priceline.com Inc.’s 208.9% return. The company’s profits grew with its innovations in an internet based hotel reservation system which allows interactive bidding by customers.
Second in percentage return was Imdex Limited, up 153.4%, an Australian oil and gas drilling system developer and manufacturer of energy production equipment.
Third in return was Westport Innovations, Inc., up 135.9%, a Canadian developer of natural gas fuel systems for automotive engines with key alliances in the U.S. markets with Ford Motor and Cummins Engine.
Power Secure International, Inc. was fourth in gain, up 110.6%. It provides energy management and
24
| |
Alpine Dynamic Innovators Fund |
|
| | |
conservation solutions to utilities and their customers to selectively regulate and reduce consumption.
Scientific Learning Corp., up 102%, was fifth. It has led in the development of internet based computer learning systems for cognitive enhancement.
The group of holdings which gained under 100%, but over 65%, were led by Allscript-Misys Healthcare Solutions, with a 97.3% return. It develops and supplies computer patient data systems for healthcare professionals. In another phase of the healthcare business, Inventiv Health, with a 78.2% return, provides marketing strategies and services for the pharmaceutical industry. Flowserve Corp., which gained 73.7%, is the leader in flow control systems for the oil and natural gas industries. Alcon, Inc., up 67.6%, is the dominant producer of specialty medications for vision and eyecare. Among the top ten is Life Technologies Corp., which gained 65.3%, a major specialty provider of biotechnology tools for medical research and healthcare institutions.
The companies we mention are predominantly small to mid-size enterprises. But, the portfolio strategy will not be limited to the smaller companies. We seek out any significant opportunity for innovation. For example, the largest company among the Fund’s holdings is Hewlett Packard Company, now being enhanced by proposed new acquisitions.
While we are pleased to report strong results in our top ten holdings, there have been others with disappointment and some where losses have been taken. Most disappointing was Sequenom, Inc., with a
loss of - -82.7% recorded after the company disclosed errors in genetic sequencing data which they had published. Promising specialized medical technology companies did prove negative with losses reported in CardioNet, Inc. (-71.3%), Synovis Life Technologies (-31.4%) and Abiomed (-39.3%). We recognize that intensive analysis is necessary in such fields as biotechnology and medical product innovation which may have risks offsetting often remarkable benefits. Other investments in the medical field which could benefit from enlarged government programs, notably stimulus money, include Alscrips-Mysis Healthcare, Mednax Inc. and Quality Systems, Inc.
The early stages of economic recovery have usually provided companies with increasing cash flow to devote to capital investment and marketing for innovative products. We anticipate that this trend may develop even with a limited pace of recovery. Concentration on innovation when successful should drive growth and provide a stream of potential opportunities for investment in this Fund’s strategic areas.
Our organization has added to its research staff and capabilities. We anticipate bringing their wider knowledge to our search for innovative businesses. We thank our shareholders for their continuing support.
Sincerely,
Stephen A. Lieber
Samuel A. Lieber
Co-Portfolio Managers
| |
| |
Past performance is not a guarantee of future results. |
Please refer to the schedule of portfolio investments for fund holding information. Fund holdings and sector allocations are subject to change and should not be considered a recommendation to buy or sell any security. Current and future portfolio holdings are subject to risk.
The Fund may invest in smaller and medium size companies, which involve additional risks such as limited liquidity and greater volatility. The Fund may also invest in micro-cap company stocks which are more volatile than those of larger companies and tend to perform poorly during times of economic stress. The Fund may invest in foreign securities which involve greater volatility and political, economic and currency risks and differences in accounting methods. The Fund may invest in debt securities which typically decrease in value when interest rates rise. This risk is usually greater for longer-term debt securities. The Fund’s portfolio will involve short positions, which involves unlimited risk including the possibility that losses may exceed the original amount invested. The Fund may also use options and future contracts, which have risks associated with unlimited losses of the underlying holdings due to unanticipated market movements and failure to correctly predict the direction of securities prices, interest rates and currency exchange rates. However, a mutual fund investor’s risk is limited to one’s amount of investment in a mutual fund.
Cash flow measures the cash generating capability of a company by adding non-cash charges (e.g. depreciation) and interest expense to pretax income.
25
| |
Alpine Dynamic Transformations Fund |
|
|
| | | | | | | | | | |
|
Comparative Annualized Returns as of 10/31/09 (Unaudited) |
| | 6 Months (1) | | 1 Year | | Since Inception
(12/31/2007) | |
|
|
|
|
|
|
|
|
Alpine Dynamic Transformations Fund | | 31.51 | % | | 33.61 | % | | -13.05 | % | |
|
|
|
|
|
|
|
|
|
|
|
S&P 500 Index | | 20.04 | % | | 9.80 | % | | -15.29 | % | |
|
|
|
|
|
|
|
|
|
|
|
NASDAQ Composite Index | | 19.62 | % | | 20.09 | % | | -12.40 | % | |
|
|
|
|
|
|
|
|
|
|
|
Lipper Mid-Cap Core Funds Average | | 19.40 | % | | 17.52 | % | | -14.43 | % | |
|
|
|
|
|
|
|
|
|
|
|
Lipper Mid-Cap Core Funds Ranking | | N/A | | | 19/370 | | 128/352 | |
|
|
|
|
|
|
|
|
|
|
|
Gross Expense Ratio: 3.00%(2) | | | | | | | | | | |
|
|
|
|
|
|
|
|
|
|
|
Net Expense Ratio: 1.40%(2) | | | | | | | | | | |
| | | | | | | | |
| |
(1) | Not annualized. FINRA does not recognize rankings for less than one year. |
(2) | As disclosed in the prospectus dated February 27, 2009. |
Performance data quoted represents past performance and is not predictive of future results. Investment return and principal value of the Fund fluctuate, so that the shares, when redeemed, may be worth more or less than their original cost. Performance current to the most recent month end may be lower or higher than performance quoted and may be obtained by calling 1-888-785-5578. Performance data shown does not reflect the 1.00% redemption fee imposed on shares held for fewer than 2 months. If it did, total returns would be reduced.
The S&P 500 Index is designed to measure performance of the broad domestic economy through changes in the aggregate market value of 500 stocks representing all major industries. The NASDAQ Composite Index is a stock market index of all of the common stocks and similar securities listed on the NASDAQ stock market, meaning that it has over 3,000 components. It is highly followed in the U.S. as an indicator of the performance of stocks of technology companies and growth companies. The Lipper Mid-Cap Core Funds Average is an average of funds that invest at least 75% of their equity assets in companies with market capitalizations below Lipper’s USDE large cap floor. Lipper Rankings for the periods shown are based on Fund total returns with dividends and distributions reinvested and do not reflect sales charges. The S&P 500 Index, NASDAQ Composite Index and the Lipper Mid-Cap Core Funds Average are unmanaged and do not reflect fees associated with a mutual fund, such as investment adviser fees. The performance for the Dynamic Transformations Fund reflects the deduction of fees for these value-added services. Investors cannot directly invest in an index.
The adviser contractually agreed to waive a portion of its fees and to absorb certain fund expenses. This arrangement will remain in effect unless the Board of Trustees approves its modification or termination.
To the extent that the Fund’s historical performance resulted from gains derived from participation in initial public offerings (“IPOs”) and/or secondary offerings, there is no guarantee that these results can be replicated in future periods or that the Fund will be able to participate to the same degree in IPO/Secondary offerings in the future.
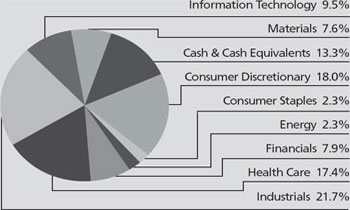
Portfolio Distributions* (Unaudited)
| | | | |
Top 10 Holdings*(Unaudited) | | | |
1. | Pall Corp. | | 9.03 | % |
2. | Intuitive Surgical, Inc. | | 7.01 | % |
3. | Priceline.com, Inc. | | 6.74 | % |
4. | Autoliv, Inc. | | 5.73 | % |
5. | CME Group, Inc. | | 5.17 | % |
6. | Walter Energy, Inc. | | 4.99 | % |
7. | Teleflex, Inc. | | 4.95 | % |
8. | Clean Harbors, Inc. | | 4.34 | % |
9. | Emergency Medical Services Corp. | | 4.10 | % |
10. | Hewlett-Packard Co. | | 4.05 | % |
| | |
| |
* | Portfolio holdings and sector distributions are as of 10/31/09 and are subject to change. Portfolio holdings are not recommendations to buy or sell any securities. Top 10 Holdings do not include short-term investments. Portfolio Distributions percentages are based on total investments and Top 10 Holdings percentages are based on total net assets. |
26
| |
Alpine Dynamic Transformations Fund |
|
| | |
|
| |
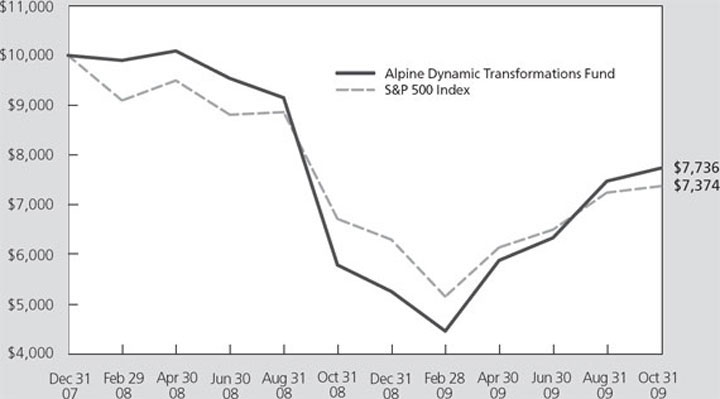
Value of a $10,000 Investment (Unaudited) |
|
|
|
|
|
This chart represents a comparison of a hypothetical $10,000 investment in the Fund versus a similar investment in the Fund’s benchmark. The graph and the table do not reflect the deduction of taxes that a shareholder would pay on Fund distributions or the redemption of Fund shares. Investment performance reflects the waiver and recovery of certain fees. Without the waiver and recovery of fees, the Fund’s total return would have differed.
Dear Investor:
The Alpine Dynamic Transformations Fund return for its first fiscal year to October 31, 2009 was 33.61%. This compared with the 9.80% for the Standard & Poor’s 500 Average and 20.09% for the NASDAQ.
The Dynamic Transformations Fund started January 1, 2008 in, what is often referred to in the investment field, as an incubation stage. In essence, the beginning of a new mutual fund strategy is a “proof of concept”. We believe that the central concept of the Fund – that there should be exceptional growth opportunities through investment in companies which are in the process of enhancing their business through transforming strategies, often literally a business culture change – has now been proven.
The strategy is well illustrated through the performance over the last year in the top ten performing holdings of the Fund.
The number one performer, up 199.8%, was Priceline.com, Inc. Priceline is leading the transformation of its industry, a specialty business of providing customer negotiated hotel, travel and cruise reservations. It has achieved sustained and large
profitability gains in an environment where travel became much more competitive as demand declined.
The second largest gainer was PNC Financial Services Group, with a 112.4% total return. This major regional bank headquartered in Western Pennsylvania, positioned itself to potentially benefit by the 2008 crisis in the banking industry through acquisition of a major Cleveland, Ohio banking system, National City, Inc. Its recent financial results compare outstandingly with a typical bank. The third largest return was in State Street Corp., at 101.3%. State Street, a major trust bank, had lost some of its investment standing during the banking crisis through its ownership of unconsolidated lending vehicles. Investor confidence began to be restored when the management announced write-downs on these vehicles to eliminate the risk of further losses.
The next largest gain was 69.9% in the shares of CME Group, Inc. CME is the parent of Chicago Mercantile Exchange and other exchanges. It is the largest exchange in the field of derivatives. Much of the investment crisis of 2008 was impacted by derivative obligations being traded outside of the exchange structures in an unregulated fashion. There now is growing expectation that regulations will require that
27
| |
Alpine Dynamic Transformations Fund |
|
| | |
exchanges such as CME take on this additional transaction volume, which should enhance growth opportunity in a transformational manner.
Walter Investment Management Corp. and Walter Energy Inc. rose 68.4% and 67.8%, respectively. These gains reflected a true transformation in the shares of Walter when the company separated its two businesses, mortgage investment management and energy resources. This particularly enabled concentration on the high growth potential metallurgical coal mining subsidiary. Autoliv Corp. provided a 61.9% return. This international manufacturer of auto safety equipment, seatbelts and airbags, has begun a new product program with the introduction of infrared safety equipment to be installed on cars in order to identify nighttime risks, particularly highlighting pedestrians.
A transformation program was initiated by Starbucks Corp., up 44.5%, recognizing that the company had lost its historical growth luster. Combining reduction in the number of stores with changes in product and even introduction of instant coffees, Starbucks appears to have regained a growth trend.
Intuitive Surgical Inc., up 42.6% continued its growth in a transformational fashion by achieving increased sales of disposable operating room products. Historically, an outstanding growth company based on its robotic surgery equipment, the company’s sales of supplies this year sustained growth when recessionary conditions reduced hospital investment in major systems.
Of the underperforming holdings in the Fund during this period, many had transformational trends that we feel are still not fully realized in the profits column. For example, General Electric Company (-9.9%) was bought in November at a price substantially identical to that which it held the end of the fiscal year. We expected then, and expect now, that General Electric should succeed in the transformation of the capital position of its extensive financial operations, and thus, bring back acceptable investment returns.
There are many other holdings with interesting potential for their transformations, such as Snap-On Tools, Inc. – the automotive tools specialist – which has developed a new line of tools which include diagnostic capabilities.
The severely competitive conditions of the recessionary environment, the managerial preoccupation with the most efficient use of capital and the necessity of seeking out new approaches to, and sources of, profits all lead to potential transformational business opportunities. But, not all results are satisfactory or even profitable. This is well illustrated by the Fund’s largest realized loss in this fiscal period, the 96% decline in the value of shares in Federal National Mortgage Association, Fannie Mae. During the early phase of the financial crisis of 2008 we believed that Fannie Mae was on the threshold of obtaining new support from proposed legislation discussed at that time by Sen. Dodd and Congressman Frank. No such support emerged and, instead, the government threw the company into a conservatorship. While still not fully resolved, this wiped out virtually all the market value. This is not an economic event which we would anticipate being repeated. Other negative performers in the fiscal year period included Ambac Financial Group (-51.1%), Helix Energy Solutions (-51.3%) and Flotek Industries
(-67.4%).
The essence of the transformation concept of investing is to recognize and select important and promising changes in corporate culture. Many have provided outstanding investment gains and we believe that the Fund’s brief experience suggests that it is well positioned to potentially benefit by strong continuing trends in a recovering economy. We appreciate the interest of our investors in our strategy.
Sincerely,
Stephen A. Lieber, Portfolio Manager
Sarah Hunt, Associate Portfolio Manager
The Fund may invest in smaller and medium size companies, which involve additional risks such as limited liquidity and greater volatility. The Fund may also invest in micro-cap company stocks which are more volatile than those of larger companies and tend to perform poorly during times of economic stress. The Fund may invest in foreign securities which involve greater volatility and political, economic and currency risks and differences in accounting methods. The Fund may invest in debt securities which typically decrease in value when interest rates rise. This risk is usually greater for longer-term debt securities. The fund may also use options and future contracts, which have risks associated with unlimited losses of the underlying holdings due to unanticipated market movements and failure to correctly predict the direction of securities prices, interest rates and currency exchange rates.
Please refer to the schedule of portfolio investments for fund holding information. Fund holdings and sector allocations are subject to change and should not be considered a recommendation to buy or sell any security. Current and future portfolio holdings are subject to risk.
The NASDAQ Composite Index is a market capitalization-weighted index that is designed to represent the performance of the National Market System which includes over 5,000 stocks traded only over-the-counter and not on an exchange. You cannot invest directly in an index.
28
| |
Alpine Dynamic Balance Fund |
|
|
| | | | | | | | | | | | | |
|
Comparative Annualized Returns as of 10/31/09 (Unaudited) |
| | | | | | | | | | | | | |
| | 6 Months (1) | | 1 Year | | 3 Years | | 5 Years | | Since Inception
(6/7/2001) | |
|
|
|
|
|
|
|
|
|
|
|
|
Alpine Dynamic Balance Fund | | 11.28 | % | | 11.03 | % | -8.48 | % | -1.45 | % | 2.61 | % | |
|
|
|
|
|
|
|
|
|
|
|
|
|
|
S&P 500 Index | | 20.04 | % | | 9.80 | % | -7.02 | % | 0.33 | % | -0.59 | % | |
|
|
|
|
|
|
|
|
|
|
|
|
|
|
Lipper Mixed-Asset Target Allocation Growth Funds Average | | 18.00 | % | | 15.96 | % | -3.22 | % | 2.05 | % | 1.65 | % | |
|
|
|
|
|
|
|
|
|
|
|
|
|
|
Lipper Mixed-Asset Target Allocation Growth Funds Ranking | | N/A | | | 553/651 | 535/540 | 438/442 | 67/278 | |
|
|
|
|
|
|
|
|
|
|
|
|
|
|
Gross Expense Ratio: 1.25%(2) | | | | | | | | | | | | | |
|
|
|
|
|
|
|
|
|
|
|
|
|
|
Net Expense Ratio: 1.25%(2) | | | | | | | | | | | | | |
| |
| |
(1) | Not annualized. FINRA does not recognize rankings for less than one year. |
(2) | As disclosed in the prospectus dated February 27, 2009. |
Performance data quoted represents past performance and is not predictive of future results. Investment return and principal value of the Fund fluctuate, so that the shares, when redeemed, may be worth more or less than their original cost. Performance current to the most recent month end may be lower or higher than performance quoted and may be obtained by calling 1-888-785-5578. Performance data shown does not reflect the 1.00% redemption fee imposed on shares held for fewer than 2 months. If it did, total returns would be reduced.
The S&P 500 Index is designed to measure performance of the broad domestic economy through changes in the aggregate market value of 500 stocks representing all major industries. The Lipper Mixed-Asset Target Allocation Growth Funds Average is an average of Funds that, by portfolio practice, maintain a mix of between 60%–80% equity securities, with the remainder invested in bonds, cash, and cash equivalents. Lipper Rankings for the periods shown are based on Fund total returns with dividends and distributions reinvested and do not reflect sales charges. The S&P 500 Index and the Lipper Mixed-Asset Target Allocation Growth Funds Average are unmanaged and do not reflect the deduction of fees associated with a mutual fund, such as investment adviser fees. The performance for the Dynamic Balance Fund reflects the deduction of fees for these value-added services. Investors cannot directly invest in an index.
|
To the extent that the Fund’s historical performance resulted from gains derived from participation in initial public offerings (“IPOs”) and/or secondary offerings, there is no guarantee that these results can be replicated in future periods or that the Fund will be able to participate to the same degree in IPO/Secondary offerings in the future. |
Portfolio Distributions* (Unaudited)
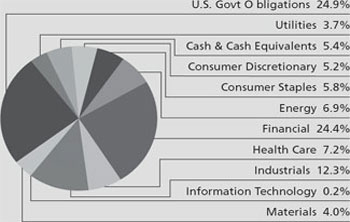
| | | | |
Top 10 Holdings* (Unaudited) | | | |
1. | U.S. Treasury Bond,
5.250%, 11/15/2028 | | 14.42 | % |
2. | U.S. Treasury Bond,
6.000%, 02/15/2026 | | 6.65 | % |
3. | CONSOL Energy, Inc. | | 4.57 | % |
4. | U.S. Treasury Note,
5.000%, 08/15/2011 | | 3.90 | % |
5. | JPMorgan Chase & Co. | | 3.45 | % |
6. | Simon Property Group, Inc. | | 2.91 | % |
7. | Johnson & Johnson | | 2.89 | % |
8. | Eagle Materials, Inc. | | 2.20 | % |
9. | Allegheny Energy, Inc. | | 2.11 | % |
10. | State Street Corp. | | 1.97 | % |
| | |
| |
* | Portfolio holdings and sector distributions are as of 10/31/09 and are subject to change. Portfolio holdings are not recommendations to buy or sell any securities. Top 10 Holdings do not include short-term investments. Portfolio Distributions percentages are based on total investments and Top 10 Holdings percentages are based on total net assets. |
| |
29
| |
Alpine Dynamic Balance Fund |
|
| | |
|
|
Value of a $10,000 Investment (Unaudited) |
|
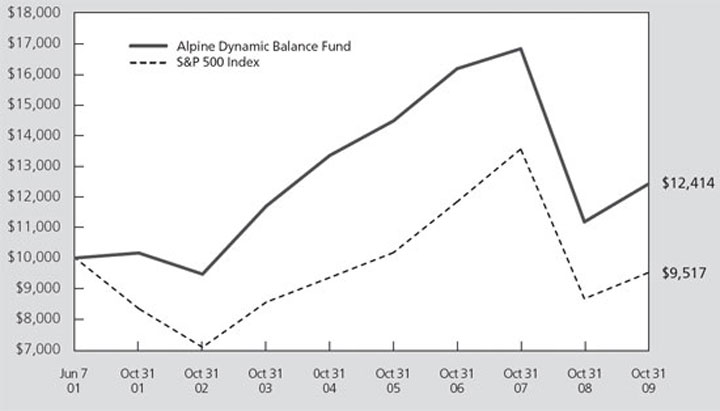
|
This chart represents a comparison of a hypothetical $10,000 investment in the Fund versus a similar investment in the Fund’s benchmark. The graph and the table do not reflect the deduction of taxes that a shareholder would pay on Fund distributions or the redemption of Fund shares. Investment performance reflects the waiver and recovery of certain fees. Without the waiver and recovery of fees, the Fund’s total return would have differed.
Dear Investor:
The Alpine Dynamic Balance Fund provided an 11.03% return for its fiscal year ending October 31, 2009. This return compared with 9.80% from the Standard & Poor’s 500 Index and the 15.96% from the Lipper Mixed-Asset Target Allocation Growth Fund Index. Since inception on June 7, 2001, the Fund has provided a 2.61% average annual rate of return as compared with -0.59% for the Standard & Poor’s 500 Index and 1.65% for the Lipper Mixed-Asset Target Allocation Growth Fund Index.
The Dynamic Balance Fund investments include diverse strategies and types of investment vehicle. Central to the program is the continuing utilization of a substantial portion of the Fund holdings in United States Treasury obligations; 25% of assets at fiscal year end. This is an actively managed segment of the portfolio aimed to add to total return by taking advantage of cyclical trends in the markets for U.S. Treasury obligations while providing income.
A major component of the Fund strategy is investing in stocks of comparatively large capitalization companies
which have demonstrated long term records of substantial dividend payment and increases. These holdings accounted for 40% of the portfolio at fiscal year end. Another segment is aimed at participating in cyclical opportunities for corporate profits growth. These stock holdings accounted for 30% of the portfolio at fiscal year end.
Within the different equity investment segments, sector commitments included real estate investment trusts and operating companies (10.6%), diversified financial services (4.8%), and commercial banks (4.5%). Portfolio results varied significantly across these different categories of investment, reflecting the high level of volatility in the fiscal year. Among equities, the top performer during our fiscal year was Temple Inland Inc., a packaging company whose shares provided a 111.3% total return. Ventas Inc., a real estate operating company, produced a 96.2% return, while ProLogis, a distribution center real estate operator, brought a 78.4% return. Among financials, the outstanding return was 75.7% in the shares of Goldman Sachs, followed by title insurer Fidelity National Financial Inc. with a 69.3% return. A variety of issues produced significant returns; with 24
30
| |
Alpine Dynamic Balance Fund |
|
| | |
different holdings providing returns ranging from 30% to 111%. Historically low volatility issues had important recoveries after the fall of prices in 2008. Illustratively, our holdings in the Walgreen Company total return was 56.3%, Darden Restaurants, 43.2%, American Electric Power, 22.4%, Honeywell International, 20.6%, J.C. Penney, 19.7%, 3M Company, 18.9%, Colgate Palmolive, 17.7%.
The major challenged area of the portfolio was in financials. Bank of America (-36.6%), Wells Fargo (-4.5%) and regional institutions, such as Southside Bankshares, Inc. (-4.3%), New York Community Bank (-20.1%), and Webster Financial (-40.9%), encountered severe challenges to their financial status and adverse volatility for their shares.
Active portfolio strategies were employed to take advantage of severe declines, and quick recoveries such as were experienced by the shares of Goldman Sachs, CVS Caremark, the drugstore chain, and Deere & Company, the tractor and farm equipment manufacturer. Many new positions were taken with the view that we saw undervaluation which should provide significant long term returns. Taking advantage of the research program we had built to search for companies with accelerating dividend potential, we added Chubb Corp. and Emerson Electric Company to the portfolio.
The fiscal year 2009 reflects the Fund’s portfolio structure in a group of strategies aimed at risk avoidance. Much of the strategy worked well in the fiscal year. The major exception was in the striking pattern of dividend cuts among financial institutions. Leading banks dropped their dividends down to a nominal $.01 per quarter level during the challenging bank crisis, and even certain stalwarts of American industry, such as General Electric, made unprecedented dividend cuts. Looking ahead, we anticipate a normalizing structure for financial institutions and for corporate earning power. While we anticipate many companies will have a slow and often limited recovery, we will concentrate on the search for what, in our view, are the more vigorous, and well financed, innovative and transformational companies to be the core of this portfolio. We will also endeavor to enhance returns, as we did earlier this year, through the sale of options on portfolio holdings at times when they appear to have limited near term potential. Our goal is strong results while continuing a defensive investment strategy.
We thank our shareholders for their continuing support.
Sincerely,
Stephen A. Lieber
Samuel A. Lieber
Co-Portfolio Managers
| |
| |
Past performance is not a guarantee of future results. |
|
Please refer to the schedule of portfolio investments for fund holdings information. Fund holdings and sector allocations are subject to change and should not be considered a recommendation to buy or sell any security. Current and future portfolio holdings are subject to risk. |
|
Investing in this fund involves special risks, including but not limited to, options and futures transactions. Please refer to the prospectus for further details. Investments in debt securities typically decrease in value when interest rates rise. This risk is usually greater for longer-term debt securities. |
31
FIXED INCOME MANAGER REPORTS

| | |
| | Alpine Ultra Short Tax Optimized Income Fund |
| | |
| | Alpine Municipal Money Market Fund |
| |
Alpine Ultra Short Tax Optimized Income Fund |
|
|
| | | | | | | | | | | | | | | | |
| |
Comparative Annualized Returns as of 10/31/09 (Unaudited) |
| | | | | | | | | | | |
| | 6 Months (1) | | 1 Year | | 3 Years | | 5 Years | | Since Inception (2) | |
|
|
|
|
|
|
|
|
|
|
|
|
Alpine Ultra Short Tax Optimized Income
Fund — Investor Class | | 1.70 | % | | 3.65 | % | | 3.79 | % | | 3.41 | % | | 3.42 | % | |
|
|
|
|
|
|
|
|
|
|
|
|
|
|
|
|
|
Alpine Ultra Short Tax Optimized Income
Fund — Investor Class (Pre-liquidation, After-tax) | | 1.40 | % | | 3.32 | % | | 3.50 | % | | 3.11 | % | | 3.06 | % | |
|
|
|
|
|
|
|
|
|
|
|
|
|
|
|
|
|
Alpine Ultra Short Tax Optimized Income
Fund — Investor Class (Post-liquidation, After-tax) | | 1.29 | % | | 3.14 | % | | 3.50 | % | | 3.13 | % | | 3.05 | % | |
|
|
|
|
|
|
|
|
|
|
|
|
|
|
|
|
|
Alpine Ultra Short Tax Optimized Income
Fund — Adviser Class | | 1.07 | % | | 2.89 | % | | 3.54 | % | | 3.24 | % | | 3.00 | % | |
|
|
|
|
|
|
|
|
|
|
|
|
|
|
|
|
|
Alpine Ultra Short Tax Optimized Income
Fund — Adviser Class (Pre-liquidation, After-tax) | | 0.80 | % | | 2.59 | % | | 3.27 | % | | 2.96 | % | | 2.69 | % | |
|
|
|
|
|
|
|
|
|
|
|
|
|
|
|
|
|
Alpine Ultra Short Tax Optimized Income
Fund — Adviser Class (Post-liquidation, After-tax) | | 0.87 | % | | 2.59 | % | | 3.27 | % | | 2.97 | % | | 2.73 | % | |
|
|
|
|
|
|
|
|
|
|
|
|
|
|
|
|
|
Barclays Capital 1 Year Municipal Bond Index | | 1.39 | % | | 4.40 | % | | 4.14 | % | | 3.33 | % | | 2.88 | % | |
|
|
|
|
|
|
|
|
|
|
|
|
|
|
|
|
|
Lipper Short Municipal Debt Funds Average(3) | | 1.61 | % | | 3.81 | % | | 2.43 | % | | 2.33 | % | | 2.28 | % | |
|
|
|
|
|
|
|
|
|
|
|
|
|
|
|
|
|
Lipper Short Municipal Debt Funds Rank — Investor Class(3) | | N/A | | 49/64 | | 12/56 | | 4/51 | | 2/42 | |
|
|
|
|
|
|
|
|
|
|
|
|
Gross Expense Ratio (Investor Class): 0.83%(4) | | | | | | | | | | | | | | | | |
|
|
|
|
|
|
|
|
|
|
|
|
|
|
|
|
|
Net Expense Ratio (Investor Class): 0.70%(4) | | | | | | | | | | | | | | | | |
|
|
|
|
|
|
|
|
|
|
|
|
|
|
|
|
|
Gross Expense Ratio (Adviser Class): 1.08%(4) | | | | | | | | | | | | | | | | |
|
|
|
|
|
|
|
|
|
|
|
|
|
|
|
|
|
Net Expense Ratio (Adviser Class): 0.95%(4) | | | | | | | | | | | | | | | | |
| |
| |
The adviser contractually agreed to waive a portion of its fees and to absorb certain fund expenses. This arrangement will remain in effect unless the Board of Trustees approves its modification or termination. |
|
(1) | Not annualized. FINRA does not recognize rankings for less than one year. |
(2) | Advisor Class shares commenced on March 30, 2004 and Investor shares commenced on December 5, 2002. Returns for indices are since December 5, 2002. |
(3) | The since inception return and ranking represents the annualized return for the period beginning 12/31/2002. |
(4) | As disclosed in the prospectus dated February 27, 2009. |
|
Performance data quoted represents past performance and is not predictive of future results. Investment return and principal value of the Fund fluctuate, so that the shares, when redeemed, may be worth more or less than their original cost. Performance current to the most recent month end may be lower or higher than performance quoted and may be obtained by calling 1-888-785-5578. Performance data shown does not reflect the 0.25% redemption fee imposed on shares held for fewer than one month. If it did, total returns would be reduced. Effective 10/12/07, Alpine Ultra Short Tax Optimized Fund Adviser Class began imposing a maximum sales charge of 0.50% on purchases. Performance data shown for time period beginning with dates after 10/12/07 reflect the sales charge. |
|
The Barclays Capital 1 Year Municipal Bond Index is the 1-year (1-2) component of the Municipal Bond Index. The Barclays Capital 1 Year Municipal Bond Index is a rules-based, market-value weighted index engineered for the long-term, tax-exempt bond market. Lipper Short Municipal Debt Funds Average is an unmanaged index that tracks funds that invest in municipal debt issues with dollar-weighted average maturities of less than three years. Lipper Rankings for the periods shown are based on Fund total returns with dividends and distributions reinvested and do not reflect sales charges. The Barclays Capital 1 Year Municipal Bond Index and the Lipper Short Municipal Debt Funds Average are unmanaged and do not reflect the deduction of fees associated with a mutual fund, such as investment adviser fees. The performance for the Ultra Short Tax Optimized Income Fund reflects the deduction of fees for these value-added services. Investors cannot directly invest in an index. |
33
| |
Alpine Ultra Short Tax Optimized Income Fund |
|
| | |
| | | | | | | |
| |
|
Portfolio Distributions*(Unaudited) | | Top 10 Holdings*(Unaudited) | | | |
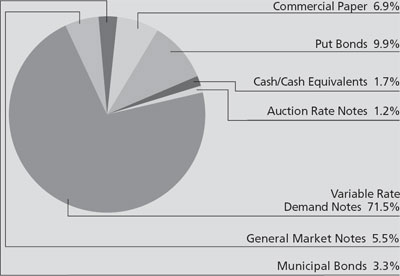
| | 1. | | City of Philadelphia Tax 7 Revenue
Anticipation Notes - Series B,
2.500%, 06/30/2010 | | 3.63% | |
| 2. | | Michigan State Housing Development
Authority Rental Revenue - Series A,
2.7500%, 11/04/2009 | | 2.99% | |
| 3. | | Pennsylvania State Higher Education
Assistance Agency - Series B,
3.250%, 11/05/2009 | | 2.77% | |
| 4. | | BayMedical Center of Florida - Series B,
2.300%, 11/04/2009 | | 2.51% | |
| 5. | | Michigan State Housing Development
Authority Single Mortgage Revenue -
Series B, 5.000%, 11/04/2009 | | 2.39% | |
| 6. | | Montgomery County, Tennessee Public
Building Authority Revenue,
0.230%, 11/02/2009 | | 1.89% | |
| 7. | | Sevier County, Tennessee Public Building
Authority Revenue, 0.370%, 11/02/2009 | | 1.86% | |
| 8. | | West Baton Rouge, Louisiana Parish
Industrial Revenue, 2.200%, 11/06/2009 | | 1.79% | |
| 9. | | New York State Mortgage Agency
Homeowner Revunue - Series 139,
0.300%, 11/2/2009 | | 1.73% | |
| 10. | | BlackRock Liquidity Fund MuniCash
Portfolio, 0.25% | | 1.71% | |
|
| | | |
| * | Portfolio holdings and sector distributions are as of 10/31/09 and are subject to change. Portfolio holdings are not recommendations to buy or sell any securities. Portfolio Distributions percentages are based on total investments and Top 10 Holdings percentages are based on total net assets. |
| | | | |
|
| |
|
Value of a $10,000 Investment (Unaudited) |
|
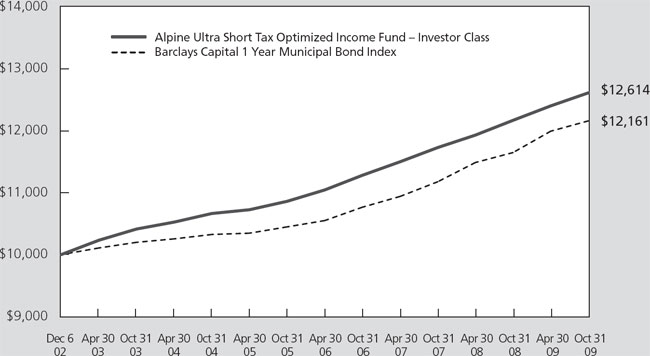
|
|
This chart represents a comparison of a hypothetical $10,000 investment in the Fund versus a similar investment in the Fund’s benchmark. The graph and the table do not reflect the deduction of taxes that a shareholder would pay on Fund distributions or the redemption of Fund shares. Investment performance reflects the waiver and recovery of certain fees. Without the waiver and recovery of fees, the Fund’s total return would have differed.
34
| |
Alpine Ultra Short Tax Optimized Income Fund |
|
| | |
|
Alpine Municipal Money Market Fund / Alpine Ultra Short Tax Optimized Income Fund—Commentary |
|
Dear Investor:
We are pleased to provide you with the annual report for the Alpine Income Trust for the period ending October 31, 2009. The Income Trust includes both the Alpine Ultra Short Tax Optimized Income Fund and the Alpine Municipal Money Market Fund.
Performance Summary
According to Lipper Analytical Services, the total return for the Alpine Ultra Short Tax Optimized Income Fund (Investor Class) for the one year period ending October 31, 2009, was 3.65% versus 3.81% for the Lipper average for Short Municipal Debt Funds. We would also like to report that at the close of this reporting period on October 31, 2009 the Alpine Ultra Short Tax Optimized Income Fund (Investor Class) received a five star overall Morningstar rating out of 123 funds in the Muni National Short Category. (derived from a weighted average of the fund’s three, five- and ten-year risk adjusted return measure, if applicable).
The Alpine Municipal Money Market Fund had a total return of 1.03% for the one year period ending October 31, 2009, versus an average of 0.29% in the Lipper category of Tax Exempt Money Market Funds. Furthermore, Lipper Analytical Services ranked the Fund number one out of 101 funds in the Tax Exempt Money Market Fund category for the one year period, number 1 out of 90 funds for the three year period, and number 1 out of 82 funds for the 5 year period ending October 31, 2009, based on total returns.
Market Overview
Although a return to robust economic growth in the near future is unlikely, the longest and deepest U.S. recession since the Great Depression may have recently ended. The economy which shrank at an annualized rate of more than 5% in the fourth quarter of 2008 and in the first quarter of 2009, showed improvement in the second and third quarters. While national unemployment has reached double digits and consumer spending has been restrained, job losses have been lower than they were in the beginning of 2009. In addition, there are signs of stabilizing real estate markets in some cities, and equities have rebounded sharply from their March lows in anticipation of stronger economic growth in the months ahead.
In the last six months, intermediate and long-term U.S. Treasury yields rose as new issuance increased significantly and steadying financial markets prompted
investors to assume greater investment risks and seek higher returns, particularly from assets that performed worst in 2008. In contrast, municipal interest rates declined in the face of very strong demand, as investors were attracted by discounted valuations and tax-free income offered by municipal securities.
Despite their strong rebound this year, tax-free securities have remained an attractive fixed income investment particularly for investors in the highest tax brackets. As of October 31, 2009, the 1.86% yield offered by a AAA (as rated by Standard and Poor’s) five-year tax-free municipal bond was about 80% of the 2.34% pretax yield offered by a five-year Treasury. Ten-year AAA municipal bonds are even more attractive on a relative basis, with a 3.04% yield that is 89% of the 3.41% pretax yield offered by 10-year Treasuries. The ratios increase even more as you go out longer on the yield curve making long-term municipal securities even more attractive.
Nationally, new municipal supply through the end of October totaled about $335 billion, according to the Bond Buyer. Tax-Exempt supply has been a bit lower than expected, due in part to the Build America Bonds program, which has shifted about 20% of the issuance to the taxable bond market and helped alleviate the supply/demand imbalance that stressed the tax-free market last year. With the national economy still very weak and a significant federal fiscal stimulus package providing some temporary relief to states, we expect aggregate new issuance in 2009 to be higher than in 2008.
Demand from retail investors for municipal securities has been very strong, and year-to-date investor cash flows into municipal bond funds have been extremely robust. In the aftermath of last year’s financial market turbulence, investors seeking more exposure to fixed income securities and higher returns than they receive from the typical cash management investments have embraced municipals because of attractive after-tax yields and valuations relative to Treasuries. Concerns about higher federal, state and local taxes have also fueled interest in tax-free securities.
Many states are facing fiscal difficulties and have been forced to take drastic actions to close budget deficits. California’s challenges show no signs of abating. Although State officials reached a budget agreement in late July that includes spending cuts and borrowing from local governments, there need to be more willingness to adjust taxes, fees and spending to match the difficult economic realities facing the state. Considering that the
35
| |
Alpine Ultra Short Tax Optimized Income Fund |
|
| | |
state’s recovery will probably lag a national economic recovery, we continue to monitor California securities for appropriate investment in our portfolios.
In terms of sector performance, the segments of the municipal market that fared the worst last year, long-term and lower-quality securities, have been this year’s leaders. Tobacco bonds outpaced other segments in the last six months, though longer-term trends do not appear to be especially positive. Corporate-related municipal securities, such as industrial revenue and pollution control revenue bonds, airline bonds and health-care related issues, also did well as credit markets stabilized. In contrast, prerefunded bonds and escrowed-to-maturity bonds lagged with only mild gains this year.
Alpine Ultra Short Tax Optimized Income Fund
During the past six months, we continued the same strategy that we have been utilizing throughout 2009. As a result, we positioned the Fund with the following goals in mind: 1) to keep volatility low while still providing a competitive return, 2) to take advantage of the current interest rate environment while being mindful that interest rates are likely to eventually rise and 3) to be defensive in the face of declining credit quality in the municipal sector. While the Fund’s total return has not kept pace with funds that have large exposure to lower-rated bonds or longer average maturities, we feel that our Fund is well positioned based on the present conditions in the marketplace.
Upon examining the fundamentals of the municipal market over the past ten months, we saw four key factors that formed our investment strategy. They included historically low interest rates, deteriorating credit quality, marginal liquidity and a supply/demand imbalance of tax exempt securities. When we took all four of these variables into consideration, we concluded that based on the objective of the Fund it would be advantageous to keep our average weighted maturity short and take a more defensive position.
As a result, the Fund’s duration, which is a measure of a bond fund’s sensitivity to changes in interest rates, was 0.12 years at the end of October, a lot shorter than that of our benchmark. With short-term interest rates so low we strategically shortened the Fund’s duration and most likely will keep it there until short-term rates move higher. One aspect of this strategy is to hold more cash or near-cash investments in the portfolio. Currently, we have an overweight of the portfolio in variable demand notes which provide the Fund with an attractive yield relative to longer maturing securities and little volatility. Furthermore, a significant portion of the remaining portfolio matures within the next year, thus providing
the Fund with flexibility to take advantage of potential opportunities in the future. At this point in the economic cycle, we do not want to reach for higher yield by increasing the Fund’s interest rate risk.
We believe the front end of the municipal yield curve will remain relatively low until such time as the Federal Open Market Committee begins to tighten its monetary policy. We think the Fed could start raising rates toward the latter half of 2010.
While the municipal bond market has rallied during most of 2009, we have remained hesitant in selling our longer-term securities despite the paper gains that have been generated for several reasons. It is our goal to minimize capital gains if possible and maximize income and selling these higher yielding investments would not be consistent with these two objectives.
Alpine Municipal Money Market Fund
Since our last shareholder report at the end of April, the money markets have improved substantially, boasting the outlook for large money center banks, which are critical to money market financing. As a result, many of the temporary supports with which the Federal Reserve and Treasury surrounded the market in 2008 are now being withdrawn as confidence returns. The Treasury’s decision not to extend the money fund guarantee program, in which this fund participated, is one such example. The program ended as scheduled on September 18, 2009.
The Federal Reserve has had a 0% interest rate policy in place since December 2008, though the transmission of that policy had not been fully felt in the market until recently because of ongoing credit worries focused on large financial institutions. But now, with the outlook for credit improving, the Fed’s unprecedented action is gaining traction and money market rates have fallen towards the 0% target. Municipal rates have moved in similar fashion since our last reporting period. Seven-day variable rates, as measured by The Bond Buyer declined from 1.13% to .51%, while rates on one-year municipal notes, as measured by The Bond Buyer declined from 0.72% to 0.55%. At this writing, rates have continued to push lower.
While credit markets have improved, municipal issuers have continued to feel the ongoing effects of the financial crisis. Many states and local governments are facing increasingly difficult budget problems; these issuers are finding money market funding very expensive or virtually impossible until their financial situations improve. Thus, seasonal borrowers such as California, Illinois and Michigan are largely missing from the holdings of most
36
| |
Alpine Ultra Short Tax Optimized Income Fund |
|
| | |
money market funds. For other borrowers who are able to access the money markets for funding, the current record-low rates have been a huge benefit.
After short-term interest rates fell to historic lows, we further reduced the Fund’s average maturity weighted to a range that continues to be shorter than industry averages in case of unexpected liquidity needs. Because yield differences have become relatively narrow along the market’s maturity range, this conservative positioning has not detracted materially from the Fund’s performance. Until we start to see rates trend higher we will continue to hold a significant portion of the Fund in variable rate demand notes and other short maturing municipal securities.
Outlook
While there could be additional supply/demand imbalances or possible credit rating downgrades, we believe overall that the municipal market is still a high quality market. We will continue to remain cautious until we feel that the markets have adjusted to where yields are more reflective of credit quality. At that point we will reposition our Funds accordingly.
Sincerely,
Steven C. Shachat
Portfolio Managers
| |
|
An investment in the Alpine Municipal Money Market Fund is neither insured nor guaranteed by the Federal Deposit Insurance Corporation or any other government agency. Although the Fund seeks to preserve the value of your investment at $1.00 per share, it is possible to lose money by investing in the Fund. |
Investing in these Funds involves special risks, including but not limited to, investing in municipal obligations and derivative securities, mortgage-related and asset-backed investments. Please refer to the prospectus for further details. Investments in debt securities typically decrease in value when interest rates rise. This risk is usually greater for longer-term debt securities. Income from tax-exempt funds may be subject to state and local taxes and a portion of income may be subject to the federal alternative minimum tax for certain investors. The Alpine Ultra Short Tax Optimized Fund is permitted to invest in Asset Backed and Mortgage- Backed Securities. Investments in these securities include additional risks that investors should be aware of and are more fully described in the prospectus. The Alpine Ultra Short Tax Optimized Fund has never invested in, does not currently hold, nor has any plans to invest in such securities.
Please refer to the Schedule of Portfolio Investments for fund holding information. Fund holdings and sector allocations are subject to change and should not be considered a recommendation to buy or sell any security. Current and future portfolio holdings are subject to risk.
Lipper Analytical Services, Inc. is an independent mutual fund research and rating service. Each Lipper average represents a universe of Funds with similar invest objectives. Rankings for the periods shown include dividends and distributions reinvested and do not reflect sales charges.
For each fund with at least a three-year history, Morningstar calculates a Morningstar Rating™ (based on a Morningstar Risk Adjusted Return measure that accounts for variation in a fund’s monthly performance, including the effects of sales charges, loads, and redemption fees), placing more emphasis on downward variations and rewarding consistent performance. The top 10% of funds in each category receive 5 stars, the next 22.5% receive 4 stars, the next 35% receive 3 stars, the next 22.5% receive 2 stars and the bottom 10% receive 1 star. (Each share class is counted as a fraction of one fund within this scale and rated separately, which may cause slight variations in the distribution percentages.) The Alpine Ultra Short Tax Optimized Income Fund – Investor Class Shares received 4 stars among 123 funds for the three-year, and received 5 stars among 117 Muni National Short funds for the five-year periods ending 10/31/2009.
©2009 Morningstar, Inc. All Rights Reserved. The information contained herein (1) is proprietary to Morningstar (2) may not be copied or distributed and (3) is not warranted to be accurate, complete or timely. Neither Morningstar nor its content providers are responsible for any damages or losses arising from any use of this information, Past performance is no guarantee of future results.
The federal government guarantees interest payments from government securities, such as U.S. Treasury bills, while dividend payments carry no such guarantee. Government securities, if held to maturity, guarantee the timely payment of principal and interest.
Any tax or legal information provided is merely a summary of our understanding and interpretation of some of the current income tax regulations and is not exhaustive. Investors must consult their tax advisor or legal counsel for advice and information concerning their particular situation. Neither the Fund nor any of its representatives may give legal or tax advice.
Cash flow: measures the cash generating capability of a company by adding non-cash charges (e.g. depreciation) and interest expense to pretax income.
37
| |
Alpine Municipal Money Market Fund |
|
|
| | | | | | | | | | | | | | | | |
| |
Comparative Annualized Returns as of 10/31/09 (Unaudited) |
|
| | 6 Months (1) | | 1 Year | | 3 Years | | 5 Years | | Since Inception
(12/5/02) | |
|
|
|
|
|
|
|
|
|
|
|
|
Alpine Municipal Money Market Fund — Investor Class | | 0.38 | % | | 1.03 | % | | 2.54 | % | | 2.64 | % | | 2.21 | % | |
|
|
|
|
|
|
|
|
|
|
|
|
|
|
|
|
|
Lipper Tax-Exempt Money Market Funds Average(2) | | 0.06 | % | | 0.29 | % | | 1.79 | % | | 1.93 | % | | 1.56 | % | |
|
|
|
|
|
|
|
|
|
|
|
|
|
|
|
|
|
Lipper Tax-Exempt Money Market Fund Rank — Investor Class(2) | | N/A | | | 1/101 | | 1/90 | | 1/82 | | 1/71 | |
|
|
|
|
|
|
|
|
|
|
|
|
|
|
|
|
|
Alpine Municipal Money Market Fund — Investor Class, 7-day effective yield (as of 10/31/09): 0.42% |
|
|
|
|
|
|
|
|
|
|
|
|
|
|
|
|
|
Gross Expense Ratio: 0.49%(3) | | | | | | | | | | | | | | | | |
|
|
|
|
|
|
|
|
|
|
|
|
|
|
|
|
|
Net Expense Ratio: 0.49%(3) | | | | | | | | | | | | | | | | |
| |
| |
(1) Not annualized. FINRA does not recognize rankings for less than one year. |
(2) The since inception return and ranking represents the annualized return for the period beginning 12/31/2002. |
(3) As disclosed in the prospectus dated February 27, 2009. |
Note, the yield more closely reflects the current earnings of the money market fund than the total return. |
Performance data quoted represents past performance and is not predictive of future results. Performance current to the most recent month end may be lower or higher than the performance quoted and may be obtained by calling 1-888-785-5578.
The Lipper Tax-Exempt Money Market Funds Average is an average of funds that invest in high quality municipal obligations with dollar-weighted average maturities of less than 90 days. The Lipper Tax-Exempt Money Market Funds Average is unmanaged and does not reflect the deduction of fees associated with a mutual fund, such as investment adviser fees. Lipper Rankings for the periods shown are based on Fund total returns with dividends and distributions reinvested and do not reflect sales charges. The performance for the Municipal Money Market Fund reflects the deduction of fees for these value-added services. Investors cannot directly invest in an index.
|
| |
Alpine Municipal Money Market Fund vs. Peer Performance (Unaudited) |
|
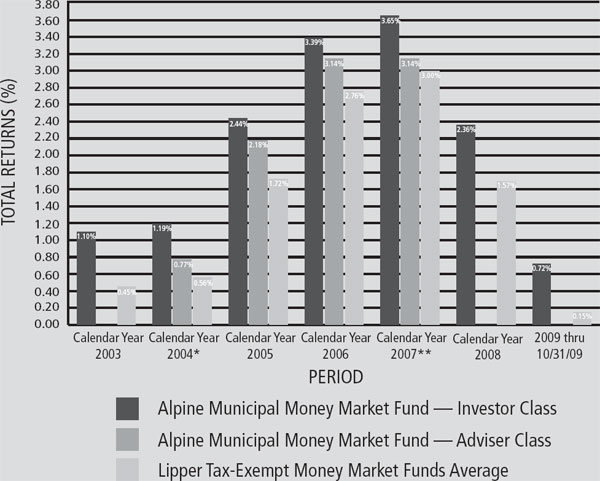
|
|
| |
* | The Adviser Class return for 2004 is from 3/30/04 (inception)–12/31/04. |
** | The Adviser Class return for 2007 is from 1/01/07–12/05/07 (class ceased operations) |
| |
The graph and the table do not reflect the deduction of taxes that a shareholder would pay on Fund distributions or the redemption of Fund shares. Investment performance reflects the waiver of certain fees. Without the waiver of fees, the Fund’s total return would have been lower. |
38
| |
Alpine Municipal Money Market Fund |
|
| | |
| | | | | | | | |
| |
Taxable Equivalent Yield as of 10/31/09 (Unaudited) |
| | | | | | | | |
Joint Return | | Single Return | | Marginal
Tax Rate | | Your Tax-Exempt Effective Yield
of 0.42% is Equivalent to a
Taxable Yield of: | |
|
|
|
|
|
|
|
|
$ 67,901 - 137,050 | | $ | 33,950 - 82,250 | | 25% | | 0.56% | |
|
|
|
|
|
|
|
|
|
$137,051 - 208,850 | | $ | 82,251 - 171,550 | | 28% | | 0.58% | |
|
|
|
|
|
|
|
|
|
$208,851 - 372,950 | | $ | 171,551 - 372,950 | | 33% | | 0.63% | |
|
|
|
|
|
|
|
|
|
Over $372,950 | | Over $372,950 | | 35% | | 0.65% | |
| |
The chart reflects projected 2009 marginal federal tax rates before limitations and phaseouts. Individuals with adjusted gross income in excess of $142,700 should consult a tax professional to determine their actual 2009 marginal tax rate.
| | | | | | | |
| |
|
Portfolio Distributions* (Unaudited) | | Top 10 Holdings* (Unaudited) |
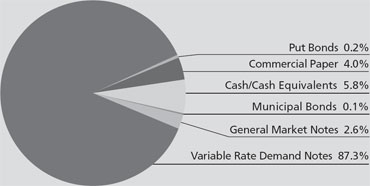
| | 1. | | Port Corpus Christi Authority Nueces County, Texas Solid Waste Disposal, Flint Hills Resources LP, 0.670%, 11/04/2009 | | 4.12% | |
| 2. | | Danville, Kentucky Commercial Paper, 1.700%, 11/05/2009 | | 3.93% | |
| 3. | | BlackRock Liquidity Fund MuniCash Portfolio, 0.240%, 11/02/2009 | | 3.43% | |
| 4. | | Gainesville, Florida Utilities Systems Revenue - Series A, 0.300%, 11/02/2009 | | 3.24% | |
| 5. | | Gulf Coast, Texas Industrial Development Authority Revenue, Citgo Pete, 0.220%, 11/02/2009 | | 3.17% | |
| 6. | | California Infrastructure & Economic Development Bank Revenue, Pacific Gas Electric - Series A, 0.200%, 11/02/2009 | | 2.89% | |
| 7. | | Citizens Property Insurance Corp. of Florida Senior Secured High Risk Notes - Series A-2, 4.500%, 06/01/2010 | | 2.54% | |
| 8. | | Michigan State Hospital Financing Authority, Oaklawn Hospital, 0.240%, 11/05/2009 | | 2.53% | |
| 9. | | Charlotte-Mecklenberg Hospital Authority Revenue - Series E | | 2.53% | |
| 10. | | West Orange, Florida Healthcare District Revenue - Series B, 1.500%, 11/05/2009 | | 2.44% | |
| | | | | | |
|
|
| * | Portfolio holdings and sector distributions are as of 10/31/09 and are subject to change. Portfolio holdings are not recommendations to buy or sell any securities. Portfolio Distributions percentages are based on total investments and Top 10 Holdings percentages are based on total net assets. | |
| | | | | | | |
39
|
Alpine Dynamic Dividend Fund |
| |
Schedule of Portfolio Investments
October 31, 2009
| | | | | | |
Shares | | Security
Description | | Value | |
| |
| |
| |
| | | | |
Common Stocks—98.1% | | | | |
Automobiles & Components—1.1% | | | | |
69,400 | | Hyundai Motor Co. | | $ | 6,427,828 | |
| | | |
|
| |
Banks—0.4% | | | | |
123,800 | | Banco Santander Brasil
SA—ADR (a) | | | 1,468,268 | |
26,200 | | Standard Chartered | | | 645,228 | |
| | | |
|
| |
| | | | | 2,113,496 | |
| | | |
|
| |
Capital Goods—9.9% | | | | |
149,200 | | Albany International Corp. | | | 2,485,672 | |
250,800 | | Atlas Copco AB | | | 3,447,848 | |
15,526,103 | | China State Construction
International Holdings, Ltd. | | | 6,350,513 | |
140,100 | | FLSmidth & Co. A/S | | | 7,465,905 | |
146,200 | | Fluor Corp. | | | 6,494,204 | |
84,800 | | ITT Corp. | | | 4,299,360 | |
42,700 | | Lockheed Martin Corp. | | | 2,937,333 | |
530,600 | | Mitsubishi Corp. | | | 11,653,571 | |
273,100 | | Outotec Oyj | | | 8,669,140 | |
47,900 | | United Technologies Corp. | | | 2,943,455 | |
| | | |
|
| |
| | | | | 56,747,001 | |
| | | |
|
| |
Commercial & Professional Services—0.8% | | | | |
2 | | De La Rue PLC | | | 30 | |
225,070 | | Healthcare Services Group, Inc. | | | 4,445,133 | |
| | | |
|
| |
| | | | | 4,445,163 | |
| | | |
|
| |
Consumer Durables & Apparel—3.6% | | | | |
1,576,300 | | Brookfield Incorporacoes SA | | | 6,075,771 | |
371,200 | | JM AB (a) | | | 5,639,508 | |
702,000 | | PDG Realty SA | | | 5,937,670 | |
38,629 | | VF Corp. | | | 2,744,204 | |
| | | |
|
| |
| | | | | 20,397,153 | |
| | | |
|
| |
Consumer Services—0.8% | | | | |
76,100 | | McDonald’s Corp. | | | 4,460,221 | |
| | | |
|
| |
Diversified Financials—10.2% | | | | |
1,500,000 | | Anglo Irish Bank Corp. PLC (a) | | | — | |
419,574 | | Azimut Holding SpA | | | 5,081,741 | |
337,500 | | Bank of America Corp. | | | 4,920,750 | |
222,100 | | CETIP SA—Balcao Organizado de
Ativos e Derivativos (a) | | | 1,487,727 | |
45,700 | | The Goldman Sachs Group, Inc. | | | 7,776,769 | |
256,200 | | JPMorgan Chase & Co. | | | 10,701,474 | |
145,579 | | Julius Baer Gruppe (a) | | | 5,480,321 | |
686,236 | | KKR & Co. Guernsey LP (a) | | | 6,107,500 | |
1,111,892 | | Man Group PLC | | | 5,657,183 | |
135,200 | | Morgan Stanley | | | 4,342,624 | |
555,700 | | Och-Ziff Capital Management
Group, LLC | | | 6,740,641 | |
| | | |
|
| |
| | | | | 58,296,730 | |
| | | |
|
| |
| | | | | | |
Shares | | Security
Description | | Value | |
| |
| |
| |
| | | | | | |
Common Stocks—continued | | | | |
Energy—12.1% | | | | |
120,100 | | Anadarko Petroleum Corp. | | $ | 7,317,693 | |
44,885 | | Diamond Offshore Drilling, Inc. | | | 4,275,296 | |
225,600 | | Fred Olsen Energy ASA | | | 8,746,783 | |
121,700 | | Frontline, Ltd. | | | 2,839,261 | |
275,100 | | Halliburton Co. | | | 8,035,671 | |
187,500 | | Petroleo Brasileiro SA—ADR | | | 8,666,250 | |
48,400 | | Pride International, Inc. (a) | | | 1,430,704 | |
122,200 | | Schlumberger, Ltd. | | | 7,600,840 | |
555,500 | | SeaDrill, Ltd. (a) | | | 11,603,032 | |
263,600 | | Suncor Energy, Inc. | | | 8,704,072 | |
| | | |
|
| |
| | | | | 69,219,602 | |
| | | |
|
| |
Food & Staples Retailing—1.1% | | | | |
113,000 | | Cia Brasileira de Distribuicao
Grupo Pao de Acucar | | | 3,418,994 | |
59,500 | | Wal-Mart Stores, Inc. | | | 2,955,960 | |
| | | |
|
| |
| | | | | 6,374,954 | |
| |
|
| |
Food, Beverage & Tobacco—4.6% | | | | |
223,500 | | Anheuser-Busch InBev NV | | | 10,526,876 | |
179,544 | | Heineken NV | | | 7,957,157 | |
33,300 | | The J.M. Smucker Co. | | | 1,755,909 | |
123,900 | | Molson Coors Brewing Co. | | | 6,067,383 | |
| | | |
|
| |
| | | | | 26,307,325 | |
| | | |
|
| |
Health Care Equipment & Services—4.3% | | | | |
68,000 | | Alcon, Inc. | | | 9,709,720 | |
151,200 | | Fresenius Medical Care | | | 7,331,812 | |
333,425 | | Meridian Bioscience, Inc. | | | 7,398,701 | |
48,600 | | Sinopharm Group Co. (a) | | | 176,837 | |
| | | |
|
| |
| | | | | 24,617,070 | |
| | | |
|
| |
Household & Personal Products—3.9% | | | | |
355,746 | | Avon Products, Inc. | | | 11,401,659 | |
78,200 | | Colgate-Palmolive Co. | | | 6,148,866 | |
168,236 | | Hypermarcas SA (a) | | | 3,444,751 | |
27,400 | | Oriflame Cosmetics SA—SDR | | | 1,545,349 | |
| | | |
|
| |
| | | | | 22,540,625 | |
| | | |
|
| |
Insurance—0.2% | | | | |
90,200 | | Hilltop Holdings, Inc. (a) | | | 1,067,968 | |
| | | |
|
| |
Materials—12.5% | | | | |
934,300 | | Aquarius Platinum, Ltd. (a) | | | 4,205,035 | |
32,400 | | ArcelorMittal—ADR | | | 1,102,248 | |
91,100 | | BHP Billiton, Ltd.—ADR | | | 5,974,338 | |
196,700 | | Cliffs Natural Resources, Inc. | | | 6,996,619 | |
96,000 | | HeidelbergCement AG | | | 5,754,264 | |
271,197 | | Impala Platinum Holdings, Ltd. | | | 6,052,449 | |
262,103 | | Israel Chemicals, Ltd. | | | 3,121,147 | |
9,247,100 | | Lumena Resources Corp. (a) | | | 3,376,596 | |
370,556 | | Mechel—ADR | | | 6,358,741 | |
41,400 | | Monsanto Co. | | | 2,781,252 | |
17,300 | | Rio Tinto PLC—ADR | | | 3,079,919 | |
318,700 | | Teck Resources, Ltd. (a) | | | 9,216,804 | |
250,500 | | Terra Industries, Inc. | | | 7,958,385 | |
166,400 | | Vedanta Resources PLC | | | 5,716,083 | |
| | | |
|
| |
| | | | | 71,693,880 | |
| | | |
|
| |
The accompanying notes are an integral part of these financial statements.
40
| |
Alpine Dynamic Dividend Fund | |
| | |
Schedule of Portfolio Investments—Continued
October 31, 2009
| | | | | | |
Shares | | Security
Description | | Value | |
| |
| |
| |
| | | | | | |
Common Stocks—continued | | | | |
Media—1.5% | | | | | | |
685,258 | | Regal Entertainment
Group—Class A | | $ | 8,641,103 | |
1 | | Time Warner Cable, Inc. | | | 40 | |
| | | |
|
| |
| | | | | 8,641,143 | |
| | | |
|
| |
Pharmaceuticals, Biotechnology &
Life Sciences—2.1% | | | | |
122,100 | | Abbott Laboratories | | | 6,174,597 | |
121,200 | | Teva Pharmaceutical Industries,
Ltd.—ADR | | | 6,118,176 | |
| | | |
|
| |
| | | | | 12,292,773 | |
| | | |
|
| |
Real Estate—5.6% | | | | |
285,700 | | BR Malls Participacoes SA (a) | | | 3,162,551 | |
10,144,600 | | Glorious Property Holdings,
Ltd. (a) | | | 4,463,509 | |
5,306,025 | | KWG Property Holdings, Ltd. | | | 3,902,395 | |
315,300 | | MRV Engenharia | | | 5,867,129 | |
7,566,100 | | Shenzhen Investment, Ltd. | | | 3,045,887 | |
3,093,500 | | Shui On Land, Ltd. | | | 1,919,916 | |
200,000 | | Starwood Property Trust, Inc. (a) | | | 4,026,000 | |
499,400 | | Westfield Group | | | 5,515,774 | |
| | | |
|
| |
| | | | | 31,903,161 | |
| | | |
|
| |
Retailing—1.0% | | | | | | |
264,900 | | Foot Locker, Inc. | | | 2,776,152 | |
73,800 | | TJX Companies, Inc. | | | 2,756,430 | |
| | | |
|
| |
| | | | | 5,532,582 | |
| | | |
|
| |
Semiconductors & Semiconductor
Equipment—4.5% | | | | |
530,800 | | Intel Corp. | | | 10,143,588 | |
198,100 | | Linear Technology Corp. | | | 5,126,828 | |
433,500 | | Microchip Technology, Inc. | | | 10,386,660 | |
2,419 | | Taiwan Semiconductor
Manufacturing, Ltd.—ADR | | | 23,077 | |
| | | |
|
| |
| | | | | 25,680,153 | |
| | | |
|
| |
Software & Services—3.2% | | | | |
437,400 | | Microsoft Corp. | | | 12,129,102 | |
112,200 | | Shanda Games, Ltd—ADR (a) | | | 1,117,512 | |
139,800 | | Trend Micro, Inc. | | | 4,969,838 | |
| | | |
|
| |
| | | | | 18,216,452 | |
| | | |
|
| |
Technology Hardware & Equipment—2.0% | | | | |
126,500 | | Hewlett-Packard Co. | | | 6,003,690 | |
41,100 | | International Business Machines
Corp. | | | 4,957,071 | |
7,300 | | QUALCOMM, Inc. | | | 302,293 | |
| | | |
|
| |
| | | | | 11,263,054 | |
| | | |
|
| |
| | | | | | |
Shares | | Security
Description | | Value | |
| |
| |
| |
| | | | | | |
Common Stocks—continued | | | | |
Telecommunication Services—4.1% | | | | |
172,400 | | AT&T, Inc. | | $ | 4,425,508 | |
112,400 | | CenturyTel, Inc. | | | 3,648,504 | |
25,720 | | Chunghwa Telecom Co.,
Ltd.—ADR | | | 447,013 | |
177,000 | | Frontier Communications Corp. | | | 1,269,090 | |
402,300 | | Tele2 AB | | | 5,961,681 | |
418,400 | | Vimpel Communications—ADR (a) | | | 7,501,912 | |
| | | |
|
| |
| | | | | 23,253,708 | |
| | | |
|
| |
Transportation—4.2% | | | | |
800 | | A P Moller—Maersk AS | | | 5,504,968 | |
259,800 | | Cia de Concessoes Rodoviarias | | | 5,132,289 | |
60,900 | | CSX Corp. | | | 2,568,762 | |
63,200 | | Norfolk Southern Corp. | | | 2,946,384 | |
92,100 | | Union Pacific Corp. | | | 5,078,394 | |
249,100 | | Westshore Terminals Income
Fund | | | 2,932,890 | |
| | | |
|
| |
| | | | | 24,163,687 | |
| | | |
|
| |
Utilities—4.4% | | | | | |
266,800 | | Endesa SA | | | 8,908,908 | |
58,600 | | FPL Group, Inc. | | | 2,877,260 | |
311,800 | | ITC Holdings Corp. | | | 13,850,156 | |
| | | |
|
| |
| | | | | 25,636,324 | |
| | | |
|
| |
| | Total Common Stocks
(Cost $544,018,575) | | | 561,292,053 | |
| | | |
|
| |
Short-Term Investments—0.0% | | | | |
984 | | Alpine Municipal Money
Market Fund, 0.42% | | | 984 | |
335 | | Federated Treasury Obligations
Fund, 0.01% | | | 335 | |
| | | |
|
| |
| | Total Short-Term Investments
(Cost $1,319) | | | 1,319 | |
| | | |
|
| |
| | Total Investments
(Cost $544,019,894)—98.1% | | | 561,293,372 | |
| | Other Assets in Excess of
Liabilities—1.9% | | | 10,858,035 | |
| | | |
|
| |
| | TOTAL NET ASSETS—100.0% | | $ | 572,151,407 | |
| | | |
|
| |
| |
|
Percentages are stated as a percent of net assets. |
|
ADR—American Depository Receipt |
SDR—Special Drawing Rights |
| |
(a) | Non-income producing security. |
The accompanying notes are an integral part of these financial statements.
41
| |
Alpine Accelerating Dividend Fund | |
| | |
Schedule of Portfolio Investments
October 31, 2009
| | | | | | |
Shares | | Security
Description | | Value | |
| |
| |
| |
| | | | |
Common Stocks—99.2% | | | | |
Aerospace & Defense—2.5% | | | | |
500 | | United Technologies Corp. | | $ | 30,725 | |
Chemicals—7.9% | |
|
| |
350 | | Air Products & Chemicals, Inc. | | | 26,995 | |
350 | | Praxair, Inc. | | | 27,804 | |
800 | | Sigma-Aldrich Corp. | | | 41,544 | |
| | | |
|
| |
| | | | | 96,343 | |
| | | |
|
| |
Commercial Banks—1.8% | | | | |
3,000 | | Banco Panamericano SA | | | 11,155 | |
1,000 | | Pacific Continental Corp. | | | 10,900 | |
| | | |
|
| |
| | | | | 22,055 | |
| | | |
|
| |
Construction Materials—0.5% | | | | |
100 | | HeidelbergCement AG | | | 5,994 | |
| | | |
|
| |
Consumer Finance—1.2% | | | | |
1,000 | | Discover Financial Services | | | 14,140 | |
| | | |
|
| |
Containers & Packaging—2.7% | | | | |
1,250 | | Sonoco Products Co. | | | 33,437 | |
| | | |
|
| |
Diversified Consumer Services—2.0% | | | | |
1,200 | | Hillenbrand, Inc. | | | 23,976 | |
| | | |
|
| |
Diversified Financial Services—3.5% | | | | |
70 | | CME Group, Inc. | | | 21,183 | |
500 | | JPMorgan Chase & Co. | | | 20,885 | |
| | | |
|
| |
| | | | | 42,068 | |
| | | |
|
| |
Diversified Telecommunication Services—1.7% | | | | |
800 | | AT&T, Inc. | | | 20,536 | |
| | | |
|
| |
Electric Utilities—7.9% | | | | |
600 | | Companhia de Transmissao de
Energia Electrica Paulista | | | 16,550 | |
400 | | CPFL Energia SA—ADR | | | 20,912 | |
600 | | Exelon Corp. | | | 28,176 | |
1,300 | | Light SA | | | 18,132 | |
400 | | Southern Co. | | | 12,476 | |
| | | |
|
| |
| | | | | 96,246 | |
| | | |
|
| |
Energy Equipment & Services—1.0% | | | | |
400 | | Halliburton Co. | | | 11,684 | |
| | | |
|
| |
Food & Staples Retailing—5.1% | | | | |
1,250 | | Sysco Corp. | | | 33,062 | |
750 | | Walgreen Co. | | | 28,373 | |
| | | |
|
| |
| | | | | 61,435 | |
| | | |
|
| |
Food Products—5.4% | | | | |
550 | | Campbell Soup Co. | | | 17,462 | |
325 | | General Mills, Inc. | | | 21,424 | |
500 | | The J.M. Smucker Co. | | | 26,365 | |
| | | |
|
| |
| | | | | 65,251 | |
| | | |
|
| |
Health Care Equipment & Supplies—7.7% | | | | |
350 | | Alcon, Inc. | | | 49,976 | |
400 | | Becton, Dickinson & Co. | | | 27,344 | |
500 | | DENTSPLY International, Inc. | | | 16,480 | |
| | | |
|
| |
| | | | | 93,800 | |
| | | |
|
| |
Household Products—4.6% | | | | |
550 | | Kimberly-Clark Corp. | | | 33,638 | |
700 | | WD-40 Co. | | | 22,043 | |
| | | |
|
| |
| | | | | 55,681 | |
| | | |
|
| |
| | | | | | |
Shares | | Security
Description | | Value | |
| |
| |
| |
| | | | | | |
Common Stocks—continued | | | | |
Independent Power Producers & Energy
Traders—0.5% |
500 | | AES Tiete SA | | $ | 5,634 | |
| | | |
|
| |
Industrial Conglomerates—1.8% | | | | |
650 | | Tyco International Ltd. | | | 21,807 | |
| | | |
|
| |
Insurance—6.6% | | | | |
500 | | Arthur J. Gallagher & Co. | | | 11,155 | |
800 | | Chubb Corp. | | | 38,816 | |
1,200 | | Hilltop Holdings, Inc. (a) | | | 14,208 | |
800 | | Protective Life Corp. | | | 15,400 | |
| | | |
|
| |
| | | | | 79,579 | |
| | | |
|
| |
IT Services—3.6% | | | | |
2,900 | | Cia Brasileira de Meios de
Pagamento | | | 26,587 | |
600 | | Telvent GIT SA | | | 17,250 | |
| | | |
|
| |
| | | | | 43,837 | |
| | | |
|
| |
Machinery—2.3% | | | | |
775 | | Snap-On, Inc. | | | 28,311 | |
| | | |
|
| |
Media—1.3% | | | | |
1,100 | | Comcast Corp.—Class A | | | 15,950 | |
| | | |
|
| |
Multi-Utilities—1.4% | | | | |
400 | | Wisconsin Energy Corp. | | | 17,468 | |
| | | |
|
| |
Oil, Gas & Consumable Fuels—8.4% | | | | |
300 | | Anadarko Petroleum Corp. | | | 18,279 | |
500 | | Chevron Corp. | | | 38,270 | |
1,400 | | El Paso Pipeline Partners LP | | | 30,828 | |
200 | | Occidental Petroleum Corp. | | | 15,176 | |
| | | |
|
| |
| | | | | 102,553 | |
| | | |
|
| |
Pharmaceuticals—0.8% | | | | |
200 | | Abbott Laboratories | | | 10,114 | |
| | | |
|
| |
Road & Rail—6.1% | | | | |
400 | | Burlington Northern Santa Fe
Corporation | | | 30,128 | |
500 | | Norfolk Southern Corp. | | | 23,310 | |
3,000 | | Tegma Gestao Logistica SA | | | 20,930 | |
| | | |
|
| |
| | | | | 74,368 | |
| | | |
|
| |
Semiconductors & Semiconductor
Equipment—4.3% | | | | |
1,500 | | Intel Corp. | | | 28,665 | |
900 | | Linear Technology Corp. | | | 23,292 | |
| | | |
|
| |
| | | | | 51,957 | |
| | | |
|
| |
Specialty Retail—1.3% | | | | |
1,500 | | Foot Locker, Inc. | | | 15,720 | |
| | | |
|
| |
Thrifts & Mortgage Finance—2.5% | | | | |
1,200 | | Brookline Bancorp Inc. | | | 11,748 | |
1,713 | | Ocwen Financial Corp. (a) | | | 18,723 | |
| | | |
|
| |
| | | | | 30,471 | |
| | | |
|
| |
Transportation Infrastructure—1.9% | | | | |
1,200 | | Companhia de Concessoes
Rodoviarias | | | 23,706 | |
| | | |
|
| |
Water Utilities—0.9% | | | | |
1,940 | | Cascal NV | | | 10,515 | |
| | | |
|
| |
| | Total Common Stocks
(Cost $1,069,723) | | | 1,205,361 | |
| | | |
|
| |
The accompanying notes are an integral part of these financial statements.
42
|
Alpine Accelerating Dividend Fund |
| |
Schedule of Portfolio Investments—Continued
October 31, 2009
| | | | | | |
Shares | | Security
Description | | Value | |
| |
| |
| |
| | | | |
Short-Term Investments—0.6% | | | | |
7,760 | | Federated Treasury Obligations
Fund, 0.01% | | $ | 7,760 | |
| | | |
|
| |
| | Total Short-Term Investments
(Cost $7,760) | | | 7,760 | |
| | | |
|
| |
| | Total Investments
(Cost $1,077,483)—99.8% | | | 1,213,121 | |
| | Other Assets in Excess of
Liabilities—0.2% | | | 1,465 | |
| | | |
|
| |
| | TOTAL NET ASSETS—100.0% | | $ | 1,214,586 | |
| | | |
|
| |
| | |
|
Percentages are stated as a percent of net assets. |
|
ADR—American Depository Receipt |
| |
(a) | Non-income producing security. |
The accompanying notes are an integral part of these financial statements.
43
| |
Alpine Dynamic Financial Services Fund | |
| | |
Schedule of Portfolio Investments
October 31, 2009
| | | | | | |
Shares | | Security
Description | | | Value | |
| |
| |
|
| |
| | | | |
Common Stocks—102.8% | | | | |
Capital Markets—17.3% | | | | |
30,850 | | BGC Partners, Inc. | | $ | 149,006 | |
20,000 | | Blackstone Group LP | | | 268,400 | |
19,700 | | Cowen Group, Inc. (a) | | | 148,735 | |
18,500 | | GFI Group, Inc. | | | 95,275 | |
2,000 | | Investment Technology Group,
Inc. (a) | | | 43,140 | |
5,000 | | JMP Group, Inc. | | | 42,100 | |
1,000 | | Legg Mason, Inc. | | | 29,110 | |
25,100 | | MF Global Ltd. (a) | | | 178,712 | |
2,000 | | Och-Ziff Capital Management
Group LLC | | | 24,260 | |
7,500 | | OptionsXpress Holdings, Inc. | | | 117,225 | |
36,040 | | Sanders Morris Harris Group, Inc. | | | 209,392 | |
6,900 | | Thomas Weisel Partners Group,
Inc. (a) | | | 31,257 | |
4,000 | | TradeStation Group, Inc. (a) | | | 30,880 | |
| | | |
|
| |
| | | | | 1,367,492 | |
| | | |
|
| |
Commercial Banks—51.8% | | | | |
45,165 | | 1st United Bancorp, Inc. (a) | | | 254,731 | |
55,000 | | Banco do Estado do Rio Grande
do Sul SA | | | 359,049 | |
26,600 | | Banco Panamericano SA | | | 98,904 | |
9,800 | | Banco Santander Brasil
SA—ADR (a) | | | 116,228 | |
90,000 | | The Bancorp, Inc. (a) | | | 459,000 | |
12,400 | | Bank of Florida Corp. (a) | | | 18,104 | |
2,428 | | Barclays PLC (a) | | | 12,832 | |
15,000 | | California United Bank (a) | | | 189,300 | |
4,000 | | Cardinal Financial Corp. | | | 32,600 | |
26,600 | | Centerstate Banks, Inc. | | | 200,298 | |
21,194 | | Citizens First Corp. | | | 178,030 | |
4,700 | | Community National Bank of the
Lakeway Area (a) | | | 9,165 | |
25,000 | | First Bancorp of Puerto Rico | | | 47,250 | |
4,000 | | First Business Financial Services,
Inc. | | | 38,000 | |
1,260 | | First Community Bank Corp. of
America (a) | | | 4,813 | |
1,500 | | Hampton Roads Bankshares, Inc. | | | 3,075 | |
35,000 | | Marshall & Ilsley Corp. | | | 186,200 | |
930 | | MB Financial, Inc. | | | 16,628 | |
30,000 | | Metro Bancorp Inc. (a) | | | 354,900 | |
11,600 | | Nara Bancorp, Inc. | | | 85,376 | |
10,200 | | New Centry Bancorp, Inc. (a) | | | 57,630 | |
2,000 | | North Valley Bancorp | | | 5,540 | |
2,375 | | Old Point Financial Corp. | | | 35,696 | |
12,042 | | Pacific Mercantile Bancorp (a) | | | 35,765 | |
3,120 | | Rurban Financial Corp. | | | 23,712 | |
100,000 | | Seacoast Banking Corp. of Florida | | | 149,000 | |
2,388 | | The South Financial Group, Inc. | | | 1,910 | |
38,750 | | Southern National Bancorp of
Virginia, Inc. (a) | | | 240,250 | |
5,000 | | State Bancorp, Inc. | | | 38,200 | |
2,500 | | Sterling Bancorp | | | 16,825 | |
7,500 | | Sterling Bancshares, Inc. | | | 41,775 | |
6,000 | | Summit State Bank | | | 33,120 | |
500 | | Superior Bancorp (a) | | | 1,060 | |
141,443 | | Synovus Financial Corp. | | | 314,003 | |
| | | | | | |
Shares | | Security
Description | | | Value | |
| |
| |
|
| |
| | | | | | |
Common Stocks—continued | | | | |
Commercial Banks—continued | | | | |
15,000 | | Tidelands Bancshares, Inc. (a) | | $ | 51,900 | |
15,000 | | Union Bankshares Corp. | | | 184,800 | |
34,300 | | United Community Banks, Inc. (a) | | | 139,258 | |
2,430 | | Valley Commerce Bancorp (a) | | | 18,104 | |
1,000 | | Wintrust Financial Corp. | | | 28,210 | |
1,974 | | Yadkin Valley Financial Corp. | | | 7,264 | |
| | | |
|
| |
| | | | | 4,088,505 | |
| | | |
|
| |
Diversified Financial Services—14.4% | | | | |
7,124 | | BM&F Bovespa SA | | | 46,102 | |
125,000 | | Bolsa Mexicana de Valores SA
de CV (a) | | | 143,330 | |
665 | | CME Group, Inc. | | | 201,236 | |
5,173 | | Interactive Brokers Group, Inc. (a) | | | 82,820 | |
4,315 | | IntercontinentalExchange, Inc. (a) | | | 432,320 | |
7,000 | | The NASDAQ OMX Group, Inc. (a) | | | 126,420 | |
4,000 | | NYSE Euronext | | | 103,400 | |
| | | |
|
| |
| | | | | 1,135,628 | |
| | | |
|
| |
Industrial Conglomerates—1.3% | | | | |
7,000 | | General Electric Co. | | | 99,820 | |
| | | |
|
| |
Insurance—1.6% | | | | |
8,000 | | CRM Holdings, Ltd. (a) | | | 7,600 | |
4,700 | | Tower Group, Inc. | | | 115,526 | |
| | | |
|
| |
| | | | | 123,126 | |
| | | |
|
| |
Professional Services—0.4% | | | | |
3,500 | | Experian PLC | | | 32,111 | |
| | | |
|
| |
Real Estate Investment Trusts—3.3% | | | | |
10,000 | | American Capital Agency Corp. | | | 260,000 | |
| | | |
|
| |
Thrifts & Mortgage Finance—11.5% | | | | |
30,398 | | Alliance Bancorp, Inc. of
Pennsylvania | | | 261,575 | |
1,700 | | Astoria Financial Corp. | | | 16,966 | |
5,000 | | Central Federal Corp. | | | 10,050 | |
2,144 | | Fidelity Bancorp, Inc. | | | 11,963 | |
10,000 | | First Keystone Financial, Inc. (a) | | | 93,750 | |
5,895 | | First Pactrust Bancorp, Inc. | | | 29,357 | |
1,100 | | Parkvale Financial Corp. | | | 9,911 | |
130,000 | | United Western Bancorp, Inc. | | | 477,100 | |
| | | |
|
| |
| | | | | 910,672 | |
| | | |
|
| |
Transportation Infrastructure—1.2% | | | | |
13,000 | | CAI International, Inc. (a) | | | 97,500 | |
| | | |
|
| |
| | Total Common Stocks
(Cost $12,629,025) | | | 8,114,854 | |
| | | |
|
| |
Investment Companies—3.7% | | | | |
30,000 | | Allied Capital Corp. (a) | | | 93,600 | |
1,950 | | Direxion Daily Financial Bear 3X
Shares (a) | | | 44,694 | |
4,000 | | Direxion Daily Large Cap Bear 3X
Shares (a) | | | 89,120 | |
2,500 | | ProShares UltraShort Financials (a) | | | 67,500 | |
| | | | | 294,914 | |
| | | |
|
| |
| | Total Investment Companies
(Cost $944,694) | | | 294,914 | |
| | | |
|
| |
The accompanying notes are an integral part of these financial statements.
44
| |
Alpine Dynamic Financial Services Fund | |
| | |
Schedule of Portfolio Investments—Continued
October 31, 2009
| | | | | | |
Shares | | Security
Description | | | Value | |
| |
| |
|
| |
|
Short-Term Investments—0.0% | | | | |
883 | | Federated Treasury Obligations
Fund, 0.01% | | $ | 883 | |
| | | |
|
| |
| | Total Short-Term Investments
(Cost $883) | | | 883 | |
| | | |
|
| |
| | Total Investments
(Cost $13,574,602)—106.5% | | | 8,410,651 | |
| | Liabilities in Excess of Other
Assets—(6.5)% | | | (515,718) | |
| | | |
|
| |
| | TOTAL NET ASSETS—100.0% | | $ | 7,894,933 | |
| | | |
|
| |
| | |
|
Percentages are stated as a percent of net assets. |
| |
ADR—American Depository Receipt |
| |
(a) | Non-income producing security. |
The accompanying notes are an integral part of these financial statements.
45
| |
Alpine Dynamic Innovators Fund | |
| | |
Schedule of Portfolio Investments
October 31, 2009
| | | | | | |
Shares | | Security
Description | | Value | |
| |
| |
| |
|
Common Stocks—113.6% | | | | |
Aerospace & Defense—1.9% | | | | |
4,000 | | Aerovironment, Inc. (a) | | $ | 106,640 | |
10,000 | | Hexcel Corp. (a) | | | 110,000 | |
| | | |
|
| |
| | | | | 216,640 | |
| | | |
|
| |
Auto Components—2.9% | | | | |
32,857 | | Westport Innovations, Inc. (a) | | | 324,911 | |
| | | |
|
| |
Chemicals—4.9% | | | | |
7,000 | | Air Products & Chemicals, Inc. | | | 539,910 | |
| | | |
|
| |
Commercial Banks—1.9% | | | | |
11,000 | | SunTrust Banks, Inc. | | | 210,210 | |
| | | |
|
| |
Communications Equipment—1.1% | | | | |
30,000 | | Alvarion, Ltd. (a) | | | 117,900 | |
| | | |
|
| |
Computers & Peripherals—11.9% | | | | |
5,000 | | Hewlett-Packard Co. | | | 237,300 | |
33,000 | | Logitech International SA (a) | | | 561,000 | |
26,000 | | Stratasys, Inc. (a) | | | 410,280 | |
5,000 | | Synaptics, Inc. (a) | | | 112,500 | |
| | | |
|
| |
| | | | | 1,321,080 | |
| | | |
|
| |
Diversified Financial Services—4.9% | | | | |
500 | | CME Group, Inc. | | | 151,305 | |
8,500 | | Portfolio Recovery Associates,
Inc. (a) | | | 392,190 | |
| | | |
|
| |
| | | | | 543,495 | |
| | | |
|
| |
Electrical Equipment—6.5% | | | | |
35,000 | | LSI Industries, Inc. | | | 244,650 | |
57,000 | | PowerSecure International,
Inc. (a) | | | 474,240 | |
| | | |
|
| |
| | | | | 718,890 | |
| | | |
|
| |
Electronic Equipment, Instruments &
Components—13.0% | | | | |
21,000 | | FLIR Systems, Inc. (a) | | | 584,010 | |
13,000 | | Itron, Inc. (a) | | | 780,520 | |
9,870 | | MOCON, Inc. | | | 79,453 | |
| | | |
|
| |
| | | | | 1,443,983 | |
| | | |
|
| |
Energy Equipment & Services—0.9% | | | | |
25,000 | | ION Geophysical Corp. (a) | | | 95,750 | |
| | | |
|
| |
Health Care Equipment & Supplies—16.1% | | | | |
10,000 | | ABIOMED, Inc. (a) | | | 90,500 | |
4,000 | | Alcon, Inc. | | | 571,160 | |
10,000 | | ArthroCare Corp. (a) | | | 190,000 | |
1,400 | | Intuitive Surgical, Inc. (a) | | | 344,890 | |
10,000 | | Medtronic, Inc. | | | 357,000 | |
19,846 | | Synovis Life Technologies, Inc. (a) | | | 239,343 | |
| | | |
|
| |
| | | | | 1,792,893 | |
| | | |
|
| |
Health Care Providers & Services—11.1% | | | | |
15,000 | | Chindex International, Inc. (a) | | | 209,100 | |
3,000 | | HMS Holdings Corp. (a) | | | 128,790 | |
28,000 | | inVentiv Health, Inc. (a) | | | 475,440 | |
8,000 | | MEDNAX, Inc. (a) | | | 415,360 | |
| | | |
|
| |
| | | | | 1,228,690 | |
| | | |
|
| |
Health Care Technology—2.0% | | | | |
5,000 | | Allscripts-Misys Healthcare
Solutions, Inc. (a) | | | 97,500 | |
2,000 | | Quality Systems, Inc. | | | 122,040 | |
| | | |
|
| |
| | | | | 219,540 | |
| | | |
|
| |
| | | | | | |
Shares | | Security
Description | | Value | |
| |
| |
| |
|
Common Stocks—continued | | | | |
Hotels, Restaurants & Leisure—1.9% | | | | |
10,000 | | Life Time Fitness, Inc. (a) | | $ | 215,500 | |
| | | |
|
| |
Internet & Catalog Retail—5.7% | | | | |
4,000 | | Priceline.com, Inc. (a) | | | 631,160 | |
| | | |
|
| |
Internet Software & Services—2.4% | | | | |
500 | | Google, Inc. (a) | | | 268,060 | |
| | | |
|
| |
IT Services—2.4% | | | | |
5,000 | | Redecard SA—ADR (b) | | | 156,750 | |
3,906 | | Telvent GIT SA | | | 112,298 | |
| | | |
|
| |
| | | | | 269,048 | |
| | | |
|
| |
Life Sciences Tools & Services—8.0% | | | | |
10,000 | | Charles River Laboratories
International, Inc. (a) | | | 365,200 | |
11,000 | | Life Technologies Corp. (a) | | | 518,870 | |
| | | |
|
| |
| | | | | 884,070 | |
| | | |
|
| |
Machinery—5.7% | | | | |
4,000 | | Flowserve Corp. | | | 392,840 | |
5,391 | | Middleby Corp. (a) | | | 244,266 | |
| | | |
|
| |
| | | | | 637,106 | |
| | | |
|
| |
Metals & Mining—0.9% | | | | |
125,000 | | Imdex, Ltd. | | | 97,328 | |
| | | |
|
| |
Personal Products—1.2% | | | | |
6,000 | | Medifast, Inc. (a) | | | 132,120 | |
| | | |
|
| |
Software—6.3% | | | | |
16,400 | | ANSYS, Inc. (a) | | | 665,512 | |
8,000 | | Scientific Learning Corp. (a) | | | 40,400 | |
| | | |
|
| |
| | | | | 705,912 | |
| | | |
|
| |
| | Total Common Stocks
(Cost $16,077,653) | | | 12,614,196 | |
| | | |
|
| |
Short-Term Investments—0.0% | | | | |
363 | | Federated Treasury Obligations
Fund, 0.01% | | | 363 | |
| | | |
|
| |
| | Total Short-Term Investments
(Cost $363) | | | 363 | |
| | | |
|
| |
| | Total Investments
(Cost $16,078,016)—113.6% | | | 12,614,559 | |
| | Liabilities in Excess of Other
Assets—(13.6)% | | | (1,507,044) | |
| | | |
|
| |
| | TOTAL NET ASSETS—100.0% | | $ | 11,107,515 | |
| | | |
|
| |
| |
|
Percentages are stated as a percent of net assets. |
|
ADR—American Depository Receipt |
|
(a) | Non-income producing security. |
|
(b) | Restricted under Rule 144A of the Securities Act of 1933. These securities may be resold in transactions exempt from registration, normally to qualified institutional buyers. These securities have been determined to be liquid under guidelines established by the Board of Trustees. Securities restricted under Rule 144A comprised 1.4% of the Fund’s net assets. |
The accompanying notes are an integral part of these financial statements.
46
| |
Alpine Dynamic Transformations Fund | |
| | |
Schedule of Portfolio Investments
October 31, 2009
| | | | | | |
Shares | | Security
Description | | Value | |
| |
| |
| |
|
Common Stocks—93.0% | | | | |
Aerospace & Defense—3.2% | | | | |
1,500 | | Aerovironment, Inc. (a) | | $ | 39,990 | |
4,000 | | BE Aerospace, Inc. (a) | | | 70,920 | |
| | | |
|
| |
| | | | | 110,910 | |
| | | |
|
| |
Air Freight & Logistics—2.3% | | | | |
3,100 | | Atlas Air Worldwide Holdings,
Inc. (a) | | | 81,499 | |
| | | |
|
| |
Auto Components—7.5% | | | | |
6,000 | | Autoliv, Inc. | | | 201,480 | |
10,000 | | Exide Technologies (a) | | | 61,200 | |
| | | |
|
| |
| | | | | 262,680 | |
| | | |
|
| |
Chemicals—3.1% | | | | |
10,000 | | Flotek Industries, Inc. (a) | | | 16,100 | |
2,000 | | Mosaic Co. | | | 93,460 | |
| | | |
|
| |
| | | | | 109,560 | |
| | | |
|
| |
Commercial Banks—3.0% | | | | |
1,000 | | PNC Financial Services Group, Inc. | | | 48,940 | |
1,991 | | Wells Fargo & Co. | | | 54,792 | |
| | | |
|
| |
| | | | | 103,732 | |
| | | |
|
| |
Commercial Services & Supplies—4.3% | | | | |
2,700 | | Clean Harbors, Inc. (a) | | | 152,415 | |
| | | |
|
| |
Computers & Peripherals—6.3% | | | | |
3,000 | | Hewlett-Packard Co. | | | 142,380 | |
5,000 | | Stratasys, Inc. (a) | | | 78,900 | |
| | | |
|
| |
| | | | | 221,280 | |
| | | |
|
| |
Diversified Financial Services—5.2% | | | | |
600 | | CME Group, Inc. | | | 181,566 | |
| | | |
|
| |
Electronic Equipment, Instruments &
Components—3.9% | | | | |
4,940 | | FLIR Systems, Inc. (a) | | | 137,382 | |
| | | |
|
| |
Health Care Equipment & Supplies—14.5% | | | | |
10,000 | | ABIOMED, Inc. (a) | | | 90,500 | |
1,000 | | Intuitive Surgical, Inc. (a) | | | 246,350 | |
3,500 | | Teleflex, Inc. | | | 174,125 | |
| | | |
|
| |
| | | | | 510,975 | |
| | | |
|
| |
Health Care Providers & Services—4.1% | | | | |
3,000 | | Emergency Medical Services
Corp. (a) | | | 144,060 | |
| | | |
|
| |
| | | | | | |
Shares | | Security
Description | | Value | |
| |
| |
| |
|
Common Stocks—continued | | | | |
Hotels, Restaurants & Leisure—2.7% | | | | |
5,000 | | Starbucks Corp. (a) | | $ | 94,900 | |
| | | |
|
| |
Household Durables—2.4% | | | | |
3,000 | | Pulte Homes, Inc. | | | 27,030 | |
3,000 | | Ryland Group, Inc. | | | 55,650 | |
| | | |
|
| |
| | | | | 82,680 | |
| | | |
|
| |
Industrial Conglomerates—1.3% | | | | |
3,300 | | General Electric Co. | | | 47,058 | |
| | | |
|
| |
Internet & Catalog Retail—6.7% | | | | |
1,500 | | Priceline.com, Inc. (a) | | | 236,685 | |
| | | |
|
| |
Machinery—12.2% | | | | |
10,000 | | Pall Corp. | | | 317,400 | |
3,000 | | Snap On, Inc. | | | 109,590 | |
| | | |
|
| |
| | | | | 426,990 | |
| | | |
|
| |
Metals & Mining—5.0% | | | | |
3,000 | | Walter Energy, Inc. | | | 175,500 | |
| | | |
|
| |
Oil, Gas & Consumable Fuels—2.4% | | | | |
2,000 | | CONSOL Energy, Inc. | | | 85,620 | |
| | | |
|
| |
Personal Products—2.5% | | | | |
4,000 | | Medifast, Inc. (a) | | | 88,080 | |
| | | |
|
| |
Real Estate Investment Trusts—0.4% | | | | |
1,095 | | Walter Investment Management
Corp. | | | 14,257 | |
| | | |
|
| |
| | Total Common Stocks
(Cost $3,560,079) | | | 3,267,829 | |
| | | |
|
| |
Short-Term Investments—14.3% | | | | |
501,629 | | Federated Treasury Obligations
Fund, 0.01% | | | 501,629 | |
| | | |
|
| |
| | Total Short-Term Investments
(Cost $501,629) | | | 501,629 | |
| | | |
|
| |
| | Total Investments
(Cost $4,061,708)—107.3% | | | 3,769,458 | |
| | Liabilities in Excess of Other
Assets—(7.3)% | | | (255,253 | ) |
| | | |
|
| |
| | TOTAL NET ASSETS—100.0% | | $ | 3,514,205 | |
| | | |
|
| |
| |
|
Percentages are stated as a percent of net assets. |
|
(a) | Non-income producing security. |
The accompanying notes are an integral part of these financial statements.
47
| |
Alpine Dynamic Balance Fund | |
| | |
Schedule of Portfolio Investments
October 31, 2009
| | | | | | |
Shares | | Security
Description | | Value | |
| |
| |
| |
|
Common Stocks—69.6% | | | | |
Aerospace & Defense—1.0% | | | | |
15,000 | | Honeywell International, Inc. | | $ | 538,350 | |
| | | |
|
| |
Airlines—0.0% | | | | |
3,000 | | AirTran Holdings, Inc. (a) | | | 12,690 | |
| | | |
|
| |
Auto Components—1.9% | | | | |
30,500 | | Autoliv, Inc. | | | 1,024,190 | |
| | | |
|
| |
Capital Markets—2.0% | | | | |
25,900 | | State Street Corp. | | | 1,087,282 | |
| | | |
|
| |
Chemicals—1.8% | | | | |
3,200 | | Air Products & Chemicals, Inc. | | | 246,816 | |
5,000 | | PPG Industries, Inc. | | | 282,150 | |
25,000 | | RPM International, Inc. | | | 440,500 | |
| | | |
|
| |
| | | | | 969,466 | |
| | | |
|
| |
Commercial Banks—4.5% | | | | |
18,000 | | Bancorp Rhode Island, Inc. | | | 459,360 | |
6,000 | | Bank of Florida Corp. (a) | | | 8,760 | |
10,000 | | Pacific Continental Corp. | | | 109,000 | |
5,000 | | PNC Financial Services Group, Inc. | | | 244,700 | |
12,000 | | Regions Financial Corp. | | | 58,080 | |
7,138 | | Southside Bancshares, Inc. | | | 148,399 | |
30,000 | | Valley National Bancorp | | | 398,400 | |
69,501 | | Webster Financial Corp. | | | 786,056 | |
10,432 | | Wells Fargo & Co. | | | 287,089 | |
| | | |
|
| |
| | | | | 2,499,844 | |
| | | |
|
| |
Commercial Services & Supplies—1.0% | | | | |
27,500 | | McGrath RentCorp | | | 543,125 | |
| | | |
|
| |
Construction Materials—2.2% | | | | |
49,199 | | Eagle Materials, Inc. | | | 1,222,595 | |
| | | |
|
| |
Consumer Finance—0.4% | | | | |
5,800 | | The Student Loan Corp. | | | 243,890 | |
| | | |
|
| |
Diversified Financial Services—4.8% | | | | |
43,041 | | Bank of America Corp. | | | 627,538 | |
300 | | CME Group, Inc. | | | 90,783 | |
45,600 | | JPMorgan Chase & Co. | | | 1,904,712 | |
| | | |
|
| |
| | | | | 2,623,033 | |
| | | |
|
| |
Electric Utilities—2.5% | | | | |
51,000 | | Allegheny Energy, Inc. | | | 1,163,820 | |
6,900 | | American Electric Power Co., Inc. | | | 208,518 | |
| | | |
|
| |
| | | | | 1,372,338 | |
| | | |
|
| |
Electrical Equipment—3.0% | | | | |
30,000 | | AMETEK, Inc. | | | 1,046,700 | |
10,700 | | Emerson Electric Co. | | | 403,925 | |
5,000 | | Hubbell, Inc.—Class B | | | 212,650 | |
| | | |
|
| |
| | | | | 1,663,275 | |
| | | |
|
| |
Food & Staples Retailing—3.6% | | | | |
200 | | Arden Group, Inc. | | | 22,554 | |
20,000 | | CVS Caremark Corp. | | | 706,000 | |
20,000 | | Sysco Corp. | | | 529,000 | |
20,000 | | Walgreen Co. | | | 756,600 | |
| | | |
|
| |
| | | | | 2,014,154 | |
| | | |
|
| |
Food Products—1.1% | | | | |
12,000 | | Kellogg Co. | | | 618,480 | |
| | | |
|
| |
| | | | | | |
Shares | | Security
Description | | Value | |
| |
| |
| |
|
Common Stocks—continued | | | | |
Health Care Equipment & Supplies—2.4% | | | | |
8,600 | | Becton, Dickinson & Co. | | $ | 587,896 | |
15,000 | | Teleflex, Inc. | | | 746,250 | |
| | | |
|
| |
| | | | | 1,334,146 | |
| | | |
|
| |
Health Care Providers & Services—1.2% | | | | |
13,000 | | MEDNAX, Inc. (a) | | | 674,960 | |
| | | |
|
| |
Hotels, Restaurants & Leisure—0.5% | | | | |
10,000 | | Darden Restaurants, Inc. | | | 303,100 | |
| | | |
|
| |
Household Durables—1.9% | | | | |
20,000 | | Ethan Allen Interiors, Inc. | | | 249,200 | |
20,000 | | Hovnanian Enterprises,
Inc.—Class A (a) | | | 78,200 | |
28,000 | | Lennar Corp.—Class A | | | 352,800 | |
30,000 | | Pulte Homes, Inc. | | | 270,300 | |
32,000 | | Standard Pacific Corp. (a) | | | 96,000 | |
| | | |
|
| |
| | | | | 1,046,500 | |
| | | |
|
| |
Household Products—1.0% | | | | |
4,000 | | Clorox Co. | | | 236,920 | |
4,000 | | Colgate-Palmolive Co. | | | 314,520 | |
| | | |
|
| |
| | | | | 551,440 | |
| | | |
|
| |
Industrial Conglomerates—3.3% | | | | |
10,000 | | 3M Co. | | | 735,700 | |
74,600 | | General Electric Co. | | | 1,063,796 | |
| | | |
|
| |
| | | | | 1,799,496 | |
| | | |
|
| |
Insurance—0.8% | | | | |
20,000 | | Ambac Financial Group, Inc. | | | 23,000 | |
5,000 | | Chubb Corp. | | | 242,600 | |
12,227 | | Fidelity National Financial,
Inc.—Class A (b) | | | 165,921 | |
| | | |
|
| |
| | | | | 431,521 | |
| | | |
|
| |
IT Services—0.2% | | | | |
5,374 | | Fidelity National Information
Services, Inc. | | | 116,938 | |
| | | |
|
| |
Machinery—2.1% | | | | |
14,800 | | Lincoln Electric Holdings, Inc. | | | 702,112 | |
12,000 | | PACCAR, Inc. | | | 448,920 | |
| | | |
|
| |
| | | | | 1,151,032 | |
| | | |
|
| |
Media—1.0% | | | | |
7,692 | | CBS Corporation—Class B | | | 90,535 | |
15,000 | | The McGraw-Hill Companies, Inc. | | | 431,700 | |
| | | |
|
| |
| | | | | 522,235 | |
| | | |
|
| |
Oil, Gas & Consumable Fuels—6.9% | | | | |
59,000 | | CONSOL Energy, Inc. | | | 2,525,790 | |
8,000 | | El Paso Pipeline Partners LP | | | 176,160 | |
13,000 | | Hess Corp. | | | 711,620 | |
20,000 | | Penn Virginia Corp. | | | 405,000 | |
| | | |
|
| |
| | | | | 3,818,570 | |
| | | |
|
| |
Pharmaceuticals—3.5% | | | | |
7,000 | | Abbott Laboratories | | | 353,990 | |
27,000 | | Johnson & Johnson | | | 1,594,350 | |
| | | |
|
| |
| | | | | 1,948,340 | |
| | | |
|
| |
The accompanying notes are an integral part of these financial statements.
48
| |
Alpine Dynamic Balance Fund | |
| | |
Schedule of Portfolio Investments—Continued
October 31, 2009
| | | | | | |
Shares | | Security
Description | | Value | |
| |
| |
| |
|
Common Stocks—continued | | | | |
Real Estate Investment Trusts—10.6% | | | | |
20,000 | | Annaly Capital Management, Inc. | | $ | 338,200 | |
15,000 | | Boston Properties, Inc. | | | 911,550 | |
100,000 | | CBL & Associates Properties, Inc. | | | 816,000 | |
37,500 | | Cogdell Spencer, Inc. | | | 174,000 | |
13,804 | | Developers Diversified Realty
Corp. | | | 118,576 | |
45,000 | | DiamondRock Hospitality Co. (a) | | | 342,450 | |
10,000 | | Mack-Cali Realty Corp. | | | 309,500 | |
12,700 | | ProLogis | | | 143,891 | |
23,677 | | Simon Property Group, Inc. | | | 1,607,432 | |
42,271 | | Sunstone Hotel Investors, Inc. | | | 319,146 | |
5,000 | | Ventas, Inc. | | | 200,650 | |
30,000 | | Weingarten Realty Investors | | | 555,000 | |
| | | |
|
| |
| | | | | 5,836,395 | |
| | | |
|
| |
Real Estate Management & Development—0.2% | | | | |
8,433 | | Forestar Group, Inc. (a) | | | 124,471 | |
| | | |
|
| |
Road & Rail—1.3% | | | | |
15,000 | | Norfolk Southern Corp. | | | 699,300 | |
| | | |
|
| |
Thrifts & Mortgage Finance—1.0% | | | | |
75,600 | | Federal National Mortgage
Association | | | 81,648 | |
8,433 | | Guaranty Financial Group, Inc. (a) | | | 573 | |
31,500 | | New York Community Bancorp,
Inc. | | | 339,885 | |
12,934 | | Ocwen Financial Corp. (a) | | | 141,369 | |
| | | |
|
| |
| | | | | 563,475 | |
| | | |
|
| |
Trading Companies & Distributors—0.7% | | | | |
15,000 | | WESCO International, Inc. (a) | | | 383,400 | |
| | | |
|
| |
Water Utilities—1.2% | | | | |
31,200 | | SJW Corp. | | | 679,224 | |
| | | |
|
| |
| | Total Common Stocks
(Cost $49,832,996) | | | 38,417,255 | |
| | | |
|
| |
Investment Companies—0.1% | | | | |
10,406 | | Medallion Financial Corp. | | | 81,687 | |
| | | |
|
| |
| | Total Investment Companies
(Cost $90,186) | | | 81,687 | |
| | | |
|
| |
| | | | | | | |
Principal
Amount | | Security
Description | | Value | |
| |
| |
| |
|
Bonds and Notes—25.0% | | | | |
U.S. Treasury Bonds—21.1% | | | | |
$ | 3,000,000 | | 6.000%, 02/15/2026 | | $ | 3,670,782 | |
| 7,000,000 | | 5.250%, 11/15/2028 | | | 7,965,783 | |
| | | | |
|
| |
| | | | | | 11,636,565 | |
| | | | |
|
| |
U.S. Treasury Notes—3.9% | | | | |
| 2,000,000 | | 5.000%, 08/15/2011 | | | 2,152,344 | |
| | | | |
|
| |
| | | Total Bonds and Notes
(Cost $13,505,427) | | | 13,788,909 | |
| | | | |
|
| |
Shares | | | | | | |
| | | | | | |
|
Short-Term Investments—5.4% | | | | |
| 2,991,615 | | Federated Treasury Obligations
Fund, 0.01% | | | 2,991,615 | |
| | | | |
|
| |
| | | Total Short-Term Investments
(Cost $2,991,615) | | | 2,991,615 | |
| | | | |
|
| |
| | | Total Investments
(Cost $66,420,224)—100.1% | | | 55,279,466 | |
| | | Liabilities in Excess of Other
Assets—(0.1)% | | | (49,248) | |
| | | | |
|
| |
| | | TOTAL NET ASSETS—100.0% | | $ | 55,230,218 | |
| | | | |
|
| |
Schedule of Written Option Contracts
October 31, 2009
| | | | | | |
Contracts
(100 shares
per contract) | | | | Value | |
| | | |
| |
|
Call Options | | | | |
122 | | Fidelity National Financial, Inc.
Expiration: December, 2009
Exercise Price: $15.00 | | $ | 4,270 | |
| | | |
|
| |
| | Total Written Options Contracts
(Premiums received $15,494) | | $ | 4,270 | |
| | | |
|
| |
| | |
|
Percentages are stated as a percent of net assets. |
|
(a) | Non-income producing security. |
|
(b) | All or a portion of the shares have been committed as collateral for written option contracts. |
The accompanying notes are an integral part of these financial statements.
49
| |
Alpine Ultra Short Tax Optimized Income Fund | |
| | |
Schedule of Portfolio Investments
October 31, 2009
| | | | | | |
Principal
Amount | | Security
Description | | Value | |
| |
| |
| |
| | | | | | |
Municipal Bonds—102.3% | | | | |
Alabama—2.4% | | | | |
$ 20,000,000 | | Chatom Industrial Development
Board Revenue (SPA: National
Rural Utilities Finance)
4.000%, 02/01/2010 (c) | | $ | 20,005,800 | |
5,795,000 | | Health Care Authority For Baptist
Health—Series A
(CS: Assured Guaranty)
6.125%, 05/15/2012 (c) | | | 6,122,823 | |
3,850,000 | | Health Care Authority For Baptist
Health—Series B
(CS: Assured Guaranty)
1.000%, 11/06/2009 (a)(b)(d) | | | 3,850,000 | |
8,500,000 | | Infirmary Health System Special
Care Facilities Financing Authority
(LOC: Regions Bank)
2.240%, 11/05/2009 (a)(b) | | | 8,500,000 | |
1,900,000 | | Madison Industrial Development
Board Revenue, WL Halsey
Grocery Co.
(LOC: Regions Bank)
1.250%, 11/05/2009 (a)(b) | | | 1,900,000 | |
| | | |
|
| |
| | | | | 40,378,623 | |
| | | |
|
| |
Arizona—1.6% | | | | | | |
8,500,000 | | Cochise County Pollution Control
Corp., Arizona Electric Power
Cooperative, Inc.
3.100%, 03/01/2010 (c) | | | 8,560,435 | |
3,300,000 | | Maricopa County Pollution
Control Corp., Arizona Public
Services Co.—Series B
5.500%, 05/01/2012 (c) | | | 3,424,212 | |
6,000,000 | | Navajo County Pollution Control
Corp.—Series A
5.000%, 06/01/2012 (c) | | | 6,160,020 | |
8,560,000 | | Tolleson Commercial Paper
1.050%, 11/05/2009 (e) | | | 8,560,000 | |
| | | |
|
| |
| | | | | 26,704,667 | |
| | | |
|
| |
Arkansas—1.7% | | | | | | |
5,400,000 | | Pulaski County Public Facilities
Board Revenue, Anthony School
(LOC: Regions Bank)
1.500%, 11/05/2009 (a)(b) | | | 5,400,000 | |
5,525,000 | | Pulaski County Public Facilities
Board Revenue, Chapelridge
(LOC: Regions Bank)
1.500%, 11/05/2009 (a)(b) | | | 5,525,000 | |
6,500,000 | | Pulaski County Public Facilities
Board Revenue, Chapelridge
South West
(LOC: Regions Bank)
1.500%, 11/05/2009 (a)(b) | | | 6,500,000 | |
4,350,000 | | Pulaski County Public Facilities
Board, VY Heights
Apartments II—Series C
(LOC: Regions Bank)
1.250%, 11/05/2009 (a)(b) | | | 4,350,000 | |
| | | | | | |
Principal
Amount | | Security
Description | | Value | |
| |
| |
| |
| | | | | |
Municipal Bonds—continued | | | | |
Arkansas—continued | | | | |
$ 7,600,000 | | State Development Finance
Authority Revenue, Chapelridge
Benton—Series C
(LOC: Regions Bank)
2.000%, 11/05/2009 (a)(b) | | $ | 7,600,000 | |
| | | |
|
| |
| | | | | 29,375,000 | |
| |
|
| |
California—11.0% | | | | |
18,970,000 | | Housing Finance Agency,
Multifamily Housing
Revenue—Series A
(CS: GO Agency; SPA: DEPFA
Bank PLC)
1.050%, 11/02/2009 (a)(b) | | | 18,970,000 | |
900,000 | | Loma Linda Hospital Revenue,
Loma Linda University Medical
Center—Series A
(CS: AMBAC)
4.750%, 12/01/2009 | | | 900,522 | |
2,000,000 | | Municipal Finance Authority,
Waste Management
Inc.—Series A
4.900%, 02/01/2010 (c) | | | 2,011,100 | |
15,800,000 | | Southern California Home
Financing Authority
Revenue—Series A
(SPA: Fannie Mae)
2.150%, 11/04/2009 (a)(b) | | | 15,800,000 | |
| | State Commercial Paper | | | | |
3,000,000 | | 0.400%, 11/05/2009 (e) | | | 3,000,000 | |
7,800,000 | | 0.500%, 11/12/2009 (e) | | | 7,800,546 | |
9,020,000 | | 0.400%, 11/13/2009 (e) | | | 9,020,451 | |
21,000,000 | | 0.450%, 11/19/2009 (e) | | | 21,002,520 | |
12,995,000 | | State Economic Recovery
Revenue—Series C-2
(CS: ST GTD; SPA: Bank of
America N.A.)
0.450%, 11/02/2009 (a)(b) | | | 12,995,000 | |
26,575,000 | | State Economic Recovery
Revenue—Series C-4
(CS: ST GTD; SPA: JPMorgan
Chase Bank)
0.400%, 11/02/2009 (a)(b) | | | 26,575,000 | |
18,100,000 | | State Economic Recovery
Revenue—Series C-5
(CS: ST GTD; SPA: Bank of
America N.A.)
0.440%, 11/02/2009 (a)(b) | | | 18,100,000 | |
11,860,000 | | State Housing Finance Agency
Revenue, Home
Mortgage—Series B
(SPA: BNP Paribas)
2.250%, 11/04/2009 (a)(b) | | | 11,860,000 | |
10,000,000 | | State Housing Finance Agency
Revenue, Multifamily—Series B
(CS: GO Agency; SPA: DEPFA
Bank PLC)
3.750%, 11/04/2009 (a)(b) | | | 10,000,000 | |
The accompanying notes are an integral part of these financial statements.
50
| |
Alpine Ultra Short Tax Optimized Income Fund | |
| | |
Schedule of Portfolio Investments—Continued
October 31, 2009
| | | | | | |
Principal
Amount | | Security
Description | | Value | |
| |
| |
| |
| | | | | |
Municipal Bonds—continued | | | | |
California—continued | | | | |
$ 2,500,000 | | State Housing Finance Agency
Revenue, Multifamily—Series D
(CS: GO Agency; SPA: DEPFA
Bank PLC)
6.000%, 11/02/2009 (a)(b) | | $ | 2,500,000 | |
3,000,000 | | State Municipal Finance
Authority Revenue, Waste
Management, Inc.
3.450%, 03/01/2010 (c) | | | 3,003,000 | |
20,000,000 | | State of California—Series DCL-049
(CS: FSA; LIQ, LOC: Dexia
Credit Local)
2.000%, 11/05/2009 (a)(b) | | | 20,000,000 | |
| | | |
|
| |
| | | | | 183,538,139 | |
| | | |
|
| |
Colorado—1.3% | | | | |
1,900,000 | | Denver City & County Airport
Revenue, Subseries A3
(CS: FSA)
5.000%, 05/15/2011 (c) | | | 1,980,788 | |
2,000,000 | | Denver City & County Airport
Revenue, Subseries A4
5.250%, 05/15/2011 (c) | | | 2,086,380 | |
6,250,000 | | Housing & Finance Authority,
Holden Properties
(LOC: Associated Bank N.A.)
5.000%, 11/05/2009 (a)(b) | | | 6,250,000 | |
5,295,000 | | State Educational & Cultural
Facilities Authority Revenue,
National Jewish Federation
Board—Series A-7
(LOC: Bank of America N.A.)
0.250%, 11/02/2009 (a)(b) | | | 5,295,000 | |
3,615,000 | | State Educational & Cultural
Facilities Authority Revenue,
National Jewish Federation
Board—Series A-8
(LOC: Bank of America N.A.)
0.250%, 11/02/2009 (a)(b) | | | 3,615,000 | |
2,700,000 | | State Educational & Cultural
Facilities Authority Revenue,
National Jewish Federation
Board—Series D-5
(LOC: JPMorgan Chase Bank)
0.250%, 11/02/2009 (a)(b) | | | 2,700,000 | |
| | | |
|
| |
| | | | | 21,927,168 | |
| | | |
|
| |
Connecticut—0.4% | | | | |
6,000,000 | | State Development Authority
Pollution Control Revenue
5.250%, 04/01/2010 (c) | | | 6,103,860 | |
| | | |
|
| |
Delaware—0.6% | | | | |
4,450,000 | | State Economic Development
Authority, Delmarva Power &
Light Co.
0.900%, 11/02/2009 (a)(b) | | | 4,450,000 | |
5,200,000 | | State Economic Development
Authority Gas Facilities,
Delmarva Power & Light Co.
4.500%, 11/02/2009 (a)(b) | | | 5,200,000 | |
| | | |
|
| |
| | | | | 9,650,0000 | |
| | | |
|
| |
| | | | | | |
Principal
Amount | | Security
Description | | Value | |
| |
| |
| |
| | | | | | |
Municipal Bonds—continued | | | | |
District of Columbia—0.3% | | | | |
$ 5,405,000 | | Reset Optional Certificates Trust II
(LIQ: Citigroup Financial Products)
1.060%, 11/05/2009 (a)(b) | | $ | 5,405,000 | |
| | | |
|
| |
Florida—10.1% | | | | | | |
2,900,000 | | Bay Medical Center—Series A
(LOC: Regions Bank)
2.300%, 11/04/2009 (a)(b) | | | 2,900,000 | |
42,000,000 | | Bay Medical Center—Series B
(LOC: Regions Bank)
2.300%, 11/04/2009 (a)(b) | | | 42,000,000 | |
8,500,000 | | Broward County Housing Finance
Authority, Golf View Gardens
Apartments
(LOC: Regions Bank)
3.250%, 11/05/2009 (a)(b) | | | 8,500,000 | |
2,705,000 | | Cape Coral Water & Sewer
Revenue
6.000%, 10/01/2011 | | | 2,775,790 | |
| | Citizens Property Insurance Corp.,
Senior Secured High Risk
Notes—Series A
(CS: MBIA) | | | | |
600,000 | | 5.000%, 03/01/2010 | | | 608,214 | |
1,700,000 | | 5.000%, 03/01/2011 | | | 1,762,458 | |
20,000,000 | | Citizens Property Insurance Corp.,
Senior Secured High Risk
Notes—Series A-2
4.500%, 06/01/2010 | | | 20,209,400 | |
3,500,000 | | Eustis Multi-Purpose Revenue,
Series A
(LOC: SunTrust Bank)
0.750%, 11/04/2009 (a)(b) | | | 3,500,000 | |
6,400,000 | | Housing Finance Corp., Autumn
Place Apartments
(LOC: SunTrust Bank)
0.860%, 11/05/2009 (a)(b) | | | 6,400,000 | |
8,850,000 | | Housing Finance Corp.,
Bridgewater Club
(LOC: SunTrust Bank)
0.670%, 11/04/2009 (a)(b) | | | 8,850,000 | |
7,900,000 | | Housing Finance Corp., Stuart
Pointe Apartments
(LOC: SunTrust Bank)
0.670%, 11/04/2009 (a)(b) | | | 7,900,000 | |
2,225,000 | | Jacksonville Aviation Authority
Revenue
(CS: AMBAC)
5.000%, 10/01/2010 | | | 2,301,140 | |
4,400,000 | | Lake County Industrial
Development Authority Revenue,
Senninger Irrigation, Inc.
(LOC: SunTrust Bank)
1.150%, 11/04/2009 (a)(b) | | | 4,400,000 | |
6,160,000 | | Lee County Housing Finance
Authority Revenue, Cape Coral
Apartments—Series A
(LOC: SunTrust Bank)
2.000%, 11/04/2009 (a)(b) | | | 6,160,000 | |
The accompanying notes are an integral part of these financial statements.
51
| |
Alpine Ultra Short Tax Optimized Income Fund | |
| | |
Schedule of Portfolio Investments—Continued
October 31, 2009
| | | | | | | |
Principal
Amount | | Security
Description | | Value | |
| |
| |
| |
| | | | | |
Municipal Bonds—continued | | | | |
Florida—continued | | | | |
$ | 5,625,000 | | Lee County Housing Finance
Authority Revenue, Heron
Pond Apartments
(LOC: Regions Bank)
3.000%, 11/05/2009 (a)(b) | | $ | 5,625,000 | |
| 6,500,000 | | Manatee County Housing Finance
Authority Revenue,
Miranda Gardens
(LOC: SunTrust Bank)
2.500%, 11/05/2009 (a)(b) | | | 6,500,000 | |
| | | Miami-Dade County Industrial
Development Authority Revenue,
Waste Management, Inc. | | | | |
| 1,000,000 | | 4.510%, 04/01/2010 (c) | | | 999,970 | |
| 10,000,000 | | 5.400%, 08/01/2011 (c) | | | 10,263,200 | |
| 5,185,000 | | Miami-Dade County Aviation
Revenue—Series C
(CS: MBIA)
5.250%, 10/01/2010 | | | 5,209,732 | |
| 10,375,000 | | Municipal Power Agency
Revenue—Series C
(LOC: Bank of America N.A.)
0.220%, 11/02/2009 (a)(b) | | | 10,375,000 | |
| 2,170,000 | | Okeechobee County, Waste
Management and
Landfill—Series A
5.000%, 01/04/2010 (c) | | | 2,176,944 | |
| 1,100,000 | | St. Johns County Industrial
Development Authority Revenue,
Coastal Health Care Investor
(LOC: SunTrust Bank)
3.250%, 11/05/2009 (a)(b) | | | 1,100,000 | |
| 3,050,000 | | State Finance Department General
Service Revenue, Environmental
Protection and
Preservation—Series 2000-A
(CS: MBIA)
5.375%, 07/01/2010 | | | 3,089,985 | |
| 6,200,000 | | West Orange Healthcare District
Revenue—Series B
(LOC: SunTrust Bank)
1.500%, 11/05/2009 (a)(b) | | | 6,200,000 | |
| | | | |
|
| |
| | | | | | 169,806,833 | |
| | | | |
|
| |
Georgia—2.2% | | | | | | |
| 6,500,000 | | Atlanta Airport
Revenue—Series C-2
(CS: MBIA; SPA: Wachovia
Bank N.A.)
2.260%, 01/01/2030 (a)(b)(i) | | | 6,500,000 | |
| 4,420,000 | | Atlanta Urban Residential Finance
Authority Revenue,
Delmonte/Brownlee—Series A
(LOC: SunTrust Bank)
0.700%, 11/04/2009 (a)(b) | | | 4,420,000 | |
| 9,000,000 | | Burke County Development
Authority Pollution Control
Revenue, Vogtle Power Co.
4.375%, 04/01/2010 (c) | | | 9,131,580 | |
| | | | | | | |
Principal
Amount | | Security
Description | | Value | |
| |
| |
| |
| | | | | | | |
Municipal Bonds—continued | | | | |
Georgia—continued | | | | |
$ | 8,600,000 | | Cobb County Development
Authority Revenue, Boy Scouts
of America
(LOC: SunTrust Bank)
0.550%, 11/04/2009 (a)(b) | | $ | 8,600,000 | |
| 1,500,000 | | Douglas County Development
Authority Revenue, Electrical
Fiber Systems
(LOC: Regions Bank)
1.250%, 11/05/2009 (a)(b) | | | 1,500,000 | |
| 400,000 | | Douglas County Development
Authority Revenue, Whirlwind
Steel Buildings
(LOC: JPMorgan Chase Bank)
2.300%, 11/05/2009 (a)(b) | | | 400,000 | |
| 4,210,000 | | Griffin-Spalding County
Development Authority Revenue,
Woodland Industries, Inc.
(LOC: SunTrust Bank)
2.260%, 11/05/2009 (a)(b) | | | 4,210,000 | |
| 2,240,000 | | Manchester Industrial
Development Authority Revenue,
G&S Metal Consultants, Inc.
(LOC: Fifth Third Bank)
1.170%, 11/06/2009 (a)(b) | | | 2,240,000 | |
| | | | |
|
| |
| | | | | | 37,001,580 | |
| | | | |
|
| |
Idaho—0.4% | | | | | | |
| 6,555,000 | | Boise Urban Renewal
Agency—Series A
(LOC: Keybank N.A.)
2.950%, 11/04/2009 (a)(b) | | | 6,555,000 | |
| | | | |
|
| |
Illinois—6.5% | | | | | | |
| 9,000,000 | | Aurora Economic Development
Revenue, Aurora Christian
Schools, Inc.
(LOC: Fifth Third Bank)
0.700%, 11/05/2009 (a)(b) | | | 9,000,000 | |
| 2,555,000 | | Bloomington Industrial
Development Revenue
1.090%, 11/05/2009 (a)(b) | | | 2,555,000 | |
| 16,050,000 | | Chicago Board of Education
Revenue—Series C-2
(CS: FSA; SPA: DEPFA Bank PLC)
3.000%, 11/05/2009 (a)(b) | | | 16,050,000 | |
| 5,700,000 | | Chicago Board of Education
Revenue, Dedicated—D-2
(CS: Assured Guarantee; SPA:
DEPFA Bank PLC)
4.050%, 11/02/2009 (a)(b) | | | 5,700,000 | |
| 26,760,000 | | Crestwood Tax Increment Revenue,
135th & Cicero Redevelopment
(LOC: Fifth Third Bank)
2.500%, 11/05/2009 (a)(b) | | | 26,760,000 | |
| 700,000 | | Des Plaines Industrial
Development Revenue,
MMP Properties LLC
(LOC: JPMorgan Chase Bank)
2.300%, 11/05/2009 (a)(b) | | | 700,000 | |
The accompanying notes are an integral part of these financial statements.
52
| |
Alpine Ultra Short Tax Optimized Income Fund | |
| | |
Schedule of Portfolio Investments—Continued
October 31, 2009
| | | | | | | |
Principal
Amount | | Security
Description | | Value | |
| |
| |
| |
| | | | | | | |
Municipal Bonds—continued | | | | |
Illinois—continued | | | | | |
$ | 4,710,000 | | Educational Facilities Authority
Revenue, Beverly Arts
Center—Chicago
(LOC: Fifth Third Bank)
0.970%, 11/06/2009 (a)(b) | | $ | 4,710,000 | |
| 1,680,000 | | Finance Authority Industrial
Development Revenue,
Transparent Container
(LOC: JPMorgan Chase Bank)
3.250%, 11/05/2009 (a)(b) | | | 1,680,000 | |
| 4,055,000 | | Granite City Solid Waste Revenue,
Waste Management Inc.
4.875%, 05/03/2010 (c) | | | 4,090,846 | |
| 20,900,000 | | Rockford Revenue, Wesley
Willows Obligations Group
(LOC: M&I Bank)
2.000%, 11/02/2009 (a)(b) | | | 20,900,000 | |
| 4,375,000 | | Springfield Airport Authority,
Allied-Signal Inc.
6.500%, 11/04/2009 (a)(b) | | | 4,375,000 | |
| 7,305,000 | | State Finance Authority Revenue,
Resurrection Health—Series B
(LOC: JPMorgan Chase Bank)
0.300%, 11/02/2009 (a)(b) | | | 7,305,000 | |
| 5,320,000 | | State Health Facilities
Authority Revenue, Memorial
Health System
(LOC: JPMorgan Chase Bank)
0.200%, 11/02/2009 (a)(b) | | | 5,320,000 | |
| | | | |
|
| |
| | | | | | 109,145,846 | |
| | | | |
|
| |
Indiana—2.7% | | | | | | |
| 6,750,000 | | Columbus Industrial Revenue,
Mill Division
(LOC: SunTrust Bank)
0.900%, 11/04/2009 (a)(b) | | | 6,750,000 | |
| 4,305,000 | | Jeffersonville Industrial Economic
Development Revenue, Eagle
Steel Products Inc.
(LOC: Fifth Third Bank)
3.400%, 11/05/2009 (a)(b) | | | 4,305,000 | |
| 2,100,000 | | Lawrence Fort Harrison Reuse
Authority Revenue, Fort
Harrison Military Base
(LOC: Fifth Third Bank)
0.970%, 11/06/2009 (a)(b) | | | 2,100,000 | |
| 9,300,000 | | State Development Finance
Authority, Cathedral High School
(LOC: Fifth Third Bank)
2.000%, 11/02/2009 (a)(b) | | | 9,300,000 | |
| 19,045,000 | | State Finance Authority Revenue,
Marion General
Hospital—Series A
(LOC: Regions Bank)
3.000%, 11/04/2009 (a)(b) | | | 19,045,000 | |
| 3,600,000 | | Whiting Environmental Facilities
Revenue, Amoco Oil Co.
0.220%, 11/02/2009 (a)(b) | | | 3,600,000 | |
| | | | |
|
| |
| | | | | | 45,100,000 | |
| | | | |
|
| |
| | | | | | | |
Principal
Amount | | Security
Description | | Value | |
| |
| |
| |
| | | | | | | |
Municipal Bonds—continued | | | | |
Iowa—1.2% | | | | | |
$ | 12,000,000 | | State Finance Authority Revenue,
Central College
(LOC: Wells Fargo Bank N.A.)
0.200%, 11/02/2009 (a)(b) | | $ | 12,000,000 | |
| 8,000,000 | | State Higher Education Loan
Authority Revenue, Private
College Facilities
(LOC: Bank of America N.A.)
0.210%, 11/02/2009 (a)(b) | | | 8,000,000 | |
| | | | |
|
| |
| | | | | | 20,000,000 | |
| | | | |
|
| |
Kansas—0.3% | | | | | | |
| 4,700,000 | | Wichita Hospital Revenue,
Christi Health
(LOC: JPMorgan Chase Bank)
0.210%, 11/02/2009 (a)(b) | | | 4,700,000 | |
| | | | |
|
| |
Kentucky—1.9% | | | | | | |
| 700,000 | | Bardstown Industrial Development
Revenue, JAV Investments LLC
(LOC: JPMorgan Chase Bank)
2.300%, 11/05/2009 (a)(b) | | | 700,000 | |
| 2,680,000 | | Clark County Pollution Control
Revenue—Series J-1
(CS: CFC)
2.000%, 04/15/2010 (a)(b) | | | 2,680,000 | |
| 4,400,000 | | Danville Commercial Paper
1.300%, 11/04/2009 (e) | | | 4,400,264 | |
| 2,335,000 | | Fort Mitchell Industrial Building
Revenue, Grandview/Hemmer
(LOC: PNC Bank N.A.)
3.250%, 02/01/2010 (a)(b) | | | 2,335,000 | |
| 400,000 | | Hancock County Industrial
Development Revenue,
Precision Roll Grinders
(LOC: Chase Manhattan Bank)
2.300%, 11/05/2009 (a)(b) | | | 400,000 | |
| 1,000,000 | | Kenton County Airport Board
Revenue—Series C
(CS: MBIA)
5.000%, 03/01/2010 | | | 1,008,810 | |
| 4,000,000 | | Kenton County Industrial
Building Revenue, Baptist
Convalescent Center
(LOC: Fifth Third Bank)
1.120%, 11/04/2009 (a)(b) | | | 4,000,000 | |
| 9,800,000 | | Louisville Regional Airport
Authority Special Facilities
Revenue, OH LLC—Series A
0.230%, 11/02/2009 (a)(b) | | | 9,800,000 | |
| 2,000,000 | | Pulaski County Waste Utilities
Revenue—Series B
3.250%, 02/15/2010 (a)(b) | | | 2,000,600 | |
| 4,630,000 | | West Buechel Industrial Building
Revenue—Derby Fabricating LLC
1.090%, 11/05/2009 (a)(b) | | | 4,630,000 | |
| | | (LOC: Fifth Third Bank) | | | | |
| | | | |
|
| |
| | | | | | 31,954,674 | |
| | | | |
|
| |
The accompanying notes are an integral part of these financial statements.
53
| |
Alpine Ultra Short Tax Optimized Income Fund | |
| | |
Schedule of Portfolio Investments—Continued
October 31, 2009
| | | | | | |
Principal
Amount | | Security
Description | | | Value | |
| |
| |
| |
|
Municipal Bonds—continued | | | | |
Louisiana—5.9% | | | | |
$ 4,600,000 | | Jefferson Parish Industrial
Development Board Revenue,
Sara Lee Corp.
7.000%, 11/02/2009 (a)(b) | | $ | 4,600,000 | |
2,195,000 | | North Webster Parish Industrial
Development Revenue, CSP
(LOC: Regions Bank)
4.260%, 11/05/2009 (a)(b) | | | 2,195,000 | |
2,995,000 | | Ouachita Parish Industrial
Development Board, Garrett
Manufacturing LLC
(LOC: Regions Bank)
1.750%, 11/05/2009 (a)(b) | | | 2,995,000 | |
20,000,000 | | Plaquemines Port Harbor &
Terminal District Revenue,
International Marine
Terminal—Series A
(LOC: Wachovia Bank N.A.)
3.250%, 03/15/2010 (a)(b) | | | 20,144,400 | |
2,050,000 | | State Housing Finance Agency
Revenue, Multifamily Housing
Restoration—Series A
(LOC: Regions Bank)
2.750%, 11/05/2009 (a)(b) | | | 2,050,000 | |
| | West Baton Rouge Parish
Industrial Revenue | | | | |
30,000,000 | | 2.200%, 11/06/2009 (e) | | | 30,001,500 | |
19,000,000 | | 2.100%, 11/12/2009 (e) | | | 19,000,950 | |
18,000,000 | | 2.300%, 11/12/2009 (e) | | | 18,001,800 | |
| | | |
|
| |
| | | | | 98,988,650 | |
| | | |
|
| |
Maine—0.4% | | | | | | |
4,780,000 | | Finance Authority Industrial
Development Revenue,
Crobb Box Co.—Series A
(LOC: Keybank N.A.)
1.050%, 11/05/2009 (a)(b) | | | 4,780,000 | |
1,750,000 | | State Finance Authority Solid
Waste Disposal Revenue,
Waste Management, Inc.
2.250%, 05/03/2010 (c) | | | 1,750,000 | |
| | | |
|
| |
| | | | | 6,530,000 | |
| | | |
|
| |
Massachusetts—1.1% | | | | |
575,000 | | State Development Finance
Agency, Waste Management,
Inc.—Series B
6.900%, 12/01/2009 (c) | | | 576,656 | |
3,500,000 | | State Health & Educational
Facilities Authority,
Northeastern University—Series T-1
4.125%, 02/16/2012 (c) | | | 3,553,620 | |
2,000,000 | | State Health & Educational
Facilities Authority,
Northeastern University—Series T-2
4.100%, 04/19/2012 (c) | | | 2,020,020 | |
11,470,000 | | State Port Authority
Revenue—Series B
(CS: FSA)
5.500%, 07/01/2010 (a)(b) | | | 11,628,401 | |
| | | |
|
| |
| | | | | 17,778,697 | |
| | | |
|
| |
| | | | | | |
Principal
Amount | | Security
Description | | | Value | |
| |
| |
|
| |
| | | | | | |
Municipal Bonds—continued | | | | |
Michigan—7.8% | | | | | | |
$ 6,000,000 | | Detroit Revenue—Anticipation
Notes
5.000%, 03/01/2010 | | $ | 6,050,820 | |
5,000,000 | | Municipal Bond Authority,
State Aid Revenue
Notes—Series 2009B
6.000%, 01/20/2010 | | | 5,027,450 | |
13,800,000 | | Royal Oak Hospital Finance
Authority, William Beaumont
(CS: AMBAC; SPA: Morgan
Stanley Bank)
0.800%, 11/02/2009 (a)(b) | | | 13,800,000 | |
50,000,000 | | State Housing Development
Authority Rental
Revenue—Series A
(CS: FSA; SPA: DEPFA Bank PLC)
2.750%, 11/04/2009 (a)(b) | | | 50,000,000 | |
40,000,000 | | State Housing Development
Authority Single Mortgage
Revenue—Series B
(SPA: DEPFA Bank PLC)
5.000%, 11/04/2009 (a)(b) | | | 40,000,000 | |
400,000 | | State Strategic Fund Limited
Obligations Revenue, Creative
Foam Corp.
(LOC: JPMorgan Chase Bank)
1.500%, 11/04/2009 (a)(b) | | | 400,000 | |
300,000 | | State Strategic Fund Limited
Obligations Revenue,
CTD Real Estate Co. LLC
(LOC: JPMorgan Chase Bank)
3.000%, 11/04/2009 (a)(b) | | | 300,000 | |
600,000 | | State Strategic Fund Limited
Obligations Revenue, Gebara
Management Co. LLC
(LOC: JPMorgan Chase Bank)
3.000%, 11/04/2009 (a)(b) | | | 600,000 | |
800,000 | | State Strategic Fund Limited
Obligations Revenue,
Press-Way Inc.
(LOC: JPMorgan Chase Bank)
3.000%, 11/04/2009 (a)(b) | | | 800,000 | |
3,520,000 | | State Strategic Fund Limited
Obligations Revenue,
Quantum, Inc.
(LOC: Keybank N.A.)
3.950%, 11/05/2009 (a)(b) | | | 3,520,000 | |
8,230,000 | | State Strategic Fund Limited
Obligations Revenue, Sacred
Heart Rehabilitation Center
(LOC: Fifth Third bank)
0.890%, 11/05/2009 (a)(b) | | | 8,230,000 | |
2,100,000 | | State Strategic Fund Limited
Obligations Revenue, Taylor
Building Products, Inc.
(LOC: PNC Bank N.A.)
3.125%, 09/15/2010 (c) | | | 2,106,636 | |
The accompanying notes are an integral part of these financial statements.
54
| |
Alpine Ultra Short Tax Optimized Income Fund | |
| | |
Schedule of Portfolio Investments—Continued
October 31, 2009
| | | | | | |
Principal
Amount | | Security
Description | | | Value | |
| |
| |
|
| |
|
Municipal Bonds—continued | | | | |
Michigan—continued | | | | |
$ 300,000 | | State Strategic Fund Limited
Obligations Revenue, Warren
Screw Products, Inc.
(LOC: JPMorgan Chase Bank)
2.900%, 11/04/2009 (a)(b) | | $ | 300,000 | |
| | | |
|
| |
| | | | | 131,134,906 | |
| | | |
|
| |
Minnesota—0.2% | | | | |
3,315,000 | | Ramsey Industrial Development
Revenue, Kilkenny LLC—Series A
(LOC: Associated Bank N.A.)
4.000%, 11/03/2009 (a)(b) | | | 3,315,000 | |
| | | |
|
| |
Mississippi—1.6% | | | | |
7,500,000 | | Business Finance Corp., Coast
Electric Power Association
(SPA: MBIA)
1.875%, 05/03/2010 (a)(b) | | | 7,500,000 | |
8,400,000 | | Business Finance Corp.,
Mississippi Power Co.
0.270%, 11/02/2009 (a)(b) | | | 8,400,000 | |
4,200,000 | | Business Finance Corp., Solid
Waste Disposal Revenue,
Mississippi Power Co.
0.290%, 11/02/2009 (a)(b) | | | 4,200,000 | |
6,175,000 | | State Home Corp. Multifamily
Authority Revenue, Chapel
Ridge Apartments
(LOC: Regions Bank)
1.500%, 11/05/2009 (a)(b) | | | 6,175,000 | |
250,000 | | State Hospital Equipment &
Facilities Authority Revenue,
Forrest County General Hospital
5.250%, 01/01/2011 | | | 257,560 | |
| | | |
|
| |
| | | | | 26,532,560 | |
| | | |
|
| |
Missouri—1.2% | | | | | | |
1,565,000 | | St. Louis Airport
Revenue—Series A
(CS: MBIA)
5.500%, 07/01/2010 | | | 1,605,409 | |
17,950,000 | | State Health & Educational
Facilities Authority,
SSM Health Care—Series B
0.610%, 11/05/2009 (c) | | | 17,950,000 | |
| | | |
|
| |
| | | | | 19,555,409 | |
| | | |
|
| |
Multistate—0.2% | | | | | |
4,700,000 | | Theop LLC
0.488%, 01/01/2039 (d)(f)(h) | | | 3,031,500 | |
| | | |
|
| |
Nevada—0.1% | | | | | | |
1,500,000 | | Clark County Passenger Facilities
Revenue, Las Vegas
McCarran Airport
(CS: MBIA)
5.250%, 07/01/2010 | | | 1,543,515 | |
| | | |
|
| |
New Hampshire—0.8% | | | | |
5,000,000 | | State Business Financing
Authority Revenue, Pennichuck
Water Works
(CS: AMBAC)
3.625%, 07/01/2010 (c) | | | 4,999,800 | |
| | | | | | |
Principal
Amount | | Security
Description | | | Value | |
| |
| |
|
| |
|
Municipal Bonds—continued | | | | |
New Hampshire—continued | | | | |
$ 1,000,000 | | State Business Financing
Authority Revenue,
United Illuminating Co.
7.125%, 02/01/2012 (c) | | $ | 1,084,830 | |
7,805,000 | | State Health & Educational
Facilities Authority Revenue,
Wentworth Gouglass Hospital
(LOC: JPMorgan Chase Bank)
0.200%, 11/02/2009 (a)(b) | | | 7,805,000 | |
| | | |
|
| |
| | | | | 13,889,630 | |
| | | |
|
| |
New Jersey—0.3% | | | | |
230,000 | | Health Care Facilities Finance
Authority Revenue,
Trinitas Hospital—Series B
6.500%, 07/01/2012 | | | 221,805 | |
2,000,000 | | Newark Tax Appeal
Notes—Series H
4.750%, 12/29/2009 | | | 2,008,460 | |
| | State Housing & Mortgage
Finance Agency Revenue,
Single Family
Housing—Series EE | | | | |
915,000 | | 2.000%, 10/01/2010 | | | 914,991 | |
720,000 | | 2.750%, 04/01/2011 | | | 720,288 | |
870,000 | | Tobacco Settlement Financing
Corporation
5.750%, 06/01/2032 | | | 942,697 | |
| | | |
|
| |
| | | | | 4,808,241 | |
| | | |
|
| |
New Mexico—0.4% | | | | | |
5,000,000 | | Hospital Equipment Loan Council,
Dialysis Clinic, Inc.
(LOC: SunTrust Bank)
0.650%, 11/05/2009 (a)(b) | | | 5,000,000 | |
1,215,000 | | Las Cruces Industrial
Development Revenue,
Parkview Metal Products
(LOC: American National
Bank & Trust)
2.300%, 11/05/2009 (a)(b) | | | 1,215,000 | |
| | | |
|
| |
| | | | | 6,215,000 | |
| | | |
|
| |
New York—6.0% | | | | | |
10,450,000 | | City of New York—Subseries A-4
(CS: FSA)
1.070%, 11/05/2009 (a)(b)(d) | | | 10,450,000 | |
3,560,000 | | Monroe County Industrial
Development Agency
Revenue—Series A
(LOC: M&T Bank)
1.050%, 11/05/2009 (a)(b) | | | 3,560,000 | |
2,620,000 | | Monroe County Industrial
Development Agency Revenue,
Hillside Children’s Center
(LOC: Keybank N.A.)
0.900%, 11/04/2009 (a)(b) | | | 2,620,000 | |
18,000,000 | | New York City Housing
Development Corp.—
Series A 1-A
(LIQ: Dexia Credit Local)
0.270%, 11/02/2009 (a)(b) | | | 18,000,000 | |
The accompanying notes are an integral part of these financial statements.
55
| |
Alpine Ultra Short Tax Optimized Income Fund | |
| | |
Schedule of Portfolio Investments—Continued
October 31, 2009
| | | | | | | |
Principal
Amount | | Security
Description | | Value | |
| |
| |
| |
| | | | | |
Municipal Bonds—continued | | | | |
New York—continued | | | | |
$ | 21,800,000 | | New York City Housing
Development Corp.—
Series H 2-A
(LIQ: Dexia Credit Local)
0.270%, 11/02/2009 (a)(b) | | $ | 21,800,000 | |
| 2,000,000 | | New York City Industrial
Development Agency Revenue,
Terminal One Group Association
5.000%, 01/01/2010 | | | 2,006,500 | |
| 2,800,000 | | New York General
Obligations—Series J
(CS: FSA)
1.030%, 11/06/2009 (a)(b)(d) | | | 2,800,000 | |
| 5,090,000 | | Otsego County Industrial
Development Agency Revenue,
Templeton Foundation—Series A
(LOC: Keybank N.A.)
0.850%, 11/05/2009 (a)(b) | | | 5,090,000 | |
| 500,000 | | Port Authority of New York & New Jersey, JFK
International Air Terminal
(CS: MBIA)
6.250%, 12/01/2009 | | | 501,225 | |
| 1,000,000 | | State Dormitory Authority
Revenue—Series A
5.000%, 07/01/2010 | | | 1,012,250 | |
| 3,000,000 | | State Energy Research &
Development Authority,
Orange/Rockland
Utilities—Series A
(CS: AMBAC; LOC: Wachovia
Bank N.A.)
0.450%, 11/04/2009 (a)(b) | | | 3,000,000 | |
| 29,000,000 | | State Mortgage Agency
Homeowner Revenue—Series 139
(SPA: Dexia Credit Local)
0.300%, 11/02/2009 (a)(b) | | | 29,000,000 | |
| 500,000 | | Westchester Tobacco Asset
Securitization Corporation
5.000%, 06/01/2026 | | | 457,745 | |
| | | | |
|
| |
| | | | | | 100,297,720 | |
| | | | |
|
| |
North Carolina—2.4% | | | | |
| 17,165,000 | | Charlotte Airport
Revenue—Series A
(CS: Chase Manhattan Bank;
SPA: MBIA)
6.000%, 11/04/2009 (a)(b) | | | 17,165,000 | |
| 4,140,000 | | Davidson County Industrial
Facilities & Pollution Control
Financing Authority Revenue,
Diebold, Inc.
(LOC: Bank of America N.A.)
0.400%, 11/05/2009 (a)(b) | | | 4,140,000 | |
| 18,000,000 | | Mecklenburg County
Certificates—Series A
(SPA: SunTrust Bank)
0.800%, 11/05/2009 (a)(b) | | | 18,000,000 | |
| | | | |
|
| |
| | | | | | 39,305,000 | |
| | | | |
|
| |
| | | | | | | |
Principal
Amount | | Security
Description | | Value | |
| |
| |
| |
| | | | | | | |
Municipal Bonds—continued | | | | |
Ohio—3.1% | | | | |
$ | 1,340,000 | | Clermont County Industrial
Development Revenue,
Iannelli Enterprises
(LOC: Fifth Third Bank)
1.270%, 11/06/2009 (a)(b) | | $ | 1,340,000 | |
| 7,000,000 | | Geauga County Revenue, South
Franklin Circle—Series B
(LOC: Keybank N.A.)
0.280%, 11/02/2009 (a)(b) | | | 7,000,000 | |
| 12,335,000 | | Hamilton County Health Care
Revenue, Sisters of Charity
Senior Care
(LOC: Fifth Third Bank)
1.100%, 11/05/2009 (a)(b) | | | 12,335,000 | |
| 6,595,000 | | Henry County Facilities
Improvement Revenue
(LOC: Keybank N.A.)
0.850%, 11/05/2009 (a)(b) | | | 6,595,000 | |
| 1,680,000 | | Marysville Tax Increment
Revenue—Series A
(LOC: Fifth Third Bank)
3.000%, 09/01/2010 | | | 1,686,804 | |
| 1,000,000 | | Marysville Tax Increment Revenue,
Gate Department—Series B
(LOC: Fifth Third Bank)
3.500%, 09/01/2010 | | | 1,008,110 | |
| 2,680,000 | | Sharonville Industrial
Development Revenue,
Duke Realty LP
(LOC: Fifth Third Bank)
1.170%, 11/05/2009 (a)(b) | | | 2,680,000 | |
| 3,225,000 | | Stark County Industrial
Development Revenue,
Products, Inc.
(LOC: Keybank N.A.)
1.100%, 11/04/2009 (a)(b) | | | 3,225,000 | |
| 5,000,000 | | State Air Quality Development
Authority, Ohio Power
7.125%, 06/01/2010 (c) | | | 5,153,350 | |
| 10,025,000 | | Summit County Port Authority
Revenue, Lawrence School
(LOC: Fifth Third Bank)
0.700%, 11/05/2009 (a)(b) | | | 10,025,000 | |
| | | | |
|
| |
| | | | | | 51,048,264 | |
| | | | |
|
| |
Oklahoma—0.0% | | | | |
| 600,000 | | Cherokee Nation of Oklahoma
National Healthcare
System—Series 2006
(CS: ACA)
4.100%, 12/01/2011 (g) | | | 600,222 | |
| | | | |
|
| |
Oregon—0.3% | | | | |
| 400,000 | | Gilliam County Solid Waste
Disposal Revenue, Waste
Management, Inc.—Series A
6.000%, 05/03/2010 (c) | | | 405,904 | |
| 5,220,000 | | Multnomah County Higher
Education Revenue, Concordia
University of Portland
(LOC: Keybank N.A.)
0.550%, 11/02/2009 (a)(b) | | | 5,220,000 | |
| | | | |
|
| |
| | | | | | 5,625,904 | |
| | | | |
|
| |
The accompanying notes are an integral part of these financial statements.
56
| |
Alpine Ultra Short Tax Optimized Income Fund | |
| | |
Schedule of Portfolio Investments—Continued
October 31, 2009
| | | | | | | |
Principal
Amount | | Security
Description | | Value | |
| |
| |
| |
| | | | | |
Municipal Bonds—continued | | | | |
Pennsylvania—6.9% | | | | |
$ | 60,000,000 | | City of Philadelphia Tax &
Revenue Anticipation
Notes—Series B
2.500%, 06/30/2010 | | $ | 60,702,600 | |
| 1,000,000 | | Philadelphia Municipal Lease
Authority Revenue—Series B
(CS: FSA)
5.250%, 11/15/2010 | | | 1,035,590 | |
| 1,000,000 | | State Economic Development
Financing Authority Revenue,
Albert Einstein
Healthcare—Series A
5.000%, 10/15/2010 | | | 1,023,530 | |
| 1,000,000 | | State Economic Development
Financing Authority Revenue,
Exelon Generation
5.000%, 06/01/2012 (c) | | | 1,054,750 | |
| 3,300,000 | | State Economic Development
Financing Authority Revenue,
Waste Management, Inc.
3.600%, 03/01/2010 (c) | | | 3,300,825 | |
| 2,750,000 | | State Economic Development
Financing Authority Revenue,
Waste Management,
Inc.—Series A
2.250%, 05/03/2010 (c) | | | 2,750,000 | |
| 46,300,000 | | State Higher Education
Assistance Agency—Series B
(CS: FSA)
3.250%, 11/05/2009 (a)(b) | | | 46,300,000 | |
| | | | |
|
| |
| | | | | | 116,167,295 | |
| | | | |
|
| |
Puerto Rico—1.8% | | | | |
| 8,000,000 | | Government Development
Bank of Puerto Rico—Series B
5.000%, 12/01/2009 | | | 8,023,280 | |
| 1,590,000 | | Municipal Finance
Agency—Series A
(CS: FSA)
5.250%, 07/01/2010 | | | 1,592,210 | |
| 20,000,000 | | Sales Tax Financing Corp.—Series A
5.000%, 08/01/2011 (c) | | | 20,728,200 | |
| | | | |
|
| |
| | | | | | 30,343,690 | |
| | | | |
|
| |
South Carolina—0.9% | | | | |
| 6,550,000 | | State Jobs—Economic
Development Authority Revenue,
Congo Medical Products
(LOC: Bayerische)
1.470%, 11/04/2009 (a)(b) | | | 6,550,000 | |
| 1,000,000 | | State Jobs—Economic
Development Authority Revenue,
Palmetto Health
3.000%, 08/01/2010 | | | 1,004,360 | |
| 7,500,000 | | York County Pollution Control
Revenue—Series B-1
(SPA: National Rural Utilities
Finance)
2.250%, 03/01/2010 (c) | | | 7,500,000 | |
| | | | |
|
| |
| | | | | | 15,054,360 | |
| | | | |
|
| |
| | | | | | | |
Principal
Amount | | Security
Description | | Value | |
| |
| |
| |
| | | | | |
Municipal Bonds—continued | | | | |
South Dakota—0.9% | | | | |
$ | 15,000,000 | | State Health & Educational
Facilities Revenue, Regional
Health
(LOC: U.S. Bank N.A.)
0.200%, 11/02/2009 (a)(b) | | $ | 15,000,000 | |
| | | | |
|
| |
Tennessee—6.2% | | | | |
| 12,500,000 | | Chattanooga Health Educational &
Housing Facilities Board,
Girls Prep Schools
(LOC: SunTrust Bank)
0.550%, 11/04/2009 (a)(b) | | | 12,500,000 | |
| 1,900,000 | | Franklin County Industrial
Development Board, Hi-Tech
(LOC: Regions Bank)
1.750%, 11/04/2009 (a)(b) | | | 1,900,000 | |
| 8,500,000 | | Franklin Public Building Authority,
Series A-1
(SPA: DEPFA Bank PLC)
0.330%, 11/02/2009 (a)(b) | | | 8,500,000 | |
| 4,755,000 | | Knox County Health Educational
& Housing Facilities Board,
Cookevelle Regional Medical
Center
(LOC: Regions Bank)
1.750%, 11/04/2009 (a)(b) | | | 4,755,000 | |
| 3,450,000 | | Metropolitan Government
Nashville & Davidson Health &
Educational Facilities Board
Revenue, Wedgewood
(LOC: AmSouth Bank)
1.250%, 11/06/2009 (a)(b) | | | 3,450,000 | |
| 4,005,000 | | Metropolitan Government
Nashville & Davidson County
Industrial Development Board,
Nashville Public Radio
(LOC: Fifth Third Bank)
4.100%, 11/06/2009 (a)(b) | | | 4,005,000 | |
| 31,600,000 | | Montgomery County Public
Building Authority Revenue
(LOC: Bank of America N.A.)
0.230%, 11/02/2009 (a)(b) | | | 31,600,000 | |
| 31,200,000 | | Sevier County Public Building
Authority
(SPA: DEPFA Bank PLC)
0.370%, 11/02/2009 (a)(b) | | | 31,200,000 | |
| 6,355,000 | | Shelby County Health Educational
& Housing Facilities Board,
Eden Pointe Apartments
(LOC: Regions Bank)
1.500%, 11/05/2009 (a)(b) | | | 6,355,000 | |
| | | | |
|
| |
| | | | | | 104,265,000 | |
| | | | |
|
| |
Texas—2.0% | | | | |
| 12,500,000 | | Brazos River Harbor Navigation
District Revenue, Merey
Sweeny LP
(LOC: JPMorgan Chase Bank)
0.240%, 11/02/2009 (a)(b) | | | 12,500,000 | |
| 6,000,000 | | Gulf Coast Industrial Development
Authority Revenue,
Cinergy Solutions
2.700%, 11/04/2009 (a)(b) | | | 6,000,000 | |
The accompanying notes are an integral part of these financial statements.
57
| |
Alpine Ultra Short Tax Optimized Income Fund | |
| | |
Schedule of Portfolio Investments—Continued
October 31, 2009
| | | | | | | |
Principal
Amount | | Security
Description | | Value | |
| |
| |
| |
| | | | | |
Municipal Bonds—continued | | | | |
Texas—continued | | | | |
$ | 2,000,000 | | Houston Airport Systems Revenue,
People Mover—Series A
(CS: FSA)
5.375%, 07/15/2010 | | $ | 2,000,120 | |
| 2,000,000 | | Municipal Gas Acquisition &
Supply Corp. Revenue—Series A
5.000%, 12/15/2010 | | | 2,039,900 | |
| 2,500,000 | | North Texas Tollway Authority
Revenue—Series H
5.000%, 01/01/2011 (c) | | | 2,580,125 | |
| 5,000,000 | | State Transportation Commission,
First Tier
5.000%, 02/15/2011 (c) | | | 5,160,850 | |
| 2,850,000 | | Waxahachie Industrial
Development Authority Revenue
(LOC: SunTrust Bank)
0.700%, 11/04/2009 (a)(b) | | | 2,850,000 | |
| | | | |
|
| |
| | | | | | 33,130,995 | |
| | | | |
|
| |
Utah—0.1% | | | | |
| 1,120,000 | | Logan City Revenue, Integrated
Systems, Inc.
(LOC: Keybank N.A.)
0.820%, 11/06/2009 (a)(b) | | | 1,120,000 | |
| | | | |
|
| |
Vermont—1.2% | | | | |
| 1,505,000 | | Housing Finance Agency,
Single Family Housing
Revenue—Series 21A
(CS: FSA; SPA: Dexia Credit Local)
0.820%, 11/04/2009 (a)(b) | | | 1,505,000 | |
| 2,820,000 | | State Economic Development
Authority, Hazelett Strip-Casting
(LOC: Keybank N.A.)
1.100%, 11/05/2009 (a)(b) | | | 2,820,000 | |
| 16,500,000 | | State Housing Finance Agency,
Multiple Purpose—Series C
(CS: FSA; SPA: Dexia Credit Local)
0.750%, 11/04/2009 (a)(b) | | | 16,500,000 | |
| | | | |
|
| |
| | | | | | 20,825,000 | |
| | | | |
|
| |
Virgin Islands—0.0% | | | | |
| 500,000 | | Public Finance Authority
Revenue—Series B
5.000%, 10/01/2010 | | | 513,195 | |
| | | | |
|
| |
Virginia—0.2% | | | | |
| 3,500,000 | | Alexandria Industrial Development
Authority, American Association
for the Study of Liver Diseases
(LOC: SunTrust Bank)
0.700%, 11/04/2009 (a)(b) | | | 3,500,000 | |
| | | | |
|
| |
Washington—1.2% | | | | |
| 1,400,000 | | State Economic Development
Finance Authority Revenue,
Belina Interiors, Inc.—Series E
(LOC: Keybank N.A.)
3.750%, 11/05/2009 (a)(b) | | | 1,400,000 | |
| 1,110,000 | | State Economic Development
Finance Authority Revenue,
Belina Interiors, Inc.—Series F
(LOC: Keybank N.A.)
3.750%, 11/05/2009 (a)(b) | | | 1,110,000 | |
| | | | | | | |
Principal
Amount | | Security
Description | | Value | |
| |
| |
| |
| | | | | |
Municipal Bonds—continued | | | | |
Washington—continued | | | | |
$ | 7,000,000 | | State Health Care Facilities
Revenue, Seattle Cancer Care
(LOC: Keybank N.A.)
0.650%, 11/05/2009 (a)(b) | | $ | 7,000,000 | |
| 10,880,000 | | State Housing Finance
Commission, Mirabella—Series A
(LOC: HSH Nordbank AG)
0.400%, 11/02/2009 (a)(b) | | | 10,880,000 | |
| | | | |
|
| |
| | | | | | 20,390,000 | |
| | | | |
|
| |
West Virginia—0.2% | | | | |
| 3,000,000 | | Economic Development Authority
Revenue, Appalachian Power Co.
7.125%, 06/01/2010 (c) | | | 3,063,840 | |
| | | | |
|
| |
Wisconsin—4.1% | | | | |
| 9,800,000 | | Ladysmith Solid Waste Disposal
Revenue, Cityforest Corp.
(LOC: Associated Bank N.A.)
3.500%, 11/04/2009 (a)(b) | | | 9,800,000 | |
| 1,200,000 | | Rhinelander Industrial
Development Revenue,
Superior Diesel/SDI Properties
(LOC: Bank of New York)
2.250%, 11/05/2009 (a)(b) | | | 1,200,000 | |
| 15,000,000 | | State Health & Educational
Facilities Authority, Bay Area
Medical Center, Inc.
(LOC: M&I Bank)
3.000%, 11/02/2009 (a)(b) | | | 15,000,000 | |
| 10,500,000 | | State Health & Educational
Facilities Authority, Mercy
Alliance, Inc.
(LOC: M&I Bank)
1.560%, 11/05/2009 (a)(b) | | | 10,500,000 | |
| 10,060,000 | | State Health & Educational
Facilities Authority,
Oakwood Village
(LOC: M&I Bank)
2.000%, 11/05/2009 (a)(b) | | | 10,060,000 | |
| 19,775,000 | | State Health & Educational
Facilities Authority, Reedsburg
Area Medical Center, Inc.
(LOC: Fifth Third Bank)
2.000%, 11/02/2009 (a)(b) | | | 19,775,000 | |
| 2,495,000 | | State Health & Educational
Facilities Authority,
St. Joseph’s Community Hospital
(LOC: M&I Bank)
2.000%, 11/05/2009 (a)(b) | | | 2,495,000 | |
| | | | |
|
| |
| | | | | | 68,830,000 | |
| | | | |
|
| |
Wyoming—0.2% | | | | |
| 2,855,000 | | Gillette Environmental
Improvement Revenue,
Black Hills Power and Light
Co.—Series A
8.000%, 11/04/2009 (a)(b) | | | 2,855,000 | |
| | | | |
|
| |
| | | Total Municipal Bonds
(Cost $1,711,272,833) | | | 1,712,604,983 | |
| | | | |
|
| |
The accompanying notes are an integral part of these financial statements.
58
| |
Alpine Ultra Short Tax Optimized Income Fund | |
| | |
Schedule of Portfolio Investments—Continued
October 31, 2009
| | | | | | | |
Shares | | Security
Description | | Value | |
|
| |
| |
| |
| | | | | |
Money Market Funds—1.7% | | | | |
| 28,700,000 | | BlackRock Liquidity Fund
MuniCash Portfolio, 0.25% | | $ | 28,700,000 | |
| 32,958 | | SEI Tax Exempt Trust—Institutional
Tax Free Fund—Class A, 0.08% | | | 32,958 | |
| | | | |
|
| |
| | | Total Money Market Funds
(Cost $28,732,958) | | | 28,732,958 | |
| | | | |
|
| |
| | | Total Investments
(Cost $1,740,005,791)—104.0% | | | 1,741,337,941 | |
| | | Liabilities in Excess of Other
Assets—(4.0)% | | | (67,477,802 | ) |
| | | | |
|
| |
| | | TOTAL NET ASSETS—100.0% | | $ | 1,673,860,139 | |
| | | | |
|
| |
| |
|
Percentages are stated as a percent of net assets. |
| |
(a) | Variable Rate Security—The rate reported is the rate in effect as of October 31, 2009. The date shown is the next reset date. |
| |
(b) | Maturity date represents first available put date. |
| |
(c) | Put Bond |
| |
(d) | Auction Rate Note |
| |
(e) | Commercial Paper |
| |
(f) | Security fair valued in accordance with procedures approved by the Board of Trustees. These securities comprised 0.2% of the Fund’s net assets. |
| |
(g) | Restricted under Rule 144A of the Securities Act of 1933. These securities may be resold in transactions exempt from registration, normally to qualified institutional buyers. These securities have been determined to be liquid under guidelines established by the Board of Trustees. Liquid securities restricted under Rule 144A comprised 0.0% of the Fund’s net assets. |
| |
(h) | Restricted under Rule 144A of the Securities Act of 1933. These securities may be resold in transactions exempt from registration, normally to qualified institutional buyers. These securities have been determined to be illiquid under guidelines established by the Board of Trustees. Illiquid securities restricted under Rule 144A comprised 0.2% of the Fund’s net assets. |
| |
(i) | Illiquid. |
CS—Credit Support
LIQ—Liquidity Facility
LOC—Letter of Credit
SPA—Standby Purchase Agreement
The accompanying notes are an integral part of these financial statements.
59
| |
Alpine Municipal Money Market Fund | |
| | |
Schedule of Portfolio Investments
October 31, 2009
| | | | | | | |
Principal
Amount | | Security
Description | | Value | |
| |
| |
| |
| | | | |
Municipal Bonds—92.6% | | | | |
Alaska—0.1% | | | | |
$ | 565,000 | | Industrial Development & Export
Authority—Lot 12
(LOC: Bank of America N.A.)
0.760%, 11/04/2009 (a)(b) | | $ | 565,000 | |
| | | | |
|
| |
Arizona—0.3% | | | | |
| 2,074,000 | | Phoenix Industrial Development
Authority, Salvo Properties LLC
(LOC: U.S. Bank N.A.)
0.700%, 11/05/2009 (a)(b) | | | 2,074,000 | |
| | | | |
|
| |
Arkansas—0.4% | | | | |
| 2,830,000 | | Lowell Industrial Development
Authority, Ark Democrat-Gazette
(LOC: JPMorgan Chase Bank)
0.550%, 11/04/2009 (a)(b) | | | 2,830,000 | |
| | | | |
|
| |
California—6.1% | | | | |
| 2,000,000 | | ABAG Finance Authority for
Nonprofit Corps., Sharp
Healthcare—Series C
(LOC: Citibank N.A.)
0.210%, 11/04/2009 (a)(b) | | | 2,000,000 | |
| 1,280,000 | | ABAG Finance Authority for
Nonprofit Corps., Sharp
Healthcare—Series D
(LOC: Citibank N.A.)
0.210%, 11/04/2009 (a)(b) | | | 1,280,000 | |
| 7,000,000 | | Housing Finance Agency Revenue,
Home Mortgage—Series U
(CS: FSA; LIQ: Dexia Credit Local)
0.440%, 11/02/2009 (a)(b) | | | 7,000,000 | |
| 22,855,000 | | Infrastructure & Economic
Development Bank Revenue,
Pacific Gas Electric—Series A
(LOC: Wells Fargo Bank N.A.)
0.200%, 11/02/2009 (a)(b) | | | 22,855,000 | |
| 14,940,000 | | State of California—Series DCL-049
(CS: FSA; LIQ, LOC: Dexia
Credit Local)
2.000%, 11/05/2009 (a)(b) | | | 14,940,000 | |
| | | | |
|
| |
| | | | | | 48,075,000 | |
| | | | |
|
| |
Colorado—0.9% | | | | |
| 2,360,000 | | Housing & Finance Authority
Economic Development Revenue,
Cytoskeleton, Inc.
(LOC: Compass Bank)
1.010%, 11/05/2009 (a)(b) | | | 2,360,000 | |
| 1,250,000 | | Housing & Finance Authority
Economic Development Revenue,
Top Shop— Series A
(LOC: JPMorgan Chase Bank)
0.610%, 11/05/2009 (a)(b) | | | 1,250,000 | |
| 1,792,000 | | Jefferson County Industrial
Development Revenue,
Epicenter LLC
(LOC: JPMorgan Chase Bank)
0.610%, 11/05/2009 (a)(b) | | | 1,792,000 | |
| 2,000,000 | | Pitkin County Industrial
Development Revenue,
Aspen Skiing Co.—Series B
(LOC: JPMorgan Chase Bank)
0.300%, 11/02/2009 (a)(b) | | | 2,000,000 | |
| | | | |
|
| |
| | | | | | 7,402,000 | |
| | | | |
|
| |
| | | | | | | |
Principal
Amount | | Security
Description | | Value | |
| |
| |
| |
| | | | |
Municipal Bonds—continued | | | | |
Florida—15.7% | | | | |
$ | 20,000,000 | | Citizens Property Insurance Corp.,
Senior Secured High Risk
Notes—Series A-2
4.500%, 06/01/2010 | | $ | 20,098,937 | |
| 25,600,000 | | Gainesville Utilities System
Revenue—Series A
(SPA: SunTrust Bank)
0.300%, 11/02/2009 (a)(b) | | | 25,600,000 | |
| 15,000,000 | | Highlands County Health Facilities
Authority, Adventist
Health—Series A
(CS: FSA; SPA: Dexia Credit Local)
0.450%, 11/05/2009 (a)(b) | | | 15,000,000 | |
| 7,995,000 | | Hillsborough County Aviation
Authority, Putters—Series 3021
(CS: Assured Guaranty Corp.; LIQ:
JPMorgan Chase Bank)
0.510%, 11/05/2009 (a)(b) | | | 7,995,000 | |
| 3,200,000 | | Industrial Development Revenue,
Enterprise—Series A-1
(LOC: Wachovia Bank N.A.)
0.570%, 11/04/2009 (a)(b) | | | 3,200,000 | |
| 3,705,000 | | Manatee County Industrial
Development Revenue,
Gaemmerler U.S. Corp.
(LOC: Bank of America N.A.)
0.570%, 11/05/2009 (a)(b) | | | 3,705,000 | |
| 1,850,000 | | Marion County Industrial
Development Authority,
Universal Forest Products
(LOC: JPMorgan Chase Bank)
0.570%, 11/05/2009 (a)(b) | | | 1,850,000 | |
| 2,800,000 | | Miami-Dade County Industrial
Development Authority,
Atlas Packaging, Inc.
(LOC: Mellon United
National Bank)
0.700%, 11/04/2009 (a)(b) | | | 2,800,000 | |
| 17,000,000 | | Orange County Health Facilities
Authority, Adventist Long
Term Care
(LOC: SunTrust Bank)
2.650%, 11/05/2009 (a)(b) | | | 17,000,000 | |
| 1,790,000 | | Polk County Industrial
Development Authority,
Elite Building Products, Inc.
(LOC: Wachovia Bank N.A.)
0.670%, 11/05/2009 (a)(b) | | | 1,790,000 | |
| 5,900,000 | | Sunshine State Governmental
Financing Commission
(LOC: DEXIA Credit Local)
0.270%, 11/04/2009 (a)(b) | | | 5,900,000 | |
| 19,300,000 | | West Orange Healthcare District
Revenue—Series B
(LOC: SunTrust Bank)
1.500%, 11/05/2009 (a)(b) | | | 19,300,000 | |
| | | | |
|
| |
| | | | | | 124,238,937 | |
| | | | |
|
| |
The accompanying notes are an integral part of these financial statements.
60
| |
Alpine Municipal Money Market Fund | |
| | |
Schedule of Portfolio Investments—Continued
October 31, 2009
| | | | | | | |
Principal
Amount | | Security
Description | | Value | |
| |
| |
| |
| | | | |
Municipal Bonds—continued | | | | |
Georgia—1.9% | | | | |
$ | 2,450,000 | | Atlanta Urban Residential
Finance Authority Revenue,
New Community East Lake
(LOC: Bank of America N.A.)
0.400%, 11/05/2009 (a)(b) | | $ | 2,450,000 | |
| 8,980,000 | | Atlanta Urban Residential
Finance Authority Revenue,
Peaks at West Atlanta
(LOC: SunTrust Bank)
1.300%, 11/04/2009 (a)(b) | | | 8,980,000 | |
| 4,000,000 | | Fulton County Development
Authority Industrial
Development Revenue,
Leggett & Platt, Inc.
(LOC: Wachovia Bank N.A.)
0.570%, 11/04/2009 (a)(b) | | | 4,000,000 | |
| | | | |
|
| |
| | | | | | 15,430,000 | |
| | | | |
|
| |
Illinois—8.3% | | | | |
| 6,660,000 | | Aurora Economic Development
Revenue, Aurora Christian
Schools, Inc.
(LOC: Fifth Third Bank)
0.700%, 11/05/2009 (a)(b) | | | 6,660,000 | |
| 2,600,000 | | Aurora Economic Development
Revenue, Christian Schools,
Inc.—Series B
(LOC: Fifth Third Bank)
0.700%, 11/05/2009 (a)(b) | | | 2,600,000 | |
| 410,000 | | Carol Stream Industrial
Development Revenue Bonds,
MI Enterprises
(LOC: JPMorgan Chase Bank)
1.500%, 11/05/2009 (a)(b) | | | 410,000 | |
| 11,000,000 | | Chicago Board of Education
Revenue—Series D
(CS: FSA; SPA: Dexia Credit Local)
0.250%, 11/05/2009 (a)(b) | | | 11,000,000 | |
| 1,495,000 | | Finance Authority Industrial
Development Revenue,
Alpha Beta Press, Inc.
(LOC: American National
Bank & Trust)
1.400%, 11/05/2009 (a)(b) | | | 1,495,000 | |
| 3,650,000 | | Finance Authority Industrial
Development Revenue,
Amtex Steel, Inc.
(LOC: Bank of America N.A.)
0.400%, 11/05/2009 (a)(b) | | | 3,650,000 | |
| 4,200,000 | | Finance Authority Industrial
Development Revenue, Beloit
Memorial Hospital, Inc.—Series A
(LOC: JPMorgan Chase Bank)
0.220%, 11/02/2009 (a)(b) | | | 4,200,000 | |
| 555,000 | | Finance Authority Industrial
Development Revenue,
Church Road Partnership
(LOC: JPMorgan Chase Bank)
2.300%, 11/05/2009 (a)(b) | | | 555,000 | |
| | | | | | | |
Principal
Amount | | Security
Description | | Value | |
| |
| |
| |
| | | | |
Municipal Bonds—continued | | | | |
Illinois—continued | | | | |
$ | 1,500,000 | | Finance Authority Industrial
Development Revenue,
DevelGroup LLC
(LOC: JPMorgan Chase Bank)
1.300%, 11/05/2009 (a)(b) | | $ | 1,500,000 | |
| 2,125,000 | | Finance Authority Industrial
Development Revenue, E Kinast
Distributors, Inc.—Series A
(LOC: JPMorgan Chase Bank)
0.910%, 11/05/2009 (a)(b) | | | 2,125,000 | |
| 440,000 | | Finance Authority Industrial
Development Revenue,
Fine Points LLC
(LOC: JPMorgan Chase Bank)
2.300%, 11/05/2009 (a)(b) | | | 440,000 | |
| 4,300,000 | | Finance Authority Industrial
Development Revenue,
Flying Food Fare, Inc.
(LOC: Harris Trust & Savings Bank)
0.580%, 11/05/2009 (a)(b) | | | 4,300,000 | |
| 1,140,000 | | Finance Authority Industrial
Development Revenue,
Haskris Co.
(LOC: JPMorgan Chase Bank)
2.300%, 11/05/2009 (a)(b) | | | 1,140,000 | |
| 3,000,000 | | Finance Authority Industrial
Development Revenue,
John Hofmeister & Son, Inc.
(LOC: Harris Bank N.A.)
0.580%, 11/05/2009 (a)(b) | | | 3,000,000 | |
| 2,800,000 | | Finance Authority Industrial
Development Revenue,
MacLean-Fogg Co.
(LOC: Bank of America N.A.)
1.420%, 11/05/2009 (a)(b) | | | 2,800,000 | |
| 995,000 | | Finance Authority Industrial
Development Revenue,
Merug LLC—Series B
(LOC: JPMorgan Chase Bank)
1.400%, 11/05/2009 (a)(b) | | | 995,000 | |
| 1,250,000 | | Finance Authority Industrial
Development Revenue,
Metform Corporation
(LOC: Bank of America N.A.)
1.420%, 11/05/2009 (a)(b) | | | 1,250,000 | |
| 2,900,000 | | Finance Authority Industrial
Development Revenue,
Search, Inc.
(LOC: JPMorgan Chase Bank)
0.300%, 11/05/2009 (a)(b) | | | 2,900,000 | |
| 6,000,000 | | Health Facilities Authority
Revenue, Rehabilitation
Institute of Chicago
(LOC: JPMorgan Chase Bank)
0.250%, 11/05/2009 (a)(b) | | | 6,000,000 | |
| 4,000,000 | | Phoenix Realty Special Account -U
LP Multifamily Revenue,
Brightons Mark
(LOC: Northern Trust Company)
0.410%, 11/05/2009 (a)(b) | | | 4,000,000 | |
The accompanying notes are an integral part of these financial statements.
61
| |
Alpine Municipal Money Market Fund | |
| | |
Schedule of Portfolio Investments—Continued
October 31, 2009
| | | | | | | |
Principal
Amount | | Security
Description | | Value | |
| |
| |
| |
| | | | |
Municipal Bonds—continued | | | | |
Illinois—continued | | | | |
$ | 1,800,000 | | Richton Park Industrial
Development Revenue,
Avatar Corp.
(LOC: National City Bank)
0.550%, 11/04/2009 (a)(b) | | $ | 1,800,000 | |
| 2,940,000 | | Woodridge Du Page Will & Cook
Variable Revenue, Home Run
Inn Frozen Foods
(LOC: JPMorgan Chase Bank)
2.300%, 11/05/2009 (a)(b) | | | 2,940,000 | |
| | | | |
|
| |
| | | | | | 65,760,000 | |
| | | | |
|
| |
Indiana—5.4% | | | | |
| 1,700,000 | | Finance Authority Industrial
Revenue, IB&B LLC—Series A
(LOC: Harris N.A.)
0.540%, 11/05/2009 (a)(b) | | | 1,700,000 | |
| 1,000,000 | | Hammond Industrial Economic
Development Revenue,
A.M. Castle & Co.
(LOC: Bank of America N.A.)
1.420%, 11/05/2009 (a)(b) | | | 1,000,000 | |
| 3,385,000 | | Hobart Economic Development
Revenue, Albanese Confectionery
(LOC: Harris N.A.)
0.580%, 11/05/2009 (a)(b) | | | 3,385,000 | |
| 3,500,000 | | Indianapolis Local Public
Improvement Revenue,
Indianapolis Airport
(CS: FSA; SPA: Dexia Credit Local)
0.230%, 11/02/2009 (a)(b) | | | 3,500,000 | |
| 10,000,000 | | State Finance Authority
Environmental Revenue,
Duke Energy—Series A-4
(LOC: Bank of America N.A.)
0.210%, 11/02/2009 (a)(b) | | | 10,000,000 | |
| 7,000,000 | | State Finance Authority Hospital
Revenue, Parkview Health
System, Inc.
(LOC: Citibank N.A.)
0.220%, 11/04/2009 (a)(b) | | | 7,000,000 | |
| 9,540,000 | | Valparaiso Industrial Economic
Development Revenue,
Task Force Tips, Inc.
(LOC: Harris N.A.)
0.540%, 11/05/2009 (a)(b) | | | 9,540,000 | |
| 1,700,000 | | Washington County Industrial
Economic Development Revenue,
Frank Miller Lumber Co.
(LOC: National City Bank)
1.350%, 11/05/2009 (a)(b) | | | 1,700,000 | |
| 1,900,000 | | Whiting Environmental Facilities
Revenue, Amoco Oil Co.
0.220%, 11/02/2009 (a)(b) | | | 1,900,000 | |
| 2,800,000 | | Whiting Environmental Facilities
Revenue, BP Products
North America, Inc.
0.220%, 11/02/2009 (a)(b) | | | 2,800,000 | |
| | | | |
|
| |
| | | | | | 42,525,000 | |
| | | | |
|
| |
| | | | | | | |
Principal
Amount | | Security
Description | | Value | |
| |
| |
| |
| | | | |
Municipal Bonds—continued | | | | |
Iowa—2.1% | | | | |
$ | 4,475,000 | | Lakes Trust Various State—
Series 2007-1
(LOC: Bank of America N.A.)
0.460%, 11/05/2009 (a)(b) | | $ | 4,475,000 | |
| 4,590,000 | | Lakes Trust Various State—
Series 2007-2
(LOC: Bank of America N.A.)
0.460%, 11/05/2009 (a)(b) | | | 4,590,000 | |
| 7,590,000 | | Sergeant Bluff Industrial
Development Revenue,
Sioux City Brick & Tile Co.
(LOC: U.S. Bank N.A.)
0.410%, 11/05/2009 (a)(b) | | | 7,590,000 | |
| | | | |
|
| |
| | | | | | 16,655,000 | |
| | | | |
|
| |
Kansas—0.1% | | | | |
| 1,110,000 | | State Development Finance
Authority, Four Seasons
Apartments
(LOC: U.S. Bank N.A.)
0.560%, 11/05/2009 (a)(b) | | | 1,110,000 | |
| | | | |
|
| |
Kentucky—4.0% | | | | |
| 300,000 | | Bardstown Industrial Development
Revenue, JAV Investment LLC
(LOC: JPMorgan Chase Bank)
2.300%, 11/05/2009 (a)(b) | | | 300,000 | |
| 31,000,000 | | Danville Commercial Paper
1.700, 11/05/2009 (c) | | | 31,000,000 | |
| 510,000 | | Hancock County Industrial
Development Revenue,
Precision Roll Grinders
(LOC: Chase Manhattan Bank)
2.300%, 11/05/2009 (a)(b) | | | 510,000 | |
| | | | |
|
| |
| | | | | | 31,810,000 | |
| | | | |
|
| |
Louisiana—0.2% | | | | |
| 1,240,000 | | Local Government Environmental
Facilities & Communities
Development Authority,
Hollybrook Cottonseed
Processing, LLC
(LOC: First South Farm Credit)
0.610%, 11/05/2009 (a)(b) | | | 1,240,000 | |
| | | | |
|
| |
Massachusetts—0.4% | | | | |
| 3,000,000 | | State Development Finance
Agency, Bridgewell, Inc.—Series A
(LOC: Keybank N.A.)
0.650%, 11/05/2009 (a)(b) | | | 3,000,000 | |
| | | | |
|
| |
Michigan—5.4% | | | | |
| 2,680,000 | | Kalamazoo Economic
Development Revenue,
Friendship Village—Series B
(LOC: Fifth Third Bank)
3.500%, 11/04/2009 (a)(b) | | | 2,680,000 | |
| 20,000,000 | | State Hospital Financing Authority,
Oaklawn Hospital
(LOC: Bank of America N.A.)
0.240%, 11/05/2009 (a)(b) | | | 20,000,000 | |
| 8,000,000 | | State Hospital Financing Authority,
Southwestern Rehabilitation
(LOC: Fifth Third Bank)
0.770%, 11/05/2009 (a)(b) | | | 8,000,000 | |
The accompanying notes are an integral part of these financial statements.
62
|
Alpine Municipal Money Market Fund |
| |
Schedule of Portfolio Investments—Continued
October 31, 2009
| | | | | | | |
Principal
Amount | | Security
Description | | Value | |
| |
| |
| |
|
Municipal Bonds—continued | | | |
Michigan—continued | | | |
$ | 400,000 | | Sterling Heights Economic
Development Corp. Limited
Obligations Revenue, Kunath
Enterprises LLC
(LOC: JPMorgan Chase Bank)
1.400%, 11/04/2009 (a)(b) | | $ | 400,000 | |
| 7,600,000 | | Strategic Fund Limited Obligation
Revenue, Glastender Inc.
(LOC: JPMorgan Chase Bank)
0.700%, 11/05/2009 (a)(b) | | | 7,600,000 | |
| 1,600,000 | | Strategic Fund Limited Obligation
Revenue, Kaja Enterprises, LLC
(LOC: National City Bank)
0.550%, 11/05/2009 (a)(b) | | | 1,600,000 | |
| 900,000 | | Strategic Fund Limited Obligations
Revenue, Landscape Forms, Inc.
(LOC: JPMorgan Chase Bank)
1.400%, 11/04/2009 (a)(b) | | | 900,000 | |
| 1,200,000 | | Strategic Fund Limited Obligation
Revenue, Mold Masters Co.
(LOC: JPMorgan Chase Bank)
2.300%, 11/05/2009 (a)(b) | | | 1,200,000 | |
| 500,000 | | Strategic Fund Limited Obligation
Revenue, Richwood Industries, Inc.
(LOC: JPMorgan Chase Bank)
0.700%, 11/04/2009 (a)(b) | | | 500,000 | |
| | | | |
|
| |
| | | | | | 42,880,000 | |
| | | | |
|
| |
Minnesota—0.8% | | | | |
| 1,570,000 | | Blooming Prairie Industrial
Development Revenue,
Metal Services
(LOC: U.S. Bank N.A.)
0.510%, 11/03/2009 (a)(b) | | | 1,570,000 | |
| 4,983,000 | | Minneapolis Revenue,
Minnehaha Academy
(LOC: U.S. Bank N.A.)
0.200%, 11/02/2009 (a)(b) | | | 4,983,000 | |
| | | | |
|
| |
| | | | | | 6,553,000 | |
| | | | |
|
| |
Missouri—1.2% | | | | |
| 1,500,000 | | Greene County Industrial
Development Authority Revenue,
Kramer Enterprises
(LOC: U.S. Bank N.A.)
0.660%, 11/05/2009 (a)(b) | | | 1,500,000 | |
| | | Springfield Industrial Development
Authority Revenue,
DMP Properties LLC
(LOC: U.S. Bank N.A.) | | | | |
| 1,825,000 | | 0.610%, 11/05/2009 (a)(b) | | | 1,825,000 | |
| 1,360,000 | | 0.660%, 11/05/2009 (a)(b) | | | 1,360,000 | |
| 1,685,000 | | St. Charles County Industrial
Development Authority Revenue,
Patriot Machine Inc.
(LOC: U.S. Bank N.A.)
0.610%, 11/05/2009 (a)(b) | | | 1,685,000 | |
| 2,000,000 | | St. Joseph Industrial Development
Authority Revenue,
Albaugh Inc.—Series A
(LOC: U.S. Bank N.A.)
0.610%, 11/05/2009 (a)(b) | | | 2,000,000 | |
| | | | | | | |
Principal
Amount | | Security
Description | | Value | |
| |
| |
| |
|
Municipal Bonds—continued |
Missouri—continued |
$ | 800,000 | | State Environmental Improvement
Revenue, Utilicorp United Inc.
(LOC: Bank of America N.A.)
2.090%, 11/04/2009 (a)(b) | | $ | 800,000 | |
| | | | |
|
| |
| | | | | | 9,170,000 | |
| | | | |
|
| |
Montana—0.5% | | | | |
| 4,180,000 | | Great Falls Multifamily Revenue,
Autumn Run Apartments
0.290%, 11/05/2009 (a)(b) | | | 4,180,000 | |
| | | | |
|
| |
New Mexico—0.4% | | | | |
| 1,305,000 | | Albuquerque Industrial
Development Revenue, Karsten Co.
(LOC: U.S. Bank N.A.)
0.640%, 11/05/2009 (a)(b) | | | 1,305,000 | |
| 1,830,000 | | Las Cruces Industrial Development
Revenue, Parkview Metal Products
(LOC: American National
Bank & Trust)
2.380%, 08/06/2009 (a)(b)
2.300%, 11/05/2009 (a)(b) | | | 1,830,000 | |
| | | | |
|
| |
| | | | | | 3,135,000 | |
| | | | |
|
| |
New York—2.3% | | | | |
| 4,000,000 | | Clinton County Industrial
Development Agency, Champlain
Valley Physicians Hospital
(CS: Radian; LOC: Keybank N.A.)
0.650%, 11/05/2009 (a)(b) | | | 4,000,000 | |
| 330,000 | | New York City Industrial
Development Agency, Peninsula
Hospital Center
(LOC: JPMorgan Chase Bank)
2.300%, 11/05/2009 (a)(b) | | | 330,000 | |
| 13,550,000 | | State Energy Research &
Development Authority, Orange/
Rockland Utilities—Series A
(CS: AMBAC; LOC:
Wachovia Bank N.A.)
0.450%, 11/04/2009 (a)(b) | | | 13,550,000 | |
| | | | |
|
| |
| | | | | | 17,880,000 | |
| | | | |
|
| |
North Carolina—2.6% | | | | |
| 20,000,000 | | Charlotte-Mecklenberg Hospital
Authority Revenue—Series E
(CS: FSA; SPA: Dexia Credit Local)
0.320%, 11/05/2009 (a)(b) | | | 20,000,000 | |
| 700,000 | | Mecklenburg County
Certificates—Series A
(SPA: SunTrust Bank)
0.800%, 11/05/2009 (a)(b) | | | 700,000 | |
| | | | |
|
| |
| | | | | | 20,700,000 | |
| | | | |
|
| |
Ohio—3.1% | | | | |
| 4,015,000 | | Cuyahoga County Civic Facilities
Revenue, Fairfax Development
Corp.
(LOC: Keybank N.A.)
0.850%, 11/05/2009 (a)(b) | | | 4,015,000 | |
| 2,105,000 | | Fairfield Industrial Development
Revenue, Prestige Display
& Packaging
(LOC: National City Bank)
0.620%, 11/04/2009 (a)(b) | | | 2,105,000 | |
The accompanying notes are an integral part of these financial statements.
63
|
Alpine Municipal Money Market Fund |
| |
Schedule of Portfolio Investments—Continued
October 31, 2009
| | | | | | | |
Principal
Amount | | Security
Description | | Value | |
| |
| |
| |
|
Municipal Bonds—continued | | | | |
Ohio—continued | | | | |
$ | 6,300,000 | | Geauga County Revenue, South
Franklin Circle—Series A
(LOC: Keybank N.A.)
0.280%, 11/02/2009 (a)(b) | | $ | 6,300,000 | |
| 11,800,000 | | State Solid Waste Revenue,
BP Exploration & Oil
0.220%, 11/02/2009 (a)(b) | | | 11,800,000 | |
| | | | |
|
| |
| | | | | | 24,220,000 | |
| | | | |
|
| |
Oklahoma—2.2% | | | | |
| 8,800,000 | | Development Finance Authority
Revenue, Seaboard Farms, Inc.
(LOC: Bank of New York)
0.400%, 11/04/2009 (a)(b) | | | 8,800,000 | |
| 3,300,000 | | Guymon Utilities Authority
Revenue, Seaboard Farms, Inc.
(LOC: Bank of the West)
0.900%, 11/04/2009 (a)(b) | | | 3,300,000 | |
| 5,000,000 | | Pittsburg County Economic
Development Authority Revenue,
Simonton Building Products, Inc.
(LOC: PNC Bank N.A.)
0.350%, 11/05/2009 (a)(b) | | | 5,000,000 | |
| | | | |
|
| |
| | | | | | 17,100,000 | |
| | | | |
|
| |
Oregon—1.1% | | | | |
| 2,200,000 | | State Economic Development
Revenue, McFarland
Cascade—Series 175
(LOC: U.S. Bank N.A.)
0.540%, 11/05/2009 (a)(b) | | | 2,200,000 | |
| 300,000 | | State Economic Development
Revenue, Patrick Industries, Inc.
(LOC: JPMorgan Chase Bank)
2.300%, 11/05/2009 (a)(b) | | | 300,000 | |
| 6,070,000 | | State Economic Development
Revenue, YoCream
(LOC: Keybank N.A.)
0.850%, 11/05/2009 (a)(b) | | | 6,070,000 | |
| | | | |
|
| |
| | | | | | 8,570,000 | |
| | | | |
|
| |
Pennsylvania—2.5% | | | | |
| 9,915,000 | | Delaware County Industrial
Development Authority Revenue
(CS: BHAC; LIQ: Citibank N.A.)
0.280%, 11/05/2009 (a)(b)(e) | | | 9,915,000 | |
| 10,225,000 | | Washington County Industrial
Development Authority Revenue,
Presbyterian Senior Care
(CS: Radian; LOC:
National City Bank)
0.310%, 11/05/2009 (a)(b) | | | 10,225,000 | |
| | | | |
|
| |
| | | | | | 20,140,000 | |
| | | | |
|
| |
South Carolina—0.6% | | | | |
| 4,380,000 | | State Jobs—Economic Development
Authority Revenue, MFG Co., Inc.
(LOC: Bank of America N.A.)
0.400%, 11/04/2009 (a)(b) | | | 4,380,000 | |
| | | | |
|
| |
Tennessee—1.1% | | | | |
$ | 1,200,000 | | Huntingdon Industrial
Development Board Revenue,
Associates Rubber Co.
(LOC: PNC Bank N.A.)
0.900%, 11/04/2009 (a)(b) | | $ | 1,200,000 | |
| | | | | | | |
Principal
Amount | | Security
Description | | Value | |
| |
| |
| |
|
Municipal Bonds—continued | | | | |
Tennessee—continued | | | | |
$ | 2,500,000 | | Metropolitan Government
Nashville & Davidson County
Health & Educational Facilities
Revenue
(LOC: U.S. Bank N.A.)
0.290%, 11/05/2009 (a)(b) | | $ | 2,500,000 | |
| 5,155,000 | | Metropolitan Nashville Airport
Authority Revenue,
AERO Nashville LLC
(LOC: JPMorgan Chase Bank)
0.360%, 11/05/2009 (a)(b) | | | 5,155,000 | |
| | | | |
|
| |
| | | | | | 8,855,000 | |
| | | | |
|
| |
Texas—11.8% | | | | |
| 10,020,000 | | Austin Hotel Occupancy Tax
Revenue, Sub Lien—Series A
(LOC: Dexia Credit Local)
0.260%, 11/05/2009 (a)(b) | | | 10,020,000 | |
| 2,600,000 | | Dallam County Industrial
Development Corp. Revenue,
Rick & Janice Van Ryn
(LOC: Great Plains AG Credit)
0.610%, 11/05/2009 (a)(b) | | | 2,600,000 | |
| 2,100,000 | | Dallam County Industrial
Development Corp. Revenue,
Cons Dairy Management LLC
(LOC: Great Plains AG Credit)
0.610%, 11/05/2009 (a)(b) | | | 2,100,000 | |
| 3,250,000 | | Fort Bend County Industrial
Development Corp. Revenue,
Aaron Rents, Inc.
(LOC: Wachovia Bank N.A.)
0.570%, 11/05/2009 (a)(b) | | | 3,250,000 | |
| 25,000,000 | | Gulf Coast Industrial Development
Authority Revenue, Citgo Pete
(LOC: BNP Paribas)
0.220%, 11/02/2009 (a)(b) | | | 25,000,000 | |
| 3,400,000 | | Gulf Coast Waste Disposal
Authority Revenue, Amoco Oil Co.
0.220%, 11/02/2009 (a)(b) | | | 3,400,000 | |
| 2,000,000 | | Northside Independent School
District
(CS: PSF-GTD; LIQ: State Street
Bank & Trust Co.)
1.200%, 12/01/2009 (d) | | | 2,000,000 | |
| 12,000,000 | | Port Arthur Navigation District
Revenue, BASF Corp.
0.520%, 11/04/2009 (a)(b) | | | 12,000,000 | |
| 32,500,000 | | Port Corpus Christi Authority
Nueces County Solid Waste
Disposal, Flint Hills Resources LP
0.670%, 11/04/2009 (a)(b) | | | 32,500,000 | |
| | | | |
|
| |
| | | | | | 92,870,000 | |
| | | | |
|
| |
Vermont—2.4% | | | | |
| 6,450,000 | | Housing Finance Agency—Series 26
(CS: FSA; SPA: TD Bank N.A.)
5.000%, 11/04/2009 (a)(b) | | | 6,450,000 | |
| 12,800,000 | | Housing Finance Agency—Series A
(CS: FSA; SPA: Dexia Credit Local)
0.750%, 11/04/2009 (a)(b) | | | 12,800,000 | |
| | | | |
|
| |
| | | | | | 19,250,000 | |
| | | | |
|
| |
The accompanying notes are an integral part of these financial statements.
64
|
Alpine Municipal Money Market Fund |
| |
Schedule of Portfolio Investments—Continued
October 31, 2009
| | | | | | | |
Principal
Amount | | Security
Description | | Value | |
| |
| |
| |
|
Municipal Bonds—continued | | | | |
Virginia—1.7% | | | | |
$ | 1,000,000 | | Brunswick County Industrial
Development Authority Revenue,
Aegis Waste Solutions, Inc.
(LOC: Bank of America N.A.)
2.300%, 11/05/2009 (a)(b) | | $ | 1,000,000 | |
| 5,170,000 | | Port Authority Revenue,
P-Floats—Series 2671
(CS: FSA; LIQ: Dexia Credit Local)
1.210%, 11/05/2009 (a)(b) | | | 5,170,000 | |
| 7,650,000 | | Staunton Industrial Development
Authority Revenue,
Specialty Blades, Inc.
(LOC: SunTrust Bank)
1.300%, 11/04/2009 (a)(b) | | | 7,650,000 | |
| | | | |
|
| |
| | | | | | 13,820,000 | |
| | | | |
|
| |
Washington—6.0% | | | | |
| 2,745,000 | | Economic Development Finance
Authority Revenue, Wesmar
Co. Inc., Project—Series F
(LOC: U.S. Bank N.A.)
0.510%, 11/05/2009 (a)(b) | | | 2,745,000 | |
| 6,125,000 | | Port Bellingham Industrial
Development Revenue,
Hempler Foods Group
(LOC: Bank of Montreal)
0.540%, 11/05/2009 (a)(b) | | | 6,125,000 | |
| 3,140,000 | | Port Bellingham Industrial
Development Revenue,
Wood Stone Corp.
(LOC: Keybank N.A.)
1.100%, 11/05/2009 (a)(b) | | | 3,140,000 | |
| 11,500,000 | | Seattle Housing Authority Revenue,
High Point Project Phase II
(LOC: Keybank N.A.)
0.850%, 11/05/2009 (a)(b) | | | 11,500,000 | |
| 9,520,000 | | State Housing Finance Commission,
Mirabella—Series A
(LOC: HSH Nordbank AG)
0.400%, 11/02/2009 (a)(b) | | | 9,520,000 | |
| 14,375,000 | | State Housing Finance Commission,
Panorama City
(LOC: Keybank N.A.)
0.400%, 11/02/2009 (a)(b) | | | 14,375,000 | |
| | | | |
|
| |
| | | | | | 47,405,000 | |
| | | | |
|
| |
| | | | | | | |
Principal
Amount | | Security
Description | | Value | |
| |
| |
| |
|
Municipal Bonds—continued | | | | |
West Virginia—0.5% | | | | |
$ | 4,000,000 | | Economic Development Authority
Solid Waste Disposal Facilities
Revenue, Appalachian
Power—Series B
(LOC: JPMorgan Chase Bank)
0.370%, 11/05/2009 (a)(b) | | $ | 4,000,000 | |
| | | | |
|
| |
Wisconsin—0.5% | | | | |
| 300,000 | | Elkhorn Industrial Development
Revenue, Lanco Precision Plus
(LOC: JPMorgan Chase Bank)
2.300%, 11/04/2009 (a)(b) | | | 300,000 | |
| 1,750,000 | | Franklin Industrial Development
Revenue, Smyczek/ECS Project
(LOC: Wells Fargo Bank N.A.)
2.300%, 11/05/2009 (a)(b) | | | 1,750,000 | |
| 600,000 | | Hartford Water & Electric Systems
Revenue
(CS: Assured Guaranty)
2.000%, 07/01/2010 | | | 603,569 | |
| 1,000,000 | | Mequon Industrial Development
Revenue, Gateway Plastics, Inc.
(LOC: JPMorgan Chase Bank)
2.300%, 11/05/2009 (a)(b) | | | 1,000,000 | |
| | | | |
|
| |
| | | | | | 3,653,569 | |
| | | | |
|
| |
| | | Total Municipal Bonds
(Cost $731,476,506) | | | 731,476,506 | |
| | | | |
|
| |
| | | | | | |
Shares | | | | | | |
| | | | | | |
|
Money Market Funds—5.7% | | | | |
| 27,100,000 | | BlackRock Liquidity Fund
MuniCash Portfolio, 0.25% | | | 27,100,000 | |
| 17,800,000 | | BlackRock Liquidity Funds
Muni Fund Portfolio, 0.17% | | | 17,800,000 | |
| 66,811 | | SEI Tax Exempt Trust—Institutional
Tax Free Fund—Class A, 0.08% | | | 66,811 | |
| | | | |
|
| |
| | | Total Money Market Funds
(Cost $44,966,811) | | | 44,966,811 | |
| | | | |
|
| |
| | | Total Investments
(Cost $776,443,317)—98.3% | | | 776,443,317 | |
| | | Other Assets in Excess of
Liabilities—1.7% | | | 13,389,137 | |
| | | | |
|
| |
| | | TOTAL NET ASSETS—100.0% | | $ | 789,832,454 | |
| | | | |
|
| |
| |
|
Percentages are stated as a percent of net assets. |
|
(a) | Variable Rate Security—The rate reported is the rate in effect as of October 31, 2009. The date shown is the next reset date. |
|
(b) | Maturity date represents first available put date. |
|
(c) | Commercial Paper |
|
(d) | Put Bond |
|
(e) | Restricted under Rule 144A of the Securities Act of 1933. These securities may be resold in transactions exempt from registration, normally to qualified institutional buyers. These securities have been determined to be liquid under guidelines established by the Board of Trustees. Liquid securities restricted under Rule 144A comprised 1.3% of the Fund’s net assets. |
|
CS—Credit Support |
LIQ—Liquidity Facility |
LOC—Letter of Credit |
SPA—Standby Purchase Agreement |
The accompanying notes are an integral part of these financial statements.
65
Statements of Assets and Liabilities
October 31, 2009
| | | | | | | | | | |
| | Dynamic
Dividend
Fund | | Accelerating
Dividend
Fund | | Dynamic
Financial Services
Fund | |
| |
| |
| |
| |
ASSETS: | | | | | | | | | | |
Investments, at value (1) | | $ | 561,293,372 | | $ | 1,213,121 | | $ | 8,410,651 | |
Cash | | | 83,906 | | | — | | | 100 | |
Cash denominated in foreign currencies | | | 3,238,039 | | | — | | | — | |
Receivable from capital shares issued | | | 2,386,629 | | | — | | | 6,263 | |
Receivable from investment securities sold | | | 47,977,308 | | | 33,565 | | | 460,158 | |
Due from Adviser | | | — | | | 685 | | | — | |
Dividends and interest receivable | | | 2,301,003 | | | 2,037 | | | 735 | |
Prepaid expenses and other assets | | | 45,607 | | | 4,730 | | | 12,884 | |
| |
|
| |
|
| |
|
| |
Total assets | | | 617,325,864 | | | 1,254,138 | | | 8,890,791 | |
| |
|
| |
|
| |
|
| |
| | | | | | | | | | |
LIABILITIES: | | | | | | | | | | |
Payable for capital shares redeemed | | | 887,931 | | | — | | | — | |
Payable for investment securities purchased | | | 22,055,397 | | | 28,809 | | | 349,074 | |
Accrued expenses and other liabilities: | | | | | | | | | | |
Investment advisory fees | | | 503,044 | | | — | | | 4,804 | |
Line of credit | | | 21,423,000 | | | — | | | 621,000 | |
Other | | | 305,085 | | | 10,743 | | | 20,980 | |
| |
|
| |
|
| |
|
| |
Total liabilities | | | 45,174,457 | | | 39,552 | | | 995,858 | |
| |
|
| |
|
| |
|
| |
Net Assets | | $ | 572,151,407 | | $ | 1,214,586 | | $ | 7,894,933 | |
| |
|
| |
|
| |
|
| |
| | | | | | | | | | |
Net assets represented by | | | | | | | | | | |
Capital stock | | $ | 1,522,135,095 | | $ | 1,060,985 | | $ | 13,458,870 | |
Accumulated undistributed net investment income | | | 24,330,835 | | | 12,387 | | | 4,653 | |
Accumulated net realized gains (losses) on investments, foreign currency translation, forward currency contracts and swap contracts | | | (991,627,413 | ) | | 5,574 | | | (404,704 | ) |
Net unrealized appreciation (depreciation) on: | | | | | | | | | | |
Investments | | | 17,273,478 | | | 135,638 | | | (5,163,951 | ) |
Foreign currency translation | | | 39,412 | | | 2 | | | 65 | |
| |
|
| |
|
| |
|
| |
Total Net Assets | | $ | 572,151,407 | | $ | 1,214,586 | | $ | 7,894,933 | |
| |
|
| |
|
| |
|
| |
| | | | | | | | | | |
Net asset value | | | | | | | | | | |
Net assets | | $ | 572,151,407 | | $ | 1,214,586 | | $ | 7,894,933 | |
Shares of beneficial interest issued and outstanding | | | 119,757,986 | | | 105,816 | | | 1,150,680 | |
Net asset value, offering price and redemption price per share | | $ | 4.78 | | $ | 11.48 | | $ | 6.86 | |
| |
|
| |
|
| |
|
| |
(1) Cost of investments | | $ | 544,019,894 | | $ | 1,077,483 | | $ | 13,574,602 | |
The accompanying notes are an integral part of these financial statements.
66
Statements of Assets and Liabilities—Continued
October 31, 2009
| | | | | | | | | | |
| | Dynamic
Innovators
Fund | | Dynamic
Transformations
Fund | | Dynamic
Balance
Fund | |
| |
| |
| |
| |
ASSETS: | | | | | | | | | | |
Investments, at value (1) | | $ | 12,614,559 | | $ | 3,769,458 | | $ | 55,279,466 | |
Receivable from capital shares issued | | | 100 | | | 15,000 | | | — | |
Receivable from investment securities sold | | | 42 | | | — | | | — | |
Due from Adviser | | | — | | | 205 | | | — | |
Dividends and interest receivable | | | 4,900 | | | 9 | | | 253,537 | |
Prepaid expenses and other assets | | | 10,595 | | | 3,615 | | | 7,834 | |
| |
|
| |
|
| |
|
| |
Total assets | | | 12,630,196 | | | 3,788,287 | | | 55,540,837 | |
| |
|
| |
|
| |
|
| |
| | | | | | | | | | |
LIABILITIES: | | | | | | | | | | |
Written option contracts, at value (2) | | | — | | | — | | | 4,270 | |
Payable for capital shares redeemed | | | 5,033 | | | — | | | 9,035 | |
Payable for investment securities purchased | | | 106,439 | | | 255,974 | | | 215,000 | |
Accrued expenses and other liabilities: | | | | | | | | | | |
Investment advisory fees | | | 11,020 | | | — | | | 48,949 | |
Line of credit | | | 1,376,000 | | | — | | | — | |
Other | | | 24,189 | | | 18,108 | | | 33,365 | |
| |
|
| |
|
| |
|
| |
Total liabilities | | | 1,522,681 | | | 274,082 | | | 310,619 | |
| |
|
| |
|
| |
|
| |
Net Assets | | $ | 11,107,515 | | $ | 3,514,205 | | $ | 55,230,218 | |
| |
|
| |
|
| |
|
| |
| | | | | | | | | | |
Net assets represented by | | | | | | | | | | |
Capital stock | | $ | 26,624,214 | | $ | 4,600,119 | | $ | 66,652,864 | |
Accumulated undistributed net investment loss | | | — | | | — | | | (26,712 | ) |
Accumulated net realized losses on investments, foreign currency translation and written option contracts expired or closed | | | (12,053,242 | ) | | (793,664 | ) | | (266,400 | ) |
Net unrealized appreciation (depreciation) on: | | | | | | | | | | |
Investments | | | (3,463,457 | ) | | (292,250 | ) | | (11,140,758 | ) |
Written options | | | — | | | — | | | 11,224 | |
| |
|
| |
|
| |
|
| |
Total Net Assets | | $ | 11,107,515 | | $ | 3,514,205 | | $ | 55,230,218 | |
| |
|
| |
|
| |
|
| |
| | | | | | | | | | |
Net asset value | | | | | | | | | | |
Net assets | | $ | 11,107,515 | | $ | 3,514,205 | | $ | 55,230,218 | |
Shares of beneficial interest issued and outstanding | | | 1,366,241 | | | 457,722 | | | 6,216,339 | |
Net asset value, offering price and redemption price per share | | $ | 8.13 | | $ | 7.68 | | $ | 8.88 | |
| |
|
| |
|
| |
|
| |
(1) Cost of investments | | $ | 16,078,016 | | $ | 4,061,708 | | $ | 66,420,224 | |
(2) Premiums received | | $ | — | | $ | — | | $ | 15,494 | |
The accompanying notes are an integral part of these financial statements.
67
Statements of Assets and Liabilities—Continued
October 31, 2009
| | | | | | | |
| | Ultra Short
Tax Optimized
Income
Fund | | Municipal
Money Market
Fund | |
| |
| |
| |
ASSETS: | | | | | | | |
Investments, at value (1) | | $ | 1,741,337,941 | | $ | 776,443,317 | |
Receivable from capital shares issued | | | 26,925,565 | | | 13,352,757 | |
Receivable from investment securities sold | | | 20,249 | | | — | |
Interest receivable | | | 7,488,614 | | | 1,130,349 | |
Prepaid expenses and other assets | | | 25,759 | | | 23,093 | |
| |
|
| |
|
| |
Total assets | | | 1,775,798,128 | | | 790,949,516 | |
| |
|
| |
|
| |
| | | | | | | |
LIABILITIES: | | | | | | | |
Payable for capital shares redeemed | | | 5,245,242 | | | 664,212 | |
Payable for investment securities purchased | | | 95,073,156 | | | — | |
Payable to custodian | | | 718,660 | | | 97,156 | |
Accrued expenses and other liabilities: | | | | | | | |
Investment advisory fees | | | 714,825 | | | 295,017 | |
Distribution fees | | | 46,517 | | | — | |
Other | | | 139,589 | | | 60,677 | |
| |
|
| |
|
| |
Total liabilities | | | 101,937,989 | | | 1,117,062 | |
| |
|
| |
|
| |
Net Assets | | $ | 1,673,860,139 | | $ | 789,832,454 | |
| |
|
| |
|
| |
| | | | | | | |
Net assets represented by | | | | | | | |
Capital stock | | $ | 1,672,579,705 | | $ | 789,832,454 | |
Accumulated undistributed net investment income | | | 524 | | | — | |
Accumulated net realized losses on investments sold | | | (52,240 | ) | | — | |
Net unrealized appreciation on investments | | | 1,332,150 | | | — | |
| |
|
| |
|
| |
Total Net Assets | | $ | 1,673,860,139 | | $ | 789,832,454 | |
| |
|
| |
|
| |
| | | | | | | |
Net asset value | | | | | | | |
Adviser Class Shares | | | | | | | |
Net assets | | $ | 211,643,324 | | | | |
Shares of beneficial interest issued and outstanding | | | 20,949,311 | | | | |
Net asset value and redemption price per share | | $ | 10.10 | | | | |
Maximum offering price per share (net asset value plus sales charge of 0.005%) | | $ | 10.15 | | | | |
Investor Class Shares | | | | | | | |
Net assets | | $ | 1,462,216,815 | | $ | 789,832,454 | |
Shares of beneficial interest issued and outstanding | | | 145,546,483 | | | 789,835,122 | |
Net asset value, offering price and redemption price per share | | $ | 10.05 | | $ | 1.00 | |
| |
|
| |
|
| |
(1) Cost of investments | | $ | 1,740,005,791 | | $ | 776,443,317 | |
The accompanying notes are an integral part of these financial statements.
68
Statements of Operations
For the year ended October 31, 2009
| | | | | | | | | | |
| | Dynamic
Dividend
Fund | | Accelerating
Dividend
Fund (1) | | Dynamic
Financial Services
Fund | |
| |
| |
| |
| |
INVESTMENT INCOME: | | | | | | | | | | |
Interest income | | $ | 25,021 | | $ | 729 | | $ | 43 | |
Dividend income* | | | 141,972,618 | | | 25,719 | | | 113,379 | |
| |
|
| |
|
| |
|
| |
Total investment income | | | 141,997,639 | | | 26,448 | | | 113,422 | |
| |
|
| |
|
| |
|
| |
| | | | | | | | | | |
EXPENSES: | | | | | | | | | | |
Investment advisory fees | | | 5,213,424 | | | 10,416 | | | 62,150 | |
Administration fees | | | 201,469 | | | 411 | | | 2,753 | |
Fund accounting fees | | | 127,249 | | | 260 | | | 1,731 | |
Audit and tax fees | | | 26,250 | | | 16,557 | | | 20,677 | |
Custodian fees | | | 44,771 | | | 94 | | | 616 | |
Legal fees | | | 48,149 | | | 17,481 | | | 4,083 | |
Registration and filing fees | | | 43,405 | | | 6,733 | | | 20,113 | |
Printing and mailing fees | | | 217,446 | | | 99 | | | 4,613 | |
Transfer agent fees | | | 201,458 | | | 414 | | | 2,751 | |
Trustee fees | | | 4,069 | | | 2,119 | | | 2,430 | |
Interest expense | | | 101,599 | | | — | | | 5,516 | |
Other fees | | | 35,743 | | | 184 | | | 465 | |
| |
|
| |
|
| |
|
| |
Total expenses before expense waiver by Adviser | | | 6,265,032 | | | 54,768 | | | 127,898 | |
Expense waiver by Adviser (Note 6) | | | — | | | (40,707 | ) | | (38,481 | ) |
| |
|
| |
|
| |
|
| |
Net expenses | | | 6,265,032 | | | 14,061 | | | 89,417 | |
| |
|
| |
|
| |
|
| |
Net investment income | | | 135,732,607 | | | 12,387 | | | 24,005 | |
| |
|
| |
|
| |
|
| |
| | | | | | | | | | |
REALIZED AND UNREALIZED GAIN (LOSS) ON INVESTMENTS: | | | | | | | | | | |
Net realized gain (loss) on: | | | | | | | | | | |
Investments | | | (371,836,256 | ) | | 5,392 | | | (145,307 | ) |
Written option contracts expired or closed | | | 672,620 | | | — | | | — | |
Foreign currency translation | | | (1,907,275 | ) | | 182 | | | 7,994 | |
Forward currency contracts | | | (3,392,718 | ) | | — | | | — | |
Swap contracts | | | 5,526,555 | | | — | | | — | |
| |
|
| |
|
| |
|
| |
Net realized gain (loss) | | | (370,937,074 | ) | | 5,574 | | | (137,313 | ) |
| |
|
| |
|
| |
|
| |
Change in unrealized appreciation on: | | | | | | | | | | |
Investments | | | 259,883,578 | | | 135,638 | | | 1,352,226 | |
Foreign currency translation | | | 249,106 | | | 2 | | | 674 | |
| |
|
| |
|
| |
|
| |
Net change in unrealized appreciation | | | 260,132,684 | | | 135,640 | | | 1,352,900 | |
| |
|
| |
|
| |
|
| |
Net realized and unrealized gain (loss) on investments | | | (110,804,390 | ) | | 141,214 | | | 1,215,587 | |
| |
|
| |
|
| |
|
| |
Change in net assets resulting from operations | | $ | 24,928,217 | | $ | 153,601 | | $ | 1,239,592 | |
| |
|
| |
|
| |
|
| |
| | | | | | | | | | |
* Net of foreign taxes withheld | | $ | 6,800,092 | | $ | 494 | | $ | 2,644 | |
| |
|
| |
|
| |
|
| |
(1) Fund commenced operations on November 5, 2008. | | | | | | | | | | |
The accompanying notes are an integral part of these financial statements.
69
Statements of Operations—Continued
For the year ended October 31, 2009
| | | | | | | | | | |
| | Dynamic
Innovators
Fund | | Dynamic
Transformations
Fund | | Dynamic
Balance
Fund | |
| |
| |
| |
| |
INVESTMENT INCOME: | | | | | | | | | | |
Interest income | | $ | — | | $ | 415 | | $ | 554,539 | |
Dividend income* | | | 61,037 | | | 32,251 | | | 930,076 | |
| |
|
| |
|
| |
|
| |
Total investment income | | | 61,037 | | | 32,666 | | | 1,484,615 | |
| |
|
| |
|
| |
|
| |
| | | | | | | | | | |
EXPENSES: | | | | | | | | | | |
Investment advisory fees | | | 98,541 | | | 27,333 | | | 511,518 | |
Administration fees | | | 4,112 | | | 1,192 | | | 22,758 | |
Fund accounting fees | | | 2,595 | | | 752 | | | 14,372 | |
Audit and tax fees | | | 20,198 | | | 20,397 | | | 23,050 | |
Custodian fees | | | 916 | | | 263 | | | 5,061 | |
Legal fees | | | 4,427 | | | 4,258 | | | 8,905 | |
Registration and filing fees | | | 21,169 | | | 19,207 | | | 22,802 | |
Printing and mailing fees | | | 5,674 | | | 956 | | | 4,151 | |
Transfer agent fees | | | 4,113 | | | 1,198 | | | 22,775 | |
Trustee fees | | | 2,273 | | | 2,384 | | | 2,617 | |
Interest expense | | | 18,786 | | | 94 | | | 1,266 | |
Other fees | | | 677 | | | 229 | | | 3,849 | |
| |
|
| |
|
| |
|
| |
Total expenses before expense waiver by Adviser | | | 183,481 | | | 78,263 | | | 643,124 | |
Expense waiver by Adviser (Note 6) | | | (31,680 | ) | | (41,270 | ) | | — | |
| |
|
| |
|
| |
|
| |
Net expenses | | | 151,801 | | | 36,993 | | | 643,124 | |
| |
|
| |
|
| |
|
| |
Net investment income (loss) | | | (90,764 | ) | | (4,327 | ) | | 841,491 | |
| |
|
| |
|
| |
|
| |
| | | | | | | | | | |
REALIZED AND UNREALIZED GAIN (LOSS) ON INVESTMENTS: | | | | | | | | | | |
Net realized gain (loss) on: | | | | | | | | | | |
Investments | | | (5,526,915 | ) | | (653,420 | ) | | 703 | |
Written option contracts expired or closed | | | — | | | — | | | 145,530 | |
Foreign currency translation | | | 92 | | | — | | | — | |
| |
|
| |
|
| |
|
| |
Net realized gain (loss) | | | (5,526,823 | ) | | (653,420 | ) | | 146,233 | |
| |
|
| |
|
| |
|
| |
Change in unrealized appreciation (depreciation) on: | | | | | | | | | | |
Investments | | | 6,968,188 | | | 1,518,183 | | | 4,462,680 | |
Written option contracts | | | — | | | — | | | 11,224 | |
Foreign currency translation | | | (49 | ) | | — | | | — | |
| |
|
| |
|
| |
|
| |
Net change in unrealized appreciation | | | 6,968,139 | | | 1,518,183 | | | 4,473,904 | |
| |
|
| |
|
| |
|
| |
Net realized and unrealized income on investments | | | 1,441,316 | | | 864,763 | | | 4,620,137 | |
| |
|
| |
|
| |
|
| |
Change in net assets resulting from operations | | $ | 1,350,552 | | $ | 860,436 | | $ | 5,461,628 | |
| |
|
| |
|
| |
|
| |
| | | | | | | | | | |
* Net of foreign taxes withheld | | $ | 3,577 | | $ | — | | $ | — | |
| |
|
| |
|
| |
|
| |
The accompanying notes are an integral part of these financial statements.
70
Statements of Operations—Continued
For the year ended October 31, 2009
| | | | | | | |
| | Ultra Short
Tax Optimized
Income
Fund | | Municipal
Money Market
Fund | |
| |
| |
| |
INVESTMENT INCOME: | | | | | | | |
Interest income | | $ | 28,207,964 | | $ | 10,340,336 | |
| |
|
| |
|
| |
Total investment income | | | 28,207,964 | | | 10,340,336 | |
| |
|
| |
|
| |
| | | | | | | |
EXPENSES: | | | | | | | |
Investment advisory fees | | | 5,872,536 | | | 3,075,664 | |
Administration fees | | | 23,290 | | | 22,506 | |
Distribution fees - Adviser Class | | | 184,838 | | | — | |
Fund accounting fees | | | 19,415 | | | 18,748 | |
Audit and tax fees | | | 23,289 | | | 19,277 | |
Custodian fees | | | 12,045 | | | 11,253 | |
Legal fees | | | 13,421 | | | 37,472 | |
Registration and filing fees | | | 139,358 | | | 52,480 | |
Printing and mailing fees | | | 80,785 | | | 31,220 | |
Transfer agent fees | | | 23,430 | | | 22,506 | |
Trustee fees | | | 3,915 | | | 5,530 | |
Interest Expense | | | — | | | 24 | |
Other fees | | | 17,719 | | | 310,297 | |
| |
|
| |
|
| |
Total expenses before expense waiver by Adviser | | | 6,414,041 | | | 3,606,977 | |
Expense waiver by Adviser (Note 6) | | | (1,528,133 | ) | | (9,413 | ) |
| |
|
| |
|
| |
Net expenses | | | 4,885,908 | | | 3,597,564 | |
| |
|
| |
|
| |
Net investment income | | | 23,322,056 | | | 6,742,772 | |
| |
|
| |
|
| |
| | | | | | | |
REALIZED AND UNREALIZED GAIN ON INVESTMENTS: | | | | | | | |
Net realized gain on investments | | | 2,449 | | | 87,593 | |
Change in unrealized appreciation on investments | | | 2,292,156 | | | — | |
| |
|
| |
|
| |
Net realized and unrealized gain on investments | | | 2,294,605 | | | 87,593 | |
| |
|
| |
|
| |
Change in net assets resulting from operations | | $ | 25,616,661 | | $ | 6,830,365 | |
| |
|
| |
|
| |
The accompanying notes are an integral part of these financial statements.
71
Statement of Cash Flows
For the year ended October 31, 2009
| | | | |
| | Dynamic
Innovators Fund | |
| |
| |
CASH FLOWS FROM OPERATING ACTIVITIES: | | | | |
Change in net assets resulting from operations | | $ | 1,350,552 | |
Adjustments to reconcile change in net assets resulting from operations to net cash provided by operating activities: | | | | |
Purchases of investments | | | (2,289,048 | ) |
Proceeds from sales of investments | | | 7,608,069 | |
Decrease in dividends and interest receivable | | | 3,285 | |
Decrease in prepaid expenses and other assets | | | 13,829 | |
Decrease in accrued expenses and other liabilities | | | (1,870 | ) |
Net realized loss on investments | | | 5,526,915 | |
Unrealized appreciation on investments | | | (6,968,188 | ) |
| |
|
| |
Net cash provided by operating activities | | | 5,243,544 | |
| |
|
| |
| | | | |
CASH FLOWS FROM FINANCING ACTIVITIES: | | | | |
Decrease in line of credit | | | (2,623,000 | ) |
Proceeds from shares sold | | | 4,676,100 | |
Payment on shares redeemed | | | (7,296,644 | ) |
| |
|
| |
Net cash used in financing activities | | | (5,243,544 | ) |
| |
|
| |
Net change in cash | | $ | — | |
| |
|
| |
| | | | |
CASH: | | | | |
Beginning Balance | | | — | |
| |
|
| |
Ending Balance | | $ | — | |
| |
|
| |
| | | | |
Supplemental disclosure of cash flow information: | | | | |
During the year ended October 31, 2009, the Dynamic Innovators Fund paid cash of $29,042 in interest. |
The accompanying notes are an integral part of these financial statements.
72
Statements of Changes in Net Assets
| | | | | | | |
| | Dynamic Dividend Fund | |
| |
| |
| | Year Ended
October 31, 2009 | | Year Ended
October 31, 2008 | |
| |
| |
| |
OPERATIONS: | | | | | | | |
Net investment income | | $ | 135,732,607 | | $ | 184,237,212 | |
Net realized gain (loss) on: | | | | | | | |
Investments | | | (371,836,256 | ) | | (544,541,420 | ) |
Written option contracts expired or closed | | | 672,620 | | | — | |
Foreign currency translation | | | (1,907,275 | ) | | (11,931,318 | ) |
Forward currency contracts | | | (3,392,718 | ) | | (11,434,127 | ) |
Swap contracts | | | 5,526,555 | | | 20,730 | |
Change in unrealized appreciation (depreciation) on: | | | | | | | |
Investments | | | 259,883,578 | | | (322,575,911 | ) |
Foreign currency translation | | | 249,106 | | | (604,332 | ) |
| |
|
| |
|
| |
Change in net assets resulting from operations | | | 24,928,217 | | | (706,829,166 | ) |
| |
|
| |
|
| |
| | | | | | | |
DISTRIBUTIONS TO SHAREHOLDERS: | | | | | | | |
From net investment income | | | (126,650,712 | ) | | (188,534,882 | ) |
From net realized gain on investments | | | — | | | — | |
From tax return on capital | | | — | | | (5,952,906 | ) |
| |
|
| |
|
| |
Change in net assets resulting from distributions to shareholders | | | (126,650,712 | ) | | (194,487,788 | ) |
| |
|
| |
|
| |
| | | | | | | |
CAPITAL SHARE TRANSACTIONS: | | | | | | | |
Proceeds from shares sold | | | 196,120,574 | | | 563,036,031 | |
Dividends reinvested | | | 87,140,087 | | | 139,704,564 | |
Redemption fees | | | 178,370 | | | 517,263 | |
Cost of shares redeemed | | | (208,323,675 | ) | | (703,254,544 | ) |
| |
|
| |
|
| |
Change in net assets from capital share transactions | | | 75,115,356 | | | 3,314 | |
| |
|
| |
|
| |
Total change in net assets | | | (26,607,139 | ) | | (901,313,640 | ) |
| |
|
| |
|
| |
| | | | | | | |
NET ASSETS: | | | | | | | |
Beginning of year | | | 598,758,546 | | | 1,500,072,186 | |
| |
|
| |
|
| |
End of year* | | $ | 572,151,407 | | $ | 598,758,546 | |
| |
|
| |
|
| |
| | | | | | | |
* Including accumulated undistributed net investment income of: | | $ | 24,330,835 | | $ | — | |
| |
|
| |
|
| |
| | | | | | | |
The accompanying notes are an integral part of these financial statements.
73
Statements of Changes in Net Assets—Continued
| | | | | |
| | Accelerating Dividend Fund |
| |
|
| | Period Ended
October 31, 2009 (1) |
| |
|
OPERATIONS: | | | | | |
Net investment income | | | $ | 12,387 | |
Net realized gain on: | | | | | |
Investments | | | | 5,392 | |
Foreign currency translation | | | | 182 | |
Change in unrealized appreciation on: | | | | | |
Investments | | | | 135,638 | |
Foreign currency translation | | | | 2 | |
| | |
|
| |
Change in net assets resulting from operations | | | | 153,601 | |
| | |
|
| |
| | | | | |
DISTRIBUTIONS TO SHAREHOLDERS: | | | | | |
From net investment income | | | | — | |
From net realized gain on investments | | | | — | |
| | |
|
| |
Change in net assets resulting from distributions to shareholders | | | | — | |
| | |
|
| |
| | | | | |
CAPITAL SHARE TRANSACTIONS: | | | | | |
Proceeds from shares sold | | | | 1,060,985 | |
Dividends reinvested | | | | — | |
Redemption fees | | | | — | |
Cost of shares redeemed | | | | — | |
| | |
|
| |
Change in net assets from capital share transactions | | | | 1,060,985 | |
| | |
|
| |
Total change in net assets | | | | 1,214,586 | |
| | |
|
| |
| | | | | |
NET ASSETS: | | | | | |
Beginning of period | | | | — | |
| | |
|
| |
End of period* | | | $ | 1,214,586 | |
| | |
|
| |
| | | | | |
* Including accumulated undistributed net investment income of: | | | $ | 12,387 | |
| | |
|
| |
| |
(1) | Fund commenced operations on November 5, 2008. |
The accompanying notes are an integral part of these financial statements.
74
| | | | | | | |
| | Dynamic Financial Services Fund | |
| |
| |
| | Year Ended
October 31, 2009 | | Year Ended
October 31, 2008 | |
| |
| |
| |
OPERATIONS: | | | | | | | |
Net investment income | | $ | 24,005 | | $ | 130,723 | |
Net realized gain (loss) on: | | | | | | | |
Investments | | | (145,307 | ) | | 310,493 | |
Foreign currency translation | | | 7,994 | | | (51,301 | ) |
Swap contracts | | | — | | | 929 | |
Change in unrealized appreciation (depreciation) on: | | | | | | | |
Investments | | | 1,352,226 | | | (5,081,969 | ) |
Foreign currency translation | | | 674 | | | (65,035 | ) |
| |
|
| |
|
| |
Change in net assets resulting from operations | | | 1,239,592 | | | (4,756,160 | ) |
| |
|
| |
|
| |
| | | | | | | |
DISTRIBUTIONS TO SHAREHOLDERS: | | | | | | | |
From net investment income | | | (99,399 | ) | | — | |
From net realized gain on investments | | | (419,990 | ) | | (2,663,086 | ) |
From tax return of capital | | | (4,121 | ) | | — | |
| |
|
| |
|
| |
Change in net assets resulting from distributions to shareholders | | | (523,510 | ) | | (2,663,086 | ) |
| |
|
| |
|
| |
| | | | | | | |
CAPITAL SHARE TRANSACTIONS: | | | | | | | |
Proceeds from shares sold | | | 1,966,966 | | | 6,472,426 | |
Dividends reinvested | | | 473,302 | | | 2,103,627 | |
Redemption fees | | | 1,015 | | | 10,070 | |
Cost of shares redeemed | | | (1,938,943 | ) | | (5,310,381 | ) |
| |
|
| |
|
| |
Change in net assets from capital share transactions | | | 502,340 | | | 3,275,742 | |
| |
|
| |
|
| |
Total change in net assets | | | 1,218,422 | | | (4,143,504 | ) |
| |
|
| |
|
| |
| | | | | | | |
NET ASSETS: | | | | | | | |
Beginning of year | | | 6,676,511 | | | 10,820,015 | |
| |
|
| |
|
| |
End of year* | | $ | 7,894,933 | | $ | 6,676,511 | |
| |
|
| |
|
| |
| | | | | | | |
* Including accumulated undistributed net investment income of: | | $ | 4,653 | | $ | 80,047 | |
| |
|
| |
|
| |
The accompanying notes are an integral part of these financial statements.
75
Statements of Changes in Net Assets—Continued
| | | | | | | |
| | Dynamic Innovators Fund | |
| |
| |
| | Year Ended
October 31, 2009 | | Year Ended
October 31, 2008 | |
| |
| |
| |
OPERATIONS: | | | | | | | |
Net investment loss | | $ | (90,764 | ) | $ | (74,231 | ) |
Net realized gain (loss) on: | | | | | | | |
Investments | | | (5,526,915 | ) | | (6,519,886 | ) |
Foreign currency translation | | | 92 | | | (65,509 | ) |
Swap contracts | | | — | | | 113 | |
Change in unrealized appreciation (depreciation) on: | | | | | | | |
Investments | | | 6,968,188 | | | (13,405,862 | ) |
Foreign currency translation | | | (49 | ) | | 49 | |
| |
|
| |
|
| |
Change in net assets resulting from operations | | | 1,350,552 | | | (20,065,326 | ) |
| |
|
| |
|
| |
| | | | | | | |
DISTRIBUTIONS TO SHAREHOLDERS: | | | | | | | |
From net investment income | | | — | | | (99,263 | ) |
From net realized gain on investments | | | — | | | (1,905,602 | ) |
| |
|
| |
|
| |
Change in net assets resulting from distributions to shareholders | | | — | | | (2,004,865 | ) |
| |
|
| |
|
| |
| | | | | | | |
CAPITAL SHARE TRANSACTIONS: | | | | | | | |
Proceeds from shares sold | | | 1,676,100 | | | 45,945,955 | |
Dividends reinvested | | | — | | | 1,654,158 | |
Redemption fees | | | 1,168 | | | 117,477 | |
Cost of shares redeemed | | | (7,302,845 | ) | | (58,619,588 | ) |
| |
|
| |
|
| |
Change in net assets from capital share transactions | | | (5,625,577 | ) | | (10,901,998 | ) |
| |
|
| |
|
| |
Total change in net assets | | | (4,275,025 | ) | | (32,972,189 | ) |
| |
|
| |
|
| |
| | | | | | | |
NET ASSETS: | | | | | | | |
Beginning of year | | | 15,382,540 | | | 48,354,729 | |
| |
|
| |
|
| |
End of year* | | $ | 11,107,515 | | $ | 15,382,540 | |
| |
|
| |
|
| |
| | | | | | | |
* Including accumulated undistributed net investment income of: | | $ | — | | $ | — | |
| |
|
| |
|
| |
The accompanying notes are an integral part of these financial statements.
76
Statements of Changes in Net Assets—Continued
| | | | | | | |
| | Dynamic Transformations Fund | |
| |
| |
| | Year Ended
October 31, 2009 | | Period Ended
October 31, 2008 (1) | |
| |
| |
| |
OPERATIONS: | | | | | | | |
Net investment income (loss) | | $ | (4,327 | ) | $ | 14,717 | |
Net realized loss on investments | | | (653,420 | ) | | (140,244 | ) |
Change in unrealized appreciation (depreciation) on investments | | | 1,518,183 | | | (1,810,433 | ) |
| |
|
| |
|
| |
Change in net assets resulting from operations | | | 860,436 | | | (1,935,960 | ) |
| |
|
| |
|
| |
| | | | | | | |
DISTRIBUTIONS TO SHAREHOLDERS: | | | | | | | |
From net investment income | | | (14,717 | ) | | — | |
From net realized gain on investments | | | — | | | — | |
From tax return of capital | | | (2,411 | ) | | — | |
| |
|
| |
|
| |
Change in net assets resulting from distributions to shareholders | | | (17,128 | ) | | — | |
| |
|
| |
|
| |
| | | | | | | |
CAPITAL SHARE TRANSACTIONS: | | | | | | | |
Proceeds from shares sold | | | 82,368 | | | 4,630,875 | |
Dividends reinvested | | | 17,115 | | | — | |
Redemption fees | | | 1 | | | 22 | |
Cost of shares redeemed | | | (78,085 | ) | | (45,439 | ) |
| |
|
| |
|
| |
Change in net assets from capital share transactions | | | 21,399 | | | 4,585,458 | |
| |
|
| |
|
| |
Total change in net assets | | | 864,707 | | | 2,649,498 | |
| |
|
| |
|
| |
| | | | | | | |
NET ASSETS: | | | | | | | |
Beginning of year | | | 2,649,498 | | | — | |
| |
|
| |
|
| |
End of year* | | $ | 3,514,205 | | $ | 2,649,498 | |
| |
|
| |
|
| |
| | | | | | | |
* Including accumulated undistributed net investment income of: | | $ | — | | $ | 14,717 | |
| |
|
| |
|
| |
(1) Fund commenced operations on December 31, 2007.
The accompanying notes are an integral part of these financial statements.
77
Statements of Changes in Net Assets—Continued
| | | | | | | |
| | Dynamic Balance Fund | |
| |
| |
| | Year Ended
October 31, 2009 | | Year Ended
October 31, 2008 | |
| |
| |
| |
OPERATIONS: | | | | | | | |
Net investment income | | $ | 841,491 | | $ | 1,768,731 | |
Net realized gain (loss) on: | | | | | | | |
Investments | | | 703 | | | (1,238,791 | ) |
Written option contracts expired or closed | | | 145,530 | | | 695,713 | |
Change in unrealized appreciation (depreciation) on: | | | | | | | |
Investments | | | 4,462,680 | | | (29,296,828 | ) |
Written option contracts | | | 11,224 | | | — | |
| |
|
| |
|
| |
Change in net assets resulting from operations | | | 5,461,628 | | | (28,071,175 | ) |
| |
|
| |
|
| |
| | | | | | | |
DISTRIBUTIONS TO SHAREHOLDERS: | | | | | | | |
From net investment income | | | (845,241 | ) | | (1,629,117 | ) |
From net realized gain on investments | | | — | | | (6,116,765 | ) |
From tax return on capital | | | (114,962 | ) | | (102,670 | ) |
| |
|
| |
|
| |
Change in net assets resulting from distributions to shareholders | | | (960,203 | ) | | (7,848,552 | ) |
| |
|
| |
|
| |
| | | | | | | |
CAPITAL SHARE TRANSACTIONS: | | | | | | | |
Proceeds from shares sold | | | 314,766 | | | 579,192 | |
Dividends reinvested | | | 918,908 | | | 7,231,038 | |
Redemption fees | | | 106 | | | 1,353 | |
Cost of shares redeemed | | | (3,602,450 | ) | | (11,154,144 | ) |
| |
|
| |
|
| |
Change in net assets from capital share transactions | | | (2,368,670 | ) | | (3,342,561 | ) |
| |
|
| |
|
| |
Total change in net assets | | | 2,132,755 | | | (39,262,288 | ) |
| |
|
| |
|
| |
| | | | | | | |
NET ASSETS: | | | | | | | |
Beginning of year | | | 53,097,463 | | | 92,359,751 | |
| |
|
| |
|
| |
End of year* | | $ | 55,230,218 | | $ | 53,097,463 | |
| |
|
| |
|
| |
| | | | | | | |
* Including accumulated undistributed net investment loss of: | | $ | (26,712 | ) | $ | (26,712 | ) |
| |
|
| |
|
| |
The accompanying notes are an integral part of these financial statements.
78
Statements of Changes in Net Assets—Continued
| | | | | | | |
| | Ultra Short
Tax Optimized Income Fund | |
| |
| |
| | Year Ended
October 31, 2009 | | Year Ended
October 31, 2008 | |
| |
| |
| |
OPERATIONS: | | | | | | | |
Net investment income | | $ | 23,322,056 | | $ | 6,238,586 | |
Net realized gain on investments | | | 2,449 | | | 2,783 | |
Change in unrealized appreciation (depreciation) on investments | | | 2,292,156 | | | (1,051,084 | ) |
| |
|
| |
|
| |
Change in net assets resulting from operations | | | 25,616,661 | | | 5,190,285 | |
| |
|
| |
|
| |
| | | | | | | |
DISTRIBUTIONS TO SHAREHOLDERS: | | | | | | | |
Distributions to Adviser Class Shareholders: | | | | | | | |
From net investment income | | | (1,957,636 | ) | | (222,769 | ) |
Distributions to Investor Class Shareholders: | | | | | | | |
From net investment income | | | (21,386,016 | ) | | (6,001,676 | ) |
| |
|
| |
|
| |
Change in net assets resulting from distributions to shareholders | | | (23,343,652 | ) | | (6,224,445 | ) |
| |
|
| |
|
| |
| | | | | | | |
CAPITAL SHARE TRANSACTIONS: | | | | | | | |
Proceeds from shares sold | | | 1,796,530,927 | | | 265,275,500 | |
Dividends reinvested | | | 16,990,391 | | | 5,659,596 | |
Redemption fees | | | 67,162 | | | 16,542 | |
Cost of shares redeemed | | | (385,248,405 | ) | | (86,950,657 | ) |
| |
|
| |
|
| |
Change in net assets from capital share transactions | | | 1,428,340,075 | | | 184,000,981 | |
| |
|
| |
|
| |
Total change in net assets | | | 1,430,613,084 | | | 182,966,821 | |
| |
|
| |
|
| |
NET ASSETS: | | | | | | | |
Beginning of year | | | 243,247,055 | | | 60,280,234 | |
| |
|
| |
|
| |
End of year* | | $ | 1,673,860,139 | | $ | 243,247,055 | |
| |
|
| |
|
| |
| | | | | | | |
* Including accumulated undistributed net investment income of: | | $ | 524 | | $ | 22,120 | |
| |
|
| |
|
| |
The accompanying notes are an integral part of these financial statements.
79
Statements of Changes in Net Assets—Continued
| | | | | | | |
| | Municipal Money Market Fund | |
| |
| |
| | Year Ended
October 31, 2009 | | Year Ended
October 31, 2008 | |
| |
| |
| |
OPERATIONS: | | | | | | | |
Net investment income | | $ | 6,742,772 | | $ | 22,134,818 | |
Net realized gain on investments | | | 87,593 | | | 10,588 | |
| |
|
| |
|
| |
Change in net assets resulting from operations | | | 6,830,365 | | | 22,145,406 | |
| |
|
| |
|
| |
| | | | | | | |
DISTRIBUTIONS TO SHAREHOLDERS: | | | | | | | |
Distributions to Adviser Class Shareholders (1): | | | | | | | |
From net investment income | | | — | | | (1,159 | ) |
Distributions to Investor Class Shareholders: | | | | | | | |
From net investment income | | | (6,742,772 | ) | | (22,133,659 | ) |
From net realized gain on investments | | | (87,593 | ) | | (10,588 | ) |
From tax return of capital | | | (2,781 | ) | | — | |
| |
|
| |
|
| |
Change in net assets resulting from distributions to shareholders | | | (6,833,146 | ) | | (22,145,406 | ) |
| |
|
| |
|
| |
| | | | | | | |
CAPITAL SHARE TRANSACTIONS: | | | | | | | |
Proceeds from shares sold | | | 1,310,070,747 | | | 5,315,613,045 | |
Dividends reinvested | | | 5,367,192 | | | 18,013,012 | |
Cost of shares redeemed | | | (1,190,003,238 | ) | | (5,784,755,674 | ) |
| |
|
| |
|
| |
Change in net assets from capital share transactions | | | 125,434,701 | | | (451,129,617 | ) |
| |
|
| |
|
| |
Total change in net assets | | | 125,431,920 | | | (451,129,617 | ) |
| |
|
| |
|
| |
| | | | | | | |
NET ASSETS: | | | | | | | |
Beginning of year | | | 664,400,534 | | | 1,115,530,151 | |
| |
|
| |
|
| |
End of year* | | $ | 789,832,454 | | $ | 664,400,534 | |
| |
|
| |
|
| |
| | | | | | | |
* Including accumulated undistributed net investment income of: | | $ | — | | $ | — | |
| |
|
| |
|
| |
(1) The Municipal Money Market Fund - - Adviser Class ceased operations on December 5, 2007.
The accompanying notes are an integral part of these financial statements.
80
Financial Highlights
(For a share outstanding throughout each period)
| | | | | | | | | | | | | | | | |
| |
| |
| | Dynamic Dividend Fund | |
| |
| |
| | Year Ended
October 31, | |
| |
| |
| | 2009 | | 2008 | | 2007 | | 2006 | | 2005 | |
| |
| |
| |
| |
| |
| |
Per Share Data: | | | | | | | | | | | | | | | | |
Net asset value per share, beginning of year | | $ | 5.72 | | $ | 13.32 | | $ | 12.52 | | $ | 11.98 | | $ | 12.34 | |
| |
|
| |
|
| |
|
| |
|
| |
|
| |
Income from investment operations: | | | | | | | | | | | | | | | | |
Net investment income | | | 1.37 | | | 1.33 | | | 1.95 | | | 1.61 | | | 1.57 | |
Net realized and unrealized gains (losses) on investments | | | (1.14 | ) | | (7.29 | ) | | 0.61 | | | 0.51 | | | (0.14 | ) |
| |
|
| |
|
| |
|
| |
|
| |
|
| |
Total from investment operations | | | 0.23 | | | (5.96 | ) | | 2.56 | | | 2.12 | | | 1.43 | |
| |
|
| |
|
| |
|
| |
|
| |
|
| |
Redemption fees | | | 0.00 | (a) | | 0.00 | (a) | | 0.00 | (a) | | 0.00 | (a) | | 0.00 | (a) |
Less Distributions: | | | | | | | | | | | | | | | | |
From net investment income | | | (1.17 | ) | | (1.58 | ) | | (1.76 | ) | | (1.58 | ) | | (1.51 | ) |
From net realized gains on investments | | | — | | | — | | | — | | | — | | | (0.28 | ) |
From tax return on capital | | | — | | | (0.06 | ) | | — | | | — | | | — | |
| |
|
| |
|
| |
|
| |
|
| |
|
| |
Total distributions | | | (1.17 | ) | | (1.64 | ) | | (1.76 | ) | | (1.58 | ) | | (1.79 | ) |
| |
|
| |
|
| |
|
| |
|
| |
|
| |
Net asset value per share, end of year | | $ | 4.78 | | $ | 5.72 | | $ | 13.32 | | $ | 12.52 | | $ | 11.98 | |
| |
|
| |
|
| |
|
| |
|
| |
|
| |
Total return | | | 6.64 | % | | –49.05 | % | | 21.66 | % | | 18.68 | % | | 11.85 | % |
Ratios/Supplemental Data: | | | | | | | | | | | | | | | | |
Net Assets at end of year (000) | | $ | 572,151 | | $ | 598,759 | | $ | 1,500,072 | | $ | 633,264 | | $ | 311,335 | |
Ratio of total expenses to average net assets: | | | | | | | | | | | | | | | | |
Before waivers, reimbursements, and recoveries | | | 1.20 | % | | 1.18 | % | | 1.15 | % | | 1.18 | % | | 1.20 | % |
After waivers, reimbursements, and recoveries | | | 1.20 | % | | 1.18 | % | | 1.15 | % | | 1.18 | % | | 1.23 | % |
Ratio of interest expense to average net assets | | | 0.02 | % | | 0.02 | % | | 0.00 | %(a) | | 0.00 | %(a) | | 0.00 | % |
Ratio of expenses to average net assets excluding interest expense: | | | | | | | | | | | | | | | | |
Before waivers, reimbursements, and recoveries | | | 1.18 | % | | 1.16 | % | | 1.15 | % | | 1.18 | % | | 1.20 | % |
After waivers, reimbursements, and recoveries | | | 1.18 | % | | 1.16 | % | | 1.15 | % | | 1.18 | % | | 1.23 | % |
Ratio of net investment income to average net assets | | | 26.04 | % | | 15.32 | % | | 15.65 | % | | 14.04 | % | | 14.22 | % |
Portfolio turnover | | | 656 | % | | 323 | % | | 216 | % | | 192 | % | | 216 | % |
(a) The amount is less than $0.005 per share or 0.005%.
The accompanying notes are an integral part of these financial statements.
81
Financial Highlights—Continued
(For a share outstanding throughout each period)
| | | | |
| |
| |
| | Accelerating
Dividend
Fund | |
| |
| |
| | Period Ended
October 31,
2009 (a) | |
| |
| |
| | (Unaudited) | |
Per Share Data: | | | | |
Net asset value per share, beginning of period | | $ | 10.00 | |
| |
|
| |
Income from investment operations: | | | | |
Net investment income | | | 0.12 | |
Net realized and unrealized gains on investments | | | 1.36 | |
| |
|
| |
Total from investment operations | | | 1.48 | |
| |
|
| |
Less Distributions: | | | | |
From net investment income | | | — | |
From net realized gains on investments | | | — | |
| |
|
| |
Total distributions | | | — | |
| |
|
| |
Net asset value per share, end of period | | $ | 11.48 | |
| |
|
| |
Total return | | | 14.80 | %(b) |
Ratios/Supplemental Data: | | | | |
Net Assets at end of period (000) | | $ | 1,215 | |
Ratio of expenses to average net assets: | | | | |
Before waivers | | | 5.26 | %(c) |
After waivers | | | 1.35 | %(c) |
Ratio of net investment income to average net assets | | | 1.19 | %(c) |
Portfolio turnover | | | 104 | % |
| | |
| |
(a) | For the period from November 5, 2008 (inception of fund) to October 31, 2009. |
| |
(b) | Not annualized. |
| |
(c) | Annualized. |
The accompanying notes are an integral part of these financial statements.
82
Financial Highlights—Continued
(For a share outstanding throughout each period)
| | | | | | | | | | | | | |
| |
| |
| | Dynamic Financial Services Fund | |
| |
| |
| | Year Ended
October 31, | | | | |
| | | Period Ended
October 31,
2006 (a) | |
| |
| | |
| | 2009 | | 2008 | | 2007 | | |
| |
| |
| |
| |
| |
Per Share Data: | | | | | | | | | | | | | |
Net asset value per share, beginning of year | | $ | 6.24 | | $ | 13.89 | | $ | 12.13 | | $ | 10.00 | |
| |
|
| |
|
| |
|
| |
|
| |
Income from investment operations: | | | | | | | | | | | | | |
Net investment income (loss) | | | 0.03 | | | 0.07 | | | (0.02 | ) | | 0.02 | |
Net realized and unrealized gains (losses) on investments | | | 1.10 | | | (4.40 | ) | | 2.54 | | | 2.12 | |
| |
|
| |
|
| |
|
| |
|
| |
Total from investment operations | | | 1.13 | | | (4.33 | ) | | 2.52 | | | 2.14 | |
| |
|
| |
|
| |
|
| |
|
| |
Redemption fees | | | 0.00 | (b) | | 0.01 | | | 0.00 | (b) | | 0.00 | (b) |
Less Distributions: | | | | | | | | | | | | | |
From net investment income | | | (0.10 | ) | | — | | | (0.01 | ) | | (0.01 | ) |
From net realized gains on investments | | | (0.41 | ) | | (3.33 | ) | | (0.75 | ) | | — | |
From tax return of capital | | | (0.00 | )(b) | | — | | | — | | | — | |
| |
|
| |
|
| |
|
| |
|
| |
Total distributions | | | (0.51 | ) | | (3.33 | ) | | (0.76 | ) | | (0.01 | ) |
| |
|
| |
|
| |
|
| |
|
| |
Net asset value per share, end of year | | $ | 6.86 | | $ | 6.24 | | $ | 13.89 | | $ | 12.13 | |
| |
|
| |
|
| |
|
| |
|
| |
Total return | | | 21.83 | % | | –41.16 | % | | 21.64 | % | | 21.47 | % |
Ratios/Supplemental Data: | | | | | | | | | | | | | |
Net Assets at end of year (000) | | $ | 7,895 | | $ | 6,677 | | $ | 10,820 | | $ | 7,544 | |
Ratio of total expenses to average net assets: | | | | | | | | | | | | | |
Before waivers | | | 2.06 | % | | 1.94 | % | | 2.61 | % | | 2.53 | % |
After waivers | | | 1.44 | % | | 1.35 | % | | 1.35 | % | | 1.35 | % |
Ratio of interest expense to average net assets | | | 0.09 | % | | 0.37 | % | | 1.02 | % | | 0.01 | % |
Ratio of expenses to average net assets excluding interest expense: | | | | | | | | | | | | | |
Before waivers | | | 1.97 | % | | 1.57 | % | | 1.59 | % | | 2.52 | % |
After waivers | | | 1.35 | % | | 0.98 | % | | 0.33 | % | | 1.34 | % |
Ratio of net investment income (loss) to average net assets | | | 0.39 | % | | 1.32 | % | | (0.16 | )% | | 0.15 | % |
Portfolio turnover | | | 437 | % | | 455 | % | | 397 | % | | 106 | % |
| |
|
(a) | For the period from November 1, 2005 (inception of fund) to October 31, 2006. |
| |
(b) | The amount is less than $0.005 per share. |
The accompanying notes are an integral part of these financial statements.
83
Financial Highlights—Continued
(For a share outstanding throughout each period)
| | | | | | | | | | | | | |
| |
| |
| | Dynamic Innovators Fund | |
| |
| |
| | Year Ended
October 31, | | | | |
| | | Period Ended
October 31,
2006 (a) | |
| |
| | |
| | 2009 | | 2008 | | 2007 | | |
| |
| |
| |
| |
| |
Per Share Data: | | | | | | | | | | | | | |
Net asset value per share, beginning of year | | $ | 6.83 | | $ | 14.08 | | $ | 10.31 | | $ | 10.00 | |
| |
|
| |
|
| |
|
| |
|
| |
Income from investment operations: | | | | | | | | | | | | | |
Net investment income (loss) | | | — | | | (0.01 | ) | | 0.07 | | | 0.09 | |
Net realized and unrealized gains (losses) on investments | | | 1.30 | | | (6.84 | ) | | 3.91 | | | 0.22 | |
| |
|
| |
|
| |
|
| |
|
| |
Total from investment operations | | | 1.30 | | | (6.85 | ) | | 3.98 | | | 0.31 | |
| |
|
| |
|
| |
|
| |
|
| |
Redemption fees | | | 0.00 | (b) | | 0.03 | | | 0.01 | | | — | |
Less Distributions: | | | | | | | | | | | | | |
From net investment income | | | — | | | (0.02 | ) | | (0.14 | ) | | — | |
From net realized gains on investments | | | — | | | (0.41 | ) | | (0.08 | ) | | — | |
| |
|
| |
|
| |
|
| |
|
| |
Total distributions | | | — | | | (0.43 | ) | | (0.22 | ) | | — | |
| |
|
| |
|
| |
|
| |
|
| |
Net asset value per share, end of year | | $ | 8.13 | | $ | 6.83 | | $ | 14.08 | | $ | 10.31 | |
| |
|
| |
|
| |
|
| |
|
| |
Total return | | | 19.03 | % | | –49.95 | % | | 39.47 | % | | 3.10 | %(c) |
Ratios/Supplemental Data: | | | | | | | | | | | | | |
Net Assets at end of year (000) | | $ | 11,108 | | $ | 15,383 | | $ | 48,355 | | $ | 5,073 | |
Ratio of total expenses to average net assets: | | | | | | | | | | | | | |
Before waivers, reimbursements, and recoveries | | | 1.86 | % | | 1.31 | % | | 1.53 | % | | 4.25 | %(d) |
After waivers, reimbursements, and recoveries | | | 1.54 | % | | 1.35 | % | | 1.33 | % | | 1.35 | %(d) |
Ratio of interest expense to average net assets | | | 0.19 | % | | 0.04 | % | | 0.00 | % | | 0.00 | % |
Ratio of expenses to average net assets excluding interest expense: | | | | | | | | | | | | | |
Before waivers, reimbursements, and recoveries | | | 1.67 | % | | 1.27 | % | | 1.53 | % | | 4.25 | %(d) |
After waivers, reimbursements, and recoveries | | | 1.35 | % | | 1.31 | % | | 1.33 | % | | 1.35 | %(d) |
Ratio of net investment income (loss) to average net assets | | | (0.92 | )% | | (0.18 | )% | | 1.08 | % | | 3.18 | %(d) |
Portfolio turnover | | | 20 | % | | 76 | % | | 135 | % | | 3 | % |
| |
|
(a) | For the period from July 11, 2006 (commencement of operations) to October 31, 2006. |
| |
(b) | The amount is less than $0.005 per share. |
| |
(c) | Not annualized. |
| |
(d) | Annualized. |
The accompanying notes are an integral part of these financial statements.
84
Financial Highlights—Continued
(For a share outstanding throughout each period)
| | | | | | | |
| |
| |
| | Dynamic
Transformations
Fund | |
| |
| |
| | Year Ended
October 31,
2009 | | Period Ended
October 31,
2008 (a) | |
| |
| |
| |
Per Share Data: | | | | | | | |
Net asset value per share, beginning of year | | $ | 5.79 | | $ | 10.00 | |
| |
|
| |
|
| |
Income from investment operations: | | | | | | | |
Net investment income | | | 0.01 | | | 0.03 | |
Net realized and unrealized gains (losses) on investments | | | 1.92 | | | (4.24 | ) |
| |
|
| |
|
| |
Total from investment operations | | | 1.93 | | | (4.21 | ) |
| |
|
| |
|
| |
Redemption fees | | | 0.00 | (b) | | 0.00 | (b) |
Less Distributions: | | | | | | | |
From net investment income | | | (0.03 | ) | | — | |
From net realized gains on investments | | | — | | | — | |
From tax return of capital | | | (0.01 | ) | | — | |
| |
|
| |
|
| |
Total distributions | | | (0.04 | ) | | — | |
| |
|
| |
|
| |
Net asset value per share, end of year | | $ | 7.68 | | $ | 5.79 | |
| |
|
| |
|
| |
Total return | | | 33.61 | % | | –42.10 | %(c) |
Ratios/Supplemental Data: | | | | | | | |
Net Assets at end of year (000) | | $ | 3,514 | | $ | 2,649 | |
Ratio of total expenses to average net assets: | | | | | | | |
Before waivers | | | 2.86 | % | | 2.95 | %(d) |
After waivers | | | 1.35 | % | | 1.35 | %(d) |
Ratio of interest expense to average net assets | | | 0.00 | %(b) | | 0.00 | %(d) |
Ratio of expenses to average net assets excluding interest expense: | | | | | | | |
Before waivers | | | 2.86 | % | | 2.95 | %(d) |
After waivers | | | 1.35 | % | | 1.35 | %(d) |
Ratio of net investment income to average net assets | | | (0.16 | )% | | 0.44 | %(d) |
Portfolio turnover | | | 57 | % | | 108 | % |
| |
|
(a) | For the period from December 31, 2007 (inception of fund) to October 31, 2008. |
| |
(b) | The amount is less than 0.005% or $0.005 per share. |
| |
(c) | Not annualized. |
| |
(d) | Annualized. |
The accompanying notes are an integral part of these financial statements.
85
Financial Highlights
(For a share outstanding throughout each period)
| | | | | | | | | | | | | | | | |
| |
| |
| | Dynamic Balance Fund | |
| |
| |
| | Year Ended
October 31, | |
| |
| |
| | 2009 | | 2008 | | 2007 | | 2006 | | 2005 | |
| |
| |
| |
| |
| |
| |
Per Share Data: | | | | | | | | | | | | | | | | |
Net asset value per share, beginning of year | | $ | 8.15 | | $ | 13.55 | | $ | 13.72 | | $ | 12.67 | | $ | 12.44 | |
| |
|
| |
|
| |
|
| |
|
| |
|
| |
Income from investment operations: | | | | | | | | | | | | | | | | |
Net investment income | | | 0.13 | | | 0.26 | | | 0.26 | | | 0.21 | | | 0.19 | |
Net realized and unrealized gains (losses) on investments | | | 0.75 | | | (4.47 | ) | | 0.28 | | | 1.26 | | | 0.85 | |
| |
|
| |
|
| |
|
| |
|
| |
|
| |
Total from investment operations | | | 0.88 | | | (4.21 | ) | | 0.54 | | | 1.47 | | | 1.04 | |
| |
|
| |
|
| |
|
| |
|
| |
|
| |
Redemption fees | | | 0.00 | (a) | | 0.00 | (a) | | 0.00 | (a) | | 0.00 | (a) | | — | |
Less Distributions: | | | | | | | | | | | | | | | | |
From net investment income | | | (0.13 | ) | | (0.25 | ) | | (0.24 | ) | | (0.20 | ) | | (0.19 | ) |
From net realized gains on investments | | | — | | | (0.93 | ) | | (0.47 | ) | | (0.22 | ) | | (0.62 | ) |
From tax return on capital | | | (0.02 | ) | | (0.01 | ) | | — | | | — | | | — | |
| |
|
| |
|
| |
|
| |
|
| |
|
| |
Total distributions | | | (0.15 | ) | | (1.19 | ) | | (0.71 | ) | | (0.42 | ) | | (0.81 | ) |
| |
|
| |
|
| |
|
| |
|
| |
|
| |
Net asset value per share, end of year | | $ | 8.88 | | $ | 8.15 | | $ | 13.55 | | $ | 13.72 | | $ | 12.67 | |
| |
|
| |
|
| |
|
| |
|
| |
|
| |
Total return | | | 11.03 | % | | –33.63 | % | | 4.03 | % | | 11.79 | % | | 8.46 | % |
Ratios/Supplemental Data: | | | | | | | | | | | | | | | | |
Net Assets at end of year (000) | | $ | 55,230 | | $ | 53,097 | | $ | 92,360 | | $ | 98,162 | | $ | 97,471 | |
Ratio of total expenses to average net assets: | | | | | | | | | | | | | | | | |
Before waivers, reimbursements, and recoveries | | | 1.26 | % | | 1.24 | % | | 1.16 | % | | 1.19 | % | | 1.21 | % |
After waivers, reimbursements, and recoveries | | | 1.26 | % | | 1.24 | % | | 1.16 | % | | 1.19 | % | | 1.31 | % |
Ratio of interest expense to average net assets | | | 0.00 | %(a) | | 0.90 | % | | 0.00 | %(a) | | 0.00 | % | | 0.00 | %(a) |
Ratio of expenses to average net assets excluding | | | | | | | | | | | | | | | | |
interest expense: | | | | | | | | | | | | | | | | |
Before waivers, reimbursements, and recoveries | | | 1.26 | % | | 1.15 | % | | 1.16 | % | | 1.19 | % | | 1.21 | % |
After waivers, reimbursements, and recoveries | | | 1.26 | % | | 1.15 | % | | 1.16 | % | | 1.19 | % | | 1.31 | % |
Ratio of net investment income to average net assets | | | 1.65 | % | | 2.35 | % | | 1.87 | % | | 1.60 | % | | 1.60 | % |
Portfolio turnover | | | 41 | % | | 34 | % | | 28 | % | | 22 | % | | 36 | % |
| |
|
(a) | The amount is less than $0.005 per share or 0.005%. |
The accompanying notes are an integral part of these financial statements.
86
Financial Highlights—Continued
(For a share outstanding throughout each period)
| | | | | | | | | | | | | | | | |
| |
| |
| | Ultra Short Tax Optimized Income Fund | |
| |
| |
| | Year Ended
October 31, | |
| |
| |
| | 2009 | | 2008 | | 2007 | | 2006 | | 2005 | |
| |
| |
| |
| |
| |
| |
Adviser Class Shares: | | | | | | | | | | | | | | | | |
Net asset value per share, beginning of year | | $ | 10.05 | | $ | 10.10 | | $ | 10.10 | | $ | 10.03 | | $ | 10.15 | |
| |
|
| |
|
| |
|
| |
|
| |
|
| |
Income from investment operations: | | | | | | | | | | | | | | | | |
Net investment income | | | 0.30 | | | 0.38 | | | 0.38 | | | 0.31 | | | 0.28 | |
Net realized and unrealized gains (losses) on investments | | | 0.04 | | | (0.04 | ) | | 0.00 | (a) | | 0.09 | | | (0.12 | ) |
| |
|
| |
|
| |
|
| |
|
| |
|
| |
Total from investment operations | | | 0.34 | | | 0.34 | | | 0.38 | | | 0.40 | | | 0.16 | |
| |
|
| |
|
| |
|
| |
|
| |
|
| |
Less Distributions: | | | | | | | | | | | | | | | | |
From net investment income | | | (0.29 | ) | | (0.39 | ) | | (0.38 | ) | | (0.33 | ) | | (0.28 | ) |
From net realized gains on investments | | | — | | | — | | | — | | | (0.00 | )(a) | | — | |
| |
|
| |
|
| |
|
| |
|
| |
|
| |
Total distributions | | | (0.29 | ) | | (0.39 | ) | | (0.38 | ) | | (0.33 | ) | | (0.28 | ) |
| |
|
| |
|
| |
|
| |
|
| |
|
| |
Net asset value per share, end of year | | $ | 10.10 | | $ | 10.05 | | $ | 10.10 | | $ | 10.10 | | $ | 10.03 | |
| |
|
| |
|
| |
|
| |
|
| |
|
| |
Total return | | | 3.40 | % | | 3.39 | % | | 3.82 | % | | 4.01 | % | | 1.60 | % |
Ratios/Supplemental Data: | | | | | | | | | | | | | | | | |
Net Assets at end of year (000) | | $ | 211,643 | | $ | 11,568 | | $ | 871,630 | | $ | 408,535 | | $ | 112,454 | |
Ratio of expenses to average net assets: | | | | | | | | | | | | | | | | |
Before waivers | | | 1.05 | % | | 1.08 | % | | 1.14 | % | | 1.16 | % | | 1.15 | % |
After waivers | | | 0.85 | % | | 0.85 | % | | 0.85 | % | | 0.85 | % | | 0.85 | % |
Ratio of net investment income to average net assets | | | 2.75 | % | | 4.12 | % | | 3.82 | % | | 3.33 | % | | 2.73 | % |
Portfolio turnover (b) | | | 16 | % | | 129 | % | | 171 | % | | 96 | % | | 97 | % |
| | |
| |
(a) | The amount is less than $0.005 per share. |
| |
(b) | Portfolio turnover is calculated on the basis of the Fund as a whole, without distinguishing between classes of shares issued. |
The accompanying notes are an integral part of these financial statements.
87
Financial Highlights—Continued
(For a share outstanding throughout each period)
| | | | | | | | | | | | | | | | |
| |
|
| | Ultra Short Tax Optimized Income Fund |
| |
|
| | Year Ended
October 31, |
| |
|
| | 2009 | | 2008 | | 2007 | | 2006 | | 2005 | |
| |
| |
| |
| |
| |
| |
Investor Class Shares: | | | | | | | | | | | | | | | | |
Net asset value per share, beginning of year | | $ | 10.00 | | $ | 10.04 | | $ | 10.05 | | $ | 10.03 | | $ | 10.15 | |
| |
|
| |
|
| |
|
| |
|
| |
|
| |
Income from investment operations: | | | | | | | | | | | | | | | | |
Net investment income | | | 0.31 | | | 0.41 | | | 0.40 | | | 0.36 | | | 0.30 | |
Net realized and unrealized gains (losses) on investments | | | 0.05 | | | (0.04 | ) | | (0.01 | ) | | 0.02 | | | (0.12 | ) |
| |
|
| |
|
| |
|
| |
|
| |
|
| |
Total from investment operations | | | 0.36 | | | 0.37 | | | 0.39 | | | 0.38 | | | 0.18 | |
| |
|
| |
|
| |
|
| |
|
| |
|
| |
Less Distributions: | | | | | | | | | | | | | | | | |
From net investment income | | | (0.31 | ) | | (0.41 | ) | | (0.40 | ) | | (0.36 | ) | | (0.30 | ) |
From net realized gains on investments | | | — | | | — | | | — | | | (0.00 | )(a) | | — | |
| |
|
| |
|
| |
|
| |
|
| |
|
| |
Total distributions | | | (0.31 | ) | | (0.41 | ) | | (0.40 | ) | | (0.36 | ) | | (0.30 | ) |
| |
|
| |
|
| |
|
| |
|
| |
|
| |
Net asset value per share, end of year | | $ | 10.05 | | $ | 10.00 | | $ | 10.04 | | $ | 10.05 | | $ | 10.03 | |
| |
|
| |
|
| |
|
| |
|
| |
|
| |
Total return | | | 3.65 | % | | 3.75 | % | | 3.97 | % | | 3.88 | % | | 1.84 | % |
Ratios/Supplemental Data: | | | | | | | | | | | | | | | | |
Net Assets at end of year (000) | | $ | 1,462,217 | | $ | 231,679 | | $ | 59,409 | | $ | 45,260 | | $ | 45,691 | |
Ratio of expenses to average net assets: | | | | | | | | | | | | | | | | |
Before waivers | | | 0.80 | % | | 0.83 | % | | 0.89 | % | | 0.91 | % | | 0.90 | % |
After waivers | | | 0.60 | % | | 0.60 | % | | 0.60 | % | | 0.60 | % | | 0.60 | % |
Ratio of net investment income to average net assets | | | 3.00 | % | | 4.37 | % | | 4.07 | % | | 3.58 | % | | 2.98 | % |
Portfolio turnover (b) | | | 16 | % | | 129 | % | | 171 | % | | 96 | % | | 97 | % |
| | |
| |
(a) | The amount is less than $0.005 per share. |
| |
(b) | Portfolio turnover is calculated on the basis of the Fund as a whole, without distinguishing between classes of shares issued. |
The accompanying notes are an integral part of these financial statements.
88
Financial Highlights—Continued
(For a share outstanding throughout each period)
| | | | | | | | | | | | | | | | |
| |
| |
| | Municipal Money Market Fund | |
| |
| |
| | Year Ended
October 31, | |
| |
| |
| | 2009 | | 2008 | | 2007 | | 2006 | | 2005 | |
| |
| |
| |
| |
| |
| |
Per Share Data: | | | | | | | | | | | | | | | | |
Net asset value per share, beginning of year | | $ | 1.00 | | $ | 1.00 | | $ | 1.00 | | $ | 1.00 | | $ | 1.00 | |
| |
|
| |
|
| |
|
| |
|
| |
|
| |
Income from investment operations: | | | | | | | | | | | | | | | | |
Net investment income | | | 0.01 | | | 0.03 | | | 0.04 | | | 0.03 | | | 0.02 | |
| |
|
| |
|
| |
|
| |
|
| |
|
| |
Total from investment operations | | | 0.01 | | | 0.03 | | | 0.04 | | | 0.03 | | | 0.02 | |
| |
|
| |
|
| |
|
| |
|
| |
|
| |
Less Distributions: | | | | | | | | | | | | | | | | |
From net investment income | | | (0.01 | ) | | (0.03 | ) | | (0.04 | ) | | (0.03 | ) | | (0.02 | ) |
From tax return of capital | | | (0.00 | )(a) | | — | | | — | | | — | | | — | |
| |
|
| |
|
| |
|
| |
|
| |
|
| |
Total distributions | | | (0.01 | ) | | (0.03 | ) | | (0.04 | ) | | (0.03 | ) | | (0.02 | ) |
| |
|
| |
|
| |
|
| |
|
| |
|
| |
Net asset value per share, end of year | | $ | 1.00 | | $ | 1.00 | | $ | 1.00 | | $ | 1.00 | | $ | 1.00 | |
| |
|
| |
|
| |
|
| |
|
| |
|
| |
| | | | | | | | | | | | | | | | |
Total return | | | 1.03 | % | | 2.94 | % | | 3.68 | % | | 3.33 | % | | 2.24 | % |
Ratios/Supplemental Data: | | | | | | | | | | | | | | | | |
Net Assets at end of year (000) | | $ | 789,832 | | $ | 664,401 | | $ | 1,115,100 | | $ | 365,840 | | $ | 204,689 | |
Ratio of total expenses to average net assets: | | | | | | | | | | | | | | | | |
Before waivers | | | 0.53 | % | | 0.49 | % | | 0.49 | % | | 0.53 | % | | 0.53 | % |
After waivers | | | 0.53 | % | | 0.35 | % | | 0.26 | % | | 0.30 | % | | 0.27 | % |
Ratio of interest expense to average net assets | | | 0.00 | %(a) | | 0.00 | % | | 0.00 | % | | 0.00 | % | | 0.00 | % |
Ratio of expenses to average net assets excluding interest expense: | | | | | | | | | | | | | | | | |
Before waivers | | | 0.53 | % | | 0.49 | % | | 0.49 | % | | 0.53 | % | | 0.53 | % |
After waivers | | | 0.53 | % | | 0.35 | % | | 0.26 | % | | 0.30 | % | | 0.27 | % |
Ratio of net investment income to average net assets | | | 0.99 | % | | 2.93 | % | | 3.37 | % | | 3.31 | % | | 2.26 | % |
| | |
| |
(a) | The amount is less than 0.005% or $0.005 per share. |
The accompanying notes are an integral part of these financial statements.
89
Notes to Financial Statements
October 31, 2009
| |
1. | Organization: |
| |
| Alpine Series Trust (the “Series Trust”) was organized in 2001 as a Delaware business trust, and is registered under the Investment Company Act of 1940, as amended (the “1940 Act”), as an open-end management investment company. Alpine Income Trust (the “Income Trust”) was organized in 2002 as a Delaware business trust, and is registered under the 1940 Act, as an open-end management investment company. The Alpine Dynamic Dividend Fund, Alpine Accelerating Dividend Fund, Alpine Dynamic Financial Services Fund, Alpine Dynamic Innovators Fund, Alpine Dynamic Transformations Fund and Alpine Dynamic Balance Fund are six separate funds of the Series Trust. The Alpine Ultra Short Tax Optimized Income Fund and Alpine Municipal Money Market Fund are two separate funds of the Income Trust. The Alpine Dynamic Dividend Fund, Alpine Accelerating Dividend Fund, Alpine Dynamic Financial Services Fund, Alpine Dynamic Innovators Fund, Alpine Dynamic Transformations Fund, Alpine Dynamic Balance Fund, Alpine Ultra Short Tax Optimized Income Fund, and Alpine Municipal Money Market Fund (individually referred to as a “Fund” and collectively, “the Funds”) are diversified funds. Alpine Woods Capital Investors, LLC (the “Adviser”) is a Delaware limited liability company and serves as the investment manager to the Funds. The Board of Trustees approved the closing of the Adviser Class of the Alpine Municipal Money Market Fund on September 24, 2007. The final day of operation for this class was December 4, 2007. The Alpine Accelerating Dividend Fund commenced operations on November 5, 2008. |
| |
2. | Significant Accounting Policies: |
| |
| The following is a summary of significant accounting policies consistently followed by the Funds in the preparation of their financial statements. The policies are in conformity with accounting principles generally accepted in the United States of America (“GAAP”), which require management to make estimates and assumptions that affect amounts reported herein. Actual results could differ from those estimates. In preparing these financial statements, the Funds have evaluated events and transactions for potential recognition or disclosure resulting from subsequent events through December 30, 2009. This evaluation did not result in any subsequent events that necessitated disclosure and/or adjustments. |
| |
| A. Valuation of Securities: |
| |
| The Dynamic Dividend Fund, Accelerating Dividend Fund, Dynamic Financial Services Fund, Dynamic Innovators Fund, Dynamic Transformations Fund, Dynamic Balance Fund and Ultra Short Tax Optimized Income Fund value securities for which the primary market is on a domestic or foreign exchange and over-the-counter admitted to trading on the National Association of Securities Dealers Automated Quotation Market System (“NASDAQ”) at the last quoted sales price at the end of each business day or, if no sale, at the mean of the closing bid and asked prices. Over-the-counter securities are valued at the last quoted sales price at the end of each business day or, if no sale, at the mean of the closing bid and asked prices. Securities for which market quotations are not readily available or whose values have been materially affected by events occurring before the close of U.S. markets but after the close of the securities’ primary markets, are valued at fair value as determined in good faith according to procedures approved by the Board of Trustees. |
| |
| For example, fair value pricing may be used where: (i) a security is illiquid (restricted securities and repurchase agreements maturing in more than seven days); (ii) the market or exchange for a security is closed on an ordinary trading day and no other market prices are available; (iii) the security is so thinly traded that there have been no transactions in the stock over an extended period; or (iv) the validity of a market quotation received is questionable. In addition, fair value pricing will be used if emergency or unusual situations have occurred, such as when trading of a security on an exchange is suspended; or when an event occurs after the close of the exchange on which the security is principally traded that is likely to have changed the value of the security before the NAV is calculated (applicable to foreign securities). |
| |
| Among those factors that may be considered when fair valuing a security are: fundamental analytical data relating to the investment in the security; evaluation of the forces that influence the market in which the security is purchased and sold; type of security or asset; financial statements of issuer; special reports prepared by analysts or the Adviser; information as to any transactions or offers with respect to the security; and the historical tendency of the security’s price to track or respond to general and specific market movements (in terms of indices, sectors, or other market measurements). |
| |
| As of October 31, 2009, the Ultra Short Tax Optimized Income Fund held securities that are fair valued, which comprised 0.2% of the Fund’s net assets. |
90
Notes to Financial Statements—Continued
October 31, 2009
| |
| The valuation of certain debt securities are valued at the evaluated mean price based upon current market prices of securities which are comparable in coupon, rating, and maturity or an appropriate matrix utilizing similar factors. |
| |
| The Municipal Money Market Fund values its investments at amortized cost, which approximates market value. Pursuant to Rule 2a-7 of the 1940 Act, amortized cost, as defined, is a method of valuing securities at acquisition cost, adjusted for amortization of premium or accretion of discount rather than at their value based on current market factors. |
| |
| In accordance with GAAP, the Funds use a three-tier hierarchy to establish classification of fair value measurements for disclosure purposes. Inputs refer broadly to the assumptions that market participants would use in pricing the asset or liability, including assumptions about risk. Inputs may be observable or unobservable. Observable inputs are inputs that reflect the assumptions market participants would us in pricing the asset or liability that are developed based on market data obtained from sources independent of the reporting entity. Unobservable inputs are inputs that reflect the reporting entities own assumptions about the assumptions market participants would us in pricing the asset or liability that are developed based on the best information available. |
| | | |
| | Level 1 — | Unadjusted quoted prices in active markets for identical assets or liabilities that the Fund has the ability to access. |
| | | |
| | Level 2 — | Observable inputs other than quoted prices included in level 1 that are observable for the asset or liability, either directly or indirectly. These inputs may include quoted prices for the identical instrument on an inactive market, prices for similar instruments, interest rates, prepayment speeds, credit risk, yield curves, default rates and similar data. |
| | | |
| | Level 3 — | Unobservable inputs for the asset or liability, to the extent relevant observable inputs are not available; representing the Funds’ own assumptions about the assumptions a market participant would use in valuing the asset or liability, and would be based on the best information available. |
| | | |
| The availability of observable inputs can vary from security to security and is affected by a wide variety of factors, including, for example, the type of security, whether the security is new and not yet established in the marketplace, the liquidity of markets, and other characteristics particular to the security. To the extent that valuation is based on models or inputs that are less observable or unobservable in the market, the determination of fair value requires more judgment. Accordingly, the degree of judgment exercised in determining fair value is greatest for instruments categorized in level 3. |
| |
| The inputs used to measure fair value may fall into different levels of the fair value hierarchy. In such cases, for disclosure purposes, the level in the fair value hierarchy within which the fair value measurement falls in its entirety, is determined based on the lowest level input that is significant to the fair value measurement in its entirety. |
| |
| Various inputs are used in determining the value of the Funds’ investments as of the reporting period end. The designated input levels are not necessarily an indication of the risk or liquidity associated with these investments. These inputs are categorized in the following hierarchy under applicable financial accounting standards. |
91
Notes to Financial Statements—Continued
October 31, 2009
The following is a summary of the inputs used to value the Funds’ net assets as of October 31, 2009:
| | | | | | | | | | | | | | | | | | | |
| | Dynamic
Dividend
Fund | | Accelerating
Dividend
Fund | | Dynamic
Financial
Services
Fund | | Dynamic
Innovators
Fund | | Dynamic
Trans-
formations
Fund | | Dynamic
Balance
Fund | |
| |
| |
| |
| |
| |
| |
| |
Level 1: | | | | | | | | | | | | | | | | | | | |
Common Stocks | | | | | | | | | | | | | | | | | | | |
Consumer Discretionary | | $ | 51,326,056 | | $ | 55,646 | | $ | — | | $ | 1,171,571 | | $ | 676,945 | | $ | 2,896,026 | |
Consumer Staples | | | 51,803,909 | | | 182,368 | | | — | | | 132,120 | | | 88,080 | | | 3,184,074 | |
Energy | | | 48,869,786 | | | 114,237 | | | — | | | 95,750 | | | 85,620 | | | 3,818,570 | |
Financials | | | 81,406,727 | | | 188,312 | | | 6,950,584 | | | 753,705 | | | 299,555 | | | 13,409,910 | |
Health Care | | | 36,909,843 | | | 103,915 | | | — | | | 4,125,193 | | | 655,035 | | | 3,957,446 | |
Industrials | | | 85,355,851 | | | 178,917 | | | 229,431 | | | 1,572,636 | | | 818,872 | | | 6,790,668 | |
Information Technology | | | 55,159,660 | | | 95,794 | | | — | | | 3,969,233 | | | 358,661 | | | 116,938 | |
Materials | | | 71,693,880 | | | 135,775 | | | — | | | 637,238 | | | 285,060 | | | 2,192,061 | |
Telecommunication Services | | | 23,253,708 | | | 20,536 | | | — | | | — | | | — | | | — | |
Utilities | | | 25,636,324 | | | 129,862 | | | — | | | — | | | — | | | 2,051,562 | |
Investment Companies | | | — | | | — | | | 294,914 | | | — | | | — | | | 81,687 | |
Short-Term Investments | | | 1,319 | | | 7,760 | | | 883 | | | 363 | | | 501,629 | | | 2,991,615 | |
Level 2: | | | | | | | | | | | | | | | | | | | |
Common Stocks | | | | | | | | | | | | | | | | | | | |
Consumer Staples | | | 3,418,994 | | | — | | | — | | | — | | | — | | | — | |
Energy | | | 20,349,815 | | | — | | | — | | | — | | | — | | | — | |
Financials | | | 6,107,500 | | | — | | | 934,839 | | | — | | | — | | | — | |
Information Technology | | | — | | | — | | | — | | | 156,750 | | | — | | | — | |
Bonds and Notes | | | — | | | — | | | — | | | — | | | — | | | 13,788,909 | |
Level 3: | | | | | | | | | | | | | | | | | | | |
Common Stocks Financials | | | — | | | — | | | — | | | — | | | — | | | — | |
| |
|
| |
|
| |
|
| |
|
| |
|
| |
|
| |
Total Investments | | $ | 561,293,372 | | $ | 1,213,122 | | $ | 8,410,651 | | $ | 12,614,559 | | $ | 3,769,457 | | $ | 55,279,466 | |
| |
|
| |
|
| |
|
| |
|
| |
|
| |
|
| |
Level 1: | | | | | | | | | | | | | | | | | | | |
Written Option Contracts | | $ | — | | $ | — | | $ | — | | $ | — | | $ | — | | $ | 4,270 | |
Following is a reconciliation of Level 3 assets for which significant unobservable inputs were used to determine fair value:
| | | | |
| | Dynamic
Dividend
Fund | |
| |
| |
Balance as of October 31, 2008 | | $ | — | |
Accrued discounts / premiums | | | — | |
Realized gain (loss) | | | — | |
Change in unrealized appreciation (depreciation) | | | (278,282 | ) |
Net purchases (sales) | | | — | |
Transfers in and / or out of Level 3 | | | 278,282 | |
| |
|
| |
Balance as of October 31, 2009 | | $ | — | |
| |
|
| |
92
Notes to Financial Statements—Continued
October 31, 2009
| | | | | | | |
| | Ultra Short
Tax Optimized
Income Fund | | Municipal
Money
Market Fund | |
| |
| |
| |
Level 1: | | | | | | | |
Money Market Funds | | $ | 28,732,958 | | $ | 44,966,811 | |
Level 2: | | | | | | | |
Municipal Bonds | | | | | | | |
Alaska | | | — | | | 565,000 | |
Alabama | | | 40,378,623 | | | — | |
Arizona | | | 26,704,667 | | | 2,074,000 | |
Arkansas | | | 29,375,000 | | | 2,830,000 | |
California | | | 183,538,139 | | | 48,075,000 | |
Colorado | | | 21,927,168 | | | 7,402,000 | |
Connecticut | | | 6,103,860 | | | — | |
Delaware | | | 9,650,000 | | | — | |
District of Columbia | | | 5,405,000 | | | — | |
Florida | | | 169,806,833 | | | 124,238,937 | |
Georgia | | | 37,001,580 | | | 15,430,000 | |
Idaho | | | 6,555,000 | | | — | |
Illinois | | | 109,145,846 | | | 65,760,000 | |
Indiana | | | 45,100,000 | | | 42,525,000 | |
Iowa | | | 20,000,000 | | | 16,655,000 | |
Kansas | | | 4,700,000 | | | 1,110,000 | |
Kentucky | | | 31,954,674 | | | 31,810,000 | |
Louisiana | | | 98,988,650 | | | 1,240,000 | |
Maine | | | 6,530,000 | | | — | |
Massachusetts | | | 17,778,697 | | | 3,000,000 | |
Michigan | | | 131,134,906 | | | 42,880,000 | |
Minnesota | | | 3,315,000 | | | 6,553,000 | |
Mississippi | | | 26,532,560 | | | — | |
Missouri | | | 19,555,409 | | | 9,170,000 | |
Montano | | | — | | | 4,180,000 | |
Nevada | | | 1,543,515 | | | — | |
New Hampshire | | | 13,889,630 | | | — | |
New Jersey | | | 4,808,241 | | | — | |
New Mexico | | | 6,215,000 | | | 3,135,000 | |
New York | | | 100,297,720 | | | 17,880,000 | |
North Carolina | | | 39,305,000 | | | 20,700,000 | |
Ohio | | | 51,048,264 | | | 24,220,000 | |
Oklahoma | | | 600,222 | | | 17,100,000 | |
Oregon | | | 5,625,904 | | | 8,570,000 | |
Pennsylvania | | | 116,167,295 | | | 20,140,000 | |
Puerto Rico | | | 30,343,690 | | | — | |
South Carolina | | | 15,054,360 | | | 4,380,000 | |
South Dakota | | | 15,000,000 | | | — | |
Tennessee | | | 104,265,000 | | | 8,855,000 | |
Texas | | | 33,130,995 | | | 92,870,000 | |
Utah | | | 1,120,000 | | | — | |
Vermont | | | 20,825,000 | | | 19,250,000 | |
Virgin Islands | | | 513,195 | | | — | |
Virginia | | | 3,500,000 | | | 13,820,000 | |
Washington | | | 20,390,000 | | | 47,405,000 | |
West Virginia | | | 3,063,840 | | | 4,000,000 | |
Wisconsin | | | 68,830,000 | | | 3,653,569 | |
Wyoming | | | 2,855,000 | | | — | |
93
Notes to Financial Statements—Continued
October 31, 2009
| | | | | | | |
| | Ultra Short
Tax Optimized
Income Fund | | Municipal
Money
Market Fund | |
| |
| |
| |
Level 3: | | | | | | | |
Municipal Bonds | | | | | | | |
Multistate | | $ | 3,031,500 | | $ | — | |
| |
|
| |
|
| |
Total Investments | | $ | 1,741,337,941 | | $ | 776,443,317 | |
| |
|
| |
|
| |
| |
| Following is a reconciliation of Level 3 assets for which significant unobservable inputs were used to determine fair value: |
| | | | |
| | Ultra Short
Tax Optimized
Income Fund | |
| |
| |
Balance as of October 31, 2008 | | $ | 4,080,000 | |
Accrued discounts / premiums | | | — | |
Realized gain (loss) | | | — | |
Change in unrealized appreciation (depreciation) | | | (948,500 | ) |
Net purchases (sales) | | | (100,000 | ) |
Transfers in and / or out of Level 3 | | | — | |
| |
|
| |
Balance as of October 31, 2009 | | $ | 3,031,500 | |
| |
|
| |
| |
| B. Security Transactions and Investment Income: |
| |
| Security transactions are recorded on the date a security is purchased or sold (i.e. on the trade date). Realized gains and losses are computed on the identified cost basis. Interest income is recorded on the accrual basis and includes accretion of discounts and amortization of premiums, where applicable. Dividend income is recorded on the ex-dividend date or in the case of some foreign securities, on the date thereafter when the Funds are made aware of the dividend. Foreign income may be subject to foreign withholding taxes, which are accrued as applicable. Capital gains realized on some foreign securities are subject to foreign taxes, which are accrued as applicable. |
| |
| Dividends and interest from non-U.S. sources received by the Funds are generally subject to non-U.S. withholding taxes at rates ranging up to 30%. Such withholding taxes may be reduced or eliminated under the terms of applicable U.S. income tax treaties, and the Funds intend to undertake any procedural steps required to claim the benefits of such treaties. |
| |
| C. Line of Credit: |
| |
| Each Fund has a line of credit with U.S. Bank N.A. Loans in aggregate, whether to cover overdrafts or for investment purposes, may not exceed the maximum amount that is permitted under the 1940 Act. For the year ended October 31, 2009, the average interest rate paid on outstanding borrowings under the line of credit was 1.39%, 1.19%, 1.19%, 1.15%, 0.87% and 1.26% for the Dynamic Dividend Fund, Dynamic Financial Services Fund, Dynamic Innovators Fund, Dynamic Transformations Fund, Dynamic Balance Fund, and Municipal Money Market Fund, respectively. The Funds also incur interest expense on custody overdraft charges. |
94
Notes to Financial Statements—Continued
October 31, 2009
| | | | | | | | | | | | | |
| | Dynamic
Dividend
Fund | | Accelerating
Dividend
Fund | | Dynamic
Financial
Services
Fund | | Dynamic
Innovators
Fund | |
| |
| |
| |
| |
| |
Total line of credit amount available | | $ | 205,775,288 | | $ | 418,046 | | $ | 2,963,597 | | $ | 4,210,065 | |
Line of credit outstanding at October 31, 2009 | | | 21,423,000 | | | — | | | 621,000 | | | 1,376,000 | |
Line of credit amount unused at October 31, 2009 | | | 184,352,288 | | | 418,046 | | | 2,342,597 | | | 2,834,065 | |
Average balance outstanding during the year | | | 8,426,786 | | | — | | | 277,556 | | | 1,542,277 | |
Interest expense incurred on line of credit during the year | | | 98,656 | | | — | | | 5,273 | | | 18,779 | |
Interest expense incurred on custody overdrafts during the year | | | 2,943 | | | — | | | 243 | | | 7 | |
| | | | | | | | | | | | | |
| | Dynamic
Trans-
formations
Fund | | Dynamic
Balance
Fund | | Ultra Short
Tax Optimized
Income
Fund | | Municipal
Money
Market
Fund | |
| |
| |
| |
| |
| |
Total line of credit amount available | | $ | 1,262,762 | | $ | 18,513,612 | | $ | 591,932,709 | | $ | 263,649,839 | |
Line of credit outstanding at October 31, 2009 | | | — | | | — | | | — | | | — | |
Line of credit amount unused at October 31, 2009 | | | 1,262,762 | | | 18,513,612 | | | 591,932,709 | | | 263,649,839 | |
Average balance outstanding during the year | | | 8,047 | | | 195,036 | | | — | | | 1,879 | |
Interest expense incurred on line of credit during the year | | | 94 | | | 1,250 | | | — | | | 24 | |
Interest expense incurred on custody overdrafts during the year | | | — | | | 16 | | | — | | | — | |
| |
| D. Income Taxes: |
| |
| It is each Fund’s policy to comply with the requirements of Subchapter M of the Internal Revenue Code applicable to regulated investment companies and to distribute timely, all of its investment company taxable income and net realized capital gains to shareholders. Therefore, no federal income tax provision is recorded. |
| |
| Under applicable foreign tax laws, a withholding tax may be imposed on interest, dividends, and capital gains earned on foreign investments. Where available, the Funds will file for claims on foreign taxes withheld. |
| |
| E. Dividends and Distributions: |
| |
| Each of the Dynamic Dividend, Accelerating Dividend, Dynamic Financial Services, Dynamic Innovators, Dynamic Transformations, Dynamic Balance Fund and Ultra Short Tax Optimized Income Funds intends to distribute substantially all of its net investment income and net realized capital gains, if any, throughout the year to its shareholders in the form of dividends. The Municipal Money Market Fund declares and accrues dividends daily on each business day based upon the Fund’s net income, and pays dividends monthly. Distributions to shareholders are recorded at the close of business on the ex-dividend date. All dividends are automatically reinvested in full and fractional shares of the Fund at net asset value per share, unless otherwise requested. |
| |
| The amounts of dividends from net investment income and of distributions from net realized gains are determined in accordance with federal income tax regulations, which may differ from GAAP. These differences are either considered temporary or permanent in nature. To the extent these differences are permanent in nature, such amounts are reclassified within the composition of net assets based on their federal tax-basis treatment; temporary differences do not require reclassification. In the event dividends and distributions to shareholders exceed net investment income and net realized gains for tax purposes they are reported as returns of capital. |
| |
| F. Class Allocations: |
| |
| Income, expenses (other than class specific expenses) and realized and unrealized gains and losses of the Ultra Short Tax Optimized Income Fund are allocated among the classes of the Fund based on the relative net assets of each class. Class specific expenses are allocated to the class to which they relate. Currently, class specific expenses are limited to those incurred under the Distribution Plan for Adviser Class shares. |
95
Notes to Financial Statements—Continued
October 31, 2009
| | | |
| G. Foreign Currency Translation Transactions: |
| | | |
| Each of the Dynamic Dividend, Accelerating Dividend, Dynamic Financial Services, Dynamic Innovators, Dynamic Transformations and Dynamic Balance Funds may invest up to 100%, 100%, 100%, 20%, 100% and 15%, respectively, of the value of its total assets in foreign securities. The books and records of each Fund are maintained in U.S. dollars. Non-U.S. denominated amounts are translated into U.S. dollars as follows, with the resultant translation gains and losses recorded in the Statements of Operations: |
| | | |
| | i) | market value of investment securities and other assets and liabilities at the exchange rate on the valuation date, |
| | | |
| | ii) | purchases and sales of investment securities, income and expenses at the exchange rate prevailing on the respective date of such transactions. |
| | | |
| H. Risk Associated With Foreign Securities and Currencies: |
| | | |
| Investments in securities of foreign issuers carry certain risks not ordinarily associated with investments in securities of domestic issuers. Such risks include future political and economic developments and the possible imposition of exchange controls or other foreign governmental laws and restrictions. In addition, with respect to certain countries, there is a possibility of expropriation of assets, confiscatory taxation, political or social instability or diplomatic developments, which could adversely affect investments in those countries. |
| | | |
| Certain countries may also impose substantial restrictions on investments in their capital markets by foreign entities, including restrictions on investments in issuers or industries deemed sensitive to relevant national interests. These factors may limit the investment opportunities available to the Funds or result in a lack of liquidity and high price volatility with respect to securities of issuers from developing countries. |
| | | |
| I. Written Option Contracts: |
| | | |
| The Funds are subject to equity price risk in the normal course of pursuing its investment objectives. The Funds may write (sell) put and call options to gain exposure to or hedge against changes in the value of equities. When the Funds write (sell) an option, an amount equal to the premium received by the Funds is included in the Statement of Assets and Liabilities as an asset and an equivalent liability. The amount of the liability is subsequently marked-to-market to reflect the current value of an option written. By writing an option, the Funds may become obligated during the term of the option to deliver (with respect to a call option) or purchase (with respect to a put option) the securities underlying the option at the exercise price if the option is exercised. When an option expires on its stipulated expiration date, the Funds realize a gain. When the Funds enter into a closing purchase transaction, the Funds realize a gain or loss if the cost of the closing purchase transaction differs from the premium received when the option was sold without regard to any unrealized gain or loss on the underlying security, and the liability related to such option is eliminated. If a call option written by a Fund is exercised, the proceeds of the sale of the underlying security will be increased by the premium originally received and the Fund will realize a gain or loss on the sale of the security. If a put option written by a Fund is exercised, the Fund’s basis in the underlying security will be reduced by the premium originally received. With written option contracts, there is minimal counterparty credit risk to the Funds since written option contracts are exchange traded. |
| | | |
| The premium amount and the number of written option contracts during the year ended October 31, 2009 were as follows: |
| | | | | | | | | | | | | |
| | Dynamic Balance Fund | | Dynamic Dividend Fund | |
| |
| |
| |
| | Number of
Contracts | | Premium
Amount | | Number of
Contracts | | Premium
Amount | |
| |
| |
| |
| |
| |
Options outstanding at October 31, 2008 | | | — | | $ | — | | | — | | $ | — | |
Options written | | | 1,874 | | | 337,815 | | | 2,720 | | | 672,620 | |
Options closed | | | (100 | ) | | (49,700 | ) | | — | | | — | |
Options exercised | | | (974 | ) | | (151,491 | ) | | — | | | — | |
Options expired | | | (678 | ) | | (121,130 | ) | | (2,720 | ) | | (672,620 | ) |
| |
|
| |
|
| |
|
| |
|
| |
Options outstanding at October 31, 2009 | | | 122 | | $ | 15,494 | | | — | | $ | — | |
| |
|
| |
|
| |
|
| |
|
| |
96
Notes to Financial Statements—Continued
October 31, 2009
| |
| J. Swap Contracts: |
| |
| The Funds are subject to equity price risk in the normal course of purusing its investment objectives. The Dynamic Dividend Fund may enter into long equity swap contracts with multiple brokers. A long equity swap contract entitles the Fund to receive from the counterparty any appreciation and dividends paid on an individual security, while obligating the Fund to pay the counterparty any depreciation on the security as well as interest on the notional amount of the contract at a rate equal to 80 basis points. |
| |
| Fluctuations in the value of an open contract are recorded daily as a net unrealized gain or loss. The Fund will realize a gain or loss upon termination or reset of the contract. Either party, under certain conditions, may terminate the contract prior to the contract’s expiration date. |
| |
| Credit risk may arise as a result of the failure of the counterparty to comply with the terms of the contract. The Fund considers the creditworthiness of each counterparty to a contract in evaluating potential credit risk quarterly. The counterparty risk to the Fund is limited to the net unrealized gain, if any, on the contract, along with dividends receivable on long equity contracts. Additionally, risk may arise from unanticipated movements in interest rates or in the value of the underlying securities. At October 31, 2009, the Dynamic Dividend Fund had no open equity swap contracts. During the year ended October 31, 2009, the Dynamic Dividend Fund opened and closed 4,137,994 equity swap contracts. |
| |
| K. Equity-Linked Structured Notes: |
| |
| Certain Funds may invest in equity-linked structured notes. Equity-linked structured notes are derivative securities which are specially designed to combine the characteristics of one or more underlying securities and their equity derivatives in a single note form. The return and/or yield or income component may be based on the performance of the underlying equity securities, and equity index, and/or option positions. Equity-linked structured notes are typically offered in limited transactions by financial institutions in either registered or non-registered form. An investment in equity-linked structured notes creates exposure to the credit risk of the issuing financial institution, as well as to the market risk of the underlying securities. There is no guaranteed return of principal with these securities and the appreciation potential of these securities may be limited by a maximum payment or call right. In certain cases, equity-linked structured notes may be more volatile and less liquid than less complex securities or other types of fixed-income securities. Such securities may exhibit price behavior that does not correlate with other fixed-income securities. The Funds did not hold any equity-linked structured notes at the year ended October 31, 2009. |
| |
| L. Forward Currency Contracts: |
| |
| The Funds are subject to foreign currency exchange rate risk in the normal course of pursuing its investment objective. The Funds may use forward currency contracts to gain exposure to or hedge against changes in the value of foreign currencies. A forward currency contract (“forward”) is an agreement between two parties to buy and sell a currency at a set price on a future date. The market value of the forward contract fluctuates with changes in forward currency exchange rates. The forward contract is marked-to-market daily and the change in market value is recorded by each Fund as unrealized appreciation or depreciation. When the forward contract is closed, a Fund records a realized gain or loss equal to the fluctuation in value during the period the forward contract was open. A Fund could be exposed to risk if a counterparty is unable to meet the terms of a forward or if the value of the currency changes unfavorably. |
| |
| During the year ended October 31, 2009, the Dynamic Dividend Fund entered into 194,000,000 forward currency contracts with Goldman Sachs with a cost of $90,485,002. |
| |
| M. Derivatives: |
| |
| The Funds have adopted authoritative standards regarding disclosure about derivatives and hedging activities and how they affect the Funds’ Statements of Assets and Liablities and Statements of Operations. |
97
Notes to Financial Statements—Continued
October 31, 2009
Statements of Assets and Liabilities
Fair values of derivative instruments as of October 31, 2009:
| | | | | | | | | | | | | | |
| | | Asset Derivatives | | Liability Derivatives | |
| | |
| |
| |
Derivatives | | | Statement of
Assets and
Liabilities Location | | Fair Value | | Statement of
Assets and
Liabilities Location | | Fair Value | |
| | |
| |
| |
| |
| |
| | | | | | | | | | |
Dynamic Balance Fund | | | | | | | | | | | | | |
Equity contracts: | | | | | | | | | | | | | |
Written option contracts | | N/A | | — | | Written option contracts | | $4,270 | |
| | | | | | | | | | | | | |
Statements of Operations
The effect of derivative instruments on the Statements of Operations for the year ended October 31, 2009:
| | | | | | | | | | | | | | |
| | Amount of Realized Gain (Loss) on Derivatives | |
| |
| |
Derivatives | | | Purchased
option
contracts | | Written
option
contracts | | Forward
currency
contracts | | Swap
contracts | |
| | |
| |
| |
| |
| |
| | | | | | | | | | | | | |
Dynamic Dividend Fund | | | | | | | | | | | | | |
Equity contracts | | $ | — | | $ | 672,620 | | $ | — | | $ | 5,526,555 | |
Forward currency contracts | | $ | — | | $ | — | | $ | (3,392,718 | ) | $ | — | |
| | | | | | | | | | | | | |
Dynamic Balance Fund | | | | | | | | | | | | | |
Equity contracts | | $ | (48,500 | ) | $ | 145,530 | | $ | — | | $ | — | |
| | | | | | | | | | | | | | |
| | Change in Unrealized Appreciation (Depreciation) on Derivatives | |
| |
| |
Derivatives | | | Purchased
option
contracts | | Written
option
contracts | | Forward
currency
contracts | | Swap
contracts | |
| | |
| |
| |
| |
| |
| | | | | | | | | | | | | |
Dynamic Balance Fund | | | | | | | | | | | | | |
Equity contracts | | $ | 47,250 | | $ | 11,224 | | $ | — | | $ | — | |
N. Temporary Guarantee Program for Money Market Funds:
The Municipal Money Market Fund elected to participate in the U.S. Department of the Treasury’s (the “Treasury”) Temporary Guarantee Program for Money Market Funds (“Program”) that was set to expire on April 30, 2009, unless extended by the Treasury. On March 31, 2009, the Treasury announced the extension of the Program until September 18, 2009 and the Municipal Money Market Fund applied for continued participation in the Program.
Continued participation in the Program for the period from April 30, 2009 through September 18, 2009, required a payment to the Treasury in the amount of 0.015% of the net asset value of the Fund as of September 19, 2008. The Fund incurred the expense of its participation in the Program without regard to any fee waivers or expense limitations in effect for the Fund. The Secretary of the Treasury did not extend the Program beyond the close of business on September 18, 2009 and the Fund is no longer able to participate in the Program. The Fund paid $257,118 for participation in the Program.
Additional information about the Program is available at http://www.ustreas.gov.
| |
3. | Capital Share Transactions: |
The Funds have an unlimited number of shares of beneficial interest, with $0.0001 par value, authorized. Transactions in shares and dollars of the Funds were as follows:
98
Notes to Financial Statements—Continued
October 31, 2009
Dynamic Dividend Fund
| | | | | | | | | | | | | |
| | Year Ended
October 31, 2009 | | Year Ended
October 31, 2008 | |
| |
| |
| |
| | Shares | | Amount | | Shares | | Amount | |
| |
| |
| |
| |
| |
Shares sold | | | 40,478,198 | | $ | 196,120,574 | | | 53,657,887 | | $ | 563,036,031 | |
Shares issued in reinvestment of dividends | | | 18,373,014 | | | 87,140,087 | | | 14,596,014 | | | 139,704,564 | |
Redemption fees | | | — | | | 178,370 | | | — | | | 517,263 | |
Shares redeemed | | | (43,839,028 | ) | | (208,323,675 | ) | | (76,116,507 | ) | | (703,254,544 | ) |
| |
|
| |
|
| |
|
| |
|
| |
Total net change | | | 15,012,184 | | $ | 75,115,356 | | | (7,862,606 | ) | $ | 3,314 | |
| |
|
| |
|
| |
|
| |
|
| |
Accelerating Dividend Fund
| | | | | | | | | | | | | |
| | Period Ended
October 31, 2009 (1) | | | | | | | |
| |
| | | | | | | |
| | Shares | | Amount | | | | | | | |
| |
| |
| | | | | | | |
Shares sold | | | 105,816 | | $ | 1,060,985 | | | | | | | |
Shares issued in reinvestment of dividends | | | — | | | — | | | | | | | |
Redemption fees | | | — | | | — | | | | | | | |
Shares redeemed | | | — | | | — | | | | | | | |
| |
|
| |
|
| | | | | | | |
Total net change | | | 105,816 | | $ | 1,060,985 | | | | | | | |
| |
|
| |
|
| | | | | | | |
| | | | | | | | | | | | | |
(1) Fund commenced operations on November 5, 2008. | | | | | | | | | | | | | |
Dynamic Financial Services Fund
| | | | | | | | | | | | | |
| | Year Ended
October 31, 2009 | | Year Ended
October 31, 2008 | |
| |
| |
| |
| | Shares | | Amount | | Shares | | Amount | |
| |
| |
| |
| |
| |
Shares sold | | | 343,876 | | $ | 1,966,966 | | | 697,809 | | $ | 6,472,426 | |
Shares issued in reinvestment of dividends | | | 94,660 | | | 473,302 | | | 201,690 | | | 2,103,627 | |
Redemption fees | | | — | | | 1,015 | | | — | | | 10,070 | |
Shares redeemed | | | (357,977 | ) | | (1,938,943 | ) | | (608,435 | ) | | (5,310,381 | ) |
| |
|
| |
|
| |
|
| |
|
| |
Total net change | | | 80,559 | | $ | 502,340 | | | 291,064 | | $ | 3,275,742 | |
| |
|
| |
|
| |
|
| |
|
| |
Dynamic Innovators Fund
| | | | | | | | | | | | | |
| | Year Ended
October 31, 2009 | | Year Ended
October 31, 2008 | |
| |
| |
| |
| | Shares | | Amount | | Shares | | Amount | |
| |
| |
| |
| |
| |
Shares sold | | | 264,825 | | $ | 1,676,100 | | | 3,672,630 | | $ | 45,945,955 | |
Shares issued in reinvestment of dividends | | | — | | | — | | | 121,184 | | | 1,654,158 | |
Redemption fees | | | — | | | 1,168 | | | — | | | 117,477 | |
Shares redeemed | | | (1,152,188 | ) | | (7,302,845 | ) | | (4,975,251 | ) | | (58,619,588 | ) |
| |
|
| |
|
| |
|
| |
|
| |
Total net change | | | (887,363 | ) | $ | (5,625,577 | ) | | (1,181,437 | ) | $ | (10,901,998 | ) |
| |
|
| |
|
| |
|
| |
|
| |
Dynamic Transformations Fund
| | | | | | | | | | | | | |
| | Year Ended
October 31, 2009 | | Period Ended
October 31, 2008 (1) | |
| |
| |
| |
| | Shares | | Amount | | Shares | | Amount | |
| |
| |
| |
| |
| |
Shares sold | | | 11,850 | | $ | 82,368 | | | 463,465 | | $ | 4,630,875 | |
Shares issued in reinvestment of dividends | | | 3,343 | | | 17,115 | | | — | | | — | |
Redemption fees | | | — | | | 1 | | | — | | | 22 | |
Shares redeemed | | | (15,191 | ) | | (78,085 | ) | | (5,744 | ) | | (45,439 | ) |
| |
|
| |
|
| |
|
| |
|
| |
Total net change | | | 2 | | $ | 21,399 | | | 457,721 | | $ | 4,585,458 | |
| |
|
| |
|
| |
|
| |
|
| |
| | | | | | | | | | | | | |
(1) Fund commenced operations on December 31, 2007. | | | | | | | | | | | |
99
Notes to Financial Statements—Continued
October 31, 2009
Dynamic Balance Fund
| | | | | | | | | | | | | |
| | Year Ended
October 31, 2009 | | Year Ended
October 31, 2008 | |
| |
| |
| |
| | Shares | | Amount | | Shares | | Amount | |
| |
| |
| |
| |
| |
Shares sold | | | 38,357 | | $ | 314,766 | | | 49,518 | | $ | 579,192 | |
Shares issued in reinvestment of dividends | | | 113,108 | | | 918,908 | | | 622,616 | | | 7,231,038 | |
Redemption fees | | | — | | | 106 | | | — | | | 1,353 | |
Shares redeemed | | | (450,286 | ) | | (3,602,450 | ) | | (972,223 | ) | | (11,154,144 | ) |
| |
|
| |
|
| |
|
| |
|
| |
Total net change | | | (298,821 | ) | $ | (2,368,670 | ) | | (300,089 | ) | $ | (3,342,561 | ) |
| |
|
| |
|
| |
|
| |
|
| |
Ultra Short Tax Optimized Income Fund
| | | | | | | | | | | | | |
| | Year Ended
October 31, 2009 | | Year Ended
October 31, 2008 | |
| |
| |
| |
| | Shares | | Amount | | Shares | | Amount | |
| |
| |
| |
| |
| |
Adviser Class | | | | | | | | | | | | | |
Shares sold | | | 21,875,510 | | $ | 220,902,141 | | | 1,276,848 | | $ | 12,879,474 | |
Shares issued in reinvestment of dividends | | | 136,158 | | | 1,373,479 | | | 18,092 | | | 182,093 | |
Redemption fees | | | — | | | 1,683 | | | — | | | 212 | |
Shares redeemed | | | (2,212,979 | ) | | (22,346,415 | ) | | (230,618 | ) | | (2,323,435 | ) |
| |
|
| |
|
| |
|
| |
|
| |
Total net change | | | 19,798,689 | | $ | 199,930,888 | | | 1,064,322 | | $ | 10,738,344 | |
| |
|
| |
|
| |
|
| |
|
| |
| | | | | | | | | | | | | |
Investor Class | | | | | | | | | | | | | |
Shares sold | | | 156,952,569 | | $ | 1,575,628,786 | | | 25,157,257 | | $ | 252,396,026 | |
Shares issued in reinvestment of dividends | | | 1,557,326 | | | 15,616,912 | | | 546,879 | | | 5,477,503 | |
Redemption fees | | | — | | | 65,479 | | | — | | | 16,330 | |
Shares redeemed | | | (36,137,658 | ) | | (362,901,990 | ) | | (8,444,341 | ) | | (84,627,222 | ) |
| |
|
| |
|
| |
|
| |
|
| |
Total net change | | | 122,372,237 | | $ | 1,228,409,187 | | | 17,259,795 | | $ | 173,262,637 | |
| |
|
| |
|
| |
|
| |
|
| |
Municipal Money Market Fund
| | | | | | | | | | | | | |
| | Year Ended
October 31, 2009 | | Year Ended
October 31, 2008 | |
| |
| |
| |
| | Shares | | Amount | | Shares | | Amount | |
| |
| |
| |
| |
| |
Adviser Class (1) | | | | | | | | | | | | | |
Shares sold | | | — | | $ | — | | | — | | $ | — | |
Shares issued in reinvestment of dividends | | | — | | | — | | | 1,124 | | | 1,124 | |
Shares redeemed | | | — | | | — | | | (430,895 | ) | | (430,895 | ) |
| |
|
| |
|
| |
|
| |
|
| |
Total net change | | | — | | $ | — | | | (429,771 | ) | $ | (429,771 | ) |
| |
|
| |
|
| |
|
| |
|
| |
| | | | | | | | | | | | | |
Investor Class | | | | | | | | | | | | | |
Shares sold | | | 1,310,070,047 | | $ | 1,310,070,047 | | | 5,315,613,045 | | $ | 5,315,613,045 | |
Shares issued in reinvestment of dividends | | | 5,367,192 | | | 5,367,192 | | | 18,011,888 | | | 18,011,888 | |
Shares redeemed | | | (1,190,003,238 | ) | | (1,190,003,238 | ) | | (5,784,324,779 | ) | | (5,784,324,779 | ) |
| |
|
| |
|
| |
|
| |
|
| |
Total net change | | | 125,434,701 | | $ | 125,434,701 | | | (450,699,846 | ) | $ | (450,699,846 | ) |
| |
|
| |
|
| |
|
| |
|
| |
| | | | | | | | | | | | | |
(1) The Municipal Money Market Fund - Adviser Class ceased operations on December 5, 2007. |
| |
4. | Purchases and Sales of Securities: |
| |
| Purchases and sales of securities (excluding short-term securities) for the year ended October 31, 2009 are as follows: |
| | | | | | | | | | | | | |
| | Non-U.S. Government | | U.S. Government | |
| |
| |
| |
| | Purchases | | Sales | | Purchases | | Sales | |
| |
| |
| |
| |
| |
Dynamic Dividend Fund | | $ | 3,442,657,321 | | $ | 3,331,588,321 | | $ | — | | $ | — | |
Accelerating Dividend Fund | | | 1,840,315 | | | 776,122 | | | — | | | — | |
Dynamic Financial Services Fund | | | 29,378,123 | | | 28,822,567 | | | — | | | — | |
Dynamic Innovators Fund | | | 2,352,005 | | | 6,075,210 | | | — | | | — | |
Dynamic Transformations Fund | | | 1,665,230 | | | 1,409,518 | | | — | | | — | |
Dynamic Balance Fund | | | 11,028,728 | | | 5,841,808 | | | 7,390,417 | | | 11,644,579 | |
Ultra Short Tax Optimized Income Fund | | | 143,934,365 | | | 11,595,000 | | | — | | | — | |
100
Notes to Financial Statements—Continued
October 31, 2009
| |
5. | Distribution Plans: |
| |
| Quasar Distributors, LLC (“Quasar”) serves as each Fund’s distributor. The Ultra Short Tax Optimized Income Fund has adopted a distribution and servicing plan (the “Plan”) for its Adviser Class shares as allowed by Rule 12b-1 under the 1940 Act. The Plan authorizes payments by the Fund in connection with the distribution and servicing of its shares at an annual rate, as determined from time to time by the Board of Trustees, of up to 0.25% of the Fund’s average daily net assets. Amounts paid under the Plan by the Fund may be spent by the Fund on any activities or expenses primarily intended to result in the sale of shares of the Fund, including but not limited to advertising, compensation for sales and marketing activities of financial institutions and others such as dealers and distributors, shareholder account servicing, the printing and mailing of prospectuses to other than current shareholders and the printing and mailing of sales literature. The Ultra Short Tax Optimized Income Fund incurred $184,838 pursuant to the Plan for the year ended October 31, 2009. |
| |
| The Plan for the Ultra Short Tax Optimized Income Fund may be terminated at any time by vote of the Trustees of the Income Trust who are not “interested persons”, as defined by the 1940 Act, of the Income Trust, or by vote of a majority of the outstanding voting shares of the respective class. |
| |
6. | Investment Advisory Agreement and Other Affiliated Transactions: |
| |
| Alpine Woods Capital Investors, LLC (“the Adviser”) provides investment advisory services to each of the Funds. Pursuant to the advisory agreements with the Funds, the Adviser is entitled to an annual fee based on 1.00% of each Fund’s average daily net assets for the Dynamic Balance Fund, Dynamic Dividend Fund, Dynamic Financial Services Fund, Dynamic Innovators Fund, Dynamic Transformations Fund and Accelerating Dividend Fund. The Adviser is entitled to an annual fee based on 0.45% of the Municipal Money Market Fund’s average daily net assets and an annual fee based on 0.75% of the Ultra Short Tax Optimized Income Fund’s average daily net assets. |
| |
| The Adviser agreed to reimburse the Dynamic Dividend Fund, Accelerating Dividend Fund, Dynamic Financial Services Fund, Dynamic Innovators Fund, Dynamic Transformations Fund, Dynamic Balance Fund and Ultra Short Tax Optimized Income Fund – Investor Class to the extent necessary to ensure that each Fund’s total operating expenses (excluding 12b-1 fees, interest, brokerage commissions and extraordinary expenses) does not exceed 1.35%, 1.35%, 1.35%, 1.35%, 1.35%, 1.35%, and 0.60% of the Fund’s average daily net assets, respectively. The expense cap for the Ultra Short Tax Optimized Income Fund – Adviser Class is 0.25% higher than the Investor Class. For the year ended October 31, 2009, the Adviser agreed to reimburse the Municipal Money Market Fund to the extent necessary to ensure that the Fund’s total operating expenses (excluding interest, brokerage commissions and extraordinary expenses) did not exceed certain limits. The limits ranged from 0.53% to 0.55% of the Fund’s average daily net assets during the year ended October 31, 2009. The Adviser may recover expenses paid in excess of the cap on expenses for the three previous years, as long as the recovery does not cause the Fund to exceed such cap on expenses. For the year ended October 31, 2009, the Adviser waived investment advisory fees and other expenses totaling $40,707, $38,481, $31,680, $41,270, $1,528,133, and $9,413, for the Accelerating Dividend Fund, Dynamic Financial Services Fund, Dynamic Innovators Fund, Dynamic Transformations Fund, Ultra Short Tax Optimized Income Fund and Municipal Money Market Fund, respectively. The expense limitations will remain in effect for each Fund unless and until the Board of Trustees of the Series and Income Trusts approve its modification or termination with respect to each Fund. |
| |
| Waived expenses subject to potential recovery by year of expiration are as follows: |
| | | | | | | | | | | | | | | | | | | |
Year of Expiration | | Accelerating
Dividend
Fund | | Dynamic
Financial
Services
Fund | | Dynamic
Innovators
Fund | | Dynamic
Transformations
Fund | | Ultra Short
Tax Optimized
Income
Fund | | Municipal
Money Market
Fund | |
| |
| |
| |
| |
| |
| |
| |
10/31/10 | | $ | — | | $ | 26,625 | | $ | 22,424 | | $ | — | | $ | 148,724 | | $ | 1,718,243 | |
10/31/11 | | | — | | | 22,153 | | | — | | | 53,829 | | | 322,815 | | | 1,007,557 | |
10/31/12 | | | 40,707 | | | 38,481 | | | 31,680 | | | 41,270 | | | 1,528,133 | | | 9,413 | |
At October 31, 2009, the Dynamic Dividend Fund had $984 invested in the Municipal Money Market Fund.
101
Notes to Financial Statements—Continued
October 31, 2009
| |
7. | Federal Income Tax Information |
| |
| At October 31, 2009, the components of accumulated earnings (losses) on a tax basis were as follows: |
| | | | | | | | | | | | | |
| | Dynamic
Dividend Fund | | Accelerating
Dividend Fund | | Dynamic
Financial
Services Fund | | Dynamic
Innovators Fund | |
| |
| |
| |
| |
| |
Cost of investments | | $ | 554,670,752 | | $ | 1,077,483 | | $ | 13,858,859 | | $ | 16,078,016 | |
| |
|
| |
|
| |
|
| |
|
| |
Gross unrealized appreciation | | | 63,507,760 | | | 144,468 | | | 197,657 | | | 1,139,842 | |
Gross unrealized depreciation | | | (56,885,140 | ) | | (8,830 | ) | | (5,645,865 | ) | | (4,603,299 | ) |
| |
|
| |
|
| |
|
| |
|
| |
Net unrealized appreciation (depreciation) | | | 6,622,620 | | | 135,638 | | | (5,448,208 | ) | | (3,463,457 | ) |
| |
|
| |
|
| |
|
| |
|
| |
Undistributed ordinary income | | | 25,082,724 | | | 17,961 | | | — | | | — | |
Undistributed long-term capital gain | | | — | | | — | | | — | | | — | |
| |
|
| |
|
| |
|
| |
|
| |
Total distributable earnings | | | 25,082,724 | | | 17,961 | | | — | | | — | |
| |
|
| |
|
| |
|
| |
|
| |
Other accumulated gains (losses) | | | (981,689,032 | ) | | 2 | | | (115,729 | ) | | (12,053,242 | ) |
| |
|
| |
|
| |
|
| |
|
| |
Total accumulated gains (losses) | | $ | (949,983,688 | ) | $ | 153,601 | | $ | (5,563,937 | ) | $ | (15,516,699 | ) |
| |
|
| |
|
| |
|
| |
|
| |
| | | | | | | | | | | | | |
| | Dynamic
Transformations
Fund | | Dynamic
Balance
Fund | | Ultra Short
Optimized Tax
Income Fund | | Municipal
Money
Market Fund | |
| |
| |
| |
| |
| |
Cost of investments | | $ | 4,061,708 | | $ | 66,446,936 | | $ | 1,740,005,791 | | $ | 776,443,317 | |
| |
|
| |
|
| |
|
| |
|
| |
Gross unrealized appreciation | | | 514,297 | | | 6,303,400 | | | 3,070,623 | | | — | |
Gross unrealized depreciation | | | (806,547 | ) | | (17,470,870 | ) | | (1,738,473 | ) | | — | |
| |
|
| |
|
| |
|
| |
|
| |
Net unrealized appreciation (depreciation) | | | (292,250 | ) | | (11,167,470 | ) | | 1,332,150 | | | — | |
| |
|
| |
|
| |
|
| |
|
| |
Undistributed ordinary income | | | — | | | — | | | 524 | | | — | |
Undistributed long-term capital gain | | | — | | | — | | | — | | | — | |
| |
|
| |
|
| |
|
| |
|
| |
Total distributable earnings | | | — | | | — | | | 524 | | | — | |
| |
|
| |
|
| |
|
| |
|
| |
Other accumulated gains (losses) | | | (793,664 | ) | | (255,176 | ) | | (52,240 | ) | | — | |
| |
|
| |
|
| |
|
| |
|
| |
Total accumulated gains (losses) | | $ | (1,085,914 | ) | $ | (11,422,646 | ) | $ | 1,280,434 | | $ | — | |
| |
|
| |
|
| |
|
| |
|
| |
| |
| The tax basis of investments for tax and financial reporting purposes differs principally due to the deferral of losses on wash sales, REIT tax adjustments, and mark-to-market cost basis adjustments for investments in passive foreign investment companies (PFICs) for tax purposes. |
| |
| The tax character of distributions paid during the years ended October 31, 2009 and 2008 were as follows: |
| | | | | | | |
| | 2009 | | 2008 | |
| |
| |
| |
| | | | | |
Dynamic Dividend Fund | | | | | | | |
Ordinary income | | $ | 126,650,712 | | $ | 188,534,882 | |
Long-term capital gain | | | — | | | — | |
Return of capital | | | — | | | 5,952,906 | |
| |
|
| |
|
| |
| | $ | 126,650,712 | | $ | 194,487,788 | |
| |
|
| |
|
| |
Accelerating Dividend Fund | | | | | | | |
Ordinary income | | $ | — | | $ | — | |
Long-term capital gain | | | — | | | — | |
Return of capital | | | — | | | — | |
| |
|
| |
|
| |
| | $ | — | | $ | — | |
| |
|
| |
|
| |
102
Notes to Financial Statements—Continued
October 31, 2009
| | | | | | | |
| | 2009 | | 2008 | |
| |
| |
| |
Dynamic Financial Services Fund | | | | | | | |
Ordinary income | | $ | 519,389 | | $ | 2,663,086 | |
Long-term capital gain | | | — | | | — | |
Return of capital | | | 4,121 | | | — | |
| |
|
| |
|
| |
| | $ | 523,510 | | $ | 2,663,086 | |
| |
|
| |
|
| |
Dynamic Innovators Fund | | | | | | | |
Ordinary income | | $ | — | | $ | 1,950,065 | |
Long-term capital gain | | | — | | | 54,800 | |
Return of capital | | | — | | | — | |
| |
|
| |
|
| |
| | $ | — | | $ | 2,004,865 | |
| |
|
| |
|
| |
Dynamic Transformations Fund | | | | | | | |
Ordinary income | | $ | 14,717 | | $ | — | |
Long-term capital gain | | | — | | | — | |
Return of capital | | | 2,411 | | | — | |
| |
|
| |
|
| |
| | $ | 17,128 | | $ | — | |
| |
|
| |
|
| |
Dynamic Balance Fund | | | | | | | |
Ordinary income | | $ | 845,241 | | $ | 2,209,394 | |
Long-term capital gain | | | — | | | 5,536,488 | |
Return of capital | | | 114,962 | | | 102,670 | |
| |
|
| |
|
| |
| | $ | 960,203 | | $ | 7,848,552 | |
| |
|
| |
|
| |
Ultra Short Tax Optimized Income Fund | | | | | | | |
Ordinary income | | $ | 91,364 | | $ | 297,298 | |
Exempt interest dividends | | | 23,252,288 | | | 5,927,147 | |
| |
|
| |
|
| |
| | $ | 23,343,652 | | $ | 6,224,445 | |
| |
|
| |
|
| |
Municipal Money Market Fund | | | | | | | |
Ordinary income | | $ | 134,761 | | $ | 141,465 | |
Exempt interest dividends | | | 6,695,604 | | | 22,003,941 | |
Return of capital | | | 2,781 | | | — | |
| |
|
| |
|
| |
| | $ | 6,833,146 | | $ | 22,145,406 | |
| |
|
| |
|
| |
103
Notes to Financial Statements—Continued
October 31, 2009
| |
| During the year ended October 31, 2009, the Dynamic Balance Fund and Ultrashort Tax Optimized Income Fund utilized $217,302 and $2,449 of capital loss carryovers, respectively. Capital loss carryovers as of October 31, 2009 are as follows: |
| | | | | | | | | | | | | | |
Expiration Date | | | Dynamic
Dividend Fund | | Accelerating
Dividend Fund | | Dynamic
Financial
Services Fund | | Dynamic
Innovators Fund | |
| | |
| |
| |
| |
| |
10/31/2013 | | $ | 4,335,047 | | $ | — | | $ | — | | $ | — | |
10/31/2014 | | $ | 15,084,034 | | $ | — | | $ | — | | $ | — | |
10/31/2015 | | $ | 37,200,325 | | $ | — | | $ | — | | $ | — | |
10/31/2016 | | $ | 536,971,822 | | $ | — | | $ | — | | $ | 6,415,976 | |
10/31/2017 | | $ | 388,137,216 | | $ | — | | $ | 115,243 | | $ | 5,637,266 | |
| | | | | | | | | |
Expiration Date | | | Dynamic
Transformations
Fund | | Dynamic
Balance
Fund | | Ultra Short
Optimized Tax
Income Fund | | Municipal
Money
Market Fund | |
| | |
| |
| |
| |
| |
10/31/2014 | | $ | — | | $ | — | | $ | 50,128 | | $ | — | |
10/31/2015 | | $ | — | | $ | — | | $ | 2,112 | | $ | — | |
10/31/2016 | | $ | 140,244 | | $ | 266,400 | | $ | — | | $ | — | |
10/31/2017 | | $ | 653,420 | | $ | — | | $ | — | | $ | — | |
| |
| In accordance with U.S. GAAP, the Funds have previously adopted accounting standards related to the accounting for uncertain tax positions. In accordance with this guidance, the Funds analyzed all open tax years, as defined by the Statute of Limitations, for all major jurisdiction. Open tax years are those that are open for exam by taxing authorities. Major jurisdications for the Funds included Federal and the state of New York. As of October 31, 2009, open Federal and New York tax years include the tax years ended October 31, 2006 through 2009. The Funds have no examination in progress. |
| |
| The Funds have reviewed all open tax years and major jurisdictions and conluded that there is no impact on the Funds’ net assets and no tax liability resulting from unrecognized tax benefits relating to uncertain income tax positions taken or expected to be taken on the tax return for the fiscal year-end October 31, 2009. Also, the Funds have recognized no interest and penalties related to uncertain tax benefits. The Funds are also not aware of any tax positions for which it is reasonably possible that the total amounts of unrecognized tax benefits will significantly change in the next twelve months. |
104
REPORT OF INDEPENDENT REGISTERED PUBLIC ACCOUNTING FIRM
To the Shareholders and Board of Trustees
of Alpine Series Trust and Alpine Income Trust:
We have audited the accompanying statements of assets and liabilities, including the schedules of portfolio investments of Alpine Series Trust, comprising the Alpine Dynamic Balance Fund, Alpine Dynamic Dividend Fund, Alpine Dynamic Financial Services Fund, Alpine Dynamic Innovators Fund, Alpine Dynamic Transformations Fund, and Alpine Accelerating Dividend Fund; and Alpine Income Trust, comprising the Alpine Municipal Money Market Fund and Alpine Ultra Short Tax Optimized Income Fund (collectively the “Funds”) as of October 31, 2009, and the related statements of operations, changes in net assets, and the financial highlights for the periods indicated therein, and the statement of cash flows for the Alpine Dynamic Innovators for the year ended October 31, 2009. These financial statements and financial highlights are the responsibility of the Funds’ management. Our responsibility is to express an opinion on these financial statements and financial highlights based on our audits.
We conducted our audits in accordance with the standards of the Public Company Accounting Oversight Board (United States). Those standards require that we plan and perform the audit to obtain reasonable assurance about whether the financial statements are free of material misstatement. The Funds are not required to have, nor were we engaged to perform, an audit of their internal control over financial reporting. Our audits included consideration of internal control over financial reporting as a basis for designing audit procedures that are appropriate in the circumstances, but not for the purpose of expressing an opinion on the effectiveness of the Funds’ internal control over financial reporting. Accordingly, we express no such opinion. An audit also includes examining, on a test basis, evidence supporting the amounts and disclosures in the financial statements, assessing the accounting principles used and significant estimates made by management, as well as evaluating the overall financial statement presentation. Our procedures included confirmation of securities owned as of October 31, 2009, by correspondence with the custodian and brokers; where replies where not received from brokers, we performed other auditing procedures. We believe that our audits provide a reasonable basis for our opinion.
In our opinion, the financial statements and financial highlights referred to above present fairly, in all material respects, the financial position of each of the Funds as of October 31, 2009, the results of their operations, the changes in their net assets, and the financial highlights for the periods indicated, and the cash flows of the Alpine Dynamic Innovators Fund for the year ended October 31, 2009, in conformity with accounting principles generally accepted in the United States of America.

Milwaukee, WI
December 30, 2009
105
Additional Information (Unaudited)
Expense Examples
October 31, 2009
As a shareholder of the Dynamic Dividend Fund, Accelerating Dividend Fund, Dynamic Financial Services Fund, Dynamic Innovators Fund, Dynamic Transformations Fund, Dynamic Balance Fund and Ultra Short Tax Optimized Income Fund – Adviser and Investor Class, you will incur two types of costs: (1) transaction costs, such as initial sales charges (loads) and/or redemption fees and (2) ongoing costs, including management fees; distribution and/or service fees; and other Fund expenses. As a shareholder of the Municipal Money Market Fund, you will incur ongoing costs, including management fees and other Fund expenses. The examples below are intended to help you understand your ongoing costs (in dollars) of investing in the Funds and to compare these costs with the ongoing costs of investing in other mutual funds. The examples are based on an investment of $1,000 for the period 5/1/2009-10/31/2009.
Actual Expenses
The first line of the tables below provides information about actual account values and actual expenses. The Funds charge no sales load (except the Ultra Short Tax Optimized Income Fund – Adviser Class, which charges a sales load of 0.50% on purchases) or transaction fees, but do assess shareholders for outgoing wire transfers, returned checks and stop payment orders at prevailing rates charged by U.S. Bancorp Fund Services, LLC, the Funds’ transfer agent. If you request a redemption by wire transfer, currently a $15.00 fee is charged by the Funds’ transfer agent. Shareholders in the Dynamic Dividend Fund, Accelerating Dividend Fund, Dynamic Financial Services Fund, Dynamic Innovators Fund, Dynamic Transformations Fund and Dynamic Balance Fund will be charged a redemption fee equal to 1.00% of the net amount of the redemption if they redeem their shares less than 2 months after purchase. Shareholders in the Ultra Short Tax Optimized Income Fund – Adviser and Investor Class will be charged a redemption fee equal to 0.25% of the net amount of the redemption if they redeem their shares less than one month after purchase. IRA accounts will be charged a $15.00 annual maintenance fee. To the extent the Funds invest in shares of other investment companies as a part of their investment strategies, you will indirectly bear your proportionate share of any fees and expenses charged by the underlying funds in which the Funds invest in addition to the expenses of the Fund. These expenses are not included in the example below. The example below includes, but is not limited to, management fees, shareholder servicing fees, fund accounting, custody and transfer agent fees. You may use the information in this line, together with the amount you invested, to estimate the expenses that you paid over the period. Simply divide your account value by $1,000 (for example, an $8,600 account value divided by $1,000 = 8.6), then multiply the result by the number in the first line under the heading entitled “Expenses Paid During Period” to estimate the expenses you paid on your account during the period.
Hypothetical Example for Comparison Purposes
The second line of the table below provides information about hypothetical account values and hypothetical expenses based on the Funds’ actual expense ratios and an assumed rate of return of 5% per year before expenses, which does not represent the Funds’ actual returns. The hypothetical account values and expenses may not be used to estimate the actual ending account balance or expenses you paid for the period. You may use this information to compare the ongoing costs of investing in the Funds and other funds. To do so, compare this 5% hypothetical example with the 5% hypothetical examples that appear in the shareholder reports of other funds. Please note that the expenses shown in the table are meant to highlight your ongoing costs only and do not reflect any transactional costs, such as redemption fees. Therefore, the second line of the table is useful in comparing ongoing costs only, and will not help you determine the relative total costs of owning different funds. In addition, if these transactional costs were included, your costs would have been higher.
106
Additional Information (Unaudited)—Continued
Expense Examples
October 31, 2009
Dynamic Dividend Fund
| | | | | | | |
| | Beginning
Account Value
5/1/09 | | Ending
Account Value
10/31/09 | | Expenses Paid
During Period
5/1/2009-10/31/2009 (3)* | |
| |
| |
| |
| |
Actual (1) | | $ 1,000.00 | | $ 1,180.40 | | $ 6.65 | |
Hypothetical (2) | | $ 1,000.00 | | $ 1,019.11 | | $ 6.16 | |
| |
|
(1) | Ending account values and expenses paid during period based on a 18.04% return. The return is considered after expenses are deducted from the Fund. |
(2) | Ending account values and expenses paid during period based on a 5.00% annual return. The return is considered before expenses are deducted from the Fund. |
(3) | Excluding interest expense of 0.03%, the actual and hypothetical expenses paid during the period were $6.49 and $6.01, respectively. |
* | Expenses are equal to the Fund’s annualized expense ratio of 1.21%, multiplied by the average account value over the period, multiplied by 184/365 (to reflect the one-half year period). |
Accelerating Dividend Fund
| | | | | | | |
| | Beginning
Account Value
5/1/09 | | Ending
Account Value
10/31/09 | | Expenses Paid
During Period
5/1/2009-10/31/2009* | |
| |
| |
| |
| |
Actual (1) | | $ 1,000.00 | | $ 1,164.30 | | $ 7.36 | |
Hypothetical (2) | | $ 1,000.00 | | $ 1,018.40 | | $ 6.87 | |
| |
|
(1) | Ending account values and expenses paid during period based on a 16.43% return. The return is considered after expenses are deducted from the Fund. |
(2) | Ending account values and expenses paid during period based on a 5.00% annual return. The return is considered before expenses are deducted from the Fund. |
* | Expenses are equal to the Fund’s annualized expense ratio of 1.35%, multiplied by the average account value over the period, multiplied by 184/365 (to reflect the one-half year period). |
Dynamic Financial Services Fund
| | | | | | | |
| | Beginning
Account Value
5/1/09 | | Ending
Account Value
10/31/09 | | Expenses Paid
During Period
5/1/2009-10/31/2009 (3)* | |
| |
| |
| |
| |
Actual (1) | | $ 1,000.00 | | $ 1,314.80 | | $ 8.46 | |
Hypothetical (2) | | $ 1,000.00 | | $ 1,017.90 | | $ 7.37 | |
| |
|
(1) | Ending account values and expenses paid during period based on a 31.48% return. The return is considered after expenses are deducted from the Fund. |
(2) | Ending account values and expenses paid during period based on a 5.00% annual return. The return is considered before expenses are deducted from the Fund. |
(3) | Excluding interest expense of 0.10%, the actual and hypothetical expenses paid during the period were $7.88 and $6.87, respectively. |
* | Expenses are equal to the Fund’s annualized expense ratio of 1.45%, multiplied by the average account value over the period, multiplied by 184/365 (to reflect the one-half year period). |
107
Additional Information (Unaudited)—Continued
Expense Examples
October 31, 2009
Dynamic Innovators Fund
| | | | | | | |
| | Beginning
Account Value
5/1/09 | | Ending
Account Value
10/31/09 | | Expenses Paid
During Period
5/1/2009-10/31/2009 (3)* | |
| |
| |
| |
| |
Actual (1) | | $ 1,000.00 | | $ 1,423.80 | | $ 9.35 | |
Hypothetical (2) | | $ 1,000.00 | | $ 1,017.49 | | $ 7.78 | |
| |
|
(1) | Ending account values and expenses paid during period based on a 42.38% return. The return is considered after expenses are deducted from the Fund. |
(2) | Ending account values and expenses paid during period based on a 5.00% annual return. The return is considered before expenses are deducted from the Fund. |
(3) | Excluding interest expense of 0.18%, the actual and hypothetical expenses paid during the period were $8.25 and $6.87, respectively. |
* | Expenses are equal to the Fund’s annualized expense ratio of 1.53%, multiplied by the average account value over the period, multiplied by 184/365 (to reflect the one-half year period). |
Dynamic Transformations Fund
| | | | | | | |
| | Beginning
Account Value
5/1/09 | | Ending
Account Value
10/31/09 | | Expenses Paid
During Period
5/1/2009-10/31/2009* | |
| |
| |
| |
| |
Actual (1) | | $ 1,000.00 | | $ 1,315.10 | | $ 7.88 | |
Hypothetical (2) | | $ 1,000.00 | | $ 1,018.40 | | $ 6.87 | |
| |
|
(1) | Ending account values and expenses paid during period based on a 31.51% return. The return is considered after expenses are deducted from the Fund. |
(2) | Ending account values and expenses paid during period based on a 5.00% annual return. The return is considered before expenses are deducted from the Fund. |
* | Expenses are equal to the Fund’s annualized expense ratio of 1.35%, multiplied by the average account value over the period, multiplied by 184/365 (to reflect the one-half year period). |
Dynamic Balance Fund
| | | | | | | |
| | Beginning
Account Value
5/1/09 | | Ending
Account Value
10/31/09 | | Expenses Paid
During Period
5/1/2009-10/31/2009* | |
| |
| |
| |
| |
Actual (1) | | $ 1,000.00 | | $ 1,112.80 | | $ 6.71 | |
Hypothetical (2) | | $ 1,000.00 | | $ 1,018.85 | | $ 6.41 | |
| |
|
(1) | Ending account values and expenses paid during period based on a 11.28% return. The return is considered after expenses are deducted from the Fund. |
(2) | Ending account values and expenses paid during period based on a 5.00% annual return. The return is considered before expenses are deducted from the Fund. |
* | Expenses are equal to the Fund’s annualized expense ratio of 1.26%, multiplied by the average account value over the period, multiplied by 184/365 (to reflect the one-half year period). |
Ultra Short Tax Optimized Income Fund
Adviser Class Shares
| | | | | | | |
| | Beginning
Account Value
5/1/09 | | Ending
Account Value
10/31/09 | | Expenses Paid
During Period
5/1/2009-10/31/2009* | |
| |
| |
| |
| |
Actual (1) | | $ 1,000.00 | | $ 1,015.70 | | $ 4.32 | |
Hypothetical (2) | | $ 1,000.00 | | $ 1,020.92 | | $ 4.33 | |
| |
|
(1) | Ending account values and expenses paid during period based on a 1.57% return. The return is considered after expenses are deducted from the Fund. |
(2) | Ending account values and expenses paid during period based on a 5.00% annual return. The return is considered before expenses are deducted from the Fund. |
* | Expenses are equal to the Fund’s annualized expense ratio of 0.85%, multiplied by the average account value over the period, multiplied by 184/365 (to reflect the one-half year period). |
108
Additional Information (Unaudited)—Continued
Expense Examples
October 31, 2009
Ultra Short Tax Optimized Income Fund
Investor Class Shares
| | | | | | | |
| | Beginning
Account Value
5/1/09 | | Ending
Account Value
10/31/09 | | Expenses Paid
During Period
5/1/2009-10/31/2009* | |
| |
| |
| |
| |
Actual (1) | | $ 1,000.00 | | $ 1,017.00 | | $ 3.05 | |
Hypothetical (2) | | $ 1,000.00 | | $ 1,022.18 | | $ 3.06 | |
| |
|
(1) | Ending account values and expenses paid during period based on a 1.70% return. The return is considered after expenses are deducted from the Fund. |
(2) | Ending account values and expenses paid during period based on a 5.00% annual return. The return is considered before expenses are deducted from the Fund. |
* | Expenses are equal to the Fund’s annualized expense ratio of 0.60%, multiplied by the average account value over the period, multiplied by 184/365 (to reflect the one-half year period). |
Municipal Money Market Fund
| | | | | | | |
| | Beginning
Account Value
5/1/09 | | Ending
Account Value
10/31/09 | | Expenses Paid
During Period
5/1/2009-10/31/2009* | |
| |
| |
| |
| |
Actual (1) | | $ 1,000.00 | | $ 1,003.80 | | $ 2.58 | |
Hypothetical (2) | | $ 1,000.00 | | $ 1,022.63 | | $ 2.60 | |
| |
|
(1) | Ending account values and expenses paid during period based on a 0.38% return. The return is considered after expenses are deducted from the Fund. |
(2) | Ending account values and expenses paid during period based on a 5.00% annual return. The return is considered before expenses are deducted from the Fund. |
* | Expenses are equal to the Fund’s annualized expense ratio of 0.51%, multiplied by the average account value over the period, multipliedby 184/365 (to reflect the one-half year period). |
109
Additional Information (Unaudited)—Continued
October 31, 2009
Information about Trustees and Officers
The business and affairs of the Funds are managed under the direction of Trusts’ Board of Trustees. Information pertaining to the Trustees and Officers of the Funds is set forth below. The SAI includes additional information about the Funds’ Trustees and Officers and is available, without charge, upon request by calling 1-888-785-5578.
| | | | | | | | | | | |
Independent Trustees |
|
Name and Age | | Position(s)
Held with
the Trust | | Term of Office
and Length of
Time Served | | Principal Occupation During
Past Five Years | | # of
Portfolios in
Fund
Complex** | | Other Directorships
Held by Trustee | |
| |
| |
| |
| |
| |
| |
| | | | | | | | | | | |
Laurence B. Ashkin (81) | | Independent
Trustee | | Indefinite, since the Trust’s inception | | Real estate developer since 1980; Founder and President of Centrum Properties, Inc. since 1980. | | 16 | | Board of Trustees Chairman, Perspective Charter Schools, Chicago, IL; Director, Chicago Public Radio; Trustee of each of the Alpine Trusts.* | |
|
|
|
|
|
|
|
|
|
|
|
|
H. Guy Leibler (55) | | Independent
Trustee | | Indefinite, since the Trust’s inception | | Private investor, since 2007; Vice Chair & Chief Operating Officer of L&L Acquisitions, LLC (2004-2007); President, Skidmore, Owings & Merrill LLP (2001-2004). | | 16 | | Chairman Emeritus, White Plains Hospital Center; Trustee, each of the Alpine Trusts.* | |
|
|
|
|
|
|
|
|
|
|
|
|
Jeffrey E. Wacksman (49) | | Independent
Trustee | | Indefinite, since 2004 | | Partner, Loeb, Block & Partners LLP, since 1994. | | 16 | | Director, International Succession Planning Association; Trustee, Larchmont Manor Park Society; Director, Bondi Icebergs Inc. (Women’s Sportswear); Director, MH Properties, Inc.; Trustee, each of the Alpine Trusts.* | |
|
|
|
|
|
|
|
|
|
|
|
|
James A. Jacobson (64) | | Independent
Trustee | �� | Indefinite, since July 2009 | | Retired, since November 2008; Vice Chairman and Managing Director, Spear Leeds & Kellogg Specialists, LLC, January 2003 to November 2008. | | 16 | | Trustee, each of the Alpine Trusts.* | |
|
|
|
|
|
|
|
|
|
|
|
|
| |
* | The term “Fund Complex” refers to the Funds in the Alpine Equity Trust, Alpine Series Trust, and Alpine Income Trust, and Alpine Global Dynamic Dividend Fund, Alpine Total Dynamic Dividend Fund, and Alpine Global Premier Properties Fund (the “Alpine Trust”). |
110
Additional Information (Unaudited)—Continued
October 31, 2009
| | | | | | | | | | | |
Interested Trustees & Officers |
|
| | | | | | | | | | | |
Name and Age | | Position(s)
Held with
the Trust | | Term of Office
and Length of
Time Served | | Principal Occupation During
Past Five Years | | # of
Portfolios in
Fund
Complex** | | Other Directorships
Held by Trustee | |
| |
| |
| |
| |
| |
| |
Samuel A. Lieber* (53) | | Interested Trustee, President and Portfolio Manager | | Indefinite, since the Trust’s inception | | CEO of Alpine Woods Capital Investors, LLC since November 1997. President of Alpine Trusts since 1998. | | 16 | | Trustee, each of the Alpine Trusts. | |
|
|
|
|
|
|
|
|
|
|
|
|
Stephen A. Lieber*** (84) | | Vice President and Portfolio Manager | | Indefinite, since the Trust’s inception | | Chief Investment Officer, Alpine Woods Capital Investors, LLC since 2003; Chairman and Senior Portfolio Manager, Saxon Woods Advisors, LLC since 1999. | | N/A | | None | |
|
|
|
|
|
|
|
|
|
|
|
|
Robert W. Gadsden (52) | | Vice President and Portfolio Manager | | Indefinite, since 1999 | | Portfolio Manager and Senior Real Estate Analyst of Alpine Woods Capital Investors, LLC since 1999. Formerly Vice President, Prudential Realty Group (1990-1999). | | N/A | | None | |
|
|
|
|
|
|
|
|
|
|
|
|
John Megyesi (48) | | Chief Compliance Officer | | Indefinite, since January 2009 | | Chief Compliance Officer, Alpine Woods Capital Investors, LLC since January 2009; Vice President and Manager, Trade Surveillance, Credit Suisse Asset Management, LLC (2006-2009); Manager, Trading and Surveillance, Allianze Global Investors (2004-2006). | | N/A | | None | |
|
|
|
|
|
|
|
|
|
|
|
|
Meimei Li (45) | | Treasurer | | Indefinite, since March 2009 | | Controller, Alpine Woods Capital Investors, LLC since February 2007; Senior Accountant Pinnacle Group (2005-2007); Senior Auditor, Eisner & Lubin (2001-2005). | | N/A | | None | |
|
|
|
|
|
|
|
|
|
|
|
|
Andrew Pappert (29) | | Secretary | | Indefinite, since March 2009 | | Director of Fund Operations, Alpine Woods Capital Investors, LLC since September 2008; Assistant Vice President, Mutual Fund Operations, Credit Suisse Asset Management, LLC (2003- 2009). | | N/A | | None | |
|
|
|
|
|
|
|
|
|
|
|
|
| |
* | Denotes Trustees who are “interested persons” of the Trust or Fund under the 1940 Act. |
** | The term “Fund Complex” refers to the Funds in the Alpine Equity Trust, Alpine Series Trust, and Alpine Income Trust, and Alpine Global Dynamic Dividend Fund, Alpine Total Dynamic Dividend Fund, and Alpine Global Premier Properties Fund (the “Alpine Trust”). |
*** | Stephen A. Lieber is the father of Samuel A. Lieber. |
Tax Information
The Funds designated the following percentages of dividends declared from net investment income for the fiscal year ended October 31, 2009 as qualified dividend income under the Jobs & Growth Tax Relief Reconciliation Act of 2003.
| | | | |
Dynamic Dividend Fund | | | 77 | % |
Accelerating Dividend Fund | | | 0 | % |
Dynamic Financial Services Fund | | | 48 | % |
Dynamic Innovators Fund | | | 0 | % |
Dynamic Transformations Fund | | | 86 | % |
Dynamic Balance Fund | | | 87 | % |
Ultra Short Tax Optimized Income Fund | | | 0 | % |
Municipal Money Market Fund | | | 0 | % |
111
Additional Information (Unaudited)—Continued
October 31, 2009
The Funds designated the following percentages of dividends declared during the fiscal year ended October 31, 2009 as dividends qualifying for the dividends received deduction available to corporate shareholders.
| | | | |
Dynamic Dividend Fund | | | 23 | % |
Accelerating Dividend Fund | | | 0 | % |
Dynamic Financial Services Fund | | | 46 | % |
Dynamic Innovators Fund | | | 0 | % |
Dynamic Transformations Fund | | | 86 | % |
Dynamic Balance Fund | | | 33 | % |
Ultra Short Tax Optimized Income Fund | | | 0 | % |
Municipal Money Market Fund | | | 0 | % |
The Fund designated as long-term capital gain dividend, pursuant to Internal Revenue Cose Section 852(b)(3), the amount necessary to reduce the earnings and profits of the Fund related to net capital gain to zero for the tax year ended October 31, 2009.
Availability of Proxy Voting Information
Information regarding how each Fund votes proxies relating to portfolio securities is available without charge upon request by calling toll-free at 1-888-785-5578 and on the SEC’s website at www.sec.gov. Information regarding how each Fund voted proxies relating to portfolio securities during the most recent twelve month period ended June 30 is available on the SEC’s website at www.sec.gov or by calling the toll-free number listed above.
Availability of Quarterly Portfolio Schedule
Beginning with each Fund’s fiscal quarter ended July 31, 2004, each Fund filed its complete schedule of portfolio holdings on Form N-Q with the SEC. Going forward, each Fund will file Form N-Q for the first and third quarters of each fiscal year on Form N-Q. Each Fund’s Form N-Q is available on the SEC’s website at www.sec.gov and may be reviewed and copied at the SEC’s Public Reference Room in Washington, DC. Information on the operation of the Public Reference Room may be obtained by calling 1-202-551-8090.
Privacy Policy
The Funds collect non-public information about you from the following sources:
| | |
| • | information we receive about you on applications or other forms; |
| • | information you give us orally; and |
| • | information about your transactions with others or us. |
The Funds do not disclose any non-public personal information about our customers or former customers without the customer’s authorization, except as required by law or in response to inquiries from governmental authorities. The Funds restrict access to your personal and account information to those employees who need to know that information to provide products and services to you. The Funds also may disclose that information to unaffiliated third parties (such as to brokers or custodians) only as permitted by law and only as needed for us to provided agreed services to you. The Funds maintain physical, electronic and procedural safeguards to guard your non-public personal information.
In the event that you hold shares of the Funds through a financial intermediary, including, but not limited to a broker-dealer, bank or trust company, the privacy policy of your financial intermediary would govern how your non-public personal information would be shared with unaffiliated third parties.
112
|
TRUSTEES |
Samuel A. Lieber |
Laurence B. Ashkin |
James A. Jacobson |
H. Guy Leibler |
Jeffrey E. Wacksman |
|
CUSTODIAN |
U.S. Bank, N.A. |
1555 N. Rivercenter Dr. Suite 302 |
Milwaukee, WI 53212 |
|
SUB-CUSTODIAN |
The Bank of New York Mellon |
One Wall Street |
New York, NY 10286 |
|
INDEPENDENT REGISTERED |
PUBLIC ACCOUNTING FIRM |
Deloitte & Touche LLP |
555 East Wells Street |
Milwaukee, WI 53202 |
|
FUND COUNSEL |
Blank Rome LLP |
The Chrysler Building |
405 Lexington Avenue |
New York, NY 10174 |
|
DISTRIBUTOR |
Quasar Distributors, LLC |
615 East Michigan Street |
Milwaukee, WI 53202 |
|
INVESTMENT ADVISER |
Alpine Woods Capital Investors, LLC |
2500 Westchester Ave., Suite 215 |
Purchase, NY 10577 |
|
TRANSFER AGENT & |
ADMINISTRATOR |
US Bancorp Fund Services, LLC |
615 East Michigan Street |
Milwaukee, WI 53202 |
|

|
|
SHAREHOLDER | INVESTOR INFORMATION |
|
1(888)785.5578 |
www.alpinefunds.com |
|
This material must be preceded or accompanied by a current prospectus. |
Item 2. Code of Ethics.
The registrant has adopted a Senior Officer Code of Ethics that applies to the registrant’s president and chief financial officer. The registrant has not made any amendments to its Senior Officer Code of Ethics during the period covered by this report. The registrant has not granted any waivers from any provisions of the code of ethics during the period covered by this report.
A copy of the registrant’s Senior Officer Code of Ethics is filed herewith.
Item 3. Audit Committee Financial Expert.
The registrant’s board of trustees has determined that there is at least one audit committee financial expert serving on its audit committee. Laurence Ashkin is the “audit committee financial expert” and is considered to be “independent” as each term is defined in Item 3 of Form N-CSR.
Item 4. Principal Accountant Fees and Services.
The registrant has engaged its principal accountant to perform audit services, audit-related services, tax services and other services during the past two fiscal years. “Audit services” refer to performing an audit of the registrant's annual financial statements or services that are normally provided by the accountant in connection with statutory and regulatory filings or engagements for those fiscal years. “Audit-related services” refer to the assurance and related services by the principal accountant that are reasonably related to the performance of the audit. “Tax services” refer to professional services rendered by the principal accountant for tax compliance, tax advice, and tax planning. “Other services” provided by the principal accountant were for performance analysis review. The following table details the aggregate fees billed or expected to be billed for each of the last two fiscal years for audit fees, audit-related fees, tax fees and other fees by the principal accountant.
| | FYE 10/31/2009 | | FYE 10/31/2008 |
| Audit Fees | $ | 30,350 | | | $ | 28,350 | |
| Audit-Related Fees | $ | 0 | | | $ | 0 | |
| Tax Fees | $ | 4,900 | | | $ | 4,800 | |
| All Other Fees | $ | 6,200 | | | $ | 0 | |
The audit committee has adopted pre-approval policies and procedures that require the audit committee to pre-approve all audit and non-audit services of the registrant, including services provided to any entity affiliated with the registrant.
The percentage of fees billed by Deloitte & Touche LLP applicable to non-audit services pursuant to waiver of pre-approval requirement were as follows:
| | FYE 10/31/2009 | FYE 10/31/2008 |
| Audit-Related Fees | 0% | 0% |
| Tax Fees | 0% | 0% |
| All Other Fees | 0% | 0% |
All of the principal accountant’s hours spent on auditing the registrant’s financial statements were attributed to work performed by full-time permanent employees of the principal accountant.
The following table indicates the non-audit fees billed or expected to be billed by the registrant’s accountant for services to the registrant and to the registrant’s investment adviser (and any other controlling entity, etc.—not sub-adviser) for the last two years. The audit committee of the board of trustees has considered whether the provision of non-audit services that were rendered to the registrant's investment adviser is compatible with maintaining the principal accountant's independence and has concluded that the provision of such non-audit services by the accountant has not compromised the accountant’s independence.
| Non-Audit Related Fees | FYE 10/31/2009 | FYE 10/31/2008 |
| Registrant | $ | 6,200 | | $0 |
| Registrant’s Investment Adviser | $ | 0 | | $0 |
Item 5. Audit Committee of Listed Registrants.
Not applicable to registrants who are not listed issuers (as defined in Rule 10A-3 under the Securities Exchange Act of 1934).
Item 6. Investments.
Schedule of Investments is included as part of the report to shareholders filed under Item 1 of this Form.
Item 7. Disclosure of Proxy Voting Policies and Procedures for Closed-End Management Investment Companies.
Not applicable to open-end investment companies.
Item 8. Portfolio Managers of Closed-End Management Investment Companies.
Not applicable to open-end investment companies.
Item 9. Purchases of Equity Securities by Closed-End Management Investment Company and Affiliated Purchasers.
Not applicable to open-end investment companies.
Item 10. Submission of Matters to a Vote of Security Holders.
Not Applicable.
Item 11. Controls and Procedures.
| (a) | The Registrant’s President and Chief Financial Officer have reviewed the Registrant's disclosure controls and procedures (as defined in Rule 30a-3(c) under the Investment Company Act of 1940 (the “Act”)) as of a date within 90 days of the filing of this report, as required by Rule 30a-3(b) under the Act and Rules 13a-15(b) or 15d-15(b) under the Securities Exchange Act of 1934. Based on their review, such officers have concluded that the disclosure controls and procedures are effective in ensuring that information required to be disclosed in this report is appropriately recorded, processed, summarized and reported and made known to them by others within the Registrant and by the Registrant’s service provider. |
| |
| (b) | There were no changes in the Registrant's internal control over financial reporting (as defined in Rule 30a-3(d) under the Act) that occurred during the second fiscal quarter of the period covered by this report that has materially affected, or is reasonably likely to materially affect, the Registrant's internal control over financial reporting. |
Item 12. Exhibits.
| (a) | (1) Any code of ethics or amendment thereto, that is the subject of the disclosure required by Item 2, to the extent that the registrant intends to satisfy Item 2 requirements through filing an exhibit. Filed herewith. |
| |
| | (2) A separate certification for each principal executive and principal financial officer pursuant to Section 302 of the Sarbanes-Oxley Act of 2002. Filed herewith. |
| |
| | (3) Any written solicitation to purchase securities under Rule 23c-1 under the Act sent or given during the period covered by the report by or on behalf of the registrant to 10 or more persons. Not applicable to open-end investment companies. |
| |
| (b) | Certifications pursuant to Section 906 of the Sarbanes-Oxley Act of 2002. Furnished herewith. |
| |
SIGNATURES
Pursuant to the requirements of the Securities Exchange Act of 1934 and the Investment Company Act of 1940, the registrant has duly caused this report to be signed on its behalf by the undersigned, thereunto duly authorized.
| (Registrant) | Alpine Income Trust |
| By (Signature and Title)* | /s/ Samuel A. Lieber |
| | Samuel A. Lieber, President |
Pursuant to the requirements of the Securities Exchange Act of 1934 and the Investment Company Act of 1940, this report has been signed below by the following persons on behalf of the registrant and in the capacities and on the dates indicated.
| By (Signature and Title)* | /s/ Samuel A. Lieber |
| | Samuel A. Lieber, President |
| By (Signature and Title)* | /s/ Ron Palmer |
| | Ron Palmer, Chief Financial Officer |
* Print the name and title of each signing officer under his or her signature.