united states
securities and exchange commission
washington, d.c. 20549
form n-csr
certified shareholder report of registered management
investment companies
Investment Company Act file number 811-21237
Unified Series Trust
(Exact name of registrant as specified in charter)
Ultimus Fund Solutions, LLC 225 Pictoria Drive, Suite 450 Cincinnati, OH 45246
(Address of principal executive offices) (Zip code)
Zachary P. Richmond
Ultimus Fund Solutions, LLC
225 Pictoria Drive, Suite 450
Cincinnati, OH 45246
(Name and address of agent for service)
Registrant's telephone number, including area code: 513-587-3400
Date of fiscal year end: 12/31
Date of reporting period: 12/31/20
Form N-CSR is to be used by management investment companies to file reports with the Commission not later than 10 days after the transmission to stockholders of any report that is required to be transmitted to stockholders under Rule 30e-1 under the Investment Company Act of 1940 (17 CFR 270.30e-1). The Commission may use the information provided on Form N-CSR in its regulatory, disclosure review, inspection and policymaking roles.
A registrant is required to disclose the information specified by Form N-CSR, and the Commission will make this information public. A registrant is not required to respond to the collection of information contained in Form N-CSR unless the Form displays a currently valid Office of Management and Budget ("OMB") control number. Please direct comments concerning the accuracy of the information collection burden estimate and any suggestions for reducing the burden to Secretary, Securities and Exchange Commission, 450 Fifth Street, NW, Washington, DC 20549-0609. The OMB has reviewed this collection of information under the clearance requirements of 44 U.S.C. § 3507.
Item 1. Reports to Stockholders.
 | Annual Report
December 31, 2020 |
| | |
| | |
| CDGCX | Crawford Large Cap Dividend Fund
(formerly known as Crawford Dividend Growth Fund) Class C |
| | |
| CDGIX | Crawford Large Cap Dividend Fund
(formerly known as Crawford Dividend Growth Fund) Class I |
| | |
| CDOFX | Crawford Small Cap Dividend Fund
Class I |
| | |
| CMALX | Crawford Multi-Asset Income Fund |
For a prospectus and more information, including charges and expenses call (800) 431-1716. The prospectus should be read carefully before investing. Past performance does not guarantee future results. Shares when redeemed may be worth more or less than their original cost.
Distributed by Ultimus Fund Distributors, LLC
225 Pictoria Drive,
Suite 450
Cincinnati, OH 45246 | Fund Investment Adviser:
Crawford Investment Counsel, Inc.
600 Galleria Parkway SE, Suite 1650
Atlanta, Georgia 30339
www.CrawfordInvestmentFunds.com |
MANAGEMENT DISCUSSION OF FUND PERFORMANCE – (Unaudited)
At Crawford Investment Counsel, we believe that within an uncertain investment landscape, many market participants continuously underestimate the potential range of investment outcomes. In 2020, we were reminded that there is much inherent uncertainty in investing. In anticipation of environments such as this, we focus our investment approach on high-quality companies with the belief that quality characteristics enhance visibility and predictability of the portfolio, which improves the likelihood of success and reduces the potential range of investment outcomes.
Dividends are an important part of our investment philosophy and process. Dividends represent a key component of total return over time, and a consistent and growing dividend often demonstrates a company’s ability to generate a sustainable and growing cash flow stream. We believe quality and dividends are inexorably linked and look to a company’s dividend history as an initial indicator of quality.
In our view, the success or failure of any investment is primarily determined by two attributes:
| 1. | Fundamental growth in intrinsic value of a business: Our focus on high-quality companies increases the likelihood that fundamental progress of the company will be achieved year after year, continually enhancing intrinsic value in the process. |
| 2. | Valuation at time of investment: Our value orientation and price sensitivity reflect the belief that valuation is an important component of both return and risk of any investment. |
Investment Process Goals:
| ● | Identify high-quality companies with a positively skewed risk/reward trade-off. |
| ● | Invest when short-term business or market considerations impair valuation. |
| ● | Allow the company’s fundamental progress, valuation improvement, and dividend stream to contribute to the total investment return over a longer-term time horizon. |
2020 will long be remembered as one of the more unusual and difficult periods in investment history. While stocks both began and finished the year at all-time highs, the pandemic led to a recession and severe decline in equity markets. This was followed quickly by a sharp recovery, election results, and additional stimulus. The market leadership shifted from growth to value late in the year, but overall growth did better and non-dividend paying companies outperformed dividend payers across the capitalization spectrum. Amidst the greatest single quarterly contraction in the economy since the Great Depression, many companies suspended or eliminated dividend payments.
Dividend Growth Fund:
“Crawford Large Cap Dividend Fund” as of January 19th, 2021
For the year ending December 31, 2020, the Crawford Large Cap Dividend Fund Class I Shares and Class C Shares produced total returns of 7.32% and 6.26%, respectively. This compares to total returns for the same time period of 2.80% for the Fund’s primary benchmark, the Russell 1000 Value Index and 18.40% for the Fund’s secondary benchmark, the S&P 500 Index. The Fund’s outperformance relative to the primary benchmark is a reflection of superior downside protection in the stock market decline experienced in the first quarter of 2020. Also, strong contributions from the technology sector, an underweighting in the energy sector, and financial sector returns all helped relative to the primary benchmark. The detractors from relative returns compared to the primary benchmark were communication services, materials, and healthcare. For the year overall, dividend-paying companies underperformed non-dividend payers and value-oriented stocks did not keep up with growth stocks nor the S&P 500 Index.
MANAGEMENT DISCUSSION OF FUND PERFORMANCE – (Unaudited) (continued)
The strategy continues to maintain a high-quality orientation, and the adviser believes the portfolio is well positioned to obtain attractive, long-term, risk-adjusted returns.
Over our 40-year history, Crawford has found that investing in companies with strong histories of raising their dividends is a great way to identify consistency and predictability in the market. This, in turn, leads to strong protection of capital in down markets relative to both the overall market and our portfolio’s respective peer group. The Dividend Growth strategy experienced no dividend cuts or eliminations during the year, and we are encouraged that as we embark on 2021, the average holding within the strategy is paying a higher dividend than last year. The dividend integrity displayed by our portfolio’s businesses contrasts with what is taking place broadly in this destabilized financial environment. We believe that this commitment to quality, which begins with a company’s dividend history, has helped lead to solid investment results over time.
Small Cap Dividend Fund:
For the year ending December 31, 2020, the Crawford Small Cap Dividend Fund Class I Shares produced a total return of 3.50%. For the same period, this compares to a total return of 19.96% for the Fund’s benchmark, the Russell 2000 Index.
During 2020, the Fund’s value tilt and quality bias did not help as growth stocks, non-dividend paying small caps, and lower quality companies performed better. In fact, the return disparity between Russell 2000 dividend payers and Russell 2000 non-dividend payers was approximately 40% in 2020. The best contributing sectors on a relative basis, compared to the Fund’s primary benchmark, were energy, communications services, and real estate. The worst relative contributions compared to the Fund’s primary benchmark came from consumer discretionary, healthcare and information technology.
The adviser believes the Fund’s quality-focused, bottom-up investment process aligns well with the objectives of the fund, and expects that the fund is positioned to continue to benefit from an information advantage in smaller company stocks and a behavioral bias among investors against more consistent, predictable, dividend-paying companies with smaller market capitalizations.
Multi-Asset Income Fund:
For the year ending December 31, 2020, the Crawford Multi-Asset Income Fund produced a total return of -7.00%. For the same time period, this compares to a total return of -13.99% for the Fund’s benchmark, the NASDAQ U.S. Multi-Asset Diversified Income Index. The advisor attributes the outperformance to superior security selection within the higher yielding opportunity set, risk management, and maintaining a high level of current income.
The Crawford Multi-Asset Income Fund’s portfolio management process is oriented toward generating a high level of current income. In order to achieve the desired yield, the Fund accepts and manages four sources of risk. These four risks are 1) Stock market risk, 2) Interest rate risk, 3) Energy price risk, and 4) Credit risk. Allocations to various asset categories such as high-dividend equities, preferred stocks, corporate bonds, real estate investment trusts, and energy infrastructure companies will vary over time as changes occur in individual security pricing and based on the overall income opportunity set. The adviser believes that the income-producing ability of the portfolio is intact and will continue to serve shareholders well going forward.
CONCLUSION: The world is uncertain and the advisor believes that many investors underestimate the potential range of outcomes. 2020 brought a pandemic, bear market and swift recovery that were virtually unpredictable. The events are a reminder that quality can help overcome the inherent uncertainty associated with investing. The advisor will continue to identify high-quality companies with a balanced risk/reward trade-off, and will attempt to invest in these companies when valuations are attractive. This should enable participation in up markets and protection in down markets. Investing in quality over the long term has proven to be an effective means of achieving investment objectives, and we expect it will be in the future.
INVESTMENT RESULTS – (Unaudited)
| Average Annual Total Returns (a) |
| (for the periods ended December 31, 2020) |
| | | | | |
| | Crawford Large Cap | | | | | |
| | Dividend Fund | | | | | |
| | | | | | Russell 1000® | | S&P 500® | |
| | Class I | | Class C (b) | | Value Index (c) | | Index (c) | |
| One Year | 7.32% | | 6.26% | | 2.80% | | 18.40% | |
| Five Year | 11.85% | | 10.73% | | 9.74% | | 15.22% | |
| Ten Year | 9.54% | | 8.45% | | 10.50% | | 13.88% | |
| | | | | | | | | |
| | Expense Ratios (d) | | | | | |
| | Class I | | Class C | | | | | |
| Gross | 0.98% | | 1.98% | | | | | |
| With Applicable Waivers | 0.98% | | 1.98% | | | | | |
The performance quoted represents past performance, which does not guarantee future results. The investment return and principal value of an investment will fluctuate so that an investor’s shares, when redeemed, may be worth more or less than their original cost. The returns shown do not reflect deduction of taxes that a shareholder would pay on Crawford Large Cap Dividend Fund (the “Fund”), formerly Crawford Dividend Growth Fund, distributions or the redemption of Fund shares. Current performance of the Fund may be lower or higher than the performance quoted. The Fund’s investment objectives, risks, charges and expenses must be considered carefully before investing. Performance data current to the most recent month end may be obtained by calling (800) 431-1716.
The Fund’s investment objectives, risks, charges and expenses must be considered carefully before investing. The prospectus and summary prospectus contain this and other important information about the Fund and may be obtained by calling the same number as above. Please read it carefully before investing.
| (a) | The average annual total returns set forth above include all waivers of fees for various periods since inception. Without such fee waivers, the total returns would have been lower. Total returns shown assume reinvestment of all capital gains and dividend distributions and reflect any changes in price per share. |
| (b) | Class C shares are sold with no initial sales charge, but are subject to a Contingent Deferred Sales Charge (CDSC) of 1.00% if redeemed within one year of purchase and an annual 12b-1 fee of 1.00%. |
| (c) | The Russell 1000® Value Index and the S&P 500® Index are widely recognized unmanaged indices of equity prices and are representative of a broader market and range of securities than are found in the Fund’s portfolio. Index returns do not reflect the deduction of expenses, which have been deducted from the Fund’s returns. Index returns assume reinvestment of all distributions and do not reflect the deduction of taxes and fees. Individuals cannot invest directly in an Index; however, an individual may invest in exchange-traded funds or other investment vehicles that attempt to track the performance of a benchmark index. |
| (d) | The expense ratios reflect information from the Fund’s prospectus dated April 29, 2020, as amended November 19, 2020. In the fiscal year ended December 31, 2019, Crawford Investment Counsel, Inc. (the “Adviser”) waived less than 0.01% of its management fee. The Adviser contractually has agreed to waive its management fee and/or reimburse expenses so that total annual operating expenses, excluding portfolio transaction and other investment-related costs (including brokerage fees and commissions); taxes; borrowing costs (such as interest and dividend expenses on securities sold short); acquired fund fees and expenses; fees and expenses associated with investments inother collective investment vehicles or derivative instruments (including for example option and swap fees and expenses); any amounts payable pursuant to a distribution or service plan adopted in accordance with Rule 12b-1 under the Investment Company Act of 1940; any administrative and/or shareholder servicing fees payable pursuant to a plan adopted by the Board of Trustees; expenses incurred in connection with any merger or reorganization; extraordinary expenses (such as litigation expenses, indemnification of Trust officers and Trustees and contractual indemnification of Fund service providers); and other expenses that the Trustees agree have not been incurred in the ordinary course of the Fund’s business, do not exceed 0.98% through April 30, 2021. This expense cap may not be terminated prior to this date except by the Board of Trustees. Each waiver/expense payment by the Adviser is subject to recoupment by the Adviser from the Fund in the three years following the date the particular waiver/expense payment occurred, but only if such recoupment can be achieved without exceeding the annual expense limitation in effect at the time of the waiver/expense payment and any expense limitation in effect at the time of the recoupment. Additional information pertaining to the Fund’s expense ratios as of December 31, 2020 can be found in the financial highlights. |
The Fund is distributed by Ultimus Fund Distributors, LLC, member FINRA/SIPC.
INVESTMENT RESULTS – (Unaudited) (continued)
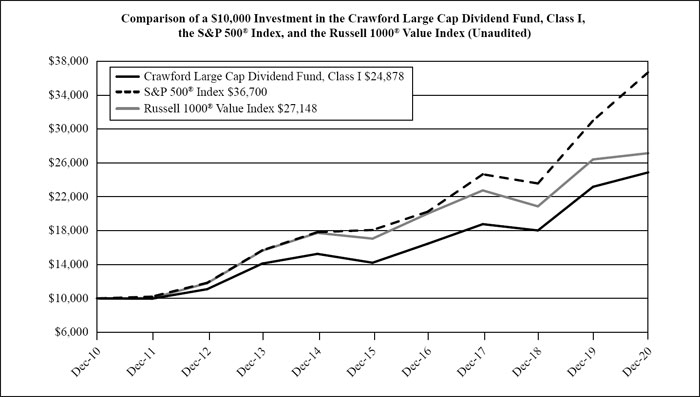
The chart above assumes an initial investment of $10,000 made on December 31, 2010 and held through December 31, 2020. THE FUND’S RETURN REPRESENTS PAST PERFORMANCE AND DOES NOT GUARANTEE FUTURE RESULTS. The S&P 500® Index and the Russell 1000® Value Index are widely recognized unmanaged indices of equity prices and are representative of a broader market and range of securities than are found in the Fund’s portfolio. The returns shown do not reflect deduction of taxes that a shareholder would pay on Fund distributions or the redemption of Fund shares. Investment returns and principal values will fluctuate so that your shares, when redeemed, may be worth more or less than their original purchase price.
Current performance may be lower or higher than the performance data quoted. For more information on the Fund, to obtain performance data current to the most recent month end, or to obtain a prospectus or summary prospectus, please call (800) 431-1716. The Fund’s prospectus and summary prospectus contains important information about the Fund’s investment objectives, potential risks, management fees, charges and expenses, and other information. Please read the prospectus or summary prospectus carefully before you invest or send money.
The Fund is distributed by Ultimus Fund Distributors, LLC, member FINRA/SIPC.
INVESTMENT RESULTS – (Unaudited) (continued)
| Average Annual Total Returns (a) |
| (for the periods ended December 31, 2020) |
| | |
| | Crawford Small Cap Dividend Fund | | Russell 2000® | |
| | Class I | | Index (b) | |
| One Year | 3.50% | | 19.96% | |
| Five Year | 10.91% | | 13.26% | |
| Since Inception (9/26/12) | 11.38% | | 12.54% | |
| | | | | |
| | Expense Ratios (c) | | | |
| Gross | 1.17% | | | |
| With Applicable Waivers | 0.99% | | | |
The performance quoted represents past performance, which does not guarantee future results. The investment return and principal value of an investment will fluctuate so that an investor’s shares, when redeemed, may be worth more or less than their original cost. The returns shown do not reflect deduction of taxes that a shareholder would pay on Crawford Small Cap Dividend Fund (the “Fund”), distributions or the redemption of Fund shares. Current performance of the Fund may be lower or higher than the performance quoted. The Fund’s investment objectives, risks, charges and expenses must be considered carefully before investing. Performance data current to the most recent month end may be obtained by calling (800) 431-1716.
The Fund’s investment objectives, risks, charges and expenses must be considered carefully before investing. The prospectus and summary prospectus contain this and other important information about the Fund and may be obtained by calling the same number as above. Please read it carefully before investing.
| (a) | The average annual total returns set forth above include all waivers of fees for various periods since inception. Without such fee waivers, the total returns would have been lower. Total returns shown assume reinvestment of all capital gains and dividend distributions and reflect any changes in price per share. |
| (b) | The Russell 2000® Index is a widely recognized unmanaged index of equity prices and is representative of a broader market and range of securities than are found in the Fund’s portfolio. Index returns do not reflect the deduction of expenses, which have been deducted from the Fund’s returns. Index returns assume reinvestment of all distributions and do not reflect the deduction of taxes and fees. Individuals cannot invest directly in an index; however, an individual may invest in exchange-traded funds or other investment vehicles that attempt to track the performance of a benchmark index. |
| (c) | The expense ratios reflect information from the Fund’s prospectus dated April 29, 2020. The Adviser contractually has agreed to waive its management fee and/or reimburse expenses so that total annual operating expenses, excluding portfolio transaction and other investment-related costs (including brokerage fees and commissions); taxes; borrowing costs (such as interest and dividend expenses on securities sold short); acquired fund fees and expenses; fees and expenses associated with investments in other collective investment vehicles or derivative instruments (including for example option and swap fees and expenses); any amounts payable pursuant to a distribution or service plan adopted in accordance with Rule 12b-1 under the Investment Company Act of 1940; any administrative and/or shareholder servicing fees payable pursuant to a plan adopted by the Board of Trustees; expenses incurred in connection with any merger or reorganization; extraordinary expenses (such as litigation expenses, indemnification of Trust officers and Trustees and contractual indemnification of Fund service providers); and other expenses that the Trustees agree have not been incurred in the ordinary course of the Fund’s business, do not exceed 0.99% through April 30, 2021. This expense cap may not be terminated prior to this date except by the Board of Trustees. Each waiver/expense payment by the Adviser is subject to recoupment by the Adviser from the Fund in the three years following the date the particular waiver/expense payment occurred, but only if such recoupment can be achieved without exceeding the annual expense limitation in effect at the time of the waiver/ expense payment and any expense limitation in effect at the time of the recoupment. Additional information pertaining to the Fund’s expense ratios as of December 31, 2020 can be found in the financial highlights. |
The Fund is distributed by Ultimus Fund Distributors, LLC, member FINRA/SIPC.
INVESTMENT RESULTS – (Unaudited) (continued)
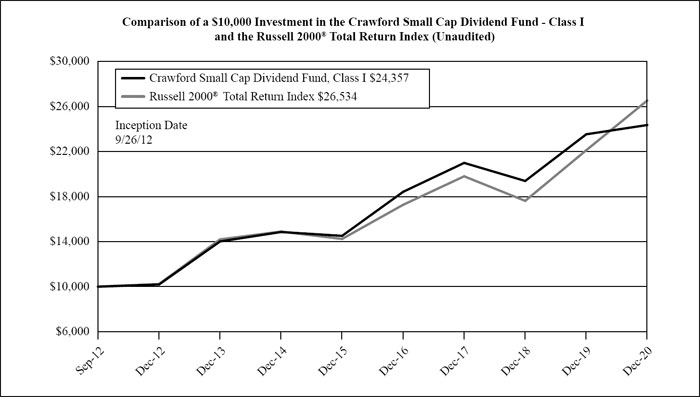
The chart above assumes an initial investment of $10,000 made on September 26, 2012 (commencement of operations) and held through December 31, 2020. THE FUND’S RETURN REPRESENTS PAST PERFORMANCE AND DOES NOT GUARANTEE FUTURE RESULTS. The Russell 2000® Index is a widely recognized unmanaged index of equity prices and is representative of a broader market and range of securities than are found in the Fund’s portfolio. The returns shown do not reflect deduction of taxes that a shareholder would pay on Fund distributions or the redemption of Fund shares. Investment returns and principal values will fluctuate so that your shares, when redeemed, may be worth more or less than their original purchase price.
Current performance may be lower or higher than the performance data quoted. For more information on the Fund, to obtain performance data current to the most recent month end, or to obtain a prospectus or summary prospectus, please call (800) 431-1716. The Fund’s prospectus and summary prospectus contains important information about the Fund’s investment objectives, potential risks, management fees, charges and expenses, and other information. Please read the prospectus or summary prospectus carefully before you invest or send money.
The Fund is distributed by Ultimus Fund Distributors, LLC, member FINRA/SIPC.
INVESTMENT RESULTS – (Unaudited) (continued)
| Average Annual Total Returns (a) |
| (for the periods ended December 31, 2020) |
| |
| | | | NASDAQ US | |
| | | | Multi-Asset | |
| | | | Diversified Income | |
| | Crawford Multi-Asset Income Fund | | IndexSM (b) | |
| One Year | -7.00% | | -13.99% | |
| Since Inception (9/12/17) | 1.94% | | -0.43% | |
| | | | | |
| | Expense Ratios (c) | | | |
| Gross | 1.33% | | | |
| With Applicable Waivers | 1.01% | | | |
The performance quoted represents past performance, which does not guarantee future results. The investment return and principal value of an investment will fluctuate so that an investor’s shares, when redeemed, may be worth more or less than their original cost. The returns shown do not reflect deduction of taxes that a shareholder would pay on Crawford Multi-Asset Income Fund (the “Fund”) distributions or the redemption of Fund shares. Current performance of the Fund may be lower or higher than the performance quoted. The Fund’s investment objectives, risks, charges and expenses must be considered carefully before investing. Performance data current to the most recent month end may be obtained by calling (800) 431-1716.
The Fund’s investment objectives, risks, charges and expenses must be considered carefully before investing. The prospectus and summary prospectus contain this and other important information about the Fund and may be obtained by calling the same number as above. Please read it carefully before investing.
| (a) | The average annual total returns set forth above include all waivers of fees for various periods since inception. Without such fee waivers, the total returns would have been lower. Total returns shown assume reinvestment of all capital gains and dividend distributions and reflect any changes in price per share. Total returns for less than one year are not annualized. |
| (b) | The NASDAQ US Multi-Asset Diversified Income Index SM is designed to provide exposure to multiple asset segments, each selected to result in a consistent and high yield. The index is comprised of securities classified as U.S. equities, U.S. Real Estate Investment Trusts, U.S. preferred securities, U.S. Master Limited Partnerships, and a high-yield corporate debt Exchange Traded Fund and is representative of a broader market and range of securities than are found in the Fund’s portfolio. Index returns do not reflect the deduction of expenses, which have been deducted from the Fund’s returns. Index returns assume reinvestment of all distributions and do not reflect the deduction of taxes and fees. Individuals cannot invest directly in an index; however, an individual may invest in exchange-traded funds or other investment vehicles that attempt to track the performance of a benchmark index. |
| (c) | The expense ratios, which include acquired fund fees and expenses of 0.01%, reflect information from the Fund’s prospectus dated April 29, 2020. Crawford Investment Counsel, Inc. (the “Adviser”) contractually has agreed to waive its management fee and/ or reimburse expenses so that total annual operating expenses, excluding portfolio transaction and other investment-related costs (including brokerage fees and commissions); taxes; borrowing costs (such as interest and dividend expenses on securities sold short); acquired fund fees and expenses; fees and expenses associated with investments in other collective investment vehicles or derivative instruments (including for example option and swap fees and expenses); any amounts payable pursuant to a distribution or service plan adopted in accordance with Rule 12b-1 under the Investment Company Act of 1940; any administrative and/or shareholder servicing fees payable pursuant to a plan adopted by the Board of Trustees; expenses incurred in connection with any merger or reorganization; extraordinary expenses (such as litigation expenses, indemnification of Trust officers and Trustees and contractual indemnification of Fund service providers); and other expenses that the Trustees agree have not been incurred in the ordinary course of the Fund’s business, do not exceed 1.00% through April 30, 2021. This expense cap may not be terminated prior to this date except by the Board of Trustees. Each waiver/expense payment by the Adviser is subject to recoupment by the Adviser from the Fund in the three years following the date the particular waiver/expense payment occurred, but only if such recoupment can be achieved without exceeding the annual expense limitation in effect at the time of the waiver/expense payment and any expense limitation in effect at the time of the recoupment. Additional information pertaining to the Fund’s expense ratios (not including acquired fund fees and expenses) as of December 31, 2020 can be found in the financial highlights. |
The Fund is distributed by Ultimus Fund Distributors, LLC, member FINRA/SIPC.
INVESTMENT RESULTS – (Unaudited) (continued)
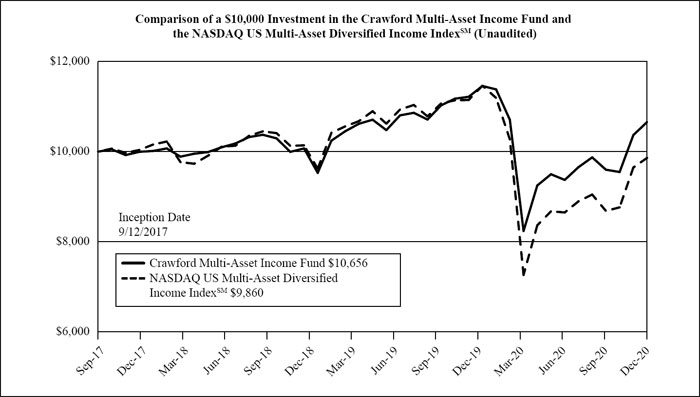
The chart above assumes an initial investment of $10,000 made on September 12, 2017 (commencement of operations) and held through December 31, 2020. THE FUND’S RETURN REPRESENTS PAST PERFORMANCE AND DOES NOT GUARANTEE FUTURE RESULTS. The NASDAQ US Multi-Asset Diversified Income Index SM is designed to provide exposure to multiple asset segments, each selected to result in a consistent and high yield. The returns shown do not reflect deduction of taxes that a shareholder would pay on Fund distributions or the redemption of Fund shares. Investment returns and principal values will fluctuate so that your shares, when redeemed, may be worth more or less than their original purchase price.
Current performance may be lower or higher than the performance data quoted. For more information on the Fund, to obtain performance data current to the most recent month end, or to obtain a prospectus or summary prospectus, please call (800) 431-1716. The Fund’s prospectus and summary prospectus contains important information about the Fund’s investment objectives, potential risks, management fees, charges and expenses, and other information. Please read the prospectus or summary prospectus carefully before you invest or send money.
The Fund is distributed by Ultimus Fund Distributors, LLC, member FINRA/SIPC.
FUND HOLDINGS – (Unaudited)
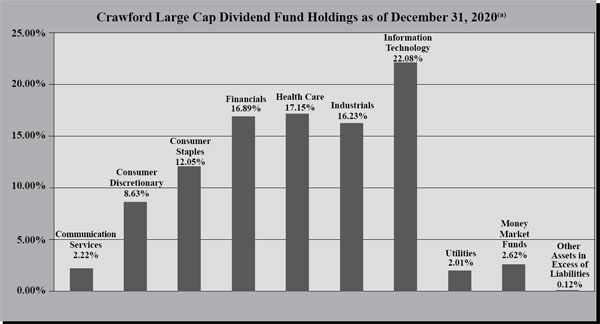
| (a) | As a percentage of net assets. |
The investment objective of the Crawford Large Cap Dividend Fund is total return. Total return is comprised of both capital appreciation and income. Under normal circumstances, the Crawford Large Cap Dividend Fund will invest at least 80% of its assets in securities of large cap companies that pay or are expected to pay regular dividends.
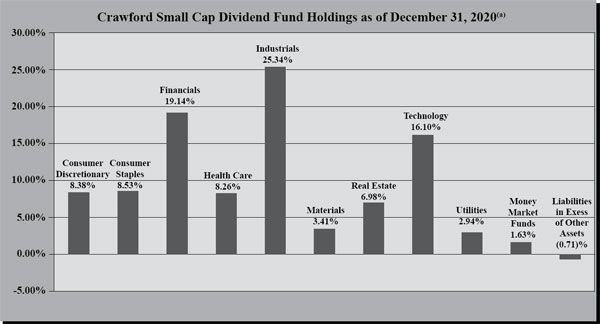
| (a) | As a percentage of net assets. |
The investment objective of the Crawford Small Cap Dividend Fund is to provide attractive long-term total return with below market risk as measured by standard deviation in comparison with the Russell 2000® Index. Total return is comprised of both capital appreciation and income.
FUND HOLDINGS – (Unaudited) (continued)
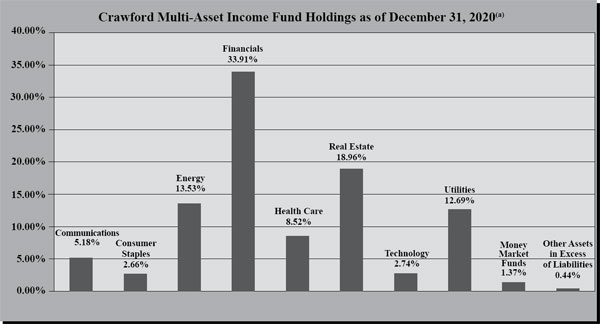
| (a) | As a percentage of net assets. |
The investment objective of the Crawford Multi-Asset Fund is to provide current income.
AVAILABILITY OF PORTFOLIO SCHEDULE – (Unaudited)
The Funds file a complete schedule of portfolio holdings with the Securities and Exchange Commission (“SEC”) for the first and third quarters as an exhibit to its reports on Form N-PORT. The Funds’ Form N-PORT reports are available on the SEC’s website at www.sec.gov.
| CRAWFORD LARGE CAP DIVIDEND FUND |
| SCHEDULE OF INVESTMENTS |
| December 31, 2020 |
| COMMON STOCKS — 97.26% | | Shares | | | Fair Value | |
| | | | | | | |
| Communications — 2.22% | | | | | | | | |
| Omnicom Group, Inc. | | | 19,110 | | | $ | 1,191,891 | |
| | | | | | | | | |
| Consumer Discretionary — 8.63% | | | | | | | | |
| Genuine Parts Co. | | | 17,170 | | | | 1,724,383 | |
| Home Depot, Inc. (The) | | | 6,960 | | | | 1,848,715 | |
| Starbucks Corp. | | | 10,000 | | | | 1,069,800 | |
| | | | | | | | 4,642,898 | |
| Consumer Staples — 12.05% | | | | | | | | |
| Coca-Cola Co. (The) | | | 26,500 | | | | 1,453,260 | |
| Colgate-Palmolive Co. | | | 11,500 | | | | 983,365 | |
| Mondelez International, Inc., Class A | | | 18,850 | | | | 1,102,160 | |
| Philip Morris International, Inc. | | | 19,250 | | | | 1,593,708 | |
| Procter & Gamble Co. (The) | | | 9,700 | | | | 1,349,657 | |
| | | | | | | | 6,482,150 | |
| Financials — 16.89% | | | | | | | | |
| American Express Co. | | | 12,900 | | | | 1,559,739 | |
| BlackRock, Inc. | | | 2,100 | | | | 1,515,234 | |
| Chubb Ltd. | | | 10,500 | | | | 1,616,160 | |
| JPMorgan Chase & Co. | | | 6,700 | | | | 851,369 | |
| Marsh & McLennan Cos., Inc. | | | 7,000 | | | | 819,000 | |
| Northern Trust Corp. | | | 12,320 | | | | 1,147,485 | |
| Willis Towers Watson PLC | | | 7,478 | | | | 1,575,465 | |
| | | | | | | | 9,084,452 | |
| Health Care — 17.15% | | | | | | | | |
| AbbVie, Inc. | | | 10,500 | | | | 1,125,075 | |
| AstraZeneca PLC - ADR | | | 28,000 | | | | 1,399,720 | |
| Cardinal Health, Inc. | | | 18,000 | | | | 964,080 | |
| Johnson & Johnson | | | 13,140 | | | | 2,067,973 | |
| Medtronic PLC | | | 15,000 | | | | 1,757,100 | |
| Merck & Co., Inc. | | | 18,920 | | | | 1,547,656 | |
| Stryker Corp. | | | 1,500 | | | | 367,560 | |
| | | | | | | | 9,229,164 | |
See accompanying notes which are an integral part of these financial statements.
| CRAWFORD LARGE CAP DIVIDEND FUND |
| SCHEDULE OF INVESTMENTS – (continued) |
| December 31, 2020 |
| COMMON STOCKS — 97.26% (continued) | | Shares | | | Fair Value | |
| | | | | | | |
| Industrials — 16.23% | | | | | | | | |
| 3M Co. | | | 4,000 | | | $ | 699,160 | |
| Honeywell International, Inc. | | | 9,500 | | | | 2,020,650 | |
| Hubbell, Inc. | | | 7,440 | | | | 1,166,518 | |
| Johnson Controls International PLC | | | 29,300 | | | | 1,365,087 | |
| Raytheon Technologies Corp. | | | 12,500 | | | | 893,875 | |
| United Parcel Service, Inc., Class B | | | 12,930 | | | | 2,177,412 | |
| W.W. Grainger, Inc. | | | 1,000 | | | | 408,340 | |
| | | | | | | | 8,731,042 | |
| Technology — 22.08% | | | | | | | | |
| Accenture PLC, Class A | | | 5,840 | | | | 1,525,466 | |
| Fidelity National Information Services, Inc. | | | 5,000 | | | | 707,300 | |
| International Business Machines Corp. | | | 8,000 | | | | 1,007,040 | |
| Microsoft Corp. | | | 10,370 | | | | 2,306,495 | |
| Paychex, Inc. | | | 13,750 | | | | 1,281,225 | |
| S&P Global, Inc. | | | 3,600 | | | | 1,183,428 | |
| SAP SE - ADR | | | 7,500 | | | | 977,925 | |
| Texas Instruments, Inc. | | | 13,350 | | | | 2,191,136 | |
| Visa, Inc., Class A | | | 3,200 | | | | 699,936 | |
| | | | | | | | 11,879,951 | |
| Utilities — 2.01% | | | | | | | | |
| American Electric Power Co., Inc. | | | 13,000 | | | | 1,082,510 | |
| | | | | | | | | |
| Total Common Stocks (Cost $30,372,427) | | | | | | | 52,324,058 | |
| | | | | | | | | |
| MONEY MARKET FUNDS — 2.62% | | | | | | | | |
| Federated Hermes Treasury Obligations Fund, Institutional Shares, 0.01%(a) | | | 1,411,289 | | | | 1,411,289 | |
| | | | | | | | | |
| Total Money Market Funds (Cost $1,411,289) | | | | | | | 1,411,289 | |
| Total Investments — 99.88% (Cost $31,783,716) | | | | | | | 53,735,347 | |
| Other Assets in Excess of Liabilities — 0.12% | | | | | | | 65,810 | |
| NET ASSETS — 100.00% | | | | | | $ | 53,801,157 | |
| (a) | Rate disclosed is the seven day effective yield as of December 31, 2020. |
ADR - American Depositary Receipt.
See accompanying notes which are an integral part of these financial statements.
| CRAWFORD SMALL CAP DIVIDEND FUND |
| SCHEDULE OF INVESTMENTS |
| December 31, 2020 |
| COMMON STOCKS — 99.08% | | Shares | | | Fair Value | |
| | | | | | | |
| Consumer Discretionary — 8.38% | | | | | | | | |
| Carter’s, Inc. | | | 31,574 | | | $ | 2,970,166 | |
| Choice Hotels International, Inc. | | | 11,503 | | | | 1,227,715 | |
| Columbia Sportswear Co. | | | 28,200 | | | | 2,464,116 | |
| Gildan Activewear, Inc. | | | 116,500 | | | | 3,263,165 | |
| Leggett & Platt, Inc. | | | 67,843 | | | | 3,005,445 | |
| Monro, Inc. | | | 80,648 | | | | 4,298,538 | |
| Wolverine World Wide, Inc. | | | 170,499 | | | | 5,328,094 | |
| | | | | | | | 22,557,239 | |
| Consumer Staples — 8.53% | | | | | | | | |
| Casey’s General Stores, Inc. | | | 28,995 | | | | 5,179,087 | |
| Core-Mark Holding Co., Inc. | | | 93,528 | | | | 2,746,917 | |
| Flowers Foods, Inc. | | | 191,461 | | | | 4,332,762 | |
| J&J Snack Foods Corp. | | | 17,578 | | | | 2,731,094 | |
| MGP Ingredients, Inc. | | | 52,699 | | | | 2,480,015 | |
| PriceSmart, Inc. | | | 60,198 | | | | 5,483,436 | |
| | | | | | | | 22,953,311 | |
| Financials — 19.14% | | | | | | | | |
| BancFirst Corp. | | | 60,660 | | | | 3,560,742 | |
| Bryn Mawr Bank Corp. | | | 84,055 | | | | 2,571,663 | |
| First Hawaiian, Inc. | | | 133,400 | | | | 3,145,572 | |
| First of Long Island Corp. (The) | | | 145,183 | | | | 2,591,517 | |
| Glacier Bancorp, Inc. | | | 65,977 | | | | 3,035,602 | |
| Hanover Insurance Group, Inc. | | | 45,472 | | | | 5,316,586 | |
| Houlihan Lokey, Inc. | | | 39,107 | | | | 2,629,164 | |
| Lazard Ltd., Class A | | | 62,239 | | | | 2,632,710 | |
| Mercury General Corp. | | | 55,700 | | | | 2,908,097 | |
| Old Republic International Corp. | | | 285,718 | | | | 5,631,502 | |
| South State Corp. | | | 54,940 | | | | 3,972,162 | |
| Sterling Bancorp | | | 234,320 | | | | 4,213,074 | |
| Trico Bancshares | | | 134,977 | | | | 4,761,988 | |
| Valley National Bancorp | | | 467,456 | | | | 4,557,695 | |
| | | | | | | | 51,528,074 | |
| Health Care — 8.26% | | | | | | | | |
| Atrion Corp. | | | 6,039 | | | | 3,878,487 | |
| Cantel Medical Corp. | | | 63,443 | | | | 5,003,115 | |
| CONMED Corp. | | | 43,885 | | | | 4,915,120 | |
| Luminex Corp. | | | 188,840 | | | | 4,365,981 | |
| Psychemedics Corp. | | | 242,076 | | | | 1,232,167 | |
| U.S. Physical Therapy, Inc. | | | 23,713 | | | | 2,851,488 | |
| | | | | | | | 22,246,358 | |
See accompanying notes which are an integral part of these financial statements.
| CRAWFORD SMALL CAP DIVIDEND FUND |
| SCHEDULE OF INVESTMENTS – (continued) |
| December 31, 2020 |
| COMMON STOCKS — 99.08% (continued) | | Shares | | | Fair Value | |
| | | | | | | |
| Industrials — 25.34% | | | | | | | | |
| ESCO Technologies, Inc. | | | 46,434 | | | $ | 4,792,917 | |
| Franklin Electric Co., Inc. | | | 56,318 | | | | 3,897,769 | |
| Hackett Group, Inc. | | | 347,404 | | | | 4,999,143 | |
| Healthcare Services Group, Inc. | | | 161,535 | | | | 4,539,134 | |
| Hubbell, Inc. | | | 17,900 | | | | 2,806,541 | |
| Kaman Corp. | | | 64,393 | | | | 3,678,772 | |
| Landstar System, Inc. | | | 17,718 | | | | 2,385,906 | |
| Littelfuse, Inc. | | | 20,902 | | | | 5,322,904 | |
| Moog, Inc., Class A | | | 53,872 | | | | 4,272,049 | |
| MSC Industrial Direct Co., Inc., Class A | | | 47,357 | | | | 3,996,458 | |
| Mueller Water Products, Inc., Series A | | | 404,851 | | | | 5,012,056 | |
| National Instruments Corp. | | | 114,679 | | | | 5,038,995 | |
| nVent Electric PLC | | | 200,622 | | | | 4,672,486 | |
| Standex International, Inc. | | | 38,000 | | | | 2,945,760 | |
| Valmont Industries, Inc. | | | 24,141 | | | | 4,222,985 | |
| Watsco, Inc. | | | 6,759 | | | | 1,531,251 | |
| Woodward, Inc. | | | 33,690 | | | | 4,094,346 | |
| | | | | | | | 68,209,472 | |
| Materials — 3.41% | | | | | | | | |
| Cameco Corp. | | | 212,331 | | | | 2,845,235 | |
| Compass Minerals International, Inc. | | | 39,958 | | | | 2,466,208 | |
| HB Fuller Co. | | | 74,804 | | | | 3,880,832 | |
| | | | | | | | 9,192,275 | |
| Real Estate — 6.98% | | | | | | | | |
| American Campus Communities, Inc. | | | 46,833 | | | | 2,003,047 | |
| Armada Hoffler Properties, Inc. | | | 109,184 | | | | 1,225,044 | |
| CoreSite Realty Corp. | | | 26,909 | | | | 3,371,160 | |
| Four Corners Property Trust, Inc. | | | 91,401 | | | | 2,721,008 | |
| Independence Realty Trust, Inc. | | | 187,151 | | | | 2,513,438 | |
| Physicians Realty Trust | | | 121,592 | | | | 2,164,338 | |
| Piedmont Office Realty Trust, Inc., Class A | | | 152,575 | | | | 2,476,292 | |
| STAG Industrial, Inc. | | | 73,817 | | | | 2,311,948 | |
| | | | | | | | 18,786,275 | |
See accompanying notes which are an integral part of these financial statements.
| CRAWFORD SMALL CAP DIVIDEND FUND |
| SCHEDULE OF INVESTMENTS – (continued) |
| December 31, 2020 |
| COMMON STOCKS — 99.08% (continued) | | Shares | | | Fair Value | |
| | | | | | | |
| Technology — 16.10% | | | | | | | | |
| American Software, Inc., Class A | | | 322,737 | | | $ | 5,541,395 | |
| Avnet, Inc. | | | 79,804 | | | | 2,801,918 | |
| Brooks Automation, Inc. | | | 74,127 | | | | 5,029,517 | |
| Cass Information Systems, Inc. | | | 106,467 | | | | 4,142,631 | |
| Computer Programs & Systems, Inc. | | | 137,571 | | | | 3,692,406 | |
| Pegasystems, Inc. | | | 29,405 | | | | 3,918,510 | |
| Power Integrations, Inc. | | | 66,514 | | | | 5,444,836 | |
| Sapiens International Corp. NV | | | 116,458 | | | | 3,564,779 | |
| Simulations Plus, Inc. | | | 66,260 | | | | 4,765,419 | |
| TTEC Holdings, Inc. | | | 60,906 | | | | 4,441,875 | |
| | | | | | | | 43,343,286 | |
| Utilities — 2.94% | | | | | | | | |
| Black Hills Corp. | | | 86,552 | | | | 5,318,620 | |
| IDACORP, Inc. | | | 27,000 | | | | 2,592,810 | |
| | | | | | | | 7,911,430 | |
| Total Common Stocks (Cost $216,114,397) | | | | | | | 266,727,720 | |
| | | | | | | | | |
| MONEY MARKET FUNDS — 1.63% | | | | | | | | |
| Federated Hermes Treasury Obligations Fund, Institutional Shares, 0.01%(a) | | | 4,398,362 | | | | 4,398,362 | |
| | | | | | | | | |
| Total Money Market Funds (Cost $4,398,362) | | | | | | | 4,398,362 | |
| Total Investments — 100.71% (Cost $220,512,759) | | | | | | | 271,126,082 | |
| Liabilities in Excess of Other Assets — (0.71)% | | | | | | | (1,899,482 | ) |
| NET ASSETS — 100.00% | | | | | | $ | 269,226,600 | |
| (a) | Rate disclosed is the seven day effective yield as of December 31, 2020. |
See accompanying notes which are an integral part of these financial statements.
| CRAWFORD MULTI-ASSET INCOME FUND |
| SCHEDULE OF INVESTMENTS |
| December 31, 2020 |
| COMMON STOCKS — 56.97% | | Shares | | | Fair Value | |
| | | | | | | |
| Communications — 5.18% | | | | | | | | |
| AT&T, Inc. | | | 70,000 | | | $ | 2,013,200 | |
| BCE, Inc. | | | 51,080 | | | | 2,186,224 | |
| Verizon Communications, Inc. | | | 22,120 | | | | 1,299,550 | |
| | | | | | | | 5,498,974 | |
| Consumer Staples — 2.66% | | | | | | | | |
| Philip Morris International, Inc. | | | 34,050 | | | | 2,819,000 | |
| | | | | | | | | |
| Energy — 9.44% | | | | | | | | |
| Kinder Morgan, Inc. | | | 169,880 | | | | 2,322,260 | |
| ONEOK, Inc. | | | 56,440 | | | | 2,166,167 | |
| Valero Energy Corp. | | | 38,360 | | | | 2,170,025 | |
| Williams Cos., Inc. (The) | | | 167,490 | | | | 3,358,175 | |
| | | | | | | | 10,016,627 | |
| Financials — 14.24% | | | | | | | | |
| AGNC Investment Corp. | | | 204,490 | | | | 3,190,044 | |
| Huntington Bancshares, Inc. | | | 169,000 | | | | 2,134,470 | |
| New Residential Investment Corp. | | | 278,100 | | | | 2,764,314 | |
| Old Republic International Corp. | | | 122,000 | | | | 2,404,620 | |
| People’s United Financial, Inc. | | | 161,540 | | | | 2,088,712 | |
| Valley National Bancorp | | | 259,170 | | | | 2,526,907 | |
| | | | | | | | 15,109,067 | |
| Health Care — 8.52% | | | | | | | | |
| AbbVie, Inc. | | | 33,730 | | | | 3,614,170 | |
| Cardinal Health, Inc. | | | 38,650 | | | | 2,070,094 | |
| GlaxoSmithKline PLC - ADR | | | 34,050 | | | | 1,253,040 | |
| Pfizer, Inc. | | | 56,930 | | | | 2,095,593 | |
| | | | | | | | 9,032,897 | |
| Real Estate — 10.66% | | | | | | | | |
| Brandywine Realty Trust | | | 173,630 | | | | 2,067,933 | |
| Four Corners Property Trust, Inc. | | | 72,350 | | | | 2,153,860 | |
| Physicians Realty Trust | | | 123,840 | | | | 2,204,352 | |
| STAG Industrial, Inc. | | | 73,780 | | | | 2,310,790 | |
| WP Carey, Inc. | | | 36,430 | | | | 2,571,228 | |
| | | | | | | | 11,308,163 | |
| Technology — 2.74% | | | | | | | | |
| International Business Machines Corp. | | | 23,110 | | | | 2,909,087 | |
See accompanying notes which are an integral part of these financial statements.
| CRAWFORD MULTI-ASSET INCOME FUND |
| SCHEDULE OF INVESTMENTS – (continued) |
| December 31, 2020 |
| COMMON STOCKS — 56.97% (continued) | | Shares | | | Fair Value | |
| | | | | | | |
| Utilities — 3.53% | | | | | | | | |
| Duke Energy Corp. | | | 18,090 | | | $ | 1,656,320 | |
| NorthWestern Corp. | | | 35,720 | | | | 2,082,834 | |
| | | | | | | | 3,739,154 | |
| Total Common Stocks (Cost $60,850,737) | | | | | | | 60,432,969 | |
| | | | | | | | | |
| PREFERRED STOCKS — 30.68% | | | | | | | | |
| | | | | | | | | |
| Energy — 1.16% | | | | | | | | |
| Energy Transfer Operating LP, Series D, 7.63% | | | 57,530 | | | | 1,225,389 | |
| | | | | | | | | |
| Financials — 16.88% | | | | | | | | |
| Allstate Corp., Series G, 5.63% | | | 64,550 | | | | 1,831,284 | |
| Annaly Capital Management, Inc., Series F, 6.95% | | | 103,520 | | | | 2,613,880 | |
| Bank of America Corp., Series KK, 5.38% | | | 51,050 | | | | 1,394,176 | |
| Charles Schwab Corp. (The), Series D, 5.95% | | | 51,250 | | | | 1,334,550 | |
| Invesco Mortgage Capital, Inc., Series A, 7.75% | | | 14,700 | | | | 369,558 | |
| Invesco Mortgage Capital, Inc., Series C, 7.50% | | | 60,130 | | | | 1,443,120 | |
| State Street Corp., Series G, 5.35% | | | 78,180 | | | | 2,264,093 | |
| Two Harbors Investment Corp., Series B, 7.63% | | | 161,400 | | | | 3,855,845 | |
| Wells Fargo & Co., Series L, 7.50% | | | 1,850 | | | | 2,808,115 | |
| | | | | | | | 17,914,621 | |
| Real Estate — 8.30% | | | | | | | | |
| Digital Realty Trust, Inc., Series L, 5.20% | | | 102,150 | | | | 2,788,695 | |
| Hersha Hospitality Trust, Series D, 6.50% | | | 66,910 | | | | 1,259,915 | |
| Monmouth Real Estate Investment Corp., Series C, 6.13% | | | 79,840 | | | | 2,003,984 | |
| Vornado Realty Trust, Series M, 5.25% | | | 104,150 | | | | 2,745,394 | |
| | | | | | | | 8,797,988 | |
| Utilities — 4.34% | | | | | | | | |
| Nisource, Inc., Series B, 6.50% | | | 63,250 | | | | 1,801,993 | |
| Sempra Energy, 5.75% | | | 33,400 | | | | 949,562 | |
| Spire, Inc., Series A, 5.90% | | | 66,580 | | | | 1,846,929 | |
| | | | | | | | 4,598,484 | |
| Total Preferred Stocks (Cost $30,975,526) | | | | | | | 32,536,482 | |
See accompanying notes which are an integral part of these financial statements.
| CRAWFORD MULTI-ASSET INCOME FUND |
| SCHEDULE OF INVESTMENTS – (continued) |
| December 31, 2020 |
| | | Principal | | | | |
| CORPORATE BONDS — 10.54% | | Amount | | | Fair Value | |
| | | | | | | |
| Energy — 2.93% | | | | | | | | |
| Transcanada Trust, 5.63%, 5/20/2075 | | $ | 2,830,000 | | | $ | 3,108,381 | |
| | | | | | | | | |
| Financials — 2.79% | | | | | | | | |
| American Express Co., 3.65%, Perpetual (3MO LIBOR + 342.8bps)(a) | | | 2,975,000 | | | | 2,960,125 | |
| | | | | | | | | |
| Utilities — 4.82% | | | | | | | | |
| Centerpoint Energy, Inc. , Series A, 6.13%, Perpetual | | | 1,920,000 | | | | 2,012,184 | |
| Southern Co. (The) , Series B, 5.50%, 3/15/2057 | | | 2,975,000 | | | | 3,093,798 | |
| | | | | | | | 5,105,982 | |
| Total Corporate Bonds (Cost $10,101,727) | | | | | | | 11,174,488 | |
| | | | | | | | | |
| MONEY MARKET FUNDS — 1.37% | | | | | | | | |
| Federated Hermes Treasury Obligations Fund, Institutional Shares, 0.01%(b) | | | 1,449,046 | | | | 1,449,046 | |
| | | | | | | | | |
| Total Money Market Funds (Cost $1,449,046) | | | | | | | 1,449,046 | |
| Total Investments — 99.56% (Cost $103,377,036) | | | | | | | 105,592,985 | |
| Other Assets in Excess of Liabilities — 0.44% | | | | | | | 463,310 | |
| NET ASSETS — 100.00% | | | | | | $ | 106,056,295 | |
| (a) | Variable rate security. The rate shown is the effective interest rate as of December 31, 2020. The benchmark on which the rate is calculated is shown parenthetically. |
| (b) | Rate disclosed is the seven day effective yield as of December 31, 2020. |
ADR - American Depositary Receipt.
See accompanying notes which are an integral part of these financial statements.
| CRAWFORD FUNDS |
| STATEMENTS OF ASSETS AND LIABILITIES |
| December 31, 2020 |
| | | Crawford | | | Crawford | | | Crawford | |
| | | Large Cap | | | Small Cap | | | Multi-Asset | |
| | | Dividend Fund | | | Dividend Fund | | | Income Fund | |
| Assets | | | | | | | | | | | | |
| Investments in securities at value (cost $31,783,716, $220,512,759 and $103,377,036) | | $ | 53,735,347 | | | $ | 271,126,082 | | | $ | 105,592,985 | |
| Receivable for fund shares sold | | | 1,975 | | | | 101,421 | | | | 85,000 | |
| Receivable for investments sold | | | — | | | | 121,437 | | | | — | |
| Dividends and interest receivable | | | 115,461 | | | | 308,725 | | | | 480,072 | |
| Prepaid expenses | | | 14,229 | | | | 21,988 | | | | 6,119 | |
| Total Assets | | | 53,867,012 | | | | 271,679,653 | | | | 106,164,176 | |
| | | | | | | | | | | | | |
| Liabilities | | | | | | | | | | | | |
| Payable for fund shares redeemed | | | — | | | | 1,704,044 | | | | — | |
| Payable for investments purchased | | | — | | | | 504,995 | | | | — | |
| Payable to Adviser | | | 25,178 | | | | 189,882 | | | | 67,858 | |
| 12b-1 fees accrued - Class C | | | 7,690 | | | | — | | | | — | |
| Payable to Administrator | | | 8,439 | | | | 18,628 | | | | 10,019 | |
| Payable to trustees | | | 3,266 | | | | 3,266 | | | | 3,266 | |
| Other accrued expenses | | | 21,282 | | | | 32,238 | | | | 26,738 | |
| Total Liabilities | | | 65,855 | | | | 2,453,053 | | | | 107,881 | |
| Net Assets | | $ | 53,801,157 | | | $ | 269,226,600 | | | $ | 106,056,295 | |
| | | | | | | | | | | | | |
| Net Assets consist of: | | | | | | | | | | | | |
| Paid-in capital | | | 31,759,736 | | | | 222,725,717 | | | | 111,685,292 | |
| Accumulated earnings (deficit) | | | 22,041,421 | | | | 46,500,883 | | | | (5,628,997 | ) |
| Net Assets | | $ | 53,801,157 | | | $ | 269,226,600 | | | $ | 106,056,295 | |
See accompanying notes which are an integral part of these financial statements.
| CRAWFORD FUNDS |
| STATEMENTS OF ASSETS AND LIABILITIES – (continued) |
| December 31, 2020 |
| | | Crawford | | | Crawford | | | Crawford | |
| | | Large Cap | | | Small Cap | | | Multi-Asset | |
| | | Dividend Fund | | | Dividend Fund | | | Income Fund | |
| Class I | | | | | | | | | | | | |
| Net Assets | | $ | 50,750,853 | | | $ | 269,226,600 | | | | | |
| Shares outstanding (unlimited number of shares authorized, no par value) | | | 4,080,953 | | | | 6,338,095 | | | | | |
| Net asset value (“NAV”) and offering price per share | | $ | 12.44 | | | $ | 42.48 | | | | | |
| | | | | | | | | | | | | |
| Class C | | | | | | | | | | | | |
| Net Assets | | $ | 3,050,304 | | | | | | | | | |
| Shares outstanding (unlimited number of shares authorized, no par value) | | | 247,365 | | | | | | | | | |
| Net asset value (“NAV”) and offering price per share | | $ | 12.33 | | | | | | | | | |
| Net Assets | | | | | | | | | | $ | 106,056,295 | |
| Shares outstanding (unlimited number of shares authorized, no par value) | | | | | | | | | | | 4,609,267 | |
| Net asset value (“NAV”) and offering price per share | | | | | | | | | | $ | 23.01 | |
See accompanying notes which are an integral part of these financial statements.
| CRAWFORD FUNDS |
| STATEMENTS OF OPERATIONS |
| For the year ended December 31, 2020 |
| | | Crawford | | | Crawford | | | Crawford | |
| | | Large Cap | | | Small Cap | | | Multi-Asset | |
| | | Dividend Fund | | | Dividend Fund | | | Income Fund | |
| Investment Income | | | | | | | | | | | | |
| Dividend income | | $ | 1,409,879 | | | $ | 5,435,821 | | | $ | 3,725,340 | |
| Interest income | | | — | | | | — | | | | 660,337 | |
| Foreign dividend taxes withheld | | | (32,989 | ) | | | (11,142 | ) | | | (24,658 | ) |
| Total investment income | | | 1,376,890 | | | | 5,424,679 | | | | 4,361,019 | |
| | | | | | | | | | | | | |
| Expenses | | | | | | | | | | | | |
| Adviser | | | 244,056 | | | | 2,210,070 | | | | 934,136 | |
| Fund accounting | | | 40,554 | | | | 54,359 | | | | 39,161 | |
| 12b-1 fees- Class C | | | 32,540 | | | | 2,240 | | | | — | |
| Administration | | | 30,010 | | | | 132,782 | | | | 58,132 | |
| Registration | | | 28,445 | | | | 30,497 | | | | 14,104 | |
| Transfer agent | | | 26,662 | | | | 24,458 | | | | 17,836 | |
| Audit and tax preparation | | | 18,404 | | | | 18,403 | | | | 19,392 | |
| Legal | | | 18,379 | | | | 18,379 | | | | 18,378 | |
| Compliance services | | | 13,282 | | | | 13,282 | | | | 13,282 | |
| Trustee | | | 12,559 | | | | 12,559 | | | | 12,559 | |
| Custodian | | | 7,125 | | | | 27,369 | | | | 12,230 | |
| Insurance | | | 2,992 | | | | 5,260 | | | | 3,524 | |
| Report printing | | | 2,790 | | | | 13,951 | | | | 3,164 | |
| Pricing | | | 1,023 | | | | 2,392 | | | | 2,408 | |
| Miscellaneous | | | 19,900 | | | | 32,623 | | | | 24,076 | |
| Total expenses | | | 498,721 | | | | 2,598,624 | | | | 1,172,382 | |
| | | | | | | | | | | | | |
| Recoupment of prior expenses waived by Adviser | | | 12,546 | | | | — | | | | — | |
| Fees contractually waived by Adviser | | | — | | | | (386,201 | ) | | | (238,010 | ) |
| Net operating expenses | | | 511,267 | | | | 2,212,423 | | | | 934,372 | |
| Net investment income | | | 865,623 | | | | 3,212,256 | | | | 3,426,647 | |
| | | | | | | | | | | | | |
| Net Realized and Change in Unrealized Gain (Loss) on Investments | | | | | | | | | | | | |
| Net realized gain (loss) on investment securities transactions | | | 2,920,470 | | | | (3,819,195 | ) | | | (7,797,201 | ) |
| Net change in unrealized appreciation (depreciation) of investment securities and translation of assets and liabilities in foreign currency | | | (323,453 | ) | | | 12,326,703 | | | | (816,582 | ) |
| | | | | | | | | | | | | |
| Net realized and change in unrealized gain (loss) on investments and foreign currency | | | 2,597,017 | | | | 8,507,508 | | | | (8,613,783 | ) |
| | | | | | | | | | | | | |
| Net increase (decrease) in net assets resulting from operations | | $ | 3,462,640 | | | $ | 11,719,764 | | | $ | (5,187,136 | ) |
See accompanying notes which are an integral part of these financial statements.
| CRAWFORD FUNDS |
| STATEMENTS OF CHANGES IN NET ASSETS |
| | | Crawford Large Cap Dividend Fund | |
| | | For the | | | For the | |
| | | Year Ended | | | Year Ended | |
| | | December 31,
2020 | | | December 31,
2019 | |
| Increase (Decrease) in Net Assets due to: | | | | | | | | |
| Operations | | | | | | | | |
| Net investment income | | $ | 865,623 | | | $ | 745,303 | |
| Net realized gain (loss) on investment securities transactions | | | 2,920,470 | | | | (54,349 | ) |
| Net change in unrealized appreciation (depreciation) of investment securities | | | (323,453 | ) | | | 11,026,433 | |
| Net increase in net assets resulting from operations | | | 3,462,640 | | | | 11,717,387 | |
| | | | | | | | | |
| Distributions to Shareholders from | | | | | | | | |
| Earnings | | | | | | | | |
| Class I | | | (3,375,504 | ) | | | (722,448 | ) |
| Class C | | | (179,279 | ) | | | (27,304 | ) |
| Total distributions | | | (3,554,783 | ) | | | (749,752 | ) |
| | | | | | | | | |
| Capital Transactions - Class I | | | | | | | | |
| Proceeds from shares sold | | | 5,550,415 | | | | 4,812,076 | |
| Reinvestment of distributions | | | 2,938,581 | | | | 480,490 | |
| Amount paid for shares redeemed | | | (5,469,889 | ) | | | (5,150,031 | ) |
| Total Class I | | | 3,019,107 | | | | 142,535 | |
| | | | | | | | | |
| Capital Transactions - Class C | | | | | | | | |
| Proceeds from shares sold | | | 22,169 | | | | 14,996 | |
| Reinvestment of distributions | | | 178,913 | | | | 26,403 | |
| Amount paid for shares redeemed | | | (1,208,235 | ) | | | (923,744 | ) |
| Total Class C | | | (1,007,153 | ) | | | (882,345 | ) |
| Net increase (decrease) in net assets resulting from capital transactions | | | 2,011,954 | | | | (739,810 | ) |
| | | | | | | | | |
| Total Increase in Net Assets | | | 1,919,811 | | | | 10,227,825 | |
| | | | | | | | | |
| Net Assets | | | | | | | | |
| Beginning of year | | | 51,881,346 | | | | 41,653,521 | |
| End of year | | $ | 53,801,157 | | | $ | 51,881,346 | |
See accompanying notes which are an integral part of these financial statements.
| CRAWFORD FUNDS |
| STATEMENTS OF CHANGES IN NET ASSETS – (continued) |
| | | Crawford Large Cap Dividend Fund | |
| | | For the | | | For the | |
| | | Year Ended | | | Year Ended | |
| | | December 31,
2020 | | | December 31,
2019 | |
| Share Transactions - Class I | | | | | | | | |
| Shares sold | | | 464,662 | | | | 425,473 | |
| Shares issued in reinvestment of distributions | | | 243,482 | | | | 41,293 | |
| Shares redeemed | | | (463,874 | ) | | | (451,870 | ) |
| Total Class I | | | 244,270 | | | | 14,896 | |
| | | | | | | | | |
| Share Transactions - Class C | | | | | | | | |
| Shares sold | | | 1,919 | | | | 1,280 | |
| Shares issued in reinvestment of distributions | | | 14,943 | | | | 2,312 | |
| Shares redeemed | | | (107,478 | ) | | | (82,690 | ) |
| Total Class C | | | (90,616 | ) | | | (79,098 | ) |
| Net increase (decrease) in shares outstanding | | | 153,654 | | | | (64,202 | ) |
See accompanying notes which are an integral part of these financial statements.
| CRAWFORD FUNDS |
| STATEMENTS OF CHANGES IN NET ASSETS – (continued) |
| | | Crawford Small Cap Dividend Fund | |
| | | For the | | | For the | |
| | | Year Ended | | | Year Ended | |
| | | December 31,
2020 | | | December 31,
2019 | |
| Increase (Decrease) in Net Assets due to: | | | | | | | | |
| Operations | | | | | | | | |
| Net investment income | | $ | 3,212,256 | | | $ | 3,014,162 | |
| Net realized gain (loss) on investment securities transactions | | | (3,819,195 | ) | | | 10,241,847 | |
| Net change in unrealized appreciation of investment securities | | | 12,326,703 | | | | 28,111,891 | |
| Net increase in net assets resulting from operations | | | 11,719,764 | | | | 41,367,900 | |
| | | | | | | | | |
| Distributions to Shareholders from | | | | | | | | |
| Earnings | | | | | | | | |
| Class I | | | (5,284,700 | ) | | | (12,293,966 | ) |
| Class C | | | — | | | | (59,857 | ) |
| Total distributions | | | (5,284,700 | ) | | | (12,353,823 | ) |
| | | | | | | | | |
| Capital Transactions - Class I | | | | | | | | |
| Proceeds from shares sold | | | 46,445,371 | | | | 53,898,478 | |
| Reinvestment of distributions | | | 4,505,607 | | | | 8,925,353 | |
| Amount paid for shares redeemed | | | (38,138,275 | ) | | | (20,311,907 | ) |
| Total Class I | | | 12,812,703 | | | | 42,511,924 | |
| | | | | | | | | |
| Capital Transactions - Class C(a) | | | | | | | | |
| Proceeds from shares sold | | | — | | | | 1,076,850 | |
| Reinvestment of distributions | | | — | | | | 51,457 | |
| Amount paid for shares redeemed | | | (1,342,811 | ) | | | (19,010 | ) |
| Total Class C | | | (1,342,811 | ) | | | 1,109,297 | |
| Net increase in net assets resulting from capital transactions | | | 11,469,892 | | | | 43,621,221 | |
| | | | | | | | | |
| Total Increase in Net Assets | | | 17,904,956 | | | | 72,635,298 | |
| | | | | | | | | |
| Net Assets | | | | | | | | |
| Beginning of year | | | 251,321,644 | | | | 178,686,346 | |
| End of year | | $ | 269,226,600 | | | $ | 251,321,644 | |
See accompanying notes which are an integral part of these financial statements.
| CRAWFORD FUNDS |
| STATEMENTS OF CHANGES IN NET ASSETS – (continued) |
| | | Crawford Small Cap Dividend Fund | |
| | | For the | | | For the | |
| | | Year Ended | | | Year Ended | |
| | | December 31,
2020 | | | December 31,
2019 | |
| Share Transactions - Class I | | | | | | | | |
| Shares sold | | | 1,326,403 | | | | 1,327,338 | |
| Shares issued in reinvestment of distributions | | | 119,445 | | | | 213,333 | |
| Shares redeemed | | | (1,059,459 | ) | | | (492,200 | ) |
| Total Class I | | | 386,389 | | | | 1,048,471 | |
| | | | | | | | | |
| Share Transactions - Class C(a) | | | | | | | | |
| Shares sold | | | — | | | | 26,631 | |
| Shares issued in reinvestment of distributions | | | — | | | | 1,236 | |
| Shares redeemed | | | (34,893 | ) | | | (439 | ) |
| Total Class C | | | (34,893 | ) | | | 27,428 | |
| Net increase in shares outstanding | | | 351,496 | | | | 1,075,899 | |
| (a) | The Small Cap Dividend Fund Class C shares ceased operations on February 26, 2020 |
See accompanying notes which are an integral part of these financial statements.
| CRAWFORD FUNDS |
| STATEMENTS OF CHANGES IN NET ASSETS – (continued) |
| | | Crawford Multi-Asset Income Fund | |
| | | For the | | | For the | |
| | | Year Ended | | | Year Ended | |
| | | December 31,
2020 | | | December 31,
2019 | |
| Increase (Decrease) in Net Assets due to: | | | | | | | | |
| Operations | | | | | | | | |
| Net investment income | | $ | 3,426,647 | | | $ | 2,718,445 | |
| Net realized gain (loss) on investment securities transactions | | | (7,797,201 | ) | | | 923,959 | |
| Net change in unrealized appreciation (depreciation) of investment securities | | | (816,582 | ) | | | 8,376,632 | |
| Net increase (decrease) in net assets resulting from operations | | | (5,187,136 | ) | | | 12,019,036 | |
| | | | | | | | | |
| Distributions to Shareholders from | | | | | | | | |
| Earnings | | | (3,540,919 | ) | | | (3,941,144 | ) |
| Return of capital | | | (103,691 | ) | | | (26,156 | ) |
| Total distributions | | | (3,644,610 | ) | | | (3,967,300 | ) |
| | | | | | | | | |
| Capital Transactions | | | | | | | | |
| Proceeds from shares sold | | | 29,078,143 | | | | 34,727,519 | |
| Reinvestment of distributions | | | 2,882,934 | | | | 1,598,769 | |
| Amount paid for shares redeemed | | | (10,399,035 | ) | | | (1,975,221 | ) |
| Net increase in net assets resulting from capital transactions | | | 21,562,042 | | | | 34,351,067 | |
| | | | | | | | | |
| Total Increase in Net Assets | | | 12,730,296 | | | | 42,402,803 | |
| | | | | | | | | |
| Net Assets | | | | | | | | |
| Beginning of year | | | 93,325,999 | | | | 50,923,196 | |
| End of year | | $ | 106,056,295 | | | $ | 93,325,999 | |
| | | | | | | | | |
| Share Transactions | | | | | | | | |
| Shares sold | | | 1,291,122 | | | | 1,382,840 | |
| Shares issued in reinvestment of distributions | | | 135,508 | | | | 63,066 | |
| Shares redeemed | | | (442,878 | ) | | | (79,289 | ) |
| Net increase in shares outstanding | | | 983,752 | | | | 1,366,617 | |
See accompanying notes which are an integral part of these financial statements.
| CRAWFORD LARGE CAP DIVIDEND FUND – CLASS I |
| FINANCIAL HIGHLIGHTS |
| (For a share outstanding during each year) |
| | | For the | | | For the | | | For the | | | For the | | | For the | |
| | | Year Ended | | | Year Ended | | | Year Ended | | | Year Ended | | | Year Ended | |
| | | December 31, | | | December 31, | | | December 31, | | | December 31, | | | December 31, | |
| | | 2020 | | | 2019 | | | 2018 | | | 2017 | | | 2016 | |
| Selected Per Share Data: | | | | | | | | | | | | | | | | | | | | |
| Net asset value, beginning of year | | $ | 12.44 | | | $ | 9.83 | | | $ | 10.63 | | | $ | 9.99 | | | $ | 9.84 | |
| Investment operations: | | | | | | | | | | | | | | | | | | | | |
| Net investment income | | | 0.21 | | | | 0.19 | | | | 0.18 | | | | 0.16 | | | | 0.16 | |
| Net realized and unrealized gain (loss) | | | 0.65 | | | | 2.61 | | | | (0.59 | ) | | | 1.24 | | | | 1.39 | |
| Total from investment operations | | | 0.86 | | | | 2.80 | | | | (0.41 | ) | | | 1.40 | | | | 1.55 | |
| Less distributions to shareholders from: | | | | | | | | | | | | | | | | | | | | |
| Net investment income | | | (0.21 | ) | | | (0.19 | ) | | | (0.18 | ) | | | (0.17 | ) | | | (0.16 | ) |
| Net realized gains | | | (0.65 | ) | | | — | | | | (0.21 | ) | | | (0.59 | ) | | | (1.24 | ) |
| Total distributions | | | (0.86 | ) | | | (0.19 | ) | | | (0.39 | ) | | | (0.76 | ) | | | (1.40 | ) |
| Net asset value, end of year | | $ | 12.44 | | | $ | 12.44 | | | $ | 9.83 | | | $ | 10.63 | | | $ | 9.99 | |
| Total Return(a) | | | 7.32 | % | | | 28.61 | % | | | (3.97 | )% | | | 14.08 | % | | | 15.76 | % |
| Ratios and Supplemental Data: | | | | | | | | | | | | | | | | | | | | |
| Net assets, end of year (000 omitted) | | $ | 50,751 | | | $ | 47,713 | | | $ | 37,585 | | | $ | 33,272 | | | $ | 29,829 | |
| Ratio of net expenses to average net assets | | | 0.98 | % | | | 0.98 | % | | | 0.98 | % | | | 0.98 | % | | | 0.98 | % |
| Ratio of expenses to average net assets before waiver or recoupment | | | 0.95 | % | | | 0.98 | % | | | 1.03 | % | | | 1.07 | % | | | 1.19 | % |
| Ratio of net investment income to average net assets | | | 1.84 | % | | | 1.64 | % | | | 1.70 | % | | | 1.57 | % | | | 1.51 | % |
| Portfolio turnover rate | | | 43 | % | | | 7 | % | | | 14 | % | | | 21 | % | | | 13 | % |
| (a) | Total return represents the rate that the investor would have earned or lost on an investment in the Fund, assuming reinvestment of distributions. |
See accompanying notes which are an integral part of these financial statements.
| CRAWFORD LARGE CAP DIVIDEND FUND – CLASS C |
| FINANCIAL HIGHLIGHTS – (continued) |
| (For a share outstanding during each year) |
| | | For the | | | For the | | | For the | | | For the | | | For the | |
| | | Year Ended | | | Year Ended | | | Year Ended | | | Year Ended | | | Year Ended | |
| | | December 31, | | | December 31, | | | December 31, | | | December 31, | | | December 31, | |
| | | 2020 | | | 2019 | | | 2018 | | | 2017 | | | 2016 | |
| Selected Per Share Data: | | | | | | | | | | | | | | | | | | | | |
| Net asset value, beginning of year | | $ | 12.33 | | | $ | 9.76 | | | $ | 10.54 | | | $ | 9.91 | | | $ | 9.77 | |
| Investment operations: | | | | | | | | | | | | | | | | | | | | |
| Net investment income | | | 0.10 | | | | 0.07 | | | | 0.08 | | | | 0.06 | | | | 0.06 | |
| Net realized and unrealized gain (loss) | | | 0.64 | | | | 2.57 | | | | (0.59 | ) | | | 1.22 | | | | 1.37 | |
| Total from investment operations | | | 0.74 | | | | 2.64 | | | | (0.51 | ) | | | 1.28 | | | | 1.43 | |
| Less distributions to shareholders from: | | | | | | | | | | | | | | | | | | | | |
| Net investment income | | | (0.09 | ) | | | (0.07 | ) | | | (0.06 | ) | | | (0.06 | ) | | | (0.05 | ) |
| Net realized gains | | | (0.65 | ) | | | — | | | | (0.21 | ) | | | (0.59 | ) | | | (1.24 | ) |
| Total distributions | | | (0.74 | ) | | | (0.07 | ) | | | (0.27 | ) | | | (0.65 | ) | | | (1.29 | ) |
| Net asset value, end of year | | $ | 12.33 | | | $ | 12.33 | | | $ | 9.76 | | | $ | 10.54 | | | $ | 9.91 | |
| Total Return(a) | | | 6.26 | % | | | 27.16 | % | | | (4.84 | )% | | | 12.95 | % | | | 14.61 | % |
| Ratios and Supplemental Data: | | | | | | | | | | | | | | | | | | | | |
| Net assets, end of year (000 omitted) | | $ | 3,050 | | | $ | 4,168 | | | $ | 4,069 | | | $ | 5,385 | | | $ | 5,503 | |
| Ratio of net expenses to average net assets | | | 1.98 | % | | | 1.98 | % | | | 1.98 | % | | | 1.98 | % | | | 1.98 | % |
| Ratio of expenses to average net assets before waiver or recoupment | | | 1.95 | % | | | 1.98 | % | | | 2.03 | % | | | 2.07 | % | | | 2.19 | % |
| Ratio of net investment income to average net assets | | | 0.84 | % | | | 0.64 | % | | | 0.68 | % | | | 0.56 | % | | | 0.51 | % |
| Portfolio turnover rate | | | 43 | % | | | 7 | % | | | 14 | % | | | 21 | % | | | 13 | % |
| (a) | Total return represents the rate that the investor would have earned or lost on an investment in the Fund, assuming reinvestment of distributions. |
See accompanying notes which are an integral part of these financial statements.
| CRAWFORD SMALL CAP DIVIDEND FUND – CLASS I |
| FINANCIAL HIGHLIGHTS – (continued) |
| (For a share outstanding during each year) |
| | | For the | | | For the | | | For the | | | For the | | | For the | |
| | | Year Ended | | | Year Ended | | | Year Ended | | | Year Ended | | | Year Ended | |
| | | December 31, | | | December 31, | | | December 31, | | | December 31, | | | December 31, | |
| | | 2020 | | | 2019 | | | 2018 | | | 2017 | | | 2016 | |
| Selected Per Share Data: | | | | | | | | | | | | | | | | | | | | |
| Net asset value, beginning of year | | $ | 41.98 | | | $ | 36.39 | | | $ | 42.42 | | | $ | 39.32 | | | $ | 31.51 | |
| Investment operations: | | | | | | | | | | | | | | | | | | | | |
| Net investment income | | | 0.52 | | | | 0.55 | | | | 0.47 | | | | 0.40 | | | | 0.52 | |
| Net realized and unrealized gain (loss) | | | 0.83 | | | | 7.20 | | | | (3.70 | ) | | | 5.06 | | | | 7.90 | |
| Total from investment operations | | | 1.35 | | | | 7.75 | | | | (3.23 | ) | | | 5.46 | | | | 8.42 | |
| Less distributions to shareholders from: | | | | | | | | | | | | | | | | | | | | |
| Net investment income | | | (0.48 | ) | | | (0.58 | ) | | | (0.45 | ) | | | (0.43 | ) | | | (0.51 | ) |
| Net realized gains | | | (0.37 | ) | | | (1.58 | ) | | | (2.35 | ) | | | (1.93 | ) | | | (0.10 | ) |
| Total distributions | | | (0.85 | ) | | | (2.16 | ) | | | (2.80 | ) | | | (2.36 | ) | | | (0.61 | ) |
| Net asset value, end of year | | $ | 42.48 | | | $ | 41.98 | | | $ | 36.39 | | | $ | 42.42 | | | $ | 39.32 | |
| Total Return(a) | | | 3.50 | % | | | 21.38 | % | | | (7.64 | )% | | | 13.94 | % | | | 26.95 | % |
| Ratios and Supplemental Data: | | | | | | | | | | | | | | | | | | | | |
| Net assets, end of year (000 omitted) | | $ | 269,227 | | | $ | 249,865 | | | $ | 178,416 | | | $ | 181,709 | | | $ | 141,098 | |
| Ratio of net expenses to average net assets | | | 0.99 | % | | | 1.03 | % | | | 1.05 | % | | | 1.05 | % | | | 1.05 | % |
| Ratio of expenses to average net assets before waiver or recoupment | | | 1.17 | % | | | 1.18 | % | | | 1.20 | % | | | 1.23 | % | | | 1.33 | % |
| Ratio of net investment income to average net assets | | | 1.44 | % | | | 1.36 | % | | | 1.11 | % | | | 1.00 | % | | | 1.61 | % |
| Portfolio turnover rate | | | 32 | % | | | 28 | % | | | 33 | % | | | 36 | % | | | 31 | % |
| (a) | Total return represents the rate that the investor would have earned or lost on an investment in the Fund, assuming reinvestment of distributions. |
See accompanying notes which are an integral part of these financial statements.
| CRAWFORD MULTI-ASSET INCOME FUND |
| FINANCIAL HIGHLIGHTS – (continued) |
| (For a share outstanding during each period) |
| | | For the | | | For the | | | For the | | | For the | |
| | | Year Ended | | | Year Ended | | | Year Ended | | | Period Ended | |
| | | December 31, | | | December 31, | | | December 31, | | | December 31, | |
| | | 2020 | | | 2019 | | | 2018 | | | 2017(a) | |
| Selected Per Share Data: | | | | | | | | | | | | | | | | |
| Net asset value, beginning of period | | $ | 25.74 | | | $ | 22.54 | | | $ | 24.79 | | | $ | 25.00 | |
| Investment operations: | | | | | | | | | | | | | | | | |
| Net investment income | | | 0.79 | | | | 0.94 | | | | 1.05 | | | | 0.24 | |
| Net realized and unrealized gain (loss) | | | (2.68 | ) | | | 3.56 | | | | (2.20 | ) | | | (0.21 | ) |
| Total from investment operations | | | (1.89 | ) | | | 4.50 | | | | (1.15 | ) | | | 0.03 | |
| Less distributions to shareholders from: | | | | | | | | | | | | | | | | |
| Net investment income | | | (0.82 | ) | | | (1.00 | ) | | | (1.04 | ) | | | (0.23 | ) |
| Net realized gains | | | — | | | | (0.29 | ) | | | (0.06 | ) | | | — | |
| Return of capital | | | (0.02 | ) | | | (0.01 | ) | | | — | | | | (0.01 | ) |
| Total distributions | | | (0.84 | ) | | | (1.30 | ) | | | (1.10 | ) | | | (0.24 | ) |
| Net asset value, end of period | | $ | 23.01 | | | $ | 25.74 | | | $ | 22.54 | | | $ | 24.79 | |
| Total Return(b) | | | (7.00 | )% | | | 20.25 | % | | | (4.86 | )% | | | 0.14 | % (c) |
| Ratios and Supplemental Data: | | | | | | | | | | | | | | | | |
| Net assets, end of period (000 omitted) | | $ | 106,056 | | | $ | 93,326 | | | $ | 50,923 | | | $ | 30,488 | |
| Ratio of net expenses to average net assets | | | 1.00 | % | | | 1.00 | % | | | 1.00 | % | | | 1.00 | % (d) |
| Ratio of expenses to average net assets before waiver or recoupment | | | 1.26 | % | | | 1.32 | % | | | 1.39 | % | | | 2.46 | % (d) |
| Ratio of net investment income to average net assets | | | 3.67 | % | | | 3.89 | % | | | 4.51 | % | | | 4.54 | % (d) |
| Portfolio turnover rate | | | 33 | % | | | 20 | % | | | 28 | % | | | 5 | % (c) |
| (a) | For the period September 12, 2017(commencement of operations) to December 31, 2017. |
| (b) | Total return represents the rate that the investor would have earned or lost on an investment in the Fund, assuming reinvestment of distributions. |
See accompanying notes which are an integral part of these financial statements.
| CRAWFORD FUNDS |
| NOTES TO THE FINANCIAL STATEMENTS |
| December 31, 2020 |
| |
NOTE 1. ORGANIZATION
Crawford Large Cap Dividend Fund (the “Large Cap Dividend Fund”, formerly known as Crawford Dividend Growth Fund), Crawford Small Cap Dividend Fund (the “Small Cap Dividend Fund”) and Crawford Multi-Asset Income Fund (the “Multi-Asset Income Fund”) (each a “Fund” and collectively, the “Funds”) are each registered under the Investment Company Act of 1940, as amended (“1940 Act”), as an open-ended diversified series of Unified Series Trust (the “Trust”). The Large Cap Dividend Fund, Small Cap Dividend Fund, and Multi-Asset Income Fund were organized on December 7, 2003, June 21, 2012, and August 7, 2017, respectively. The Trust is an open-end investment company established under the laws of Ohio by an Agreement and Declaration of Trust dated October 17, 2002 (the “Trust Agreement”). The Trust Agreement permits the Board of Trustees (the “Board”) to issue an unlimited number of shares of beneficial interest of separate series without par value. Each Fund is one of a series of funds currently authorized by the Board. The investment adviser to the Funds is Crawford Investment Counsel, Inc. (the “Adviser”). The investment objective of the Large Cap Dividend Fund is to provide total return. Total return is comprised of both capital appreciation and income. The investment objective of the Small Cap Dividend Fund is to provide attractive long-term total return with below market risk as measured by standard deviation in comparison with the Russell 2000® Index. Total return is comprised of both capital appreciation and income. The investment objective of the Multi-Asset Income Fund is to provide current income.
The Large Cap Dividend Fund currently offers two classes of shares: Class C and Class I. Large Cap Dividend Fund Class I shares were first offered to the public on January 5, 2004, and Large Cap Dividend Fund Class C shares were first offered to the public on January 27, 2004. Small Cap Dividend Fund Class I shares were first offered to the public on September 26, 2012, and Small Cap Dividend Fund Class C shares were first offered to the public on April 29, 2015; closed for sale on December 3, 2019, and ceased operation on February 26, 2020. Shares of the Multi-Asset Income Fund were first offered to the public on September 12, 2017. Each class votes separately on matters affecting only that class, or on matters expressly required to be voted on separately by state or federal law. Shares of each class of a series have the same voting and other rights and preferences as the other classes and series of the Trust for matters that affect the Trust as a whole. Each share represents an equal proportionate interest in the assets and liabilities belonging to the Funds and is entitled to such dividends and distributions out of income belonging to the Funds as are declared by the Board.
NOTE 2. SIGNIFICANT ACCOUNTING POLICIES
The Funds are investment companies and follow accounting and reporting guidance under Financial Accounting Standards Board Accounting Standards Codification (“ASC”) Topic 946, “Financial Services-Investment Companies.” The following is a summary of significant accounting policies followed by the Funds in the preparation of their financial statements. These policies are in conformity with the generally accepted accounting principles in the United States of America (“GAAP”).
Estimates – The preparation of financial statements in conformity with GAAP requires management to make estimates and assumptions that affect the reported amounts of assets and liabilities and disclosure of contingent assets and liabilities at the date of the financial statements and the reported amounts of increases and decreases in net assets from operations during the reporting period. Actual results could differ from those estimates.
Foreign Currency Translation – The accounting records of the Funds are maintained in U.S. dollars. Foreign currency amounts are translated into U.S. dollars at the current rate of exchange each business day to determine the value of investments, and other assets and liabilities. Purchases and sales of foreign securities, and income and expenses, are translated at the prevailing rate of exchange on the respective date of these transactions. The Funds do not isolate that portion of the results of operations resulting from changes in foreign exchange rates on investments
| CRAWFORD FUNDS |
| NOTES TO THE FINANCIAL STATEMENTS – (continued) |
| December 31, 2020 |
| |
NOTE 2. SIGNIFICANT ACCOUNTING POLICIES – continued
from fluctuation arising from changes in market prices of securities held. These fluctuations are included with the realized and unrealized gain or loss from investments. Net realized gain (loss) on foreign currency translations on the Statements of Operations represents currency gains (losses) realized between the trade and settlement dates on securities transactions, and the difference between the amount of investment income and foreign withholding taxes recorded on the Fund’s books and the U.S. dollar equivalent amounts actually received or paid. The change in unrealized currency gains (losses) on foreign currency translations for the period is reflected in the Statement of Operations.
Federal Income Taxes – The Funds make no provision for federal income or excise tax. Each Fund has qualified and intends to qualify each year as a regulated investment company (“RIC”) under subchapter M of the Internal Revenue Code of 1986, as amended, by complying with the requirements applicable to RICs and by distributing substantially all of its taxable income. Each Fund also intends to distribute sufficient net investment income and net capital gains, if any, so that it will not be subject to excise tax on undistributed income and gains. If the required amount of net investment income or gains is not distributed, the Fund could incur a tax expense.
As of and during the fiscal year ended December 31, 2020, the Funds did not have any liabilities for any unrecognized tax benefits. The Funds recognize interest and penalties, if any, related to unrecognized tax benefits as income tax expense in the Statement of Operations when incurred. During the year, the Funds did not incur any interest or penalties. Management of the Funds has reviewed tax positions taken in tax years that remain subject to examination by all major tax jurisdictions, including federal (i.e., the previous three tax year ends and the interim tax period since then, as applicable) and has concluded that no provision for unrecognized tax benefits or expenses is required in these financial statements and does not expect this to change over the next twelve months.
Expenses – Expenses incurred by the Trust that do not relate to a specific fund of the Trust are allocated to the individual funds based on each fund’s relative net assets or another appropriate basis (as determined by the Board). Expenses specifically attributable to any class are borne by that class. Income, realized gains and losses, unrealized appreciation and depreciation, and fund-wide expenses not allocated to a particular class shall be allocated to each class based on the net assets of that class in relation to the net assets of the entire fund.
Security Transactions and Related Income – The Funds follow industry practice and record security transactions on the trade date for financial reporting purposes. The specific identification method is used for determining gains or losses for financial statements and income tax purposes. Dividend income is recorded on the ex-dividend date and interest income is recorded on an accrual basis. Distributions received from investments in real estate investment trusts (“REITs”) that represent a return of capital or capital gain are recorded as a reduction of the cost of investment or as a realized gain, respectively. The calendar year-end amounts of ordinary income, capital gains, and return of capital included in distributions received from the Funds’ investments in REITs are reported to the Funds after the end of the calendar year; accordingly, the Funds estimate these amounts for accounting purposes until the characterization of REIT distributions is reported. Estimates are based on the most recent REIT distributions information available. Withholding taxes on foreign dividends and related reclaims have been provided for in accordance with the Funds’ understanding of the applicable country’s tax rules and rates.
Dividends and Distributions – Large Cap Dividend Fund and Small Cap Dividend Fund each typically distribute substantially all of its net investment income quarterly and net realized capital gains, if any, at least annually. Multi-Asset Income Fund typically distributes net investment income monthly and any realized net capital gains annually. Distributions to shareholders, which are determined in accordance with income tax regulations, are recorded on the ex-dividend date. The treatment for financial reporting purposes of distributions made to shareholders during the
| CRAWFORD FUNDS |
| NOTES TO THE FINANCIAL STATEMENTS – (continued) |
| December 31, 2020 |
| |
NOTE 2. SIGNIFICANT ACCOUNTING POLICIES – continued
year from net investment income or net realized capital gains may differ from their ultimate treatment for federal income tax purposes. Where such differences are permanent in nature; they are reclassified in the components of net assets based on their ultimate characterization for federal income tax purposes. Any such reclassifications will have no effect on net assets, results of operations, or net asset values (“NAV”) per share of the Funds.
For the fiscal year ended December 31, 2020, the Funds made the following reclassifications to increase (decrease)
the components of net assets:
| | | | | | Accumulated | |
| | | Paid-In | | | Earnings | |
| | | Capital | | | (Deficit) | |
| Crawford Multi-Asset Income Fund | | $ | (94,739 | ) | | $ | 94,739 | |
| | | | | | | | | |
Contingent Deferred Sales Charges – With respect to the Class C Shares of Large Cap Dividend Fund there is no initial sales charge on purchases. However, a contingent deferred sales charge (“CDSC”) of 1.00%, based on the lower of the shares’ cost or current NAV, will be imposed on such purchases if the shares are redeemed within 12 months of purchase. Any shares acquired by reinvestment of distributions will be redeemed without a CDSC. In determining whether a CDSC is payable, the applicable Funds will first redeem shares not subject to any charge.
NOTE 3. SECURITIES VALUATION AND FAIR VALUE MEASUREMENTS
Each Fund values its portfolio securities at fair value as of the close of regular trading on the New York Stock Exchange (the “NYSE”) (normally 4:00 p.m. Eastern time) on each business day the NYSE is open for business. Fair value is defined as the price that a Fund would receive upon selling an investment in a timely transaction to an independent buyer in the principal or most advantageous market of the investment. GAAP establishes a three-tier hierarchy to maximize the use of observable market data and minimize the use of unobservable inputs and to establish classification of fair value measurements for disclosure purposes.
Inputs refer broadly to the assumptions that market participants would use in pricing the asset or liability, including assumptions about risk (the risk inherent in a particular valuation technique used to measure fair value including a pricing model and/or the risk inherent in the inputs to the valuation technique). Inputs may be observable or unobservable. Observable inputs are inputs that reflect the assumptions market participants would use in pricing the asset or liability developed based on market data obtained and available from sources independent of the reporting entity. Unobservable inputs are inputs that reflect the reporting entity’s own assumptions about the assumptions market participants would use in pricing the asset or liability developed based on the best information available in the circumstances.
Various inputs are used in determining the value of each Fund’s investments. These inputs are summarized in the three broad levels listed below.
| ● | Level 1 – unadjusted quoted prices in active markets for identical investments and/or registered investment companies where the value per share is determined and published and is the basis for current transactions for identical assets or liabilities at the valuation date |
| ● | Level 2 – other significant observable inputs (including, but not limited to, quoted prices for an identical security in an inactive market, quoted prices for similar securities, interest rates, prepayment speeds, credit risk, etc.) |
| ● | Level 3 – significant unobservable inputs (including the Funds’ own assumptions in determining fair value of investments based on the best information available) |
| CRAWFORD FUNDS |
| NOTES TO THE FINANCIAL STATEMENTS – (continued) |
| December 31, 2020 |
| |
NOTE 3. SECURITIES VALUATION AND FAIR VALUE MEASUREMENTS – continued
The inputs used to measure fair value may fall into different levels of the fair value hierarchy. In such cases, for disclosure purposes, the level in the fair value hierarchy which is reported is determined based on the lowest level input that is significant to the fair value measurement in its entirety.
Equity securities that are traded on any stock exchange are generally valued at the last quoted sale price on the security’s primary exchange. Lacking a last sale price, an exchange-traded security is generally valued at its last bid price. Securities traded in the NASDAQ over-the-counter market are generally valued at the NASDAQ Official Closing Price. When using the market quotations and when the market is considered active, the security is classified as a Level 1 security. In the event that market quotations are not readily available or are considered unreliable due to market or other events, a Fund values its securities and other assets at fair value in accordance with policies established by and under the general supervision of the Board. Under these policies, the securities will be classified as Level 2 or 3 within the fair value hierarchy, depending on the inputs used.
Debt securities are valued by using the mean between the closing bid and ask prices provided by a pricing service. If the closing bid and ask prices are not readily available, the pricing service may provide a price determined by a matrix pricing method. Matrix pricing is a mathematical technique used to value fixed income securities without relying exclusively on quoted prices. Matrix pricing takes into consideration recent transactions, yield, liquidity, risk, credit quality, coupon, maturity, type of issue and any other factors or market data the pricing service deems relevant for the actual security being priced and for other securities with similar characteristics. These securities will generally be categorized as Level 2 securities. If the Adviser decides that a price provided by the pricing service does not accurately reflect the fair value of the securities or when prices are not readily available from a pricing service, securities are valued at fair value as determined by the Adviser, in conformity with guidelines adopted by and subject to review of the Board. These securities will generally be categorized as Level 3 securities.
Investments in mutual funds, including money market mutual funds, are generally priced at the ending NAV provided by the service agent of the mutual funds. These securities are categorized as Level 1 securities.
In accordance with the Trust’s valuation policies, the Adviser is required to consider all appropriate factors relevant to the value of securities for which it has determined other pricing sources are not available or reliable as described above. No single method exists for determining fair value, because fair value depends upon the circumstances of each individual case. As a general principle, the current fair value of a security being valued by the Adviser would be the amount that the Funds might reasonably expect to receive upon the current sale. Methods that are in accordance with this principle may, for example, be based on (i) a multiple of earnings; (ii) a discount from market prices of a similar freely traded security (including a derivative security or a basket of securities traded on other markets, exchanges or among dealers); or (iii) yield to maturity with respect to debt issues, or a combination of these and other methods. Fair-value pricing is permitted if, in the Adviser’s opinion, the validity of market quotations appears to be questionable based on factors such as evidence of a thin market in the security based on a small number of quotations, a significant event occurs after the close of a market but before a Fund’s NAV calculation that may affect a security’s value, or the Adviser is aware of any other data that calls into question the reliability of market quotations.
| CRAWFORD FUNDS |
| NOTES TO THE FINANCIAL STATEMENTS – (continued) |
| December 31, 2020 |
| |
NOTE 3. SECURITIES VALUATION AND FAIR VALUE MEASUREMENTS – continued
The following is a summary of the inputs used to value the Funds’ investments as of December 31, 2020:
| | | Valuation Inputs | |
| Assets | | Level 1 | | | Level 2 | | | Level 3 | | | Total | |
| Large Cap Dividend Fund | | | | | | | | | | | | | | | | |
| Common Stocks(a) | | $ | 52,324,058 | | | $ | — | | | $ | — | | | $ | 52,324,058 | |
| Money Market Funds | | | 1,411,289 | | | | — | | | | — | | | | 1,411,289 | |
| Total | | $ | 53,735,347 | | | $ | — | | | $ | — | | | $ | 53,735,347 | |
| | | | | | | | | | | | | | | | | |
| Small Cap Dividend Fund | | | | | | | | | | | | | | | | |
| Common Stocks(a) | | $ | 266,727,720 | | | $ | — | | | $ | — | | | $ | 266,727,720 | |
| Money Market Funds | | | 4,398,362 | | | | — | | | | — | | | | 4,398,362 | |
| Total | | $ | 271,126,082 | | | $ | — | | | $ | — | | | $ | 271,126,082 | |
| | | | | | | | | | | | | | | | | |
| Multi-Asset Income Fund | | | | | | | | | | | | | | | | |
| Common Stocks(a) | | $ | 60,432,969 | | | $ | — | | | $ | — | | | $ | 60,432,969 | |
| Preferred Stocks(a) | | | 32,536,482 | | | | — | | | | — | | | | 32,536,482 | |
| Corporate Bonds(a) | | | — | | | | 11,174,488 | | | | — | | | | 11,174,488 | |
| Money Market Funds | | | 1,449,046 | | | | — | | | | — | | | | 1,449,046 | |
| Total | | $ | 94,418,497 | | | $ | 11,174,488 | | | $ | — | | | $ | 105,592,985 | |
| | | | | | | | | | | | | | | | | |
| (a) | Refer to Schedule of Investments for sector classifications. |
The Funds did not hold any investments at the end of the reporting period for which significant unobservable inputs (Level 3) were used in determining fair value; therefore, no reconciliation of Level 3 securities is included for this reporting period.
NOTE 4. FEES AND OTHER TRANSACTIONS WITH AFFILIATES
The Adviser, under the terms of the management agreement with the Trust with respect to each Fund (each an “Agreement”), manages the Funds’ investments. As compensation for its management services, each Fund pays the Adviser a fee based on each Fund’s average daily net assets as follows:
| | | Large Cap | | | Small Cap | | | Multi-Asset | |
| | | Dividend Fund | | | Dividend Fund | | | Income Fund | |
| Management fee rate | | | 0.50 | % | | | 0.99 | % | | | 1.00 | % |
| Management fees earned | | $ | 244,056 | | | $ | 2,210,070 | | | $ | 934,136 | |
| Fees recouped (waived) | | $ | 12,546 | | | $ | (386,201 | ) | | $ | (238,010 | ) |
| | | | | | | | | | | | | |
The Adviser contractually has agreed to waive its management fee and/or reimburse expenses so that total annual operating expenses, excluding portfolio transaction and other investment-related costs (including brokerage fees and commissions); taxes; borrowing costs (such as interest and dividend expenses on securities sold short); acquired fund fees and expenses; fees and expenses associated with investments in other collective investment vehicles or derivative instruments (including for example option and swap fees and expenses); any amounts payable pursuant to a distribution or service plan adopted in accordance with Rule 12b-1 under the Investment Company Act of 1940; any administrative and/or shareholder servicing fees payable pursuant to a plan adopted by the Board of Trustees; expenses incurred in connection with any merger or reorganization; extraordinary expenses (such as litigation expenses, indemnification of Trust officers and Trustees and contractual indemnification of Fund service
| CRAWFORD FUNDS |
| NOTES TO THE FINANCIAL STATEMENTS – (continued) |
| December 31, 2020 |
| |
NOTE 4. FEES AND OTHER TRANSACTIONS WITH AFFILIATES – continued
providers); and other expenses that the Trustees agree have not been incurred in the ordinary course of the Fund’s business, do not exceed 0.98% of the Fund’s average daily net assets with respect to the Large Cap Dividend Fund, 0.99% of the Fund’s average daily net assets with respect to the Small Cap Dividend Fund and 1.00% with respect to the Multi-Asset Income Fund. The contractual arrangement for the Funds is in place through April 30, 2021.
Each waiver/expense payment by the Adviser is subject to recoupment by the Adviser from the applicable Fund in the three years following the date the particular waiver/expense payment occurred, but only if such recoupment can be achieved without exceeding the annual expense limitation in effect at the time of the waiver/expense payment and any expense limitation in effect at the time of the recoupment. The amounts subject to repayment by the Funds, pursuant to the aforementioned conditions are as follows:
| | | Large Cap | | | Small Cap | | | Multi-Asset | |
| Recoverable through | | Dividend Fund | | | Dividend Fund | | | Income Fund | |
| December 31, 2021 | | $ | 22,777 | | | $ | 287,119 | | | $ | 174,332 | |
| December 31, 2022 | | | 1,841 | | | | 332,606 | | | | 224,679 | |
| December 31, 2023 | | | — | | | | 386,201 | | | | 238,010 | |
| | | | | | | | | | | | | |
Ultimus Fund Solutions, LLC (the “Administrator”) provides the Funds with administration, fund accounting, transfer agent and compliance services, including all regulatory reporting. For the fiscal year ended December 31, 2020, fees for administration, transfer agent, fund accounting and compliance services, and the amounts due to the Administrator at December 31, 2020 were as follows:
| | | Large Cap | | | Small Cap | | | Multi-Asset | |
| | | Dividend Fund | | | Dividend Fund | | | Income Fund | |
| Administration | | $ | 30,010 | | | $ | 132,782 | | | $ | 58,132 | |
| Fund accounting | | | 40,554 | | | | 54,359 | | | | 39,161 | |
| Transfer agent | | | 26,662 | | | | 24,458 | | | | 17,836 | |
| Compliance services | | | 13,282 | | | | 13,282 | | | | 13,282 | |
| Payable to Administrator | | | 8,439 | | | | 18,628 | | | | 10,019 | |
| | | | | | | | | | | | | |
The Board supervises the business activities of the Trust. Each Trustee serves as a trustee until termination of the Trust unless the Trustee dies, resigns, retires, or is removed. The Chairman of the Board and more than 75% of the Trustees are “Independent Trustees,” which means that they are not “interested persons” as defined in the 1940 Act. Each Trustee of the Trust received annual compensation of $2,290 per fund from the Trust, except that the Independent Chairman of the Board, the Chairman of the Audit Committee, the Chairman of the Governance & Nominating Committee, and the Chairman of the Pricing & Liquidity Committee each received annual compensation of $2,740 per fund from the Trust. Trustees also receive $1,000 for attending each special in-person meeting. In addition, the Trust reimburses Trustees for out-of-pocket expenses incurred in conjunction with attendance at meetings.
One Trustee and certain officers of the Trust are employees of the Administrator or Ultimus Fund Distributors, LLC (the “Distributor”). The Distributor acts as the principal distributor of the Fund’s shares. The Distributor operates as a wholly-owned subsidiary of the Administrator. An officer of the Trust is an officer of the Distributor and such person may be deemed to be an affiliate of the Distributor. Officers, other than the Chief Compliance Officer, who is not an officer or employee of the Administrator or the Distributor, are not paid by the Trust for services to the Fund.
| CRAWFORD FUNDS |
| NOTES TO THE FINANCIAL STATEMENTS – (continued) |
| December 31, 2020 |
| |
NOTE 4. FEES AND OTHER TRANSACTIONS WITH AFFILIATES – continued
The Trust, with respect to the Large Cap Dividend Fund and Small Cap Dividend Fund, has adopted a Class C Distribution Plan (the “Plan”) pursuant to Rule 12b-1 under the 1940 Act. Under the Plan, a Fund pays a fee to the Distributor, the Adviser or other financial institutions of 1.00% of the Class C’s average daily net assets (0.75% to help defray the cost of distributing Class C shares and 0.25% for servicing the Class C shareholders) attributable to that Fund in connection with the promotion and distribution of the Fund’s Class C shares or the provision of personal services to Class C shareholders. These services include, but are not necessarily limited to, advertising, compensation to underwriters, dealers and selling personnel, the printing and mailing of prospectuses to other than current Fund shareholders, the printing and mailing of sales literature and servicing shareholder accounts (“12b-1 Expenses”). The Plan is a compensation plan, which means that compensation is provided regardless of 12b-1 Expenses actually incurred. Pursuant to the Plan, the Board reviews, at least quarterly, a written report of the distribution expenses incurred on behalf of the Funds under the Plan. For the fiscal year ended December 31, 2020, the Class C shares incurred 12b-1 Expenses as follows:
| | | Large Cap | | | Small Cap | |
| | | Dividend Fund | | | Dividend Fund | |
| 12b-1 fees | | $ | 32,540 | | | $ | 2,240 | |
| 12b-1 fees accrued | | | 7,690 | | | | — | |
| | | | | | | | | |
NOTE 5. INVESTMENT TRANSACTIONS
For the fiscal year ended December 31, 2020, purchases and sales of investment securities, other than short-term investments were as follows:
| | | Large Cap | | | Small Cap | | | Multi-Asset | |
| | | Dividend Fund | | | Dividend Fund | | | Income Fund | |
| Purchases | | $ | 20,448,724 | | | $ | 83,673,846 | | | $ | 53,309,400 | |
| Sales | | | 21,520,403 | | | | 71,414,996 | | | | 30,371,951 | |
| | | | | | | | | | | | | |
There were no purchases or sales of long-term U.S. government obligations during the fiscal year ended December 31, 2020.
NOTE 6. FEDERAL TAX INFORMATION
At December 31, 2020, the net unrealized appreciation (depreciation) and tax cost of investments for tax purposes was as follows:
| | | Large Cap | | | Small Cap | | | Multi-Asset | |
| | | Dividend Fund | | | Dividend Fund | | | Income Fund | |
| Gross unrealized appreciation | | $ | 21,955,604 | | | $ | 55,809,492 | | | $ | 7,358,870 | |
| Gross unrealized depreciation | | | (27,697 | ) | | | (6,370,281 | ) | | | (5,142,843 | ) |
| Net unrealized appreciation (depreciation) on investments | | | 21,927,907 | | | | 49,439,211 | | | | 2,216,027 | |
| Tax cost of investments | | $ | 31,807,440 | | | $ | 221,686,871 | | | $ | 103,377,038 | |
| CRAWFORD FUNDS |
| NOTES TO THE FINANCIAL STATEMENTS – (continued) |
| December 31, 2020 |
| |
NOTE 6. FEDERAL TAX INFORMATION – continued
The tax character of distributions paid for the fiscal years ended December 31, 2020 and December 31, 2019 were as follows:
| | | Large Cap Dividend Fund | | | Small Cap Dividend Fund | | | Multi-Asset Income Fund | |
| | | 2020 | | | 2019 | | | 2020 | | | 2019 | | | 2020 | | | 2019 | |
| Distributions paid from: | | | | | | | | | | | | | | | | | | | | | | | | |
| Ordinary income (a) | | $ | 864,312 | | | $ | 749,752 | | | $ | 2,965,677 | | | $ | 3,117,756 | | | $ | 3,540,919 | | | $ | 3,611,731 | |
| Long-term capital gains | | | 2,690,471 | | | | — | | | | 2,319,023 | | | | 9,236,067 | | | | — | | | | 329,413 | |
| Tax return of capital | | | — | | | | — | | | | — | | | | — | | | | 103,691 | | | | 26,156 | |
| Total distributions paid | | $ | 3,554,783 | | | $ | 749,752 | | | $ | 5,284,700 | | | $ | 12,353,823 | | | $ | 3,644,610 | | | $ | 3,967,300 | |
| | | | | | | | | | | | | | | | | | | | | | | | | |
| (a) | Short-term capital gain distributions are treated as ordinary income for tax purposes. |
At December 31, 2020, the components of accumulated earnings (deficit) on a tax basis were as follows:
| | | Large Cap | | | Small Cap | | | Multi-Asset | |
| | | Dividend Fund | | | Dividend Fund | | | Income Fund | |
| Undistributed ordinary income | | $ | 12,490 | | | $ | 130,695 | | | $ | — | |
| Undistributed long-term capital gains | | | 101,024 | | | | — | | | | — | |
| Accumulated capital and other losses | | | — | | | | (3,069,023 | ) | | | (7,845,024 | ) |
| Unrealized appreciation on investments | | | 21,927,907 | | | | 49,439,211 | | | | 2,216,027 | |
| Total accumulated earnings | | $ | 22,041,421 | | | $ | 46,500,883 | | | $ | (5,628,997 | ) |
| | | | | | | | | | | | | |
The differences between book-basis and tax-basis unrealized appreciation (depreciation) are attributable primarily to: tax deferral of losses on wash sales, differences related to partnership investments and the return of capital adjustments from underlying investments.
As of December 31, 2020, the Small Cap Dividend Fund had available for tax purposes an unused capital loss carryforward of $2,857,064 in short term and $211,958 in long term capital losses with no expiration, which are available to offset against future taxable net capital gains. To the extent that these carryforward are used to offset future gains, it is probable that the amount offset will not be distributed to shareholders.
As of December 31, 2020, the Multi-Asset Income Fund had available for tax purposes an unused capital loss carryforward of $2,272,100 in short term and $5,572,924 in long term capital losses with no expiration, which are available to offset against future taxable net capital gains. To the extent that these carryforward are used to offset future gains, it is probable that the amount offset will not be distributed to shareholders.
NOTE 7. SECTOR RISK
If a Fund has significant investments in the securities of issuers within a particular sector, any development affecting that sector will have a greater impact on the value of the net assets of that Fund than would be the case if a Fund did not have significant investments in that sector. In addition, this may increase the risk of loss in a Fund and increase the volatility of the Fund’s NAV per share. For instance, economic or market factors, regulatory changes or other developments may negatively impact all companies in a particular sector, and therefore the value of the Fund’s portfolio will be adversely affected. As of December 31, 2020, the Small Cap Dividend Fund had 25.43% of its net asset value invested in stocks within the Industrials sector. As of December 31, 2020, the Multi-Asset Income Fund had 33.91% of its net asset value invested in stocks within the Financials sector.
| CRAWFORD FUNDS |
| NOTES TO THE FINANCIAL STATEMENTS – (continued) |
| December 31, 2020 |
| |
NOTE 8. CORONAVIRUS (COVID-19) PANDEMIC
The COVID-19 pandemic has caused financial markets to experience periods of increased volatility due to uncertainty that exists around its long-term effects. COVID-19 has resulted in varying levels of travel restrictions, quarantines, disruptions to supply chains and customer activity, leading to general concern and economic uncertainty. The full impact and duration of the pandemic cannot necessarily be foreseen. Management continues to monitor developments and navigate accordingly, further evaluating the anticipated impact to financial markets.
NOTE 9. COMMITMENTS AND CONTINGENCIES
The Trust indemnifies its officers and Trustees for certain liabilities that may arise from their performance of their duties to the Trust or the Funds. Additionally, in the normal course of business, the Trust enters into contracts that contain a variety of representations and warranties which provide general indemnifications. The Trust’s maximum exposure under these arrangements is unknown, as this would involve future claims that may be made against the Trust that have not yet occurred.
NOTE 10. SUBSEQUENT EVENTS
Effective January 19, 2021, the Crawford Dividend Growth Fund changed its name to Crawford Large Cap Dividend Fund. Management of the Funds has evaluated the need for disclosures and/or adjustments resulting from subsequent events through the date at which these financial statements were issued. Based upon this evaluation, management has determined there were no other items requiring adjustment of the financial statements or additional disclosure.
REPORT OF INDEPENDENT REGISTERED PUBLIC ACCOUNTING FIRM
To the Shareholders of Crawford Large Cap Dividend Fund (formerly known as Crawford Dividend Growth Fund), Crawford Small Cap Dividend Fund, and Crawford Multi-Asset Income Fund and Board of Trustees of Unified Series Trust
Opinion on the Financial Statements
We have audited the accompanying statements of assets and liabilities, including the schedules of investments, of Crawford Large Cap Dividend Fund (formerly known as Crawford Dividend Growth Fund), Crawford Small Cap Dividend Fund, and Crawford Multi-Asset Income Fund (the “Funds”), each a series of Unified Series Trust, as of December 31, 2020, the related statements of operations for the year then ended, the statements of changes in net assets for each of the two years in the period then ended, the related notes, and the financial highlights for each of the four periods in the period then ended (collectively referred to as the “financial statements”). In our opinion, the financial statements present fairly, in all material respects, the financial position of each of the Funds as of December 31, 2020, the results of their operations for the year then ended, the changes in net assets for each of the two years in the period then ended, and the financial highlights for each of the four periods in the period then ended, in conformity with accounting principles generally accepted in the United States of America.
The Funds’ financial highlights for the year ended December 31, 2016 were audited by other auditors whose report dated February 27, 2017, expressed an unqualified opinion on those financial highlights.
Basis for Opinion
These financial statements are the responsibility of the Funds’ management. Our responsibility is to express an opinion on the Funds’ financial statements based on our audits. We are a public accounting firm registered with the Public Company Accounting Oversight Board (United States) (“PCAOB”) and are required to be independent with respect to the Funds in accordance with the U.S. federal securities laws and the applicable rules and regulations of the Securities and Exchange Commission and the PCAOB.
We conducted our audits in accordance with the standards of the PCAOB. Those standards require that we plan and perform the audit to obtain reasonable assurance about whether the financial statements are free of material misstatement whether due to error or fraud.
Our audits included performing procedures to assess the risks of material misstatement of the financial statements, whether due to error or fraud, and performing procedures that respond to those risks. Such procedures included examining, on a test basis, evidence regarding the amounts and disclosures in the financial statements. Our procedures included confirmation of securities owned as of December 31, 2020, by correspondence with the custodian and brokers; when replies were not received from brokers, we performed other auditing procedures. Our audits also included evaluating the accounting principles used and significant estimates made by management, as well as evaluating the overall presentation of the financial statements. We believe that our audits provide a reasonable basis for our opinion.
We have served as the Funds’ auditor since 2017.
COHEN & COMPANY, LTD.
Chicago, Illinois
February 26, 2021
LIQUIDITY RISK MANAGEMENT PROGRAM (Unaudited)
The Funds have adopted and implemented a written liquidity risk management program (the “Program”) as required by Rule 22e-4 (the “Liquidity Rule”) under the 1940 Act. The Program is reasonably designed to assess and manage the Funds’ liquidity risk, taking into consideration, among other factors, the Funds’ investment strategy and the liquidity of its portfolio investments during normal and reasonably foreseeable stressed conditions; its short and long-term cash flow projections; and its cash holdings and access to other funding sources. The Board approved the appointment of the Liquidity Administrator Committee, comprising certain Trust officers and employees of the Adviser. The Liquidity Administrator Committee maintains Program oversight and reports to the Board on at least an annual basis regarding the Program’s operational effectiveness through a written report (the “Report”). The Program’s initial Report, which was presented to the Board for consideration at its meeting held on November 17, 2020, outlined the operation of the Program and the adequacy and effectiveness of the Program’s implementation. During the review period, the Funds did not experience unusual stress or disruption to its operations related to purchase and redemption activity. Also, during the review period the Funds held adequate levels of cash and highly liquid investments to meet shareholder redemption activities in accordance with applicable requirements. The Report concluded that the Program is reasonably designed to prevent violation of the Liquidity Rule and has been effectively implemented.
SUMMARY OF FUND EXPENSES – (Unaudited)
As a shareholder of a Fund, you incur two types of costs: (1) transaction costs and (2) ongoing costs, including management fees and other Fund expenses. These examples are intended to help you understand your ongoing costs (in dollars) of investing in each Fund and to compare these costs with the ongoing costs of investing in other mutual funds. Each Fund’s example is based on an investment of $1,000 invested at the beginning of the period and held for the entire period from July 1, 2020 through December 31, 2020.
Actual Expenses
The first line of the table for each class provides information about actual account values and actual expenses. You may use the information in these lines, together with the amount you invested, to estimate the expenses that you paid over the period. Simply divide your account value by $1,000 (for example, an $8,600 account value divided by $1,000 = 8.60), then multiply the result by the number in the first line under the heading “Expenses Paid During Period” to estimate the expenses you paid on your account during this period.
Hypothetical Example for Comparison Purposes
The second line of the table for each class provides information about hypothetical account values and hypothetical expenses based on each Fund’s actual expense ratios and an assumed rate of return of 5% per year before expenses, which is not the Fund’s actual return. The hypothetical account values and expenses may not be used to estimate the actual ending account balances or expenses you paid for the period. You may use this information to compare the ongoing costs of investing in the Funds and other funds. To do so, compare this 5% hypothetical example with the 5% hypothetical examples that appear in the shareholder reports of other funds.
SUMMARY OF FUND EXPENSES – (Unaudited) (continued)
Expenses shown in the table are meant to highlight your ongoing costs only and do not reflect any transactional costs. Therefore, the second line of the table below is useful in comparing ongoing costs only and will not help you determine the relative costs of owning different funds. In addition, if transaction costs were included, your costs would have been higher.
| | Beginning
Account Value
July 1, 2020 | Ending Account
Value
December 31, 2020 | Expenses Paid
During Period(a) | Annualized
Expense Ratio |
Crawford Large Cap
Dividend Fund – Class I | | | | |
| Actual | $ 1,000.00 | $ 1,174.50 | $ 5.36 | 0.98% |
| Hypothetical (b) | $ 1,000.00 | $ 1,020.21 | $ 4.98 | 0.98% |
Crawford Large Cap
Dividend Fund – Class C | | | | |
| Actual | $ 1,000.00 | $ 1,168.10 | $ 10.79 | 1.98% |
| Hypothetical (b) | $ 1,000.00 | $ 1,015.18 | $ 10.03 | 1.98% |
Crawford Small Cap
Dividend Fund – Class I | | | | |
| Actual | $ 1,000.00 | $ 1,252.90 | $ 5.61 | 0.99% |
| Hypothetical (b) | $ 1,000.00 | $ 1,020.16 | $ 5.03 | 0.99% |
Crawford Multi-Asset
Income Fund | | | | |
| Actual | $ 1,000.00 | $ 1,137.10 | $ 5.37 | 1.00% |
| Hypothetical (b) | $ 1,000.00 | $ 1,020.11 | $ 5.08 | 1.00% |
| (a) | Expenses are equal to the Fund’s annualized expense ratios, multiplied by the average account value over the period, multiplied by 184/366 (to reflect the one-half year period). |
| (b) | Hypothetical assumes 5% annual return before expenses. |
ADDITIONAL FEDERAL INCOME TAX INFORMATION – (Unaudited)
The Form 1099-DIV you receive in January 2021 will show the tax status of all distributions paid to your account in calendar year 2020. Shareholders are advised to consult their own tax adviser with respect to the tax consequences of their investment in the Fund. As required by the Internal Revenue Code and/or regulations, shareholders must be notified regarding the status of qualified dividend income for individuals and the dividends received deduction for corporations.
Qualified Dividend Income. The Funds designate the following percentage or up to the maximum amount of such dividends allowable pursuant to the Internal Revenue Code, as qualified dividend income eligible for the reduced tax rate.
| | | Large Cap | | | Small Cap | | | Multi-Asset | |
| | | Dividend Fund | | | Dividend Fund | | | Income Fund | |
| Qualified Dividend Income | | | 100 | % | | | 100 | % | | | 100 | % |
| | | | | | | | | | | | | |
Qualified Business Income. The Funds designate the following percentage of ordinary income dividends, or up to the maximum amount of such dividends allowable pursuant to the Internal Revenue Code, as qualified business income.
| | | Large Cap | | | Small Cap | | | Multi-Asset | |
| | | Dividend Fund | | | Dividend Fund | | | Income Fund | |
| Qualified Business Income | | | 0 | % | | | 0 | % | | | 0 | % |
| | | | | | | | | | | | | |
Dividends Received Deduction. Corporate shareholders are generally entitled to take the dividends received deduction on the portion of the Funds’ dividend distribution that qualifies under tax law. For the Funds’ calendar year 2019 ordinary income dividends, the following percentage qualifies for the corporate dividends received deduction.
| | | Large Cap | | | Small Cap | | | Multi-Asset | |
| | | Dividend Fund | | | Dividend Fund | | | Income Fund | |
| Dividends Received Deduction | | | 100 | % | | | 100 | % | | | 100 | % |
| | | | | | | | | | | | | |
The Funds designate the following amounts as long-term capital gains distributions. The amounts designated may not agree with long-term capital gains in the tax character of distribution table due to utilization of earnings and profits distributed to shareholders on redemption of shares.
| | | Large Cap | | | Small Cap | | | Multi-Asset | |
| | | Dividend Fund | | | Dividend Fund | | | Income Fund | |
| Long-Term Capital Gains Distributions | | $ | 2,690,471 | | | $ | 2,319,023 | | | $ | — | |
| | | | | | | | | | | | | |
TRUSTEES AND OFFICERS – (Unaudited)
GENERAL QUALIFICATIONS. The Board supervises the business activities of the Trust. Each Trustee serves as a trustee until termination of the Trust unless the Trustee dies, resigns, retires, or is removed. The Chairman of the Board and more than 75% of the Trustees are “Independent Trustees,” which means that they are not “interested persons” (as defined in the 1940 Act) of the Trust or any adviser, sub-adviser or distributor of the Trust.
The following table provides information regarding the Independent Trustees.
| Name, Address*, (Year of Birth), Position | | |
| with Trust**, Term of Position with Trust | | Principal Occupation During Past 5 Years and Other Directorships |
| | | |
Kenneth G.Y. Grant (1949)
Chairman, January 2017 to present; Independent Trustee, May 2008 to present | | Current: Director, Standpoint Multi-Asset (Cayman) Fund, Ltd. (2019 – present); Director, Advisors Charitable Gift Fund (2020 - present), a Donor Advised Fund. Previous: EVP, Benefit Plans Administrative Services, Inc., provider of retirement benefit plans administration (2019 – 2020); Director, Northeast Retirement Services (NRS) LLC, a transfer agent and fund administrator; and Director, Global Trust Company (GTC), a non-depository trust company sponsoring private investment product (2003 – 2019); EVP, NRS (2003 – 2019); GTC, EVP (2008 – 2019); EVP, Savings Banks Retirement Association (2003 – 2019), provider of qualified retirement benefit plans. |
| | | |
Daniel J. Condon (1950)
Chairman of the Audit Committee; Chairman of the Governance & Nominating Committee; Independent Trustee, December 2002 to present | | Current: Retired (2017 - present) Previous: Executive Advisor of Standard Steel LLC, a Railway manufacturing supply company (2016); Chief Executive Officer of Standard Steel LLC (2011 - 2015); Director of Standard Steel Holdings Co., which owns Standard Steel LLC (2011 - 2016); Director of International Crankshaft Inc. (2004 - 2016). |
| | | |
Gary E. Hippenstiel (1947)
Chairman of the Pricing & Liquidity Committee; Independent Trustee, December 2002 to present | | Current: President and founder of Hippenstiel Investment Counsel LLC (“Hippenstiel”) since 2008. Hippenstiel was registered as an investment adviser from 2008 to December 31, 2019. |
| | | |
Stephen A. Little (1946)
Independent Trustee, December 2002 to present; Chairman, December 2004 to December 2016 | | Current: President and founder of The Rose, Inc., a registered investment adviser, since 1993. |
| | | |
Ronald C. Tritschler (1952)
Independent Trustee, January 2007 to present; Interested Trustee, December 2002 to December 2006 | | Current: Chief Executive Officer, Director and Legal Counsel of The Webb Companies, a national real estate company, since 2001; Director, Standpoint Multi-Asset (Cayman) Fund, Ltd. (2020 – present). |
| | | |
| * | The address for each Trustee is 225 Pictoria Drive, Suite 450, Cincinnati, Ohio 45246. |
| ** | As of the date of this report, the Trust consists of 25 series. |
TRUSTEES AND OFFICERS – (Unaudited) (continued)
The following table provides information regarding the Officers of the Trust.
| Name, Address*, (Year of Birth), Position | | |
| with Trust, Term of Position with Trust | | Principal Occupation During Past 5 Years and Other Directorships |
| | | |
David R. Carson (1958)
President, January 2016 to present; Interested Trustee, August 2020 to present | | Current: Senior Vice President Client Strategies of Ultimus Fund Solutions, LLC, since 2013. |
| | | |
Zachary P. Richmond (1980)
Treasurer and Chief Financial Officer, November 2014 to present | | Current: Vice President, Director of Financial Administration for Ultimus Fund Solutions, LLC, since 2015. |
| | | |
Martin R. Dean (1963)
Vice President, November 2020 to present; Assistant Chief Compliance Officer, January 2016 to present | | Current: Vice President, Director of Fund Compliance of Ultimus Fund Solutions, LLC, since 2016. |
| | | |
Elisabeth Dahl (1962)
Secretary, May 2017 to present; Assistant Secretary, March 2016 to May 2017 | | Current: Attorney, Ultimus Fund Solutions, LLC since March 2016. |
| | | |
Stephen Preston (1966)
AML Compliance Officer, May 2017 to present | | Current: Vice President and Chief Compliance Officer, Ultimus Fund Solutions, LLC and Ultimus Fund Distributors, LLC, since 2011. |
| | | |
Lynn E. Wood (1946)
Chief Compliance Officer, October 2004 to present | | Current: Managing Member, Buttonwood Compliance Partners, LLC, since 2013. |
| | | |
| * | The address for each Officer is 225 Pictoria Drive, Suite 450, Cincinnati, Ohio 45246. |
INVESTMENT ADVISORY AGREEMENT APPROVAL – (Unaudited)
The Crawford Large Cap Dividend Fund (“Large Cap Fund”), the Crawford Small Cap Dividend Fund (“Small Cap Fund”), and the Crawford Multi-Asset Fund (“Multi-Asset Fund”) (together, the “Funds” and each, a “Fund”) are series of Unified Series Trust (the “Trust”). The Trust’s Board of Trustees (the “Board”) oversees the management of the Funds and, as required by law, has considered the approval of continuance of the Funds’ management agreements with their investment adviser, Crawford Investment Counsel, Inc. (“Crawford”).
The Board requested and evaluated all information that the Trustees deemed reasonably necessary under the circumstances in connection with the approval of the continuance of the management agreements.
The Trustees held a teleconference on August 13, 2020 to review and discuss materials compiled by Ultimus Fund Solutions, LLC, the Trust’s administrator, with regard to the management agreements between the Trust and Crawford. At the Trustees’ quarterly meeting held in August 2020, the Board interviewed certain executives of Crawford, including Crawford’s Chief Compliance Officer, and its Managing Director of Equity Investments, and its Chief Financial Officer. After discussion, the Trustees, including the Trustees who are not “interested persons” (as that term is defined in the Investment Company Act of 1940) of the Trust or Crawford (the “Independent Trustees”), approved the continuance of the management agreements between the Trust and Crawford for an additional year. The Trustees’ approval of the continuance of the Funds’ management agreements was based on a consideration of all the information provided to the Trustees, and was not the result of any single factor. Some of the factors that figured particularly in the Trustees’ deliberations are described below, although individual Trustees may have evaluated this information differently, ascribing different weights to various factors.
(i) The Nature, Extent, and Quality of Services. The Trustees reviewed and considered information regarding the nature, extent, and quality of services that Crawford provides to the Funds, which include, but are not limited to, providing a continuous investment program for the Funds, adhering to the Funds’ investment restrictions, complying with the Trust’s policies and procedures, and voting proxies on behalf of the Funds. The Trustees considered the qualifications and experience of Crawford’s portfolio managers who are responsible for the day-to-day management of the Funds’ portfolios, as well as the qualifications and experience of the other individuals at Crawford who provide services to the Funds. The Trustees considered a favorable report from the Trust CCO regarding compliance and other information provided by Crawford’s CCO with respect to recent investments in IT infrastructure and uses of PPP loan proceeds. The Trustees concluded that they were satisfied with the nature, extent, and quality of investment management services provided by Crawford to the Funds.
(ii) Fund Performance. The Trustees next reviewed and discussed the Funds’ performance for periods ended June 30, 2020. The Trustees discussed each Fund’s performance with management and concluded it was satisfied with each Fund’s performance and Crawford’s discussion and considerations related to any underperformance.
The Trustees observed that the Large Cap Fund Institutional Class had outperformed its benchmark, Russell 1000 Value Index, for the year-to-date and the one-, three-, and five-year periods but underperformed for the ten-year period. They noted that the Fund had underperformed the S&P 500 Index, and the average return of its Morningstar Large Blend Category, for each period. The Trustees also considered information about the Large Cap Fund’s performance against a peer group and a composite of other accounts managed by Crawford using a substantially similar strategy for the one-, three-, five- and ten-year periods, noting that the Large Cap Fund’s performance was higher than that of the composite for all periods except the ten-year period, where it was slightly lower than that of the composite.
The Trustees noted that the Small Cap Fund had underperformed its benchmark, the Russell 2000 Index, for the year-to-date and one-, and three-year periods, but outperformed for the five-year period. The Trustees noted that the Small Cap Fund had underperformed the average return of its Morningstar Small Blend Category for the year-to-date and one-year periods, but outperformed for the three- and five-year periods. The Trustees observed that the Small Cap Fund’s performance was fairly close to that of a composite of other accounts managed by Crawford using a substantially similar strategy for the one-, three- and five-year periods.
INVESTMENT ADVISORY AGREEMENT APPROVAL – (Unaudited) (continued)
The Trustees observed that the Multi-Asset Fund had outperformed its index, the NASDAQ U.S. Multi-Asset Diversified Income Index, for the year-to-date and one-year periods, but that it had underperformed the average return of its Morningstar Allocation 30%-50% Equity Category for both periods. The Trustees observed that the Multi-Asset Fund’s performance was fairly close to that of a composite of other accounts managed by Crawford using a substantially similar strategy for the one-year period. The Trustees noted Crawford’s discussion of how its Funds’ portfolios differ from the typical portfolios in the Funds’ comparison groups and considered the impact of each Fund’s Morningstar category on relative performance, given attributes of the other funds in the respective categories.
(iii) Fee Rate and Profitability. With respect to each Fund, the Trustees reviewed a fee and expense comparison for funds with a similar strategy and similarly sized. The Trustees observed that the gross management fee for the Large Cap Fund was lower than the average and median of funds in the Morningstar Large Blend Category and that net expenses were higher than the average and median. The Trustees observed that both the gross management fee and net expenses for the Small Cap Fund exceeded the average and median for funds in the Morningstar Small Blend Category. The Trustees observed that both the gross management fee and the net expenses for the Multi-Asset Fund were higher than the average and median of funds in the Morningstar Allocation 30%-50% Equity Category.
The Trustees also considered a profitability analysis prepared by Crawford for its management of the Funds, which indicated that, before the deduction of marketing expenses, Crawford is not earning a profit as a result of managing any of the Funds.
The Trustees recalled their review of the Large Cap Fund’s 12b-1 Plan at the meeting and considered other potential benefits that Crawford may receive in connection with its management of the Funds, including third-party research obtained by soft dollars, which may be used to benefit the Funds along with Crawford’s other advisory clients. After considering the above information, the Trustees concluded that the current advisory fee for each Fund represents reasonable compensation in light of the nature and quality of Crawford’s services to the Fund, the fees paid by competitive mutual funds, and the profitability of Crawford’s services to the Fund.
(iv) Economies of Scale. In determining the reasonableness of the management fees, the Trustees also considered the extent to which Crawford will realize economies of scale as a Fund grows larger. The Trustees determined that, in light of the size of the Funds and the fact that Crawford is not yet profitable in managing the Funds, Crawford is not realizing benefits from economies of scale in managing any Fund and therefore it is premature to reduce the management fee or introduce breakpoints at this time.
PRIVACY POLICY – (Unaudited)
Rev: January 2020
| FACTS | WHAT DO THE CRAWFORD FUNDS DO WITH YOUR PERSONAL INFORMATION? |
| |
| Why? | Financial companies choose how they share your personal information. Federal law gives consumers the right to limit some but not all sharing. Federal law also requires us to tell you how we collect, share, and protect your personal information. Please read this notice carefully to understand what we do. |
| |
| What? | The types of personal information we collect and share depend on the product or service you have with us. This information can include: ● Social Security number ● account balances and account transactions ● transaction or loss history and purchase history ● checking account information and wire transfer instructions When you are no longer our customer, we continue to share your information as described in this notice. |
| |
| How? | All financial companies need to share customers’ personal information to run their everyday business. In the section below, we list the reasons financial companies can share their customers’ personal information; the reasons the Crawford Funds chooses to share; and whether you can limit this sharing. |
| Reasons we can share your personal information | Do the Crawford
Funds share? |
For our everyday business purposes—
such as to process your transactions, maintain your account(s), respond to court orders and legal investigations, or report to credit bureaus | Yes |
For our marketing purposes—
to offer our products and services to you | No |
| For joint marketing with other financial companies | No |
For our affiliates’ everyday business purposes—
information about your transactions and experiences | No |
For our affiliates’ everyday business purposes—
information about your creditworthiness | No |
| For nonaffiliates to market to you | No |
| Questions? | Call (800) 431-1716 |
PRIVACY POLICY – (Unaudited) (continued)
| Who we are |
| Who is providing this notice? | Crawford Funds
Ultimus Fund Distributors, LLC (Distributor)
Ultimus Fund Solutions, LLC (Administrator) |
| What we do |
| How does the Crawford Funds protect my personal information? | To protect your personal information from unauthorized access and use, we use security measures that comply with federal law. These measures include computer safeguards and secured files and buildings. Our service providers are held accountable for adhering to strict policies and procedures to prevent any misuse of your nonpublic personal information. |
| How does the Crawford Funds collect my personal information? | We collect your personal information, for example, when you ● open an account or deposit money ● buy securities from us or sell securities to us ● make deposits or withdrawals from your account or provide account information ● give us your account information ● make a wire transfer ● tell us who receives the money ● tell us where to send the money ● show your government-issued ID ● show your driver’s license |
| Why can’t I limit all sharing? | Federal law gives you the right to limit only ● sharing for affiliates’ everyday business purposes—information about your creditworthiness ● affiliates from using your information to market to you ● sharing for nonaffiliates to market to you State laws and individual companies may give you additional rights to limit sharing. |
| Definitions |
| Affiliates | Companies related by common ownership or control. They can be financial and nonfinancial companies. ● Crawford Investment Counsel, Inc., the investment adviser to the Fund, could be deemed to be an affiliate. |
| Nonaffiliates | Companies not related by common ownership or control. They can be financial and nonfinancial companies. ● The Crawford Funds do not share your personal information with nonaffiliates so they can market to you |
| Joint marketing | A formal agreement between nonaffiliated financial companies that together market financial products or services to you. ● The Crawford Funds don’t jointly market. |
This page intentionally left blank.
This page intentionally left blank.
This page intentionally left blank.
OTHER INFORMATION
The Funds’ Statement of Additional Information (“SAI”) includes additional information about the trustees and is available without charge, upon request. You may call toll-free at (800) 431-1716 to request a copy of the SAI or to make shareholder inquiries.
PROXY VOTING
A description of the policies and procedures that each Fund uses to determine how to vote proxies relating to portfolio securities and information regarding how each Fund voted those proxies during the most recent twelve month period ended June 30, are available (1) without charge upon request by calling the Funds at (800) 431-1716 and (2) in Fund documents filed with the Securities and Exchange Commission (“SEC”) on the SEC’s website at www.sec.gov.
| TRUSTEES | INDEPENDENT REGISTERED PUBLIC |
| Kenneth G.Y. Grant, Chairman | ACCOUNTING FIRM |
| David R. Carson | Cohen & Company, Ltd. |
| Daniel J. Condon | 151 N Franklin Street, Suite 575 |
| Gary E. Hippenstiel | Chicago, IL 60606 |
| Stephen A. Little | |
| Ronald C. Tritschler | LEGAL COUNSEL |
| | Thompson Hine LLP |
| OFFICERS | 312 Walnut Street, 14th Floor |
| David R. Carson, President | Cincinnati, OH 45202 |
| Martin R. Dean, Vice President | |
| Zachary P. Richmond, | CUSTODIAN |
| Treasurer and Chief Financial Officer | Huntington National Bank |
| Lynn E. Wood, Chief Compliance Officer | 41 South High Street |
| | Columbus, OH 43215 |
| INVESTMENT ADVISER | |
| Crawford Investment Counsel, Inc. | ADMINISTRATOR, TRANSFER AGENT AND |
| 600 Galleria Parkway SE | FUND ACCOUNTANT |
| Suite 1650 | Ultimus Fund Solutions, LLC |
| Atlanta, GA 30339 | 225 Pictoria Drive, Suite 450 |
| | Cincinnati, OH 45246 |
| DISTRIBUTOR | |
| Ultimus Fund Distributors, LLC | |
| 225 Pictoria Drive, Suite 450 | |
| Cincinnati, OH 45246 | |
| | |
This report is intended only for the information of shareholders or those who have received the Funds’ prospectus which contains information about the Funds’ management fee and expenses. Please read the prospectus carefully before investing.
Distributed by Ultimus Fund Distributors, LLC
Member FINRA/SIPC
Crawford-AR-20

Selective Opportunity Fund
Foundation Class (SLCTX)
Service Class (SLCSX)
Selective Premium Income Fund
(SLCPX)
Annual Report
December 31, 2020
Selective Wealth Management, Inc.
828 Main Street, Suite 1101
Lynchburg, VA 24504
www.selectivewealthmanagement.com
Selective Opportunity Fund
Letter to Shareholders (Unaudited)
We can confidently say that 2020 was full of surprises. The global pandemic caused rapid changes to the fabric of our society, which in turn contributed to one of the most volatile years for the stock market in history. Through it all, the Selective Opportunity Fund (“Opportunity Fund”) ended the year with an investment performance of +7.73% compared to +18.40% for the S&P 500® Index (“S&P 500”).
| | Opportunity | | |
| Year | Fund | S&P 500 | Relative |
| 2020 | +7.73% | +18.40% | -10.67% |
Our investment philosophy at Selective is simple: Buy the world’s most dominant businesses at attractive prices. This simple philosophy was particularly difficult to execute in 2020. The high degree of uncertainty, elevated asset prices, and global pandemic made this one of the most difficult years to navigate in history. Covid-19 caused wild swings for economies around the world. The U.S. Real GDP, which typically crawls at a glacial pace of 2-3% per year, swung more than 30 percentage points in Q2 and Q3 (down, then up).1 This level of economic volatility has not been seen in the United States since the Federal Reserve began reporting GDP data in 1930.2 Oddly enough, by the end of the second quarter, GDP was down 31% quarter-over-quarter, and the S&P 500 was twice as expensive as the historical average of the last 40 years.3 The combination of high prices, disastrous economic results, and a dangerous global pandemic led to our decision to be conservative. We accumulated cash, sold covered calls to protect the downside (and capped our upside), and purchased puts on the S&P 500 to hedge against the worst. Our logic was simple – if asset prices declined, we believed we would protect our client’s investments and outperform the market, if asset prices rose, we would make money for our clients, but underperform the market. We felt this was a prudent course of action.
Around this time the U.S. government stepped in with the largest stimulus relief package in history. In just 90 days the U.S. added $5 trillion dollars of national debt, more than the first 219 years of our nation’s history combined.4 Interest rates were slashed to zero
| 1 | U.S. Department of Commerce, Bureau of Economic Analysis, https://www.bea.gov/news/glance |
| 2 | https://www.thebalance.com/national-debt-by-year-compared-to-gdp-and-major-events-3306287 |
| 3 | The P/E ratio of the S&P 500 was 32.33 July 1, 2020 vs a historical average of 15.88, https://www.multpl.com/s-p-500-pe-ratio/table/by-month |
| 4 | U.S. Department of Commerce, Burea of Economic Analysis, https://www.bea.gov/ & https://www.thebalance.com/national-debt-by-year-compared-to-gdp-and-major-events-3306287 |
and the federal reserve purchased $7 trillion in bonds on the open market – nearly double the amount spent during the Financial Crisis.5 The dramatic measures taken by the U.S. government saved tens of millions of jobs, rescued our economy from collapse, and the already expensive stock market rocketed upward.
This series of events made it difficult to find Selective Companies at attractive prices. The 1-Year U.S. Treasury, considered a risk-free investment, yields 0.10%. The highest rated corporate debt, Moody’s Aaa rated bonds, yields 2.22%. The poorest quality debt that is still considered investment grade, Moody’s Baa, is yielding only 3.13%. Inflation adjusted returns for these asset classes promise very poor results for investors.
Federal Reserve Target Inflation Rate: 2.25%6
| Asset Class | Yield | Real Return |
| 1-Year U.S. Treasury | 0.10%7 | -2.15% |
| Highest Quality Debt | 2.22%8 | -0.03% |
| Lowest Investment Grade Debt | 3.13%9 | 0.88% |
The lack of investment opportunities is forcing investors to buy stocks, which has pushed the market to record levels. Achieving our simple investment objective – buying the world’s best businesses at attractive prices – will require patience in 2021. The highest quality businesses on our Selective Watchlist are priced at more than 200x earnings. For this reason, we purchased nothing in the back half of the year. We have positioned the Opportunity Fund conservatively with 28% cash and an additional 53% of the portfolio in covered calls and cash covered puts. The covered calls and S&P 500 put position negatively impacted overall portfolio performance by more than 10%, but we are pleased with this disciplined approach. We believe now is a perfect time to remember Warren Buffett’s words of wisdom, “Be greedy when others are fearful, and be fearful when others are greedy.”10
| 5 | https://www.cnbc.com/2020/03/23/fed-is-helping-the-markets-more-than-it-did-during-the-financial-crisis.html |
| 6 | Brookings Educational, https://www.brookings.edu/blog/up-front/2020/09/02/what-do-changes-in-the-feds-longer-run-goals-and-monetary-strategy-statement-mean |
| 7 | U.S. Treasury Resource Center, https://www.treasury.gov/resource-center/data-chart-center/interest-rates/ Pages/TextView.aspx?data=yield |
| 8 | Y-Charts, https://ycharts.com/indicators/moodys_seasoned_aaa_corporate_bond_yield |
| 9 | Y-Charts, https://ycharts.com/indicators/moodys_seasoned_baa_corporate_bond_yield |
| 10 | https://www.investopedia.com/articles/investing/012116/warren-buffett-be-fearful-when-others-are-greedy |
Our Annual Letter each year contains the guiding principles that are the foundation of our Selective Process. Our aim is to purchase world class companies - which are those that we believe possess six common characteristics:
| ● | Enduring Product or Service |
Selective Companies provide goods or services that endure the test of time. We attempt to purchase companies that will be operating in substantially the same way in five years, ten years and beyond.
Selective Companies demonstrate consistent profitability - earning more than 20% on invested capital. We believe that when earnings are retained and reinvested at rates above 20%, it produces good long-term results for owners of the business.
Selective Companies possess a competitive advantage through an economic moat that we understand. Moats include market dynamics such as high switching costs, network effects, or price leadership, to name a few.
Selective Companies typically operate with little or no debt. We prefer companies with strong cash positions that take advantage of market opportunities during economic downturns.
| ● | Skillful Reinvestment of Earnings |
Selective Companies skillfully reinvest profits through thoughtful capital allocation practices – balancing the ROI between dividends, share repurchases, and retained earnings.
Selective Companies are led by world class leaders and develop cultures that are beneficial for all stakeholders.
We intend to hold our Selective Companies for long periods of time and would not give too much weight to the short-term fluctuations of the market. We encourage shareholders to focus more on the operating results of the Selective Companies they own, and less on short-term price movements of the Fund shares.
Selective Premium Income Fund Letter to Shareholders (Unaudited) |
The Selective Premium Income Fund (“Income Fund”) was open for a partial year in 2020 and performed as expected. The Income Fund increased +1.40% for the period from inception on March 31, 2020 through December 31, 2020, well above the 1-year U.S. Treasury yield of 0.10%, and compared to +4.23% for the Bloomberg Barclays U.S. Aggregate Bond Index. Due to the extreme uncertainty associated with the global pandemic we operated the Income Fund with caution holding an average cash balance of more than 70% throughout the year. The global pandemic drove up asset prices, both stocks and bonds, to record levels. We exercised caution while attempting to achieve our investment objective. The Income Fund held roughly 70% cash on average during 2020 and operated for a partial year, which contributed to the under performance of the stated benchmarks. As of December 31, 2020, the 1-Year U.S. Treasury, considered a risk-free investment, yields 0.10%. The highest rated corporate debt, Moody’s Aaa rated bonds, yields 2.22%. The poorest quality debt that is still considered investment grade, Moody’s Baa, is yielding only 3.13%. The Premium Income Fund has a duration of less than 12 months with all option positions being less than one-year out. We believe this shorter duration provides protection against rising interest rates, if they were to occur.
| Asset Class | Yield |
| 1-Year US Treasury | 0.10% 1 |
| Highest Quality Debt | 2.22% 2 |
| Lowest Investment Grade Debt | 3.13% 3 |
| 1 | US Treasury Resource Center, https://www.treasury.gov/resource-center/data-chart-center/interest-rates/ Pages/TextView.aspx?data=yield |
| 2 | Y-Charts, https://ycharts.com/indicators/moodys_seasoned_aaa_corporate_bond_yield |
| 3 | Y-Charts, https://ycharts.com/indicators/moodys_seasoned_baa_corporate_bond_yield |
| Investment Results (Unaudited) |
| |
| Average Annual Total Returns(a) |
| (for the periods ended December 31, 2020) |
| | | | | | Since |
| | | One Year | | Inception |
| Selective Opportunity Fund | | | | | | |
| Foundation Class | | | 7.73 | % | | | 15.47 | % |
| Service Class | | | 7.58 | % | | | 15.36 | % |
| S&P 500® Index (b) | | | 18.40 | % | | | 15.86 | % |
| | | | | | | | | |
| | | Expense | | | | |
| | | Ratios(c) | | | | |
| Foundation Class | | | 0.93 | % | | | | |
| Service Class | | | 1.03 | % | | | | |
The performance quoted represents past performance, which does not guarantee future results. The investment return and principal value of an investment will fluctuate so that an investor’s shares, when redeemed, may be worth more or less than their original cost. The returns shown do not reflect deduction of taxes that a shareholder would pay on Selective Opportunity Fund (“Opportunity Fund”) distributions or the redemption of Opportunity Fund shares. Current performance of the Opportunity Fund may be lower or higher than the performance quoted. For more information on the Opportunity Fund, and to obtain performance data current to the most recent month end or to request a prospectus, please call (434) 515-1517.
| (a) | Return figures reflect any change in price per share and assume the reinvestment of all capital gains and dividend distributions. The Foundation Class commenced operations on January 31, 2017. The Service Class commenced operations on March 16, 2018. Prior to March 16, 2018, performance of the Service Class is based on the performance of the Foundation Class and has been adjusted to reflect differences in expenses between classes. |
| (b) | The S&P 500® Index (“S&P 500”) is a widely recognized unmanaged index of equity securities and is representative of a broader domestic equity market and range of securities than is found in the Opportunity Fund’s portfolio. Individuals cannot invest directly in the S&P 500; however, an individual can invest in exchange-traded funds or other investment vehicles that attempt to track the performance of a benchmark index. |
| (c) | The expense ratios, which include acquired fund fees and expenses of 0.01% for each class, are from the Opportunity Fund’s prospectus dated April 29, 2020. The Opportunity Fund’s expense ratios (which did not include acquired fund fees and expenses) were 1.03% for the Foundation Class and 1.11% for the Service Class for the fiscal year ended December 31, 2020. |
You should consider the Opportunity Fund’s investment objectives, risks, charges and expenses carefully before you invest. The Opportunity Fund’s prospectus contains important information about the Opportunity Fund’s investment objectives, potential risks, management fees, charges and expenses, and other information and should be read carefully before investing. You may obtain a current copy of the Opportunity Fund’s prospectus or performance data current to the most recent month by calling (434) 515-1517.
The Opportunity Fund is distributed by Ultimus Fund Distributors, LLC, member FINRA/SIPC.
Investment Results (Unaudited) (continued)
Comparison of the Growth of a $10,000 Investment in the Selective
Opportunity Fund - Foundation Class, and the S&P 500® Index.
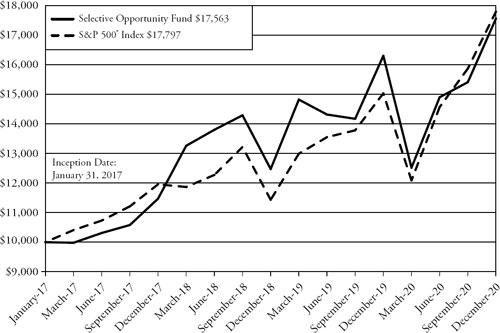
The chart above assumes an initial investment of $10,000 made on January 31, 2017 (commencement of operations) for the Opportunity Fund’s Foundation Class and held through December 31, 2020. The S&P 500® Index is a widely recognized unmanaged index of equity prices and is representative of a broader market and range of securities than is found in the Opportunity Fund’s portfolio. Individuals cannot invest directly in an index; however, an individual may invest in exchange-traded funds or other investment vehicles that attempt to track the performance of a benchmark index. THE OPPORTUNITY FUND’S RETURNS REPRESENT PAST PERFORMANCE AND DO NOT GUARANTEE FUTURE RESULTS. The returns shown do not reflect deduction of taxes that a shareholder would pay on Opportunity Fund distributions or the redemption of Opportunity Fund shares. Investment returns and principal values will fluctuate so that your shares, when redeemed, may be worth more or less than their original purchase price.
Current performance may be lower or higher than the performance data quoted. For more information on the Opportunity Fund, and to obtain performance data current to the most recent month-end, or to request a prospectus, please call (434) 515-1517. You should carefully consider the investment objectives, potential risks, management fees, and charges and expenses of the Opportunity Fund before investing. The Opportunity Fund’s prospectus contains this and other information about the Opportunity Fund and should be read carefully before investing.
The Opportunity Fund is distributed by Ultimus Fund Distributors, LLC, member FINRA/SIPC.
Investment Results (Unaudited) (continued)
Total Returns(a)
(for the period ended December 31, 2020)
| | | Since |
| | | Inception |
| | | (3/31/20) |
| Selective Premium Income Fund | | | 1.40 | % |
| Bloomberg Barclays U.S. Aggregate Bond Index (b) | | | 4.23 | % |
| | | | | |
| | | Expense |
| | | | Ratio(c) |
| Selective Premium Income Fund | | | 1.60 | % |
The performance quoted represents past performance, which does not guarantee future results. The investment return and principal value of an investment will fluctuate so that an investor’s shares, when redeemed, may be worth more or less than their original cost. The returns shown do not reflect deduction of taxes that a shareholder would pay on Selective Premium Income Fund (“Income Fund”) distributions or the redemption of Income Fund shares. Current performance of the Income Fund may be lower or higher than the performance quoted. For more information on the Income Fund, and to obtain performance data current to the most recent month end or to request a prospectus, please call (800) 985-3497.
| (a) | Return figures reflect any change in price per share and assume the reinvestment of all capital gains and dividend distributions. Total returns for periods less than one year are not annualized. |
| (b) | The Bloomberg Barclays U.S. Aggregate Bond Index (“Index”) is an unmanaged index that assumes reinvestment of all distributions and exclude the effect of taxes and fees. The Index is widely recognized as an unmanaged index and is representative of a broader market and range of securities than is found in the Income Fund’s portfolio. The return of the Index is not reduced by any fees or operating expenses. Individuals cannot invest directly in the Index; however, an individual can invest in exchange-traded funds or other investment vehicles that attempt to track the performance of a benchmark index. |
| (c) | The expense ratio, which includes acquired fund fees and expenses of 0.01% for the Income Fund, is from the Income Fund’s prospectus dated March 4, 2019 (as amended June 21, 2019 and February 28, 2020). The Income Fund’s expense ratios (excluding acquired fund fees and expenses) were 2.33% before reimbursement and 1.50% after reimbursement for the period ended December 31, 2020. |
You should consider the Income Fund’s investment objectives, risks, charges and expenses carefully before you invest. The Income Fund’s prospectus contains important information about the Income Fund’s investment objectives, potential risks, management fees, charges and expenses, and other information and should be read carefully before investing. You may obtain a current copy of the Income Fund’s prospectus or performance data current to the most recent month by calling (800) 985-3497.
The Income Fund is distributed by Ultimus Fund Distributors, LLC, member FINRA/SIPC.
Investment Results (Unaudited) (continued)
Comparison of the Growth of a $10,000 Investment in the Selective
Premium Income Fund and the Bloomberg Barclays U.S. Aggregate Bond Index

The chart above assumes an initial investment of $10,000 made on March 31, 2020 (commencement of operations) for the Income Fund and held through December 31, 2020. The Bloomberg Barclays U.S. Aggregate Bond Index is a widely recognized unmanaged index of equity prices and is representative of a broader market and range of securities than is found in the Income Fund’s portfolio. Individuals cannot invest directly in an index; however, an individual may invest in exchange-traded funds or other investment vehicles that attempt to track the performance of a benchmark index. THE INCOME FUND’S RETURNS REPRESENT PAST PERFORMANCE AND DO NOT GUARANTEE FUTURE RESULTS. The returns shown do not reflect deduction of taxes that a shareholder would pay on Income Fund distributions or the redemption of Income Fund shares. Investment returns and principal values will fluctuate so that your shares, when redeemed, may be worth more or less than their original purchase price.
Current performance may be lower or higher than the performance data quoted. For more information on the Income Fund, and to obtain performance data current to the most recent month-end, or to request a prospectus, please call (800) 985-3497. You should carefully consider the investment objectives, potential risks, management fees, and charges and expenses of the Income Fund before investing. The Income Fund’s prospectus contains this and other information about the Income Fund and should be read carefully before investing.
The Income Fund is distributed by Ultimus Fund Distributors, LLC, member FINRA/SIPC.
Fund Holdings (Unaudited)
Selective Opportunity Fund Holdings as of December 31, 2020(a)
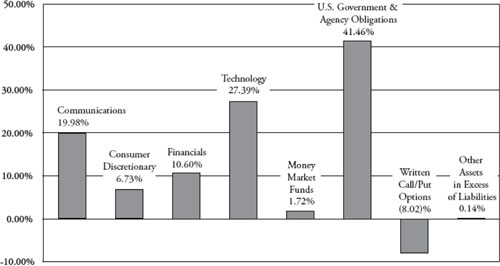
| (a) | As a percentage of net assets. |
The investment objective of the Selective Opportunity Fund is maximizing long-term returns while protecting client principal.
Fund Holdings (Unaudited) (continued)
Selective Premium Income Fund Holdings as of December 31, 2020(a)
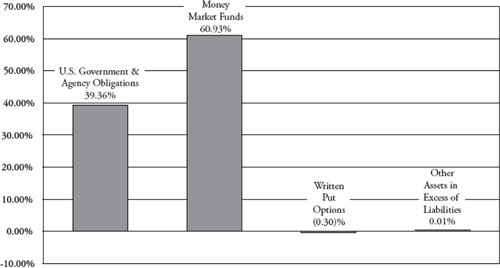
| (a) | As a percentage of net assets. |
The investment objective of the Selective Premium Income Fund is generating income while protecting principal.
Availability of Portfolio Schedules (Unaudited)
The Funds file their complete schedules of portfolio holdings with the Securities and Exchange Commission (“SEC”) for the first and third quarters of each fiscal year as an exhibit to its reports on Form N-PORT. The Funds’ Form N-PORT reports are available on the SEC’s website at http://www.sec.gov.
| Selective Opportunity Fund |
| Schedule of Investments |
| December 31, 2020 |
| | | Shares | | | Fair Value | |
| COMMON STOCKS — 64.70% | | | | | | | | |
| | | | | | | | | |
| Communications — 19.98% | | | | | | | | |
| Alphabet, Inc., Class C(a)(b) | | | 8,200 | | | $ | 14,365,416 | |
| Baidu, Inc. - ADR (China)(a)(b) | | | 43,500 | | | | 9,406,440 | |
| Facebook, Inc., Class A(a)(b) | | | 27,200 | | | | 7,429,952 | |
| | | | | | | | 31,201,808 | |
| Consumer Discretionary — 6.73% | | | | | | | | |
| Alibaba Group Holding Ltd. - ADR (China)(a)(b) | | | 45,200 | | | | 10,519,396 | |
| | | | | | | | | |
| Financials — 10.60% | | | | | | | | |
| Bank of the Ozarks, Inc.(b) | | | 529,367 | | | | 16,553,306 | |
| | | | | | | | | |
| Technology — 27.39% | | | | | | | | |
| Blue Prism Group PLC (United Kingdom)(a) | | | 833,967 | | | | 19,616,044 | |
| Cognizant Technology Solutions Corp., Class A(b) | | | 75,300 | | | | 6,170,835 | |
| Optiva, Inc. (Canada)(a) | | | 102,963 | | | | 2,824,884 | |
| Splunk, Inc.(a)(b) | | | 83,400 | | | | 14,168,826 | |
| | | | | | | | 42,780,589 | |
| Total Common Stocks (Cost $68,294,797) | | | | | | | 101,055,099 | |
| | | | | | | | | |
| MONEY MARKET FUNDS — 1.72% | | | | | | | | |
| | | | | | | | | |
| BlackRock Liquidity Funds Treasury Trust Fund, Institutional Class, 0.01%(c) | | | 2,692,538 | | | | 2,692,538 | |
| Total Money Market Funds (Cost $2,692,538) | | | | | | | 2,692,538 | |
See accompanying notes which are an integral part of these financial statements.
| Selective Opportunity Fund |
| Schedule of Investments (continued) |
| December 31, 2020 |
| | | Principal | | | | |
| | | Amount | | | Fair Value | |
| U.S. GOVERNMENT & AGENCY OBLIGATIONS — 41.46% | | | | | | | | |
| | | | | | | | | |
| United States Cash Management Bill, 0.09%, 2/9/2021(b) (d) | | $ | 15,941,000 | | | $ | 15,940,442 | |
| United States Treasury Note, 1.88%, 2/28/2022(b) | | | 47,834,000 | | | | 48,811,234 | |
| Total U.S. Government & Agency Obligations (Cost $64,754,594) | | | | | | | 64,751,676 | |
| | | | | | | | | |
| Total Investments — 107.88% (Cost $135,741,929) | | | | | | | 168,499,313 | |
| Liabilities in Excess of Other Assets — (7.88)% | | | | | | | (12,308,953 | ) |
| NET ASSETS — 100.00% | | | | | | $ | 156,190,360 | |
| (a) | Non-income producing security. |
| (b) | All or a portion of the security is held as collateral for unsettled security transactions, written put options and written call options. |
| (c) | Rate disclosed is the seven day effective yield as of December 31, 2020. |
| (d) | Discount security. Rate shown is the effective yield at time of purchase. |
ADR – American Depositary Receipt
| Selective Opportunity Fund |
| Schedule of Open Written Option Contracts |
| December 31, 2020 |
| | | Number of | | | Notional | | | Exercise | | | | | | |
| | | Contracts | | | Amount | | | Price | | | Expiration Date | | Fair Value | |
| WRITTEN CALL OPTIONS — (5.20)% | | | | | | | | | |
| Alibaba Group Holding Ltd. | | | (452) | | | $ | (10,519,396 | ) | | $ | 240.00 | | | January 15, 2021 | | $ | (183,060 | ) |
| Alphabet, Inc. | | | (82) | | | | (14,365,416 | ) | | | 1,620.00 | | | January 15, 2021 | | | (1,085,270 | ) |
| Baidu, Inc. | | | (435) | | | | (9,406,440 | ) | | | 120.00 | | | January 15, 2021 | | | (4,154,250 | ) |
| Cognizant Technology Solutions Corp. | | | (753) | | | | (6,170,835 | ) | | | 60.00 | | | January 15, 2021 | | | (1,664,130 | ) |
| Facebook, Inc. | | | (272) | | | | (7,429,952 | ) | | | 240.00 | | | January 15, 2021 | | | (876,112 | ) |
| Splunk, Inc. | | | (834) | | | | (14,168,826 | ) | | | 180.00 | | | January 15, 2021 | | | (153,456 | ) |
| Total Written Call Options (Premiums Received $2,388,377) | | | | | | | | (8,116,278 | ) |
| | | | | | | | | | | | | | | | | | | |
| WRITTEN PUT OPTIONS — (2.82)% | | | | | | | | | |
| Nutanix, Inc. | | | (3,113) | | | | (9,921,131 | ) | | | 35.00 | | | January 15, 2021 | | | (961,917 | ) |
| Nutanix, Inc. | | | (2,106) | | | | (6,711,822 | ) | | | 17.50 | | | January 21, 2022 | | | (344,331 | ) |
| Nutanix, Inc. | | | (7,605) | | | | (24,237,135 | ) | | | 25.00 | | | January 21, 2022 | | | (3,099,038 | ) |
| Total Written Put Options (Premiums Received $10,508,696) | | | | | | | | (4,405,286 | ) |
| Total Written Options (Premiums Received $12,897,073) | | | | | | | $ | (12,521,564 | ) |
See accompanying notes which are an integral part of these financial statements.
| Selective Premium Income Fund |
| Schedule of Investments |
| December 31, 2020 |
| | | Principal | | | | |
| | | Amount | | | Fair Value | |
| U.S. GOVERNMENT & AGENCY OBLIGATIONS — 39.36% | | | | | | | | |
| | | | | | | | | |
| United States Treasury Bill, 0.14%, 1/7/2021(a) | | $ | 405,000 | | | $ | 404,999 | |
| United States Treasury Bill, 0.10%, 1/28/2021(a) (b) | | | 3,390,000 | | | | 3,389,892 | |
| United States Treasury Bill, 0.13%, 2/25/2021(a) | | | 689,000 | | | | 688,943 | |
| United States Treasury Bill, 0.08%, 3/4/2021(a) | | | 310,000 | | | | 309,970 | |
| United States Treasury Bill, 0.08%, 5/20/2021(a) | | | 315,000 | | | | 314,915 | |
| United States Treasury Note, 1.13%, 2/28/2022(a) | | | 722,000 | | | | 730,574 | |
| Total U.S. Government & Agency Obligations (Cost $5,838,619) | | | | | | | 5,839,293 | |
| | | | | | | | | |
| | | Shares | | | | | |
| MONEY MARKET FUNDS — 60.93% | | | | | | | | |
| | | | | | | | | |
| BlackRock Liquidity Funds Treasury Trust Fund, Institutional Class, 0.01%(c) | | | 9,038,091 | | | | 9,038,091 | |
| Total Money Market Funds (Cost $9,038,091) | | | | | | | 9,038,091 | |
| | | | | | | | | |
| Total Investments — 100.29% (Cost $14,876,710) | | | | | | | 14,877,384 | |
| Liabilities in Excess of Other Assets — (0.29)% | | | | | | | (43,162 | ) |
| NET ASSETS — 100.00% | | | | | | $ | 14,834,222 | |
| (a) | Discount security. Rate shown is the effective yield at time of purchase. |
| (b) | All or a portion of the security is held as collateral for unsettled security transactions and written put options. |
| (c) | Rate disclosed is the seven day effective yield as of December 31, 2020. |
| Selective Premium Income Fund |
| Schedule of Open Written Option Contracts |
| December 31, 2020 |
| | | Number of | | | Notional | | | Exercise | | | | | | |
| | | Contracts | | | Amount | | | Price | | | Expiration Date | | Fair Value | |
| WRITTEN PUT OPTIONS — (0.30)% | | | | | | | | | |
| CVS Caremark Corp. | | | (59) | | | $ | (402,970 | ) | | | 50.00 | | | February 19, 2021 | | $ | (531 | ) |
| Intel Corp. | | | (75) | | | | (373,650 | ) | | | 40.00 | | | April 16, 2021 | | | (5,625 | ) |
| Nutanix, Inc. | | | (550) | | | | (1,752,850 | ) | | | 12.50 | | | January 21, 2022 | | | (35,475 | ) |
| salesforce.com, Inc. | | | (22) | | | | (489,566 | ) | | | 110.00 | | | January 15, 2021 | | | (66 | ) |
| Upwork, Inc. | | | (551) | | | | (1,902,052 | ) | | | 7.50 | | | January 15, 2021 | | | (2,755 | ) |
| Total Written Put Options (Premiums Received $217,415) | | | | | | | $ | (44,452 | ) |
See accompanying notes which are an integral part of these financial statements.
| Selective Funds |
| Statements of Assets and Liabilities |
| December 31, 2020 |
| | | Selective | | | Selective Premium | |
| | | Opportunity Fund | | | Income Fund | |
| Assets | | | | | | |
| Investments in securities at fair value (cost $135,741,929 and $14,876,710) | | $ | 168,499,313 | | | $ | 14,877,384 | |
| Cash held at broker for option contract transactions | | | 19,806 | | | | 22,366 | |
| Dividends and interest receivable | | | 302,351 | | | | 2,891 | |
| Deferred offering cost | | | — | | | | 4,050 | |
| Prepaid expenses | | | 16,163 | | | | 6,221 | |
| Total Assets | | | 168,837,633 | | | | 14,912,912 | |
| Liabilities | | | | | | | | |
| Options written, at fair value (premiums received $12,897,073 and $217,415) | | | 12,521,564 | | | | 44,452 | |
| Payable to Adviser | | | 65,529 | | | | 1,194 | |
| Payable to Administrator | | | 21,588 | | | | 6,324 | |
| Payable for administrative services fee | | | 7,225 | | | | 1,265 | |
| Other accrued expenses | | | 31,367 | | | | 25,455 | |
| Total Liabilities | | | 12,647,273 | | | | 78,690 | |
| Net Assets | | $ | 156,190,360 | | | $ | 14,834,222 | |
| Net Assets consist of: | | | | | | | | |
| Paid-in capital | | $ | 127,032,747 | | | $ | 14,624,213 | |
| Accumulated earnings | | | 29,157,613 | | | | 210,009 | |
| Net Assets | | $ | 156,190,360 | | | $ | 14,834,222 | |
| Net Assets: Foundation Class | | $ | 69,126,403 | | | | | |
| Shares outstanding (unlimited number of shares authorized, no par value) | | | 5,013,720 | | | | | |
| Net asset value (“NAV”), offering and redemption price per share | | $ | 13.79 | | | | | |
| Net Assets: Service Class | | $ | 87,063,957 | | | | | |
| Shares outstanding (unlimited number of shares authorized, no par value) | | | 6,320,694 | | | | | |
| Net asset value (“NAV”), offering and redemption price per share | | $ | 13.77 | | | | | |
| Net Assets: | | | | | | $ | 14,834,222 | |
| Shares outstanding (unlimited number of shares authorized, no par value) | | | | | | | 1,463,604 | |
| Net asset value (“NAV”), offering and redemption price per share | | | | | | $ | 10.14 | |
See accompanying notes which are an integral part of these financial statements.
| Selective Funds |
| Statements of Operations |
| For the year ended December 31, 2020 |
| | | Selective | | | Selective Premium | |
| | | Opportunity Fund | | | Income Fund(a) | |
| Investment Income | | | | | | | | |
| Dividend income | | $ | 669,580 | | | $ | 1,745 | |
| Interest income | | | 93,682 | | | | 7,787 | |
| Total investment income | | | 763,262 | | | | 9,532 | |
| Expenses | | | | | | | | |
| Adviser | | | 719,178 | | | | 50,396 | |
| Interest | | | 210,427 | | | | 1,358 | |
| Administration | | | 121,260 | | | | 18,000 | |
| Administrative services fees, Service Class | | | 63,007 | | | | — | |
| Fund accounting | | | 59,624 | | | | 20,809 | |
| Transfer agent | | | 30,000 | | | | 9,000 | |
| Registration | | | 24,619 | | | | 3,469 | |
| Legal | | | 20,396 | | | | 16,923 | |
| Audit and tax preparation | | | 18,600 | | | | 18,600 | |
| Custodian | | | 17,471 | | | | 4,583 | |
| Compliance services | | | 14,790 | | | | 9,000 | |
| Trustee | | | 12,896 | | | | 9,808 | |
| Report printing | | | 9,942 | | | | 2,394 | |
| Administrative services fees | | | — | | | | 9,517 | |
| Offering | | | — | | | | 13,468 | |
| Organizational | | | — | | | | 26,883 | |
| Miscellaneous | | | 33,521 | | | | 20,374 | |
| Total expenses | | | 1,355,731 | | | | 234,582 | |
| Fees waived and expenses reimbursed by Adviser | | | — | | | | (83,597 | ) |
| Net operating expenses | | | 1,355,731 | | | | 150,985 | |
| Net investment loss | | | (592,469 | ) | | | (141,453 | ) |
| Net Realized and Change in Unrealized Gain (Loss) on Investments | | | | | | | | |
| Net realized gain (loss) on: | | | | | | | | |
| Investment securities | | $ | (4,979,931 | ) | | $ | (446 | ) |
| Written options | | | 1,279,135 | | | | 164,802 | |
| Net increase from payments by Administrator for investment losses | | | 5,588 | | | | — | |
| Foreign currency translations | | | (52,763 | ) | | | — | |
| Change in unrealized appreciation on: | | | | | | | | |
| Investment securities | | | 17,975,322 | | | | 674 | |
| Written options | | | 3,070,330 | | | | 172,963 | |
| Net realized and change in unrealized gain on investments, written options and foreign currency | | | 17,297,681 | | | | 337,993 | |
| Net increase in net assets resulting from operations | | $ | 16,705,212 | | | $ | 196,540 | |
| (a) | For the period March 31, 2020 (commencement of operations) to December 31, 2020. |
See accompanying notes which are an integral part of these financial statements.
| Selective Funds |
| Statements of Changes in Net Assets |
| | | Selective | | | Selective Premium | |
| | | Opportunity Fund | | | Income Fund | |
| | | For the | | | For the | | | For the | |
| | | Year Ended | | | Year Ended | | | Period Ended | |
| | | December 31, | | | December 31, | | | December 31, | |
| | | 2020 | | | 2019 | | | 2020(a) | |
| Increase (Decrease) in Net Assets due to: | | | | | | | | | | | | |
| Operations | | | | | | | | | | | | |
| Net investment loss | | $ | (592,469 | ) | | $ | (249,182 | ) | | $ | (141,453 | ) |
| Net realized gain (loss) on investment securities, written options and foreign currency translations | | | (3,753,559 | ) | | | 5,424,714 | | | | 164,356 | |
| Net increase from payments by Administrator for investment losses | | | 5,588 | | | | — | | | | — | |
| Net change in unrealized appreciation of investment securities | | | 21,045,652 | | | | 18,139,578 | | | | 173,637 | |
| Net increase in net assets resulting from operations | | | 16,705,212 | | | | 23,315,110 | | | | 196,540 | |
| Distributions to Shareholders from Earnings | | | | | | | | | | | | |
| Foundation Class | | | — | | | | (3,467,085 | ) | | | — | |
| Service Class | | | — | | | | (2,074,257 | ) | | | — | |
| Total distributions | | | — | | | | (5,541,342 | ) | | | — | |
| Capital Transactions | | | | | | | | | | | | |
| Proceeds from shares sold | | | | | | | | | | | 14,777,784 | |
| Amount paid for shares redeemed | | | | | | | | | | | (140,102 | ) |
| Total | | | | | | | | | | | 14,637,682 | |
| Capital Transactions - Foundation Class | | | | | | | | | | | | |
| Proceeds from shares sold | | | 3,349,440 | | | | 5,401,889 | | | | | |
| Reinvestment of distributions | | | — | | | | 3,467,085 | | | | | |
| Amount paid for shares redeemed | | | (5,605,791 | ) | | | (5,684,612 | ) | | | | |
| Total – Foundation Class | | | (2,256,351 | ) | | | 3,184,362 | | | | | |
| Capital Transactions - Service Class | | | | | | | | | | | | |
| Proceeds from shares sold | | | 38,156,259 | | | | 14,335,142 | | | | | |
| Reinvestment of distributions | | | — | | | | 2,074,257 | | | | | |
| Amount paid for shares redeemed | | | (2,450,077 | ) | | | (2,397,670 | ) | | | | |
| Total – Service Class | | | 35,706,182 | | | | 14,011,729 | | | | | |
| Net increase in net assets resulting from capital transactions | | | 33,449,831 | | | | 17,196,091 | | | | 14,637,682 | |
| Total Increase in Net Assets | | | 50,155,043 | | | | 34,969,859 | | | | 14,834,222 | |
| Net Assets | | | | | | | | | | | | |
| Beginning of period | | | 106,035,317 | | | | 71,065,458 | | | | — | |
| End of period | | $ | 156,190,360 | | | $ | 106,035,317 | | | $ | 14,834,222 | |
See accompanying notes which are an integral part of these financial statements.
| Selective Funds |
| Statements of Changes in Net Assets (continued) |
| | | Selective | | | Selective Premium | |
| | | Opportunity Fund | | | Income Fund | |
| | | For the | | | For the | | | For the | |
| | | Year Ended | | | Year Ended | | | Period Ended | |
| | | December 31, | | | December 31, | | | December 31, | |
| | | 2020 | | | 2019 | | | 2020(a) | |
| Share Transactions | | | | | | | | | | | | |
| Shares sold | | | | | | | | | | | 1,477,454 | |
| Shares redeemed | | | | | | | | | | | (13,850 | ) |
| Total | | | | | | | | | | | 1,463,604 | |
| Share Transactions - Foundation Class | | | | | | | | | | | | |
| Shares sold | | | 289,307 | | | | 445,779 | | | | | |
| Shares issued in reinvestment of distributions | | | — | | | | 276,924 | | | | | |
| Shares redeemed | | | (433,984 | ) | | | (468,146 | ) | | | | |
| Total – Foundation Class | | | (144,677 | ) | | | 254,557 | | | | | |
| Share Transactions - Service Class | | | | | | | | | | | | |
| Shares sold | | | 3,406,521 | | | | 1,192,382 | | | | | |
| Shares issued in reinvestment of distributions | | | — | | | | 165,675 | | | | | |
| Shares redeemed | | | (209,829 | ) | | | (193,160 | ) | | | | |
| Total – Service Class | | | 3,196,692 | | | | 1,164,897 | | | | | |
| Net increase in shares outstanding | | | 3,052,015 | | | | 1,419,454 | | | | 1,463,604 | |
| (a) | For the period March 31, 2020 (commencement of operations) to December 31, 2020. |
See accompanying notes which are an integral part of these financial statements.
| Selective Opportunity Fund - Foundation Class |
| Financial Highlights |
| (For a share outstanding during each period) |
| | | For the | | | For the | | | For the | | | For the | |
| | | Year Ended | | | Year Ended | | | Year Ended | | | Period Ended | |
| | | December 31, | | | December 31, | | | December 31, | | | December 31, | |
| | | 2020 | | | 2019 | | | 2018 | | | 2017(a) | |
| Selected Per Share Data | | | | | | | | | | | | | | | | |
| Net asset value, beginning of period | | $ | 12.80 | | | $ | 10.35 | | | $ | 11.47 | | | $ | 10.00 | |
| Investment operations: | | | | | | | | | | | | | | | | |
| Net investment loss | | | (0.05 | ) | | | (0.03 | ) | | | (0.01 | ) | | | (0.13 | ) |
| Net realized and unrealized gain | | | 1.04 | | | | 3.19 | | | | 0.91 | | | | 1.60 | |
| Total from investment operations | | | 0.99 | | | | 3.16 | | | | 0.90 | | | | 1.47 | |
| Less distributions to shareholders from: | | | | | | | | | | | | | | | | |
| Net realized gains | | | — | | | | (0.71 | ) | | | (2.02 | ) | | | — | |
| Total distributions | | | — | | | | (0.71 | ) | | | (2.02 | ) | | | — | |
| Net asset value, end of period | | $ | 13.79 | | | $ | 12.80 | | | $ | 10.35 | | | $ | 11.47 | |
| Total Return(b) | | | 7.73 | % | | | 30.70 | % | | | 8.74 | % | | | 14.70 | % (c) |
| Ratios and Supplemental Data: | | | | | | | | | | | | | | | | |
| Net assets, end of period (000 omitted) | | $ | 69,126 | | | $ | 66,042 | | | $ | 50,768 | | | $ | 39,733 | |
| Ratio of net expenses to average net assets | | | 1.03 | % | | | 1.17 | % | | | 1.25 | % | | | 1.92 | % (d) |
| Ratio of net investment loss to average net assets | | | (0.40 | )% | | | (0.23 | )% | | | (0.09 | )% | | | (1.39 | )% (d) |
| Portfolio turnover rate | | | 57 | % | | | 37 | % | | | 82 | % | | | 1 | % (c) |
| | | | | | | | | | | | | | | | | |
| (a) | For the period January 31, 2017 (commencement of operations) to December 31, 2017. |
| (b) | Total return represents the rate that the investor would have earned or lost on an investment in the Fund, assuming reinvestment of distributions. |
See accompanying notes which are an integral part of these financial statements.
| Selective Opportunity Fund - Service Class |
| Financial Highlights |
| (For a share outstanding during each period) |
| | | For the | | | For the | | | For the | |
| | | Year Ended | | | Year Ended | | | Period Ended | |
| | | December 31, | | | December 31, | | | December 31, | |
| | | 2020 | | | 2019 | | | 2018(a) | |
| Selected Per Share Data | | | | | | | | | | | | |
| Net asset value, beginning of period | | $ | 12.80 | | | $ | 10.36 | | | $ | 12.92 | |
| Investment operations: | | | | | | | | | | | | |
| Net investment loss | | | (0.05 | ) | | | (0.03 | ) | | | — | (b) |
| Net realized and unrealized gain (loss) | | | 1.02 | | | | 3.18 | | | | (0.54 | ) (c) |
| Total from investment operations | | | 0.97 | | | | 3.15 | | | | (0.54 | ) |
| Less distributions to shareholders from: | | | | | | | | | | | | |
| Net realized gains | | | — | | | | (0.71 | ) | | | (2.02 | ) |
| Total distributions | | | — | | | | (0.71 | ) | | | (2.02 | ) |
| Net asset value, end of period | | $ | 13.77 | | | $ | 12.80 | | | $ | 10.36 | |
| Total Return(d) | | | 7.58 | % | | | 30.58 | % | | | (3.39 | )% (e) |
| Ratios and Supplemental Data: | | | | | | | | | | | | |
| Net assets, end of period (000 omitted) | | $ | 87,064 | | | $ | 39,994 | | | $ | 20,298 | |
| Ratio of net expenses to average net assets | | | 1.11 | % | | | 1.27 | % | | | 1.32 | % (f) |
| Ratio of net investment income (loss) to average net assets | | | (0.54 | )% | | | (0.34 | )% | | | 0.05 | % (f) |
| Portfolio turnover rate | | | 57 | % | | | 37 | % | | | 82 | % (e) |
| | | | | | | | | | | | | |
| (a) | For the period March 16, 2018 (commencement of operations) to December 31, 2018. |
| (b) | Rounds to less than $0.005 per share. |
| (c) | The amount shown for a share outstanding throughout the period does not accord with the change in aggregate gains and losses in the portfolio of securities during the period because of the timing of sales and purchases of fund shares in relation to fluctuating market values during the period. |
| (d) | Total return represents the rate that the investor would have earned or lost on an investment in the Fund, assuming reinvestment of distributions. |
See accompanying notes which are an integral part of these financial statements.
Selective Premium Income Fund
Financial Highlights
(For a share outstanding during the period)
| | | For the | |
| | | Period Ended | |
| | | December 31, | |
| | | | 2020(a) | |
| Selected Per Share Data | | | | |
| Net asset value, beginning of period | | $ | 10.00 | |
| Investment operations: | | | | |
| Net investment loss | | | (0.10 | ) |
| Net realized and unrealized gain | | | 0.24 | |
| Total from investment operations | | | 0.14 | |
| Net asset value, end of period | | $ | 10.14 | |
| Total Return(b) | | | 1.40 | % (c) |
| Ratios and Supplemental Data: | | | | |
| Net assets, end of period (000 omitted) | | $ | 14,834 | |
| Ratio of net expenses to average net assets | | | 1.50 | % (d)(e) |
| Ratio of expenses to average net assets before expense waiver and reimbursement | | | 2.33 | % (d) |
| Ratio of net investment loss to average net assets | | | (1.40 | )% (d) |
| Portfolio turnover rate | | | 18 | % (c) |
| | | | | |
| (a) | For the period March 31, 2020 (commencement of operations) to December 31, 2020. |
| (b) | Total return represents the rate that the investor would have earned or lost on an investment in the Fund, assuming reinvestment of distributions. |
| (e) | Excluding administrative service fees and interest expense, the ratio of net expenses to average net assets was 1.39%. |
| Selective Funds |
| Notes to the Financial Statements |
| December 31, 2020 |
NOTE 1. ORGANIZATION
The Selective Opportunity Fund (the “Opportunity Fund”) and the Selective Premium Income Fund (the “Income Fund”) (each a “Fund” and, collectively the “Funds”) are each registered under the Investment Company Act of 1940, as amended (“1940 Act”), as non-diversified series of Unified Series Trust (the “Trust”). The Opportunity Fund and Income Fund were organized on November 14, 2016 and February 19, 2019, respectively. The Trust is an open-end investment company established under the laws of Ohio by an Agreement and Declaration of Trust dated October 17, 2002 (the “Trust Agreement”). The Trust Agreement permits the Board of Trustees of the Trust (the “Board”) to issue an unlimited number of shares of beneficial interest of separate series without par value. The Funds are two of a series of funds currently authorized by the Board. The Opportunity Fund commenced operations on January 31, 2017. The Income Fund commenced operations on March 31, 2020. The investment adviser to the Funds is Selective Wealth Management, Inc. (the “Adviser”). The investment objective of the Opportunity Fund is maximizing long-term returns while protecting client principal. The investment objective of the Income Fund is generating income while protecting client principal.
The Opportunity Fund currently offers two classes of shares, Foundation Class and Service Class. The Foundation Class commencement of operations was on January 31, 2017 and the Service Class commencement of operations was on March 16, 2018. The Income Fund currently offers one class of shares that commenced operations on March 31, 2020. Each share represents an equal proportionate interest in the assets and liabilities belonging to the applicable class of the Funds and is entitled to such dividends and distributions out of income belonging to the applicable class of the Funds as are declared by the Board. Expenses attributable to any class are borne by that class. On matters that affect a Fund as a whole, each class has the same voting and other rights and preferences as any other class. On matters that affect only one class, only shareholders of that class may vote. Each class votes separately on matters affecting only that class, or as expressly required to be voted on separately by state or federal law. Shares of each class of a series have the same voting and other rights and preferences as the other classes and series of the Trust for matters that affect the Trust as a whole. The Funds may offer additional classes of shares in the future.
NOTE 2. SIGNIFICANT ACCOUNTING POLICIES
The Funds are investment companies and follow accounting and reporting guidance under Financial Accounting Standards Board Accounting Standards Codification (“ASC”) Topic 946, “Financial Services-Investment Companies.” The following is a summary of significant accounting policies followed by the Funds in the preparation of their financial statements. These policies are in conformity with the generally accepted accounting principles in the United States of America (“GAAP”).
Estimates – The preparation of financial statements in conformity with GAAP requires management to make estimates and assumptions that affect the reported amounts of assets and liabilities and disclosure of contingent assets and liabilities at the date of the financial statements and the reported amounts of increases and decreases in net assets from operations during the reporting period. Actual results could differ from those estimates.
| Selective Funds |
| Notes to the Financial Statements (continued) |
| December 31, 2020 |
Federal Income Taxes – The Funds make no provision for federal income or excise tax. Each Fund has qualified and intends to qualify each year as a regulated investment company (“RIC”) under subchapter M of the Internal Revenue Code of 1986, as amended, by complying with the requirements applicable to RICs and by distributing substantially all of its taxable income. Each Fund also intends to distribute sufficient net investment income and net capital gains, if any, so that it will not be subject to excise tax on undistributed income and gains. If the required amount of net investment income or gains is not distributed, the Fund could incur a tax expense.
As of and during the fiscal year ended December 31, 2020, the Funds did not have any liabilities for any unrecognized tax benefits. The Funds recognize interest and penalties, if any, related to unrecognized tax benefits as income tax expense in the Statements of Operations when incurred. During the year, the Funds did not incur any interest or penalties. Management of the Funds has reviewed tax positions taken in tax years that remain subject to examination by all major tax jurisdictions, including federal (i.e., the previous three tax year ends and the interim tax period since then, as applicable) and has concluded that no provision for unrecognized tax benefits or expenses is required in these financial statements and does not expect this to change over the next twelve months.
Expenses – Expenses incurred by the Trust that do not relate to a specific fund of the Trust are allocated to the individual funds based on each fund’s relative net assets or another appropriate basis (as determined by the Board). Expenses specifically attributable to any class are borne by that class. Income, realized gains and losses, unrealized appreciation and depreciation, and fund-wide expenses not allocated to a particular class shall be allocated to each class based on the net assets of that class in relation to the net assets of the entire fund.
Security Transactions and Related Income – The Funds follow industry practice and record security transactions on the trade date for financial reporting purposes. The specific identification method is used for determining gains or losses for financial statement and income tax purposes. Dividend income is recorded on the ex-dividend date and interest income is recorded on an accrual basis. Discounts and premiums on securities are amortized or accreted using the effective interest method. Non-cash income, if any, is recorded at the fair market value of the securities received. Withholding taxes on foreign dividends, if any, have been provided for in accordance with the Funds’ understanding of the applicable country’s tax rules and rates.
Foreign Currency Translation – The accounting records of the Funds are maintained in U.S. dollars. Foreign currency amounts are translated into U.S. dollars at the current rate of exchange each business day to determine the value of investments, and other assets and liabilities. Purchases and sales of foreign securities, and income and expenses, are translated at the prevailing rate of exchange on the respective date of these transactions. The Funds do not isolate that portion of the results of operations resulting from changes in foreign exchange rates on investments from fluctuation arising from changes in market prices of securities held. These fluctuations are included with the realized and unrealized gain or loss from investments. Net realized gain (loss) on foreign currency translations on the Statements of Operations represents currency gains (losses) realized between the trade and settlement dates on securities transactions, and the difference between the amount of investment
| Selective Funds |
| Notes to the Financial Statements (continued) |
| December 31, 2020 |
income and foreign withholding taxes recorded on the Funds’ books and the U.S. dollar equivalent amounts actually received or paid. The change in unrealized currency gains (losses) on foreign currency translations for the period is reflected in the Statements of Operations.
Dividends and Distributions – Each Fund intends to distribute its net investment income and net realized long-term and short-term capital gains, if any, at least annually. Dividends and distributions to shareholders, which are determined in accordance with income tax regulations, are recorded on the ex-dividend date. The treatment for financial reporting purposes of distributions made to shareholders during the period from net investment income or net realized capital gains may differ from their ultimate treatment for federal income tax purposes. These differences are caused primarily by differences in the timing of the recognition of certain components of income, expense or realized capital gain for federal income tax purposes. Where such differences are permanent in nature, they are reclassified among the components of the net assets based on their ultimate characterization for federal income tax purposes. Any such reclassifications will have no effect on net assets, results of operations or net asset value (“NAV”) per share of the Funds.
For the fiscal year ended December 31, 2020, the Funds made the following reclassifications to increase (decrease) the components of net assets:
| | | | | | Accumulated | |
| | | Paid-In Capital | | | Earnings (Deficit) | |
| Opportunity Fund | | $ | (647,169 | ) | | $ | 647,169 | |
| Income Fund | | | (13,469 | ) | | | 13,469 | |
NOTE 3. NON-DIVERSIFICATION RISK
Each Fund is non-diversified, which means it may invest a greater percentage of its assets in a fewer number of stocks as compared to other mutual funds that are more broadly diversified. As a result, each Fund’s share price may be more volatile than the share price of some other mutual funds, and the poor performance of an individual stock in a Fund’s portfolio may have a significant negative impact on that Fund’s performance.
NOTE 4. DERIVATIVE TRANSACTIONS
The Funds may engage in options transactions, which are sometimes referred to as derivative transactions. The Opportunity Fund uses derivative instruments for any purpose consistent with its investment objective, such as for hedging or obtaining market exposure or interest rate exposure. The Income Fund uses derivative instruments for any purpose consistent with its investment objective, such as transactions to generate income. The Funds also may use derivative instruments to obtain market exposure (that is, for speculative purposes rather than hedging). The Adviser may establish a position in the derivatives market as a substitute for buying, selling, or holding certain securities. The use of derivative instruments may provide a less expensive, more expedient or more specifically focused way to invest than traditional securities would. As of December 31, 2020, the amount of restricted cash or cash equivalents held at the broker as collateral for derivatives was $19,806 and $22,366, in the Opportunity Fund and Income Fund, respectively.
| Selective Funds |
| Notes to the Financial Statements (continued) |
| December 31, 2020 |
Purchased/Written Option Contracts – The Funds may write or purchase option contracts to adjust risk and return of its overall investment positions. When a Fund writes or purchases an option, an amount equal to the premium received or paid by the Fund is recorded as a liability or an asset and is subsequently adjusted to the current market value of the option written or purchased. Premiums received or paid from writing or purchasing options that expire unexercised are treated by the Fund on the expiration date as realized gains or losses. The difference between the premium and the amount paid or received on affecting a closing purchase or sale transaction, including brokerage commissions, is also treated as a realized gain or loss. If an option is exercised, the premium paid or received is added to or subtracted from the cost of the purchase or proceeds from the sale in determining whether a Fund has realized a gain or loss on investment transactions. In addition, the Funds may be subject to expenses related to option contracts that are not typically associated with investing in securities directly, such as costs of borrowing and margin account maintenance costs associated with the Funds’ open short positions. These costs are reflected on the Statements of Operations as interest expense. Investing in purchased and written options contracts exposes the Funds to equity price risk.
Derivative Transactions – The following tables identify the location and fair value of derivative instruments on the Statements of Assets and Liabilities as of December 31, 2020 and the effect of derivative instruments on the Statements of Operations for the fiscal year ended December 31, 2020.
As of December 31, 2020:
| | | Statements of Assets | | | | | | | | |
| | | and Liabilities | | Statements of Operations |
| Fund/ | | | | | | | Location of | | | | | | |
| Financial | | Location of | | | | | Gain (Loss) | | Amount of | | | Amount of | |
| Instrument | | Asset/Liability | | | | | on Derivatives | | Realized Gain | | | Unrealized | |
| Type | | Derivatives | | Fair Value | | | Recognized | | (Loss) | | | Gain (Loss) | |
| Opportunity Fund | | | | | | | | | | | | | | |
| Equity Contracts | | Written options, at value | | $ | (12,521,564 | ) | | Net realized gain (loss) on: Written options | | $ | 1,279,135 | | | | | |
| | | | | | | | | Change in unrealized appreciation (depreciation) on: Written options | | | | | | $ | 3,070,330 | |
| | | | | | | | | | | | | | | | | |
| Income Fund | | | | | | | | | | | | | | |
| Equity Contracts | | Written options, at value | | | (44,452 | ) | | Net realized gain (loss) on: (a) Written options | | | 164,802 | | | | | |
| | | | | | | | | Change in unrealized appreciation (depreciation) on: (a) Written options | | | | | | | 172,963 | |
| Selective Funds |
| Notes to the Financial Statements (continued) |
| December 31, 2020 |
The following summarizes the average ending monthly fair value of derivatives outstanding during the fiscal year ended December 31, 2020:
| | | | | Average | |
| Fund | | Derivative | | Market Value | |
| Opportunity Fund | | Written options | | $ | (15,422,881 | ) |
| | | Purchased options | | | 1,040,857 | |
| | | | | | | |
| Income Fund(a) | | Written options | | | (157,111 | ) |
| | | Purchased options | | | — | |
| (a) | For the period March 31, 2020 (commencement of operations) to December 31, 2020. |
Balance Sheet Offsetting Information
The following table provides a summary of offsetting financial liabilities and derivatives and the effect of derivative instruments on the Statements of Assets and Liabilities as of December 31, 2020:
| | | | | | | | | | | | Gross Amounts Not Offset | | | | |
| | | | | | | | | | | | in Statements of Assets and | | | | |
| | | | | | | | | | | | Liabilities | | | | |
| | | | | | | | | Net Amount | | | | | | | | | | |
| | | | | | Gross Amount | | | of Liabilities | | | | | | | | | | |
| | | Gross | | | Offset in | | | Presented in | | | | | | | | | | |
| | | Amounts of | | | Statements | | | Statements | | | | | | Cash | | | | |
| | | Recognized | | | of Assets and | | | of Assets and | | | Financial | | | Collateral | | | | |
| | | Liabilities | | | Liabilities | | | Liabilities | | | Instruments | | | Pledged | | | Net Amount | |
| Opportunity Fund | | | | | | | | | | | | | | | | | | | | | | | | |
| Options | | | | | | | | | | | | | | | | | | | | | | | | |
| Written | | $ | (12,521,564 | ) | | $ | — | | | $ | (12,521,564 | ) | | $ | 12,521,564 | | | $ | — | | | $ | — | |
| | | | | | | | | | | | | | | | | | | | | | | | | |
| Income Fund | | | | | | | | | | | | | | | | | | | | | | | | |
| Options | | | | | | | | | | | | | | | | | | | | | | | | |
| Written | | $ | (44,452 | ) | | $ | — | | | $ | (44,452 | ) | | $ | 44,452 | | | $ | — | | | $ | — | |
NOTE 5. SECURITIES VALUATION AND FAIR VALUE MEASUREMENTS
Each Fund values its portfolio securities at fair value as of the close of regular trading on the New York Stock Exchange (the “NYSE”) (normally 4:00 p.m. Eastern time) on each business day the NYSE is open for business. Fair value is defined as the price that a Fund would receive upon selling an investment in a timely transaction to an independent buyer in the principal or most advantageous market of the investment. GAAP establishes a three-tier hierarchy to maximize the use of observable market data and minimize the use of unobservable inputs and to establish classification of fair value measurements for disclosure purposes.
Inputs refer broadly to the assumptions that market participants would use in pricing the asset or liability, including assumptions about risk (the risk inherent in a particular valuation technique used to measure fair value including a pricing model and/or the risk inherent in the inputs to the valuation
| Selective Funds |
| Notes to the Financial Statements (continued) |
| December 31, 2020 |
technique). Inputs may be observable or unobservable. Observable inputs are inputs that reflect the assumptions market participants would use in pricing the asset or liability developed based on market data obtained and available from sources independent of the reporting entity. Unobservable inputs are inputs that reflect the reporting entity’s own assumptions about the assumptions market participants would use in pricing the asset or liability developed based on the best information available in the circumstances.
Various inputs are used in determining the value of each Fund’s investments. These inputs are summarized in the three broad levels listed below.
| ● | Level 1 – unadjusted quoted prices in active markets for identical investments and/or registered investment companies where the value per share is determined and published and is the basis for current transactions for identical assets or liabilities at the valuation date |
| ● | Level 2 – other significant observable inputs (including, but not limited to, quoted prices for an identical security in an inactive market, quoted prices for similar securities, interest rates, prepayment speeds, credit risk, etc.) |
| ● | Level 3 – significant unobservable inputs (including the Funds’ own assumptions in determining fair value of investments based on the best information available) |
The inputs used to measure fair value may fall into different levels of the fair value hierarchy. In such cases, for disclosure purposes, the level in the fair value hierarchy which is reported is determined based on the lowest level input that is significant to the fair value measurement in its entirety.
Equity securities that are traded on any stock exchange are generally valued at the last quoted sale price on the security’s primary exchange. Lacking a last sale price, an exchange-traded security is generally valued at its last bid price. Securities traded in the NASDAQ over-the-counter market are generally valued at the NASDAQ Official Closing Price. When using the market quotations and when the market is considered active, the security is classified as a Level 1 security. In the event that market quotations are not readily available or are considered unreliable due to market or other events, a Fund values its securities and other assets at fair value in accordance with policies established by and under the general supervision of the Board. Under these policies, the securities will be classified as Level 2 or 3 within the fair value hierarchy, depending on the inputs used.
Debt securities are valued by using the mean between the closing bid and ask prices provided by a pricing service. If the closing bid and ask prices are not readily available, the pricing service may provide a price determined by a matrix pricing method. Matrix pricing is a mathematical technique used to value fixed income securities without relying exclusively on quoted prices. Matrix pricing takes into consideration recent transactions, yield, liquidity, risk, credit quality, coupon, maturity, type of issue and any other factors or market data the pricing service deems relevant for the actual security being priced and for other securities with similar characteristics. These securities will generally be categorized as Level 2 securities. If the Adviser decides that a price provided by the pricing service does not accurately reflect the fair value of the securities or when prices are not readily available from a pricing service, securities are valued at fair value as determined by the Adviser, in conformity with guidelines adopted by and subject to review of the Board. These securities will generally be categorized as Level 3 securities.
| Selective Funds |
| Notes to the Financial Statements (continued) |
| December 31, 2020 |
Option contracts are generally traded on an exchange and are generally valued at the last trade price or at the mean of the last bid and ask prices, as provided by a pricing service. If there is no such reported sale on the valuation date, long positions are valued at the most recent bid price, and short positions are valued at the most recent ask price. The option contracts will generally be categorized as Level 1 securities unless the market is considered inactive or the absence of a last bid or ask price, in which case, they will be categorized as Level 2 securities.
Investments in mutual funds, including money market mutual funds, are generally priced at the ending NAV provided by the service agent of the mutual funds. These securities are categorized as Level 1 securities.
In accordance with the Trust’s valuation policies, the Adviser is required to consider all appropriate factors relevant to the value of securities for which it has determined other pricing sources are not available or reliable as described above. No single method exists for determining fair value, because fair value depends upon the circumstances of each individual case. As a general principle, the current fair value of a security being valued by the Adviser would be the amount that the Funds might reasonably expect to receive upon the current sale. Methods that are in accordance with this principle may, for example, be based on (i) a multiple of earnings; (ii) a discount from market prices of a similar freely traded security (including a derivative security or a basket of securities traded on other markets, exchanges or among dealers); or (iii) yield to maturity with respect to debt issues, or a combination of these and other methods. Fair-value pricing is permitted if, in the Adviser’s opinion, the validity of market quotations appears to be questionable based on factors such as evidence of a thin market in the security based on a small number of quotations, a significant event occurs after the close of a market but before a Fund’s NAV calculation that may affect a security’s value, or the Adviser is aware of any other data that calls into question the reliability of market quotations.
The following is a summary of the inputs used to value the Funds’ investments as of December 31, 2020:
| | | Opportunity Fund | |
| Assets | | Level 1 | | | Level 2 | | | Level 3 | | | Total | |
| Common Stocks(a) | | $ | 101,055,099 | | | $ | — | | | $ | — | | | $ | 101,055,099 | |
| U.S. Government & Agency Obligations | | | — | | | | 64,751,676 | | | | — | | | | 64,751,676 | |
| Money Market Funds | | | 2,692,538 | | | | — | | | | — | | | | 2,692,538 | |
| Total | | $ | 103,747,637 | | | $ | 64,751,676 | | | $ | — | | | $ | 168,499,313 | |
| | | | | | | | | | | | | | | | | |
| | | Income Fund | |
| Assets | | Level 1 | | | Level 2 | | | Level 3 | | | Total | |
| U.S. Government & Agency Obligations | | $ | — | | | $ | 5,839,293 | | | $ | — | | | $ | 5,839,293 | |
| Money Market Funds | | | 9,038,091 | | | | — | | | | — | | | | 9,038,091 | |
| Total | | $ | 9,038,091 | | | $ | 5,839,293 | | | $ | — | | | $ | 14,877,384 | |
| Selective Funds |
| Notes to the Financial Statements (continued) |
| December 31, 2020 |
| | | Other Financial Instruments at Value | |
| Fund / Liabilities | | Level 1 | | | Level 2 | | | Level 3 | | | Total | |
| Opportunity Fund | | | | | | | | | | | | | | | | |
| Written Call/Put Options | | $ | (7,414,065 | ) | | $ | (5,107,499 | ) | | $ | — | | | $ | (12,521,564 | ) |
| Income Fund | | | | | | | | | | | | | | | | |
| Written Put Options | | $ | (6,156 | ) | | $ | (38,296 | ) | | $ | — | | | $ | (44,452 | ) |
| (a) | Refer to Schedule of Investments for sector classifications. |
The Funds did not hold any investments at the end of the reporting period for which significant unobservable inputs (Level 3) were used in determining fair value; therefore, no reconciliation of Level 3 securities is included for this reporting period.
NOTE 6. FEES AND OTHER TRANSACTIONS WITH AFFILIATES
The Adviser, under the terms of the management agreement with the Trust with respect to each Fund, manages the Funds’ investments. In accordance with the management agreement for each Fund, the Adviser is entitled to an investment advisory fee, computed and accrued daily and paid monthly, at an annual rate of 0.50% of the average daily net assets of the Opportunity Fund and Income Fund, respectively. Prior to April 30, 2020, the Adviser was entitled to an investment advisory fee, computed and accrued daily and paid monthly, at an annual rate of 0.75% of the average daily net assets of the Opportunity Fund. For the fiscal year ended December 31, 2020, the Adviser earned a fee of $719,178 from the Opportunity Fund. For the period March 31, 2020 (commencement of operations) to December 31, 2020 (the “Period”), the Adviser earned a fee, before the waiver described below, of $50,396 from the Income Fund. At December 31, 2020, the Opportunity Fund and the Income Fund owed the Adviser $65,529 and $1,194, respectively, for advisory services.
The Adviser has contractually agreed to waive its management fee and/or reimburse expenses so that total annual operating expenses (excluding portfolio transaction and other investment-related costs (including brokerage fees and commissions); taxes; borrowing costs (such as interest and dividend expenses on securities sold short); acquired fund fees and expenses; fees and expenses associated with investments in other collective investment vehicles or derivative instruments (including for example option and swap fees and expenses); any amounts payable pursuant to a distribution or service plan adopted in accordance with Rule 12b-1 under the 1940 Act; any administrative and/or shareholder servicing fees payable pursuant to a plan adopted by the Board; expenses incurred in connection with any merger or reorganization; extraordinary expenses (such as litigation expenses, indemnification of Trust officers and Trustees and contractual indemnification of Income Fund service providers); and other expenses that the Trustees agree have not been incurred in the ordinary course of the Income Fund’s business) do not exceed 1.39% of the Income Fund’s average daily net assets through April 30, 2021. This expense cap may not be terminated prior to this date except by the Board. For the Period, the Adviser waived fees and reimbursed expenses in the amount of $83,597.
Each waiver/expense payment by the Adviser is subject to recoupment by the Adviser from the Income Fund in the three years following the date in which that particular waiver/expense payment occurred, but only if such recoupment can be achieved without exceeding the annual expense limitation in effect at the time of the waiver/expense payment and any expense limitation in effect at the time of the
| Selective Funds |
| Notes to the Financial Statements (continued) |
| December 31, 2020 |
recoupment. As of December 31, 2020, the Adviser may seek repayment of investment advisory fees waived and expense reimbursements pursuant to the aforementioned conditions, from the Income Fund no later than the dates stated below:
| Recoverable through | | Amount | |
| December 31, 2023 | | $ | 83,597 | |
The Trust retains Ultimus Fund Solutions, LLC (the “Administrator”) to provide the Funds with administration, fund accounting, transfer agent and compliance services, including all regulatory reporting. For the fiscal year ended December 31, 2020 in the Opportunity Fund, the Administrator earned fees of $121,260 for administration services, $59,624 for fund accounting services, $30,000 for transfer agent services, and $14,790 for compliance services. For the Period in the Income Fund, the Administrator earned fees of $18,000 for administration services, $20,809 for fund accounting services, $9,000 for transfer agent services, and $9,000 for compliance services. At December 31, 2020, the Opportunity Fund and Income Fund owed the Administrator $21,588 and $6,324, respectively, for such services.
The Board supervises the business activities of the Trust. Each Trustee serves as a trustee until termination of the Trust unless the Trustee dies, resigns, retires, or is removed. The Chairman of the Board and more than 75% of the Trustees are “Independent Trustees,” which means that they are not “interested persons” as defined in the 1940 Act. Each Trustee of the Trust received annual compensation of $2,290 per fund from the Trust, except that the Independent Chairman of the Board, the Chairman of the Audit Committee, the Chairman of the Governance & Nominating Committee, and the Chairman of the Pricing & Liquidity Committee each received annual compensation of $2,740 per fund from the Trust. Effective for the calendar year 2021 the chairmen receive $2,940 per fund. In addition, the Trust reimburses Trustees for out-of-pocket expenses incurred in conjunction with attendance at meetings.
One Trustee and certain officers of the Trust are employees of the Administrator or Ultimus Fund Distributors, LLC (the “Distributor”). The Distributor acts as the principal distributor of the Funds’ shares. The Distributor operates as a wholly-owned subsidiary of the Administrator. An officer of the Trust is an officer of the Distributor and such person may be deemed to be an affiliate of the Distributor. Officers, other than the Chief Compliance Officer, who is not an officer or employee of the Administrator or the Distributor, are not paid by the Trust for services to the Fund.
The Funds have each adopted an Administrative Services Plan pursuant to which the Funds may pay an annual fee of up to 0.20% of the Opportunity Fund’s Service Class and the Income Fund’s average daily net assets to compensate financial intermediaries who provide administrative services to the shareholders of the respective Class or Fund. Financial intermediaries eligible to receive payments under the Administrative Services Plan include mutual fund supermarkets or other platforms offered by broker dealers, 401(k) plans and/or trust companies that provide administrative and shareholder
| Selective Funds |
| Notes to the Financial Statements (continued) |
| December 31, 2020 |
account services to the shareholders. For the fiscal year ended December 31, 2020, the Opportunity Fund’s Service Class incurred fees of $63,007 pursuant to the Administrative Services Plan. For the Period, the Income Fund incurred fees of $9,517 pursuant to the Administrative Services Plan.
NOTE 7. INVESTMENT TRANSACTIONS
For the fiscal year ended December 31, 2020, purchases and sales of investment securities, other than short-term investments and short-term U.S. government obligations, were as follows:
| | | Opportunity Fund | | | Income Fund(a) | |
| Purchases | | | | | | | | |
| U.S. Government Obligations | | $ | 70,179,516 | | | $ | 734,522 | |
| Other | | | 23,151,995 | | | | — | |
| Sales | | | | | | | | |
| U.S. Government Obligations | | | 21,249,531 | | | | — | |
| Other | | | 37,870,308 | | | | 136,688 | |
| (a) | For the period March 31, 2020 (commencement of operations) to December 31, 2020. |
NOTE 8. FEDERAL TAX INFORMATION
At December 31, 2020, the net unrealized appreciation (depreciation) and tax cost of investments, including written options, for tax purposes were as follows:
| | | Opportunity Fund | | | Income Fund | |
| Gross unrealized appreciation | | $ | 38,517,712 | | | $ | 173,637 | |
| Gross unrealized depreciation | | | (6,938,113 | ) | | | — | |
| Net unrealized appreciation/(depreciation) on investments | | $ | 31,579,599 | | | $ | 173,637 | |
| Tax cost of investments and written options | | $ | 124,398,150 | | | $ | 14,659,295 | |
At December 31, 2020, the difference between book basis and tax basis unrealized appreciation (depreciation) for the Opportunity Fund was attributable to the tax deferral of losses on wash sales.
The tax character of distributions paid for the fiscal years ended December 31, 2020 and December 31, 2019 were as follows:
| | | Opportunity Fund | | | Income Fund | |
| Distributions paid from: | | 2020 | | | 2019 | | | 2020 | |
| Ordinary income(a) | | $ | — | | | $ | 2,157,218 | | | $ | — | |
| Long-term capital gain | | | — | | | | 3,384,124 | | | | — | |
| Total distributions paid | | $ | — | | | $ | 5,541,342 | | | $ | — | |
| (a) | Short-term capital gain distributions are treated as ordinary income for tax purposes. |
| Selective Funds |
| Notes to the Financial Statements (continued) |
| December 31, 2020 |
At December 31, 2020, the components of accumulated earnings (deficit) on a tax basis were as follows:
| | | Opportunity Fund | | | Income Fund | |
| Undistributed ordinary income | | $ | — | | | $ | 57,161 | |
| Unrealized appreciation (depreciation) on investments | | | 31,579,599 | | | | 173,637 | |
| Accumulated capital and other losses | | | (2,421,986 | ) | | | (20,789 | ) |
| Total accumulated earnings (deficit) | | $ | 29,157,613 | | | $ | 210,009 | |
As of December 31, 2020, the Opportunity Fund had short-term capital loss carryforwards of $2,414,246. These capital loss carryforwards, which do not expire, may be utilized in future years to offset net realized capital gains, if any, prior to distributing such gains to shareholders.
NOTE 9. SECTOR RISK
If a Fund has significant investments in the securities of issuers within a particular sector, any development affecting that sector will have a greater impact on the value of the net assets of the Fund than would be the case if the Fund did not have significant investments in that sector. In addition, this may increase the risk of loss in the Fund and increase the volatility of the Fund’s NAV per share. For instance, economic or market factors, regulatory changes or other developments may negatively impact all companies in a particular sector, and therefore the value of the Fund’s portfolio will be adversely affected. As of December 31, 2020, the Opportunity Fund had 27.39% of the value of its net assets invested in stocks within the Technology sector.
NOTE 10. SIGNIFICANT OWNERSHIP CONCENTRATION
At December 31, 2020, the Income Fund invested 60.93% of its net assets in the BlackRock Liquidity Funds Treasury Trust Fund (“BlackRock Fund”). The financial statements of the BlackRock Fund, including the portfolio of investments, are included in the BlackRock Liquidity Funds annual report and can be found at www.blackrock.com and should be read in conjunction with the Income Fund’s financial statements.
NOTE 11. COMMITMENTS AND CONTINGENCIES
The Trust indemnifies its officers and Trustees for certain liabilities that may arise from their performance of their duties to the Trust or the Funds. Additionally, in the normal course of business, the Trust enters into contracts that contain a variety of representations and warranties which provide general indemnifications. The Trust’s maximum exposure under these arrangements is unknown, as this would involve future claims that may be made against the Trust that have not yet occurred.
| Selective Funds |
| Notes to the Financial Statements (continued) |
| December 31, 2020 |
NOTE 12. SUBSEQUENT EVENTS
Management of the Funds has evaluated the need for disclosures and/or adjustments resulting from subsequent events through the date at which these financial statements were issued. Based upon this evaluation, management has determined there were no items requiring adjustment of the financial statements or additional disclosure, other than the item below.
On February 24, 2021, the Board approved the liquidation of the Funds as being in the best interest of the Funds and their shareholders. It is anticipated that all outstanding shares of the Opportunity Fund and Income Fund will be redeemed and all operations will be discontinued on or about June 21, 2021 and April 30, 2021, respectively.
Report of Independent Registered Public Accounting Firm
To the Shareholders of Selective Opportunity Fund and Selective Premium Income Fund and Board of Trustees of Unified Series Trust
Opinion on the Financial Statements
We have audited the accompanying statements of assets and liabilities, including the schedules of investments and open written option contracts, of Selective Opportunity Fund and Selective Premium Income Fund (the “Funds”), each a series of Unified Series Trust, as of December 31, 2020, the related statements of operations, the statements of changes in net assets, the related notes, and the financial highlights for each of the periods indicated below (collectively referred to as the “financial statements”). In our opinion, the financial statements present fairly, in all material respects, the financial position of each of the Funds as of December 31, 2020, the results of their operations, the changes in net assets, and the financial highlights for each of the periods indicated below in conformity with accounting principles generally accepted in the United States of America.
| | Statements of | Statements of | |
| Fund Name | Operations | Changes in Net Assets | Financial Highlights |
| Selective Opportunity Fund | For the year ended December 31, 2020 | For the years ended December 31, 2020 and 2019 | For the years ended December 31, 2020, 2019, 2018, and for the period from January 31, 2017 (commencement of operations) through December 31, 2017 |
| | | | |
| Selective Premium Income Fund | For the period from March 31, 2020 (commencement of operations) through December 31, 2020 |
Basis for Opinion
These financial statements are the responsibility of the Funds’ management. Our responsibility is to express an opinion on the Funds’ financial statements based on our audits. We are a public accounting firm registered with the Public Company Accounting Oversight Board (United States) (“PCAOB”) and are required to be independent with respect to the Funds in accordance with the U.S. federal securities laws and the applicable rules and regulations of the Securities and Exchange Commission and the PCAOB.
We conducted our audits in accordance with the standards of the PCAOB. Those standards require that we plan and perform the audit to obtain reasonable assurance about whether the financial statements are free of material misstatement whether due to error or fraud.
Report of Independent Registered Public Accounting Firm (continued)
Our audits included performing procedures to assess the risks of material misstatement of the financial statements, whether due to error or fraud, and performing procedures that respond to those risks. Such procedures included examining, on a test basis, evidence regarding the amounts and disclosures in the financial statements. Our procedures included confirmation of securities owned as of December 31, 2020, by correspondence with the custodian and brokers; when replies were not received from brokers, we performed other auditing procedures. Our audits also included evaluating the accounting principles used and significant estimates made by management, as well as evaluating the overall presentation of the financial statements. We believe that our audits provide a reasonable basis for our opinion.
We have served as the Funds’ auditor since 2017.
COHEN & COMPANY, LTD.
Chicago, Illinois
February 26, 2021
Liquidity Risk Management Program (Unaudited)
The Funds have adopted and implemented a written liquidity risk management program (the “Program”) as required by Rule 22e-4 (the “Liquidity Rule”) under the 1940 Act. The Program is reasonably designed to assess and manage the Funds’ liquidity risk, taking into consideration, among other factors, each Fund’s investment strategy and the liquidity of its portfolio investments during normal and reasonably foreseeable stressed conditions; its short and long-term cash flow projections; and its cash holdings and access to other funding sources. The Board approved the appointment of the Liquidity Administrator Committee, comprising certain Trust officers and employees of the Adviser. The Liquidity Administrator Committee maintains Program oversight and reports to the Board on at least an annual basis regarding the Program’s operational effectiveness through a written report (the “Report”). The Program’s initial Report, which was presented to the Board for consideration at its meeting held on November 17, 2020, outlined the operation of the Program and the adequacy and effectiveness of the Program’s implementation. During the review period, the Funds did not experience unusual stress or disruption to its operations related to purchase and redemption activity. Also, during the review period the Funds held adequate levels of cash and highly liquid investments to meet shareholder redemption activities in accordance with applicable requirements. The Report concluded that the Program is reasonably designed to prevent violation of the Liquidity Rule and has been effectively implemented.
Summary of Funds Expenses (Unaudited)
As a shareholder of a Fund, you incur two types of costs: (1) transaction costs and (2) ongoing costs, including management fees and other Fund expenses. These examples are intended to help you understand your ongoing costs (in dollars) of investing in each Fund and to compare these costs with the ongoing costs of investing in other mutual funds. Each Fund’s example is based on an investment of $1,000 invested at the beginning of the period and held for the entire period from July 1, 2020 through December 31, 2020.
Actual Expenses
The first line of the table for each class provides information about actual account values and actual expenses. You may use the information in these lines, together with the amount you invested, to estimate the expenses that you paid over the period. Simply divide your account value by $1,000 (for example, an $8,600 account value divided by $1,000 = 8.60), then multiply the result by the number in the first line under the heading “Expenses Paid During Period” to estimate the expenses you paid on your account during this period.
Hypothetical Example for Comparison Purposes
The second line of the table for each class provides information about hypothetical account values and hypothetical expenses based on each Fund’s actual expense ratios and an assumed rate of return of 5% per year before expenses, which is not the Fund’s actual return. The hypothetical account values and expenses may not be used to estimate the actual ending account balances or expenses you paid for the period. You may use this information to compare the ongoing costs of investing in the Funds and other funds. To do so, compare this 5% hypothetical example with the 5% hypothetical examples that appear in the shareholder reports of other funds.
Expenses shown in the table are meant to highlight your ongoing costs only and do not reflect any transactional costs. Therefore, the second line of the table below is useful in comparing ongoing costs only and will not help you determine the relative costs of owning different funds. In addition, if transaction costs were included, your costs would have been higher.
| | | | | Beginning | | Ending | | | | |
| | | | | Account | | Account | | Expenses | | |
| | | | | Value | | Value | | Paid | | Annualized |
| | | | | July 1, | | December 31, | | During | | Expense |
| | | | | 2020 | | 2020 | | Period(a) | | Ratio |
| Selective Opportunity Fund | | | | | | | | |
| Foundation | | | | | | | | |
| Class | | Actual | | $1,000.00 | | $1,178.60 | | $5.20 | | 0.95% |
| | | Hypothetical(b) | | $1,000.00 | | $1,020.36 | | $4.82 | | 0.95% |
| Service Class | | Actual | | $1,000.00 | | $1,177.90 | | $5.75 | | 1.05% |
| | | Hypothetical(b) | | $1,000.00 | | $1,019.86 | | $5.33 | | 1.05% |
| | | | | | | | | | | |
| Selective Premium Income Fund | | | | | | | | |
| | | Actual | | $1,000.00 | | $1,015.00 | | $7.75 | | 1.53% |
| | | Hypothetical | | $1,000.00 | | $1,017.44 | | $7.76 | | 1.53% |
| (a) | Expenses are equal to the Funds’ annualized expense ratios, multiplied by the average account value over the period, multiplied by 184/366 (to reflect the one-half year period). |
| (b) | Hypothetical assumes 5% annual return before expenses. |
Trustees and Officers (Unaudited)
GENERAL QUALIFICATIONS. The Board supervises the business activities of the Trust. Each Trustee serves as a trustee until termination of the Trust unless the Trustee dies, resigns, retires, or is removed. The Chairman of the Board and more than 75% of the Trustees are “Independent Trustees,” which means that they are not “interested persons” (as defined in the 1940 Act) of the Trust or any adviser, sub-adviser or distributor of the Trust.
The following table provides information regarding the Independent Trustees.
Name, Address*, (Year of
Birth), Position with Trust**,
Term of Position with Trust | Principal Occupation During Past 5 Years
and Other Directorships |
Kenneth G.Y. Grant (1949) Chairman, January 2017 to present; Independent Trustee, May 2008 to present | Current: Director, Standpoint Multi-Asset (Cayman) Fund, Ltd. (2019 – present); Director, Advisors Charitable Gift Fund (2020 - present), a Donor Advised Fund.
Previous: EVP, Benefit Plans Administrative Services, Inc., provider of retirement benefit plans administration (2019 – 2020); Director, Northeast Retirement Services (NRS) LLC, a transfer agent and fund administrator; and Director, Global Trust Company (GTC), a non-depository trust company sponsoring private investment product (2003 – 2019); EVP, NRS (2003 – 2019); GTC, EVP (2008 – 2019); EVP, Savings Banks Retirement Association (2003 – 2019), provider of qualified retirement benefit plans. |
Daniel J. Condon (1950) Chairman of the Audit Committee; Chairman of the Governance & Nominating Committee; Independent Trustee, December 2002 to present | Current: Retired (2017 - present)
Previous: Executive Advisor of Standard Steel LLC, a Railway manufacturing supply company (2016); Chief Executive Officer of Standard Steel LLC (2011 - 2015); Director of Standard Steel Holdings Co., which owns Standard Steel LLC (2011 - 2016); Director of International Crankshaft Inc. (2004 - 2016). |
Gary E. Hippenstiel (1947) Chairman of the Pricing & Liquidity Committee; Independent Trustee, December 2002 to present | Current: President and founder of Hippenstiel Investment Counsel LLC (“Hippenstiel”) since 2008. Hippenstiel was registered as an investment adviser from 2008 to December 31, 2019. |
Stephen A. Little (1946) Independent Trustee, December 2002 to present; Chairman, December 2004 to December 2016 | Current: President and founder of The Rose, Inc., a registered investment adviser, since 1993. |
Ronald C. Tritschler (1952) Independent Trustee, January 2007 to present; Interested Trustee, December 2002 to December 2006 | Current: Chief Executive Officer, Director and Legal Counsel of The Webb Companies, a national real estate company, since 2001; Director, Standpoint Multi-Asset (Cayman) Fund, Ltd. (2020 – present). |
| * | The address for each Trustee is 225 Pictoria Drive, Suite 450, Cincinnati, Ohio 45246. |
| ** | As of the date of this report, the Trust consists of 25 series. |
Trustees and Officers (Unaudited) (continued)
The following table provides information regarding the Officers of the Trust.
Name, Address*, (Year of
Birth), Position with Trust,
Term of Position with Trust | Principal Occupation During Past 5 Years
and Other Directorships |
David R. Carson (1958)
President, January 2016 to present; Interested Trustee, August 2020 to present | Current: Senior Vice President Client Strategies of Ultimus Fund Solutions, LLC, since 2013. |
Zachary P. Richmond (1980)
Treasurer and Chief Financial Officer, November 2014 to present | Current: Vice President, Director of Financial Administration for Ultimus Fund Solutions, LLC, since 2019.
Previous: Assistant Vice President, Associate Director of Financial Administration for Ultimus Fund Solutions, LLC (2015 - 2019). |
Martin R. Dean (1963)
Vice President, November 2020 to present; Assistant Chief Compliance Officer, January 2016 to present | Current: Senior Vice President, Head of Fund Compliance of Ultimus Fund Solutions, LLC, since 2016. |
Elisabeth Dahl (1962)
Secretary, May 2017 to present; Assistant Secretary, March 2016 to May 2017 | Current: Attorney, Ultimus Fund Solutions, LLC since March 2016. |
Stephen Preston (1966)
AML Compliance Officer, May 2017 to present | Current: Vice President and Chief Compliance Officer, Ultimus Fund Solutions, LLC and Ultimus Fund Distributors, LLC, since 2011. |
Lynn E. Wood (1946)
Chief Compliance Officer, October 2004 to present | Current: Managing Member, Buttonwood Compliance Partners, LLC, since 2013. |
| * | The address for each Officer is 225 Pictoria Drive, Suite 450, Cincinnati, Ohio 45246. |
Investment Advisory Agreement Approval (Unaudited)
The Selective Opportunity Fund (the “Fund”) is a series of Unified Series Trust (the “Trust”). The Trust’s Board of Trustees (the “Board”) oversees the management of the Fund and, as required by law, has considered the approval of the continuance of the Fund’s management agreement with its investment adviser, Selective Wealth Management, Inc. (“Selective”).
The Board requested and evaluated all information that the Trustees deemed reasonably necessary under the circumstances in connection with the approval of the continuance of the management agreement.
The Trustees held a teleconference on November 11, 2020 to review and discuss materials compiled by Ultimus Fund Solutions, LLC, the Trust’s administrator, with regard to the management agreement between the Trust and Selective. At the Trustees’ quarterly meeting held in November 2020, the Board interviewed certain executives of Selective, including Selective’s Founder and Chief Investment Officer and its Chief Compliance Officer and Chief Operating Officer. After discussion, the Trustees, including the Trustees who are not “interested persons” (as that term is defined in the Investment Company Act of 1940) of the Trust or Selective (the “Independent Trustees”), approved the continuance of the management agreement between the Trust and Selective for an additional year. The Trustees’ approval of the continuance of the Fund’s management agreement was based on a consideration of all the information provided to the Trustees, and was not the result of any single factor. Some of the factors that figured particularly in the Trustees’ deliberations are described below, although individual Trustees may have evaluated this information differently, ascribing different weights to various factors.
(i) The Nature, Extent, and Quality of Services. The Trustees reviewed and considered information regarding the nature, extent, and quality of services that Selective provides to the Fund, which include, but are not limited to, providing a continuous investment program for the Fund, adhering to the Fund’s investment restrictions, complying with the Trust’s policies and procedures, and voting proxies on behalf of the Fund. The Trustees considered the qualifications and experience of Selective’s portfolio manager who is responsible for the day-to-day management of the Fund’s portfolio, as well as the qualifications and experience of the other individuals at Selective who provide services to the Fund. They discussed Selective’s compliance program, personnel and compliance resources. The Trustees concluded that they were satisfied with the nature, extent, and quality of investment management services provided by Selective to the Fund.
(ii) Fund Performance. The Trustees next reviewed and discussed the Fund’s performance for periods ended September 30, 2020. The Trustees observed that the Fund’s Foundation Class had underperformed both its benchmark, the S&P 500 Index, and its Morningstar Large Blend category, for the year-to-date and one-year periods, but it had outperformed both the index and category for the three-year period. The Trustees also observed that the Fund’s portfolio has an average market cap that is lower than most funds in the Large Blend category. They considered Selective’s explanation of the investments which contributed to the underperformance and corrective measures. The Trustees considered the Fund’s performance to be satisfactory.
(iii) Fee Rate and Profitability. The Trustees reviewed fee and expense comparisons for peer group funds with similar strategies and those in the Fund’s Morningstar category, all of similar size to the Fund. The Trustees noted that the Fund’s management fee is close to the average for the peer group but higher than the average for funds in the Morningstar category. The Trustees also considered a profitability analysis prepared by Selective for its management of the Fund, which indicated that,
Investment Advisory Agreement Approval (Unaudited)(continued)
both before and after the deduction of marketing expenses, Selective is not earning a profit as a result of managing the Fund. The Trustees discussed and considered the management fee and noted that that the management fee for the Fund is lower than the management fee for Selective’s separately managed accounts.
The Trustees also considered other potential benefits that Selective may receive in connection with its management of the Fund and noted Selective’s representation that it does not enter into soft-dollar transactions on behalf of the Fund. After considering the above information, the Trustees concluded that the current management fee for the Fund represents reasonable compensation in light of the nature and quality of Selective’s services to the Fund, the costs incurred by Selective in providing services to the Fund, the fees paid by competitive mutual funds, and the fact that Selective is not earning a profit with respect to the Fund.
(iv) Economies of Scale. In determining the reasonableness of the management fee, the Trustees also considered the extent to which Selective will realize economies of scale as the Fund grows larger. The Trustees determined that, in light of the size of the Fund and Selective’s lack of profitability in managing the Fund, it does not appear that Selective is realizing benefits from economies of scale in managing the Fund and therefore, it is premature to consider a reduction to the management fee or whether breakpoints in the management fee should be implemented at this time.
| Privacy Policy (Unaudited) | Rev: January 2020 |
| FACTS | WHAT DO SELECTIVE FUNDS (THE “FUNDS”) DO WITH YOUR PERSONAL INFORMATION? |
| |
| Why? | Financial companies choose how they share your personal information. Federal law gives consumers the right to limit some but not all sharing. Federal law also requires us to tell you how we collect, share, and protect your personal information. Please read this notice carefully to understand what we do. |
| |
| What? | The types of personal information we collect and share depend on the product or service you have with us. This information can include: ■ Social Security number ■ account balances and account transactions ■ transaction or loss history and purchase history ■ checking account information and wire transfer instructions When you are no longer our customer, we continue to share your information as described in this notice. |
| |
| How? | All financial companies need to share customers’ personal information to run their everyday business. In the section below, we list the reasons financial companies can share their customers’ personal information; the reasons the Funds chooses to share; and whether you can limit this sharing. |
| Reasons we can share your personal information | Do the Funds share? |
For our everyday business purposes—
such as to process your transactions, maintain your account(s), respond to court orders and legal investigations, or report to credit bureaus | Yes |
For our marketing purposes—
to offer our products and services to you | No |
| For joint marketing with other financial companies | No |
For our affiliates’ everyday business purposes—
information about your transactions and experiences | No |
For our affiliates’ everyday business purposes—
information about your creditworthiness | No |
| For nonaffiliates to market to you | No |
| Questions? | Call (434) 515-1517 for the Selective Opportunity Fund or (800) 985-3497 for the Selective Premium Income Fund. |
| Who we are |
| Who is providing this notice? | Selective Funds Ultimus Fund Distributors, LLC (Distributor) Ultimus Fund Solutions, LLC (Administrator) |
| What we do |
| How do the Funds protect my personal information? | To protect your personal information from unauthorized access and use, we use security measures that comply with federal law. These measures include computer safeguards and secured files and buildings. Our service providers are held accountable for adhering to strict policies and procedures to prevent any misuse of your nonpublic personal information. |
| How do the Funds collect my personal information? | We collect your personal information, for example, when you ■ open an account or deposit money ■ buy securities from us or sell securities to us ■ make deposits or withdrawals from your account ■ give us your account information ■ make a wire transfer ■ tell us who receives the money ■ tell us where to send the money ■ show your government-issued ID ■ show your driver’s license |
| Why can’t I limit all sharing? | Federal law gives you the right to limit only ■ sharing for affiliates’ everyday business purposes — information about your creditworthiness ■ affiliates from using your information to market to you ■ sharing for nonaffiliates to market to you State laws and individual companies may give you additional rights to limit sharing. |
| Definitions |
| Affiliates | Companies related by common ownership or control. They can be financial and nonfinancial companies. ■ Selective Wealth Management, Inc., the investment adviser to the Funds, could be deemed to be an affiliate. |
| Nonaffiliates | Companies not related by common ownership or control. They can be financial and nonfinancial companies. ■ The Funds do not share your personal information with nonaffiliates so they can market to you |
| Joint marketing | A formal agreement between nonaffiliated financial companies that together market financial products or services to you. ■ The Funds don’t jointly market. |
This page intentionally left blank.
This page intentionally left blank.
This page intentionally left blank.
Other Information
The Funds’ Statement of Additional Information (“SAI”) includes additional information about the trustees and is available without charge, upon request. You may call toll-free at (434) 515-1517 for the Selective Opportunity Fund or (800) 985-3497 for the Selective Premium Income Fund to request a copy of the SAI or to make shareholder inquiries.
Proxy Voting
A description of the policies and procedures that each Fund uses to determine how to vote proxies relating to portfolio securities and information regarding how each Fund voted those proxies during the most recent twelve month period ended June 30, are available (1) without charge upon request by calling (434) 515-1517 for the Selective Opportunity Fund or (800) 985-3497 for the Selective Premium Income Fund and (2) in Fund documents filed with the Securities and Exchange Commission (“SEC”) on the SEC’s website at www.sec.gov.
| TRUSTEES | INDEPENDENT REGISTERED |
| Kenneth G.Y. Grant, Chairman | PUBLIC ACCOUNTING FIRM |
| David R. Carson | Cohen & Company, Ltd. |
| Daniel J. Condon | 151 N Franklin Street, Suite 575 |
| Gary E. Hippenstiel | Chicago, IL 60606 |
| Stephen A. Little | |
| Ronald C. Tritschler | LEGAL COUNSEL |
| | Thompson Hine LLP |
| OFFICERS | 312 Walnut Street, 14th Floor |
| David R. Carson, President | Cincinnati, OH 45202 |
| Zachary P. Richmond, | |
| Treasurer and Chief Financial Officer | CUSTODIAN |
| Lynn E. Wood, | MUFG Union Bank, N.A. |
| Chief Compliance Officer | 350 California Street, Suite 2018 |
| | San Francisco, CA 94104 |
| INVESTMENT ADVISER | |
| Selective Wealth Management, Inc. | ADMINISTRATOR, TRANSFER |
| 828 Main Street, Suite 1101 | AGENT AND FUND ACCOUNTANT |
| Lynchburg, VA 24504 | Ultimus Fund Solutions, LLC |
| | 225 Pictoria Drive, Suite 450 |
| DISTRIBUTOR | Cincinnati, OH 45246 |
| Ultimus Fund Distributors, LLC | |
| 225 Pictoria Drive, Suite 450 | |
| Cincinnati, OH 45246 | |
This report is intended only for the information of shareholders or those who have received the Funds’ prospectus which contains information about the Funds’ management fee and expenses. Please read the prospectus carefully before investing.
Distributed by Ultimus Fund Distributors, LLC
Member FINRA/SIPC
Selective-AR-20
Item 2. Code of Ethics.
As of the end of the period covered by this report, the registrant has adopted a code of ethics that applies to the registrant’s principal executive officer, principal financial officer, principal accounting officer or controller, or persons performing similar functions, regardless of whether these individuals are employed by the registrant or a third party. Pursuant to Item 12(a)(1), a copy of registrant’s code of ethics is filed as an exhibit to this Form N-CSR. During the period covered by this report, the code of ethics has not been amended, and the registrant has not granted any waivers, including implicit waivers, from the provisions of the code of ethics.
Item 3. Audit Committee Financial Expert.
(a) The registrant’s board of trustees has determined that the registrant does not have an audit committee financial expert. The committee members and the full Board considered a possibility of adding a member that would qualify as an expert. The audit committee determined that, although none of its members meet the technical definition of an audit committee expert, the committee has sufficient financial expertise to adequately perform its duties under the Audit Committee Charter without the addition of a qualified expert.
Item 4. Principal Accountant Fees and Services.
Crawford Funds: FY 2020 $43,900
FY 2019 $43,000
Selective: FY 2020 $28,600
FY 2019 $14,000
Registrant
Crawford Funds: FY 2020 $0
FY 2019 $0
Selective: FY 2020 $0
FY 2019 $0
Registrant
Crawford Funds: FY 2020 $9,900
FY 2019 $9,000
Selective: FY 2020 $6,600
FY 2019 $3,000
Nature of the fees: Preparation of the 1120 RIC and Excise review
Registrant
Crawford Funds: FY 2020 $0
FY 2019 $0
Selective: FY 2020 $0
FY 2019 $0
| (e) | (1) Audit Committee’s Pre-Approval Policies |
The Audit Committee Charter requires the Audit Committee to be responsible for the selection, retention or termination of auditors and, in connection therewith, to (i) evaluate the proposed fees and other compensation, if any, to be paid to the auditors, (ii) evaluate the independence of the auditors, (iii) pre-approve all audit services and, when appropriate, any non-audit services provided by the independent auditors to the Trust, (iv) pre-approve, when appropriate, any non-audit services provided by the independent auditors to the Trust's investment adviser, or any entity controlling, controlled by, or under common control with the investment adviser and that provides ongoing services to the Trust if the engagement relates directly to the operations and financial reporting of the Trust, and (v) receive the auditors’ specific representations as to their independence;
| (2) | All of the services described in paragraphs (b) through (d) of Item 4 were pre-approved by the Audit Committee. |
(f) During audit of registrant's financial statements for the most recent fiscal year, less than 50 percent of the hours expended on the principal accountant's engagement were attributed to work performed by persons other than the principal accountant's full-time, permanent employees.
(g) The aggregate non-audit fees billed by the registrant's accountant for services rendered to the registrant, and rendered to the registrant's investment adviser (not including any sub-adviser whose role is primarily portfolio management and is subcontracted with or overseen by another investment adviser), and any entity controlling, controlled by, or under common control with the adviser that provides ongoing services to the registrant:
Registrant Adviser
FY 2020 $ 0 $ 0
FY 2019 $ 0 $ 0
(h) The registrant’s audit committee has considered that the provision of non-audit services that were rendered to the registrant’s investment adviser and any entity controlling, controlled by, or under common control with the investment adviser that provides ongoing services to the registrant that were not pre-approved pursuant to paragraph (c)(7)(ii) of Rule 2-01 of Regulation S-X is compatible with maintaining the principal accountant’s independence.
Item 5. Audit Committee of Listed Companies. NOT APPLICABLE – applies to listed companies only
Item 6. Schedule of Investments. Schedule filed with Item 1.
Item 7. Disclosure of Proxy Voting Policies and Procedures for Closed-End Management Investment Companies. NOT APPLICABLE – applies to closed-end funds only
Item 8. Portfolio Managers of Closed-End Investment Companies. NOT APPLICABLE – applies to closed-end funds only
Item 9. Purchases of Equity Securities by Closed-End Management Investment Company and Affiliated Purchasers. NOT APPLICABLE – applies to closed-end funds only
Item 10. Submission of Matters to a Vote of Security Holders.
The registrant has not adopted procedures by which shareholders may recommend nominees to the registrant’s board of trustees.
Item 11. Controls and Procedures.
(a) Based on their evaluation of the registrant’s disclosure controls and procedures (as defined in Rule 30a-3(c) under the Investment Company Act of 1940, as amended (the “Act”)) as of a date within 90 days of the filing date of this report, the registrant’s principal executive officer and principal financial officer have concluded that such disclosure controls and procedures are reasonably designed and are operating effectively to ensure that material information relating to the registrant is made known to them by others within those entities, particularly during the period in which this report is being prepared, and that the information required in filings on Form N-CSR is recorded, processed, summarized, and reported on a timely basis.
(b) There were no significant changes in the registrant’s internal control over financial reporting that occurred during the registrant’s second fiscal quarter of the period covered by this report that have materially affected, or are reasonably likely to materially affect, the registrant’s internal control over financial reporting.
Item 12. Disclosure of Securities Lending Activities for Closed-End Investment Companies.
Not Applicable.
Item 13. Exhibits.
(a) (1) Code is filed herewith
(3) Not Applicable
SIGNATURES
Pursuant to the requirements of the Securities Exchange Act of 1934 and the Investment Company Act of 1940, the registrant has duly caused this report to be signed on its behalf by the undersigned, thereunto duly authorized.
(Registrant) Unified Series Trust
By
| /s/ David R. Carson |
| David R. Carson, President |
| |
Pursuant to the requirements of the Securities Exchange Act of 1934 and the Investment Company Act of 1940, this report has been signed below by the following persons on behalf of the registrant and in the capacities and on the dates indicated.
By
| /s/ David R. Carson |
| David R. Carson, President |
| |
By
/s/ Zachary P. Richmond
| Zachary P. Richmond, Treasurer |
| |