united states
securities and exchange commission
washington, d.c. 20549
form n-csr
certified shareholder report of registered management
investment companies
Investment Company Act file number 811-21237
Unified Series Trust
(Exact name of registrant as specified in charter)
225 Pictoria Drive, Suite 450
Cincinnati, OH 45246
(Address of principal executive offices)
(Zip code)
Zachary P. Richmond
Ultimus Fund Solutions, LLC
225 Pictoria Drive. Suite 450
Cincinnati, OH 45246
(Name and address of agent for service)
Registrant's telephone number, including area code: 513-587-3400
Date of fiscal year end: 03/31
Date of reporting period: 03/31/21
Form N-CSR is to be used by management investment companies to file reports with the Commission not later than 10 days after the transmission to stockholders of any report that is required to be transmitted to stockholders under Rule 30e-1 under the Investment Company Act of 1940 (17 CFR 270.30e-1). The Commission may use the information provided on Form N-CSR in its regulatory, disclosure review, inspection and policymaking roles.
A registrant is required to disclose the information specified by Form N-CSR, and the Commission will make this information public. A registrant is not required to respond to the collection of information contained in Form N-CSR unless the Form displays a currently valid Office of Management and Budget ("OMB") control number. Please direct comments concerning the accuracy of the information collection burden estimate and any suggestions for reducing the burden to Secretary, Securities and Exchange Commission, 450 Fifth Street, NW, Washington, DC 20549-0609. The OMB has reviewed this collection of information under the clearance requirements of 44 U.S.C. § 3507.
Item 1. Reports to Stockholders.

Absolute Core Strategy ETF (ABEQ)
NYSE Arca, Inc.
Annual Report
March 31, 2021
Absolute Investment Advisers LLC
4 North Street, Suite 2
Hingham, MA 02043
Telephone: 1-833-CORE ETF (267-3383)
Absolute Core Strategy ETF
Management’s Discussion of Fund Performance (Unaudited)
For the year ending March 31, 2021, the Absolute Core Equity ETF (ABEQ) returned 31.02%. By comparison, the S&P 500 Index returned 56.35%. These figures reflect a reflation of financial markets following the pandemic driven market drawdown in Q1 2020.
Dupont De Nemours, Berkshire Hathaway, and Corteva were larger gainers in the Fund during the period. Liberty Global, Kirkland Lake Gold, and Equity Commonwealth were detractors.
Our belief is that there is too much air and fragility underneath the market, a caution nobody wants to hear. We see disconnects everywhere between price and value. The total debt-to-GDP ratio across the entire U.S. economy stands at a record 365%. In just three quarters, the U.S. added as much debt to the country’s balance sheet as in the prior two decades combined - $77.4 trillion ($620,000 per household). At the 2000 technology bubble peak, the liability was $260,000 per household and at the peak of the 2007 housing bubble the ratio was $475,000. Perhaps this massive debt overhang explains the deflationary pressures that persist and why interest rates remain so low? We do not have the answer, but we know that these low rates can support elevated asset prices for a while.
Eventually, the underpinnings of low interest rates will wane when it becomes obvious that corporate profits can disappoint. The day will eventually arrive when profitless companies will no longer outperform those with solid business fundamentals. A credible plan to generate returns on invested capital and build future residual cash flow streams will be necessary, as markets can ignore fundamentals for only so long.
The key is to manage risk by continuously focusing on the quality of one’s investment and the price one pays. Timing market tops and bottoms is impossible, but one can assume that we are closer to a top than a bottom. We believe that valuations are so extreme that their starting point today represents limited future expected returns. As Jim Grant once warned, “The only permanent truth in finance is that people get bullish at the top and bearish at the bottom.” Therefore, if an investor can keep their head when all others are losing theirs, if one can wait and not be tired by waiting, if one can trust oneself when all men doubt them, yours is the Earth and everything that is in it.
Investment Results (Unaudited)
Average Annual Total Returns(a)
(for the periods ended March 31, 2021)
| | | Since Inception |
| | One Year | January 21, 2020 |
| Absolute Core Strategy ETF — NAV | 31.02% | 4.63% |
| Absolute Core Strategy ETF — Market | 30.61% | 4.67% |
| S&P 500 Total Return Index(b) | 56.35% | 18.32% |
| | | |
| | | Expense Ratios(c) |
| Gross | | 1.87% |
| With Applicable Waivers | | 0.88% |
The performance quoted represents past performance, which does not guarantee future results. The investment return and principal value of an investment will fluctuate so that an investor’s shares, when redeemed, may be worth more or less than their original cost. The returns shown do not reflect deduction of taxes that a shareholder would pay on Absolute Core Strategy ETF (the “Fund”) distributions or the redemption of Fund shares. Current performance of the Fund may be lower or higher than the performance quoted. The Fund’s investment objectives, risks, charges and expenses must be considered carefully before investing. Performance data current to the most recent month end may be obtained by calling (833) 267-3383.
| (a) | Return figures reflect any change in price per share and assume the reinvestment of all distributions. The Fund’s returns reflect any fee reductions during the applicable period. If such fee reductions had not occurred, the quoted performances would have been lower. |
| (b) | The S&P 500 Total Return Index (“Index”) is a widely recognized unmanaged index of equity securities and is representative of a broader domestic equity market and range of securities than is found in the Fund’s portfolio. Individuals cannot invest directly in the Index; however, an individual can invest in exchange-traded funds or other investment vehicles that attempt to track the performance of a benchmark index. |
| (c) | The expense ratios which include acquired fund fees and expenses of 0.03%, are from the Fund’s prospectus dated July 29, 2020, which were estimated amounts for the Fund’s initial fiscal year. Absolute Investment Advisers, LLC (the “Adviser”) contractually has agreed to waive its management fee and/or reimburse expenses so that total annual Fund operating expenses, excluding portfolio transaction and other investment-related costs (including brokerage fees and commissions); taxes; borrowing costs (such as interest and dividend expenses on securities sold short); acquired fund fees and expenses; fees and expenses associated with investments in other collective investment vehicles or derivative instruments (including for example option and swap fees and expenses); any amounts payable pursuant to a distribution or service plan adopted in accordance with Rule 12b-1 under the Investment Company Act of 1940; any administrative and/or shareholder servicing fees payable pursuant to a plan adopted by the Board of Trustees; expenses incurred in connection with any merger or reorganization; extraordinary expenses (such as litigation expenses, indemnification of Trust officers and Trustees and contractual indemnification of Fund service providers); and other expenses that the Trustees agree have not been incurred in the ordinary course of the Fund’s business, do not exceed 0.85% through July 31, 2023. This expense cap may not be terminated prior to this date except by the Board of Trustees. Each waiver/expense payment by the Adviser is subject to recoupment by the Adviser from the Fund in the three years following the date the particular waiver/expense payment occurred, but only if such recoupment can be achieved without exceeding the annual expense limitation in effect at the time of the waiver/expense payment and any expense limitation in effect at the time of the recoupment. Additional information pertaining to the Fund’s expense ratios (not including acquired fund fees and expenses) as of March 31, 2021 can be found in the financial highlights. |
You should consider the Fund’s investment objectives, risks, charges and expenses carefully before you invest. The Fund’s prospectus contains important information about the Fund’s investment objectives, potential risks, management fees, charges and expenses, and other information and should be read carefully before investing. You may obtain a current copy of the Fund’s prospectus or performance data current to the most recent month by calling (833) 267-3383.
The Fund is distributed by Northern Lights Distributors, LLC, member FINRA/SIPC.
Investment Results (Unaudited) (continued)
Comparison of the Growth of a $10,000 Investment in the
Absolute Core Strategy ETF and the S&P 500 Total Return Index
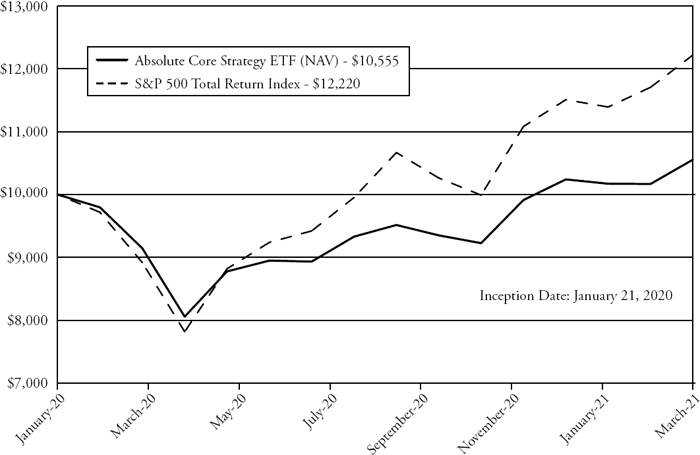
The chart above assumes an initial investment of $10,000 made on January 21, 2020 (commencement of operations) and held through March 31, 2021. The S&P 500 Total Return Index is a widely recognized unmanaged index of equity prices and is representative of a broader market and range of securities than is found in the Fund’s portfolio. Individuals cannot invest directly in an index; however, an individual may invest in exchange-traded funds or other investment vehicles that attempt to track the performance of a benchmark index. THE FUND’S RETURN REPRESENTS PAST PERFORMANCE AND DOES NOT GUARANTEE FUTURE RESULTS. The returns shown do not reflect deduction of taxes that a shareholder would pay on Fund distributions or the redemption of Fund shares. Investment returns and principal values will fluctuate so that your shares, when redeemed, may be worth more or less than their original purchase price.
Current performance may be lower or higher than the performance data quoted. For more information on the Fund, and to obtain performance data current to the most recent month-end, or to request a prospectus, please call (833) 267-3383. You should carefully consider the investment objectives, potential risks, management fees, and charges and expenses of the Fund before investing. The Fund’s prospectus contains this and other information about the Fund and should be read carefully before investing.
The Fund is distributed by Northern Lights Distributors, LLC, member FINRA/SIPC.
Portfolio Illustration (Unaudited)
March 31, 2021
The following chart gives a visual breakdown of the Fund’s holdings as a percentage of net assets.
Absolute Core Strategy ETF Holdings as of March 31, 2021(a)
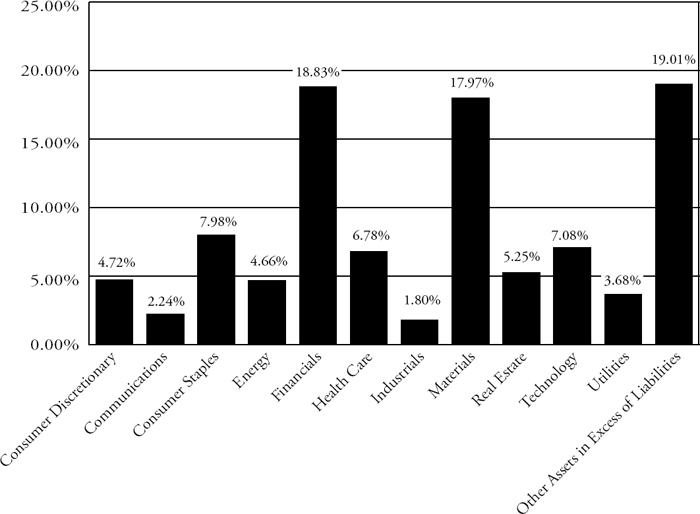
| (a) | As a percent of net assets. |
The investment objective of the Absolute Core Strategy ETF (the “Fund”) is positive absolute returns.
Portfolio holdings are subject to change.
Availability of Portfolio Schedule (Unaudited)
The Fund files its complete schedule of portfolio holdings with the Securities and Exchange Commission (the “SEC”) for the first and third quarters of each fiscal year as an exhibit to its reports on Form N-PORT. The Fund’s Form N-PORT reports are available on the SEC’s website at http://www.sec.gov.
| Absolute Core Strategy ETF |
| Schedule of Investments |
| March 31, 2021 |
| | | Shares | | | Fair Value | |
| Common Stocks — 80.99% | | | | | | | | |
| | | | | | | | | |
| Canada — 13.23% | | | | | | | | |
| Energy — 4.66% | | | | | | | | |
| Enbridge, Inc. | | | 58,733 | | | $ | 2,137,881 | |
| | | | | | | | | |
| Materials — 8.57% | | | | | | | | |
| Agnico Eagle Mines Ltd. | | | 23,293 | | | | 1,346,569 | |
| Barrick Gold Corp. | | | 58,398 | | | | 1,156,280 | |
| Kirkland Lake Gold Ltd. | | | 22,449 | | | | 758,776 | |
| Pan American Silver Corp. | | | 22,377 | | | | 671,981 | |
| | | | | | | | 3,933,606 | |
| Total Canada | | | | | | | 6,071,487 | |
| | | | | | | | | |
| Ireland — 2.22% | | | | | | | | |
| Health Care — 2.22% | | | | | | | | |
| Medtronic PLC | | | 8,609 | | | | 1,016,981 | |
| | | | | | | | | |
| Total Ireland | | | | | | | 1,016,981 | |
| | | | | | | | | |
| United Kingdom — 4.59% | | | | | | | | |
| Consumer Staples — 4.59% | | | | | | | | |
| Diageo PLC - ADR | | | 5,148 | | | | 845,353 | |
| Unilever PLC - ADR | | | 22,643 | | | | 1,264,159 | |
| | | | | | | | 2,109,512 | |
| Total United Kingdom | | | | | | | 2,109,512 | |
| | | | | | | | | |
| United States — 60.95% | | | | | | | | |
| Communications — 2.24% | | | | | | | | |
| Comcast Corp., Class A | | | 18,974 | | | | 1,026,683 | |
| | | | | | | | | |
| Consumer Discretionary — 4.72% | | | | | | | | |
| Graham Holdings Co., Class B | | | 1,012 | | | | 569,189 | |
| Starbucks Corp. | | | 8,875 | | | | 969,772 | |
| TJX Cos., Inc. (The) | | | 9,460 | | | | 625,779 | |
| | | | | | | | 2,164,740 | |
| Consumer Staples — 3.39% | | | | | | | | |
| Ingredion, Inc. | | | 17,279 | | | | 1,553,727 | |
| | | | | | | | | |
| Financials — 18.83% | | | | | | | | |
| Alleghany Corp.(a) | | | 1,615 | | | | 1,011,458 | |
| Berkshire Hathaway, Inc., Class B(a) | | | 15,337 | | | | 3,918,143 | |
| Loews Corp. | | | 44,550 | | | | 2,284,524 | |
| Travelers Cos., Inc. (The) | | | 9,500 | | | | 1,428,800 | |
| | | | | | | | 8,642,925 | |
See accompanying notes which are an integral part of these financial statements.
| Absolute Core Strategy ETF |
| Schedule of Investments (continued) |
| March 31, 2021 |
| | | Shares | | | Fair Value | |
| Common Stocks — (continued) | | | | | | | | |
| | | | | | | | | |
| United States — (continued) | | | | | | | | |
| Health Care — 4.56% | | | | | | | | |
| Pfizer, Inc. | | | 39,813 | | | $ | 1,442,426 | |
| UnitedHealth Group, Inc. | | | 1,602 | | | | 596,056 | |
| Viatris, Inc.(a) | | | 3,988 | | | | 55,712 | |
| | | | | | | | 2,094,194 | |
| Industrials — 1.80% | | | | | | | | |
| Expeditors International of Washington, Inc. | | | 5,327 | | | | 573,665 | |
| Mueller Water Products, Inc. - Series A | | | 18,010 | | | | 250,159 | |
| | | | | | | | 823,824 | |
| Materials — 9.40% | | | | | | | | |
| Corteva, Inc. | | | 39,704 | | | | 1,851,000 | |
| DuPont de Nemours, Inc. | | | 31,897 | | | | 2,465,001 | |
| | | | | | | | 4,316,001 | |
| Real Estate — 5.25% | | | | | | | | |
| Equity Commonwealth | | | 49,899 | | | | 1,387,192 | |
| Jones Lang LaSalle, Inc. | | | 5,701 | | | | 1,020,707 | |
| | | | | | | | 2,407,899 | |
| Technology — 7.08% | | | | | | | | |
| Cerner Corp. | | | 17,690 | | | | 1,271,557 | |
| Cisco Systems, Inc. | | | 27,798 | | | | 1,437,435 | |
| Guidewire Software, Inc.(a) | | | 5,311 | | | | 539,757 | |
| | | | | | | | 3,248,749 | |
| Utilities — 3.68% | | | | | | | | |
| Dominion Energy, Inc. | | | 22,201 | | | | 1,686,388 | |
| | | | | | | | | |
| Total United States | | | | | | | 27,965,130 | |
| | | | | | | | | |
| TOTAL COMMON STOCKS (Cost $32,278,718) | | | | | | | 37,163,110 | |
| | | | | | | | | |
| Total Investments — 80.99% (Cost $32,278,718) | | | | | | | 37,163,110 | |
| | | | | | | | | |
| Other Assets in Excess of Liabilities — 19.01% | | | | | | | 8,723,593 | |
| | | | | | | | | |
| Net Assets — 100.00% | | | | | | $ | 45,886,703 | |
| (a) | Non-income producing security. |
ADR - American Depositary Receipt.
See accompanying notes which are an integral part of these financial statements.
| Absolute Core Strategy ETF |
| Statement of Assets and Liabilities |
| March 31, 2021 |
| Assets | | | |
| Investments in securities, at fair value (cost $32,278,718) | | $ | 37,163,110 | |
| Cash | | | 9,115,607 | |
| Receivable for investments sold | | | 1,601,232 | |
| Dividends receivable | | | 26,617 | |
| Tax reclaims receivable | | | 19,941 | |
| Total Assets | | | 47,926,507 | |
| Liabilities | | | | |
| Payable for fund shares redeemed | | | 1,975,689 | |
| Payable to Adviser, net of waiver | | | 11,560 | |
| Payable to Administrator | | | 7,161 | |
| Payable to trustees | | | 207 | |
| Other accrued expenses | | | 45,187 | |
| Total Liabilities | | | 2,039,804 | |
| Net Assets | | $ | 45,886,703 | |
| Net Assets consist of: | | | | |
| Paid-in capital | | | 41,662,214 | |
| Accumulated earnings | | | 4,224,489 | |
| Net Assets | | $ | 45,886,703 | |
| Shares outstanding (unlimited number of shares authorized, no par value) | | | 1,750,000 | |
| Net asset value per share | | $ | 26.22 | |
See accompanying notes which are an integral part of these financial statements.
| Absolute Core Strategy ETF |
| Statement of Operations |
| For the year ended March 31, 2021 |
| Investment Income | | | |
| Dividend income (net of foreign taxes withheld of 26,330) | | $ | 466,654 | |
| Total investment income | | | 466,654 | |
| Expenses | | | | |
| Adviser | | | 277,453 | |
| Administration | | | 52,982 | |
| Chief Compliance Officer | | | 27,952 | |
| Legal | | | 23,109 | |
| Report printing | | | 19,450 | |
| Custodian | | | 19,041 | |
| Audit and tax | | | 18,423 | |
| Trustee | | | 13,541 | |
| Transfer agent | | | 10,489 | |
| Pricing | | | 772 | |
| Miscellaneous | | | 32,125 | |
| Total expenses | | | 495,337 | |
| Fees waived by Adviser | | | (217,326 | ) |
| Net operating expenses | | | 278,011 | |
| Net investment income | | | 188,643 | |
| Net Realized and Change in Unrealized Gain (Loss) on Investments | | | | |
| Net realized gain (loss) on: | | | | |
| Investment securities | | | 983,951 | |
| Foreign currency translations | | | 1,177 | |
| Change in unrealized appreciation on: | | | | |
| Investment securities | | | 7,054,329 | |
| Foreign currency translations | | | 386 | |
| Net realized and unrealized gain (loss) on investment securities and foreign currency translations | | | 8,039,843 | |
| Net increase in net assets resulting from operations | | $ | 8,228,486 | |
See accompanying notes which are an integral part of these financial statements.
| Absolute Core Strategy ETF |
| Statements of Changes in Net Assets |
| | | For the | | | For the | |
| | | Year Ended | | | Period Ended | |
| | | March 31, 2021 | | | March 31, 2020(a) | |
| Increase (Decrease) in Net Assets due to: | | | | | | | | |
| Operations | | | | | | | | |
| Net investment income | | $ | 188,643 | | | $ | 27,729 | |
| Net realized gain (loss) on investment securities and foreign currency translations | | | 985,128 | | | | (744,558 | ) |
| Change in unrealized appreciation (depreciation) on investment securities and foreign currency translations | | | 7,054,715 | | | | (2,169,937 | ) |
| Net increase (decrease) in net assets resulting from operations | | | 8,228,486 | | | | (2,886,766 | ) |
| Distributions to Shareholders From: | | | | | | | | |
| Earnings | | | (212,839 | ) | | | — | |
| Total distributions | | | (212,839 | ) | | | — | |
| Capital Transactions | | | | | | | | |
| Proceeds from shares sold | | | 21,233,292 | | | | 25,037,624 | |
| Amount paid for shares redeemed | | | (5,513,094 | ) | | | — | |
| Net increase in net assets resulting from capital transactions | | | 15,720,198 | | | | 25,037,624 | |
| Total Increase in Net Assets | | | 23,735,845 | | | | 22,150,858 | |
| Net Assets | | | | | | | | |
| Beginning of period | | $ | 22,150,858 | | | $ | — | |
| End of period | | $ | 45,886,703 | | | $ | 22,150,858 | |
| Share Transactions | | | | | | | | |
| Shares sold | | | 875,000 | | | | 1,100,000 | |
| Shares redeemed | | | (225,000 | ) | | | — | |
| Net increase in shares outstanding | | | 650,000 | | | | 1,100,000 | |
| (a) | For the period January 21, 2020 (commencement of operations) to March 31, 2020. |
See accompanying notes which are an integral part of these financial statements.
| Absolute Core Strategy ETF |
| Financial Highlights |
| (For a share outstanding during each period) |
| | | For the | | | For the | |
| | | Year Ended | | | Period Ended | |
| | | March 31, 2021 | | | March 31, 2020(a) | |
| Selected Per Share Data: | | | | | | |
| Net asset value, beginning of period | | $ | 20.14 | | | $ | 25.00 | |
| Investment operations: | | | | | | | | |
| Net investment income (loss) | | | 0.13 | | | | 0.03 | |
| Net realized and unrealized gain (loss) on investments | | | 6.10 | | | | (4.89 | ) |
| Total from investment operations | | | 6.23 | | | | (4.86 | ) |
| Less distributions to shareholders from: | | | | | | | | |
| Net investment income | | | (0.15 | ) | | | — | |
| Total distributions | | | (0.15 | ) | | | — | |
| Net asset value, end of period | | $ | 26.22 | | | $ | 20.14 | |
| Market price, end of period | | $ | 26.23 | | | $ | 20.21 | |
| Total Return(b) | | | 31.02 | % | | | (19.44 | )% (c) |
| Ratios and Supplemental Data: | | | | | | | | |
| Net assets, end of period (000 omitted) | | $ | 45,887 | | | $ | 22,151 | |
| Ratio of net expenses to average net assets | | | 0.85 | % | | | 0.85 | % (d) |
| Ratio of expenses to average net assets before waiver and reimbursement | | | 1.51 | % | | | 3.88 | % (d) |
| Ratio of net investment income to average net assets | | | 0.58 | % | | | 1.40 | % (d) |
| Portfolio turnover rate(e) | | | 36 | % | | | 30 | % (c) |
| (a) | For the period January 21, 2020 (commencement of operations) to March 31, 2020. |
| (b) | Total return is calculated assuming a purchase of shares at net asset value on the first day and a sale at net asset value on the last day of the period. Distributions are assumed, for the purpose of this calculation, to be reinvested at the ex-dividend date net asset value per share on their respective payment dates. |
| (e) | Portfolio turnover rate excludes securities received or delivered from in-kind processing of creations or redemptions. |
See accompanying notes which are an integral part of these financial statements.
| Absolute Core Strategy ETF |
| Notes to the Financial Statements |
| March 31, 2021 |
NOTE 1. ORGANIZATION
Absolute Core Strategy ETF (the “Fund”) was organized as a non-diversified series of Unified Series Trust (the “Trust”) on August 20, 2019, and is registered under the Investment Company Act of 1940, as amended (“1940 Act”). The Trust is an open-end investment company established under the laws of Ohio by an Agreement and Declaration of Trust dated October 17, 2002 (the “Trust Agreement”). The Trust Agreement permits the Board of Trustees of the Trust (the “Board”) to issue an unlimited number of shares of beneficial interest of separate series. The Fund is one of a series of funds currently authorized by the Board. The Fund’s investment adviser is Absolute Investment Advisers LLC (the “Adviser”). The Adviser has retained St. James Investment Company, LLC (the “Sub-Adviser”) to serve as sub-adviser to the Fund. The investment objective of the Fund is to provide positive absolute returns.
Non-Diversification Risk – The Fund is non-diversified, which means it may invest a greater percentage of its assets in a fewer number of stocks as compared to other mutual funds that are more broadly diversified. As a result, the Fund’s share price may be more volatile than the share price of some other exchange traded funds, and the poor performance of an individual stock in the Fund’s portfolio may have a significant negative impact on the Fund’s performance.
NOTE 2. SIGNIFICANT ACCOUNTING POLICIES
The Fund is an investment company and follows accounting and reporting guidance under Financial Accounting Standards Board Accounting Standards Codification (“ASC”) Topic 946, “Financial Services-Investment Companies.” The following is a summary of significant accounting policies followed by the Fund in the preparation of its financial statements. These policies are in conformity with generally accepted accounting principles in the United States of America (“GAAP”).
Estimates – The preparation of financial statements in conformity with GAAP requires management to make estimates and assumptions that affect the reported amounts of assets and liabilities and disclosure of contingent assets and liabilities at the date of the financial statements and the reported amounts of increases and decreases in net assets from operations during the reporting period. Actual results could differ from those estimates.
Foreign Currency Translation – The accounting records of the Fund are maintained in U.S. dollars. Foreign currency amounts are translated into U.S. dollars at the current rate of exchange each business day to determine the value of investments, and other assets and liabilities. Purchases and sales of foreign securities, and income and expenses, are translated at the prevailing rate of exchange on the respective date of these transactions. The Fund does not isolate that portion of the results of operations resulting from changes in foreign exchange rates on investments from fluctuation arising from changes in market prices of securities held. These fluctuations are included with the realized and unrealized
| Absolute Core Strategy ETF |
| Notes to the Financial Statements (continued) |
| March 31, 2021 |
gain or loss from investments. Net realized gain (loss) on foreign currency translations on the Statement of Operations represents currency gains (losses) realized between the trade and settlement dates on securities transactions, and the difference between the amount of investment income and foreign withholding taxes recorded on the Fund’s books and the U.S. dollar equivalent amounts actually received or paid. The change in unrealized currency gains (losses) on foreign currency translations for the period is reflected in the Statement of Operations.
Federal Income Taxes – The Fund makes no provision for federal income or excise tax. The Fund has qualified and intends to qualify each year as a regulated investment company (“RIC”) under subchapter M of the Internal Revenue Code of 1986, as amended, by complying with the requirements applicable to RICs and by distributing substantially all of its taxable income. The Fund also intends to distribute sufficient net investment income and net realized capital gains, if any, so that it will not be subject to excise tax on undistributed income and gains. If the required amount of net investment income or gains is not distributed, the Fund could incur a tax expense.
As of and during the fiscal year ended March 31, 2021, the Fund did not have any liabilities for any unrecognized tax benefits. The Fund recognizes interest and penalties, if any, related to unrecognized tax benefits as income tax expense in the Statement of Operations when incurred. During the year, the Fund did not incur any interest or penalties. Management of the Fund has reviewed tax positions taken in tax years that remain subject to examination by all major tax jurisdictions, including federal (i.e., the previous three tax year ends and the interim tax period since then, as applicable) and has concluded that no provision for unrecognized tax benefits or expenses is required in these financial statements and does not expect this to change over the next twelve months.
Expenses – Expenses incurred by the Trust that do not relate to a specific fund of the Trust are allocated to the individual funds based on each fund’s relative net assets or another appropriate basis (as determined by the Board).
Security Transactions and Related Income – The Fund follows industry practice and records security transactions on the trade date for financial reporting purposes. The specific identification method is used for determining gains or losses for financial statements and income tax purposes. Dividend income is recorded on the ex-dividend date and interest income is recorded on an accrual basis. Distributions received from investments in real estate investment trusts (“REITs”) that represent a return of capital or capital gain are recorded as a reduction of the cost of investment or as a realized gain, respectively. The calendar year-end amounts of ordinary income, capital gains, and return of capital included in distributions received from the Fund’s investments in REITs are reported to the Fund after the end of the calendar year; accordingly, the Fund estimates these amounts for accounting purposes until the characterization of REIT distributions is reported. Estimates
| Absolute Core Strategy ETF |
| Notes to the Financial Statements (continued) |
| March 31, 2021 |
are based on the most recent REIT distributions information available. Withholding taxes on foreign dividends and related reclaims have been provided for in accordance with the Fund’s understanding of the applicable country’s tax rules and rates.
Dividends and Distributions – The Fund intends to distribute substantially all of its net investment income, if any, at least semi-annually. The Fund intends to distribute its net realized long-term and short-term capital gains, if any, annually. Distributions to shareholders, which are determined in accordance with income tax regulations, are recorded on the ex-dividend date. The treatment for financial reporting purposes of distributions made to shareholders during the year from net investment income or net realized capital gains may differ from their ultimate treatment for federal income tax purposes. These differences are caused primarily by differences in the timing of the recognition of certain components of income, expense or realized capital gain for federal income tax purposes. Where such differences are permanent in nature, they are reclassified in the components of the net assets based on their ultimate characterization for federal income tax purposes. Any such reclassifications will have no effect on net assets, results of operations or net asset value (“NAV”) per share of the Fund.
For the fiscal year ended March 31, 2021, the Fund made the following reclassifications to increase (decrease) the components of net assets:
| | Accumulated |
| Paid-In Capital | Earnings (Deficit) |
| $904,392 | $(904,392) |
NOTE 3. SECURITIES VALUATION AND FAIR VALUE MEASUREMENTS
The Fund values its portfolio securities at fair value as of the close of regular trading on the New York Stock Exchange (the “NYSE”) (normally 4:00 p.m. Eastern time) on each business day the NYSE is open for business. Fair value is defined as the price that the Fund would receive upon selling an investment in a timely transaction to an independent buyer in the principal or most advantageous market of the investment. GAAP establishes a three-tier hierarchy to maximize the use of observable market data and minimize the use of unobservable inputs and to establish classification of fair value measurements for disclosure purposes.
Inputs refer broadly to the assumptions that market participants would use in pricing the asset or liability, including assumptions about risk (the risk inherent in a particular valuation technique used to measure fair value including a pricing model and/or the risk inherent in the inputs to the valuation technique). Inputs may be observable or unobservable. Observable inputs are inputs that reflect the assumptions market participants would use in pricing the asset or liability developed based on market data obtained and available from sources independent of the reporting entity. Unobservable inputs are inputs that reflect the
| Absolute Core Strategy ETF |
| Notes to the Financial Statements (continued) |
| March 31, 2021 |
reporting entity’s own assumptions about the assumptions market participants would use in pricing the asset or liability developed based on the best information available in the circumstances.
Various inputs are used in determining the value of the Fund’s investments. These inputs are summarized in the three broad levels listed below.
| ● | Level 1 – unadjusted quoted prices in active markets for identical investments and/ or registered investment companies where the value per share is determined and published and is the basis for current transactions for identical assets or liabilities at the valuation date |
| ● | Level 2 – other significant observable inputs (including, but not limited to, quoted prices for an identical security in an inactive market, quoted prices for similar securities, interest rates, prepayment speeds, credit risk, etc.) |
| ● | Level 3 – significant unobservable inputs (including the Fund’s own assumptions in determining fair value of investments based on the best information available) |
The inputs used to measure fair value may fall into different levels of the fair value hierarchy. In such cases, for disclosure purposes, the level in the fair value hierarchy which is reported is determined based on the lowest level input that is significant to the fair value measurement in its entirety.
Equity securities that are traded on any stock exchange are generally valued at the last quoted sale price on the security’s primary exchange. Lacking a last sale price, an exchange-traded security is generally valued at its last bid price. Securities traded in the NASDAQ over-the-counter market are generally valued at the NASDAQ Official Closing Price. When using the market quotations and when the market is considered active, the security is classified as a Level 1 security. In the event that market quotations are not readily available or are considered unreliable due to market or other events, the Fund values its securities and other assets at fair value in accordance with policies established by and under the general supervision of the Board. Under these policies, the securities will be classified as Level 2 or 3 within the fair value hierarchy, depending on the inputs used.
In accordance with the Trust’s valuation policies, the Adviser and/or Sub-Adviser is required to consider all appropriate factors relevant to the value of securities for which it has determined other pricing sources are not available or reliable as described above. No single method exists for determining fair value, because fair value depends upon the circumstances of each individual case. As a general principle, the current fair value of a security being valued by the Adviser and/or Sub-Adviser would be the amount that the Fund might reasonably expect to receive upon the current sale. Methods that are in accordance with this principle may, for example, be based on (i) a multiple of earnings; (ii) a discount from market prices of a similar freely traded security (including a derivative security or a basket of securities traded on other markets, exchanges or among dealers); or (iii) yield to maturity
| Absolute Core Strategy ETF |
| Notes to the Financial Statements (continued) |
| March 31, 2021 |
with respect to debt issues, or a combination of these and other methods. Fair-value pricing is permitted if, in the Adviser and/or Sub-Adviser’s opinion, the validity of market quotations appears to be questionable based on factors such as evidence of a thin market in the security based on a small number of quotations, a significant event occurs after the close of a market but before the Fund’s NAV calculation that may affect a security’s value, or the Adviser and/or Sub-Adviser is aware of any other data that calls into question the reliability of market quotations.
The following is a summary of the inputs used to value the Fund’s investments as of March 31, 2021:
| | | Valuation Inputs | | | | |
| Assets | | Level 1 | | | Level 2 | | | Level 3 | | | Total | |
| Common Stocks (a) | | $ | 37,163,110 | | | $ | — | | | $ | — | | | $ | 37,163,110 | |
| Total | | $ | 37,163,110 | | | $ | — | | | $ | — | | | $ | 37,163,110 | |
| (a) | Refer to Schedule of Investments for sector classifications. |
The Fund did not hold any investments at the end of the reporting period for which significant unobservable inputs (Level 3) were used in determining fair value; therefore, no reconciliation of Level 3 securities is included for this reporting period.
NOTE 4. FEES AND OTHER TRANSACTIONS WITH AFFILIATES
The Adviser, under the terms of the management agreement with the Trust with respect to the Fund (the “Agreement”), manages the Fund’s investments. As compensation for its management services, the Fund is obligated to pay the Adviser a fee computed and accrued daily and paid monthly at an annual rate of 0.85% of the Fund’s average daily net assets. The Adviser has hired the Sub-Adviser to manage the Fund’s assets on a day-to-day basis. The Sub-Adviser is paid by the Adviser. For the fiscal year ended March 31, 2021, before the waiver described below, the Adviser earned a fee of $277,453 from the Fund.
The Adviser has contractually agreed to waive its management fee and/or reimburse expenses so that total annual operating expenses (excluding portfolio transaction and other investment-related costs (including brokerage fees and commissions); taxes; borrowing costs (such as interest and dividend expenses on securities sold short); acquired fund fees and expenses; fees and expenses associated with investments in other collective investment vehicles or derivative instruments (including for example option and swap fees and expenses); any amounts payable pursuant to a distribution or service plan adopted in accordance with Rule 12b-1 under the 1940 Act; any administrative and/or shareholder servicing fees payable pursuant to a plan adopted by the Board of Trustees; expenses incurred in connection with any merger or reorganization; extraordinary expenses (such as litigation expenses, indemnification of Trust officers and Trustees and contractual indemnification of Fund service providers); and other expenses that the Trustees agree have not been incurred
| Absolute Core Strategy ETF |
| Notes to the Financial Statements (continued) |
| March 31, 2021 |
in the ordinary course of the Fund’s business) do not exceed 0.85% of the Fund’s average daily net assets through July 31, 2023. For the fiscal year ended March 31, 2021, the Adviser waived fees of $217,326. At March 31, 2021, the Fund owed the Adviser $11,560.
Each fee waiver/expense payment by the Adviser is subject to recoupment by the Adviser from the Fund in the three years following the date in which that particular waiver/ expense payment occurred, but only if such recoupment can be achieved without exceeding the annual expense limitation in effect at the time of the waiver/expense payment and any expense limitation in effect at the time of the recoupment. As of March 31, 2021 the Adviser may seek repayment of investment advisory fees waived and expense reimbursements pursuant to the aforementioned conditions, from the Fund no later than the dates stated below:
| Recoverable through | | | | |
| March 31, 2023 | | $ | 59,995 | |
| March 31, 2024 | | | 217,326 | |
Ultimus Fund Solutions, LLC (the “Administrator”) and its affiliate, Northern Lights Compliance Services, LLC (“Northern Lights”) provide the Fund with administration, fund accounting and compliance services, including all regulatory reporting. For the fiscal year ended March 31, 2021, the Administrator earned fees of $52,982 for administration services and $27,952 for compliance services. At March 31, 2021, the Fund owed the Administrator $7,161 for such services.
The Board supervises the business activities of the Trust. Each Trustee serves as a trustee until termination of the Trust unless the Trustee dies, resigns, retires, or is removed. The Chairman of the Board and more than 75% of the Trustees are “Independent Trustees,” which means that they are not “interested persons” as defined in the 1940 Act. Each Independent Trustee of the Trust receives annual compensation of $2,510 per fund from the Trust, except that the Chairman of the Audit Committee, the Chairman of the Governance & Nominating Committee, and the Chairman of the Pricing & Liquidity Committee each receives annual compensation of $2,960 per fund from the Trust, and the Independent Chairman of the Board receives $3,160 per fund from the Trust. Independent Trustees also receive $1,000 for attending each special in-person meeting. Prior to January 1, 2021, these fees were $2,290 for non-chairmen and $2,740 for all chairmen. In addition, the Trust reimburses Independent Trustees for out-of-pocket expenses incurred in conjunction with attendance at meetings.
Northern Lights Distributors, LLC (the “Distributor”) acts as the principal distributor of the Fund’s shares. The Distributor acts as the principal distributor of the Fund’s shares. The Administrator is the parent company of the Distributor. One Trustee and certain officers of the Trust are members of management and/or employees of the Distributor or Administrator. Officers are not paid for services to the Trust, however, the Fund pays Northern Lights, which compensates the Assistant Chief Compliance Officer.
| Absolute Core Strategy ETF |
| Notes to the Financial Statements (continued) |
| March 31, 2021 |
NOTE 5. INVESTMENT TRANSACTIONS
For the fiscal year ended March 31, 2021, purchases and sales of investment securities, other than short-term investments, were $9,019,608 and $11,323,660, respectively.
For the fiscal year ended March 31, 2021, purchases and sales for in-kind transactions were $16,530,586 and $4,161,524, respectively
For the fiscal year ended March 31, 2021, the Fund had in-kind net realized gain of $904,501.
There were no purchases or sales of long-term U.S. government obligations during the fiscal year ended March 31, 2021.
NOTE 6. BENEFICIAL OWNERSHIP
The beneficial ownership, either directly or indirectly, of more than 25% of the voting securities of a fund creates a presumption of control of a fund, under Section 2(a)(9) of the 1940 Act. As of March 31, 2021, the Sub-Adviser owned 25.42% of the Fund’s outstanding shares. As a result, the Sub-Adviser may be deemed to control the Fund.
NOTE 7. CAPITAL SHARE TRANSACTIONS
Shares are not individually redeemable and may be redeemed by the Fund at NAV only in large blocks known as “Creation Units” of 25,000 shares. Only Authorized Participants or transactions done through an Authorized Participant are permitted to purchase or redeem Creation Units from the Fund. An Authorized Participant is either (i) a broker-dealer or other participant in the clearing process through the Continuous Net Settlement System of the National Securities Clearing Corporation or (ii) a Depository Trust Company participant and, in each case, must have executed a Participant Agreement with the Distributor. Such transactions are generally permitted on an in-kind basis, with a balancing cash component to equate the transaction to the NAV per share of the Fund on the transaction date. Cash may be substituted equivalent to the value of certain securities generally when they are not available in sufficient quantity for delivery, not eligible for trading by the Authorized Participant or as a result of other market circumstances. In addition, the Fund may impose transaction fees on purchases and redemptions of Fund shares to cover the custodial and other costs incurred by the Fund in effecting trades. A fixed fee payable to the Custodian may be imposed on each creation and redemption transaction regardless of the number of Creation Units involved in the transaction (“Fixed Fee”). Purchases and redemptions of Creation Units for cash or involving cash-in-lieu are required to pay an additional variable charge to compensate the Fund and its ongoing shareholders for brokerage and market impact expenses relating to Creation Unit transactions (“Variable Charge,” and together with the Fixed Fee, the “Transaction Fees”). Transactions in capital shares for the Fund are
| Absolute Core Strategy ETF |
| Notes to the Financial Statements (continued) |
| March 31, 2021 |
disclosed in the Statement of Changes in Net Assets. For the fiscal year ended March 31, 2021, the Fund received $7,000 and $0 in Fixed Fees and Variable Charges, respectively. The Transaction Fees for the Fund are listed in the table below:
| Fixed Fee | Variable Charge |
| $250 | 2.00%* |
* The maximum Transaction Fee may be up to 2.00% of the amount invested.
NOTE 8. FEDERAL TAX INFORMATION
At March 31, 2021, the net unrealized appreciation (depreciation) and tax cost of investments for tax purposes was as follows:
| Gross unrealized appreciation | | $ | 5,431,715 | |
| Gross unrealized depreciation | | | (547,323 | ) |
| Net unrealized appreciation on investments | | $ | 4,884,392 | |
| Tax cost of investments | | $ | 32,278,718 | |
The tax character of distributions paid for the fiscal years ended March 31, 2021 was as follows:
| Distributions paid from: | | | | |
| Ordinary income(a) | | $ | 212,839 | |
| Total distributions paid | | $ | 212,839 | |
| (a) | Short-term capital gain distributions are treated as ordinary income for tax purposes. |
At March 31, 2021, the components of accumulated earnings (deficit) on a tax basis were as follows:
| Undistributed ordinary income | | $ | 4,679 | |
| Accumulated capital and other losses | | | (664,968 | ) |
| Unrealized appreciation on investments | | | 4,884,778 | |
| Total accumulated earnings | | $ | 4,224,489 | |
As of March 31, 2021, the Fund had short-term capital loss carryforwards available to offset future gains, not subject to expiration, in the amount of $664,968.
Management has analyzed the Fund’s tax positions and has concluded that no liability for unrecognized tax benefits should be recorded related to uncertain tax positions expected to be taken in the Fund’s March 31, 2021 year-end tax returns.
| Absolute Core Strategy ETF |
| Notes to the Financial Statements (continued) |
| March 31, 2021 |
NOTE 9. CORONAVIRUS (COVID-19) PANDEMIC
The COVID-19 pandemic has caused financial markets to experience periods of increased volatility due to uncertainty that exists around its long-term effects. COVID-19 has resulted in varying levels of travel restrictions, quarantines, disruptions to supply chains and customer activity, leading to general concern and economic uncertainty. The full impact and duration of the pandemic cannot necessarily be foreseen. Management continues to monitor developments and navigate accordingly, further evaluating the anticipated impact to financial markets.
NOTE 10. COMMITMENTS AND CONTINGENCIES
The Trust indemnifies its officers and Trustees for certain liabilities that may arise from their performance of their duties to the Trust or the Fund. Additionally, in the normal course of business, the Trust enters into contracts that contain a variety of representations and warranties which provide general indemnifications. The Trust’s maximum exposure under these arrangements is unknown, as this would involve future claims that may be made against the Trust that have not yet occurred.
NOTE 11. SUBSEQUENT EVENTS
Management of the Fund has evaluated the need for disclosures and/or adjustments resulting from subsequent events through the date at which these financial statements were issued. Based upon this evaluation, management has determined there were no items requiring adjustment of the financial statements or additional disclosure.
Report of Independent Registered Public Accounting Firm
To the Shareholders of Absolute Core Strategy ETF and
Board of Trustees of Unified Series Trust
Opinion on the Financial Statements
We have audited the accompanying statement of assets and liabilities, including the schedule of investments, of Absolute Core Strategy ETF (the “Fund”), a series of Unified Series Trust, as of March 31, 2021, the related statement of operations for the year then ended, the statements of changes in net assets and the financial highlights for each of the two periods in the period then ended, and the related notes (collectively referred to as the “financial statements”). In our opinion, the financial statements present fairly, in all material respects, the financial position of the Fund as of March 31, 2021, the results of its operations for the year then ended, the changes in net assets and the financial highlights for each of the two periods in the period then ended, in conformity with accounting principles generally accepted in the United States of America.
Basis for Opinion
These financial statements are the responsibility of the Fund’s management. Our responsibility is to express an opinion on the Fund’s financial statements based on our audits. We are a public accounting firm registered with the Public Company Accounting Oversight Board (United States) (“PCAOB”) and are required to be independent with respect to the Fund in accordance with the U.S. federal securities laws and the applicable rules and regulations of the Securities and Exchange Commission and the PCAOB.
We conducted our audits in accordance with the standards of the PCAOB. Those standards require that we plan and perform the audit to obtain reasonable assurance about whether the financial statements are free of material misstatement whether due to error or fraud.
Our audits included performing procedures to assess the risks of material misstatement of the financial statements, whether due to error or fraud, and performing procedures that respond to those risks. Such procedures included examining, on a test basis, evidence regarding the amounts and disclosures in the financial statements. Our procedures included confirmation of securities owned as of March 31, 2021, by correspondence with the custodian and brokers; when replies were not received from brokers, we performed other auditing procedures. Our audits also included evaluating the accounting principles used and significant estimates made by management, as well as evaluating the overall presentation of the financial statements. We believe that our audits provide a reasonable basis for our opinion.
We have served as the Fund’s auditor since 2020.
COHEN & COMPANY, LTD.
Chicago, Illinois
May 27, 2021
Liquidity Risk Management Program (Unaudited)
The Fund has adopted and implemented a written liquidity risk management program (the “Program”) as required by Rule 22e-4 (the “Liquidity Rule”) under the 1940 Act. The Program is reasonably designed to assess and manage the Fund’s liquidity risk, taking into consideration, among other factors, the Fund’s investment strategy and the liquidity of its portfolio investments during normal and reasonably foreseeable stressed conditions; its short and long-term cash flow projections; and its cash holdings and access to other funding sources. The Board approved the appointment of the Liquidity Administrator Committee, comprising certain Trust officers and employees of the Adviser. The Liquidity Administrator Committee maintains Program oversight and reports to the Board on at least an annual basis regarding the Program’s operational effectiveness through a written report (the “Report”). The Program’s initial Report, which was presented to the Board for consideration at its meeting held on November 17, 2020, outlined the operation of the Program and the adequacy and effectiveness of the Program’s implementation. During the review period, the Fund did not experience unusual stress or disruption to its operations related to purchase and redemption activity. Also, during the review period the Fund held adequate levels of cash and highly liquid investments to meet shareholder redemption activities in accordance with applicable requirements. The Report concluded that the Program is reasonably designed to prevent violation of the Liquidity Rule and has been effectively implemented.
Summary of Fund Expenses (Unaudited)
As a shareholder of the Fund, you incur two types of costs: (1) transaction and (2) ongoing costs, including management fees and other Fund expenses. These examples are intended to help you understand your ongoing costs (in dollars) of investing in the Fund and to compare these costs with the ongoing costs of investing in other mutual funds. The example is based on an investment of $1,000 invested at the beginning of the period and held for the entire period from October 1, 2020 through March 31, 2021. Investors may pay brokerage commissions on their purchases and sales of exchange traded fund shares, which are not reflected in the example.
Actual Expenses
The first line of the table below provides information about actual account values and actual expenses. You may use the information in this line, together with the amount you invested, to estimate the expenses that you paid over the period. Simply divide your account value by $1,000 (for example, an $8,600 account value divided by $1,000 = 8.6), then multiply the result by the number in the first line under the heading entitled “Expenses Paid During Period” to estimate the expenses you paid on your account during this period.
Hypothetical Example for Comparison Purposes
The second line of the table below provides information about hypothetical account values and hypothetical expenses based on the Fund’s actual expense ratio and an assumed rate of return of 5% per year before expenses, which is not the Fund’s actual return. The hypothetical account values and expenses may not be used to estimate the actual ending account balance or expenses you paid for the period. You may use this information to compare the ongoing costs of investing in the Fund and other funds. To do so, compare this 5% hypothetical example with the 5% hypothetical examples that appear in the shareholder reports of other funds.
Expenses shown in the table are meant to highlight your ongoing costs only and do not reflect any transactional costs. Therefore, the second line of the table below is useful in comparing ongoing costs only and will not help you determine the relative costs of owning different funds. In addition, if transaction costs were included, your costs would have been higher.
| | Beginning | | Ending | | | | |
| | Account Value | | Account Value | | Expenses Paid | | Annualized |
| | October 1, | | March 31, | | During | | Expense |
| | 2020 | | 2021 | | Period(a) | | Ratio |
| ABSOLUTE CORE STRATEGY ETF | | | | | | | |
| | Actual | $ 1,000.00 | | $ 1,128.80 | | $ 4.51 | | 0.85% |
| | Hypothetical(b) | $ 1,000.00 | | $ 1,020.69 | | $ 4.28 | | 0.85% |
| (a) | Expenses are equal to the Fund’s annualized expense ratios, multiplied by the average account value over the period, multiplied by 182/365 (to reflect the one-half year period). |
| (b) | Hypothetical assumes 5% annual return before expenses. |
Additional Federal Income Tax Information (Unaudited)
The Form 1099-DIV you receive in January 2022 will show the tax status of all distributions paid to your account in calendar year 2021. Shareholders are advised to consult their own tax adviser with respect to the tax consequences of their investment in the Fund. As required by the Internal Revenue Code and/or regulations, shareholders must be notified regarding the status of qualified dividend income for individuals and the dividends received deduction for corporations.
Qualified Dividend Income. The Fund designates approximately 100% or up to the maximum amount of such dividends allowable pursuant to the Internal Revenue Code, as qualified dividend income eligible for a reduced tax rate.
Qualified Business Income. The Fund designates approximately 100% of its ordinary income dividends, or up to the maximum amount of such dividends allowable pursuant to the Internal Revenue Code, as qualified business income.
Dividends Received Deduction. Corporate shareholders are generally entitled to take the dividends received deduction on the portion of the Fund’s dividend distribution that qualifies under tax law. For the Fund’s calendar year 2021 ordinary income dividends, 0% qualifies for the corporate dividends received deduction.
Trustees and Officers (Unaudited)
GENERAL QUALIFICATIONS. The Board supervises the business activities of the Trust. Each Trustee serves as a trustee until termination of the Trust unless the Trustee dies, resigns, retires, or is removed. The Chairman of the Board and more than 75% of the Trustees are “Independent Trustees,” which means that they are not “interested persons” (as defined in the 1940 Act) of the Trust or any adviser, sub-adviser or distributor of the Trust.
The following table provides information regarding the Independent Trustees.
| Name, Address*, (Year of Birth), Position with Trust**, Term of Position with Trust | Principal Occupation During Past 5 Years and Other Directorships |
Kenneth G.Y. Grant (1949)
Chairman, January 2017 to present; Independent Trustee, May 2008 to present | Current: Director, Standpoint Multi-Asset (Cayman) Fund, Ltd. (2019 – present); Director, Advisors Charitable Gift Fund (2020 - present), a Donor Advised Fund. |
| | |
| | Previous: EVP, Benefit Plans Administrative Services, Inc., provider of retirement benefit plans administration (2019 – 2020); Director, Northeast Retirement Services (NRS) LLC, a transfer agent and fund administrator; and Director, Global Trust Company (GTC), a non-depository trust company sponsoring private investment product (2003 – 2019); EVP, NRS (2003 – 2019); GTC, EVP (2008 – 2019); EVP, Savings Banks Retirement Association (2003 – 2019), provider of qualified retirement benefit plans. |
Daniel J. Condon (1950)
Chairman of the Audit Committee; Chairman of the Governance & Nominating Committee; Independent Trustee, December 2002 to present | Current: Retired (2017 - present)
Previous: Executive Advisor of Standard Steel LLC, a Railway manufacturing supply company (2016); Chief Executive Officer of Standard Steel LLC (2011 - 2015); Director of Standard Steel Holdings Co., which owns Standard Steel LLC (2011 - 2016); Director of International Crankshaft Inc. (2004 - 2016). |
Gary E. Hippenstiel (1947)
Chairman of the Pricing & Liquidity Committee; Independent Trustee, December 2002 to present | Current: President and founder of Hippenstiel Investment Counsel LLC (“Hippenstiel”) since 2008. Hippenstiel was registered as an investment adviser from 2008 to December 31, 2019. |
Stephen A. Little (1946)
Independent Trustee, December 2002 to present; Chairman, December 2004 to December 2016 | Current: President and founder of The Rose, Inc., a registered investment adviser, since 1993. |
Ronald C. Tritschler (1952)
Independent Trustee, January 2007 to present; Interested Trustee, December 2002 to December 2006 | Current: Chief Executive Officer, Director and Legal Counsel of The Webb Companies, a national real estate company, since 2001; Director, Standpoint Multi-Asset (Cayman) Fund, Ltd. (2020 – present). |
| * | The address for each Trustee is 225 Pictoria Drive, Suite 450, Cincinnati, Ohio 45246. |
| ** | As of the date of this report, the Trust consists of 25 series. |
Trustees and Officers (Unaudited) (continued)
The following table provides information regarding the Interested Trustee and the Officers of the Trust.
Name, Address*, (Year of Birth),
Position with Trust,
Term of Position with Trust | Principal Occupation During
Past 5 Years and Other Directorships |
David R. Carson (1958)
President, January 2016 to present; Interested Trustee, August 2020 to present | Current: Senior Vice President Client Strategies of Ultimus Fund Solutions, LLC, since 2013. |
Zachary P. Richmond (1980)
Treasurer and Chief Financial Officer, November 2014 to present | Current: Vice President, Director of Financial Administration for Ultimus Fund Solutions, LLC, since 2015. |
Martin R. Dean (1963)
Vice President, November 2020 to present; Chief Compliance Officer, April 2021 to present; Assistant Chief Compliance Officer, January 2016 to April 2021 | Current: Senior Vice President, Head of Fund Compliance of Ultimus Fund Solutions, LLC, since 2016. |
Elisabeth Dahl (1962)
Secretary, May 2017 to present; Assistant Secretary, March 2016 to May 2017 | Current: Attorney, Ultimus Fund Solutions, LLC since March 2016. |
Stephen Preston (1966)
AML Compliance Officer, May 2017 to present | Current: Vice President and Chief Compliance Officer, Ultimus Fund Solutions, LLC and Ultimus Fund Distributors, LLC, since 2011. |
Lynn E. Wood (1946)
Assistant Chief Compliance Officer, April 2021 to present; Chief Compliance Officer, October 2004 to April 2021 | Current: Managing Member, Buttonwood Compliance Partners, LLC, since 2013. |
| * | The address for each Officer is 225 Pictoria Drive, Suite 450, Cincinnati, Ohio 45246. |
Other Information
The Fund’s Statement of Additional Information (“SAI”) includes additional information about the Trustees and is available without charge, upon request. You may call toll-free at (833) 267-3383 to request a copy of the SAI or to make shareholder inquiries.
Proxy Voting
A description of the policies and procedures that the Fund uses to determine how to vote proxies relating to portfolio securities and information regarding how the Fund voted those proxies during the most recent twelve month period ended June 30, are available (1) without charge upon request by calling the Fund at (833) 267-3383 and (2) in Fund documents filed with the Securities and Exchange Commission (“SEC”) on the SEC’s website at www.sec.gov.
| TRUSTEES |
| Kenneth G.Y. Grant, Chairman |
| David R. Carson |
| Daniel J. Condon |
| Gary E. Hippenstiel |
| Stephen A. Little |
| Ronald C. Tritschler |
| |
| OFFICERS |
| David R. Carson, President |
| Martin R. Dean, |
| Vice President / Chief Compliance Officer |
| Zachary P. Richmond, |
| Treasurer and Chief Financial Officer |
| Lynn E. Wood, Assistant Chief Compliance Officer |
| |
| INVESTMENT ADVISER |
| Absolute Investment Advisers LLC |
| 4 North Street, Suite 2 |
| Hingham, MA 02043 |
| |
| DISTRIBUTOR |
| Northern Lights Distributors, LLC |
| 17605 Wright Street |
| Omaha, Nebraska 68130 |
| INDEPENDENT REGISTERED PUBLIC ACCOUNTING FIRM |
| Cohen & Company, Ltd. |
| 151 N Franklin Street, Suite 575 |
| Chicago, IL 60606 |
| |
| LEGAL COUNSEL |
| Thompson Hine LLP |
| 312 Walnut Street, 20th Floor |
| Cincinnati, OH 45202 |
| |
| CUSTODIAN |
| Brown Brothers Harriman & Co. |
| 50 Post Office Square |
| Boston, MA 02110 |
| |
| ADMINISTRATOR |
| Ultimus Fund Solutions, LLC |
| 225 Pictoria Drive, Suite 450 |
| Cincinnati, OH 45246 |
This report is intended only for the information of shareholders or those who have received the Fund’s prospectus which contains information about the Fund’s management fee and expenses. Please read the prospectus carefully before investing.
Distributed by Northern Lights Distributors, LLC
Member FINRA/SIPC
Absolute Core-AR-21

Dean Small Cap Value Fund
Dean Mid Cap Value Fund
Annual Report
March 31, 2021
DEAN SMALL CAP VALUE FUND
MANAGEMENT’S DISCUSSION OF FUND PERFORMANCE
(Unaudited)
Management’s Discussion & Analysis
The Dean Small Cap Value Fund returned +86.33% net of fees for the twelve months ended March 31st, 2021, compared with a +97.05% return for the benchmark Russell 2000 Value Index and a +94.85% return for the broader Russell 2000 Index.
Macro Factors Impacting Performance
Macro factors were mixed this past fiscal year. The portfolio consistently held stocks with lower valuations than the benchmark throughout the year and greatly benefited from this positioning in the final quarter of the fiscal year. However, the portfolio also has a high-quality bias through which it holds stocks with lower volatility and higher profitability. Both of these factors worked against the portfolio throughout the year as low-quality stocks had a strong rally due to unprecedented monetary and fiscal stimulus in response to COVID-19.
Sector Performance (best/worst relative to benchmark)
The best performing sector relative to the benchmark for the twelve-month period was Industrials. The outperformance was a result of being overweight the outperforming sector, as well as having better-than-benchmark stock selection. The Industrials sector benefited from the “risk-on” reopening trade in the market. The portfolio particularly benefited from its heavy weighting in Capital Goods stocks as the market embraced increased probabilities for infrastructure spending and fiscal support.
The second best performing sector relative to the benchmark was Utilities. The outperformance stemmed from our dynamic sector allocation as well as having better-than-benchmark stock selection. Utilities outperformed in the COVID-19 market selloff causing them to appear expensive in our normalized earnings power framework. Thus, we exited all Utility positions to have no weight in the sector. As interest rates climbed throughout the year, Utility stocks underperformed, and we were able to initiate well timed additions to the sector during this underperformance. We were consistently adding to the portfolio’s Utility weight throughout the last half of the fiscal year as normalized valuations became more attractive. As of March 31st, 2021 Utilities are the portfolio’s second largest overweight sector as we believe the future risk-adjusted returns look promising.
DEAN SMALL CAP VALUE FUND
MANAGEMENT’S DISCUSSION OF FUND PERFORMANCE
(Unaudited) – (continued)
The worst performing sector relative to the benchmark for the last twelve months was Consumer Discretionary. The underperformance was the result of below index stock selection as well as being underweight the best performing sector for the period during its steepest climb in the last two quarters. Drilling down even further, most of the sector underperformance came from being underweight the Retailing industry. Retail stocks benefited from the year’s “risk-on” mood, which resulted in Retail having the best performance of all the industries. Using our high-quality investing framework, in which we emphasize strong balance sheets, predictable earnings, and market leading positions, we feel like many of the Retail stocks that had strong performance this year appear to have a very wide range of outcomes, meaning the large gains from this year can just as easily turn into large losses at any given time in the future. We continue to see great uncertainty surrounding post-pandemic normalized earnings power levels in the Retailing industry, even in a “fully” opened economy.
The second worst performing sector relative to the benchmark was Consumer Staples. The underperformance was due to below index stock selection. Two stocks accounted for the underperformance, one was a name the portfolio did not hold, and one was a portfolio holding; Andersons (ANDE), which we discuss in more detail in the Individual Securities section. The largest consumer staples stock in the benchmark is Darling Ingredients (DAR), a former portfolio holding that we sold last fiscal year as it became too large and, in our opinion, too high of a valuation to continue holding in the portfolio. DAR is a rendering company that also has a joint venture in a biofuel refinery. DAR was swept up in the rush to invest in renewable energy companies and became, at one point, the largest holding in the benchmark. The combination of DAR’s large benchmark weight and strong performance led to over half of the portfolio’s underperformance in the Consumer Staples sector.
Individual Securities Performance (best/worst absolute contributors)
The largest contributing company in the fiscal year was Cooper Tire & Rubber (CTB). CTB manufactures replacement tires. Its brands include Coopertires, Roadmaster, and Mastercraft, amongst others. CTB benefited from hopes of an economic recovery as it began reopening its manufacturing facilities. CTB could also benefit, going forward, from its positioning as a less cyclical replacement manufacturer versus selling to OEM’s as consumers look to extend the life of their existing vehicles. These attributes attracted a cash and stock acquisition offer from Goodyear Tire (GT) that valued CTB at $54.26/share, which represented a 24% premium to CTB’s stock price prior to the announcement. The portfolio maintains a position in CTB as we wait for the acquisition to close.
DEAN SMALL CAP VALUE FUND
MANAGEMENT’S DISCUSSION OF FUND PERFORMANCE
(Unaudited) – (continued)
The second largest contributing stock was Wesco International (WCC). WCC operates distribution centers that distribute electrical products and other industrial maintenance, repair, and operating supplies, while also providing integrated supply services. WCC closed on its acquisition of Anixter (AXE) midway through the period. The AXE acquisition will make WCC the largest domestic industrial distributor in a highly fragmented market. While there is execution risk, and WCC did leverage the balance sheet, the AXE acquisition has the potential to provide a very attractive return if management’s significant synergy targets are met. WCC’s stock price reacted favorably to the combination of the merger plus the reopening of the economy. Taking advantage of the price strength, we exited the position in WCC after a nice gain.
The largest detracting stock in the period was MTS Systems (MTSC). MTSC is a leading supplier of test, simulation, and measurement systems. The test and simulations segment produces high performance test systems and motion simulators for research, product design, and manufacturing applications. The sensors segment produces precise measurement devices that improve product performance, optimize machine operation, and provide safer environments. MTSC has global exposure with roughly 1/3 of its business in the Americas, Europe, and Asia, respectively, all places impacted by the COVID-19 lockdowns. It also has end market exposure to air traffic, autos, and amusement parks, which, once again, were all areas impacted by the pandemic; thus its stock price suffered during the market selloff related to COVID-19. We felt that MTSC was well positioned in niche businesses where it had a competitive advantage given its reputation and long-standing customer relationships. However, we became increasingly concerned about the less than pristine balance sheet, and the final straw was when the CEO exited to pursue another opportunity as the stock was cratering; thus, we exited the position in MTSC on the news while harvesting a tax loss.
The second largest detracting stock was Andersons (ANDE). ANDE merchandises grain, operates grain elevator facilities, repairs/sells/leases railcars, distributes wholesale agricultural fertilizer, and distributes agricultural inputs to dealers and farmers. Historically, ANDE’s diverse set of agricultural related businesses had produced reasonably steady fundamental growth as the businesses would offset each other with some prospering while others would struggle and vice versa. However, with commodity prices declining before COVID-19 and then collapsing when COVID-19 first hit, nearly all of ANDE’s businesses were in the down part of the cycle. We believe that ANDE has solid assets; however, we decided to move on to better risk/rewards coming out of the COVID-19 downturn; thus we exited the position and harvested a tax loss.
DEAN SMALL CAP VALUE FUND
MANAGEMENT’S DISCUSSION OF FUND PERFORMANCE
(Unaudited) – (continued)
Current Positioning and Opportunities
The portfolio’s largest overweight sectors relative to the benchmark are currently in the Consumer Staples and Utilities sectors. The largest underweight sectors relative to the benchmark are currently in the Industrials and Consumer Discretionary sectors. Throughout the year, the Financials and Utilities sectors increased the most in weight, while the Industrials and Information Technology sectors decreased the most in weight. As always, these relative weights are a residual of our bottom-up opportunities and not based on a top-down macro call on the market or economy.
The COVID-19 pandemic, and the global response to it, is an unprecedented event that has created enormous economic disruption and uncertainty. At this time, it appears the U.S. is on a good vaccine trajectory and coupled with the monetary and fiscal stimulus, seems to have weathered the worst of the storm, so far. However, it is difficult to know whether the COVID-19 virus mutates or reemerges in a different form and the extent of the economic damage that might cause. We are monitoring the situation closely, as we do all economic shocks, whether that be in the form of a pandemic or a normal economic cycle. We would expect further volatility ahead as the world works its way through this pandemic, vaccine rollout, and possible variants of the virus. However, we have dealt with elevated bouts of market volatility on many occasions since Dean Capital Management began sub-advising the funds in 2008. The pandemic might have been an unprecedented catalyst, but the volatility it caused was within the range of what we would consider historically normal for small cap and mid cap stocks. We stay focused on the normalized earnings power, the valuations, and the quality of the companies the portfolio holds, and this has served us well in the long run through times of elevated market volatility.
We remain focused on the fundamentals of the companies we own, and the price we are paying for those fundamentals. We are confident that a steadfast application of our proven and disciplined process should produce favorable results over time.
Thank you for your continued confidence in Dean.
DEAN SMALL CAP VALUE FUND
Performance Summary (Unaudited)
| Average Annual Total Returns* |
| (for the periods ended March 31, 2021) |
| |
| | | 1 Year | | 5 Year | | 10 year | |
| Dean Small Cap Value Fund | | 86.33% | | 9.68% | | 9.19% | |
| Russell 2000 Value Index** | | 97.05% | | 13.56% | | 10.06% | |
| Russell 2000 Index** | | 94.85% | | 16.35% | | 11.68% | |
| Total annual operating expenses, which include acquired fund fees and expenses of 0.01%, as disclosed in the Dean Small Cap Value Fund (the “Fund”) prospectus dated July 29, 2020, were 1.16% of the Fund’s average daily net assets. Additional information pertaining to the expense ratios as of March 31, 2021 can be found in the financial highlights. |
The performance quoted represents past performance, which does not guarantee future results. The investment return and principal value of an investment will fluctuate so that an investor’s shares, when redeemed, may be worth more or less than their original cost. The returns shown do not reflect deduction of taxes that a shareholder would pay on Fund distributions or the redemption of Fund shares. Current performance may be lower or higher than the performance quoted. The Fund’s investment objectives, risks, charges and expenses must be considered carefully before investing. Performance data current to the most recent month end may be obtained by calling (888) 899-8343.
| * | Return figures reflect any change in price per share and assume the reinvestment of all distributions. |
| ** | The Russell 2000 and Russell 2000 Value Indices are unmanaged indices that assume reinvestment of all distributions and exclude the effect of taxes and fees. The indices are widely recognized unmanaged indices of equity prices and are representative of a broader market and range of securities than are found in the Fund’s portfolio. An individual cannot invest directly in an index or, the indices. However, an individual may be able to invest in exchange traded funds or other investment vehicles that attempt to track the performance of an index. |
You should consider the Fund’s investment objectives, risks, charges and expenses carefully before you invest. The Fund’s prospectus contains important information about the Fund’s investment objectives, potential risks, management fees, charges and expenses, and other information and should be read carefully before investing. You may obtain a current copy of the Fund’s prospectus or performance data current to the most recent month end by calling (888) 899-8343.
The Fund is distributed by Ultimus Fund Distributors, LLC, member FINRA/SIPC.
DEAN SMALL CAP VALUE FUND
Performance Summary (Unaudited) – (continued)
Comparison of the Change in Value of a $10,000 Investment in the Dean Small Cap Value
Fund, the Russell 2000 Index and the Russell 2000 Value Index (Unaudited)
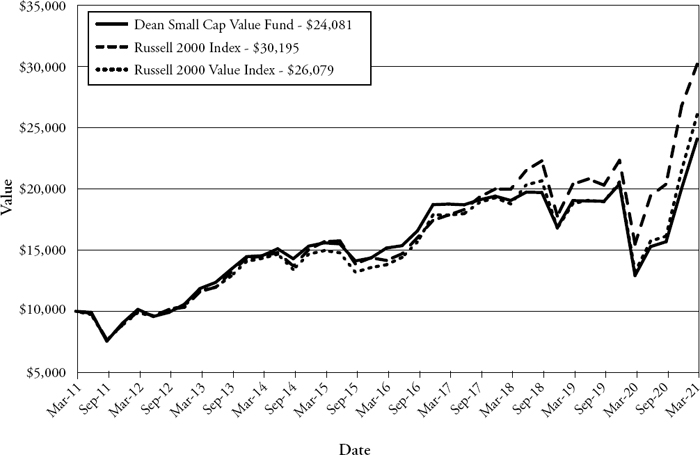
This graph shows the value of a hypothetical initial investment of $10,000 in the Fund, the Russell 2000 Index and the Russell 2000 Value Index on March 31, 2011 and held through March 31, 2021.
The Russell 2000 Index and the Russell 2000 Value Index widely recognized unmanaged indices of common stock prices and are representative of a broader market and range of securities than is found in the Fund’s portfolio. Individuals cannot invest directly in an index; however, an individual may invest in exchange traded funds or other investment vehicles that attempt to track the performance of a benchmark index. THE FUND’S RETURN REPRESENTS PAST PERFORMANCE AND DOES NOT GUARANTEE OR PREDICT FUTURE RESULTS. The returns shown do not reflect deduction of taxes that a shareholder would pay on Fund distributions or the redemption of Fund shares. Investment returns and principal values will fluctuate so that an investor’s shares, when redeemed, may be worth more or less than their original cost.
Current performance may be lower or higher than the performance data quoted. For more information on the Fund, and to obtain performance data current to the most recent month-end, or to request a prospectus, please call (888) 899-8343. You should carefully consider the investment objectives, risks, charges and expenses of the Fund before investing. The Fund’s prospectus contains this and other information about the Fund and should be read carefully before investing.
The Fund is distributed by Ultimus Fund Distributors, LLC, member FINRA/SIPC.
DEAN MID CAP VALUE FUND
MANAGEMENT’S DISCUSSION OF FUND PERFORMANCE
(Unaudited)
Management’s Discussion & Analysis
The Dean Mid Cap Value Fund returned 59.75% net of fees for the twelve months ending March 31st, 2021, compared with a 73.76% return for the benchmark Russell Midcap Value Index and a 73.64% return for the broader Russell Midcap Index.
Macro Factors Impacting Performance
Macro style factors were a significant headwind for the Fund over the past year. The high levels of monetary and fiscal stimulus injected into the system to combat the economic fallout from COVID-19 led to low-quality stocks rallying from March 2020 lows. Stocks with the highest trading turnover, volatility, financial leverage, and wide range of earnings variability significantly outperformed other stock characteristics. The Fund’s high-quality bias led the Fund to be underweight these factors while being overweight stocks with high profitability, which was the worst performing style factor for the year. However, the Fund’s consistent overweight of stocks with lower valuations than the benchmark was an offset as value stocks outperformed with a large portion of the outperformance generated in the final quarter of the fiscal year.
Sector Performance (best/worst relative to benchmark)
The best performing sector relative to the benchmark for the fiscal year was Information Technology. The sector outperformance was driven both by allocation and above average stock selection. On average for the year, the Fund’s weight in Information Technology was generally in line with the benchmark. However, early in the fiscal year, the Fund was overweight Information Technology during a period of outperformance. As the sector continued to outperform, the Fund reduced its position through the year to being underweight the sector nearly 100bps in the fiscal fourth quarter when the sector underperformed on concerns of valuation and rising interest rates. Stock selection was primarily driven by semiconductor equipment company KLA Corp (KLAC), which is discussed in more detail below. Technology distributor Arrow Electronics (ARW), storage device manufacturer Western Digital (WDC) and electrical device manufacturer Littlefuse (LFUS) also contributed to positive stock selection. The Fund’s underweight within the sub industry group Software & Services was also beneficial as the industry group underperformed the sector and benchmark for the year.
DEAN MID CAP VALUE FUND
MANAGEMENT’S DISCUSSION OF FUND PERFORMANCE
(Unaudited) – (continued)
Real Estate was the second best performing sector. The outperformance was driven entirely by sector allocation. The Real Estate sector underperformed the benchmark by nearly 30% on concerns of rising unpaid rents and vacancies as the economy was curtailed by the Coronavirus pandemic. The sector was the Fund’s largest underweight at nearly 4.5% below the benchmark, leading to significant relative outperformance. However, this was partially offset by underperforming stock selection. The past year has shown many are able to work from home efficiently, thus putting future office demand in question and negatively impacting holding Highwood Properties (HIW). Similar concerns impacted medical office building owner Healthcare Realty Trust (HTA). West Coast apartment manager, Essex Property Trust (ESS) was negatively impacted by rent deferrals and moratoriums as well as vacancies on a flight to the suburbs.
The worst performing sector relative to the benchmark for the fiscal year was Industrials. With the Industrial sector outperforming the overall benchmark, the Fund’s nearly 4.0% overweight to the sector was beneficial. The Industrial sector benefitted from expected increased demand as inventories were depleted and supply chains interrupted. In addition to the reopening trade, the appetite for risk increased fueled by monetary stimulus and discussions of increased infrastructure spending. However, the Fund’s holdings lagged the sector returns due to lack of leverage to the early cycle reopening trade. Government consultant Science Applications (SAIC), heavy duty truck transmission manufacturer Allison Transmissions (ALSN), waste company Republic Services (RSG) and defense contractor Curtiss-Wright (CW) all materially underperformed the sector’s performance.
Consumer Discretionary was the second worst performing sector. The underperformance was the result of being modestly underweight the second best performing sector for the year. In addition, the high-quality stocks held in the portfolio underperformed the higher risk, lower quality stocks in the sector overall. Within Consumer Discretionary, the Fund was most underweight the Consumer Services industry group, which includes many companies directly impacted by the COVID-19 closures such as hotels, restaurants, cruise lines, casinos, and leisure facilities. Companies in these industries typically have high debt leverage as well as high operating leverage. As the “risk-on” trade accelerated, investors sought companies with the most leverage to an opening economy regardless of the weak balance sheets and wide range of outcomes, contrary to the Funds high-quality investment framework. While the Fund was overweight the Retail and Consumer Durables industries, the Fund was hurt by a strong “risk-on” rally in stocks with similar characteristics as those in Consumer Services, as deeply
DEAN MID CAP VALUE FUND
MANAGEMENT’S DISCUSSION OF FUND PERFORMANCE
(Unaudited) – (continued)
depressed retailers and apparel manufactures outperformed. The Fund was also void homebuilder related stocks, which benefitted from increased demand on historically low interest rates.
Individual Securities Performance (best/worst absolute contributors)
The largest contributing stock for the fiscal year was Aptiv (APTV), rising 199.4% for the period held. Aptiv’s primary business is designing and assembling a car’s electronics, including wiring assemblies, cabling, and safety control. The company has been growing its advanced electrical systems and software business, which are used in autonomous driving features and vehicle connectivity. With the growing content per car for electrical control systems as well as the increase in electric vehicle programs, Aptiv has generated above market growth and customer award activity, which accelerated in the second half of the fiscal year. After trimming the weight twice in the year on the stock’s outperformance, the Fund exited the position in late February due to high valuation on the extreme euphoria over electrical vehicles. The proceeds were invested in BorgWarner (BWA), a leader in powertrain technology to improve fuel economy, on the belief that their investments in electric vehicle technology have been underappreciated.
KLA Corp (KLAC) was the second best contributing stock, up 132.2% for the period held. KLA Corp is the leading supplier of process control equipment to the Semiconductor industry, serving all major semiconductor manufacturers, and is the fifth-largest supplier of wafer fab equipment. KLAC tends to benefit the most in the early stages of new technology production as suppliers work to reduce costs and improve efficiency. As the complexity of chips increase, the need to analyze and test critical aspects of chip design and the manufacturing process are required. New technologies within 7nm/5nm Foundry/Logic and high layer count 3D NAND are driving capital spending within the company’s customer base. While the Semiconductor industry has seen disruptions due to supply chain issues, product demand continues to be strong. Customers have maintained fabrication plans, supporting KLA’s record backlog despite macro concerns. The strong product cycle along with investor’s appetite for Technology stocks, continued to drive the shares higher. The Fund trimmed the position twice during the year on significant outperformance and exited the stock in February on stretched valuation to normalized earnings.
Mohawk Industries (MHK) was the largest detracting stock this quarter, down -18.7% for the period held. Mohawk is a leading global manufacturer of carpet, rugs, ceramic tile, laminate, wood, stone, luxury vinyl tile (LVT) and vinyl flooring. Mohawk
DEAN MID CAP VALUE FUND
MANAGEMENT’S DISCUSSION OF FUND PERFORMANCE
(Unaudited) – (continued)
has been plagued by a shift in consumer tastes away from carpet and ceramic tile to newer technologies such as LVT and laminates. The newer technologies allow for sophisticated looks but are less expensive than natural materials with less labor-intensive installation processes. After years of decline, the Fund took an untimely position in Mohawk early in the year prior to COVID-19 on the belief that the worst was behind Mohawk and changes made would lead to improving financial performance. In late March 2020, Mohawk lowered first quarter guidance significantly as well as curtailed production, sending the shares down tumbling. The Fund exited the shares of Mohawk in early April 2020 based on the decline in fundamentals at a company in the midst of right-sizing the business and a belief that housing would be negatively impacted as unemployment soared. However, our thesis proved incorrect as lower interest rates, a rebounding stock market and changed behavior, with people valuing their home space, helped support the building industry and a rebound in the shares of Mohawk post exit.
The second largest detracting stock was M&T Bank (MTB), down -11.5% for the period held. M&T is a regional bank based in New York with its primary growth in the mid-Atlantic region of the east coast. In addition to traditional retail and commercial banking activity, the company also manages a line of mutual funds through Wilmington Funds Management. Early in the year, Bank industry earnings were being squeezed due to fallout from COVID-19 with increases in loan loss reserves, slowing loan growth and a squeeze in net interest margins. In the first calendar quarter report, M&T missed earnings expectations meaningfully, primarily due to higher-than-expected loan loss reserves and operating expenses. Earnings would have been even worse but were partially offset by strong mortgage banking, an earnings stream not considered sustainable. The Fund exited the position in M&T Bank in May and reinvested the proceeds in Regions Financial (RF), a bank with operations in the South and Midwest, on the belief it would see higher earnings leverage as the yield curve steepened and excess reserves were released. Since the Fund purchased Regions Financial, the stock has outperformed M&T by just over 50.0%.
Current Positioning and Opportunities
The portfolio’s largest overweight sectors relative to the benchmark are the Consumer Staples and Financials sectors. The largest underweight sectors relative to the benchmark are the Real Estate and Communication Services sectors. In the last quarter of the Fund’s fiscal year, the most weight was added in the Consumer Staples, Consumer Discretionary and Utilities sectors while Industrials, Information Technology and Financials decreased the most in weight.
DEAN MID CAP VALUE FUND
MANAGEMENT’S DISCUSSION OF FUND PERFORMANCE
(Unaudited) – (continued)
As valuations have become more stretched and with uncertainty in the future implied growth rates, the Fund has trimmed positions in some of our stocks with higher cyclicality and range of outcomes and rotated to those with higher profitability and an expected narrower range of outcomes. After lagging for much of the past year, stocks with high-quality characteristics, primarily high profitability, look very attractive, while those with low-quality characteristics, primarily high volatility, look stretched.
We remain focused on the fundamentals of the companies we own, and the price we are paying for those fundamentals. We are confident that a steadfast application of our proven and disciplined process should produce favorable results over time.
The COVID-19 pandemic, and the global response to it, is an unprecedented event that has created enormous economic disruption and uncertainty. At this time, it appears the U.S. is on a good vaccine trajectory and coupled with the monetary and fiscal stimulus so far seems to have weathered the worst of the storm. However, it is difficult to know if the COVID-19 virus mutates or reemerges in a different form and the extent of the economic damage that might cause. We are monitoring the situation closely, as we do all economic shocks, whether that be in the form of a pandemic, or a normal economic cycle. We would expect further volatility ahead as the world works its way through this pandemic, vaccine rollout, and possible variants of the virus. However, we have dealt with elevated bouts of market volatility on many occasions since Dean Capital Management began sub-advising the funds in 2008. The pandemic might have been an unprecedented catalyst, but the volatility it caused was within the range of what we would consider historically normal for small cap and mid cap stocks. We stay focused on the normalized earnings power, the valuations, and the quality of the companies the portfolio holds, and this has served us well in the long run through times of elevated market volatility.
DEAN MID CAP VALUE FUND
Performance Summary (Unaudited)
| Average Annual Total Returns* |
| (for the periods ended March 31, 2021) |
| |
| | | 1 Year | | 5 Year | | 10 year | |
| Dean Mid Cap Value Fund | | 59.75% | | 10.24% | | 9.82% | |
| Russell Midcap Value Index** | | 73.76% | | 11.60% | | 11.05% | |
| Russell Midcap Index** | | 73.64% | | 14.67% | | 12.47% | |
| Total annual operating expenses, which included acquired fund fees and expenses of less than 0.005%, as disclosed in the Dean Mid Cap Value Fund (the “Fund”) prospectus dated July 29, 2020, were 1.20% of the Fund’s average daily net assets (0.85% after fee waivers/ expense reimbursements by Dean Investment Associates, LLC (the “Adviser”)). The Adviser has contractually agreed to waive its management fee and/or reimburse expenses so that total annual Fund operating expenses (excluding portfolio transaction and other investment-related costs (including brokerage fees and commissions); taxes; borrowing costs (such as interest and dividend expenses on securities sold short); acquired fund fees and expenses; fees and expenses associated with investments in other collective investment vehicles or derivative instruments (including for example option and swap fees and expenses); any amounts payable pursuant to a distribution or service plan adopted in accordance with Rule 12b-1 under the Investment Company Act of 1940; expenses incurred in connection with any merger or reorganization; extraordinary expenses (such as litigation expenses, indemnification of Trust officers and Trustees and contractual indemnification of Fund service providers) do not exceed 0.85% of the Fund’s average daily net assets through July 31, 2021. Each waiver/expense payment by the Adviser is subject to recoupment by the Adviser from the Fund in the three years following the date the particular waiver/expense payment occurred, but only if such recoupment can be achieved without exceeding the annual expense limitation in effect at the time of the waiver/ expense payment and any expense limitation in effect at the time of recoupment. This expense limitation agreement may not be terminated prior to July 31, 2021, except by the Board of Trustees. Additional information pertaining to the expense ratios as of March 31, 2021 can be found in the financial highlights. |
The performance quoted represents past performance, which does not guarantee future results. The investment return and principal value of an investment will fluctuate so that an investor’s shares, when redeemed, may be worth more or less than their original cost. The returns shown do not reflect deduction of taxes that a shareholder would pay on Fund distributions or the redemption of Fund shares. Current performance may be lower or higher than the performance quoted. The Fund’s investment objectives, risks, charges and expenses must be considered carefully before investing. Performance data current to the most recent month end may be obtained by calling (888) 899-8343.
| * | Return figures reflect any change in price per share and assume the reinvestment of all distributions. The Fund’s returns reflect any fee reductions during the applicable periods. If such fee reductions had not occurred, the quoted performance would have been lower. |
| ** | The Russell Midcap and Russell Midcap Value Indices are unmanaged benchmarks that assume reinvestment of all distributions and exclude the effect of taxes and fees. The indices are widely |
DEAN MID CAP VALUE FUND
Performance Summary (Unaudited) – (continued)
| | recognized unmanaged indices of equity prices and are representative of a broader market and range of securities than are found in the Fund’s portfolio. An individual cannot invest directly in an index. However, an individual may be able to invest in exchange traded funds or other investment vehicles that attempt to track the performance of an index. |
You should consider the Fund’s investment objectives, risks, charges and expenses carefully before you invest. The Fund’s prospectus contains important information about the Fund’s investment objectives, potential risks, management fees, charges and expenses, and other information and should be read carefully before investing. You may obtain a current copy of the Fund’s prospectus or performance data current to the most recent month end by calling (888) 899-8343.
The Fund is distributed by Ultimus Fund Distributors, LLC, member FINRA/SIPC.
DEAN MID CAP VALUE FUND
Performance Summary (Unaudited) – (continued)
Comparison of the Change in the Value of a $10,000 Investment in the Dean Mid Cap
Value Fund, the Russell Midcap Index, and the Russell Midcap Value Index (Unaudited)
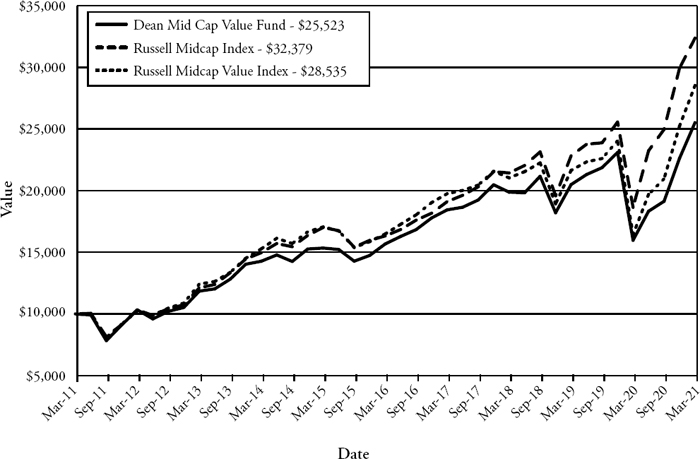
This graph shows the value of a hypothetical initial investment of $10,000 in the Fund, the Russell Midcap Index and the Russell Midcap Value Index on March 31, 2011 and held through March 31, 2021.
The Russell Midcap Index and the Russell Midcap Value Index are widely recognized unmanaged indices of common stock prices and are representative of a broader market and range of securities than is found in the Fund’s portfolio. Individuals cannot invest directly in an index; however, an individual may invest in exchange traded funds or other investment vehicles that attempt to track the performance of a benchmark index. THE FUND’S RETURN REPRESENTS PAST PERFORMANCE AND DOES NOT GUARANTEE OR PREDICT FUTURE RESULTS. The returns shown do not reflect deduction of taxes that a shareholder would pay on Fund distributions or the redemption of Fund shares. Investment returns and principal values will fluctuate so that an investor’s shares, when redeemed, may be worth more or less than their original cost.
Current performance may be lower or higher than the performance data quoted. For more information on the Fund, and to obtain performance data current to the most recent month-end, or to request a prospectus, please call (888) 899-8343. You should carefully consider the investment objectives, risks, charges and expenses of the Fund before investing. The Fund’s prospectus contains this and other information about the Fund and should be read carefully before investing.
The Fund is distributed by Ultimus Fund Distributors, LLC, member FINRA/SIPC.
DEAN SMALL CAP VALUE FUND HOLDINGS (Unaudited)
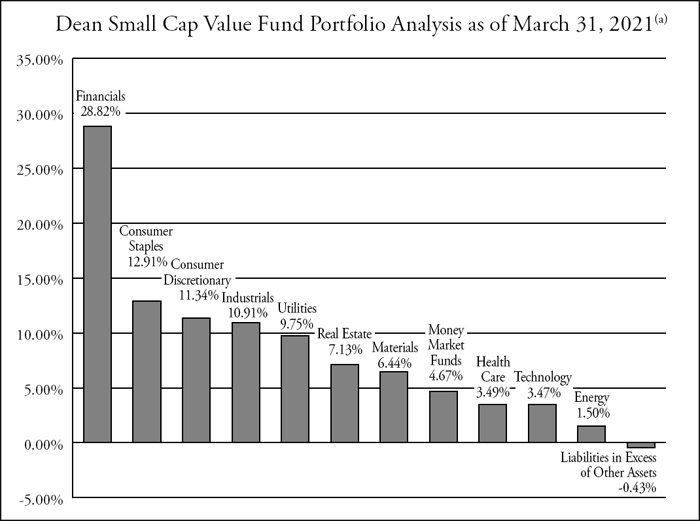
| (a) | As a percent of total net assets. |
The investment objective of the Dean Small Cap Value Fund is long-term capital appreciation and, secondarily, dividend income. Portfolio holdings are subject to change.
DEAN MID CAP VALUE FUND HOLDINGS (Unaudited)
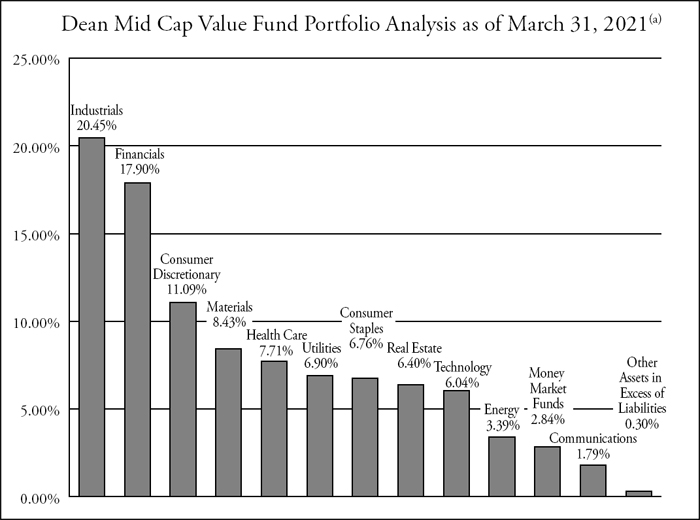
| (a) | As a percent of total net assets. |
The investment objective of the Dean Mid Cap Value Fund is long-term capital appreciation and, secondarily, dividend income. Portfolio holdings are subject to change.
Portfolio Holdings (Unaudited)
The Funds file their complete schedule of portfolio holdings with the Securities and Exchange Commission (the “SEC”) for the first and third quarters of each fiscal year as an exhibit to their reports on Form N-PORT. The Funds’ Form N-PORT reports are available on the SEC’s website at http://www.sec.gov.
| DEAN SMALL CAP VALUE FUND |
| SCHEDULE OF INVESTMENTS |
| March 31, 2021 |
| COMMON STOCKS — 95.76% | | Shares | | | Fair Value | |
| | | | | | | |
| Consumer Discretionary — 11.34% | | | | | | | | |
| Cooper Tire & Rubber Co. | | | 48,044 | | | $ | 2,689,503 | |
| Hamilton Beach Brands Holding Co., Class A | | | 79,800 | | | | 1,446,774 | |
| Hooker Furniture Corp. | | | 34,463 | | | | 1,256,521 | |
| Johnson Outdoors, Inc., Class A | | | 16,451 | | | | 2,348,380 | |
| KAR Auction Services, Inc.(a) | | | 84,239 | | | | 1,263,585 | |
| Malibu Boats, Inc., Class A(a) | | | 12,592 | | | | 1,003,331 | |
| Methode Electronics, Inc. | | | 45,848 | | | | 1,924,699 | |
| Sally Beauty Holdings, Inc.(a) | | | 36,317 | | | | 731,061 | |
| Standard Motor Products, Inc. | | | 70,994 | | | | 2,951,930 | |
| TRI Pointe Group, Inc.(a) | | | 174,249 | | | | 3,547,710 | |
| | | | | | | | 19,163,494 | |
| Consumer Staples — 12.91% | | | | | | | | |
| Alico, Inc. | | | 29,974 | | | | 895,024 | |
| Cal-Maine Foods, Inc.(a) | | | 67,848 | | | | 2,606,720 | |
| Edgewell Personal Care Co. | | | 53,662 | | | | 2,125,015 | |
| Fresh Del Monte Produce, Inc. | | | 69,213 | | | | 1,981,568 | |
| Hostess Brands, Inc.(a) | | | 140,699 | | | | 2,017,624 | |
| John B. Sanfilippo & Son, Inc. | | | 24,843 | | | | 2,245,062 | |
| Mission Produce, Inc.(a) | | | 95,092 | | | | 1,807,699 | |
| Sanderson Farms, Inc. | | | 9,360 | | | | 1,458,101 | |
| Sprouts Farmers Market, Inc.(a) | | | 49,882 | | | | 1,327,859 | |
| TreeHouse Foods, Inc.(a) | | | 50,960 | | | | 2,662,149 | |
| Weis Markets, Inc. | | | 47,634 | | | | 2,692,274 | |
| | | | | | | | 21,819,095 | |
| Energy — 1.50% | | | | | | | | |
| Bonanza Creek Energy, Inc.(a) | | | 70,793 | | | | 2,529,434 | |
| | | | | | | | | |
| Financials — 28.82% | | | | | | | | |
| American Equity Investment Life Holding Co. | | | 40,559 | | | | 1,278,825 | |
| American National Group, Inc. | | | 37,149 | | | | 4,007,262 | |
| Associated Banc-Corp. | | | 167,611 | | | | 3,576,819 | |
| Bryn Mawr Bank Corp. | | | 77,983 | | | | 3,549,006 | |
| Cathay General Bancorp | | | 75,654 | | | | 3,085,170 | |
| Diamond Hill Investment Group, Inc. | | | 21,391 | | | | 3,337,210 | |
| Employers Holdings, Inc. | | | 62,213 | | | | 2,678,892 | |
| F.N.B. Corp. | | | 129,841 | | | | 1,648,981 | |
| First Financial Bancorp | | | 70,588 | | | | 1,694,112 | |
| Nelnet, Inc., Class A | | | 16,462 | | | | 1,197,446 | |
See accompanying notes which are an integral part of these financial statements.
| DEAN SMALL CAP VALUE FUND |
| SCHEDULE OF INVESTMENTS – (continued) |
| March 31, 2021 |
| COMMON STOCKS — 95.76% - continued | | Shares | | | Fair Value | |
| | | | | | | |
| Financials — 28.82% - continued | | | | | | | | |
| Northwest Bancshares, Inc. | | | 76,586 | | | $ | 1,106,668 | |
| Safety Insurance Group, Inc. | | | 29,575 | | | | 2,491,694 | |
| Stewart Information Services Corp. | | | 55,393 | | | | 2,882,098 | |
| StoneX Group, Inc.(a) | | | 57,966 | | | | 3,789,817 | |
| UMB Financial Corp. | | | 33,045 | | | | 3,051,045 | |
| Washington Federal, Inc. | | | 99,302 | | | | 3,058,502 | |
| Washington Trust Bancorp, Inc. | | | 77,112 | | | | 3,981,293 | |
| Waterstone Financial, Inc. | | | 113,622 | | | | 2,320,161 | |
| | | | | | | | 48,735,001 | |
| Health Care — 3.49% | | | | | | | | |
| Magellan Health, Inc.(a) | | | 8,630 | | | | 804,661 | |
| National Healthcare Corp. | | | 33,373 | | | | 2,600,090 | |
| Prestige Consumer Healthcare, Inc.(a) | | | 56,545 | | | | 2,492,504 | |
| | | | | | | | 5,897,255 | |
| Industrials — 10.91% | | | | | | | | |
| Argan, Inc. | | | 73,224 | | | | 3,906,500 | |
| AZZ, Inc. | | | 44,246 | | | | 2,227,786 | |
| DHT Holdings, Inc. | | | 325,338 | | | | 1,929,254 | |
| Diamond S Shipping, Inc.(a) | | | 74,085 | | | | 743,073 | |
| Hackett Group, Inc. (The) | | | 40,756 | | | | 667,991 | |
| Heartland Express, Inc. | | | 153,530 | | | | 3,006,117 | |
| Powell Industries, Inc. | | | 80,296 | | | | 2,719,626 | |
| Textainer Group Holdings Ltd.(a) | | | 58,155 | | | | 1,666,141 | |
| Werner Enterprises, Inc. | | | 33,408 | | | | 1,575,855 | |
| | | | | | | | 18,442,343 | |
| Materials — 6.44% | | | | | | | | |
| Alamos Gold, Inc., Class A | | | 174,228 | | | | 1,360,721 | |
| Apogee Enterprises, Inc. | | | 39,848 | | | | 1,628,986 | |
| Commercial Metals Co. | | | 89,468 | | | | 2,759,193 | |
| Encore Wire Corp. | | | 31,881 | | | | 2,140,172 | |
| Pactiv Evergreen, Inc. | | | 155,359 | | | | 2,134,633 | |
| Valvoline, Inc. | | | 33,062 | | | | 861,926 | |
| | | | | | | | 10,885,631 | |
See accompanying notes which are an integral part of these financial statements.
| DEAN SMALL CAP VALUE FUND |
| SCHEDULE OF INVESTMENTS – (continued) |
| March 31, 2021 |
| COMMON STOCKS — 95.76% - continued | | Shares | | | Fair Value | |
| | | | | | | |
| Real Estate — 7.13% | | | | | | | | |
| CTO Realty Growth Inc. | | | 49,601 | | | $ | 2,579,748 | |
| Equity Commonwealth | | | 123,292 | | | | 3,427,518 | |
| Getty Realty Corp. | | | 102,623 | | | | 2,906,283 | |
| Piedmont Office Realty Trust, Inc., Class A | | | 180,573 | | | | 3,136,553 | |
| | | | | | | | 12,050,102 | |
| Technology — 3.47% | | | | | | | | |
| CSG Systems International, Inc. | | | 47,883 | | | | 2,149,468 | |
| Insight Enterprises, Inc.(a) | | | 17,301 | | | | 1,650,861 | |
| Plexus Corp.(a) | | | 16,308 | | | | 1,497,727 | |
| Vishay Intertechnology, Inc. | | | 23,439 | | | | 564,411 | |
| | | | | | | | 5,862,467 | |
| Utilities — 9.75% | | | | | | | | |
| Avista Corp. | | | 68,362 | | | | 3,264,286 | |
| Northwest Natural Holding Co. | | | 22,463 | | | | 1,211,879 | |
| NorthWestern Corp. | | | 53,798 | | | | 3,507,629 | |
| Portland General Electric Co. | | | 42,043 | | | | 1,995,781 | |
| Southwest Gas Corp. | | | 57,246 | | | | 3,933,373 | |
| Spire, Inc. | | | 34,769 | | | | 2,569,081 | |
| | | | | | | | 16,482,029 | |
| Total Common Stocks (Cost $131,201,902) | | | | | | | 161,866,851 | |
| | | | | | | | | |
| MONEY MARKET FUNDS — 4.67% | | | | | | | | |
| Fidelity Investments Money Market Government Portfolio, Institutional Class, 0.01%(b) | | | 7,900,982 | | | | 7,900,982 | |
| Total Money Market Funds (Cost $7,900,982) | | | | | | | 7,900,982 | |
| Total Investments — 100.43% (Cost $139,102,884) | | | | | | | 169,767,833 | |
| Liabilities in Excess of Other Assets — (0.43)% | | | | | | | (719,947 | ) |
| NET ASSETS — 100.00% | | | | | | $ | 169,047,886 | |
| (a) | Non-income producing security. |
| (b) | Rate disclosed is the seven day effective yield as of March 31, 2021. |
See accompanying notes which are an integral part of these financial statements.
| DEAN MID CAP VALUE FUND |
| SCHEDULE OF INVESTMENTS |
| March 31, 2021 |
| COMMON STOCKS — 96.86% | | Shares | | | Fair Value | |
| | | | | | | |
| Communications — 1.79% | | | | | | |
| Omnicom Group, Inc. | | | 19,248 | | | $ | 1,427,239 | |
| | | | | | | | | |
| Consumer Discretionary — 11.09% | | | | | | | | |
| BorgWarner, Inc. | | | 25,043 | | | | 1,160,993 | |
| Genuine Parts Co. | | | 11,294 | | | | 1,305,473 | |
| Masco Corp. | | | 19,739 | | | | 1,182,366 | |
| Polaris Industries, Inc. | | | 10,803 | | | | 1,442,201 | |
| PulteGroup, Inc. | | | 22,931 | | | | 1,202,502 | |
| Skechers U.S.A., Inc., Class A(a) | | | 28,627 | | | | 1,194,032 | |
| Ulta Beauty, Inc.(a) | | | 4,321 | | | | 1,335,924 | |
| | | | | | | | 8,823,491 | |
| Consumer Staples — 6.76% | | | | | | | | |
| BJ’s Wholesale Club Holdings, Inc.(a) | | | 31,181 | | | | 1,398,780 | |
| Casey’s General Stores, Inc. | | | 6,138 | | | | 1,326,974 | |
| Conagra Brands, Inc. | | | 35,894 | | | | 1,349,614 | |
| Tyson Foods, Inc., Class A | | | 17,579 | | | | 1,306,120 | |
| | | | | | | | 5,381,488 | |
| Energy — 3.39% | | | | | | | | |
| Baker Hughes Co. | | | 44,537 | | | | 962,445 | |
| Pioneer Natural Resources Co. | | | 10,901 | | | | 1,731,296 | |
| | | | | | | | 2,693,741 | |
| Financials — 17.90% | | | | | | | | |
| Ameriprise Financial, Inc. | | | 6,482 | | | | 1,506,741 | |
| Assurant, Inc. | | | 9,477 | | | | 1,343,554 | |
| Fifth Third Bancorp | | | 39,626 | | | | 1,483,994 | |
| Globe Life, Inc. | | | 14,829 | | | | 1,432,927 | |
| Raymond James Financial, Inc. | | | 12,521 | | | | 1,534,574 | |
| Regions Financial Corp. | | | 76,601 | | | | 1,582,576 | |
| Reinsurance Group of America, Inc. | | | 9,575 | | | | 1,206,929 | |
| Synchrony Financial | | | 32,064 | | | | 1,303,722 | |
| UMB Financial Corp. | | | 16,744 | | | | 1,545,974 | |
| W.R. Berkley Corp. | | | 17,284 | | | | 1,302,349 | |
| | | | | | | | 14,243,340 | |
| Health Care — 7.71% | | | | | | | | |
| Encompass Health Corp. | | | 14,485 | | | | 1,186,322 | |
| Hill-Rom Holdings, Inc. | | | 10,852 | | | | 1,198,929 | |
| Quest Diagnostics, Inc. | | | 9,182 | | | | 1,178,418 | |
See accompanying notes which are an integral part of these financial statements.
| DEAN MID CAP VALUE FUND |
| SCHEDULE OF INVESTMENTS – (continued) |
| March 31, 2021 |
| COMMON STOCKS — 96.86% - continued | | Shares | | | Fair Value | |
| | | | | | | |
| Health Care — 7.71% - continued | | | | | | | | |
| Syneos Health, Inc.(a) | | | 17,824 | | | $ | 1,351,950 | |
| Zimmer Biomet Holdings, Inc. | | | 7,611 | | | | 1,218,369 | |
| | | | | | | | 6,133,988 | |
| Industrials — 20.45% | | | | | | | | |
| Allison Transmission Holdings, Inc. | | | 28,283 | | | | 1,154,795 | |
| Curtiss-Wright Corp. | | | 9,231 | | | | 1,094,797 | |
| Delta Air Lines, Inc.(a) | | | 22,244 | | | | 1,073,940 | |
| Dover Corp. | | | 8,593 | | | | 1,178,358 | |
| frontdoor, Inc.(a) | | | 20,476 | | | | 1,100,585 | |
| Hubbell, Inc. | | | 7,807 | | | | 1,459,051 | |
| ITT, Inc. | | | 17,726 | | | | 1,611,471 | |
| Kansas City Southern | | | 5,450 | | | | 1,438,364 | |
| Littelfuse, Inc. | | | 5,107 | | | | 1,350,495 | |
| MSC Industrial Direct Co., Inc., Class A | | | 13,012 | | | | 1,173,552 | |
| nVent Electric PLC | | | 45,470 | | | | 1,269,068 | |
| Pentair PLC | | | 19,101 | | | | 1,190,374 | |
| Republic Services, Inc. | | | 11,883 | | | | 1,180,576 | |
| | | | | | | | 16,275,426 | |
| Materials — 8.43% | | | | | | | | |
| Avery Dennison Corp. | | | 7,758 | | | | 1,424,757 | |
| Avient Corp. | | | 30,100 | | | | 1,422,827 | |
| Eagle Materials, Inc. | | | 9,428 | | | | 1,267,217 | |
| FMC Corp. | | | 11,637 | | | | 1,287,169 | |
| Steel Dynamics, Inc. | | | 25,779 | | | | 1,308,542 | |
| | | | | | | | 6,710,512 | |
| Real Estate — 6.40% | | | | | | | | |
| CBRE Group, Inc., Class A(a) | | | 17,186 | | | | 1,359,584 | |
| Essex Property Trust, Inc. | | | 5,009 | | | | 1,361,646 | |
| Healthcare Trust of America, Inc., Class A | | | 40,952 | | | | 1,129,456 | |
| STAG Industrial, Inc. | | | 37,024 | | | | 1,244,377 | |
| | | | | | | | 5,095,063 | |
See accompanying notes which are an integral part of these financial statements.
| DEAN MID CAP VALUE FUND |
| SCHEDULE OF INVESTMENTS – (continued) |
| March 31, 2021 |
| COMMON STOCKS — 96.86% - continued | | Shares | | | Fair Value | |
| | | | | | | |
| Technology — 6.04% | | | | | | |
| Arrow Electronics, Inc.(a) | | | 11,441 | | | $ | 1,267,891 | |
| Broadridge Financial Solutions, Inc. | | | 7,218 | | | | 1,105,076 | |
| MKS Instruments, Inc. | | | 6,727 | | | | 1,247,320 | |
| Western Digital Corp. | | | 17,726 | | | | 1,183,211 | |
| | | | | | | | 4,803,498 | |
| Utilities — 6.90% | | | | | | | | |
| Ameren Corp. | | | 17,186 | | | | 1,398,253 | |
| Atmos Energy Corp. | | | 12,963 | | | | 1,281,393 | |
| CMS Energy Corp. | | | 22,047 | | | | 1,349,717 | |
| Entergy Corp. | | | 14,682 | | | | 1,460,418 | |
| | | | | | | | 5,489,781 | |
| Total Common Stocks (Cost $59,126,751) | | | | | | | 77,077,567 | |
| | | | | | | | | |
| MONEY MARKET FUNDS — 2.84% | | | | | | | | |
| Fidelity Investments Money Market Government Portfolio, Institutional Class, 0.01%(b) | | | 2,258,196 | | | | 2,258,196 | |
| Total Money Market Funds (Cost $2,258,196) | | | | | | | 2,258,196 | |
| Total Investments — 99.70% (Cost $61,384,947) | | | | | | | 79,335,763 | |
| Other Assets in Excess of Liabilities — 0.30% | | | | | | | 240,137 | |
| NET ASSETS — 100.00% | | | | | | $ | 79,575,900 | |
| (a) | Non-income producing security. |
| (b) | Rate disclosed is the seven day effective yield as of March 31, 2021. |
See accompanying notes which are an integral part of these financial statements.
| DEAN FUNDS |
| STATEMENTS OF ASSETS AND LIABILITIES |
| March 31, 2021 |
| | | Dean Small Cap | | | Dean Mid Cap | |
| | | Value Fund | | | Value Fund | |
| Assets | | | | | | |
| Investments in securities at value (cost $139,102,884 and $61,384,947) | | $ | 169,767,833 | | | $ | 79,335,763 | |
| Receivable for fund shares sold | | | 103,259 | | | | 31,128 | |
| Receivable for investments sold | | | 427,197 | | | | 136,696 | |
| Dividends receivable | | | 184,361 | | | | 143,928 | |
| Prepaid expenses | | | 12,251 | | | | 14,991 | |
| Total Assets | | | 170,494,901 | | | | 79,662,506 | |
| | | | | | | | | |
| Liabilities | | | | | | | | |
| Payable for investments purchased | | | 1,175,119 | | | | — | |
| Payable for fund shares redeemed | | | 77,153 | | | | 16,252 | |
| Payable to Adviser | | | 129,378 | | | | 31,757 | |
| Payable to Administrator | | | 18,605 | | | | 9,898 | |
| Other accrued expenses | | | 46,760 | | | | 28,699 | |
| Total Liabilities | | | 1,447,015 | | | | 86,606 | |
| | | | | | | | | |
| Net Assets | | $ | 169,047,886 | | | $ | 79,575,900 | |
| Net Assets consist of: | | | | | | | | |
| Paid-in capital | | | 183,319,890 | | | | 61,184,382 | |
| Accumulated earnings (deficit) | | | (14,272,004 | ) | | | 18,391,518 | |
| Net Assets | | $ | 169,047,886 | | | $ | 79,575,900 | |
| Shares outstanding (unlimited number of shares authorized, no par value) | | | 9,966,713 | | | | 3,523,915 | |
| Net asset value, offering and redemption price per share | | $ | 16.96 | | | $ | 22.58 | |
See accompanying notes which are an integral part of these financial statements.
| DEAN FUNDS |
| STATEMENTS OF OPERATIONS |
| For the year ended March 31, 2021 |
| | | Dean Small Cap | | | Dean Mid Cap | |
| | | Value Fund | | | Value Fund | |
| Investment Income | | | | | | | | |
| Dividend income (net of foreign taxes withheld of $— and $2,783) | | $ | 3,553,763 | | | $ | 1,121,397 | |
| Total investment income | | | 3,553,763 | | | | 1,121,397 | |
| | | | | | | | | |
| Expenses | | | | | | | | |
| Adviser | | | 1,359,433 | | | | 408,898 | |
| Administration | | | 126,734 | | | | 49,277 | |
| Custodian | | | 73,019 | | | | 17,576 | |
| Transfer agent | | | 53,985 | | | | 11,290 | |
| Registration | | | 32,447 | | | | 23,911 | |
| Fund accounting | | | 31,400 | | | | 15,476 | |
| Legal | | | 19,804 | | | | 19,804 | |
| Audit and tax preparation | | | 17,600 | | | | 17,600 | |
| Trustee | | | 13,333 | | | | 13,333 | |
| Compliance services | | | 12,000 | | | | 12,000 | |
| Report printing | | | 5,298 | | | | 7,039 | |
| Insurance | | | 4,145 | | | | 2,639 | |
| Pricing | | | 1,298 | | | | 881 | |
| Interest | | | 400 | | | | — | |
| Miscellaneous | | | 55,741 | | | | 28,826 | |
| Total expenses | | | 1,806,637 | | | | 628,550 | |
| Fees waived by Adviser | | | — | | | | (163,089 | ) |
| Fees reduced by Administrator | | | — | | | | (617 | ) |
| Net operating expenses | | | 1,806,637 | | | | 464,844 | |
| Net investment income | | | 1,747,126 | | | | 656,553 | |
| | | | | | | | | |
| Net Realized and Change in Unrealized Gain (Loss) on Investments | | | | | | | | |
| Net realized gain on investment securities transactions | | | 2,034,895 | | | | 4,811,594 | |
| Net change in unrealized appreciation of investment securities | | | 89,313,587 | | | | 20,156,186 | |
| | | | | | | | | |
| Net realized and change in unrealized gain on investments | | | 91,348,482 | | | | 24,967,780 | |
| Net increase in net assets resulting from operations | | $ | 93,095,608 | | | $ | 25,624,333 | |
See accompanying notes which are an integral part of these financial statements.
| DEAN FUNDS |
| STATEMENTS OF CHANGES IN NET ASSETS |
| | | Dean Small Cap Value Fund | | | Dean Mid Cap Value Fund | |
| | | For the Year | | | For the Year | | | For the Year | | | For the Year | |
| | | Ended | | | Ended | | | Ended | | | Ended | |
| | | March 31, | | | March 31, | | | March 31, | | | March 31, | |
| | | 2021 | | | 2020 | | | 2021 | | | 2020 | |
| Increase (Decrease) in Net Assets due to: | | | | | | | | | | | | | | | | |
| Operations | | | | | | | | | | | | | | | | |
| Net investment income | | $ | 1,747,126 | | | $ | 3,476,382 | | | $ | 656,553 | | | $ | 506,129 | |
| Net realized gain (loss) on investment securities transactions | | | 2,034,895 | | | | (37,519,889 | ) | | | 4,811,594 | | | | (1,796,029 | ) |
| Net change in unrealized appreciation (depreciation) of investment securities | | | 89,313,587 | | | | (59,597,988 | ) | | | 20,156,186 | | | | (8,398,175 | ) |
| | | | | | | | | | | | | | | | | |
| Net increase (decrease) in net assets resulting from operations | | | 93,095,608 | | | | (93,641,495 | ) | | | 25,624,333 | | | | (9,688,075 | ) |
| Distributions to Shareholders From: | | | | | | | | | | | | | | | | |
| Earnings | | | (2,361,460 | ) | | | (12,218,938 | ) | | | (608,981 | ) | | | (3,703,150 | ) |
| Total distributions | | | (2,361,460 | ) | | | (12,218,938 | ) | | | (608,981 | ) | | | (3,703,150 | ) |
| | | | | | | | | | | | | | | | | |
| Capital Transactions | | | | | | | | | | | | | | | | |
| Proceeds from shares sold | | | 51,629,499 | | | | 130,664,673 | | | | 30,635,226 | | | | 5,797,965 | |
| Reinvestment of distributions | | | 1,948,526 | | | | 11,590,761 | | | | 601,186 | | | | 3,633,596 | |
| Amount paid for shares redeemed | | | (201,828,242 | ) | | | (131,008,885 | ) | | | (9,348,917 | ) | | | (5,256,253 | ) |
| Net increase (decrease) in net assets resulting from capital transactions | | | (148,250,217 | ) | | | 11,246,564 | | | | 21,887,495 | | | | 4,175,308 | |
| Total Increase (Decrease) in Net Assets | | | (57,516,069 | ) | | | (94,613,869 | ) | | | 46,902,847 | | | | (9,215,917 | ) |
| | | | | | | | | | | | | | | | | |
| Net Assets | | | | | | | | | | | | | | | | |
| Beginning of year | | | 226,563,955 | | | | 321,177,824 | | | | 32,673,053 | | | | 41,888,970 | |
| End of year | | $ | 169,047,886 | | | $ | 226,563,955 | | | $ | 79,575,900 | | | $ | 32,673,053 | |
| | | | | | | | | | | | | | | | | |
| Share Transactions | | | | | | | | | | | | | | | | |
| Shares sold | | | 4,526,065 | | | | 10,726,584 | | | | 1,684,591 | | | | 284,677 | |
| Shares issued in reinvestment of distributions | | | 139,380 | | | | 806,594 | | | | 30,363 | | | | 179,083 | |
| Shares redeemed | | | (19,190,963 | ) | | | (9,669,893 | ) | | | (481,662 | ) | | | (285,572 | ) |
| Net increase (decrease) in shares outstanding | | | (14,525,518 | ) | | | 1,863,285 | | | | 1,233,292 | | | | 178,188 | |
See accompanying notes which are an integral part of these financial statements.
| DEAN SMALL CAP VALUE FUND |
| FINANCIAL HIGHLIGHTS |
| (For a share outstanding during each year) |
| | | For the Years ended | |
| | | March 31, | | | March 31, | | | March 31, | | | March 31, | | | March 31, | |
| | | 2021 | | | 2020 | | | 2019 | | | 2018 | | | 2017 | |
| Selected Per Share Data: | | | | | | | | | | | | | | | |
| Net asset value, beginning of year | | $ | 9.25 | | | $ | 14.19 | | | $ | 14.63 | | | $ | 17.04 | | | $ | 14.32 | |
| Investment operations: | | | | | | | | | | | | | | | | | | | | |
| Net investment income | | | 0.27 | | | | 0.16 | | | | 0.15 | | | | 0.12 | | | | 0.19 | |
| Net realized and unrealized gain (loss) | | | 7.67 | | | | (4.51 | ) | | | (0.18 | ) | | | 0.19 | (a) | | | 3.20 | |
| Total from investment operations | | | 7.94 | | | | (4.35 | ) | | | (0.03 | ) | | | 0.31 | | | | 3.39 | |
| Less distributions to shareholders from: | | | | | | | | | | | | | | | | | | | | |
| Net investment income | | | (0.23 | ) | | | (0.19 | ) | | | (0.20 | ) | | | (0.11 | ) | | | (0.18 | ) |
| Net realized gains | | | — | | | | (0.40 | ) | | | (0.21 | ) | | | (2.61 | ) | | | (0.49 | ) |
| Total distributions | | | (0.23 | ) | | | (0.59 | ) | | | (0.41 | ) | | | (2.72 | ) | | | (0.67 | ) |
| Net asset value, end of year | | $ | 16.96 | | | $ | 9.25 | | | $ | 14.19 | | | $ | 14.63 | | | $ | 17.04 | |
| | | | | | | | | | | | | | | | | | | | | |
| Total Return(b) | | | 86.33 | % | | | (32.14 | )% | | | (0.08 | )% | | | 1.59 | % | | | 23.67 | % |
| Ratios and Supplemental Data: | | | | | | | | | | | | | | | | | | | | |
| Net assets, end of year (000 omitted) | | $ | 169,048 | | | $ | 226,564 | | | $ | 321,178 | | | $ | 350,182 | | | $ | 284,563 | |
| Ratio of net expenses to average net assets | | | 1.19 | % | | | 1.15 | % | | | 1.12 | % | | | 1.18 | % | | | 1.15 | % |
| Ratio of gross expenses to average net assets before waiver or recoupment | | | 1.19 | % | | | 1.15 | % | | | 1.12 | % | | | 1.18 | % | | | 1.15 | % |
| Ratio of net investment income to average net assets | | | 1.16 | % | | | 1.14 | % | | | 1.04 | % | | | 0.97 | % | | | 1.36 | % |
| Portfolio turnover rate | | | 181 | % | | | 157 | % | | | 120 | % | | | 165 | % | | | 154 | % |
| (a) | The amount shown for a share outstanding throughout the period does not accord with the change in aggregate gains and losses in the portfolio of securities during the period because of the timing of sales and purchases of fund shares in relation to fluctuating market values during the period. |
| (b) | Total return represents the rate that the investor would have earned or lost on an investment in the Fund, assuming reinvestment of distributions. |
See accompanying notes which are an integral part of these financial statements.
| DEAN MID CAP VALUE FUND |
| FINANCIAL HIGHLIGHTS |
| (For a share outstanding during each year) |
| | | For the Years ended | |
| | | March 31, | | | March 31, | | | March 31, | | | March 31, | | | March 31, | |
| | | 2021 | | | 2020 | | | 2019 | | | 2018 | | | 2017 | |
| Selected Per Share Data: | | | | | | | | | | | | | | | |
| Net asset value, beginning of year | | $ | 14.26 | | | $ | 19.83 | | | $ | 19.87 | | | $ | 18.92 | | | $ | 16.15 | |
| Investment operations: | | | | | | | | | | | | | | | | | | | | |
| Net investment income | | | 0.16 | | | | 0.22 | | | | 0.22 | | | | 0.08 | | | | 0.12 | |
| Net realized and unrealized gain (loss) | | | 8.34 | | | | (4.08 | ) | | | 0.36 | | | | 1.40 | | | | 2.73 | |
| Total from investment operations | | | 8.50 | | | | (3.86 | ) | | | 0.58 | | | | 1.48 | | | | 2.85 | |
| Less distributions to shareholders from: | | | | | | | | | | | | | | | | | | | | |
| Net investment income | | | (0.18 | ) | | | (0.22 | ) | | | (0.16 | ) | | | (0.10 | ) | | | (0.08 | ) |
| Net realized gains | | | — | | | | (1.49 | ) | | | (0.46 | ) | | | (0.43 | ) | | | — | |
| Total distributions | | | (0.18 | ) | | | (1.71 | ) | | | (0.62 | ) | | | (0.53 | ) | | | (0.08 | ) |
| Net asset value, end of year | | $ | 22.58 | | | $ | 14.26 | | | $ | 19.83 | | | $ | 19.87 | | | $ | 18.92 | |
| | | | | | | | | | | | | | | | | | | | | |
| Total Return(a) | | | 59.75 | % | | | (22.04 | )% | | | 3.10 | % | | | 7.79 | % | | | 17.65 | % |
| Ratios and Supplemental Data: | | | | | | | | | | | | | | | | | | | | |
| Net assets, end of year (000 omitted) | | $ | 79,576 | | | $ | 32,673 | | | $ | 41,889 | | | $ | 34,093 | | | $ | 26,132 | |
| Ratio of net expenses to average net assets | | | 0.85 | % | | | 1.02 | % | | | 1.10 | % | | | 1.10 | % | | | 1.10 | % |
| Ratio of gross expenses to average net assets before waiver or recoupment | | | 1.15 | % | | | 1.30 | % | | | 1.40 | % | | | 1.53 | % | | | 1.76 | % |
| Ratio of net investment income to average net assets | | | 1.20 | % | | | 1.14 | % | | | 1.20 | % | | | 0.49 | % | | | 0.75 | % |
| Portfolio turnover rate | | | 65 | % | | | 76 | % | | | 46 | % | | | 52 | % | | | 57 | % |
| (a) | Total return represents the rate that the investor would have earned or lost on an investment in the Fund, assuming reinvestment of distributions. |
See accompanying notes which are an integral part of these financial statements.
| DEAN FUNDS |
| NOTES TO THE FINANCIAL STATEMENTS |
| March 31, 2021 |
NOTE 1. ORGANIZATION
The Dean Small Cap Value Fund (the “Small Cap Fund”) and the Dean Mid Cap Value Fund (the “Mid Cap Fund”) (each a “Fund” and, collectively the “Funds”) were organized as diversified series of Unified Series Trust (the “Trust”) on November 13, 2006 and are each registered under the Investment Company Act of 1940, as amended (“1940 Act”). The Trust is an open-end investment company established under the laws of Ohio by an Agreement and Declaration of Trust dated October 17, 2002 (the “Trust Agreement”). The Trust Agreement permits the Board of Trustees (the “Board”) to issue an unlimited number of shares of beneficial interest of separate series. The Funds are each a series of the Trust currently authorized by the Board. The investment adviser to each Fund is Dean Investment Associates, LLC (“Dean Investment Associates” or “Adviser”). In addition, the Adviser has retained Dean Capital Management, LLC (“DCM” or “Sub-Adviser”) to serve as sub-adviser to the Funds. DCM is an affiliate of the Adviser. The investment objective of each Fund is long-term capital appreciation and, secondarily, dividend income.
NOTE 2. SIGNIFICANT ACCOUNTING POLICIES
The Funds are investment companies and follow accounting and reporting guidance under Financial Accounting Standards Board Accounting Standards Codification (“ASC”) Topic 946, “Financial Services-Investment Companies.” The following is a summary of significant accounting policies followed by the Funds in the preparation of their financial statements. These policies are in conformity with the generally accepted accounting principles in the United States of America (“GAAP”).
Estimates – The preparation of financial statements in conformity with GAAP requires management to make estimates and assumptions that affect the reported amounts of assets and liabilities and disclosure of contingent assets and liabilities at the date of the financial statements and the reported amounts of increases and decreases in net assets from operations during the reporting period. Actual results could differ from those estimates.
Federal Income Taxes – The Funds make no provision for federal income or excise tax. Each Fund has qualified and intends to qualify each year as a regulated investment company (“RIC”) under subchapter M of the Internal Revenue Code of 1986, as amended, by complying with the requirements applicable to RICs and by distributing substantially all of its taxable income. Each Fund also intends to distribute sufficient
| DEAN FUNDS |
| NOTES TO THE FINANCIAL STATEMENTS – (continued) |
| March 31, 2021 |
NOTE 2. SIGNIFICANT ACCOUNTING POLICIES – continued
net investment income and net capital gains, if any, so that it will not be subject to excise tax on undistributed income and gains. If the required amount of net investment income or gains is not distributed, the Fund could incur a tax expense.
As of and during the fiscal year ended March 31, 2021, the Funds did not have any liabilities for any unrecognized tax benefits. The Funds recognize interest and penalties, if any, related to unrecognized tax benefits as income tax expense in the Statement of Operations when incurred. During the year, the Funds did not incur any interest or penalties. Management of the Funds has reviewed tax positions taken in tax years that remain subject to examination by all major tax jurisdictions, including federal (i.e., the previous three tax year ends and the interim tax period since then, as applicable) and has concluded that no provision for unrecognized tax benefits or expenses is required in these financial statements and does not expect this to change over the next twelve months.
Expenses – Expenses incurred by the Trust that do not relate to a specific fund of the Trust are allocated to the individual funds based on each fund’s relative net assets or another appropriate basis (as determined by the Board).
Security Transactions and Related Income – The Funds follow industry practice and record security transactions on the trade date for financial reporting purposes. The specific identification method is used for determining gains or losses for financial statements and income tax purposes. Dividend income is recorded on the ex-dividend date and interest income is recorded on an accrual basis. Distributions received from investments in real estate investment trusts (“REITs”) that represent a return of capital or capital gain are recorded as a reduction of the cost of investment or as a realized gain, respectively. The calendar year-end amounts of ordinary income, capital gains, and return of capital included in distributions received from the Funds’ investments in REITs are reported to the Funds after the end of the calendar year; accordingly, the Funds estimate these amounts for accounting purposes until the characterization of REIT distributions is reported. Estimates are based on the most recent REIT distributions information available. Withholding taxes on foreign dividends and related reclaims have been provided for in accordance with the Funds’ understanding of the applicable country’s tax rules and rates.
| DEAN FUNDS |
| NOTES TO THE FINANCIAL STATEMENTS – (continued) |
| March 31, 2021 |
NOTE 2. SIGNIFICANT ACCOUNTING POLICIES – continued
Dividends and Distributions – Each Fund intends to distribute its net investment income and net realized long-term and short-term capital gains, if any, at least annually. Dividends and distributions to shareholders, which are determined in accordance with income tax regulations, are recorded on the ex-dividend date. The treatment for financial reporting purposes of distributions made to shareholders during the period from net investment income or net realized capital gains may differ from their ultimate treatment for federal income tax purposes. These differences are caused primarily by differences in the timing of the recognition of certain components of income, expense or realized capital gain for federal income tax purposes. Where such differences are permanent in nature, they are reclassified among the components of the net assets based on their ultimate characterization for federal income tax purposes. Any such reclassifications will have no effect on net assets, results of operations or net asset value (“NAV”) per share of the Funds.
For the fiscal year ended March 31, 2021, the Mid Cap Fund made the following reclassifications to increase (decrease) the components of net assets:
| Paid-In | | | Accumulated | |
| Capital | | | Earnings (Deficit) | |
| $ | (202 | ) | | $ | 202 | |
NOTE 3. SECURITIES VALUATION AND FAIR VALUE MEASUREMENTS
Each Fund values its portfolio securities at fair value as of the close of regular trading on the New York Stock Exchange (the “NYSE”) (normally 4:00 p.m. Eastern time) on each business day the NYSE is open for business. Fair value is defined as the price that a Fund would receive upon selling an investment in a timely transaction to an independent buyer in the principal or most advantageous market of the investment. GAAP establishes a three-tier hierarchy to maximize the use of observable market data and minimize the use of unobservable inputs and to establish classification of fair value measurements for disclosure purposes.
Inputs refer broadly to the assumptions that market participants would use in pricing the asset or liability, including assumptions about risk (the risk inherent in a particular valuation technique used to measure fair value including a pricing model and/or the risk inherent in the inputs to the valuation technique). Inputs may be observable or unobservable. Observable inputs are inputs that reflect the assumptions market
| DEAN FUNDS |
| NOTES TO THE FINANCIAL STATEMENTS – (continued) |
| March 31, 2021 |
NOTE 3. SECURITIES VALUATION AND FAIR VALUE MEASUREMENTS – continued
participants would use in pricing the asset or liability developed based on market data obtained and available from sources independent of the reporting entity. Unobservable inputs are inputs that reflect the reporting entity’s own assumptions about the assumptions market participants would use in pricing the asset or liability developed based on the best information available in the circumstances.
Various inputs are used in determining the value of each Fund’s investments. These inputs are summarized in the three broad levels listed below.
| ● | Level 1 – unadjusted quoted prices in active markets for identical investments and/or registered investment companies where the value per share is determined and published and is the basis for current transactions for identical assets or liabilities at the valuation date |
| ● | Level 2 – other significant observable inputs (including, but not limited to, quoted prices for an identical security in an inactive market, quoted prices for similar securities, interest rates, prepayment speeds, credit risk, etc.) |
| ● | Level 3 – significant unobservable inputs (including the Funds’ own assumptions in determining fair value of investments based on the best information available) |
The inputs used to measure fair value may fall into different levels of the fair value hierarchy. In such cases, for disclosure purposes, the level in the fair value hierarchy which is reported is determined based on the lowest level input that is significant to the fair value measurement in its entirety.
Equity securities that are traded on any stock exchange are generally valued at the last quoted sale price on the security’s primary exchange. Lacking a last sale price, an exchange-traded security is generally valued at its last bid price. Securities traded in the NASDAQ over-the-counter market are generally valued at the NASDAQ Official Closing Price. When using the market quotations and when the market is considered active, the security is classified as a Level 1 security. In the event that market quotations are not readily available or are considered unreliable due to market or other events, a Fund values its securities and other assets at fair value in accordance with
| DEAN FUNDS |
| NOTES TO THE FINANCIAL STATEMENTS – (continued) |
| March 31, 2021 |
NOTE 3. SECURITIES VALUATION AND FAIR VALUE MEASUREMENTS – continued
policies established by and under the general supervision of the Board. Under these policies, the securities will be classified as Level 2 or 3 within the fair value hierarchy, depending on the inputs used.
Investments in mutual funds, including money market mutual funds, are generally priced at the ending NAV provided by the service agent of the mutual funds. These securities are categorized as Level 1 securities.
In accordance with the Trust’s valuation policies, the Adviser and/or Sub-Adviser is required to consider all appropriate factors relevant to the value of securities for which it has determined other pricing sources are not available or reliable as described above. No single method exists for determining fair value, because fair value depends upon the circumstances of each individual case. As a general principle, the current fair value of a security being valued by the Adviser and/or Sub-Adviser would be the amount that the Fund might reasonably expect to receive upon the current sale. Methods that are in accordance with this principle may, for example, be based on (i) a multiple of earnings; (ii) a discount from market prices of a similar freely traded security (including a derivative security or a basket of securities traded on other markets, exchanges or among dealers); or (iii) yield to maturity with respect to debt issues, or a combination of these and other methods. Fair-value pricing is permitted if, in the Adviser and/or Sub-Adviser’s opinion, the validity of market quotations appears to be questionable based on factors such as evidence of a thin market in the security based on a small number of quotations, a significant event occurs after the close of a market but before a Fund’s NAV calculation that may affect a security’s value, or the Adviser and/or Sub-Adviser is aware of any other data that calls into question the reliability of market quotations.
| DEAN FUNDS |
| NOTES TO THE FINANCIAL STATEMENTS – (continued) |
| March 31, 2021 |
NOTE 3. SECURITIES VALUATION AND FAIR VALUE MEASUREMENTS – continued
The following is a summary of the inputs used to value the Funds’ investments as of March 31, 2021:
| | | Valuation Inputs | |
| | | Level 1 | | | Level 2 | | | Level 3 | | | Total | |
| Small Cap Fund | | | | | | | | | | | | | | | | |
| Assets | | | | | | | | | | | | | | | | |
| Common Stocks(a) | | $ | 161,866,851 | | | $ | — | | | $ | — | | | $ | 161,866,851 | |
| Money Market Funds | | | 7,900,982 | | | | — | | | | — | | | | 7,900,982 | |
| Total | | $ | 169,767,833 | | | $ | — | | | $ | — | | | $ | 169,767,833 | |
| | | | | | | | | | | | | | | | | |
| Mid Cap Fund | | | | | | | | | | | | |
| Assets | | | | | | | | | | | | |
| Common Stocks(a) | | $ | 77,077,567 | | | $ | — | | | $ | — | | | $ | 77,077,567 | |
| Money Market Funds | | | 2,258,196 | | | | — | | | | — | | | | 2,258,196 | |
| Total | | $ | 79,335,763 | | | $ | — | | | $ | — | | | $ | 79,335,763 | |
| | | | | | | | | | | | | | | | | |
| (a) | Refer to Schedule of Investments for sector classifications. |
The Funds did not hold any investments at the end of the reporting period for which significant unobservable inputs (Level 3) were used in determining fair value; therefore, no reconciliation of Level 3 securities is included for this reporting period.
NOTE 4. FEES AND OTHER TRANSACTIONS WITH AFFILIATES
Each Fund’s investments are managed by the Adviser pursuant to the terms of an advisory agreement with the Trust. The Adviser has hired the Sub-Adviser to manage the Funds’ assets on a day-to-day basis. The Sub-Adviser is paid by the Adviser. In accordance with the advisory agreement for each Fund, the Adviser is entitled to an investment advisory fee, computed and accrued daily and paid monthly, at an annual rate of 0.90% and 0.75% of the average daily net assets of the Small Cap Fund and Mid Cap Fund, respectively. For the fiscal year ended March 31, 2021, the Adviser earned fees, before the waiver described below, of $1,359,433 and $408,898 from the Small Cap Fund and the Mid Cap Fund, respectively. At March 31, 2021, the Adviser was owed $129,378 from the Small Cap Fund and $31,757 from the Mid Cap Fund.
| DEAN FUNDS |
| NOTES TO THE FINANCIAL STATEMENTS – (continued) |
| March 31, 2021 |
NOTE 4. FEES AND OTHER TRANSACTIONS WITH AFFILIATES – continued
The Adviser has contractually agreed to waive its management fee and/or to reimburse certain Fund operating expenses, but only to the extent necessary so that total annual operating expenses, excluding portfolio transaction and other investment-related costs (including brokerage fees and commissions); taxes; borrowing costs (such as interest and dividend expenses on securities sold short); acquired fund fees and expenses; fees and expenses associated with investments in other collective investment vehicles or derivative instruments (including for example option and swap fees and expenses); any amounts payable pursuant to a distribution or service plan adopted in accordance with Rule 12b-1 under the 1940 Act; expenses incurred in connection with any merger or reorganization; extraordinary expenses (such as litigation expenses, indemnification of Trust officers and Trustees and contractual indemnification of Fund service providers, and other expenses that the Trustees agree have not been incurred in the ordinary course of the Funds’ business), do not exceed 1.25% of the Small Cap Fund’s average daily net assets and 0.85% of the Mid Cap Fund’s average daily net assets. The contractual agreement with respect to each Fund is in place through July 31, 2021. For the fiscal year ended March 31, 2021, the Adviser waived fees of $163,089 for the Mid Cap Fund.
Each waiver/expense payment by the Adviser is subject to recoupment by the Adviser from the Fund in the three years following the date the particular waiver/expense payment occurred, but only if such recoupment can be achieved without exceeding the annual expense limitation in effect at the time of the waiver/expense payment and any expense limitation in effect at the time of recoupment. As of March 31, 2021, the Adviser may seek repayment of investment advisory fees waived and expense reimbursements pursuant to the aforementioned conditions, from the Mid Cap Fund no later than the dates stated below:
| March 31, 2022 | | $ | 85,295 | |
| March 31, 2023 | | | 118.935 | |
| March 31, 2024 | | | 163,089 | |
Ultimus Fund Solutions, LLC (the “Administrator”) and its affiliate, Northern Lights Compliance Services, LLC (“Northern Lights”) provide the Funds with administration, fund accounting, transfer agent and compliance services, including all
| DEAN FUNDS |
| NOTES TO THE FINANCIAL STATEMENTS – (continued) |
| March 31, 2021 |
NOTE 4. FEES AND OTHER TRANSACTIONS WITH AFFILIATES – continued
regulatory reporting. For the fiscal year ended March 31, 2021, fees for administration, transfer agent, fund accounting and compliance services, and the amounts due to the Administrator at March 31, 2021 were as follows:
| | | Small Cap Fund | | | Mid Cap Fund | |
| Administration | | $ | 126,734 | | | $ | 49,277 | |
| Fund accounting | | | 31,400 | | | | 15,476 | |
| Transfer agent | | | 53,985 | | | | 11,290 | |
| Compliance services | | | 12,000 | | | | 12,000 | |
| Ultimus waived fees | | | — | | | | (617 | ) |
| Payable to Administrator | | | 18,605 | | | | 9,898 | |
The Board supervises the business activities of the Trust. Each Trustee serves as a trustee until termination of the Trust unless the Trustee dies, resigns, retires, or is removed. The Chairman of the Board and more than 75% of the Trustees are “Independent Trustees,” which means that they are not “interested persons” as defined in the 1940 Act. Each Independent Trustee of the Trust receives annual compensation of $2,510 per fund from the Trust, except that the Independent Chairman of the Board, the Chairman of the Audit Committee, the Chairman of the Governance & Nominating Committee, and the Chairman of the Pricing & Liquidity Committee each receives annual compensation of $2,960 per fund from the Trust, and the Chairman of the Board receives $3,160 per fund from the Trust. Independent Trustees also receive $1,000 for attending each special in-person meeting. Prior to January 1, 2021, these fees were $2,290 for non-chairmen and $2,740 for all chairmen. In addition, the Trust reimburses Independent Trustees for out-of-pocket expenses incurred in conjunction with attendance at meetings.
One Trustee and certain officers of the Trust are employees of the Administrator or Ultimus Fund Distributors, LLC (the “Distributor”). The Distributor acts as the principal distributor of each Fund’s shares. The Distributor operates as a wholly-owned subsidiary of the Administrator. An officer of the Trust is an officer of the Distributor and such person may be deemed to be an affiliate of the Distributor. Officers are not paid for services to the Trust, however, the Fund pays Northern Lights, which compensates the Assistant Chief Compliance Officer.
| DEAN FUNDS |
| NOTES TO THE FINANCIAL STATEMENTS – (continued) |
| March 31, 2021 |
NOTE 5. INVESTMENT TRANSACTIONS
For the fiscal year ended March 31, 2021, purchases and sales of investment securities, other than short-term investments and short-term U.S. government obligations, were as follows:
| | | Small Cap Fund | | | Mid Cap Fund | |
| Purchases | | $ | 270,937,299 | | | $ | 55,191,502 | |
| Sales | | | 420,250,671 | | | | 34,242,301 | |
There were no purchases or sales of long-term U.S. government obligations during the fiscal year ended March 31, 2021.
NOTE 6. FEDERAL TAX INFORMATION
At March 31, 2021, the net unrealized appreciation (depreciation) and tax cost of investments for tax purposes was as follows:
| | | Small Cap Fund | | | Mid Cap Fund | |
| Gross unrealized appreciation | | $ | 26,520,127 | | | $ | 18,020,543 | |
| Gross unrealized depreciation | | | (1,105,901 | ) | | | (86,109 | ) |
| Net unrealized appreciation | | $ | 25,414,226 | | | $ | 17,934,434 | |
| Tax cost | | $ | 144,353,607 | | | $ | 61,401,329 | |
The tax character of distributions paid for the fiscal years ended March 31, 2021 and March 31, 2020 were as follows:
| | | Small Cap Fund | | | Mid Cap Fund | |
| | | 2021 | | | 2020 | | | 2021 | | | 2020 | |
| Distributions paid from: | | | | | | | | | | | | | | | | |
| Ordinary income(a) | | $ | 2,361,460 | | | $ | 9,336,304 | | | $ | 608,981 | | | $ | 473,794 | |
| Long-term capital gains | | | — | | | | 2,882,635 | | | | — | | | | 3,229,357 | |
| Total distributions paid | | $ | 2,361,460 | | | $ | 12,218,939 | | | $ | 608,981 | | | $ | 3,703,151 | |
| (a) | Short-term capital gain distributions are treated as ordinary income for tax purposes. |
| DEAN FUNDS |
| NOTES TO THE FINANCIAL STATEMENTS – (continued) |
| March 31, 2021 |
NOTE 6. FEDERAL TAX INFORMATION – continued
At March 31, 2021, the components of accumulated earnings (deficit) on a tax basis were as follows:
| | | Small Cap Fund | | | Mid Cap Fund | |
| Undistributed ordinary income | | $ | 1,057,816 | | | $ | 292,697 | |
| Undistributed long-term capital gains | | | — | | | | 164,387 | |
| Accumulated Capital and Other Losses | | | (40,744,046 | ) | | | — | |
| Unrealized appreciation on investments | | | 25,414,226 | | | | 17,934,434 | |
| Total accumulated earnings (losses) | | $ | (14,272,004 | ) | | $ | 18,391,518 | |
The difference between book basis and tax basis of unrealized appreciation (depreciation) is primarily attributable to the tax deferral of losses on wash sales.
As of March 31, 2021, the Small Cap Fund had short-term and long-term capital loss carryforwards available to offset future gains, not subject to expiration, in the amount of $13,339,910 and $27,404,136, respectively.
NOTE 7. SECTOR RISK
If a Fund has significant investments in the securities of issuers within a particular sector, any development affecting that sector will have a greater impact on the value of the net assets of the Fund than would be the case if the Fund did not have significant investments in that sector. In addition, this may increase the risk of loss in the Fund and increase the volatility of the Fund’s NAV per share. For instance, economic or market factors, regulatory changes or other developments may negatively impact all companies in a particular sector, and therefore the value of the Fund’s portfolio will be adversely affected. As of March 31, 2021, the Small Cap Fund had 28.82% of the value of its net assets invested in stocks within the Financials sector.
| DEAN FUNDS |
| NOTES TO THE FINANCIAL STATEMENTS – (continued) |
| March 31, 2021 |
NOTE 8. CORONAVIRUS (COVID-19) PANDEMIC
The COVID-19 pandemic has caused financial markets to experience periods of increased volatility due to uncertainty that exists around its long-term effects. COVID-19 has resulted in varying levels of travel restrictions, quarantines, disruptions to supply chains and customer activity, leading to general concern and economic uncertainty. The full impact and duration of the pandemic cannot necessarily be foreseen. Management continues to monitor developments and navigate accordingly, further evaluating the anticipated impact to financial markets.
NOTE 9. COMMITMENTS AND CONTINGENCIES
The Trust indemnifies its officers and Trustees for certain liabilities that may arise from their performance of their duties to the Trust or the Funds. Additionally, in the normal course of business, the Trust enters into contracts that contain a variety of representations and warranties which provide general indemnifications. The Trust’s maximum exposure under these arrangements is unknown, as this would involve future claims that may be made against the Trust that have not yet occurred.
NOTE 10. SUBSEQUENT EVENTS
Management of the Funds has evaluated the need for disclosures and/or adjustments resulting from subsequent events through the date at which these financial statements were issued. Based upon this evaluation, management has determined there were no items requiring adjustment of the financial statements or additional disclosure.
| REPORT OF INDEPENDENT REGISTERED PUBLIC |
| ACCOUNTING FIRM |
To the Shareholders of Dean Funds and
Board of Trustees of Unified Series Trust
Opinion on the Financial Statements
We have audited the accompanying statements of assets and liabilities, including the schedules of investments, of Dean Funds, comprising Dean Small Cap Value Fund and Dean Mid Cap Value Fund (the “Funds”), each a series of Unified Series Trust, as of March 31, 2021, the related statements of operations for the year then ended, the statements of changes in net assets for each of the two years in the period then ended, the related notes, and the financial highlights for each of the five years in the period then ended (collectively referred to as the “financial statements”). In our opinion, the financial statements present fairly, in all material respects, the financial position of the each of the Funds as of March 31, 2021, the results of their operations for the year then ended, the changes in net assets for each of the two years in the period then ended, and the financial highlights for each of the five years in the period then ended, in conformity with accounting principles generally accepted in the United States of America.
Basis for Opinion
These financial statements are the responsibility of the Funds’ management. Our responsibility is to express an opinion on the Funds’ financial statements based on our audits. We are a public accounting firm registered with the Public Company Accounting Oversight Board (United States) (“PCAOB”) and are required to be independent with respect to the Funds in accordance with the U.S. federal securities laws and the applicable rules and regulations of the Securities and Exchange Commission and the PCAOB.
We conducted our audits in accordance with the standards of the PCAOB. Those standards require that we plan and perform the audit to obtain reasonable assurance about whether the financial statements are free of material misstatement whether due to error or fraud.
| REPORT OF INDEPENDENT REGISTERED PUBLIC |
| ACCOUNTING FIRM – (continued) |
Our audits included performing procedures to assess the risks of material misstatement of the financial statements, whether due to error or fraud, and performing procedures that respond to those risks. Such procedures included examining, on a test basis, evidence regarding the amounts and disclosures in the financial statements. Our procedures included confirmation of securities owned as of March 31, 2021, by correspondence with the custodian and brokers; when replies were not received from brokers, we performed other auditing procedures. Our audits also included evaluating the accounting principles used and significant estimates made by management, as well as evaluating the overall presentation of the financial statements. We believe that our audits provide a reasonable basis for our opinion.
We have served as the Funds’ auditor since 2007.
COHEN & COMPANY, LTD.
Chicago, Illinois
May 27, 2021
| LIQUIDITY RISK MANAGEMENT PROGRAM (Unaudited) |
The Funds have adopted and implemented a written liquidity risk management program (the “Program”) as required by Rule 22e-4 (the “Liquidity Rule”) under the 1940 Act. The Program is reasonably designed to assess and manage the Funds’ liquidity risk, taking into consideration, among other factors, the Funds’ investment strategy and the liquidity of its portfolio investments during normal and reasonably foreseeable stressed conditions; its short and long-term cash flow projections; and its cash holdings and access to other funding sources. The Board approved the appointment of the Liquidity Administrator Committee, comprising certain Trust officers and employees of the Adviser. The Liquidity Administrator Committee maintains Program oversight and reports to the Board on at least an annual basis regarding the Program’s operational effectiveness through a written report (the “Report”). The Program’s initial Report, which was presented to the Board for consideration at its meeting held on November 17, 2020, outlined the operation of the Program and the adequacy and effectiveness of the Program’s implementation. During the review period, the Funds did not experience unusual stress or disruption to its operations related to purchase and redemption activity. Also, during the review period the Funds held adequate levels of cash and highly liquid investments to meet shareholder redemption activities in accordance with applicable requirements. The Report concluded that the Program is reasonably designed to prevent violation of the Liquidity Rule and has been effectively implemented.
| SUMMARY OF FUND EXPENSES (Unaudited) |
As a shareholder of a Fund, you incur two types of costs: (1) transaction costs and (2) ongoing costs, including management fees and other Fund expenses. These examples are intended to help you understand your ongoing costs (in dollars) of investing in each Fund and to compare these costs with the ongoing costs of investing in other mutual funds. Each Fund’s example is based on an investment of $1,000 invested at the beginning of the period and held for the entire period from October 1, 2020 through March 31, 2021.
Actual Expenses
The first line of the table below provides information about actual account values and actual expenses. You may use the information in this line, together with the amount you invested, to estimate the expenses that you paid over the period. Simply divide your account value by $1,000 (for example, an $8,600 account value divided by $1,000 = 8.60), then multiply the result by the number in the first line under the heading entitled “Expenses Paid During Period” to estimate the expenses you paid on your account during this period.
Hypothetical Example for Comparison Purposes
The second line of the table below provides information about hypothetical account values and hypothetical expenses based on the Fund’s actual expense ratio and an assumed rate of return of 5% per year before expenses, which is not the Fund’s actual return. The hypothetical account values and expenses may not be used to estimate the actual ending account balance or expenses you paid for the period. You may use this information to compare the ongoing costs of investing in the Fund and other funds. To do so, compare this 5% hypothetical example with the 5% hypothetical examples that appear in the shareholder reports of other funds.
Expenses shown in the table are meant to highlight your ongoing costs only and do not reflect any transactional costs. Therefore, the second line of the table below is useful in comparing ongoing costs only and will not help you determine the relative costs of owning different funds. In addition, if transaction costs were included, your costs would have been higher.
| SUMMARY OF FUND EXPENSES (Unaudited) – (continued) |
| | | Beginning | | Ending | | | | |
| | | Account | | Account | | Expenses | | |
| | | Value | | Value | | Paid | | Annualized |
| | | October 1, | | March 31, | | During | | Expense |
| | | 2020 | | 2021 | | Period (a) | | Ratio |
| Dean Small Cap Value Fund | | | | | | | | |
| Actual | | $1,000.00 | | $1,534.80 | | $7.19 | | 1.14% |
| Hypothetical(b) | | $1,000.00 | | $1,019.26 | | $5.73 | | 1.14% |
| | | | | | | | | |
| Dean Mid Cap Value Fund | | | | | | | | |
| Actual | | $1,000.00 | | $1,333.70 | | $4.95 | | 0.85% |
| Hypothetical(b) | | $1,000.00 | | $1,020.69 | | $4.28 | | 0.85% |
| (a) | Expenses are equal to the Fund’s annualized expense ratios, multiplied by the average account value over the period, multiplied by 182/365 (to reflect the one-half year period). |
| (b) | Hypothetical assumes 5% annual return before expenses. |
| ADDITIONAL FEDERAL INCOME TAX INFORMATION (Unaudited) |
The Form 1099-DIV you receive in January 2022 will show the tax status of all distributions paid to your account in calendar year 2021. Shareholders are advised to consult their own tax adviser with respect to the tax consequences of their investment in the Fund. As required by the Internal Revenue Code and/or regulations, shareholders must be notified regarding the status of qualified dividend income for individuals and the dividends received deduction for corporations.
Qualified Dividend Income. The Funds designate the following percentage or up to the maximum amount of such dividends allowable pursuant to the Internal Revenue Code, as qualified dividend income eligible for the reduced tax rate.
| | | Dean Mid Cap | | Dean Small Cap |
| | | Value Fund | | Value Fund |
| Qualified Dividend Income | | 100.00% | | 87.99% |
Qualified Business Income. The Funds designate the following percentage of ordinary income dividends, or up to the maximum amount of such dividends allowable pursuant to the Internal Revenue Code, as qualified business income.
| | | Dean Mid Cap | | Dean Small Cap |
| | | Value Fund | | Value Fund |
| Qualified Business Income | | — | | 9.33% |
Dividends Received Deduction. Corporate shareholders are generally entitled to take the dividends received deduction on the portion of the Funds’ dividend distribution that qualifies under tax law. For the Funds’ calendar year 2020 ordinary income dividends, the following percentage qualifies for the corporate dividends received deduction.
| | | Dean Mid Cap | | Dean Small Cap |
| | | Value Fund | | Value Fund |
| Dividends Received Deduction | | 100.00% | | 87.53% |
| TRUSTEES AND OFFICERS (Unaudited) |
GENERAL QUALIFICATIONS. The Board supervises the business activities of the Trust. Each Trustee serves as a trustee until termination of the Trust unless the Trustee dies, resigns, retires, or is removed. The Chairman of the Board and more than 75% of the Trustees are “Independent Trustees,” which means that they are not “interested persons” (as defined in the 1940 Act) of the Trust or any adviser, sub-adviser or distributor of the Trust.
The following table provides information regarding the Independent Trustees.
Name, Address*,
(Year of Birth),
Position with Trust**,
Term of Position with Trust | Principal Occupation During Past 5 Years and
Other Directorships |
Kenneth G.Y. Grant (1949)
Chairman, January 2017 to present; Independent Trustee, May 2008 to present | Current: Director, Standpoint Multi-Asset (Cayman) Fund, Ltd. (2019 – present); Director, Advisors Charitable Gift Fund (2020 - present), a Donor Advised Fund. Previous: EVP, Benefit Plans Administrative Services, Inc., provider of retirement benefit plans administration (2019 – 2020); Director, Northeast Retirement Services (NRS) LLC, a transfer agent and fund administrator; and Director, Global Trust Company (GTC), a non-depository trust company sponsoring private investment product (2003 – 2019); EVP, NRS (2003 – 2019); GTC, EVP (2008 – 2019); EVP, Savings Banks Retirement Association (2003 – 2019), provider of qualified retirement benefit plans. |
Daniel J. Condon (1950)
Chairman of the Audit Committee; Chairman of the Governance & Nominating Committee; Independent Trustee, December 2002 to present | Current: Retired (2017 - present) Previous: Executive Advisor of Standard Steel LLC, a Railway manufacturing supply company (2016); Chief Executive Officer of Standard Steel LLC (2011 - 2015); Director of Standard Steel Holdings Co., which owns Standard Steel LLC (2011 - 2016); Director of International Crankshaft Inc. (2004 - 2016). |
| TRUSTEES AND OFFICERS (Unaudited) – (continued) |
Name, Address*,
(Year of Birth),
Position with Trust**,
Term of Position with Trust | Principal Occupation During Past 5 Years and
Other Directorships |
Gary E. Hippenstiel (1947)
Chairman of the Pricing & Liquidity Committee; Independent Trustee, December 2002 to present | Current: President and founder of Hippenstiel Investment Counsel LLC (“Hippenstiel”) since 2008. Hippenstiel was registered as an investment adviser from 2008 to December 31, 2019. |
Stephen A. Little (1946)
Independent Trustee, December 2002 to present; Chairman, December 2004 to December 2016 | Current: President and founder of The Rose, Inc., a registered investment adviser, since 1993. |
Ronald C. Tritschler (1952)
Independent Trustee, January 2007 to present; Interested Trustee, December 2002 to December 2006 | Current: Chief Executive Officer, Director and Legal Counsel of The Webb Companies, a national real estate company, since 2001; Director, Standpoint Multi-Asset (Cayman) Fund, Ltd. (2020 – present). |
| * | The address for each Trustee is 225 Pictoria Drive, Suite 450, Cincinnati, Ohio 45246. |
| ** | As of the date of this report, the Trust consists of 25 series. |
| TRUSTEES AND OFFICERS (Unaudited) – (continued) |
The following table provides information regarding the Interested Trustee and the Officers of the Trust.
Name, Address*,
(Year of Birth),
Position with Trust,
Term of Position with Trust | Principal Occupation During Past 5 Years and
Other Directorships |
David R. Carson (1958)
President, January 2016 to present; Interested Trustee, August 2020 to present | Current: Senior Vice President Client Strategies of Ultimus Fund Solutions, LLC, since 2013. |
Zachary P. Richmond (1980)
Treasurer and Chief Financial Officer, November 2014 to present | Current: Vice President, Director of Financial Administration for Ultimus Fund Solutions, LLC, since 2015. |
Martin R. Dean (1963)
Vice President, November 2020 to present; Chief Compliance Officer, April 2021 to present; Assistant Chief Compliance Officer, January 2016 to April 2021 | Current: Senior Vice President, Head of Fund Compliance of Ultimus Fund Solutions, LLC, since 2016. |
Elisabeth Dahl (1962)
Secretary, May 2017 to present; Assistant Secretary, March 2016 to May 2017 | Current: Attorney, Ultimus Fund Solutions, LLC since March 2016. |
Stephen Preston (1966)
AML Compliance Officer, May 2017 to present | Current: Vice President and Chief Compliance Officer, Ultimus Fund Solutions, LLC and Ultimus Fund Distributors, LLC, since 2011. |
Lynn E. Wood (1946)
Assistant Chief Compliance Officer, April 2021 to present; Chief Compliance Officer, October 2004 to April 2021 | Current: Managing Member, Buttonwood Compliance Partners, LLC, since 2013. |
| * | The address for each Officer is 225 Pictoria Drive, Suite 450, Cincinnati, Ohio 45246. |
| MANAGEMENT AGREEMENT RENEWALS (Unaudited) |
The Dean Mid Cap Value Fund (the “Mid Cap Fund”) and the Dean Small Cap Value Fund (the “Small Cap Fund”) (together the “Funds” and each, a “Fund”) are series of Unified Series Trust (the “Trust”). The Trust’s Board of Trustees (the “Board”) oversees the management of the Funds and, as required by law, has considered the approval of the continuance of the Funds’ management agreements with their investment adviser, Dean Investment Associates, LLC (“DIA”) and the sub-advisory agreement between DIA and Dean Capital Management, LLC (“DCM”).
The Board requested and evaluated all information that the Trustees deemed reasonably necessary under the circumstances in connection with the approval of the continuance of the management agreements and the sub-advisory agreement.
The Trustees held a teleconference on November 11, 2020 to review and discuss materials compiled by Ultimus Fund Solutions, LLC, the Trust’s administrator, with regard to the management agreements between the Trust and DIA, and the sub-advisory agreement between DIA and DCM. At the Trustees’ quarterly meeting held in November 2020, the Board interviewed certain executives of DIA, including DIA’s Chief Compliance Officer and its President. The Trustees, including the Trustees who are not “interested persons” (as that term is defined in the Investment Company Act of 1940) of the Trust, DIA or DCM (the “Independent Trustees”), approved the continuance of the management agreements between the Trust and DIA, and the sub-advisory agreement between DIA and DCM, for an additional year. The Trustees’ approval of the continuance of the Fund’s management agreements was based on a consideration of all the information provided to the Trustees, and was not the result of any single factor. Some of the factors that figured particularly in the Trustees’ deliberations are described below, although individual Trustees may have evaluated this information differently, ascribing different weights to various factors.
| (i) | The Nature, Extent, and Quality of Services. The Trustees reviewed and considered information regarding the nature, extent, and quality of services that DIA and DCM provide to the Funds, which include, but are not limited to, providing a continuous investment program for the Funds, adhering to the Funds’ investment restrictions, complying with the Trust’s policies and procedures, and voting proxies on behalf of the Funds. The Trustees considered the qualifications and experience of DCM’s portfolio managers who are responsible for the day-to-day management of the Funds’ portfolios, as well as the qualifications and experience of the other individuals at DIA and DCM who provide services to the Funds. The Trustees also reviewed the services provided by DIA in its oversight of DCM, noting that the two investment advisers are affiliated. The Trustees considered that the work of DIA is not duplicative of DCM and that each is responsible for a significant amount of work on behalf of the Funds. The Trustees |
| MANAGEMENT AGREEMENT RENEWALS (Unaudited) – (continued) |
concluded that they continue to be impressed with the nature, extent, and quality of investment management services provided by each of DIA and DCM to the Funds.
| (ii) | Fund Performance. The Trustees next reviewed and discussed the Funds’ performance for periods ended September 30, 2020. The Trustees observed that the Small Cap Fund had underperformed its primary benchmark, the Russell 2000 Value Index over the year-to-date, one-, three-, five-, ten- and fifteen-year periods, underperforming by the least over the fifteen-year period. The Trustees noted that the Small Cap Fund had underperformed its Morningstar Small-Cap Value category over each period except the ten-year period, in which it slightly outperformed the category. The Trustees considered DIA and DCM’s commitment to style purity and their explanation that, although the small cap value market has been the poorest performing market segment over the past ten years, they continue to see opportunities. The Trustees observed that the Mid Cap Fund had underperformed its primary benchmark, the Russell Midcap Value Index, over the year-to-date, one-, three-, five-, ten- and fifteen-year periods. The Trustees noted that the Mid Cap Fund underperformed its Morningstar Mid-Cap Value category, over the year-to-date, one- and fifteen-year periods but that it outperformed the category over the three-, five- and ten-year periods. The Trustees noted that the Mid Cap Fund changed its investment strategy from Large Cap Value to Mid Cap Value on March 11, 2011 and thus is approaching the ten-year anniversary of that change. The Trustees also noted that the Funds performed comparably to DIA’s separately managed accounts that have similar investment strategies, considering differences in fees and methods of calculating performance. The Trustees considered the Funds’ performance to be satisfactory. |
| (iii) | Fee Rate and Profitability. The Trustees reviewed fee and expense comparisons for funds with similar strategies and funds in the respective Morningstar category, all of similar size to the respective Funds. The comparisons indicated that the Small Cap Fund’s gross management fee and net expense ratio are slightly higher than the averages for the groups of funds in the comparison. The comparisons indicated that the Mid Cap Fund’s gross management fee and net expense ratio are also slightly higher than the averages for the groups of funds in the comparison. The Trustees considered that both Funds have net assets that are on the low side of the comparison groups. The Trustees discussed and considered both the management fee and the sub-advisory fee and noted that that the management fee for both Funds is lower than the highest management fee in a sliding fee scale for DIA’s separately managed accounts. |
| MANAGEMENT AGREEMENT RENEWALS (Unaudited) – (continued) |
The Trustees also considered profitability analyses prepared by DIA and DCM for their management of each Fund, which indicated that, before the deduction of marketing expenses, DIA is earning a profit as a result of managing the Small Cap Fund but is not earning a profit as a result of managing the Mid Cap Fund. The analyses indicated that after deduction of marketing expenses DIA is not earning a profit as a result of managing either Fund. The Trustees considered that DCM is earning a profit both before and after deduction of marketing expenses as a result of managing the Small Cap Fund and that DCM is earning a profit before deduction of marketing expenses as a result of managing the Mid Cap Fund, but is not earning a profit after deduction of marketing expenses for the Mid Cap Fund. The Trustees determined that the profits for DIA and DCM were not excessive, based in part on their review of expense comparisons in the Broadridge 15(c) report prepared for the Board.
The Trustees also considered other potential benefits that DIA or DCM may receive in connection with its management of the Funds, including third-party research obtained by soft dollars, which may be used to benefit the Funds along with DIA’s and DCM’s other advisory clients. After considering the above information, the Trustees concluded that the current management fee and sub-advisory fee for each Fund represent reasonable compensation in light of the nature and quality of DIA’s and DCM’s respective services to the Fund, the fees paid by competitive mutual funds, and the profitability of DIA’s and DCM’s services to the Fund.
| (iv) | Economies of Scale. In determining the reasonableness of the management fee and sub-advisory fee for each Fund, the Trustees also considered the extent to which DIA and DCM will realize economies of scale as such Fund grows larger. The Trustees determined that, in light of the size of the Funds and DIA’s and DCM’s levels of profitability in managing the Funds, it does not appear that DIA or DCM is realizing benefits from economies of scale in managing the Funds to such an extent that breakpoints should be implemented at this time. |
PRIVACY NOTICE
Rev. March 2021
| FACTS | WHAT DO DEAN FUNDS (THE “FUNDS”) DO WITH YOUR PERSONAL INFORMATION? |
| Why? | Financial companies choose how they share your personal information. Federal law gives consumers the right to limit some but not all sharing. Federal law also requires us to tell you how we collect, share, and protect your personal information. Please read this notice carefully to understand what we do. |
| What? | The types of personal information we collect and share depend on the product or service you have with us. This information can include: ● Social Security number ● account balances and account transactions ● transaction or loss history and purchase history ● checking account information and wire transfer instructions When you are no longer our customer, we continue to share your information as described in this notice. |
| How? | All financial companies need to share customers’ personal information to run their everyday business. In the section below, we list the reasons financial companies can share their customers’ personal information; the reasons the Funds chooses to share; and whether you can limit this sharing. |
| Reasons we can share your personal information | Do the Funds share? |
For our everyday business purposes— such as to process your transactions, maintain your account(s), respond to court orders and legal investigations, or report to credit bureaus | Yes |
For our marketing purposes— to offer our products and services to you | No |
| For joint marketing with other financial companies | No |
For our affiliates’ everyday business purposes— information about your transactions and experiences | No |
For our affiliates’ everyday business purposes— information about your creditworthiness | No |
| For nonaffiliates to market to you | No |
| Questions? | Call (888) 899-8343 |
| Who we are |
| Who is providing this notice? | Dean Funds Ultimus Fund Distributors, LLC (Distributor) Ultimus Fund Solutions, LLC (Administrator) |
| What we do |
| How do the Funds protect my personal information? | To protect your personal information from unauthorized access and use, we use security measures that comply with federal law. These measures include computer safeguards and secured files and buildings. Our service providers are held accountable for adhering to strict policies and procedures to prevent any misuse of your nonpublic personal information. |
| How do the Funds collect my personal information? | We collect your personal information, for example, when you ● open an account or deposit money ● buy securities from us or sell securities to us ● make deposits or withdrawals from your account or provide account information ● give us your account information ● make a wire transfer ● tell us who receives the money ● tell us where to send the money ● show your government-issued ID ● show your driver’s license |
| Why can’t I limit all sharing? | Federal law gives you the right to limit only ● sharing for affiliates’ everyday business purposes — information about your creditworthiness ● affiliates from using your information to market to you ● sharing for nonaffiliates to market to you State laws and individual companies may give you additional rights to limit sharing. |
| Definitions |
| Affiliates | Companies related by common ownership or control. They can be financial and nonfinancial companies. ● Dean Investment Associates, LLC, the investment adviser to the Funds, could be deemed to be an affiliate. |
| Nonaffiliates | Companies not related by common ownership or control. They can be financial and nonfinancial companies. ● The Funds do not share your personal information with nonaffiliates so they can market to you |
| Joint marketing | A formal agreement between nonaffiliated financial companies that together market financial products or services to you. ● The Funds don’t jointly market. |
This page intentionally left blank.
| OTHER INFORMATION (Unaudited) |
The Funds’ Statement of Additional Information (“SAI”) includes additional information about the Trustees and is available without charge, upon request. You may call toll-free at (888) 899-8343 to request a copy of the SAI or to make shareholder inquiries.
A description of the policies and procedures that the Funds use to determine how to vote proxies relating to portfolio securities and information regarding how each Fund voted those proxies during the most recent twelve month period ended June 30, are available (1) without charge upon request by calling the Funds at (888) 899-8343 and (2) in Fund documents filed with the Securities and Exchange Commission (“SEC”) on the SEC’s website at www.sec.gov.
TRUSTEES
Kenneth G.Y. Grant, Chairman
David R. Carson
Daniel J. Condon
Gary E. Hippenstiel
Stephen A. Little
Ronald C. Tritschler OFFICERS
David R. Carson, President
Martin R. Dean, Vice President / Chief
Compliance Officer
Zachary P. Richmond,
Treasurer and Chief Financial Officer
Lynn E. Wood, Assistant Chief
Compliance Officer INVESTMENT ADVISER
Dean Investment Associates LLC
3500 Pentagon Blvd., Suite 200
Beavercreek, Ohio. 45431 DISTRIBUTOR
Ultimus Fund Distributors, LLC
225 Pictoria Drive, Suite 450
Cincinnati, OH 45246 | INDEPENDENT REGISTERED
PUBLIC ACCOUNTING FIRM
Cohen & Company, Ltd.
151 N Franklin Street, Suite 575
Chicago, IL 60606 LEGAL COUNSEL
Thompson Hine LLP
312 Walnut Street, 20th Floor
Cincinnati, OH 45202 CUSTODIAN
Huntington National Bank
41 South High Street
Columbus, OH 43215 ADMINISTRATOR, TRANSFER
AGENT AND FUND ACCOUNTANT
Ultimus Fund Solutions, LLC
225 Pictoria Drive, Suite 450
Cincinnati, OH 45246 |
This report is intended only for the information of shareholders or those who have received the Fund’s prospectus which contains information about the Fund’s management fee and expenses. Please read the prospectus carefully before investing.
Distributed by Ultimus Fund Distributors, LLC
Member FINRA/SIPC
Dean-AR-21
Item 2. Code of Ethics.
As of the end of the period covered by this report, the registrant has adopted a code of ethics that applies to the registrant’s principal executive officer, principal financial officer, principal accounting officer or controller, or persons performing similar functions, regardless of whether these individuals are employed by the registrant or a third party. Pursuant to Item 12(a)(1), a copy of registrant’s code of ethics is filed as an exhibit to this Form N-CSR. During the period covered by this report, the code of ethics has not been amended, and the registrant has not granted any waivers, including implicit waivers, from the provisions of the code of ethics.
Item 3. Audit Committee Financial Expert.
(a) The registrant’s board of trustees has determined that the registrant does not have an audit committee financial expert. The committee members and the full Board considered a possibility of adding a member that would qualify as an expert. The audit committee determined that, although none of its members meet the technical definition of an audit committee expert, the committee has sufficient financial expertise to adequately perform its duties under the Audit Committee Charter without the addition of a qualified expert.
Item 4. Principal Accountant Fees and Services.
The Dean Funds: FY 2021 $26,600
FY 2020 $26,600
The Absolute Core Strategy ETF FY 2021 $14,300
FY 2020 $14,300
The Dean Funds: FY 2021 $0
FY 2020 $0
The Absolute Core Strategy ETF FY 2021 $0
FY 2020 $0
The Dean Funds: FY 2021 $6,600
FY 2020 $6,600
The Absolute Core Strategy ETF FY 2021 $3,300
FY 2020 $3,300
Nature of the fees: Preparation of the 1120 RIC and Excise review
The Dean Funds: FY 2021 $0
FY 2020 $0
The Absolute Core Strategy ETF FY 2021 $0
FY 2020 $0
| (e) | (1) Audit Committee’s Pre-Approval Policies |
The Audit Committee Charter requires the Audit Committee to be responsible for the selection, retention or termination of auditors and, in connection therewith, to (i) evaluate the proposed fees and other compensation, if any, to be paid to the auditors, (ii) evaluate the independence of the auditors, (iii) pre-approve all audit services and, when appropriate, any non-audit services provided by the independent auditors to the Trust, (iv) pre-approve, when appropriate, any non-audit services provided by the independent auditors to the Trust's investment adviser, or any entity controlling, controlled by, or under common control with the investment adviser and that provides ongoing services to the Trust if the engagement relates directly to the operations and financial reporting of the Trust, and (v) receive the auditors’ specific representations as to their independence;
(2) Percentages of Services Approved by the Audit Committee
Audit-Related Fees: 0%
Tax Fees: 0%
All Other Fees: 0%
(f) During audit of registrant's financial statements for the most recent fiscal year, less than 50 percent of the hours expended on the principal accountant's engagement were attributed to work performed by persons other than the principal accountant's full-time, permanent employees.
(g) The aggregate non-audit fees billed by the registrant's accountant for services rendered to the registrant, and rendered to the registrant's investment adviser (not including any sub-adviser whose role is primarily portfolio management and is subcontracted with or overseen by another investment adviser), and any entity controlling, controlled by, or under common control with the adviser that provides ongoing services to the registrant:
Registrant Adviser
The Dean Funds:
FY 2021 $ 0 $ 0
FY 2020 $ 0 $ 0
The Absolute Core Strategy ETF
FY 2021 $ 0 $ 0
FY 2020 $ 0 $ 0
(h) Not applicable. The auditor performed no services for the registrant’s investment adviser or any entity controlling, controlled by, or under common control with the investment adviser that provides ongoing services to the registrant.
Item 5. Audit Committee of Listed Companies. NOT APPLICABLE – applies to listed companies only
Item 6. Schedule of Investments. Schedule filed with Item 1.
Item 7. Disclosure of Proxy Voting Policies and Procedures for Closed-End Management Investment Companies. NOT APPLICABLE – applies to closed-end funds only
Item 8. Portfolio Managers of Closed-End Investment Companies. NOT APPLICABLE – applies to closed-end funds only
Item 9. Purchases of Equity Securities by Closed-End Management Investment Company and Affiliated Purchasers. NOT APPLICABLE – applies to closed-end funds only
Item 10. Submission of Matters to a Vote of Security Holders.
The registrant has not adopted procedures by which shareholders may recommend nominees to the registrant’s board of trustees.
Item 11. Controls and Procedures.
(a) Based on their evaluation of the registrant’s disclosure controls and procedures (as defined in Rule 30a-3(c) under the Investment Company Act of 1940, as amended (the “Act”)) as of a date within 90 days of the filing date of this report, the registrant’s principal executive officer and principal financial officer have concluded that such disclosure controls and procedures are reasonably designed and are operating effectively to ensure that material information relating to the registrant is made known to them by others within those entities, particularly during the period in which this report is being prepared, and that the information required in filings on Form N-CSR is recorded, processed, summarized, and reported on a timely basis.
(b) There were no significant changes in the registrant’s internal control over financial reporting that occurred during the registrant’s second fiscal quarter of the period covered by this report that have materially affected, or are reasonably likely to materially affect, the registrant’s internal control over financial reporting.
Item 12. Disclosure of Securities Lending Activities for Closed-End Investment Companies.
Not Applicable.
Item 13. Exhibits.
(a) (1) Code is filed herewith
(3) Not Applicable
SIGNATURES
Pursuant to the requirements of the Securities Exchange Act of 1934 and the Investment Company Act of 1940, the registrant has duly caused this report to be signed on its behalf by the undersigned, thereunto duly authorized.
(Registrant) Unified Series Trust
By /s/ David R. Carson
David R. Carson, President
Date 5/27/2021
Pursuant to the requirements of the Securities Exchange Act of 1934 and the Investment Company Act of 1940, this report has been signed below by the following persons on behalf of the registrant and in the capacities and on the dates indicated.
By /s/ David R. Carson
David R. Carson, President
Date 5/27/2021
By /s/ Zachary P. Richmond
Zachary P. Richmond, Treasurer
Date 5/27/2021