united states
securities and exchange commission
washington, d.c. 20549
form n-csr
certified shareholder report of registered management
investment companies
Investment Company Act file number 811-21237
Unified Series Trust
(Exact name of registrant as specified in charter)
225 Pictoria Drive, Suite 450
Cincinnati, OH 45246
(Address of principal executive offices)
(Zip code)
Zachary P. Richmond
Ultimus Fund Solutions, LLC
225 Pictoria Drive. Suite 450
Cincinnati, OH 45246
(Name and address of agent for service)
Registrant's telephone number, including area code: 513-587-3400
Date of fiscal year end: 08/31
Date of reporting period: 08/31/21
Form N-CSR is to be used by management investment companies to file reports with the Commission not later than 10 days after the transmission to stockholders of any report that is required to be transmitted to stockholders under Rule 30e-1 under the Investment Company Act of 1940 (17 CFR 270.30e-1). The Commission may use the information provided on Form N-CSR in its regulatory, disclosure review, inspection and policymaking roles.
A registrant is required to disclose the information specified by Form N-CSR, and the Commission will make this information public. A registrant is not required to respond to the collection of information contained in Form N-CSR unless the Form displays a currently valid Office of Management and Budget ("OMB") control number. Please direct comments concerning the accuracy of the information collection burden estimate and any suggestions for reducing the burden to Secretary, Securities and Exchange Commission, 450 Fifth Street, NW, Washington, DC 20549-0609. The OMB has reviewed this collection of information under the clearance requirements of 44 U.S.C. § 3507.
Item 1. Reports to Stockholders.
| (a) | PRINTER: Insert the Tactical and FIIG Retirement, FIIG Large Cap, FIIG Small Cap, and FIIG All Foreign Equity Funds 8/31/21 annual reports here. |
| |
| |
| Tactical Multi-Purpose Fund |
| |
| |
| |
| |
| |
| |
| |
| |
| |
| Annual Report |
| |
| |
| August 31, 2021 |
| |
| |
| |
| |
| |
| Fund Adviser: |
| |
| |
| Fisher Asset Management, LLC |
| |
| 5525 NW Fisher Creek Drive |
| Camas, Washington 98607 |
| (800) 550-1071 |
| |
| |
| |
| |
| |
| |
| |
| |
| |
| |
| |
| |
| |
| |
| |
| |
| |
| |
| |
| |
| |
| |
| |
| Tactical Multi-Purpose Fund |
| Management’s Discussion of Fund Performance (Unaudited) |
| |
Dear Shareholder:
Market Commentary and Outlook
Global stocks rose +34.4% in the fiscal year ended August 31, 2021, continuing strong returns since the March 2020 bottom. Equity markets rose as COVID-19 lockdowns and restrictions loosened, vaccines were developed and distributed, and monetary and fiscal policy remained accommodative. The recovery wasn’t perfectly smooth. The path ahead won’t be, either. In our view, there is little reason stocks shouldn’t do well from here—finishing 2021 strong.
We expect recent jumps in economic growth and inflation to prove temporary. Interestingly, the consensus view now seems more in line with ours, which is normally concerning. But the facts and logic supporting our view still hold.
Specifically, pundits now cite falling lumber prices and long-term interest rates as signs inflation pressures are temporary. They also note the base effect from last year’s pandemic-induced deflation in April and May. These are correct observations, if incomplete. One, spiking resource prices due to supply shortages don’t represent lasting inflation. We see this more as a false fear resolving and people realizing what the market already knew. Two, inflation is a monetary phenomenon. While broad measures of money supply soared, most of the components aren’t actually money, i.e., mediums of exchange. Note, we aren’t arguing there is no inflation. Just that there is a huge difference between the hot, 1970s-style inflation many fear and the slow, pre-pandemic inflation rates we expect.
Pundits are also cooling on infrastructure spending as stimulus, noting the slow rollout. Instead of overheating and a new Roaring Twenties, many now anticipate slow growth. We largely agree. After a temporary pop tied to reopening, we have long believed pre-pandemic slow growth was likely to return. “Stimulus” was never likely to stimulate, considering shovel-ready infrastructure projects are largely a myth and households spent only a portion of their COVID-19 relief money. Most measures proposed now aren’t even stimulus—just normal government spending called “stimulus” for marketing purposes. Regardless, government spending can aid growth when the conditions are right, but that isn’t now. Most economic data are near or even above pre-pandemic levels now. The notion the economy needs support from here strains credulity.
While some legislation has passed and other ideas could come to fruition, overall, far less should squeak through than some hope and others fear. Gridlock is blocking some ideas and diluting others. Tax hikes have already fizzled. The G7’s vaunted global minimum corporate tax rate agreement seems set to do the same. In addition, we are three months away from the traditional start of midterm campaigning. Politicians are already shifting gears. The rhetoric around a bipartisan infrastructure deal looks more like campaign talk than serious progress on legislation. Moreover, markets are familiar with all this. If major legislative disruption were likely, stocks would show it. However, they are looking through the noise and notching new highs. That is telling.
Volatility has been low all year, despite pundits latching onto every wiggle as something huge. It wouldn’t surprise us if actual volatility picked up, as that is part and parcel of bull markets. A correction is also possible, for any or no reason. But volatility is the price for stocks’ high longer-term returns.
Performance Attribution
The Tactical Multi-Purpose Fund (the “Fund”) seeks positive total returns over the long-term regardless of market conditions in the U.S. and foreign equity markets. The Fund is designed to be used by the Adviser to facilitate moving groups of clients into and out of defensive and special situation investments efficiently, based on the Adviser’s perceptions of market risks and opportunities.
During the fiscal year ended August 31, 2021, the Adviser did not take a defensive position; therefore the Fund was limited in size, with its assets invested mostly in T-Bills and cash equivalents. The Fund returned -0.91% during the fiscal year ended August 31, 2021. During the same period, the Fund’s primary benchmark, the ICE BofA ML 3-month U.S. Treasury Bill Index returned 0.08%.
The Fund’s underperformance is reflective of its modest investment in T-Bills at the beginning of the period and cash equivalents for the remainder of the period, which generated minimal interest. Underperformance as compared
| Tactical Multi-Purpose Fund |
| Management’s Discussion of Fund Performance (Unaudited) (continued) |
| |
to the index is also in part due to the Fund’s 1.00% expense ratio (the performance of the index does not reflect the deduction of expenses). Due to the size of the investment, the Fund maintained a sizeable portion of the investments in cash equivalents to meet expense obligations. However, T-Bills were purchased at the beginning of the period with a portion of the Fund to opportunistically benefit from changes by the Fed to short rates. It is anticipated that similar returns will continue until the Adviser utilizes the Fund for defensive purposes or prevailing short-term interest rates meaningfully change.
| Tactical Multi-Purpose Fund |
| Investment Results (Unaudited) |
Average Annual Total Returns(a)
(for the periods ended August 31, 2021) |
| | | | |
| | | | | | | Since | |
| | | | | | | Inception | |
| | | One Year | | Three Year | | (3/30/17) | |
| Tactical Multi-Purpose Fund | | (0.91)% | | (0.30)% | | (0.36)% | |
| ICE BofA ML 3-Month U.S. Treasury Bill Index | | 0.08% | | 1.23% | | 1.27% | |
| | | | | | | | |
| Total annual operating expenses, as disclosed in the Tactical Multi-Purpose Fund (the “Fund”) prospectus dated December 29, 2020, were 596.00% of average daily net assets (1.00% after fee waivers/expense reimbursements). Fisher Asset Management, LLC, d/b/a Fisher Investments (the “Adviser”) is contractually obligated to limit the Fund’s total annual operating expenses to 1.00% of the Fund’s average daily net assets through December 31, 2025 (excluding portfolio transaction and other investment-related costs (including brokerage fees and commissions); taxes; borrowing costs (such as interest and dividend expenses on securities sold short); acquired fund fees and expenses; fees and expenses associated with investments in other collective investment vehicles or derivative instruments (including for example option and swap fees and expenses); any amounts payable pursuant to a distribution or service plan adopted in accordance with Rule 12b-1 under the Investment Company Act of 1940; any administrative and/or shareholder servicing fees payable to financial intermediaries; expenses incurred in connection with any merger or reorganization; extraordinary expenses (such as litigation expenses, indemnification of Trust officers and Trustees and contractual indemnification of Fund service providers, and other expenses that the Trustees agree have not been incurred in the ordinary course of the Fund’s business). This expense cap may not be terminated prior to this date except by the Board of Trustees. Each expense payment by the Adviser (but not management fee waiver) is subject to recoupment by the Adviser from the Fund in the three years following the date the particular expense payment occurred, but only if such recoupment can be achieved without exceeding the annual expense limitation in effect at the time of the expense payment and any expense limitation in effect at the time of the recoupment. Additional information pertaining to the Fund’s expense ratios as of August 31, 2021 can be found in the financial highlights. |
The performance quoted represents past performance, which does not guarantee future results. The investment return and principal value of an investment will fluctuate so that an investor’s shares, when redeemed, may be worth more or less than their original cost. The returns shown do not reflect deduction of taxes that a shareholder would pay on Fund distributions or the redemption of Fund shares. Current performance of the Fund may be lower or higher than the performance quoted. The Fund’s investment objectives, risks, charges and expenses must be considered carefully before investing. Performance data current to the most recent month end may be obtained by calling (800) 550-1071.
| (a) | Return figures reflect any change in price per share and assume the reinvestment of all distributions. The Fund’s returns reflect any fee reductions during the applicable periods. If such fee reductions had not occurred, the quoted performance would have been lower. |
| (b) | The ICE BofA ML 3-Month U.S. Treasury Bill Index (the “Index”) is comprised of a single issue purchased at the beginning of the month and held for a full month. Each month the Index is rebalanced and the issue selected is the outstanding Treasury Bill that matures closest to, but not beyond 3 months from the rebalancing date. The Index returns assume reinvestment of all distributions and do not reflect the deduction of taxes and fees. Individuals cannot invest directly in the Index; however, an individual may invest in exchange traded funds or other investment vehicles that attempt to track the performance of a benchmark index. |
You should consider the Fund’s investment objectives, risks, charges and expenses carefully before you invest. The Fund’s prospectus contains important information about the Fund’s investment objectives, potential risks, management fees, charges and expenses, and other information and should be read carefully before investing. You may obtain a current copy of the Fund’s prospectus or performance data current to the most recent month by calling (800) 550-1071.
The Fund is distributed by Ultimus Fund Distributors, LLC, member FINRA/SIPC.
| Tactical Multi-Purpose Fund |
| Investment Results (Unaudited) (continued) |
| |
Comparison of the Growth of a $10,000 Investment in the Tactical Multi-Purpose Fund and the
ICE BofA ML 3-Month U.S. Treasury Bill Index (Unaudited)
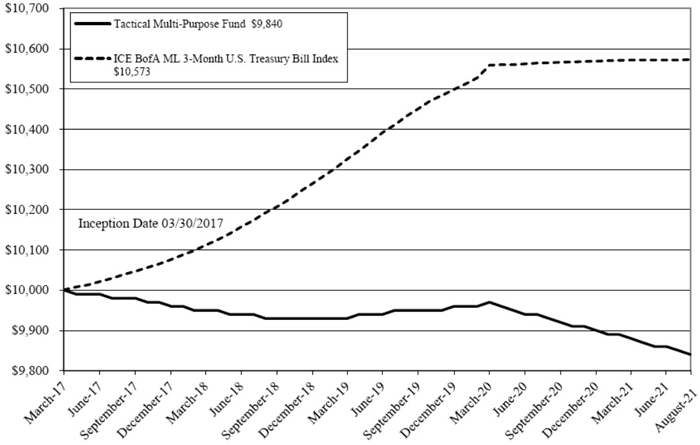
This graph shows the value of a hypothetical initial investment of $10,000 made on March 30, 2017 (commencement of operations) and held through August 31, 2021. THE FUND’S RETURN REPRESENTS PAST PERFORMANCE AND DOES NOT GUARANTEE FUTURE RESULTS. The ICE BofA ML 3-Month U.S. Treasury Bill Index is an unmanaged index of Treasury securities that assumes reinvestment of all income. The returns shown do not reflect deduction of taxes that a shareholder would pay on Fund distributions or the redemption of Fund shares. Investment returns and principal values will fluctuate so that your shares, when redeemed, may be worth more or less than their original purchase price.
Current performance may be lower or higher than the performance data quoted. For more information on the Fund, and to obtain performance data current to the most recent month-end, or to request a prospectus, please call (800) 550-1071. You should carefully consider the investment objectives, potential risks, management fees, and charges and expenses of the Fund before investing. The Fund’s prospectus contains this and other information about the Fund, and should be read carefully before investing.
The Fund is distributed by Ultimus Fund Distributors, LLC, member FINRA/SIPC.
| Tactical Multi-Purpose Fund |
| Fund Holdings (Unaudited) |
| |
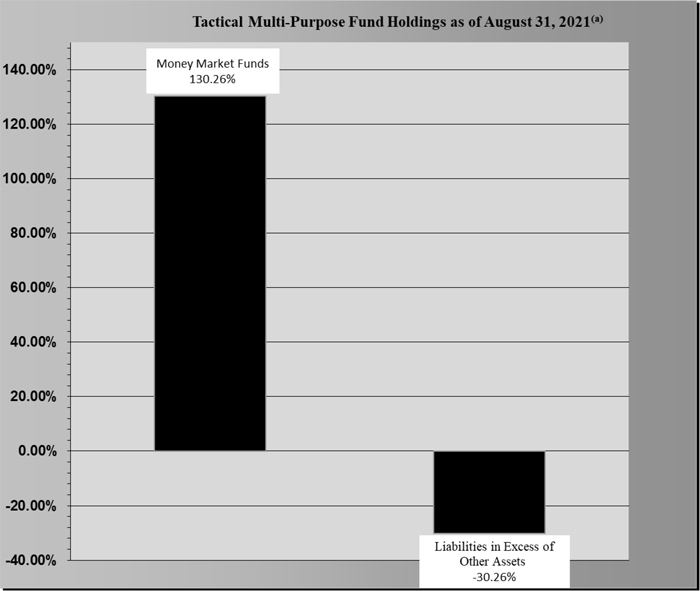
| (a) | As a percentage of net assets. |
The investment objective of the Fund is to seek positive total returns over the long-term regardless of market conditions in the U.S. and foreign equity markets.
Availability of Portfolio Schedule (Unaudited)
The Fund files its complete schedule of portfolio holdings with the Securities and Exchange Commission (the “SEC”) for the first and third quarters of each fiscal year as an exhibit to its reports on Form N-PORT. The Fund’s Form N-PORT reports are available on the SEC’s website at http://www.sec.gov.
| Tactical Multi-Purpose Fund |
| Schedule of Investments |
| August 31, 2021 |
| | | Shares | | | Fair Value | |
| MONEY MARKET FUNDS - 130.26% | | | | | | |
| | | | | | | |
| First American Government Obligations Fund, Class X, 0.03%(a) | | | 32,057 | | | $ | 32,057 | |
| | | | | | | | | |
| Total Money Market Funds (Cost $32,057) | | | | | | | 32,057 | |
| | | | | | | | | |
| Total Investments — 130.26% (Cost $32,057) | | | | | | | 32,057 | |
| | | | | | | | | |
| Liabilities in Excess of Other Assets — (30.26)% | | | | | | | (7,447 | ) |
| | | | | | | | | |
| NET ASSETS — 100.00% | | | | | | $ | 24,610 | |
| | | | | | | | | |
| (a) | Rate disclosed is the seven day effective yield as of August 31, 2021. |
See accompanying notes which are an integral part of these financial statements.
| Tactical Multi-Purpose Fund |
| Statement of Assets and Liabilities |
| August 31, 2021 |
| Assets | | | | |
| Investments in securities at fair value (cost $32,057) | | $ | 32,057 | |
| Interest receivable | | | 1 | |
| Receivable from Adviser | | | 11,854 | |
| Prepaid expenses | | | 3,799 | |
| Total Assets | | | 47,711 | |
| Liabilities | | | | |
| Payable to affiliates | | | 7,253 | |
| Payable to auditors | | | 10,800 | |
| Other accrued expenses | | | 5,048 | |
| Total Liabilities | | | 23,101 | |
| Net Assets | | $ | 24,610 | |
| Net Assets consist of: | | | | |
| Paid-in capital | | | 24,761 | |
| Accumulated deficit | | | (151 | ) |
| Net Assets | | $ | 24,610 | |
| Shares outstanding (unlimited number of shares authorized, no par value) | | | 2,501 | |
| Net asset value, offering and redemption price per share | | $ | 9.84 | |
| | | | | |
See accompanying notes which are an integral part of these financial statements.
| Tactical Multi-Purpose Fund |
| Statement of Operations |
| For the year ended August 31, 2021 |
| Investment Income | | | | |
| Interest income | | $ | 23 | |
| Total investment income | | | 23 | |
| | | | | |
| Expenses | | | | |
| Fund accounting | | | 30,003 | |
| Administration | | | 30,000 | |
| Legal | | | 21,355 | |
| Trustee | | | 13,983 | |
| Transfer agent | | | 12,000 | |
| Compliance services | | | 12,000 | |
| Audit and tax | | | 11,760 | |
| Custodian | | | 4,583 | |
| Report printing | | | 1,652 | |
| Registration | | | 371 | |
| Adviser | | | 62 | |
| Pricing | | | 49 | |
| Miscellaneous | | | 19,237 | |
| Total expenses | | | 157,055 | |
| Fees waived and expenses reimbursed by Adviser | | | (156,061 | ) |
| Fees reduced by Administrator | | | (747 | ) |
| Net operating expenses | | | 247 | |
| Net investment loss | | | (224 | ) |
| | | | | |
| Net decrease in net assets resulting from operations | | $ | (224 | ) |
| | | | | |
See accompanying notes which are an integral part of these financial statements.
| Tactical Multi-Purpose Fund |
| Statements of Changes in Net Assets |
| | | For the Year | | | For the Year | |
| | | Ended August 31, | | | Ended August 31, | |
| | | 2021 | | | 2020 | |
| Decrease in Net Assets due to: | | | | | | | | |
| Operations | | | | | | | | |
| Net investment loss | | $ | (224 | ) | | $ | (49 | ) |
| Net change in unrealized depreciation of investment securities | | | — | | | | (1 | ) |
| Net decrease in net assets resulting from operations | | | (224 | ) | | | (50 | ) |
| | | | | | | | | |
| Total Decrease in Net Assets | | | (224 | ) | | | (50 | ) |
| | | | | | | | | |
| Net Assets | | | | | | | | |
| Beginning of year | | | 24,834 | | | | 24,884 | |
| End of year | | $ | 24,610 | | | $ | 24,834 | |
| | | | | | | | | |
See accompanying notes which are an integral part of these financial statements.
| Tactical Multi-Purpose Fund |
| Financial Highlights |
| |
| (For a share outstanding during each period) |
| | | For the Year | | | For the Year | | | For the Year | | | For the Year | | | For the Period | |
| | | Ended August 31, | | | Ended August 31, | | | Ended August 31, | | | Ended August 31, | | | Ended August 31, | |
| | | 2021 | | | 2020 | | | 2019 | | | 2018 | | | 2017(a) | |
| Selected Per Share Data: | | | | | | | | | | | | | | | |
| Net asset value, beginning of period | | $ | 9.93 | | | $ | 9.95 | | | $ | 9.93 | | | $ | 9.98 | | | $ | 10.00 | |
| | | | | | | | | | | | | | | | | | | | | |
| Investment operations: | | | | | | | | | | | | | | | | | | | | |
| Net investment income (loss) | | | (0.09 | ) | | | (0.02 | ) | | | 0.02 | | | | (0.05 | ) | | | (0.02 | ) |
| Net realized and unrealized gain | | | — | | | | — | (b) | | | — | (b) | | | — | | | | — | |
| Total from investment operations | | | (0.09 | ) | | | (0.02 | ) | | | 0.02 | | | | (0.05 | ) | | | (0.02 | ) |
| | | | | | | | | | | | | | | | | | | | | |
| | | | | | | | | | | | | | | | | | | | | |
| Net asset value, end of period | | $ | 9.84 | | | $ | 9.93 | | | $ | 9.95 | | | $ | 9.93 | | | $ | 9.98 | |
| | | | | | | | | | | | | | | | | | | | | |
| Total Return(c) | | | (0.91 | )% | | | (0.20 | )% | | | 0.20 | % | | | (0.50 | )% | | | (0.20 | )% (d) |
| | | | | | | | | | | | | | | | | | | | | |
| Ratios and Supplemental Data: | | | | | | | | | | | | | | | | | | | | |
| Net assets, end of period (000 omitted) | | $ | 25 | | | $ | 25 | | | $ | 25 | | | $ | 25 | | | $ | 25 | |
| Ratio of net expenses to average net assets | | | 1.00 | % | | | 1.00 | % | | | 1.00 | % | | | 1.00 | % | | | 1.00 | % (e) |
| Ratio of gross expenses to average net assets before waiver and reimbursement | | | 635.29 | % | | | 596.00 | % | | | 589.45 | % | | | 534.46 | % | | | 558.98 | % (e) |
| Ratio of net investment income (loss) to average net assets | | | (0.91 | )% | | | (0.20 | )% | | | 0.15 | % | | | (0.46 | )% | | | (0.49 | )% (e) |
| Portfolio turnover rate | | | 0 | % | | | 0 | % | | | 0 | % | | | 0 | % | | | 0 | % (d) |
| | | | | | | | | | | | | | | | | | | | | |
| (a) | For the period March 30, 2017 (commencement of operations) to August 31, 2017. |
| (b) | Rounds to less than $0.005 per share. |
| (c) | Total return represents the rate that the investor would have earned or lost on an investment in the Fund, assuming reinvestment of distributions. |
See accompanying notes which are an integral part of these financial statements.
| Tactical Multi-Purpose Fund |
| Notes to the Financial Statements |
| August 31, 2021 |
| |
NOTE 1. ORGANIZATION
Tactical Multi-Purpose Fund (the “Fund”) is registered under the Investment Company Act of 1940, as amended (“1940 Act”), as a non-diversified series of Unified Series Trust (the “Trust”) on November 14, 2016. The Trust is an open-end investment company established under the laws of Ohio by an Agreement and Declaration of Trust dated October 14, 2002 (the “Trust Agreement”). The Trust Agreement permits the Board of Trustees of the Trust (the “Board”) to issue an unlimited number of shares of beneficial interest of separate series without par value. The Fund is one of a series of funds currently authorized by the Board. The Fund commenced operations on March 30, 2017. The investment adviser to the Fund is Fisher Asset Management, LLC, d/b/a Fisher Investments (the “Adviser”). The investment objective of the Fund is to seek positive total returns over the long-term regardless of market conditions in the U.S. and foreign equity markets.
NOTE 2. SIGNIFICANT ACCOUNTING POLICIES
The Fund is an investment company and follows accounting and reporting guidance under Financial Accounting Standards Board Accounting Standards Codification (“ASC”) Topic 946, “Financial Services-Investment Companies.” The following is a summary of significant accounting policies followed by the Fund in the preparation of its financial statements. These policies are in conformity with generally accepted accounting principles in the United States of America (“GAAP”).
Estimates – The preparation of financial statements in conformity with GAAP requires management to make estimates and assumptions that affect the reported amounts of assets and liabilities and disclosure of contingent assets and liabilities at the date of the financial statements and the reported amounts of increases and decreases in net assets from operations during the reporting period. Actual results could differ from those estimates.
Federal Income Taxes – The Fund makes no provision for federal income or excise tax. The Fund has qualified and intends to qualify each year as a regulated investment company (“RIC”) under subchapter M of the Internal Revenue Code of 1986, as amended, by complying with the requirements applicable to RICs and by distributing substantially all of its taxable income. The Fund also intends to distribute sufficient net investment income and net realized capital gains, if any, so that it will not be subject to excise tax on undistributed income and gains. If the required amount of net investment income or gains is not distributed, the Fund could incur a tax expense.
As of and during the fiscal year ended August 31, 2021, the Fund did not have any liabilities for any unrecognized tax benefits. The Fund recognizes interest and penalties, if any, related to unrecognized tax benefits as income tax expense in the Statement of Operations when incurred. During the year, the Fund did not incur any interest or penalties. Management of the Fund has reviewed tax positions taken in tax years that remain subject to examination by all major tax jurisdictions, including federal (i.e., the previous three tax year ends and the interim tax period since then, as applicable) and has concluded that no provision for unrecognized tax benefits or expenses is required in these financial statements and does not expect this to change over the next twelve months.
Expenses – Expenses incurred by the Trust that do not relate to a specific fund of the Trust are allocated to the individual funds based on each fund’s relative net assets or another appropriate basis (as determined by the Board).
Security Transactions and Related Income – The Fund follows industry practice and records security transactions on the trade date for financial reporting purposes. The specific identification method is used for determining gains or losses for financial statement and income tax purposes. Dividend income is recorded on the ex-dividend date and interest income is recorded on an accrual basis.
Dividends and Distributions – The Fund intends to distribute its net investment income and net realized long-term and short-term capital gains, if any, at least annually. Dividends and distributions to shareholders, which are determined in accordance with income tax regulations, are recorded on the ex-dividend date. The treatment for financial reporting purposes of distributions made to
| Tactical Multi-Purpose Fund |
| Notes to the Financial Statements (continued) |
| August 31, 2021 |
| |
shareholders during the period from net investment income or net realized capital gains may differ from their ultimate treatment for federal income tax purposes. These differences are caused primarily by differences in the timing of the recognition of certain components of income, expense or realized capital gain for federal income tax purposes. Where such differences are permanent in nature, they are reclassified among the components of net assets based on their ultimate characterization for federal income tax purposes. Any such reclassifications will have no effect on net assets, results of operations or net asset value (“NAV”) per share of the Fund.
For the fiscal year ended August 31, 2021, the Fund made the following reclassifications to increase (decrease) the components of net assets:
| | | | Accumulated | |
| Paid-In Capital | | | Earnings (Deficit) | |
| $ | (122 | ) | | $ | 122 | |
| | | | | | | |
NOTE 3. NON-DIVERSIFICATION RISK
The Fund is non-diversified, which means it may invest a greater percentage of its assets in a limited number of issuers as compared to other mutual funds that are more broadly diversified. As a result, the Fund’s share price may be more volatile than the share price of some other mutual funds, and the poor performance of an individual holding in the Fund’s portfolio may have a significant negative impact on the Fund’s performance.
NOTE 4. SECURITIES VALUATION AND FAIR VALUE MEASUREMENTS
The Fund values its portfolio securities at fair value as of the close of regular trading on the New York Stock Exchange (“NYSE”) (normally 4:00 p.m. Eastern time) on each business day the NYSE is open for business. Fair value is defined as the price that the Fund would receive upon selling an investment in a timely transaction to an independent buyer in the principal or most advantageous market of the investment. GAAP establishes a three-tier hierarchy to maximize the use of observable market data and minimize the use of unobservable inputs and to establish classification of fair value measurements for disclosure purposes.
Inputs refer broadly to the assumptions that market participants would use in pricing the asset or liability, including assumptions about risk (the risk inherent in a particular valuation technique used to measure fair value including a pricing model and/or the risk inherent in the inputs to the valuation technique). Inputs may be observable or unobservable. Observable inputs are inputs that reflect the assumptions market participants would use in pricing the asset or liability developed based on market data obtained and available from sources independent of the reporting entity. Unobservable inputs are inputs that reflect the reporting entity’s own assumptions about the assumptions market participants would use in pricing the asset or liability developed based on the best information available in the circumstances.
Various inputs are used in determining the value of the Fund’s investments. These inputs are summarized in the three broad levels listed below.
| ● | Level 1 – unadjusted quoted prices in active markets for identical investments and/or registered investment companies where the value per share is determined and published and is the basis for current transactions for identical assets or liabilities at the valuation date |
| ● | Level 2 – other significant observable inputs (including, but not limited to, quoted prices for an identical security in an inactive market, quoted prices for similar securities, interest rates, prepayment speeds, credit risk, etc.) |
| ● | Level 3 – significant unobservable inputs (including the Fund’s own assumptions in determining fair value of investments based on the best information available) |
| Tactical Multi-Purpose Fund |
| Notes to the Financial Statements (continued) |
| August 31, 2021 |
| |
The inputs used to measure fair value may fall into different levels of the fair value hierarchy. In such cases, for disclosure purposes, the level in the fair value hierarchy which is reported is determined based on the lowest level input that is significant to the fair value measurement in its entirety.
Debt securities are valued by using the mean between the closing bid and ask prices provided by a pricing service. If the closing bid and ask prices are not readily available, the pricing service may provide a price determined by a matrix pricing method. Matrix pricing is a mathematical technique used to value fixed income securities without relying exclusively on quoted prices. Matrix pricing takes into consideration recent transactions, yield, liquidity, risk, credit quality, coupon, maturity, type of issue and any other factors or market data the pricing service deems relevant for the actual security being priced and for other securities with similar characteristics. These securities will generally be categorized as Level 2 securities. If the Adviser decides that a price provided by the pricing service does not accurately reflect the fair value of the securities or when prices are not readily available from a pricing service, securities are valued at fair value as determined by the Adviser, in conformity with guidelines adopted by and subject to review of the Board. These securities will generally be categorized as Level 3 securities.
Equity securities that are traded on any stock exchange are generally valued at the last quoted sale price on the security’s primary exchange. Lacking a last sale price, an exchange-traded security is generally valued at its last bid price. Securities traded in the NASDAQ over-the-counter market are generally valued at the NASDAQ Official Closing Price. When using market quotations and when the market is considered active, the security is classified as a Level 1 security. In the event that market quotations are not readily available or are considered unreliable due to market or other events, the Fund values its securities and other assets at fair value in accordance with policies established by and under the general supervision of the Board. Under these policies, the securities will be classified as Level 2 or 3 within the fair value hierarchy, depending on the inputs used.
Investments in mutual funds, including money market mutual funds, are generally priced at the ending NAV. These securities are categorized as Level 1 securities.
In accordance with the Trust’s valuation policies, the Adviser is required to consider all appropriate factors relevant to the value of securities for which it has determined other pricing sources are not available or reliable as described above. No single method exists for determining fair value, because fair value depends upon the circumstances of each individual case. As a general principle, the current fair value of a security being valued by the Adviser would be the amount that the Fund might reasonably expect to receive upon the current sale. Methods that are in accordance with this principle may, for example, be based on (i) a multiple of earnings; (ii) a discount from market prices of a similar freely traded security (including a derivative security or a basket of securities traded on other markets, exchanges or among dealers); or (iii) yield to maturity with respect to debt issues, or a combination of these and other methods. Fair-value pricing is permitted if, in the Adviser’s opinion, the validity of market quotations appears to be questionable based on factors such as evidence of a thin market in the security based on a small number of quotations, a significant event occurs after the close of a market but before the Fund’s NAV calculation that may affect a security’s value, or the Adviser is aware of any other data that calls into question the reliability of market quotations.
The following is a summary of the inputs used to value the Fund’s investments as of August 31, 2021:
| | | Valuation Inputs | |
| Assets | | Level 1 | | | Level 2 | | | Level 3 | | | Total | |
| Money Market Funds | | $ | 32,057 | | | $ | — | | | $ | — | | | $ | 32,057 | |
| Total | | $ | 32,057 | | | $ | — | | | $ | — | | | $ | 32,057 | |
| Tactical Multi-Purpose Fund |
| Notes to the Financial Statements (continued) |
| August 31, 2021 |
| |
The Fund did not hold any investments at the end of the reporting period for which significant unobservable inputs (Level 3) were used in determining fair value; therefore, no reconciliation of Level 3 securities is included for this reporting period. The Fund did not hold any derivative instruments during the reporting period.
NOTE 5. FEES AND OTHER TRANSACTIONS WITH AFFILIATES
The Adviser, under the terms of the management agreement (the “Agreement”) with the Trust with respect to the Fund, manages the Fund’s investments. As compensation for its management services, the Fund is obligated to pay the Adviser a fee computed and accrued daily and paid monthly at an annual rate of 0.25% of the Fund’s average daily net assets. For the fiscal year ended August 31, 2021, the Adviser earned fees of $62 from the Fund before the waiver and reimbursement described below.
The Adviser is contractually obligated to limit the Fund’s total annual operating expenses to 1.00% of the Fund’s average daily net assets through December 31, 2025 (excluding portfolio transaction and other investment-related costs (including brokerage fees and commissions); taxes; borrowing costs (such as interest and dividend expenses on securities sold short); acquired fund fees and expenses; fees and expenses associated with investments in other collective investment vehicles or derivative instruments (including for example option and swap fees and expenses); any amounts payable pursuant to a distribution or service plan adopted in accordance with Rule 12b-1 under the 1940 Act; any administrative and/or shareholder servicing fees payable to financial intermediaries; expenses incurred in connection with any merger or reorganization; extraordinary expenses (such as litigation expenses, indemnification of Trust officers and Trustees and contractual indemnification of Fund service providers); and other expenses that the Trustees agree have not been incurred in the ordinary course of the Fund’s business. This expense cap may not be terminated prior to this date except by the Board of Trustees.
Each expense payment by the Adviser (but not management fee waiver) is subject to recoupment by the Adviser from the Fund in the three years following the date the particular expense payment occurred, but only if such recoupment can be achieved without exceeding the annual expense limitation in effect at the time of the expense payment and any expense limitation in effect at the time of the recoupment. As of August 31, 2021, the Adviser may seek repayment of expense reimbursements in the amount as follow:
| Recoverable through | | | | |
| August 31, 2022 | | $ | 145,625 | |
| August 31, 2023 | | | 146,296 | |
| August 31, 2024 | | | 155,999 | |
| | | | | |
Ultimus Fund Solutions, LLC (“Ultimus”) provides administration, fund accounting and transfer agent services to the Fund. The Fund pays Ultimus fees in accordance with the agreements for such services.
The Administrator has agreed to waive fees to the extent necessary that the Fund’s total annual operating expenses (excluding taxes, borrowing costs such as interest and dividend expenses on securities sold short, brokerage commissions, acquired fund fees and expenses, shareholder servicing fees paid to financial intermediaries, extraordinary expenses and expenses outside the normal course of business) do not exceed $156,000 annually, based on a twelve-month period commencing April 1 and ending March 31 (the “Annual Period”). The waiver will accrue on a monthly basis such that the Fund’s operating expenses for any month during the Annual Period will not exceed the sum of $13,000 (the “Monthly Expense Cap”), provided that Ultimus may recoup any fees waived by Ultimus in a prior month during the Annual Period to the extent of any unused amount of the Monthly Expense Cap in the current month. The waiver will be suspended and forfeited in any month that the Adviser is not the sole shareholder of the Fund. During the fiscal year ended August 31, 2021, the total amount waived by the Administrator was $747.
| Tactical Multi-Purpose Fund |
| Notes to the Financial Statements (continued) |
| August 31, 2021 |
| |
Northern Lights Compliance Services, LLC (“NLCS”), an affiliate of Ultimus, provides a Chief Compliance Officer to the Trust, as well as related compliance services, pursuant to a consulting agreement between NLCS and the Trust. Under the terms of such agreement, NLCS receives fees from the Fund, which are approved annually by the Board. Prior to April 1, 2021, Ultimus provided certain compliance services and Buttonwood Compliance Partners provided the Chief Compliance Officer to the Trust.
Under the terms of a Distribution Agreement with the Trust, Ultimus Fund Distributors, LLC (the “Distributor”) serves as principal underwriter to the Fund. The Distributor is a wholly-owned subsidiary of Ultimus. The Distributor is compensated by the Adviser (not the Fund) for acting as principal underwriter.
Certain officers and a Trustee of the Trust are also employees of Ultimus and such persons are not paid by the Fund for serving in such capacities.
The Board supervises the business activities of the Trust. Each Trustee serves as a trustee until termination of the Trust unless the Trustee dies, resigns, retires, or is removed. The Chairman of the Board and more than 75% of the Trustees are “Independent Trustees,” which means that they are not “interested persons” as defined in the 1940 Act. Each Independent Trustee of the Trust receives annual compensation of $2,510 per fund from the Trust, except that the Chairman of the Audit Committee, the Chairman of the Governance & Nominating Committee, and the Chairman of the Pricing & Liquidity Committee each receives annual compensation of $2,960 per fund from the Trust, and the Independent Chairman of the Board receives $3,160 per fund from the Trust. Independent Trustees also receive $250 for the first hour and $200 for each additional hour for attending special meetings. Prior to January 1, 2021, these fees were $2,290 for non-chairmen and $ 2,740 for all chairmen. In addition, the Trust reimburses Independent Trustees for out-of-pocket expenses incurred in conjunction with attendance at meetings.
NOTE 6. INVESTMENT TRANSACTIONS
For the fiscal year ended August 31, 2021, there were no purchases or sales of investment securities, other than short-term investments.
NOTE 7. BENEFICIAL OWNERSHIP
The beneficial ownership, either directly or indirectly, of more than 25% of the voting securities of a fund creates a presumption of control of a fund, under Section 2(a)(9) of the 1940 Act. As of August 31, 2021, the Adviser owned 99.96% of the Fund’s outstanding shares. As a result, the Adviser may be deemed to control the Fund.
NOTE 8. FEDERAL TAX INFORMATION
At August 31, 2021, the net unrealized appreciation (depreciation) and tax cost of investments for tax purposes was as follows:
| Gross unrealized appreciation | | $ | — | |
| Gross unrealized depreciation | | | — | |
| Net unrealized appreciation on investments | | $ | — | |
| | | | | |
| Tax cost of investments | | $ | 32,057 | |
| | | | | |
At August 31, 2021, the components of accumulated earnings (deficit) on a tax basis were as follows:
| Accumulated capital and other losses | | | (151 | ) |
| Total accumulated earnings | | $ | (151 | ) |
| Tactical Multi-Purpose Fund |
| Notes to the Financial Statements (continued) |
| August 31, 2021 |
| |
For tax purposes no distributions were paid by the Fund for the fiscal years 2020 and 2021.
Certain capital losses and specified gains realized after October 31, and net investment losses realized after December 31 of the Fund’s fiscal year may be deferred and treated as occurring on the first business day of the Fund’s following taxable year. For the tax period ended August 31, 2021, the Fund deferred qualified late year ordinary losses in the amount of $151.
NOTE 9. COMMITMENTS AND CONTINGENCIES
The Trust indemnifies its officers and Trustees for certain liabilities that may arise from their performance of their duties to the Trust or the Fund. Additionally, in the normal course of business, the Trust enters into contracts that contain a variety of representations and warranties which provide general indemnifications. The Trust’s maximum exposure under these arrangements is unknown, as this would involve future claims that may be made against the Trust that have not yet occurred.
NOTE 10. SUBSEQUENT EVENTS
Management of the Fund has evaluated the need for disclosures and/or adjustments resulting from subsequent events through the date at which these financial statements were issued. Based upon this evaluation, management has determined there were no items requiring adjustment of the financial statements or additional disclosure.
Report of Independent Registered Public Accounting Firm
To the Shareholders of Tactical Multi-Purpose Fund and
Board of Trustees of Unified Series Trust
Opinion on the Financial Statements
We have audited the accompanying statement of assets and liabilities, including the schedule of investments, of Tactical Multi-Purpose Fund (the “Fund”), a series of Unified Series Trust, as of August 31, 2021, the related statement of operations for the year then ended, the statements of changes in net assets for each of the two years in the period then ended, the related notes, and the financial highlights for each of the five periods in the period then ended (collectively referred to as the “financial statements”). In our opinion, the financial statements present fairly, in all material respects, the financial position of the Fund as of August 31, 2021, the results of its operations for the year then ended, the changes in net assets for each of the two years in the period then ended, and the financial highlights for each of the five periods in the period then ended, in conformity with accounting principles generally accepted in the United States of America.
Basis for Opinion
These financial statements are the responsibility of the Fund’s management. Our responsibility is to express an opinion on the Fund’s financial statements based on our audits. We are a public accounting firm registered with the Public Company Accounting Oversight Board (United States) (“PCAOB”) and are required to be independent with respect to the Fund in accordance with the U.S. federal securities laws and the applicable rules and regulations of the Securities and Exchange Commission and the PCAOB.
We conducted our audits in accordance with the standards of the PCAOB. Those standards require that we plan and perform the audit to obtain reasonable assurance about whether the financial statements are free of material misstatement whether due to error or fraud.
Our audits included performing procedures to assess the risks of material misstatement of the financial statements, whether due to error or fraud, and performing procedures that respond to those risks. Such procedures included examining, on a test basis, evidence regarding the amounts and disclosures in the financial statements. Our procedures included confirmation of securities owned as of August 31, 2021, by correspondence with the custodian. Our audits also included evaluating the accounting principles used and significant estimates made by management, as well as evaluating the overall presentation of the financial statements. We believe that our audits provide a reasonable basis for our opinion.
We have served as the auditor of one or more investment companies advised by Fisher Asset Management, LLC since 2017.
COHEN & COMPANY, LTD.
Chicago, Illinois
October 28, 2021
| Shareholder Voting Results (Unaudited) |
| |
Upon written consent of a majority of shareholders of the Fund, effective August 16, 2021, the following resolutions were adopted and approved:
| 1) | The amended and restated Commodities investment restriction for the Fund, as shown below, replaces and supersedes in its entirety the original Commodities investment restriction. |
Commodities. The Fund will not directly purchase or sell commodities, but may acquire exposure as a result of ownership of securities or through derivative instruments linked to commodities. This limitation does not preclude the Fund from purchasing or selling options or futures contracts, including commodities futures contracts, from investing in securities or other instruments backed by commodities or from investing in companies which are engaged in a commodities business or have a significant portion of their assets in commodities.
| 2) | Pursuant to Section 13(a)(1) of the 1940 Act, the Fund’s subclassification is changed from a diversified company to a non-diversified company. |
| 3) | The officers of the Trust are authorized and instructed to amend the Fund’s registration statement, as necessary, to reflect approved changes. |
| Summary of Fund Expenses (Unaudited) |
| |
As a shareholder of the Fund, you incur two types of costs: (1) transaction and (2) ongoing costs, including management fees and other Fund expenses. These examples are intended to help you understand your ongoing costs (in dollars) of investing in the Fund and to compare these costs with the ongoing costs of investing in other mutual funds. The example is based on an investment of $1,000 invested at the beginning of the period and held for the entire period from March 1, 2021 through August 31, 2021.
Actual Expenses
The first line of the table below provides information about actual account values and actual expenses. You may use the information in this line, together with the amount you invested, to estimate the expenses that you paid over the period. Simply divide your account value by $ 1,000 (for example, an $8,600 account value divided by $1,000 = 8.6), then multiply the result by the number in the first line under the heading entitled “Expenses Paid During the Period” to estimate the expenses you paid on your account during this period.
Hypothetical Example for Comparison Purposes
The second line of the table below provides information about hypothetical account values and hypothetical expenses based on the Fund’s actual expense ratio and an assumed rate of return of 5% per year before expenses, which is not the Fund’s actual return. The hypothetical account values and expenses may not be used to estimate the actual ending account balance or expenses you paid for the period. You may use this information to compare the ongoing costs of investing in the Fund and other funds. To do so, compare this 5% hypothetical example with the 5% hypothetical examples that appear in the shareholder reports of other funds.
| | | Beginning | | | Ending | | | | | | |
| | | Account | | | Account | | | Expenses | | | |
| | | Value | | | Value | | | Paid | | | Annualized |
| | | March 1, | | | August 31, | | | During the | | | Expense |
| | | 2021 | | | 2021 | | | Period(a) | | | Ratio |
| Actual | | $ | 1,000.00 | | | $ | 994.90 | | | $ | 5.02 | | | 1.00% |
| Hypothetical(b) | | $ | 1,000.00 | | | $ | 1,020.17 | | | $ | 5.08 | | | 1.00% |
| | | | | | | | | | | | | | | |
| (a) | Expenses are equal to the Fund’s annualized expense ratios, multiplied by the average account value over the period, multiplied by 184/365 (to reflect the one-half year period). |
| (b) | Hypothetical assumes 5% annual return before expenses. |
| Trustees and Officers (Unaudited) |
| |
GENERAL QUALIFICATIONS. The Board supervises the business activities of the Trust. Each Trustee serves as a trustee until termination of the Trust unless the Trustee dies, resigns, retires, or is removed. The Chairman of the Board and more than 75% of the Trustees are “Independent Trustees,” which means that they are not “interested persons” (as defined in the 1940 Act) of the Trust or any adviser, sub-adviser or distributor of the Trust.
The following table provides information regarding the Independent Trustees.
Name, Address*, (Year of Birth),
Position with Trust**,
Term of Position with Trust | Principal Occupation During Past 5 Years and Other
Directorships |
Kenneth G.Y. Grant (1949)
Chairman, January 2017 to present;
Independent Trustee, May 2008 to present | Current: Director, Standpoint Multi-Asset (Cayman) Fund, Ltd. (2019 – present); Director, Advisors Charitable Gift Fund (2020 - present), a Donor Advised Fund. Previous: EVP, Benefit Plans Administrative Services, Inc., provider of retirement benefit plans administration (2019 – 2020); Director, Northeast Retirement Services (NRS) LLC, a transfer agent and fund administrator; and Director, Global Trust Company (GTC), a non-depository trust company sponsoring private investment product (2003 – 2019); EVP, NRS (2003 – 2019); GTC, EVP (2008 – 2019); EVP, Savings Banks Retirement Association (2003 – 2019), provider of qualified retirement benefit plans. |
Daniel J. Condon (1950)
Chairman of the Audit Committee;
Chairman of the Governance &
Nominating Committee; Independent
Trustee, December 2002 to present | Current: Retired (2017 - present) |
Gary E. Hippenstiel (1947)
Chairman of the Pricing & Liquidity
Committee; Independent Trustee,
December 2002 to present | Current: President and founder of Hippenstiel Investment Counsel LLC (“Hippenstiel”) since 2008. Hippenstiel was registered as an investment adviser from 2008 to December 31, 2019. |
Stephen A. Little (1946)
Independent Trustee, December 2002 to
present; Chairman, December 2004 to
December 2016 | Current: President and founder of The Rose, Inc., a registered investment adviser, since 1993. |
Ronald C. Tritschler (1952)
Independent Trustee, January 2007 to
present; Interested Trustee, December 2002
to December 2006 | Current: Chief Executive Officer, Director and Legal Counsel of The Webb Companies, a national real estate company, since 2001; Director, Standpoint Multi-Asset (Cayman) Fund, Ltd. (2020 – present). |
| * | The address for each Trustee is 225 Pictoria Drive, Suite 450, Cincinnati, Ohio 45246. |
| ** | As of the date of this report, the Trust consists of 21 series. |
Trustees and Officers (Unaudited) (continued)
The following table provides information regarding the Interested Trustee and Officers of the Trust.
Name, Address*, (Year of Birth), Position
with Trust,
Term of Position with Trust | Principal Occupation During Past 5 Years and Other
Directorships |
David R. Carson (1958)
President, January 2016 to August 2021;
Interested Trustee, August 2020 to present | Current: Senior Vice President Client Strategies of Ultimus Fund Solutions, LLC, since 2013; Interested Trustee of Ultimus Mangers Trust, since 2020. |
Zachary P. Richmond (1980)
Treasurer and Chief Financial Officer,
November 2014 to present | Current: Vice President, Director of Financial Administration for Ultimus Fund Solutions, LLC, since 2015. |
Martin R. Dean (1963)
President, August 2021 to present; Vice
President, November 2020 to August 2021;
Chief Compliance Officer, April 2021 to
August 2021; Assistant Chief Compliance
Officer, January 2016 to April 2021 | Current: Senior Vice President, Head of Fund Compliance of Ultimus Fund Solutions, LLC, since 2016. |
Gweneth K. Gosselink (1955)
Chief Compliance Officer, August 2021 to
present | Current: Assistant Vice President, Senior Compliance Officer of Ultimus Fund Solutions, LLC, since 2019.
Previous: Chief Operating Officer & CCO at Miles Capital, Inc. (2013 – 2019). |
Elisabeth Dahl (1962)
Secretary, May 2017 to present; Assistant
Secretary, March 2016 to May 2017 | Current: Attorney, Ultimus Fund Solutions, LLC since March 2016. |
Stephen Preston (1966)
AML Compliance Officer, May 2017 to
present | Current: Vice President and Chief Compliance Officer, Ultimus Fund Solutions, LLC and Ultimus Fund Distributors, LLC, since 2011. |
Lynn E. Wood (1946)
Assistant Chief Compliance Officer, April
2021 to present; Chief Compliance Officer,
October 2004 to April 2021 | Current: Managing Member, Buttonwood Compliance Partners, LLC, since 2013. |
| * | The address for each Officer is 225 Pictoria Drive, Suite 450, Cincinnati, Ohio 45246. |
PRIVACY NOTICE
Rev: January 2020
| FACTS | WHAT DOES TACTICAL MULTI-PURPOSE FUND (THE “FUND”) DO WITH YOUR PERSONAL INFORMATION? |
| Why? | Financial companies choose how they share your personal information. Federal law gives consumers the right to limit some but not all sharing. Federal law also requires us to tell you how we collect, share, and protect your personal information. Please read this notice carefully to understand what we do. |
| What? | The types of personal information we collect and share depend on the product or service you have with us. This information can include: ● Social Security number ● account balances and account transactions ● transaction or loss history and purchase history When you are no longer our customer, we continue to share your information as described in this notice. |
| How? | All financial companies need to share customers’ personal information to run their everyday business. In the section below, we list the reasons financial companies can share their customers’ personal information; the reasons the Fund chooses to share; and whether you can limit this sharing. |
| Reasons we can share your personal information | Does the Fund share? | Can you limit this
sharing? |
| For our everyday business purposes— | | |
| such as to process your transactions, maintain your account(s), respond to court orders and legal investigations, or report to credit bureaus | Yes | No |
| For our marketing purposes— | | |
| to offer our products and services to you | No | We don’t share |
| For joint marketing with other financial companies | No | We don’t share |
For our affiliates’ everyday business purposes—
information about your transactions and experiences | No | We don’t share |
For our affiliates’ everyday business purposes—
information about your creditworthiness | No | We don’t share |
| For nonaffiliates to market to you | No | We don’t share |
| Questions? | Call (800) 550-1071 |
| Who we are |
| Who is providing this notice? | Tactical Multi-Purpose Fund Ultimus Fund Distributors, LLC (Distributor) Ultimus Fund Solutions, LLC (Administrator) |
| What we do |
| How does the Fund protect my personal information? | To protect your personal information from unauthorized access and use, we use security measures that comply with federal law. These measures include computer safeguards and secured files and buildings. Our service providers are held accountable for adhering to strict policies and procedures to prevent any misuse of your nonpublic personal information. |
| How does the Fund collect my personal information? | We collect your personal information, for example, when you ● open an account or deposit money ● make deposits or withdrawals from your account or provide account information We also collect your personal information from other companies. |
| Why can’t I limit all sharing? | Federal law gives you the right to limit only ● sharing for affiliates’ everyday business purposes—information about your creditworthiness ● affiliates from using your information to market to you ● sharing for nonaffiliates to market to you State laws and individual companies may give you additional rights to limit sharing. |
| Definitions | |
| Affiliates | Companies related by common ownership or control. They can be financial and nonfinancial companies. ● Fisher Asset Management, LLC, d/b/a Fisher Investments, the investment adviser to the Fund, could be deemed to be an affiliate. |
| Nonaffiliates | Companies not related by common ownership or control. They can be financial and nonfinancial companies. ● The Fund does not share your personal information with nonaffiliates so they can market to you |
| Joint marketing | A formal agreement between nonaffiliated financial companies that together market financial products or services to you.
● The Fund doesn’t jointly market. |
| | |
Other Information (Unaudited)
The Fund’s Statement of Additional Information (“SAI”) includes additional information about the trustees and is available without charge, upon request. You may call toll-free at (800) 550-1071 to request a copy of the SAI or to make shareholder inquiries.
PROXY VOTING
A description of the policies and procedures that the Fund uses to determine how to vote proxies relating to portfolio securities and information regarding how the Fund voted those proxies during the most recent twelve month period ended June 30, are available (1) without charge upon request by calling the Fund at (800) 550-1071 and (2) in Fund documents filed with the Securities and Exchange Commission (“SEC”) on the SEC’s website at www.sec.gov.
| TRUSTEES | INDEPENDENT REGISTERED PUBLIC |
| Kenneth G.Y. Grant, Chairman | ACCOUNTING FIRM |
| David R. Carson | Cohen & Company, Ltd. |
| Daniel J. Condon | 151 N Franklin Street, Suite 575 |
| Gary E. Hippenstiel | Chicago, IL 60606 |
| Stephen A. Little | |
| Ronald C. Tritschler | |
| | |
| OFFICERS | LEGAL COUNSEL |
| Martin R. Dean, President | Thompson Hine LLP |
| Gweneth K. Gosselink, | 312 Walnut Street, 20th Floor |
| Chief Compliance Officer | Cincinnati, OH 45202 |
| Zachary P. Richmond, | |
| Treasurer and Chief Financial Officer | |
| Lynn E. Wood, Assistant Chief | |
| Compliance Officer | |
| | |
| INVESTMENT ADVISER | CUSTODIAN |
| Fisher Asset Management, LLC | U.S. Bank, N.A. |
| 5525 NW Fisher Creek Drive | 425 Walnut Street |
| Camas, WA 98607 | Cincinnati, OH 45202 |
| | |
| DISTRIBUTOR | ADMINISTRATOR, TRANSFER AGENT AND FUND |
| Ultimus Fund Distributors, LLC | ACCOUNTANT |
| 225 Pictoria Drive, Suite 450 | Ultimus Fund Solutions, LLC |
| Cincinnati, OH 45246 | 225 Pictoria Drive, Suite 450 |
| | Cincinnati, OH 45246 |
| | |
This report is intended only for the information of shareholders or those who have received the Fund’s prospectus which contains information about the Fund’s management fee and expenses. Please read the prospectus carefully before investing.
Distributed by Ultimus Fund Distributors, LLC
Member FINRA/SIPC
FISHER INVESTMENTS INSTITUTIONAL GROUP FUND FAMILY |
Annual Report
August 31, 2021
Fisher Investments Institutional Group
Stock Fund for Retirement Plans
Fisher Investments Institutional Group
ESG Stock Fund for Retirement Plans
Fisher Investments Institutional Group
Fixed Income Fund for Retirement Plans
Fisher Investments Institutional Group
ESG Fixed Income Fund for Retirement Plans
Fund Adviser:
Fisher Asset Management, LLC
5525 NW Fisher Creek Drive,
Camas, Washington 98607
(800) 851-8845
FISHER INVESTMENTS INSTITUTIONAL GROUP
MANAGEMENT’S DISCUSSION OF FUND PERFORMANCE
(Unaudited)
Dear Shareholder:
Market Outlook
Global developed markets and emerging markets (EM) has continued to rise, turning in a positive first half to the year. Despite growth stocks outperformance in global developed markets, value stocks have been outperforming lately, beating growth stocks. However, that trend, as well as several sector and country winners and losers, reversed in June — a sign of things to come in our view. We think this trend is durable as stocks focus on the likelihood of global economies slowing after an initial reopening surge.
In our view, stocks are beginning to look beyond the next few months and ahead to a post-pandemic normal. Future growth likely returns to pre-pandemic trends—an environment that favors growth stocks over value, in our view. While countertrends have no preset durations, growth stocks have made up some ground in the last couple of months. Although COVID-19 could always stir sentiment in the short term, we think markets are focusing more on the global economy’s likelihood of slowing after an initial reopening surge. While the bull market in developed world stocks likely continues for the foreseeable future, growth stocks’ recent leadership is a sign of things to come, in our view.
After reaching post-Brexit trade deal in December 2020, the UK proposed a free-trade deal with Australia despite strong resistance from British farmers. The EU and Emerging Market India agreed to resume talks, which have been dormant since 2013, on a comprehensive trade deal. Yet Brussels also suffered a setback with Switzerland. After seven years of talks, Bern left negotiations for an updated EU deal, which sought to simplify and modernize their economic relationship by replacing scores of bilateral agreements with an overarching treaty. However, markets largely looked past all of this news as trade agreement progress did not correlate with regional outperformance. In our view, this is a reminder that trade developments don’t have a preset market impact. Changes often take a long time to become reality—usually beyond the timeframe we think stocks focus on. Even if both sides reach an agreement after long negotiations, the terms are usually implemented over many years. This gradual, drawn-out process dampens most surprise power.
Regional elections in France grabbed headlines, as President Emmanuel Macron’s La Republique en Marche (LREM) party and presidential challenger Marine Le Pen’s National Rally both had worse-than-expected showings. Many treated the results as a sign for next year’s national elections, penciling in the Republicans’ Xavier Bertrand with President Macron and Marine Le Pen in a three-person race, potentially upending
FISHER INVESTMENTS INSTITUTIONAL GROUP
MANAGEMENT’S DISCUSSION OF FUND PERFORMANCE
(Unaudited) – (continued)
the long-running presumption that the second round would be a rematch between the latter two. However, in our view, local elections don’t predict national votes. For one, LREM is a young party, lacking the grass roots operations necessary to thrive at the local level. Two, voter turnout was just under 35%—well below the two-thirds of voters who participated in 2017’s presidential race. Politically, the outcome may be a wakeup call for LREM and President Macron, who will probably focus on less controversial matters (e.g., COVID-19 relief) as next year’s election looms.
India’s battle with COVID-19 during the quarter was a humanitarian tragedy. Yet at times like this, we believe it is crucial to remember that markets are unemotional and, as a result, see through events like this and focus on corporate prospects over the next 3 – 30 months. Illustrating this, Indian stocks rose overall. Indian banks got a big boost as they revised their estimated loan losses lower from the prolonged lockdown, easing widespread concerns over the financial impact of the country’s tragic ordeal with COVID-19. Buoyed by Financials and the prospect of much lower loan loss reserves, Indian stocks overall surged in May 2021. Markets have been familiar with India’s infrastructure challenges for many years now, making the vaccine distribution difficulties sadly unsurprising. Overall, we think that as time passes, the faster recoveries in developed nations will help pull the rest of the world along.
Chinese data probably remains inconsistent a while longer, but the overall trend of slowing growth probably continues as the government continues trying to rein in perceived excess in the shadow financing world. The degree of government intervention was arguably one of investors’ main concerns during China’s correction, as regulators increasingly concentrated on Tech and Tech-like firms’ forays into commercial finance, sparking fears of drastic intervention. Those fears seemingly came true when The Wall Street Journal reported that regulators ordered large Internet platforms to unload all extra financial services from their mobile payment apps. The move drove speculation that if they want to continue providing financial services beyond mobile payments, big Chinese Tech firms will have to follow Ant Financial’s lead and reorganize as traditional financial institutions subject to normal banking regulations. This might seem negative, but markets barely reacted, which we think is logical. For one, markets seemingly dealt with this fear in March 2021, as rumors of future intervention swirled. Two, the largest Chinese internet platforms are well equipped to handle these changes, which may create barriers to entry for new competition, making these changes a long-term benefit. Overall, though, this seems like further confirmation that Chinese officials have shifted fully from their pandemic recovery efforts to their longer-running aims of promoting financial stability, illustrating the return to normal.
FISHER INVESTMENTS INSTITUTIONAL GROUP
MANAGEMENT’S DISCUSSION OF FUND PERFORMANCE
(Unaudited) – (continued)
We expect a brief spike in economic growth largely from base-effect. Following the bounce, we expect the economic trends pre-COVID-19 to return highlighted by a shallow yield curve, tough access to credit and increasingly late cycle sentiment. This favors growth over value with high-quality firms in Tech or Tech-like industries of Internet Retail and Interactive Media as best positioned. Growth companies typically thrive in modest-growth environments as their sales and earnings are less dependent upon a strong economy, and investors seek out firms consistently able to grow. Value companies benefit more from an accelerating economic trajectory, with improved volume and higher operating leverage. We believe economic growth likely begins to inflect as last March’s base effect fades and the economy settles back into a trajectory similar to 2019, before the disruption.
Over halfway into 2021, markets are well familiar with the pandemic’s issues and setbacks—and are looking beyond them. We believe they are pricing in the return to pre-pandemic growth trends, an environment that favors growth stocks over value. In our view, that most benefits the nations and sectors with growth characteristics, though we think maintaining exposure to high-growth value areas makes sense for diversification. Most of all, we expect the bull market in developed world stocks to continue and deliver a good-to-great year.
Fisher Investments Institutional Group Stock Fund for Retirement Plans
Performance Attribution
The Fisher Investments Institutional Group Stock Fund for Retirement Plans outperformed the MSCI ACWI Investable Markets Index for the period from September 1, 2020 through August 31, 2021. During this period, the Fund returned 32.06% while the Fund’s primary benchmark, the MSCI ACWI Investable Markets Index, returned 30.10%. Sector and equity selection contributed to relative return, while country allocation detracted. An overweight to and selection within the United States was the largest contributor to relative return, driven by multinational conglomerate Google holding company Alphabet, visual computing company Nvidia and medical device company Align Technology. Additionally, an overweight to and selection within Dutch Information Technology, as the category outperformed the broader benchmark. Conversely, an overweight to and selection within China was the largest detractor from relative return, driven by internet retailer Alibaba, medicine products enterprise Sino Biopharm and internet media company Tencent. Further, a lack of exposure to India detracted, as the country outperformed.
FISHER INVESTMENTS INSTITUTIONAL GROUP
MANAGEMENT’S DISCUSSION OF FUND PERFORMANCE
(Unaudited) – (continued)
Fisher Investments Institutional Group ESG Stock Fund for Retirement Plans
Performance Attribution
The Fisher Investments Institutional Group ESG Stock Fund for Retirement Plans performed in line with the MSCI ACWI Investable Markets Index for the period from September 1, 2020 through August 31, 2021. During this period, the Fund returned 31.07% while the Fund’s primary benchmark, the MSCI ACWI Investable Markets Index, returned 30.10%. Sector and equity selection contributed to relative return, while country allocation detracted. An overweight to and selection within the United States was the largest contributor to relative return, driven by multinational conglomerate Google holding company Alphabet, visual computing company Nvidia and medical device company Align Technology. Additionally, an overweight to Dutch Information Technology contributed, as the category outperformed the broader benchmark. Conversely, an overweight to and selection within China was the largest detractor from relative return, driven by internet retailer Alibaba, medicine products enterprise Sino Biopharm and internet media company Tencent. Further, selection within United Kingdom detracted, as fast-moving consumer goods company Unilever, global pharmaceutical company GlaxoSmithKline and pharmaceutical and biotechnology company Astra Zeneca underperformed.
Fisher Investments Institutional Group Fixed Income Fund for Retirement Plans
Performance Attribution
The Fisher Investments Institutional Group Fixed Income Fund for Retirement Plans outperformed ICE Bank of America Merrill Lynch U.S. Broad Market Index for the period from September 1, 2020 through August 31, 2021. During this period, the Fund returned 2.38% while the Fund’s primary benchmark, the ICE Bank of America Merrill Lynch U.S. Broad Market Index, returned -0.14%. An underweight to and selection within Sovereign debt was the largest contributor to relative return. Additionally, an overweight to Corporate Debt contributed as the category outperformed the broader benchmark. Further, a lack of exposure to securitized debt was the largest detractor from relative return as the category outperformed.
FISHER INVESTMENTS INSTITUTIONAL GROUP
MANAGEMENT’S DISCUSSION OF FUND PERFORMANCE
(Unaudited) – (continued)
Fisher Investments Institutional Group ESG Fixed Income Fund for Retirement Plans
Performance Attribution
The Fisher Investments Institutional Group ESG Fixed Income Fund for Retirement Plans outperformed the ICE Bank of America Merrill Lynch U.S. Broad Market Index for the period from September 1, 2020 through August 31, 2021. During this period, the Fund returned 2.02% while the Fund’s primary benchmark, the ICE Bank of America Merrill Lynch U.S. Broad Market Index, returned -0.14%. An underweight and selection within Sovereign debt was the largest contributor to relative return. Additionally, an overweight to Corporate Debt contributed as the category outperformed the broader benchmark. Further, a lack of exposure to securitized debt was the largest detractor from relative return as the category outperformed.
FISHER INVESTMENTS INSTITUTIONAL GROUP
STOCK FUND FOR RETIREMENT PLANS
Investment Results (Unaudited)
| Average Annual Total Returns as of August 31, 2021(a) |
| | | | | | Since | |
| | | | | | Inception | |
| | Fund/Index | | 1 Year | | (12/13/19) | |
| | Fisher Investments Institutional Group Stock Fund for Retirement Plans | | 32.06% | | 28.05% | |
| | MSCI ACWI Investable Markets Index(b) | | 30.10% | | 20.35% | |
| | | | | | | |
| | | | | | Expense | |
| | | | | | Ratios(c) | |
| | Gross | | | | 0.00% | |
| | With Applicable Waivers | | | | 0.00% | |
The performance quoted represents past performance, which does not guarantee future results. The investment return and principal value of an investment will fluctuate so that an investor’s shares, when redeemed, may be worth more or less than their original cost. The returns shown do not reflect deduction of taxes that a shareholder would pay on Fisher Investments Institutional Group Stock Fund for Retirement Plans (the “Fund”) distributions or the redemption of Fund shares. The Fund’s investment objectives, risks, charges and expenses must be considered carefully before investing. Current performance may be lower or higher than the performance quoted. Performance data current to the most recent month end may be obtained by calling (800) 851-8845.
| (a) | Return figures reflect any change in price per share and assume the reinvestment of all distributions. |
| (b) | The MSCI ACWI Investable Markets Index is designed to represent performance of the full opportunity set of large, mid, and small-cap stocks across 23 developed and 27 emerging markets. Individuals cannot invest directly in an index; however, an individual can invest in exchange traded funds or other investment vehicles that attempt to track the performance of a benchmark index. |
| (c) | The expense ratios are from the Fund’s prospectus dated December 29, 2020. Fisher Asset Management, LLC, d/b/a Fisher Investments (the “Adviser”) pays all of the operating expenses of the Funds except portfolio transaction and other investment related costs (including brokerage fees and commissions, and fees and expenses associated with investments in derivative instruments, such as option and swap fees and expenses), taxes, borrowing costs (such as interest and dividend expense on securities sold short), extraordinary expenses, and any indirect expenses (such as fees and expenses associated with investment in acquired funds and other collective investment vehicles). The Fund is available only to eligible retirement plans receiving the Adviser’s managed account or other services. The Fund does not pay a management fee to the Adviser. Retirement plans, plan sponsors and/or plan participants pay a separate fee for the Adviser’s services and also pay fees to record keepers and administrators. If paid from plan assets, these fees will reduce the net return to plan participants but are not reflected in net fund performance. |
The Fund’s investment objective, strategies, risks, charges and expenses must be considered carefully before investing. The Fund’s prospectus contains this and other important information about the investment company and may be obtained by calling (800) 851-8845. Please read it carefully before investing.
The Fund is distributed by Ultimus Fund Distributors, LLC, Member FINRA/SIPC.
FISHER INVESTMENTS INSTITUTIONAL GROUP
STOCK FUND FOR RETIREMENT PLANS
Investment Results (Unaudited) – (continued)
Comparison of the Growth of a $10,000 Investment in the Fisher Investments
Institutional Group Stock Fund for Retirement Plans and the MSCI ACWI Investable
Markets Index (Unaudited)
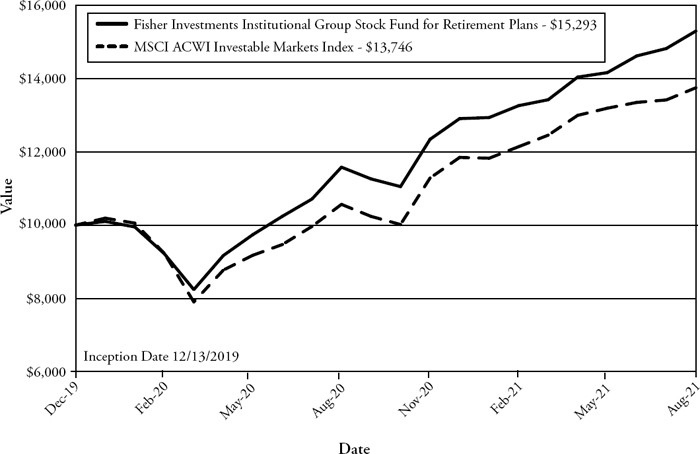
This graph shows the value of a hypothetical initial investment of $10,000 made on December 13, 2019 (commencement of operations) and held through August 31, 2021. The MSCI ACWI Investable Markets Index is designed to represent performance of the full opportunity set of large, mid, and small-cap stocks across 23 developed and 27 emerging markets. THE FUND’S RETURN REPRESENTS PAST PERFORMANCE AND DOES NOT GUARANTEE OR PREDICT FUTURE RESULTS. The returns shown do not reflect deduction of taxes that a shareholder would pay on Fund distributions or the redemption of Fund shares. Investment returns and principal values will fluctuate so that an investor’s shares, when redeemed, may be worth more or less than their original cost.
Current performance may be lower or higher than the performance data quoted. For more information on the Fund, and to obtain performance data current to the most recent month-end, or to request a prospectus, please call (800) 851-8845.
You should carefully consider the investment objectives, risks, charges and expenses of the fund before investing. The Fund’s prospectus contains this and other information about the Fund and should be read carefully before investing.
The Fund is distributed by Ultimus Fund Distributors, LLC, member FINRA/SIPC.
FISHER INVESTMENTS INSTITUTIONAL GROUP
ESG STOCK FUND FOR RETIREMENT PLANS
Investment Results (Unaudited) – (continued)
| Average Annual Total Returns as of August 31, 2021(a) |
| | | | | | Since | |
| | | | | | Inception | |
| | Fund/Index | | 1 Year | | (12/13/19) | |
| | Fisher Investments Institutional Group ESG Stock Fund for Retirement Plans | | 31.07% | | 27.49% | |
| | MSCI ACWI Investable Markets Index(b) | | 30.10% | | 20.35% | |
| | | | | | | |
| | | | | | Expense | |
| | | | | | Ratios(c) | |
| | Gross | | | | 0.00% | |
| | With Applicable Waivers | | | | 0.00% | |
The performance quoted represents past performance, which does not guarantee future results. The investment return and principal value of an investment will fluctuate so that an investor’s shares, when redeemed, may be worth more or less than their original cost. The returns shown do not reflect deduction of taxes that a shareholder would pay on Fisher Investments Institutional Group ESG Stock Fund for Retirement Plans (the “Fund”) distributions or the redemption of Fund shares. The Fund’s investment objectives, risks, charges and expenses must be considered carefully before investing. Current performance may be lower or higher than the performance quoted. Performance data current to the most recent month end may be obtained by calling (800) 851-8845.
| (a) | Return figures reflect any change in price per share and assume the reinvestment of all distributions. |
| (b) | The MSCI ACWI Investable Markets Index is designed to represent performance of the full opportunity set of large, mid, and small-cap stocks across 23 developed and 27 emerging markets. Individuals cannot invest directly in an index; however, an individual can invest in exchange traded funds or other investment vehicles that attempt to track the performance of a benchmark index. |
| (c) | The expense ratios are from the Fund’s prospectus dated December 29, 2020. Fisher Asset Management, LLC, d/b/a Fisher Investments (the “Adviser”) pays all of the operating expenses of the Funds except portfolio transaction and other investment related costs (including brokerage fees and commissions, and fees and expenses associated with investments in derivative instruments, such as option and swap fees and expenses), taxes, borrowing costs (such as interest and dividend expense on securities sold short), extraordinary expenses, and any indirect expenses (such as fees and expenses associated with investment in acquired funds and other collective investment vehicles). The Fund is available only to eligible retirement plans receiving the Adviser’s managed account or other services. The Fund does not pay a management fee to the Adviser. Retirement plans, plan sponsors and/or plan participants pay a separate fee for the Adviser’s services and also pay fees to record keepers and administrators. If paid from plan assets, these fees will reduce the net return to plan participants but are not reflected in net fund performance. |
The Fund’s investment objective, strategies, risks, charges and expenses must be considered carefully before investing. The Fund’s prospectus contains this and other important information about the investment company and may be obtained by calling (800) 851-8845. Please read it carefully before investing.
The Fund is distributed by Ultimus Fund Distributors, LLC, Member FINRA/SIPC
FISHER INVESTMENTS INSTITUTIONAL GROUP
ESG STOCK FUND FOR RETIREMENT PLANS
Investment Results (Unaudited) – (continued)
Comparison of the Growth of a $10,000 Investment in the Fisher Investments
Institutional Group ESG Stock Fund for Retirement Plans and the MSCI ACWI Investable
Markets Index (Unaudited)
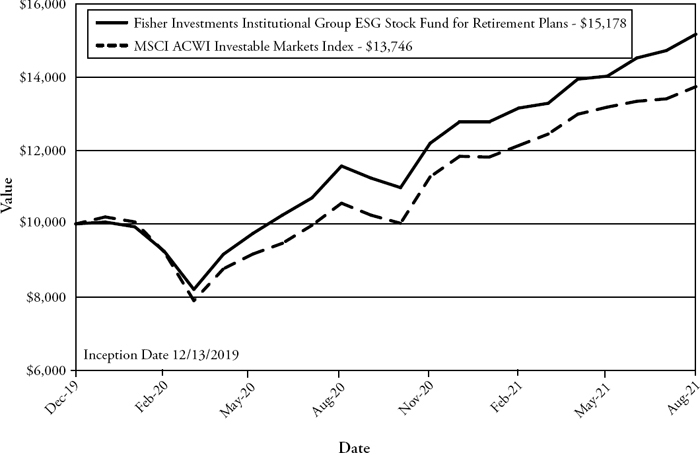
This graph shows the value of a hypothetical initial investment of $10,000 made on December 13, 2019 (commencement of operations) and held through August 31, 2021. The MSCI ACWI Investable Markets Index is designed to represent performance of the full opportunity set of large, mid, and small-cap stocks across 23 developed and 27 emerging markets. THE FUND’S RETURN REPRESENTS PAST PERFORMANCE AND DOES NOT GUARANTEE OR PREDICT FUTURE RESULTS. The returns shown do not reflect deduction of taxes that a shareholder would pay on Fund distributions or the redemption of Fund shares. Investment returns and principal values will fluctuate so that an investor’s shares, when redeemed, may be worth more or less than their original cost.
Current performance may be lower or higher than the performance data quoted. For more information on the Fund, and to obtain performance data current to the most recent month-end, or to request a prospectus, please call (800) 851-8845.
You should carefully consider the investment objectives, risks, charges and expenses of the fund before investing. The Fund’s prospectus contains this and other information about the Fund and should be read carefully before investing.
The Fund is distributed by Ultimus Fund Distributors, LLC, member FINRA/SIPC.
FISHER INVESTMENTS INSTITUTIONAL GROUP
FIXED INCOME FUND FOR RETIREMENT PLANS
Investment Results (Unaudited) – (continued)
| Average Annual Total Returns as of August 31, 2021(a) |
| | | | | | Since | |
| | | | | | Inception | |
| | Fund/Index | | 1 Year | | (12/13/19) | |
| | Fisher Investments Institutional Group Fixed Income Fund for Retirement Plans | | 2.38% | | 4.47% | |
| | ICE Bank of America Merrill Lynch U.S. Broad Market Index(b) | | -0.14% | | 3.80% | |
| | | | | | | |
| | | | | | Expense | |
| | | | | | Ratios(c) | |
| | Gross | | | | 0.04% | |
| | With Applicable Waivers | | | | 0.04% | |
The performance quoted represents past performance, which does not guarantee future results. The investment return and principal value of an investment will fluctuate so that an investor’s shares, when redeemed, may be worth more or less than their original cost. The returns shown do not reflect deduction of taxes that a shareholder would pay on Fisher Investments Institutional Group Fixed Income Fund for Retirement Plans (the “Fund”) distributions or the redemption of Fund shares. The Fund’s investment objectives, risks, charges and expenses must be considered carefully before investing. Current performance may be lower or higher than the performance quoted. Performance data current to the most recent month end may be obtained by calling (800) 851-8845.
| (a) | Return figures reflect any change in price per share and assume the reinvestment of all distributions. |
| (b) | The ICE Bank of America Merrill Lynch U.S. Broad Market Index measures the performance of US dollar-denominated, investment grade debt securities, including US Treasury notes and bonds, quasi-government securities, corporate securities, residential and commercial mortgage-backed securities and asset-backed securities. Individuals cannot invest directly in an index; however, an individual can invest in exchange traded funds or other investment vehicles that attempt to track the performance of a benchmark index. |
| (c) | The expense ratios, which include acquired fund fees and expenses of 0.04%, are from the Fund’s prospectus dated December 29, 2020. Fisher Asset Management, LLC, d/b/a Fisher Investments (the “Adviser”) pays all of the operating expenses of the Fund except portfolio transaction and other investment related costs (including brokerage fees and commissions, and fees and expenses associated with investments in derivative instruments, such as option and swap fees and expenses), taxes, borrowing costs (such as interest and dividend expense on securities sold short), extraordinary expenses, and any indirect expenses (such as fees and expenses associated with investment in acquired funds and other collective investment vehicles). The Fund is available only to eligible retirement plans receiving the Adviser’s managed account or other services. The Fund does not pay a management fee to the Adviser. Retirement plans, plan sponsors and/or plan participants pay a separate fee for the Adviser’s services and also pay fees to record keepers and administrators. If paid from plan assets, these fees will reduce the net return to plan participants but are not reflected in net fund performance. |
The Fund’s investment objective, strategies, risks, charges and expenses must be considered carefully before investing. The Fund’s prospectus contains this and other important information about the investment company and may be obtained by calling (800) 851-8845. Please read it carefully before investing.
The Fund is distributed by Ultimus Fund Distributors, LLC, Member FINRA/SIPC
FISHER INVESTMENTS INSTITUTIONAL GROUP
FIXED INCOME FUND FOR RETIREMENT PLANS
Investment Results (Unaudited) – (continued)
Comparison of the Growth of a $10,000 Investment in the Fisher Investments Institutional Group
Fixed Income Fund for Retirement Plans and the ICE Bank of America Merrill Lynch U.S. Broad
Market Index (Unaudited)
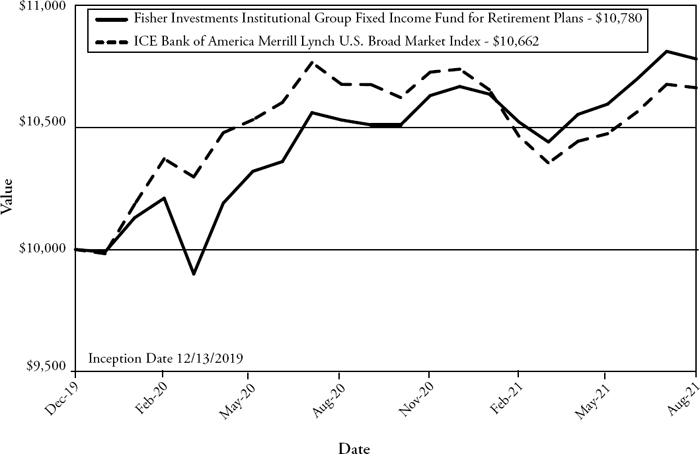
This graph shows the value of a hypothetical initial investment of $10,000 made on December 13, 2019 (commencement of operations) and held through August 31, 2021. The ICE Bank of America Merrill Lynch U.S. Broad Market Index measures the performance of US dollar-denominated, investment grade debt securities, including US Treasury notes and bonds, quasi-government securities, corporate securities, residential and commercial mortgage-backed securities and asset-backed securities. THE FUND’S RETURN REPRESENTS PAST PERFORMANCE AND DOES NOT GUARANTEE OR PREDICT FUTURE RESULTS. The returns shown do not reflect deduction of taxes that a shareholder would pay on Fund distributions or the redemption of Fund shares. Investment returns and principal values will fluctuate so that an investor’s shares, when redeemed, may be worth more or less than their original cost.
Current performance may be lower or higher than the performance data quoted. For more information on the Fund, and to obtain performance data current to the most recent month-end, or to request a prospectus, please call (800) 851-8845.
You should carefully consider the investment objectives, risks, charges and expenses of the Fund before investing. The Fund’s prospectus contains this and other information about the Fund and should be read carefully before investing.
The Fund is distributed by Ultimus Fund Distributors, LLC, member FINRA/SIPC.
FISHER INVESTMENTS INSTITUTIONAL GROUP
ESG FIXED INCOME FUND FOR RETIREMENT PLANS
Investment Results (Unaudited) – (continued)
| Average Annual Total Returns as of August 31, 2021(a) |
| | | | | | Since | |
| | | | | | Inception | |
| | Fund/Index | | 1 Year | | (12/13/19) | |
| | Fisher Investments Institutional Group ESG Fixed Income Fund for Retirement Plans | | 2.02% | | 4.31% | |
| | ICE Bank of America Merrill Lynch U.S. Broad Market Index(b) | | -0.14% | | 3.80% | |
| | | | | | | |
| | | | | | Expense | |
| | | | | | Ratios(c) | |
| | Gross | | | | 0.07% | |
| | With Applicable Waivers | | | | 0.07% | |
The performance quoted represents past performance, which does not guarantee future results. The investment return and principal value of an investment will fluctuate so that an investor’s shares, when redeemed, may be worth more or less than their original cost. The returns shown do not reflect deduction of taxes that a shareholder would pay on Fisher Investments Institutional Group ESG Fixed Income Fund for Retirement Plans (the “Fund”) distributions or the redemption of Fund shares. The Fund’s investment objectives, risks, charges and expenses must be considered carefully before investing. Current performance may be lower or higher than the performance quoted. Performance data current to the most recent month end may be obtained by calling (800) 851-8845.
| (a) | Return figures reflect any change in price per share and assume the reinvestment of all distributions. |
| (b) | The ICE Bank of America Merrill Lynch U.S. Broad Market Index measures the performance of US dollar-denominated, investment grade debt securities, including US Treasury notes and bonds, quasi-government securities, corporate securities, residential and commercial mortgage-backed securities and asset-backed securities. Individuals cannot invest directly in an index; however, an individual can invest in exchange traded funds or other investment vehicles that attempt to track the performance of a benchmark index. |
| (c) | The expense ratios, which include acquired fund fees and expenses of 0.07%, are from the Fund’s prospectus dated December 29, 2020. Fisher Asset Management, LLC, d/b/a Fisher Investments (the “Adviser”) pays all of the operating expenses of the Funds except portfolio transaction and other investment related costs (including brokerage fees and commissions, and fees and expenses associated with investments in derivative instruments, such as option and swap fees and expenses), taxes, borrowing costs (such as interest and dividend expense on securities sold short), extraordinary expenses, and any indirect expenses (such as fees and expenses associated with investment in acquired funds and other collective investment vehicles). The Fund is available only to eligible retirement plans receiving the Adviser’s managed account or other services. The Fund does not pay a management fee to the Adviser. Retirement plans, plan sponsors and/or plan participants pay a separate fee for the Adviser’s services and also pay fees to record keepers and administrators. If paid from plan assets, these fees will reduce the net return to plan participants but are not reflected in net fund performance. |
The Fund’s investment objective, strategies, risks, charges and expenses must be considered carefully before investing. The Fund’s prospectus contains this and other important information about the investment company and may be obtained by calling (800) 851-8845. Please read it carefully before investing.
The Fund is distributed by Ultimus Fund Distributors, LLC, Member FINRA/SIPC
FISHER INVESTMENTS INSTITUTIONAL GROUP
ESG FIXED INCOME FUND FOR RETIREMENT PLANS
Investment Results (Unaudited) – (continued)
Comparison of the Growth of a $10,000 Investment in the Fisher Investments Institutional Group
ESG Fixed Income Fund for Retirement Plans and the ICE Bank of America Merrill Lynch U.S.
Broad Market Index (Unaudited)
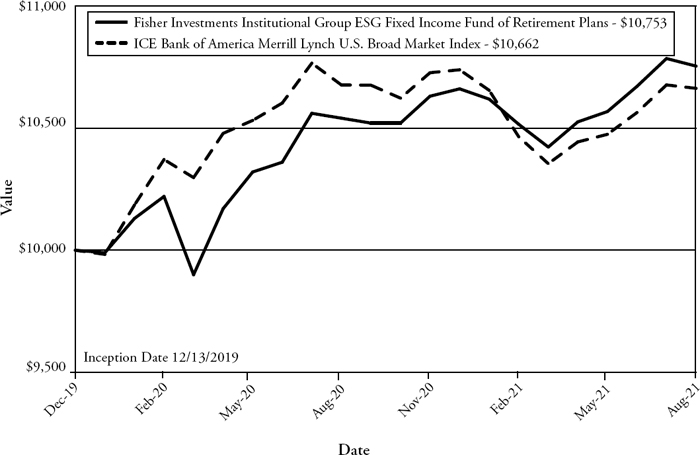
This graph shows the value of a hypothetical initial investment of $10,000 made on December 13, 2019 (commencement of operations) and held through August 31, 2021. The ICE Bank of America Merrill Lynch U.S. Broad Market Index measures the performance of US dollar-denominated, investment grade debt securities, including US Treasury notes and bonds, quasi-government securities, corporate securities, residential and commercial mortgage-backed securities and asset-backed securities. THE FUND’S RETURN REPRESENTS PAST PERFORMANCE AND DOES NOT GUARANTEE OR PREDICT FUTURE RESULTS. The returns shown do not reflect deduction of taxes that a shareholder would pay on Fund distributions or the redemption of Fund shares. Investment returns and principal values will fluctuate so that an investor’s shares, when redeemed, may be worth more or less than their original cost.
Current performance may be lower or higher than the performance data quoted. For more information on the Fund, and to obtain performance data current to the most recent month-end, or to request a prospectus, please call (800) 851-8845.
You should carefully consider the investment objectives, risks, charges and expenses of the fund before investing. The Fund’s prospectus contains this and other information about the Fund and should be read carefully before investing.
The Fund is distributed by Ultimus Fund Distributors, LLC, member FINRA/SIPC.
FISHER INVESTMENTS INSTITUTIONAL GROUP
STOCK FUND FOR RETIREMENT PLANS
Fund Holdings (Unaudited)
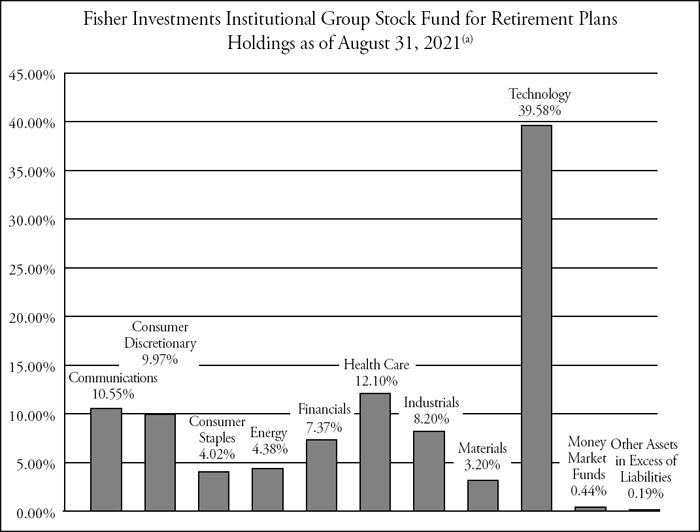
| (a) | As a percentage of net assets. |
The investment objective of Fisher Investments Institutional Group Stock Fund for Retirement Plans seeks to outperform, net of fees and expenses, the return of the MSCI ACWI Investable Markets Index.
FISHER INVESTMENTS INSTITUTIONAL GROUP
ESG STOCK FUND FOR RETIREMENT PLANS
Fund Holdings (Unaudited) – (continued)
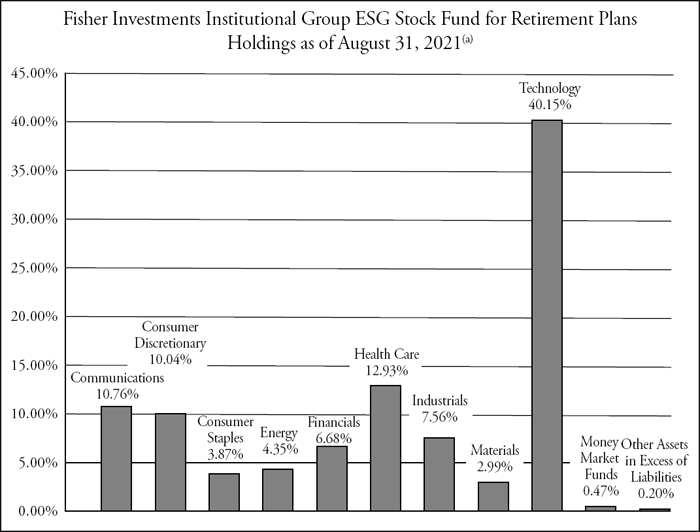
| (a) | As a percentage of net assets. |
The investment objective of the Fisher Investments Institutional Group ESG Stock Fund for Retirement Plans seeks to outperform, net of fees and expenses, the return of the MSCI ACWI Investable Markets Index.
FISHER INVESTMENTS INSTITUTIONAL GROUP
FIXED INCOME FUND FOR RETIREMENT PLANS
Fund Holdings (Unaudited) – (continued)
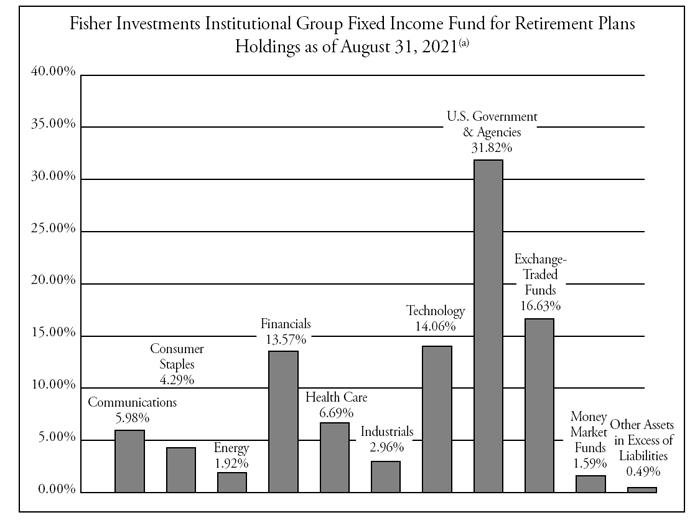
| (a) | As a percentage of net assets. |
The investment objective of Fisher Investments Institutional Group Fixed Income Fund for Retirement Plans seeks to outperform, net of fees and expenses, the return of the ICE Bank of America Merrill Lynch U.S. Broad Market Index.
FISHER INVESTMENTS INSTITUTIONAL GROUP
ESG FIXED INCOME FUND FOR RETIREMENT PLANS
Fund Holdings (Unaudited) – (continued)
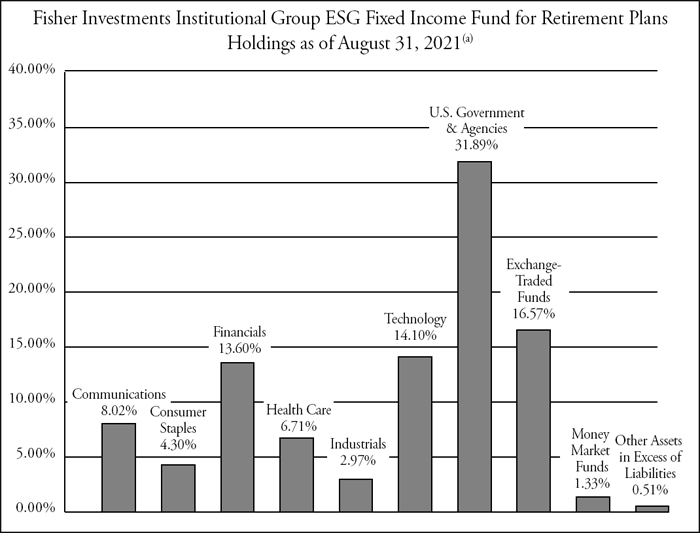
| (a) | As a percentage of net assets. |
The investment objective of Fisher Investments Institutional Group ESG Fixed Income Fund for Retirement Plans seeks to outperform, net of fees and expenses, the return of the ICE Bank of America Merrill Lynch U.S. Broad Market Index.
Availability of Portfolio Schedule (Unaudited)
The Funds file their complete schedule of portfolio holdings with the Securities and Exchange Commission (“SEC”) for the first and third quarters of each fiscal year as an exhibit to its reports on Form N-PORT. The Funds’ Form N-PORT reports are available on the SEC’s website at http://www.sec.gov.
| FISHER INVESTMENTS INSTITUTIONAL GROUP |
| STOCK FUND FOR RETIREMENT PLANS |
| SCHEDULE OF INVESTMENTS |
| August 31, 2021 |
| | | Shares | | | Fair Value | |
| COMMON STOCKS — 99.37% | | | | | | |
| | | | | | | |
| Argentina — 0.81% | | | | | | |
| Consumer Discretionary — 0.81% | | | | | | | | |
| MercadoLibre, Inc.(a) | | | 1 | | | $ | 1,867 | |
| Total Argentina | | | | | | | 1,867 | |
| | | | | | | | | |
| Australia — 1.32% | | | | | | | | |
| Materials — 1.32% | | | | | | | | |
| BHP Group Ltd. | | | 26 | | | | 867 | |
| OZ Minerals Ltd.(a) | | | 77 | | | | 1,327 | |
| Rio Tinto Ltd. | | | 10 | | | | 820 | |
| | | | | | | | 3,014 | |
| Total Australia | | | | | | | 3,014 | |
| | | | | | | | | |
| Brazil — 1.01% | | | | | | | | |
| Energy — 0.69% | | | | | | | | |
| Petroleo Brasileiro SA - ADR | | | 146 | | | | 1,582 | |
| | | | | | | | | |
| Materials — 0.32% | | | | | | | | |
Vale SA - ADR | | | 38 | | | | 725 | |
| | | | | | | | | |
| Total Brazil | | | | | | | 2,307 | |
| | | | | | | | | |
| Canada — 0.54% | | | | | | | | |
| Materials — 0.54% | | | | | | | | |
| Hudbay Minerals, Inc.(a) | | | 80 | | | | 490 | |
| Lundin Mining Corp. | | | 93 | | | | 752 | |
| | | | | | | | 1,242 | |
| Total Canada | | | | | | | 1,242 | |
| | | | | | | | | |
| China — 5.09% | | | | | | | | |
| Communications — 2.70% | | | | | | | | |
| 51job Inc. - ADR(a) | | | 6 | | | | 461 | |
| Tencent Holdings Ltd. - ADR | | | 78 | | | | 4,809 | |
| Trip.com Group Ltd. - ADR(a) | | | 30 | | | | 915 | |
| | | | | | | | 6,185 | |
See accompanying notes which are an integral part of these financial statements.
| FISHER INVESTMENTS INSTITUTIONAL GROUP |
| STOCK FUND FOR RETIREMENT PLANS |
| SCHEDULE OF INVESTMENTS – (continued) |
| August 31, 2021 |
| | | Shares | | | Fair Value | |
| COMMON STOCKS — 99.37% - continued | | | | | | |
| | | | | | | |
| China — 5.09% - continued | | | | | | | | |
| Consumer Discretionary — 2.39% | | | | | | | | |
| Alibaba Group Holding Ltd. - ADR(a) | | | 16 | | | $ | 2,672 | |
| JD.com, Inc. - ADR(a) | | | 36 | | | | 2,828 | |
| | | | | | | | 5,500 | |
| Total China | | | | | | | 11,685 | |
| | | | | | | | | |
| France — 4.73% | | | | | | | | |
| Consumer Discretionary — 1.22% | | | | | | | | |
| Kering SA - ADR(a) | | | 35 | | | | 2,783 | |
| | | | | | | | | |
| Energy — 0.67% | | | | | | | | |
| TotalEnergies SE | | | 35 | | | | 1,543 | |
| | | | | | | | | |
| Financials — 0.44% | | | | | | | | |
| BNP Paribas SA | | | 16 | | | | 1,015 | |
| | | | | | | | | |
| Health Care — 0.41% | | | | | | | | |
| Sanofi | | | 9 | | | | 931 | |
| | | | | | | | | |
| Technology — 1.99% | | | | | | | | |
| Dassault Systems SE | | | 80 | | | | 4,563 | |
| | | | | | | | | |
| Total France | | | | | | | 10,835 | |
| | | | | | | | | |
| Germany — 1.35% | | | | | | | | |
| Consumer Discretionary — 0.35% | | | | | | | | |
| Sixt SE(a) | | | 6 | | | | 806 | |
| | | | | | | | | |
| Industrials — 1.00% | | | | | | | | |
| MTU Aero Engines AG | | | 3 | | | | 688 | |
| Siemens AG | | | 9 | | | | 1,497 | |
| Siemens Energy AG(a) | | | 4 | | | | 116 | |
| | | | | | | | 2,301 | |
| Total Germany | | | | | | | 3,107 | |
See accompanying notes which are an integral part of these financial statements.
| FISHER INVESTMENTS INSTITUTIONAL GROUP |
| STOCK FUND FOR RETIREMENT PLANS |
| SCHEDULE OF INVESTMENTS – (continued) |
| August 31, 2021 |
| | | Shares | | | Fair Value | |
| COMMON STOCKS — 99.37% - continued | | | | | | |
| | | | | | | |
| Hong Kong — 0.52% | | | | | | | | |
| Health Care — 0.52% | | | | | | | | |
| Sino Biopharmaceutical Ltd. - ADR(a) | | | 75 | | | $ | 1,202 | |
| Total Hong Kong | | | | | | | 1,202 | |
| | | | | | | | | |
| Italy — 0.79% | | | | | | | | |
| Energy — 0.31% | | | | | | | | |
| Eni SpA | | | 58 | | | | 716 | |
| | | | | | | | | |
| Financials — 0.48% | | | | | | | | |
| Intesa Sanpaolo SpA | | | 390 | | | | 1,104 | |
| | | | | | | | | |
| Total Italy | | | | | | | 1,820 | |
| | | | | | | | | |
| Japan — 3.49% | | | | | | | | |
| Industrials — 3.49% | | | | | | | | |
| Daifuku Co. Ltd - ADR(a) | | | 42 | | | | 946 | |
| FANUC Corp. - ADR | | | 99 | | | | 2,161 | |
| SMC Corp. - ADR | | | 98 | | | | 3,137 | |
| Yaskawa Electric Corp. - ADR(a) | | | 18 | | | | 1,757 | |
| | | | | | | | 8,001 | |
| Total Japan | | | | | | | 8,001 | |
| | | | | | | | | |
| Korea (Republic Of) — 2.14% | | | | | | | | |
| Technology — 2.14% | | | | | | | | |
| Samsung Electronics Co. Ltd. - GDR | | | 3 | | | | 4,907 | |
| Total Korea (Republic Of) | | | | | | | 4,907 | |
| | | | | | | | | |
| Netherlands — 3.46% | | | | | | | | |
| Financials — 0.56% | | | | | | | | |
| ING Groep NV | | | 93 | | | | 1,285 | |
| | | | | | | | | |
| Technology — 2.90% | | | | | | | | |
| ASML Holding NV | | | 8 | | | | 6,655 | |
| | | | | | | | | |
| Total Netherlands | | | | | | | 7,940 | |
See accompanying notes which are an integral part of these financial statements.
| FISHER INVESTMENTS INSTITUTIONAL GROUP |
| STOCK FUND FOR RETIREMENT PLANS |
| SCHEDULE OF INVESTMENTS – (continued) |
| August 31, 2021 |
| | | Shares | | | Fair Value | |
| COMMON STOCKS — 99.37% - continued | | | | | | |
| | | | | | | |
| Spain — 0.73% | | | | | | |
| Financials — 0.73% | | | | | | |
| Banco Bilbao Vizcaya Argentaria SA | | | 142 | | | $ | 930 | |
| Banco Santander SA(a) | | | 198 | | | | 731 | |
| | | | | | | | 1,661 | |
| Total Spain | | | | | | | 1,661 | |
| | | | | | | | | |
| Switzerland — 0.72% | | | | | | | | |
| Health Care — 0.72% | | | | | | | | |
| Novartis AG | | | 18 | | | | 1,666 | |
| Total Switzerland | | | | | | | 1,666 | |
| | | | | | | | | |
| Taiwan Province Of China — 3.53% | | | | | | | | |
| Technology — 3.53% | | | | | | | | |
| Taiwan Semiconductor Manufacturing Co. Ltd. - ADR | | | 68 | | | | 8,093 | |
| Total Taiwan Province Of China | | | | | | | 8,093 | |
| | | | | | | | | |
| United Kingdom — 1.87% | | | | | | | | |
| Energy — 0.87% | | | | | | | | |
| BP PLC | | | 149 | | | | 608 | |
| Royal Dutch Shell PLC(a) | | | 69 | | | | 1,371 | |
| | | | | | | | 1,979 | |
| Health Care — 1.00% | | | | | | | | |
| AstraZeneca PLC | | | 12 | | | | 1,405 | |
| GlaxoSmithKline PLC | | | 44 | | | | 885 | |
| | | | | | | | 2,290 | |
| Total United Kingdom | | | | | | | 4,269 | |
| | | | | | | | | |
| United States — 67.27% | | | | | | | | |
| Communications — 7.85% | | | | | | | | |
| Alphabet, Inc., Class A(a) | | | 4 | | | | 11,576 | |
| Facebook, Inc., Class A(a) | | | 11 | | | | 4,173 | |
| Netflix, Inc.(a) | | | 4 | | | | 2,277 | |
| | | | | | | | 18,026 | |
See accompanying notes which are an integral part of these financial statements.
| FISHER INVESTMENTS INSTITUTIONAL GROUP |
| STOCK FUND FOR RETIREMENT PLANS |
| SCHEDULE OF INVESTMENTS – (continued) |
| August 31, 2021 |
| | | Shares | | | Fair Value | |
| COMMON STOCKS — 99.37% - continued | | | | | | |
| | | | | | | |
| United States — 67.27% - continued | | | | | | | | |
| Consumer Discretionary — 5.20% | | | | | | | | |
| Amazon.com, Inc.(a) | | | 2 | | | $ | 6,942 | |
| Home Depot, Inc. (The) | | | 8 | | | | 2,610 | |
| NIKE, Inc., Class B | | | 8 | | | | 1,318 | |
| Starbucks Corp. | | | 9 | | | | 1,057 | |
| | | | | | | | 11,927 | |
| Consumer Staples — 4.02% | | | | | | | | |
| Costco Wholesale Corp. | | | 10 | | | | 4,555 | |
| Procter & Gamble Co. (The) | | | 13 | | | | 1,851 | |
| Walmart, Inc. | | | 19 | | | | 2,814 | |
| | | | | | | | 9,220 | |
| Energy — 1.83% | | | | | | | | |
| Chevron Corp. | | | 15 | | | | 1,452 | |
| Exxon Mobil Corp. | | | 21 | | | | 1,145 | |
| Marathon Oil Corp. | | | 40 | | | | 470 | |
| Schlumberger Ltd. | | | 41 | | | | 1,150 | |
| | | | | | | | 4,217 | |
| Financials — 5.16% | | | | | | | | |
| American Express Co. | | | 13 | | | | 2,157 | |
| BlackRock, Inc. | | | 3 | | | | 2,830 | |
| Goldman Sachs Group, Inc. (The) | | | 5 | | | | 2,068 | |
| JPMorgan Chase & Co. | | | 11 | | | | 1,760 | |
| Morgan Stanley | | | 29 | | | | 3,028 | |
| | | | | | | | 11,843 | |
| Health Care — 9.45% | | | | | | | | |
| Abbott Laboratories | | | 9 | | | | 1,137 | |
| Align Technology, Inc.(a) | | | 7 | | | | 4,962 | |
| Clovis Oncology, Inc.(a) | | | 23 | | | | 111 | |
| Danaher Corp. | | | 5 | | | | 1,621 | |
| Edwards LifeSciences Corp.(a) | | | 9 | | | | 1,055 | |
| Eli Lilly & Co. | | | 14 | | | | 3,615 | |
| Exact Sciences Corp.(a) | | | 7 | | | | 731 | |
| Intuitive Surgical, Inc.(a) | | | 3 | | | | 3,161 | |
| Merck & Co., Inc. | | | 17 | | | | 1,297 | |
| Organon & Co. | | | 1 | | | | 34 | |
| PTC Therapeutics, Inc.(a) | | | 15 | | | | 655 | |
See accompanying notes which are an integral part of these financial statements.
| FISHER INVESTMENTS INSTITUTIONAL GROUP |
| STOCK FUND FOR RETIREMENT PLANS |
| SCHEDULE OF INVESTMENTS – (continued) |
| August 31, 2021 |
| | | Shares | | | Fair Value | |
| COMMON STOCKS — 99.37% - continued | | | | | | |
| | | | | | | |
| United States — 67.27% - continued | | | | | | | | |
| Health Care — 9.45% - continued | | | | | | | | |
| Puma Biotechnology, Inc.(a) | | | 17 | | | $ | 129 | |
| Sarepta Therapeutics, Inc.(a) | | | 5 | | | | 391 | |
| Stryker Corp. | | | 6 | | | | 1,663 | |
| Thermo Fisher Scientific, Inc. | | | 2 | | | | 1,110 | |
| | | | | | | | 21,672 | |
| Industrials — 3.76% | | | | | | | | |
| AeroVironment, Inc.(a) | | | 14 | | | | 1,432 | |
| Boeing Co. (The) | | | 3 | | | | 659 | |
| Carrier Global Corp. | | | 6 | | | | 346 | |
| Cummins, Inc. | | | 4 | | | | 944 | |
| Deere & Co. | | | 4 | | | | 1,512 | |
| Kansas City Southern | | | 7 | | | | 1,965 | |
| Otis Worldwide Corp. | | | 3 | | | | 277 | |
| Raytheon Technologies Corp. | | | 6 | | | | 509 | |
| Rockwell Automation, Inc. | | | 3 | | | | 976 | |
| | | | | | | | 8,620 | |
| Materials — 1.02% | | | | | | | | |
| Cleveland-Cliffs, Inc. | | | 69 | | | | 1,619 | |
| Materion Corp. | | | 10 | | | | 730 | |
| | | | | | | | 2,349 | |
| Technology — 28.98% | | | | | | | | |
| Adobe, Inc.(a) | | | 10 | | | | 6,637 | |
| Apple, Inc. | | | 72 | | | | 10,931 | |
| Autodesk, Inc.(a) | | | 7 | | | | 2,171 | |
| Cisco Systems, Inc. | | | 28 | | | | 1,653 | |
| Intel Corp. | | | 60 | | | | 3,244 | |
| MasterCard, Inc., Class A | | | 22 | | | | 7,617 | |
| Microsoft Corp. | | | 37 | | | | 11,170 | |
| NVIDIA Corp. | | | 44 | | | | 9,849 | |
| Oracle Corp. | | | 42 | | | | 3,743 | |
| Paycom Software, Inc.(a) | | | 6 | | | | 2,933 | |
See accompanying notes which are an integral part of these financial statements.
| FISHER INVESTMENTS INSTITUTIONAL GROUP |
| STOCK FUND FOR RETIREMENT PLANS |
| SCHEDULE OF INVESTMENTS – (continued) |
| August 31, 2021 |
| | | Shares | | | Fair Value | |
| COMMON STOCKS — 99.37% - continued | | | | | | |
| | | | | | | |
| United States — 67.27% - continued | | | | | | | | |
| Technology — 28.98% - continued | | | | | | | | |
| salesforce.com, Inc.(a) | | | 16 | | | $ | 4,244 | |
| Visa, Inc., Class A | | | 10 | | | | 2,291 | |
| | | | | | | | 66,483 | |
| Total United States | | | | | | | 154,357 | |
| | | | | | | | | |
| Total Common Stocks— 99.37% (Cost $151,888) | | | | | | | 227,973 | |
| | | | | | | | | |
| MONEY MARKET FUNDS — 0.44% | | | | | | | | |
| First American Government Obligations Fund, Class X, 0.03%(b) | | | 1,000 | | | | 1,000 | |
| | | | | | | | | |
| Total Money Market Funds — 0.44% (Cost $1,000) | | | | | | | 1,000 | |
| Total Investments — 99.81% (Cost $152,888) | | | | | | | 228,973 | |
| Other Assets in Excess of Liabilities — 0.19% | | | | | | | 445 | |
| NET ASSETS — 100.00% | | | | | | $ | 229,418 | |
| (a) | Non-income producing security. |
| (b) | Rate disclosed is the seven day effective yield as of August 31, 2021. |
ADR - American Depositary Receipt.
GDR - Global Depositary Receipt.
See accompanying notes which are an integral part of these financial statements.
| FISHER INVESTMENTS INSTITUTIONAL GROUP |
| ESG STOCK FUND FOR RETIREMENT PLANS |
| SCHEDULE OF INVESTMENTS |
| August 31, 2021 |
| | | Shares | | | Fair Value | |
| COMMON STOCKS — 99.33% | | | | | | |
| | | | | | | |
| Argentina — 0.82% | | | | | | |
| Consumer Discretionary — 0.82% | | | | | | | | |
| MercadoLibre, Inc.(a) | | | 1 | | | $ | 1,867 | |
| Total Argentina | | | | | | | 1,867 | |
| | | | | | | | | |
| Australia — 1.32% | | | | | | | | |
| Materials — 1.32% | | | | | | | | |
| OZ Minerals Ltd.(a) | | | 70 | | | | 1,207 | |
| Rio Tinto Ltd. | | | 22 | | | | 1,802 | |
| | | | | | | | 3,009 | |
| Total Australia | | | | | | | 3,009 | |
| | | | | | | | | |
| Canada — 0.32% | | | | | | | | |
| Materials — 0.32% | | | | | | | | |
| Lundin Mining Corp. | | | 90 | | | | 728 | |
| Total Canada | | | | | | | 728 | |
| | | | | | | | | |
| China — 5.33% | | | | | | | | |
| Communications — 2.85% | | | | | | | | |
| 51job Inc. - ADR(a) | | | 8 | | | | 614 | |
| Tencent Holdings Ltd. - ADR | | | 79 | | | | 4,871 | |
| Trip.com Group Ltd. - ADR(a) | | | 33 | | | | 1,006 | |
| | | | | | | | 6,491 | |
| Consumer Discretionary — 2.48% | | | | | | | | |
| Alibaba Group Holding Ltd. - ADR(a) | | | 16 | | | | 2,672 | |
| JD.com, Inc. - ADR(a) | | | 38 | | | | 2,985 | |
| | | | | | | | 5,657 | |
| Total China | | | | | | | 12,148 | |
| | | | | | | | | |
| Colombia — 0.71% | | | | | | | | |
| Energy — 0.71% | | | | | | | | |
| Ecopetrol SA - ADR | | | 116 | | | | 1,619 | |
| Total Colombia | | | | | | | 1,619 | |
| | | | | | | | | |
| France — 4.07% | | | | | | | | |
| Consumer Discretionary — 1.15% | | | | | | | | |
| Kering SA - ADR(a) | | | 33 | | | | 2,624 | |
See accompanying notes which are an integral part of these financial statements.
| FISHER INVESTMENTS INSTITUTIONAL GROUP |
| ESG STOCK FUND FOR RETIREMENT PLANS |
| SCHEDULE OF INVESTMENTS – (continued) |
| August 31, 2021 |
| | | Shares | | | Fair Value | |
| COMMON STOCKS — 99.33% - continued | | | | | | |
| | | | | | | |
| France — 4.07% - continued | | | | | | | | |
| Financials — 0.42% | | | | | | | | |
| BNP Paribas SA | | | 15 | | | $ | 952 | |
| | | | | | | | | |
| Health Care — 0.50% | | | | | | | | |
| Sanofi | | | 11 | | | | 1,138 | |
| | | | | | | | | |
| Technology — 2.00% | | | | | | | | |
| Dassault Systems SE | | | 80 | | | | 4,563 | |
| | | | | | | | | |
| Total France | | | | | | | 9,277 | |
| | | | | | | | | |
| Germany — 1.06% | | | | | | | | |
| Consumer Discretionary — 0.35% | | | | | | | | |
| Sixt SE(a) | | | 6 | | | | 806 | |
| | | | | | | | | |
| Industrials — 0.71% | | | | | | | | |
| Siemens AG | | | 9 | | | | 1,497 | |
| Siemens Energy AG(a) | | | 4 | | | | 116 | |
| | | | | | | | 1,613 | |
| Total Germany | | | | | | | 2,419 | |
| | | | | | | | | |
| Hong Kong — 0.53% | | | | | | | | |
| Health Care — 0.53% | | | | | | | | |
| Sino Biopharmaceutical Ltd. - ADR(a) | | | 76 | | | | 1,218 | |
| Total Hong Kong | | | | | | | 1,218 | |
| | | | | | | | | |
| Italy — 0.80% | | | | | | | | |
| Energy — 0.33% | | | | | | | | |
| Eni SpA | | | 61 | | | | 753 | |
| | | | | | | | | |
| Financials — 0.47% | | | | | | | | |
| Intesa Sanpaolo SpA | | | 380 | | | | 1,076 | |
| | | | | | | | | |
| Total Italy | | | | | | | 1,829 | |
See accompanying notes which are an integral part of these financial statements.
| FISHER INVESTMENTS INSTITUTIONAL GROUP |
| ESG STOCK FUND FOR RETIREMENT PLANS |
| SCHEDULE OF INVESTMENTS – (continued) |
| August 31, 2021 |
| | | Shares | | | Fair Value | |
| COMMON STOCKS — 99.33% - continued | | | | | | |
| | | | | | | |
| Japan — 2.46% | | | | | | |
| Industrials — 2.46% | | | | | | |
| Daifuku Co. Ltd - ADR(a) | | | 43 | | | $ | 969 | |
| FANUC Corp. - ADR | | | 92 | | | | 2,008 | |
| Yaskawa Electric Corp. - ADR(a) | | | 27 | | | | 2,636 | |
| | | | | | | | 5,613 | |
| Total Japan | | | | | | | 5,613 | |
| | | | | | | | | |
| Korea (Republic Of) — 1.44% | | | | | | | | |
| Technology — 1.44% | | | | | | | | |
| Samsung Electronics Co. Ltd. - GDR | | | 2 | | | | 3,271 | |
| Total Korea (Republic Of) | | | | | | | 3,271 | |
| | | | | | | | | |
| Netherlands — 2.92% | | | | | | | | |
| Technology — 2.92% | | | | | | | | |
| ASML Holding NV | | | 8 | | | | 6,655 | |
| Total Netherlands | | | | | | | 6,655 | |
| | | | | | | | | |
| Spain — 1.33% | | | | | | | | |
| Energy — 0.60% | | | | | | | | |
| Repsol SA | | | 119 | | | | 1,364 | |
| | | | | | | | | |
| Financials — 0.73% | | | | | | | | |
| Banco Bilbao Vizcaya Argentaria SA | | | 137 | | | | 897 | |
| Banco Santander SA(a) | | | 208 | | | | 768 | |
| | | | | | | | 1,665 | |
| Total Spain | | | | | | | 3,029 | |
| | | | | | | | | |
| Switzerland — 0.67% | | | | | | | | |
| Industrials — 0.67% | | | | | | | | |
| ABB Ltd. | | | 41 | | | | 1,519 | |
| Total Switzerland | | | | | | | 1,519 | |
| | | | | | | | | |
| Taiwan Province Of China — 3.50% | | | | | | | | |
| Technology — 3.50% | | | | | | | | |
| Taiwan Semiconductor Manufacturing Co. Ltd. - ADR | | | 67 | | | | 7,974 | |
| Total Taiwan Province Of China | | | | | | | 7,974 | |
See accompanying notes which are an integral part of these financial statements.
| FISHER INVESTMENTS INSTITUTIONAL GROUP |
| ESG STOCK FUND FOR RETIREMENT PLANS |
| SCHEDULE OF INVESTMENTS – (continued) |
| August 31, 2021 |
| | | Shares | | | Fair Value | |
| COMMON STOCKS — 99.33% - continued | | | | | | |
| | | | | | | |
| United Kingdom — 2.85% | | | | | | | | |
| Consumer Staples — 0.64% | | | | | | | | |
| Unilever PLC | | | 26 | | | $ | 1,447 | |
| | | | | | | | | |
| Energy — 0.86% | | | | | | | | |
| BP PLC | | | 479 | | | | 1,956 | |
| | | | | | | | | |
| Health Care — 1.04% | | | | | | | | |
| AstraZeneca PLC | | | 12 | | | | 1,405 | |
| GlaxoSmithKline PLC | | | 48 | | | | 965 | |
| | | | | | | | 2,370 | |
| Materials — 0.31% | | | | | | | | |
| Antofagasta PLC | | | 35 | | | | 701 | |
| | | | | | | | | |
| Total United Kingdom | | | | | | | 6,474 | |
| | | | | | | | | |
| United States — 69.20% | | | | | | | | |
| Communications — 7.91% | | | | | | | | |
| Alphabet, Inc., Class A(a) | | | 4 | | | | 11,576 | |
| Facebook, Inc., Class A(a) | | | 11 | | | | 4,173 | |
| Netflix, Inc.(a) | | | 4 | | | | 2,277 | |
| | | | | | | | 18,026 | |
| Consumer Discretionary — 5.24% | | | | | | | | |
| Amazon.com, Inc.(a) | | | 2 | | | | 6,942 | |
| Home Depot, Inc. (The) | | | 8 | | | | 2,610 | |
| NIKE, Inc., Class B | | | 8 | | | | 1,318 | |
| Starbucks Corp. | | | 9 | | | | 1,057 | |
| | | | | | | | 11,927 | |
| Consumer Staples — 3.22% | | | | | | | | |
| Costco Wholesale Corp. | | | 8 | | | | 3,644 | |
| PepsiCo, Inc. | | | 11 | | | | 1,720 | |
| Procter & Gamble Co. (The) | | | 14 | | | | 1,994 | |
| | | | | | | | 7,358 | |
| Energy — 1.85% | | | | | | | | |
| Exxon Mobil Corp. | | | 45 | | | | 2,452 | |
| Marathon Oil Corp. | | | 54 | | | | 635 | |
| Schlumberger Ltd. | | | 40 | | | | 1,122 | |
| | | | | | | | 4,209 | |
See accompanying notes which are an integral part of these financial statements.
| FISHER INVESTMENTS INSTITUTIONAL GROUP |
| ESG STOCK FUND FOR RETIREMENT PLANS |
| SCHEDULE OF INVESTMENTS – (continued) |
| August 31, 2021 |
| | | Shares | | | Fair Value | |
| COMMON STOCKS — 99.33% - continued | | | | | | |
| | | | | | | |
| United States — 69.20% - continued | | | | | | | | |
| Financials — 5.06% | | | | | | | | |
| American Express Co. | | | 14 | | | $ | 2,323 | |
| BlackRock, Inc. | | | 3 | | | | 2,830 | |
| Goldman Sachs Group, Inc. (The) | | | 5 | | | | 2,068 | |
| JPMorgan Chase & Co. | | | 10 | | | | 1,599 | |
| Morgan Stanley | | | 26 | | | | 2,715 | |
| | | | | | | | 11,535 | |
| Health Care — 10.86% | | | | | | | | |
| Abbott Laboratories | | | 9 | | | | 1,137 | |
| Align Technology, Inc.(a) | | | 7 | | | | 4,962 | |
| Danaher Corp. | | | 5 | | | | 1,621 | |
| Edwards LifeSciences Corp.(a) | | | 9 | | | | 1,055 | |
| Eli Lilly & Co. | | | 16 | | | | 4,132 | |
| Exact Sciences Corp.(a) | | | 8 | | | | 835 | |
| Intuitive Surgical, Inc.(a) | | | 3 | | | | 3,161 | |
| Merck & Co., Inc. | | | 19 | | | | 1,450 | |
| Organon & Co. | | | 1 | | | | 34 | |
| PTC Therapeutics, Inc.(a) | | | 14 | | | | 611 | |
| Puma Biotechnology, Inc.(a) | | | 61 | | | | 462 | |
| Sarepta Therapeutics, Inc.(a) | | | 5 | | | | 391 | |
| Stryker Corp. | | | 6 | | | | 1,663 | |
| Thermo Fisher Scientific, Inc. | | | 4 | | | | 2,220 | |
| Vertex Pharmaceuticals, Inc.(a) | | | 5 | | | | 1,001 | |
| | | | | | | | 24,735 | |
| Industrials — 3.77% | | | | | | | | |
| Cummins, Inc. | | | 4 | | | | 944 | |
| Deere & Co. | | | 4 | | | | 1,512 | |
| HEICO Corp. | | | 10 | | | | 1,268 | |
| Kansas City Southern | | | 6 | | | | 1,684 | |
| Rockwell Automation, Inc. | | | 8 | | | | 2,603 | |
| Spirit AeroSystems Holdings, Inc., Class A(a) | | | 15 | | | | 589 | |
| | | | | | | | 8,600 | |
| Materials — 1.04% | | | | | | | | |
| Cleveland-Cliffs, Inc. | | | 70 | | | | 1,643 | |
| Materion Corp. | | | 10 | | | | 730 | |
| | | | | | | | 2,373 | |
See accompanying notes which are an integral part of these financial statements.
| FISHER INVESTMENTS INSTITUTIONAL GROUP |
| ESG STOCK FUND FOR RETIREMENT PLANS |
| SCHEDULE OF INVESTMENTS – (continued) |
| August 31, 2021 |
| | | Shares | | | Fair Value | |
| COMMON STOCKS — 99.33% - continued | | | | | | |
| | | | | | | |
| United States — 69.20% - continued | | | | | | | | |
| Technology — 30.25% | | | | | | | | |
| Adobe, Inc.(a) | | | 10 | | | $ | 6,637 | |
| Apple, Inc. | | | 76 | | | | 11,539 | |
| Autodesk, Inc.(a) | | | 7 | | | | 2,171 | |
| Cisco Systems, Inc. | | | 28 | | | | 1,653 | |
| Intel Corp. | | | 56 | | | | 3,027 | |
| MasterCard, Inc., Class A | | | 23 | | | | 7,963 | |
| Microsoft Corp. | | | 37 | | | | 11,170 | |
| NVIDIA Corp. | | | 44 | | | | 9,849 | |
| Oracle Corp. | | | 45 | | | | 4,011 | |
| Paycom Software, Inc.(a) | | | 6 | | | | 2,933 | |
| salesforce.com, Inc.(a) | | | 17 | | | | 4,510 | |
| Visa, Inc., Class A | | | 15 | | | | 3,437 | |
| | | | | | | | 68,900 | |
| Total United States | | | | | | | 157,663 | |
| | | | | | | | | |
| Total Common Stocks— 99.33% (Cost $151,038) | | | | | | | 226,312 | |
| | | | | | | | | |
| MONEY MARKET FUNDS — 0.47% | | | | | | | | |
| First American Government Obligations Fund, Class X, 0.03%(b) | | | 1,080 | | | | 1,080 | |
| | | | | | | | | |
| Total Money Market Funds — 0.47% (Cost $1,080) | | | | | | | 1,080 | |
| Total Investments — 99.80% (Cost $152,118) | | | | | | | 227,392 | |
| Other Assets in Excess of Liabilities — 0.20% | | | | | | | 452 | |
| NET ASSETS — 100.00% | | | | | | $ | 227,844 | |
| (a) | Non-income producing security. |
| (b) | Rate disclosed is the seven day effective yield as of August 31, 2021. |
ADR - American Depositary Receipt.
GDR - Global Depositary Receipt.
See accompanying notes which are an integral part of these financial statements.
| FISHER INVESTMENTS INSTITUTIONAL GROUP |
| FIXED INCOME FUND FOR RETIREMENT PLANS |
| SCHEDULE OF INVESTMENTS |
| August 31, 2021 |
| | | Principal | | | | |
| | | Amount | | | Fair Value | |
| CORPORATE BONDS — 49.47% | | | | | | |
| | | | | | | |
| Communications — 5.98% | | | | | | |
| Comcast Corp., 3.55%, 5/1/2028 | | $ | 100,000 | | | $ | 111,991 | |
| TWDC Enterprises 18 Corp., 3.15%, 9/17/2025 | | | 75,000 | | | | 81,571 | |
| | | | | | | | 193,562 | |
| Consumer Staples — 4.29% | | | | | | | | |
| Procter & Gamble Co. (The), 5.50%, 2/1/2034 | | | 100,000 | | | | 138,698 | |
| | | | | | | | | |
| Energy — 1.92% | | | | | | | | |
| Chevron Corp., 2.24%, 5/11/2030 | | | 60,000 | | | | 62,167 | |
| | | | | | | | | |
| Financials — 13.57% | | | | | | | | |
| BlackRock, Inc., 3.25%, 4/30/2029 | | | 100,000 | | | | 111,559 | |
| Citigroup, Inc., 3.50%, 5/15/2023 | | | 100,000 | | | | 105,032 | |
| Goldman Sachs Group, Inc. (The), 3.50%, 11/16/2026 | | | 100,000 | | | | 108,935 | |
| JPMorgan Chase & Co., 4.13%, 12/15/2026 | | | 100,000 | | | | 113,441 | |
| | | | | | | | 438,967 | |
| Health Care — 6.69% | | | | | | | | |
| Bristol-Myers Squibb Co., 4.55%, 2/20/2048 | | | 100,000 | | | | 131,661 | |
| Pfizer, Inc., 3.45%, 3/15/2029 | | | 75,000 | | | | 84,727 | |
| | | | | | | | 216,388 | |
| Industrials — 2.96% | | | | | | | | |
| Southwest Airlines Co., 7.38%, 3/1/2027 | | | 75,000 | | | | 95,778 | |
| | | | | | | | | |
| Technology — 14.06% | | | | | | | | |
| Cisco Systems, Inc., 2.95%, 2/28/2026 | | | 100,000 | | | | 109,012 | |
| International Business Machines Corp., 4.25%, 5/15/2049 | | | 100,000 | | | | 125,170 | |
| Microsoft Corp., 3.30%, 2/6/2027 | | | 100,000 | | | | 111,537 | |
| Oracle Corp., 3.25%, 11/15/2027 | | | 100,000 | | | | 109,139 | |
| | | | | | | | 454,858 | |
| Total Corporate Bonds (Cost $1,525,745) | | | | | | | 1,600,418 | |
See accompanying notes which are an integral part of these financial statements.
| FISHER INVESTMENTS INSTITUTIONAL GROUP |
| FIXED INCOME FUND FOR RETIREMENT PLANS |
| SCHEDULE OF INVESTMENTS – (continued) |
| August 31, 2021 |
| | | Principal | | | | |
| | | Amount | | | Fair Value | |
| U.S. GOVERNMENT & AGENCIES — 31.82% | | | | | | |
| | | | | | | |
| United States Treasury Note, 0.13%, 9/15/2023 | | $ | 220,200 | | | $ | 219,796 | |
| United States Treasury Note, 1.50%, 9/30/2024 | | | 209,700 | | | | 216,695 | |
| United States Treasury Note, 2.63%, 2/15/2029 | | | 287,100 | | | | 318,278 | |
| United States Treasury Bond, 4.63%, 2/15/2040 | | | 187,300 | | | | 274,738 | |
| Total U.S. Government & Agencies (Cost $1,011,859) | | | | | | | 1,029,507 | |
| | | | | | | | | |
| EXCHANGE-TRADED FUNDS — 16.63% | | Shares | | | | | |
| iShares MBS ETF | | | 4,956 | | | | 538,172 | |
| Total Exchange-Traded Funds (Cost $535,296) | | | | | | | 538,172 | |
| | | | | | | | | |
| MONEY MARKET FUNDS — 1.59% | | | | | | | | |
| First American Government Obligations Fund, Class X, 0.03%(a) | | | 51,465 | | | | 51,465 | |
| | | | | | | | | |
| Total Money Market Funds — 1.59% (Cost $51,465) | | | | | | | 51,465 | |
| Total Investments — 99.51% (Cost $3,124,365) | | | | | | | 3,219,562 | |
| Other Assets in Excess of Liabilities — 0.49% | | | | | | | 15,984 | |
| NET ASSETS — 100.00% | | | | | | $ | 3,235,546 | |
| (a) | Rate disclosed is the seven day effective yield as of August 31, 2021. |
See accompanying notes which are an integral part of these financial statements.
| FISHER INVESTMENTS INSTITUTIONAL GROUP |
| ESG FIXED INCOME FUND FOR RETIREMENT PLANS |
| SCHEDULE OF INVESTMENTS |
| August 31, 2021 |
| | | Principal | | | | |
| | | Amount | | | Fair Value | |
| CORPORATE BONDS — 49.70% | | | | | | |
| | | | | | | |
| Communications — 8.02% | | | | | | |
| Comcast Corp., 3.55%, 5/1/2028 | | $ | 100,000 | | | $ | 111,991 | |
| TWDC Enterprises 18 Corp., 3.15%, 9/17/2025 | | | 135,000 | | | | 146,827 | |
| | | | | | | | 258,818 | |
| Consumer Staples — 4.30% | | | | | | | | |
| Procter & Gamble Co. (The), 5.50%, 2/1/2034 | | | 100,000 | | | | 138,698 | |
| | | | | | | | | |
| Financials — 13.60% | | | | | | | | |
| BlackRock, Inc., 3.25%, 4/30/2029 | | | 100,000 | | | | 111,559 | |
| Citigroup, Inc., 3.50%, 5/15/2023 | | | 100,000 | | | | 105,032 | |
| Goldman Sachs Group, Inc. (The), 3.50%, 11/16/2026 | | | 100,000 | | | | 108,935 | |
| JPMorgan Chase & Co., 4.13%, 12/15/2026 | | | 100,000 | | | | 113,441 | |
| | | | | | | | 438,967 | |
| Health Care — 6.71% | | | | | | | | |
| Bristol-Myers Squibb Co., 4.55%, 2/20/2048 | | | 100,000 | | | | 131,661 | |
| Pfizer, Inc., 3.45%, 3/15/2029 | | | 75,000 | | | | 84,727 | |
| | | | | | | | 216,388 | |
| Industrials — 2.97% | | | | | | | | |
| Southwest Airlines Co., 7.38%, 3/1/2027 | | | 75,000 | | | | 95,778 | |
| | | | | | | | | |
| Technology — 14.10% | | | | | | | | |
| Cisco Systems, Inc., 2.95%, 2/28/2026 | | | 100,000 | | | | 109,012 | |
| International Business Machines Corp., 4.25%, 5/15/2049 | | | 100,000 | | | | 125,170 | |
| Microsoft Corp., 3.30%, 2/6/2027 | | | 100,000 | | | | 111,537 | |
| Oracle Corp., 3.25%, 11/15/2027 | | | 100,000 | | | | 109,139 | |
| | | | | | | | 454,858 | |
| Total Corporate Bonds (Cost $1,527,643) | | | | | | | 1,603,507 | |
| | | | | | | | | |
| U.S. GOVERNMENT & AGENCIES — 31.89% | | | | | | | | |
| United States Treasury Note, 0.13%, 9/15/2023 | | | 220,400 | | | | 219,995 | |
| United States Treasury Note, 1.50%, 9/30/2024 | | | 209,900 | | | | 216,902 | |
| United States Treasury Note, 2.63%, 2/15/2029 | | | 286,700 | | | | 317,834 | |
| United States Treasury Bond, 4.63%, 2/15/2040 | | | 187,100 | | | | 274,445 | |
| Total U.S. Government & Agencies (Cost $1,011,553) | | | | | | | 1,029,176 | |
See accompanying notes which are an integral part of these financial statements.
| FISHER INVESTMENTS INSTITUTIONAL GROUP |
| ESG FIXED INCOME FUND FOR RETIREMENT PLANS |
| SCHEDULE OF INVESTMENTS – (continued) |
| August 31, 2021 |
| | | Shares | | | Fair Value | |
| EXCHANGE-TRADED FUNDS — 16.57% | | | | | | |
| | | | | | | |
| iShares MBS ETF | | | 4,925 | | | $ | 534,806 | |
| Total Exchange-Traded Funds (Cost $531,946) | | | | | | | 534,806 | |
| | | | | | | | | |
| MONEY MARKET FUNDS — 1.33% | | | | | | | | |
| First American Government Obligations Fund, Class X, 0.03%(a) | | | 42,886 | | | | 42,886 | |
| | | | | | | | | |
| Total Money Market Funds — 1.33% (Cost $42,886) | | | | | | | 42,886 | |
| Total Investments — 99.49% (Cost $3,114,028) | | | | | | | 3,210,375 | |
| Other Assets in Excess of Liabilities — 0.51% | | | | | | | 16,435 | |
| NET ASSETS — 100.00% | | | | | | $ | 3,226,810 | |
| (a) | Rate disclosed is the seven day effective yield as of August 31, 2021. |
See accompanying notes which are an integral part of these financial statements.
| FISHER INVESTMENTS INSTITUTIONAL GROUP FUND FAMILY |
| STATEMENTS OF ASSETS AND LIABILITIES |
| August 31, 2021 |
| | Fisher Investments Institutional Group |
| | | | | | ESG | | | Fixed | | | ESG Fixed | |
| | | Stock Fund | | | Stock Fund | | | Income Fund | | | Income Fund | |
| | | for Retirement | | | for Retirement | | | for Retirement | | | for Retirement | |
| | | Plans | | | Plans | | | Plans | | | Plans | |
| Assets | | | | | | | | | | | | | | | | |
| Investments in securities at value (cost $152,888, $152,118, $3,124,365 and $3,114,028) | | $ | 228,973 | | | $ | 227,392 | | | $ | 3,219,562 | | | $ | 3,210,375 | |
| Cash | | | 102 | | | | 96 | | | | — | | | | — | |
| Dividends and interest receivable | | | 343 | | | | 356 | | | | 15,984 | | | | 16,435 | |
| Total Assets | | | 229,418 | | | | 227,844 | | | | 3,235,546 | | | | 3,226,810 | |
| Net Assets | | $ | 229,418 | | | $ | 227,844 | | | $ | 3,235,546 | | | $ | 3,226,810 | |
| Net Assets consist of: | | | | | | | | | | | | | | | | |
| Paid-in capital | | | 152,282 | | | | 152,469 | | | | 3,100,655 | | | | 3,101,505 | |
| Accumulated earnings | | | 77,136 | | | | 75,375 | | | | 134,891 | | | | 125,305 | |
| Net Assets | | $ | 229,418 | | | $ | 227,844 | | | $ | 3,235,546 | | | $ | 3,226,810 | |
| Shares outstanding (unlimited number of shares authorized, no par value) | | | 15,182 | | | | 15,199 | | | | 309,782 | | | | 309,874 | |
| Net asset value (“NAV”) and offering price per share | | $ | 15.11 | | | $ | 14.98 | (a) | | $ | 10.44 | | | $ | 10.41 | |
| (a) | Per share amounts may not recalculate due to rounding of net assets and/or shares outstanding. |
See accompanying notes which are an integral part of these financial statements.
| FISHER INVESTMENTS INSTITUTIONAL GROUP FUND FAMILY |
| STATEMENTS OF OPERATIONS |
| For the year ended August 31, 2021 |
| | | Fisher Investments Institutional Group | |
| | | | | | ESG | | | Fixed | | | ESG Fixed | |
| | | Stock Fund | | | Stock Fund | | | Income Fund | | | Income Fund | |
| | | for Retirement | | | for Retirement | | | for Retirement | | | for Retirement | |
| | | Plans | | | Plans | | | Plans | | | Plans | |
| Investment Income | | | | | | | | | | | | | | | | |
| Dividend income | | $ | 2,785 | | | $ | 2,652 | | | $ | 22,365 | | | $ | 22,415 | |
| Interest income | | | — | | | | — | | | | 41,303 | | | | 40,888 | |
| Foreign dividend taxes withheld | | | (260 | ) | | | (221 | ) | | | — | | | | — | |
| Total investment income | | | 2,525 | | | | 2,431 | | | | 63,668 | | | | 63,303 | |
| Net investment income | | | 2,525 | | | | 2,431 | | | | 63,668 | | | | 63,303 | |
| Net Realized and Change in Unrealized Gain (Loss) on Investments | | | | | | | | | | | | | | | | |
| Net realized gain (loss) on investment securities transactions | | | (747 | ) | | | (741 | ) | | | 21,246 | | | | 13,053 | |
| Net change in unrealized appreciation (depreciation) of investment securities and foreign currency translations | | | 53,868 | | | | 52,486 | | | | (9,436 | ) | | | (11,549 | ) |
| Net realized and change in unrealized gain on investments and foreign currency | | | 53,121 | | | | 51,745 | | | | 11,810 | | | | 1,504 | |
| Net increase in net assets resulting from operations | | $ | 55,646 | | | $ | 54,176 | | | $ | 75,478 | | | $ | 64,807 | |
See accompanying notes which are an integral part of these financial statements.
| FISHER INVESTMENTS INSTITUTIONAL GROUP FUND FAMILY |
| STATEMENTS OF CHANGES IN NET ASSETS |
| | | Fisher Investments | | | Fisher Investments | |
| | | Institutional Group Stock Fund | | | Institutional Group ESG Stock | |
| | | for Retirement Plans | | | Fund for Retirement Plans | |
| | | For the | | | For the | | | For the | | | For the | |
| | | Year Ended | | | Period Ended | | | Year Ended | | | Period Ended | |
| | | August 31, | | | August 31, | | | August 31, | | | August 31, | |
| | | 2021 | | | 2020(a) | | | 2021 | | | 2020(a) | |
| Increase (Decrease) in Net Assets due to: | | | | | | | | | | | | | | | | |
| Operations | | | | | | | | | | | | | | | | |
| Net investment income | | $ | 2,525 | | | $ | 1,526 | | | $ | 2,431 | | | $ | 1,740 | |
| Net realized gain (loss) on investment securities transactions and foreign currency translations | | | (747 | ) | | | 18 | | | | (741 | ) | | | (870 | ) |
| Net change in unrealized appreciation (depreciation) of investment securities and foreign currency translations | | | 53,868 | | | | 22,218 | | | | 52,486 | | | | 22,788 | |
| Net increase in net assets resulting from operations | | | 55,646 | | | | 23,762 | | | | 54,176 | | | | 23,658 | |
| Distributions to Shareholders From: | | | | | | | | | | | | | | | | |
| Earnings | | | (2,272 | ) | | | — | | | | (2,459 | ) | | | — | |
| Total distributions | | | (2,272 | ) | | | — | | | | (2,459 | ) | | | — | |
| Capital Transactions | | | | | | | | | | | | | | | | |
| Proceeds from shares sold | | | — | | | | 150,010 | | | | — | | | | 150,010 | |
| Reinvestment of distributions | | | 2,272 | | | | — | | | | 2,459 | | | | — | |
| Net increase in net assets resulting from capital transactions | | | 2,272 | | | | 150,010 | | | | 2,459 | | | | 150,010 | |
| Total Increase in Net Assets | | | 55,646 | | | | 173,772 | | | | 54,176 | | | | 173,668 | |
| Net Assets | | | | | | | | | | | | | | | | |
| Beginning of period | | | 173,772 | | | | — | | | | 173,668 | | | | — | |
| End of period | | $ | 229,418 | | | $ | 173,772 | | | $ | 227,844 | | | $ | 173,668 | |
| Share Transactions | | | | | | | | | | | | | | | | |
| Shares sold | | | — | | | | 15,001 | | | | — | | | | 15,001 | |
| Shares issued in reinvestment of distributions | | | 181 | | | | — | | | | 198 | | | | — | |
| Net increase in shares outstanding | | | 181 | | | | 15,001 | | | | 198 | | | | 15,001 | |
| (a) | For the period December 13, 2019 (commencement of operations) to August 31, 2020. |
See accompanying notes which are an integral part of these financial statements.
| FISHER INVESTMENTS INSTITUTIONAL GROUP FUND FAMILY |
| STATEMENTS OF CHANGES IN NET ASSETS – (continued) |
| | | Fisher Investments | | | Fisher Investments | |
| | | Institutional Group Fixed Income | | | Institutional Group ESG Fixed | |
| | | Fund for Retirement Plans | | | Income Fund for Retirement Plans | |
| | | For the | | | For the | | | For the | | | For the | |
| | | Year Ended | | | Period Ended | | | Year Ended | | | Period Ended | |
| | | August 31, | | | August 31, | | | August 31, | | | August 31, | |
| | | 2021 | | | 2020(a) | | | 2021 | | | 2020(a) | |
| Increase (Decrease) in Net Assets due to: | | | | | | | | | | | | | | | | |
| Operations | | | | | | | | | | | | | | | | |
| Net investment income | | $ | 63,668 | | | $ | 55,425 | | | $ | 63,303 | | | $ | 54,097 | |
| Net realized gain on investment securities transactions and foreign currency translations | | | 21,246 | | | | — | | | | 13,053 | | | | — | |
| Net change in unrealized appreciation (depreciation) of investment securities and foreign currency translations | | | (9,436 | ) | | | 104,633 | | | | (11,549 | ) | | | 107,896 | |
| Net increase in net assets resulting from operations | | | 75,478 | | | | 160,058 | | | | 64,807 | | | | 161,993 | |
| Distributions to Shareholders From: | | | | | | | | | | | | | | | | |
| Earnings | | | (100,645 | ) | | | — | | | | (101,495 | ) | | | — | |
| Total distributions | | | (100,645 | ) | | | — | | | | (101,495 | ) | | | — | |
| Capital Transactions | | | | | | | | | | | | | | | | |
| Proceeds from shares sold | | | — | | | | 3,000,010 | | | | — | | | | 3,000,010 | |
| Reinvestment of distributions | | | 100,645 | | | | — | | | | 101,495 | | | | — | |
| Net increase in net assets resulting from capital transactions | | | 100,645 | | | | 3,000,010 | | | | 101,495 | | | | 3,000,010 | |
| Total Increase in Net Assets | | | 75,478 | | | | 3,160,068 | | | | 64,807 | | | | 3,162,003 | |
| Net Assets | | | | | | | | | | | | | | | | |
| Beginning of period | | | 3,160,068 | | | | — | | | | 3,162,003 | | | | — | |
| End of period | | $ | 3,235,546 | | | $ | 3,160,068 | | | $ | 3,226,810 | | | $ | 3,162,003 | |
| Share Transactions | | | | | | | | | | | | | | | | |
| Shares sold | | | — | | | | 300,001 | | | | — | | | | 300,001 | |
| Shares issued in reinvestment of distributions | | | 9,781 | | | | — | | | | 9,873 | | | | — | |
| Net increase in shares outstanding | | | 9,781 | | | | 300,001 | | | | 9,873 | | | | 300,001 | |
| (a) | For the period December 13, 2019 (commencement of operations) to August 31, 2020. |
See accompanying notes which are an integral part of these financial statements.
| FISHER INVESTMENTS INSTITUTIONAL GROUP |
| STOCK FUND FOR RETIREMENT PLANS |
| FINANCIAL HIGHLIGHTS |
| (For a share outstanding during each period) |
| | | | | | For the | |
| | | For the | | | Period | |
| | | Year Ended | | | Ended | |
| | | August 31, | | | August 31, | |
| | | 2021 | | | 2020(a) | |
| Selected Per Share Data: | | | | | | | | |
| Net asset value, beginning of period | | $ | 11.58 | | | $ | 10.00 | |
| Investment operations: | | | | | | | | |
| Net investment income | | | 0.17 | | | | 0.10 | |
| Net realized and unrealized gain | | | 3.51 | | | | 1.48 | |
| Total from investment operations | | | 3.68 | | | | 1.58 | |
| Less distributions to shareholders from: | | | | | | | | |
| Net investment income | | | (0.15 | ) | | | — | |
| Total distributions | | | (0.15 | ) | | | — | |
| Net asset value, end of period | | $ | 15.11 | | | $ | 11.58 | |
| Total Return(b) | | | 32.06 | % | | | 15.80 | % (c) |
| Ratios and Supplemental Data: | | | | | | | | |
| Net assets, end of period (000 omitted) | | $ | 229 | | | $ | 174 | |
| Ratio of net investment income to average net assets | | | 1.27 | % | | | 1.44 | % (d) |
| Portfolio turnover rate | | | 1 | % | | | 12 | % (c) |
| (a) | For the period December 13, 2019 (commencement of operations) to August 31, 2020. |
| (b) | Total return represents the rate that the investor would have earned or lost on an investment in the Fund, assuming reinvestment of distributions. |
See accompanying notes which are an integral part of these financial statements.
| FISHER INVESTMENTS INSTITUTIONAL GROUP |
| ESG STOCK FUND FOR RETIREMENT PLANS |
| FINANCIAL HIGHLIGHTS |
| (For a share outstanding during each period) |
| | | | | | For the | |
| | | For the | | | Period | |
| | | Year Ended | | | Ended | |
| | | August 31, | | | August 31, | |
| | | 2021 | | | 2020(a) | |
| Selected Per Share Data: | | | | | | | | |
| Net asset value, beginning of period | | $ | 11.58 | | | $ | 10.00 | |
| Investment operations: | | | | | | | | |
| Net investment income | | | 0.16 | | | | 0.12 | |
| Net realized and unrealized gain | | | 3.40 | | | | 1.46 | |
| Total from investment operations | | | 3.56 | | | | 1.58 | |
| Less distributions to shareholders from: | | | | | | | | |
| Net investment income | | | (0.16 | ) | | | — | |
| Total distributions | | | (0.16 | ) | | | — | |
| Net asset value, end of period | | $ | 14.98 | | | $ | 11.58 | |
| Total Return(b) | | | 31.07 | % | | | 15.80 | % (c) |
| Ratios and Supplemental Data: | | | | | | | | |
| Net assets, end of period (000 omitted) | | $ | 228 | | | $ | 174 | |
| Ratio of net investment income to average net assets | | | 1.23 | % | | | 1.64 | % (d) |
| Portfolio turnover rate | | | 1 | % | | | 15 | % (c) |
| (a) | For the period December 13, 2019 (commencement of operations) to August 31, 2020. |
| (b) | Total return represents the rate that the investor would have earned or lost on an investment in the Fund, assuming reinvestment of distributions. |
See accompanying notes which are an integral part of these financial statements.
| FISHER INVESTMENTS INSTITUTIONAL GROUP |
| FIXED INCOME FUND FOR RETIREMENT PLANS |
| FINANCIAL HIGHLIGHTS |
| (For a share outstanding during each period) |
| | | | | | For the | |
| | | For the | | | Period | |
| | | Year Ended | | | Ended | |
| | | August 31, | | | August 31, | |
| | | 2021 | | | 2020(a) | |
| Selected Per Share Data: | | | | | | | | |
| Net asset value, beginning of period | | $ | 10.53 | | | $ | 10.00 | |
| Investment operations: | | | | | | | | |
| Net investment income | | | 0.21 | | | | 0.18 | |
| Net realized and unrealized gain | | | 0.04 | | | | 0.35 | |
| Total from investment operations | | | 0.25 | | | | 0.53 | |
| Less distributions to shareholders from: | | | | | | | | |
| Net investment income | | | (0.27 | ) | | | — | |
| Net realized gains | | | (0.07 | ) | | | — | |
| Total distributions | | | (0.34 | ) | | | — | |
| Net asset value, end of period | | $ | 10.44 | | | $ | 10.53 | |
| Total Return(b) | | | 2.38 | % | | | 5.30 | % (c) |
| Ratios and Supplemental Data: | | | | | | | | |
| Net assets, end of period (000 omitted) | | $ | 3,236 | | | $ | 3,160 | |
| Ratio of net investment income to average net assets | | | 2.00 | % | | | 2.51 | % (d) |
| Portfolio turnover rate | | | 46 | % | | | — | % (c) |
| (a) | For the period December 13, 2019 (commencement of operations) to August 31, 2020. |
| (b) | Total return represents the rate that the investor would have earned or lost on an investment in the Fund, assuming reinvestment of distributions. |
See accompanying notes which are an integral part of these financial statements.
| FISHER INVESTMENTS INSTITUTIONAL GROUP |
| ESG FIXED INCOME FUND FOR RETIREMENT PLANS |
| FINANCIAL HIGHLIGHTS |
| (For a share outstanding during each period) |
| | | | | | For the | |
| | | For the | | | Period | |
| | | Year Ended | | | Ended | |
| | | August 31, | | | August 31, | |
| | | 2021 | | | 2020(a) | |
| Selected Per Share Data: | | | | | | | | |
| Net asset value, beginning of period | | $ | 10.54 | | | $ | 10.00 | |
| Investment operations: | | | | | | | | |
| Net investment income | | | 0.21 | | | | 0.18 | |
| Net realized and unrealized gain | | | — | (b) | | | 0.36 | |
| Total from investment operations | | | 0.21 | | | | 0.54 | |
| Less distributions to shareholders from: | | | | | | | | |
| Net investment income | | | (0.27 | ) | | | — | |
| Net realized gains | | | (0.07 | ) | | | — | |
| Total distributions | | | (0.34 | ) | | | — | |
| Net asset value, end of period | | $ | 10.41 | | | $ | 10.54 | |
| Total Return(c) | | | 2.02 | % | | | 5.40 | % (d) |
| Ratios and Supplemental Data: | | | | | | | | |
| Net assets, end of period (000 omitted) | | $ | 3,227 | | | $ | 3,162 | |
| Ratio of net investment income to average net assets | | | 1.99 | % | | | 2.46 | % (e) |
| Portfolio turnover rate | | | 46 | % | | | — | % (d) |
| (a) | For the period December 13, 2019 (commencement of operations) to August 31, 2020. |
| (b) | Rounds to less than $0.005 per share. |
| (c) | Total return represents the rate that the investor would have earned or lost on an investment in the Fund, assuming reinvestment of distributions. |
See accompanying notes which are an integral part of these financial statements.
| FISHER INVESTMENTS INSTITUTIONAL GROUP FUND FAMILY |
| NOTES TO THE FINANCIAL STATEMENTS |
| August 31, 2021 |
NOTE 1. ORGANIZATION
Fisher Investments Institutional Group Stock Fund for Retirement Plans (the “Stock Fund”), Fisher Investments Institutional Group ESG Stock Fund for Retirement Plans (the “ESG Stock Fund”), Fisher Investments Institutional Group Fixed Income Fund for Retirement Plans (the “Fixed Income Fund”) and the Fisher Investments Institutional Group ESG Fixed Income Fund for Retirement Plans (the “ESG Fixed Income Fund”) (each a “Fund” and collectively the “Funds”) were each registered under the Investment Company Act of 1940, as amended (“1940 Act”), as a diversified series of Unified Series Trust (the “Trust”) on November 12, 2018. The Trust is an open-end investment company established under the laws of Ohio by an Agreement and Declaration of Trust dated October 14, 2002 (the “Trust Agreement”). The Trust Agreement permits the Board of Trustees of the Trust (the “Board”) to issue an unlimited number of shares of beneficial interest of separate series without par value. Each Fund is one of a series of funds currently authorized by the Board. The Funds commenced operations on December 13, 2019. The investment adviser to the Funds is Fisher Asset Management, LLC, d/b/a Fisher Investments (the “Adviser”). The investment objective of the Stock Fund and ESG Stock Fund is to seek to outperform, net of fees and expenses, the return of the MSCI ACWI Investable Markets Index. The investment objective of the Fixed Income Fund and ESG Fixed Income Fund is to outperform, net of fees and expenses, the return of the ICE Bank of America Merrill Lynch U.S. Broad Market Index.
NOTE 2. SIGNIFICANT ACCOUNTING POLICIES
The Funds are investment companies and follow accounting and reporting guidance under Financial Accounting Standards Board Accounting Standards Codification (“ASC”) Topic 946, “Financial Services-Investment Companies.” The following is a summary of significant accounting policies followed by the Funds in the preparation of their financial statements. These policies are in conformity with the generally accepted accounting principles in the United States of America (“GAAP”).
Estimates – The preparation of financial statements in conformity with GAAP requires management to make estimates and assumptions that affect the reported amounts of assets and liabilities and disclosure of contingent assets and liabilities at the date of the financial statements and the reported amounts of increases and decreases in net assets from operations during the reporting period. Actual results could differ from those estimates.
| FISHER INVESTMENTS INSTITUTIONAL GROUP FUND FAMILY |
| NOTES TO THE FINANCIAL STATEMENTS – (continued) |
| August 31, 2021 |
NOTE 2. SIGNIFICANT ACCOUNTING POLICIES – continued
Foreign Currency Translation – The accounting records of the Funds are maintained in U.S. dollars. Foreign currency amounts are translated into U.S. dollars at the current rate of exchange each business day to determine the value of investments, and other assets and liabilities. Purchases and sales of foreign securities, and income and expenses, are translated at the prevailing rate of exchange on the respective date of these transactions. The Funds do not isolate that portion of the results of operations resulting from changes in foreign exchange rates on investments from fluctuation arising from changes in market prices of securities held. These fluctuations are included with the realized and unrealized gain or loss from investments. Net realized gain (loss) on foreign currency translations on the Statements of Operations represents currency gains (losses) realized between the trade and settlement dates on securities transactions, and the difference between the amount of investment income and foreign withholding taxes recorded on the Funds’ books and the U.S. dollar equivalent amounts actually received or paid. The change in unrealized currency gains (losses) on foreign currency translations for the period is reflected in the Statements of Operations.
Federal Income Taxes – The Funds make no provision for federal income or excise tax. Each Fund has qualified and intends to qualify each year as a regulated investment company (“RIC”) under subchapter M of the Internal Revenue Code of 1986, as amended, by complying with the requirements applicable to RICs and by distributing substantially all of its taxable income. Each Fund also intends to distribute sufficient net investment income and net capital gains, if any, so that it will not be subject to excise tax on undistributed income and gains. If the required amount of net investment income or gains is not distributed, the Fund could incur a tax expense.
As of and during the fiscal year ended August 31, 2021, the Funds did not have any liabilities for any unrecognized tax benefits. The Funds recognize interest and penalties, if any, related to unrecognized tax benefits as income tax expense on the Statements of Operations when incurred. During the fiscal year ended August 31, 2021, the Funds did not incur any interest or penalties. Management of the Funds has reviewed tax positions taken in tax years that remain subject to examination by all major tax jurisdictions, including federal (i.e., the last three tax year ends and the interim tax period since then, as applicable). Management believes that there is no tax liability resulting from unrecognized tax benefits related to uncertain tax positions taken.
| FISHER INVESTMENTS INSTITUTIONAL GROUP FUND FAMILY |
| NOTES TO THE FINANCIAL STATEMENTS – (continued) |
| August 31, 2021 |
NOTE 2. SIGNIFICANT ACCOUNTING POLICIES – continued
Expenses – Expenses incurred by the Trust that do not relate to a specific fund of the Trust are allocated to the individual funds based on each fund’s relative net assets or another appropriate basis (as determined by the Board).
Security Transactions and Related Income – The Funds follow industry practice and record security transactions on the trade date for financial reporting purposes. The specific identification method is used for determining gains or losses for financial statement and income tax purposes. Dividend income is recorded on the ex-dividend date and interest income is recorded on an accrual basis. Discounts and premiums on securities purchased are amortized or accreted using the effective interest method. Withholding taxes on foreign dividends, related reclaims, and foreign capital gain taxes have been provided for in accordance with the Funds’ understanding of the applicable country’s tax rules and rates.
Dividends and Distributions – Each Fund intends to distribute its net investment income and net realized long-term and short-term capital gains, if any, at least annually. Dividends and distributions to shareholders, which are determined in accordance with income tax regulations, are recorded on the ex-dividend date. The treatment for financial reporting purposes of distributions made to shareholders during the period from net investment income or net realized capital gains may differ from their ultimate treatment for federal income tax purposes. These differences are caused primarily by differences in the timing of the recognition of certain components of income, expense or realized capital gain for federal income tax purposes. Where such differences are permanent in nature, they are reclassified among the components of the net assets based on their ultimate characterization for federal income tax purposes. Any such reclassifications will have no effect on net assets, results of operations or net asset value (“NAV”) per share of the Funds.
For the fiscal year ended August 31, 2021, the Funds made the following reclassifications to increase (decrease) the components of net assets:
| | | | | | Accumulated | |
| | | Paid-In Capital | | | Earnings (Deficit) | |
| Stock Fund | | $ | 3 | | | $ | (3 | ) |
| ESG Stock Fund | | | 4 | | | | (4 | ) |
| Fixed Income Fund | | | 165 | | | | (165 | ) |
| ESG Fixed Income Fund | | | 159 | | | | (159 | ) |
| FISHER INVESTMENTS INSTITUTIONAL GROUP FUND FAMILY |
| NOTES TO THE FINANCIAL STATEMENTS – (continued) |
| August 31, 2021 |
NOTE 3. SECURITIES VALUATION AND FAIR VALUE MEASUREMENTS
Each Fund values its portfolio securities at fair value as of the close of regular trading on the New York Stock Exchange (“NYSE”) (normally 4:00 p.m. Eastern time) on each business day the NYSE is open for business. Fair value is defined as the price that a Fund would receive upon selling an investment in a timely transaction to an independent buyer in the principal or most advantageous market of the investment. GAAP establishes a three-tier hierarchy to maximize the use of observable market data and minimize the use of unobservable inputs and to establish classification of fair value measurements for disclosure purposes.
Inputs refer broadly to the assumptions that market participants would use in pricing the asset or liability, including assumptions about risk (the risk inherent in a particular valuation technique used to measure fair value including a pricing model and/or the risk inherent in the inputs to the valuation technique). Inputs may be observable or unobservable. Observable inputs are inputs that reflect the assumptions market participants would use in pricing the asset or liability developed based on market data obtained and available from sources independent of the reporting entity. Unobservable inputs are inputs that reflect the reporting entity’s own assumptions about the assumptions market participants would use in pricing the asset or liability developed based on the best information available in the circumstances.
Various inputs are used in determining the value of each Fund’s investments. These inputs are summarized in the three broad levels listed below.
| ● | Level 1 – unadjusted quoted prices in active markets for identical investments and/or registered investment companies where the value per share is determined and published and is the basis for current transactions for identical assets or liabilities at the valuation date |
| ● | Level 2 – other significant observable inputs (including, but not limited to, quoted prices for an identical security in an inactive market, quoted prices for similar securities, interest rates, prepayment speeds, credit risk, etc.) |
| ● | Level 3 – significant unobservable inputs (including the Funds’ own assumptions in determining fair value of investments based on the best information available) |
| FISHER INVESTMENTS INSTITUTIONAL GROUP FUND FAMILY |
| NOTES TO THE FINANCIAL STATEMENTS – (continued) |
| August 31, 2021 |
NOTE 3. SECURITIES VALUATION AND FAIR VALUE MEASUREMENTS – continued
The inputs used to measure fair value may fall into different levels of the fair value hierarchy. In such cases, for disclosure purposes, the level in the fair value hierarchy which is reported is determined based on the lowest level input that is significant to the fair value measurement in its entirety.
Equity securities that are traded on any stock exchange are generally valued at the last quoted sale price on the security’s primary exchange. Lacking a last sale price, an exchange-traded security is generally valued at its last bid price. Securities traded in the NASDAQ over-the-counter market are generally valued at the NASDAQ Official Closing Price. When using market quotations and when the market is considered active, the security is classified as a Level 1 security. In the event that market quotations are not readily available or are considered unreliable due to market or other events, a Fund values its securities and other assets at fair value in accordance with policies established by and under the general supervision of the Board. Under these policies, the securities will be classified as Level 2 or 3 within the fair value hierarchy, depending on the inputs used.
Debt securities are valued by using the mean between the closing bid and ask prices provided by a pricing service. If the closing bid and ask prices are not readily available, the pricing service may provide a price determined by a matrix pricing method. Matrix pricing is a mathematical technique used to value fixed income securities without relying exclusively on quoted prices. Matrix pricing takes into consideration recent transactions, yield, liquidity, risk, credit quality, coupon, maturity, type of issue and any other factors or market data the pricing service deems relevant for the actual security being priced and for other securities with similar characteristics. These securities will generally be categorized as Level 2 securities. If the Adviser decides that a price provided by the pricing service does not accurately reflect the fair value of the securities or when prices are not readily available from a pricing service, securities are valued at fair value as determined by the Adviser, in conformity with guidelines adopted by and subject to review of the Board. These securities will generally be categorized as Level 3 securities.
Investments in mutual funds, including money market mutual funds, are generally priced at the ending NAV provided by the service agent of the mutual funds. These securities are categorized as Level 1 securities.
| FISHER INVESTMENTS INSTITUTIONAL GROUP FUND FAMILY |
| NOTES TO THE FINANCIAL STATEMENTS – (continued) |
| August 31, 2021 |
NOTE 3. SECURITIES VALUATION AND FAIR VALUE MEASUREMENTS – continued
In accordance with the Trust’s valuation policies, the Adviser is required to consider all appropriate factors relevant to the value of securities for which it has determined other pricing sources are not available or reliable as described above. No single method exists for determining fair value, because fair value depends upon the circumstances of each individual case. As a general principle, the current fair value of a security being valued by the Adviser would be the amount that the Funds might reasonably expect to receive upon the current sale. Methods that are in accordance with this principle may, for example, be based on (i) a multiple of earnings; (ii) a discount from market prices of a similar freely traded security (including a derivative security or a basket of securities traded on other markets, exchanges or among dealers); or (iii) yield to maturity with respect to debt issues, or a combination of these and other methods. Fair-value pricing is permitted if, in the Adviser’s opinion, the validity of market quotations appears to be questionable based on factors such as evidence of a thin market in the security based on a small number of quotations, a significant event occurs after the close of a market but before a Fund’s NAV calculation that may affect a security’s value, or the Adviser is aware of any other data that calls into question the reliability of market quotations.
The following is a summary of the inputs used to value the Funds’ investments as of August 31, 2021:
| | | Valuation Inputs | |
| | | Level 1 | | | Level 2 | | | Level 3 | | | Total | |
| Stock Fund | | | | | | | | | | | | | | | | |
| | | | | | | | | | | | | | | | | |
| Assets | | | | | | | | | | | | | | | | |
| Common Stocks(a) | | $ | 226,771 | | | $ | 1,202 | | | $ | — | | | $ | 227,973 | |
| Money Market Funds | | | 1,000 | | | | — | | | | — | | | | 1,000 | |
| Total | | $ | 227,771 | | | $ | 1,202 | | | $ | — | | | $ | 228,973 | |
| | | | | | | | | | | | | | | | | |
| ESG Stock Fund | | | | | | | | | | | | | | | | |
| | | | | | | | | | | | | | | | | |
| Assets | | | | | | | | | | | | | | | | |
| Common Stocks(a) | | $ | 225,094 | | | $ | 1,218 | | | | — | | | $ | 226,312 | |
| Money Market Funds | | | 1,080 | | | | — | | | | — | | | | 1,080 | |
| Total | | $ | 226,174 | | | $ | 1,218 | | | $ | — | | | $ | 227,392 | |
| FISHER INVESTMENTS INSTITUTIONAL GROUP FUND FAMILY |
| NOTES TO THE FINANCIAL STATEMENTS – (continued) |
| August 31, 2021 |
NOTE 3. SECURITIES VALUATION AND FAIR VALUE MEASUREMENTS – continued
| | | Valuation Inputs | |
| | | Level 1 | | | Level 2 | | | Level 3 | | | Total | |
| Fixed Income Fund | | | | | | | | | | | | | | | | |
| | | | | | | | | | | | | | | | | |
| Assets | | | | | | | | | | | | | | | | |
| Corporate Bonds(a) | | $ | — | | | $ | 1,600,418 | | | $ | — | | | $ | 1,600,418 | |
| U.S. Government & Agencies | | | — | | | | 1,029,507 | | | | — | | | | 1,029,507 | |
| Exchange-Traded Funds | | | 538,172 | | | | — | | | | — | | | | 538,172 | |
| Money Market Funds | | | 51,465 | | | | — | | | | — | | | | 51,465 | |
| Total | | $ | 589,637 | | | $ | 2,629,925 | | | $ | — | | | $ | 3,219,562 | |
| | | | | | | | | | | | | | | | | |
| ESG Fixed Income Fund | | | | | | | | | | | | | | | | |
| | | | | | | | | | | | | | | | | |
| Assets | | | | | | | | | | | | | | | | |
| Corporate Bonds(a) | | $ | — | | | $ | 1,603,507 | | | | — | | | $ | 1,603,507 | |
| U.S. Government & Agencies | | | — | | | | 1,029,176 | | | | — | | | | 1,029,176 | |
| Exchange-Traded Funds | | | 534,806 | | | | — | | | | — | | | | 534,806 | |
| Money Market Funds | | | 42,886 | | | | — | | | | — | | | | 42,886 | |
| Total | | $ | 577,692 | | | $ | 2,632,683 | | | $ | — | | | $ | 3,210,375 | |
| (a) | Refer to Schedule of Investments for sector classifications. |
The Funds did not hold any investments at the end of the reporting period for which significant unobservable inputs (Level 3) were used in determining fair value; therefore, no reconciliation of Level 3 securities is included for this reporting period. The Funds did not hold any derivative instruments during the reporting period.
NOTE 4. FEES AND OTHER TRANSACTIONS WITH AFFILIATES
The Adviser, under the terms of the management agreement with the Trust with respect to the Funds, manages the Funds’ investments. The Adviser pays all of the operating expenses of the Funds except portfolio transaction and other investment related costs (including brokerage fees and commissions, and fees and expenses associated with investments in derivative instruments, such as option and swap fees and expenses), taxes, borrowing costs (such as interest and dividend expense on securities sold short), extraordinary expenses, and any indirect expenses (such as fees and expenses associated with investment in acquired funds and other collective investment vehicles). In this regard, it should be noted that most investment companies pay their own operating expenses directly, while the Funds’ expenses, except those
| FISHER INVESTMENTS INSTITUTIONAL GROUP FUND FAMILY |
| NOTES TO THE FINANCIAL STATEMENTS – (continued) |
| August 31, 2021 |
NOTE 4. FEES AND OTHER TRANSACTIONS WITH AFFILIATES – continued
specified above, are paid by the Adviser. The Funds do not pay a management fee to the Adviser. Retirement plans, plan sponsors and/or plan participants pay a separate fee for the Adviser’s services and also pay fees to record keepers and administrators.
Ultimus Fund Solutions, LLC (“Ultimus”) provides administration, fund accounting and transfer agent services to the Funds.
Northern Lights Compliance Services, LLC (“NLCS”), an affiliate of Ultimus, provides a Chief Compliance Officer to the Trust, as well as related compliance services, pursuant to a consulting agreement between NLCS and the Trust. Under the terms of such agreement, NLCS receives fees from the Fund, which are approved annually by the Board. Prior to April 1, 2021, Ultimus provided certain compliance services and Buttonwood Compliance Partners provided the Chief Compliance Officer to the Trust.
Under the terms of a Distribution Agreement with the Trust, Ultimus Fund Distributors, LLC (the “Distributor”) serves as principal underwriter to the Funds. The Distributor is a wholly-owned subsidiary of Ultimus. The Distributor is compensated by the Adviser (not the Funds) for acting as principal underwriter.
Certain officers and a Trustee of the Trust are also employees of Ultimus and are not paid by the Funds for serving in such capacities.
The Board supervises the business activities of the Trust. Each Trustee serves as a trustee until termination of the Trust unless the Trustee dies, resigns, retires, or is removed. The Chairman of the Board and more than 75% of the Trustees are “Independent Trustees,” which means that they are not “interested persons” as defined in the 1940 Act. Each Independent Trustee of the Trust receives annual compensation of $2,510 per fund from the Trust, except that the Chairman of the Audit Committee, the Chairman of the Governance & Nominating Committee, and the Chairman of the Pricing & Liquidity Committee each receives annual compensation of $2,960 per fund from the Trust and the Independent Chairman of the Board receives $3,160 per fund from the Trust. Independent Trustees also receive $250 for the first hour and $200 for each additional hour for attending special meetings. Prior to January 1, 2021, these fees were $2,290 for non-chairmen and $2,740 for all chairmen. In addition, the Trust reimburses Independent Trustees for out-of-pocket expenses incurred in conjunction with attendance at meetings.
| FISHER INVESTMENTS INSTITUTIONAL GROUP FUND FAMILY |
| NOTES TO THE FINANCIAL STATEMENTS – (continued) |
| August 31, 2021 |
NOTE 5. INVESTMENT TRANSACTIONS
For the fiscal year ended August 31, 2021, purchases and sales of investment securities, other than short-term investments were as follows:
| | | | | | | | | Fixed | | | ESG Fixed | |
| | | Stock | | | ESG Stock | | | Income | | | Income | |
| | | Fund | | | Fund | | | Fund | | | Fund | |
| Purchases | | $ | 5,412 | | | $ | 5,062 | | | $ | 321,056 | | | $ | 323,463 | |
| Sales | | | 2,704 | | | | 2,753 | | | | 1,206,992 | | | | 1,201,525 | |
| U.S. Government Purchases | | | — | | | | — | | | | 1,236,508 | | | | 1,236,401 | |
| U.S. Government Sales | | | — | | | | — | | | | 220,169 | | | | 220,369 | |
NOTE 6. BENEFICIAL OWNERSHIP
The beneficial ownership, either directly or indirectly, of more than 25% of the voting securities of a fund creates a presumption of control of a fund, under Section 2(a)(9) of the 1940 Act. As of August 31, 2021, the Adviser owned 99.99%, 99.99%, 100.00% and 100.00% of the Stock Fund, ESG Stock Fund, Fixed Income Fund and ESG Fixed Income Fund outstanding shares, respectively. As a result, the Adviser may be deemed to control each Fund.
NOTE 7. FEDERAL TAX INFORMATION
At August 31, 2021, the net unrealized appreciation (depreciation) and tax cost of investments for tax purposes was as follows:
| | | | | | | | | Fixed | | | ESG Fixed | |
| | | Stock | | | ESG Stock | | | Income | | | Income | |
| | | Fund | | | Fund | | | Fund | | | Fund | |
| Gross unrealized appreciation | | $ | 82,061 | | | $ | 81,733 | | | $ | 97,970 | | | $ | 97,559 | |
| Gross unrealized depreciation | | | (5,976 | ) | | | (6,459 | ) | | | (2,773 | ) | | | (1,212 | ) |
| Net unrealized appreciation (depreciation) on investments | | | 76,085 | | | | 75,274 | | | | 95,197 | | | | 96,347 | |
| Tax cost of investments | | | 152,888 | | | | 152,118 | | | | 3,124,365 | | | | 3,114,028 | |
| FISHER INVESTMENTS INSTITUTIONAL GROUP FUND FAMILY |
| NOTES TO THE FINANCIAL STATEMENTS – (continued) |
| August 31, 2021 |
NOTE 7. FEDERAL TAX INFORMATION – continued
The tax character of distributions paid for the fiscal years ended August 31, 2021 was as follows:
| | | | | | | | | Fixed | | | ESG Fixed | |
| | | Stock | | | ESG Stock | | | Income | | | Income | |
| | | Fund | | | Fund | | | Fund | | | Fund | |
| Distributions paid from: | | | | | | | | | | | | | | | | |
| Ordinary income(a) | | $ | 2,272 | | | $ | 2,459 | | | $ | 100,645 | | | $ | 101,495 | |
| Total distributions paid | | $ | 2,272 | | | $ | 2,459 | | | $ | 100,645 | | | $ | 101,495 | |
| (a) | Short-term capital gain distributions are treated as ordinary income for tax purposes. |
At August 31, 2021, the components of accumulated earnings (deficit) on a tax basis were as follows:
| | | | | | | | | Fixed | | | ESG Fixed | |
| | | Stock | | | ESG Stock | | | Income | | | Income | |
| | | Fund | | | Fund | | | Fund | | | Fund | |
| Undistributed ordinary income | | $ | 1,798 | | | $ | 1,698 | | | $ | 39,644 | | | $ | 36,834 | |
| Undistributed long-term capital gains | | | — | | | | — | | | | 50 | | | | — | |
| Accumulated capital and other | | | (747 | ) | | | (1,597 | ) | | | — | | | | (7,876 | ) |
| Unrealized appreciation on investments | | | 76,085 | | | | 75,274 | | | | 95,197 | | | | 96,347 | |
| Total accumulated earnings | | $ | 77,136 | | | $ | 75,375 | | | $ | 134,891 | | | $ | 125,305 | |
As of August 31, 2021, the Stock Fund and ESG Stock Fund had short-term capital loss carryforwards available to offset future gains, not subject to expiration, in the amount of $747 and $1,597 respectively.
Capital losses and specified gains realized after October 31, and net investment losses realized after December 31 of a Fund’s fiscal year may be deferred and treated as occurring on the first business day of the flowing fiscal year for tax purposes. For the year ended August 31, 2021, the ESG Fixed Income Fund deferred $7,876 of capital losses.
| FISHER INVESTMENTS INSTITUTIONAL GROUP FUND FAMILY |
| NOTES TO THE FINANCIAL STATEMENTS – (continued) |
| August 31, 2021 |
NOTE 8. SECTOR RISK
If a Fund has significant investments in the securities of issuers within a particular sector, any development affecting that sector will have a greater impact on the value of the net assets of a Fund than would be the case if a Fund did not have significant investments in that sector. In addition, this may increase the risk of loss in a Fund and increase the volatility of a Fund’s NAV per share. For instance, economic or market factors, regulatory changes or other developments may negatively impact all companies in a particular sector, and therefore the value of a Fund’s portfolio will be adversely affected. As of August 31, 2021, the Stock Fund and ESG Stock Fund had 39.58% and 40.15%, respectively, of the value of its net assets invested in stocks within the Technology sector.
NOTE 9. COMMITMENTS AND CONTINGENCIES
The Trust indemnifies its officers and Trustees for certain liabilities that may arise from their performance of their duties to the Trust or the Funds. Additionally, in the normal course of business, the Trust enters into contracts that contain a variety of representations and warranties which provide general indemnifications. The Trust’s maximum exposure under these arrangements is unknown, as this would involve future claims that may be made against the Trust that have not yet occurred.
NOTE 10. SUBSEQUENT EVENTS
Management of the Funds has evaluated the need for disclosures and/or adjustments resulting from subsequent events through the date at which these financial statements were issued. Based upon this evaluation, management has determined there were no items requiring adjustment of the financial statements or additional disclosure.
| REPORT OF INDEPENDENT REGISTERED PUBLIC |
| ACCOUNTING FIRM |
To the Shareholders of Fisher Investments Institutional Group Fund Family and Board of Trustees of Unified Series Trust
Opinion on the Financial Statements
We have audited the accompanying statements of assets and liabilities, including the schedules of investments, of Fisher Investments Institutional Group Stock Fund for Retirement Plans, Fisher Investments Institutional Group ESG Stock Fund for Retirement Plans, Fisher Investments Institutional Group Fixed Income Fund for Retirement Plans, and Fisher Investments Institutional Group ESG Fixed Income Fund for Retirement Plans (the “Funds”), each a series of Unified Series Trust, as of August 31, 2021, the related statements of operations for the year then ended, and the statements of changes in net assets, the related notes, and the financial highlights for each of the two periods in the period then ended (collectively referred to as the “financial statements”). In our opinion, the financial statements present fairly, in all material respects, the financial position of each of the Funds as of August 31, 2021, the results of their operations for the year then ended, and the changes in net assets and the financial highlights for each of the two periods in the period then ended, in conformity with accounting principles generally accepted in the United States of America.
Basis for Opinion
These financial statements are the responsibility of the Funds’ management. Our responsibility is to express an opinion on the Funds’ financial statements based on our audits. We are a public accounting firm registered with the Public Company Accounting Oversight Board (United States) (“PCAOB”) and are required to be independent with respect to the Funds in accordance with the U.S. federal securities laws and the applicable rules and regulations of the Securities and Exchange Commission and the PCAOB.
We conducted our audits in accordance with the standards of the PCAOB. Those standards require that we plan and perform the audit to obtain reasonable assurance about whether the financial statements are free of material misstatement whether due to error or fraud.
Our audits included performing procedures to assess the risks of material misstatement of the financial statements, whether due to error or fraud, and performing procedures that respond to those risks. Such procedures included examining, on a test basis, evidence regarding the amounts and disclosures in the financial statements. Our procedures included confirmation of securities owned as of August 31, 2021, by correspondence with the custodian. Our audits also included evaluating the accounting
| REPORT OF INDEPENDENT REGISTERED PUBLIC |
| ACCOUNTING FIRM – (continued) |
principles used and significant estimates made by management, as well as evaluating the overall presentation of the financial statements. We believe that our audits provide a reasonable basis for our opinion.
We have served as the auditor of one or more investment companies advised by Fisher Asset Management, LLC since 2017.
COHEN & COMPANY, LTD.
Chicago, Illinois
October 28, 2021
| SUMMARY OF FUND EXPENSES (Unaudited) |
As a shareholder of a Fund, you incur two types of costs: (1) transaction costs and (2) ongoing costs, including management fees and other Fund expenses. These examples are intended to help you understand your ongoing costs (in dollars) of investing in each Fund and to compare these costs with the ongoing costs of investing in other mutual funds. Each Fund’s example is based on an investment of $1,000 invested at the beginning of the period and held for the entire period from March 1, 2021 through August 31, 2021.
Actual Expenses
The first line of the table below provides information about actual account values and actual expenses. You may use the information in this line, together with the amount you invested, to estimate the expenses that you paid over the period. Simply divide your account value by $1,000 (for example, an $8,600 account value divided by $1,000 = 8.6), then multiply the result by the number in the first line under the heading entitled “Expenses Paid During Period” to estimate the expenses you paid on your account during this period.
Hypothetical Example for Comparison Purposes
The second line of the table below provides information about hypothetical account values and hypothetical expenses based on the Fund’s actual expense ratio and an assumed rate of return of 5% per year before expenses, which is not the Fund’s actual return. The hypothetical account values and expenses may not be used to estimate the actual ending account balance or expenses you paid for the period. You may use this information to compare the ongoing costs of investing in the Fund and other funds. To do so, compare this 5% hypothetical example with the 5% hypothetical examples that appear in the shareholder reports of other funds.
| SUMMARY OF FUND EXPENSES (Unaudited) – (continued) |
| | | Beginning | | Ending | | Expenses | | |
| | | Account Value | | Account Value | | Paid | | Annualized |
| | | March 1, | | August 31, | | During | | Expense |
| | | 2021 | | 2021 | | Period(a) | | Ratio |
| Fisher Investments Institutional Group Stock Fund for Retirement Plans |
| Actual | | $ 1,000.00 | | $ 1,153.40 | | $ — | | —% |
| Hypothetical(b) | | $ 1,000.00 | | $ 1,025.21 | | $ — | | —% |
| | | | | | | | | |
| Fisher Investments Institutional Group ESG Stock Fund for Retirement Plans |
| Actual | | $ 1,000.00 | | $ 1,153.20 | | $ — | | —% |
| Hypothetical(b) | | $ 1,000.00 | | $ 1,025.21 | | $ — | | —% |
| | | | | | | | | |
| Fisher Investments Institutional Group Fixed Income Fund for Retirement Plans |
| Actual | | $ 1,000.00 | | $ 1,024.50 | | $ — | | —% |
| Hypothetical(b) | | $ 1,000.00 | | $ 1,025.21 | | $ — | | —% |
| | | | | | | | | |
| Fisher Investments Institutional Group ESG Fixed Income Fund for Retirement Plans |
| Actual | | $ 1,000.00 | | $ 1,022.60 | | $ — | | —% |
| Hypothetical(b) | | $ 1,000.00 | | $ 1,025.21 | | $ — | | —% |
| (a) | Expenses are equal to the Fund’s annualized expense ratios, multiplied by the average account value over the period, multiplied by 184/365 (to reflect the one-half year period). |
| (b) | Hypothetical assumes 5% annual return before expenses. |
| ADDITIONAL FEDERAL INCOME TAX INFORMATION (Unaudited) |
The Form 1099-DIV you receive in January 2022 will show the tax status of all distributions paid to your account in calendar year 2021. Shareholders are advised to consult their own tax adviser with respect to the tax consequences of their investment in the Funds. As required by the Internal Revenue Code and/or regulations, shareholders must be notified regarding the status of qualified dividend income for individuals and the dividends received deduction for corporations.
Qualified Dividend Income. The Funds designates the following percentage or up to the maximum amount of such dividends allowable pursuant to the Internal Revenue Code, as qualified dividend income eligible for a reduced tax rate.
| | | | | | | Fixed | | ESG Fixed |
| | | Stock | | ESG Stock | | Income | | Income |
| | | Fund | | Fund | | Fund | | Fund |
| Qualified Dividend Income | | 80.85% | | 83.40% | | 0% | | 0% |
Qualified Business Income. The Funds designates approximately 0% of its ordinary income dividends, or up to the maximum amount of such dividends allowable pursuant to the Internal Revenue Code, as qualified business income.
Dividends Received Deduction. Corporate shareholders are generally entitled to take the dividends received deduction on the portion of the Funds’ dividend distribution that qualifies under tax law. For the Funds’ calendar year 2021 ordinary income dividends, the following percentage qualifies for the corporate dividends received deduction.
| | | | | | | Fixed | | ESG Fixed |
| | | Stock | | ESG Stock | | Income | | Income |
| | | Fund | | Fund | | Fund | | Fund |
| Dividends Received Deduction | | 50.71% | | 47.72% | | 0% | | 0% |
TRUSTEES AND OFFICERS (Unaudited)
GENERAL QUALIFICATIONS. The Board supervises the business activities of the Trust. Each Trustee serves as a trustee until termination of the Trust unless the Trustee dies, resigns, retires, or is removed. The Chairman of the Board and more than 75% of the Trustees are “Independent Trustees,” which means that they are not “interested persons” (as defined in the 1940 Act) of the Trust or any adviser, sub-adviser or distributor of the Trust.
The following table provides information regarding the Independent Trustees.
Name, Address*,
(Year of Birth),
Position with Trust**,
Term of Position
with Trust | Principal Occupation During Past 5 Years and Other Directorships |
Kenneth G.Y. Grant (1949) Chairman, January 2017 to present; Independent Trustee, May 2008 to present | Current: Director, Standpoint Multi-Asset (Cayman) Fund, Ltd. (2019 – present); Director, Advisors Charitable Gift Fund (2020 – present), a Donor Advised Fund. Previous: EVP, Benefit Plans Administrative Services, Inc., provider of retirement benefit plans administration (2019 – 2020); Director, Northeast Retirement Services (NRS) LLC, a transfer agent and fund administrator; and Director, Global Trust Company (GTC), a non-depository trust company sponsoring private investment product (2003 – 2019); EVP, NRS (2003 – 2019); GTC, EVP (2008 – 2019); EVP, Savings Banks Retirement Association (2003 – 2019), provider of qualified retirement benefit plans. |
Daniel J. Condon (1950) Chairman of the Audit Committee; Chairman of the Governance & Nominating Committee; Independent Trustee, December 2002 to present | Current: Retired (2017 – present) |
Gary E. Hippenstiel (1947) Chairman of the Pricing & Liquidity Committee; Independent Trustee, December 2002 to present | Current: President and founder of Hippenstiel Investment Counsel LLC (“Hippenstiel”) since 2008. Hippenstiel was registered as an investment adviser from 2008 to December 31, 2019. |
TRUSTEES AND OFFICERS (Unaudited) – (continued)
Name, Address*,
(Year of Birth),
Position with Trust**,
Term of Position
with Trust | Principal Occupation During Past 5 Years and Other Directorships |
Stephen A. Little (1946) Independent Trustee, December 2002 to present; Chairman, December 2004 to December 2016 | Current: President and founder of The Rose, Inc., a registered investment adviser, since 1993. |
Ronald C. Tritschler (1952) Independent Trustee, January 2007 to present; Interested Trustee, December 2002 to December 2006 | Current: Chief Executive Officer, Director and Legal Counsel of The Webb Companies, a national real estate company, since 2001; Director, Standpoint Multi-Asset (Cayman) Fund, Ltd. (2020 – present). |
| * | The address for each Trustee is 225 Pictoria Drive, Suite 450, Cincinnati, Ohio 45246. |
| ** | As of the date of this report, the Trust consists of 21 series. |
The following table provides information regarding the Interested Trustee and the Officers of the Trust.
Name, Address*,
(Year of Birth),
Position with Trust,
Term of Position
with Trust | Principal Occupation During Past 5 Years and Other Directorships |
David R. Carson (1958) President, January 2016 to August 2021; Interested Trustee, August 2020 to present | Current: Senior Vice President Client Strategies of Ultimus Fund Solutions, LLC, since 2013; Interested Trustee of Ultimus Managers Trust, since 2020. |
Zachary P. Richmond (1980) Treasurer and Chief Financial Officer, November 2014 to present | Current: Vice President, Director of Financial Administration for Ultimus Fund Solutions, LLC, since 2015. |
TRUSTEES AND OFFICERS (Unaudited) – (continued)
Name, Address*,
(Year of Birth),
Position with Trust,
Term of Position
with Trust | Principal Occupation During Past 5 Years and Other Directorships |
Martin R. Dean (1963) President, August 2021 to present; Vice President, November 2020 to August 2021; Chief Compliance Officer, April 2021 to August 2021; Assistant Chief Compliance Officer, January 2016 to April 2021 | Current: Senior Vice President, Head of Fund Compliance of Ultimus Fund Solutions, LLC, since 2016. |
Gweneth K. Gosselink (1955) Chief Compliance Officer, August 2021 to present | Current: Assistant Vice President, Senior Compliance Officer of Ultimus Fund Solutions, LLC, since 2019. Previous: Chief Operating Officer & CCO at Miles Capital, Inc. (2013 – 2019). |
Elisabeth Dahl (1962) Secretary, May 2017 to present; Assistant Secretary, March 2016 to May 2017 | Current: Attorney, Ultimus Fund Solutions, LLC since March 2016. |
Stephen Preston (1966) AML Compliance Officer, May 2017 to present | Current: Vice President and Chief Compliance Officer, Ultimus Fund Solutions, LLC and Ultimus Fund Distributors, LLC, since 2011. |
Lynn E. Wood (1946) Assistant Chief Compliance Officer, April 2021 to present; Chief Compliance Officer, October 2004 to April 2021 | Current: Managing Member, Buttonwood Compliance Partners, LLC, since 2013. |
| * | The address for each Officer is 225 Pictoria Drive, Suite 450, Cincinnati, Ohio 45246. |
| PRIVACY NOTICE | Rev: January 2020 |
| FACTS | WHAT DO THE FISHER INVESTMENTS INSTITUTIONAL GROUP FUND FAMILY (THE “FUNDS”) DO WITH YOUR PERSONAL INFORMATION? |
| Why? | Financial companies choose how they share your personal information. Federal law gives consumers the right to limit some but not all sharing. Federal law also requires us to tell you how we collect, share, and protect your personal information. Please read this notice carefully to understand what we do. |
| What? | The types of personal information we collect and share depend on the product or service you have with us. This information can include: ● Social Security number ● account balances and account transactions ● transaction or loss history and purchase history When you are no longer our customer, we continue to share your information as described in this notice. |
| How? | All financial companies need to share customers’ personal information to run their everyday business. In the section below, we list the reasons financial companies can share their customers’ personal information; the reasons the Funds chooses to share; and whether you can limit this sharing. |
| |
| Reasons we can share your personal information | Do the Funds
share? | Can you
limit this
sharing? |
For our everyday business purposes— such as to process your transactions, maintain your account(s), respond to court orders and legal investigations, or report to credit bureaus | Yes | No |
For our marketing purposes— to offer our products and services to you | No | We don’t share |
| For joint marketing with other financial companies | No | We don’t share |
For our affiliates’ everyday business purposes— information about your transactions and experiences | No | We don’t share |
For our affiliates’ everyday business purposes— information about your creditworthiness | No | We don’t share |
| For nonaffiliates to market to you | No | We don’t share |
| | | | |
| Questions? | Call (800) 851-8845 |
| Who we are |
| Who is providing this notice? | Fisher Investments Institutional Group Fund Family Ultimus Fund Distributors, LLC (Distributor) Ultimus Fund Solutions, LLC (Administrator) |
| What we do |
| How do the Funds protect my personal information? | To protect your personal information from unauthorized access and use, we use security measures that comply with federal law. These measures include computer safeguards and secured files and buildings. Our service providers are held accountable for adhering to strict policies and procedures to prevent any misuse of your nonpublic personal information. |
| How do the Funds collect my personal information? | We collect your personal information, for example, when you ● open an account or deposit money ● make deposits or withdrawals from your account or provide account information We also collect your personal information from other companies. |
| Why can’t I limit all sharing? | Federal law gives you the right to limit only ● sharing for affiliates’ everyday business purposes—information about your creditworthiness ● affiliates from using your information to market to you ● sharing for nonaffiliates to market to you State laws and individual companies may give you additional rights to limit sharing. |
| Definitions |
| Affiliates | Companies related by common ownership or control. They can be financial and nonfinancial companies. ● Fisher Asset Management, LLC, d/b/a Fisher Investments, the investment adviser to the Funds, could be deemed to be an affiliate. |
| Nonaffiliates | Companies not related by common ownership or control. They can be financial and nonfinancial companies. ● The Funds do not share your personal information with nonaffiliates so they can market to you |
| Joint marketing | A formal agreement between nonaffiliated financial companies that together market financial products or services to you. ● The Funds don’t jointly market. |
This page intentionally left blank.
This page intentionally left blank.
OTHER INFORMATION
The Funds’ Statement of Additional Information (“SAI”) includes additional information about the trustees and is available without charge, upon request. You may call toll-free at (800) 851-8845 to request a copy of the SAI or to make shareholder inquiries.
PROXY VOTING
A description of the policies and procedures that each Fund uses to determine how to vote proxies relating to portfolio securities and information regarding how each Fund voted those proxies during the most recent twelve month period ended June 30, are available (1) without charge upon request by calling the Funds at (800) 851-8845 and (2) in Fund documents filed with the Securities and Exchange Commission (“SEC”) on the SEC’s website at www.sec.gov.
TRUSTEES Kenneth G.Y. Grant, Chairman David R. Carson Daniel J. Condon Gary E. Hippenstiel Stephen A. Little Ronald C. Tritschler OFFICERS Martin R. Dean, President Gwen Gosselink, Chief Compliance Officer Zachary P. Richmond, Treasurer and Chief Financial Officer Lynn E. Wood, Assistant Chief Compliance Officer INVESTMENT ADVISER Fisher Asset Management, LLC 5525 NW Fisher Creek Drive Camas, WA 98607 DISTRIBUTOR Ultimus Fund Distributors, LLC 225 Pictoria Drive, Suite 450 Cincinnati, OH 45246 | INDEPENDENT REGISTERED PUBLIC ACCOUNTING FIRM Cohen & Company, Ltd. 151 N Franklin Street, Suite 575 Chicago, IL 60606 LEGAL COUNSEL Thompson Hine LLP 312 Walnut Street, 20th Floor Cincinnati, OH 45202 CUSTODIAN U.S. Bank, N.A. 425 Walnut Street Cincinnati, OH 45202 ADMINISTRATOR, TRANSFER AGENT AND FUND ACCOUNTANT Ultimus Fund Solutions, LLC 225 Pictoria Drive, Suite 450 Cincinnati, OH 45246 |
This report is intended only for the information of shareholders or those who have received the Funds’ prospectus which contains information about the Funds’ management fee and expenses. Please read the prospectus carefully before investing.
Distributed by Ultimus Fund Distributors, LLC
Member FINRA/SIPC
Fisher4-AR-21
| FISHER INVESTMENTS INSTITUTIONAL |
| GROUP FUND FAMILY |
Annual Report
August 31, 2021
Fisher Investments Institutional Group
All Foreign Equity Environmental and Social Values Fund
Fund Adviser:
Fisher Asset Management, LLC
5525 NW Fisher Creek Drive,
Camas, Washington 98607
(800) 851-8845
FISHER INVESTMENTS INSTITUTIONAL GROUP ALL FOREIGN
EQUITY ENVIRONMENTAL AND SOCIAL VALUES FUND
MANAGEMENT’S DISCUSSION OF FUND PERFORMANCE
(Unaudited)
Dear Shareholder:
Market Outlook
Global developed markets and emerging markets (EM) has continued to rise, turning in a positive first half to the year. Despite growth equities outperformance in global developed markets, value equities have been outperforming lately, beating growth equities. However, that trend, as well as several sector and country winners and losers, reversed in June — a sign of things to come in our view. We think this trend is durable as equities focus on the likelihood of global economies slowing after an initial reopening surge.
In our view, equities are beginning to look beyond the next few months and ahead to a post-pandemic normal. Future growth likely returns to pre-pandemic trends—an environment that favors growth equities over value, in our view. While countertrends have no preset durations, growth equities have made up some ground in the last couple of months. Although COVID-19 could always stir sentiment in the short term, we think markets are focusing more on the global economy’s likelihood of slowing after an initial reopening surge. While the bull market in developed world equities likely continues for the foreseeable future, growth equities’ recent leadership is a sign of things to come, in our view.
After reaching post-Brexit trade deal in December 2020, the UK proposed a free-trade deal with Australia despite strong resistance from British farmers. The EU and Emerging Market India agreed to resume talks, which have been dormant since 2013, on a comprehensive trade deal. Yet Brussels also suffered a setback with Switzerland. After seven years of talks, Bern left negotiations for an updated EU deal, which sought to simplify and modernize their economic relationship by replacing scores of bilateral agreements with an overarching treaty. However, markets largely looked past all of this news as trade agreement progress did not correlate with regional outperformance. In our view, this is a reminder that trade developments don’t have a preset market impact. Changes often take a long time to become reality—usually beyond the timeframe we think equities focus on. Even if both sides reach an agreement after long negotiations, the terms are usually implemented over many years. This gradual, drawn-out process dampens most surprise power.
Regional elections in France grabbed headlines, as President Emmanuel Macron’s La Republique en Marche (LREM) party and presidential challenger Marine Le Pen’s National Rally both had worse-than-expected showings. Many treated the results as a sign for next year’s national elections, penciling in the Republicans’ Xavier Bertrand
FISHER INVESTMENTS INSTITUTIONAL GROUP ALL FOREIGN
EQUITY ENVIRONMENTAL AND SOCIAL VALUES FUND
MANAGEMENT’S DISCUSSION OF FUND PERFORMANCE
(Unaudited) – (continued)
with President Macron and Marine Le Pen in a three-person race, potentially upending the long-running presumption that the second round would be a rematch between the latter two. However, in our view, local elections don’t predict national votes. For one, LREM is a young party, lacking the grass roots operations necessary to thrive at the local level. Two, voter turnout was just under 35%—well below the two-thirds of voters who participated in 2017’s presidential race. Politically, the outcome may be a wakeup call for LREM and President Macron, who will probably focus on less controversial matters (e.g., COVID-19 relief) as next year’s election looms.
India’s battle with COVID-19 during the quarter was a humanitarian tragedy. Yet at times like this, we believe it is crucial to remember that markets are unemotional and, as a result, see through events like this and focus on corporate prospects over the next 3 – 30 months. Illustrating this, Indian equities rose overall. Indian banks got a big boost as they revised their estimated loan losses lower from the prolonged lockdown, easing widespread concerns over the financial impact of the country’s tragic ordeal with COVID-19. Buoyed by Financials and the prospect of much lower loan loss reserves, Indian equities overall surged in May 2021. Markets have been familiar with India’s infrastructure challenges for many years now, making the vaccine distribution difficulties sadly unsurprising. Overall, we think that as time passes, the faster recoveries in developed nations will help pull the rest of the world along.
Chinese data probably remains inconsistent a while longer, but the overall trend of slowing growth probably continues as the government continues trying to rein in perceived excess in the shadow financing world. The degree of government intervention was arguably one of investors’ main concerns during China’s correction, as regulators increasingly concentrated on Tech and Tech-like firms’ forays into commercial finance, sparking fears of drastic intervention. Those fears seemingly came true when The Wall Street Journal reported that regulators ordered large Internet platforms to unload all extra financial services from their mobile payment apps. The move drove speculation that if they want to continue providing financial services beyond mobile payments, big Chinese Tech firms will have to follow Ant Financial’s lead and reorganize as traditional financial institutions subject to normal banking regulations. This might seem negative, but markets barely reacted, which we think is logical. For one, markets seemingly dealt with this fear in March 2021, as rumors of future intervention swirled. Two, the largest Chinese internet platforms are well equipped to handle these changes, which may create barriers to entry for new competition, making these changes a long-term benefit. Overall, though, this seems like further confirmation that Chinese officials have shifted fully from their pandemic recovery efforts to their longer-running aims of promoting financial stability, illustrating the return to normal.
FISHER INVESTMENTS INSTITUTIONAL GROUP ALL FOREIGN
EQUITY ENVIRONMENTAL AND SOCIAL VALUES FUND
MANAGEMENT’S DISCUSSION OF FUND PERFORMANCE
(Unaudited) – (continued)
We expect a brief spike in economic growth largely from base-effect. Following the bounce, we expect the economic trends pre-COVID-19 to return highlighted by a shallow yield curve, tough access to credit and increasingly late cycle sentiment. This favors growth over value with high-quality firms in Tech or Tech-like industries of Internet Retail and Interactive Media as best positioned. Growth companies typically thrive in modest-growth environments as their sales and earnings are less dependent upon a strong economy, and investors seek out firms consistently able to grow. Value companies benefit more from an accelerating economic trajectory, with improved volume and higher operating leverage. We believe economic growth likely begins to inflect as last March’s base effect fades and the economy settles back into a trajectory similar to 2019, before the disruption.
Over halfway into 2021, markets are well familiar with the pandemic’s issues and setbacks—and are looking beyond them. We believe they are pricing in the return to pre-pandemic growth trends, an environment that favors growth equities over value. In our view, that most benefits the nations and sectors with growth characteristics, though we think maintaining exposure to high-growth value areas makes sense for diversification. Most of all, we expect the bull market in developed world equities to continue and deliver a good-to-great year.
Performance Attribution
The Fisher Investments Institutional Group All Foreign Equity Environmental and Social Values Fund outperformed the MSCI ACWI ex U.S. Index for the period from September 1, 2020 through August 31, 2021. During this period, the Fund returned 34.07% while the Fund’s primary benchmark, the MSCI ACWI ex U.S. Index, returned 24.87%. Country, sector and equity selection contributed to relative return. An overweight to and selection within Semiconductors & Semiconductor Equipment was the largest contributor to relative return, driven by ASML Holding, Taiwan Semiconductor and NXP Semiconductors. Additionally, an overweight to and selection within Industrials contributed as building materials manufacturer Saint-Gobain S.A., postal services courier Deutsche Post AG and human resources company Recruit Holdings outperformed. Conversely, an underweight to and selection within Financials was the largest detractor, driven by exchange organization and transaction provider Deutsche Boerse, stock exchange operator London Stock Exchange and banking services provider Banco Santander. Further, selection within China detracted, as internet retailer Alibaba, internet media company Tencent and food delivery platform Meituan underperformed.
FISHER INVESTMENTS INSTITUTIONAL GROUP ALL FOREIGN
EQUITY ENVIRONMENTAL AND SOCIAL VALUES FUND
Investment Results (Unaudited)
| Average Annual Total Return as of August 31, 2021 (a) |
| |
| | Fund/Index | | One Year | | Since
Inception
(7/17/20) | |
| | Fisher Investments Institutional Group All Foreign Equity Environmental and Social Values Fund | | 34.07% | | 33.98% | |
| | MSCI ACWI ex U.S. Index(b) | | 24.87% | | 26.13% | |
| | | | | | | |
| | | | | | Expense | |
| | | | | | Ratios(c) | |
| | Gross | | | | 95.58% | |
| | With Applicable Waivers | | | | 0.68% | |
The performance quoted represents past performance, which does not guarantee future results. The investment return and principal value of an investment will fluctuate so that an investor’s shares, when redeemed, may be worth more or less than their original cost. The returns shown do not reflect deduction of taxes that a shareholder would pay on Fisher Investments Institutional Group All Foreign Equity Environmental and Social Values Fund (the “Fund”) distributions or the redemption of Fund shares. The Fund’s investment objectives, risks, charges and expenses must be considered carefully before investing. Current performance of a fund may be lower or higher than the performance quoted. Performance data current to the most recent month end may be obtained by calling (800) 851-8845.
| (a) | Return figures reflect any change in price per share and assume the reinvestment of all distributions. |
| (b) | The MSCI ACWI ex U.S. Index is a stock market index comprising of non-U.S. stocks from 22 developed markets and 27 emerging markets. Individuals cannot invest directly in an index; however, an individual can invest in exchange traded funds or other investment vehicles that attempt to track the performance of a benchmark index. |
| (c) | The expense ratios are from the Fund’s prospectus dated December 29, 2020. Fisher Asset Management, LLC, d/b/a Fisher Investments (the “Adviser”) is contractually obligated to limit the Fund’s total annual operating expenses to 0.68% of the Fund’s average daily net assets through December 31, 2024 (excluding portfolio transaction and other investment-related costs (including brokerage fees and commissions); taxes; borrowing costs (such as interest and dividend expenses on securities sold short); acquired fund fees and expenses; certain fees and expenses associated with investments in other collective investment vehicles or derivative instruments (including for example option and swap fees and expenses); any administrative and/ or shareholder servicing fees payable pursuant to a plan adopted by the Board of Trustees; expenses incurred in connection with any merger or reorganization; extraordinary expenses (such as litigation expenses, indemnification of Trust officers and Trustees and contractual indemnification of Fund service providers); and other expenses that the Trustees agree have not been incurred in the ordinary course of the Fund’s business). This expense cap may not be terminated prior to this date except by the Board of Trustees. Each waiver/expense payment by the Adviser is subject to recoupment by the Adviser from the Fund in the three years following the date the particular waiver/expense payment occurred, but only if such recoupment can be achieved without exceeding the annual expense limitation in effect at the time of the waiver/expense payment and any expense limitation in effect at the time of the recoupment. Additional information pertaining to the Fund’s expense ratios as of August 31, 2021 can be found in the financial highlights. |
The Fund’s investment objective, strategies, risks, charges and expenses must be considered carefully before investing. The Fund’s prospectus contains this and other important information about the investment company and may be obtained by calling (800) 851-8845. Please read it carefully before investing.
The Fund is distributed by Ultimus Fund Distributors, LLC, Member FINRA/SIPC.
FISHER INVESTMENTS INSTITUTIONAL GROUP ALL FOREIGN
EQUITY ENVIRONMENTAL AND SOCIAL VALUES FUND
Investment Results (Unaudited) – (continued)
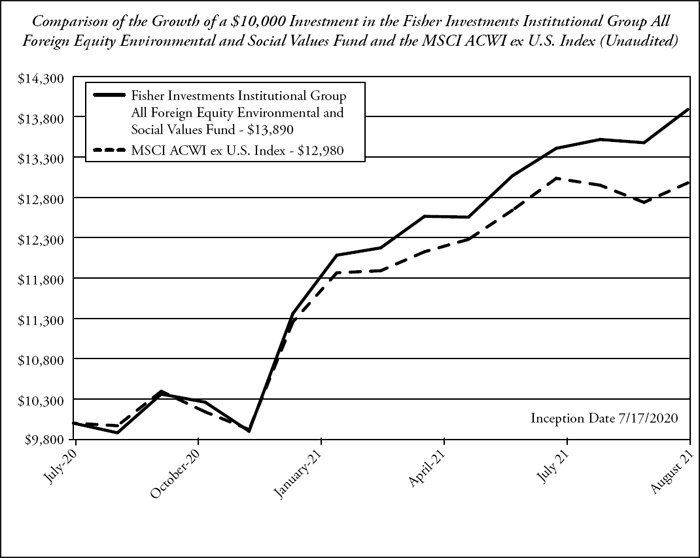
This graph shows the value of a hypothetical initial investment of $10,000 made on July 17, 2020 (commencement of operations) and held through August 31, 2021. MSCI ACWI ex U.S. Index is a widely recognized unmanaged index of equity prices and is representative of a broader market and range of securities than is found in the Fund’s portfolio. Individuals cannot invest directly in an index; however, an individual may invest in exchange traded funds or other investment vehicles that attempt to track the performance of a benchmark index. THE FUND’S RETURN REPRESENTS PAST PERFORMANCE AND DOES NOT GUARANTEE OR PREDICT FUTURE RESULTS. The returns shown do not reflect deduction of taxes that a shareholder would pay on Fund distributions or the redemption of Fund shares. Investment returns and principal values will fluctuate so that an investor’s shares, when redeemed, may be worth more or less than their original cost.
Current performance may be lower or higher than the performance data quoted. For more information on the Fund, and to obtain performance data current to the most recent month-end, or to request a prospectus, please call (800) 851-8845. You should carefully consider the investment objectives, risks, charges and expenses of the Fund before investing. The Fund’s prospectus contains this and other information about the Fund and should be read carefully before investing.
The Fund is distributed by Ultimus Fund Distributors, LLC, member FINRA/SIPC.
FISHER INVESTMENTS INSTITUTIONAL GROUP ALL FOREIGN
EQUITY ENVIRONMENTAL AND SOCIAL VALUES FUND
Fund Holdings (Unaudited)
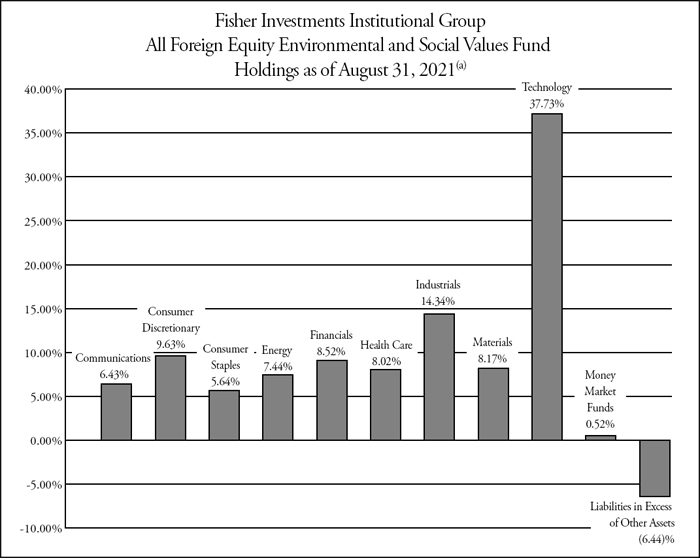
| (a) | As a percentage of net assets |
The investment objective of the Fund is to seek to outperform, net of fees and expenses, the return of the MSCI ACWI ex U.S. Index.
Availability of Portfolio Schedule – (Unaudited)
The Fund files its complete schedule of portfolio holdings with the Securities and Exchange Commission (the “SEC”) for the first and third quarters of each fiscal year as an exhibit to its reports on Form N-PORT. The Fund’s Form N-PORT reports are available on the SEC’s website at http://www.sec.gov.
| FISHER INVESTMENTS INSTITUTIONAL GROUP ALL FOREIGN |
| EQUITY ENVIRONMENTAL AND SOCIAL VALUES FUND |
| SCHEDULE OF INVESTMENTS |
| August 31, 2021 |
| | | Shares | | | Fair Value | |
| COMMON STOCKS — 105.92% | | | | | | |
| | | | | | | |
| Argentina — 0.90% | | | | | | | | |
| Consumer Discretionary — 0.90% | | | | | | | | |
| MercadoLibre, Inc.(a) | | | 1 | | | $ | 1,867 | |
| Total Argentina | | | | | | | 1,867 | |
| | | | | | | | | |
| Australia — 3.78% | | | | | | | | |
| Technology — 0.57% | | | | | | | | |
| Afterpay Ltd.(a) | | | 12 | | | | 1,181 | |
| | | | | | | | | |
| Health Care — 1.10% | | | | | | | | |
| CSL Ltd. | | | 10 | | | | 2,282 | |
| | | | | | | | | |
| Technology — 2.11% | | | | | | | | |
| Atlassian Corp. PLC, Class A(a) | | | 12 | | | | 4,405 | |
| | | | | | | | | |
| Total Australia | | | | | | | 7,868 | |
| | | | | | | | | |
| Brazil — 1.14% | | | | | | | | |
| Financials — 1.14% | | | | | | | | |
| Itau Unibanco Holding SA - ADR | | | 401 | | | | 2,378 | |
| Total Brazil | | | | | | | 2,378 | |
| | | | | | | | | |
| Canada — 1.23% | | | | | | | | |
| Technology — 1.23% | | | | | | | | |
| Open Text Corp. | | | 19 | | | | 1,042 | |
| Shopify, Inc., Class A(a) | | | 1 | | | | 1,525 | |
| | | | | | | | 2,567 | |
| Total Canada | | | | | | | 2,567 | |
| | | | | | | | | |
| China — 8.74% | | | | | | | | |
| Communications — 4.36% | | | | | | | | |
| NetEase, Inc. - ADR | | | 20 | | | | 1,948 | |
| Tencent Holdings Ltd. - ADR | | | 116 | | | | 7,152 | |
| | | | | | | | 9,100 | |
See accompanying notes which are an integral part of these financial statements.
| FISHER INVESTMENTS INSTITUTIONAL GROUP ALL FOREIGN |
| EQUITY ENVIRONMENTAL AND SOCIAL VALUES FUND |
| SCHEDULE OF INVESTMENTS – (continued) |
| August 31, 2021 |
| | | Shares | | | Fair Value | |
| COMMON STOCKS — 105.92% - continued | | | | | | | | |
| | | | | | | | | |
| China — 8.74% - (continued) | | | | | | | | |
| Consumer Discretionary — 4.38% | | | | | | | | |
| Alibaba Group Holding Ltd. - ADR(a) | | | 19 | | | $ | 3,173 | |
| JD.com, Inc. - ADR(a) | | | 54 | | | | 4,243 | |
| Meituan - ADR(a) | | | 27 | | | | 1,726 | |
| | | | | | | | 9,142 | |
| Total China | | | | | | | 18,242 | |
| | | | | | | | | |
| Colombia — 0.48% | | | | | | | | |
| Energy — 0.48% | | | | | | | | |
| Ecopetrol SA - ADR | | | 72 | | | | 1,005 | |
| Total Colombia | | | | | | | 1,005 | |
| | | | | | | | | |
| Denmark — 3.69% | | | | | | | | |
| Energy — 1.45% | | | | | | | | |
| Vestas Wind Systems A/S | | | 75 | | | | 3,028 | |
| | | | | | | | | |
| Health Care — 2.24% | | | | | | | | |
| Coloplast A/S - ADR | | | 51 | | | | 887 | |
| Novo Nordisk A/S, Class B | | | 38 | | | | 3,787 | |
| | | | | | | | 4,674 | |
| Total Denmark | | | | | | | 7,702 | |
| | | | | | | | | |
| France — 14.21% | | | | | | | | |
| Consumer Discretionary — 4.35% | | | | | | | | |
| Hermes International SA | | | 4 | | | | 5,878 | |
| Kering SA | | | 4 | | | | 3,183 | |
| | | | | | | | 9,061 | |
| Consumer Staples — 1.93% | | | | | | | | |
| Danone SA | | | 10 | | | | 731 | |
| L’Oreal SA | | | 7 | | | | 3,275 | |
| | | | | | | | 4,006 | |
| Financials — 0.76% | | | | | | | | |
| BNP Paribas SA | | | 12 | | | | 761 | |
| Credit Agricole SA(a) | | | 56 | | | | 807 | |
| | | | | | | | 1,568 | |
See accompanying notes which are an integral part of these financial statements.
| FISHER INVESTMENTS INSTITUTIONAL GROUP ALL FOREIGN |
| EQUITY ENVIRONMENTAL AND SOCIAL VALUES FUND |
| SCHEDULE OF INVESTMENTS – (continued) |
| August 31, 2021 |
| | | Shares | | | Fair Value | |
| COMMON STOCKS — 105.92% - continued | | | | | | | | |
| | | | | | | | | |
| France — 14.21% - (continued) | | | | | | | | |
| Health Care — 0.99% | | | | | | | | |
| Sanofi | | | 20 | | | $ | 2,069 | |
| | | | | | | | | |
| Industrials — 0.69% | | | | | | | | |
| Aeroports de Paris | | | 6 | | | | 705 | |
| Vinci SA - ADR | | | 27 | | | | 723 | |
| | | | | | | | 1,428 | |
| Materials — 2.37% | | | | | | | | |
| Cie de Saint-Gobain | | | 68 | | | | 4,929 | |
| | | | | | | | | |
| Technology — 3.12% | | | | | | | | |
| Dassault Systems SE | | | 75 | | | | 4,278 | |
| Teleperformance | | | 3 | | | | 1,326 | |
| Worldline SA/France(a) | | | 10 | | | | 889 | |
| | | | | | | | 6,493 | |
| Total France | | | | | | | 29,554 | |
| | | | | | | | | |
| Germany — 8.56% | | | | | | | | |
| Consumer Staples — 1.22% | | | | | | | | |
| Beiersdorf AG | | | 21 | | | | 2,548 | |
| | | | | | | | | |
| Financials — 1.32% | | | | | | | | |
| Deutsche Boerse AG | | | 16 | | | | 2,760 | |
| | | | | | | | | |
| Industrials — 4.21% | | | | | | | | |
| Deutsche Post AG | | | 75 | | | | 5,276 | |
| Siemens AG | | | 21 | | | | 3,492 | |
| | | | | | | | 8,768 | |
| Technology — 1.81% | | | | | | | | |
| SAP SE | | | 25 | | | | 3,763 | |
| | | | | | | | | |
| Total Germany | | | | | | | 17,839 | |
| | | | | | | | | |
| Hong Kong — 0.57% | | | | | | | | |
| Financials — 0.57% | | | | | | | | |
| AIA Group Ltd. - ADR | | | 25 | | | | 1,196 | |
| Total Hong Kong | | | | | | | 1,196 | |
See accompanying notes which are an integral part of these financial statements.
| FISHER INVESTMENTS INSTITUTIONAL GROUP ALL FOREIGN |
| EQUITY ENVIRONMENTAL AND SOCIAL VALUES FUND |
| SCHEDULE OF INVESTMENTS – (continued) |
| August 31, 2021 |
| | | Shares | | | Fair Value | |
| COMMON STOCKS — 105.92% - continued | | | | | | | | |
| | | | | | | | | |
| India — 1.58% | | | | | | | | |
| Financials — 1.58% | | | | | | | | |
| HDFC Bank Ltd. - ADR | | | 42 | | | $ | 3,288 | |
| Total India | | | | | | | 3,288 | |
| | | | | | | | | |
| Indonesia — 1.25% | | | | | | | | |
| Financials — 1.25% | | | | | | | | |
| Bank Rakyat Indonesia Persero Tbk PT - ADR | | | 191 | | | | 2,623 | |
| Total Indonesia | | | | | | | 2,623 | |
| | | | | | | | | |
| Israel — 1.95% | | | | | | | | |
| Technology — 1.95% | | | | | | | | |
| NICE-Systems Ltd. - ADR(a) | | | 4 | | | | 1,163 | |
| Wix.com Ltd.(a) | | | 13 | | | | 2,887 | |
| | | | | | | | 4,050 | |
| Total Israel | | | | | | | 4,050 | |
| | | | | | | | | |
| Italy — 1.75% | | | | | | | | |
| Energy — 1.30% | | | | | | | | |
| Eni SpA | | | 220 | | | | 2,716 | |
| | | | | | | | | |
| Financials — 0.45% | | | | | | | | |
| Intesa Sanpaolo SpA | | | 329 | | | | 931 | |
| | | | | | | | | |
| Total Italy | | | | | | | 3,647 | |
| | | | | | | | | |
| Japan — 12.64% | | | | | | | | |
| Communications — 2.07% | | | | | | | | |
| M3, Inc. | | | 64 | | | | 4,306 | |
| | | | | | | | | |
| Health Care — 1.68% | | | | | | | | |
| Eisai Co. Ltd. - ADR | | | 10 | | | | 826 | |
| Hoya Corp. - ADR | | | 11 | | | | 1,785 | |
| Terumo Corp. - ADR(a) | | | 21 | | | | 879 | |
| | | | | | | | 3,490 | |
See accompanying notes which are an integral part of these financial statements.
| FISHER INVESTMENTS INSTITUTIONAL GROUP ALL FOREIGN |
| EQUITY ENVIRONMENTAL AND SOCIAL VALUES FUND |
| SCHEDULE OF INVESTMENTS – (continued) |
| August 31, 2021 |
| | | Shares | | | Fair Value | |
| COMMON STOCKS — 105.92% - continued | | | | | | | | |
| | | | | | | | | |
| Japan — 12.64% - (continued) | | | | | | | | |
| Industrials — 8.25% | | | | | | | | |
| Daifuku Co. Ltd - ADR | | | 50 | | | $ | 1,127 | |
| FANUC Corp. - ADR | | | 115 | | | | 2,510 | |
| Keyence Corp. | | | 15 | | | | 9,016 | |
| Recruit Holdings Co. Ltd. - ADR(a) | | | 386 | | | | 4,536 | |
| | | | | | | | 17,189 | |
| Technology — 0.64% | | | | | | | | |
| Obic Co. Ltd. | | | 7 | | | | 1,333 | |
| | | | | | | | | |
| Total Japan | | | | | | | 26,318 | |
| | | | | | | | | |
| Korea (Republic Of) — 3.72% | | | | | | | | |
| Technology — 3.72% | | | | | | | | |
| Samsung Electronics Co. Ltd. | | | 117 | | | | 7,743 | |
| Total Korea (Republic Of) | | | | | | | 7,743 | |
| | | | | | | | | |
| Netherlands — 13.98% | | | | | | | | |
| Financials — 0.66% | | | | | | | | |
| ING Groep NV | | | 100 | | | | 1,382 | |
| | | | | | | | | |
| Technology — 13.32% | | | | | | | | |
| Adyen NV(a) | | | 1 | | | | 3,229 | |
| ASML Holding NV | | | 17 | | | | 14,142 | |
| NXP Semiconductors NV | | | 35 | | | | 7,530 | |
| Wolters Kluwer NV | | | 25 | | | | 2,876 | |
| | | | | | | | 27,777 | |
| Total Netherlands | | | | | | | 29,159 | |
| | | | | | | | | |
| Norway — 1.60% | | | | | | | | |
| Energy — 1.60% | | | | | | | | |
| Equinor ASA | | | 156 | | | | 3,315 | |
| Total Norway | | | | | | | 3,315 | |
See accompanying notes which are an integral part of these financial statements.
| FISHER INVESTMENTS INSTITUTIONAL GROUP ALL FOREIGN |
| EQUITY ENVIRONMENTAL AND SOCIAL VALUES FUND |
| SCHEDULE OF INVESTMENTS – (continued) |
| August 31, 2021 |
| | | Shares | | | Fair Value | |
| COMMON STOCKS — 105.92% - continued | | | | | | | | |
| | | | | | | | | |
| Spain — 2.19% | | | | | | | | |
| Energy — 1.38% | | | | | | | | |
| Repsol SA | | | 250 | | | $ | 2,865 | |
| | | | | | | | | |
| Financials — 0.37% | | | | | | | | |
| Banco Santander SA | | | 209 | | | | 772 | |
| | | | | | | | | |
| Technology — 0.44% | | | | | | | | |
| Amadeus IT Group SA(a) | | | 15 | | | | 916 | |
| | | | | | | | | |
| Total Spain | | | | | | | 4,553 | |
| | | | | | | | | |
| Switzerland — 1.80% | | | | | | | | |
| Industrials — 1.19% | | | | | | | | |
| ABB Ltd. | | | 67 | | | | 2,482 | |
| | | | | | | | | |
| Technology — 0.61% | | | | | | | | |
| Temenos AG | | | 8 | | | | 1,270 | |
| | | | | | | | | |
| Total Switzerland | | | | | | | 3,752 | |
| | | | | | | | | |
| Taiwan Province Of China — 6.00% | | | | | | | | |
| Technology — 6.00% | | | | | | | | |
| Taiwan Semiconductor Manufacturing Co. Ltd. - ADR | | | 105 | | | | 12,496 | |
| Total Taiwan Province Of China | | | | | | | 12,496 | |
| | | | | | | | | |
| United Kingdom — 14.16% | | | | | | | | |
| Consumer Staples — 2.49% | | | | | | | | |
| Coca-Cola European Partners PLC | | | 57 | | | | 3,291 | |
| Reckitt Benckiser Group PLC | | | 25 | | | | 1,904 | |
| | | | | | | | 5,195 | |
| Energy — 1.23% | | | | | | | | |
| BP PLC | | | 630 | | | | 2,572 | |
| | | | | | | | | |
| Financials — 0.42% | | | | | | | | |
| London Stock Exchange Group PLC | | | 8 | | | | 875 | |
See accompanying notes which are an integral part of these financial statements.
| FISHER INVESTMENTS INSTITUTIONAL GROUP ALL FOREIGN |
| EQUITY ENVIRONMENTAL AND SOCIAL VALUES FUND |
| SCHEDULE OF INVESTMENTS – (continued) |
| August 31, 2021 |
| | | Shares | | | Fair Value | |
| COMMON STOCKS — 105.92% - continued | | | | | | | | |
| | | | | | | | | |
| United Kingdom — 14.16% - (continued) | | | | | | | | |
| Health Care — 2.01% | | | | | | | | |
| AstraZeneca PLC | | | 26 | | | $ | 3,044 | |
| GlaxoSmithKline PLC | | | 57 | | | | 1,146 | |
| | | | | | | | 4,190 | |
| Materials — 5.80% | | | | | | | | |
| Anglo American PLC | | | 102 | | | | 4,304 | |
| Antofagasta PLC | | | 223 | | | | 4,465 | |
| Rio Tinto PLC | | | 45 | | | | 3,330 | |
| | | | | | | | 12,099 | |
| Technology — 2.21% | | | | | | | | |
| Experian PLC | | | 105 | | | | 4,625 | |
| | | | | | | | | |
| Total United Kingdom | | | | | | | 29,556 | |
| | | | | | | | | |
| Total Common Stocks — 105.92% | | | | | | | | |
| (Cost $167,419) | | | | | | | 220,718 | |
| | | | | | | | | |
| MONEY MARKET FUNDS — 0.52% | | | | | | | | |
| | | | | | | | | |
| First American Government Obligations Fund, X Class, 0.03%(b) | | | 1,079 | | | | 1,079 | |
| | | | | | | | | |
| Total Money Market Funds — 0.52% | | | | | | | 1,079 | |
| (Cost $1,079) | | | | | | | | |
| | | | | | | | | |
| Total Investments — 106.44% | | | | | | | | |
| (Cost $168,498) | | | | | | | 221,797 | |
| | | | | | | | | |
| Liabilities in Excess of Other Assets — (6.44)% | | | | | | | (13,412 | ) |
| | | | | | | | | |
| NET ASSETS — 100.00% | | | | | | $ | 208,385 | |
| (a) | Non-income producing security. |
| (b) | Rate disclosed is the seven day effective yield as of August 31, 2021. |
See accompanying notes which are an integral part of these financial statements.
| FISHER INVESTMENTS INSTITUTIONAL GROUP ALL FOREIGN |
| EQUITY ENVIRONMENTAL AND SOCIAL VALUES FUND |
| STATEMENT OF ASSETS AND LIABILITIES |
| August 31, 2021 |
| Assets | | | | |
| Investments in securities at fair value (cost $168,498) | | $ | 221,797 | |
| Cash | | | 29 | |
| Dividends receivable | | | 635 | |
| Receivable from Adviser | | | 12,093 | |
| Prepaid expenses | | | 4,393 | |
| Total Assets | | | 238,947 | |
| Liabilities | | | | |
| Payable to affiliates | | | 6,145 | |
| Other accrued expenses | | | 24,417 | |
| Total Liabilities | | | 30,562 | |
| Net Assets | | $ | 208,385 | |
| Net Assets consist of: | | | | |
| Paid-in capital | | | 150,640 | |
| Accumulated earnings | | | 57,745 | |
| Net Assets | | $ | 208,385 | |
| Shares outstanding (unlimited number of shares authorized, no par value) | | | 15,055 | |
| Net asset value, offering and redemption price per share | | $ | 13.84 | |
See accompanying notes which are an integral part of these financial statements.
| FISHER INVESTMENTS INSTITUTIONAL GROUP ALL FOREIGN |
| EQUITY ENVIRONMENTAL AND SOCIAL VALUES FUND |
| STATEMENT OF OPERATIONS |
| For the year ended August 31, 2021 |
| Investment Income | | | | |
| Dividend income (net of foreign taxes withheld of $506) | | $ | 3,385 | |
| Total investment income | | | 3,385 | |
| Expenses | | | | |
| Administration | | | 40,000 | |
| Audit and tax | | | 18,660 | |
| Legal | | | 17,348 | |
| Trustee | | | 13,942 | |
| Transfer agent | | | 12,000 | |
| Compliance services | | | 12,000 | |
| Custodian | | | 6,063 | |
| Report printing | | | 4,853 | |
| Pricing | | | 4,835 | |
| Adviser | | | 1,129 | |
| Registration | | | 768 | |
| Miscellaneous | | | 16,992 | |
| Total expenses | | | 148,590 | |
| Fees waived and expenses reimbursed by Adviser | | | (147,330 | ) |
| Net operating expenses | | | 1,260 | |
| Net investment income | | | 2,125 | |
| Net Realized and Change in Unrealized Gain (Loss) on Investments | | | | |
| Net realized gain on investment securities transactions | | | 2,726 | |
| Net realized gain on foreign currency translations | | | 23 | |
| Net change in unrealized appreciation (depreciation) of investment securities | | | 48,090 | |
| Net change in unrealized appreciation(depreciation) of foreign currency | | | (4 | ) |
| Net realized and change in unrealized gain on investments | | | 50,835 | |
| Net increase in net assets resulting from operations | | $ | 52,960 | |
See accompanying notes which are an integral part of these financial statements.
| FISHER INVESTMENTS INSTITUTIONAL GROUP ALL FOREIGN |
| EQUITY ENVIRONMENTAL AND SOCIAL VALUES FUND |
| STATEMENTS OF CHANGES IN NET ASSETS |
| | | For the | | | For the | |
| | | Year | | | Period | |
| | | Ended | | | Ended | |
| | | August 31, | | | August 31, | |
| | | 2021 | | | 2020(a) | |
| Increase (Decrease) in Net Assets due to: | | | | | | | | |
| Operations | | | | | | | | |
| Net investment income | | $ | 2,125 | | | $ | 176 | |
| Net realized gain on investment securities transactions | | | 2,749 | | | | 27 | |
| Net change in unrealized appreciation of investment securities | | | 48,086 | | | | 5,212 | |
| Net increase in net assets resulting from operations | | | 52,960 | | | | 5,415 | |
| Distributions From: | | | | | | | | |
| Earnings | | | (630 | ) | | | — | |
| Total distributions | | | (630 | ) | | | — | |
| Capital Transactions | | | | | | | | |
| Proceeds from shares sold | | | — | | | | 150,010 | |
| Reinvestment of distributions | | | 630 | | | | — | |
| Net increase in net assets resulting from capital transactions | | | 630 | | | | 150,010 | |
| Total Increase in Net Assets | | | 52,960 | | | | 155,425 | |
| Net Assets | | | | | | | | |
| Beginning of period | | | 155,425 | | | | — | |
| End of period | | $ | 208,385 | | | $ | 155,425 | |
| Share Transactions | | | | | | | | |
| Shares sold | | | — | | | | 15,001 | |
| Shares issued in reinvestment of distributions | | | 54 | | | | — | |
| Net increase in shares | | | 54 | | | | 15,001 | |
| (a) | For the period July 17, 2020 (commencement of operations) to August 31, 2020. |
See accompanying notes which are an integral part of these financial statements.
| FISHER INVESTMENTS INSTITUTIONAL GROUP ALL FOREIGN |
| EQUITY ENVIRONMENTAL AND SOCIAL VALUES FUND |
| FINANCIAL HIGHLIGHTS |
(For a share outstanding during each period)
| | | For the | | | For the | |
| | | Year | | | Period | |
| | | Ended | | | Ended | |
| | | August 31, | | | August 31, | |
| | | 2021 | | | 2020(a) | |
| Selected Per Share Data: | | | | | | | | |
| Net asset value, beginning of period | | $ | 10.36 | | | $ | 10.00 | |
| Investment operations: | | | | | | | | |
| Net investment income | | | 0.14 | | | | 0.01 | |
| Net realized and unrealized gain | | | 3.38 | | | | 0.35 | |
| Total from investment operations | | | 3.52 | | | | 0.36 | |
| | | | | | | | | |
| Less distributions from: | | | | | | | | |
| Net investment income | | | (0.04 | ) | | | — | |
| Total distributions | | | (0.04 | ) | | | — | |
| Net asset value, end of period | | $ | 13.84 | | | $ | 10.36 | |
| | | | | | | | | |
| Total Return(b) | | | 34.07 | % | | | 3.60 | % (c) |
| Ratios and Supplemental Data: | | | | | | | | |
| Net assets, end of period (000 omitted) | | $ | 208 | | | $ | 155 | |
| Ratio of net expenses to average net assets | | | 0.68 | % | | | 0.68 | % (d) |
| Ratio of gross expenses to average net assets before waiver and reimbursement | | | 80.18 | % | | | 201.44 | % (d) |
| Ratio of net investment income to average net assets | | | 1.15 | % | | | 0.98 | % (d) |
| Portfolio turnover rate | | | 17 | % | | | 4 | % (c) |
| (a) | For the period July 17, 2020 (commencement of operations) to August 31, 2020. |
| (b) | Total return represents the rate that the investor would have earned or lost on an investment in the Fund, assuming reinvestment of distributions. |
See accompanying notes which are an integral part of these financial statements.
| FISHER INVESTMENTS INSTITUTIONAL GROUP ALL FOREIGN |
| EQUITY ENVIRONMENTAL AND SOCIAL VALUES FUND |
| NOTES TO THE FINANCIAL STATEMENTS |
| August 31, 2021 |
NOTE 1. ORGANIZATION
Fisher Investments Institutional Group All Foreign Equity Environmental and Social Values Fund (the “Fund”) is registered under the Investment Company Act of 1940, as amended (“1940 Act”), as a diversified series of Unified Series Trust (the “Trust”) on November 12, 2018. The Trust is an open-end investment company established under the laws of Ohio by an Agreement and Declaration of Trust dated October 14, 2002 (the “Trust Agreement”). The Trust Agreement permits the Board of Trustees of the Trust (the “Board”) to issue an unlimited number of shares of beneficial interest of separate series without par value. The Fund is one of a series of funds currently authorized by the Board. The Fund commenced operations on July 17, 2020. The investment adviser to the Fund is Fisher Asset Management, LLC, d/b/a Fisher Investments (the “Adviser”). The investment objective of the Fund is to seek to outperform, net of fees and expenses, the return of the MSCI ACWI ex US Index.
NOTE 2. SIGNIFICANT ACCOUNTING POLICIES
The Fund is an investment company and follows accounting and reporting guidance under Financial Accounting Standards Board Accounting Standards Codification (“ASC”) Topic 946, “Financial Services-Investment Companies.” The following is a summary of significant accounting policies followed by the Fund in the preparation of its financial statements. These policies are in conformity with generally accepted accounting principles in the United States of America (“GAAP”).
Estimates – The preparation of financial statements in conformity with GAAP requires management to make estimates and assumptions that affect the reported amounts of assets and liabilities and disclosure of contingent assets and liabilities at the date of the financial statements and the reported amounts of increases and decreases in net assets from operations during the reporting period. Actual results could differ from those estimates.
Foreign Currency Translation – The accounting records of the Fund are maintained in U.S. dollars. Foreign currency amounts are translated into U.S. dollars at the current rate of exchange each business day to determine the value of investments, and other assets and liabilities. Purchases and sales of foreign securities, and income and expenses, are translated at the prevailing rate of exchange on the respective date of these transactions. The Fund does not isolate that portion of the results of operations resulting from changes in foreign exchange rates on investments from fluctuations arising from changes in market prices of securities held. These fluctuations are
| FISHER INVESTMENTS INSTITUTIONAL GROUP ALL FOREIGN |
| EQUITY ENVIRONMENTAL AND SOCIAL VALUES FUND |
| NOTES TO THE FINANCIAL STATEMENTS – (continued) |
| August 31, 2021 |
NOTE 2. SIGNIFICANT ACCOUNTING POLICIES – continued
included with the realized and unrealized gain or loss from investments. Net realized gain (loss) on foreign currency translations on the Statement of Operations represents currency gains (losses) realized between the trade and settlement dates on securities transactions, and the difference between the amount of investment income and foreign withholding taxes recorded on the Fund’s books and the U.S. dollar equivalent amounts actually received or paid. The change in unrealized currency gains (losses) on foreign currency translations for the period is reflected in the Statement of Operations.
Federal Income Taxes – The Fund makes no provision for federal income or excise tax. The Fund has qualified and intends to qualify each year as a regulated investment company (“RIC”) under subchapter M of the Internal Revenue Code of 1986, as amended, by complying with the requirements applicable to RICs and by distributing substantially all of its taxable income. The Fund also intends to distribute sufficient net investment income and net realized capital gains, if any, so that it will not be subject to excise tax on undistributed income and gains. If the required amount of net investment income or gains is not distributed, the Fund could incur a tax expense.
As of and during the fiscal year ended August 31, 2021, the Fund did not have any liabilities for any unrecognized tax benefits. The Fund recognizes interest and penalties, if any, related to unrecognized tax benefits as income tax expense on the Statement of Operations when incurred. During the fiscal year ended August 31, 2021, the Fund did not incur any interest or penalties. Management of the Fund has reviewed tax positions taken in tax years that remain subject to examination by all major tax jurisdictions, including federal (i.e., the last three tax year ends and the interim tax period since then, as applicable). Management believes that there is no tax liability resulting from unrecognized tax benefits related to uncertain tax positions taken.
Expenses – Expenses incurred by the Trust that do not relate to a specific fund of the Trust are allocated to the individual funds based on each fund’s relative net assets or another appropriate basis (as determined by the Board).
Security Transactions and Related Income – The Fund follows industry practice and records security transactions on the trade date for financial reporting purposes. The specific identification method is used for determining gains or losses for financial statements and income tax purposes. Dividend income is recorded on the ex-dividend
| FISHER INVESTMENTS INSTITUTIONAL GROUP ALL FOREIGN |
| EQUITY ENVIRONMENTAL AND SOCIAL VALUES FUND |
| NOTES TO THE FINANCIAL STATEMENTS – (continued) |
| August 31, 2021 |
NOTE 2. SIGNIFICANT ACCOUNTING POLICIES – continued
date and interest income is recorded on an accrual basis. Withholding taxes on foreign dividends and related reclaims have been provided for in accordance with the Fund’s understanding of the applicable country’s tax rules and rates.
Dividends and Distributions – The Fund intends to distribute its net investment income and net realized long-term and short-term capital gains, if any, at least annually. Dividends and distributions to shareholders, which are determined in accordance with income tax regulations, are recorded on the ex-dividend date. The treatment for financial reporting purposes of distributions made to shareholders during the period from net investment income or net realized capital gains may differ from their ultimate treatment for federal income tax purposes. These differences are caused primarily by differences in the timing of the recognition of certain components of income, expense or realized capital gain for federal income tax purposes. Where such differences are permanent in nature, they are reclassified among the components of net assets based on their ultimate characterization for federal income tax purposes. Any such reclassifications will have no effect on net assets, results of operations or net asset value (“NAV”) per share of the Fund.
NOTE 3. SECURITIES VALUATION AND FAIR VALUE MEASUREMENTS
The Fund values its portfolio securities at fair value as of the close of regular trading on the New York Stock Exchange (“NYSE”) (normally 4:00 p.m. Eastern time) on each business day the NYSE is open for business. Fair value is defined as the price that the Fund would receive upon selling an investment in a timely transaction to an independent buyer in the principal or most advantageous market of the investment. GAAP establishes a three-tier hierarchy to maximize the use of observable market data and minimize the use of unobservable inputs and to establish classification of fair value measurements for disclosure purposes.
Inputs refer broadly to the assumptions that market participants would use in pricing the asset or liability, including assumptions about risk (the risk inherent in a particular valuation technique used to measure fair value including a pricing model and/or the risk inherent in the inputs to the valuation technique). Inputs may be observable or unobservable. Observable inputs are inputs that reflect the assumptions market participants would use in pricing the asset or liability developed based on market data obtained and available from sources independent of the reporting entity. Unobservable
| FISHER INVESTMENTS INSTITUTIONAL GROUP ALL FOREIGN |
| EQUITY ENVIRONMENTAL AND SOCIAL VALUES FUND |
| NOTES TO THE FINANCIAL STATEMENTS – (continued) |
| August 31, 2021 |
NOTE 3. SECURITIES VALUATION AND FAIR VALUE MEASUREMENTS – continued
inputs are inputs that reflect the reporting entity’s own assumptions about the assumptions market participants would use in pricing the asset or liability developed based on the best information available in the circumstances.
Various inputs are used in determining the value of the Fund’s investments. These inputs are summarized in the three broad levels listed below.
| ● | Level 1 – unadjusted quoted prices in active markets for identical investments and/or registered investment companies where the value per share is determined and published and is the basis for current transactions for identical assets or liabilities at the valuation date |
| ● | Level 2 – other significant observable inputs (including, but not limited to, quoted prices for an identical security in an inactive market, quoted prices for similar securities, interest rates, prepayment speeds, credit risk, etc.) |
| ● | Level 3 – significant unobservable inputs (including the Fund’s own assumptions in determining fair value of investments based on the best information available) |
The inputs used to measure fair value may fall into different levels of the fair value hierarchy. In such cases, for disclosure purposes, the level in the fair value hierarchy which is reported is determined based on the lowest level input that is significant to the fair value measurement in its entirety.
Equity securities that are traded on any stock exchange are generally valued at the last quoted sale price on the security’s primary exchange. Lacking a last sale price, an exchange-traded security is generally valued at its last bid price. Securities traded in the NASDAQ over-the-counter market are generally valued at the NASDAQ Official Closing Price. When using market quotations and when the market is considered active, the security is classified as a Level 1 security. In the event that market quotations are not readily available or are considered unreliable due to market or other events, the Fund values its securities and other assets at fair value in accordance with policies established by and under the general supervision of the Board. Under these policies, the securities will be classified as Level 2 or 3 within the fair value hierarchy, depending on the inputs used.
| FISHER INVESTMENTS INSTITUTIONAL GROUP ALL FOREIGN |
| EQUITY ENVIRONMENTAL AND SOCIAL VALUES FUND |
| NOTES TO THE FINANCIAL STATEMENTS – (continued) |
| August 31, 2021 |
NOTE 3. SECURITIES VALUATION AND FAIR VALUE MEASUREMENTS – continued
Investments in mutual funds, including money market mutual funds, are generally priced at the ending NAV provided by the service agent of the mutual funds. These securities are categorized as Level 1 securities.
In accordance with the Trust’s valuation policies, the Adviser is required to consider all appropriate factors relevant to the value of securities for which it has determined other pricing sources are not available or reliable as described above. No single method exists for determining fair value, because fair value depends upon the circumstances of each individual case. As a general principle, the current fair value of a security being valued by the Adviser would be the amount that the Fund might reasonably expect to receive upon the current sale. Methods that are in accordance with this principle may, for example, be based on (i) a multiple of earnings; (ii) a discount from market prices of a similar freely traded security (including a derivative security or a basket of securities traded on other markets, exchanges or among dealers); or (iii) yield to maturity with respect to debt issues, or a combination of these and other methods. Fair-value pricing is permitted if, in the Adviser’s opinion, the validity of market quotations appears to be questionable based on factors such as evidence of a thin market in the security based on a small number of quotations, a significant event occurs after the close of a market but before the Fund’s NAV calculation that may affect a security’s value, or the Adviser is aware of any other data that calls into question the reliability of market quotations.
The following is a summary of the inputs used to value the Fund’s investments as of August 31, 2021:
| | | Valuation Inputs | |
| | | Level 1 | | | Level 2 | | | Level 3 | | | Total | |
| Assets | | | | | | | | | | | | | | | | |
| Common Stocks(a) | | $ | 220,718 | | | $ | — | | | $ | — | | | $ | 220,718 | |
| Money Market Funds | | | 1,079 | | | | — | | | | — | | | | 1,079 | |
| Total | | $ | 221,797 | | | $ | — | | | $ | — | | | $ | 221,797 | |
| (a) | Refer to Schedule of Investments for sector classifications. |
| FISHER INVESTMENTS INSTITUTIONAL GROUP ALL FOREIGN |
| EQUITY ENVIRONMENTAL AND SOCIAL VALUES FUND |
| NOTES TO THE FINANCIAL STATEMENTS – (continued) |
| August 31, 2021 |
NOTE 3. SECURITIES VALUATION AND FAIR VALUE MEASUREMENTS – continued
The Fund did not hold any investments at the end of the reporting period for which significant unobservable inputs (Level 3) were used in determining fair value; therefore, no reconciliation of Level 3 securities is included for this reporting period. The Fund did not hold any derivative instruments during the reporting period.
NOTE 4. FEES AND OTHER TRANSACTIONS WITH AFFILIATES
The Adviser, under the terms of the management agreement (the “Agreement”) with the Trust with respect to the Fund, manages the Fund’s investments. As compensation for its management services, the Fund is obligated to pay the Adviser a fee computed and accrued daily and paid monthly at an annual rate of 0.61% of the Fund’s average daily net assets. For the fiscal year ended August 31, 2021, the Adviser earned fees of $1,129 from the Fund before the waiver and reimbursement described below.
The Adviser is contractually obligated to limit the Fund’s total annual operating expenses to 0.68% of the Fund’s average daily net assets through December 31, 2024 (excluding portfolio transaction and other investment-related costs (including brokerage fees and commissions); taxes; borrowing costs (such as interest and dividend expenses on securities sold short); acquired fund fees and expenses; fees and expenses associated with investments in other collective investment vehicles or derivative instruments (including for example option and swap fees and expenses); any amounts payable pursuant to a distribution or service plan adopted in accordance with Rule 12b-1 under the 1940 Act; any administrative and/or shareholder servicing fees payable to financial intermediaries; expenses incurred in connection with any merger or reorganization; extraordinary expenses (such as litigation expenses, indemnification of Trust officers and Trustees and contractual indemnification of Fund service providers); and other expenses that the Trustees agree have not been incurred in the ordinary course of the Fund’s business. This expense cap may not be terminated prior to this date except by the Board of Trustees. For the fiscal year ended August 31, 2021, the Adviser waived fees and reimbursed expenses in the amount of $147,330 for the Fund. At August 31, 2021, the Adviser owed the Fund $12,093.
Each waiver/expense payment by the Adviser is subject to recoupment by the Adviser from the Fund in the three years following the date the particular expense payment occurred, but only if such recoupment can be achieved without exceeding the annual
| FISHER INVESTMENTS INSTITUTIONAL GROUP ALL FOREIGN |
| EQUITY ENVIRONMENTAL AND SOCIAL VALUES FUND |
| NOTES TO THE FINANCIAL STATEMENTS – (continued) |
| August 31, 2021 |
NOTE 4. FEES AND OTHER TRANSACTIONS WITH AFFILIATES – continued
expense limitation in effect at the time of the expense payment and any expense limitation in effect at the time of the recoupment. As of August 31, 2021, the Adviser may seek repayment of expense reimbursements in the amount as follows:
| Recoverable through |
| August 31, 2023 | | $ | 35,943 | |
| August 31, 2024 | | | 147,330 | |
Ultimus Fund Solutions, LLC (“Ultimus”) provides administration, fund accounting and transfer agent services to the Fund. The Fund pays Ultimus fees in accordance with the agreements for such services.
Northern Lights Compliance Services, LLC (“NLCS”), an affiliate of Ultimus, provides a Chief Compliance Officer to the Trust, as well as related compliance services, pursuant to a consulting agreement between NLCS and the Trust. Under the terms of such agreement, NLCS receives fees from the Fund, which are approved annually by the Board. Prior to April 1, 2021, Ultimus provided certain compliance services and Buttonwood Compliance Partners provided the Chief Compliance Officer to the Trust.
Under the terms of a Distribution Agreement with the Trust, Ultimus Fund Distributors, LLC (the “Distributor”) serves as principal underwriter to the Fund. The Distributor is a wholly-owned subsidiary of Ultimus. The Distributor is compensated by the Adviser (not the Fund) for acting as principal underwriter.
Certain officers and a Trustee of the Trust are also employees of Ultimus and are not paid by the Fund for serving in such capacities.
The Board supervises the business activities of the Trust. Each Trustee serves as a trustee until termination of the Trust unless the Trustee dies, resigns, retires, or is removed. The Chairman of the Board and more than 75% of the Trustees are “Independent Trustees,” which means that they are not “interested persons” as defined in the 1940 Act. Each Independent Trustee of the Trust receives annual compensation of $2,510 per fund from the Trust, except that the Chairman of the Audit Committee, the Chairman of the Governance & Nominating Committee, and the Chairman of the
| FISHER INVESTMENTS INSTITUTIONAL GROUP ALL FOREIGN |
| EQUITY ENVIRONMENTAL AND SOCIAL VALUES FUND |
| NOTES TO THE FINANCIAL STATEMENTS – (continued) |
| August 31, 2021 |
NOTE 4. FEES AND OTHER TRANSACTIONS WITH AFFILIATES – continued
Pricing & Liquidity Committee each receives annual compensation of $2,960 per fund from the Trust, and the Independent Chairman of the Board receives $3,160 per fund from the Trust. Independent Trustees also receive $250 for the first hour and $200 for each additional hour for attending special meetings. Prior to January 1, 2021, these fees were $2,290 for non-chairmen and $2,740 for all chairmen. In addition, the Trust reimburses Independent Trustees for out-of-pocket expenses incurred in conjunction with attendance at meetings.
NOTE 5. INVESTMENT TRANSACTIONS
For the fiscal year ended August 31, 2021, purchases and sales of investment securities, other than short-term investments, were $45,812 and $33,111, respectively.
There were no purchases or sales of long-term U.S. government obligations during the fiscal year ended August 31, 2021.
NOTE 6. BENEFICIAL OWNERSHIP
The beneficial ownership, either directly or indirectly, of more than 25% of the voting securities of a fund creates a presumption of control of a fund, under Section 2(a)(9) of the 1940 Act. As of August 31, 2021, the Adviser owned 99.99% of the Fund’s outstanding shares. As a result, the Adviser may be deemed to control the Fund.
NOTE 7. FEDERAL TAX INFORMATION
At August 31, 2021, the net unrealized appreciation (depreciation) and tax cost of investments for tax purposes was as follows:
| Gross unrealized appreciation | | $ | 57,504 | |
| Gross unrealized depreciation | | | (4,505 | ) |
| Net unrealized appreciation on investments | | $ | 52,999 | |
| Tax cost of investments | | $ | 168,797 | |
| FISHER INVESTMENTS INSTITUTIONAL GROUP ALL FOREIGN |
| EQUITY ENVIRONMENTAL AND SOCIAL VALUES FUND |
| NOTES TO THE FINANCIAL STATEMENTS – (continued) |
| August 31, 2021 |
NOTE 7. FEDERAL TAX INFORMATION – continued
The tax character of distributions paid for the fiscal year ended August 31, 2021 was as follows:
| Distributions paid from: | | | | |
| Ordinary income(a) | | $ | 630 | |
| Total distributions paid | | $ | 630 | |
| (a) | Short-term capital gain distributions are treated as ordinary income for tax purposes. |
At August 31, 2021, the components of accumulated earnings (deficit) on a tax basis were as follows:
| Undistributed ordinary income | | $ | 3,956 | |
| Undistributed long-term capital gains | | | 790 | |
| Unrealized appreciation on investments | | | 52,999 | |
| Total accumulated earnings | | $ | 57,745 | |
NOTE 8. SECTOR RISK
If the Fund has significant investments in the securities of issuers within a particular sector, any development affecting that sector will have a greater impact on the value of the net assets of the Fund than would be the case if the Fund did not have significant investments in that sector. In addition, this may increase the risk of loss in the Fund and increase the volatility of the Fund’s NAV per share. For instance, economic or market factors, regulatory changes or other developments may negatively impact all companies in a particular sector, and therefore the value of the Fund’s portfolio will be adversely affected. As of August 31, 2021, the Fund had 37.73% of the value of its net assets invested in stocks within the Technology sector.
NOTE 9. COMMITMENTS AND CONTINGENCIES
The Trust indemnifies its officers and Trustees for certain liabilities that may arise from their performance of their duties to the Trust or the Fund. Additionally, in the normal course of business, the Trust enters into contracts that contain a variety of representations and warranties which provide general indemnifications. The Trust’s maximum exposure under these arrangements is unknown, as this would involve future claims that may be made against the Trust that have not yet occurred.
| FISHER INVESTMENTS INSTITUTIONAL GROUP ALL FOREIGN |
| EQUITY ENVIRONMENTAL AND SOCIAL VALUES FUND |
| NOTES TO THE FINANCIAL STATEMENTS – (continued) |
| August 31, 2021 |
NOTE 10. SUBSEQUENT EVENTS
Management of the Fund has evaluated the need for disclosures and/or adjustments resulting from subsequent events through the date at which these financial statements were issued. Based upon this evaluation, management has determined there were no items requiring adjustment of the financial statements or additional disclosure.
| REPORT OF INDEPENDENT REGISTERED PUBLIC |
| ACCOUNTING FIRM |
To the Shareholders of Fisher Investments Institutional Group Fund Family and Board of Trustees of Unified Series Trust
Opinion on the Financial Statements
We have audited the accompanying statement of assets and liabilities, including the schedule of investments, of Fisher Investments Institutional Group All Foreign Equity Environmental and Social Values Fund (the “Fund”), a series of Unified Series Trust, as of August 31, 2021, the related statement of operations for the year then ended, and the statements of changes in net assets, the related notes, and the financial highlights for each of the two periods in the period then ended (collectively referred to as the “financial statements”). In our opinion, the financial statements present fairly, in all material respects, the financial position of the Fund as of August 31, 2021, the results of its operations for the year then ended, and the changes in net assets and the financial highlights for each of the two periods in the period then ended, in conformity with accounting principles generally accepted in the United States of America.
Basis for Opinion
These financial statements are the responsibility of the Fund’s management. Our responsibility is to express an opinion on the Fund’s financial statements based on our audits. We are a public accounting firm registered with the Public Company Accounting Oversight Board (United States) (“PCAOB”) and are required to be independent with respect to the Fund in accordance with the U.S. federal securities laws and the applicable rules and regulations of the Securities and Exchange Commission and the PCAOB.
We conducted our audits in accordance with the standards of the PCAOB. Those standards require that we plan and perform the audit to obtain reasonable assurance about whether the financial statements are free of material misstatement whether due to error or fraud.
Our audits included performing procedures to assess the risks of material misstatement of the financial statements, whether due to error or fraud, and performing procedures that respond to those risks. Such procedures included examining, on a test basis, evidence regarding the amounts and disclosures in the financial statements. Our procedures included confirmation of securities owned as of August 31, 2021, by correspondence with the custodian and brokers, or by other appropriate auditing procedures where replies from brokers or counterparties were not received. Our audits also included evaluating the accounting principles used and significant estimates made by management, as well as evaluating the overall presentation of the financial statements. We believe that our audits provide a reasonable basis for our opinion.
We have served as the auditor of one or more investment companies advised by Fisher Asset Management, LLC since 2017.
COHEN & COMPANY, LTD.
Chicago, Illinois
October 28, 2021
| SUMMARY OF FUND EXPENSES (Unaudited) |
As a shareholder of the Fund, you incur two types of costs: (1) transaction and (2) ongoing costs, including management fees and other Fund expenses. These examples are intended to help you understand your ongoing costs (in dollars) of investing in the Fund and to compare these costs with the ongoing costs of investing in other mutual funds. The example is based on an investment of $1,000 invested at the beginning of the period and held for the entire period from March 1, 2021 through August 31, 2021.
Actual Expenses
The first line of the table below provides information about actual account values and actual expenses. You may use the information in this line, together with the amount you invested, to estimate the expenses that you paid over the period. Simply divide your account value by $1,000 (for example, an $8,600 account value divided by $1,000 = 8.6), then multiply the result by the number in the first line under the heading entitled “Expenses Paid During the Period” to estimate the expenses you paid on your account during this period.
Hypothetical Example for Comparison Purposes
The second line of the table below provides information about hypothetical account values and hypothetical expenses based on the Fund’s actual expense ratio and an assumed rate of return of 5% per year before expenses, which is not the Fund’s actual return. The hypothetical account values and expenses may not be used to estimate the actual ending account balance or expenses you paid for the period. You may use this information to compare the ongoing costs of investing in the Fund and other funds. To do so, compare this 5% hypothetical example with the 5% hypothetical examples that appear in the shareholder reports of other funds.
| | | Beginning | | Ending | | Expenses | | |
| | | Account Value | | Account Value | | Paid | | Annualized |
| | | March 1, | | August 31, | | During the | | Expense |
| | | 2021 | | 2021 | | Period(a) | | Ratio |
| Actual | | $1,000.00 | | $1,105.40 | | $3.61 | | 0.68% |
| Hypothetical(b) | | $1,000.00 | | $1,021.78 | | $3.47 | | 0.68% |
| (a) | Expenses are equal to the Fund’s annualized expense ratios, multiplied by the average account value over the period, multiplied by 184/365 (to reflect the one-half year period). |
| (b) | Hypothetical assumes 5% annual return before expenses. |
| ADDITIONAL FEDERAL INCOME TAX INFORMATION (Unaudited) |
The Form 1099-DIV you receive in January 2022 will show the tax status of all distributions paid to your account in calendar year 2021. Shareholders are advised to consult their own tax adviser with respect to the tax consequences of their investment in the Fund. As required by the Internal Revenue Code and/or regulations, shareholders must be notified regarding the status of qualified dividend income for individuals and the dividends received deduction for corporations.
Qualified Dividend Income. The Fund designates approximately 35.76% or up to the maximum amount of such dividends allowable pursuant to the Internal Revenue Code, as qualified dividend income eligible for a reduced tax rate.
Qualified Business Income. The Fund designates approximately 0% of its ordinary income dividends, or up to the maximum amount of such dividends allowable pursuant to the Internal Revenue Code, as qualified business income.
Dividends Received Deduction. Corporate shareholders are generally entitled to take the dividends received deduction on the portion of the Fund’s dividend distribution that qualifies under tax law. For the Fund’s calendar year 2021 ordinary income dividends, 0% qualifies for the corporate dividends received deduction.
| TRUSTEES AND OFFICERS (Unaudited) |
GENERAL QUALIFICATIONS. The Board supervises the business activities of the Trust. Each Trustee serves as a trustee until termination of the Trust unless the Trustee dies, resigns, retires, or is removed. The Chairman of the Board and more than 75% of the Trustees are “Independent Trustees,” which means that they are not “interested persons” (as defined in the 1940 Act) of the Trust or any adviser, sub-adviser or distributor of the Trust.
The following table provides information regarding the Independent Trustees.
Name, Address*,
(Year of Birth),
Position with Trust**,
Term of Position
with Trust | Principal Occupation During Past 5 Years and Other Directorships |
Kenneth G.Y. Grant (1949)
Chairman, January 2017 to present; Independent Trustee, May 2008 to present | Current: Director, Standpoint Multi-Asset (Cayman) Fund, Ltd. (2019 – present); Director, Advisors Charitable Gift Fund (2020 - present), a Donor Advised Fund. Previous: EVP, Benefit Plans Administrative Services, Inc., provider of retirement benefit plans administration (2019 – 2020); Director, Northeast Retirement Services (NRS) LLC, a transfer agent and fund administrator; and Director, Global Trust Company (GTC), a non-depository trust company sponsoring private investment product (2003 – 2019); EVP, NRS (2003 – 2019); GTC, EVP (2008 – 2019); EVP, Savings Banks Retirement Association (2003 – 2019), provider of qualified retirement benefit plans. |
Daniel J. Condon (1950)
Chairman of the Audit Committee; Chairman of the Governance & Nominating Committee; Independent Trustee, December 2002 to present | Current: Retired (2017 – present) |
Gary E. Hippenstiel (1947)
Chairman of the Pricing & Liquidity Committee; Independent Trustee, December 2002 to present | Current: President and founder of Hippenstiel Investment Counsel LLC (“Hippenstiel”) since 2008. Hippenstiel was registered as an investment adviser from 2008 to December 31, 2019. |
| TRUSTEES AND OFFICERS (Unaudited) – (continued) |
Name, Address*,
(Year of Birth),
Position with Trust**,
Term of Position
with Trust | Principal Occupation During Past 5 Years and Other Directorships |
Stephen A. Little (1946)
Independent Trustee, December 2002 to present; Chairman, December 2004 to December 2016 | Current: President and founder of The Rose, Inc., a registered investment adviser, since 1993. |
Ronald C. Tritschler (1952)
Independent Trustee, January 2007 to present; Interested Trustee, December 2002 to December 2006 | Current: Chief Executive Officer, Director and Legal Counsel of The Webb Companies, a national real estate company, since 2001; Director, Standpoint Multi-Asset (Cayman) Fund, Ltd. (2020 – present). |
| * | The address for each Trustee is 225 Pictoria Drive, Suite 450, Cincinnati, Ohio 45246. |
| ** | As of the date of this report, the Trust consists of 21 series. |
The following table provides information regarding the Interested Trustee and the Officers of the Trust.
Name, Address*,
(Year of Birth),
Position with Trust,
Term of Position
with Trust | Principal Occupation During Past 5 Years and Other Directorships |
David R. Carson (1958)
President, January 2016 to August 2021; Interested Trustee, August 2020 to present | Current: Senior Vice President Client Strategies of Ultimus Fund Solutions, LLC, since 2013; Interested Trustee of Ultimus Managers Trust, since 2020. |
Zachary P. Richmond (1980)
Treasurer and Chief Financial Officer, November 2014 to present | Current: Vice President, Director of Financial Administration for Ultimus Fund Solutions, LLC, since 2015. |
| TRUSTEES AND OFFICERS (Unaudited) – (continued) |
Name, Address*,
(Year of Birth),
Position with Trust,
Term of Position
with Trust | Principal Occupation During Past 5 Years and Other Directorships |
Martin R. Dean (1963)
President, August 2021 to present; Vice President, November 2020 to August 2021; Chief Compliance Officer, April 2021 to August 2021; Assistant Chief Compliance Officer, January 2016 to April 2021 | Current: Senior Vice President, Head of Fund Compliance of Ultimus Fund Solutions, LLC, since 2016. |
Gweneth K. Gosselink (1955)
Chief Compliance Officer, August 2021 to present | Current: Assistant Vice President, Senior Compliance Officer of Ultimus Fund Solutions, LLC, since 2019. Previous: Chief Operating Officer & CCO at Miles Capital, Inc. (2013 – 2019). |
Elisabeth Dahl (1962)
Secretary, May 2017 to present; Assistant Secretary, March 2016 to May 2017 | Current: Attorney, Ultimus Fund Solutions, LLC since March 2016. |
Stephen Preston (1966)
AML Compliance Officer, May 2017 to present | Current: Vice President and Chief Compliance Officer, Ultimus Fund Solutions, LLC and Ultimus Fund Distributors, LLC, since 2011. |
Lynn E. Wood (1946)
Assistant Chief Compliance Officer, April 2021 to present; Chief Compliance Officer, October 2004 to April 2021 | Current: Managing Member, Buttonwood Compliance Partners, LLC, since 2013. |
| * | The address for each Officer is 225 Pictoria Drive, Suite 450, Cincinnati, Ohio 45246. |
PRIVACY NOTICE
Rev. January 2020
| FACTS | WHAT DOES FISHER INVESTMENTS INSTITUTIONAL GROUP ALL FOREIGN EQUITY ENVIRONMENTAL AND SOCIAL VALUES FUND (THE “FUND”) DO WITH YOUR PERSONAL INFORMATION? |
| Why? | Financial companies choose how they share your personal information. Federal law gives consumers the right to limit some but not all sharing. Federal law also requires us to tell you how we collect, share, and protect your personal information. Please read this notice carefully to understand what we do. |
| What? | The types of personal information we collect and share depend on the product or service you have with us. This information can include: ● Social Security number ● account balances and account transactions ● transaction or loss history and purchase history When you are no longer our customer, we continue to share your information as described in this notice. |
| How? | All financial companies need to share customers’ personal information to run their everyday business. In the section below, we list the reasons financial companies can share their customers’ personal information; the reasons the Fund chooses to share; and whether you can limit this sharing. |
| Reasons we can share your personal information | Does the
Fund share? | Can you limit
this sharing? |
For our everyday business purposes— such as to process your transactions, maintain your account(s), respond to court orders and legal investigations, or report to credit bureaus | Yes | No |
For our marketing purposes— to offer our products and services to you | No | We don’t share |
| For joint marketing with other financial companies | No | We don’t share |
For our affiliates’ everyday business purposes— information about your transactions and experiences | No | We don’t share |
For our affiliates’ everyday business purposes— information about your creditworthiness | No | We don’t share |
| For nonaffiliates to market to you | No | We don’t share |
| Questions? | Call (800) 851-8845 |
| Who we are |
| Who is providing this notice? | Fisher Investments Institutional Group All Foreign Equity Environmental and Social Values Fund Ultimus Fund Distributors, LLC (Distributor) Ultimus Fund Solutions, LLC (Administrator) |
| What we do |
| How does the Fund protect my personal information? | To protect your personal information from unauthorized access and use, we use security measures that comply with federal law. These measures include computer safeguards and secured files and buildings. Our service providers are held accountable for adhering to strict policies and procedures to prevent any misuse of your nonpublic personal information. |
| How does the Fund collect my personal information? | We collect your personal information, for example, when you ● open an account or deposit money ● make deposits or withdrawals from your account or provide account information We also collect your personal information from other companies. |
| Why can’t I limit all sharing? | Federal law gives you the right to limit only ● sharing for affiliates’ everyday business purposes—information about your creditworthiness ● affiliates from using your information to market to you ● sharing for nonaffiliates to market to you State laws and individual companies may give you additional rights to limit sharing. |
| Definitions |
| Affiliates | Companies related by common ownership or control. They can be financial and nonfinancial companies. ● Fisher Asset Management, LLC, d/b/a Fisher Investments, the investment adviser to the Fund, could be deemed to be an affiliate. |
| Nonaffiliates | Companies not related by common ownership or control. They can be financial and nonfinancial companies. ● The Fund does not share your personal information with nonaffiliates so they can market to you |
| Joint marketing | A formal agreement between nonaffiliated financial companies that together market financial products or services to you. ● The Fund doesn’t jointly market. |
This page intentionally left blank.
This page intentionally left blank.
| OTHER INFORMATION (Unaudited) |
The Fund’s Statement of Additional Information (“SAI”) includes additional information about the trustees and is available without charge, upon request. You may call toll-free at (800) 851-8845 to request a copy of the SAI or to make shareholder inquiries.
A description of the policies and procedures that the Fund uses to determine how to vote proxies relating to portfolio securities and information regarding how the Fund voted those proxies during the most recent twelve month period ended June 30, are available (1) without charge upon request by calling the Fund at (800) 851-8845 and (2) in Fund documents filed with the Securities and Exchange Commission (“SEC”) on the SEC’s website at www.sec.gov.
TRUSTEES Kenneth G.Y. Grant, Chairman David R. Carson Daniel J. Condon Gary E. Hippenstiel Stephen A. Little Ronald C. Tritschler OFFICERS Martin R. Dean, President Gweneth K. Gosselink, Chief Compliance Officer Zachary P. Richmond, Treasurer and Chief Financial Officer Lynn E. Wood, Assistant Chief Compliance Officer INVESTMENT ADVISER Fisher Asset Management, LLC 5525 NW Fisher Creek Drive Camas, WA 98607 DISTRIBUTOR Ultimus Fund Distributors, LLC 225 Pictoria Drive, Suite 450 Cincinnati, OH 45246 | INDEPENDENT REGISTERED PUBLIC ACCOUNTING FIRM Cohen & Company, Ltd. 151 N Franklin Street, Suite 575 Chicago, IL 60606 LEGAL COUNSEL Thompson Hine LLP 312 Walnut Street, 20th Floor Cincinnati, OH 45202 CUSTODIAN U.S. Bank, N.A. 425 Walnut Street Cincinnati, OH 45202 ADMINISTRATOR, TRANSFER AGENT AND FUND ACCOUNTANT Ultimus Fund Solutions, LLC 225 Pictoria Drive, Suite 450 Cincinnati, OH 45246 |
This report is intended only for the information of shareholders or those who have received the Fund’s prospectus which contains information about the Fund’s management fee and expenses. Please read the prospectus carefully before investing.
Distributed by Ultimus Fund Distributors, LLC Member FINRA/SIPC
Fisher1-AR-21
FISHER INVESTMENTS INSTITUTIONAL
GROUP FUND FAMILY |
Annual Report
August 31, 2021
Fisher Investments Institutional Group
U.S. Small Cap Equity Fund
Fund Adviser:
Fisher Asset Management, LLC
5525 NW Fisher Creek Drive,
Camas, Washington 98607
(800) 851-8845
FISHER INVESTMENTS INSTITUTIONAL GROUP
U.S. SMALL CAP EQUITY FUND
MANAGEMENT’S DISCUSSION OF FUND PERFORMANCE
(Unaudited)
Dear Shareholder:
Market Outlook
US markets hit new record highs in Q2, topping off an impressive first half of the year. Inflation fears and economic growth expectations seemed to subside somewhat last month. Now pundits increasingly see a return toward pre-pandemic growth rates—a rational turn, to us, which matches our long-held view. We think that is a fine backdrop for further broad market gains, and one suggesting growth’s leadership should persist.
While rising price fears escalated in the first half of the quarter, bond yields that are most sensitive to inflation didn’t follow suit. In Q1, the 10-year Treasury yield increased from 0.9% to 1.7%, anticipating a return to more normal pre-pandemic economic conditions, in our view. The move higher caused the initial wave of inflation-related worries, but in Q2 yields have fallen to around 1.4%—markets appear to have pre-priced the impact of the reopening-led bounce in inflation pressures.
Additionally, falling bond market-implied breakeven inflation rates—as measured by 10-year Treasury yields minus Treasury inflation-protected securities—suggest inflation fears are receding. After rising steadily from 2.0% year-over-year (y/y) to begin the year, the implied breakeven inflation rate hit 2.5% in May 2021 then fell, ending June at 2.3%. Now, breakeven inflation rates don’t forecast inflation very accurately. We see them mostly as a snapshot of sentiment—a bond market gauge of inflation expectations and fears. That relief was likely a tailwind for markets in June.
That said, May’s Consumer Price Index (CPI) report, like April’s, suggests inflation is likely to subside—in this case, reality appears to be matching expectations. CPI rose 0.6% month-over-month (m/m) in May, moderating from April’s 0.8%, but that monthly jump again stemmed from temporary one-offs. Used cars’ 7.3% m/m price gain (after April’s 10% jump) drove a third of May CPI’s monthly increase. Similarly, other reopening categories related to travel (auto rentals, airfares) and ones facing supply-chain bottlenecks (new vehicles, household furnishings) generated most of the rest of prices’ rise. These seem tied mainly to reopening and shortages that should prove temporary after companies work out reopening-related supply-chain issues. Simply, it is generally far faster to shut down production than bring it back online. Meanwhile, CPI’s year-over-year base effects are set to fade after May’s 5.0% y/y jump—a 13-year high. CPI’s level troughed in May 2020, so big year-over-year growth rates will become harder to sustain in the months ahead as the denominator rises.
FISHER INVESTMENTS INSTITUTIONAL GROUP
U.S. SMALL CAP EQUITY FUND
MANAGEMENT’S DISCUSSION OF FUND PERFORMANCE
(Unaudited) – (continued)
It is also worth mentioning that inflation itself doesn’t automatically harm equities. To the degree there would be any, companies are often able to control costs or pass them on to preserve profit margins. Historically, equities have fared fine during inflationary periods. The damage usually comes through policy mistakes aimed at combating rising prices, e.g. the Nixon administration’s price controls or the Fed increasing short-term rates above long-term rates, inverting the yield curve. These are worth watching out for, but at this point it is premature to speculate about, in our view.
Consumer spending is also leveling off. After exceeding pre-pandemic highs early this year, personal consumption expenditures’ (PCE) m/m growth was flat in May 2021 after slowing to 0.9% m/m in April from March’s 5.0% monthly gain. Services PCE—about two-thirds of the total—remain -1.2% below pre-pandemic levels but rose 0.7% m/m in June. This contrasts with goods PCE’s -1.3% m/m drop, highlighting how reopening is currently driving consumption patterns to mixed effect.
Yes, households have savings to spend, but after satisfying their pent-up demand, the evidence suggests they are conserving large amounts of cash. An NBER survey last year found almost 60% of first-round COVID-19 relief payments went to savings or debt reduction. Studies of subsequent economic impact payments from the Census Bureau show similar results. Moreover, the Fed’s quarterly report on household wealth, released in June, showed cash balances in Americans’ accounts up $850 billion in Q1. Their amassed cash on hand stands over $14.5 trillion, more than $3 trillion above 2019’s level. This is similar to how households reacted in the wake of the 2007 – 2009 recession and the government’s recovery efforts, albeit bigger in scope. Despite generous federal stimulus, households in aggregate are spending carefully and choosing to maintain pristine balance sheets. In our view, the so-called new normal looks a lot like the old normal.
A divergence between booming economic growth expectations versus the likelier underwhelming reality sets up disappointment. However, this probably wouldn’t upset the bull market overall. Equities can handle tapering economic growth fine, as 2009 – 2020’s bull market—the longest ever—demonstrated over the decade’s seemingly frustratingly slow expansion. This slow growth environment ahead likely favors growth equities.
The popular concern now is that reopening plus monetary and fiscal support measures will favor value equities. Many suspect value’s leadership burst in the first half of the quarter is more than just a countertrend. We believe this year’s value-and-growth leadership rotations retread similar sentiment-driven moves over the past year, with the same conclusion: Value countertrends can occur, but they seem unlikely to last.
FISHER INVESTMENTS INSTITUTIONAL GROUP
U.S. SMALL CAP EQUITY FUND
MANAGEMENT’S DISCUSSION OF FUND PERFORMANCE
(Unaudited) – (continued)
Sector-wise, greater demand may be good for Energy, but we think it is largely priced into markets already. Meanwhile, less noticed but critical, in our view: readily available, easily tapped oil supplies waiting in the wings. OPEC+ is discussing ramping up production. US rig counts are rising, too. This suggests more supply is waiting to be brought online, which could offset demand increases and weigh on oil prices, Energy’s key driver. However, growth regained leadership toward the end of Q2. Markets seem to be looking past the reopening bounce and seeing slower growth ahead, which is why we think economically sensitive value equities’ run is unlikely to resume.
In late April, President Joe Biden unveiled his $1.8 trillion American Families Plan (AFP), the second part of his “Build Back Better” economic agenda after the $2.3 trillion American Jobs Plan (often referred to as the “infrastructure plan”). The AFP includes $1 trillion in spending for preschool, child care and community college over the next 10 years and $800 billion in tax credits for child and dependent care. To raise revenue to help pay for these initiatives, it would nearly double capital gains taxes to 39.6% from 20% on households earning more than $1 million (bringing the effective rate to 43.4% after factoring in the Affordable Care Act’s surtax), raise the highest marginal tax rate bracket to 39.6% from 37% (while lowering that tax band to $400,000) and eliminate certain tax provisions including the cost-basis step up on inherited assets, carried interest and tax-deferred “1031 exchanges” on real estate transactions with profits over $500,000.
In June, a bipartisan group of senators reached an agreement on the infrastructure plan, but passage is far from assured. Beyond that, the proposed package has shrunk considerably from what President Biden initially envisioned. New spending would be just $579 billion, less than a third of the original proposal. This is because the evenly split 10 Senate Republicans and Democrats behind the effort could agree only on “physical” infrastructure like roads and bridges and not the progressive definitions including climate change mitigation and child or elderly care measures. While the group settled on what infrastructure to spend on, how to fund it remains an open question, but even agreement there would still leave deep divisions. Progressive Democrats want the bipartisan deal tied to a “human infrastructure” mega-bill passed via budget reconciliation or they won’t support it. However, if it is linked, then Republicans indicate they would revoke support, sending any infrastructure bill back to the beginning of the process.
FISHER INVESTMENTS INSTITUTIONAL GROUP
U.S. SMALL CAP EQUITY FUND
MANAGEMENT’S DISCUSSION OF FUND PERFORMANCE
(Unaudited) – (continued)
Performance Attribution
The Fisher Investments Institutional Group U.S. Small Cap Equity Fund performed in line with the Russell 2000 Index for the period from September 1, 2020 through August 31, 2021. During this period, the Fund returned 49.47% while the Fund’s primary benchmark, the Russell 2000 Index, returned 47.08%. Equity selection contributed to relative return, while sector allocation detracted. Selection within Health Care was the largest contributor to relative return, driven by medical device company Align Technology, automated healthcare solutions operator Omnicell and medical technology company CONMED Corporation. Additionally, selection within Financials contributed as financial services providers SVB Financial Group, Cowen and Piper Sandler Companies outperformed. Conversely, an overweight to and selection within Software was the largest detractor, driven by Alteryx, Bottomline Technologies and Momentive. Further, an overweight to and selection within Consumer Staples detracted, driven by craft brewer Boston Beer and snack food distributor J&J Snack Foods.
FISHER INVESTMENTS INSTITUTIONAL GROUP
U.S. SMALL CAP EQUITY FUND
Investment Results (Unaudited)
| | | | | |
| Average Annual Total Return as of August 31, 2021(a) |
| | | Since | |
| | | Inception | |
| Fund/Index | One Year | | (7/17/20) | |
| Fisher Investments Institutional Group U.S. Small Cap Equity Fund | 49.47% | | 48.99% | |
| Russell 2000 Index(b) | 47.08% | | 48.69% | |
| | | | | |
| | | | Expense | |
| | | | Ratios(c) | |
| Gross | | | 85.62% | |
| With Applicable Waivers | | | 0.75% | |
The performance quoted represents past performance, which does not guarantee future results. The investment return and principal value of an investment will fluctuate so that an investor’s shares, when redeemed, may be worth more or less than their original cost. The returns shown do not reflect deduction of taxes that a shareholder would pay on Fisher Investments Institutional Group U.S. Small Cap Equity Fund (the “Fund”) distributions or the redemption of Fund shares. Current performance of the Fund may be lower or higher than the performance quoted. The Fund’s investment objectives, risks, charges and expenses must be considered carefully before investing. Performance data current to the most recent month end may be obtained by calling (800) 851-8845.
| (a) | Return figures reflect any change in price per share and assume the reinvestment of all distributions. |
| (b) | The Russell 2000 Index (“Russell Index”) is a widely recognized unmanaged index of equity securities and is representative of a broader domestic equity market and range of securities than are found in the Fund’s portfolio. Individuals cannot invest directly in the Russell Index; however, an individual can invest in exchange traded funds or other investment vehicles that attempt to track the performance of a benchmark index. |
| (c) | The expense ratios are from the Fund’s prospectus dated December 29, 2020. Fisher Asset Management, LLC, d/b/a Fisher Investments (the “Adviser”) is contractually obligated to limit the Fund’s total annual operating expenses to 0.75% of the Fund’s average daily net assets through December 31, 2024 (excluding portfolio transaction and other investment-related costs (including brokerage fees and commissions); taxes; borrowing costs (such as interest and dividend expenses on securities sold short); acquired fund fees and expenses; certain fees and expenses associated with investments in other collective investment vehicles or derivative instruments (including for example option and swap fees and expenses); any administrative and/or shareholder servicing fees payable pursuant to a plan adopted by the Board of Trustees; expenses incurred in connection with any merger or reorganization; extraordinary expenses (such as litigation expenses, indemnification of Trust officers and Trustees and contractual indemnification of Fund service providers); and other expenses that the Trustees agree have not been incurred in the ordinary course of the Fund’s business). This expense cap may not be terminated prior to this date except by the Board of Trustees. Each waiver/expense payment by the Adviser is subject to recoupment by the Adviser from the Fund in the three years following the date the particular waiver/expense payment occurred, but only if such recoupment can be achieved without exceeding the annual expense limitation in effect at the time of the waiver/expense payment and any expense limitation in effect at the time of the recoupment. Additional information pertaining to the Fund’s expense ratios as of August 31, 2021 can be found in the financial highlights. |
The Fund’s investment objective, strategies, risks, charges and expenses must be considered carefully before investing. The Fund’s prospectus contains this and other important information about the investment company and may be obtained by calling (800) 851-8845. Please read it carefully before investing.
The Fund is distributed by Ultimus Fund Distributors, LLC, Member FINRA/SIPC.
FISHER INVESTMENTS INSTITUTIONAL GROUP
U.S. SMALL CAP EQUITY FUND
Investment Results (Unaudited) – (continued)
Comparison of the Growth of a $10,000 Investment in the Fisher Investments Institutional
Group U.S. Small Cap Equity Fund and the Russell 2000 Index
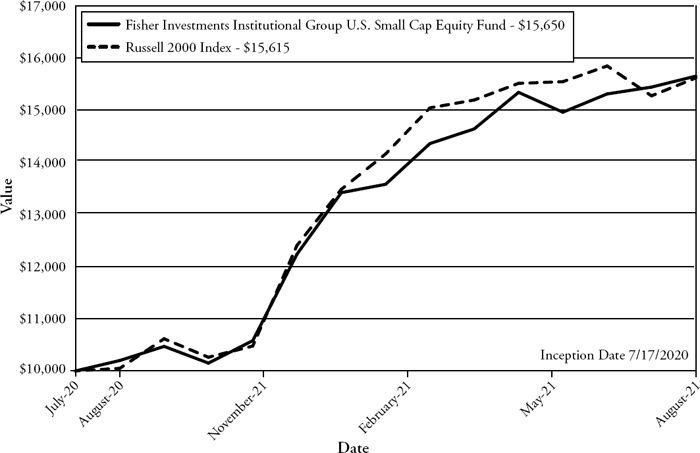
This graph shows the value of a hypothetical initial investment of $10,000 made on July 17, 2020 (commencement of operations) and held through August 31, 2021. Russell 2000 Index is a widely recognized unmanaged index of equity securities and is representative of a broader domestic equity market and range of securities than is found in the Fund’s portfolio. Individuals cannot invest directly in an index; however, an individual may invest in exchange traded funds or other investment vehicles that attempt to track the performance of a benchmark index. THE FUND’S RETURN REPRESENTS PAST PERFORMANCE AND DOES NOT GUARANTEE OR PREDICT FUTURE RESULTS. The returns shown do not reflect deduction of taxes that a shareholder would pay on Fund distributions or the redemption of Fund shares. Investment returns and principal values will fluctuate so that an investor’s shares, when redeemed, may be worth more or less than their original cost.
Current performance may be lower or higher than the performance data quoted. For more information on the Fund, and to obtain performance data current to the most recent month-end, or to request a prospectus, please call (800) 851-8845. You should carefully consider the investment objectives, risks, charges and expenses of the Fund before investing. The Fund’s prospectus contains this and other information about the Fund and should be read carefully before investing.
The Fund is distributed by Ultimus Fund Distributors, LLC, member FINRA/SIPC.
FISHER INVESTMENTS INSTITUTIONAL GROUP
U.S. SMALL CAP EQUITY FUND
Fund Holdings (Unaudited)
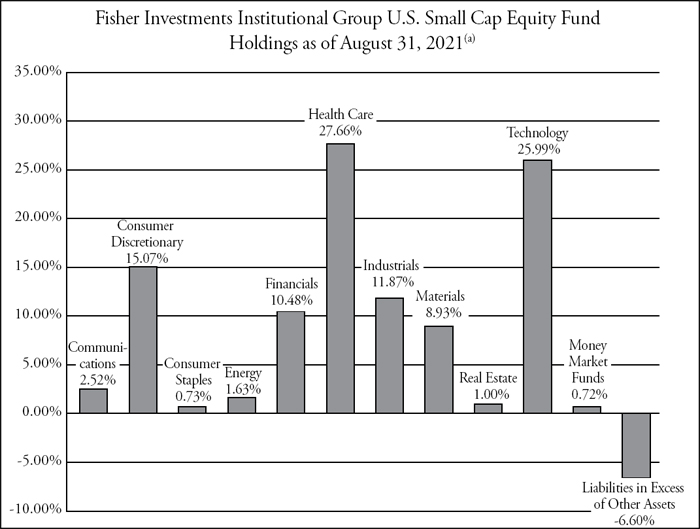
| (a) | As a percentage of net assets. |
The investment objective of the Fund is to seek to outperform, net of fees and expenses, the return of the Russell 2000 Index.
Availability of Portfolio Schedule – (Unaudited)
The Fund files its complete schedule of portfolio holdings with the Securities and Exchange Commission (the “SEC”) for the first and third quarters of each fiscal year as an exhibit to its reports on Form N-PORT. The Fund’s Form N-PORT reports are available on the SEC’s website at http://www.sec.gov.
| FISHER INVESTMENTS INSTITUTIONAL GROUP |
| U.S. SMALL CAP EQUITY FUND |
| SCHEDULE OF INVESTMENTS |
| August 31, 2021 |
| | | Shares | | | Fair Value | |
| COMMON STOCKS — 105.88% | | | | | | |
| | | | | | | |
| Communications — 2.52% | | | | | | |
| 8X8, Inc.(a) | | | 149 | | | $ | 3,598 | |
| Yelp, Inc.(a) | | | 60 | | | | 2,311 | |
| | | | | | | | 5,909 | |
| Consumer Discretionary — 15.07% | | | | | | | | |
| Builders FirstSource, Inc.(a) | | | 70 | | | | 3,730 | |
| Domino’s Pizza, Inc. | | | 4 | | | | 2,068 | |
| Freshpet, Inc.(a) | | | 50 | | | | 6,406 | |
| M.D.C. Holdings, Inc. | | | 38 | | | | 1,986 | |
| M/I Homes, Inc.(a) | | | 39 | | | | 2,511 | |
| Papa John’s International, Inc. | | | 37 | | | | 4,718 | |
| Pool Corp. | | | 15 | | | | 7,415 | |
| Revolve Group, Inc.(a) | | | 58 | | | | 3,333 | |
| Scotts Miracle-Gro Co. (The) | | | 14 | | | | 2,196 | |
| Taylor Morrison Home Corp.(a) | | | 36 | | | | 1,011 | |
| | | | | | | | 35,374 | |
| Consumer Staples — 0.73% | | | | | | | | |
| Boston Beer Co., Inc. (The), Class A(a) | | | 3 | | | | 1,711 | |
| | | | | | | | | |
| Energy — 1.63% | | | | | | | | |
| ChampionX Corp.(a) | | | 87 | | | | 2,030 | |
| Helmerich & Payne, Inc. | | | 12 | | | | 323 | |
| Oceaneering International, Inc.(a) | | | 120 | | | | 1,476 | |
| | | | | | | | 3,829 | |
| Financials — 10.48% | | | | | | | | |
| BancorpSouth Bank | | | 34 | | | | 997 | |
| Cowen Group, Inc., Class A | | | 106 | | | | 3,821 | |
| East West Bancorp, Inc. | | | 14 | | | | 1,027 | |
| Evercore Partners, Inc., Class A | | | 16 | | | | 2,234 | |
| First Merchants Corp. | | | 62 | | | | 2,551 | |
| Independent Bank Corp. | | | 27 | | | | 2,071 | |
| Lazard Ltd., Class A | | | 17 | | | | 806 | |
| Piper Jaffray Cos. | | | 21 | | | | 3,001 | |
| Stifel Financial Corp. | | | 32 | | | | 2,211 | |
| SVB Financial Group(a) | | | 8 | | | | 4,476 | |
| Umpqua Holdings Corp. | | | 73 | | | | 1,421 | |
| | | | | | | | 24,616 | |
See accompanying notes which are an integral part of these financial statements.
| FISHER INVESTMENTS INSTITUTIONAL GROUP |
| U.S. SMALL CAP EQUITY FUND |
| SCHEDULE OF INVESTMENTS – (continued) |
| August 31, 2021 |
| | | Shares | | | Fair Value | |
| COMMON STOCKS — 105.88% - continued | | | | | | |
| | | | | | | |
| Health Care — 27.66% | | | | | | | | |
| Align Technology, Inc.(a) | | | 13 | | | $ | 9,216 | |
| Alkermes PLC(a) | | | 14 | | | | 438 | |
| Anika Therapeutics(a) | | | 90 | | | | 3,882 | |
| Avid Bioservices, Inc.(a) | | | 56 | | | | 1,357 | |
| BioCryst Pharmaceuticals, Inc.(a) | | | 74 | | | | 1,178 | |
| Charles River Laboratories International, Inc.(a) | | | 8 | | | | 3,551 | |
| CONMED Corp. | | | 62 | | | | 8,143 | |
| Emergent BioSolutions, Inc.(a) | | | 55 | | | | 3,469 | |
| Exact Sciences Corp.(a) | | | 20 | | | | 2,088 | |
| Haemonetics Corp.(a) | | | 46 | | | | 2,887 | |
| Halozyme Therapeutics, Inc.(a) | | | 176 | | | | 7,390 | |
| ImmunoGen, Inc.(a) | | | 37 | | | | 224 | |
| Ironwood Pharmaceuticals, Inc.(a) | | | 34 | | | | 445 | |
| Medpace Holdings, Inc.(a) | | | 29 | | | | 5,288 | |
| Myriad Genetics, Inc.(a) | | | 27 | | | | 966 | |
| NanoString Technologies, Inc.(a) | | | 44 | | | | 2,561 | |
| Neurocrine Biosciences Inc.(a) | | | 8 | | | | 762 | |
| PTC Therapeutics, Inc.(a) | | | 21 | | | | 917 | |
| Vericel Corp.(a) | | | 38 | | | | 2,058 | |
| West Pharmaceutical Services, Inc. | | | 7 | | | | 3,161 | |
| WillScot Mobile Mini Holdings Corp.(a) | | | 166 | | | | 4,914 | |
| | | | | | | | 64,895 | |
| Industrials — 11.87% | | | | | | | | |
| Advanced Energy Industries, Inc. | | | 55 | | | | 4,960 | |
| Alarm.com Holdings, Inc.(a) | | | 42 | | | | 3,542 | |
| Cactus, Inc., Class A | | | 107 | | | | 4,013 | |
| Casella Waste Systems, Inc., Class A(a) | | | 36 | | | | 2,664 | |
| Chart Industries, Inc.(a) | | | 26 | | | | 4,898 | |
| HEICO Corp. | | | 21 | | | | 2,663 | |
| Lincoln Electric Holdings, Inc. | | | 16 | | | | 2,234 | |
| Mercury Systems, Inc.(a) | | | 32 | | | | 1,612 | |
| Moog, Inc., Class A | | | 16 | | | | 1,271 | |
| | | | | | | | 27,857 | |
See accompanying notes which are an integral part of these financial statements.
| FISHER INVESTMENTS INSTITUTIONAL GROUP |
| U.S. SMALL CAP EQUITY FUND |
| SCHEDULE OF INVESTMENTS – (continued) |
| August 31, 2021 |
| | | Shares | | | Fair Value | |
| COMMON STOCKS — 105.88% - continued | | | | | | |
| | | | | | | |
| Materials — 8.93% | | | | | | |
| Alcoa Corp.(a) | | | 56 | | | $ | 2,485 | |
| AptarGroup, Inc. | | | 16 | | | | 2,157 | |
| Carpenter Technology Corp. | | | 34 | | | | 1,134 | |
| Cleveland-Cliffs, Inc. | | | 279 | | | | 6,548 | |
| Kaiser Aluminum Corp. | | | 10 | | | | 1,263 | |
| Rogers Corp.(a) | | | 8 | | | | 1,699 | |
| Steel Dynamics, Inc. | | | 32 | | | | 2,159 | |
| UFP Industries, Inc. | | | 26 | | | | 1,952 | |
| Worthington Industries, Inc. | | | 27 | | | | 1,565 | |
| | | | | | | | 20,962 | |
| Real Estate — 1.00% | | | | | | | | |
| CoreSite Realty Corp. | | | 7 | | | | 1,039 | |
| PotlatchDeltic Corp. | | | 25 | | | | 1,298 | |
| | | | | | | | 2,337 | |
| Technology — 25.99% | | | | | | | | |
| Allscripts Healthcare Solutions, Inc.(a) | | | 295 | | | | 4,531 | |
| Alteryx, Inc., Class A(a) | | | 45 | | | | 3,329 | |
| Aspen Technology, Inc.(a) | | | 36 | | | | 4,662 | |
| Bottomline Technologies de, Inc.(a) | | | 55 | | | | 2,325 | |
| Cerence, Inc.(a) | | | 32 | | | | 3,470 | |
| Diodes, Inc.(a) | | | 69 | | | | 6,681 | |
| Fair Isaac Corp.(a) | | | 6 | | | | 2,758 | |
| Knowles Corp.(a) | | | 128 | | | | 2,560 | |
| Liveperson, Inc.(a) | | | 68 | | | | 4,359 | |
| Momentive Global, Inc.(a) | | | 200 | | | | 3,922 | |
| Omnicell, Inc.(a) | | | 35 | | | | 5,434 | |
| Paycom Software, Inc.(a) | | | 9 | | | | 4,400 | |
| Paylocity Holdings Corp.(a) | | | 38 | | | | 10,230 | |
| Pegasystems, Inc. | | | 17 | | | | 2,340 | |
| | | | | | | | 61,001 | |
| Total Common Stocks — 105.88% (Cost $174,881) | | | | | | | 248,491 | |
See accompanying notes which are an integral part of these financial statements.
| FISHER INVESTMENTS INSTITUTIONAL GROUP |
| U.S. SMALL CAP EQUITY FUND |
| SCHEDULE OF INVESTMENTS – (continued) |
| August 31, 2021 |
| | | Shares | | | Fair Value | |
| MONEY MARKET FUNDS — 0.72% | | | | | | |
| | | | | | | |
| First American Government Obligations Fund, X Class, 0.03%(b) | | | 1,698 | | | $ | 1,698 | |
| Total Money Market Funds — 0.72% (Cost $1,698) | | | | | | | 1,698 | |
| Total Investments — 106.60% (Cost $176,579) | | | | | | | 250,189 | |
| Liabilities in Excess of Other Assets — (6.60)% | | | | | | | (15,486 | ) |
| NET ASSETS — 100.00% | | | | | | $ | 234,703 | |
| (a) | Non-income producing security. |
| (b) | Rate disclosed is the seven day effective yield as of August 31, 2021. |
See accompanying notes which are an integral part of these financial statements.
| FISHER INVESTMENTS INSTITUTIONAL GROUP |
| U.S. SMALL CAP EQUITY FUND |
| STATEMENT OF ASSETS AND LIABILITIES |
| August 31, 2021 |
| Assets | | | |
| Investments in securities at fair value (cost $176,579) | | $ | 250,189 | |
| Dividends receivable | | | 71 | |
| Receivable from Adviser | | | 11,339 | |
| Prepaid expenses | | | 4,337 | |
| Total Assets | | | 265,936 | |
| | | | | |
| Liabilities | | | | |
| Payable to affiliates | | | 6,144 | |
| Other accrued expenses | | | 25,089 | |
| Total Liabilities | | | 31,233 | |
| | | | | |
| Net Assets | | $ | 234,703 | |
| Net Assets consist of: | | | | |
| Paid-in capital | | | 150,263 | |
| Accumulated earnings | | | 84,440 | |
| Net Assets | | $ | 234,703 | |
| | | | | |
| Shares outstanding (unlimited number of shares authorized, no par value) | | | 15,020 | |
| Net asset value, offering and redemption price per share | | $ | 15.63 | |
See accompanying notes which are an integral part of these financial statements.
| FISHER INVESTMENTS INSTITUTIONAL GROUP |
| U.S. SMALL CAP EQUITY FUND |
| STATEMENT OF OPERATIONS |
| For the year ended August 31, 2021 |
| Investment Income | | | |
| Dividend income (net of foreign taxes withheld of $1) | | $ | 1,009 | |
| Interest income | | | 3 | |
| Total investment income | | | 1,012 | |
| | | | | |
| Expenses | | | | |
| Administration | | | 40,000 | |
| Audit and tax | | | 18,060 | |
| Legal | | | 17,348 | |
| Trustee | | | 13,983 | |
| Transfer agent | | | 12,000 | |
| Compliance services | | | 12,000 | |
| Report printing | | | 4,613 | |
| Custodian | | | 2,496 | |
| Pricing | | | 1,472 | |
| Adviser | | | 1,399 | |
| Registration | | | 977 | |
| Miscellaneous | | | 16,869 | |
| Total expenses | | | 141,217 | |
| Fees waived and expenses reimbursed by Adviser | | | (139,672 | ) |
| Net operating expenses | | | 1,545 | |
| Net investment loss | | | (533 | ) |
| Net Realized and Change in Unrealized Gain (Loss) on Investments | | | | |
| Net realized gain on investment securities transactions | | | 11,374 | |
| Net change in unrealized appreciation of investment securities | | | 66,846 | |
| Net realized and change in unrealized gain on investments | | | 78,220 | |
| Net increase in net assets resulting from operations | | $ | 77,687 | |
See accompanying notes which are an integral part of these financial statements.
| FISHER INVESTMENTS INSTITUTIONAL GROUP |
| U.S. SMALL CAP EQUITY FUND |
| STATEMENTS OF CHANGES IN NET ASSETS |
| | | For the | | | For the | |
| | | Year Ended | | | Period Ended | |
| | | August 31, | | | August 31, | |
| | | 2021 | | | 2020(a) | |
| Increase (Decrease) in Net Assets due to: | | | | | | | | |
| Operations | | | | | | | | |
| Net investment income (loss) | | $ | (533 | ) | | $ | 54 | |
| Net realized gain on investment securities transactions | | | 11,374 | | | | 188 | |
| Net change in unrealized appreciation of investment securities | | | 66,846 | | | | 6,764 | |
| Net increase in net assets resulting from operations | | | 77,687 | | | | 7,006 | |
| | | | | | | | | |
| Distributions From: | | | | | | | | |
| Earnings | | | (253 | ) | | | — | |
| | | | | | | | | |
| Total distributions | | | (253 | ) | | | — | |
| Capital Transactions | | | | | | | | |
| Proceeds from shares sold | | | — | | | | 150,010 | |
| Reinvestment of distributions | | | 253 | | | | — | |
| Net increase in net assets resulting from capital transactions | | | 253 | | | | 150,010 | |
| Total Increase in Net Assets | | | 77,687 | | | | 157,016 | |
| | | | | | | | | |
| Net Assets | | | | | | | | |
| Beginning of period | | | 157,016 | | | | — | |
| End of period | | $ | 234,703 | | | $ | 157,016 | |
| | | | | | | | | |
| Share Transactions | | | | | | | | |
| Shares sold | | | — | | | | 15,001 | |
| Shares issued in reinvestment of distributions | | | 19 | | | | — | |
| Net increase in shares | | | 19 | | | | 15,001 | |
| (a) | For the period July 17, 2020 (commencement of operations) to August 31, 2020. |
See accompanying notes which are an integral part of these financial statements.
| FISHER INVESTMENTS INSTITUTIONAL GROUP |
| U.S. SMALL CAP EQUITY FUND |
| FINANCIAL HIGHLIGHTS |
| (For a share outstanding during each period) |
| | | For the | | | For the | |
| | | Year Ended | | | Period Ended | |
| | | August 31, | | | August 31, | |
| | | 2021 | | | 2020(a) | |
| Selected Per Share Data: | | | | | | | | |
| Net asset value, beginning of period | | $ | 10.47 | | | $ | 10.00 | |
| Investment operations: | | | | | | | | |
| Net investment loss | | | (0.04 | ) | | | — | (b) |
| Net realized and unrealized gain | | | 5.22 | | | | 0.47 | |
| Total from investment operations | | | 5.18 | | | | 0.47 | |
| Less distributions from: | | | | | | | | |
| Net realized gains | | | (0.02 | ) | | | — | |
| Total distributions | | | (0.02 | ) | | | — | |
| Net asset value, end of period | | $ | 15.63 | | | $ | 10.47 | |
| Total Return(c) | | | 49.47 | % | | | 4.70 | % (d) |
| Ratios and Supplemental Data: | | | | | | | | |
| Net assets, end of period (000 omitted) | | $ | 235 | | | $ | 157 | |
| Ratio of net expenses to average net assets | | | 0.75 | % | | | 0.75 | % (e) |
| Ratio of gross expenses to average net assets before waiver and reimbursement | | | 68.54 | % | | | 188.33 | % (e) |
| Ratio of net investment income (loss) to average net assets | | | (0.26 | )% | | | 0.30 | % (e) |
| Portfolio turnover rate | | | 24 | % | | | 2 | % (d) |
| (a) | For the period July 17, 2020 (commencement of operations) to August 31, 2020. |
| (b) | Rounds to less than $0.005 per share. |
| (c) | Total return represents the rate that the investor would have earned or lost on an investment in the Fund, assuming reinvestment of distributions. |
See accompanying notes which are an integral part of these financial statements.
| FISHER INVESTMENTS INSTITUTIONAL GROUP |
| U.S. SMALL CAP EQUITY FUND |
| NOTES TO THE FINANCIAL STATEMENTS |
| August 31, 2021 |
NOTE 1. ORGANIZATION
Fisher Investments Institutional Group U.S. Small Cap Equity Fund (the “Fund”) is registered under the Investment Company Act of 1940, as amended (“1940 Act”), as a diversified series of Unified Series Trust (the “Trust”) on November 12, 2018. The Trust is an open-end investment company established under the laws of Ohio by an Agreement and Declaration of Trust dated October 14, 2002 (the “Trust Agreement”). The Trust Agreement permits the Board of Trustees of the Trust (the “Board”) to issue an unlimited number of shares of beneficial interest of separate series without par value. The Fund is one of a series of funds currently authorized by the Board. The Fund commenced operations on July 17, 2020. The investment adviser to the Fund is Fisher Asset Management, LLC, d/b/a Fisher Investments (the “Adviser”). The investment objective of the Fund is to seek to outperform, net of fees and expenses, the Russell 2000 Index.
NOTE 2. SIGNIFICANT ACCOUNTING POLICIES
The Fund is an investment company and follows accounting and reporting guidance under Financial Accounting Standards Board Accounting Standards Codification (“ASC”) Topic 946, “Financial Services-Investment Companies.” The following is a summary of significant accounting policies followed by the Fund in the preparation of its financial statements. These policies are in conformity with generally accepted accounting principles in the United States of America (“GAAP”).
Estimates – The preparation of financial statements in conformity with GAAP requires management to make estimates and assumptions that affect the reported amounts of assets and liabilities and disclosure of contingent assets and liabilities at the date of the financial statements and the reported amounts of increases and decreases in net assets from operations during the reporting period. Actual results could differ from those estimates.
Federal Income Taxes – The Fund makes no provision for federal income or excise tax. The Fund has qualified and intends to qualify each year as a regulated investment company (“RIC”) under subchapter M of the Internal Revenue Code of 1986, as amended, by complying with the requirements applicable to RICs and by distributing substantially all of its taxable income. The Fund also intends to distribute sufficient net investment income and net realized capital gains, if any, so that it will not be subject to excise tax on undistributed income and gains. If the required amount of net investment income or gains is not distributed, the Fund could incur a tax expense.
| FISHER INVESTMENTS INSTITUTIONAL GROUP |
| U.S. SMALL CAP EQUITY FUND |
| NOTES TO THE FINANCIAL STATEMENTS – (continued) |
| August 31, 2021 |
NOTE 2. SIGNIFICANT ACCOUNTING POLICIES – continued
As of and during the fiscal year ended August 31, 2021, the Fund did not have any liabilities for any unrecognized tax benefits. The Fund recognizes interest and penalties, if any, related to unrecognized tax benefits as income tax expense on the Statement of Operations when incurred. During the fiscal year ended August 31, 2021, the Fund did not incur any interest or penalties. Management of the Fund has reviewed tax positions taken in tax years that remain subject to examination by all major tax jurisdictions, including federal (i.e., the last three tax year ends and the interim tax period since then, as applicable). Management believes that there is no tax liability resulting from unrecognized tax benefits related to uncertain tax positions taken.
Expenses – Expenses incurred by the Trust that do not relate to a specific fund of the Trust are allocated to the individual funds based on each fund’s relative net assets or another appropriate basis (as determined by the Board).
Security Transactions and Related Income – The Fund follows industry practice and records security transactions on the trade date for financial reporting purposes. The specific identification method is used for determining gains or losses for financial statements and income tax purposes. Dividend income is recorded on the ex-dividend date and interest income is recorded on an accrual basis. Withholding taxes on foreign dividends and related reclaims have been provided for in accordance with the Fund’s understanding of the applicable country’s tax rules and rates.
Dividends and Distributions – The Fund intends to distribute its net investment income and net realized long-term and short-term capital gains, if any, at least annually. Dividends and distributions to shareholders, which are determined in accordance with income tax regulations, are recorded on the ex-dividend date. The treatment for financial reporting purposes of distributions made to shareholders during the period from net investment income or net realized capital gains may differ from their ultimate treatment for federal income tax purposes. These differences are caused primarily by differences in the timing of the recognition of certain components of income, expense or realized capital gain for federal income tax purposes. Where such differences are permanent in nature, they are reclassified among the components of net assets based on their ultimate characterization for federal income tax purposes. Any such reclassifications will have no effect on net assets, results of operations or net asset value (“NAV”) per share of the Fund.
| FISHER INVESTMENTS INSTITUTIONAL GROUP |
| U.S. SMALL CAP EQUITY FUND |
| NOTES TO THE FINANCIAL STATEMENTS – (continued) |
| August 31, 2021 |
NOTE 3. SECURITIES VALUATION AND FAIR VALUE MEASUREMENTS
The Fund values its portfolio securities at fair value as of the close of regular trading on the New York Stock Exchange (“NYSE”) (normally 4:00 p.m. Eastern time) on each business day the NYSE is open for business. Fair value is defined as the price that the Fund would receive upon selling an investment in a timely transaction to an independent buyer in the principal or most advantageous market of the investment. GAAP establishes a three-tier hierarchy to maximize the use of observable market data and minimize the use of unobservable inputs and to establish classification of fair value measurements for disclosure purposes.
Inputs refer broadly to the assumptions that market participants would use in pricing the asset or liability, including assumptions about risk (the risk inherent in a particular valuation technique used to measure fair value including a pricing model and/or the risk inherent in the inputs to the valuation technique). Inputs may be observable or unobservable. Observable inputs are inputs that reflect the assumptions market participants would use in pricing the asset or liability developed based on market data obtained and available from sources independent of the reporting entity. Unobservable inputs are inputs that reflect the reporting entity’s own assumptions about the assumptions market participants would use in pricing the asset or liability developed based on the best information available in the circumstances.
Various inputs are used in determining the value of the Fund’s investments. These inputs are summarized in the three broad levels listed below.
| ● | Level 1 – unadjusted quoted prices in active markets for identical investments and/or registered investment companies where the value per share is determined and published and is the basis for current transactions for identical assets or liabilities at the valuation date |
| ● | Level 2 – other significant observable inputs (including, but not limited to, quoted prices for an identical security in an inactive market, quoted prices for similar securities, interest rates, prepayment speeds, credit risk, etc.) |
| ● | Level 3 – significant unobservable inputs (including the Fund’s own assumptions in determining fair value of investments based on the best information available) |
| FISHER INVESTMENTS INSTITUTIONAL GROUP |
| U.S. SMALL CAP EQUITY FUND |
| NOTES TO THE FINANCIAL STATEMENTS – (continued) |
| August 31, 2021 |
NOTE 3. SECURITIES VALUATION AND FAIR VALUE MEASUREMENTS – continued
The inputs used to measure fair value may fall into different levels of the fair value hierarchy. In such cases, for disclosure purposes, the level in the fair value hierarchy which is reported is determined based on the lowest level input that is significant to the fair value measurement in its entirety.
Equity securities that are traded on any stock exchange are generally valued at the last quoted sale price on the security’s primary exchange. Lacking a last sale price, an exchange-traded security is generally valued at its last bid price. Securities traded in the NASDAQ over-the-counter market are generally valued at the NASDAQ Official Closing Price. When using market quotations and when the market is considered active, the security is classified as a Level 1 security. In the event that market quotations are not readily available or are considered unreliable due to market or other events, the Fund values its securities and other assets at fair value in accordance with policies established by and under the general supervision of the Board. Under these policies, the securities will be classified as Level 2 or 3 within the fair value hierarchy, depending on the inputs used.
Investments in mutual funds, including money market mutual funds, are generally priced at the ending NAV provided by the service agent of the mutual funds. These securities are categorized as Level 1 securities.
In accordance with the Trust’s valuation policies, the Adviser is required to consider all appropriate factors relevant to the value of securities for which it has determined other pricing sources are not available or reliable as described above. No single method exists for determining fair value, because fair value depends upon the circumstances of each individual case. As a general principle, the current fair value of a security being valued by the Adviser would be the amount that the Fund might reasonably expect to receive upon the current sale. Methods that are in accordance with this principle may, for example, be based on (i) a multiple of earnings; (ii) a discount from market prices of a similar freely traded security (including a derivative security or a basket of securities traded on other markets, exchanges or among dealers); or (iii) yield to maturity with respect to debt issues, or a combination of these and other methods. Fair-value pricing is permitted if, in the Adviser’s opinion, the validity of market quotations appears to be questionable based on factors such as evidence of a thin market in the security based on a small number of quotations, a significant
| FISHER INVESTMENTS INSTITUTIONAL GROUP |
| U.S. SMALL CAP EQUITY FUND |
| NOTES TO THE FINANCIAL STATEMENTS – (continued) |
| August 31, 2021 |
NOTE 3. SECURITIES VALUATION AND FAIR VALUE MEASUREMENTS – continued
event occurs after the close of a market but before the Fund’s NAV calculation that may affect a security’s value, or the Adviser is aware of any other data that calls into question the reliability of market quotations.
The following is a summary of the inputs used to value the Fund’s investments as of August 31, 2021:
| | | Valuation Inputs | |
| | | Level 1 | | | Level 2 | | | Level 3 | | | Total | |
| Assets | | | | | | | | | | | | | | | | |
| Common Stocks(a) | | $ | 248,491 | | | $ | — | | | $ | — | | | $ | 248,491 | |
| Money Market Funds | | | 1,698 | | | | — | | | | — | | | | 1,698 | |
| Total | | $ | 250,189 | | | $ | — | | | $ | — | | | $ | 250,189 | |
| (a) | Refer to Schedule of Investments for sector classifications. |
The Fund did not hold any investments at the end of the reporting period for which significant unobservable inputs (Level 3) were used in determining fair value; therefore, no reconciliation of Level 3 securities is included for this reporting period. The Fund did not hold any derivative instruments during the reporting period.
NOTE 4. FEES AND OTHER TRANSACTIONS WITH AFFILIATES
The Adviser, under the terms of the management agreement (the “Agreement”) with the Trust with respect to the Fund, manages the Fund’s investments. As compensation for its management services, the Fund is obligated to pay the Adviser a fee computed and accrued daily and paid monthly at an annual rate of 0.68% of the Fund’s average daily net assets. For the fiscal year ended August 31, 2021, the Adviser earned fees of $1,399 from the Fund before the waiver and reimbursement described below.
The Adviser is contractually obligated to limit the Fund’s total annual operating expenses to 0.75% of the Fund’s average daily net assets through December 31, 2024 (excluding portfolio transaction and other investment-related costs (including brokerage fees and commissions); taxes; borrowing costs (such as interest and dividend expenses on securities sold short); acquired fund fees and expenses; fees and expenses associated with investments in other collective investment vehicles or derivative instruments (including for example option and swap fees and expenses);
| FISHER INVESTMENTS INSTITUTIONAL GROUP |
| U.S. SMALL CAP EQUITY FUND |
| NOTES TO THE FINANCIAL STATEMENTS – (continued) |
| August 31, 2021 |
NOTE 4. FEES AND OTHER TRANSACTIONS WITH AFFILIATES - continued
any amounts payable pursuant to a distribution or service plan adopted in accordance with Rule 12b-1 under the 1940 Act; any administrative and/or shareholder servicing fees payable to financial intermediaries; expenses incurred in connection with any merger or reorganization; extraordinary expenses (such as litigation expenses, indemnification of Trust officers and Trustees and contractual indemnification of Fund service providers); and other expenses that the Trustees agree have not been incurred in the ordinary course of the Fund’s business. This expense cap may not be terminated prior to this date except by the Board of Trustees. For the fiscal year ended August 31, 2021, the Adviser waived fees and reimbursed expenses in the amount of $139,672 for the Fund. At August 31, 2021, the Adviser owed the Fund $11,339.
Each waiver/expense payment by the Adviser is subject to recoupment by the Adviser from the Fund in the three years following the date the particular expense payment occurred, but only if such recoupment can be achieved without exceeding the annual expense limitation in effect at the time of the expense payment and any expense limitation in effect at the time of the recoupment. As of August 31, 2021, the Adviser may seek repayment of expense reimbursements in the amount as follows:
| Recoverable through |
| August 31, 2023 | | $ | 34,216 | |
| August 31, 2024 | | | 139,672 | |
Ultimus Fund Solutions, LLC (“Ultimus”) provides administration, fund accounting and transfer agent services to the Fund. The Fund pays Ultimus fees in accordance with the agreements for such services.
Northern Lights Compliance Services, LLC (“NLCS”), an affiliate of Ultimus, provides a Chief Compliance Officer to the Trust, as well as related compliance services, pursuant to a consulting agreement between NLCS and the Trust. Under the terms of such agreement, NLCS receives fees from the Fund, which are approved annually by the Board. Prior to April 1, 2021, Ultimus provided certain compliance services and Buttonwood Compliance Partners provided the Chief Compliance Officer to the Trust.
| FISHER INVESTMENTS INSTITUTIONAL GROUP |
| U.S. SMALL CAP EQUITY FUND |
| NOTES TO THE FINANCIAL STATEMENTS – (continued) |
| August 31, 2021 |
NOTE 4. FEES AND OTHER TRANSACTIONS WITH AFFILIATES - continued
Under the terms of a Distribution Agreement with the Trust, Ultimus Fund Distributors, LLC (the “Distributor”) serves as principal underwriter to the Fund. The Distributor is a wholly-owned subsidiary of Ultimus. The Distributor is compensated by the Adviser (not the Fund) for acting as principal underwriter.
Certain officers and a Trustee of the Trust are also employees of Ultimus and are not paid by the Fund for serving in such capacities.
The Board supervises the business activities of the Trust. Each Trustee serves as a trustee until termination of the Trust unless the Trustee dies, resigns, retires, or is removed. The Chairman of the Board and more than 75% of the Trustees are “Independent Trustees,” which means that they are not “interested persons” as defined in the 1940 Act. Each Independent Trustee of the Trust receives annual compensation of $2,510 per fund from the Trust, except that the Chairman of the Audit Committee, the Chairman of the Governance & Nominating Committee, and the Chairman of the Pricing & Liquidity Committee each receives annual compensation of $2,960 per fund from the Trust, and the Independent Chairman of the Board receives $3,160 per fund from the Trust. Independent Trustees also receive $250 for the first hour and $200 for each additional hour for attending special meetings. Prior to January 1, 2021, these fees were $2,290 for non-chairmen and $2,740 for all chairmen. In addition, the Trust reimburses Independent Trustees for out-of-pocket expenses incurred in conjunction with attendance at meetings.
NOTE 5. INVESTMENT TRANSACTIONS
For the fiscal year ended August 31, 2021, purchases and sales of investment securities, other than short-term investments, were $63,854 and $51,389, respectively.
There were no purchases or sales of long-term U.S. government obligations during the fiscal year ended August 31, 2021.
NOTE 6. BENEFICIAL OWNERSHIP
The beneficial ownership, either directly or indirectly, of more than 25% of the voting securities of a fund creates a presumption of control of a fund, under Section 2(a)(9) of the 1940 Act. As of August 31, 2021, the Adviser owned 99.99% of the Fund’s outstanding shares. As a result, the Adviser may be deemed to control the Fund.
| FISHER INVESTMENTS INSTITUTIONAL GROUP |
| U.S. SMALL CAP EQUITY FUND |
| NOTES TO THE FINANCIAL STATEMENTS – (continued) |
| August 31, 2021 |
NOTE 7. FEDERAL TAX INFORMATION
At August 31, 2021, the net unrealized appreciation (depreciation) and tax cost of investments for tax purposes was as follows:
| Gross unrealized appreciation | | $ | 82,896 | |
| Gross unrealized depreciation | | | (9,284 | ) |
| Net unrealized appreciation on investments | | $ | 73,612 | |
| Tax cost of investments | | $ | 176,577 | |
The tax character of distributions paid for the fiscal year ended August 31, 2021 was as follows:
| Distributions paid from: | | | | |
| Ordinary income(a) | | $ | 253 | |
| Total distributions paid | | $ | 253 | |
| (a) | Short-term capital gain distributions are treated as ordinary income for tax purposes. |
At August 31, 2021, the components of accumulated earnings (deficit) on a tax basis were as follows:
| Undistributed ordinary income | | $ | 10,596 | |
| Undistributed long-term capital gains | | | 232 | |
| Unrealized appreciation on investments | | | 73,612 | |
| Total accumulated earnings | | $ | 84,440 | |
NOTE 8. SECTOR RISK
If the Fund has significant investments in the securities of issuers within a particular sector, any development affecting that sector will have a greater impact on the value of the net assets of the Fund than would be the case if the Fund did not have significant investments in that sector. In addition, this may increase the risk of loss in the Fund and increase the volatility of the Fund’s NAV per share. For instance, economic or market factors, regulatory changes or other developments may negatively impact all companies in a particular sector, and therefore the value of the Fund’s portfolio will be adversely affected. As of August 31, 2021, the Fund had 27.66% and 25.99% of the value of its net assets invested in stocks within the Health Care and Technology sectors, respectively.
| FISHER INVESTMENTS INSTITUTIONAL GROUP |
| U.S. SMALL CAP EQUITY FUND |
| NOTES TO THE FINANCIAL STATEMENTS – (continued) |
| August 31, 2021 |
NOTE 9. COMMITMENTS AND CONTINGENCIES
The Trust indemnifies its officers and Trustees for certain liabilities that may arise from their performance of their duties to the Trust or the Fund. Additionally, in the normal course of business, the Trust enters into contracts that contain a variety of representations and warranties which provide general indemnifications. The Trust’s maximum exposure under these arrangements is unknown, as this would involve future claims that may be made against the Trust that have not yet occurred.
NOTE 10. SUBSEQUENT EVENTS
Management of the Fund has evaluated the need for disclosures and/or adjustments resulting from subsequent events through the date at which these financial statements were issued. Based upon this evaluation, management has determined there were no items requiring adjustment of the financial statements or additional disclosure.
| REPORT OF INDEPENDENT REGISTERED PUBLIC |
| ACCOUNTING FIRM |
To the Shareholders of Fisher Investments Institutional Group Fund Family and Board of Trustees of Unified Series Trust
Opinion on the Financial Statements
We have audited the accompanying statement of assets and liabilities, including the schedule of investments, of Fisher Investments Institutional Group U.S. Small Cap Equity Fund (the “Fund”), a series of Unified Series Trust, as of August 31, 2021, the related statement of operations for the year then ended, and the statements of changes in net assets, the related notes, and the financial highlights for each of the two periods in the period then ended (collectively referred to as the “financial statements”). In our opinion, the financial statements present fairly, in all material respects, the financial position of the Fund as of August 31, 2021, the results of its operations for the year then ended, and the changes in net assets and the financial highlights for each of the two periods in the period then ended, in conformity with accounting principles generally accepted in the United States of America.
Basis for Opinion
These financial statements are the responsibility of the Fund’s management. Our responsibility is to express an opinion on the Fund’s financial statements based on our audits. We are a public accounting firm registered with the Public Company Accounting Oversight Board (United States) (“PCAOB”) and are required to be independent with respect to the Fund in accordance with the U.S. federal securities laws and the applicable rules and regulations of the Securities and Exchange Commission and the PCAOB.
We conducted our audits in accordance with the standards of the PCAOB. Those standards require that we plan and perform the audit to obtain reasonable assurance about whether the financial statements are free of material misstatement whether due to error or fraud.
Our audits included performing procedures to assess the risks of material misstatement of the financial statements, whether due to error or fraud, and performing procedures that respond to those risks. Such procedures included examining, on a test basis, evidence regarding the amounts and disclosures in the financial statements. Our procedures included confirmation of securities owned as of August 31, 2021, by correspondence with the custodian. Our audits also included evaluating the accounting principles used and significant estimates made by management, as well as evaluating the overall presentation of the financial statements. We believe that our audits provide a reasonable basis for our opinion.
We have served as the auditor of one or more investment companies advised by Fisher Asset Management, LLC since 2017.
COHEN & COMPANY, LTD.
Chicago, Illinois
October 28, 2021
| SUMMARY OF FUND EXPENSES (Unaudited) |
As a shareholder of the Fund, you incur two types of costs: (1) transaction and (2) ongoing costs, including management fees and other Fund expenses. These examples are intended to help you understand your ongoing costs (in dollars) of investing in the Fund and to compare these costs with the ongoing costs of investing in other mutual funds. The example is based on an investment of $1,000 invested at the beginning of the period and held for the entire period from March 1, 2021 through August 31, 2021.
Actual Expenses
The first line of the table below provides information about actual account values and actual expenses. You may use the information in this line, together with the amount you invested, to estimate the expenses that you paid over the period. Simply divide your account value by $1,000 (for example, an $8,600 account value divided by $1,000 = 8.6), then multiply the result by the number in the first line under the heading entitled “Expenses Paid During the Period” to estimate the expenses you paid on your account during this period.
Hypothetical Example for Comparison Purposes
The second line of the table below provides information about hypothetical account values and hypothetical expenses based on the Fund’s actual expense ratio and an assumed rate of return of 5% per year before expenses, which is not the Fund’s actual return. The hypothetical account values and expenses may not be used to estimate the actual ending account balance or expenses you paid for the period. You may use this information to compare the ongoing costs of investing in the Fund and other funds. To do so, compare this 5% hypothetical example with the 5% hypothetical examples that appear in the shareholder reports of other funds.
| | | Beginning | | Ending | | Expenses | | |
| | | Account Value | | Account Value | | Paid | | Annualized |
| | | March 1, | | August 31, | | During the | | Expense |
| | | 2021 | | 2021 | | Period(a) | | Ratio |
| Actual | | $1,000.00 | | $1,090.00 | | $3.95 | | 0.75% |
| Hypothetical(b) | | $1,000.00 | | $1,021.42 | | $3.82 | | 0.75% |
| (a) | Expenses are equal to the Fund’s annualized expense ratios, multiplied by the average account value over the period, multiplied by 184/365 (to reflect the one-half year period). |
| (b) | Hypothetical assumes 5% annual return before expenses. |
| ADDITIONAL FEDERAL INCOME TAX INFORMATION (Unaudited) |
The Form 1099-DIV you receive in January 2022 will show the tax status of all distributions paid to your account in calendar year 2021. Shareholders are advised to consult their own tax adviser with respect to the tax consequences of their investment in the Fund. As required by the Internal Revenue Code and/or regulations, shareholders must be notified regarding the status of qualified dividend income for individuals and the dividends received deduction for corporations.
Qualified Dividend Income. The Fund designates approximately 0.66% or up to the maximum amount of such dividends allowable pursuant to the Internal Revenue Code, as qualified dividend income eligible for a reduced tax rate.
Qualified Business Income. The Fund designates approximately 0% of its ordinary income dividends, or up to the maximum amount of such dividends allowable pursuant to the Internal Revenue Code, as qualified business income.
Dividends Received Deduction. Corporate shareholders are generally entitled to take the dividends received deduction on the portion of the Fund’s dividend distribution that qualifies under tax law. For the Fund’s calendar year 2021 ordinary income dividends, 73.39% qualifies for the corporate dividends received deduction.
| TRUSTEES AND OFFICERS (Unaudited) |
GENERAL QUALIFICATIONS. The Board supervises the business activities of the Trust. Each Trustee serves as a trustee until termination of the Trust unless the Trustee dies, resigns, retires, or is removed. The Chairman of the Board and more than 75% of the Trustees are “Independent Trustees,” which means that they are not “interested persons” (as defined in the 1940 Act) of the Trust or any adviser, sub-adviser or distributor of the Trust.
The following table provides information regarding the Independent Trustees.
Name, Address*,
(Year of Birth),
Position with Trust**,
Term of Position
with Trust | Principal Occupation During Past 5 Years and
Other Directorships |
Kenneth G.Y. Grant(1949)
Chairman, January 2017 to present; Independent Trustee, May 2008 to present | Current:Director, Standpoint Multi-Asset (Cayman) Fund, Ltd. (2019 – present); Director, Advisors Charitable Gift Fund (2020 - present), a Donor Advised Fund. Previous:EVP, Benefit Plans Administrative Services, Inc., provider of retirement benefit plans administration (2019 – 2020); Director, Northeast Retirement Services (NRS) LLC, a transfer agent and fund administrator; and Director, Global Trust Company (GTC), a non-depository trust company sponsoring private investment product (2003 – 2019); EVP, NRS (2003 – 2019); GTC, EVP (2008 – 2019); EVP, Savings Banks Retirement Association (2003 – 2019), provider of qualified retirement benefit plans. |
Daniel J. Condon(1950)
Chairman of the Audit Committee; Chairman of the Governance & Nominating Committee; Independent Trustee, December 2002 to present | Current: Retired (2017 – present) |
TRUSTEES AND OFFICERS (Unaudited) – (continued)
Name, Address*,
(Year of Birth),
Position with Trust**,
Term of Position
with Trust | Principal Occupation During Past 5 Years and
Other Directorships |
Gary E. Hippenstiel (1947)
Chairman of the Pricing & Liquidity Committee; Independent Trustee, December 2002 to present | Current: President and founder of Hippenstiel Investment Counsel LLC (“Hippenstiel”) since 2008. Hippenstiel was registered as an investment adviser from 2008 to December 31, 2019. |
Stephen A. Little(1946)
Independent Trustee, December 2002 to present; Chairman, December 2004 to December 2016 | Current:President and founder of The Rose, Inc., a registered investment adviser, since 1993. |
Ronald C. Tritschler(1952)
Independent Trustee, January 2007 to present; Interested Trustee, December 2002 to December 2006 | Current: Chief Executive Officer, Director and Legal Counsel of The Webb Companies, a national real estate company, since 2001; Director, Standpoint Multi-Asset (Cayman) Fund, Ltd. (2020 – present). |
| * | The address for each Trustee is 225 Pictoria Drive, Suite 450, Cincinnati, Ohio 45246. |
| ** | As of the date of this report, the Trust consists of 21 series. |
The following table provides information regarding the Interested Trustee and the Officers of the Trust.
Name, Address*,
(Year of Birth),
Position with Trust,
Term of Position
with Trust | Principal Occupation During Past 5 Years and
Other Directorships |
David R. Carson(1958)
President, January 2016 to August 2021; Interested Trustee, August 2020 to present | Current:Senior Vice President Client Strategies of Ultimus Fund Solutions, LLC, since 2013; Interested Trustee of Ultimus Managers Trust, since 2020. |
| TRUSTEES AND OFFICERS (Unaudited) – (continued) |
Name, Address*,
(Year of Birth),
Position with Trust,
Term of Position
with Trust | Principal Occupation During Past 5 Years and
Other Directorships |
Zachary P. Richmond(1980)
Treasurer and Chief Financial Officer, November 2014 to present | Current: Vice President, Director of Financial Administration for Ultimus Fund Solutions, LLC, since 2015. |
Martin R. Dean(1963)
President, August 2021 to present; Vice President, November 2020 to August 2021; Chief Compliance Officer, April 2021 to August 2021; Assistant Chief Compliance Officer, January 2016 to April 2021 | Current: Senior Vice President, Head of Fund Compliance of Ultimus Fund Solutions, LLC, since 2016. |
Gweneth K. Gosselink(1955)
Chief Compliance Officer, August 2021 to present | Current: Assistant Vice President, Senior Compliance Officer of Ultimus Fund Solutions, LLC, since 2019. Previous:Chief Operating Officer & CCO at Miles Capital, Inc. (2013 – 2019). |
Elisabeth Dahl(1962)
Secretary, May 2017 to present; Assistant Secretary, March 2016 to May 2017 | Current: Attorney, Ultimus Fund Solutions, LLC since March 2016. |
Stephen Preston(1966)
AML Compliance Officer, May 2017 to present | Current: Vice President and Chief Compliance Officer, Ultimus Fund Solutions, LLC and Ultimus Fund Distributors, LLC, since 2011. |
Lynn E. Wood(1946)
Assistant Chief Compliance Officer, April 2021 to present; Chief Compliance Officer, October 2004 to April 2021 | Current: Managing Member, Buttonwood Compliance Partners, LLC, since 2013. |
| * | The address for each Officer is 225 Pictoria Drive, Suite 450, Cincinnati, Ohio 45246. |
| PRIVACY NOTICE | Rev: January 2020 |
| FACTS | WHAT DOES FISHER INVESTMENTS INSTITUTIONAL GROUP U.S. SMALL CAP EQUITY FUND (THE “FUND”) DO WITH YOUR PERSONAL INFORMATION? |
| |
| Why? | Financial companies choose how they share your personal information. Federal law gives consumers the right to limit some but not all sharing. Federal law also requires us to tell you how we collect, share, and protect your personal information. Please read this notice carefully to understand what we do. |
| |
| What? | The types of personal information we collect and share depend on the product or service you have with us. This information can include: ■ Social Security number ■ account balances and account transactions ■ transaction or loss history and purchase history When you are no longer our customer, we continue to share your information as described in this notice. |
| |
| How? | All financial companies need to share customers’ personal information to run their everyday business. In the section below, we list the reasons financial companies can share their customers’ personal information; the reasons the Fund chooses to share; and whether you can limit this sharing. |
| |
| Reasons we can share your personal information | Does the Fund
share? | Can you limit
this sharing? |
For our everyday business purposes – such as to process your transactions, maintain your account(s), respond to court orders and legal investigations, or report to credit bureaus | Yes | No |
For our marketing purposes – to offer our products and services to you | No | We don’t share |
| For joint marketing with other financial companies | No | We don’t share |
For our affiliates’ everyday business purposes – information about your transactions and experiences | No | We don’t share |
For our affiliates’ everyday business purposes – information about your creditworthiness | No | We don’t share |
| For nonaffiliates to market to you | No | We don’t share |
| | | | |
| Questions? | Call (800) 851-8845 |
| Who we are |
| Who is providing this notice? | Fisher Investments Institutional Group U.S. Small Cap Equity Fund Ultimus Fund Distributors, LLC (Distributor) Ultimus Fund Solutions, LLC (Administrator) |
| What we do |
| How does the Fund protect my personal information? | To protect your personal information from unauthorized access and use, we use security measures that comply with federal law. These measures include computer safeguards and secured files and buildings. Our service providers are held accountable for adhering to strict policies and procedures to prevent any misuse of your nonpublic personal information. |
| How does the Fund collect my personal information? | We collect your personal information, for example, when you ■ open an account or deposit money ■ make deposits or withdrawals from your account or provide account information We also collect your personal information from other companies. |
| Why can’t I limit all sharing? | Federal law gives you the right to limit only ■ sharing for affiliates’ everyday business purposes – information about your creditworthiness ■ affiliates from using your information to market to you ■ sharing for nonaffiliates to market to you State laws and individual companies may give you additional rights to limit sharing. |
| |
| Definitions |
| Affiliates | Companies related by common ownership or control. They can be financial and nonfinancial companies. ■ Fisher Asset Management, LLC, d/b/a Fisher Investments, the investment adviser to the Fund, could be deemed to be an affiliate. |
| Nonaffiliates | Companies not related by common ownership or control. They can be financial and nonfinancial companies. ■ The Fund does not share your personal information with nonaffiliates so they can market to you. |
| Joint marketing | A formal agreement between nonaffiliated financial companies that together market financial products or services to you. ■ The Fund doesn’t jointly market. |
This page intentionally left blank.
This page intentionally left blank.
| OTHER INFORMATION (Unaudited) |
The Fund’s Statement of Additional Information (“SAI”) includes additional information about the trustees and is available without charge, upon request. You may call toll-free at (800) 851-8845 to request a copy of the SAI or to make shareholder inquiries.
A description of the policies and procedures that the Fund uses to determine how to vote proxies relating to portfolio securities and information regarding how the Fund voted those proxies during the most recent twelve month period ended June 30, are available (1) without charge upon request by calling the Fund at (800) 851-8845 and (2) in Fund documents filed with the Securities and Exchange Commission (“SEC”) on the SEC’s website at www.sec.gov.
TRUSTEES Kenneth G.Y. Grant, Chairman David R. Carson Daniel J. Condon Gary E. Hippenstiel Stephen A. Little Ronald C. Tritschler OFFICERS Martin R. Dean, President Gweneth K. Gosselink, Chief Compliance Officer Zachary P. Richmond, Treasurer and Chief Financial Officer Lynn E. Wood, Assistant Chief Compliance Officer INVESTMENT ADVISER Fisher Asset Management, LLC 5525 NW Fisher Creek Drive Camas, WA 98607 DISTRIBUTOR Ultimus Fund Distributors, LLC 225 Pictoria Drive, Suite 450 Cincinnati, OH 45246 | INDEPENDENT REGISTERED PUBLIC ACCOUNTING FIRM Cohen & Company, Ltd. 151 N Franklin Street, Suite 575 Chicago, IL 60606 LEGAL COUNSEL Thompson Hine LLP 312 Walnut Street, 20th Floor Cincinnati, OH 45202 CUSTODIAN U.S. Bank, N.A. 425 Walnut Street Cincinnati, OH 45202 ADMINISTRATOR, TRANSFER AGENT AND FUND ACCOUNTANT Ultimus Fund Solutions, LLC 225 Pictoria Drive, Suite 450 Cincinnati, OH 45246 |
This report is intended only for the information of shareholders or those who have received the Fund’s prospectus which contains information about the Fund’s management fee and expenses. Please read the prospectus carefully before investing.
Distributed by Ultimus Fund Distributors, LLC
Member FINRA/SIPC
Fisher3-AR-21
FISHER INVESTMENTS INSTITUTIONAL GROUP FUND FAMILY |
Annual Report
August 31, 2021
Fisher Investments Institutional Group
U.S. Large Cap Equity
Environmental and Social Values Fund
Fund Adviser:
Fisher Asset Management, LLC
5525 NW Fisher Creek Drive,
Camas, Washington 98607
(800) 851-8845
FISHER INVESTMENTS INSTITUTIONAL GROUP
U.S. LARGE CAP EQUITY ENVIRONMENTAL AND SOCIAL VALUES FUND
MANAGEMENT’S DISCUSSION OF FUND PERFORMANCE
(Unaudited)
Dear Shareholder:
Market Outlook
US markets hit new record highs in Q2, topping off an impressive first half of the year. Inflation fears and economic growth expectations seemed to subside somewhat last month. Now pundits increasingly see a return toward pre-pandemic growth rates—a rational turn, to us, which matches our long-held view. We think that is a fine backdrop for further broad market gains, and one suggesting growth’s leadership should persist.
While rising price fears escalated in the first half of the quarter, bond yields that are most sensitive to inflation didn’t follow suit. In Q1, the 10-year Treasury yield increased from 0.9% to 1.7%, anticipating a return to more normal pre-pandemic economic conditions, in our view. The move higher caused the initial wave of inflation-related worries, but in Q2 yields have fallen to around 1.4%—markets appear to have pre-priced the impact of the reopening-led bounce in inflation pressures.
Additionally, falling bond market-implied breakeven inflation rates—as measured by 10-year Treasury yields minus Treasury inflation-protected securities—suggest inflation fears are receding. After rising steadily from 2.0% year-over-year (y/y) to begin the year, the implied breakeven inflation rate hit 2.5% in May 2021 then fell, ending June at 2.3%. Now, breakeven inflation rates don’t forecast inflation very accurately. We see them mostly as a snapshot of sentiment—a bond market gauge of inflation expectations and fears. That relief was likely a tailwind for markets in June.
That said, May’s Consumer Price Index (CPI) report, like April’s, suggests inflation is likely to subside—in this case, reality appears to be matching expectations. CPI rose 0.6% month-over-month (m/m) in May, moderating from April’s 0.8%, but that monthly jump again stemmed from temporary one-offs. Used cars’ 7.3% m/m price gain (after April’s 10% jump) drove a third of May CPI’s monthly increase. Similarly, other reopening categories related to travel (auto rentals, airfares) and ones facing supply-chain bottlenecks (new vehicles, household furnishings) generated most of the rest of prices’ rise. These seem tied mainly to reopening and shortages that should prove temporary after companies work out reopening-related supply-chain issues. Simply, it is generally far faster to shut down production than bring it back online. Meanwhile, CPI’s year-over-year base effects are set to fade after May’s 5.0% y/y jump—a 13-year high. CPI’s level troughed in May 2020, so big year-over-year growth rates will become harder to sustain in the months ahead as the denominator rises.
FISHER INVESTMENTS INSTITUTIONAL GROUP
U.S. LARGE CAP EQUITY ENVIRONMENTAL AND SOCIAL VALUES FUND
MANAGEMENT’S DISCUSSION OF FUND PERFORMANCE
(Unaudited) – (continued)
It is also worth mentioning that inflation itself doesn’t automatically harm equities. To the degree there would be any, companies are often able to control costs or pass them on to preserve profit margins. Historically, equities have fared fine during inflationary periods. The damage usually comes through policy mistakes aimed at combating rising prices, e.g. the Nixon administration’s price controls or the Fed increasing short-term rates above long-term rates, inverting the yield curve. These are worth watching out for, but at this point it is premature to speculate about, in our view.
Consumer spending is also leveling off. After exceeding pre-pandemic highs early this year, personal consumption expenditures’ (PCE) m/m growth was flat in May 2021 after slowing to 0.9% m/m in April from March’s 5.0% monthly gain. Services PCE— about two-thirds of the total—remain -1.2% below pre-pandemic levels but rose 0.7% m/m in June. This contrasts with goods PCE’s -1.3% m/m drop, highlighting how reopening is currently driving consumption patterns to mixed effect.
Yes, households have savings to spend, but after satisfying their pent-up demand, the evidence suggests they are conserving large amounts of cash. An NBER survey last year found almost 60% of first-round COVID-19 relief payments went to savings or debt reduction. Studies of subsequent economic impact payments from the Census Bureau show similar results. Moreover, the Fed’s quarterly report on household wealth, released in June, showed cash balances in Americans’ accounts up $850 billion in Q1. Their amassed cash on hand stands over $14.5 trillion, more than $3 trillion above 2019’s level. This is similar to how households reacted in the wake of the 2007 – 2009 recession and the government’s recovery efforts, albeit bigger in scope. Despite generous federal stimulus, households in aggregate are spending carefully and choosing to maintain pristine balance sheets. In our view, the so-called new normal looks a lot like the old normal.
A divergence between booming economic growth expectations versus the likelier underwhelming reality sets up disappointment. However, this probably wouldn’t upset the bull market overall. Equities can handle tapering economic growth fine, as 2009 – 2020’s bull market—the longest ever—demonstrated over the decade’s seemingly frustratingly slow expansion. This slow growth environment ahead likely favors growth equities.
The popular concern now is that reopening plus monetary and fiscal support measures will favor value equities. Many suspect value’s leadership burst in the first half of the quarter is more than just a countertrend. We believe this year’s value-and-growth leadership rotations retread similar sentiment-driven moves over the past year, with the same conclusion: Value countertrends can occur, but they seem unlikely to last.
FISHER INVESTMENTS INSTITUTIONAL GROUP
U.S. LARGE CAP EQUITY ENVIRONMENTAL AND SOCIAL VALUES FUND
MANAGEMENT’S DISCUSSION OF FUND PERFORMANCE
(Unaudited) – (continued)
Sector-wise, greater demand may be good for Energy, but we think it is largely priced into markets already. Meanwhile, less noticed but critical, in our view: readily available, easily tapped oil supplies waiting in the wings. OPEC+ is discussing ramping up production. US rig counts are rising, too. This suggests more supply is waiting to be brought online, which could offset demand increases and weigh on oil prices, Energy’s key driver. However, growth regained leadership toward the end of Q2. Markets seem to be looking past the reopening bounce and seeing slower growth ahead, which is why we think economically sensitive value equities’ run is unlikely to resume.
In late April, President Joe Biden unveiled his $1.8 trillion American Families Plan (AFP), the second part of his “Build Back Better” economic agenda after the $2.3 trillion American Jobs Plan (often referred to as the “infrastructure plan”). The AFP includes $1 trillion in spending for preschool, child care and community college over the next 10 years and $800 billion in tax credits for child and dependent care. To raise revenue to help pay for these initiatives, it would nearly double capital gains taxes to 39.6% from 20% on households earning more than $1 million (bringing the effective rate to 43.4% after factoring in the Affordable Care Act’s surtax), raise the highest marginal tax rate bracket to 39.6% from 37% (while lowering that tax band to $400,000) and eliminate certain tax provisions including the cost-basis step up on inherited assets, carried interest and tax-deferred “1031 exchanges” on real estate transactions with profits over $500,000.
In June, a bipartisan group of senators reached an agreement on the infrastructure plan, but passage is far from assured. Beyond that, the proposed package has shrunk considerably from what President Biden initially envisioned. New spending would be just $579 billion, less than a third of the original proposal. This is because the evenly split 10 Senate Republicans and Democrats behind the effort could agree only on “physical” infrastructure like roads and bridges and not the progressive definitions including climate change mitigation and child or elderly care measures. While the group settled on what infrastructure to spend on, how to fund it remains an open question, but even agreement there would still leave deep divisions. Progressive Democrats want the bipartisan deal tied to a “human infrastructure” mega-bill passed via budget reconciliation or they won’t support it. However, if it is linked, then Republicans indicate they would revoke support, sending any infrastructure bill back to the beginning of the process.
FISHER INVESTMENTS INSTITUTIONAL GROUP
U.S. LARGE CAP EQUITY ENVIRONMENTAL AND SOCIAL VALUES FUND
MANAGEMENT’S DISCUSSION OF FUND PERFORMANCE
(Unaudited) – (continued)
Performance Attribution
The Fisher Investments Institutional Group U.S. Large Cap Equity Environmental and Social Values Fund outperformed the S&P 500 Index for the period from September 1, 2020 through August 31, 2021. During this period, the Fund returned 36.46% while the Fund’s primary benchmark, the S&P 500 Index, returned 31.17%. Equity selection contributed to relative return, while sector allocation detracted. Selection within Health Care Equipment & Supplies was the largest contributor to relative return, driven by Align Technology and Intuitive Surgical. Additionally, an overweight to and selection within the category Metals & Mining contributed, as Nucor Corporation outperformed. Conversely, an overweight to and selection within Information Technology was the largest detractor, driven by cloud computing company Salesforce, computer hardware manufacturing conglomerate Intel and credit services company Visa. Further, selection within Consumer Discretionary detracted, driven by internet retailer Amazon and construction retailer Home Depot.
FISHER INVESTMENTS INSTITUTIONAL GROUP
U.S. LARGE CAP EQUITY ENVIRONMENTAL AND SOCIAL VALUES FUND
Investment Results (Unaudited)
| Average Annual Total Returns as of August 31, 2021 (a) | |
| | | | | Since | |
| | | | | Inception | |
| Fund/Index | | One Year | | (7/17/20) | |
| Fisher Investments Institutional Group | | | | | |
| U.S. Large Cap Equity Environmental and Social Values Fund | | 36.46% | | 45.88% | |
| S&P 500 Index(b) | | 31.17% | | 37.22% | |
| | | | | | |
| | | | | Expense | |
| | | | | Ratios(c) | |
| Gross | | | | 90.61% | |
| With Applicable Waivers | | | | 0.47% | |
The performance quoted represents past performance, which does not guarantee future results. The investment return and principal value of an investment will fluctuate so that an investor’s shares, when redeemed, may be worth more or less than their original cost. The returns shown do not reflect deduction of taxes that a shareholder would pay on Fisher Investments Institutional Group U.S. Large Cap Environmental and Social Values Fund (the “Fund”) distributions or the redemption of Fund shares. Current performance of the Fund may be lower or higher than the performance quoted. The Fund’s investment objectives, risks, charges and expenses must be considered carefully before investing. Performance data current to the most recent month end may be obtained by calling (800) 851-8845.
| (a) | Return figures reflect any change in price per share and assume the reinvestment of all distributions. |
| (b) | The S&P 500 Index (“S&P Index”) is a widely recognized unmanaged index of equity securities and is representative of a broader domestic equity market and range of securities than is found in the Fund’s portfolio. Individuals cannot invest directly in the S&P Index; however, an individual can invest in exchange traded funds or other investment vehicles that attempt to track the performance of a benchmark index. |
| (c) | The expense ratios are from the Fund’s prospectus dated December 29, 2020. Fisher Asset Management, LLC, d/b/a Fisher Investments (the “Adviser”) is contractually obligated to limit the Fund’s total annual operating expenses to 0.47% of the Fund’s average daily net assets through December 31, 2024 (excluding portfolio transaction and other investment-related costs (including brokerage fees and commissions); taxes; borrowing costs (such as interest and dividend expenses on securities sold short); acquired fund fees and expenses; certain fees and expenses associated with investments in other collective investment vehicles or derivative instruments (including for example option and swap fees and expenses); any administrative and/ or shareholder servicing fees payable pursuant to a plan adopted by the Board of Trustees; expenses incurred in connection with any merger or reorganization; extraordinary expenses (such as litigation expenses, indemnification of Trust officers and Trustees and contractual indemnification of Fund service providers); and other expenses that the Trustees agree have not been incurred in the ordinary course of the Fund’s business). This expense cap may not be terminated prior to this date except by the Board of Trustees. Each waiver/expense payment by the Adviser is subject to recoupment by the Adviser from the Fund in the three years following the date the particular waiver/expense payment occurred, but only if such recoupment can be achieved without exceeding the annual expense limitation in effect at the time of the waiver/expense payment and any expense limitation in effect at the time of the recoupment. Additional information pertaining to the Fund’s expense ratios as of August 31, 2021 can be found in the financial highlights. |
The Fund’s investment objective, strategies, risks, charges and expenses must be considered carefully before investing. The Fund’s prospectus contains this and other important information about the investment company and may be obtained by calling (800) 851-8845. Please read it carefully before investing.
The Fund is distributed by Ultimus Fund Distributors, LLC, Member FINRA/SIPC.
FISHER INVESTMENTS INSTITUTIONAL GROUP
U.S. LARGE CAP EQUITY ENVIRONMENTAL AND SOCIAL VALUES FUND
Investment Results (Unaudited) – (continued)
Comparison of the Growth of a $10,000 Investment in the Fisher Investments Institutional Group
U.S. Large Cap Equity Environmental and Social Values Fund and the S&P 500 Index (Unaudited)
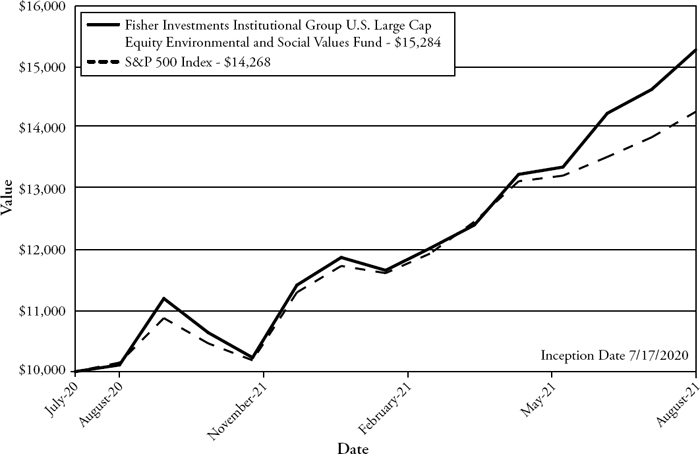
This graph shows the value of a hypothetical initial investment of $10,000 made on July 17, 2020 (commencement of operations) and held through August 31, 2021. S&P 500 Index is a widely recognized unmanaged index of equity securities and is representative of a broader domestic equity market and range of securities than is found in the Fund’s portfolio. Individuals cannot invest directly in an index; however, an individual may invest in exchange traded funds or other investment vehicles that attempt to track the performance of a benchmark index. THE FUND’S RETURN REPRESENTS PAST PERFORMANCE AND DOES NOT GUARANTEE OR PREDICT FUTURE RESULTS. The returns shown do not reflect deduction of taxes that a shareholder would pay on Fund distributions or the redemption of Fund shares. Investment returns and principal values will fluctuate so that an investor’s shares, when redeemed, may be worth more or less than their original cost.
Current performance may be lower or higher than the performance data quoted. For more information on the Fund, and to obtain performance data current to the most recent month-end, or to request a prospectus, please call (800) 851-8845. You should carefully consider the investment objectives, risks, charges and expenses of the Fund before investing. The Fund’s prospectus contains this and other information about the Fund and should be read carefully before investing.
The Fund is distributed by Ultimus Fund Distributors, LLC, member FINRA/SIPC.
FISHER INVESTMENTS INSTITUTIONAL GROUP
U.S. LARGE CAP EQUITY ENVIRONMENTAL AND SOCIAL VALUES FUND
Fund Holdings (Unaudited)

| (a) | As a percentage of net assets. |
The investment objective of the Fund is to seek to outperform, net of fees and expenses, the return of the S&P 500 Index.
Availability of Portfolio Schedule – (Unaudited)
The Fund files its complete schedule of portfolio holdings with the Securities and Exchange Commission (the “SEC”) for the first and third quarters of each fiscal year as an exhibit to its reports on Form N-PORT. The Fund’s Form N-PORT reports are available on the SEC’s website at http://www.sec.gov.
| FISHER INVESTMENTS INSTITUTIONAL GROUP |
| U.S. LARGE CAP EQUITY ENVIRONMENTAL AND SOCIAL VALUES FUND |
| SCHEDULE OF INVESTMENTS |
| August 31, 2021 |
| | | Shares | | | Fair Value | |
| COMMON STOCKS — 106.22% | | | | | | |
| | | | | | | |
| Communications — 10.43% | | | | | | | | |
| Alphabet, Inc., Class A(a) | | | 4 | | | $ | 11,576 | |
| Facebook, Inc., Class A(a) | | | 22 | | | | 8,346 | |
| Netflix, Inc.(a) | | | 7 | | | | 3,984 | |
| | | | | | | | 23,906 | |
| Consumer Discretionary — 8.38% | | | | | | | | |
| Amazon.com, Inc.(a) | | | 3 | | | | 10,412 | |
| Home Depot, Inc. (The) | | | 27 | | | | 8,807 | |
| | | | | | | | 19,219 | |
| Consumer Staples — 1.81% | | | | | | | | |
| Costco Wholesale Corp. | | | 4 | | | | 1,822 | |
| General Mills, Inc. | | | 21 | | | | 1,214 | |
| Kimberly-Clark Corp. | | | 8 | | | | 1,102 | |
| | | | | | | | 4,138 | |
| Energy — 4.47% | | | | | | | | |
| ConocoPhillips | | | 36 | | | | 1,999 | |
| Exxon Mobil Corp. | | | 22 | | | | 1,199 | |
| Halliburton Co. | | | 71 | | | | 1,418 | |
| Hess Corp. | | | 35 | | | | 2,407 | |
| Pioneer Natural Resources Co. | | | 14 | | | | 2,095 | |
| Schlumberger Ltd. | | | 40 | | | | 1,122 | |
| | | | | | | | 10,240 | |
| Financials — 7.23% | | | | | | | | |
| American Express Co. | | | 28 | | | | 4,647 | |
| BlackRock, Inc. | | | 5 | | | | 4,716 | |
| Goldman Sachs Group, Inc. (The) | | | 12 | | | | 4,963 | |
| JPMorgan Chase & Co. | | | 14 | | | | 2,239 | |
| | | | | | | | 16,565 | |
| Health Care — 12.01% | | | | | | | | |
| Abbott Laboratories | | | 20 | | | | 2,527 | |
| Align Technology, Inc.(a) | | | 9 | | | | 6,381 | |
| Amgen, Inc. | | | 6 | | | | 1,353 | |
| Biogen, Inc.(a) | | | 7 | | | | 2,372 | |
| DexCom, Inc.(a) | | | 2 | | | | 1,059 | |
See accompanying notes which are an integral part of these financial statements.
| FISHER INVESTMENTS INSTITUTIONAL GROUP |
| U.S. LARGE CAP EQUITY ENVIRONMENTAL AND SOCIAL VALUES FUND |
| SCHEDULE OF INVESTMENTS – (continued) |
| August 31, 2021 |
| | | Shares | | | Fair Value | |
| COMMON STOCKS — 106.22% - continued | | | | | | |
| | | | | | | |
| Health Care — 12.01% - continued | | | | | | | | |
| IDEXX Laboratories, Inc.(a) | | | 2 | | | $ | 1,348 | |
| Intuitive Surgical, Inc.(a) | | | 5 | | | | 5,268 | |
| Johnson & Johnson | | | 5 | | | | 866 | |
| Medtronic PLC | | | 12 | | | | 1,602 | |
| Merck & Co., Inc. | | | 36 | | | | 2,746 | |
| Organon & Co. | | | 3 | | | | 102 | |
| Pfizer, Inc. | | | 16 | | | | 737 | |
| ResMed, Inc. | | | 4 | | | | 1,162 | |
| Viatris, Inc. | | | 1 | | | | 15 | |
| | | | | | | | 27,538 | |
| Industrials — 5.47% | | | | | | | | |
| 3M Co. | | | 7 | | | | 1,363 | |
| Caterpillar, Inc. | | | 10 | | | | 2,109 | |
| HEICO Corp. | | | 14 | | | | 1,775 | |
| Kansas City Southern | | | 5 | | | | 1,403 | |
| Rockwell Automation, Inc. | | | 10 | | | | 3,255 | |
| Spirit AeroSystems Holdings, Inc., Class A | | | 12 | | | | 471 | |
| United Parcel Service, Inc., Class B | | | 11 | | | | 2,152 | |
| | | | | | | | 12,528 | |
| Materials — 2.05% | | | | | | | | |
| Nucor Corp. | | | 40 | | | | 4,702 | |
| | | | | | | | | |
| Technology — 54.37% | | | | | | | | |
| Adobe, Inc.(a) | | | 11 | | | | 7,301 | |
| Advanced Micro Devices, Inc.(a) | | | 70 | | | | 7,750 | |
| Apple, Inc. | | | 126 | | | | 19,131 | |
| Autodesk, Inc.(a) | | | 14 | | | | 4,341 | |
| Cisco Systems, Inc. | | | 57 | | | | 3,364 | |
| Intel Corp. | | | 69 | | | | 3,730 | |
| Microsoft Corp. | | | 50 | | | | 15,094 | |
| MSCI, Inc. | | | 11 | | | | 6,980 | |
| NVIDIA Corp. | | | 72 | | | | 16,118 | |
| Oracle Corp. | | | 46 | | | | 4,100 | |
| PayPal Holdings, Inc.(a) | | | 36 | | | | 10,392 | |
| QUALCOMM, Inc. | | | 27 | | | | 3,961 | |
| salesforce.com, Inc.(a) | | | 31 | | | | 8,223 | |
See accompanying notes which are an integral part of these financial statements.
| FISHER INVESTMENTS INSTITUTIONAL GROUP |
| U.S. LARGE CAP EQUITY ENVIRONMENTAL AND SOCIAL VALUES FUND |
| SCHEDULE OF INVESTMENTS – (continued) |
| August 31, 2021 |
| | | Shares | | | Fair Value | |
| COMMON STOCKS — 106.22% - continued | | | | | | |
| | | | | | | |
| Technology — 54.37% - continued | | | | | | | | |
| Texas Instruments, Inc. | | | 31 | | | $ | 5,918 | |
| Visa, Inc., Class A | | | 36 | | | | 8,248 | |
| | | | | | | | 124,651 | |
| Total Common Stocks — 106.22% | | | | | | | | |
| (Cost $166,235) | | | | | | | 243,487 | |
| | | | | | | | | |
| MONEY MARKET FUNDS — 0.49% | | | | | | | | |
| First American Government Obligations Fund, X Class, 0.03%(b) | | | 1,121 | | | | 1,121 | |
| | | | | | | | | |
| Total Money Market Funds — 0.49% | | | | | | | | |
| (Cost $1,121) | | | | | | | 1,121 | |
| | | | | | | | | |
| Total Investments — 106.71% | | | | | | | | |
| (Cost $167,356) | | | | | | | 244,608 | |
| | | | | | | | | |
| Liabilities in Excess of Other Assets — (6.71)% | | | | | | | (15,372 | ) |
| | | | | | | | | |
| NET ASSETS — 100.00% | | | | | | $ | 229,236 | |
| (a) | Non-income producing security. |
| (b) | Rate disclosed is the seven day effective yield as of August 31, 2021. |
See accompanying notes which are an integral part of these financial statements.
| FISHER INVESTMENTS INSTITUTIONAL GROUP |
| U.S. LARGE CAP EQUITY ENVIRONMENTAL AND SOCIAL VALUES FUND |
| STATEMENT OF ASSETS AND LIABILITIES |
| August 31, 2021 |
| Assets | | | |
| Investments in securities at fair value (cost $167,356) | | $ | 244,608 | |
| Dividends receivable | | | 191 | |
| Receivable from Adviser | | | 11,346 | |
| Prepaid expenses | | | 4,311 | |
| Total Assets | | | 260,456 | |
| Liabilities | | | | |
| Payable to affiliates | | | 6,145 | |
| Other accrued expenses | | | 25,075 | |
| Total Liabilities | | | 31,220 | |
| Net Assets | | $ | 229,236 | |
| Net Assets consist of: | | | | |
| Paid-in capital | | | 150,515 | |
| Accumulated earnings | | | 78,721 | |
| Net Assets | | $ | 229,236 | |
| Shares outstanding (unlimited number of shares authorized, no par value) | | | 15,044 | |
| Net asset value, offering and redemption price per share | | $ | 15.24 | |
See accompanying notes which are an integral part of these financial statements.
| FISHER INVESTMENTS INSTITUTIONAL GROUP |
| U.S. LARGE CAP EQUITY ENVIRONMENTAL AND SOCIAL VALUES FUND |
| STATEMENT OF OPERATIONS |
| For the year ended August 31, 2021 |
| Investment Income | | | |
| Dividend income | | $ | 1,998 | |
| Interest income | | | 4 | |
| Total investment income | | | 2,002 | |
| Expenses | | | | |
| Administration | | | 40,000 | |
| Audit and tax | | | 18,060 | |
| Legal | | | 17,348 | |
| Trustee | | | 13,983 | |
| Transfer agent | | | 12,000 | |
| Compliance services | | | 12,000 | |
| Report printing | | | 4,494 | |
| Custodian | | | 2,492 | |
| Registration | | | 950 | |
| Pricing | | | 901 | |
| Adviser | | | 750 | |
| Miscellaneous | | | 16,917 | |
| Total expenses | | | 139,895 | |
| Fees waived and expenses reimbursed by Adviser | | | (139,012 | ) |
| Net operating expenses | | | 883 | |
| Net investment income | | | 1,119 | |
| Net Realized and Change in Unrealized Gain (Loss) on Investments | | | | |
| Net realized gain on investment securities transactions | | | 745 | |
| Net change in unrealized appreciation of investment securities | | | 59,421 | |
| Net realized and change in unrealized gain on investments | | | 60,166 | |
| Net increase in net assets resulting from operations | | $ | 61,285 | |
See accompanying notes which are an integral part of these financial statements.
| FISHER INVESTMENTS INSTITUTIONAL GROUP |
| U.S. LARGE CAP EQUITY ENVIRONMENTAL AND SOCIAL VALUES FUND |
| STATEMENTS OF CHANGES IN NET ASSETS |
| | | For the | | | For the | |
| | | Year Ended | | | Period Ended | |
| | | August 31, | | | August 31, | |
| | | 2021 | | | 2020(a) | |
| Increase (Decrease) in Net Assets due to: | | | | | | | | |
| Operations | | | | | | | | |
| Net investment income | | $ | 1,119 | | | $ | 110 | |
| Net realized gain on investment securities transactions | | | 745 | | | | — | |
| Net change in unrealized appreciation of investment securities | | | 59,421 | | | | 17,831 | |
| Net increase in net assets resulting from operations | | | 61,285 | | | | 17,941 | |
| Distributions From: | | | | | | | | |
| Earnings | | | (505 | ) | | | — | |
| Total distributions | | | (505 | ) | | | — | |
| Capital Transactions | | | | | | | | |
| Proceeds from shares sold | | | — | | | | 150,010 | |
| Reinvestment of distributions | | | 505 | | | | — | |
| Net increase in net assets resulting from capital transactions | | | 505 | | | | 150,010 | |
| Total Increase in Net Assets | | | 61,285 | | | | 167,951 | |
| Net Assets | | | | | | | | |
| Beginning of period | | | 167,951 | | | | — | |
| End of period | | $ | 229,236 | | | $ | 167,951 | |
| Share Transactions | | | | | | | | |
| Shares sold | | | — | | | | 15,001 | |
| Shares issued in reinvestment of distributions | | | 43 | | | | — | |
| Net increase in shares | | | 43 | | | | 15,001 | |
| (a) | For the period July 17, 2020 (commencement of operations) to August 31, 2020. |
See accompanying notes which are an integral part of these financial statements.
| FISHER INVESTMENTS INSTITUTIONAL GROUP |
| U.S. LARGE CAP EQUITY ENVIRONMENTAL AND SOCIAL VALUES FUND |
| FINANCIAL HIGHLIGHTS |
| (For a share outstanding during each period) |
| | | For the | | | For the | |
| | | Year Ended | | | Period Ended | |
| | | August 31, | | | August 31, | |
| | | 2021 | | | 2020(a) | |
| Selected Per Share Data: | | | | | | | | |
| Net asset value, beginning of period | | $ | 11.20 | | | $ | 10.00 | |
| Investment operations: | | | | | | | | |
| Net investment income | | | 0.07 | | | | 0.01 | |
| Net realized and unrealized gain | | | 4.00 | | | | 1.19 | |
| Total from investment operations | | | 4.07 | | | | 1.20 | |
| Less distributions from: | | | | | | | | |
| Net investment income | | | (0.03 | ) | | | — | |
| Total distributions | | | (0.03 | ) | | | — | |
| Net asset value, end of period | | $ | 15.24 | | | $ | 11.20 | |
| Total Return(b) | | | 36.46 | % | | | 12.00 | % (c) |
| Ratios and Supplemental Data: | | | | | | | | |
| Net assets, end of period (000 omitted) | | $ | 229 | | | $ | 168 | |
| Ratio of net expenses to average net assets | | | 0.47 | % | | | 0.47 | % (d) |
| Ratio of gross expenses to average net assets before waiver and reimbursement | | | 74.51 | % | | | 185.76 | % (d) |
| Ratio of net investment income to average net assets | | | 0.60 | % | | | 0.60 | % (d) |
| Portfolio turnover rate | | | 9 | % | | | — | % (c) |
| (a) | For the period July 17, 2020 (commencement of operations) to August 31, 2020. |
| (b) | Total return represents the rate that the investor would have earned or lost on an investment in the Fund, assuming reinvestment of distributions. |
See accompanying notes which are an integral part of these financial statements.
FISHER INVESTMENTS INSTITUTIONAL GROUP
U.S. LARGE CAP EQUITY ENVIRONMENTAL AND SOCIAL VALUES FUND
NOTES TO THE FINANCIAL STATEMENTS
August 31, 2021
NOTE 1. ORGANIZATION
Fisher Investments Institutional Group U.S. Large Cap Equity Environmental and Social Values Fund (the “Fund”) is registered under the Investment Company Act of 1940, as amended (“1940 Act”), as a diversified series of Unified Series Trust (the “Trust”) on November 12, 2018. The Trust is an open-end investment company established under the laws of Ohio by an Agreement and Declaration of Trust dated October 14, 2002 (the “Trust Agreement”). The Trust Agreement permits the Board of Trustees of the Trust (the “Board”) to issue an unlimited number of shares of beneficial interest of separate series without par value. The Fund is one of a series of funds currently authorized by the Board. The Fund commenced operations on July 17, 2020. The investment adviser to the Fund is Fisher Asset Management, LLC, d/b/a Fisher Investments (the “Adviser”). The investment objective of the Fund is to seek to outperform, net of fees and expenses, the return of the S&P 500 Index.
NOTE 2. SIGNIFICANT ACCOUNTING POLICIES
The Fund is an investment company and follows accounting and reporting guidance under Financial Accounting Standards Board Accounting Standards Codification (“ASC”) Topic 946, “Financial Services-Investment Companies.” The following is a summary of significant accounting policies followed by the Fund in the preparation of its financial statements. These policies are in conformity with generally accepted accounting principles in the United States of America (“GAAP”).
Estimates – The preparation of financial statements in conformity with GAAP requires management to make estimates and assumptions that affect the reported amounts of assets and liabilities and disclosure of contingent assets and liabilities at the date of the financial statements and the reported amounts of increases and decreases in net assets from operations during the reporting period. Actual results could differ from those estimates.
Federal Income Taxes – The Fund makes no provision for federal income or excise tax. The Fund has qualified and intends to qualify each year as a regulated investment company (“RIC”) under subchapter M of the Internal Revenue Code of 1986, as amended, by complying with the requirements applicable to RICs and by distributing substantially all of its taxable income. The Fund also intends to distribute sufficient net investment income and net realized capital gains, if any, so that it will not be subject to excise tax on undistributed income and gains. If the required amount of net investment income or gains is not distributed, the Fund could incur a tax expense.
FISHER INVESTMENTS INSTITUTIONAL GROUP
U.S. LARGE CAP EQUITY ENVIRONMENTAL AND SOCIAL VALUES FUND
NOTES TO THE FINANCIAL STATEMENTS – (continued)
August 31, 2021
NOTE 2. SIGNIFICANT ACCOUNTING POLICIES – continued
As of and during the fiscal year ended August 31, 2021, the Fund did not have any liabilities for any unrecognized tax benefits. The Fund recognizes interest and penalties, if any, related to unrecognized tax benefits as income tax expense on the Statement of Operations when incurred. During the fiscal year ended August 31, 2021, the Fund did not incur any interest or penalties. Management of the Fund has reviewed tax positions taken in tax years that remain subject to examination by all major tax jurisdictions, including federal (i.e., the last three tax year ends and the interim tax period since then, as applicable). Management believes that there is no tax liability resulting from unrecognized tax benefits related to uncertain tax positions taken.
Expenses – Expenses incurred by the Trust that do not relate to a specific fund of the Trust are allocated to the individual funds based on each fund’s relative net assets or another appropriate basis (as determined by the Board).
Security Transactions and Related Income – The Fund follows industry practice and records security transactions on the trade date for financial reporting purposes. The specific identification method is used for determining gains or losses for financial statements and income tax purposes. Dividend income is recorded on the ex-dividend date and interest income is recorded on an accrual basis. Withholding taxes on foreign dividends and related reclaims have been provided for in accordance with the Fund’s understanding of the applicable country’s tax rules and rates.
Dividends and Distributions – The Fund intends to distribute its net investment income and net realized long-term and short-term capital gains, if any, at least annually. Dividends and distributions to shareholders, which are determined in accordance with income tax regulations, are recorded on the ex-dividend date. The treatment for financial reporting purposes of distributions made to shareholders during the period from net investment income or net realized capital gains may differ from their ultimate treatment for federal income tax purposes. These differences are caused primarily by differences in the timing of the recognition of certain components of income, expense or realized capital gain for federal income tax purposes. Where such differences are permanent in nature, they are reclassified among the components of net assets based on their ultimate characterization for federal income tax purposes. Any such reclassifications will have no effect on net assets, results of operations or net asset value (“NAV”) per share of the Fund.
FISHER INVESTMENTS INSTITUTIONAL GROUP
U.S. LARGE CAP EQUITY ENVIRONMENTAL AND SOCIAL VALUES FUND
NOTES TO THE FINANCIAL STATEMENTS – (continued)
August 31, 2021
NOTE 3. SECURITIES VALUATION AND FAIR VALUE MEASUREMENTS
The Fund values its portfolio securities at fair value as of the close of regular trading on the New York Stock Exchange (“NYSE”) (normally 4:00 p.m. Eastern time) on each business day the NYSE is open for business. Fair value is defined as the price that the Fund would receive upon selling an investment in a timely transaction to an independent buyer in the principal or most advantageous market of the investment. GAAP establishes a three-tier hierarchy to maximize the use of observable market data and minimize the use of unobservable inputs and to establish classification of fair value measurements for disclosure purposes.
Inputs refer broadly to the assumptions that market participants would use in pricing the asset or liability, including assumptions about risk (the risk inherent in a particular valuation technique used to measure fair value including a pricing model and/or the risk inherent in the inputs to the valuation technique). Inputs may be observable or unobservable. Observable inputs are inputs that reflect the assumptions market participants would use in pricing the asset or liability developed based on market data obtained and available from sources independent of the reporting entity. Unobservable inputs are inputs that reflect the reporting entity’s own assumptions about the assumptions market participants would use in pricing the asset or liability developed based on the best information available in the circumstances.
Various inputs are used in determining the value of the Fund’s investments. These inputs are summarized in the three broad levels listed below.
| ● | Level 1 – unadjusted quoted prices in active markets for identical investments and/or registered investment companies where the value per share is determined and published and is the basis for current transactions for identical assets or liabilities at the valuation date |
| ● | Level 2 – other significant observable inputs (including, but not limited to, quoted prices for an identical security in an inactive market, quoted prices for similar securities, interest rates, prepayment speeds, credit risk, etc.) |
| ● | Level 3 – significant unobservable inputs (including the Fund’s own assumptions in determining fair value of investments based on the best information available) |
FISHER INVESTMENTS INSTITUTIONAL GROUP
U.S. LARGE CAP EQUITY ENVIRONMENTAL AND SOCIAL VALUES FUND
NOTES TO THE FINANCIAL STATEMENTS – (continued)
August 31, 2021
NOTE 3. SECURITIES VALUATION AND FAIR VALUE MEASUREMENTS – continued
The inputs used to measure fair value may fall into different levels of the fair value hierarchy. In such cases, for disclosure purposes, the level in the fair value hierarchy which is reported is determined based on the lowest level input that is significant to the fair value measurement in its entirety.
Equity securities that are traded on any stock exchange are generally valued at the last quoted sale price on the security’s primary exchange. Lacking a last sale price, an exchange-traded security is generally valued at its last bid price. Securities traded in the NASDAQ over-the-counter market are generally valued at the NASDAQ Official Closing Price. When using market quotations and when the market is considered active, the security is classified as a Level 1 security. In the event that market quotations are not readily available or are considered unreliable due to market or other events, the Fund values its securities and other assets at fair value in accordance with policies established by and under the general supervision of the Board. Under these policies, the securities will be classified as Level 2 or 3 within the fair value hierarchy, depending on the inputs used.
Investments in mutual funds, including money market mutual funds, are generally priced at the ending NAV provided by the service agent of the mutual funds. These securities are categorized as Level 1 securities.
In accordance with the Trust’s valuation policies, the Adviser is required to consider all appropriate factors relevant to the value of securities for which it has determined other pricing sources are not available or reliable as described above. No single method exists for determining fair value, because fair value depends upon the circumstances of each individual case. As a general principle, the current fair value of a security being valued by the Adviser would be the amount that the Fund might reasonably expect to receive upon the current sale. Methods that are in accordance with this principle may, for example, be based on (i) a multiple of earnings; (ii) a discount from market prices of a similar freely traded security (including a derivative security or a basket of securities traded on other markets, exchanges or among dealers); or (iii) yield to maturity with respect to debt issues, or a combination of these and other methods. Fair-value pricing is permitted if, in the Adviser’s opinion, the validity of market quotations appears to be questionable based on factors such as evidence of a thin market in the security based
FISHER INVESTMENTS INSTITUTIONAL GROUP
U.S. LARGE CAP EQUITY ENVIRONMENTAL AND SOCIAL VALUES FUND
NOTES TO THE FINANCIAL STATEMENTS – (continued)
August 31, 2021
NOTE 3. SECURITIES VALUATION AND FAIR VALUE MEASUREMENTS – continued
on a small number of quotations, a significant event occurs after the close of a market but before the Fund’s NAV calculation that may affect a security’s value, or the Adviser is aware of any other data that calls into question the reliability of market quotations.
The following is a summary of the inputs used to value the Fund’s investments as of August 31, 2021:
| | | Valuation Inputs | |
| | | Level 1 | | | Level 2 | | | Level 3 | | | Total | |
| Assets | | $ | 243,487 | | | $ | — | | | $ | — | | | $ | 243,487 | |
| Common Stocks(a) | | | | | | | | | | | | | | | | |
| Money Market Funds | | | 1,121 | | | | — | | | | — | | | | 1,121 | |
| Total | | $ | 244,608 | | | $ | — | | | $ | — | | | $ | 244,608 | |
| (a) | Refer to Schedule of Investments for sector classifications. |
The Fund did not hold any investments at the end of the reporting period for which significant unobservable inputs (Level 3) were used in determining fair value; therefore, no reconciliation of Level 3 securities is included for this reporting period. The Fund did not hold any derivative instruments during the reporting period.
NOTE 4. FEES AND OTHER TRANSACTIONS WITH AFFILIATES
The Adviser, under the terms of the management agreement (the “Agreement”) with the Trust with respect to the Fund, manages the Fund’s investments. As compensation for its management services, the Fund is obligated to pay the Adviser a fee computed and accrued daily and paid monthly at an annual rate of 0.40% of the Fund’s average daily net assets. For the fiscal year ended August 31, 2021, the Adviser earned fees of $750 from the Fund before the waiver and reimbursement described below.
The Adviser is contractually obligated to limit the Fund’s total annual operating expenses to 0.47% of the Fund’s average daily net assets through December 31, 2024 (excluding portfolio transaction and other investment-related costs (including brokerage fees and commissions); taxes; borrowing costs (such as interest and dividend expenses on securities sold short); acquired fund fees and expenses; fees and expenses associated with investments in other collective investment vehicles or derivative instruments (including for example option and swap fees and expenses);
FISHER INVESTMENTS INSTITUTIONAL GROUP
U.S. LARGE CAP EQUITY ENVIRONMENTAL AND SOCIAL VALUES FUND
NOTES TO THE FINANCIAL STATEMENTS – (continued)
August 31, 2021
NOTE 4. FEES AND OTHER TRANSACTIONS WITH AFFILIATES - continued
any amounts payable pursuant to a distribution or service plan adopted in accordance with Rule 12b-1 under the 1940 Act; any administrative and/or shareholder servicing fees payable to financial intermediaries; expenses incurred in connection with any merger or reorganization; extraordinary expenses (such as litigation expenses, indemnification of Trust officers and Trustees and contractual indemnification of Fund service providers); and other expenses that the Trustees agree have not been incurred in the ordinary course of the Fund’s business. This expense cap may not be terminated prior to this date except by the Board of Trustees. For the fiscal year ended August 31, 2021, the Adviser waived fees and reimbursed expenses in the amount of $139,012 for the Fund. At August 31, 2021, the Adviser owed the Fund $11,346.
Each waiver/expense payment by the Adviser is subject to recoupment by the Adviser from the Fund in the three years following the date the particular expense payment occurred, but only if such recoupment can be achieved without exceeding the annual expense limitation in effect at the time of the expense payment and any expense limitation in effect at the time of the recoupment. As of August 31, 2021, the Adviser may seek repayment of expense reimbursements in the amount as follows:
| Recoverable through | | | |
| August 31, 2023 | | $ | 33,995 | |
| August 31, 2024 | | | 139,012 | |
Ultimus Fund Solutions, LLC (“Ultimus”) provides administration, fund accounting and transfer agent services to the Fund. The Fund pays Ultimus fees in accordance with the agreements for such services.
Northern Lights Compliance Services, LLC (“NLCS”), an affiliate of Ultimus, provides a Chief Compliance Officer to the Trust, as well as related compliance services, pursuant to a consulting agreement between NLCS and the Trust. Under the terms of such agreement, NLCS receives fees from the Fund, which are approved annually by the Board. Prior to April 1, 2021, Ultimus provided certain compliance services and Buttonwood Compliance Partners provided the Chief Compliance Officer to the Trust.
FISHER INVESTMENTS INSTITUTIONAL GROUP
U.S. LARGE CAP EQUITY ENVIRONMENTAL AND SOCIAL VALUES FUND
NOTES TO THE FINANCIAL STATEMENTS – (continued)
August 31, 2021
NOTE 4. FEES AND OTHER TRANSACTIONS WITH AFFILIATES – continued
Under the terms of a Distribution Agreement with the Trust, Ultimus Fund Distributors, LLC (the “Distributor”) serves as principal underwriter to the Fund. The Distributor is a wholly-owned subsidiary of Ultimus. The Distributor is compensated by the Adviser (not the Fund) for acting as principal underwriter.
Certain officers and a Trustee of the Trust are also employees of Ultimus and are not paid by the Fund for serving in such capacities.
The Board supervises the business activities of the Trust. Each Trustee serves as a trustee until termination of the Trust unless the Trustee dies, resigns, retires, or is removed. The Chairman of the Board and more than 75% of the Trustees are “Independent Trustees,” which means that they are not “interested persons” as defined in the 1940 Act. Each Independent Trustee of the Trust receives annual compensation of $2,510 per fund from the Trust, except that the Chairman of the Audit Committee, the Chairman of the Governance & Nominating Committee, and the Chairman of the Pricing & Liquidity Committee each receives annual compensation of $2,960 per fund from the Trust, and the Independent Chairman of the Board receives $3,160 per fund from the Trust. Independent Trustees also receive $250 for the first hour and $200 for each additional hour for attending special meetings. Prior to January 1, 2021, these fees were $2,290 for non-chairmen and $2,740 for all chairmen. In addition, the Trust reimburses Independent Trustees for out-of-pocket expenses incurred in conjunction with attendance at meetings.
NOTE 5. INVESTMENT TRANSACTIONS
For the fiscal year ended August 31, 2021, purchases and sales of investment securities, other than short-term investments, were $32,842 and $18,231, respectively.
There were no purchases or sales of long-term U.S. government obligations during the fiscal year ended August 31, 2021.
NOTE 6. BENEFICIAL OWNERSHIP
The beneficial ownership, either directly or indirectly, of more than 25% of the voting securities of a fund creates a presumption of control of a fund, under Section 2(a)(9) of the 1940 Act. As of August 31, 2021, the Adviser owned 99.99% of the Fund’s outstanding shares. As a result, the Adviser may be deemed to control the Fund.
FISHER INVESTMENTS INSTITUTIONAL GROUP
U.S. LARGE CAP EQUITY ENVIRONMENTAL AND SOCIAL VALUES FUND
NOTES TO THE FINANCIAL STATEMENTS – (continued)
August 31, 2021
NOTE 7. FEDERAL TAX INFORMATION
At August 31, 2021, the net unrealized appreciation (depreciation) and tax cost of investments for tax purposes was as follows:
| Gross unrealized appreciation | | $ | 77,967 | |
| Gross unrealized depreciation | | | (748 | ) |
| Net unrealized appreciation on investments | | $ | 77,219 | |
| Tax cost of investments | | $ | 167,389 | |
The tax character of distributions paid for the fiscal year ended August 31, 2021 was as follows:
| Distributions paid from: | | | | |
| Ordinary income(a) | | $ | 505 | |
| Total distributions paid | | $ | 505 | |
| (a) | Short-term capital gain distributions are treated as ordinary income for tax purposes. |
At August 31, 2021, the components of accumulated earnings (deficit) on a tax basis were as follows:
| Undistributed ordinary income | | $ | 1,450 | |
| Undistributed long-term capital gains | | | 52 | |
| Unrealized appreciation on investments | | | 77,219 | |
| Total accumulated earnings | | $ | 78,721 | |
NOTE 8. SECTOR RISK
If the Fund has significant investments in the securities of issuers within a particular sector, any development affecting that sector will have a greater impact on the value of the net assets of the Fund than would be the case if the Fund did not have significant investments in that sector. In addition, this may increase the risk of loss in the Fund and increase the volatility of the Fund’s NAV per share. For instance, economic or market factors, regulatory changes or other developments may negatively impact all companies in a particular sector, and therefore the value of the Fund’s portfolio will be adversely affected. As of August 31, 2021, the Fund had 54.37% of the value of its net assets invested in stocks within the Technology sector.
FISHER INVESTMENTS INSTITUTIONAL GROUP
U.S. LARGE CAP EQUITY ENVIRONMENTAL AND SOCIAL VALUES FUND
NOTES TO THE FINANCIAL STATEMENTS – (continued)
August 31, 2021
NOTE 9. COMMITMENTS AND CONTINGENCIES
The Trust indemnifies its officers and Trustees for certain liabilities that may arise from their performance of their duties to the Trust or the Fund. Additionally, in the normal course of business, the Trust enters into contracts that contain a variety of representations and warranties which provide general indemnifications. The Trust’s maximum exposure under these arrangements is unknown, as this would involve future claims that may be made against the Trust that have not yet occurred.
NOTE 10. SUBSEQUENT EVENTS
Management of the Fund has evaluated the need for disclosures and/or adjustments resulting from subsequent events through the date at which these financial statements were issued. Based upon this evaluation, management has determined there were no items requiring adjustment of the financial statements or additional disclosure.
REPORT OF INDEPENDENT REGISTERED PUBLIC ACCOUNTING FIRM
To the Shareholders of Fisher Investments Institutional Group Fund Family and Board of Trustees of Unified Series Trust
Opinion on the Financial Statements
We have audited the accompanying statement of assets and liabilities, including the schedule of investments, of Fisher Investments Institutional Group U.S. Large Cap Equity Environmental and Social Values Fund (the “Fund”), a series of Unified Series Trust, as of August 31, 2021, the related statement of operations for the year then ended, and the statements of changes in net assets, the related notes, and the financial highlights for each of the two periods in the period then ended (collectively referred to as the “financial statements”). In our opinion, the financial statements present fairly, in all material respects, the financial position of the Fund as of August 31, 2021, the results of its operations for the year then ended, and the changes in net assets and the financial highlights for each of the two periods in the period then ended, in conformity with accounting principles generally accepted in the United States of America.
Basis for Opinion
These financial statements are the responsibility of the Fund’s management. Our responsibility is to express an opinion on the Fund’s financial statements based on our audits. We are a public accounting firm registered with the Public Company Accounting Oversight Board (United States) (“PCAOB”) and are required to be independent with respect to the Fund in accordance with the U.S. federal securities laws and the applicable rules and regulations of the Securities and Exchange Commission and the PCAOB.
We conducted our audits in accordance with the standards of the PCAOB. Those standards require that we plan and perform the audit to obtain reasonable assurance about whether the financial statements are free of material misstatement whether due to error or fraud.
Our audits included performing procedures to assess the risks of material misstatement of the financial statements, whether due to error or fraud, and performing procedures that respond to those risks. Such procedures included examining, on a test basis, evidence regarding the amounts and disclosures in the financial statements. Our procedures included confirmation of securities owned as of August 31, 2021, by correspondence with the custodian. Our audits also included evaluating the accounting principles used and significant estimates made by management, as well as evaluating the overall presentation of the financial statements. We believe that our audits provide a reasonable basis for our opinion.
We have served as the auditor of one or more investment companies advised by Fisher Asset Management, LLC since 2017.
COHEN & COMPANY, LTD.
Chicago, Illinois
October 28, 2021
SUMMARY OF FUND EXPENSES (Unaudited)
As a shareholder of the Fund, you incur two types of costs: (1) transaction and (2) ongoing costs, including management fees and other Fund expenses. These examples are intended to help you understand your ongoing costs (in dollars) of investing in the Fund and to compare these costs with the ongoing costs of investing in other mutual funds. The example is based on an investment of $1,000 invested at the beginning of the period and held for the entire period from March 1, 2021 through August 31, 2021.
Actual Expenses
The first line of the table below provides information about actual account values and actual expenses. You may use the information in this line, together with the amount you invested, to estimate the expenses that you paid over the period. Simply divide your account value by $1,000 (for example, an $8,600 account value divided by $1,000 = 8.6), then multiply the result by the number in the first line under the heading entitled “Expenses Paid During the Period” to estimate the expenses you paid on your account during this period.
Hypothetical Example for Comparison Purposes
The second line of the table below provides information about hypothetical account values and hypothetical expenses based on the Fund’s actual expense ratio and an assumed rate of return of 5% per year before expenses, which is not the Fund’s actual return. The hypothetical account values and expenses may not be used to estimate the actual ending account balance or expenses you paid for the period. You may use this information to compare the ongoing costs of investing in the Fund and other funds. To do so, compare this 5% hypothetical example with the 5% hypothetical examples that appear in the shareholder reports of other funds.
| | | Beginning | | Ending | | Expenses | | |
| | | Account Value | | Account Value | | Paid | | Annualized |
| | | March 1, | | August 31, | | During the | | Expense |
| | | 2021 | | 2021 | | Period(a) | | Ratio |
| Actual | | $ 1,000.00 | | $ 1,271.10 | | $ 2.69 | | 0.47% |
| Hypothetical(b) | | $ 1,000.00 | | $ 1,022.84 | | $ 2.40 | | 0.47% |
| (a) | Expenses are equal to the Fund’s annualized expense ratios, multiplied by the average account value over the period, multiplied by 184/365 (to reflect the one-half year period). |
| (b) | Hypothetical assumes 5% annual return before expenses. |
ADDITIONAL FEDERAL INCOME TAX INFORMATION (Unaudited)
The Form 1099-DIV you receive in January 2022 will show the tax status of all distributions paid to your account in calendar year 2021. Shareholders are advised to consult their own tax adviser with respect to the tax consequences of their investment in the Fund. As required by the Internal Revenue Code and/or regulations, shareholders must be notified regarding the status of qualified dividend income for individuals and the dividends received deduction for corporations.
Qualified Dividend Income. The Fund designates approximately 78.22% or up to the maximum amount of such dividends allowable pursuant to the Internal Revenue Code, as qualified dividend income eligible for a reduced tax rate.
Qualified Business Income. The Fund designates approximately 0% of its ordinary income dividends, or up to the maximum amount of such dividends allowable pursuant to the Internal Revenue Code, as qualified business income.
Dividends Received Deduction. Corporate shareholders are generally entitled to take the dividends received deduction on the portion of the Fund’s dividend distribution that qualifies under tax law. For the Fund’s calendar year 2021 ordinary income dividends, 100% qualifies for the corporate dividends received deduction.
TRUSTEES AND OFFICERS (Unaudited)
GENERAL QUALIFICATIONS. The Board supervises the business activities of the Trust. Each Trustee serves as a trustee until termination of the Trust unless the Trustee dies, resigns, retires, or is removed. The Chairman of the Board and more than 75% of the Trustees are “Independent Trustees,” which means that they are not “interested persons” (as defined in the 1940 Act) of the Trust or any adviser, sub-adviser or distributor of the Trust.
The following table provides information regarding the Independent Trustees.
Name, Address*,
(Year of Birth),
Position with Trust**,
Term of Position
with Trust | Principal Occupation During Past 5 Years and Other Directorships |
Kenneth G.Y. Grant (1949) Chairman, January 2017 to present; Independent Trustee, May 2008 to present | Current: Director, Standpoint Multi-Asset (Cayman) Fund, Ltd. (2019 – present); Director, Advisors Charitable Gift Fund (2020 – present), a Donor Advised Fund. Previous: EVP, Benefit Plans Administrative Services, Inc., provider of retirement benefit plans administration (2019 – 2020); Director, Northeast Retirement Services (NRS) LLC, a transfer agent and fund administrator; and Director, Global Trust Company (GTC), a non-depository trust company sponsoring private investment product (2003 – 2019); EVP, NRS (2003 – 2019); GTC, EVP (2008 – 2019); EVP, Savings Banks Retirement Association (2003 – 2019), provider of qualified retirement benefit plans. |
Daniel J. Condon (1950) Chairman of the Audit Committee; Chairman of the Governance & Nominating Committee; Independent Trustee, December 2002 to present | Current: Retired (2017 – present) |
Gary E. Hippenstiel (1947) Chairman of the Pricing & Liquidity Committee; Independent Trustee, December 2002 to present | Current: President and founder of Hippenstiel Investment Counsel LLC (“Hippenstiel”) since 2008. Hippenstiel was registered as an investment adviser from 2008 to December 31, 2019. |
TRUSTEES AND OFFICERS (Unaudited) – (continued)
Name, Address*,
(Year of Birth),
Position with Trust**,
Term of Position
with Trust | Principal Occupation During Past 5 Years and Other Directorships |
Stephen A. Little (1946) Independent Trustee, December 2002 to present; Chairman, December 2004 to December 2016 | Current: President and founder of The Rose, Inc., a registered investment adviser, since 1993. |
Ronald C. Tritschler (1952) Independent Trustee, January 2007 to present; Interested Trustee, December 2002 to December 2006 | Current: Chief Executive Officer, Director and Legal Counsel of The Webb Companies, a national real estate company, since 2001; Director, Standpoint Multi-Asset (Cayman) Fund, Ltd. (2020 – present). |
| * | The address for each Trustee is 225 Pictoria Drive, Suite 450, Cincinnati, Ohio 45246. |
| ** | As of the date of this report, the Trust consists of 21 series. |
The following table provides information regarding the Interested Trustee and the Officers of the Trust.
Name, Address*,
(Year of Birth),
Position with Trust,
Term of Position
with Trust | Principal Occupation During Past 5 Years and Other Directorships |
David R. Carson (1958) President, January 2016 to August 2021; Interested Trustee, August 2020 to present | Current: Senior Vice President Client Strategies of Ultimus Fund Solutions, LLC, since 2013; Interested Trustee of Ultimus Managers Trust, since 2020. |
Zachary P. Richmond (1980) Treasurer and Chief Financial Officer, November 2014 to present | Current: Vice President, Director of Financial Administration for Ultimus Fund Solutions, LLC, since 2015. |
TRUSTEES AND OFFICERS (Unaudited) – (continued)
Name, Address*,
(Year of Birth),
Position with Trust,
Term of Position
with Trust | Principal Occupation During Past 5 Years and Other Directorships |
Martin R. Dean (1963) President, August 2021 to present; Vice President, November 2020 to August 2021; Chief Compliance Officer, April 2021 to August 2021; Assistant Chief Compliance Officer, January 2016 to April 2021 | Current: Senior Vice President, Head of Fund Compliance of Ultimus Fund Solutions, LLC, since 2016. |
Gweneth K. Gosselink (1955) Chief Compliance Officer, August 2021 to present | Current: Assistant Vice President, Senior Compliance Officer of Ultimus Fund Solutions, LLC, since 2019. Previous: Chief Operating Officer & CCO at Miles Capital, Inc. (2013 – 2019). |
Elisabeth Dahl (1962) Secretary, May 2017 to present; Assistant Secretary, March 2016 to May 2017 | Current: Attorney, Ultimus Fund Solutions, LLC since March 2016. |
Stephen Preston (1966) AML Compliance Officer, May 2017 to present | Current: Vice President and Chief Compliance Officer, Ultimus Fund Solutions, LLC and Ultimus Fund Distributors, LLC, since 2011. |
Lynn E. Wood (1946) Assistant Chief Compliance Officer, April 2021 to present; Chief Compliance Officer, October 2004 to April 2021 | Current: Managing Member, Buttonwood Compliance Partners, LLC, since 2013. |
| * | The address for each Officer is 225 Pictoria Drive, Suite 450, Cincinnati, Ohio 45246. |
| PRIVACY NOTICE | Rev. January 2020 |
| FACTS | WHAT DOES FISHER INVESTMENTS INSTITUTIONAL GROUP U.S. LARGE CAP EQUITY ENVIRONMENTAL AND SOCIAL VALUES FUND (THE “FUND”) DO WITH YOUR PERSONAL INFORMATION? |
| Why? | Financial companies choose how they share your personal information. Federal law gives consumers the right to limit some but not all sharing. Federal law also requires us to tell you how we collect, share, and protect your personal information. Please read this notice carefully to understand what we do. |
| What? | The types of personal information we collect and share depend on the product or service you have with us. This information can include: ■ Social Security number ■ account balances and account transactions ■ transaction or loss history and purchase history When you are no longer our customer, we continue to share your information as described in this notice. |
| How? | All financial companies need to share customers’ personal information to run their everyday business. In the section below, we list the reasons financial companies can share their customers’ personal information; the reasons the Fund chooses to share; and whether you can limit this sharing. |
| Reasons we can share your personal information | Does the
Fund share? | Can you limit
this sharing? |
For our everyday business purposes— such as to process your transactions, maintain your account(s), respond to court orders and legal investigations, or report to credit bureaus | Yes | No |
For our marketing purposes— to offer our products and services to you | No | We don’t share |
| For joint marketing with other financial companies | No | We don’t share |
For our affiliates’ everyday business purposes— information about your transactions and experiences | No | We don’t share |
For our affiliates’ everyday business purposes— information about your creditworthiness | No | We don’t share |
| For nonaffiliates to market to you | No | We don’t share |
| Questions? | Call (800) 851-8845 |
| Who we are |
| Who is providing this notice? | Fisher Investments Institutional Group U.S. Large Cap Equity Environmental and Social Values Fund Ultimus Fund Distributors, LLC (Distributor) Ultimus Fund Solutions, LLC (Administrator) |
| What we do |
| How does the Fund protect my personal information? | To protect your personal information from unauthorized access and use, we use security measures that comply with federal law. These measures include computer safeguards and secured files and buildings. Our service providers are held accountable for adhering to strict policies and procedures to prevent any misuse of your nonpublic personal information. |
| How does the Fund collect my personal information? | We collect your personal information, for example, when you ■ open an account or deposit money ■ make deposits or withdrawals from your account or provide account information We also collect your personal information from other companies. |
| Why can’t I limit all sharing? | Federal law gives you the right to limit only ■ sharing for affiliates’ everyday business purposes — information about your creditworthiness ■ affiliates from using your information to market to you ■ sharing for nonaffiliates to market to you State laws and individual companies may give you additional rights to limit sharing. |
| Definitions |
| Affiliates | Companies related by common ownership or control. They can be financial and nonfinancial companies. ■ Fisher Asset Management, LLC, d/b/a Fisher Investments, the investment adviser to the Fund, could be deemed to be an affiliate. |
| Nonaffiliates | Companies not related by common ownership or control. They can be financial and nonfinancial companies. ■ The Fund does not share your personal information with nonaffiliates so they can market to you. |
| Joint marketing | A formal agreement between nonaffiliated financial companies that together market financial products or services to you. ■ The Fund doesn’t jointly market. |
This page intentionally left blank.
This page intentionally left blank.
OTHER INFORMATION (Unaudited)
The Fund’s Statement of Additional Information (“SAI”) includes additional information about the trustees and is available without charge, upon request. You may call toll-free at (800) 851-8845 to request a copy of the SAI or to make shareholder inquiries.
PROXY VOTING
A description of the policies and procedures that the Fund uses to determine how to vote proxies relating to portfolio securities and information regarding how the Fund voted those proxies during the most recent twelve month period ended June 30, are available (1) without charge upon request by calling the Fund at (800) 851-8845 and (2) in Fund documents filed with the Securities and Exchange Commission (“SEC”) on the SEC’s website at www.sec.gov.
| TRUSTEES | INDEPENDENT REGISTERED |
| Kenneth G.Y. Grant, Chairman | PUBLIC ACCOUNTING FIRM |
| David R. Carson | Cohen & Company, Ltd. |
| Daniel J. Condon | 151 N Franklin Street, Suite 575 |
| Gary E. Hippenstiel | Chicago, IL 60606 |
| Stephen A. Little | |
| Ronald C. Tritschler | LEGAL COUNSEL |
| | Thompson Hine LLP |
| OFFICERS | 312 Walnut Street, 20th Floor |
| Martin R. Dean, President | Cincinnati, OH 45202 |
| Gweneth K. Gosselink, | |
| Chief Compliance Officer | CUSTODIAN |
| Zachary P. Richmond, | U.S. Bank, N.A. |
| Treasurer and Chief Financial Officer | 425 Walnut Street |
| Lynn E. Wood, | Cincinnati, OH 45202 |
| Assistant Chief Compliance Officer | |
| | ADMINISTRATOR, TRANSFER |
| INVESTMENT ADVISER | AGENT AND FUND ACCOUNTANT |
| Fisher Asset Management, LLC | Ultimus Fund Solutions, LLC |
| 5525 NW Fisher Creek Drive | 225 Pictoria Drive, Suite 450 |
| Camas, WA 98607 | Cincinnati, OH 45246 |
| | |
| DISTRIBUTOR | |
| Ultimus Fund Distributors, LLC | |
| 225 Pictoria Drive, Suite 450 | |
| Cincinnati, OH 45246 | |
This report is intended only for the information of shareholders or those who have received the Fund’s prospectus which contains information about the Fund’s management fee and expenses. Please read the prospectus carefully before investing.
Distributed by Ultimus Fund Distributors, LLC
Member FINRA/SIPC
Fisher2-AR-21
Item 2. Code of Ethics.
As of the end of the period covered by this report, the registrant has adopted a code of ethics that applies to the registrant’s principal executive officer, principal financial officer, principal accounting officer or controller, or persons performing similar functions, regardless of whether these individuals are employed by the registrant or a third party. Pursuant to Item 12(a)(1), a copy of registrant’s code of ethics is filed as an exhibit to this Form N-CSR. During the period covered by this report, the code of ethics has not been amended, and the registrant has not granted any waivers, including implicit waivers, from the provisions of the code of ethics.
Item 3. Audit Committee Financial Expert.
(a) The registrant’s board of trustees has determined that the registrant does not have an audit committee financial expert. The committee members and the full Board considered a possibility of adding a member that would qualify as an expert. The audit committee determined that, although none of its members meet the technical definition of an audit committee expert, the committee has sufficient financial expertise to adequately perform its duties under the Audit Committee Charter without the addition of a qualified expert.
Item 4. Principal Accountant Fees and Services.
Tactical Multi-Purpose Fund: FY 2021 $7,500
FY 2020 $7,500
FIIG Retirement Funds FY 2021 $57,200
FY 2020 $57,200
FIIG US Small Cap Equity Fund FY 2021 $13,800
FY 2020 $13,800
FIIG All Foreign Equity Environmental and
Social Values Fund FY 2021 $14,300
FY 2020 $14,300
FIIG US Large Cap Equity
Environmental and Social Values Fund FY 2021 $13,800
FY 2020 $13,800
Tactical Multi-Purpose Fund: FY 2021 $0
FY 2020 $0
FIIG Retirement Funds FY 2021 $0
FY 2020 $0
FIIG US Small Cap Equity Fund FY 2021 $0
FY 2020 $0
FIIG All Foreign Equity Environmental and
Social Values Fund FY 2021 $0
FY 2020 $0
FIIG US Large Cap Equity
Environmental and Social Values Fund FY 2021 $0
FY 2020 $0
Tactical Multi-Purpose Fund: FY 2021 $3,300
FY 2020 $3,300
FIIG Retirement Funds FY 2021 $13,200
FY 2020 $13,200
FIIG US Small Cap Equity Fund FY 2021 $3,300
FY 2020 $3,300
FIIG All Foreign Equity Environmental and
Social Values Fund FY 2021 $3,300
FY 2020 $3,300
FIIG US Large Cap Equity
Environmental and Social Values Fund FY 2021 $3,300
FY 2020 $3,300
Nature of the fees: Preparation of the 1120 RIC and Excise review
Tactical Multi-Purpose Fund: FY 2021 $0
FY 2020 $0
FIIG Retirement Funds FY 2021 $0
FY 2020 $0
FIIG US Small Cap Equity Fund FY 2021 $0
FY 2020 $0
FIIG All Foreign Equity Environmental and
Social Values Fund FY 2021 $0
FY 2020 $0
FIIG US Large Cap Equity
Environmental and Social Values Fund FY 2021 $0
FY 2020 $0
| (e) | (1) Audit Committee’s Pre-Approval Policies |
The Audit Committee Charter requires the Audit Committee to be responsible for the selection, retention or termination of auditors and, in connection therewith, to (i) evaluate the proposed fees and other compensation, if any, to be paid to the auditors, (ii) evaluate the independence of the auditors, (iii) pre-approve all audit services and, when appropriate, any non-audit services provided by the independent auditors to the Trust, (iv) pre-approve, when appropriate, any non-audit services provided by the independent auditors to the Trust's investment adviser, or any entity controlling, controlled by, or under common control with the investment adviser and that provides ongoing services to the Trust if the engagement relates directly to the operations and financial reporting of the Trust, and (v) receive the auditors’ specific representations as to their independence;
| (2) | All of the services described in paragraphs (b) through (d) of Item 4 were pre-approved by the Audit Committee. |
(f) During audit of registrant's financial statements for the most recent fiscal year, less than 50 percent of the hours expended on the principal accountant's engagement were attributed to work performed by persons other than the principal accountant's full-time, permanent employees.
(g) The aggregate non-audit fees billed by the registrant's accountant for services rendered to the registrant, and rendered to the registrant's investment adviser (not including any sub-adviser whose role is primarily portfolio management and is subcontracted with or overseen by another investment adviser), and any entity controlling, controlled by, or under common control with the adviser that provides ongoing services to the registrant:
Registrant Adviser
FY 2021 $ 0 $ 0
FY 2020 $ 0 $ 0
(h) Not applicable. The auditor performed no services for the registrant’s investment adviser or any entity controlling, controlled by, or under common control with the investment adviser that provides ongoing services to the registrant.
Item 5. Audit Committee of Listed Companies. NOT APPLICABLE – applies to listed companies only
Item 6. Schedule of Investments. Schedule filed with Item 1.
Item 7. Disclosure of Proxy Voting Policies and Procedures for Closed-End Management Investment Companies. NOT APPLICABLE – applies to closed-end funds only
Item 8. Portfolio Managers of Closed-End Investment Companies. NOT APPLICABLE – applies to closed-end funds only
Item 9. Purchases of Equity Securities by Closed-End Management Investment Company and Affiliated Purchasers. NOT APPLICABLE – applies to closed-end funds only
Item 10. Submission of Matters to a Vote of Security Holders.
The registrant has not adopted procedures by which shareholders may recommend nominees to the registrant’s board of trustees.
Item 11. Controls and Procedures.
(a) Based on their evaluation of the registrant’s disclosure controls and procedures (as defined in Rule 30a-3(c) under the Investment Company Act of 1940, as amended (the “Act”)) as of a date within 90 days of the filing date of this report, the registrant’s principal executive officer and principal financial
officer have concluded that such disclosure controls and procedures are reasonably designed and are operating effectively to ensure that material information relating to the registrant is made known to them by others within those entities, particularly during the period in which this report is being prepared, and that the information required in filings on Form N-CSR is recorded, processed, summarized, and reported on a timely basis.
(b) There were no significant changes in the registrant’s internal control over financial reporting that occurred during the registrant’s second fiscal quarter of the period covered by this report that have materially affected, or are reasonably likely to materially affect, the registrant’s internal control over financial reporting.
Item 12. Disclosure of Securities Lending Activities for Closed-End Investment Companies.
Not Applicable.
Item 13. Exhibits.
(a) (1) Code is filed herewith
(3) Not Applicable
SIGNATURES
Pursuant to the requirements of the Securities Exchange Act of 1934 and the Investment Company Act of 1940, the registrant has duly caused this report to be signed on its behalf by the undersigned, thereunto duly authorized.
(Registrant) Unified Series Trust
By /s/ Martin R. Dean
Martin R. Dean, President
Date 10/29/2021
Pursuant to the requirements of the Securities Exchange Act of 1934 and the Investment Company Act of 1940, this report has been signed below by the following persons on behalf of the registrant and in the capacities and on the dates indicated.
By /s/ Martin R. Dean
Martin R. Dean, President
Date 10/29/2021
By /s/ Zachary P. Richmond
Zachary P. Richmond, Treasurer
Date 10/29/2021