SECURITIES AND EXCHANGE COMMISSION
Washington, D.C. 20549
FORM 6-K
REPORT ON FOREIGN ISSUER
PURSUANT TO RULE 13a-16 OR 15d-16 OF
THE SECURITIES EXCHANGE ACT OF 1934
Date: Period February, 2004
WMC RESOURCES LTD
ACN 004 184 598
Level 16, IBM Centre
60 City Road
Southbank, Victoria 3006
Australia
Indicate by check mark whether the registrant files or will file annual reports under cover of Form 20-F or Form 40-F.
Form 20-F x Form 40-F ¨
Indicate by check mark whether the registrant by furnishing the information contained in this Form is also thereby furnishing the information to the Commission pursuant to Rule 12g3-2(b) under the Securities Exchange Act of 1934. Yes ¨ No x
If “Yes” is marked, indicate below the file number assigned to the registrant in connection with Rule 12g3-2(b): 82-
This report on Form 6-K includes press releases made during the period January 15, 2004—February 11, 2004 (and includes WMC Resources Ltd’s December 2003 Quarterly Production Report and WMC Resources Ltd’s 2003 Full Year Results).
SIGNATURES
Pursuant to the requirements of the Securities Exchange Act of 1934, the registrant has duly caused this report to be signed on its behalf by the undersigned, thereunto duly authorised.
| WMC RESOURCES LTD | ||
| By: | /s/ R.E. Mallett | |
Name: | R.E. Mallett | |
Title: | Assistant Company Secretary | |
Date: | 12 February 2004 | |

To: The Manager
Announcements
ASX Company Announcements Office
Public Announcement 2004-1
Please find attached for immediate release, Public Announcement 2004-1 covering WMC Resources Ltd’s December 2003 Quarterly Production Report.
A copy of this public announcement will be published on WMC’s web site atwww.wmc.com later this morning.
WMC’s Chief Executive Officer, Mr Andrew Michelmore, will host an audio conference at 11.00am this morning which will be broadcast live from WMC’s web site. A recording of this conference will be available for playback on WMC’s web site this afternoon.
Ross Mallett
Assistant Company Secretary
15 January 2004
WMC Resources Ltd ACN 004 184 598 | ||||
GPO Box 860K Melbourne Vic. 3001 Australia
Level 16 IBM Centre 60 City Road Southbank Vic. 3006 Australia
Tel +61 (0)3 9685 6000 Fax +61 (0)3 9685 6115 | ||||
WMC Resources Ltd
Quarterly Review, Quarter ended 31 December 2003
Safety, health & environment
We regret to advise that Teodosio Gabriel Macumbue, a security guard employed at our Corridor Sands Pilot Plant near Chibuto in Mozambique, was attacked and killed during a robbery in October. We are cooperating with local authorities who are investigating the crime.
The (LT+MT)IFR of 8.5 for the quarter is equal to the best quarterly performance on record. The full year (LT+MT)IFR of 10.9 represents a 5 per cent improvement over 2002.
There were three spills of process materials at Olympic Dam this quarter. While none of these spills caused injury or impact to the environment they were reportable under the South Australian Government’s spill reporting guidelines.
Note: Unless otherwise stated, comparisons contained in this production report are quarter on previous quarter. Statements, particularly those regarding the possible or assumed future performance, production levels, prices, reserves, divestments, growth or other trend projections are or may be forward looking statements. Actual results, actions and developments may differ materially from those expressed or implied by these forward looking statements depending on a variety of factors including known and unknown risks and uncertainties
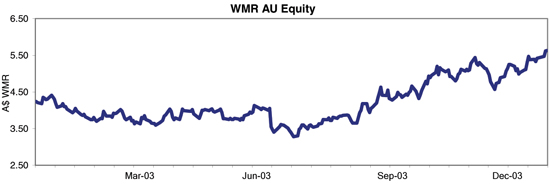
WMC Resources Ltd share price
Overview
Dear Shareholder,
Record production performance from our nickel and fertilizer businesses were highlights for the quarter.
Construction of the copper solvent extraction plant was completed as planned by year end, with commissioning to continue throughout the first quarter of 2004.
The nickel business had another strong quarter with record production of nickel-in-concentrate – up 8% on the September quarter. Excellent second half performance from the Kalgoorlie smelter ensured WMC reached its 2003 target of 99,000 tonnes of nickel-in-matte and quarterly metal production at the Kwinana refinery was at record levels.
Queensland Fertilizer Operations again exceeded design capacity for the quarter with the plant operating at 103 per cent of design capacity. Annual production exceeded the 2003 target by 6 per cent.
Copper production was lower for the quarter following a smelter foam-up and failure of an acid plant heat exchanger. A reliability review was initiated in November, with an initial focus on smelter and acid plant performance at Olympic Dam. Uranium production was in line with the previous quarter.
Major maintenance programs at the Kalgoorlie smelter, Queensland Fertilizer Operations and the Olympic Dam smelter and construction of the copper and uranium solvent extraction plants at Olympic Dam were key milestones completed in 2003.
Looking forward, we remain focused on delivering safe, sustained and consistent production performance into a continuing strong market for our major commodities.

A G MICHELMORE
Chief Executive Officer
15 January 2004
| Quarter ended 31 December 2003 | |
Production overview
Copper & Uranium
The Olympic Dam smelter was recommissioned on 9 October following completion of the planned major maintenance shutdown, with anode production at full rates by late October.
Smelter operations were subsequently interrupted by a foam-up of the furnace bath and failure of a heat exchanger in the acid plant. Uranium production was correspondingly constrained by the shortage of acid for leaching. The combined production impact was approximately 18,000 tonnes of copper and 340 tonnes of uranium.
A review of operational performance at Olympic Dam has been commissioned with an initial focus on the smelter and acid plant. The review will concentrate on plant reliability and improvements necessary for consistent production performance.
Gold production was 12 per cent higher for the quarter.
Mine production increased 13 per cent to record levels equivalent to an annualized rate of 10 million tonnes.
Nickel
Nickel-in-concentrate production increased 8 per cent to record levels for the quarter.
This performance was underpinned by record production at Mount Keith based on continued high ore grades from the bottom of Stage E pit, record throughput and metallurgical recovery (74 per cent).
Production at Leinster increased 6 per cent with higher ore grades and metallurgical recovery. The increase in recovery to over 85 per cent reflects the benefits of improvement projects based on Mount Keith experience and is 4 per cent higher than previously achieved on similar ore blends.
Concentrate production at Kambalda was 13 per cent higher reflecting increased ore deliveries from the operators of nickel mines in the area.
Strong performance continued at the Kalgoorlie smelter with production similar to the previous quarter yielding a record 55,145 tonnes of nickel-in-matte for the half-year.
Refinery performance was also at record levels with 17,780 tonnes of nickel metal produced for the quarter.
The following milestones are scheduled for the March quarter:
| • | completion of mining from Stage E pit at Mount Keith with ore progressively sourced from the new Stage F cutback during the June quarter |
| • | completion of mining from Harmony open cut at Leinster late in the period |
| • | a planned three week statutory maintenance shutdown at the Kwinana refinery in March |
| • | Sub-lease of the Lanfranchi mine at Kambalda subject to regulatory approval. |
Fertilizers
Record performance continued at Queensland Fertilizer Operations with quarterly production equivalent to 103 per cent of design capacity.
A key milestone was also achieved for the full year with 2003 production equivalent to 100 per cent of design capacity after accounting for the planned 15 day statutory maintenance shutdown in the third quarter.
Business Development
Solvent Extraction Plant Rebuild
Construction of the copper solvent extraction plant has been completed on schedule and the total cost is expected to be in line with the revised budget. Commissioning has commenced and will continue throughout the first quarter as planned.
Exploration Activities
Western Australia
Collurabbie
Drilling has intersected disseminated nickel-copper-PGE sulphide mineralisation over a 7 kilometre mineralised zone. Results are currently being assessed and drilling is planned to recommence in March.
Mundra South
Ground-based exploration progressed at the Mundra South nickel prospect, with geological targets currently under assessment for drilling later this year.
West Musgrave
We expanded our exploration agreement with the Ngaanyatjarra Land Council to gain ground access to new areas that contain previously identified airborne electromagnetic anomalies.
Global Exploration
We began a program to assess exploration tenements considered prospective for nickel sulphides in Malawi in Southern Africa. An airborne EM survey was flown during the quarter and data compilation is in progress.
Exploration for nickel sulphide deposits also continued in North America, Africa and China and for copper-gold deposits in Mongolia and Peru.
Other
Hedge Book Closeout
The 2005 to 2008 legacy currency hedge book was closed out during the quarter resulting in a net cash gain of $18m. The accounting profit of $367m will be deferred and recognised over 2005 to 2008.
2003 Full Year Results
WMC Resources Ltd will release its full year results for 2003 on 11 February 2004.
This event will be webcast live at www.wmc.com
| Quarter ended 31 December 2003 | |
Summary of WMC Resources’ production
Quarter ended 31 Dec 2003 | Quarter ended 30 Sept 2003 | Year ended 31 Dec 2003 | Year ended 31 Dec 2002^ | |||||||
Copper (tonnes of refined copper) | Olympic Dam Operations | 33,420 | 35,337 | 160,080 | 178,120 | |||||
Uranium Oxide concentrate(tonnes) | Olympic Dam Operations | 898 | 906 | 3,203 | 2,890 | |||||
Gold (ounces) | Olympic Dam Operations | 18,904 | 16,910 | 86,117 | 64,293 | |||||
Silver (ounces) | Olympic Dam Operations | 164,757 | 113,632 | 601,395 | 643,935 | |||||
Nickel (tonnes contained nickel) | Kambalda Nickel Operations | 6,576 | 5,828 | 25,912 | 23,225 | |||||
| Leinster Nickel Operations | 11,340 | 10,667 | 41,806 | 40,006 | ||||||
| Mount Keith Operations | 14,586 | 13,661 | 50,004 | 43,192 | ||||||
| Total nickel-in-concentrate | 32,502 | 30,156 | 117,722 | 106,423 | ||||||
| Total nickel-in-matte | 27,346 | 27,799 | 99,152 | 91,574 | ||||||
| Total nickel metal | 17,780 | 13,969 | 61,417 | 65,055 | ||||||
Fertilizer | ||||||||||
Di-ammonium phosphate (tonnes) | Phosphate Hill | 215,412 | 173,441 | 759,856 | 718,287 | |||||
Mono-ammonium phosphate (tonnes) | Phosphate Hill | 32,839 | 27,484 | 162,121 | 102,713 | |||||
Total Fertilizer(tonnes) | Phosphate Hill | 248,251 | 200,925 | 921,977 | 821,000 | |||||
A statistical supplement providing a detailed breakdown of WMC production results is available on WMC Internet home page at http://www.wmc.com
| ^ | The figures quoted represent the production from the operations now comprising WMC Resources Ltd. |
| Quarter ended 31 December 2003 | |
Commodity and Currency Hedging as at 31 December 2003
Following the close out of the 2005 to 2008 legacy currency hedge positions and the majority of the gold hedge positions, the following hedges remain as at 31 December 2003:
Currency
Period | Forward Sale of US$ | Synthetic Forward Sale of US$ | Non-limiting Cover | Profit & Loss Rate A$/US$ | ||||||||||
Amount US$m | Cash Flow Rate A$/US$ | Amount US$m | Cash Flow Rate A$/US$ | Amount US$m | Cash Flow Rate A$/US$ | |||||||||
2004 | 228 | 0.6753 | 20 | 0.6772 | 53 | 0.6271 | 0.5292 | |||||||
A synthetic forward consists of a bought US$ put and a written US$ call option. The written US$ call option has the potential to knock out above certain exchange rates. US$43m of written call options were knocked out during the quarter.
Gold
Period | Forward Sale of Gold | Profit & Loss Rate A$/oz | ||||
| Ounces | Cash Flow Rate A$/oz | |||||
2005 | 44,600 | 573 | 622 | |||
Gold production from Olympic Dam is delivered into the gold hedging positions.
The legacy hedges were fair valued at the date of demerger. Consequently, the profit and loss for each hedge will be determined by the difference between a particular hedge’s fair valued rate and the spot price at the date of the hedge’s maturity. The tables above show both the rates at which the hedge transactions are contracted with third parties to determine the cash flow impact for each hedge and the fair valued rates for determining the profit and loss impact.
Currency Scenarios
As WMC 2004 hedge positions comprise a combination of limiting and non-limiting cover, at various price levels, any one exchange rate or spot price cannot be used to predict the outcome of WMC’s hedge position. The following table provides an estimate of the realised rate to determine cash flow under various scenarios, taking into account the hedged and unhedged exposures. All realised exchange rate and price estimates include applicable option premium.
A$/US$ Rate at maturity | Estimated realised rate – $A/US 2004 | |
0.80 | 0.7649 | |
0.75 | 0.7291 | |
0.70 | 0.6920 | |
0.65 | 0.6531 | |
0.60 | 0.6128 | |
0.55 | 0.5699 |
Deferred Profits
Profits arising on the close out of the legacy hedge book during 2003 has been deferred and recognized during 2005 to 2008 as shown in the tables below.
Currency
| 2005 | 2006 | 2007 | 2008 | |||||||||||||
| H1 | H2 | H1 | H2 | H1 | H2 | H1 | H2 | |||||||||
Deferred Profit (A$m) | 54.5 | 60.2 | 37.3 | 41.8 | 40.5 | 42.1 | 43.0 | 47.4 | ||||||||
Gold
| 2004 | 2005 | 2006 | 2007 | 2008 | 2009 | 2010 | ||||||||
Deferred Profit (A$m) | 3.6 | 1.2 | 2.5 | 2.8 | 2.6 | 3.0 | 3.2 |
Deferred Cashflow
In 2001 some foreign exchange and gold hedges were reversed as a result of the gold asset sales. The cash flow impact of these transactions is shown in the table below.
| 2004 | 2005 | 2006 | 2007 | 2008 | |||||||||||
Deferred Cashflow (A$m) | (26.4 | ) | (37.4 | ) | (28.5 | ) | (23.4 | ) | (21.2 | ) |
| WMC Resources Ltd Quarterly Statistical Supplement – Total Production | Quarter Ended 31 December 2003 |
| Quarter ending 31/12/2003 | Quarter ending 30/09/2003 | Quarter ending 30/06/2003 | Quarter ending 31/03/2003 | Quarter ending 31/12/2002 | |||||||||||||||||
COPPER & URANIUM – OLYMPIC DAM OPERATIONS | |||||||||||||||||||||
| COPPER | tonnes | tonnes | tonnes | tonnes | tonnes | ||||||||||||||||
Ore hoisted | 2,575,092 | 2,281,673 | 2,089,739 | 2,056,895 | 2,151,978 | ||||||||||||||||
| tonnes | grade % | tonnes | grade % | tonnes | grade % | tonnes | grade % | tonnes | grade % | ||||||||||||
Ore treated and head grade | 1,959,037 | 2.50 | 2,151,125 | 2.45 | 2,334,685 | 2.19 | 1,941,782 | 2.57 | 2,172,677 | 2.57 | |||||||||||
Concentrate smelted | 67,723 | 50.3 | 64,322 | 51.3 | 125,159 | 47.4 | 101,209 | 47.5 | 99,823 | 45.1 | |||||||||||
| tonnes | tonnes | tonnes | tonnes | tonnes | |||||||||||||||||
Copper cathode produced | 33,420 | 35,337 | 49,644 | 41,678 | 48,328 | ||||||||||||||||
| tonnes | kg/tonne | tonnes | kg/tonne | tonnes | kg/tonne | tonnes | kg/tonne | tonnes | kg/tonne | ||||||||||||
Uranium oxide concentrate produced & head grade | 898 | 0.62 | 906 | 0.65 | 764 | 0.64 | 635 | 0.61 | 826 | 0.69 | |||||||||||
| ounces | g/tonne | ounces | g/tonne | ounces | g/tonne | ounces | g/tonne | ounces | g/tonne | ||||||||||||
Refined gold produced & head grade | 18,904 | 0.45 | 16,910 | 0.46 | 23,371 | 0.48 | 26,931 | 0.49 | 13,682 | 0.51 | |||||||||||
| ounces | g/tonne | ounces | g/tonne | ounces | g/tonne | ounces | g/tonne | ounces | g/tonne | ||||||||||||
Refined silver produced & head grade | 164,757 | 5.11 | 113,632 | 4.90 | 173,340 | 4.32 | 149,666 | 4.22 | 191,001 | 4.12 | |||||||||||
NICKEL | |||||||||||||||||||||
| Ore treated and head grade | tonnes | grade % | tonnes | grade % | tonnes | grade % | tonnes | grade % | tonnes | grade % | |||||||||||
Kambalda Nickel Operations | 204,016 | * | 3.56 | 178,990 | 3.62 | 218,327 | 3.57 | 203,376 | 3.56 | 216,687 | 4.03 | ||||||||||
Leinster Nickel Operations | 621,748 | 2.13 | 664,652 | 1.92 | 581,944 | 2.02 | 620,927 | 1.97 | 657,619 | 2.01 | |||||||||||
Mount Keith Nickel Operations | 2,974,189 | 0.66 | 2,838,202 | 0.66 | 2,698,898 | 0.59 | 2,688,597 | 0.56 | 2,752,407 | 0.54 | |||||||||||
| Concentrate produced & concentrate grade | tonnes | grade % | tonnes | grade % | tonnes | grade % | tonnes | grade % | tonnes | grade % | |||||||||||
Kambalda Nickel Operations | 45,930 | 14.3 | 41,821 | 13.9 | 50,748 | 14.0 | 42,808 | 15.0 | 50,727 | 15.2 | |||||||||||
Leinster Nickel Operations | 93,661 | 12.1 | 89,509 | 11.9 | 84,963 | 11.9 | 78,770 | 12.3 | 78,230 | 13.2 | |||||||||||
Mount Keith Nickel Operations | 70,681 | 20.6 | 66,366 | 20.6 | 54,386 | 21.3 | 55,796 | 18.2 | 42,071 | 22.5 | |||||||||||
| Nickel contained in concentrate | tonnes | tonnes | tonnes | tonnes | tonnes | ||||||||||||||||
Kambalda Nickel Operations | 6,576 | 5,828 | 7,100 | 6,409 | 7,720 | ||||||||||||||||
Leinster Nickel Operations | 11,340 | 10,667 | 10,099 | 9,700 | 10,331 | ||||||||||||||||
Mount Keith Nickel Operations | 14,586 | 13,661 | 11,590 | 10,167 | 9,465 | ||||||||||||||||
Total | 32,502 | 30,156 | 28,789 | 26,276 | 27,516 | ||||||||||||||||
| Smelter feed & matte produced (tonnes) | Feed | Matte | Feed | Matte | Feed | Matte | Feed | Matte | Feed | Matte | |||||||||||
Kalgoorlie Nickel Smelter | 188,631 | 39,654 | 194,407 | 43,688 | 167,471 | 31,854 | 160,593 | 32,517 | 179,695 | 38,858 | |||||||||||
| Nickel contained in matte | tonnes | tonnes | tonnes | tonnes | tonnes | ||||||||||||||||
Kalgoorlie Nickel Smelter | 27,346 | 27,799 | 21,923 | 22,084 | 26,901 | ||||||||||||||||
| Matte treated | tonnes | tonnes | tonnes | tonnes | tonnes | ||||||||||||||||
Kwinana Nickel Refinery | 26,354 | 20,867 | 21,706 | 23,109 | 26,041 | ||||||||||||||||
| Nickel packaged | tonnes | tonnes | tonnes | tonnes | tonnes | ||||||||||||||||
Kwinana Nickel Refinery | 17,780 | 13,969 | 14,498 | 15,171 | 17,246 | ||||||||||||||||
FERTILIZER – PHOSPHATE HILL | |||||||||||||||||||||
| tonnes | tonnes | tonnes | tonnes | tonnes | |||||||||||||||||
DAP | 215,412 | 173,441 | 168,075 | 202,928 | 198,448 | ||||||||||||||||
MAP | 32,839 | 27,484 | 70,726 | 31,072 | 30,264 | ||||||||||||||||
Total Fertilizer | 248,251 | 200,925 | 238,801 | 234,000 | 228,712 | ||||||||||||||||
| * | 100% sourced from purchased third party feeds. Corresponding data for the previous period is 100%, 100%, 100% and 97% respectively. |
To: The Manager
Announcements
ASX Company Announcements Office
Public Announcement 2004-2
In accordance with Listing Rule 2.7 please find enclosed Appendix 3B, application for quotation of additional securities.
Ross Mallett
Assistant Company Secretary
27 January 2004
WMC Resources Ltd ABN 76 004 184 598
GPO Box 860K Melbourne Vic. 3001 Australia
Level 16 IBM Centre 60 City Road Southbank Vic. 3006 Australia
Tel +61 (0)3 9685 6000 Fax +61 (0)3 9686 3569 |
Appendix 3B
New issue announcement
Rule 2.7, 3.10.3, 3.10.4, 3.10.5
Appendix 3B
New issue announcement, application for quotation of additional securities and agreement
Information or documents not available now must be given to ASX as soon as available. Information and documents given to ASX become ASX’s property and may be made public.
Introduced 1/7/96. Origin: Appendix 5. Amended 1/7/98, 1/9/99, 1/7/2000, 30/9/2001, 11/3/2002, 1/1/2003.
| Name of entity | ||
WMC Resources Ltd | ||
| ABN | ||||
74 004 184 598 | ||||
We (the entity) give ASX the following information.
Part 1 – All issues
You must complete the relevant sections (attach sheets if there is not enough space).
| 1 | +Class of +securities issued or to be issued | Fully paid ordinary shares. | ||||
| 2 | Number of +securities issued or to be issued (if known) or maximum number which may be issued | 5,230,105 | ||||
| 3 | Principal terms of the +securities (eg, if options, exercise price and expiry date; if partly paid +securities, the amount outstanding and due dates for payment; if +convertible securities, the conversion price and dates for conversion) | The securities in (2) above comprise of 5,230,105 shares arising from options which were exercised during the period. Option exercise prices and expiry dates are detailed in Attachment “A”. | ||||
+ See chapter 19 for defined terms.
1/1/2003 | Appendix 3B Page 1 |
Appendix 3B
New issue announcement
| 4 | Do the +securities rank equally in all respects from the date of allotment with an existing +class of quoted +securities? | Securities rank equally from date of allotment. | ||||||||
| If the additional securities do not rank equally, please state: | ||||||||||
• the date from which they do | ||||||||||
• the extent to which they participate for the next dividend, (in the case of a trust, distribution) or interest payment | ||||||||||
• the extent to which they do not rank equally, other than in relation to the next dividend, distribution or interest payment | ||||||||||
| 5 | Issue price or consideration | Refer to Attachment “A”. | ||||||||
| 6 | Purpose of the issue (If issued as consideration for the acquisition of assets, clearly identify those assets) | Refer to Item 3 above. | ||||||||
| 7 | Dates of entering +securities into uncertificated holdings or despatch of certificates | Following allotment of shares | ||||||||
| Number | +Class | |||||||||
| 8 | Number and +class of all +securities quoted on ASX(including the securities in clause 2 if applicable) | 1,150,070,945 | Fully paid ordinary shares. | |||||||
+ See chapter 19 for defined terms.
Appendix 3B Page 2 | 1/1/2003 |
Appendix 3B
New issue announcement
| Number | +Class | |||||||
| 9 | Number and +class of all +securities not quoted on ASX(including the securities in clause 2 if applicable) | Refer to Attachment “A”. | ||||||
| 10 | Dividend policy (in the case of a trust, distribution policy) on the increased capital (interests) | N/A. | ||||||
Part 2 – Bonus issue or pro rata issue
| 11 | Is security holder approval required? | |||||
| 12 | Is the issue renounceable or non-renounceable? | |||||
| 13 | Ratio in which the +securities will be offered | |||||
| 14 | +Class of +securities to which the offer relates | |||||
| 15 | +Record date to determine entitlements | |||||
| 16 | Will holdings on different registers (or subregisters) be aggregated for calculating entitlements? | |||||
| 17 | Policy for deciding entitlements in relation to fractions | |||||
| 18 | Names of countries in which the entity has +security holders who will not be sent new issue documents | |||||
| Note: Security holders must be told how their entitlements are to be dealt with. | ||||||
| Cross reference: rule 7.7. | ||||||
| 19 | Closing date for receipt of acceptances or renunciations | |||||
+ See chapter 19 for defined terms.
1/1/2003 | Appendix 3B Page 3 |
Appendix 3B
New issue announcement
| 20 | Names of any underwriters | |||||
| 21 | Amount of any underwriting fee or commission | |||||
| 22 | Names of any brokers to the issue | |||||
| 23 | Fee or commission payable to the broker to the issue | |||||
| 24 | Amount of any handling fee payable to brokers who lodge acceptances or renunciations on behalf of +security holders | |||||
| 25 | If the issue is contingent on +security holders’ approval, the date of the meeting | |||||
| 26 | Date entitlement and acceptance form and prospectus or Product Disclosure Statement will be sent to persons entitled | |||||
| 27 | If the entity has issued options, and the terms entitle option holders to participate on exercise, the date on which notices will be sent to option holders | |||||
| 28 | Date rights trading will begin (if applicable) | |||||
| 29 | Date rights trading will end (if applicable) | |||||
| 30 | How do +security holders sell their entitlementsin full through a broker? | |||||
| 31 | How do +security holders sellpart of their entitlements through a broker and accept for the balance? | |||||
+ See chapter 19 for defined terms.
Appendix 3B Page 4 | 1/1/2003 |
Appendix 3B
New issue announcement
| 32 | How do +security holders dispose of their entitlements (except by sale through a broker)? | |||||
| 33 | +Despatch date | |||||
Part 3 – Quotation of securities
You need only complete this section if you are applying for quotation of securities
| 34 | Type of securities (tick one) | |||
| (a) | x | Securities described in Part 1 | ||
| (b) | ¨ | All other securities
Example: restricted securities at the end of the escrowed period, partly paid securities that become fully paid, employee incentive share securities when restriction ends, securities issued on expiry or conversion of convertible securities | ||
Entities that have ticked box 34(a)
Additional securities forming a new class of securities
| Tick to indicate you are providing the information or documents | ||||
| 35 | ¨ | If the +securities are +equity securities, the names of the 20 largest holders of the additional +securities, and the number and percentage of additional +securities held by those holders | ||
| 36 | ¨ | If the +securities are +equity securities, a distribution schedule of the additional +securities setting out the number of holders in the categories | ||
| 1 – 1,000 | ||||
| 1,001 – 5,000 | ||||
| 5,001 – 10,000 | ||||
| 10,001 – 100,000 | ||||
| 100,001 and over | ||||
| 37 | ¨ | A copy of any trust deed for the additional +securities | ||
+ See chapter 19 for defined terms.
| 1/1/2003 | Appendix 3B Page 5 |
Appendix 3B
New issue announcement
Entities that have ticked box 34(b)
| 38 | Number of securities for which +quotation is sought | |||||||
| 39 | Class of +securities for which quotation is sought | |||||||
| 40 | Do the +securities rank equally in all respects from the date of allotment with an existing +class of quoted +securities?
If the additional securities do not rank equally, please state:
• the date from which they do
• the extent to which they participate for the next dividend, (in the case of a trust, distribution) or interest payment
• the extent to which they do not rank equally, other than in relation to the next dividend, distribution or interest payment | |||||||
| 41 | Reason for request for quotation now
Example: In the case of restricted securities, end of restriction period
(if issued upon conversion of another security, clearly identify that other security) | |||||||
| Number | +Class | |||||||
| 42 | Number and +class of all +securities quoted on ASX(including the securities in clause 38) | |||||||
+ See chapter 19 for defined terms.
| Appendix 3B Page 6 | 1/1/2003 |
Appendix 3B
New issue announcement
Quotation agreement
| 1 | +Quotation of our additional+securities is in ASX’s absolute discretion. ASX may quote the+securities on any conditions it decides. |
| 2 | We warrant the following to ASX. |
| • | The issue of the+securities to be quoted complies with the law and is not for an illegal purpose. |
| • | There is no reason why those+securities should not be granted+quotation. |
| • | An offer of the+securities for sale within 12 months after their issue will not require disclosure under section 707(3) or section 1012C(6) of the Corporations Act. |
Note: An entity may need to obtain appropriate warranties from subscribers for the securities in order to be able to give this warranty
| • | Section 724 or section 1016E of the Corporations Act does not apply to any applications received by us in relation to any+securities to be quoted and that no-one has any right to return any+securities to be quoted under sections 737, 738 or 1016F of the Corporations Act at the time that we request that the+securities be quoted. |
| • | We warrant that if confirmation is required under section 1017F of the Corporations Act in relation to the+securities to be quoted, it has been provided at the time that we request that the+securities be quoted. |
| • | If we are a trust, we warrant that no person has the right to return the+securities to be quoted under section 1019B of the Corporations Act at the time that we request that the+securities be quoted. |
+ See chapter 19 for defined terms.
| 1/1/2003 | Appendix 3B Page 7 | |
Appendix 3B
New issue announcement
| 3 | We will indemnify ASX to the fullest extent permitted by law in respect of any claim, action or expense arising from or connected with any breach of the warranties in this agreement. |
| 4 | We give ASX the information and documents required by this form. If any information or document not available now, will give it to ASX before+quotation of the+securities begins. We acknowledge that ASX is relying on the information and documents. We warrant that they are (will be) true and complete. |
Sign here: | Ross E. Mallett | Date: 27 January 2004 | ||
(Assistant Company Secretary) | ||||
| Print name: | Ross E. Mallett | |||
== == == == ==
+ See chapter 19 for defined terms.
| Appendix 3B Page 8 | 1/1/2003 | |
31 December 2003
Attachment “A”
Details of Securities Issued
| Shares | Issue Price | Issue Date | Expiry Date | Description | Share Capital | |||||||||
| 296,250 | $ | 2.26 | 21.12.1998 | 21.12.03 | Employee Options Exercised | 669,525 | ||||||||
| 45,000 | $ | 2.49 | 21.12.1998 | 21.12.03 | 112,050 | |||||||||
| 520,955 | $ | 3.90 | 20.12.1999 | 20.12.04 | 2,031,725 | |||||||||
| 675,000 | $ | 3.48 | 18.12.2000 | 18.12.05 | 2,349,000 | |||||||||
| 1,980,900 | $ | 4.33 | 30.11.2001 | 30.11.06 | 8,577,297 | |||||||||
| 1,712,000 | $ | 4.34 | 23.12.2002 | 23.12.07 | 7,430,080 | |||||||||
Total Shares Issued | 5,230,105 | 21,169,677 | ||||||||||||
(Exercise of Employee Options) | ||||||||||||||
Shares to be Quoted | 5,230,105 | Total Share Capital to be Quoted | $ | 21,169,677 | ||||||||||
Details of Securities Not Quoted on the ASX
| Unquoted Securities as at 31/10/03 | Description | Options exercised | Options lapsed | Options issued | Unquoted Securities As at 31/12/03 | |||||
| 296,250 | (a) employee options expiring 21/12/2003 exerciseable at $2.26 | 296,250 | 0 | 0 | ||||||
| 45,000 | (b) employee options expiriting 21/12/2003 exercisable at $2.49 | 45,000 | 0 | 0 | ||||||
| 1,910,900 | (c) employee options expiring 20/12/2004 exerciseable at $3.90 | 520,955 | 0 | 1,389,945 | ||||||
| 2,473,500 | (d) employee options expiring 18/12/2005 exerciseable at $3.48 | 675,000 | 0 | 1,798,500 | ||||||
| 6,380,800 | (e) employee options expiring 30/11/2006 exerciseable at $4.33 | 1,980,900 | 0 | 4,399,900 | ||||||
| 10,476,800 | (g) employee options expiring 23/12/2007 exercised at $4.34 | 1,712,000 | 146,000 | 8,618,800 | ||||||
| 21,583,250 | TOTAL OPTIONS | 5,230,105 | 146,000 | — | 16,207,145 | |||||
Quoted Securities as at 31.10.03 | 1,144,840,840 | |
plus Securities subject to this application for quotation | 5,230,105 | |
TOTAL SECURITIES TO BE QUOTED ON ASX | 1,150,070,945 | |
| Value | Fee | ||
21169677 Issued Capital | |||
In excess of: 10,000,000 | $ | 8,600.00 | |
Excess 11,169,677 @0.014% | $ | 1,563.75 | |
Total Fee | $ | 10,163.75 | |
To: The Manager
Announcements
ASX Company Announcements Office
Public Announcement 2004-3
Please find attached Change of Director’s Interest Notices (Appendix 3Y) in respect of WMC Resources Ltd executive directors, Messrs Andrew Michelmore and Alan Dundas representing shares allocated to them as their entitlement under the WMC Resources Ltd Senior Executive Share Plan. These entitlements form part of the total shares purchased on behalf of employees under the 2003 Employee Share Purchase Plan by the Share Plan Secretary.
A copy of these notices can be viewed at WMC’s internet site atwww.wmc.com following their release to the market.
Ross Mallett
Assistant Company Secretary
4 February 2004
Appendix 3Y
Change of Director’s Interest Notice
Rule 3.19A.2
Appendix 3Y
Change of Director’s Interest Notice
Information or documents not available now must be given to ASX as soon as available. Information and documents given to ASX become ASX’s property and may be made public.
Introduced 30/9/2001.
| Name of entity | WMC RESOURCES LTD | |
| ABN | 76 004 184 598 | |
We (the entity) give ASX the following information under listing rule 3.19A.2 and as agent for the director for the purposes of section 205G of the Corporations Act.
| Name of Director | Mr Andrew Gordon Michelmore | |
| Date of last notice | 24 December 2003 |
Part 1 – Change of director’s relevant interests in securities
In the case of a trust, this includes interests in the trust made available by the responsible entity of the trust
Note: In the case of a company, interests which come within paragraph (i) of the definition of “notifiable interest of a director” should be disclosed in this part.
| Direct or indirect interest | Direct | |
Nature of indirect interest (including registered holder) Note: Provide details of the circumstances giving rise to the relevant interest. | N/a | |
| Date of change | 2 February 2004 | |
| No. of securities held prior to change | Fully paid shares—159,981 Employee share plan options—280,000 | |
| Class | Fully paid ordinary shares | |
| Number acquired | On 2 February 2004 192,001 fully paid shares were allocated to Mr Andrew Gordon Michelmore by the WMC Share Plan Secretary under the terms of the 2003 Senior Executive Share Plan. This allocation was part of the total number of shares purchased on behalf of employees under the 2003 Employee Share Purchase Plan by the Share Plan Secretary | |
| Number disposed | N/a | |
+ See chapter 19 for defined terms.
| Appendix 3Y Page 2 | 11/3/2002 |
Value/Consideration Note: If consideration is non-cash, provide details and estimated | $5.19 per share. | |
| No. of securities held after change | Fully paid shares—351,982 Employee share plan options—280,000 | |
Nature of change Example: on-market trade, off-market trade, exercise of options, issue of securities under dividend reinvestment plan, participation in buy-back | Issue of fully paid ordinary shares under senior executive share plan. | |
Part 2 – Change of director’s interests in contracts
Note: In the case of a company, interests which come within paragraph (ii) of the definition of “notifiable interest of a director” should be disclosed in this part.
| Detail of contract | N/a | |
| Nature of interest | ||
Name of registered holder (if issued securities) | ||
| Date of change | ||
No. and class of securities to which interest related prior to change Note: Details are only required for a contract in relation to which the interest has changed | ||
| Interest acquired | ||
| Interest disposed | ||
Value/Consideration Note: If consideration is non-cash, provide details and an estimated valuation | ||
| Interest after change | ||
Appendix 3Y
Change of Director’s Interest Notice
Rule 3.19A.2
Appendix 3Y
Change of Director’s Interest Notice
Information or documents not available now must be given to ASX as soon as available. Information and documents given to ASX become ASX’s property and may be made public.
Introduced 30/9/2001.
| Name of entity | WMC RESOURCES LTD | |
| ABN | 76 004 184 598 | |
We (the entity) give ASX the following information under listing rule 3.19A.2 and as agent for the director for the purposes of section 205G of the Corporations Act.
| Name of Director | Mr Alan Kevin Dundas | |||
| Date of last notice | 17 March 2003 | |||
Part 1—Change of director’s relevant interests in securities
In the case of a trust, this includes interests in the trust made available by the responsible entity of the trust
Note: In the case of a company, interests which come within paragraph (i) of the definition of “notifiable interest of a director” should be disclosed in this part.
| Direct or indirect interest | Direct | |
Nature of indirect interest (including registered holder) Note: Provide details of the circumstances giving rise to the relevant interest. | N/a | |
| Date of change | 2 February 2004 | |
| No. of securities held prior to change | Fully paid shares—115,157 Employee share plan options—202,000 | |
| Class | Fully paid ordinary shares | |
| Number acquired | On 2 February 2004 108,000 fully paid shares were allocated to Mr Alan Kevin Dundas by the WMC Share Plan Secretary under the terms of the 2003 Senior Executive Share Plan. This allocation was part of the total number of shares purchased on behalf of employees under the 2003 Employee Share Purchase Plan by the Share Plan Secretary. | |
| Number disposed | N/a | |
+ See chapter 19 for defined terms.
| Appendix 3Y Page 4 | 11/3/2002 |
Value/Consideration Note: If consideration is non-cash, provide details and estimated | $5.19 per share. | |
| No. of securities held after change | Fully paid shares - 223,157 Employee share plan options - 202,000 | |
Nature of change Example: on-market trade, off-market trade, exercise of options, issue of securities under dividend reinvestment plan, participation in buy-back | Issue of fully paid ordinary shares under senior executive share plan. | |
Part 2 – Change of director’s interests in contracts
Note: In the case of a company, interests which come within paragraph (ii) of the definition of “notifiable interest of a director” should be disclosed in this part.
| Detail of contract | N/a | |
| Nature of interest | ||
Name of registered holder (if issued securities) | ||
| Date of change | ||
No. and class of securities to which interest related prior to change Note: Details are only required for a contract in relation to which the interest has changed | ||
| Interest acquired | ||
| Interest disposed | ||
Value/Consideration Note: If consideration is non-cash, provide details and an estimated valuation | ||
| Interest after change | ||
| To: | The Manager Announcements ASX Company Announcements Office |
Public Announcement 2004-4
WMC Resources Ltd 2003 Full Year Results
Please find attached for immediate release Public Announcement 2004-4 covering the release of WMC Resources Ltd’s Financial Results for the year ended 31 December 2003.
The following documents are included as part of the release:
| • | Public Announcement |
| • | Appendix 4E – Preliminary Final ASX Report |
| • | Business Performance Report (Fact File) |
WMC’s Chief Executive Officer, Mr Andrew Michelmore, will host an audio conference at 2.00pm this afternoon which will be broadcast live from WMC’s web site. A recording of this conference will be available for playback on WMC’s web site later this evening.
Peter Horton
Company Secretary
11 February 2004
For further information, please call: Nerida Mossop, Manager Investor Relations on; 0418 378 809, or Troy Hey, Group Manager Public Affairs on; 0419 502 852 | WMC Resources Ltd ACN 004 184 598
GPO Box 860K Melbourne Vic. 3001 Australia
Level 16 IBM Centre 60 City Road Southbank Vic. 3006 Australia
Tel +61 (0)3 9685 6000 Fax +61 (0)3 9685 6115 |
Statements contained in this material, particularly those regarding the possible or assumed future performance, costs, dividends, returns, production levels or rates, prices, reserves, divestments, potential growth of WMC, industry growth or other trend projections and any estimated company earnings are or may be forward looking statements. Such statements relate to future events and expectations and as such involve known and unknown risks and uncertainties. Actual results actions and developments may differ materially from those expressed or implied by these forward looking statements depending on a variety of factors, including: variations in the market price of the minerals and metals produced by WMC, the impact of foreign currency exchange rates on these market prices, WMC’s ability to profitably produce and transport minerals and metals extracted to applicable markets, WMC’s ability to achieve projected cost and scheduling targets for repair and construction activities and the activities of governmental authorities in certain countries where WMC has projects, facilities or mines that are being explored or developed, as well as the factors discussed under the caption “Risk Factors” at pages 13 to 16 of WMC’s Annual Report on Form 20-F for the fiscal year ended 31 December 2002.
This report (Fact File) contains a comparison of WMC Resources Ltd’s 2003 full year actual statutory results to pro forma historical results for the 2002 year. The 2003 statutory results have been drawn from the Full Year ASX report for the twelve months ended 31 December 2003 as lodged with the ASX and ASIC on 11 February 2004. The 2002 pro forma comparatives are drawn from the Special Purpose Report lodged with the ASX and ASIC on 26 February 2003. The 2002 comparatives are not a substitute for the WMC Resources Ltd consolidated financial report. A copy of all documents referred to are available on our website www.wmc.com.
Presentation
The presentation of the statement of financial performance and statement of cash flows is consistent with the format of these statements in the WMC Limited’s Scheme Booklet dated 28 October 2002 and the Special Purpose Report dated 26 February 2003. The presentation of the statement of financial position is designed to provide information in relation to each of the business segments and is therefore not set out in accordance with Australian Generally Accepted Accounting Principles (GAAP).
All amounts are in Australian dollars unless otherwise stated.
2002 Pro Forma Comparatives
The Pro Forma 2002 Results and Cash Flows of WMC Resources Ltd, set out in this report, have been prepared on a consolidated entity basis for WMC Resources Ltd and its controlled entities and assumes for the comparative period shown, that the entities acquired by WMC Resources Ltd as part of the demerger (principally the copper and fertilizer businesses and the finance companies) were controlled entities for the full period reported (from 1 January 2002).
The transactions that occurred in conjunction with the demerger and the manner in which the demerger was implemented has had an effect on WMC Resources Ltd’s results and financial position in 2003 and will have an effect in all future years relative to its historical results and financial position.
The 2002 comparatives in this report have been prepared as if the following transactions and events had occurred at 1 January 2002:
| • | the copper, fertilizer and international exploration assets and business were acquired at their fair value as required under Australian GAAP. The fair value adjustments, principally copper (uplift) and fertilizer (write down) impact on the carrying values in the statement of financial position and consequently result in higher net amortisation charges compared with prior periods but with no cash flow implications; |
| • | overall level of debt was reduced and higher yield long dated securities repurchased and refinanced with consequently lower interest charges in 2002 and future years; |
| • | derivative and financial instruments (primarily the hedge book) were fair valued at the forward price prevailing at demerger date. This resulted in the extinguishment of deferred hedge losses with future gains and losses being determined with reference to the new forward price including the base exchange rate at demerger of 0.5608. This does not impact the underlying contract prices; and |
| • | demerger costs were borne by WMC Resources Ltd. Some of these have been capitalised into asset values increasing future depreciation and amortisation charges. |
3
This page left intentionally blank
4

WMC EARNINGS UP – DESPITE $A STRENGTH
| • | Full year profit after tax of $246 million. |
Compares with 2002 statutory loss of $44 million and 2002 pro forma earnings of $75 million as described in the attached Fact File.
| • | Higher $A offsets improving $US commodity prices. |
| • | Directors declare 2003 unfranked dividend of 6 cents per share. |
| • | Cashflow from operations up $318 million on 2002. |
| • | Construction of copper solvent extraction plant completed. |
| • | Nickel earnings up on higher volumes and realised $A prices. |
| • | Scheduled smelter maintenance and heat exchanger failure cut copper earnings. |
| • | Higher fertilizer production offsets lower realised $A prices. |
| • | Sound financial position – gearing of 24%, interest cover 13.2 times. |
KEY FINANCIALS
Pro forma 2002 | Actual 2003 | |||||
Profit (after tax) ($M) | 75.4 | 245.6 | ||||
EBIT from operations (pre hedging) ($M) | 249.9 | 290.0 | ||||
EBITDA (pre hedging) ($M) | 664.1 | 730.4 | ||||
Revenue from operations (pre-hedging) ($M) | 2,690.5 | 2,933.4 | ||||
Cash flow from operations ($M) | 324.4 | 642.5 | ||||
Capital expenditure ($M) | 471.1 | 661.9 | ||||
Cash flow before debt and equity funding ($M) | (30.3 | ) | (85.8 | ) | ||
Return on equity (%) | 2.6 | 6.2 | ||||
Net assets ($M) | 3,606.6 | 3,949.7 | ||||
Gearing (%) | 30.3 | 24.1 | ||||
Interest cover (times) | 10.5 | 13.2 | ||||
Dividend per share (cents) | — | 6.0 | ||||
Earnings per share (cents) | — | 21.7 |
“After a tough year, I’m pleased to report strong earnings growth, improved cashflow from operations and a maiden dividend,” said WMC Resources CEO, Andrew Michelmore
“While US dollar commodity prices surged during 2003, the Australian dollar’s strength largely offset gains.”
“Second half production records across our nickel and fertilizer businesses and strong performance from the mine at Olympic Dam have positioned us well for 2004.”
“Commissioning of the copper solvent extraction plant at Olympic Dam in 2004 will complete our schedule of major projects.
“Improving returns, reinvestment for the future and delivering operating reliability is our focus in 2004.”
The outlook for WMC is for sustained and consistent production performance in a continuing strong market for our major commodities,” Mr Michelmore said.
5
This page left intentionally blank
6

KEY POINTS
| • | Profit after income tax was $246m for the year ended 31 December 2003 compared with $75m on a pro forma basis for 2002. The current year tax charge of $2m includes a credit of $39m in respect of tax loss recognition. |
| • | Directors declared a maiden dividend of 6 cents per share. |
| • | EBIT from operations increased $40m from the prior year. This improvement reflects a strong performance from the nickel business during a time of high nickel prices. The gains from the nickel business were partially offset by a decline in EBIT from the copper business, which benefited in 2002 from a $90m insurance credit, higher sales and higher Australian dollar prices. EBIT from Queensland Fertilizer Operation improved despite lower realised Australian dollar prices, reflecting significantly improved production volumes. EBIT from Hi-Fert declined $10m due to lower margins and sales volumes caused by the drought. |
| • | Cashflow from operations increased $318m from 2002. |
| • | Capital expenditure of $662m included costs associated with the construction of the uranium and copper solvent extraction plants at Olympic Dam, and major planned maintenance in each business. |
| • | The return on equity has improved to 6.2%. |
| • | The company’s financial position remains sound, with gearing of 24 per cent and interest cover of 13.2 times. |
OUTLOOK FOR 2004
| • | Buoyant markets for each of our commodities are expected to continue throughout 2004. The strength in commodity prices is expected to be partially offset by a strong Australian dollar relative to US dollar. |
| • | Strong production is expected from each operation. |
| • | We remain focused on delivering safe, sustained and consistent performance from each of our operations. |
(A$ Million) | Actual 1H03 | Actual 2H03 | Actual FY03 | Pro forma FY02 | |||||||
Revenue from operations (pre hedging) | 1,394.9 | 1,538.5 | 2,933.4 | 2,690.5 | |||||||
Profit after tax | 47.0 | 198.6 | 245.6 | 75.4 | |||||||
EBIT from operations (pre hedging) | 71.3 | 218.7 | 290.0 | 249.9 | |||||||
Cashflow from Operations | 187.8 | 454.7 | 642.5 | 324.3 | |||||||
Capital Expenditure | 305.0 | 356.9 | 661.9 | 471.1 | |||||||
Cashflow before debt and equity funding | (210.9 | ) | 125.1 | (85.8 | ) | (30.3 | ) | ||||
Net Debt | 1,556 | 1,253 | 1,253 | 1,567 | |||||||
Total Assets | 7,542 | 7,560 | 7,560 | 7,348 | |||||||
Equity | 3,661 | 3,950 | 3,950 | 3,607 | |||||||
Return on equity (%) | 2.6 | 10.1 | 6.2 | 2.6 | |||||||
Cash flow from Operations to Net Debt (%) | 24.1 | 72.6 | 51.3 | 20.7 | |||||||
Net Debt / Net Debt + Equity (%) | 29.8 | 24.1 | 24.1 | 30.3 | |||||||
Interest Cover (times) | 11.4 | 14.6 | 13.2 | 10.5 | |||||||
Earnings per share (cents) | 4.2 | 17.5 | 21.7 | N/A | |||||||
Dividend per share - unfranked (cents) | — | 6.0 | 6.0 | — | |||||||
7
Environment Health and Safety
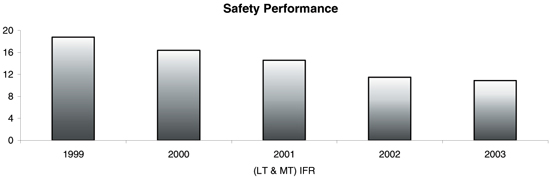
The full year lost time and medically treated injury frequency rate of 10.9 represents a 5 per cent improvement over 2002. The continued downward trend in injury rates reflects the ongoing implementation and application of our environment, health and safety management system. Despite this excellent improvement, we regret to advise that Teodosio Gabriel Macumbue, a security guard employed at our Corridor Sands pilot plant near Chibuto in Mozambique was attacked and killed during a robbery in October.
During 2003, we recorded a 28 per cent reduction in environmental non compliances, and carbon dioxide and sulphur dioxide emissions were reduced by 0.7 per cent and 2.2 per cent respectively.
During the year the Kwinana refinery reported that routine monitoring and follow up testing had identified historic arsenic contamination beneath the plant and contained within the site boundaries. Remediation has commenced in accordance with a plan approved by the Western Australian Department of Environmental Protection.
Five environmental spills were reported at Olympic Dam – four following the introduction of new reporting criteria introduced by the South Australian Government. None of these incidents produced any occupational health or environmental impacts. The spills were contained within the extensive bunding and drainage systems and returned to process or tailings circuits.
WMC Resources Share Price
8
Marketing
Commodity markets were volatile in 2003 with prices improving significantly in the second half of the year. Improvement was driven by better supply and demand fundamentals. We have experienced strong demand for our products, particularly in Asian markets, and have received good sales premiums on all commodities. A major contract with the Jinchuan Group was entered into during the year in which WMC will supply 90,000 tonnes of nickel-in-matte between the years 2005 to 2010.
Treasury
Significant financing activities during 2003 included issuing US$700 million of bonds (US$500 million maturing in 2013 and US$200 million in 2033) to extend the tenor of our debt profile following the demerger. During the third quarter of 2003, we exchanged our fixed rate interest exposure on the 10-year bonds to a fixed exposure for 2004 and 2005 followed by a floating interest rate for the remainder of the bond. This swap enabled us to lock in an annual interest cost saving of A$23 million for 2004 and 2005.
We also closed out our 2005 to 2008 legacy currency hedge book at a net cash gain of $18 million. The hedge book for 2004, which comprises forward cover and options for US$300 million of revenue, remains in place. At the end of year Australian dollar exchange rate, the 2004 book has a positive cash mark to market value of $40 million.
Corporate costs
The move toward shared service delivery continued in 2003. Under the approach adopted by WMC, functional expertise and service delivery is centralised with standardised processes applied consistently and continually improved. The approach delivers economies of scale, minimises duplication and waste and ensures knowledge is shared across our operations. During 2003, we reviewed our approach to ensure we maintain cost effective service delivery to our operations and ongoing efficiency improvements.
Corporate costs include the Board, the office of the Chief Executive Officer, Executive General Managers and support and governance functions including Company Secretariat, Treasury, Investor Relations, Corporate Affairs and Corporate Accounting.
The shared service costs associated with supporting the operations are fully allocated to the respective business units. WMC has historically allocated such costs to business units, however, a broader pool of costs representative of the full suite of support services provided is now being allocated. Business unit and corporate costs have been restated for comparative purposes.
Unit cost of sales for each business now includes the shared service cost allocations - prior periods have been restated accordingly.
We have also disclosed certain corporate costs as one-off. In 2003, these constitute restructuring costs associated with the further rationalisation of our shared services model. In 2002, the one-offs included retirement allowances in respect of contractual arrangements with certain directors, charges arising from a reduction in leased office space and a number of non-recurring smaller charges not directly related to our operations.
9
Employee share plan
During 2002 WMC discontinued the executive share option plan for senior management, and during 2003 discontinued option plans for employees generally. This reflects the Board’s decision for full transparency in the value of employee reward and had regard for governance concerns regarding option valuation and the diluting effect of options on shareholders. The equity plans provide employees with company shares purchased on-market. The plans provide rewards based on overall company performance.
The cost of purchasing the shares to meet plan entitlements has been accrued against 2003 profit.
Insurance claim
WMC has an outstanding insurance claim in relation to the 2001 Olympic Dam fire. An amount of $120 million was recognized in relation to the claim in the 2002 accounts. To date, we have received $82 million of cash in relation to the claim. We will continue to progress collection of outstanding amounts. The final amount of the claim will be in excess of the $120 million already brought to account. Any amount in excess of the $120 million will be recorded in the 2004 financial statements in accordance with accounting standards.
Tax
The effective tax rate for the group is less than 30 per cent and is impacted by tax credits associated with cash payments made in respect of the legacy foreign currency hedge book. These credits shield approximately the first $100 million of pre-tax income each year up to and including 2008. The tax credit is calculated by treating cash movements on the hedge as taxable and the accounting hedge result as effectively not taxable.
At demerger, a significant proportion of the Australian tax losses were fair valued to zero due to the uncertainty of full recoverability, tax law and accounting standard requirements, for recovery and recognition.
The recoverability of off balance sheet tax benefits was reviewed following a favourable tax ruling in respect of prior period tax losses and the close out of the legacy foreign exchange contracts in 2003. The 2003 income tax charge includes a tax credit of $39 million arising from the partial recognition of Australian tax losses and other timing differences not previously brought to account.
The recoverability of the off-balance sheet tax benefits is not certain nor capable of reliable measurement. Accordingly, Accounting Standards do not permit any further recognition at this time. The amounts will be regularly assessed in accordance with Accounting Standards and Tax Law and recognised only when the criteria are satisfied.
10
| Actual 1H03 | Actual 2H03 | Actual FY03 | Pro forma FY02 | |||||
Contained nickel (‘000 tonnes) | ||||||||
- Concentrate | 55.1 | 62.6 | 117.7 | 106.4 | ||||
- Matte | 44.0 | 55.2 | 99.2 | 91.6 | ||||
- Metal | 29.7 | 31.7 | 61.4 | 65.1 | ||||
Copper (‘000 tonnes) | 91.3 | 68.8 | 160.1 | 178.1 | ||||
Uranium (tonnes) | 1,399 | 1,804 | 3,203 | 2,891 | ||||
Gold (‘000 ounces) | 50.3 | 35.8 | 86.1 | 64.3 | ||||
Fertilizer (‘000 tonnes) | ||||||||
- Di-ammonium phosphate | 371 | 389 | 760 | 718 | ||||
- Mono-ammonium phosphate | 102 | 60 | 162 | 103 | ||||
Total Fertilizer | 473 | 449 | 922 | 821 | ||||
Production Summary
For production commentary, please refer to Nickel, Copper and Fertilizer sections of this document.
11
Statement of Financial Performance
(A$ Million) | Actual 1H03 | Actual 2H03 | Actual FY03 | Pro forma FY02 | ||||||||
REVENUE | ||||||||||||
Nickel | 758.8 | 1,024.7 | 1,783.5 | 1,373.5 | ||||||||
Copper / Uranium | 362.6 | 333.7 | 696.3 | 765.0 | ||||||||
Fertilizer (QFO and Hi-Fert) | 255.9 | 158.9 | 414.8 | 432.6 | ||||||||
Other sales revenue | 17.3 | 17.3 | 34.6 | 28.0 | ||||||||
Sales revenue (pre hedging) | 1,394.6 | 1,534.6 | 2,929.2 | 2,599.1 | ||||||||
Revenue received/receivable from insurance claim and other | 0.3 | 3.9 | 4.2 | 91.4 | ||||||||
REVENUE from operations (pre hedging) | 1,394.9 | 1,538.5 | 2,933.4 | 2,690.5 | ||||||||
COSTS | ||||||||||||
Cash (includes commodity trading expenses) | (964.4 | ) | (915.3 | ) | (1,879.7 | ) | (1,785.8 | ) | ||||
Non Cash | (266.8 | ) | (316.4 | ) | (583.2 | ) | (594.1 | ) | ||||
Third party purchases | (154.2 | ) | (173.8 | ) | (328.0 | ) | (259.2 | ) | ||||
Change in stock | 29.0 | 50.6 | 79.6 | 93.4 | ||||||||
TOTAL COST OF SALES | (1,356.4 | ) | (1,354.9 | ) | (2,711.3 | ) | (2,545.7 | ) | ||||
Total EBIT (pre hedging) | 38.5 | 183.6 | 222.1 | 144.8 | ||||||||
EBIT | ||||||||||||
Nickel | 103.2 | 325.6 | 428.8 | 249.7 | ||||||||
Copper / Uranium | (42.2 | ) | (78.0 | ) | (120.2 | ) | 27.6 | |||||
Fertilizer | 4.5 | (35.8 | ) | (31.3 | ) | (27.2 | ) | |||||
Other EBIT from operations1 | 5.8 | 6.9 | 12.7 | (0.2 | ) | |||||||
EBIT from operations (pre hedging) | 71.3 | 218.7 | 290.0 | 249.9 | ||||||||
Net currency and commodity hedging gains/(losses) | 22.1 | 50.0 | 72.1 | (13.5 | ) | |||||||
EBIT from operations (post hedging) | 93.4 | 268.7 | 362.1 | 236.4 | ||||||||
Corporate | (8.7 | ) | (11.9 | ) | (20.6 | ) | (22.0 | ) | ||||
Corporate one-off items | 0.0 | (8.4 | ) | (8.4 | ) | (15.5 | ) | |||||
Finance and other costs | (1.1 | ) | (1.4 | ) | (2.5 | ) | 1.0 | |||||
Exploration and new business | (23.0 | ) | (13.4 | ) | (36.4 | ) | (68.6 | ) | ||||
Total EBIT | 60.6 | 233.6 | 294.2 | 131.3 | ||||||||
Net borrowing costs | (21.2 | ) | (25.1 | ) | (46.3 | ) | (57.4 | ) | ||||
PROFIT before income tax credit/(expense) | 39.4 | 208.5 | 247.9 | 73.9 | ||||||||
Income tax credit/(expense) | 7.6 | (9.9 | ) | (2.3 | ) | 1.5 | ||||||
PROFIT AFTER TAX | 47.0 | 198.6 | 245.6 | 75.4 | ||||||||
| 1 | Other EBIT from operations is matched by costs in Business Units with minimal net contribution to Group earnings |
Comparatives have been restated to reflect the reclassification of intragroup sales and purchases and additionalshared services cost allocations. As a result, Business Unit EBITs and unit costs have changed. There is noimpact on the overall consolidated pro forma results.
The table above includes line items which are not prepared under Australian GAAP. They have been included asthey are considered a useful measure of operational performance because they are commonly used by investorsto evaluate company results. Financial statements prepared in accordance with Australian GAAP can befound in the ASX Preliminary Final Report.
12
Statement of Financial Position
(A$ Million) | Actual Dec-03 | Actual Jun-03 | Actual Dec-02 | ||||||
Property, Plant & Equipment (including Acquired Mineral Rights) | |||||||||
Nickel | 1,242.5 | 1,279.8 | 1,269.3 | ||||||
Copper | 3,930.7 | 3,806.1 | 3,745.1 | ||||||
Fertilizer | 565.7 | 561.2 | 567.3 | ||||||
Other1 | 136.4 | 96.6 | 23.9 | ||||||
| 5,875.3 | 5,743.7 | 5,605.6 | |||||||
Working Capital | |||||||||
Nickel | 297.8 | 212.2 | 236.6 | ||||||
Copper | 215.5 | 213.8 | 250.0 | ||||||
Fertilizer | 81.2 | 165.4 | 97.5 | ||||||
Other | (61.4 | ) | (36.1 | ) | (76.5 | ) | |||
| 533.1 | 555.3 | 507.6 | |||||||
Corporate | |||||||||
Net deferred gains and creditor balances relating to hedging and debt revaluations | (915.8 | ) | (818.6 | ) | (707.5 | ) | |||
Tax balances (net of provision for deferred tax) | (337.3 | ) | (327.2 | ) | (336.3 | ) | |||
Exploration and evaluation expenditure capitalised | 68.5 | 83.8 | 152.7 | ||||||
Provisions | (189.5 | ) | (185.7 | ) | (175.7 | ) | |||
Other | 168.3 | 166.7 | 127.3 | ||||||
NET ASSETS FUNDED BY DEBT AND EQUITY | 5,202.6 | 5,217.9 | 5,173.6 | ||||||
Net Debt | 1,252.9 | 1,556.5 | 1,567.0 | ||||||
Shareholders’ Equity | 3,949.7 | 3,661.4 | 3,606.6 | ||||||
NET DEBT AND EQUITY | 5,202.6 | 5,217.9 | 5,173.6 | ||||||
| 1 | During the year $77.2m was transferred on finalisation of the Corridor Sands acquisition from Explorationand Evaluation to Acquired Mineral Rights. |
13
Statement of Cash Flows
(A$ Million) | Actual 1H03 | Actual 2H03 | Actual FY03 | Pro forma FY02 | ||||||||
EBITDA (pre hedging) | ||||||||||||
Nickel | 206.9 | 464.6 | 671.5 | 458.8 | ||||||||
Copper | 72.8 | 25.0 | 97.8 | 283.4 | ||||||||
Fertilizer | 25.3 | (13.5 | ) | 11.8 | 15.9 | |||||||
Corporate/New Business/Exploration/Other | (23.1 | ) | (27.7 | ) | (50.8 | ) | (94.1 | ) | ||||
| 281.9 | 448.4 | 730.3 | 664.0 | |||||||||
Movements in working capital | ||||||||||||
Nickel | 24.4 | (85.5 | ) | (61.1 | ) | (66.8 | ) | |||||
Copper | 36.2 | (1.7 | ) | 34.5 | (72.9 | ) | ||||||
Fertilizer | (67.9 | ) | 84.2 | 16.3 | (7.6 | ) | ||||||
Corporate/New Business/Exploration/Other | (40.4 | ) | 24.4 | (16.0 | ) | 51.1 | ||||||
| (47.7 | ) | 21.4 | (26.3 | ) | (96.2 | ) | ||||||
Other Balance Sheet movements | (0.4 | ) | 18.2 | 17.8 | (26.9 | ) | ||||||
Hedging payments / receipts | (38.4 | ) | 12.8 | (25.6 | ) | (158.1 | ) | |||||
Net borrowing costs paid | (6.0 | ) | (44.8 | ) | (50.8 | ) | (58.5 | ) | ||||
Income tax paid | (1.6 | ) | (1.3 | ) | (2.9 | ) | — | |||||
Cash flow from operations | 187.8 | 454.7 | 642.5 | 324.3 | ||||||||
Capital expenditure | ||||||||||||
Nickel | (118.9 | ) | (100.1 | ) | (219.0 | ) | (192.0 | ) | ||||
Copper | (171.0 | ) | (225.7 | ) | (396.7 | ) | (215.6 | ) | ||||
Fertilizer | (13.9 | ) | (26.6 | ) | (40.5 | ) | (50.3 | ) | ||||
Corporate/New Business/Exploration/Other | (1.2 | ) | (4.5 | ) | (5.7 | ) | (13.2 | ) | ||||
| (305.0 | ) | (356.9 | ) | (661.9 | ) | (471.1 | ) | |||||
Other investing cashflows | (1.2 | ) | 28.4 | 27.2 | 45.2 | |||||||
Net cash flow before financing and demerger costs | (118.4 | ) | 126.2 | 7.8 | (101.6 | ) | ||||||
Bond issue costs paid | (8.9 | ) | (1.0 | ) | (9.9 | ) | — | |||||
Interest rate swap close out | — | — | — | 71.2 | ||||||||
Payment on close out of interest rate hedge | (38.5 | ) | — | (38.5 | ) | — | ||||||
Demerger costs paid | (45.2 | ) | — | (45.2 | ) | — | ||||||
Net cash flow before debt and equity funding | (210.9 | ) | 125.1 | (85.8 | ) | (30.3 | ) | |||||
14
Reconciliation of Income Tax Credit / (Expense)
(A$ Million) | Actual 1H03 | Actual 2H03 | Actual FY03 | Pro forma FY02 | ||||||||
Operating profit before tax | 39.4 | 208.5 | 247.9 | 73.9 | ||||||||
Prima facie income tax expense at 30% | (11.8 | ) | (62.6 | ) | (74.4 | ) | (22.2 | ) | ||||
The following items caused the total (expense)/benefit for income tax to vary from the above: | ||||||||||||
Adjustment for hedging contracts fair valued at demerger | 18.2 | 17.4 | 35.6 | 43.4 | ||||||||
Fair value adjustment arising from acquisition of entities | — | (3.1 | ) | (3.1 | ) | 29.9 | ||||||
Non deductible depreciation or amortisation | 1.0 | (8.6 | ) | (7.6 | ) | (1.4 | ) | |||||
FITB recognised /(not brought to account) - overseas | (3.5 | ) | (0.8 | ) | (4.3 | ) | (1.7 | ) | ||||
FITB recognised /(not brought to account) - Australia | 1.9 | 37.3 | 39.2 | (48.9 | ) | |||||||
Other | 1.7 | 2.1 | 3.8 | 2.4 | ||||||||
Over provision of tax in prior year | 0.1 | 8.4 | 8.5 | — | ||||||||
Consequent reduction in charge for income tax | 19.4 | 52.7 | 72.1 | 23.7 | ||||||||
Income tax credit / (expense) for the period | 7.6 | (9.9 | ) | (2.3 | ) | 1.5 | ||||||
15
Commodity Prices and Exchange Rates
| Nickel | Copper | DAP | ||||||||||||
Financial Period Ended | US$/lb | A$/Ib | US$/lb | A$/Ib | US$/t | A$/t | US$/A$1.00 | |||||||
31 December 1999 | �� | |||||||||||||
First Half | 2.24 | 3.48 | 0.65 | 1.01 | 194 | 3.01 | 0.6438 | |||||||
Second Half | 3.21 | 4.96 | 0.77 | 1.19 | 159 | 246 | 0.6473 | |||||||
Full Year | 2.74 | 4.24 | 0.71 | 1.10 | 178 | 276 | 0.6456 | |||||||
31 December 2000 | ||||||||||||||
First Half | 4.28 | 7.01 | 0.80 | 1.31 | 146 | 239 | 0.6103 | |||||||
Second Half | 3.57 | 6.47 | 0.84 | 1.52 | 161 | 291 | 0.5538 | |||||||
Full Year | 3.92 | 6.73 | 0.82 | 1.41 | 154 | 265 | 0.5821 | |||||||
31 December 2001 | ||||||||||||||
First Half | 3.00 | 5.74 | 0.78 | 1.49 | 153 | 293 | 0.5228 | |||||||
Second Half | 2.41 | 4.70 | 0.66 | 1.29 | 141 | 275 | 0.5127 | |||||||
Full Year | 2.70 | 5.22 | 0.72 | 1.39 | 147 | 284 | 0.5175 | |||||||
31 December 2002 | ||||||||||||||
First Half | 2.97 | 5.56 | 0.72 | 1.35 | 154 | 288 | 0.5345 | |||||||
Second Half | 3.15 | 5.70 | 0.70 | 1.27 | 160 | 290 | 0.5525 | |||||||
Full Year | 3.07 | 5.65 | 0.71 | 1.31 | 157 | 289 | 0.5438 | |||||||
At 31 December 2002 | 3.22 | 5.70 | 0.70 | 1.24 | 149 | 264 | 0.5646 | |||||||
31 December 2003 | ||||||||||||||
First Half | 3.78 | 6.13 | 0.75 | 1.22 | 175 | 284 | 0.6166 | |||||||
Second Half | 4.93 | 7.17 | 0.86 | 1.25 | 182 | 265 | 0.6872 | |||||||
Full Year | 4.37 | 6.70 | 0.81 | 1.24 | 179 | 274 | 0.6523 | |||||||
At 31 December 2003 | 7.56 | 10.07 | 1.05 | 1.40 | 205 | 273 | 0.7507 | |||||||
US dollar prices and exchange rates sourced from Bloomberg
Improvements in commodity prices were offset by a strengthening Australian dollar relative to the US dollar. Positive factors for the Australian dollar included USD weakness resulting from poor economic and market conditions, along with interest rate differentials and a resilient domestic economy.
16
Commodity and Currency Hedging
During the year, the company closed out its 2005 to 2008 legacy currency hedge position and the majority of the gold hedge positions.
The legacy hedges were fair valued at the date of demerger. Consequently, the profit and loss for each hedge will be determined by the difference between a particular hedge’s fair valued rate and the spot price at the date of the hedge’s maturity. The table below shows both the rates at which the hedge transactions are contracted with third parties to determine the cash flow impact for each hedge and the fair valued rates for determining the profit and loss impact.
Hedging as at 31 December 2003
Period | Forward Sale of US$ | Synthetic Forward Sale of US$ | Non-limiting Cover | Profit & Loss Rate A$/US$ | ||||||||||
| Amount US$m | Cash Flow Rate A$/ US$ | Amount US$m | Cash Flow Rate A$/ US$ | Amount US$m | Cash Flow Rate A$/ US$ | |||||||||
2004 | 228 | 0.6753 | 20 | 0.6772 | 53 | 0.6271 | 0.5292 | |||||||
A synthetic forward consists of a bought US$ put and a written US$ call option. The written US$ call option has the potential to knock out above certain exchange rates.
As at 31 December 2003, 44,600 ounces of gold had been forward sold for 2005 at a cash flow rate of A$573 oz and a profit and loss rate of A$622. This position has subsequently been closed out.
Deferred profits
Profits arising on the close out of the legacy hedge book during 2003 have been deferred and will be recognized during 2004 to 2008 as shown in the tables below.
| Currency (A$m) | Gold (A$m) | |||||||
| 1H | 2H | 1H | 2H | |||||
2004 | 1.6 | 2.2 | ||||||
2005 | 54.5 | 60.2 | 0.5 | 0.7 | ||||
2006 | 37.3 | 41.8 | 1.1 | 1.4 | ||||
2007 | 40.5 | 42.1 | 1.2 | 1.6 | ||||
2008 | 43.0 | 47.5 | 1.1 | 1.5 | ||||
2009 | 1.3 | 1.7 | ||||||
2010 | 1.4 | 1.8 | ||||||
Deferred cashflows
In 2001 some foreign exchange and gold hedges were reversed as a result of the gold asset sales. The profit and loss in these transactions was realised in 2001, but the cash outflow will occur as shown in the table below.
| (A$m) | ||
2004 | 26.4 | |
2005 | 37.4 | |
2006 | 28.5 | |
2007 | 23.4 | |
2008 | 21.2 |
17
This page left intentionally blank
18

Market Review
Average US dollar nickel prices for 2003 increased 42 per cent compared to 2002. This was a result of favourable market fundamentals, including higher western world stainless steel production, strong Chinese nickel demand and limitations on near-to medium-term upside production capacity. In Australian dollar terms, the increase in nickel prices was a more modest 19 per cent.
Production
Nickel-in-concentrate was at its highest levels for five years following record production at Mount Keith, strong output from the Perseverance mine at Leinster and increased ore deliveries to the Kambalda concentrator.
Record performance during the second half of the year ensured that the Kalgoorlie nickel smelter met its full year target of 99,000 tonnes of nickel-in-matte.
Metal production at the Kwinana refinery returned to record levels in the final quarter. Overall metal production was 6% lower than 2002.
Financials
Earnings before interest and tax from the nickel operations were $429m, up $179m from 2002. Key variances from the prior year were:
| • | Revenue from operations increased by $326m due to higher realised nickel prices and higher sales volumes |
| • | The cost of purchased feed at Kambalda was $60m higher due to the higher nickel price. |
| • | Cash operating costs were 9.6% higher reflecting: |
| • | higher production: |
+ 3 per cent tonnes mined
+ 11 per cent nickel-in-concentrate
+ 8 per cent nickel-in-matte
| • | increased royalties due to the higher nickel price |
| • | costs associated with supplementary processing capacity to increase output at Mount Keith and Leinster |
| • | Non-cash costs were $22m higher primarily as a result of increased amortisation at the Harmony open cut mine at Leinster. |
Capital expenditure was $27m higher reflecting infrastructure development for the Perseverance lower mine at Leinster ($62m in 2003 compared to $18m in 2002) and the statutory maintenance shutdown at the Kalgoorlie smelter.
Current assets increased by $114m due to higher debtors balances and higher ore stocks at Leinster and Mount Keith at the end of the year.
Outlook
Concentrate production is expected to be lower in 2004 with completion of the Harmony open cut mine at Leinster and completion of higher grade ore from the bottom of Stage E pit at Mount Keith. Mount Keith output will be constrained in 2004 by the move into the new Stage F cutback which will yield lower ore grades and recoveries. Matte production at Kalgoorlie smelter is expected to be correspondingly lower (in the range of 90,000 to 95,000 tonnes).
Metal production at the Kwinana refinery is expected to be slightly higher at 62,000 tonnes with output constrained in the first half by the triannual statutory maintenance shutdown.
A key project for 2004 is the continued development of the Perseverance lower mine at Leinster. The project includes access tunnels, ventilation systems, crushing, materials handling and hoisting infrastructure to enable mining down to 1,100 metres below the surface. The majority of the project work will be completed by the end of 2005, with 2004 capital expenditure expected to be in the order of $70 million.
We are finalising an assessment of a small satellite deposit at 11 Mile Well, located eight kilometres south of the Leinster concentrator. The deposit is suited to open cut mining and has a lead time for overburden removal of around nine months. We expect to make a decision on the project during the first half of 2004.
19
FINANCIAL STATEMENTS
(A$ Million) | Actual 1H03 | Actual 2H03 | Actual FY03 | Pro forma FY02 | ||||||||
Profit & Loss | ||||||||||||
Revenue | ||||||||||||
Nickel | 633.0 | 897.1 | 1,530.1 | 1,207.4 | ||||||||
Intermediate Products | 47.6 | 45.5 | 93.1 | 90.2 | ||||||||
Revenue from Operations | 680.6 | 942.6 | 1,623.2 | 1,297.6 | ||||||||
Commodity Trading Revenue | 78.2 | 82.1 | 160.3 | 75.9 | ||||||||
Sales Revenue | 758.8 | 1,024.7 | 1,783.5 | 1,373.5 | ||||||||
Insurance and other | 0.1 | 3.9 | 4.0 | 5.3 | ||||||||
Total Revenue | 758.9 | 1,028.6 | 1,787.5 | 1,378.8 | ||||||||
Cash Costs | ||||||||||||
Production | (269.8 | ) | (274.2 | ) | (544.0 | ) | (496.5 | ) | ||||
Non-Production | (83.8 | ) | (87.8 | ) | (171.6 | ) | (156.1 | ) | ||||
Purchased Feed | (111.5 | ) | (146.4 | ) | (257.9 | ) | (198.2 | ) | ||||
Non Cash Costs | ||||||||||||
Production | (104.4 | ) | (142.9 | ) | (247.3 | ) | (207.6 | ) | ||||
Non-Production | (15.6 | ) | (15.5 | ) | (31.1 | ) | (49.1 | ) | ||||
Change in Stock | 7.5 | 43.6 | 51.1 | 54.2 | ||||||||
Cost of Sales of WMC product | (577.6 | ) | (623.2 | ) | (1,200.8 | ) | (1,053.3 | ) | ||||
Commodity Trading Expenses | (78.1 | ) | (79.8 | ) | (157.9 | ) | (75.8 | ) | ||||
Total Cost of Sales | (655.7 | ) | (703.0 | ) | (1,358.7 | ) | (1,129.1 | ) | ||||
EBIT (pre hedging) | 103.2 | 325.6 | 428.8 | 249.7 | ||||||||
Currency Hedging | 12.9 | 30.8 | 43.7 | (6.8 | ) | |||||||
EBIT (post hedging) | 116.1 | 356.4 | 472.5 | 242.8 | ||||||||
Depreciation and Amortisation | 103.7 | 139.0 | 242.7 | 209.1 | ||||||||
EBITDA (post hedging) | 219.8 | 495.4 | 715.2 | 451.9 | �� | |||||||
Operating cash flows | 230.5 | 374.8 | 605.3 | 423.8 | ||||||||
Capital Expenditure | ||||||||||||
Sustain | 28.6 | 37.4 | 66.0 | 44.9 | ||||||||
Enhance | 11.5 | 6.4 | 17.9 | 28.6 | ||||||||
Mine Capital Development | 70.8 | 55.9 | 126.7 | 118.2 | ||||||||
Capitalised Major Maintenance | 8.0 | 0.4 | 8.4 | 0.3 | ||||||||
Total | 118.9 | 100.1 | 219.0 | 192.0 | ||||||||
Balance Sheet | ||||||||||||
Current Assets | 341.5 | 471.9 | 471.9 | 358.0 | ||||||||
Non-Current Assets | 1,359.1 | 1,351.8 | 1,351.8 | 1,353.0 | ||||||||
Liabilities | (336.3 | ) | (328.8 | ) | (328.8 | ) | (301.1 | ) | ||||
Net Assets | 1,364.3 | 1,494.9 | 1,494.9 | 1,409.9 | ||||||||
Comparatives have been restated to reflect the reclassification of intragroup sales and purchases and additionalshared services cost allocations. As a result, Business Unit EBITs and unit costs have changed. There is noimpact on the overall consolidated pro forma results.
The table above includes line items which are not prepared under Australian GAAP. They have been included asthey are considered a useful measure of operational performance because they are commonly used by investorsto evaluate company results. Financial statements prepared in accordance with Australian GAAP can befound in the ASX Preliminary Final Report.
20
| Actual 1H03 | Actual 2H03 | Actual FY03 | Pro forma FY02 | |||||
Ratios/Unit Costs | ||||||||
Return on Net Assets (Annualised %) | 13.8 | 42.5 | 28.3 | 16.7 | ||||
Unit Cash Cost of Nickel Metal Production (A$/lb) | 2.44 | 2.06 | 2.24 | 2.13 | ||||
Unit Total Cost of Nickel Metal Sales (A$/lb) | 4.89 | 4.68 | 4.79 | 4.33 | ||||
Average Nickel Sales Price including hedging (A$/lb) | 6.21 | 7.18 | 6.70 | 5.59 |
21
Production
| Actual 1H03 | Actual 2H03 | Actual FY03 | Pro forma FY02 | |||||
Kambalda Nickel Operations | ||||||||
Ore treated (‘000 tonnes) | 422 | 383 | 805 | 688 | ||||
Head grade (%) | 3.57 | 3.59 | 3.58 | 3.79 | ||||
Total Concentrate produced (‘000 tonnes) | 93.6 | 87.7 | 181.3 | 159.0 | ||||
Concentrate grade (%) | 14.4 | 14.1 | 14.3 | 14.6 | ||||
Nickel in concentrate (‘000 tonnes) | 13.5 | 12.4 | 25.9 | 23.2 | ||||
Leinster Nickel Operations | ||||||||
Ore treated (‘000 tonnes) | 1,203 | 1,286 | 2,489 | 2,571 | ||||
Head grade (%) | 2.02 | 2.02 | 2.02 | 1.99 | ||||
Concentrate produced (‘000 tonnes) | 163.7 | 183.2 | 346.9 | 311.5 | ||||
Concentrate grade (%) | 12.1 | 12.0 | 12.1 | 12.8 | ||||
Nickel in concentrate (‘000 tonnes) | 19.8 | 22.0 | 41.8 | 40.0 | ||||
Mount Keith Nickel Operations | ||||||||
Ore treated (‘000 tonnes) | 5,387 | 5,812 | 11,200 | 11,055 | ||||
Head grade (%) | 0.59 | 0.66 | 0.63 | 0.58 | ||||
Concentrate produced (‘000 tonnes) | 110.2 | 137.0 | 247.2 | 217.6 | ||||
Concentrate grade (%) | 19.7 | 20.6 | 20.2 | 19.8 | ||||
Nickel in concentrate (‘000 tonnes) | 21.8 | 28.2 | 50.0 | 43.2 | ||||
Total Nickel in concentrate (‘000 tonnes) | 55.1 | 62.6 | 117.7 | 106.4 | ||||
Kalgoorlie Nickel Smelter (‘000 tonnes) | ||||||||
Concentrate treated | 328.1 | 383.0 | 711.1 | 640.5 | ||||
Nickel in concentrate treated from WMC sources | 32.5 | 44.0 | 76.5 | 71.7 | ||||
Nickel in concentrate treated from third party sources | 14.5 | 12.4 | 26.9 | 23.8 | ||||
Matte produced | 64.4 | 83.3 | 147.7 | 134.5 | ||||
Nickel in matte produced | 44.0 | 55.2 | 99.2 | 91.6 | ||||
Kwinana Nickel Refinery (‘000 tonnes) | ||||||||
Matte treated | 44.8 | 47.2 | 92.0 | 100.7 | ||||
Refined nickel produced | 29.7 | 31.7 | 61.4 | 65.1 | ||||
| Sales | ||||||||
Nickel (‘000 tonnes) | ||||||||
Nickel in concentrate | 7.3 | 7.6 | 14.9 | 14.1 | ||||
Nickel in matte | 14.1 | 22.4 | 36.5 | 25.7 | ||||
Metal | 30.3 | 30.6 | 60.9 | 64.8 | ||||
Total Nickel | 51.7 | 60.6 | 112.3 | 104.6 | ||||
Cobalt (tonnes) | 495 | 391 | 886 | 848 | ||||
22

Market Review
LME US dollar copper prices improved significantly in the second half of the year with strong consumption growth in Asia, and China in particular. The average US dollar price increased 14 per cent compared to 2002, however the strengthening of the Australian dollar resulted in a decrease of 5 per cent in the Australian dollar copper price for the year.
Spot uranium prices also increased strongly during the second half of 2003 in US dollar terms. WMC sells most of its uranium under long term contracts in which the spot price has a limited impact in the short term. The realised Australian dollar price for uranium declined relative to the prior year.
Production
Copper production in 2003 was impacted by the planned reline of the smelter furnace and failure of a heat exchanger in the acid plant.
Uranium production was 11% higher reflecting commissioning of the new uranium solvent extraction plant during the first half.
Gold production increased with the conversion into bullion of stocks built up in 2002.
Financial
Earnings before interest and tax for the copper uranium operation was a loss of $120m. This outcome primarily reflects the impact of operating the plant at rates less than design capacity due to the smelter furnace reline and the construction of the solvent extraction plants.
Key variances from the prior year include:
| • | Revenue from operations declined $69m as a result of lower copper sales, weak Australian |
| • | dollar prices for copper, and lower realised Australian dollar uranium prices. |
| • | Revenue in 2002 included $90m of insurance revenue (nil in 2003). |
| • | Cash operating costs were 6 per cent higher reflecting increases in both mining and administration/legal costs. |
| • | Purchases of finished copper increased to maintain the sales profile. |
| • | Non cash costs declined by $37m primarily as a result of higher accelerated depreciation in 2002. |
Capital expenditure of $397m includes construction of the copper and uranium solvent extraction plants and major maintenance and equipment replacement during the reline of the smelter furnace.
Outlook
Copper production is expected to be at design capacity following commissioning of the copper solvent extraction plant in the first quarter of 2004. Full year production is expected to be 230,000 to 235,000 tonnes of copper and 4,200 tonnes of uranium.
An important program in 2004 will be positioning the mine to progressively ramp up production rates to 11 million tonnes by the end of 2005 and towards 12 million tonnes by 2007. Total capital expenditure in the mine will correspondingly increase to approximately $80m in 2004 reflecting increased underground development, drilling, ventilation and mobile equipment. The increased mining rates will also require a reduction in the overall underground void with correspondingly higher backfill volumes and costs in the short to medium term.
The primary emphasis at Olympic Dam for 2004 remains on delivering sustained and consistent performance from all aspects of the operation.
23
(A$ Million) | Actual 1H03 | Actual 2H03 | Actual FY03 | Pro forma FY02 | ||||||||
Profit & Loss | ||||||||||||
Revenue | ||||||||||||
Revenue from operations | 362.6 | 333.7 | 696.3 | 765.0 | ||||||||
Revenue from insurance claim | — | — | — | 90.4 | ||||||||
Total Revenue | 362.6 | 333.7 | 696.3 | 855.4 | ||||||||
Cash Costs | ||||||||||||
Production | (185.9 | ) | (205.4 | ) | (391.3 | ) | (350.2 | ) | ||||
Non-Production* | (79.5 | ) | (82.9 | ) | (162.4 | ) | (174.5 | ) | ||||
Finished Goods Purchased | (42.7 | ) | (27.5 | ) | (70.2 | ) | (61.0 | ) | ||||
Non Cash Costs | ||||||||||||
Production | (106.9 | ) | (93.1 | ) | (200.0 | ) | (207.3 | ) | ||||
Non-Production* | (11.8 | ) | (21.7 | ) | (33.5 | ) | (63.3 | ) | ||||
Change in Stock | 22.0 | 18.9 | 40.9 | 28.5 | ||||||||
Total Cost of Sales | (404.8 | ) | (411.7 | ) | (816.5 | ) | (827.8 | ) | ||||
EBIT (pre hedging) | (42.2 | ) | (78.0 | ) | (120.2 | ) | 27.6 | |||||
Currency/Commodity Hedging | 6.9 | 15.8 | 22.7 | (5.3 | ) | |||||||
EBIT (post hedging) | (35.3 | ) | (62.2 | ) | (97.5 | ) | 22.3 | |||||
Depreciation and Amortisation | 115.0 | 103.0 | 218.0 | 255.8 | ||||||||
EBITDA (post hedging) | 79.7 | 40.8 | 120.5 | 278.1 | ||||||||
* Non-Production Costs includes idle capacity charge associated with the SX plant rebuild of: | (33.1 | ) | (15.4 | ) | (48.5 | ) | (97.6 | ) | ||||
Operating cash flows | 98.7 | 43.1 | 141.8 | 222.8 | ||||||||
Capital Expenditure | ||||||||||||
Sustain - Olympic Dam Operations | 17.4 | 49.4 | 66.8 | 37.2 | ||||||||
Sustain - SX plant rebuild | 126.1 | 107.1 | 233.2 | 127.8 | ||||||||
Enhance | 3.5 | 4.1 | 7.6 | 37.6 | ||||||||
Mine Capital Development | 7.0 | 7.8 | 14.8 | 13.0 | ||||||||
Capitalised Major Maintenance | 17.0 | 57.3 | 74.3 | — | ||||||||
Total | 171.0 | 225.7 | 396.7 | 215.6 | ||||||||
Balance Sheet | ||||||||||||
Current Assets | 379.6 | 362.2 | 362.2 | 398.1 | ||||||||
Non-Current Assets | 3,827.7 | 3,950.8 | 3,950.8 | 3,760.3 | ||||||||
Liabilities | (466.5 | ) | (443.8 | ) | (443.8 | ) | (462.2 | ) | ||||
Net Assets | 3,740.8 | 3,869.2 | 3,869.2 | 3,696.2 | ||||||||
Comparatives have been restated to reflect the reclassification of intragroup sales and purchases and additionalshared services cost allocations. As a result, Business Unit EBITs and unit costs have changed. There is noimpact on the overall consolidated pro forma results.
The table above includes line items which are not prepared under Australian GAAP. They have been includedthey are considered a useful measure of operational performance because they are commonly used by investorsto evaluate company results. Financial statements prepared in accordance with Australian GAAP can befound in the ASX Preliminary Final Report.
24
Actual 1H03 | Actual 2H03 | Actual FY03 | Pro forma FY02 | |||||
Ratios/Unit Costs | ||||||||
Return on Net Assets (Annualised %) | N/A | N/A | N/A | 0.7 | ||||
Unit Cash Cost of Production (A$/lb) | 0.68 | 0.64 | 0.68 | 0.58 | ||||
Unit Total Cost of Sales excluding idle capacity charge | ||||||||
associated with the SX fire (A$/lb) | 1.23 | 1.55 | 1.38 | 1.19 | ||||
Unit Total Cost of Sales including idle capacity charge | ||||||||
associated with the SX fire (A$/lb) | 1.38 | 1.63 | 1.50 | 1.36 | ||||
Average Copper Sales Price including hedging (A$/lb) | 1.25 | 1.29 | 1.27 | 1.30 | ||||
PRODUCTION
| ||||||||
Actual 1H03 | Actual 2H03 | Actual FY03 | Pro forma FY02 | |||||
Ore hoisted (‘000 tonnes) | 4,147 | 4,857 | 9,004 | 8,732 | ||||
Ore treated (‘000 tonnes) | 4,276 | 4,110 | 8,386 | 8,875 | ||||
Copper ore grade (%) | 2.36 | 2.48 | 2.42 | 2.57 | ||||
Copper produced (‘000 tonnes) | 91.3 | 68.8 | 160.1 | 178.1 | ||||
Uranium ore grade (kg/tonne) | 0.63 | 0.63 | 0.63 | 0.69 | ||||
Uranium produced (tonnes) | 1,399 | 1,804 | 3,203 | 2,891 | ||||
Gold ore grade (g/tonne) | 0.49 | 0.45 | 0.47 | 0.53 | ||||
Gold produced (‘000 ounces) | 50.3 | 35.8 | 86.1 | 64.3 | ||||
Silver ore grade (g/tonne) | 4.28 | 4.99 | 4.63 | 4.29 | ||||
Silver produced (‘000 ounces) | 323.0 | 278.4 | 601.4 | 644.0 | ||||
SALES
| ||||||||
Actual 1H03 | Actual 2H03 | Actual FY03 | Pro forma FY02 | |||||
Copper ('000 tonnes) | 90.8 | 83.7 | 174.5 | 186.1 | ||||
Uranium Oxide (tonnes) | 2,168 | 2,407 | 4,575 | 3,888 | ||||
25
This page left intentionally blank
26
Market Review
Di-ammonium phosphate (DAP) prices improved toward the end of the year with an increase in average US dollar prices of 14 per cent compared to 2002. However, the increase in the US dollar price was more than offset by the strengthening Australian dollar, with the result that realised Australian dollar fertilizer prices declined by 5 per cent during the year.
Production
Total fertilizer production increased 12 percent to record levels. The plant achieved full year production equivalent to 100 per cent of design capacity after accounting for a planned 15 day statutory maintenance shutdown which was completed on time and under budget in the third quarter. Production of mono-ammonium phosphate based products was 57 per cent higher than 2002, consistent with our plans to increase our share of this segment of the Australian fertilizer market.
Financials
Earnings before interest and tax for Queensland Fertilizer Operations increased by $6m. Higher production volumes and lower total costs more than offset the revenue impact of the decline in the realised Australian dollar fertilizer prices. This improvement was offset by a $10m decline in the contribution from Hi-Fert, which suffered from lower sales volumes and margins due to the drought. Cash costs were in line with 2002 and non cash costs declined slightly. This is particularly pleasing given the 12 per cent increase in production volumes.
The change in stock reflects an increase in finished product at the end of the year due to strong production volumes and the timing of sales.
Capital expenditure was $10m lower than 2002 primarily reflecting a lower level of sustaining capital expenditure now that the plant is operating at design rates.
Outlook
The Queensland Fertilizer Operation is expected to produce 960,000 tonnes of fertilizer in 2004. Trials are underway at Phosphate Hill to increase the production of mono-ammonium phosphate fertilizer and to produce a sulphur-fortified variation to meet customer demand.
We have also developed a program of low cost de-bottlenecking to increase annual production by 15% to around 1.1 million tonnes per annum over the next few years.
27
(A$ Million) | Actual 1H03 | Actual 2H03 | Actual FY03 | Pro forma FY02 | ||||||||
Profit & Loss | ||||||||||||
Revenue | ||||||||||||
Fertilizer sales revenue | 156.8 | 103.9 | 260.7 | 276.0 | ||||||||
Total Revenue | 156.8 | 103.9 | 260.7 | 276.0 | ||||||||
Cash Costs | ||||||||||||
Production | (108.7 | ) | (103.0 | ) | (211.7 | ) | (211.5 | ) | ||||
Non-Production | (23.6 | ) | (26.3 | ) | (49.9 | ) | (49.4 | ) | ||||
Non Cash Costs | ||||||||||||
Production | (19.1 | ) | (19.4 | ) | (38.5 | ) | (42.4 | ) | ||||
Non-Production | 0.9 | (2.4 | ) | (1.5 | ) | (3.8 | ) | |||||
Change in Stock | (11.0 | ) | 15.9 | 4.9 | (10.5 | ) | ||||||
Total Cost of Sales | (161.5 | ) | (135.2 | ) | (296.7 | ) | (317.6 | ) | ||||
QFO EBIT (pre hedging) | (4.7 | ) | (31.3 | ) | (36.0 | ) | (41.6 | ) | ||||
Profit/(Loss) from Hi-Fert | 9.2 | (4.5 | ) | 4.7 | 14.4 | |||||||
Fertilizer EBIT (pre hedging) | 4.5 | (35.8 | ) | (31.3 | ) | (27.2 | ) | |||||
Currency Hedging | 2.3 | 3.4 | 5.7 | (1.4 | ) | |||||||
EBIT (post hedging) | 6.8 | (32.4 | ) | (25.6 | ) | (28.6 | ) | |||||
QFO Depreciation and Amortisation | 18.9 | 20.5 | 39.4 | 39.5 | ||||||||
Hi-Fert Depreciation and Amortisation | 1.9 | 1.8 | 3.7 | 3.6 | ||||||||
Fertilizer EBITDA (post hedging) | 27.6 | (10.1 | ) | 17.5 | 14.5 | |||||||
Operating cash flows (QFO only) | 11.6 | (16.5 | ) | (4.9 | ) | 23.5 | ||||||
Capital Expenditure | ||||||||||||
QFO | ||||||||||||
Sustain | 4.3 | 7.5 | 11.8 | 25.0 | ||||||||
Enhance | 0.3 | 1.7 | 2.0 | 0.7 | ||||||||
Mine Capital Development | (0.3 | ) | 0.6 | 0.3 | 16.2 | |||||||
Capitalised Major Maintenance | 8.9 | 15.0 | 23.9 | 6.2 | ||||||||
Total | 13.2 | 24.8 | 38.0 | 48.1 | ||||||||
Hi-Fert | 0.7 | 1.8 | 2.5 | 2.2 | ||||||||
Fertilizer Capital Expenditure | 13.9 | 26.6 | 40.5 | 50.3 | ||||||||
Balance Sheet (QFO) | ||||||||||||
Current Assets | 49.6 | 57.1 | 57.1 | 49.6 | ||||||||
Non-Current Assets | 553.5 | 587.7 | 587.7 | 554.3 | ||||||||
Liabilities | (60.3 | ) | (58.1 | ) | (58.1 | ) | (43.6 | ) | ||||
Net Assets | 542.8 | 586.7 | 586.7 | 560.3 | ||||||||
Balance Sheet (Hi-Fert) | ||||||||||||
Current Assets | 180.2 | 82.1 | 82.1 | 93.2 | ||||||||
Non-Current Assets | 27.0 | 26.6 | 26.6 | 28.1 | ||||||||
Liabilities | (33.1 | ) | (27.5 | ) | (27.5 | ) | (18.1 | ) | ||||
Net Assets | 174.1 | 81.2 | 81.2 | 103.2 | ||||||||
Comparatives have been restated to reflect the reclassification of intragroup sales and purchases and additionalshared services cost allocations. As a result, Business Unit EBITs and unit costs have changed. There is noimpact on the overall consolidated pro forma results.
The table above includes line items which are not prepared under Australian GAAP. They have been included asthey are considered a useful measure of operational performance because they are commonly used by investorsto evaluate company results. Financial statements prepared in accordance with Australian GAAP can befound in the ASX Preliminary Final Report.
28
| Actual 1H03 | Actual 2H03 | Actual FY03 | Pro forma FY02 | |||||
Ratios/Unit Costs (QFO only) | ||||||||
Unit Cash Cost of Fertilizer Production (A$/t) | 228 | 236 | 233 | 244 | ||||
Unit Cost of Fertilizer Sales (A$/t) | 312 | 360 | 332 | 364 | ||||
Average DAP Sales Price including hedging (A$/t) | 281 | 263 | 274 | 281 | ||||
Average DAP Sales Price excluding hedging (A$/t) | 277 | 254 | 267 | 283 | ||||
PRODUCTION
| ||||||||
Actual 1H03 | Actual 2H03 | Actual FY03 | Pro forma FY02 | |||||
Di-Ammonium Phosphate (DAP) (‘000 tonnes) | 371 | 389 | 760 | 718 | ||||
Mono-Ammonium Phosphate (MAP) (‘000 tonnes) | 102 | 60 | 162 | 103 | ||||
Total Fertilizer (‘000 tonnes) | 473 | 449 | 922 | 821 | ||||
SALES
| ||||||||
Actual 1H03 | Actual 2H03 | Actual FY03 | Pro forma FY02 | |||||
QFO (‘000 tonnes) - third parties | 327 | 362 | 689 | 606 | ||||
QFO (‘000 tonnes) - via Hi-Fert | 186 | 19 | 205 | 294 | ||||
Hi-Fert - Purchased Product (‘000 tonnes) - third parties | 213 | 137 | 350 | 354 | ||||
29
This page left intentionally blank
30
Corridor Sands
The acquisition of the Corridor Sands project was completed during the year. The Industrial Development Corporation of South Africa agreed to exercise its option over 10 per cent of the Corridor Sands project in Mozambique, however completion of this option exercise is still subject to approval of the Reserve Bank of South Africa.
Additional studies were carried out during the year, including refining cost estimates and seeking environmental approvals for export infrastructure, investigation of alternative power supply options and optimisation of the mining plan. Discussions continued with potential partners for the project and with market participants on moving towards offtake contracts. WMC’s objective is for the project to be developed to meet the estimated market window for additional chloride slag at the end of 2007/early 2008. This would require the alignment of the technical, marketing, financing and partnership aspects of the project for a development decision during 2005.
Meliadine
In a transaction completed in the final quarter of 2003, the WMC Canadian subsidiary that held its 56 percent interest in the Meliadine project (and other Canadian exploration assets) was merged into Comaplex Minerals Corp. (a company listed on the Toronto stock exchange). WMC received US$6.75m in cash and approximately 17 per cent of Comaplex’s issued shares.
Exploration
Collurabbie
Drilling at Collurabbie, located 170km east-north-east of Mount Keith, intersected disseminated nickel-copper-PGE sulphide mineralisation over a 7 kilometre strike length. Results are currently being assessed and drilling is planned to recommence in March.
West Musgrave
Initial definition of the Nebo and Babel prospects was completed during the year with significant in-situ mineralisation identified. While the prospects have future potential, the mineralisation has not been categorised as resources at this stage. The exploration agreement with the Ngaanyatjarra Land Council was expanded to enable ground access to new areas that contain previously identified electromagnetic anomalies, and it is intended to drill these areas in 2004.
Mundra South
Access agreements were negotiated for the Mundra South areas in Western Australia and geologic targets are being prepared for drilling.
International
Exploration continued for new discoveries in various countries internationally, including programs in China, Mongolia, Tanzania, Peru and the USA. Targeting was focused on nickel sulphide, copper-gold and gold deposits.
Olympic Dam expansion study
In 2003 work continued to optimise and build on the outcomes of the previous Scoping Study. This work has allowed a more detailed analysis of the key drivers for the various options to expand production at Olympic Dam.
A surface-drilling program of 39,000 metres was undertaken. This delivered geotechnical information to allow further refinement of the mining options being studied, while also adding to the reserve and resource knowledge. With the additional geological data an extensive modelling program allowed the narrowing of potential mining options and also the development of the next phase of the drilling program.
31

Other work undertaken during the year included a review of smelting options, an analysis of the integration of the existing surface facilities for optimum capital utilisation and a preliminary review of a heap leaching option. Studies into the provision of site services and infrastructure, in particular power, water and transport, were advanced with assistance of the South Australian Government and major suppliers.
The studies have defined a program of work for 2004 which includes the next phase of drilling and further assessment of the most prospective mining options.
Fertilizer review
A strategic review of the Fertilizer business was undertaken in the second half of the year. The review determined that a continued increase in the relative proportion of MAP production and progressive de-bottlenecking of the operation is the best alternative to increase the value of the business. The review included discussions with a number of industry participants, but concluded that our current ownership arrangement is the most appropriate means of realising any such increase in value.
32
Average sales price (excluding hedging)
Australian dollar sales price per unit received inclusive of contractual premiums, discounts or rebates.
Average sales price (including hedging)
Australian dollar sales price per unit received inclusive of pro rated currency hedging gains or losses.
Capitalised major maintenance
Costs related to planned cyclical maintenance capitalised and amortised over the period to the next major shut-down (where this period is greater than twelve months).
Cash flow from Operations to Net Debt
The percentage of annualised net cash flow from operations relative to net debt.
Earnings per share (EPS)
Basic EPS: Profit after tax divided by the weighted average number of ordinary shares on issue during the period.
Diluted EPS: Profit after tax divided by the weighted average number of ordinary and potential ordinary shares on issue during the period.
Enhance capital
Capital expenditure where there is a high degree of confidence that a discrete return on expenditure will be achieved through increased production or a reduction in operating costs.
Frequency Rate (FR)
Number of lost time and medically treated injuries per million hours exposure.
GAAP
Generally accepted accounting principles in Australia.
Idle capacity
Idle capacity reflects a situation where productive assets are not used at their full or near full capacity. This may result from a shortage of material to process, a shutdown for maintenance or be due to an industrial dispute. Costs are proportionately reallocated from production to non-production costs with the effect that they are charged immediately against earnings as opposed to being included in the valuation of stocks and charged to earnings as product is sold.
Interest Cover
Earnings before interest, taxes, depreciation and amortisation and hedging divided by net interest expense incurred before subtracting capitalised interest.
LME
London Metal Exchange.
Lost Time Injury (LTI)
An injury that results in at least one full shift being lost at some time (not necessarily immediately) after the shift during which the injury occurred, providing it is not a rostered day off.
Mine capital development
Costs of establishing access to ore where the access is expected to be used for production over greater than twelve months.
Medically Treated Injury (MTI)
Injuries that do not result in lost work days, but require medical treatment (including restricted work).
33
Return on Net Assets
Business Units earnings before interest, tax and hedging divided by average net assets (excluding tax assets, liabilities and intra-group assets).
Return on Equity
Operating profit after tax divided by total shareholders’ equity.
Return on Invested Capital
The annualised earnings before interest and tax as a percentage of funds employed in the business (shareholders’ equity and net debt).
Sustain Capital
Capital expenditure to maintain the operations at current level of performance with no material impact on production or reduction in the cost base.
Unit Cash Cost of Production
Cash costs directly attributable to production (excludes sales and distribution, royalties, idle capacity and R&D costs amongst others) less the value of by-products produced divided by production volumes.
Unit Total Cost of Sales
‘Unit Cost of Sales’ is ‘Total Cost of Sales’ less co-product revenue divided by product sold. ‘Total Cost of Sales’ includes all production and non production costs, and stock movements.
Working Capital
Working capital includes net current trade and other debtors, inventories, and trade and other creditors.
34
Table of Contents
| 1 | ||||
| 2 | ||||
| 2 | ||||
| 2 | ||||
| 3 | ||||
| 4 | ||||
| 5 | ||||
1. | 7 | |||
2. | 7 | |||
3. | 8 | |||
4. | 10 | |||
5. | 11 | |||
6. | 11 | |||
7. | 15 | |||
8. | 16 | |||
9. | 16 | |||
10. | 16 | |||
11. | 16 | |||
12. | 18 | |||
13. | Reconciliation of profit/(loss) from ordinary activities after income tax to net cash flow provided by operating activities | 19 | ||
14. | 19 | |||
15. | 19 | |||
16. | 20 | |||
17. | 20 | |||
18. | 20 | |||

WMC Resources Ltd - ABN 76 004 184 598
Year ended 31 December 2003 (“Current period”)
(Previous corresponding period: Year ended 31 December 2002)
Results for announcement to the market
| 2002 | 2003 | ||||||||
| $M | $M | ||||||||
Revenues from ordinary activities | up from | 2,107.4 | to | 3,064.7 | |||||
Profit from ordinary activities after tax attributable to members | up from a loss of | (43.7 | ) | to a profit of | 245.6 | ||||
Net profit for the period attributable to members | up from a loss of | (43.7 | ) | to a profit of | 245.6 |
Dividends
| 2003 | ||
Interim dividend per share (cents) | Nil | |
Final dividend per share (cents) | 6.0 | |
Franked amount per share (cents) | Nil | |
Record date for determining entitlements to the dividend | 2 April 2004 |
Basis of preparation
The financial statements for the year ended 31 December 2003 as presented on pages 1 to 20 reflect the financial performance of the operations of the WMC Resources Ltd group for the full financial year.
In compliance with Australian Accounting Standards and the Corporations Act 2001, comparative figures for the year ended 31 December 2002, reflect the results of the nickel operations, corporate and exploration activities for the full financial year but only include the results of the copper-uranium, fertilizer and finance activities, acquired at demerger on 1 December 2002, for one month.
Explanation of Revenue
Revenue from ordinary activities for 2003 was $3,065 million, reflecting 12 months activities of the operations now comprising the WMC Resources group. Revenue for the 2002 year only included one month’s activities for Copper and Fertilizer post demerger.
Explanation of Profit from ordinary activities after tax
The consolidated group recorded a profit after tax of $246 million compared with a loss in 2002 of $44 million. The current year reflects a full year’s contribution from all operations. The prior year reflected only one month’s results from Copper and Fertilizer and a number of significant items. Nickel business delivered a strong performance during a time of high nickel prices offset by a decline in Copper and Fertilizer contributions. Further details in respect of the group’s financial performance are set out on page 5.
Audit report
This preliminary final report is based on accounts which have been audited. The audit report, which was unqualified, will be made available with the company’s financial report.
1
Consolidated statement of financial performance
| Notes | 2003 | 2002 | ||||||
| $M | $M | |||||||
Operating revenues | 3,001.3 | 1,456.3 | ||||||
Proceeds from sale of assets other than goods | 37.2 | 62.7 | ||||||
Interest received/receivable | 22.0 | 525.3 | ||||||
Other revenue from outside the operating activities | 4.2 | 63.1 | ||||||
Revenue from ordinary activities | 2 | 3,064.7 | 2,107.4 | |||||
Cost of goods sold | (2,083.4 | ) | (1,008.6 | ) | ||||
Selling and distribution expenses | (239.2 | ) | (31.9 | ) | ||||
General and administrative expenses | (229.1 | ) | (207.9 | ) | ||||
Exploration and evaluation expenses | (28.0 | ) | (14.4 | ) | ||||
Borrowing costs | (68.3 | ) | (930.5 | ) | ||||
Other expenses from ordinary activities | (168.8 | ) | (111.3 | ) | ||||
Profit/(loss) from ordinary activities before income tax | 247.9 | (197.2 | ) | |||||
Income tax (expense)/credit relating to ordinary activities | 4 | (2.3 | ) | 153.5 | ||||
Net profit/(loss) attributable to members of WMC Resources Ltd | 245.6 | (43.7 | ) | |||||
Transfer of asset revaluation reserve to retained earnings | (24.5 | ) | — | |||||
Net exchange differences recognised directly in equity | (3.7 | ) | 6.2 | |||||
Net transfers to retained earnings | 31.4 | — | ||||||
Total revenues, expenses and valuation adjustments attributable to members of WMC Resources Ltd and recognised directly in equity | 3.2 | 6.2 | ||||||
Total changes in equity other than those resulting from transactions with owners as owners | 248.8 | (37.5 | ) | |||||
The above consolidated statement of financial performance should be read in conjunction with the accompanying notes.
The financial statements for the year ended 31 December 2003 as presented on pages 1 to 20 reflect the financial performance of the operations of the WMC Resources Ltd group for the full financial year. In compliance with Australian Accounting Standards and the Corporations Act 2001, comparative figures for the year ended 31 December 2002, reflect the results of the nickel operations, corporate and exploration activities for the full financial year but only include the results of the copper-uranium, fertilizer and finance activities acquired at demerger on 1 December 2002, for one month.
| 2003 | 2002 | ||||
Basic EPS (cents) | 21.7 | (5.1 | ) | ||
Diluted EPS (cents) | 21.7 | (5.1 | ) | ||
| |||||
| 2003 | 2002 | ||||
Net tangible assets per share ($) | 3.43 | 3.19 | |||
2
Consolidated statement of financial position
| Notes | 2003 | 2002 | |||||
| $M | $M | ||||||
CURRENT ASSETS | |||||||
Cash assets | 100.3 | 90.5 | |||||
Receivables | 450.4 | 557.7 | |||||
Other financial assets | 13.1 | 12.7 | |||||
Inventories | 545.8 | 468.8 | |||||
Other | 68.1 | 69.6 | |||||
Total current assets | 1,177.7 | 1,199.3 | |||||
NON-CURRENT ASSETS | |||||||
Receivables | 277.3 | 218.8 | |||||
Other financial assets | 21.3 | 12.3 | |||||
Inventories | 71.2 | 74.9 | |||||
Exploration and evaluation | 9 | 68.5 | 152.7 | ||||
Property, plant and equipment | 4,520.5 | 4,336.3 | |||||
Acquired mineral rights | 10 | 1,354.8 | 1,269.3 | ||||
Deferred tax assets | 46.0 | 44.6 | |||||
Other | 11 | 22.9 | 39.9 | ||||
Total non-current assets | 6,382.5 | 6,148.8 | |||||
TOTAL ASSETS | 7,560.2 | 7,348.1 | |||||
CURRENT LIABILITIES | |||||||
Payables | 432.2 | 657.9 | |||||
Interest-bearing liabilities | 212.0 | 1,287.6 | |||||
Current tax liabilities | 1.3 | 3.9 | |||||
Provisions | 67.7 | 66.0 | |||||
Other | 11 | 184.4 | 17.0 | ||||
Total current liabilities | 897.6 | 2,032.4 | |||||
NON-CURRENT LIABILITIES | |||||||
Payables | 379.2 | 849.7 | |||||
Interest-bearing liabilities | 1,141.2 | 369.9 | |||||
Deferred tax liabilities | 382.0 | 377.0 | |||||
Provisions | 121.8 | 109.7 | |||||
Other | 11 | 688.7 | 2.8 | ||||
Total non-current liabilities | 2,712.9 | 1,709.1 | |||||
TOTAL LIABILITIES | 3,610.5 | 3,741.5 | |||||
NET ASSETS | 3,949.7 | 3,606.6 | |||||
EQUITY | |||||||
Contributed equity | 3,747.7 | 3,653.4 | |||||
Reserves | 2.5 | 30.7 | |||||
Retained profits/(accumulated losses) | 12 | 199.5 | (77.5 | ) | |||
TOTAL EQUITY | 3,949.7 | 3,606.6 | |||||
The above consolidated statement of financial position should be read in conjunction with the accompanying notes.
3
Consolidated statement of cash flows
| Notes | 2003 | 2002 | ||||||
| $M | $M | |||||||
CASH FLOWS FROM OPERATING ACTIVITIES | ||||||||
Receipts from customers | 2,987.3 | 1,454.4 | ||||||
Payments to suppliers and employees | (2,251.8 | ) | (1,281.3 | ) | ||||
Payments on settlement of hedge contracts | (46.9 | ) | (11.4 | ) | ||||
Receipts from early close out of legacy foreign exchange contracts | 18.6 | — | ||||||
Receipts from early close out of commodity hedge contracts | 2.7 | — | ||||||
Interest received | 20.3 | 28.2 | ||||||
Borrowing costs paid | (71.1 | ) | (23.5 | ) | ||||
Income taxes paid | (2.9 | ) | — | |||||
Payments for exploration: | ||||||||
- Grassroots | (20.7 | ) | (10.9 | ) | ||||
- Additional, supporting existing operations | (3.5 | ) | (3.5 | ) | ||||
Proceeds from insurance claims (business interruption) | 10.5 | — | ||||||
Net cash provided by operating activities | 13 | 642.5 | 152.0 | |||||
CASH FLOWS FROM INVESTING ACTIVITIES | ||||||||
Payments for property, plant and equipment | (661.9 | ) | (236.3 | ) | ||||
Payments for evaluation expenditure | (7.3 | ) | (1.2 | ) | ||||
Proceeds from sale of non-current assets | 22.6 | 62.7 | ||||||
Demerger costs paid | (45.2 | ) | (21.7 | ) | ||||
Proceeds from insurance claims (material damage) | 12.0 | 16.5 | ||||||
Payments for research and development | (0.1 | ) | (0.3 | ) | ||||
Net cash used in investing activities | (679.9 | ) | (180.3 | ) | ||||
CASH FLOWS FROM FINANCING ACTIVITIES | ||||||||
Proceeds from issues of shares | 54.8 | 600.0 | ||||||
Redemption costs on Yankee Bonds | — | (150.2 | ) | |||||
Global bond issue costs paid | (9.9 | ) | — | |||||
Payment on close-out of interest rate hedge | (38.5 | ) | — | |||||
Proceeds from borrowings | 1,086.5 | 992.0 | ||||||
Repayments of borrowings | (1,032.6 | ) | (1,388.2 | ) | ||||
Net cash provided by financing activities | 60.3 | 53.6 | ||||||
Net increase in cash held | 22.9 | 25.3 | ||||||
Cash at the beginning of the financial year | 90.5 | — | ||||||
Cash balances acquired on acquisition of controlled entities | — | 65.2 | ||||||
Effect of exchange rate changes on opening foreign currency cash balances | (13.1 | ) | — | |||||
Cash at the end of the financial year | 100.3 | 90.5 | ||||||
The above consolidated statement of cash flows should be read in conjunction with the accompanying notes.
The financial statements for the year ended 31 December 2003 as presented on pages 1 to 20 reflect the financial performance of the operations of the WMC Resources group for the full financial year. In compliance with Australian Accounting Standards and the Corporations Act 2001, comparative figures for the year ended 31 December 2002, reflect the results of the nickel operations, corporate and exploration activities for the full financial year but only include the results of the copper-uranium, fertilizer and finance activities acquired at demerger on 1 December 2002, for one month.
Non-cash financing and investing activities
In December 2003, WMC Resources made the final contractual payment for the acquisition of the Corridor Sands project from Southern Mining Corporation Limited Group (‘SMC’). WMC acquired Corridor Sands from SMC in December 2002. The final payment was made by the issue of 6,715,123 WMC Resources Ltd shares.
4
Statement of financial performance
The statement of financial performance reflects the results of the operations now comprising the WMC Resources Ltd group for the full financial year. The 2002 comparative financial reporting information reflects the results of the nickel operations and corporate activities for the full 2002 year but only includes the results of the copper-uranium and fertilizer operations and finance, exploration and development activities for December 2002, the month following demerger.
In 2003, the consolidated group recorded a profit after tax of $246 million from revenue generated by ordinary activities of $3,065 million. The prior year loss of $44 million reflected one month’s contribution from Copper and Fertilizer and a number of significant items.
The Copper operations made a loss of $120 million (pre-hedging) for the year on revenues of $696 million. This outcome primarily reflects the impact of operating the plant at rates less than design capacity, due to the smelter furnace reline and construction of the copper and uranium solvent extraction plants.
Earnings from nickel operations were $429 million (pre-hedging) for the year on revenues of $1,784 million. The earnings outcome reflects strong US dollar nickel prices and higher sales volumes.
The fertilizer operations made a loss of $31 million (pre-hedging) on revenues of $415 million. Despite strong US dollar di-ammonium phosphate prices, earnings were adversely impacted by the strengthening Australian dollar. Lower year-on-year realised Australian dollar prices overshadowed excellent production performance from the Queensland Fertilizer Operations. The contribution from WMC’s distribution arm, Hi Fert, was impacted by lower sales volumes and margins due to the drought.
Hedging gains contributed $72 million to the group result, reflecting the strength of the Australian dollar relative to the value of the hedge book.
Net borrowing costs of $46 million are net of $9 million interest capitalised in respect of major projects during the year.
A charge of $8 million has been taken against 2003 earnings relating to the further rationalisation of our shared services model.
The merger of WMC’s interest in Meliadine with Comaplex Minerals Corp. contributed $10 million after tax.
The tax charge for the year was $2 million, including a tax credit of $39 million arising from the partial recognition of Australian tax losses and other timing differences not previously brought to account.
The net profit after tax translates to a basic and diluted earnings per share of 21.7 cents and a return on equity of 6.2 per cent.
On 11 February 2004 the directors declared an unfranked dividend of 6 cents per share.
Other factors which will impact future results:
The legacy currency hedge book for 2005 to 2008 was closed out during the year at a net cash gain of $18 million. The resulting profit of $367 million has been deferred and will be recognised over the years of 2005 to 2008 in line with the underlying production. The portion of the hedge book relating to 2004, comprising forward cover and options for US$300 million of revenue, was not closed out.
The majority of the gold hedge positions, covering maturities from 2004 to 2010, were closed out in 2003. The gains and losses on the contracts are deferred until the underlying production occurs.
5
Commentary on results (continued)
Statement of financial position
The group is in a sound financial position. As an operator of large world-class assets we seek to finance our assets and growth opportunities with a mix of equity and debt financing that best balances risk and reward to shareholders.
WMC Resources concluded the year with gearing (measured as net debt to net debt-plus-equity) at 24%.
At 31 December 2003, total assets were $7.6 billion, an increase of $300 million from 31 December 2002. The increase largely reflects capital expenditure of $662 million partly offset by depreciation and amortisation of $508 million.
The company completed a two tranche debt issue in the US bond market in May 2003, including US$500 million 10-year notes and US$200 million 30-year notes. The proceeds from the offering were used to retire short-term US denominated debt. Consequently, the profile of debt has been extended.
The strong appreciation of the Australian dollar and close out of the 2005 – 2008 legacy currency hedge books has resulted in a substantial movements in hedge related balances (largely deferred gains) year-on-year.
Contributed equity increased by $94 million during the year from the issue of shares on conversion of employee options and settlement of the final contractual acquisition payment for Corridor Sands.
Total equity of $3.9 billion was strengthened by the 2003 profit after tax of $246 million.
Statement of cash flows
Cash flow from operations rose appreciably during the year to $643 million reflecting a full twelve months contribution from WMC’s operations, improved nickel price, strong nickel and uranium sales and partial realisation of Copper and Fertilizer working capital balances.
Capital expenditure for 2003 was $662 million including expenditure on the construction of the Olympic Dam solvent extractions plants and scheduled major maintenance programs across WMC’s operations.
The proceeds from the global bond issues were used to retire short-term debt.
Overall, net cash flow was impacted by the payment of demerger costs and one-off financing arrangements, notably the close out of an interest rate hedge and global bond issue costs.
The 6 cent dividend ($69 million) declared on 11 February 2004 will be reflected in the 2004 financial statements and cash flows.
6
Notes to and forming part of the consolidated financial statements
| 1. | Basis of financial report preparation |
This general purpose financial report is for the year ended 31 December 2003, and has been prepared in accordance with the Australian Stock Exchange Listing Rules as they relate to Appendix 4E and in accordance with Accounting Standards, other mandatory professional reporting requirements (Urgent Issues Group consensus views), other authoritative pronouncements of the Australian Accounting Standards Board, and the Corporations Act 2001. It is recommended that this report be read in conjunction with any public announcements made by WMC Resources Ltd and its controlled entities during the reporting year in accordance with the continuous disclosure requirements of the Corporations Act 2001.
The accounting policies adopted are consistent with those of the previous financial year.
This financial report is prepared in accordance with the historical cost convention. Comparative information is re-classified where appropriate to enhance comparability.
The financial statements for the year ended 31 December 2003 as presented on pages 1 to 20 reflect the financial performance of the operations of the WMC Resources Ltd group for the full financial year. In compliance with Australian Accounting Standards and the Corporations Act 2001, comparative figures for the year ended 31 December 2002, reflect the results of the nickel operations and corporate and exploration activities for the full financial year, but only include the results of the copper-uranium, fertilizer and finance activities acquired at demerger on 1 December 2002, for one month.
| 2. | Revenue and expenses from ordinary activities |
| 2003 | 2002 | |||
| $M | $M | |||
Revenues from operating activities: | ||||
Sale of goods | 3,001.3 | 1,456.3 | ||
Revenue from outside operating activities: | ||||
Proceeds from sale of assets other than goods | 37.2 | 62.7 | ||
Interest received/receivable | 22.0 | 525.3 | ||
Insurance proceeds received/receivable | 3.6 | 63.1 | ||
Other income | 0.6 | — | ||
Revenue from ordinary activities | 3,064.7 | 2,107.4 | ||
Expenses from ordinary activities | ||||
Depreciation and amortisation (including amortisation of intangibles) | 508.3 | 240.9 | ||
7
| 3. | Significant items |
Profit/(loss) from ordinary activities after income tax, includes the following revenues and expenses whose disclosure is relevant in explaining the financial performance of the entity due to their size or nature:
| 2003 | 2002 | ||||||||||
| $M | $M | ||||||||||
Corporate restructure costs | 3(a | ) | (5.8 | ) | — | ||||||
Meliadine | 3(b | ) | 10.3 | — | |||||||
Idle capacity charge - SX fire | 3(c | ) | (34.0 | ) | (3.6 | ) | |||||
Insurance receivable - SX fire | 3(d | ) | — | 40.6 | |||||||
Demerger costs | 3(e | ) | — | (35.8 | ) | ||||||
Sale of gold royalty | 3(f | ) | — | 15.4 | |||||||
Disposal of Long/Victor nickel mines at Kambalda | 3(g | ) | — | 9.4 | |||||||
Tax benefit not previously brought to account | 3(h | ) | 39.2 | — | |||||||
Tax credit - over provision of tax in prior year | 3(i | ) | — | 76.8 | |||||||
Total significant items after tax | 9.7 | 102.8 | |||||||||
(a) | Corporate restructure costs:
| ||||||||||
Restructure of certain corporate functions and information technology services | (8.4 | ) | — | ||||||||
Income tax benefit | 2.6 | — | |||||||||
| (5.8 | ) | — | |||||||||
(b) | Meliadine:
| ||||||||||
Proceeds | 23.8 | — | |||||||||
Book value | (13.5 | ) | — | ||||||||
Profit | 10.3 | — | |||||||||
Income tax expense | — | — | |||||||||
| 10.3 | — | ||||||||||
During the year, WMC merged the operating subsidiary that holds WMC’s interest in the Meliadine West gold project with Comaplex Minerals Corporation, a Canadian mining junior. The merger took place on 7 October 2003.
|
| ||||||||||
(c) | Idle capacity charge - SX fire:
| ||||||||||
Idle capacity charge in relation to the fire at the Olympic Dam solvent extraction (SX) plant | (48.5 | ) | (5.2 | ) | |||||||
Income tax credit | 14.5 | 1.6 | |||||||||
| (34.0 | ) | (3.6 | ) | ||||||||
On 21 October 2001, a fire destroyed a large portion of the tank farm area of the copper and uranium solvent extraction facilities at Olympic Dam. Other expenses from ordinary activities includes idle capacity costs associated with lower production of copper and uranium during the rebuild of the solvent extraction facilities.
8
| 3. | Significant items (continued) |
| 2003 | 2002 | ||||||
| $M | $M | ||||||
(d)
| Insurance receivable - SX fire: | ||||||
Amount receivable from insurance claims in relation to the fire at the Olympic Dam solvent extraction plant | — | 58.0 | |||||
Income tax expense | — | (17.4 | ) | ||||
| — | 40.6 | ||||||
WMC Resources has an outstanding insurance claim in relation to the Olympic Dam fire that occurred in 2001. An amount of $120 million was recognised in relation to the claim in the 2002 year. To date, WMC has received $82 million of cash in relation to the claim, and will continue to progress collection of outstanding amounts. It is anticipated that the final amount of the claim will be in excess of the $120 million already brought to account. Any amount in excess of the $120 million will be recorded in future years in accordance with accounting standards.
|
| ||||||
| 2003 | 2002 | ||||||
| $M | $M | ||||||
(e)
| Demerger costs: | ||||||
Demerger costs | — | (51.2 | ) | ||||
Income tax benefit | — | 15.4 | |||||
| — | (35.8 | ) | |||||
(f)
| Sale of gold royalty: | ||||||
Proceeds from the sale of right to gold royalty received from the sale of St Ives and Agnew gold operations | — | 45.0 | |||||
Book value of gold royalty and costs associated with the sale | — | (29.6 | ) | ||||
Profit on sale | — | 15.4 | |||||
Income tax expense | — | — | |||||
| — | 15.4 | ||||||
(g)
| Disposal of Long/Victor nickel mines at Kambalda: | ||||||
Proceeds from the sale | — | 14.0 | |||||
Book value and costs associated with the sale | — | (2.0 | ) | ||||
Profit on sale | — | 12.0 | |||||
Income tax expense | — | (2.6 | ) | ||||
| — | 9.4 | ||||||
9
| 3. | Significant items (continued) |
| 2003 | 2002 | |||||
| $M | $M | |||||
(h)
| Tax benefit not previously brought to account: | |||||
Recognition of Future Income Tax Benefits not previously brought to account | 39.2 | — | ||||
The recoverability of off balance sheet tax benefits was reviewed following a favourable tax ruling in respect of prior period tax losses and the close out of the legacy foreign exchange contracts in 2003. The 2003 income tax charge includes a credit of $39 million arising from the partial recognition of Australian tax losses and other timing differences not previously brought to account.
| ||||||
(i) | Tax credit - over provision of tax in prior year: | — | 76.8 | |||
In the year ended 31 December 2001, WMC Resources Ltd made a profit on the sale of its gold business. At the time of completing the 2001 accounts there was no certainty that the profit was not taxable. As a result, a tax expense was recognised in the 2001 company accounts of WMC Resources Ltd.
Upon completion of the 2001 tax return, it was established that the profit was not taxable. Consequently, a prior period tax adjustment, reversing the 2001 tax expense, has been made which resulted in a tax benefit of $77 million in the accounts of WMC Resources Ltd for the year ended 31 December 2002.
| 4. | Income tax |
| 2003 | 2002 | |||||
| $M | $M | |||||
Profit/(loss) from ordinary activities before income tax | 247.9 | (197.2 | ) | |||
Prima facie tax (expense)/credit at the rate of 30% | (74.4 | ) | 59.1 | |||
The following items caused the total (expense)/credit for income tax to vary from the above:
|
| |||||
Adjustment for impact of hedging contracts fair valued at demerger | 35.6 | 3.2 | ||||
Fair value adjustment arising from acquisition of entities | (3.1 | ) | 91.0 | |||
Non-deductible depreciation or amortisation | (7.6 | ) | (0.9 | ) | ||
Future income tax benefits not brought to account - overseas | (4.3 | ) | (2.5 | ) | ||
Future income tax benefits recognised / (not brought to account) - Australia | 39.2 | (75.9 | ) | |||
Other | 3.8 | 2.7 | ||||
Over-provision of tax in prior year | 8.5 | 76.8 | ||||
Consequent reduction in income tax expense | 72.1 | 94.4 | ||||
Income tax (expense)/credit | (2.3 | ) | 153.5 | |||
Comprising: | ||||||
- current income tax | (2.2 | ) | (1.9 | ) | ||
- deferred income tax | (192.3 | ) | (24.8 | ) | ||
- income tax benefit | 183.7 | 103.4 | ||||
- over-provision of tax in prior year | 8.5 | 76.8 | ||||
Income tax (expense) / credit | (2.3 | ) | 153.5 | |||
10
| 5. | Earnings per share (EPS) |
| 2003 | 2002 | ||||||
Basic earnings per share | cents | 21.7 | (5.1 | ) | |||
Diluted earnings per share | cents | 21.7 | (5.1 | ) | |||
Weighted average number of shares used in the calculation of earnings per share | |||||||
| Number of shares | |||||||
| 2003 | 2002 | ||||||
Number for basic earnings per share | 1,131,654,938 | 851,923,261 | |||||
Effect of share options on issue | 663,679 | 1,797,256 | |||||
Number for diluted earnings per share | 1,132,318,617 | 853,720,517 | |||||
| 6. | Segment information |
| (a) | Description of business segments: |
Copper-uranium | Exploration, development, mining, smelting and refining of copper, and extraction of uranium in South Australia. | |
Nickel | Exploration, development, mining, smelting and refining of nickel in Western Australia. | |
Fertilizer | Exploration, development and mining of fertilizer product in Phosphate Hill, Queensland and distribution of fertilizer products via Hi Fert. | |
11
| 6. | Segment information (continued) |
| (b) | Information for the year ended 31 December 2003 |
| (i) | Business segments |
| Copper- uranium | Nickel | Fertilizer | Elimination | Consolidated | ||||||||||
| $M | $M | $M | $M | $M | ||||||||||
Revenue | ||||||||||||||
Sales revenue1 | 696.3 | 1,783.5 | 414.8 | — | 2,894.6 | |||||||||
Inter-segment sales revenue | — | — | 7.6 | (7.6 | ) | — | ||||||||
Total sales revenue from operations | 696.3 | 1,783.5 | 422.4 | (7.6 | ) | 2,894.6 | ||||||||
Unallocated sales revenue | 34.6 | |||||||||||||
Revenue before hedging | 2,929.2 | |||||||||||||
Hedging | 22.7 | 43.7 | 5.7 | — | 72.1 | |||||||||
Revenue from operating activities | 3,001.3 | |||||||||||||
Proceeds from disposal of non-current assets: | ||||||||||||||
Business segments | 0.4 | 6.5 | 0.2 | — | 7.1 | |||||||||
Unallocated | — | — | — | — | 30.1 | |||||||||
Insurance proceeds received/receivable | — | 3.6 | — | — | 3.6 | |||||||||
Other income | — | 0.4 | 0.2 | — | 0.6 | |||||||||
Segment revenues | 719.4 | 1,837.7 | 428.5 | |||||||||||
Interest received/receivable | 22.0 | |||||||||||||
Revenue from ordinary activities | 3,064.7 | |||||||||||||
Result | ||||||||||||||
Earnings before allocation of hedging result | (120.2 | ) | 428.8 | (31.3 | ) | — | 277.3 | |||||||
Unallocated profits2 | 12.7 | |||||||||||||
| 290.0 | ||||||||||||||
Hedging | 22.7 | 43.7 | 5.7 | — | 72.1 | |||||||||
Segment result | (97.5 | ) | 472.5 | (25.6 | ) | |||||||||
Earnings from operations | 362.1 | |||||||||||||
Unallocated corporate expenses: | ||||||||||||||
New business | (13.0 | ) | ||||||||||||
Regional exploration | (23.4 | ) | ||||||||||||
Corporate | (20.6 | ) | ||||||||||||
Corporate restructuring costs | (8.4 | ) | ||||||||||||
Finance and other costs | (2.5 | ) | ||||||||||||
Net borrowing costs | (46.3 | ) | ||||||||||||
Profit from ordinary activities before income tax expense | 247.9 | |||||||||||||
Income tax expense | (2.3 | ) | ||||||||||||
Net profit after tax | 245.6 | |||||||||||||
| 1 | Sales revenue includes intermediate product sales. Segment revenues, expenses and results include transfers between segments. Such transfers are priced on an “arm’s-length” basis and are eliminated on consolidation. |
| 2 | Unallocated profit is largely matched by costs in business segments with minimal net contribution to group earnings. |
12
| 6. | Segment information (continued) |
| (b) | Information for the year ended 31 December 2003 (continued) |
| (i) | Business segments (continued) |
| Copper- uranium | Nickel | Fertilizer | Consolidated | |||||
| $M | $M | $M | $M | |||||
Depreciation and amortisation | 218.0 | 242.7 | 43.1 | 503.8 | ||||
Unallocated depreciation and amortisation | 4.5 | |||||||
Total depreciation and amortisation | 508.3 | |||||||
Other non-cash expenses | 15.6 | 36.0 | 1.4 | 53.0 | ||||
Assets | ||||||||
Segment assets | 4,313.0 | 1,823.7 | 753.5 | 6,890.2 | ||||
Unallocated corporate assets | 670.0 | |||||||
Consolidated total assets | 7,560.2 | |||||||
Liabilities | ||||||||
Segment liabilities | 443.8 | 328.8 | 85.6 | 858.2 | ||||
Unallocated corporate liabilities | 2,752.3 | |||||||
Consolidated total liabilities | 3,610.5 | |||||||
Acquisitions of non-current assets1 | 396.7 | 219.0 | 40.5 | 656.2 | ||||
Unallocated corporate acquisitions2 | 55.8 | |||||||
Total acquisitions of non-current assets | 712.0 | |||||||
| 1 | Comprises acquisitions of property, plant and equipment, exploration and evaluation expenditure, mine properties under development and acquired mineral rights. |
| 2 | Includes final contractual payment for acquisition of Corridor Sands, satisfied by the issue of 6,715,123 shares in WMC Resources Ltd ($33.7 million), and capitalised interest ($9.1 million). |
| (ii) | Geographical segments |
| Australia | North America | Europe | Japan | Other | Total | |||||||
| $M | $M | $M | $M | $M | $M | |||||||
Segment revenue by location of customer | 515.7 | 379.9 | 994.5 | 413.3 | 697.9 | 3,001.3 | ||||||
WMC Resources Ltd’s assets are primarily located within Australia. Capital expenditure and depreciation is also incurred primarily on assets located in Australia.
13
| 6. | Segment information (continued) |
| (c) | Information for the year ended 31 December 2002 |
| (i) | Business segments |
| Copper- uranium | Nickel | Fertilizer | Eliminations | Consolidated | ||||||||||
| $M | $M | $M | $M | $M | ||||||||||
Revenue | ||||||||||||||
Sales revenue1 | 106.0 | 1,301.4 | 20.7 | — | 1,428.1 | |||||||||
Inter-segment sales revenue | — | — | 0.5 | (0.5 | ) | — | ||||||||
Total sales revenue from operations | 106.0 | 1,301.4 | 21.2 | (0.5 | ) | 1,428.1 | ||||||||
Unallocated sales revenue | 28.0 | |||||||||||||
Revenue before hedging | 1,456.1 | |||||||||||||
Hedging2 | (0.4 | ) | 0.5 | 0.1 | — | 0.2 | ||||||||
Revenue from operating activities | 1,456.3 | |||||||||||||
Proceeds from disposal of non-current assets: | ||||||||||||||
Business segments | — | 17.4 | — | — | 17.4 | |||||||||
Unallocated | — | — | — | — | 45.3 | |||||||||
Insurance proceeds received/receivable | 58.2 | 4.9 | — | — | 63.1 | |||||||||
Segment revenues | 163.8 | 1,324.2 | 21.3 | |||||||||||
Interest received/receivable | 525.3 | |||||||||||||
Revenue from ordinary activities | 2,107.4 | |||||||||||||
Result | ||||||||||||||
Earnings before allocation of hedging result | 73.8 | 273.4 | (7.4 | ) | — | 339.8 | ||||||||
Unallocated profits3 | 15.4 | |||||||||||||
| 355.2 | ||||||||||||||
Hedging2 | (0.4 | ) | 0.5 | 0.1 | — | 0.2 | ||||||||
Segment result | 73.4 | 273.9 | (7.3 | ) | ||||||||||
Earnings from operations | 355.4 | |||||||||||||
Unallocated corporate expenses: | ||||||||||||||
New business | (18.5 | ) | ||||||||||||
Regional exploration | (11.3 | ) | ||||||||||||
Corporate4 | (62.4 | ) | ||||||||||||
Finance and other costs | (4.0 | ) | ||||||||||||
Corporate - demerger costs | (51.2 | ) | ||||||||||||
Net borrowing costs | (405.2 | ) | ||||||||||||
Loss from ordinary activities before income tax credit | (197.2 | ) | ||||||||||||
Income tax credit | 153.5 | |||||||||||||
Net loss after tax | (43.7 | ) | ||||||||||||
| 1 | Sales revenue includes intermediate product sales. Segment revenues, expenses and results include transfers between segments. Such transfers are priced on an “arm’s-length” basis and are eliminated on consolidation. |
| 2 | Prior to the demerger, the hedging activities were conducted in an entity outside the WMC Resources Ltd group. |
| 3 | Unallocated profit is largely matched by costs in business segments with minimal net contribution to group earnings. |
| 4 | Corporate costs – it is not practicable to restate 2002 for the higher proportion of shared service cost recoveries from business segments introduced with effect from 1 January 2003. |
14
| 6. | Segment information (continued) |
| (c) | Information for the year ended 31 December 2002 (continued) |
| (i) | Business segments (continued) |
| Copper- uranium | Nickel | Fertilizer | Consolidated | |||||
| $M | $M | $M | $M | |||||
Depreciation and amortisation | 19.2 | 209.6 | 3.9 | 232.7 | ||||
Unallocated depreciation and amortisation | 8.2 | |||||||
| 240.9 | ||||||||
Other non-cash expenses | 1.7 | 49.8 | 1.2 | 52.7 | ||||
Assets | ||||||||
Segment assets | 4,146.2 | 1,696.0 | 720.6 | 6,562.8 | ||||
Unallocated corporate assets | 785.3 | |||||||
Consolidated total assets | 7,348.1 | |||||||
Liabilities | ||||||||
Segment liabilities | 450.0 | 286.0 | 75.9 | 811.9 | ||||
Unallocated corporate liabilities | 2,929.6 | |||||||
Consolidated total liabilities | 3,741.5 | |||||||
Acquisitions of non-current assets1 | ||||||||
Upon acquisition of entities | 3,738.8 | — | 538.4 | 4,277.2 | ||||
Other acquisitions of non-current assets | 26.8 | 192.9 | 7.2 | 226.9 | ||||
Unallocated corporate acquisitions (including upon acquisition of entities)2 | 135.0 | |||||||
Total acquisitions of non-current assets | 4,639.1 | |||||||
| 1 | Comprises acquisitions of property, plant and equipment, exploration and evaluation expenditure, mine properties under development and acquired mineral rights. |
| 2 | Includes capitalised interest of $0.4 million. |
| (ii) | Geographical segments |
| Australia | North America | Europe | Japan | Other | Total | |||||||
| $M | $M | $M | $M | $M | $M | |||||||
Segment revenue by location of customer | 98.0 | 197.6 | 635.7 | 250.6 | 274.4 | 1,456.3 | ||||||
WMC Resources Ltd’s assets are primarily located within Australia. Capital expenditure and depreciation is also incurred primarily on assets located in Australia.
| 7. | Dividends |
On 11 February 2004, the directors declared an unfranked dividend of 6 cents per share.
15
| 1 | During December 2003, WMC Resources made the final contractual payment for the acquisition of Corridor Sands. The final payment was made by the issue of 6,715,123 WMC Resources Ltd shares. This amount has been treated as acquired mineral rights in accordance with WMC’s accounting policy. |
| 11. | Deferred gains/(losses) - hedging contracts |
Deferred gains and losses in relation to hedging contracts are reported within non-current assets and other current and non-current liabilities in the statement of financial position. The net deferred gains and losses at the end of the year are:
| 2003 | 2002 | ||||
| $M | $M | ||||
Current - deferred gains | 175.1 | 7.2 | |||
Non-current - deferred gains | 684.6 | — | |||
Non-current - deferred losses | — | (25.9 | ) | ||
Net deferred gains/(losses) | 859.7 | (18.7 | ) | ||
16
Deferred gains and losses mainly consist of realised and unrealised gains and losses arising from revaluations of foreign-denominated debt and commodity and currency hedging contracts that relate to commodities to be produced and sold in future years. The deferred gains and losses will be brought to account in the year that the related production is sold. During 2003, the close out of the 2005-2008 legacy foreign exchange and commodity contracts has realised a large amount of these gains. Whether the unrealised deferred balances will be realised and at what amount depends upon commodity and currency price movements until the maturity of the hedge contracts concerned.
The acquisition of WMC Finance Limited by WMC Resources Ltd prior to the demerger in December 2002 required that WMC Resources Ltd acquire the hedge book held by WMC Finance at its fair value at demerger. Subsequent to the demerger, the profit and loss for each hedge is determined by the difference between the particular hedge’s fair value at demerger (rather than the contract price) and the spot price at the date of maturity. The strengthening of the Australian dollar against the US dollar in the year to 31 December 2003 has therefore resulted in significant gains.
The expected timing of recognition of the deferred gains and losses based on current valuations is shown below:
Deferred hedging gains/(losses) as at 31 December 2003
Years | Less than 1 Year | 1 - 2 Years | 2 - 3 Years | 3 - 4 Years | 4 - 5 Years | More than 5 Years | Total | ||||||||||||||
| $M | $M | $M | $M | $M | $M | $M | |||||||||||||||
Deferred gains | 185.1 | 149.3 | 236.0 | 112.6 | 123.5 | 540.5 | 1,347.0 | ||||||||||||||
Deferred losses | (10.0 | ) | (19.6 | ) | (139.9 | ) | (10.4 | ) | (13.3 | ) | (294.1 | ) | (487.3 | ) | |||||||
Total | 175.1 | 129.7 | 96.1 | 102.2 | 110.2 | 246.4 | 859.7 | ||||||||||||||
Total deferred on statement of financial position | 859.7 | ||||||||||||||||||||
Close out of 2005 - 2008 foreign currency hedge book during 2003
Included in the above is a realised gain of $366.9 million in relation to foreign currency hedges maturing between 2005 and 2008 which were closed-out during 2003. In accordance with Australian Accounting Standards, these will be deferred until the underlying transaction occurs. The expected timing of recognition of the deferred gains is shown below:
Years | Less than 1 Year | 1 - 2 Years | 2 - 3 Years | 3 - 4 Years | 4 - 5 Years | More than 5 Years | Total | |||||||
| $M | $M | $M | $M | $M | $M | $M | ||||||||
Deferred gains | — | 114.7 | 79.1 | 82.6 | 90.5 | — | 366.9 |
17
| 11. | Deferred gains/(losses) - hedging contracts (continued) |
Close out of gold hedges during 2003
Included in the above deferred gains is a gain of $18.9 million in relation to gold hedges which were closed out during 2003.
Gold hedges maturing between 2006 and 2010 were closed-out, realising a net cash inflow of A$2.7 million and net gain of A$14.1 million. Offsetting deals for all gold hedges maturing in 2004 and 35,600 ounces of gold hedges maturing in 2005 were also entered into, providing a deferred cash inflow of A$0.5 million and a net profit of A$4.8 million. In accordance with Australian Accounting Standards, these gains will be deferred until the underlying transaction occurs. The expected timing of recognition of the deferred gains is shown below:
Years | Less than 1 Year | 1 - 2 Years | 2 - 3 Years | 3 - 4 Years | 4 - 5 Years | More than 5 Years | Total | |||||||
| $M | $M | $M | $M | $M | $M | $M | ||||||||
Deferred gains | 3.6 | 1.2 | 2.5 | 2.8 | 2.6 | 6.2 | 18.9 |
| 12. | Retained profits/(accumulated losses) |
| 2003 | 2002 | |||||
| $M | $M | |||||
Accumulated losses at the beginning of the financial year | (77.5 | ) | (33.8 | ) | ||
Net profit/(loss) attributable to members of WMC Resources Ltd | 245.6 | (43.7 | ) | |||
Net transfers - from asset revaluation reserve1 | 24.5 | — | ||||
- from foreign currency translation reserve | 6.9 | — | ||||
Retained profits/(accumulated losses) at the end of the financial year | 199.5 | (77.5 | ) | |||
| 1 | During the current year, the balance of the asset revaluation reserve was transferred to retained profits. |
18
| 13. | Reconciliation of profit/(loss) from ordinary activities after income tax to net cash flow provided by operating activities |
| 2003 | 2002 | |||||
| $M | $M | |||||
Operating profit/(loss) after income tax | 245.6 | (43.7 | ) | |||
Depreciation and amortisation | 508.3 | 240.9 | ||||
Research and development written off | 0.5 | 0.4 | ||||
Profit on disposal of non-current assets | (12.6 | ) | (22.9 | ) | ||
Provision for diminution in investments and loans | 2.0 | 0.2 | ||||
Demerger costs | — | 21.7 | ||||
Interest capitalised | 9.1 | 0.4 | ||||
Write-down in value of inventory | 16.5 | 31.4 | ||||
Sub total | 769.4 | 228.4 | ||||
| Change in assets and liabilities adjusted for effects of purchase and disposal of controlled entities during the financial year: | ||||||
(Increase)/decrease in: | ||||||
- inventories | (73.3 | ) | (20.7 | ) | ||
- receivables | 48.8 | (72.1 | ) | |||
- deferred tax assets | (1.4 | ) | 210.3 | |||
- other assets | (92.5 | ) | 14.0 | |||
(Decrease)/increase in: | ||||||
- payables | (22.6 | ) | (47.4 | ) | ||
- current tax liabilities | (2.7 | ) | (15.5 | ) | ||
- deferred tax liabilities | 5.0 | (19.1 | ) | |||
- provisions | 13.8 | 5.5 | ||||
- loans from controlled entities | — | (120.1 | ) | |||
- other liabilities | (2.0 | ) | (11.3 | ) | ||
Net cash provided by operating activities | 642.5 | 152.0 | ||||
| 14. | Control gained over entities having material effect |
There have been no acquisitions of material entities in the year to 31 December 2003.
| 15. | Loss of control of entities having material effect |
There were no losses of control over material entities in the year to 31 December 2003.
19
| 16. | Issued and quoted securities at end of current year |
Category of securities | Number issued | Number quoted | Issue price per share | ||||
| ($) | |||||||
Ordinary shares | |||||||
Fully paid | 1,150,070,945 | 1,150,070,945 | Various | ||||
Changes during current year: | |||||||
Increase in fully paid shares following exercise of options | 15,004,775 | Various | |||||
Shares issued for final contractual payment for the acquisition of Corridor Sands | 6,715,123 | $ | 5.02 | ||||
Unquoted employee options to acquire fully paid ordinary shares | Number issued | Number quoted | Exercise price | Expiry date | |||||
| 1,389,945 | Nil | $ | 3.90 | 20 December 2004 | |||||
| 1,798,500 | Nil | $ | 3.48 | 18 December 2005 | |||||
| 4,399,900 | Nil | $ | 4.33 | 30 November 2006 | |||||
| 8,618,800 | Nil | $ | 4.34 | 23 December 2007 | |||||
| 16,207,145 | |||||||||
Issued during the current year | 322,800 | Nil | $ | 4.34 | 23 December 2007 | ||||
Exercised during the current year | 926,220 | Nil | $ | 2.26 | 21 December 2003 | ||||
| 375,000 | Nil | $ | 2.49 | 21 December 2003 | |||||
| 2,203,655 | Nil | $ | 3.90 | 20 December 2004 | |||||
| 4,028,200 | Nil | $ | 3.48 | 18 December 2005 | |||||
| 5,675,800 | Nil | $ | 4.33 | 30 November 2006 | |||||
| 1,795,900 | Nil | $ | 4.34 | 23 December 2007 | |||||
| 15,004,775 | |||||||||
Expired/lapsed during the current year | |||||||||
| 154,500 | Nil | $ | 3.90 | 20 December 2004 | |||||
| 91,400 | Nil | $ | 3.48 | 18 December 2005 | |||||
| 506,200 | Nil | $ | 4.33 | 30 November 2006 | |||||
| 859,960 | Nil | $ | 4.34 | 23 December 2007 | |||||
| 1,612,060 | |||||||||
| 17. | Events subsequent to balance date |
There has not arisen in the interval between the end of the year and the date of this report, any item, transaction or event of a material or unusual nature which has or may significantly affect the operations of the group, the results of those operations, or the state of affairs of the group in future periods.
| 18. | Annual General Meeting |
The Annual General Meeting of WMC Resources Ltd will be held as follows:
Place:Grand Ballroom, Hyatt Regency, 99 Adelaide Terrace, Perth, Western Australia.
Date:6 April 2004
Time:10am
The 2003 Annual Report of WMC Resources Ltd will be available in March 2004.
20