SECURITIES AND EXCHANGE COMMISSION
Washington, D.C. 20549
FORM 6-K
REPORT ON FOREIGN ISSUER
PURSUANT TO RULE 13a-16 OR 15d-16 OF
THE SECURITIES EXCHANGE ACT OF 1934
Date: Period August 4, 2003
WMC RESOURCES LTD
ACN 004 184 598
Level 16, IBM Centre
60 City Road
Southbank, Victoria 3006
Australia
Indicate by check mark whether the registrant files or will file annual reports under cover of Form 20-F or Form 40-F.
Form 20-F x | Form 40-F ¨ |
Indicate by check mark whether the registrant by furnishing the information contained in this Form is also thereby furnishing the information to the Commission pursuant to Rule 12g3-2(b) under the Securities Exchange Act of 1934.
Yes ¨ | No x |
If “Yes” is marked, indicate below the file number assigned to the registrant in connection with Rule 12g3-2(b): 82-
This report on Form 6-K includes press releases of WMC Resources Ltd made during the period February 27, 2003 – August 4, 2003. Forms F-4 and 20-F have also been lodged separately with the SEC during this period.
SIGNATURES
Pursuant to the requirements of the Securities Exchange Act of 1934, the registrant has duly caused this report to be signed on its behalf by the undersigned, thereunto duly authorised.
WMC RESOURCES LTD
By:
Name: R.E. Mallett
Title: Assistant Company Secretary
Date: 14 August 2003

To: | The Manager | |
| Announcements | ||
| ASX Company Announcements Office |
Public Announcement 2003-7
WMC Resources Board Appointment
The WMC Resources Board today announced the appointment of Executive General Manager—Operations, Mr Alan Dundas, to the Board, effective 12 March 2003.
WMC Resources Chairman, Mr Ian Burgess, said that Mr Dundas would bring to the Board valuable expertise and a detailed understanding of the company’s operations.
Mr Dundas, 46, was appointed as EGM, Operations in December 2001. He joined WMC in 1994 as Resident Manager at the Kwinana Nickel Refinery and has held the positions of General Manager, Nickel Operations and EGM — Nickel.
Prior to joining WMC, Mr Dundas was General Operations Manager for Nabalco in the Northern Territory. He has held a variety of operational roles in the coal industry in Queensland and British Columbia, Canada and in the tarsand business in Northern Alberta, Canada.
Mr Dundas has a formal qualification in civil engineering and is a fellow of the Australasian Institute of Mining and Metallurgy.
The Board of WMC Resources now comprises 7 independent non-executive directors and 2 executive directors.
Ross Mallett Assistant Company Secretary | ||
| WMC Resources Ltd | ||
ACN 004 184 598 | ||
13 March 2003 | GPO Box 860K | |
Melbourne Vic. 3001 | ||
Australia | ||
| For further information, please call: | Level 16 IBM Centre | |
Tania Price, Group Manager Public Affairs on: | 60 City Road | |
(03) 96856233 or 0419 502 852 | Southbank Vic. 3006 | |
Australia | ||
Tel +61 (0)3 9685 6000 | ||
Fax +61 (0)3 9685 6115 | ||
To: | The Manager | |
Announcements | ||
Company Announcements Office |
Public Announcement 2003-8
Please find attached Initial Director’s Interest Notice (Appendix 3X) in respect of WMC Resources Ltd Director, Mr Alan Dundas.
A copy of this can be viewed at WMC’s internet site atwww.wmc.com following its release to the market.
Peter Horton
Company Secretary
18 March 2003
| WMC Resources Ltd |
ACN 004 184 598 |
GPO Box 860K |
Melbourne Vic. 3001 |
Australia |
Level 16 IBM Centre |
60 City Road |
Southbank Vic. 3006 |
Australia |
Tel +61 (0)3 9685 6000 |
Fax +61 (0)3 9685 6115 |
Appendix 3X
Initial Director’s Interest Notice
Rule 3.19A.1
Appendix 3X
Initial Director’s Interest Notice
Information or documents not available now must be given to ASX as soon as available. Information and documents given to ASX become ASX’s property and may be made public.
Introduced 30/9/2001.
Name of entity | WMC Resources Ltd | |
ABN | 76 004 820 419 | |
We (the entity) give ASX the following information under listing rule 3.19A.1 and as agent for the director for the purposes of section 205G of the Corporations Act.
Name of Director | Alan Kevin DUNDAS | |
Date of appointment | 12 March 2003 | |
Part 1—Director’s relevant interests in securities of which the director is the registered holder
In the case of a trust, this includes interests in the trust made available by the responsible entity of the trust
Note: In the case of a company, interests which come within paragraph (i) of the definition of “notifiable interest of a director” should be disclosed in this part.
Number & class of securities |
115,157 Ordinary Shares in WMC Resources Ltd 202,000 Options in WMC Resources Ltd |
Part 2—Director’s relevant interests in securities of which the director is not the registered holder
In the case of a trust, this includes interests in the trust made available by the responsible entity of the trust
Name of holder & nature of interest | Number & class of Securities | |
| Note: Provide details of the circumstances giving rise to the relevant interest. | ||
Nil | ||
| + | See chapter 19 for defined terms. |
11/3/2002 | Appendix 3X Page 3 |
Appendix 3X
Initial Director’s Interest Notice
Part 3—Director’s interests in contracts
Note: In the case of a company, interests which come within paragraph (ii) of the definition of “notifiable interest of a director” should be disclosed in this part.
Detail of contract | N/A | |
Nature of interest | ||
Name of registered holder (if issued securities) | ||
| No. and class of securities to which interest relates | ||
| + | See chapter 19 for defined terms. |
Appendix 3X Page 2 | 11/3/2002 |
To: | The Manager | |
Announcements | ||
ASX Company Announcements Office |
Public Announcement 2003-10
Please find attached for immediate release, Public Announcement 2003-10 covering WMC Resources Ltd’s March 2003 Quarterly Production Report.
A copy of this public announcement will be published on WMC’s web site atwww.wmc.com later this morning.
WMC’s Chief Executive Officer, Mr Andrew Michelmore, will host an audio conference at 11.00am this morning which will be broadcast live from WMC’s web site. A recording of this conference will be available for playback on WMC’s web site later today.
Ross Mallett
Assistant Company Secretary
15 April 2003
| WMC Resources Ltd |
ACN 004 184 598 |
GPO Box 860K |
Melbourne Vic. 3001 |
Australia |
Level 16 IBM Centre |
60 City Road |
Southbank Vic. 3006 |
Australia |
Tel +61 (0)3 9685 6000 |
Fax +61 (0)3 9685 6115 |
WMC Resources Ltd
Quarterly Review, Quarter ended 31 March 2003
Safety, health & environment
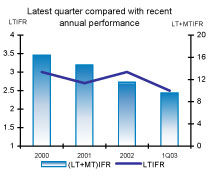
Safety, health and environment
First quarter 2003 safety, health and environment performance continued to show improvement over previous quarters.
No significant safety or environmental incidents were recorded for the period.
Our lost time and medical treatment injury frequency rate of 9.6 was a 17 per cent improvement over the 2002 average.
The continued downward trend in injury rates reflects the ongoing implementation and application of the WMC Resources’ EH&S Management System and improvement programs.
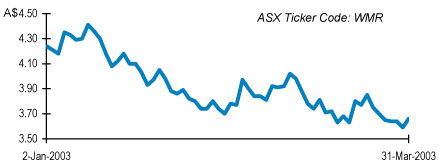
WMC Resources Ltd share price
Dear Shareholder
WMC Resources on track to meet the 2003 production targets.
We are on track for, and remain committed to, delivering the full year targeted production levels. Subdued first quarter production and first half forecast for our nickel operations are the result of scheduled maintenance programs, which are proceeding to plan.
The highlight for the quarter was record fertilizer production with stable operating performance at near design rates.
At Olympic Dam, gold production doubled during the March quarter. Copper production was 14 per cent lower due to a planned reline of the slag furnace and restocking of the refinery following strong production in the December quarter.
Scheduling and expenditure on the Olympic Dam copper and uranium solvent extraction plant rebuild are on track and remain as previously advised.
Reduced nickel-in-matte production reflected a planned statutory maintenance shutdown at the Kalgoorlie smelter. Metal production at the Kwinana refinery was correspondingly lower with statutory inspections scheduled to coincide with the smelter shutdown.
The Mount Keith feasibility study has confirmed expansion of nickel ore throughput by 25 per cent to 14 million tonnes per annum as a robust project with returns exceeding our targets. Implementation options to optimise returns are being assessed.
Corridor Sands project work continues on schedule across all technical and commercial streams.
The outlook for the June quarter is for increased copper, nickel-in-concentrate and nickel metal production with nickel-in-matte and fertilizer at similar levels to the March quarter. Consistent and optimal operating performance remains our priority and the key controllable value driver for WMC Resources.
|
A G MICHELMORE Chief Executive Officer 15 April 2003 |
WMC Resources Ltd
ABN 76 004 184 598
| Quarter ended 31 March 2003 | |
Production overview
Copper & Uranium
Smelter throughput was in line with the previous quarter.
The annual reline of the slag cleaning furnace commenced on 5 March. The reline takes one month and constrains copper production by 4,000 tonnes each year. The furnace has since been recommissioned on schedule. The slag furnace will be modified during the smelter shutdown in August/September to enhance cooling capacity and increase campaign durations from one to four years.
Copper production was lower in the March quarter, reflecting the slag furnace reline and restocking of the refinery following the strong December quarter.
Uranium oxide production was reduced due to lower head grades and deferral of some ore throughput to capitalise on planned higher recoveries from the new uranium solvent extraction circuit.
Gold production doubled in the March quarter with the conversion into bullion of stocks built up during the previous quarter.
The outlook for the June quarter is for copper production to increase with the slag furnace back in operation and commissioning of a new higher capacity concentrate burner in the smelter.
Planning for the smelter flash furnace reline and major maintenance is well advanced with the shutdown scheduled to start in the second half of August.
Production targets for 2003 remain at 185,000 tonnes of copper and 3,600 tonnes of uranium oxide.
Nickel
Nickel-in-matte production was lower, reflecting a planned statutory maintenance shutdown at the Kalgoorlie smelter which commenced on 25 March. The smelter was recommissioned on 11 April and is now operating at full production rates.
Production of concentrate and metal was correspondingly lower, with maintenance at other operations scheduled to coincide with the smelter shutdown. This included a mill reline at Leinster and statutory autoclave inspections at the Kwinana refinery.
Higher recoveries at Mount Keith and Leinster largely offset the impact on concentrate production of lower ore grades at Kambalda.
Full year production targets remain at 99,000 tonnes of nickel-in-matte and 67,000 tonnes of nickel metal.
The outlook for the June quarter includes:
| • | higher concentrate production with higher ore grades and recoveries at Mount Keith and Leinster; |
| • | maintaining first quarter matte production levels with the smelter ramping back up to full production rates by mid-April; |
| • | slightly higher metal production with the balance of the 2003 autoclave inspections scheduled to be completed during April. |
The Mount Keith feasibility study has confirmed expansion of throughput by 25 per cent to 14 million tonnes per annum as a robust project. Implementation options, including incremental expansion, are being assessed.
Further drilling has identified the 11 Mile Well deposit near Leinster as a potential ore source to replace the Harmony open cut mine which is scheduled to close in the first half of 2004. The 11 Mile Well is a small satellite deposit located eight kilometres south of the Leinster concentrator and is suited to open cut mining. A feasibility study will be completed by year-end.
Geophysical results have indicated potential extensions to ore zones at the Cliffs nickel deposit eight kilometres south of Mount Keith. Further drilling is underway and metallurgical testing has confirmed that Cliffs ore is suitable for the Leinster concentrator. WMC Resources has an option to acquire Cliffs from MPI Nickel.
Fertilizers
In a period of improved fertilizer pricing, our fertilizer production increased to record levels, equivalent to an annualised rate of almost 950,000 tonnes. This reflects the benefits of a program to address minor process bottlenecks now that plant performance has stabilised near design rates.
Similar performance levels are expected in the June quarter.
Planning is well advanced for the scheduled statutory maintenance shutdown of the ammonia plant during the September quarter.
Fertilizer production is well placed for the target of 870,000 tonnes for 2003.
Business Development
Solvent Extraction Plant Rebuild
Rebuilding the uranium and copper solvent extraction plants at Olympic Dam continued during the quarter.
Schedule and expenditure remain as previously advised.
Construction of the uranium plant is nearing completion and a rigorous testing and commissioning program designed to ensure compliance with strict fire prevention, detection and containment standards has commenced. The plant is expected to be operating by the end of April.
Olympic Dam Expansion Study
The drilling phase of the expansion study commenced this quarter with approximately 6,500 metres drilled from a program of 40,000 metres. This program will deliver geological, geotechnical and hydrology data to enable an appropriate decision to be made on the future mining methods and scales at Olympic Dam. Work has also commenced to assess vital infrastructure requirements, in particular water and power, with initial discussion on these issues with the South Australian Government’s taskforce.
Corridor Sands
WMC Resources completed the acquisition of 100 per cent of the Corridor Sands Limitada (CSL) on 30 January 2003.
The Industrial Development Corporation of South Africa holds an option, exercisable during the first half of 2003 to acquire 10 per cent of CSL.
Project work continues across all technical and commercial streams. The project remains in line with previously advised timeframes.
Exploration Activities
West Musgrave
Analysis of the 2002 drilling results at the Nebo/Babel project is nearing completion and an update will be provided in the next quarterly report.
Global Exploration
Exploration for nickel sulphide continued in Australia, North America and China and for copper-gold deposits in Mongolia and Peru.
In Mongolia, a drilling program to test for copper-gold deposits at the Khuvyn Khar prospect has commenced.
Annual General Meeting
WMC Resources Ltd will hold its Annual General Meeting at 10.00am (Melbourne time) on Friday, 2 May 2003 in the Regent Theatre, 191 Collins Street, Melbourne.
The Annual General Meeting will be webcast live, together with the Chairman’s and CEO’s speeches and the formal meeting proceedings.
| Quarter ended 31 March 2003 | |
Summary of WMC Resources’ production
| Quarter ended 31 March 2003^ | Quarter ended 31 December 2002^ | Quarter ended 31 March 2002^ | ||||||
Copper (tonnes of refined copper) | Olympic Dam Operations | 41,678 | 48,328 | 48,849 | ||||
Uranium Oxide concentrate(tonnes) | Olympic Dam Operations | 635 | 826 | 597 | ||||
Silver (ounces) | Olympic Dam Operations | 149,666 | 191,001 | 164,044 | ||||
Gold (ounces) | Olympic Dam Operations | 26,931 | 13,682 | 19,661 | ||||
Nickel (tonnes contained nickel) | Kambalda Nickel Operations | 6,409 | 7,720 | 3,836 | ||||
| Leinster Nickel Operations | 9,700 | 10,331 | 8,524 | |||||
| Mount Keith Operations | 10,167 | 9,465 | 10,109 | |||||
| Total nickel-in-concentrate | 26,276 | 27,516 | 22,469 | |||||
| Total nickel-in-matte | 22,084 | 26,901 | 16,615 | |||||
| Total nickel metal | 15,171 | 17,246 | 13,902 | |||||
Fertilizer | ||||||||
Di-ammonium phosphate(tonnes) | Phosphate Hill | 202,928 | 198,448 | 213,055 | ||||
Mono-ammonium phosphate(tonnes) | Phosphate Hill | 31,072 | 30,264 | — | ||||
Total Fertilizer (tonnes) | Phosphate Hill | 234,000 | 228,712 | 213,055 | ||||
A statistical supplement providing a detailed breakdown of WMC Resources’ production results is available on WMC Resources’ Internet home page at http://www.wmc.com
| ^ | The figures quoted represent the production from the operations now comprising WMC Resources Ltd. |
| Quarter ended 31 March 2003 | |
Hedging
Commodity & Currency Hedging as at 31 March 2003
WMC Resources’ revenues vary significantly with movements in commodity prices and the AUD/USD exchange rate. There is an existing hedge position that will be continuously managed.
The hedge book was marked-to-market at the date of demerger. Consequently, the profit and loss for each hedge will be determined by the difference between that particular hedge’s fair value and the spot price at the date of the hedge’s maturity.
The following tables show both the rates at which the hedge transactions are contracted with third parties to determine the cash flow impact for each hedge and the rates for determining the profit and loss impact.
Currency (as at 31 March 2003)
| Forward Sale of US$ | Synthetic Forward Sale of US$ | |||||||||
Period | Amount US$m | Cash Flow Rate A$/US$ | Amount US$m | Cash Flow Rate A$/US$ | Profit & Loss Rate A$/US$ | |||||
2003 | 155 | 0.6745 | 47 | 0.6479 | 0.5535 | |||||
2004 | 228 | 0.6753 | 73 | 0.6402 | 0.5452 | |||||
2005-2008 | 737 | 0.6740 | 345 | 0.6239 | 0.5426 | |||||
A synthetic forward consists of a bought US$ put and a written US$ call option. The written US$ call option has the potential to knock out above certain exchange rates.
Gold (as at 31 March 2003)
| Forward Sale of Gold | ||||||
Period | Amount Ounces | Cash Flow Rate A$/oz | Profit & Loss Rate A$/oz$ | |||
2003 | 60,795 | 548 | 580 | |||
2004 | 80,000 | 559 | 600 | |||
2005-2010 | 450,200 | 646 | 678 | |||
Gold production from Olympic Dam is delivered into the gold hedging positions.
Some foreign exchange and gold hedges were reversed as a result of the gold asset sales in 2001. The cash flow impact of these reversals has been deferred to the original settlement date as follows:
| 2003 remainder | 2004 | 2005 | 2006 | 2007 | 2008 | |||||||||||||
Deferred Cashflow(A$m) | (22.8 | ) | (26.5 | ) | (37.4 | ) | (28.6 | ) | (23.4 | ) | (21.2 | ) |
Scenario tables
As WMC Resources’ hedge positions comprise a combination of limiting and non-limiting cover, at various price levels, any one exchange rate or spot price cannot be used to predict the outcome of WMC Resources’ hedge position. The following table provides an estimate of the realised value under various scenarios, taking into account the hedged and unhedged exposures. All realised exchange rate and price estimates include applicable option premium.
Currency
A$/US$ | Estimated realised rate - $A/US$ | |||||
Rate at maturity | 2003 | 2004 | 2005-2008 | |||
0.65 | 0.6546 | 0.6543 | 0.6511 | |||
0.60 | 0.6146 | 0.6164 | 0.6081 | |||
0.55 | 0.5766 | 0.5769 | 0.5641 | |||
0.50 | 0.5352 | 0.5357 | 0.5191 | |||
| Quarter ended 31 March 2003 | |
Market conditions
Commodity prices
| Current | Average | Average | ||||
| Prices at 31/03/03 | Quarter ended 31/03/03 | Quarter ended 31/12/02 | ||||
Copper* US$/lb | 0.72 | 0.75 | 0.70 | |||
Nickel* US$/lb | 3.52 | 3.78 | 3.22 | |||
Gold* US$/oz | 333 | 351 | 323 | |||
DAP^ US$/t | 195 | 168 | 153 |
Source: Reuters
| * | Spot prices |
| ^ | fob Tampa prices |
Copper
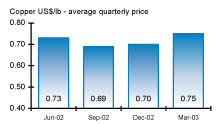
The copper price strengthened during the quarter and the average LME cash price was US$1,663/t (US$0.75/lb), up 7 per cent on the previous quarter. Prices rose strongly during the first part of the quarter, reaching $1,728/t (US$0.78/lb) before falling in line with other commodity prices and equity markets as a result of an uncertain global economic outlook and concerns about the duration of the conflict in Iraq.
LME copper stocks fell for the fourth consecutive quarter, down 4.8 per cent (40,700 tonnes) to 815,700 tonnes.
Copper consumption remains firm in Asia, particularly China, where double-digit consumption growth is expected again this year, while slower economic activity in Europe and the US has stalled consumption there. We continue to experience firm demand from our customers in Asia and Australia.
Uranium
Olympic Dam sells most of its uranium under long-term contracts that yield a premium over the spot price.
The spot price for uranium as represented by the Nuexco Exchange fell from US$10.20/lb at the beginning of the quarter to US$10.10/lb in March.
Nickel
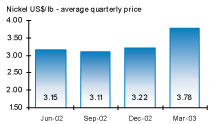
The nickel price was significantly higher during the quarter, with the average LME cash price at US$8,337/t (US$3.78/lb), up 17 per cent over the previous quarter. The range over the period was US$7,210 to US$9,105/t (US$3.27 to US$4.13/lb), the highest price since June 2000.
Pricing support resulted from favourable market fundamentals, including higher stainless steel production, low inventories and tight scrap availability. Negative influences included global economic uncertainty, the conflict in Iraq and large deliveries of full plate cathodes into LME warehouses. LME stocks rose by 11 per cent (2,406 tonnes) to 24,396 tonnes.
Fertilizer
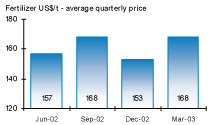
The DAP price increased substantially over the period, with a range of US$149/t (fob Tampa) to US$195/t. Several factors contributed to the price strength, including strong demand for product on international markets and a rapid increase in raw material costs that has forced producers to raise prices or reduce output. The DAP price has also been undergoing cyclical recovery since mid 2001, and this improvement has continued.
Prices are expected to soften slightly in the short-term as seasonal demand in Europe, Latin America and Australia declines through May. Weakness should be limited due to high raw material prices and tight margins for producers.
Currency
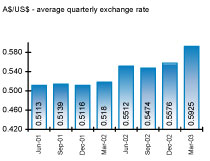
The Australian dollar was substantially stronger during the period, with the average rate 6 per cent higher than the previous period at A$/US$0.5925. A 3-year high of A$/US$0.6180 was reached before the A$ closed the quarter at A$/US$0.6006. Positive factors for the A$ included US$ weakness, resulting from poor economic and market conditions, along with strong interest rate differentials and a resilient domestic economy.
Attachment “A”
Details of Securities Issued
| Shares | Issue Price | Issue Date | Expirry Date | Description | Share Capital | |||||||||
| 71,700 | $ | 2.26 | 21.12.03 | Empolyee Options Exercised | $ | 162,042 | ||||||||
| 290,000 | $ | 2.49 | 21.12.03 | 722,100 | ||||||||||
| 162,600 | $ | 3.90 | 20.12.04 | 634,140 | ||||||||||
| 517,900 | $ | 3.48 | 18.12.05 | 1,802,292 | ||||||||||
| 26,200 | $ | 4.33 | 30.11.06 | 113,446 | ||||||||||
| Shares to be Quoted | 1,068,400 | Total Share Capital to be Quoted | $ | 3,434,020 | ||||||||||
Details of Securities Not Quoted on the ASX
Unquoted Securities as at 30/12/02 | Description | Options Exercised | Options Lapsed | Options Issued | Unquoted Securities As at | |||||
| 926,220 | (a) employee options expiring 21/12/2003 exercisable at $2.26 | 71,700 | 0 | 854,520 | ||||||
| 375,000 | (b) employee options expiring 21/12/2003 exercisable at $2.49 | 290,000 | 0 | 85,000 | ||||||
| 3,748,100 | (c) employee options expiring 20/12/2004 exercisable at $3.90 | 162,600 | 36,900 | 3,548,600 | ||||||
| 5,918,100 | (d) employee options expiring 18/12/2005 exercisable at $3.48 | 517,900 | 9,000 | 5,391,200 | ||||||
| 9,981,900 | (e) employee options expiring 30/11/2006 exercisable at $4.33 | 26,200 | 374,400 | 9,581,300 | ||||||
| 600,000 | (f) employee options expiring 30/11/2006 exercisable at $4.33 | 0 | 0 | 600,000 | ||||||
| 10,951,860 | (g) employee options expiring 23/12/2007 exercised at $4.34 | 0 | 391,060 | 322,800 | 10,883,600 | |||||
| 32,501,180 | TOTAL OPTIONS | 1,068,400 | 811,360 | 322,800 | 30,944,220 | |||||
| Quoted Securities as at 31.12.02 | 1,128,351,047 | |
| plus Securities subject to this application for quotation | 1,068,400 | |
| TOTAL SECURITIES TO BE QUOTED ON ASX | 1,129,419,447 | |
Value | Fee | ||
| $3,434,020 | |||
| (4,800+.0.05066667% on excess | $ | 4,800.00 | |
| over $2,500,000) | $ | 473.24 | |
| Total Fee | $ | 5,273.24 | |
11
To: | The Manager | |
Announcements | ||
ASX Company Announcements Office |
Public Announcement 2003-11
WMC Resources Ltd is holding its Annual General Meeting on Friday, 2 May 2003 at 10.00am, in the Regent Theatre, 191 Collins Street, Melbourne.
Items of business to be considered at the meeting include the Company’s 2002 financial statements and reports and re-election of directors. The Chairman and CEO will also review the Company’s performance for 2002 and the outlook for 2003.
Shareholders unable to attend the Annual General Meeting at the Melbourne venue, can view the meeting through the live webcast from WMC’s website atwww.wmc.com
Enquiries should be directed to:
| • | Media enquiries: Tania Price (03) 9685 6233 |
| • | Investor enquiries: Nerida Mossop on (03) 9685 6236 |
Ross Mallett Assistant Company Secretary | ||
| WMC Resources Ltd | ||
ACN 004 184 598 | ||
30 April 2003 | GPO Box 860K | |
Melbourne Vic. 3001 | ||
Australia | ||
Level 16 IBM Centre | ||
60 City Road | ||
Southbank Vic. 3006 | ||
Australia | ||
Tel +61 (0)3 9685 6000 | ||
Fax +61 (0)3 9685 6115 | ||
To: | The Manager | |
Announcements | ||
Company Announcements Office |
Public Announcement 2003-12
Please find attached Change of Director’s Interest Notice (Appendix 3Y) in respect of WMC Resources Ltd Director, Mr Tommie Bergman.
A copy of this notice can be viewed at WMC’s internet site atwww.wmc.com following its release to the market.
Ross Mallett
Assistant Company Secretary
1 May 2003
| WMC Resources Ltd |
ACN 004 184 598 |
GPO Box 860K |
Melbourne Vic. 3001 |
Australia |
Level 16 IBM Centre |
60 City Road |
Southbank Vic. 3006 |
Australia |
Tel +61 (0)3 9685 6000 |
Fax +61 (0)3 9685 6115 |
Appendix 3Y
Change of Director’s Interest Notice
Rule 3.19A.2
Appendix 3Y
Change of Director’s Interest Notice
Information or documents not available now must be given to ASX as soon as available. Information and documents given to ASX become ASX’s property and may be made public.
Introduced 30/9/2001.
Name of entity | WMC RESOURCES LTD | |
ABN | 76 004 184 598 | |
We (the entity) give ASX the following information under listing rule 3.19A.2 and as agent for the director for the purposes of section 205G of the Corporations Act.
Name of Director | Mr Tommie Carl-Eric Bergman | |
Date of last notice | 11 December 2002 | |
Part 1—Change of director’s relevant interests in securities
In the case of a trust, this includes interests in the trust made available by the responsible entity of the trust
Note: In the case of a company, interests which come within paragraph (i) of the definition of “notifiable interest of a director” should be disclosed in this part.
Direct or indirect interest | Direct | |
Nature of indirect interest (including registered holder) Note: Provide details of the circumstances giving rise to the relevant interest. | N/a | |
Date of change | 28 April 2003 | |
No. of securities held prior to change | 10,000 Fully paid shares | |
Class | Ordinary Shares | |
Number acquired | 30,000 Fully paid shares | |
Number disposed | N/a | |
Value/Consideration Note: If consideration is non-cash, provide details and estimated valuation | $3.76 per share | |
No. of securities held after change | 40,000 Fully paid shares | |
Nature of change Example: on-market trade, off-market trade, exercise of options, issue of securities under dividend reinvestment plan, participation in buy-back | On-market purchase. | |
| + | See chapter 19 for defined terms. |
Appendix 3Y Page 2 | 11/3/2002 |
Part 2—Change of director’s interests in contracts
Note: In the case of a company, interests which come within paragraph (ii) of the definition of “notifiable interest of a director” should be disclosed in this part.
Detail of contract | N/a | |
Nature of interest | ||
Name of registered holder (if issued securities) | ||
Date of change | ||
No. and class of securities to which interest related prior to change Note: Details are only required for a contract in relation to which the interest has changed | ||
Interest acquired | ||
Interest disposed | ||
Value/Consideration Note: If consideration is non-cash, provide details and an estimated valuation | ||
Interest after change | ||
To: | The Manager | |
Announcements | ||
ASX Company Announcements Office |
Public Announcement 2003-13
Please find attached for immediate release, a copy of the Annual General Meeting Address to be presented to shareholders today.
A copy of the Annual General Meeting Address will be published on WMC’s website atwww.wmc.com later this morning.
Ross Mallett
Assistant Company Secretary
2 May 2003
| WMC Resources Ltd |
ACN 004 184 598 |
GPO Box 860K |
Melbourne Vic. 3001 |
Australia |
Level 16 IBM Centre |
60 City Road |
Southbank Vic. 3006 |
Australia |
Tel +61 (0)3 9685 6000 |
Fax +61 (0)3 9685 6115 |

Chairman’s Address
Good morning ladies and gentlemen, I am Ian Burgess, Chairman of WMC Resources Ltd’s Board of Directors and I will be chairing today’s Annual General Meeting.
I would like to welcome you to the first annual meeting of WMC Resources Ltd following the demerger of WMC Limited and listing of WMC Resources Ltd on the Australian Stock Exchange in December last year.
I also welcome those observing the meeting through our Internet broadcast. We are broadcasting the meeting to provide access to as many shareholders and employees as possible.
Firstly, I am pleased to announce that the Board has agreed that Tommie Bergman will succeed me as Chairman from today.
Focus on performance
It is more than four months since the demerger and the board is pleased with how the company has adapted to its changed circumstances and performed. There are no surprises to report.
We have achieved a smooth transition and have a company that is very focused on operating and financial objectives.
The company and the board have made clear since the demerger that our focus going forward is very much on optimising performance of our existing assets and operations, as well as identifying and exploiting targeted growth opportunities.
Because we are a different company to when I last had the opportunity of addressing you, I will describe the company as it is today and outline some of the goals we are aspiring to.
Our assets
WMC Resources has some of the best resources assets in the world - large, long-life and low cost, in the businesses of nickel, copper/uranium and ammonia phosphate fertilizer.
We are the world’s third largest nickel producer, a particularly good position to be in at this time of strong nickel demand.
Olympic Dam in South Australia produces two percent of the world’s copper and seven percent of the world’s uranium needs and has the potential to be greatly expanded.
Out of northern Queensland, we are currently producing the world’s lowest cost fertilizer and, in an environment of industry consolidation, we are Australia’s only producer of ammonia phosphate fertilizers.
Late last year we announced the acquisition of the whole of the Corridor Sands titanium dioxide asset in Mozambique, whose resources are equivalent to one-third of the world’s known resources of titanium dioxide.
Project development of this asset initially would be in the order of US$500 million.
We continue to explore for nickel sulphides, copper and gold, around the globe, and remain committed to a vigorous exploration program.
We are also looking to access growth opportunities through partnerships, mergers and acquisitions and Andrew Michelmore will explain some of our growth prospects in greater detail later.
Safety performance
Turning to our people - regrettably, last year we had a fatal accident at Mt Keith, when a haul truck driven by Daniel Comrie, a 33-year-old contractor with Roche Mining, fell into the pit.
An investigation into that incident has been held and we are in the process of implementing the recommendations arising from it.
While a fatality is clearly unacceptable, safety continues to be a priority for us, demonstrated by a 21 percent decrease in injury frequency rate over 2001 and a 19 percent year-on-year reduction over the last five years.

We are pleased to say we are continuing to track at about one-third the injury rate of our Australian peer group.
Our people
World-wide, we employ just over 3000 people directly and another 1600 or so indirectly through contractors.
We have a policy of seeking to attract and retain the best available people and encourage them to work collaboratively to achieve the company’s overall goals.
This has been demonstrated in the past months with a number of excellent people joining our management ranks and committing themselves to the new WMC Resources.
With the formation of the new company following last year’s demerger, and a new chief executive in Andrew Michelmore, we have also taken the opportunity to review and refine our people-related goals.
The Board has been strengthened with the appointment of Alan Dundas, Executive General Manager—Operations, who brings to the board a real hands-on understanding of and involvement in the operations.
And our senior executive team of Andrew Michelmore, Alan Dundas, Greg Travers as Executive General Manager—Group Services, Bruce Brook as CFO and newly appointed Michael Nossal as Executive General Manager—Business Strategy and Development is a strong mix of WMC knowledge, industry experience and new ways of thinking.
Our objective
Many of you will know that corporate objectives can be elusive and something of an illusion.
Ours is to achieve total shareholder returns in the top quartile of our peer group companies over any five year time frame.
We recognise that the resources industry is cyclical and that some of our peer companies are in single commodities that may be particularly strong or weak in any given year.
So that is why we have identified a five-year time frame and a goal of being in the top quartile. We think, with this company, that this is achievable.
Our results
Due to the demerger transaction and the associated transfer of businesses between company structures, the statutory result for the year reflects the financials for twelve months of our nickel business operations but only one month of our copper and fertilizer operations.
It also reflects that WMC Resources bore the cost of the demerger and intra-group interest charges for the full 12 months.
So that figure, showing a loss of A$44 million, is not actually representative of how the businesses performed.
The figure which actually represents the performance of our on-going operations is a profit of $75 million, which you will have seen explained in the Special Purpose Report mailed to you with the annual Business Performance Report.
Importantly, this figure is consistent with the financial commitments we outlined in last year’s demerger Scheme Booklet and we are pleased to have been able to meet those commitments.
As indicated in the Scheme Booklet, we did not pay a dividend for the year. As was said last November, we do not have the franking credits that belonged to WMC Limited. For that reason, dividends are likely to be modest with cash flow directed to growing the business.
Those of you who continue to hold your Alumina Limited shares will have benefited from a generous dividend payment from Alumina—in fact the same dividend payment you would have received from the former WMC Limited.
In the short term, it is not WMC Resources’ dividend that you should be looking to as the measure of the company’s value, but rather the growth in share price created as the company performs and grows.
If you look at this graph, you can see that the combined share price of WMC Resources and Alumina Ltd, since the demerger, has outperformed both the All Ordinaries Index and the Resources Index.
So, we are pleased that in the period of time since the demerger, those shareholders who continue to hold both WMC Resources and Alumina Limited have definitely outperformed the market.
Now, if WMC Resources can achieve our objective of being in the top quartile of our peer companies over any five-year period, we will be fulfilling a large part of our long-term obligation to shareholders.
Corporate governance
Another obligation we have to shareholders is in the area of corporate governance. This is a much vexed subject.
It needs to be said and understood that directors do not manage companies and should not normally meddle in management. They appoint professional managers to do that.
Never-the-less, directors are responsible and accountable for the overall performance of the company and what it does to achieve good performance.
Boards bring variety of experience and perspective to their task and they are personally liable for what happens.
It is not an enviable task, especially when things go badly, as they do from time to time.
To be a director, or a chairman these days is not something that anyone should take on lightly. The responsibilities are large.
I believe directors in general and certainly your directors at WMC are open and honest and transparent within the law. You will understand that there will always be difficulties in airing incomplete negotiations because, if agreement is not reached, shareholders can be misled.
At this time we are not having serious talks with any other company about significant matters affecting the corporation.
With last year’s announcement to suspend the granting of options to senior managers and replace them with a fully costed and deductible Executive Share Plan, we led the way in Australia’s corporate response to shareholder concern around options.
In March this year, the ASX Corporate Governance Principles and Recommendations were released.
I am pleased to say we compare favorably. However, we are not being complacent and are continuing to review these and other measures to ensure we have best practice.
Despite the fact that we are not obliged to report against the recommendations until 2005, we have already moved to address two matters raised—one that we did not have a formal Nominations Committee in place to review the appointment of new directors and succession planning for the board—and two, that our directors’ total remuneration packages include a retirement benefit.
The role of a Nominations Committee has, in fact, been performed by the board as a whole, but to meet the ASX principles and recommendations, we have determined formally to appoint the full board as the Nominations Committee and we are in the process of finalising a charter for that committee.
We recognise that there has been public comment about directors’ retirement benefits. It needs to be said that to attract the best people to our board, we need to ensure directors’ fees reflect market rates and adequately reward directors for the experience they bring and the risks and liabilities they assume in undertaking their role.
While the ASX report did not specifically recommend a change to the structure of our directors’ remuneration, we have decided to implement different arrangements for new directors appointed to the board.
From now on, new directors will not accumulate a retirement benefit but rather be compensated entirely through their annual fee.
As part of our on-going commitment to transparency, our 2002 annual report, which you would have received about a month ago, outlined all of the relevant issues regarding payments to the former CEO, Hugh Morgan.
Our disclosure was early, complete and transparent. This is as it should be.
Given the current community discussion about departing CEOs, I would like to ensure that the composition of Hugh’s final payment is understood.
There is certainly no large retirement payment included and, in fact, of the figures given in our report, the amount referred to is largely comprised of his annual and long service leave, and other contractual entitlements after 26 years with WMC and 11 years with North Broken Hill.
The amount relating to a retirement payment to both Hugh Morgan and Don Morley, who have now left the company, was two times their annual salary.
Both retired before their 65th birthday and both greatly assisted the company in the transition to a new management team.
A new CEO
I’d also like to use this opportunity to thank Hugh Morgan for his service to the company over the past decades. It is rare indeed these days to be farewelling a Chief Executive who has had 16 years in the job, and it was a job well done.
We are of course, very fortunate to have, as Hugh’s successor, Andrew Michelmore as the new CEO of WMC Resources.
Let me tell you something about Andrew. He is a chemical engineer by training. He was a Rhodes Scholar and rowed for Oxford and Australia.
He has many years experience in minerals processing and was general manager of Nabalco for four years prior to joining WMC.
At WMC, he had a range of experience, variously managing operations, planning and development.
I will hand over to him to discuss the company’s performance last year and our priorities going forward.
So, to sum up, there are no surprises to report. We have excellent assets and our emphasis is on optimising performance. And there are growth opportunities that Andrew will go into in more detail.
Chief Executive Officer’s address
As the Chairman has said, at our full-year results announcement in February, we were pleased to be able to confirm that WMC Resources has delivered on the commitments set out in the Scheme Booklet for last year’s demerger.
Our performance
Overall last year, we achieved solid production results, although we were impacted by a number of operational issues, some of which we are continuing to manage this year. Let me take you through each of the businesses.
As the Chairman indicated, nickel is a strong performer for us.
It has been over the last 12 months and will continue to be this year.
We expect to produce a record level of nickel metal from the Kwinana refinery this year, and an increase in production of nickel-in-matte from the Kalgoorlie smelter.
The market outlook for nickel is strong, from both the demand and price points of view, and we are accessing new markets for nickel.
This was demonstrated last year with an agreement for the sale of nickel-in-matte to China’s largest nickel producer, Jinchuan.
At Olympic Dam, our focus this year is to position ourselves for full production from 2004.
We will be conducting a smelter reline and will complete the rebuild of the copper solvent extraction plant during the year, both of which will impact on this year’s production.
These repair and maintenance works have been factored into our forecasts and we now plan to produce 185,000 tonnes of copper.
The rebuilding of the uranium solvent extraction plant, following the fire in late 2001, has been completed, and we are pleased to say that we are in the process of handing over the uranium circuit to the operations, who will then start filling the circuit with solvent.
The global market for copper is still uncertain and we expect demand, and therefore price, to be largely driven by the economic growth of China and the economic sentiment of the United States.
At Queensland Fertilizers, with stable operating performance and production nearing full capacity, we can work towards our target of more than one million tonnes per annum. We remain the lowest cash cost producer of ammonium phosphate fertilizers in the world and are the only Australian producer.
With drought conditions improving, market sentiment and prices are strengthening and we are well-positioned to benefit from any upturn.
We are also watching global markets carefully, with China coming back into the market and India as a likely growth market.
Our sales and distribution business, Hi-Fert, is now number two in the largest part of the Australian market and we are expecting another good year.
We achieved the highest returns in the fertilizer industry last year. Overall, we are on track to meet the production and financial targets we outlined early this year, however, as I’ve discussed in other forums, the intensive maintenance programs of the first half, and some other issues, mean that our profit will be skewed towards the second half of the year. Throughout our operations, we have a focus on improving margins, and we are achieving significant financial
savings through a variety of programs.
We are dedicated users of the Six Sigma analytical approach, which enabled us to achieve savings of more than $30 million last year, and we are on track to achieve our previously stated target of $100 million in cumulative benefits by December 2004.
To date, we have well over 1,000 of our employees trained in the Six Sigma approach.
Generating shareholder value through growth
Improving shareholder value through growth is clearly a priority, and we have identified three directions through which growth will be achieved.
The first is by generating more from our current assets.
One of the ways of doing this is through targeted programs developed using the Six Sigma tools.
We also have plans to grow our existing businesses.
In the nickel business, we have a number of opportunities, including expansion of the refinery, expansion of Mt Keith and the use of spare capacity at the smelter.
At Olympic Dam, studies are underway for expansion, and we have the potential to more than double our capacity.
As part of the study, we are working with a South Australian government task force which is looking at how to best facilitate and resolve the complex issues involved in any expansion. These include water supply and environmental impact.
While our focus at Queensland Fertilizers is to ensure consistent performance, we know we are able to expand that business in response to market demand.
There are a number of fronts on which we are pursuing external growth and it is certainly our intention to grow beyond, as well as within Australia.
Our top priority in exploration is on nickel sulphides and secondly, on copper / gold.
We also have made it clear that we will evaluate merger and acquisition opportunities, including partnerships, as they arise.
But we will only pursue opportunities that create value for shareholders.
The Chairman has mentioned the Corridor Sands project in Mozambique, which is an exciting greenfields opportunity for us.
So, as you see, we are pursuing a number of avenues and strategies for growing the company and, through each, to increase shareholder value.
The way we do business
Beyond this, however, it is the way we do business today that will provide us the ability and leverage to grow in the future.
We have identified four key drivers for success.
They are our people, our assets, business excellence and our reputation. Certainly, much of our current internal emphasis is on developing a level of excellence in our processes and procedures, to give us the sustained, consistent performance necessary to reach our goals.
We continue to recruit high calibre people across the company to help us reach these levels of excellence and I am delighted to welcome Michael Nossal to the executive team as head of Business Strategy and Development.
Having most recently held that role myself, I have high expectations of what Michael and his team will be able to achieve.
The Chairman touched on our commitment to corporate governance and I’d like to take this opportunity to explain where we are heading with our public reporting program.
Our reputation
WMC has a long-held reputation for setting the standard in transparent reporting of our financial, environmental and social performance.
With our latest Business Performance Report, we have taken a major step forward to integrate these aspects of our business, each of which play a vital role in our success.
We believe that the financial, environmental and social elements of our business must work together seamlessly, and we will continue to reflect this integration in next year’s report.
We are pleased with our performance in the environment and community areas, having significantly reduced environmental incidents and committed ourselves to challenging site and company targets for improvements in areas such as water use, energy use, sulphur dioxide emissions and land rehabilitation.
We have in place a range of programs, based around partnerships with the communities in which we operate, to address specific local issues and concerns.
I am particularly pleased with our progress in implementing training programs for indigenous people and, even more importantly, our efforts to employ indigenous people across our operations.
We have generated more than $30 million in contract services with indigenous-based companies. At Leinster Downs in Western Australia and Phosphate Hill in Queensland, our training programs have had 41 graduates, with 38 taking up full-time work.
I would encourage anyone interested in finding out more about our community and environment programs to visit the Sustainability Report on our website atwww.wmc.com.
I would like to conclude today by paying tribute to Ian Burgess, who has been chairman of WMC since 1999 and who has overseen a significant chapter of this company’s life.
We will miss his forthright approach and his keen sense of humour.
Annual General Meeting Proceedings
At the meeting shareholders voted to receive the company’s financial statements and reports for the year ended 31 December 2002.
Shareholders also re-elected Professor Adrienne Clarke and elected Mr Alan Dundas as directors.
Both Mr Ian Burgess and Mr Roger Vines retired from the Board from the conclusion of the meeting. Mr Tommie Bergman succeeds Mr Burgess as Chairman of the company.
Share enquiries
Investors seeking information about their WMC Resources shareholding or dividends should contact Computershare Investor Services Pty Limited:
Mail to GPO Box 2975EE,
Melbourne, Victoria 3001,
Australia
Telephone +61 (0)3 9615 5970 or 1300 366 353 for callers within Australia
Facsimilie +61 (0)3 9611 5710
Email towmc.registry@computershare.com.au
Shareholders may also access shareholding details directly from our website atwww.wmc.com. When seeking information, shareholders must provide their Shareholder Reference Number of Holder Identification Number, which is recorded on their shareholding statements.
To: | The Manager | |
| Announcements | ||
| ASX Company Announcements Office |
Public Announcement 2003-14
RESULTS OF ANNUAL GENERAL MEETING
In accordance with ASX Listing Rule 3.13.2 and section 251AA of the Corporations Act 2001, I advise the following results in relation to the items of business considered by members of WMC Resources Ltd at the Company’s Annual General Meeting held on 2 May 2003:
Resolution Results:
RESOLUTION NO. | RESOLUTION | RESULT | ||
1 | To receive and consider the Financial Report and the Reports of the Directors and the Auditor for the year ended 31 December 2002. | Passed by a show of Hands | ||
2 | To re-elect Professor A.E. Clarke as a Director | Passed by a show of Hands | ||
3 | To elect Mr A.K. Dundas as a Director | Passed by a show of Hands | ||
Proxy Voting Intentions:
Resolution No. | For | Against | Open | Total | Abstentions | |||||
1 | 460,520,697 | 175,686 | 35,378,613 | 496,070,996 | 16,150,111 | |||||
2 | 473,141,508 | 2,408,955 | 35,459,430 | 511,009,893 | 1,183,320 | |||||
3 | 473,889,096 | 1,624,602 | 35,495,295 | 511,008,993 | 1,183,320 | |||||
Ross Mallett
Assistant Company Secretary
2 May 2003
WMC Resources Ltd |
ACN 004 184 598 |
GPO Box 860K |
Melbourne Vic. 3001 |
Australia |
Level 16 IBM Centre |
60 City Road |
Southbank Vic. 3006 |
Australia |
Tel +61 (0)3 9685 6000 |
Fax +61 (0)3 9685 6115 |
To: | The Manager | |
| Announcements | ||
| ASX Company Announcements Office |
Public Announcement 2003-16
Please find attached a media release by WMC Resources Ltd relating to the pricing of the company’s US$700 million global bond.
A copy of this notice can be viewed at WMC’s internet site atwww.wmc.com following its release to the market.
Ross Mallett
Assistant Company Secretary
6 May 2003
WMC Resources Ltd |
ACN 004 184 598 |
GPO Box 860K |
Melbourne Vic. 3001 |
Australia |
Level 16 IBM Centre |
60 City Road |
Southbank Vic. 3006 |
Australia |
Tel +61 (0)3 9685 6000 |
Fax +61 (0)3 9685 6115 |
MEDIA RELEASE
Date: 6 May 2003 |
WMC Resources prices a debut
US$700 million Global Bond
WMC Resources, a diversified mining and resources company, announced today that it had priced via WMC Finance (USA) Limited a two tranche offering of $500 million 5 1/8% 10-year notes and $200 million 6 1/4% 30-year notes guaranteed by WMC Resources Ltd and its subsidiaries, WMC (Olympic Dam Corporation) Pty Ltd and WMC Fertilizers Pty Ltd. The net proceeds from the offering will be used to refinance short-term indebtedness.
The transaction represents WMC Resources’ debut issue in the U.S. bond market after the 2002 demerger of WMC Limited.
WMC Resources Chief Financial Officer, Bruce Brook, said “the offering achieves our objectives of diversifying our investor base and lengthening out maturity profile”.
WMC Resources initially approached the market with a 10-year $500 million transaction. The transaction was upsized from $500 million to $700 million, with a 30-year tranche added. More than 100 institutional investors purchased the offering, with over 90% from the U.S.
The notes have been offered only to qualified institutional buyers in the United States under Rule144A under the Securities Act of 1933, as amended (the “Securities Act”), and certain investors outside of the United States under Regulation S under the Securities Act. The offering of the notes has not been registered under the Securities Act or any state securities laws and the notes may not be offered or sold in the United States absent registration or an applicable exemption from the registration requirements of the Securities Act and applicable state securities laws. In connection with the offering, the Company has agreed, subject to certain terms and conditions, to subsequently file an exchange offer registration statement under the Securities Act in order to effect the exchange of the unregistered notes for substantially identical registered notes.
This press release does not and will not constitute an offer to sell or the solicitation of an offer to buy the notes. This press release is being issued pursuant to and in accordance with Rule 135c under the Securities Act.
This press release contains forward-looking statements within the meaning of the Federal securities laws. You should exercise caution in interpreting and relying on forward-looking statements because they involve known and unknown risks, uncertainties and other factors which are, in some cases, beyond WMC Resources Ltd’s control and could materially affect actual results, performance or achievements. These factors include, without limitation, that completion of the
WMC Resources Ltd |
ABN 76004 184 598 |
GPO Box 860K |
Melbourne Vic. 3001 |
Australia |
Level 16 IBM Centre |
60 City Road |
Southbank Vic. 3006 |
Australia |
Tel +61 (0)3 9685 6000 |
Fax +61 (0)3 9685 6265 |
A member of the |
WMC Resources |
group of companies |
1/2
aforementioned offering is subject to, among other things, market condition, that no assurance can be given that the offering can be completed under acceptable terms or on the anticipated timetable, and other risks and uncertainties detailed from time to time in the company’s filings with the Securities and Exchange Commission.
For further information contact:
Media contact:
Tania Price
Group Manager—Public Affairs
Telephone: (03) 9685 6233
Mobile: 0419 502 852
Analyst contact:
Nerida Mossop
Manager—Investor Relations
Mobile: 0418 378 809
2/2
| To: | The Manager |
Announcements
ASX Company Announcements Office
Public Announcement 2003-17
WMC Resources Ltd would like to announce that following the retirement of Mr Ian Burgess as Chairman at the company’s Annual General Meeting on 2 May 2003, Mr Tommie Bergman has been appointed as Chairman of the Board. Mr Roger Vines also retired from the board at the meeting.
In accordance with ASX Listing Rule 3.19A.3, we enclose Final Director’s Interest Notices (Appendix 3Z) for Mr Bergman and Mr Vines.
A Change of Director’s Interest Notice (Appendix 3Y) for Mr Bergman is also attached in accordance with ASX Listing Rule 3.19A.2.
Ross Mallett
Assistant Company Secretary
6 May 2003
| WMC Resources Ltd |
ACN 004 184 598 |
GPO Box 860K |
Melbourne Vic. 3001 |
Australia |
Level 16 IBM Centre |
60 City Road |
Southbank Vic. 3006 |
Australia |
Tel +61 (0)3 9685 6000 |
Fax +61 (0)3 9685 6115 |
Appendix 3Y
Change of Director’s Interest Notice
Rule 3.19A.2
Appendix 3Y
Change of Director’s Interest Notice
Information or documents not available now must be given to ASX as soon as available. Information and documents given to ASX become ASX’s property and may be made public.
Introduced 30/9/2001.
Name of entity | WMC RESOURCES LTD | |
ABN | 76 004 184 598 | |
We (the entity) give ASX the following information under listing rule 3.19A.2 and as agent for the director for the purposes of section 205G of the Corporations Act.
| Name of Director | Mr Tommie Carl-Eric Bergman | |
| Date of last notice | 1 May 2003 | |
Part 1—Change of director’s relevant interests in securities
In the case of a trust, this includes interests in the trust made available by the responsible entity of the trust
Note: In the case of a company, interests which come within paragraph (i) of the definition of “notifiable interest of a director” should be disclosed in this part.
Direct or indirect interest | Direct | |
Nature of indirect interest (including registered holder) Note: Provide details of the circumstances giving rise to the relevant interest. | N/a | |
Date of change | 2 May 2003 | |
No. of securities held prior to change | 40,000 Fully paid shares | |
Class | Ordinary Shares | |
Number acquired | 10,000 Fully paid shares | |
Number disposed | N/a | |
Value/Consideration Note: If consideration is non-cash, provide details and estimated valuation | Ranging from $4.00 to $4.06 per share | |
No. of securities held after change | 50,000 Fully paid shares | |
Nature of change Example: on-market trade, off-market trade, exercise of options, issue of securities under dividend reinvestment plan, participation in buy-back | On-market purchase. | |
| + | See chapter 19 for defined terms. |
Appendix 3Y Page 2 | 11/3/2002 |
Part 2—Change of director’s interests in contracts
Note: In the case of a company, interests which come within paragraph (ii) of the definition of “notifiable interest of a director” should be disclosed in this part.
Detail of contract | N/a | |
Nature of interest | ||
Name of registered holder (if issued securities) | ||
Date of change | ||
No. and class of securities to which interest related prior to change Note: Details are only required for a contract in relation to which the interest has changed | ||
Interest acquired | ||
Interest disposed | ||
Value/Consideration Note: If consideration is non-cash, provide details and an estimated valuation | ||
Interest after change | ||
Appendix 3Z
Final Director’s Interest Notice
Rule 3.19A.3
Appendix 3Z
Final Director’s Interest Notice
Information or documents not available now must be given to ASX as soon as available. Information and documents given to ASX become ASX’s property and may be made public.
Introduced 30/9/2001.
Name of entity | WMC RESOURCES LTD | |
ABN | 76 004 184 598 | |
We (the entity) give ASX the following information under listing rule 3.19A.3 and as agent for the director for the purposes of section 205G of the Corporations Act.
Name of director | Mr Ian Glencross Radcliffe Burgess | |
Date of last notice | 11 December 2002 | |
Date that director ceased to be director | 2 May 2003 | |
Part 1—Director’s relevant interests in securities of which the director is the registered holder
In the case of a trust, this includes interests in the trust made available by the responsible entity of the trust
Note: In the case of a company, interests which come within paragraph (i) of the definition of “notifiable interest of a director” should be disclosed in this part.
Number & class of securities
18,039 ordinary shares in WMC Resources Ltd |
| + | See chapter 19 for defined terms. |
Appendix 3Z Page 4 | 11/3/2002 |
Part 2—Director’s relevant interests in securities of which the director is not the registered holder
Note: In the case of a company, interests which come within paragraph (ii) of the definition of “notifiable interest of a director” should be disclosed in this part.
In the case of a trust, this includes interests in the trust made available by the responsible entity of the trust
Name of holder & nature of interest Note: Provide details of the circumstances givingrise to the relevant interest
N/a | Number & class of securities
N/a |
Part 3—Director’s interests in contracts
Detail of contract | N/a | |
Nature of interest | ||
Name of registered holder (if issued securities) | ||
No. and class of securities to which interest relates | ||
Appendix 3Z
Final Director’s Interest Notice
Rule 3.19A.3
Appendix 3Z
Final Director’s Interest Notice
Information or documents not available now must be given to ASX as soon as available. Information and documents given to ASX become ASX’s property and may be made public.
Introduced 30/9/2001.
Name of entity | WMC RESOURCES LTD | |
ABN | 76 004 184 598 | |
We (the entity) give ASX the following information under listing rule 3.19A.3 and as agent for the director for the purposes of section 205G of the Corporations Act.
Name of director | Mr Roger Andrew Geoffrey Vines | |
Date of last notice | 11 December 2002 | |
Date that director ceased to be director | 2 May 2003 | |
Part 1—Director’s relevant interests in securities of which the director is the registered holder
In the case of a trust, this includes interests in the trust made available by the responsible entity of the trust
Note: In the case of a company, interests which come within paragraph (i) of the definition of “notifiable interest of a director” should be disclosed in this part.
Number & class of securities
1,368 Ordinary shares in WMC Resources Ltd
| + | See chapter 19 for defined terms. |
Appendix 3Z Page 6 | 11/3/2002 |
Part 2 – Director’s relevant interests in securities of which the director is not the registered holder
Note: In the case of a company, interests which come within paragraph (ii) of the definition of “notifiable interest of a director” should be disclosed in this part.
In the case of a trust, this includes interests in the trust made available by the responsible entity of the trust
Name of holder & nature of interest Note: Provide details of the circumstances giving rise to the relevant interest
N/a | Number & class of securities
N/a |
Part 3—Director’s interests in contracts
Detail of contract | N/a | |
Nature of interest | ||
Name of registered holder (if issued securities) | ||
No. and class of securities to which interest relates | ||
| To: | The Manager |
Announcements
Company Announcements Office
Public Announcement 2003-18
Please find attached media release regarding option over the Corridor Sands project.
A copy of this can be viewed at WMC’s internet site atwww.wmc.com following its release to the market.
Ross Mallett
Assistant Company Secretary
23 May 2003
WMC Resources Ltd |
ACN 004 184 598 |
GPO Box 860K |
Melbourne Vic. 3001 |
Australia |
Level 16 IBM Centre |
60 City Road |
Southbank Vic. 3006 |
Australia |
Tel +61 (0)3 9685 6000 |
Fax +61 (0)3 9685 6115 |
MEDIA RELEASE
Release: | Immediate | |
Date: | 23 May, 2003 |
WMC Resources today said it was pleased to announce that the Industrial Development Corporation of South Africa (IDC) had elected to exercise its option over 10% of the Corridor Sands titanium dioxide project in Mozambique, which was acquired by WMC in late 2002.
WMC Resources CEO, Andrew Michelmore said the IDC would pay an initial exercise price of US$0.1million, with the balance of US$9.9million (plus interest) payable on achievement of the earlier of the following key project milestones:
| • | Introduction of a major technical partner |
| • | Establishment of terms for Project financing |
| • | Project commitment |
Mr Michelmore said that the IDC’s decision to exercise its option reflected the significance of the Corridor Sands project to the region and its confidence in the project’s commercial strength.
“The IDC is a significant participant in the South African business scene, with a strong pro-development charter in South Africa and the region. WMC warmly welcomes the IDC as a partner and looks forward to jointly progressing the project with them.”
The IDC is now a fully participating project partner and is contributing its 10% share of project pre-development, construction and commissioning costs.
The Limpopo Corridor Sands project in Mozambique is the world’s largest known resource of ilmenite, an important feedstock for the titanium dioxide pigment industry. Development of the project is expected to cost about US$500m. It will produce about 375,000 tonnes per annum of titanium dioxide slag plus about 185,000 tonnes per annum of high purity pig iron and other valuable by-products.
WMC Resources Ltd |
ABN 76004 184 598 |
GPO Box 860K |
Melbourne Vic. 3001 |
Australia |
Level 16 IBM Centre |
60 City Road |
Southbank Vic. 3006 |
Australia |
Tel +61 (0)3 9685 6000 |
Fax +61 (0)3 9685 6265 |
A member of the WMC Resources group of companies |
Mr Michelmore said that production from the project was needed by the customers in late 2007 and this would require construction to begin in the first half of 2005.
The purchase by the IDC is subject to RSA Reserve Bank approval and the settlement of formal documentation.
For further information contact:
Media contact (South Africa): | ||
Brian Taylor | Stephan Vermaak | |
Project Manager | Head Project Finance | |
WMC Resources | IDC | |
Telephone: +27 11 722 5300 | Telephone: +27 11 2693269 | |
Mobile: +27 83 279 8013 | ||
Paul Thomson | Kevin Hodges | |
Director | Senior Projects Manager | |
Corridor Sands Limitada | IDC | |
Telephone: +258 1 450567 | Telephone: +27 11 2693630 | |
Mobile: +258 82 303 909 | ||
Media contact (Australia): | ||
David Griffiths | ||
General Manager—Corporate and Community Affairs | ||
WMC Resources | ||
Telephone: +61 (3) 9685 6489 | ||
Mobile: +61 0419 912 496 | ||
Analyst contact (Australia): | ||
Nerida Mossop | ||
Manager—Investor Relations | ||
WMC Resources | ||
Telephone: +61 (3) 9685 6274 | ||
Mobile: +61 0418 378 809 | ||
To: | The Manager | |
| Announcements | ||
| ASX Company Announcements Office |
Public Announcement 2003-19
Please find attached for immediate release media announcement by WMC Resources Ltd providing an update on the company’s nickel business and on the status of Olympic Dam’s SX Plants.
A copy of this announcement can be viewed at WMC’s internet site atwww.wmc.com following its release to the market
Ross Mallett
Assistant Company Secretary
18 June 2003
| WMC Resources Ltd |
ACN 004 184 598 |
GPO Box 860K |
Melbourne Vic. 3001 |
Australia |
Level 16 IBM Centre |
60 City Road |
Southbank Vic. 3006 |
Australia |
Tel +61 (0)3 9685 6000 |
Fax +61 (0)3 9685 6115 |
Update on WMC Resources Ltd Nickel Business and Status
of Olympic Dam’s Solvent Extraction Plants
WMC Resources today advised that the strong Australian dollar exchange rate and a lower contribution from the nickel business are expected to offset the benefits of higher commodity prices in the first half of 2003. Consequently, first half earnings are expected to be similar to the pro forma earnings for WMC Resources’ second half of 2002.
The reduced contribution of the nickel business reflects lower production and sales of just under 6,000 tonnes, primarily as a result of the planned statutory maintenance shutdown at the Kalgoorlie smelter earlier this year.
Total nickel costs of sales, excluding on market purchases, are expected to be in line with those of the previous half. The consequent higher unit costs of production and sales are a result of several factors including increased volume and price of third party feed purchases and the lag impact of reduced production at Mt Keith for the fourth quarter of 2002 and the first quarter of 2003.
WMC Resources Chief Executive Officer, Andrew Michelmore, advised that commissioning of the new uranium solvent extraction (SX) plant at Olympic Dam has been substantially completed, with uranium production now running at planned rates.
Construction of the copper SX plant is progressing and is scheduled for completion by year end with final commissioning and production ramp up taking place during the first quarter 2004. A re-forecast of the total capital cost of the combined SX plants at Olympic Dam has indicated that it may exceed earlier estimates of $300 million by approximately 25%.
Following an extensive internal review of the company’s approach to the management of capital projects generally, and including the uranium section of the SX plant, WMC Resources has decided to restructure its approach to project management of the copper SX plant rebuild by increasing the company’s direct role in project management. A strengthened project team based at site will assume overall responsibility for project management.
Andrew Michelmore, said: “We are pleased to see the uranium plant completed and a return to full uranium production.
“While the likely cost outcome of the overall solvent extraction rebuild at Olympic Dam is disappointing, it is important to note that the new plant incorporates a large number of fire safety modifications which have added to the cost of the project but which were essential pre-conditions to our operating such facilities in the future”.
It is expected that certain extra costs associated with fire safety will eventually be offset by the settlement of related insurance claims.
For further information please contact:
Analyst contacts:
Gordon Drake
General Manager Investor Relations
WMC Resources
Telephone: +61 (3) 9685 6102
Mobile: +61 0419 894 059
Nerida Mossop
Manager—Investor Relations
WMC Resources
Telephone: +61 (3) 9685 6274
Mobile: +61 0418 378 809
Media contact:
David Griffiths
General Manager—Corporate and Community Affairs
WMC Resources
Telephone: +61 (3) 9685 6489
Mobile: +61 0419 912 496
18 June 2003
To: | The Manager | |
| Announcements | ||
| Company Announcements Office | ||
Public Announcement 2003-21
Please find attached Change of Director’s Interest Notice (Appendix 3Y) in respect of WMC Resources Ltd Director, Mr Tommie Bergman.
A copy of this notice can be viewed at WMC’s internet site atwww.wmc.com following its release to the market.
Ross Mallett
Assistant Company Secretary
25 June 2003
Appendix 3Y
Change of Director’s Interest Notice
Rule 3.19A.2
Appendix 3Y
Change of Director’s Interest Notice
Information or documents not available now must be given to ASX as soon as available. Information and documents given to ASX become ASX’s property and may be made public.
Introduced 30/9/2001.
| Name of entity | WMC RESOURCES LTD | |
| ABN | 76 004 184 598 | |
We (the entity) give ASX the following information under listing rule 3.19A.2 and as agent for the director for the purposes of section 205G of the Corporations Act.
| Name of Director | Mr Tommie Carl-Eric Bergman | |
| Date of last notice | 6 May 2003 | |
Part 1—Change of director’s relevant interests in securities
In the case of a trust, this includes interests in the trust made available by the responsible entity of the trust
Note: In the case of a company, interests which come within paragraph (i) of the definition of “notifiable interest of a director” should be disclosed in this part.
Direct or indirect interest | Direct | |
Nature of indirect interest (including registered holder) Note: Provide details of the circumstances giving rise to the relevant interest. | N/a | |
Date of change | 24 June 2003 | |
No. of securities held prior to change | 50,000 Fully paid shares | |
Class | Ordinary Shares | |
Number acquired | 10,000 Fully paid shares | |
Number disposed | N/a | |
Value/Consideration Note: If consideration is non-cash, provide details and estimated valuation | $3.48 per share | |
No. of securities held after change | 60,000 Fully paid shares | |
| + | See chapter 19 for defined terms. |
Appendix 3Y Page 2 | 11/3/2002 |
Nature of change Example: on-market trade, off-market trade, exercise of options, issue of securities under dividend reinvestment plan, participation in buy-back | On-market purchase |
Part 2—Change of director’s interests in contracts
Note: In the case of a company, interests which come within paragraph (ii) of the definition of “notifiable interest of a director” should be disclosed in this part.
Detail of contract | N/a | |
Nature of interest | ||
Name of registered holder (if issued securities) | ||
Date of change | ||
No. and class of securities to which interest related prior to change Note: Details are only required for a contract in relation to which the interest has changed | ||
Interest acquired | ||
Interest disposed | ||
Value/Consideration Note: If consideration is non-cash, provide details and an estimated valuation | ||
Interest after change | ||
To: | The Manager | |
Announcements | ||
ASX Company Announcements Office |
Public Announcement 2003-22
Please find attached for immediate release, Public Announcement 2003-22 covering WMC Resources Ltd’s June 2003 Quarterly Production Report.
A copy of this public announcement will be published on WMC’s web site atwww.wmc.com later this morning.
WMC’s Chief Executive Officer, Mr Andrew Michelmore, will host an audio conference at 11.00am this morning which will be broadcast live from WMC’s web site. A recording of this conference will be available for playback on WMC’s web site later today.
Peter Horton
Company Secretary
15 July 2003
| WMC Resources Ltd |
ACN 004 184 598 |
GPO Box 860K |
Melbourne Vic. 3001 |
Australia |
Level 16 IBM Centre |
60 City Road |
Southbank Vic. 3006 |
Australia |
Tel +61 (0)3 9685 6000 |
Fax +61 (0)3 9685 6115 |
WMC Resources Ltd
Quarterly Review, Quarter ended 30 June 2003
Safety, health & environment
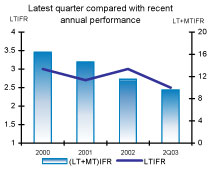
Safety, health and environment
The second quarter safety performance was in line with the first quarter result. The year-to-date injury rate of 9.9 (lost time plus medical treatment injuries per million hours worked) is a 14 per cent improvement over the full year 2002 result.
During the quarter, the Kwinana refinery reported that routine monitoring and follow-up testing had identified historic arsenic contamination beneath the plant and contained within the site boundaries. Remediation has commenced in accordance with a plan approved by the WA Department of Environmental Protection.
Efforts throughout the company are focused on sustaining our improved safety and environmental performance and on achieving injury and incident free completion of the forthcoming major shutdowns at Queensland Fertilizer Operations and Olympic Dam.
WMC Resources Ltd share price
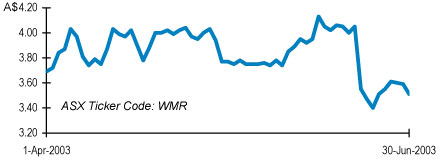
Dear Shareholder
Solid production quarter for WMC Resources
Progress continues towards full year production targets with sound performance during the second quarter of 2003 and a lost time plus medical treatment injury rate below 10 for the first time.
During the quarter we gave an update on the expected contribution of our nickel business and the cost overrun at the Olympic Dam Solvent Extraction Plants. Notwithstanding our disappointment with this aspect of our performance, we remain focused on delivering consistent and sustained performance and improving shareholder returns.
Copper production was 19 per cent higher reflecting improved performance in all areas of the Olympic Dam operation. Smelter throughput was at record levels and uranium production increased by 20 per cent.
Fertilizer production at the Phosphate Hill fertilizer plant was at record levels, equivalent to an annualized rate of 958,000 tonnes. Production in May and June was at 102 per cent of design rates for the plant.
Nickel-in-concentrate production increased by 9 per cent and nickel-in-matte was in line with the previous quarter. Nickel metal production was slightly lower due to matte feed constraints following the statutory maintenance shutdown at the Kalgoorlie smelter.
The rebuilt uranium solvent extraction plant has been commissioned and is operating at planned rates. The forecast overall project cost for the uranium and copper solvent extraction plants has increased to $375 million. Effective from the 1st June, WMC Resources has assumed project management responsibility for the remaining work associated with the copper solvent extraction plant rebuild.
The outlook for the September quarter is for increased nickel-in-matte and nickel metal production with a higher proportion of feed sourced from WMC operations. Copper and fertilizer production will be lower due to scheduled major maintenance at the Olympic Dam smelter and at the Phosphate Hill fertilizer plant. Uranium production is expected to be higher with the return of full production capacity.
A G MICHELMORE Chief Executive Officer 15 July 2003 |  |
| • | Note: Unless otherwise stated, comparisons contained in this production report are quarter on previous quarter |
| WMC | Resources Ltd |
ABN 76 004 184 598

Production overview
Copper & Uranium
Copper production increased 19 per cent with improved performance in all areas of the Olympic Dam operation.
Smelter throughput was a record 125,000 tonnes of concentrate reflecting the benefits of the new higher capacity concentrate burner and targeted improvement programs in the feed preparation and gas handling systems.
Uranium production was 20 per cent higher. This was due to increased ore throughput and grades and the contribution from the rebuilt uranium solvent extraction plant, commissioned during the quarter. Early performance of the new circuit has been encouraging and the uranium plant has been operating at planned rates since mid-June.
Gold production returned to normal levels following the processing of built-up stocks during the previous quarter.
Planning for the smelter flash furnace reline and major maintenance is nearing completion and most of the components and supplies have been delivered to site. Detailed reviews have confirmed previous estimates for duration and cost and the shutdown is scheduled to commence in the second half of August.
Whilst the smelter shutdown will significantly reduce copper production in the September quarter, uranium production is expected to be higher with return to full uranium production capacity.
Production targets for 2003 remain at 185,000 tonnes of copper and 3,600 tonnes of uranium oxide.
Nickel
Nickel-in-concentrate production increased 9 per cent reflecting higher ore grades and metallurgical recoveries at Mount Keith, Leinster and Kambalda.
The Kalgoorlie smelter was recommissioned on 11 April following a planned shutdown for statutory maintenance. As forecast, production of nickel-in-matte was in line with the previous quarter although the timing varied with more of the production achieved late in the period.
The full year target for nickel-in-matte production remains at 99,000 tonnes reflecting the expected benefit of an increased proportion of higher grade concentrate from Mount Keith in smelter feed during the second half of the year.
Lag effects of matte deliveries from the smelter resulted in lower than forecast metal production at the Kwinana nickel refinery. With the refinery scheduled to operate at capacity during the second half of the year, full year nickel metal production is expected to be in the range of 65,000 to 66,000 tonnes. The resulting additional matte will be sold into a tight market.
The review of options for capacity expansion at Mount Keith continues. In addition, approximately 7,000 metres of further drilling has been completed at the Cliffs nickel deposit eight kilometres south of Mount Keith. The drilling has extended the mineralisation both along strike and down plunge. A concept study is expected to be completed by year-end. WMC Resources has an option to acquire Cliffs from MPI Nickel.
Combined nickel, copper and PGE mineralisation has been confirmed over a strike length of approximately seven kilometres at the Collurabbie exploration project located 170 kilometres east-northeast of the Mouth Keith operation. A comprehensive drilling program will commence in the coming quarter.
Fertilizers
Record performance was again achieved at the Phosphate Hill fertilizer plant with production equivalent to an annualized rate of 958,000 tonnes. Production in May and June was 102 per cent of design capacity.
Production will be lower in the coming quarter with a major statutory maintenance shutdown of the Phosphate Hill fertilizer plant and the Mount Isa acid plant scheduled to start in July.
Fertilizer production is well placed for the target of 870,000 tonnes in 2003.
Business Development
Solvent Extraction Plant Rebuild
The rebuild of the uranium solvent extraction plant was completed and the plant was commissioned during the quarter. Construction of the copper solvent extraction plant continued on schedule for physical completion by December.
Forecast overall project cost for rebuilding the solvent extraction plants has increased to $375 million.
Effective 1st June, project management of the copper solvent extraction plant rebuild has been assumed by WMC Resources from the EPCM contractor.
Olympic Dam Expansion Study
Drilling continued during the quarter to develop geotechnical and geological data, with approximately 19,000 metres now drilled from a program of 40,000 metres. Discussions continued with the South Australian Government taskforce regarding the Olympic Dam expansion study.
Corridor Sands Limitada (CSL)
The Industrial Development Corporation of South Africa has agreed to exercise its option over 10 per cent of CSL, WMC Resources’ holding vehicle for the Corridor Sands project.
Exploration Activities
West Musgrave
Whilst drilling results to date at Nebo and Babel have been encouraging, the economic viability of the project has not yet been clearly established.
Regional exploration at West Musgrave will continue during 2003. We are progressing an exploration agreement covering new exploration licenses in the region. This will enable follow-up of further airborne electromagnetic targets.
Mundra South, Western Australia
Exploration tenements have been granted and access has been obtained at the Mundra South nickel-sulphide prospect, located roughly 200 kilometres south of West Musgrave. Airborne magnetic and electromagnetic surveys have been completed and on-ground geophysical work will commence this quarter.
Global Exploration
Exploration for nickel sulphide deposits continued in Australia, North America and China and for copper-gold deposits in Mongolia and Peru.
2003 Half Year Results
WMC Resources Ltd will release its half year results for 2003 on 13 August 2003.
This event will be webcast through WMC Resources’ internet site.
Summary of WMC Resources’ production
| Quarter ended 30 June 2003 | Quarter ended 31 Mar 2003 | Quarter ended 30 June 2002^ | ||||||
Copper (tonnes of refined copper) | Olympic Dam Operations | 49,644 | 41,678 | 38,977 | ||||
Uranium Oxide concentrate (tonnes) | Olympic Dam Operations | 764 | 635 | 595 | ||||
Silver (ounces) | Olympic Dam Operations | 173,340 | 149,666 | 157,184 | ||||
Gold (ounces) | Olympic Dam Operations | 23,371 | 26,931 | 17,948 | ||||
Nickel (tonnes contained nickel) | Kambalda Nickel Operations | 7,100 | 6,409 | 5,872 | ||||
Leinster Nickel Operations | 10,099 | 9,700 | 10,650 | |||||
Mount Keith Operations | 11,590 | 10,167 | 11,461 | |||||
Total nickel-in-concentrate | 28,789 | 26,276 | 27,983 | |||||
Total nickel-in-matte | 21,923 | 22,084 | 25,089 | |||||
Total nickel metal | 14,498 | 15,171 | 17,002 | |||||
Fertilizer | ||||||||
Di-ammonium phosphate (tonnes) | Phosphate Hill | 168,075 | 202,928 | 126,014 | ||||
Mono-ammonium phosphate (tonnes) | Phosphate Hill | 70,726 | 31,072 | 59,108 | ||||
Total Fertilizer (tonnes) | Phosphate Hill | 238,801 | 234,000 | 185,122 | ||||
A statistical supplement providing a detailed breakdown of WMC Resources’ production results is available on WMC Resources’ Internet home page at http://www.wmc.com
| ^ | The figures quoted represent the production from the operations now comprising WMC Resources Ltd. |
Hedging
Commodity & Currency Hedging as at 30 June 2003
WMC Resources’ revenues vary significantly with movements in commodity prices and the AUD/USD exchange rate. There is an existing hedge position that will be continuously managed.
The hedge book was fair valued at the date of demerger. Consequently, the profit and loss for each hedge will be determined by the difference between a particular hedge’s fair valued rate and the spot price at the date of the hedge’s maturity. The following tables show both the rates at which the hedge transactions are contracted with third parties to determine the cash flow impact for each hedge and the rates for determining the profit and loss impact.
Currency (as at 30 June 2003)
Period | Forward Sale of US$ | Synthetic Forward Sale of US$ | Non-limiting Cover | Profit & Loss Rate A$/US$ | ||||||||||
| Amount US$m | Cash Flow Rate A$/US$ | Amount US$m | Cash Flow Rate A$/US$ | Amount US$m | Cash Flow Rate A$/US$ | |||||||||
2003 (remainder) | 94 | 0.6843 | 35 | 0.6500 | 5 | 0.5920 | 0.5510 | |||||||
2004 | 228 | 0.6753 | 73 | 0.6402 | — | — | 0.5449 | |||||||
2005-2008 | 737 | 0.6740 | 345 | 0.6239 | — | — | 0.5424 | |||||||
A synthetic forward consists of a bought US$ put and a written US$ call option. The written US$ call option has the potential to knock out above certain exchange rates. US$5m of written call options were knocked out during the quarter.
Gold (as at 30 June 2003)
Period | Forward Sale of Gold | Profit & Loss Rate A$/oz | ||||
| Ounces | Cash Flow Rate A$/oz | |||||
2003 (remainder) | 40,000 | 548 | 586 | |||
2004 | 80,000 | 559 | 600 | |||
2005 | 80,000 | 579 | 620 | |||
Gold production from Olympic Dam is delivered into the gold hedging positions.
Gold hedges for 2006-2010 were closed out during the quarter. The profit on those transactions will be deferred to match the original maturity dates.
In 2001 some foreign exchange and gold hedges were reversed as a result of the gold asset sales. The cash flow impact of these reversals has been deferred to the original settlement date as follows:
| 2003 (remainder) | 2004 | 2005 | 2006 | 2007 | 2008 | |||||||||||||
Deferred Cashflow(A$m) | (14.8 | ) | (26.4 | ) | (37.4 | ) | (28.5 | ) | (23.4 | ) | (21.2 | ) |
Scenario tables
As WMC Resources’ hedge positions comprise a combination of limiting and non-limiting cover, at various price levels, any one exchange rate or spot price cannot be used to predict the outcome of WMC Resources’ hedge position. The following table provides an estimate of the realised rate to determine cash flow under various scenarios, taking into account the hedged and unhedged exposures. All realised exchange rate and price estimates include applicable option premium.
Currency
A$/US$ | Estimated realised rate-$A/US$ | |||||
Rate at maturity | 2003 (remainder) | 2004 | 2005-2008 | |||
0.75 | 0.7264 | 0.7264 | 0.7318 | |||
0.70 | 0.6887 | 0.6910 | 0.6921 | |||
0.65 | 0.6498 | 0.6542 | 0.6513 | |||
0.60 | 0.6096 | 0.6159 | 0.6094 | |||
0.55 | 0.5678 | 0.5761 | 0.5663 | |||
Market conditions
Commodity prices
| Current | Average | Average | ||||
| Prices at 30/06/03 | Quarter ended 30/06/03 | Quarter ended 30/06/02 | ||||
Copper* US$/lb | 0.75 | 0.74 | 0.73 | |||
Nickel* US$/lb | 3.75 | 3.80 | 3.15 | |||
Gold* US$/oz | 346 | 347 | 313 | |||
DAP^ US$/t | 176 | 182 | 157 |
Source: Reuters
| * | Spot prices |
| ^ | fob Tampa prices |
Copper
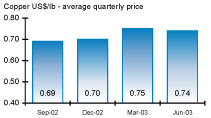
The copper price moved higher during the quarter. However, the average over the period was still 1.4 per cent lower than the previous quarter at US$1,641/t (US$0.74/lb). A high of US$1,712/t (US$0.78/lb) was reached in early June, but a lack of consumer buying interest and the approach of the northern hemisphere holiday season dampened enthusiasm, with prices correcting to around US$1,650/t (US$0.75/lb).
LME copper stocks have fallen for fifteen consecutive months, and fell 146,050 tonnes (or 18 per cent) during the quarter. Globally, consumption of refined copper appears to be exceeding supply this year, mainly due to strong consumption growth in Asia which has created regional shortages. Higher premiums have contributed to the accelerated delivery from LME warehouses and have drawn product from non-traditional sources such as North America.
We continue to experience firm demand from our customers in Asia and Australia.
Uranium
Olympic Dam sells most of its uranium under long term contracts which yield a premium over the spot price.
The spot price for uranium as represented by the Nuexco Exchange Value rose from US$10.10/lb at the beginning of the quarter to US$10.90/lb at the end of June.
Nickel
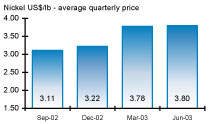
The nickel price was relatively unchanged during the quarter, with the average LME cash price up 0.5 per cent to US$8,383/t (US$3.80/lb). Prices ranged from an early low of US$7,710/t (US$3.50/lb) to US$9,550/t ($4.33/lb), the highest price since June 2000, before settling lower. Pricing support resulted from the strike at Inco Ontario and favourable market fundamentals, including higher stainless steel production, low inventories, tight scrap availability and strong Chinese demand. Negative influences included global economic uncertainty and large deliveries of full plate nickel cathodes into LME warehouses. LME stocks rose by 1.5 per cent to 24,762 tonnes.
Fertilizer
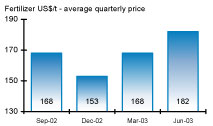
The DAP price fell substantially from starting highs of US$191/t (fob Tampa) to US$176/t. However, the average over the period was still 8 per cent higher than the previous quarter at US$182/t. Several factors contributed to the price weakness, including a seasonal drop in European and North American demand, combined with increased production following a decline in the cost of ammonia.
Prices have begun recovering following the indefinite closure of IMC’s DAP plant in Faustina, Louisiana and increased imports by India and Pakistan. Increasing demand from Europe and Chinese spot requirements are expected to provide further price support over the third quarter.
Currency
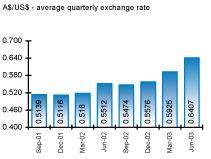
The Australian dollar continued to strengthen during the quarter, closing at 0.6661 after reaching a 4 year high of 0.6735. The average rate for the period was 8 per cent higher at 0.6407. Key supportive factors for the $A include general weakness in the $US, strong local economic fundamentals and favourable interest rate differentials. Further strength is expected following a period of stability and consolidation.
| WMC Resources Ltd Quarterly Statistical Supplement—Total Production | Quarter Ended 30 June 2003 | |||||||||||||||||||
| Quarter ending 30/06/2003 | Quarter ending 31/03/2003 | Quarter ending 31/12/2002 | Quarter ending 30/09/2002 | Quarter ending 30/06/2002 | ||||||||||||||||
COPPER & URANIUM—OLYMPIC DAM OPERATIONS | ||||||||||||||||||||
COPPER | tonnes | grade% | tonnes | grade% | tonnes | grade% | tonnes | grade% | tonnes | grade% | ||||||||||
Ore treated and head grade | 2,334,685 | 2.19 | 1,941,782 | 2.57 | 2,172,677 | 2.57 | 2,235,437 | 2.67 | 2,276,650 | 2.53 | ||||||||||
Concentrate smelted | 125,159 | 47.42 | 101,209 | 47.50 | 99,823 | 45.10 | 98,328 | 46.90 | 102,381 | 45.50 | ||||||||||
| tonnes | tonnes | tonnes | tonnes | tonnes | ||||||||||||||||
Copper cathode produced | 49,644 | 41,678 | 48,328 | 41,966 | 38,977 | |||||||||||||||
| tonnes | kg/tonne | tonnes | kg/tonne | tonnes | kg/tonne | tonnes | kg/tonne | tonnes | kg/tonne | |||||||||||
Uranium oxide concentrate produced & head grade | 764 | 0.64 | 635 | 0.61 | 826 | 0.69 | 873 | 0.76 | 595 | 0.64 | ||||||||||
| ounces | g/tonne | ounces | g/tonne | ounces | g/tonne | ounces | g/tonne | ounces | g/tonne | |||||||||||
Refined silver produced & head grade | 173,340 | 4.32 | 149,666 | 4.22 | 191,001 | 4.12 | 131,706 | 4.86 | 157,184 | 4.08 | ||||||||||
| ounces | g/tonne | ounces | g/tonne | ounces | g/tonne | ounces | g/tonne | ounces | g/tonne | |||||||||||
Refined gold produced & head grade | 23,371 | 0.48 | 26,931 | 0.49 | 13,682 | 0.51 | 13,002 | 0.52 | 17,948 | 0.53 | ||||||||||
NICKEL | ||||||||||||||||||||
Ore treated and head grade | tonnes | grade% | tonnes | grade% | tonnes | grade% | tonnes | grade% | tonnes | grade% | ||||||||||
Kambalda Nickel Operations1 | 218,327 | 3.57 | 203,376 | 3.56 | 216,687 | 4.03 | 168,392 | 3.95 | 183,590 | 3.58 | ||||||||||
Leinster Nickel Operations | 581,944 | 2.02 | 620,927 | 1.97 | 657,619 | 2.01 | 682,303 | 2.02 | 700,142 | 1.95 | ||||||||||
Mount Keith Nickel Operations | 2,698,898 | 0.59 | 2,688,597 | 0.56 | 2,752,407 | 0.54 | 2,829,929 | 0.62 | 2,731,299 | 0.60 | ||||||||||
Concentrate produced & concentrate grade | tonnes | grade% | tonnes | grade% | tonnes | grade% | tonnes | grade% | tonnes | grade% | ||||||||||
Kambalda Nickel Operations | 50,748 | 14.44 | 42,808 | 14.97 | 50,727 | 15.22 | 40,276 | 14.39 | 40,049 | 14.66 | ||||||||||
Leinster Nickel Operations | 84,963 | 12.09 | 78,770 | 12.31 | 78,230 | 13.21 | 81,587 | 12.87 | 82,309 | 12.94 | ||||||||||
Mount Keith Nickel Operations | 54,386 | 19.75 | 55,796 | 18.22 | 42,071 | 22.50 | 63,171 | 19.24 | 58,232 | 19.68 | ||||||||||
Nickel contained in concentrate | tonnes | tonnes | tonnes | tonnes | tonnes | |||||||||||||||
Kambalda Nickel Operations | 7,100 | 6,409 | 7,720 | 5,797 | 5,872 | |||||||||||||||
Leinster Nickel Operations | 10,099 | 9,700 | 10,331 | 10,501 | 10,650 | |||||||||||||||
Mount Keith Nickel Operations | 11,590 | 10,167 | 9,465 | 12,157 | 11,461 | |||||||||||||||
Total | 28,789 | 26,276 | 27,516 | 28,455 | 27,983 | |||||||||||||||
Smelter feed & matte produced (tonnes) | Feed | Matte | Feed | Matte | Feed | Matte | Feed | Matte | Feed | Matte | ||||||||||
Kalgoorlie Nickel Smelter | 167,471 | 31,854 | 160,593 | 32,517 | 179,695 | 38,858 | 160,610 | 33,511 | 175,651 | 37,222 | ||||||||||
Nickel contained in matte | tonnes | tonnes | tonnes | tonnes | tonnes | |||||||||||||||
Kalgoorlie Nickel Smelter | 21,923 | 22,084 | 26,901 | 22,969 | 25,089 | |||||||||||||||
Matte treated | tonnes | tonnes | tonnes | tonnes | tonnes | |||||||||||||||
Kwinana Nickel Refinery | 21,706 | 23,109 | 26,041 | 25,613 | 26,471 | |||||||||||||||
Nickel packaged | tonnes | tonnes | tonnes | tonnes | tonnes | |||||||||||||||
Kwinana Nickel Refinery | 14,498 | 15,171 | 17,246 | 16,905 | 17,002 | |||||||||||||||
FERTILIZER—PHOSPHATE HILL | ||||||||||||||||||||
| tonnes | tonnes | tonnes | tonnes | tonnes | ||||||||||||||||
DAP | 168,075 | 202,928 | 198,448 | 180,770 | 126,014 | |||||||||||||||
MAP | 70,726 | 31,072 | 30,264 | 13,341 | 59,108 | |||||||||||||||
Total Fertilizer | 238,801 | 234,000 | 228,712 | 194,111 | 185,122 | |||||||||||||||
| 1 | 100% Represents purchase third party feeds. Corresponding data for the previous period is 100%, 97%, 90% and 77% respectively. |
49
To: | The Manager | |
Announcements | ||
ASX Company Announcements Office |
Public Announcement 2003-23
WMC Resources Ltd Canadian subsidiary
accepts merger offer
WMC International Holdings Ltd, a wholly owned Canadian subsidiary of WMC Resources Ltd has accepted an offer to merge its Canadian operating subsidiary, WMC International Ltd (“WIL”), with Canadian mining junior, Comaplex Minerals Corp (“Comaplex”). (Comaplex is listed on the Toronto Stock Exchange—CMF).
The merger will result in Comaplex assuming control of all of WIL’s exploration properties, including its 56% interest in the Meliadine West gold project in Canada’s lower Arctic territories. This will increase Comaplex’s ownership in that project from 22% to a 78% interest.
WMC will acquire 5,200,000 or 15% of shares in Comaplex and receive a cash payment of $US6,750,000. The offer, effective 1 October 2003, is subject to due diligence, regulatory and Board approvals.
Please find attached a copy of the Comaplex release lodged with the Canadian Stock Exchange today.
Peter Horton
Company Secretary
17 July 2003
| WMC Resources Ltd |
ACN 004 184 598 |
GPO Box 860K |
Melbourne Vic. 3001 |
Australia |
Level 16 IBM Centre |
60 City Road |
Southbank Vic. 3006 |
Australia |
Tel +61 (0)3 9685 6000 |
Fax +61 (0)3 9685 6115 |

July 16, 2003
Release 03-06
Merger with WMC Canadian Subsidiary Results in
Comaplex Increasing Ownership in Meliadine West
Gold Property from 22% to 78%
Comaplex Minerals Corp. (TSX-CMF) is pleased to announce an arrangement has been entered into with WMC Resources Ltd. (WMC) whereby WMC’s wholly-owned Canadian subsidiary, WMC International Limited (WIL), will be merged with CMF. This will result in CMF taking control of 100% of WMC’s Canadian exploration properties, including WMC’s 56 percent interest in the Meliadine West gold property in Nunavut Territory.
Major Components of the Deal
| • | WMC will receive $6,750,000 U.S. cash payable from CMF existing working capital. |
| • | WMC will receive 5,200,000 shares of CMF and will then own 15 percent of CMF after the merger. |
| • | The effective date will be October 1, 2003, and closing is scheduled for October 1, 2003, with closing subject to, amongst other things, due diligence by both companies, an environmental review by CMF, approval by all regulatory bodies, and final approval by the applicable Boards. |
Future Plans
| • | Upon closing CMF intends to finance and will operate the project with the intention of completing the feasibility study on Meliadine West as soon as possible. CMF will also consider third party financing and operational arrangements if they are deemed beneficial to CMF shareholders. |
| • | CMF will have discussions with Cumberland Resources Ltd., who owns the remaining 22 percent of Meliadine West and 50 percent of Meliadine East, to attempt to advance the development of the Meliadine West and East properties in a timely manner to the mutual benefit of both Companies. |
| • | WMC and CMF have agreed, on a non-binding basis, to share consulting services and expertise and to pursue mutually beneficial arrangements for mineral exploration consistent with their respective strategies. |
SUITE 901, 1015 4TH STREET SW, CALGARY, CANADA T2R 1J4© TEL [403] 265-2846© FAX [403]232-1421
Meliadine Property
| • | The Meliadine property is an advanced gold exploration project with total expenditures to date of approximately $80,000,000. |
| • | CMF will own 78 percent of Meliadine West (Cumberland 22 percent) and 50 percent of Meliadine East (Cumberland 50%). |
| • | This merger will result in CMF increasing its ownership to 78% in a considerable portion of the potential diamond property in Meliadine East and will have 50% of the remaining Meliadine East potential diamond property. |
| • | The Tiriganiaq deposit is the most advanced zone in Meliadine West and CMF intends to accelerate the project to feasibility as soon as possible. The property also has other highly prospective anomalies that have little or no drilling completed to date. |
The TSX has not reviewed and does not accept responsibility for the adequacy or accuracy of this release.
For additional information, please contact George F. Fink, President, or Mark J. Balog, Vice President, Exploration, at (403) 265-2846 or visit our website atwww. comaplex.com.
SUITE 901, 1015 4TH STREET SW, CALGARY, CANADA T2R 1J4© TEL [403] 265-2846© FAX [403]232-1421
| To: | The Manager |
Announcements
ASX Company Announcements Office
Public Announcement 2003-24
In accordance with Listing Rule 2.7 please find enclosed Appendix 3B, application for quotation of additional securities.
Ross Mallett
Assistant Company Secretary
4 August 2003
| WMC Resources Ltd |
ACN 004 184 598 |
GPO Box 860K |
Melbourne Vic. 3001 |
Australia |
Level 16 IBM Centre |
60 City Road |
Southbank Vic. 3006 |
Australia |
Tel +61 (0)3 9685 6000 |
Fax +61 (0)3 9685 6115 |
Appendix 3B
New issue announcement
Rule 2.7, 3.10.3, 3.10.4, 3.10.5
Appendix 3B
New issue announcement,
application for quotation of additional securities
and agreement
Information or documents not available now must be given to ASX as soon as available. Information and documents given to ASX become ASX’s property and may be made public.
Introduced 1/7/96. Origin: Appendix 5. Amended 1/7/98, 1/9/99, 1/7/2000, 30/9/2001, 11/3/2002, 1/1/2003.
Name of entity
WMC Resources Ltd
ABN
74 004 184 598
We (the entity) give ASX the following information.
Part 1—All issues
You must complete the relevant sections (attach sheets if there is not enough space).
1 | +Class of+securities issued or to be issued | Fully paid ordinary shares | ||
2 | Number of+securities issued or to be issued (if known) or maximum number which may be issued | 1,068,400 | ||
3 | Principal terms of the+securities (eg, if options, exercise price and expiry date; if partly paid+securities, the amount outstanding and due dates for payment; if+convertible securities, the conversion price and dates for conversion) | The securities in (2) above comprise of 1,068,400 shares arising from options which were exercised during the period option exercise prices and expiry dates are detailed in Attachment “A”. | ||
| + | See chapter 19 for defined terms. |
1/1/2003 | Appendix 3B Page 1 |
Appendix 3B
New issue announcement
4 | Do the+securities rank equally in all respects from the date of allotment with an existing+class of quoted+securities?
If the additional securities do not rank equally, please state:
• the date from which they do • the extent to which they participate for the next dividend, (in the case of a trust, distribution) or interest payment • the extent to which they do not rank equally, other than in relation to the next dividend, distribution or interest payment | Securities rank equally from : a) date they became fully paid b) date of allotment | ||||
5 | Issue price or consideration | Refer to Attachment “A”. | ||||
6 | Purpose of the issue (If issued as consideration for the acquisition of assets, clearly identify those assets) | Refer to Item 3 above | ||||
7 | Dates of entering+securities into uncertificated holdings or despatch of certificates | a) Upon becoming fully paid shares b) Following allotment | ||||
Number | +Class | |||||
8 | Number and+class of all+securities quoted on ASX (includingthe securities in clause 2 if applicable) | 1,129,419,447 | Fully paid ordinary shares | |||
| + | See chapter 19 for defined terms. |
Appendix 3B Page 2 | 1/1/2003 |
Appendix 3B
New issue announcement
Number | +Class | |||||
9 | Number and+class of all+securities not quoted on ASX (including the securities in clause 2 if applicable) | Refer to Attachment “A”. | ||||
10 | Dividend policy (in the case of a trust, distribution policy) on the increased capital (interests) | N/A | ||||
Part 2—Bonus issue or pro rata issue
11 | Is security holder approval required? | |||
12 | Is the issue renounceable or non-renounceable? | |||
13 | Ratio in which the+securities will be offered | |||
14 | +Class of+securities to which the offer relates | |||
15 | +Record date to determine entitlements | |||
16 | Will holdings on different registers (or subregisters) be aggregated for calculating entitlements? | |||
17 | Policy for deciding entitlements in relation to fractions | |||
18 | Names of countries in which the entity has+security holders who will not be sent new issue documents
Note: Security holders must be told how their entitlements are to be dealt with.
Cross reference: rule 7.7. | |||
19 | Closing date for receipt of acceptances or renunciations | |||
| + | See chapter 19 for defined terms. |
1/1/2003 | Appendix 3B Page 3 |
Appendix 3B
New issue announcement
20 | Names of any underwriters | |||
21 | Amount of any underwriting fee or commission | |||
22 | Names of any brokers to the issue | |||
23 | Fee or commission payable to the broker to the issue | |||
24 | Amount of any handling fee payable to brokers who lodge acceptances or renunciations on behalf of+security holders | |||
25 | If the issue is contingent on+security holders’ approval, the date of the meeting | |||
26 | Date entitlement and acceptance form and prospectus or Product Disclosure Statement will be sent to persons entitled | |||
27 | If the entity has issued options, and the terms entitle option holders to participate on exercise, the date on which notices will be sent to option holders | |||
28 | Date rights trading will begin (if applicable) | |||
29 | Date rights trading will end (if applicable) | |||
30 | How do+security holders sell their entitlementsin full through a broker? | |||
31 | How do+security holders sellpart of their entitlements through a broker and accept for the balance? | |||
| + | See chapter 19 for defined terms. |
Appendix 3B Page 4 | 1/1/2003 |
Appendix 3B
New issue announcement
32 | How do+security holders dispose of their entitlements (except by sale through a broker)? | |||
33 | +Despatch date | |||
Part 3—Quotation of securities
You need only complete this section if you are applying for quotation of securities
34 | Type of securities (tick one) | |||
(a) | x | Securities described in Part 1 | ||
(b) | ¨ | All other securities
Example: restricted securities at the end of the escrowed period, partly paid securities that become fully paid, employee incentive share securities when restriction ends, securities issued on expiry or conversion of convertible securities | ||
Entities that have ticked box 34(a)
Additional securities forming a new class of securities
Tick to indicate you are providing the information or documents
35 | ¨ | If the+securities are+equity securities, the names of the 20 largest holders of the additional+securities, and the number and percentage of additional+securities held by those holders | ||
36 | ¨ | If the+securities are+equity securities, a distribution schedule of the additional+securities setting out the number of holders in the categories 1 - 1,000 1,001 - 5,000 5,001 - 10,000 10,001 - 100,000 100,001 and over | ||
37 | ¨ | A copy of any trust deed for the additional+securities | ||
| + | See chapter 19 for defined terms. |
1/1/2003 | Appendix 3B Page 5 |
Appendix 3B
New issue announcement
Entities that have ticked box 34(b)
38 | Number of securities for which+quotation is sought | |||||
39 | Class of+securities for which quotation is sought | |||||
40 | Do the+securities rank equally in all respects from the date of allotment with an existing+class of quoted+securities?
If the additional securities do not rank equally, please state:
• the date from which they do • the extent to which they participate for the next dividend, (in the case of a trust, distribution) or interest payment • the extent to which they do not rank equally, other than in relation to the next dividend, distribution or interest payment | |||||
41 | Reason for request for quotation now
Example: In the case of restricted securities, end of restriction period
(if issued upon conversion of another security, clearly identify that other security) | |||||
Number | +Class | |||||
42 | Number and+class of all+securities quoted on ASX (including the securities in clause 38) | |||||
| + | See chapter 19 for defined terms. |
Appendix 3B Page 6 | 1/1/2003 |
Appendix 3B
New issue announcement
Quotation agreement
| 1 | +Quotation of our additional+securities is in ASX’s absolute discretion. ASX may quote the+securities on any conditions it decides. |
| 2 | We warrant the following to ASX. |
| • | The issue of the+securities to be quoted complies with the law and is not for an illegal purpose. |
| • | There is no reason why those+securities should not be granted+quotation. |
| • | An offer of the+securities for sale within 12 months after their issue will not require disclosure under section 707(3) or section 1012C(6) of the Corporations Act. |
Note: An entity may need to obtain appropriate warranties from subscribers for the securities in order to be able to give this warranty
| • | Section 724 or section 1016E of the Corporations Act does not apply to any applications received by us in relation to any+securities to be quoted and that no-one has any right to return any+securities to be quoted under sections 737, 738 or 1016F of the Corporations Act at the time that we request that the+securities be quoted. |
| • | We warrant that if confirmation is required under section 1017F of the Corporations Act in relation to the+securities to be quoted, it has been provided at the time that we request that the+securities be quoted. |
| • | If we are a trust, we warrant that no person has the right to return the+securities to be quoted under section 1019B of the Corporations Act at the time that we request that the+securities be quoted. |
| + | See chapter 19 for defined terms. |
1/1/2003 | Appendix 3B Page 7 |
Appendix 3B
New issue announcement
| 3 | We will indemnify ASX to the fullest extent permitted by law in respect of any claim, action or expense arising from or connected with any breach of the warranties in this agreement. |
| 4 | We give ASX the information and documents required by this form. If any information or document not available now, will give it to ASX before+quotation of the+securities begins. We acknowledge that ASX is relying on the information and documents. We warrant that they are (will be) true and complete. |
Sign here: | Ross E. Mallett | Date: 4 August 2003 | ||
(Assistant Company secretary) | ||||
| Print name: | Ross E. Mallet | |||
== == == == ==
| + | See chapter 19 for defined terms. |
Appendix 3B Page 8 | 1/1/2003 |
| WMCResources Ltd Quarterly Statistical Supplement—Total Production | Quarter Ended 31 March 2003 | |||||||||||||||||||
| Quarter ending 31/03/03 | Quarter ending 31/12/02 | Quarter ending 30/09/2002 | Quarter ending 30/06/2002 | Quarter ending 31/03/2002 | ||||||||||||||||
| COPPER & URANIUM—OLYMPIC DAM OPERATIONS | ||||||||||||||||||||
| COPPER | tonnes | grade % | tonnes | grade % | tonnes | grade % | tonnes | grade % | tonnes | grade % | ||||||||||
Ore treated and head grade | 1,941,782 | 2.57 | 2,172,677 | 2.57 | 2,235,437 | 2.67 | 2,276,650 | 2.53 | 2,189,822 | 2.53 | ||||||||||
Concentrate smelted | 101,209 | 47.50 | 99,823 | 45.10 | 98,328 | 46.90 | 102,381 | 45.50 | 103,161 | 47.10 | ||||||||||
| tonnes | tonnes | tonnes | tonnes | tonnes | ||||||||||||||||
| Copper cathode produced | 41,678 | 48,328 | 41,966 | 38,977 | 48,849 | |||||||||||||||
| tonnes | kg/tonne | tonnes | kg/tonne | tonnes | kg/tonne | tonnes | kg/tonne | tonnes | kg/tonne | |||||||||||
Uranium oxide concentrate produced & head grade | 635 | 0.61 | 826 | 0.69 | 873 | 0.76 | 595 | 0.64 | 597 | 0.66 | ||||||||||
| ounces | g/tonne | ounces | g/tonne | ounces | g/tonne | ounces | g/tonne | ounces | g/tonne | |||||||||||
Refined silver produced & head grade | 149,666 | 4.22 | 191,001 | 4.12 | 131,706 | 4.86 | 157,184 | 4.08 | 164,044 | 4.09 | ||||||||||
| ounces | g/tonne | ounces | g/tonne | ounces | g/tonne | ounces | g/tonne | ounces | g/tonne | |||||||||||
Refined gold produced & head grade | 26,931 | 0.49 | 13,682 | 0.51 | 13,002 | 0.52 | 17,948 | 0.53 | 19,661 | 0.55 | ||||||||||
| NICKEL | ||||||||||||||||||||
| Ore treated and head grade | tonnes | grade % | tonnes | grade % | tonnes | grade % | tonnes | grade % | tonnes | grade % | ||||||||||
Kambalda Nickel Operations1 | 203,376 | 3.56 | 216,687 | 4.03 | 168,392 | 3.95 | 183,590 | 3.58 | 119,801 | 3.46 | ||||||||||
Leinster Nickel Operations | 620,927 | 1.97 | 657,619 | 2.01 | 682,303 | 2.02 | 700,142 | 1.95 | 530,621 | 1.99 | ||||||||||
Mount Keith Nickel Operations | 2,688,597 | 0.56 | 2,752,407 | 0.54 | 2,829,929 | 0.62 | 2,731,299 | 0.60 | 2,741,317 | 0.56 | ||||||||||
| Concentrate produced & concentrate grade | tonnes | grade % | tonnes | grade % | tonnes | grade % | tonnes | grade % | tonnes | grade % | ||||||||||
Kambalda Nickel Operations | 42,808 | 14.97 | 50,727 | 15.22 | 40,276 | 14.39 | 40,049 | 14.66 | 27,982 | 13.71 | ||||||||||
Leinster Nickel Operations | 78,770 | 12.31 | 78,230 | 13.21 | 81,587 | 12.87 | 82,309 | 12.94 | 69,376 | 12.29 | ||||||||||
Mount Keith Nickel Operations | 55,796 | 18.22 | 42,071 | 22.50 | 63,171 | 19.24 | 58,232 | 19.68 | 54,128 | 18.68 | ||||||||||
| Nickel contained in concentrate | tonnes | tonnes | tonnes | tonnes | tonnes | |||||||||||||||
| Kambalda Nickel Operations | 6,409 | 7,720 | 5,797 | 5,872 | 3,836 | |||||||||||||||
| Leinster Nickel Operations | 9,700 | 10,331 | 10,501 | 10,650 | 8,524 | |||||||||||||||
| Mount Keith Nickel Operations | 10,167 | 9,465 | 12,157 | 11,461 | 10,109 | |||||||||||||||
Total | 26,276 | 27,516 | 28,455 | 27,983 | 22,469 | |||||||||||||||
| Smelter feed & matte produced (tonnes) | Feed | Matte | Feed | Matte | Feed | Matte | Feed | Matte | Feed | Matte | ||||||||||
Kalgoorlie Nickel Smelter | 160,593 | 32,517 | 179,695 | 38,858 | 160,610 | 33,511 | 175,651 | 37,222 | 124,557 | 24,847 | ||||||||||
| Nickel contained in matte | tonnes | tonnes | tonnes | tonnes | tonnes | |||||||||||||||
Kalgoorlie Nickel Smelter | 22,084 | 26,901 | 22,969 | 25,089 | 16,615 | |||||||||||||||
| Matte treated | tonnes | tonnes | tonnes | tonnes | tonnes | |||||||||||||||
Kwinana Nickel Refinery | 23,109 | 26,041 | 25,613 | 26,471 | 22,568 | |||||||||||||||
| Nickel packaged | tonnes | tonnes | tonnes | tonnes | tonnes | |||||||||||||||
Kwinana Nickel Refinery | 15,171 | 17,246 | 16,905 | 17,002 | 13,902 | |||||||||||||||
| FERTILIZER—PHOSPHATE HILL | ||||||||||||||||||||
| tonnes | tonnes | tonnes | tonnes | tonnes | ||||||||||||||||
DAP | 202,928 | 198,448 | 180,770 | 126,014 | 213,055 | |||||||||||||||
MAP | 31,072 | 30,264 | 13,341 | 59,108 | 0 | |||||||||||||||
| Total Fertilizer | 234,000 | 228,712 | 194,111 | 185,122 | 213,055 | |||||||||||||||
1 100% represents purchase third party feeds. Corresponding data for the previous period is 97%, 90%, 77% and 64% respectively.
62
| To: | The Manager |
Announcements
Company Announcements Office
Public Announcement 2003-25
WMC Resources Ltd 2003 Half-Year Results
Please find attached for immediate release Public Announcement 2003-25 covering the release of WMC Resources Ltd’s Financial Results for the half-year ended 30 June 2003.
The following documents are included as part of the release:
| • | Public Announcement |
| • | Appendix 4D – Half-Yearly ASX Report |
| • | Business Performance Report (Fact File) |
Ross Mallett
Assistant Company Secretary
13 August 2003
| For further information, please call: | ||
Media Contact: Troy Hey, Group Manager, Public Affairs (03) 96856233 or 0419 502 852 | WMC Resources Ltd ACN 004 184 598 | |
Analyst/Shareholder Contact: Nerida Mossop, Manager, Investor Relations (03) 9685 6274 or 0418 378 809 | GPO Box 860K Melbourne Vic. 3001 Australia | |
Level 16 IBM Centre 60 City Road Southbank Vic. 3006 Australia | ||
Tel +61 (0)3 9685 6000 Fax +61 (0)3 9685 6115 | ||

WMC Resources Ltd—ABN 76 004 184 598
Six months ended 30 June 2003 (“Current period”)
Results for announcement to the market
| $ million | ||
Revenues from ordinary activities | 1,441.9 | |
Profit from ordinary activities after tax attributable to members | 47.0 | |
NET PROFIT FOR THE PERIOD ATTRIBUTABLE TO MEMBERS | 47.0 | |
Dividends
Six months to 30 June 2003 | ||
Interim dividend per share | Nil | |
Franked amount per share | N/A | |
This interim financial report is to be read in conjunction with the most recent annual financial report.
Comparatives
No comparative financial information has been presented for the six months to 30 June 2002 in accordance with AASB 1029Interim Financial Reporting, as this is the first half year reported by WMC Resources Ltd. WMC Resources Ltd did not prepare an interim report for the preceding corresponding interim period as the company was not a disclosing entity required to prepare half-year financial reports by section 2M.3 of the Corporations Act 2001.
3
Directors’ Report
The directors of WMC Resources Ltd present their report on the consolidated entity consisting of WMC Resources Ltd and the entities it controlled during or at the end of the six months to 30 June 2003.
Directors
The following persons were directors of the company during the half-year and up to the date of this report:
Tommie C-E Bergman | (Deputy Chairman until 2 May 2003 when Mr. Bergman was appointed Chairman) | |
Andrew G Michelmore | (appointed Chief Executive Officer on 1 January 2003) | |
Hugh M MorganAC | (retired as Chief Executive Officer and director on 1 January 2003) | |
Ian G R BurgessAO | (retired as a director and Chairman on 2 May 2003) | |
Adrienne E ClarkeAO | ||
Alan K Dundas | (appointed a director on 12 March 2003) | |
Peter J Knight | ||
David E Meiklejohn | ||
Roger A G Vines | (retired as a director on 2 May 2003) | |
Ian E WebberAO | ||
Review of Operations and comments by Directors
Financial Result
The consolidated operating profit after income tax was $47.0 million for the half year. The contribution from operating businesses is set out in Note 7.
The financial result for the nickel operation was a profit of $120.2 million for the half. Nickel sales revenues of $758.8 million reflect lower volumes of nickel matte and nickel metal due to planned statutory maintenance at the Kalgoorlie smelter, partly offset by stronger realised nickel prices over the half. Unit costs were adversely affected by lower production and higher purchased feed and production costs during the half.
The copper uranium operation made a loss for the half of $31.6 million. This outcome primarily reflects the anticipated impact of operating the plant at rates less than capacity due to the required rebuild of the solvent extraction plants, coupled with the unfavourable impact of exchange rates on revenue. Costs include an idle capacity charge of $33.1 million ($23.2 million after tax) relating to uranium and copper extraction plants. Uranium production is now at planned rates, following commissioning of the new uranium solvent extraction plant. Construction of the copper solvent extraction plant is scheduled to be completed by the end of December.
The financial result for the fertilizer business was a profit of $8.4 million. Revenue was adversely affected by falling Australian dollar DAP prices. This was partially offset by an increase in sales volumes, reflecting the improved operating performance of the Queensland Fertilizer Operation (QFO). QFO operated at 99% of capacity for the half, and achieved rates in excess of full capacity for the months of May and June. Hi-Fert contributed $9.3 million to the overall profit for the half, despite the drought.
Hedging gains of $22.1 million contributed to the operating profit, representing a stronger Australian dollar relative to the fair value of the hedge contracts at demerger.
Tax credits on the cash payments in respect of the company’s hedge book more than offset tax expense on operating activities, giving rise to a net credit of $7.6 million.
The company completed a two tranche debt issue in the US Bond market in May 2003, including US $500 million 10-year notes and US $200 million 30-year notes. The net proceeds from the offering were used to retire short-term debt.
As at 30 June 2003, net assets were $3,661.4 million, including net debt of $1,556.5 million. The gearing ratio (measured as net debt / net debt plus equity) was 29.8%.
4
Business development
On 9 December 2002, WMC announced that it had agreed to acquire 100% of the Corridor Sands titanium dioxide project from Southern Mining Corporation Limited. The net cost of the acquisition is payable in two tranches. Conditions for the payment of the first tranche were satisfied on 31 January 2003 through the issue of shares in both WMC Resources and Alumina Limited. The final tranche of the purchase price, which will be up to US$25 million to be paid in shares or cash, is to be made before mid March 2004.
A feasibility study completed in the third quarter of 2002 confirmed that the Corridor Sands titanium dioxide resource is capable of supporting the development of a large, long life, profitable and growing business.
On 22 May 2003, WMC Resources announced that the Industrial Development Corporation of South Africa (IDC) had elected to exercise its option to purchase 10% of the Corridor Sands project. The purchase price of US$10 million is payable as an initial payment of US$100,000 and the balance of US$9.9 million (plus interest) on the achievement of certain milestones. As at 30 June 2003, execution of the agreements had not been finalised and the milestones were not sufficiently advanced to recognise the sale. The execution of the agreements occurred in early August 2003.
Hedging
As a result of the transfer of the finance companies on demerger, the hedge contracts held by the finance companies were marked to market (fair value) and deferred losses previously carried on WMC Limited’s balance sheet were fair valued to zero. Consequently, the impact on revenue of any subsequent change in the exchange rate will be determined by reference to the fair value rate at the date of the demerger and the rate at the date of the hedge’s maturity. Cash flows will continue to be based on the original contract rates.
Gold hedges covering 370,200 ounces of gold production for the years 2006 to 2010 were closed out during the half. The profit realised on these transactions will be deferred to match the original maturity dates.
The company has an existing currency hedge position that will be managed on an ongoing basis. For the second half of 2003, US$94 million has been sold using limiting cover at an average cash rate of A$/US$0.6843 (average profit and loss rate A$/US$0.5510)
A total of 40,000 ounces of gold is hedged for the second half of 2003 at an average price of A$548 an ounce.
The full hedge position is disclosed in the annual financial statements. There are no off balance sheet positions.
Dividend
No dividend has been declared for the six months to 30 June 2003.
In the medium-term, WMC Resources Ltd is not expected to generate franking credits due to the utilisation of tax losses. As at 30 June 2003, the Australian revenue tax losses were approximately $1.9 billion. Accordingly, the company is not expected to be able to pay franked dividends in the medium-term.
Native Title
The majority of WMC Resources Ltd’s interests fall within one or more claimant Applications for Native Title Determination. The applications are filed for hearing in the Federal Court of Australia. The WMC Resources group cannot make any assessment whether existing assets or operations will be materially affected until it is determined what rights, if any, the applicants are entitled to. Recent decisions of the High Court indicate that each claim will be decided on its facts.
Consideration of the implications of Federal Court Determinations make it evident there are complex legal and factual issues potentially affecting existing and future WMC Resources interests. Accordingly, the impact of these developments cannot be determined at this time, although it is indicated that no native title rights reside in minerals where valid state legislation has placed minerals in Crown ownership.
5
Rounding of amounts
The company is of a kind referred to in Australian Securities and Investments Commission Class Order 98/0100. Amounts shown in this Directors’ Report and the financial report have been rounded off to the nearest hundred thousand dollars except where otherwise required, in accordance with that Class Order.
Comparatives
No comparative financial information has been presented for the six months to 30 June 2002 in accordance with AASB 1029Interim Financial Reporting, as this is the first half year reported by WMC Resources Ltd. WMC Resources Ltd did not prepare an interim report for the preceding corresponding interim period as the company was not a disclosing entity required to prepare half-year financial reports by section 2M.3 of the Corporations Act 2001.
This report is made in accordance with a resolution of the Directors.
|
Andrew G Michelmore Chief Executive Officer |

13 August 2003
6
Condensed consolidated statement of financial performance
| Notes | Six months to 30 June 2003 $ million | ||||
Revenues from operating activities | 2 | 1,416.7 | |||
Interest received / receivable | 2 | 9.3 | |||
Other revenue | 2 | 15.9 | |||
Revenue from ordinary activities | 1,441.9 | ||||
Expenses from ordinary activities | 2 | (1,372.0 | ) | ||
Borrowing costs (net borrowing costs are $21.2m) | (30.5 | ) | |||
Profit from ordinary activities before tax | 39.4 | ||||
Income tax credit on ordinary activities | 5 | 7.6 | |||
Net profit for the period attributable to members of WMC Resources Ltd | 47.0 | ||||
Non-owner transaction changes in equity
Net exchange differences recognised in equity | 1.1 | |
Total revenues, expenses and valuation adjustments recognised directly in equity | 1.1 | |
Total changes in equity other than those resulting from transactions with owners as owners | 48.1 | |
The above condensed consolidated statement of financial performance should be read in conjunction with the accompanying notes.
Earnings per share (EPS)
| Notes | Six months to 30 June 2003 | |||
Basic EPS (cents) | 6 | 4.2 | ||
Diluted EPS (cents) | 6 | 4.2 |
Net tangible assets per share
| 31 December 2002 | 30 June 2003 | |||
Net tangible assets per share ($) | 3.19 | 3.24 |
7
Consolidated statement of financial position
| Notes | 31 December $ million | 30 June $ million | ||||
Current assets | ||||||
Cash | 90.5 | 120.8 | ||||
Receivables—trade debtors | 238.5 | 260.4 | ||||
Receivables—other | 319.2 | 212.9 | ||||
Inventories | 468.8 | 494.2 | ||||
Other financial assets | 12.7 | 12.9 | ||||
Other | 69.6 | 86.7 | ||||
Total current assets | 1,199.3 | 1,187.9 | ||||
Non-current assets | ||||||
Receivables | 218.8 | 314.8 | ||||
Other financial assets | 12.3 | 11.0 | ||||
Inventories | 74.9 | 71.3 | ||||
Exploration and evaluation expenditure capitalised | 10 | 152.7 | 83.8 | |||
Mine properties under development | 5.7 | 5.1 | ||||
Other property, plant and equipment (net) | 4,330.6 | 4,410.9 | ||||
Acquired mineral rights | 11 | 1,269.3 | 1,327.7 | |||
Deferred tax assets | 44.6 | 101.5 | ||||
Deferred losses—hedging contracts | 25.9 | — | ||||
Other | 14.0 | 28.2 | ||||
Total non-current assets | 6,148.8 | 6,354.3 | ||||
Total assets | 7,348.1 | 7,542.2 | ||||
Current liabilities | ||||||
Payables | 657.9 | 422.4 | ||||
Interest-bearing liabilities | 1,287.6 | 558.7 | ||||
Current tax liabilities | 3.9 | 2.2 | ||||
Provisions (excluding tax liabilities) | 66.0 | 70.0 | ||||
Deferred gains—hedging contracts | 7.2 | 105.8 | ||||
Other | 9.8 | 10.8 | ||||
Total current liabilities | 2,032.4 | 1,169.9 | ||||
Non-current liabilities | ||||||
Payables | 849.7 | 486.7 | ||||
Interest-bearing liabilities | 369.9 | 1,118.6 | ||||
Deferred tax liabilities | 377.0 | 426.5 | ||||
Provisions (excluding tax liabilities) | 109.7 | 115.7 | ||||
Deferred gains—hedging contracts | — | 560.5 | ||||
Other | 2.8 | 2.9 | ||||
Total non-current liabilities | 1,709.1 | 2,710.9 | ||||
Total liabilities | 3,741.5 | 3,880.8 | ||||
Net assets | 3,606.6 | 3,661.4 | ||||
8
Consolidated statement of financial position (continued)
| Notes | 31 December $ million | 30 June $ million | ||||||
Equity | ||||||||
Contributed equity | 3,653.4 | 3,659.3 | ||||||
Reserves | 30.7 | 31.8 | ||||||
Accumulated losses | 3 | (77.5 | ) | (30.1 | ) | |||
Equity attributable to members of the parent entity | 3,606.6 | 3,661.0 | ||||||
Outside equity interests in controlled entities | — | 0.4 | ||||||
Total equity | 3,606.6 | 3,661.4 | ||||||
There is no preference capital.
The above consolidated statement of financial position should be read in conjunction with the accompanying notes.
9
Consolidated statement of cash flows
| Notes | Six months to 30 June 2003 | ||||
Cash flows from operating activities | |||||
Receipts from customers | 1,394.8 | ||||
Payments to suppliers and employees | (1,150.4 | ) | |||
Payments on settlement of hedge contracts | (38.4 | ) | |||
Interest received | 11.9 | ||||
Borrowing costs paid | (17.9 | ) | |||
Payments for exploration: | |||||
—Grassroots | 10 | (9.3 | ) | ||
—Additional, supporting existing operations | 10 | (1.3 | ) | ||
Income taxes paid | (1.6 | ) | |||
Net cash provided by operating activities | 187.8 | ||||
Cash flows from investing activities | |||||
Payments for property, plant and equipment | (305.6 | ) | |||
Proceeds from sale of non-current assets | 3.1 | ||||
Demerger costs paid | (45.1 | ) | |||
Payments for evaluation expenditure | 10 | (4.3 | ) | ||
Net cash used in investing activities | (351.9 | ) | |||
Cash flows from financing activities | |||||
Proceeds from issues of shares | 5.9 | ||||
Payment on close-out of interest rate hedge | (38.5 | ) | |||
Global bond issue costs paid | (8.9 | ) | |||
Proceeds from borrowings | 1,087.8 | ||||
Repayment of borrowings | (843.9 | ) | |||
Net cash provided by financing activities | 202.4 | ||||
Net increase in cash held | 38.3 | ||||
Cash at the beginning of the financial year | 90.5 | ||||
Effect of exchange rate changes on opening foreign currency cash balances | (8.0 | ) | |||
Cash at the end of the financial year | 120.8 | ||||
WMC Resources, via its wholly owned subsidiary WMC Finance (USA) Limited, completed a two tranche debt issue in the US Bond market during the six months to 30 June 2003. US$500 million 10-year notes and US$200 million 30-year notes were raised. The notes are guaranteed by WMC Resources Ltd and its subsidiaries, WMC (Olympic Dam Corporation) Pty Ltd and WMC Fertilizers Pty Ltd. The net proceeds from the offering were used to retire short-term debt.
The above consolidated statement of cash flows should be read in conjunction with the accompanying notes.
Non-cash financing and investing activities
There were no significant non-cash financing or investing activities in the six months to 30 June 2003.
10
Notes to and forming part of the condensed consolidated financial statements
Note 1 Basis of financial report preparation
This general purpose financial report is for the half-year ended 30 June 2003, and has been prepared in accordance with the Australian Stock Exchange Listing Rules as they relate to Appendix 4D and in accordance with Accounting Standard AASB 1029:Interim Financial Reporting, other mandatory professional reporting requirements (Urgent Issues Group Consensus Views), other authoritative pronouncements of the Australian Accounting Standards Board, and the Corporations Act 2001. This interim report does not include all of the notes of the type normally included in an annual financial report. It is recommended that this report be read in conjunction with any public announcements made by WMC Resources Ltd and its controlled entities during the reporting period in accordance with the continuous disclosure requirements of the Corporations Act 2001.
No comparative financial information has been presented for the six months to 30 June 2002 in accordance with AASB 1029Interim Financial Reporting, as this is the first half year reported by WMC Resources Ltd. WMC Resources Ltd did not prepare an interim report for the preceding corresponding interim period as the company was not a disclosing entity required to prepare half-year financial reports by section 2M.3 of the Corporations Act 2001.
The accounting policies adopted are consistent with those of the previous financial year.
The financial report is prepared in accordance with the historical cost convention.
Note 2 Revenue and expenses from ordinary activities
Six months to 30 June 2003 | ||
Revenue from ordinary activities | ||
Revenues from operating activities: | ||
Sale of goods | 1,416.7 | |
| 1,416.7 | ||
Revenue from outside operating activities: | ||
Interest received/receivable | 9.3 | |
Proceeds from disposal of non-current assets | 3.1 | |
Other income | 12.8 | |
Other revenue | 15.9 | |
| 25.2 | ||
Revenue from ordinary activities | 1,441.9 | |
Expenses from ordinary activities | ||
Cost of goods sold (including depreciation and amortisation) | 1,038.1 | |
Selling and distribution expenses | 124.3 | |
General and administrative expenses | 127.3 | |
Exploration and evaluation expenses | 12.2 | |
Other expenses from ordinary activities | 70.1 | |
Expenses from ordinary activities | 1,372.0 | |
Depreciation and amortisation (including amortisation of intangibles) | 243.4 | |
11
Note 3 Accumulated losses
Six months to 30 June 2003 | |||
Accumulated losses at the beginning of the financial period | (77.5 | ) | |
Net profit attributable to members | 47.0 | ||
Net transfers from reserves | 0.4 | ||
Dividends and other equity distributions paid or payable | — | ||
Accumulated losses at the end of financial period | (30.1 | ) | |
Note 4 Significant items
Profit from ordinary activities after income tax, includes the following revenues and expenses whose disclosure is relevant in explaining the financial performance of the entity due to their size or nature:
a) Idle capacity charge | |||||
| Costs associated with lost production due to the fire in October 2001 at the Olympic Dam solvent extraction plant | 33.1 | ||||
Income tax benefit | (9.9 | ) | |||
| 23.2 | |||||
12
Note 5 Income tax
Six months to 30 June 2003 | |||
Profit from ordinary activities before tax | 39.4 | ||
Prima facie tax charge for the period at the rate of 30% | (11.8 | ) | |
The following items caused the total charge for income tax to vary from the above: | |||
Additional claim for research and development expenditure | 4.5 | ||
Exempt income | 3.0 | ||
Non-assessable capital gains | 0.6 | ||
Additional depreciation and amortisation | 3.3 | ||
Non-deductible expenses | (2.2 | ) | |
Non-deductible foreign expenses | (1.4 | ) | |
Adjustment for tax impact of hedging contracts fair valued at demerger | 60.5 | ||
Net movement | 68.3 | ||
Tax effect of the above adjustments at 30% | 20.5 | ||
Variance between Australian and foreign tax rates | 0.4 | ||
Future income tax benefits not brought to account—Overseas | (3.5 | ) | |
Future income tax benefits recognised—Australia | 1.9 | ||
Over provision of tax in prior years | 0.1 | ||
Consequent reduction in charge for income tax | 19.4 | ||
Income tax credit for the period | 7.6 | ||
Note 6 Earnings per share (EPS)
Earnings in cents per ordinary share | ||
Basic EPS | 4.2 | |
Diluted EPS | 4.2 | |
Weighted average number of shares used in the calculation of earnings per share | ||
—Number for basic earnings per share | 1,128,920,217 | |
—Effect of share options on issue | 943,029 | |
—Number for diluted earnings per share | 1,129,863,246 | |
Net profit used in calculation of basic and diluted earnings per share | 47.0 | |
13
Note 7 Segment information
Business segments
Six months to 30 June 2003 $ million | |||||||||||||
| Copper/ uranium | Nickel | Fertilizer | Eliminations | Consolidated | |||||||||
Revenue | |||||||||||||
Sales revenue1 | 362.6 | 758.8 | 255.9 | — | 1,377.3 | ||||||||
Inter-segment sales revenue | — | — | 3.8 | (3.8 | ) | — | |||||||
Total sales revenue from operations | 362.6 | 758.8 | 259.7 | (3.8 | ) | 1,377.3 | |||||||
Unallocated sales revenue | 17.3 | ||||||||||||
Revenue before hedging | 1,394.6 | ||||||||||||
Hedging | 6.9 | 12.9 | 2.3 | — | 22.1 | ||||||||
Revenues from operating activities | 1,416.7 | ||||||||||||
Proceeds from disposal of non-current assets | 0.4 | 1.3 | 0.1 | — | 1.8 | ||||||||
Other income | 1.6 | 4.3 | 0.9 | — | 6.8 | ||||||||
Segment revenues | 371.5 | 777.3 | 263.0 | ||||||||||
Other unallocated revenues | 7.3 | ||||||||||||
Interest received / receivable | 9.3 | ||||||||||||
Revenue from ordinary activities | 1,441.9 | ||||||||||||
Result | |||||||||||||
Earnings before allocation of hedging result | (38.5 | ) | 107.3 | 6.1 | — | 74.9 | |||||||
Unallocated profits | 5.8 | ||||||||||||
| 80.7 | |||||||||||||
Hedging | 6.9 | 12.9 | 2.3 | — | 22.1 | ||||||||
Segment result | (31.6 | ) | 120.2 | 8.4 | |||||||||
Earnings from operations | 102.8 | ||||||||||||
Unallocated corporate expenses: | |||||||||||||
New business | (11.0 | ) | |||||||||||
Regional exploration | (10.2 | ) | |||||||||||
Corporate | (19.9 | ) | |||||||||||
Finance and other costs | (1.1 | ) | |||||||||||
Net borrowing costs | (21.2 | ) | |||||||||||
Profit from ordinary activities before income tax credit | 39.4 | ||||||||||||
Income tax credit | 7.6 | ||||||||||||
Net profit after tax | 47.0 | ||||||||||||
1 Sales revenue includes intermediate product sales.
14
Note 7 Segment information (continued)
Business segments
As at 30 June 2003 $ million | ||||||||
| Copper/ uranium | Nickel | Fertilizer | Consolidated | |||||
Assets | ||||||||
Segment assets | 4,207.3 | 1,700.6 | 810.4 | 6,718.3 | ||||
Unallocated corporate assets | 823.9 | |||||||
Consolidated total assets | 7,542.2 | |||||||
Liabilities | ||||||||
Segment liabilities | 466.5 | 336.3 | 93.4 | 896.2 | ||||
Unallocated corporate liabilities | 2,984.6 | |||||||
Consolidated total liabilities | 3,880.8 | |||||||
Acquisition of non-current assets | 171.6 | 118.9 | 13.9 | 304.4 | ||||
Unallocated corporate acquisitions | 1.2 | |||||||
| 305.6 | ||||||||
Description of business segments | ||
Copper/uranium | Exploration, development, mining and refining of copper, uranium, silver and gold in South Australia. | |
Nickel | Exploration, development, mining, smelting and refining of nickel in Western Australia. | |
Fertilizer | Production of fertilizer product in Phosphate Hill, Queensland and distribution of fertilizer products via Hi-Fert. | |
15
Note 8 Dividends
No dividend has been declared for the six months to 30 June 2003.
Note 9 Capitalised outlays
Six months to 30 June 2003 | ||
Borrowing costs capitalised (into property, plant & equipment) | 3.6 | |
Global bond issue costs capitalised (into other non-current assets) | 10.0 | |
Corridor Sands exploration and evaluation expenditure capitalised (refer Note 10) | 2.7 | |
Note 10 Exploration and evaluation expenditure capitalised
Opening balance | 152.7 | ||
Grassroots expenditure | 9.3 | ||
Expenditure for additional reserves, supporting existing operations | 1.3 | ||
Evaluation expenditure—Corridor Sands | 2.7 | ||
—Other | 1.6 | ||
Expenditure written off during current period | (12.2 | ) | |
Transferred to Acquired mineral rights on finalisation of acquisition of Corridor Sands | (71.1 | ) | |
Foreign currency exchange differences | (0.5 | ) | |
Closing balance as shown in the consolidated statement of financial position | 83.8 | ||
Note 11 Acquired mineral rights
Opening balance—Olympic Dam | 1,269.3 | ||
Amortisation—Olympic Dam | (12.7 | ) | |
Amount transferred from Exploration and Evaluation – Corridor Sands | 71.1 | ||
Closing balance as shown in the consolidated statement of financial position | 1,327.7 | ||
Note 12 Control gained over entities having material effect
There have been no material acquisitions of entities in the six months to 30 June 2003.
Note 13 Loss of control of entities having material effect
There were no material losses of control over entities in the group during the period.
16
Note 14 Issued and quoted securities at end of current period
Category of securities | Number issued | Number quoted | Issue price per share ($) | |||||
Ordinary shares | ||||||||
Fully paid | 1,129,419,447 | 1,129,419,447 | Various | |||||
Changes during current period: | ||||||||
Increase in fully paid shares following exercise of options | 1,068,400 | 1,068,400 | Various | |||||
Unquoted employee options to acquire fully paid | Number issued | Number quoted | Exercise price | Expiry date | ||||
| 854,520 | Nil | $2.26 | 21 December 2003 | |||||
| 85,000 | Nil | $2.49 | 21 December 2003 | |||||
| 3,548,600 | Nil | $3.90 | 20 December 2004 | |||||
| 5,391,200 | Nil | $3.48 | 18 December 2005 | |||||
| 9,581,300 | Nil | $4.33 | 30 November 2006 | |||||
| 600,000 | Nil | $4.33 | 30 November 2006 | |||||
| 10,883,600 | Nil | $4.34 | 23 December 2007 | |||||
| 30,944,220 | ||||||||
Issued during the current period | 322,800 | Nil | $4.34 | 23 December 2007 | ||||
Exercised during the current period | 71,700 | Nil | $2.26 | 21 December 2003 | ||||
| 290,000 | Nil | $2.49 | 21 December 2003 | |||||
| 162,600 | Nil | $3.90 | 20 December 2004 | |||||
| 517,900 | Nil | $3.48 | 18 December 2005 | |||||
| 26,200 | Nil | $4.33 | 30 November 2006 | |||||
| 1,068,400 | ||||||||
Expired/lapsed during the current period | ||||||||
| 36,900 | Nil | $3.90 | 20 December 2004 | |||||
| 9,000 | Nil | $3.48 | 18 December 2005 | |||||
| 374,400 | Nil | $4.33 | 30 November 2006 | |||||
| 391,060 | Nil | $4.34 | 23 December 2007 | |||||
| 811,360 | ||||||||
17
Note 15 Contingent assets and liabilities
There have been no significant changes in contingent assets and liabilities in the six months to 30 June 2003.
Note 16 Events subsequent to balance date
On 17 July 2003, WMC Resources announced that it had accepted an offer to merge its Canadian subsidiary WMC International Ltd (WIL) with Comaplex Minerals Corp. The merger will result in Comaplex assuming control of all of WIL’s exploration properties, including the 56% interest held in the Meliadine West gold project in Canada.
Upon completion of the transaction, the sale is expected to realise a value in excess of current book value.
18
Directors’ Declaration
The directors declare that the financial statements and notes set out on pages 7 to 18:
| a) | comply with Accounting Standards, the Corporations Regulations 2001 and other mandatory professional reporting requirements; and |
| b) | give a true and fair view of the consolidated entity’s financial position as at 30 June 2003, and of its performance, as represented by the results of its operations and its cash flows for the half-year ended on that date. |
In the directors’ opinion:
| a) | the financial statements and notes are in accordance with the Corporations Act 2001; and |
| b) | there are reasonable grounds to believe that WMC Resources Ltd will be able to pay its debts as and when they become due and payable. |
The declaration is made in accordance with a resolution of the Directors.
|
Andrew G Michelmore Chief Executive Officer |
13 August 2003
19

Independent review report to the members of WMC Resources Ltd
Statement
Based on our review, which is not an audit, we have not become aware of any matter that makes us believe that the financial report of WMC Resources Ltd:
| • | does not give a true and fair view, as required by the Corporations Act 2001 in Australia, of the financial position of the WMC Resources Group (defined below) as at 30 June 2003 and of its performance for the half-year ended on that date, and |
| • | is not presented in accordance with the Corporations Act 2001, Accounting Standard AASB 1029: Interim Financial Reporting and other mandatory financial reporting requirements in Australia, and the Corporations Regulations 2001. |
This statement must be read in conjunction with the rest of our review report.
Scope
The financial report and directors’ responsibility
The financial report comprises the statement of financial position, statement of financial performance, statement of cash flows, accompanying notes to the financial statements, and the directors’ declaration for the WMC Resources Group (the consolidated entity), for the half-year ended 30 June 2003. The consolidated entity comprises both WMC Resources Ltd (the company) and the entities it controlled during that half-year.
The directors of the company are responsible for the preparation and true and fair presentation of the financial report in accordance with the Corporations Act 2001. This includes responsibility for the maintenance of adequate accounting records and internal controls that are designed to prevent and detect fraud and error, and for the accounting policies and accounting estimates inherent in the financial report.
Review approach
We conducted an independent review in order for the company to lodge the financial report with the Australian Securities and Investments Commission. Our review was conducted in accordance with Australian Auditing Standards applicable to review engagements.
We performed procedures in order to state whether, on the basis of the procedures described, anything has come to our attention that would indicate that the financial report does not present fairly, in accordance with the Corporations Act 2001, Accounting Standard AASB 1029: Interim Financial Reporting and other mandatory financial reporting requirements in Australia, a view which is consistent with our understanding of the consolidated entity’s financial position, and its performance as represented by the results of its operations and cash flows.
We formed our statement on the basis of the review procedures performed, which included:
| • | inquiries of company personnel, and |
| • | analytical procedures applied to financial data. |
When this review report is included in a document containing information in addition to the financial report, our procedures include reading the other information to determine whether it contains any material inconsistencies with the financial report.
20
Independent review report to the members of WMC Resources Ltd (continued)
These procedures do not provide all the evidence that would be required in an audit, thus the level of assurance provided is less than that given in an audit. We have not performed an audit, and accordingly, we do not express an audit opinion.
While we considered the effectiveness of management’s internal controls over financial reporting when determining the nature and extent of our procedures, our review was not designed to provide assurance on internal controls.
Our review did not involve an analysis of the prudence of business decisions made by directors or management.
Independence
In conducting our review, we followed applicable independence requirements of Australian professional ethical pronouncements and the Corporations Act 2001.
| ||
PricewaterhouseCoopers | ||
| ||
P A Bendall | Melbourne | |
Partner | 13 August 2003 | |


21
Comparison of actual statutory results for the half year ended
30 June 2003 to pro forma 2002 comparative results
For additional information please contact: | ||
Gordon Drake General Manager, Investor Relations gordon.drake@wmc.com +61 (0)3 9685 6102 | Nerida Mossop Manager, Investor Relations nerida.mossop@wmc.com +61 (0)3 9685 6274 | |
Statements contained in this material, particularly those regarding the possible or assumed future performance, costs, dividends, returns, production levels or rates, prices, reserves, divestments, potential growth of WMC, industry growth or other trend projections and any estimated company earnings are or may be forward looking statements. Such statements relate to future events and expectations and as such involve known and unknown risks and uncertainties. Actual results actions and developments may differ materially from those expressed or implied by these forward looking statements depending on a variety of factors, including: variations in the market price of the minerals and metals produced by WMC, the impact of foreign currency exchange rates on these market prices, WMC’s ability to profitably produce and transport minerals and metals extracted to applicable markets, WMC’s ability to achieve projected cost and scheduling targets for repair and construction activities and the activities of governmental authorities in certain countries where WMC has projects, facilities or mines that are being explored or developed, as well as the factors discussed under the caption “Risk Factors” at pages 13 to 16 of WMC’s Annual Report on Form 20-F for the fiscal year ended December 31, 2002.
This report (Fact File) contains a comparison of WMC Resources Ltd’s 2003 half-year actual statutory results, to pro forma historical results for the 2002 year. The 2003 statutory results have been drawn from the Half Yearly ASX report for the six months ended 30 June 2003 as lodged with ASIC on 13 August 2003. The 2002 pro forma comparatives are drawn from the Special Purpose Report lodged with ASIC on 26 February 2003. The 2002 comparatives are not a substitute for the WMC Resources Ltd consolidated financial report. A copy of all documents referred to are available on our websitewww.wmc.com.
Basis of preparation
The presentation of the statement of financial performance and statement of cash flows is consistent with the format of these statements in the WMC Limited’s Scheme Booklet dated 28 October 2002 and the Special Purpose Report dated 26 February 2003. The presentation of the statement of financial position is designed to provide information in relation to each of the business segments and is therefore not set out in accordance with Australian Generally Accepted Accounting Principles (GAAP).
2002 Pro Forma Comparatives
The Pro Forma 2002 Results and Cash Flows of WMC Resources Ltd, set out in this report, have been prepared on a consolidated entity basis for WMC Resources Ltd and its controlled entities and assumes for the comparative periods shown, that the entities acquired by WMC Resources Ltd as part of the demerger (principally the copper/uranium and fertilizer businesses and the finance companies) were controlled entities for the full periods reported (from 1 January 2002).
The transactions that occurred in conjunction with the demerger and the manner in which the demerger was implemented has had an effect on WMC Resources Ltd’s results and financial position in 2003 and will have an effect in all future years relative to its historical results and financial position.
This report has been prepared as if the following transactions and events for the comparative periods presented had occurred at 1 January 2002:
| • | the copper/uranium, fertilizer and international exploration assets and business were acquired at their fair value as required under Australian GAAP. The fair value adjustments, principally copper/ uranium (uplift) and fertilizer (write down) impact on the carrying values in the statement of financial position and consequently result in higher net amortisation charges compared with prior periods but with no cash flow implications; |
| • | overall level of debt was reduced and higher yield long dated securities repurchased and refinanced with consequently lower interest charges in 2002 and future years; |
| • | derivative and financial instruments (primarily the hedge book) were fair valued at the forward price prevailing at demerger date. This resulted in the extinguishment of deferred hedge losses with future gains and losses being determined with reference to the new forward price including the base exchange rate at demerger of 0.5608. This does not impact the underlying contract prices; and |
| • | demerger costs were borne by WMC Resources Ltd. Some of these have been capitalised into asset values increasing future depreciation and amortisation charges. |

WMC Resources first half earnings in line with previous half
Summary
| • | First half profit after tax of $47 million—in line with second half 2002 pro forma earnings of $46.3 million. |
| • | Higher A$ offsets improving US$ commodity prices during the first half. |
| • | Nickel production and sales lower due to planned major maintenance at the Kalgoorlie smelter. |
| • | Rebuilt uranium solvent extraction plant commissioned at Olympic Dam. |
| • | Rising A$ increases cost of purchased nickel concentrate feed. |
| • | Project budget forecasts for Olympic Dam uranium and copper solvent extraction plant rebuilds increase to $375 million. |
| • | Improved production performance in June quarter. |
Key Financials
Pro forma historical 2nd half 2002 | Actual 1st half 2003 | ||||
Profit (after tax) ($m) | 46.3 | 47.0 | |||
EBIT from operations excluding significant items ($m) | 135.8 | 135.9 | |||
EBITDA (pre hedging) ($m) | 335.3 | 281.9 | |||
Revenue from operations ($m) | 1,388.0 | 1,394.9 | |||
Cash flow from operations ($m) | 347.6 | 187.8 | |||
Cash flow before debt and equity funding ($m)1 | 62.4 | (211.5 | ) | ||
Return on equity (%) | 2.6 | 2.6 | |||
Net assets ($m) | 3,607 | 3,661 | |||
Gearing (%) | 30.3 | 29.8 | |||
Interest cover (times) | 11.0 | 11.4 |
| 1 | Cash flow before debt and equity funding includes net cash flows from operating and investing activities less bond issue costs and interest rate hedge payments. |
“We are at the midpoint of what was always going to be a tough year for WMC Resources,” said WMC Resources CEO, Andrew Michelmore.
“The planned maintenance shutdown of the Kalgoorlie nickel smelter and commissioning of the Olympic Dam uranium solvent extraction plant were completed in the first half.”
“The maintenance shutdown of our Queensland fertilizer operations was completed on time and under budget last week.”
“A reline of our copper smelter and completion of the copper solvent extraction plant at Olympic Dam will give us a relatively clear run in 2004.”
1
Outlook
“The outlook is for an improved second half, building on the return to stronger production in the June quarter.”
“Increased volumes of higher grade, lower cost nickel concentrate from Mount Keith will feed the Kalgoorlie smelter at full rates in the second half.”
“The new Olympic Dam uranium circuit is operating at planned rates.”
“The focus for the second half 2003 is to deliver the remaining maintenance and capital projects on time and on budget and drive production toward 2003 full year targets.”
“The market outlook for our commodities is strong and all our operations will have gone through major repair and rebuild during 2003.”
“Our focus remains firmly on delivering shareholder value,” Andrew Michelmore said.
Directors have determined that an interim dividend will not be declared.
Media Contact:
Troy Hey, Group Manager—Public Affairs
(03) 9685 6233 or 0419 502 852
Analyst/Shareholder Contact:
Nerida Mossop—Manager, Investor Relations
(03) 9685 6274 or 0418 378 809
2
Results Summary
| Proforma Historical 2nd Half 2002 | Actual 1st Half 2003 | ||||
| $m | $m | ||||
Profit after tax | 46.3 | 47.0 | |||
EBIT from operations (pre hedging) | 143.8 | 80.7 | |||
EBIT from operations excluding significant items | 135.8 | 135.9 | |||
Cashflow from Operations | 347.6 | 187.8 | |||
Capital Expenditure | 330.8 | 305.6 | |||
Cashflow before debt and equity funding | 62.4 | (211.5 | ) | ||
Cash & Liquid Investments—net of overdraft | 90.5 | 120.8 | |||
Borrowings (net of cash) | 1,567 | 1,556 | |||
Assets | 7,348 | 7,542 | |||
Equity | 3,607 | 3,661 | |||
Return on equity (%) | 2.6 | 2.6 | |||
Cash flow from Operations to Net Debt (%) | 44.4 | 24.1 | |||
Net Debt / Net Debt + Equity (%) | 30.3 | 29.8 | |||
Interest Cover—times | 11.0 | 11.4 | |||
Earnings per share—cents | 4.1 | 4.2 | |||
Key Points
| • | Profit after income tax was $47 million for the half. This included a tax credit of $7.6 million. |
| • | Earnings before interest and tax (EBIT) from operations declined by $63.1 million from the previous half. The previous half benefited from insurance revenue of $45.4 million. |
| • | EBIT from operations before significant items (copper insurance revenue and idle capacity charges) was in line with the prior half. |
| • | Cash flow from operations declined by $159.8 million. The current half was impacted by a seasonal increase in working capital at the Hi Fert retail operation. The previous half benefited from insurance proceeds. |
| • | Cash flow before debt and equity funding includes one-off items relating to prior year demerger costs paid in the current half and transaction costs relating to refinancing of debt. |
| • | Whilst the return on equity was in line with the previous half, it is not yet meeting our target. |
| • | Capital expenditure of $305.6 million includes costs associated with the rebuild of the uranium and copper solvent extraction plants at Olympic Dam. |
| • | The company’s financial position remains sound, with gearing of 29.8 per cent and interest cover of 11.4 times. Both measures are within our target range. |
| • | Directors have determined that an interim dividend will not be declared. |
Outlook for Second Half 2003
| • | Construction of the copper solvent extraction plant is scheduled for physical completion in December. |
| • | Reline of the copper smelter is scheduled for completion at the end of September . |
| • | Strong production outlook for all operations. |
| • | Cash flow from operations is expected to be positively impacted by working capital reductions. |
22
Environment Health & Safety
The first half of 2003 showed continued improvement in the company’s environment, health and safety performance.
The combined lost time and medically treated injury rate in the first half of 9.9 injuries per million hours was 14 per cent lower than the full year 2002 result and 32 per cent lower than 2001 performance.
An area of arsenic contamination of soil and groundwater has been identified at the Kwinana Nickel Refinery. It is believed that the contamination originated prior to the mid-1990s. The contamination is confined within site boundaries. Recovery of the arsenic in groundwater has commenced using existing infrastructure.
The ongoing improvement in environment, health and safety performance reflects the results of the positive contribution of our workforce and management team and the application of our Environment, Health and Safety Management System.
23
Production Summary
| Full Year 2002 | 1st Half 2002 | 2nd Half 2002 | 1st Half 2003 | |||||
Nickel (contained nickel) (‘000 tonnes) | ||||||||
—Concentrate | 106.4 | 50.5 | 55.9 | 55.1 | ||||
—Matte | 91.6 | 41.7 | 49.9 | 44.0 | ||||
—Metal | 65.1 | 30.9 | 34.2 | 29.7 | ||||
Copper (‘000 tonnes) | 178.1 | 87.8 | 90.3 | 91.3 | ||||
Uranium (tonnes) | 2,891 | 1,192 | 1,699 | 1,399 | ||||
Gold (‘000 ounces) | 64.3 | 37.6 | 26.7 | 50.3 | ||||
Fertilizer (‘000 tonnes) | ||||||||
—Di-ammonium phosphate | 718 | 339 | 379 | 371 | ||||
—Mono-ammonium phosphate | 103 | 59 | 44 | 102 | ||||
Total Fertilizer | 821 | 398 | 423 | 473 |
Nickel in concentrate production was in line with the previous half at Mount Keith and Kambalda. Leinster production was lower in response to reduced demand from the Kalgoorlie smelter.
Nickel in matte production was 12 per cent lower due to major maintenance and statutory inspections at the Kalgoorlie smelter. The lower matte production constrained feed to the Kwinana refinery during the half.
Copper production at Olympic Dam increased slightly. Record smelter throughput was achieved in the second quarter, reflecting the benefits of a new higher capacity concentrate burner and improvement programs in the feed preparation and gas handling systems. Uranium production was 18 per cent lower than the previous half, primarily as a result of lower head grades. Gold production increased by 23,618 ounces due to the conversion into bullion of stocks built up in the previous half.
Record performance was achieved at the Phosphate Hill fertilizer plant with production equivalent to 99 per cent of nameplate capacity. Production in May and June was at rates equivalent to 102 per cent of design capacity. Production of Mono-ammonium phosphate (MAP) fertilizer increased, reflecting both seasonal demand for the product and a move toward our strategy of increasing the proportion of MAP production.
24
Average Commodity Prices & Exchange Rates
Financial Period Ended | Copper US$/lb | Nickel US$/lb | DAP US$/t | US$/A$1.00 | ||||
31 December 1999 | ||||||||
First Half | 0.65 | 2.24 | 194 | 0.6438 | ||||
Second Half | 0.77 | 3.21 | 159 | 0.6473 | ||||
Full Year | 0.71 | 2.74 | 178 | 0.6456 | ||||
31 December 2000 | ||||||||
First Half | 0.80 | 4.28 | 146 | 0.6103 | ||||
Second Half | 0.84 | 3.57 | 161 | 0.5538 | ||||
Full Year | 0.82 | 3.92 | 154 | 0.5821 | ||||
31 December 2001 | ||||||||
First Half | 0.78 | 3.00 | 153 | 0.5228 | ||||
Second Half | 0.66 | 2.41 | 141 | 0.5127 | ||||
Full Year | 0.72 | 2.70 | 147 | 0.5175 | ||||
31 December 2002 | ||||||||
First Half | 0.72 | 2.97 | 154 | 0.5345 | ||||
Second Half | 0.70 | 3.15 | 160 | 0.5525 | ||||
Full Year | 0.71 | 3.07 | 157 | 0.5438 | ||||
30 June 2003 | ||||||||
First Half | 0.75 | 3.78 | 175 | 0.6166 | ||||
Scheme Booklet Forecast | 0.78 | 3.40 | 175 | 0.5800 | ||||
Average US dollar copper prices strengthened during the half, up 7 per cent from the prior half, with strong consumption growth in Asia, and China in particular.
Average LME cash nickel prices (US dollar) for the half increased 20 per cent from the prior half as a result of favourable market fundamentals, including higher western world stainless steel production and strong Chinese nickel demand.
Di-ammonium phosphate (DAP) prices improved with average US dollar prices 9 per cent higher than the previous half. DAP prices have been undergoing cyclical recovery since mid 2001, and were supported in the current half by strong demand in international markets, and increases in raw material costs that forced producers to raise prices or reduce output.
Improvements in commodity prices were offset by a strengthening Australian dollar relative to the US dollar.
25
WMC Resources Share Price
26
Statement of Financial Performance
| Pro Forma Historical | ||||||||||||
(A$ Million)
| Full Year 2002 | 1st Half 2002 | 2nd Half 2002 | Actual 1st Half | ||||||||
REVENUE | ||||||||||||
Nickel | 1,373.5 | 629.5 | 744.0 | 758.8 | ||||||||
Copper / Uranium | 765.0 | 344.2 | 420.8 | 362.6 | ||||||||
Fertilizer (QFO and Hi-Fert) | 432.6 | 277.7 | 154.9 | 255.9 | ||||||||
Other sales revenue | 28.0 | 12.3 | 15.7 | 17.3 | ||||||||
Sales revenue (pre hedging) | 2,599.1 | 1,263.7 | 1,335.4 | 1,394.6 | ||||||||
Revenue received/receivable from insurance claim | 85.3 | 35.0 | 50.3 | — | ||||||||
Other revenue | 6.1 | 3.8 | 2.3 | 0.3 | ||||||||
REVENUE from operations (pre hedging) | 2,690.5 | 1,302.5 | 1,388.0 | 1,394.9 | ||||||||
Total EBITDA (pre hedging) | 664.1 | 328.8 | 335.3 | 281.9 | ||||||||
Amortisation | (194.1 | ) | (100.7 | ) | (93.4 | ) | (96.5 | ) | ||||
Depreciation | (325.2 | ) | (167.0 | ) | (158.2 | ) | (146.9 | ) | ||||
Total EBIT (pre hedging) | 144.8 | 61.1 | 83.7 | 38.5 | ||||||||
EBIT | ||||||||||||
Nickel | 258.7 | 113.7 | 145.0 | 107.3 | ||||||||
Copper / Uranium | 36.2 | 9.4 | 26.8 | (38.5 | ) | |||||||
Fertilizer | (23.9 | ) | 2.0 | (25.9 | ) | 6.1 | ||||||
Other EBIT from operations | (0.2 | ) | 1.9 | (2.1 | ) | 5.8 | ||||||
EBIT from operations (pre hedging) | 270.8 | 127.0 | 143.8 | 80.7 | ||||||||
Net currency and commodity hedging gains/(losses) | (13.5 | ) | (10.2 | ) | (3.3 | ) | 22.1 | |||||
EBIT from operations (post hedging) | 257.3 | 116.8 | 140.5 | 102.8 | ||||||||
Corporate | (61.6 | ) | (26.3 | ) | (35.3 | ) | (19.9 | ) | ||||
Finance and other costs | 1.0 | 0.2 | 0.8 | (1.1 | ) | |||||||
Exploration and New Business | (65.4 | ) | (39.8 | ) | (25.6 | ) | (21.2 | ) | ||||
Total EBIT | 131.3 | 50.9 | 80.4 | 60.6 | ||||||||
Net borrowing costs | (57.4 | ) | (30.4 | ) | (27.0 | ) | (21.2 | ) | ||||
PROFIT before income tax credit/(expense) | 73.9 | 20.5 | 53.4 | 39.4 | ||||||||
Income tax credit/(expense) | 1.5 | 8.6 | (7.1 | ) | 7.6 | |||||||
PROFIT AFTER TAX | 75.4 | 29.1 | 46.3 | 47.0 | ||||||||
27
Statement of Financial Performance (continued)
| Pro Forma Historical | Actual 1st Half 2003 | ||||||||||
(A$ Million) | Full Year 2002 | 1st Half 2002 | 2nd Half 2002 | ||||||||
EBIT from Operations (post hedging) | 257.3 | 116.8 | 140.5 | 102.8 | |||||||
Impact of significant items: | |||||||||||
Insurance revenue (Olympic Dam) | (80.4 | ) | (35.0 | ) | (45.4 | ) | — | ||||
Idle capacity charge (Olympic Dam) | 97.6 | 56.9 | 40.7 | 33.1 | |||||||
EBIT from Operations excluding significant items | 274.5 | 138.7 | 135.8 | 135.9 | |||||||
The 2002 pro forma comparatives have been restated to reflect the reclassification of certain intragroup sales and purchases. As a result, the Business Unit EBITs have changed marginally. There is no impact on the overall consolidated pro forma results for 2002.
The above statement includes line items which are not prepared under Australian GAAP. They have been included as they are considered to be a useful measure of operational performance because they are commonly used by certain investors to evaluate the core results of the company. Financial statements prepared in accordance with Australian GAAP can be found in the Appendix 4D Half Yearly ASX Report.
28
Statement of Financial Position
(A$ Million) | Actual 31 December 2002 | Actual 30 June 2003 | ||||
Property, Plant & Equipment (including acquired mineral rights)1 | ||||||
Nickel | 1,269.3 | 1,279.8 | ||||
Copper | 3,745.1 | 3,806.1 | ||||
Fertilizer | 567.3 | 561.2 | ||||
Other | 23.9 | 96.6 | ||||
| 5,605.6 | 5,743.7 | |||||
Working Capital | ||||||
Nickel | 236.6 | 212.2 | ||||
Copper | 250.0 | 213.8 | ||||
Fertilizer | 97.5 | 165.4 | ||||
Other | (76.5 | ) | (36.1 | ) | ||
| 507.6 | 555.3 | |||||
Corporate | ||||||
Hedging related balances (includes debtors and creditors related to hedging and deferred hedging gains) | (714.9 | ) | (818.6 | ) | ||
Tax balances (net provision for deferred tax) | (336.3 | ) | (327.2 | ) | ||
Exploration and Evaluation expenditure capitalised1 | 152.7 | 83.8 | ||||
Provisions for rehabilitation and employee entitlements | (175.7 | ) | (185.7 | ) | ||
Other | 134.6 | 166.6 | ||||
NET ASSETS FUNDED BY DEBT AND EQUITY | 5,173.6 | 5,217.9 | ||||
Net Debt | 1,567.0 | 1,556.5 | ||||
Shareholders’ Equity | 3,606.6 | 3,661.4 | ||||
DEBT AND EQUITY | 5,173.6 | 5,217.9 | ||||
| 1 | During the current period, $71.1 million was transferred on finalisation of the Corridor Sands acquisition from Exploration and Evaluation to Acquired Mineral Rights (included in Property, Plant & Equipment above). |
29
Statement of Cash Flows
| Pro Forma Historical | Actual 1st Half | |||||||||||
(A$ Million) | Full Year 2002 | 1st Half 2002 | 2nd Half 2002 | |||||||||
EBITDA (pre hedging) | ||||||||||||
Nickel | 467.8 | 222.6 | 245.2 | 211.0 | ||||||||
Copper | 292.0 | 140.8 | 151.2 | 76.5 | ||||||||
Fertilizer | 19.2 | 22.7 | (3.5 | ) | 26.9 | |||||||
Other | (114.9 | ) | (57.3 | ) | (57.6 | ) | (32.5 | ) | ||||
| 664.1 | 328.8 | 335.3 | 281.9 | |||||||||
Other | (26.9 | ) | (15.0 | ) | (11.9 | ) | (0.4 | ) | ||||
Movements in working capital | ||||||||||||
Nickel | (66.8 | ) | (123.1 | ) | 56.3 | 24.4 | ||||||
Copper | (72.9 | ) | (33.1 | ) | (39.8 | ) | 36.2 | |||||
Fertilizer | (7.6 | ) | (43.8 | ) | 36.2 | (67.9 | ) | |||||
Other | 51.1 | (15.8 | ) | 66.9 | (40.4 | ) | ||||||
| (96.2 | ) | (215.8 | ) | 119.6 | (47.7 | ) | ||||||
Currency and Commodity hedging payments | (158.1 | ) | (91.9 | ) | (66.2 | ) | (38.4 | ) | ||||
Net borrowing costs paid | (58.5 | ) | (29.3 | ) | (29.2 | ) | (6.0 | ) | ||||
Income tax paid | — | — | — | (1.6 | ) | |||||||
Cash flow from operations | 324.4 | (23.2 | ) | 347.6 | 187.8 | |||||||
Capital expenditure | ||||||||||||
Nickel | (192.0 | ) | (75.9 | ) | (116.1 | ) | (118.9 | ) | ||||
Copper | (215.6 | ) | (51.0 | ) | (164.6 | ) | (171.6 | ) | ||||
Fertilizer | (50.3 | ) | (10.6 | ) | (39.7 | ) | (13.9 | ) | ||||
Other | (13.2 | ) | (2.8 | ) | (10.4 | ) | (1.2 | ) | ||||
| (471.1 | ) | (140.3 | ) | (330.8 | ) | (305.6 | ) | |||||
Other investing cashflows | 45.2 | (0.4 | ) | 45.6 | (1.2 | ) | ||||||
Net cash flow before financing and demerger costs | (101.5 | ) | (163.9 | ) | 62.4 | (119.0 | ) | |||||
Bond issue costs paid | — | — | — | (8.9 | ) | |||||||
Interest rate swap close out | 71.2 | 71.2 | — | — | ||||||||
Payment on close out of interest rate hedge | — | — | — | (38.5 | ) | |||||||
Demerger costs paid | N/A | N/A | N/A | (45.1 | ) | |||||||
Net cash flow before debt and equity funding | (30.3 | ) | (92.7 | ) | 62.4 | (211.5 | ) | |||||
30
Commodity & Currency Hedging
Hedging gains of $22 million contributed to the operating profit, representing a stronger Australian dollar relative to the exchange rate used to fair value the hedge contracts at the time of the demerger.
Borrowing Costs
Net borrowing costs benefited from the impact of lower floating rates for the majority of the half.
In May 2003, WMC successfully completed a two tranche global bond debt issue into the US market, raising US$700 million comprising US$500 million at 5.125 per cent over 10 years and US$200 million at 6.25 per cent over 30 years. During the period up to the bond issue, a US Treasury lock was entered into as a hedge against US interest rate changes. With the fall in US interest rates during the period, a hedge loss of $39 million was crystallized and settled in the current half. In accordance with generally accepted accounting principles the loss has been capitalized and will be amortised over the life of the bond (10 years).
Taxation
Tax credits on the cash payments in respect of the company��s hedge book more than offset tax expense on operating activities, giving rise to a net credit of $7.6 million.
Reconciliation of Income Tax Benefit
| Pro Forma Historical | Actual 1st Half | |||||||||||
(A$ Million) | Full Year 2002 | 1st Half 2002 | 2nd Half 2002 | |||||||||
Operating profit before tax | 73.9 | 20.5 | 53.4 | 39.4 | ||||||||
Prima facie income tax expense at 30% | (22.2 | ) | (6.2 | ) | (16.0 | ) | (11.8 | ) | ||||
Items varying the prima facie income tax expense: | ||||||||||||
Rebateable and exempt dividends | 3.2 | 3.2 | — | — | ||||||||
Additional claim for research and development expenditure | 8.1 | 2.6 | 5.5 | 4.5 | ||||||||
Exempt income | 1.8 | 3.3 | (1.5 | ) | 3.0 | |||||||
Non-assessable capital gains | 0.8 | — | 0.8 | 0.6 | ||||||||
Additional / (Non-deductible) depreciation and amortisation | (4.8 | ) | (3.4 | ) | (1.4 | ) | 3.3 | |||||
Non-deductible expenses | (0.4 | ) | (0.4 | ) | — | (2.2 | ) | |||||
Non-deductible foreign expenses | (5.5 | ) | (2.1 | ) | (3.4 | ) | (1.4 | ) | ||||
Adjustment for fair values at demerger: | ||||||||||||
—Hedging | 144.6 | 81.7 | 62.9 | 60.5 | ||||||||
—Debt balances | 99.8 | — | 99.8 | — | ||||||||
Net variations | 247.6 | 84.9 | 162.7 | 68.3 | ||||||||
Tax effect of above variations at 30% | 74.3 | 25.5 | 48.8 | 20.5 | ||||||||
Variance between Australian and foreign tax rates | — | — | — | 0.4 | ||||||||
Future income tax benefits not brought to account - Overseas | (1.7 | ) | (1.7 | ) | — | (3.5 | ) | |||||
Future income tax benefits recognised / (not brought to account) - Australia | (48.9 | ) | (9.0 | ) | (39.9 | ) | 1.9 | |||||
Over provision of tax in prior years | — | — | — | 0.1 | ||||||||
Reduction in prima facie income tax | 23.7 | 14.8 | 8.9 | 19.4 | ||||||||
Income tax benefit / (expense) for the period | 1.5 | 8.6 | (7.1 | ) | 7.6 | |||||||
31
Commodity & Currency Hedging as at 30 June 2003
WMC Resources revenues vary significantly with movements in commodity prices and the AUD/USD exchange rate. There is an existing hedge position that will be continuously managed.
The hedge book was fair valued at the date of demerger. Consequently, the profit and loss for each hedge will be determined by the difference between a particular hedge’s fair valued rate and the spot price at the date of the hedge’s maturity. The following tables show both the rates at which the hedge transactions are contracted with third parties to determine the cash flow impact for each hedge and the fair valued rates for determining the profit and loss impact.
Currency (as at 30 June 2003)
Period | Forward Sale of US$ | Synthetic Forward Sale of US$ | Non limiting Cover | Profit & Loss Rate A$/US$ | ||||||||||
| Amount US$m | Cash Flow Rate A$/US$ | Amount US$m | Cash Flow Rate A$/US$ | Amount US$m | Cash Flow Rate A$/US$ | |||||||||
2003 (remainder) | 94 | 0.6843 | 35 | 0.6500 | 5 | 0.5920 | 0.5510 | |||||||
2004 | 228 | 0.6753 | 73 | 0.6402 | — | — | 0.5449 | |||||||
2005-08 | 737 | 0.6740 | 345 | 0.6239 | — | — | 0.5424 | |||||||
A synthetic forward consists of a bought US$ put and a written US$ call option. The written US$call option has the potential to knock out above certain exchange rates.
Gold (as at 30 June 2003)
| Forward Sale of Gold | Profit & Loss A$/oz | |||||
Period | Amount Ounces | Cash Flow Rate A$/oz | ||||
2003 (remainder) | 40,000 | 548 | 586 | |||
2004 | 80,000 | 559 | 600 | |||
2005 | 80,000 | 579 | 620 | |||
Gold production from Olympic Dam is delivered into the gold hedging positions.
Gold hedges for 2006-2010 were closed out during the current half. The profit on those transactions has been deferred to match the original maturity dates.
In 2001 some foreign exchange and gold hedges were reversed as a result of the gold asset sales. The cash flow impact of these reversals has been deferred to the original settlement date as follows:
| 2003 (remainder) | 2004 | 2005 | 2006 | 2007 | 2008 | |||||||||||||
Deferred Cashflow (A$m) | (14.8 | ) | (26.4 | ) | (37.4 | ) | (28.5 | ) | (23.4 | ) | (21.2 | ) |
Scenario Tables
As WMC Resources’ hedge positions comprise a combination of limiting and non-limiting cover, at various price levels, any one exchange rate or spot price cannot be used to predict the outcome of WMC Resources’ hedge position. The following table provides an estimate of the realised rate to determine cash flow under various scenarios taking into account the hedged and unhedged exposures. All realised exchange rate and price estimates include applicable option premium.
Currency
A$/US$ | Estimated realised rate—A$/US$ | |||||
Rate at maturity | 2003 (remainder) | 2004 | 2005-2008 | |||
0.75 | 0.7264 | 0.7264 | 0.7318 | |||
0.70 | 0.6887 | 0.6910 | 0.6921 | |||
0.65 | 0.6498 | 0.6542 | 0.6513 | |||
0.60 | 0.6096 | 0.6159 | 0.6094 | |||
32

Overview of Nickel Operations
Market review
Average US dollar nickel prices for the half increased 20 per cent from the prior half as a result of favourable market fundamentals, including higher western world stainless steel production, strong Chinese nickel demand and limitations on near to medium term upside production capacity. In Australian dollar terms, increase in nickel prices was a more modest 8 per cent.
Production
Production from our nickel operations in the first half was constrained by the biennial shutdown of the Kalgoorlie smelter for major maintenance and statutory inspections. Nickel-in-matte production was approximately 6,000 tonnes lower than the previous half and as a consequence nickel metal produced at the Kwinana refinery was also lower. Combined nickel-in-concentrate production from Mount Keith, Leinster and Kambalda was similar to the previous half with concentrate stockpiled during the smelter maintenance.
Financials
Earnings before interest and tax for the nickel operations were $120.2 million for the half, compared to $143.2 million for the preceding half. Key variances included:
| • | Revenue from operations (pre-hedging) declined by $25.7 million with reduced sales of nickel matte and metal due to the smelter maintenance shutdown. The impact of lower volumes was partially offset by higher realised prices. |
| • | Operational cash costs increased by $14.5 million reflecting higher mining costs at Mount Keith and operation of supplementary processing facilities (secondary crushing at Mount Keith and ore sorting at Leinster). |
| • | The cost of purchased feed increased by $22.3 million due to both higher purchase costs relating to the rising nickel price, and higher volumes. |
| • | Non cash costs (prior to changes in stock) were similar to the previous period. |
The combined impact of lower production (smelter maintenance shutdown), and higher purchased feed and production costs resulted in a 13 per cent increase in the unit cost of sales for the period.
Capital expenditure of $118.9 million was similar to the preceding half. Enhance capital was invested in recovery improvement projects at both Leinster and Mount Keith. Mine capital development increased in line with progressive development of the Perseverance lower mine at Leinster.
Outlook
Production of nickel matte and metal are expected to increase in the second half with the smelter maintenance and statutory inspections completed and improving ore grades at Mount Keith. The lag effect of matte deliveries from the smelter to the refinery that occurred in the first half is expected to result in full year nickel metal production to be in the range of 65,000 to 66,000 tonnes.
Unit costs are expected to decrease in the second half in line with higher production and a greater proportion of lower cost Mount Keith concentrate relative to purchased concentrate in smelter feed.
A low cost de-bottlenecking project is underway to increase the capacity of the Kwinana refinery by 3,000 tonnes to 70,000 a year. The project cost is $3 million and final components will be installed during planned major maintenance at the refinery in the first quarter of 2004.
The review of options for capacity expansion at Mount Keith continues. In addition, a concept study of the Cliffs nickel deposit eight kilometres south of Mount Keith is scheduled for completion by year end.
Combined nickel, copper and PGE mineralisation has been confirmed over a strike length of approximately seven kilometres at the Collurabbie exploration project located 170 kilometres east-northeast of the Mount Keith Operation. A comprehensive drilling program will commence in the second half.
33
Production
| Full Year 2002 | 1st Half 2002 | 2nd Half 2002 | 1st Half 2003 | |||||
Kambalda Nickel Operations | ||||||||
Ore treated (‘000 tonnes) | 688.5 | 303.4 | 385.1 | 421.7 | ||||
Head grade (%) | 3.79 | 3.53 | 3.99 | 3.57 | ||||
Total Concentrate produced (‘000 tonnes) | 159.0 | 68.0 | 91.0 | 93.6 | ||||
Concentrate grade (%) | 14.6 | 14.3 | 14.9 | 14.4 | ||||
Nickel-in-concentrate (‘000 tonnes) | 23.2 | 9.7 | 13.5 | 13.5 | ||||
Leinster Nickel Operations | ||||||||
Ore treated (‘000 tonnes) | 2,570.7 | 1,230.8 | 1,339.9 | 1,202.9 | ||||
Head grade (%) | 1.99 | 1.97 | 2.02 | 2.02 | ||||
Concentrate produced (‘000 tonnes) | 311.5 | 151.7 | 159.8 | 163.7 | ||||
Concentrate grade (%) | 12.8 | 12.6 | 13.0 | 12.1 | ||||
Nickel-in-concentrate (‘000 tonnes) | 40.0 | 19.2 | 20.8 | 19.8 | ||||
Mt Keith Nickel Operations | ||||||||
Ore treated (‘000 tonnes) | 11,054.9 | 5,472.6 | 5,582.3 | 5,387.5 | ||||
Head grade (%) | 0.58 | 0.58 | 0.58 | 0.59 | ||||
Concentrate produced (‘000 tonnes) | 217.6 | 112.4 | 105.2 | 110.2 | ||||
Concentrate grade (%) | 19.8 | 19.2 | 20.5 | 19.7 | ||||
Nickel-in-concentrate (‘000 tonnes) | 43.2 | 21.6 | 21.6 | 21.8 | ||||
Total Nickel-in-concentrate (‘000 tonnes) | 106.4 | 50.5 | 55.9 | 55.1 | ||||
Kalgoorlie Nickel Smelter | ||||||||
Concentrate treated (‘000 tonnes) | 640.5 | 300.2 | 340.3 | 328.1 | ||||
Nickel-in-concentrate treated from WMC sources (‘000 tonnes) | 71.7 | 33.1 | 38.6 | 32.5 | ||||
Nickel-in-concentrate treated from third party sources (‘000 tonnes) | 23.8 | 10.3 | 13.5 | 14.5 | ||||
Matte produced (‘000 tonnes) | 134.5 | 62.1 | 72.4 | 64.4 | ||||
Nickel-in-matte produced (‘000 tonnes) | 91.6 | 41.7 | 49.9 | 44.0 | ||||
Kwinana Nickel Refinery | ||||||||
Matte treated (‘000 tonnes) | 100.7 | 49.0 | 51.7 | 44.8 | ||||
Refined nickel produced (‘000 tonnes) | 65.1 | 30.9 | 34.2 | 29.7 | ||||
Sales
| Full Year 2002 | 1st Half 2002 | 2nd Half 2002 | 1st Half 2003 | |||||
Nickel-in-concentrate (‘000 tonnes) | 14.1 | 7.0 | 7.1 | 7.3 | ||||
Nickel-in-matte (‘000 tonnes) | 25.7 | 9.5 | 16.2 | 14.1 | ||||
Metal (‘000 tonnes) | 64.8 | 31.0 | 33.8 | 30.3 | ||||
Total Nickel (‘000 tonnes) | 104.6 | 47.5 | 57.1 | 51.7 | ||||
Cobalt (tonnes) | 848 | 454 | 394 | 495 | ||||
34
Financial Statements
| Pro Forma Historical | Actual 1st Half | |||||||||||
(A$ Million) | Full Year 2002 | 1st Half 2002 | 2nd Half 2002 | |||||||||
Profit & Loss | ||||||||||||
Revenue | ||||||||||||
Nickel | 1,207.4 | 542.5 | 664.9 | 633.0 | ||||||||
Intermediate Products | 90.2 | 48.8 | 41.4 | 47.6 | ||||||||
Revenue from Operations | 1,297.6 | 591.3 | 706.3 | 680.6 | ||||||||
Commodity Trading Revenue | 75.9 | 38.2 | 37.7 | 78.2 | ||||||||
Sales Revenue | 1,373.5 | 629.5 | 744.0 | 758.8 | ||||||||
Revenue received/receivable from insurance claim | 4.9 | — | 4.9 | — | ||||||||
Other | 0.4 | 0.4 | — | 0.1 | ||||||||
Total Revenue | 1,378.8 | 629.9 | 748.9 | 758.9 | ||||||||
Cash Costs | ||||||||||||
Production | (496.5 | ) | (236.5 | ) | (260.0 | ) | (269.8 | ) | ||||
Non-Production | (147.1 | ) | (72.1 | ) | (75.0 | ) | (79.7 | ) | ||||
Purchased Feed | (198.2 | ) | (109.0 | ) | (89.2 | ) | (111.5 | ) | ||||
Non Cash Costs | ||||||||||||
Production Costs | (207.6 | ) | (106.6 | ) | (101.0 | ) | (104.4 | ) | ||||
Non-Production Costs | (49.1 | ) | (27.4 | ) | (21.7 | ) | (15.6 | ) | ||||
Change in Stock | 54.2 | 73.5 | (19.3 | ) | 7.5 | |||||||
Cost of Sales of WMC products | (1,044.3 | ) | (478.1 | ) | (566.2 | ) | (573.5 | ) | ||||
Commodity Trading Expenses | (75.8 | ) | (38.1 | ) | (37.7 | ) | (78.1 | ) | ||||
Total Cost of Sales | (1,120.1 | ) | (516.2 | ) | (603.9 | ) | (651.6 | ) | ||||
EBIT (pre hedging) | 258.7 | 113.7 | 145.0 | 107.3 | ||||||||
Currency/Commodity Hedging | (6.8 | ) | (5.0 | ) | (1.8 | ) | 12.9 | |||||
EBIT (post hedging) | 251.9 | 108.7 | 143.2 | 120.2 | ||||||||
Depreciation and Amortisation | 209.1 | 108.9 | 100.2 | 103.7 | ||||||||
EBITDA (post hedging) | 461.0 | 217.6 | 243.4 | 223.9 | ||||||||
Capital Expenditure | ||||||||||||
Sustain | 44.9 | 15.4 | 29.5 | 28.6 | ||||||||
Enhance | 28.6 | 4.4 | 24.2 | 11.5 | ||||||||
Mine Capital Development | 118.2 | 56.0 | 62.2 | 70.8 | ||||||||
Capitalised Major Maintenance | 0.3 | 0.1 | 0.2 | 8.0 | ||||||||
Total | 192.0 | 75.9 | 116.1 | 118.9 | ||||||||
Balance Sheet | ||||||||||||
Current Assets | 358.0 | 398.9 | 358.0 | 341.5 | ||||||||
Non-Current Assets | 1,353.0 | 1,343.4 | 1,353.0 | 1,359.1 | ||||||||
Liabilities | (301.1 | ) | (432.8 | ) | (301.1 | ) | (336.3 | ) | ||||
Net Assets | 1,409.9 | 1,309.5 | 1,409.9 | 1,364.3 | ||||||||
Operating cash flows | 432.8 | 122.7 | 310.1 | 234.5 | ||||||||
The 2002 pro forma comparatives have been restated to reflect the reclassification of certain intragroup sales and purchases. As a result, the Business Unit EBITs have changed marginally. There is no impact on the overall consolidated pro forma results for 2002.
The above statement includes line items which are not prepared under Australian GAAP. They have been included as they are considered to be a useful measure of operational performance because they are commonly used by certain investors to evaluate the core results of the company. Financial statements prepared in accordance with Australian GAAP can be found in the Appendix 4D Half Yearly ASX Report.
35
Ratios and Unit Costs
| Pro Forma Historical | Actual 1st Half | |||||||
| Full Year 2002 | 1st Half 2002 | 2nd Half 2002 | ||||||
Ratios/Unit Costs | ||||||||
Return on Net Assets (Annualised %) | 17.3 | 15.3 | 19.1 | 14.4 | ||||
Unit Cash Cost of Nickel Metal Production (A$/lb) | 2.13 | 2.02 | 2.24 | 2.44 | ||||
Unit Total Cost of Nickel Metal Sales (A$/lb) | 4.17 | 4.14 | 4.18 | 4.75 | ||||
Average Nickel Sales Price excluding hedging (A$/lb) | 5.62 | 5.44 | 5.78 | 6.09 | ||||
Average Nickel Sales Price including hedging (A$/lb) | 5.59 | 5.39 | 5.77 | 6.21 | ||||
36
Overview of Copper Uranium Operation
Market Review
Average US dollar copper prices strengthened during the first half, up 7 per cent from the prior half, with strong consumption growth in Asia, and China in particular. The realised Australian dollar copper price declined 4 per cent compared to the preceding half.
Production
Copper production was slightly higher at 91,322 tonnes for the half. Smelter throughput increased to record levels in the second quarter, reflecting the benefits of a new higher capacity concentrate burner and improvement programs in the feed preparation and gas handling systems. Uranium production was 18 per cent lower than the previous half, primarily reflecting lower head grades. The new uranium solvent extraction plant was commissioned and is now operating at planned rates.
Gold production increased by 23,618 ounces from the prior half, reflecting the conversion into bullion of stocks built up in the previous half. Gold production is expected to return to normal levels in the second half.
Financials
Earnings before interest and tax for the copper uranium operation was a loss of $31.6 million. This outcome was anticipated and primarily reflects the impact of operating the plant at rates less than capacity due to the rebuild of the solvent extraction plants. Declining Australian dollar prices for copper also impacted unfavourably on the result.
Revenue from operations declined $58.2 million as a result of lower realised prices, and lower sales volumes for both copper and uranium. Total revenue declined by $103.6 million, primarily due to the recognition of $45.4 million of insurance revenue in the previous half.
Cash operating costs were in line with the previous half.
Non cash costs were lower than the previous half which had been impacted by accelerated depreciation.
Purchases of uranium and copper finished goods increased to meet the sales profile for the second half.
Unit costs were higher due to lower uranium credits (foreign exchange and volume related).
Capital expenditure of $172 million included $126 million relating to the rebuild of the copper and uranium solvent extraction plants. $121 million remains to be spent on this project, the majority of which will be incurred in the current half year. Capitalised major maintenance of $17 million for the half relates to preparation for the smelter reline. The remaining capital for this project will be incurred in the second half.
Outlook
The Olympic Dam smelter has now operated for a record four and a half years. The smelter is scheduled to be taken offline for major maintenance starting on 20 August 2003. The work scope includes:
| • | relining of the flash, anode and slag furnaces, |
| • | refurbishment and repairs to the boiler, acid plant and utilities, and |
| • | capability improvements to the gas handling system and slag furnace. |
The shutdown is scheduled to take 40 days and will significantly reduce copper production in the third quarter. The uranium plant is scheduled to operate throughout the smelter shutdown with higher production forecast in the second half reflecting the contribution of the new uranium solvent extraction plant.
Unit costs are expected to be lower in the second half as a result of higher volumes, increased uranium production and lower finished goods purchases.
A review of mining practices and stoping strategies at the Olympic Dam mine is currently underway focusing on the assessment of regional ground conditions. The outcomes of the review to date have been a reduction in stope size and changed scheduling for some areas. The impact on costs is expected to be negligible, with increased development costs offset by lower strength backfill requirements, and improved loader and stope productivity.
Construction of the copper solvent extraction plant is scheduled to be completed by the end of December 2003, with commissioning in the first quarter of 2004. The delay from the original plan is expected to impact 2004 production by approximately 4,000 tonnes. We are working toward ensuring that operational improvements currently being undertaken at Olympic Dam offset the impact of the delay.
37
Production
| Full Year 2002 | 1st Half 2002 | 2nd Half 2002 | 1st Half 2003 | |||||
Olympic Dam Operations | ||||||||
Ore treated (‘000 tonnes) | 8,874.6 | 4,466.5 | 4,408.1 | 4,276.5 | ||||
Copper ore grade (%) | 2.57 | 2.53 | 2.61 | 2.36 | ||||
Copper produced (‘000 tonnes) | 178.1 | 87.8 | 90.3 | 91.3 | ||||
Uranium ore grade (kg/tonne) | 0.69 | 0.65 | 0.73 | 0.63 | ||||
Uranium produced (tonnes) | 2,891 | 1,192 | 1,699 | 1,399 | ||||
Gold ore grade (g/tonne) | 0.53 | 0.54 | 0.52 | 0.49 | ||||
Gold produced (‘000 ounces) | 64.3 | 37.6 | 26.7 | 50.3 | ||||
Silver ore grade (g/tonne) | 4.29 | 4.08 | 4.50 | 4.28 | ||||
Silver produced (‘000 ounces) | 644.0 | 321.3 | 322.7 | 323.0 | ||||
| Sales | ||||||||
| Full Year 2002 | 1st Half 2002 | 2nd Half 2002 | 1st Half 2003 | |||||
Copper (‘000 tonnes) | 186.1 | 89.3 | 96.8 | 90.8 | ||||
Uranium Oxide (tonnes) | 3,888 | 1,246 | 2,642 | 2,168 | ||||
38
Financials
| Pro Forma Historical | Actual 1st Half 2003 | |||||||||||
(A$ Million) | Full Year 2002 | 1st Half 2002 | 2nd Half 2002 | |||||||||
Profit & Loss | ||||||||||||
Revenue | ||||||||||||
Revenue from Operations | 765.0 | 344.2 | 420.8 | 362.6 | ||||||||
Revenue received/receivable from insurance claim | 90.4 | 45.0 | 45.4 | — | ||||||||
Total Revenue | 855.4 | 389.2 | 466.2 | 362.6 | ||||||||
Cash Costs | ||||||||||||
Production | (350.2 | ) | (163.8 | ) | (186.4 | ) | (185.9 | ) | ||||
Non-Production * | (165.9 | ) | (89.3 | ) | (76.6 | ) | (75.8 | ) | ||||
Finished Goods Purchased | (61.0 | ) | (23.9 | ) | (37.1 | ) | (42.7 | ) | ||||
Non Cash Costs | ||||||||||||
Production | (207.3 | ) | (99.4 | ) | (107.9 | ) | (106.9 | ) | ||||
Non-Production * | (63.3 | ) | (36.4 | ) | (26.9 | ) | (11.8 | ) | ||||
Change in Stock | 28.5 | 33.0 | (4.5 | ) | 22.0 | |||||||
Total Cost of Sales | (819.2 | ) | (379.8 | ) | (439.4 | ) | (401.1 | ) | ||||
EBIT (pre hedging) | 36.2 | 9.4 | 26.8 | (38.5 | ) | |||||||
Currency/Commodity Hedging | (5.3 | ) | (4.2 | ) | (1.1 | ) | 6.9 | |||||
EBIT (post hedging) | 30.9 | 5.2 | 25.7 | (31.6 | ) | |||||||
Depreciation and Amortisation | 255.8 | 131.4 | 124.4 | 115.0 | ||||||||
EBITDA (post hedging) | 286.7 | 136.6 | 150.1 | 83.4 | ||||||||
| * Non-Production Costs include idle capacity charge associated with the SX plant rebuild of: | (97.6 | ) | (56.9 | ) | (40.7 | ) | (33.1 | ) | ||||
Capital Expenditure | ||||||||||||
Sustain—Olympic Dam Operations | 37.2 | 5.0 | 32.2 | 17.4 | ||||||||
Sustain—SX plant rebuild | 127.8 | 17.2 | 110.6 | 126.1 | ||||||||
Enhance | 37.6 | 21.4 | 16.2 | 3.5 | ||||||||
Mine Capital Development | 13.0 | 7.4 | 5.6 | 7.6 | ||||||||
Capitalised Major Maintenance | — | — | — | 17.0 | ||||||||
Total | 215.6 | 51.0 | 164.6 | 171.6 | ||||||||
Balance Sheet | ||||||||||||
Current Assets | 398.1 | 310.5 | 398.1 | 379.6 | ||||||||
Non-Current Assets | 3,760.3 | 3,737.6 | 3,760.3 | 3,827.7 | ||||||||
Liabilities | (462.2 | ) | (414.5 | ) | (462.2 | ) | (466.5 | ) | ||||
Net Assets | 3,696.2 | 3,633.6 | 3,696.2 | 3,740.8 | ||||||||
Operating cash flows | 231.4 | 111.2 | 120.2 | 102.3 | ||||||||
The 2002 pro forma comparatives have been restated to reflect the reclassification of certain intragroup sales and purchases. As a result, the Business Unit EBITs have changed marginally. There is no impact on the overall consolidated pro forma results for 2002.
The above statement includes line items which are not prepared under Australian GAAP. They have been included as they are considered to be a useful measure of operational performance because they are commonly used by certain investors to evaluate the core results of the company. Financial statements prepared in accordance with Australian GAAP can be found in the Appendix 4D Half Yearly ASX Report.
39
Ratios and Unit Costs
| Pro Forma Historical | Actual 1st Half 2003 | |||||||
| Full Year 2002 | 1st Half 2002 | 2nd Half 2002 | ||||||
Ratios/Unit Costs | ||||||||
Return on Net Assets (Annualised %) | 0.9 | 0.5 | 1.4 | N/A | ||||
Unit Cash Cost of Production (A$/lb) | 0.58 | 0.62 | 0.53 | 0.68 | ||||
Unit Total Cost of Sales excluding idle capacity charge associated with the SX plant rebuild (A$/lb) | 1.11 | 1.13 | 1.09 | 1.14 | ||||
Unit Total Cost of Sales including idle capacity charge associated with the SX plant rebuild (A$/lb) | 1.35 | 1.42 | 1.28 | 1.30 | ||||
Average Copper Sales Price excluding hedging (A$/lb) | 1.31 | 1.35 | 1.28 | 1.23 | ||||
Average Copper Sales Price including hedging (A$/lb) | 1.30 | 1.33 | 1.28 | 1.25 | ||||
40

Overview of Fertilizer Operation
Market review
Di-ammonium phosphate (DAP) prices improved significantly during the half, with average US dollar prices 9 per cent higher than the previous half. DAP prices have been undergoing cyclical recovery since mid 2001, and were supported in the current half by strong demand in international markets, and increases in raw material costs that forced producers to raise prices or reduce output. As a result of the strengthening Australian dollar, average Australian dollar DAP prices declined by 1 per cent compared to the prior half.
Production
Record performance was achieved at the Phosphate Hill fertilizer plant in the first half with production equivalent to 99 per cent of design capacity. Production in May and June was at rates equivalent to 102 per cent of design capacity.
Production of mono-ammonium phosphate (MAP) fertilizer increased in the half, reflecting both seasonal demand for the product and a move toward our strategy of increasing the proportion of MAP production.
Financials
Earnings before interest and tax for WMC Fertilizers was $8.4 million for the half. The result was impacted by the following items:
| • | Revenue from sale of WMC produced fertilizer increased $36.6 million as a result of a 31 per cent increase in volumes. This was partially offset by a 1 per cent decline in the average Australian dollar price for DAP. |
| • | Unit cash costs of fertilizer production improved A$13 per tonne, primarily as a result of the economies of scale achieved by higher production. |
| • | The EBIT contribution from the Hi-Fert retail operation was $13 million higher, reflecting the seasonal nature of the sales profile. |
Outlook
A shutdown of all plants in the Queensland Fertilizer Operations for major maintenance and statutory inspections was completed on schedule and under budget in early August. Fertilizer production has since ramped up to normal production rates. The shutdown will impact fertilizer production by approximately 45,000 tonnes in the September quarter. The operation is well placed to exceed its full year production target of 870,000 tonnes.
41
Production
| Full Year 2002 | 1st Half 2002 | 2nd Half 2002 | 1st Half 2003 | |||||
Di-Ammonium Phosphate (DAP) (‘000 tonnes) | 718 | 339 | 379 | 371 | ||||
Mono-Ammonium Phosphate (MAP) (‘000 tonnes) | 103 | 59 | 44 | 102 | ||||
Total Fertilizer (‘000 tonnes) | 821 | 398 | 423 | 473 | ||||
| Sales | ||||||||
| Full Year 2002 | 1st Half 2002 | 2nd Half 2002 | 1st Half 2003 | |||||
QFO (‘000 tonnes)—third parties | 606 | 292 | 314 | 327 | ||||
QFO (‘000 tonnes)—via Hi-Fert | 294 | 216 | 78 | 186 | ||||
Hi-Fert—Purchased Product (‘000 tonnes) - third parties | 354 | 277 | 78 | 213 | ||||
42
Financials
| Pro Forma Historical | Actual 1st Half | |||||||||||
(A$ Million) | Full Year 2002 | 1st Half 2002 | 2nd Half 2002 | |||||||||
Profit & Loss | ||||||||||||
Revenue | ||||||||||||
Fertilizer sales revenue | 276.0 | 155.8 | 120.2 | 156.8 | ||||||||
Total Revenue | 276.0 | 155.8 | 120.2 | 156.8 | ||||||||
Cash Costs | ||||||||||||
Production | (211.5 | ) | (111.1 | ) | (100.4 | ) | (108.7 | ) | ||||
Non-Production | (46.2 | ) | (21.3 | ) | (24.9 | ) | (22.1 | ) | ||||
Non Cash Costs | ||||||||||||
Production | (42.4 | ) | (20.9 | ) | (21.5 | ) | (19.1 | ) | ||||
Non-Production | (3.8 | ) | (4.5 | ) | 0.7 | 0.9 | ||||||
Change in Stock | (10.5 | ) | (14.2 | ) | 3.7 | (11.0 | ) | |||||
Total Cost of Sales | (314.4 | ) | (172.0 | ) | (142.4 | ) | (160.0 | ) | ||||
QFO EBIT (pre hedging) | (38.4 | ) | (16.2 | ) | (22.2 | ) | (3.2 | ) | ||||
Profit/(Loss) from Hi-Fert | 14.5 | 18.2 | (3.7 | ) | 9.3 | |||||||
Fertilizer EBIT (pre hedging) | (23.9 | ) | 2.0 | (25.9 | ) | 6.1 | ||||||
Currency/Commodity Hedging | (1.4 | ) | (1.0 | ) | (0.4 | ) | 2.3 | |||||
EBIT (post hedging) | (25.3 | ) | 1.0 | (26.3 | ) | 8.4 | ||||||
QFO Depreciation and Amortisation | 39.5 | 18.9 | 20.6 | 18.9 | ||||||||
Hi-Fert Depreciation and Amortisation | 3.6 | 1.8 | 1.8 | 1.9 | ||||||||
Fertilizer EBITDA (post hedging) | 17.8 | 21.7 | (3.9 | ) | 29.2 | |||||||
Capital Expenditure (QFO only) | ||||||||||||
Sustain | 25.0 | 7.6 | 17.4 | 4.3 | ||||||||
Enhance | 0.7 | 0.1 | 0.6 | 0.3 | ||||||||
Mine Capital Development | 16.2 | 0.5 | 15.7 | (0.3 | ) | |||||||
Capitalised Major Maintenance | 6.2 | 0.3 | 5.9 | 8.9 | ||||||||
Total | 48.1 | 8.5 | 39.6 | 13.2 | ||||||||
Balance Sheet (QFO only) | ||||||||||||
Current Assets | 49.6 | 45.4 | 49.6 | 49.6 | ||||||||
Non-Current Assets | 554.3 | 513.5 | 554.3 | 553.5 | ||||||||
Liabilities | (43.6 | ) | (38.4 | ) | (43.6 | ) | (42.3 | ) | ||||
Net Assets | 560.3 | 520.5 | 560.3 | 560.8 | ||||||||
Operating cash flows (QFO only) | 26.7 | 24.9 | 1.8 | 13.2 | ||||||||
The 2002 pro forma comparatives have been restated to reflect the reclassification of certain intragroup sales and purchases. As a result, the Business Unit EBITs have changed marginally. There is no impact on the overall consolidated pro forma results for 2002.
The above statement includes line items which are not prepared under Australian GAAP. They have been included as they are considered to be a useful measure of operational performance because they are commonly used by certain investors to evaluate the core results of the company. Financial statements prepared in accordance with Australian GAAP can be found in the Appendix 4D Half Yearly ASX Report.
43
Ratios and Unit Costs
| Pro Forma Historical | Actual 1st Half | |||||||
| Full Year 2002 | 1st Half 2002 | 2nd Half 2002 | ||||||
Ratios/Unit Costs (QFO only) | ||||||||
Return on Net Assets (Annualised %) | N/A | N/A | N/A | N/A | ||||
Unit Cash Cost of Fertilizer Production (A$/t) | 244 | 249 | 241 | 228 | ||||
Unit Cost of Fertilizer Sales (A$/t) | 332 | 324 | 341 | 300 | ||||
Average DAP Sales Price excluding hedging (A$/t) | 283 | 280 | 286 | 277 | ||||
Average DAP Sales Price including hedging (A$/t) | 281 | 278 | 285 | 281 | ||||
44

Business Strategy & Development
Exploration
West Musgrave
Whilst drilling results to date at Nebo and Babel have been encouraging, the economic viability of the project has not yet been clearly established.
Regional exploration at West Musgrave will continue during 2003. We are progressing an exploration agreement covering new exploration licences in the region. This will enable follow-up of further airborne electromagnetic targets.
Mundra South
Exploration tenements have been granted and access has been agreed at the Mundra South nickel-sulphide prospect, located approximately 200 kilometres south of West Musgrave. Airborne electromagnetic surveys have been completed and on-ground geophysical work will commence this quarter.
Comaplex / WIL Merger (Meliadine West)
In July 2003, WMC International Holdings Ltd, a wholly owned Canadian subsidiary of WMC Resources Ltd accepted an offer to merge its Canadian operating subsidiary, WMC International Ltd (‘WIL’), with Canadian mining junior, Comaplex Minerals Corp (‘Comaplex’). (Comaplex is listed on the Toronto Stock Exchange – CMF).
The merger will result in Comaplex assuming control of all of WIL’s exploration properties, including its 56 per cent interest in the Meliadine West gold project in Canada’s lower Arctic territories. This will increase Comaplex’s ownership in that project from 22 per cent to a 78 per cent interest. WMC will acquire 5,200,000 or 15 per cent of the shares in Comaplex and receive a cash payment of $US6.7 million. The offer is subject to due diligence, regulatory and Board approvals, and is targeted to be complete in the final quarter of 2003.
Global Exploration
Exploration for nickel sulphide deposits continued in Australia, North America and China and for copper-gold deposits in Mongolia and Peru.
Projects
Solvent Extraction Plant Rebuild
The rebuild of the uranium solvent extraction plant was completed and the plant was commissioned during the June quarter. Construction of the copper solvent extraction plant is scheduled for physical completion by December 2003.
Forecast overall project cost for rebuilding the solvent extraction plants has increased to $375 million.
Effective 1st June 2003, project management of the copper solvent extraction plant rebuild has been assumed by WMC Resources from the EPCM contractor.
Olympic Dam Expansion Study
Drilling continued during the quarter to develop geotechnical and geological data, with approximately 19,000 metres drilled from a program of 40,000 metres. Discussions continued with the South Australian Government taskforce regarding the Olympic Dam expansion study.
Corridor Sands
On 22 May 2003, WMC Resources announced that the Industrial Development Corporation of South Africa (IDC) had elected to exercise its option to purchase 10 per cent of the Corridor Sands project. Documentation was signed post 30 June 2003. The purchase price of US$10 million is payable as an initial payment of US$100,000 and the balance of US$9.9 million (plus interest) on the achievement of certain milestones.
45

Average sales price (excluding hedging)
Australian dollar sales price per unit received inclusive of contractual premiums, discounts or rebates. In effect, total product revenue divided by product sales volumes.
Average sales price (including hedging)
Australian dollar sales prices unit received inclusive of hedging. In effect, total product revenue plus or minus commodity and pro rated currency hedging gains or losses divided by product sales volumes.
Capitalised major maintenance
Costs related to planned cyclical maintenance capitalised and amortised over the period to the next major shut-down (where this period is greater than twelve months).
Earnings per share (EPS)
Basic EPS: Profit after tax divided by the weighted average number of ordinary shares on issue during the period.
Diluted EPS: Profit after tax divided by the weighted average number of ordinary and potential shares on issue during the period.
Enhance capital
Capital expenditure where there is a high degree of confidence that a discrete return on expenditure will be achieved through increased production or a reduction in operating costs.
Frequency Rate (FR)
Number of lost time and medically treated injuries per million hours exposure.
GAAP
Generally accepted accounting principles in Australia.
Idle capacity
Idle capacity reflects a situation where productive assets are not used at their full or near full capacity. This may result from a shortage of material to process, a shutdown for maintenance or be due to an industrial dispute. Costs are proportionately reallocated from production to non-production costs with the effect that they are charged immediately against earnings as opposed to being included in the valuation of stocks and charged to earnings as product is sold.
Interest Cover
Earnings before interest, taxes, depreciation and amortisation and hedging divided by net interest expense incurred before subtracting capitalised interest.
Liquid Investments
Investments that are convertible to cash within a period not exceeding ninety days.
LME
London Metal Exchange.
Lost Time Injury (LTI)
An injury that results in at least one full shift being lost at some time (not necessarily immediately) after the shift during which the injury occurred, providing it is not a rostered day off.
Mine capital development
Costs of establishing access to ore where the access is expected to be used for production over greater than twelve months.
46
Medically Treated Injury (MTI)
Injuries that do not result in lost work days, but require medical treatment (including restricted work).
Operating Cash flow to Debt
The percentage of annualised net cash flow from operations relative to net debt.
Return on Net Assets
Business Units earnings before interest, tax and hedging divided by average net assets (excluding tax assets / liabilities and intra-group assets).
Return on equity
Operating profit after tax / total shareholders’ equity.
Return on invested capital
The annualised earnings before interest and tax as a percentage of funds employed in the business (shareholders’ equity and net debt).
Sustain capital
Capital expenditure to maintain the operations at there current level of performance with no material impact on production or reduction in the cost base.
Unit Cash Cost of production
Cash costs directly attributable to production (excludes sales and distribution, royalties, idle capacity and R&D costs amongst others) less the value of by-products produced divided by production volumes.
Unit Total Cost of Sales
‘Unit Cost of Sales’ is ‘Total Cost of Sales’ less co-product revenue divided by product sold. ‘Total Cost of Sales’ includes all production and non production costs, and stock movements.
Working Capital
Working capital only includes net current trade and other debtors, inventories, and trade and other creditors.
47