Table of Contents
SECURITIES AND EXCHANGE COMMISSION
Washington, D.C. 20549
FORM 6-K
REPORT ON FOREIGN ISSUER
PURSUANT TO RULE 13a-16 OR 15d-16 OF
THE SECURITIES EXCHANGE ACT OF 1934
Date: Period February 17, 2003
WMC RESOURCES LTD
ACN 004 184 598
Level 16, IBM Centre
60 City Road
Southbank, Victoria 3006
Australia
Indicate by check mark whether the registrant files or will file annual reports under cover of Form 20-F or Form 40-F.
Form 20-F x Form 40-F ¨
Indicate by check mark whether the registrant by furnishing the information contained in this Form is also thereby furnishing the information to the Commission pursuant to Rule 12g3-2(b) under the Securities Exchange Act of 1934.
Yes ¨ No x
If “Yes” is marked, indicate below the file number assigned to the registrant in connection with Rule 12g3-2(b):
82-
Table of Contents
This report on Form 6-K includes press releases of WMC Resources Ltd made during the period February 18, 2002 to February 26, 2003.
SIGNATURES
Pursuant to the requirements of the Securities Exchange Act of 1934, the registrant has duly caused this report to be signed on its behalf by the undersigned, thereunto duly authorised.
WMC RESOURCES LTD
By:
Name: R.E. Mallett
Title: Assistant Company Secretary
Date: February 26, 2002
Table of Contents

| To: | The Manager |
Announcements
Company Announcements Office
Public Announcement 2003-5
Please find attached for immediate release, an announcement by WMC Resources Ltd on the basis of preparation of the company’s end of year results to be released on 26 February 2003.
Peter Horton
Company Secretary
19 February 2003
For further information, please call:
Tania Price, Group Manager Public Affairs on;
(03) 96856233 or 0419 502 852, or
David Hall, General Manager Finance on;
(03) 9685 6081 or 0412 371 592
WMC Resources Ltd
ACN 004 184 598
GPO Box 860K
Melbourne Vic. 3001
Australia
Level 16 IBM Centre
60 City Road
Southbank Vic. 3006
Australia
Tel +61 (0)3 9685 6000
Fax +61 (0)3 9685 6115
Table of Contents

Year end 31 December 2002 – Basis of Preparation
The Directors of WMC Resources Ltd advise that the financial results for the year ended 31 December 2002 will be released to the market on 26 February 2003. In the interests of ensuring that the market is fully informed as to the structure of the intended disclosures, this advice sets out the form and basis of the reports which will be presented as part of the release.
Preliminary Final ASX Report
Under the Corporations Act and in accordance with accounting standards, Directors are required to present this report as the substantive financial report for the year. WMC Resources Ltd was a subsidiary company of the former WMC Limited (now called Alumina Limited) owning the nickel business, and the Directors are required to present the accounts for the year ending 31 December 2002 on the basis that WMC Resources Ltd acquired the copper/uranium and fertilizer businesses and financing vehicles only as of the demerger date. Therefore, the financial statements presented will reflect the results of the nickel operations and corporate activities for the full financial year but include the results of the copper/uranium, fertilizer and finance activities for only one month. In addition, as WMC Resources Ltd bore all the demerger costs, they are reflected in these accounts.
Special Purpose Report
For illustrative purposes and to assist shareholders in understanding the performance of the businesses now comprising WMC Resources Ltd as compared with the forecast contained in the Scheme Booklet dated 28 October 2002, pro forma historical results for the year ended 31 December 2002 for WMC Resources Ltd (prepared on a basis consistent with that contained in the Scheme Booklet) will be provided in a Special Purpose Report.
The Special Purpose Report, being the comparison of Scheme Booklet pro forma forecast results with pro forma historical results for year ended 31 December 2002, will be lodged with the ASX together with the Preliminary Final ASX Report.
The pro forma basis reflects WMC Resources Ltd as though it had owned all of the businesses it acquired on demerger for the full year. It reflects the accounting adjustments on demerger for the full year and normalises one off items.
The Alumina Limited financial statements will disclose 11 months of WMC Resources Ltd operations as part of its discontinued businesses disclosure.
The attached table sets out the major differences in basis between the WMC Resources Ltd disclosures which will be made on 26 February 2003. Reconciliations of the financial outcomes between each of the reports will be detailed in the Fact File which will be lodged with the ASX together with the reports listed above and will be provided in management presentations.
The Directors are conscious of the potential complexity surrounding this release and have authorised this issue as part of a program to assist in the proper and informed analysis of WMC Resources Ltd results.
For further clarification contact:
David Hall, General Manager – Finance | (03) 9685 6081 | |
Tania Price, Group Manager – Public Affairs | (03) 9685 6233 |
Table of Contents
Preliminary Final ASX Report | Special Purpose Pro forma | |||
Nickel Operations | 12 months of operations | 12 months of operations | ||
Copper Operations | 1 month of operations
Impact of fair value adjustment increases amortisation charge (1 month) | 12 months of operations
Impact of fair value adjustment increases amortisation charge (12 months) | ||
Queensland Fertilizer Operations | 1 month of operations
Impact of fair value adjustments decreases depreciation charge (1 month) | 12 months of operations
Impact of fair value adjustment decreases depreciation charge (12 months) | ||
Other Operations | Includes only those operations specific to WMC Resources Ltd post demerger | Excludes activities no longer undertaken | ||
Corporate | 12 months including costs of demerger | 12 months excluding costs of demerger. One offs normalised consistent with the Scheme Booklet approach | ||
Exploration | 12 months of operations | 12 months of operations | ||
Net Currency & Commodity Hedging | 11 months impact at historical rates and one month’s impact at fair value rates | 12 months impact at relevant fair value rates | ||
Borrowing Costs | Net intercompany borrowing costs of the WMC Resources group for 11 months plus one month of external refinanced position post demerger | 12 months of WMC Resources Ltd post demerger debt i.e. adjusted for transfer of $600m to Alumina Limited and movement in interest rates | ||
Tax Expense | Tax effect of above amounts and tax adjustments relevant to the legal entity | Tax effect of above and other normalisations | ||
Table of Contents
| To: | The Manager |
| Announcements |
| Company Announcements Office |
Public Announcement 2003-6
WMC Resources Ltd 2002 Full Year Results
Please find attached for immediate release Public Announcement 2003-6 covering the release of WMC Resources Ltd’s Financial Results for the year ended 31 December 2002.
The following documents are included as part of the release:
| • | Public Announcement |
| • | Appendix 4B — Preliminary Final ASX Report |
| • | Special Purpose Report — Comparison of Scheme Booklet pro forma forecast results to pro forma historical results for the year ended 31 December 2002 |
| • | Business Performance Report (Fact File) |
Peter Horton
Company Secretary
26 February 2003
For further information, please call: | WMC Resources Ltd | |
Tania Price, Group Manager Public Affairs on; | ACN 004 184 598 | |
0419 502 852, or | ||
David Hall, General Manager Finance on; | GPO Box 860K | |
0412 371 592 | Melbourne Vic. 3001 | |
Australia | ||
Level 16 IBM Centre | ||
60 City Road | ||
Southbank Vic. 3006 | ||
Australia | ||
Tel +61 (0)3 9685 6000 | ||
Fax +61 (0)3 9685 6115 |
Table of Contents

WMC Resources delivers on targets
| • | On a statutory basis, WMC Resources Ltd recorded a loss of $43.7 million. This figure reflects 12 months of nickel and corporate costs but only one month of copper and fertilizer operations. |
| • | On a basis consistent with the demerger Scheme Booklet, WMC Resources’ pro forma profit, at $75.4 million, is in line with expectations. |
| • | Operations focused on sustained, consistent performance. |
WMC Resources has delivered on the targets set in last year’s demerger Scheme Booklet and is well-positioned for growth, CEO Andrew Michelmore said today.
Mr Michelmore said the 2002 pro forma result reflected the robust and flexible nature of the businesses, enabling the company to meet its financial commitments as set out to shareholders in the Scheme Booklet.
“Our statutory results are complicated by the nature of the transactions that gave effect to the demerger and, by law, cannot reflect the full-year result of all the businesses that now comprise WMC Resources, Mr Michelmore said.
“The pro forma result from our existing businesses, as compared with the targets set out in the Scheme Booklet, show a solid result.”
“We are looking for sustained, consistent performance from all our operations and a high level of flexibility in our management of those businesses.”
Mr Michelmore said he expected record production in 2003 from some areas of the business, in particular nickel, at a time of strong prices and demand.
“We are positioned to produce a record amount of nickel metal this year at 67,000 tonnes, as well as 99,000 tonnes of nickel-in-matte, and we expect to be selling into a strong market,” he said.
Mr Michelmore said that at Olympic Dam, 2003 copper production would be constrained by a scheduled reline of the smelter and the rebuild of the copper solvent extraction plant.
“With our priority this year being the smelter reline, plus the costs associated with fast-tracking the solvent extraction plant, we have decided to extend the time-frame for rebuilding the copper solvent extraction plant to December 2003,” Mr Michelmore said.
“Accordingly, while we will continue to mitigate the impact by operating that part of the plant not damaged by fire, we expect copper output this year to be reduced by 5000 tonnes to 185,000 tonnes.
“This year will be one of consolidation at Olympic Dam, following which we expect to meet our 2004 target of 235,000 tonnes.”
“Fertilizer production is becoming consistent and, as the lowest cash cost producer in the world at current production rates, we are in a strong position to capitalise on any upswing in prices.”
Mr Michelmore said technological innovation in areas such as metal recovery meant the company was working its assets harder and continually improving margins.
He said the company would look at growth opportunities that added value for shareholders. Such opportunities could arise through exploration, development, mergers, acquisitions and partnerships.
Table of Contents

“Management focus on financial disciplines will also ensure we get the best value from our world-class suite of assets as we expand production capacity and evaluate new opportunities,” he said.
Mr Michelmore said that, in line with forecasts in the Scheme Booklet, the Board had confirmed there would be no dividend paid in relation to the 2002 year.
Table of Contents
WMC RESOURCES LTD
(A.B.N. 76 004 184 598)
PRELIMINARY FINAL ASX REPORT
FOR THE YEAR ENDED
31 DECEMBER 2002
December 2002 Preliminary Final ASX Report
Table of Contents
December 2002 Preliminary Final ASX Report
Table of Contents

WMC Resources Ltd — ABN 76 004 184 598
Financial Year ended 31 December 2002 (“Current Period”)
For announcement to the market
$ million | |||||
1.4 | Revenues from ordinary activities | 2,116.9 |
| ||
1.22 | Loss from ordinary activities after tax attributable to members | (43.7 | ) | ||
1.10 | Profit from extraordinary items after tax attributable to members | Nil |
| ||
1.13 | NET LOSS FOR THE YEAR ATTRIBUTABLE TO MEMBERS | (43.7 | ) | ||
Dividends | |||||
Year ended 31 Dec 2002 | |||||
Interim dividend per share | Nil |
| |||
Franked amount per share | N/A |
| |||
Basis of preparation
WMC Resources Ltd (WMCR) was formed as a result of the demerger of WMC Limited into two entities, one holding the interest in the AWAC joint venture and the other constituting the nickel, copper/uranium and fertilizer operations.
As part of the demerger, WMCR, which already held the nickel businesses and other corporate activities, acquired WMC Limited’s copper/uranium and fertilizer businesses, two finance vehicles as well as exploration and development interests.
In compliance with Australian Accounting Standards and the Corporations Act 2001, the Directors are required to present the accounts for the year ending 31 December 2002 on the basis that WMCR acquired the copper and fertilizer businesses and financing vehicles as part of the demerger. Therefore, the financial statements as presented on pages 2 to 17, reflect the results of the nickel operations and corporate activities for the full financial year but only include the results of the copper/uranium, fertilizer and finance activities for one month. In addition, as WMCR has borne all the demerger costs they are reflected in these accounts.
For illustrative purposes and to assist shareholders in understanding the combined performance of WMCR, and the businesses it acquired, as compared with the forecast contained in the Scheme Booklet dated 28 October 2002, a Special Purpose Report, being the comparison of Scheme Booklet pro forma financial results with pro forma historical results for the year ended 31 December 2002 has been lodged with the ASX together with this Preliminary Final ASX Report.
The pro forma information is provided in addition to, and not in substitution for, the statutory financial information provided by WMC Resources Limited in the financial reports prepared in accordance with the Corporations Act 2001 (Cth) for the year ended 31 December 2002.
Comparatives
WMC Resources Ltd is granted relief pursuant to Australian Securities and Investment Commission (ASIC) Class Order 98/1416 dated 29 July 1998 from disclosing comparative information for the preceding financial year as required by Australian Accounting Standards. This relief is granted on the basis that WMC Resources Ltd was not required to prepare accounts in the preceding financial year pursuant to ASIC Class Order 98/1418 as the company was a member of a ‘Closed Group’ and party to a deed of cross guarantee which was lodged with, and approved by, ASIC.
December 2002 Preliminary Final ASX Report
Table of Contents

Condensed consolidated statement of financial performance
Year ended 31 Dec 2002 $ million | |||||
1.1 | Revenues from operating activities (see item 1.24) | 1,456.3 |
| ||
1.2 | Interest revenue | 525.3 |
| ||
1.3 | Other revenue | 135.3 |
| ||
1.4 | Revenue from ordinary activities (see item 1.29) | 2,116.9 |
| ||
1.5 | Expenses from ordinary activities (see item 1.35) | 1,383.6 |
| ||
1.6 | Borrowing costs (net borrowing costs are $405.2m (debit) at 31 December 2002) | 930.5 |
| ||
1.7 | Loss from ordinary activities before tax | (197.2 | ) | ||
1.8 | Income tax credit on ordinary activities | 153.5 |
| ||
1.9 | Loss from ordinary activities after tax | (43.7 | ) | ||
1.10 | Profit from extraordinary items after tax | — |
| ||
1.11 | Net loss | (43.7 | ) | ||
1.12 | Net loss attributable to outside equity interests | — |
| ||
1.13 | Net loss for the year attributable to members of WMC Resources Ltd | (43.7 | ) | ||
Non-owner transaction changes in equity | |||||
1.14 | Increase/(decrease) in asset revaluation reserve | — |
| ||
1.15 | Net exchange differences recognised in equity | 6.2 |
| ||
1.16 | Total transactions and adjustments recognised directly in equity | 6.2 |
| ||
1.17 | Total changes in equity not resulting from transactions with owners as owners | (37.5 | ) | ||
Earnings per share (EPS) | |||||
Year ended 31 Dec 2002 | |||||
1.18 | Basic EPS (cents) | (5.1 | ) | ||
1.19 | Diluted EPS (cents) | (5.1 | ) | ||
December 2002 Preliminary Final ASX Report
Table of Contents

Notes to the condensed consolidated statement of financial performance
Loss from ordinary activities attributable to members
Year ended 31 Dec 2002 $ million | |||||
1.20 | Loss from ordinary activities after tax (item 1.9) | (43.7 | ) | ||
1.21 | Add/(Less) outside equity interests | — |
| ||
1.22 | Loss from ordinary activities after tax, attributable to members of WMC Resources Ltd | (43.7 | ) | ||
Revenue and expenses from ordinary activities | |||||
Year ended 31 Dec 2002$ million | |||||
Revenue from ordinary activities | |||||
1.23 | Sale of goods | 1,456.3 |
| ||
1.24 | Revenue from operating activities | 1,456.3 |
| ||
1.25 | Interest received/receivable | 525.3 |
| ||
1.26 | Proceeds from disposal of non-current assets | 62.7 |
| ||
1.27 | Insurance proceeds received / receivable | 63.1 |
| ||
1.28 | Other income | 9.5 |
| ||
1.29 | Revenue from ordinary activities | 2,116.9 |
| ||
Expenses from ordinary activities | |||||
1.30 | Cost of goods sold (including depreciation and amortisation — see item 1.36) | 972.0 |
| ||
1.31 | Selling and distribution expenses | 31.9 |
| ||
1.32 | General and administrative expenses | 252.2 |
| ||
1.33 | Exploration and evaluation expenses | 14.4 |
| ||
1.34 | Other expenses from ordinary activities | 113.1 |
| ||
1.35 | Expenses from ordinary activities | 1,383.6 |
| ||
1.36 | Depreciation and amortisation excluding amortisation of intangibles (see item 2.2) | 231.2 |
| ||
December 2002 Preliminary Final ASX Report
Table of Contents

Capitalised outlays
Year ended 31 Dec 2002 $ million | |||||
1.37 | Interest costs capitalised | 0.4 |
| ||
Consolidated accumulated losses | |||||
1.38 | Accumulated losses at the beginning of the financial period | (33.8 | ) | ||
1.39 | Net loss attributable to members (item 1.13) | (43.7 | ) | ||
1.40 | Net transfers (to) and from reserves | — |
| ||
1.41 | Dividends and other equity distributions paid or payable | — |
| ||
1.42 | Accumulated losses at the end of financial period | (77.5 | ) | ||
December 2002 Preliminary Final ASX Report
Table of Contents

Loss from ordinary activities after income tax, includes the following revenues and expenses whose disclosure is relevant in explaining the financial performance of the entity due to their size or nature:-
Note | Year ended 31 Dec 2002 $ million | ||||||
1.43 | Sale of gold royalty | (a) | 15.4 |
| |||
1.44 | Disposal of Long /Victor nickel mines at Kambalda | (b) | 9.4 |
| |||
1.45 | Demerger costs | (c) | (35.8 | ) | |||
1.46 | Insurance receivable and idle capacity charge | (d) | 37.0 |
| |||
1.47 | Tax credit — overprovision of tax in prior year | (e) | 76.8 |
| |||
1.48 | Total significant items after tax | 102.8 |
| ||||
(a) Sale of gold royalty: | |||
Proceeds from the sale of right to gold royalty received from the sale of St Ives and Agnew gold operations. | 45.0 |
| |
Book value of gold royalty and costs associated with the sale | (29.6 | ) | |
Profit on sale | 15.4 |
| |
Income tax expense | — |
| |
15.4 |
| ||
(b) Disposal of Long / Victor nickel mines at Kambalda: | |||
Proceeds from the sale | 14.0 |
| |
Book value and costs associated with the sale | (2.0 | ) | |
Profit on sale | 12.0 |
| |
Income tax expense | (2.6 | ) | |
9.4 |
| ||
(c) Demerger costs: | |||
As outlined in the demerger Scheme Booklet, WMC Resources Ltd has borne the majority of the transaction costs arising as a result of the demerger. The following costs are included in the loss from ordinary activities for the year ended 31 December 2002: | (51.2 | ) | |
Income tax benefit | 15.4 |
| |
(35.8 | ) | ||
Demerger costs expensed (as above) | (51.2 | ) | |
Other demerger related costs: | |||
Stamp Duty1 | (24.0 | ) | |
Novation of hedge contracts2 | (2.4 | ) | |
Debt restructuring3 | (14.0 | ) | |
Yankee bond Buyback — consent fee4 | (38.0 | ) | |
Total demerger costs | (129.6 | ) | |
| 1 | To be amortised over the same timeframe as the fair value adjustments that it relates to. |
| 2 | Capitalised into the applicable new hedge contracts |
| 3 | To be amortised over the life of the new borrowings |
| 4 | Included in the fair value adjustments as part of the demerger. |
December 2002 Preliminary Final ASX Report
Table of Contents

Significant Items (continued)
Year ended 31 Dec 2002 $ million | |||
(d) Insurance receivable and idle capacity charge | |||
Amount receivable from insurance claims in relation to the fire at the Olympic Dam solvent extraction plant | 58.0 |
| |
Idle capacity charge (month of December only) | (5.2 | ) | |
Income tax expense | (15.8 | ) | |
37.0 |
| ||
On 21 October 2001, a fire occurred which destroyed a large portion of the tank farm area of the copper and uranium solvent extraction facilities at Olympic Dam.
An insurance claim has been lodged with the insurers to recover the rebuild cost and business interruption cost of the fire. The lead insurer has formally accepted liability with regard to the event.
The total amount of loss recoverable from insurers for re-instatement of the facilities to suitable standards and for business interruption has yet to be fully concluded.
To date, insurance proceeds of $62 million (net of retentions and deductibles) have been received, $35 million of which relates to business interruption and $27 million to rebuild costs. This amount was recognised as revenue in WMC Limited group’s reported results for the first half ended 30 June 2002.
At 31 December 2002, WMC Resources group has recognised an insurance receivable of $58 million, bringing the total amount recognised during the year to $120 million (net of retentions and deductibles).
Business interruption $ million | Material damage $ million | Total $ million | ||||
Net proceeds received (WMC Limited group) | 35.0 | 27.0 | 62.0 | |||
Receivable (WMC Resources Ltd group) | 45.0 | 13.0 | 58.0 | |||
Total | 80.0 | 40.0 | 120.0 | |||
Year ended 31 Dec 2002 $ million | ||
(e) Tax credit | 76.8 | |
In the year ended 31 December 2001, WMC Resources Ltd made a book profit on the sale of its gold business. At the time of completing the 2001 accounts there was no certainty that the profit was not taxable. As a result, a tax expense was recognised in the 2001 company accounts of WMC Resources Ltd.
Upon completion of the 2001 tax return, it was established that the profit was not taxable. Consequently, a prior period tax adjustment, reversing the 2001 tax expense, has been made which results in a tax benefit of $76.8 million in the accounts of WMC Resources Ltd for the year ended 31 December 2002.
December 2002 Preliminary Final ASX Report
Table of Contents

Intangible and extraordinary items
Consolidated-Year ended 31 December 2002 | Before tax $A million | Related tax $A million | Related outside equity interests $A million | Amount (after tax) attributable to members $A million | |||||
2.1 Amortisation of intangibles | 9.7 | (2.9 | ) | — | 6.8 | ||||
2.2 Total amortisation of intangibles | 9.7 | (2.9 | ) | — | 6.8 | ||||
2.3 Extraordinary items | There were no extraordinary items | ||||||||
Comparison of half year results
| 3.1 | A comparison of half year results has not been provided for the year ended 31 December 2002 as WMC Resources Ltd was not listed on the Australian Stock Exchange (ASX) at 30 June 2002 and not required to prepare an Appendix 4B. Refer page 20 for further information. |
Year ended 31 Dec 2002 $ million | |||||
(a) | Loss from ordinary activities before tax (item 1.7) | 197.2 |
| ||
Prima facie tax benefit for the period at the rate of 30% | 59.1 |
| |||
The following items caused the total charge for income tax to vary from the above: | |||||
Additional claim for research and development expenditure | 2.8 |
| |||
Exempt income | 1.9 |
| |||
Non-assessable capital gains | 4.9 |
| |||
Non-deductible depreciation and amortisation | (1.0 | ) | |||
Non-deductible expenses | (1.1 | ) | |||
Non-deductible foreign expenses | (1.0 | ) | |||
Fair value adjustment arising from acquisition of entities | 311.9 |
| |||
Net Movement | 318.4 |
| |||
Tax effect of the above adjustments at 30% | 95.5 |
| |||
Variance between Australian and foreign tax rates | 0.5 |
| |||
Future income tax benefits not brought to account | (81.4 | ) | |||
Recognition of future income tax benefits not previously brought to account | 3.0 |
| |||
Over provision of tax in prior year | 76.8 |
| |||
Consequent reduction in charge for income tax | 94.4 |
| |||
Income tax credit for the period (item 1.8) | 153.5 |
| |||
December 2002 Preliminary Final ASX Report
Table of Contents

Condensed consolidated statement of financial position
31 Dec 2002 $ million | ||||
Current Assets | ||||
4.1 | Cash | 90.5 | ||
4.2 | Receivables — trade debtors | 238.5 | ||
4.3 | Receivables — other | 319.2 | ||
4.4 | Inventories | 468.8 | ||
4.5 | Tax assets | — | ||
4.6 | Other financial assets | 12.7 | ||
4.7 | Other | 69.6 | ||
4.8 | Total current assets | 1,199.3 | ||
Non-current Assets | ||||
4.9 | Receivables | 218.8 | ||
4.10 | Other financial assets | 12.3 | ||
4.11 | Inventories | 74.9 | ||
4.12 | Exploration and evaluation expenditure capitalised (see item 5.8) | 152.7 | ||
4.13 | Mine properties under development (see item 6.7) | 5.7 | ||
4.14 | Other property, plant and equipment (net) | 4,330.6 | ||
4.15 | Acquired mineral rights | 1,269.3 | ||
4.16 | Tax assets | 44.6 | ||
4.17 | Deferred losses — hedging contracts | 25.9 | ||
4.18 | Other | 14.0 | ||
4.19 | Total non-current assets | 6,148.8 | ||
4.20 | Total assets | 7,348.1 | ||
Current Liabilities | ||||
4.21 | Payables | 657.9 | ||
4.22 | Interest bearing liabilities | 1,287.6 | ||
4.23 | Tax liabilities | 3.9 | ||
4.24 | Provisions (excluding tax liabilities) | 66.0 | ||
4.25 | Deferred gains — hedging contracts | 7.2 | ||
4.26 | Other | 9.8 | ||
4.27 | Total current liabilities | 2,032.4 | ||
Non-current Liabilities | ||||
4.28 | Payables | 849.7 | ||
4.29 | Interest bearing liabilities | 369.9 | ||
4.30 | Tax liabilities | 377.0 | ||
4.31 | Provisions (excluding tax liabilities) | 109.7 | ||
4.32 | Other | 2.8 | ||
4.33 | Total non-current liabilities | 1,709.1 | ||
4.34 | Total liabilities | 3,741.5 | ||
4.35 | Net assets | 3,606.6 | ||
December 2002 Preliminary Final ASX Report
Table of Contents

Condensed consolidated statement of financial position (continued)
31 Dec 2002 $ million | |||||
Equity | |||||
4.36 | Contributed equity | 3,653.4 |
| ||
4.37 | Reserves | 30.7 |
| ||
4.38 | Accumulated losses | (77.5 | ) | ||
4.39 | Equity attributable to members of the parent entity | 3,606.6 |
| ||
4.40 | Outside equity interests in controlled entities | — |
| ||
4.41 | Total equity | 3,606.6 |
| ||
There is no preference capital.
December 2002 Preliminary Final ASX Report
Table of Contents

Notes to the condensed consolidated statement of financial position
Exploration and Evaluation Expenditure Capitalised
Year ended 31 Dec 2002 $ million | |||||
5.1 | Opening balance | 29.0 |
| ||
5.2 | Grassroots expenditure | 10.9 |
| ||
5.3 | Expenditure for additional reserves, supporting existing operations | 3.5 |
| ||
5.4 | Expenditure written off during current period | (14.4 | ) | ||
5.5 | Evaluation expenditure | 1.2 |
| ||
5.6 | Transferred to mine properties and development | (2.7 | ) | ||
5.7 | Increase through acquisition of entities (including Corridor Sands1) | 125.2 |
| ||
5.8 | Closing balance as shown in the condensed consolidated statement of financial position (Item 4.12) | 152.7 |
| ||
| 1 | On 9 December 2002, WMC announced that it had agreed to acquire 100% of the Corridor Sands titanium dioxide project from Southern Mining Corporation Limited. The net cost of the acquisition is payable in at least two tranches. |
| The first tranche was required under the purchase and sale agreement to be determined as a number of WMC Limited shares on the basis of the volume weighted average price of WMC Limited shares in the 30 calendar days prior to entering into the agreement. WMC Limited effectively purchased Corridor Sands prior to the demerger. WMC Limited’s investment in Corridor Sands was then transferred to WMC Resources Ltd on the demerger date and has been measured at fair value of US$ 62.5 million (A$111.1 million). The entitlement to 14,080,604 WMC Limited shares was satisfied by the issue of an identical number of shares in both Alumina Limited and WMC Resources Ltd into a trust, pending completion of the purchase and sale transaction on 31 January 2003. |
| The final tranche of up to US$25 million will be paid in either shares or cash by WMC Resources. As the quantum of the second tranche payment is subject to, and contingent upon, sell down arrangements (if any entered into by the company) it has not been recognised in the above carrying value nor as a present obligation (liability). |
Mine Properties Under Development
Year ended 31 Dec 2002 $ million | ||||
6.1 | Opening balance | 0.5 | ||
6.2 | Expenditure incurred during current period | 2.3 | ||
6.3 | Expenditure transferred from exploration and evaluation | — | ||
6.4 | Acquisitions, disposals, reclassifications, etc | 2.8 | ||
6.5 | Increase through acquisition of entities | 0.1 | ||
6.6 | Expenditure transferred to mine properties and development | — | ||
6.7 | Closing balance as shown in the condensed consolidated statement of financial position (Item 4.13) | 5.7 | ||
December 2002 Preliminary Final ASX Report
Table of Contents

Condensed consolidated statement of cash flows
Year ended 31 Dec 2002 $ million | |||||
Cash Flows Related to Operating Activities | |||||
7.1 | Receipts from customers | 1,454.4 |
| ||
7.2 | Payments to suppliers and employees | (1,292.7 | ) | ||
7.3 | Interest received | 28.2 |
| ||
7.4 | Borrowing costs | (23.5 | ) | ||
7.5 | Payments for exploration: | ||||
7.6 | — Grassroots | (10.9 | ) | ||
7.7 | — Additional, supporting existing operations | (3.5 | ) | ||
7.8 | Net operating cash flows | 152.0 |
| ||
Cash Flows Related to Investing Activities | |||||
7.9 | Payments for property, plant and equipment | (236.3 | ) | ||
7.10 | Proceeds from sale of gold royalty | 45.0 |
| ||
7.11 | Proceeds from sale of Long / Victor nickel mines at Kambalda | 14.0 |
| ||
7.12 | Proceeds from sale of non-current assets | 3.7 |
| ||
7.13 | Demerger costs | (21.7 | ) | ||
7.14 | Proceeds from insurance claims | 16.5 |
| ||
7.15 | Payments for research and development | (0.3 | ) | ||
7.16 | Payments for evaluation expenditure | (1.2 | ) | ||
7.17 | Net investing cash flows | (180.3 | ) | ||
Cash Flows Related to Financing Activities | |||||
7.18 | Proceeds from issues of shares | 600.0 |
| ||
7.19 | Redemption cost of Yankee Bonds | (150.2 | ) | ||
7.20 | Proceeds from borrowings | 992.0 |
| ||
7.21 | Repayment of borrowings | (1,388.2 | ) | ||
7.22 | Net financing cash flows | 53.6 |
| ||
Net Increase in Cash Held | 25.3 |
| |||
7.23 | Cash at the beginning of the financial year | — |
| ||
7.24 | Cash balances acquired on acquisition of entities | 65.2 |
| ||
7.25 | Cash at the end of the financial year | 90.5 |
| ||
December 2002 Preliminary Final ASX Report
Table of Contents

Non-Cash Financing and Investing Activities
Effective 2 December 2002, as part of the demerger of WMC Limited, WMC Resources Ltd acquired from WMC Limited, the copper/uranium and fertilizer businesses, WMC Finance Ltd, WMC Finance (USA) Ltd as well as WMC Limited exploration and development interests. The entities acquired by WMC Resources Ltd as part of the demerger from WMC Limited were for consideration of 1,505,907,806 shares. Refer to 11.1 below for details.
Reconciliation of Cash
Year ended 31 Dec 2002 $ million | ||||
Reconciliation of cash at the end of the financial year (as shown in the condensed consolidated statement of cash flows) to the related items in the accounts is as follows: | ||||
8.1 | Cash on hand and at bank | 66.7 | ||
8.2 | Money market deposits (with maturity on investment three months or less) | 23.8 | ||
8.3 | Cash assets (Item 4.1) | 90.5 | ||
8.4 | Bank overdraft | — | ||
8.5 | Total cash at end of period (Item 7.25) | 90.5 | ||
Other notes to the condensed financial statements
Ratios
Year ended 31 Dec 2002 % | |||||
Loss before tax/revenue | |||||
9.1 | Consolidated loss from ordinary activities before tax (Items 1.7) as a percentage of revenue (Item 1.4) | (9.3 | )% | ||
Loss after tax/equity interests (annualised) | |||||
9.2 | Consolidated net loss from ordinary activities after tax attributable to members (Item 1.13) as a percentage of members equity at the end of the period (Item 4.41) | (1.2 | )% | ||
December 2002 Preliminary Final ASX Report
Table of Contents

Earnings per share (EPS)
Year ended 31 Dec 2002 | |||||
Equity accounted earnings in cents per ordinary share | |||||
10.1 | Basic EPS | (5.1 | ) | ||
10.2 | Diluted EPS | (5.1 | ) | ||
10.3 | Weighted average number of shares used in the calculation of earnings per share | ||||
— Number for basic earnings per share | 851,923,261 |
| |||
— Effect of share options on issue | 1,797,256 |
| |||
— Number for diluted earnings per share | 853,720,517 |
| |||
$A million | |||||
10.4 | Net loss used in calculation of basic and diluted earnings per share | (43.7 | ) |
Control gained over entities having material effect
| 11.1 | With an effective accounting date of 30 November 2002, as part of the demerger of WMC Limited, WMC Resources acquired from WMC Limited, the copper/uranium and fertilizer businesses, WMC Finance Ltd, WMC Finance (USA) Ltd as well as WMC Limited exploration and development interests. Details of the acquisitions are as follows: |
Year ended 31 Dec 2002 $ million | ||
Consideration1 | 1,870.1 | |
Fair value of net assets of entities acquired:2 | ||
Assets | ||
Cash assets | 65.2 | |
Receivables | 657.4 | |
Inventories | 303.7 | |
Property, plant and equipment | 3,028.6 | |
Exploration and evaluation | 125.2 | |
Acquired mineral rights | 1,271.5 | |
Other financial assets | 15.4 | |
Deferred tax assets | 24.2 | |
Other Assets | 59.9 | |
5,551.1 | ||
Liabilities | ||
Payables | 1,182.0 | |
Interest bearing liabilities | 2,063.4 | |
Current tax liabilities | 15.8 | |
Deferred tax liabilities | 353.2 | |
Other provisions | 55.7 | |
Other liabilities | 10.9 | |
3,681.0 | ||
Net Assets Acquired | 1,870.1 | |
| 1 | WMC Resources issued 1,505,907,806 shares to Alumina Limited (formerly WMC Limited) as consideration for all entities acquired. The value of the consideration was determined by reference to the fair values of the assets acquired. |
| 2 | Values are at acquisition date of 30 November 2002. |
December 2002 Preliminary Final ASX Report
Table of Contents

Loss of control of entities having material effect
| 12.1 | There were no material losses of control. |
Dividends
| 13.1 | No dividend has been declared for the year ended 31 December 2002. |
Refer to Change in Accounting Policy note on page 19 for details of the change in the accounting policy on the provision for dividends.
Details of aggregate share of results of associates and joint venture entities
WMC Resources Ltd had no share in associates or joint venture entities for the year ended 31 December 2002.
Material interests in entities which are not controlled entities
WMC Resources Ltd has no interests in entities which are not controlled entities that are material to it.
December 2002 Preliminary Final ASX Report
Table of Contents

Issued and quoted securities at end of current period
Category of Securities | Number issued | Number quoted | |||||
14.1 | Ordinary shares | ||||||
Fully paid | 1,128,351,047 |
| 1,128,351,047 | ||||
14.2 | Changes during current period: | ||||||
a) increase in fully paid shares: | |||||||
i) In relation to capitalisation of debt and acquisition of entities | 2,477,751,485 |
| |||||
ii) following exercise of options | 947,050 |
| |||||
b) decrease in fully paid shares following share consolidation as part of WMC demerger | (2,150,347,488 | ) | |||||
Net increase in fully paid shares | 328,351,047 |
| 328,351,047 | ||||
14.3 | Unquoted employee options to acquire fully paid ordinary shares | Number issued | Number Quoted | Exercise Price | Expiry Date | |||||
375,000 | Nil | $2.49 | 21 December 2003 | |||||||
926,220 | Nil | $2.26 | 21 December 2003 | |||||||
3,748,100 | Nil | $3.90 | 20 December 2004 | |||||||
5,918,100 | Nil | $3.48 | 18 December 2005 | |||||||
9,981,900 | Nil | $4.33 | 30 November 2006 | |||||||
600,000 | Nil | $4.33 | 30 November 2006 | |||||||
10,951,860 | Nil | $4.34 | 23 December 2007 | |||||||
32,501,180 | ||||||||||
14.4 | Issued during the current period | 451,300 | Nil | $2.27 | 22 December 2002 | |||||
250,000 | Nil | $2.50 | 22 December 2002 | |||||||
375,000 | Nil | $2.49 | 21 December 2003 | |||||||
963,120 | Nil | $2.26 | 21 December 2003 | |||||||
3,868,000 | Nil | $3.90 | 20 December 2004 | |||||||
6,007,050 | Nil | $3.48 | 18 December 2005 | |||||||
10,060,500 | Nil | $4.33 | 30 November 2006 | |||||||
600,000 | Nil | $4.33 | 30 November 2006 | |||||||
10,951,860 | Nil | $4.34 | 23 December 2007 | |||||||
33,526,830 | ||||||||||
14.5 | Exercised during the current period | 451,300 | Nil | $2.27 | 22 December 2002 | |||||
250,000 | Nil | $2.50 | 22 December 2002 | |||||||
36,900 | Nil | $2.26 | 21 December 2003 | |||||||
119,900 | Nil | $3.90 | 20 December 2004 | |||||||
88,950 | Nil | $3.48 | 18 December 2005 | |||||||
947,050 | ||||||||||
14.6 | Expired/lapsed during the current period | |||||||||
78,600 | Nil | $4.33 | 30 November 2006 | |||||||
December 2002 Preliminary Final ASX Report
Table of Contents

(a) Business segments
Year ended 31 Dec 2002? $ million | |||||||||||
Group consolidation | Copper/ uranium | Nickel | Fertilizer | Consolidated | |||||||
Revenue | |||||||||||
Segment revenues1 | 164.0 |
| 1,330.1 | 20.9 |
| 1,515.0 |
| ||||
Unallocated corporate revenues | 76.6 |
| |||||||||
Less insurance proceeds received/receivable | (63.1 | ) | |||||||||
Less proceeds from disposal of non-current assets | (62.7 | ) | |||||||||
Less other income | (9.5 | ) | |||||||||
Operating revenues | 1,456.3 |
| |||||||||
Result | |||||||||||
Segment result | 73.4 |
| 273.9 | (7.3 | ) | 340.0 |
| ||||
Unallocated profit on sale of gold royalty | 15.4 |
| |||||||||
Unallocated corporate expenses: | |||||||||||
New business | (18.5 | ) | |||||||||
Regional exploration | (11.3 | ) | |||||||||
Corporate (including demerger costs) | (113.6 | ) | |||||||||
Finance and other costs | (4.0 | ) | |||||||||
Net borrowing costs ($5.5m external, $399.7m inter-group) | (405.2 | ) | |||||||||
Loss from ordinary activities before income tax expense | (197.2 | ) | |||||||||
Income tax credit | 153.5 |
| |||||||||
Net loss after tax | (43.7 | ) | |||||||||
Depreciation and amortisation | 19.2 |
| 209.6 | 3.9 |
| 232.7 |
| ||||
Unallocated | 8.2 |
| |||||||||
240.9 |
| ||||||||||
Other non-cash expenses | 1.7 |
| 49.8 | 1.2 |
| 52.7 |
| ||||
1 Segment revenues include currency and commodity hedging and intermediate product sales. Inter segment sales are insignificant. Currency and commodity hedging is allocated to business units as follows: | |||||||||||
Currency and commodity hedging gain/(loss) (December month only) | (0.4 | ) | 0.5 | 0.1 |
| 0.2 |
| ||||
Prior to the demerger, the hedging activities were conducted in an entity outside the WMC Resources’ group.
December 2002 Preliminary Final ASX Report
Table of Contents

Segment Information
(a) Business segments (continued)
Year ended 31 Dec 2002 $ million | ||||||||
Group consolidation | Copper/ uranium | Nickel | Fertilizer | Consolidated | ||||
Assets | ||||||||
Segment assets | 4,146.2 | 1,696.0 | 720.6 | 6,562.8 | ||||
Unallocated corporate assets | 785.3 | |||||||
Consolidated total assets | 7,348.1 | |||||||
Liabilities | ||||||||
Segment liabilities | 450.0 | 286.0 | 75.9 | 811.9 | ||||
Unallocated corporate liabilities | 2,929.6 | |||||||
Consolidated total liabilities | 3,741.5 | |||||||
Acquisitions of non-current assets1 | ||||||||
Upon acquisition of entities | 3,738.8 | — | 538.4 | 4,277.2 | ||||
Other acquisitions of non-current assets | 26.8 | 192.9 | 7.2 | 226.9 | ||||
Unallocated corporate acquisitions (including upon acquisition of entities) | 134.6 | |||||||
4,638.7 | ||||||||
| 1 | Comprises acquisitions of Property, plant and equipment, Exploration and evaluation expenditure, Mine properties under development and Acquired mineral rights. |
Description of business segments
Copper/uranium | Exploration, development, mining and refining of copper, uranium, silver and gold in South Australia. | |
Nickel | Exploration, development, mining, smelting and refining of nickel in Western Australia. | |
Fertilizers | Production of fertilizer product in Phosphate Hill, Queensland and distribution of fertilizer products via Hi-Fert. | |
(b) Geographical segments
Group consolidation | Year ended 31 Dec 2002 $millions | |||||||||||
Australia | North America | Europe | Japan | Other | Total | |||||||
Segment revenue by location of customer | 98.0 | 197.6 | 635.7 | 250.6 | 274.4 | 1,456.3 | ||||||
WMC Resources Ltd’s assets are primarily located within Australia. Capital expenditure and depreciation is all also incurred primarily in Australia.
December 2002 Preliminary Final ASX Report
Table of Contents

Background, Presentation and Basis of financial report preparation
Background
Prior to 2 December 2002, WMC Resources Ltd was a wholly owned subsidiary of Alumina Limited (formerly WMC Limited). The principal business of the company, and its sub group, was the mining, processing and marketing of nickel ore, concentrates, matte and metals. On 2 December 2002, Alumina Limited distributed to its shareholders all of its interest in WMC Resources Ltd through a scheme of arrangement and capital reduction and dividend (“the demerger”).
Prior to effecting the demerger, through a series of transactions internal to the WMC Limited Group, WMC Resources Ltd acquired WMC Limited’s shares in the legal entities which held the copper/uranium and fertilizer businesses, WMC Finance Limited, WMC Finance (USA) Ltd as well as WMC Limited’s exploration and development interests other than those relating to AWAC. These acquisitions were made at fair value in return for shares in WMC Resources Ltd. To consummate the demerger, WMC Limited effected a capital reduction and dividend to its shareholders in an amount equivalent to the value of WMC Resources Ltd after the internal transfers were completed. The entitlement of WMC Limited’s shareholders to the capital reduction and dividend was ultimately satisfied in the demerger through the distribution to WMC Limited’s shareholders of shares in WMC Resources Ltd on a one-for-one basis.
Presentation of financial report
As part of the demerger, WMC Resources Ltd, which already held the nickel businesses and other corporate activities, acquired WMC Limited’s copper/uranium and fertilizer businesses, two finance vehicles as well as exploration and development interests.
In compliance with Australian Accounting Standards and the Corporations Act 2001, the Directors are required to present the accounts for the year ending 31 December 2002 on the basis that WMC Resources acquired the copper and fertilizer businesses and financing vehicles as of the demerger. Therefore, the financial statements as presented on pages 2 to 17 reflect the results of the nickel operations and corporate activities for the full financial year but only include the results of the copper/uranium, fertiliser and finance activities for one month. In addition, as WMC Resources Ltd has borne all the demerger costs they are reflected in these accounts.
For illustrative purposes and to assist shareholders in understanding the combined performance of WMC Resources Ltd and the businesses it acquired as compared with the forecast contained in the Scheme Booklet dated 28 October 2002, aSpecial Purpose Report, being the comparison of Scheme Booklet pro forma financial results with pro forma historical results for the year ended 31 December 2002 has been lodged with the ASX together with the Preliminary Final ASX Report.
The pro forma information is provided in addition to, and not in substitution for, the statutory financial information provided by WMC Resources Ltd in the financial reports prepared in accordance with the Corporations Act 2001 (Cth) for the year ended 31 December 2002.
Basis of preparation
This general purpose financial report is for the year ended 31 December 2002, and has been prepared in accordance with the Australian Stock Exchange Listing Rules as they relate to Appendix 4B and in accordance with Accounting Standards other mandatory professional reporting requirements (Urgent Issues Group Consensus Views) and the Corporations Act 2001. It is recommended that this report be read in conjunction with and any public announcements made by WMC Resources Ltd and its controlled entities during the reporting period in accordance with the continuous disclosure requirements of the Corporations Act 2001.
The preparation of financial statements in conformity with generally accepted accounting principles (GAAP) requires management to make estimates and assumptions that affect the reported amounts of assets and liabilities and disclosure of contingent assets and liabilities at the dates of the financial statements and the reported amounts of revenues and expenses during the reporting periods. Actual results could differ from those estimates.
The accounting policies adopted are consistent with those of the previous financial year, other than as disclosed below.
It is prepared in accordance with the historical cost convention.
December 2002 Preliminary Final ASX Report
Table of Contents

Provision for dividends
The Company has applied AASB 1044Provisions, Contingent Liabilities and Contingent Assets (issued October 2001) for the first time from 1 January 2002 in accordance with a written election by the directors under subsection 334(5) of the Corporations Act 2001. In accordance with this new standard, provisions are recognised for the amount of any dividend declared, determined or publicly recommended by the directors on or before the end of the period but not distributed at balance date.
In previous periods, in addition to providing for the amount of any dividends declared, determined or publicly recommended by the directors on or before the end of the period but not distributed at balance date, a provision was also made for dividends to be paid out of retained profits where the dividend was proposed, recommended or declared between the end of the period and the completion of the financial report.
As the company has applied class order 98/1416, no restatement of consolidated retained profits and total dividends provided for or paid (showing the information that would have been disclosed had the new accounting policy always been applied) has been provided.
Comparatives
WMC Resources Ltd is granted relief pursuant to Australian Securities and Investment Commission (ASIC) Class Order 98/1416 dated 29 July 1998 from disclosing comparative information for the preceding financial year as required by Australian Accounting Standard. This relief is granted on the basis that WMC Resources Ltd was not required to prepare accounts in the preceding financial year pursuant to ASIC Class Order 98/1418 as the company was a member of a “Closed Group” and party to a deed of cross guarantee which was lodged with, and approved by, ASIC.
December 2002 Preliminary Final ASX Report
Table of Contents

Review of Operations and comments by Directors
The financial statements as presented on pages 2 to 17, reflect the results of the nickel operations and corporate activities for the full financial year but only include the results of the copper/uranium, fertilizer, exploration and finance activities for one month. In addition, as WMC Resources has borne all the demerger costs they are reflected in these accounts.
Financial Result — WMC Resources Ltd
The consolidated group loss after income tax was $43.7 million for the financial year. The result includes contributions from copper-uranium and fertilizer businesses, exploration and financing activities from 1 December 2002.
The contribution from operating businesses is set out in page 16. Nickel revenues benefited from higher realized prices and stronger sales volumes of concentrate and nickel metal, partly offset by reduced matte sales. LME spot nickel prices averaged US$3.07 per pound in 2002, 14% higher than the 2001 average of US$2.70 per pound. The weaker US dollar relative to the Australian dollar impacted Australian dollar nickel price averages, rising only 3% from the average 2001 price of A$5.41 per pound to A$5.55 in 2002. The benefit of stronger revenues was offset by higher total cost of sales primarily reflecting increased concentrate purchased from third parties.
Copper and Fertilizer revenue only reflects December sales. Copper revenue includes an insurance receivable of $58 million.
The net borrowing costs of $405.2 million are high—this is due to net inter-group interest charges. Ordinarily these charges would eliminate on consolidation, however, as the Finance entities only became part of the WMC Resources group effective 30 November 2002, there is a mis-match in the current year, which will not occur in subsequent years.
The result has been impacted by a number of significant items:
| • | recognition of a $58 million insurance receivable in relation to the fire at the Olympic Dam solvent extraction plant in October 2001, less idle capacity charge for the month of December ($5.2m). The net addition to net profit after tax was $37.0 million; |
| • | sale for $45 million of the right to gold royalty from the sale of St Ives and Agnew Operation. The net profit after tax was $15.4 million; |
| • | sale of the Long/Victor nickel mines at Kambalda for $14.0 million. The net profit after tax was $9.4 million; |
| • | non-recurring expenditure associated with the demerger of $51.2 million. The impact on earnings after tax was $35.8 million; and |
| • | tax credit of $76.8 million relating to an over-provision for tax on disposal of assets in 2001. |
The result also includes a number of smaller non-recurring charges in respect of lease commitments, redundancies and additional rehabilitation charges for non-operating sites.
At 31 December 2002, net assets were $3,607 million including net debt of $1,567 million. The gearing ratio (measured as net debt / net debt and equity) was 30.3%. WMC Resources’s debt profile is predominantly short-term at 31 December 2002 immediately following the demerger. The profile will be lengthened in 2003. The refinancing program is currently underway.
December 2002 Preliminary Final ASX Report
Table of Contents

Business Development
On 9 December 2002, WMC announced that it had agreed to acquire 100% of the Corridor Sands titanium dioxide project from Southern Mining Corporation Limited. The net cost of the acquisition is payable in two tranches. Conditions precedent for the first tranche, satisfied through the issue of shares in both WMC Resources and Alumina, were satisfied on 31 January 2002. The final tranche of the purchase price, which will be up to US$25 million to be paid in shares or cash, is to be made before the end of 2003.
A feasibility study completed in the third quarter of 2002 confirmed that the Corridor Sands titanium dioxide resource is capable of supporting the development of a large, long life, profitable and growing business. Since the announcement of the agreement, a number of parties have expressed interest in joining the company in developing the project.
The most advanced exploration project is West Musgrave (Australia) — the target is nickel/copper.
Hedging
As a result of previous price risk management undertaken for the Company, the total revenue for the month of December 2002, which would otherwise have been realised, was decreased by $0.5 million for currency hedging and increased by $0.7 million for gold price hedging. Prior to demerger the hedging activities were conducted in the finance entities which were outside the WMC Resources group.
On demerger, the hedge contracts held by the finance companies were marked to market (fair value) on the date of demerger and deferred losses previously carried on WMC Limited balance sheet fair valued to zero. Consequently, the impact on revenue of any subsequent change in the exchange rate will be determined by reference to the fair value rate on demerger and the rate at date of the hedge maturity. From a cash flow perspective, the outflows will continue to be based on the original contract rates.
The Company has an existing currency hedge position that will be managed on an ongoing basis. For the 2003 year, US$258 million has been sold using limiting cover at an average cash rate of A$/US$ 0.6735 (average profit and loss rate A$/US$ 0.5535).
A total of 85,028 ounces of gold is hedged for 2003 at an average cash price of $547 an ounce (profit and loss price of $580 an ounce).
There are no outstanding copper or nickel hedge positions for 2002.
The full hedge position is disclosed in the annual financial statements. There are no off balance sheet positions.
Dividend franking credits
No dividend has been declared for the year ended 31 December 2002.
In the short term, WMC Resources Ltd is not expected to generate franking credits due to the utilisation of tax losses, which total approximately $1,913 million as at 31 December 2002. Accordingly, the company is not expected to be able to pay franked dividends in the short-term.
Native Title
The majority of the WMC Resources group’s interests fall within one or more Applications for Native Title Determination. The applications are filed for hearing in the Federal Court of Australia. The WMC Resources group cannot make any assessment whether existing assets or operations will be materially affected until it is determined what rights, if any, the applicants are entitled to. Recent decisions of the High Court indicate that each claim will be decided on its facts.
Consideration of the implications of Court Determinations make it evident there are complex legal and factual issues potentially affecting existing and future WMC Resources interests. Accordingly, the impact of these developments cannot be determined at this time, although it is indicated that no native title rights reside in minerals where valid state legislation has placed minerals in Crown ownership.
Events subsequent to balance date
There has not arisen in the interval between the end of the financial year and the date of this report any item, transaction or event of a material and unusual nature which in the opinion of the directors has or may significantly affect the operations of the group, the results of those operations, or the state of affairs of the group, in future financial years.
December 2002 Preliminary Final ASX Report
Table of Contents

The Annual General Meeting of WMC Resources Ltd will be held as follows:
| Place: | Regent Theatre, 191 Collins Street, Melbourne |
| Date: | 2 May 2003 |
| Time: | 10:00 am |
The 2002 Annual Report of WMC Resources Ltd will be available approximately 31 March 2003.
| 1. | This report has been prepared in accordance with AASB standards, other AASB authoritative pronouncements and Urgent Issues Group Consensus Views. |
| 2. | This report gives a true and fair view of the matters disclosed. |
| 3. | This report is based on financial statements which have been audited. |
| 4. | WMC Resources Ltd has a formally constituted audit committee. |
P J HORTON | 26 February 2003 | |
COMPANY SECRETARY | DATE |
December 2002 Preliminary Final ASX Report
Table of Contents

WMC RESOURCES LTD
SPECIAL PURPOSE REPORT
Comparison of
Scheme Booklet pro forma forecast results
to
pro forma historical results
for the year ended 31 December 2002
IMPORTANT NOTICE: The information contained in this report has been prepared to assist shareholders in understanding the combined performance of WMC Resources Ltd and the businesses it acquired in December 2002 as compared with the forecast contained in the WMC Limited demerger Scheme Booklet dated 28 October 2002. This pro forma information is provided in addition to, and not in substitution for, the statutory financial information provided by WMC Resources Ltd in its financial reports prepared in accordance with theCorporations Act 2001 (Cth) for the year ended 31 December 2002.
Table of Contents

Contents
INTRODUCTION | 1 | |
BASIS OF PREPARATION | 1 | |
DISCUSSION OF 2002 PRO FORMA HISTORICAL v PRO FORMA FORECAST RESULTS | 2 | |
Overview | 2 | |
Nickel (2002 Pro Forma Historical v Forecast) | 5 | |
Copper / Uranium (2002 Pro Forma Historical v Forecast) | 6 | |
Fertilizer (2002 Pro Forma Historical v Forecast) | 7 | |
DISCUSSION OF 2002 v 2001 PRO FORMA HISTORICAL RESULTS | 8 | |
Overview | 8 | |
Nickel | 8 | |
Copper / Uranium | 9 | |
Fertilizer | 9 | |
DISCUSSION OF 2002 PRO FORMA HISTORICAL v PRO FORMA FORECAST CASH FLOWS | 10 | |
RECONCILIATION TO 2002 STATEMENT OF FINANCIAL PERFORMANCE | 11 | |
RECONCILIATION OF 2002 PRO FORMA HISTORICAL INCOME TAX BENEFIT | 12 | |
INDEPENDENT REVIEW REPORT TO MEMBERS OF WMC RESOURCES LTD | 13 | |
TABLES | ||
Table 1 – Pro forma Combined Results of WMC Resources Ltd | 4 | |
Table 2 – Nickel | 6 | |
Table 3 – Copper / Uranium | 7 | |
Table 4 – Fertilizer | 8 | |
Table 5 – Pro forma Combined Cash Flows of WMC Resources Ltd | 11 | |
Table 6 – Reconciliation of 2002 Pro forma Results to 2002 Statement of Financial Performance | 12 | |
Table 7 – Reconciliation of 2002 Pro forma Historical Income Tax Benefit | 13 |
Table of Contents

INTRODUCTION
The demerger of WMC Limited into two separate ASX listed entities, WMC Resources Ltd and Alumina Limited, was implemented in December 2002 with an effective date for accounting of 30 November 2002. As a result, WMC Resources Ltd now holds all of WMC Limited’s non-alumina assets (ie the nickel, copper / uranium and fertilizer businesses, and the exploration and development interests, including the finance companies holding assets and liabilities relating to these operations). WMC Limited, which has now changed its name to ‘Alumina Limited’, continues to hold the 40% interest in the Alcoa World Alumina and Chemicals (AWAC) joint venture.
A Scheme Booklet, setting out all the significant elements of the demerger, was forwarded to WMC Limited shareholders prior to the date of the meetings held to approve the demerger. Included in the Scheme Booklet were WMC Resources Ltd’s pro forma forecast results for the year ended 31 December 2002. This Special Purpose Report contains a comparison of WMC Resources Ltd’s 2002 pro forma historical results, to both pro forma forecast results for the 2002 year and pro forma historical results for the 2001 year.
The pro forma results set out in this Special Purpose Report are not a substitute for the WMC Resources Ltd consolidated financial report for the year ended 31 December 2002, a copy of which is set out on our websitewww.wmc.com or can be obtained by telephoning +61(0)3 9685 6000.
BASIS OF PREPARATION
The basis of preparation of the pro forma results and cash flows set out in this Special Purpose Report is described more fully in notes 2 and 3 to the Pro Forma Combined Results (Table 1) and the Pro Forma Combined Cash Flows (Table 5) on pages 4 and 11 respectively, and is consistent with that of the Scheme Booklet. Certain forecast information was not presented in the Scheme Booklet to the same level of detail as the historical information provided in this Special Purpose Report. Accordingly, where the level of detail was not provided in the Scheme Booklet, it is designated (“N/A”) in the relevant section of the tables in this Special Purpose Report.
| (i) | Basis of combination |
The Pro Forma Combined Results and Cash Flows of WMC Resources Ltd, set out in this Special Purpose Report, have been prepared on a consolidated entity basis for WMC Resources Ltd and its controlled entities and assumes the entities acquired by WMC Resources Ltd as part of the demerger (principally the copper/uranium and fertilizer businesses and the finance companies) were controlled entities for the full periods reported, i.e. from 1 January 2001.
| (ii) | Impact of demerger transactions |
The transactions that occurred in conjunction with the demerger and the manner in which the demerger was implemented will have an effect on WMC Resource Ltd’s results from operations and financial position in future years relative to its historical results and financial position. This Special Purpose Report has been prepared as if the following transactions and events had occurred at 1 January 2002:
| • | The copper/uranium, fertiliser assets and international exploration assets and business were acquired at their fair value as required under Australian generally accepted accounting principles. The fair value adjustments, principally copper/ uranium (uplift) and fertiliser (write down) impacts on the carrying values in the balance sheet and consequently results in net higher amortisation charges compared with prior periods but with no cash flow implications; |
| • | overall level of debt was reduced and higher yield long dated securities repurchased and refinanced with consequently lower interest charges in future years; |
| • | derivative and financial instruments (primarily the hedge book) were fair valued at the forward price prevailing at demerger date. This resulted in the extinguishment of deferred hedge losses with future gains and losses being determined with reference to the new base exchange rate of 0.5608. This does not impact the underlying contract prices, which continue to be cash flow negative at exchange rates up to around 0.6200 as indicated in the Scheme Booklet; and |
| • | demerger costs of around $130 million have been borne by WMC Resources Ltd. Some of these have been capitalised into asset values increasing future depreciation and amortisation charges. |
| (iii) | Non-recurring items |
The pro forma results and cash flows have been adjusted for certain non-recurring items which are detailed in Reconciliation of 2002 Pro Forma Results to 2002 Statement of Financial Performance (Table 6).
Table of Contents

DISCUSSION OF 2002 PRO FORMA HISTORICAL v PRO FORMA FORECAST RESULTS
Overview
Pro forma net profit for WMC Resources Ltd of A$75.4 million was in line with the Scheme Booklet forecast of A$73.0 million.
Pro forma revenue (excluding hedging) of A$2,689.9 million for 2002 was above the forecast of A$2,650.5 million due to:
| • | higher realised nickel prices |
| • | increased fertilizer sales volumes, and |
| • | increased third party power sales |
offset by:
| • | lower realised copper, uranium and DAP prices, and |
| • | reduced gold sales volumes |
Pro forma EBITDA (excluding hedging) of A$663.1 million for 2002 was 3.0% below the forecast of A$683.4 million due to:
| • | the affect of the lower realised copper and uranium prices exceeding the benefit of the increased copper sales |
| • | increased purchases of nickel concentrate feed and royalty expenses resulting in Nickel’s EBITDA being A$4 million below forecast |
| • | Queensland Fertilizer Operation’s lower realised DAP prices exceeding the benefit of the increased production and sales volumes |
| • | higher corporate costs, up A$8 million, principally due to replacement of the executive share option plan with a fully expensed replacement compensation plan |
offset by:
| • | reduced exploration and project expenditure from targeted exploration and reduced joint venture contributions to Corridor Sands pending the new ownership arrangements |
Pro forma amortisation and depreciation of A$519.3 million in 2002 was $20.0 million below forecast with the variance emanating principally from the Nickel Business Unit where lower mine development amortisation was recorded commensurate with lower mine production at Mt Keith and Leinster.
The exchange rate at which the currency hedge contracts were fair valued at the time of the demerger (0.5608) was lower than the rate for the forecast (0.5664), resulting in the pro forma currency and commodity hedging losses of A$12.5 million being A$11.1 million less than the forecast loss of A$23.6 million. This resulted in a pro forma EBIT of A$131.3 million, $10.8 million above the pro forma forecast.
Pro forma borrowing costs of A$57.4 million were marginally above forecast due to a higher net debt balance as a result of increased capital expenditure and increased working capital. This in conjunction with a marginally lower tax benefit resulted in a pro forma net profit of A$75.4 million, A$2.4 million above the pro forma forecast.
Table of Contents

PRO FORMA COMBINED RESULTS OF WMC RESOURCES LTD (Table 1)(1) | PRO FORMA HISTORICAL | PRO FORMA FORECAST | |||||||||||||
(A$ Million) | Full Year(3) 2001 | 1st Half(2) 2002 | 2nd Half(2) 2002 | Full Year(2) 2002 | Full Year(2)(4) 2002 | ||||||||||
Nickel | 1,342.4 |
| 628.5 |
| 744.0 |
| 1,372.5 |
| 1,361.6 |
| |||||
Copper / Uranium | 913.2 |
| 344.2 |
| 420.8 |
| 765.0 |
| 771.7 |
| |||||
Fertilizer | 382.4 |
| 277.7 |
| 154.9 |
| 432.6 |
| 426.0 |
| |||||
Sales revenue | 2,638.0 |
| 1,250.4 |
| 1,319.7 |
| 2,570.1 |
| 2,559.3 |
| |||||
Revenue received/receivable from insurance claims(5) | 23.1 |
| 35.0 |
| 50.3 |
| 85.3 |
| 80.0 |
| |||||
Other revenue from outside the operating activities | 66.7 |
| 16.6 |
| 17.9 |
| 34.5 |
| 11.2 |
| |||||
PRO FORMA REVENUE | 2,727.8 |
| 1,302.0 |
| 1,387.9 |
| 2,689.9 |
| 2,650.5 |
| |||||
Nickel | 510.9 |
| 221.6 |
| 245.2 |
| 466.8 |
| 470.9 |
| |||||
Copper / Uranium | 404.5 |
| 142.1 |
| 154.9 |
| 297.0 |
| 302.9 |
| |||||
Fertilizer | 6.1 |
| 22.4 |
| (7.2 | ) | 15.2 |
| 26.9 |
| |||||
Corporate | (37.3 | ) | (21.9 | ) | (31.5 | ) | (53.4 | ) | (43.8 | ) | |||||
Exploration, New Projects and Other | (108.8 | ) | (35.6 | ) | (26.9 | ) | (62.5 | ) | (73.5 | ) | |||||
PRO FORMA EBITDA | 775.4 |
| 328.6 |
| 334.5 |
| 663.1 |
| 683.4 |
| |||||
Amortisation | 168.3 |
| 87.5 |
| 80.1 |
| 167.6 |
| 186.1 |
| |||||
Depreciation | 312.9 |
| 176.4 |
| 167.6 |
| 344.0 |
| 344.1 |
| |||||
Amortisation and depreciation on fair value adjustments(6) | — |
| 3.8 |
| 3.9 |
| 7.7 |
| 9.1 |
| |||||
PRO FORMA EBIT (pre hedging) | 294.2 |
| 60.9 |
| 82.9 |
| 143.8 |
| 144.1 |
| |||||
Nickel | 288.4 |
| 112.7 |
| 145.0 |
| 257.7 |
| 247.0 |
| |||||
Copper / Uranium | 222.6 |
| 10.7 |
| 30.5 |
| 41.2 |
| 45.8 |
| |||||
Fertilizer | (59.9 | ) | 1.7 |
| (29.6 | ) | (27.9 | ) | (19.6 | ) | |||||
Corporate | (43.6 | ) | (26.3 | ) | (35.3 | ) | (61.6 | ) | (53.5 | ) | |||||
Exploration, New Projects and Other | (113.3 | ) | (37.9 | ) | (27.7 | ) | (65.6 | ) | (75.6 | ) | |||||
PRO FORMA EBIT (pre hedging) | 294.2 |
| 60.9 |
| 82.9 |
| 143.8 |
| 144.1 |
| |||||
Net currency and commodity hedging gains/(losses)(7) | (290.9 | ) | (10.0 | ) | (2.5 | ) | (12.5 | ) | (23.6 | ) | |||||
PRO FORMA EBIT | 3.3 |
| 50.9 |
| 80.4 |
| 131.3 |
| 120.5 |
| |||||
Net borrowing costs(8) | N/A |
| (30.4 | ) | (27.0 | ) | (57.4 | ) | (54.5 | ) | |||||
PRO FORMA PROFIT before income tax expense | N/A |
| 20.5 |
| 53.4 |
| 73.9 |
| 66.0 |
| |||||
Income tax benefit/(expense) | N/A |
| 8.6 |
| (7.1 | ) | 1.5 |
| 7.0 |
| |||||
PRO FORMA NET PROFIT | N/A |
| 29.1 |
| 46.3 |
| 75.4 |
| 73.0 |
| |||||
Table of Contents

Notes to Table 1
| (1) | The Pro Forma Combined Results of WMC Resources Ltd, set out in Table 1, have been prepared on a consolidated entity basis for WMC Resources Ltd and its controlled entities and assume the entities acquired by WMC Resources Ltd as part of the demerger (principally the copper / uranium and fertilizer businesses and the finance companies) were controlled entities for the full periods reported, i.e. from 1st January 2001. |
| (2) | The 2002 half and full year pro forma historical and forecast results have been prepared as if the following transactions and events, which took place on or before the demerger, had occurred as at 1st January 2002: |
| • | The allocation of approximately A$600 million of existing debt and A$23 million of cash from WMC Resources Ltd to Alumina Limited; |
| • | The measurement at fair value of the subsidiaries acquired by WMC Resources Ltd (principally the copper / uranium and fertilizer businesses and the finance companies); and |
| • | Payment of stamp duty costs by WMC Resources Ltd in acquiring the subsidiaries. |
| (3) | The 2001 full year pro forma historical results are as per “Table 1 — PRO FORMA CONSOLIDATED RESULTS OF WMC RESOURCES” on pages 122 and 123 of the Scheme Booklet. They were extracted from WMC Limited’s audited financial statements for the year ended 31 December 2001 by excluding: |
| • | The results of entities comprising the Alumina Limited Group following the demerger and the equity accounted share of profits from AWAC; |
| • | Gains and losses on the disposal of discontinued operations; |
| • | The revenues and costs (including hedging losses) of discontinued operations; and |
| • | The impact of non-recurring items as follows: |
| – | $71.8 million write-off of assets and costs associated with the fire at the Olympic Dam solvent extraction circuits. |
| – | $21.5 million cost of redundancies and closure costs associated with the restructuring of the service and exploration functions. |
| (4) | The 2002 full year pro forma forecast results are as per “Table 1 — PRO FORMA CONSOLIDATED RESULTS OF WMC RESOURCES” on pages 122 and 123 of the Scheme Booklet. |
| (5) | The pro forma revenue from insurance claims in 2002 includes A$80 million in relation to an insurance claim for lost production and sales in relation to the fire in the copper and uranium solvent extraction circuits at Olympic Dam in October 2001. Further insurance claim revenue of A$40 million in relation to the rebuild of the solvent extraction circuits is not included in either the historical or forecast revenue on the basis that it is a claim with respect to plant and equipment and is non-recurring. |
| (6) | The pro forma amortisation and depreciation on the fair value adjustments resulting from the acquisition of Olympic Dam and the Queensland Fertilizer Operations commence on 1st January 2002, on the assumption that the transactions that gave rise to the demerger took place on that day. |
| (7) | The currency hedge contracts acquired by WMC Resources Ltd as a result of the demerger were fair valued to the market US Dollar / Australian Dollar exchange rate at the time of the demerger. |
| The 2002 pro forma historical and forecast results assume that the fair value adjustment occurred on 1st January 2002. The 2002 historical currency and commodity loss has been determined by comparing the actual exchange rate on the date the contracts matured during 2002 to the fair value adjustment rate of 0.5608. |
| The forecast currency and commodity loss for the 1st half of 2002 was determined by comparing the actual exchange rate on the date the contracts matured during the period to the market exchange rate at 30 June 2002 (0.5664). The forecast currency and commodity loss for the 2nd half of 2002 was determined by comparing the forecast exchange rate for the period (0.5500) to the rates used to determine the forecast fair value of the hedges as at 30 June 2002 ( based on 0.5664). |
| (8) | Approximately A$600 million of existing debt and A$23 million of cash was allocated from WMC Resources Ltd to Alumina Limited at the time of the demerger. The pro forma net borrowing costs assume the net A$577 million allocation occurred on 1st January 2002. |
Table of Contents

Nickel (2002 Pro Forma Historical v Forecast)
Nickel’s pro forma revenue of A$1,377.8 million for 2002 was marginally in excess of the A$1,361.6 million forecast principally as a result of realised A$ nickel prices being over 1% higher than forecast. A A$5.5 million increase in total cost of sales, partially price driven by higher purchased feed and royalty expenses net of a reduced amortisation charge (from lower production at Mt Keith), resulting in a pro forma EBIT (pre hedging) of A$257.7 million, A$10.7 million above forecast.
NICKEL (Table 2) | PRO FORMA HISTORICAL | PRO FORMA FORECAST | |||||||||||||
Full Year 2001 | 1st Half 2002 | 2nd Half 2002 | Full Year 2002 | Full Year 2002 | |||||||||||
(A$ Million) | |||||||||||||||
PRO FORMA RESULTS | |||||||||||||||
Nickel — Revenue | 1,148.6 |
| 541.5 |
| 664.9 |
| 1,206.4 |
| N/A |
| |||||
Intermediate Products | 107.0 |
| 48.8 |
| 41.4 |
| 90.2 |
| N/A |
| |||||
Commodity Trading Revenue | 86.8 |
| 38.2 |
| 37.7 |
| 75.9 |
| N/A |
| |||||
Sales Revenue | 1,342.4 |
| 628.5 |
| 744.0 |
| 1,372.5 |
| 1,361.6 |
| |||||
Revenue received/receivable from insurance claims | — |
| — |
| 4.9 |
| 4.9 |
| N/A |
| |||||
Other | — |
| 0.4 |
| — |
| 0.4 |
| N/A |
| |||||
PRO FORMA REVENUE | 1,342.4 |
| 628.9 |
| 748.9 |
| 1,377.8 |
| 1,361.6 |
| |||||
CASH COSTS | |||||||||||||||
Production (Cash) | (473.8 | ) | (236.5 | ) | (260.0 | ) | (496.5 | ) | N/A |
| |||||
Purchased Feed (Cash) | (142.0 | ) | (109.0 | ) | (89.2 | ) | (198.2 | ) | N/A |
| |||||
Non-Production (Cash) | (129.5 | ) | (72.1 | ) | (75.0 | ) | (147.1 | ) | N/A |
| |||||
Commodity Trading Expenses | (86.0 | ) | (38.1 | ) | (37.7 | ) | (75.8 | ) | N/A |
| |||||
NON CASH COSTS | |||||||||||||||
Production (Non-Cash) | (218.6 | ) | (106.6 | ) | (101.0 | ) | (207.6 | ) | N/A |
| |||||
Non-Production (Non-Cash) | (35.9 | ) | (27.4 | ) | (21.7 | ) | (49.1 | ) | N/A |
| |||||
Change in Stock | 31.8 |
| 73.5 |
| (19.3 | ) | 54.2 |
| N/A |
| |||||
PRO FORMA TOTAL COST OF SALES | (1,054.0 | ) | (516.2 | ) | (603.9 | ) | (1,120.1 | ) | (1,114.6 | ) | |||||
PRO FORMA EBIT (pre hedging) | 288.4 |
| 112.7 |
| 145.0 |
| 257.7 |
| 247.0 |
| |||||
Currency & Commodity Hedging | (141.5 | ) | (5.0 | ) | (1.8 | ) | (6.8 | ) | N/A |
| |||||
PRO FORMA EBIT | 146.9 |
| 107.7 |
| 143.2 |
| 250.9 |
| N/A |
| |||||
OTHER PRO FORMA DATA | |||||||||||||||
Depreciation & Amortisation | 222.5 |
| 108.9 |
| 100.2 |
| 209.1 |
| 223.9 |
| |||||
Return on Net Assets (Annualised %) | 19.1 |
| 15.1 |
| 18.6 |
| 16.9 |
| N/A |
| |||||
Unit Cash Cost of Nickel Metal Production (A$/lb) | 1.81 |
| 2.02 |
| 2.24 |
| 2.13 |
| N/A |
| |||||
Unit Total Cost of Nickel Metal Sales (A$/lb) | 3.74 |
| 4.14 |
| 4.18 |
| 4.17 |
| N/A |
| |||||
Average Nickel Sales Price (excluding hedging)(A$/lb) | 5.41 |
| 5.28 |
| 5.79 |
| 5.55 |
| N/A |
| |||||
Average Nickel Sales Price (including hedging)(A$/lb) | 4.36 |
| 5.21 |
| 5.77 |
| 5.50 |
| N/A |
| |||||
CAPITAL EXPENDITURE | |||||||||||||||
Sustain | 45.4 |
| 15.4 |
| 29.5 |
| 44.9 |
| N/A |
| |||||
Enhance | 40.1 |
| 4.4 |
| 24.2 |
| 28.6 |
| N/A |
| |||||
Mine Capital Development | 117.7 |
| 56.0 |
| 62.2 |
| 118.2 |
| N/A |
| |||||
Capitalised Major Maintenance | 23.9 |
| 0.1 |
| 0.2 |
| 0.3 |
| N/A |
| |||||
Total Capital Expenditure | 227.1 |
| 75.9 |
| 116.1 |
| 192.0 |
| N/A |
| |||||
SALES VOLUMES – (‘000 tonnes) | |||||||||||||||
Nickel in Concentrate | 13.8 |
| 7.0 |
| 7.1 |
| 14.1 |
| 14.0 |
| |||||
Nickel in Matte | 34.6 |
| 9.5 |
| 16.2 |
| 25.7 |
| 25.0 |
| |||||
Metal | 61.1 |
| 31.0 |
| 33.8 |
| 64.8 |
| 66.0 |
| |||||
Total Nickel Sales Volume | 109.5 |
| 47.5 |
| 57.1 |
| 104.6 |
| 105.0 |
| |||||
Table of Contents

Copper / Uranium (2002 Pro Forma Historical v Forecast)
Copper / Uranium’s pro forma revenue of A$855.4 million was marginally below the forecast of A$861.7 million, with the variance almost entirely price driven. Lower gold sales volumes were offset by higher copper sales volumes. Total cost of sales of A$814.2 million were in line with forecast resulting in a pro forma EBIT (pre hedging) of A$41.2 million versus the A$45.8 million forecast.
COPPER / URANIUM (Table 3) | PRO FORMA HISTORICAL | PRO FORMA FORECAST | |||||||||||||
Full Year 2001 | 1st Half 2002 | 2nd Half 2002 | Full Year 2002 | Full Year 2002 | |||||||||||
(A$ Million) | |||||||||||||||
PRO FORMA RESULTS | |||||||||||||||
Copper, Uranium, Gold & Silver sales revenue | 913.2 |
| 344.2 |
| 420.8 |
| 765.0 |
| 771.7 |
| |||||
Revenue received/receivable from insurance claims | — |
| 45.0 |
| 45.4 |
| 90.4 |
| 90.0 |
| |||||
PRO FORMA REVENUE | 913.2 |
| 389.2 |
| 466.2 |
| 855.4 |
| 861.7 |
| |||||
CASH COSTS | |||||||||||||||
Production (Cash) | (423.9 | ) | (162.5 | ) | (182.7 | ) | (345.2 | ) | N/A |
| |||||
Non-Production (Cash) * | (79.2 | ) | (89.3 | ) | (76.6 | ) | (165.9 | ) | N/A |
| |||||
Finished Goods Purchased (Cash) | — |
| (23.9 | ) | (37.1 | ) | (61.0 | ) | N/A |
| |||||
NON CASH COSTS | |||||||||||||||
Production (Non-Cash) | (172.0 | ) | (99.4 | ) | (107.9 | ) | (207.3 | ) | N/A |
| |||||
Non-Production (Non-Cash) * | (7.1 | ) | (36.4 | ) | (26.9 | ) | (63.3 | ) | N/A |
| |||||
Change in Stock | (8.4 | ) | 33.0 |
| (4.5 | ) | 28.5 |
| N/A |
| |||||
PRO FORMA TOTAL COST OF SALES | (690.6 | ) | (378.5 | ) | (435.7 | ) | (814.2 | ) | (815.9 | ) | |||||
PRO FORMA EBIT (pre hedging) | 222.6 |
| 10.7 |
| 30.5 |
| 41.2 |
| 45.8 |
| |||||
Currency & Commodity Hedging | (102.9 | ) | (4.2 | ) | (1.1 | ) | (5.3 | ) | N/A |
| |||||
PRO FORMA EBIT | 119.7 |
| 6.5 |
| 29.4 |
| 35.9 |
| N/A |
| |||||
* Non-Production Costs includes Idle Capacity Charge of: | — |
| (56.9 | ) | (40.7 | ) | (97.6 | ) | N/A |
| |||||
OTHER PRO FORMA DATA | |||||||||||||||
Depreciation & Amortisation | 181.9 |
| 131.4 |
| 124.4 |
| 255.8 |
| 257.1 |
| |||||
Return on Net Assets (Annualised%) | 7.9 |
| 6.0 |
| 1.5 |
| 1.1 |
| N/A |
| |||||
Unit Cash Cost of Production (A$/lb) | 0.35 |
| 0.62 |
| 0.53 |
| 0.58 |
| N/A |
| |||||
Unit Total Cost of Sales (A$/lb) — Pro forma basis | 0.89 |
| 1.19 |
| 1.07 |
| 1.13 |
| N/A |
| |||||
Average Copper Sales Price (excluding hedging) (A$/lb) | 1.44 |
| 1.33 |
| 1.29 |
| 1.31 |
| N/A |
| |||||
Average Copper Sales Price (including hedging) (A$/lb) | 1.21 |
| 1.31 |
| 1.28 |
| 1.30 |
| N/A |
| |||||
CAPITAL EXPENDITURE | |||||||||||||||
Sustain | 26.1 |
| 22.2 |
| 142.8 |
| 165.0 |
| N/A |
| |||||
Enhance | 38.9 |
| 21.4 |
| 16.2 |
| 37.6 |
| N/A |
| |||||
Mine Capital Development | 10.3 |
| 7.4 |
| 5.6 |
| 13.0 |
| N/A |
| |||||
Total Capital Expenditure | 75.3 |
| 51.0 |
| 164.6 |
| 215.6 |
| N/A |
| |||||
SALES VOLUMES | |||||||||||||||
Copper (‘000 tonnes) | 200.8 |
| 89.3 |
| 96.8 |
| 186.1 |
| 185.0 |
| |||||
Uranium Oxide (tonnes) | 4,534 |
| 1,246 |
| 2,642 |
| 3,888 |
| 3,888 |
| |||||
Table of Contents

Fertilizer (2002 Pro Forma Historical v Forecast)
Fertilizer’s pro forma revenue of A$433.3 million was A$7.3 million above the forecast. This increase was production and sales volume driven, which were both over 20,000 tonnes higher than forecast. This more than offset the decline in the US$ benchmark price, with realised prices approximately A$6 tonne below forecast. Higher production volumes and a draw down in stocks resulted in total cost of sales exceeding forecast by A$15.6 million. As a consequence, Fertilizer’s pro forma EBIT (pre hedging) for 2002 was a loss of A$27.9 million, an A$8.3 million negative variance to forecast.
FERTILIZER (Table 4) | PRO FORMA HISTORICAL | PRO FORMA FORECAST | |||||||||||||
Full Year 2001 | 1st Half 2002 | 2nd Half 2002 | Full Year 2002 | Full Year 2002 | |||||||||||
(A$ Million) | |||||||||||||||
PRO FORMA RESULTS | |||||||||||||||
Fertilizer sales revenue | 382.4 |
| 277.7 |
| 154.9 |
| 432.6 |
| N/A |
| |||||
Revenue received/receivable from insurance claims | 22.5 |
| — |
| — |
| — |
| N/A |
| |||||
Other | 0.5 |
| 0.5 |
| 0.2 |
| 0.7 |
| N/A |
| |||||
PRO FORMA REVENUE | 405.4 |
| 278.2 |
| 155.1 |
| 433.3 |
| 426.0 |
| |||||
CASH COSTS | |||||||||||||||
Production (Cash) | (324.5 | ) | (205.0 | ) | (142.2 | ) | (347.2 | ) | N/A |
| |||||
Non Production (Cash) | (61.1 | ) | (36.0 | ) | (34.9 | ) | (70.9 | ) | N/A |
| |||||
NON CASH COSTS | |||||||||||||||
Production (Non-Cash) | (59.0 | ) | (22.1 | ) | (22.8 | ) | (44.9 | ) | N/A |
| |||||
Non-Production (Non-Cash) | (23.2 | ) | (7.5 | ) | (1.5 | ) | (9.0 | ) | N/A |
| |||||
Change in Stock | 2.5 |
| (5.9 | ) | 16.7 |
| 10.8 |
| N/A |
| |||||
PRO FORMA TOTAL COST OF SALES | (465.3 | ) | (276.5 | ) | (184.7 | ) | (461.2 | ) | (445.6 | ) | |||||
PRO FORMA EBIT (pre hedging) | (59.9 | ) | 1.7 |
| (29.6 | ) | (27.9 | ) | (19.6 | ) | |||||
Currency & Commodity Hedging | (29.5 | ) | (1.0 | ) | (0.4 | ) | (1.4 | ) | N/A |
| |||||
PRO FORMA EBIT | (89.4 | ) | 0.7 |
| (30.0 | ) | (29.3 | ) | N/A |
| |||||
OTHER PRO FORMA DATA | |||||||||||||||
Depreciation & Amortisation | 66.0 |
| 20.7 |
| 22.4 |
| 43.1 |
| 46.5 |
| |||||
Return on Net Assets (Annualised %) | N/A |
| 0.4 |
| N/A |
| N/A |
| N/A |
| |||||
Unit Cash Cost of Fertilizer Production (A$/t) | 266 |
| 249 |
| 241 |
| 244 |
| N/A |
| |||||
Unit Cost of Fertilizer Sales (A$/t) | 409 |
| 324 |
| 341 |
| 332 |
| N/A |
| |||||
Average DAP Sales Price (excluding hedging) (A$/t) | 288 |
| 280 |
| 286 |
| 283 |
| N/A |
| |||||
Average DAP Sales Price (including hedging) (A$/t) | 244 |
| 278 |
| 285 |
| 281 |
| N/A |
| |||||
CAPITAL EXPENDITURE | |||||||||||||||
Sustain | 23.4 |
| 7.9 |
| 19.2 |
| 27.1 |
| N/A |
| |||||
Enhance | 10.5 |
| 0.1 |
| 0.6 |
| 0.7 |
| N/A |
| |||||
Mine Capital Development | 0 |
| 0.5 |
| 15.7 |
| 16.2 |
| N/A |
| |||||
Capitalised Major Maintenance | 8.4 |
| 0.3 |
| 5.9 |
| 6.2 |
| N/A |
| |||||
Total Capital Expenditure | 42.3 |
| 8.8 |
| 41.4 |
| 50.2 |
| N/A |
| |||||
SALES VOLUMES (‘000 tonnes) | |||||||||||||||
QFO product direct to Third Parties | 537 |
| 292 |
| 314 |
| 606 |
| N/A |
| |||||
QFO product via Hi-Fert | 134 |
| 216 |
| 78 |
| 294 |
| N/A |
| |||||
Total Sales Volume of QFO product | 671 |
| 508 |
| 392 |
| 900 |
| 876 |
| |||||
Other Sales | 457 |
| 342 |
| 163 |
| 505 |
| N/A |
| |||||
Total Fertilizer Sales | 1,128 |
| 850 |
| 555 |
| 1,405 |
| N/A |
| |||||
Table of Contents

DISCUSSION OF 2002 v 2001 PRO FORMA HISTORICAL RESULTS
Overview
Pro forma revenue ( excluding currency & commodity hedging ) for WMC Resources of A$2,689.9 million for 2002 was down marginally on the 2001 revenue of A$2,727.8 million. The decline in 2002 was principally attributable to Olympic Dam where sales revenue decreased by A$148.2 million reflecting lower realised copper prices and lower sales volumes as a consequence of the fire in the solvent extraction circuits in October 2001 and reduced production associated with water leaks from cooling jackets in the smelter’s flash furnace of the smelter in the 1st half of the year.
Offsetting, in part, the lower copper / uranium revenues was an increase in insurance receivables of $62.2 million resulting from an A$90 million (net A$80 million after A$10 million charge to captive insurer) business interruption insurance claim relating to the fire in the Olympic Dam solvent extraction circuits. Also impacting positively was a combined A$50.2 million increase in revenues from the Queensland Fertilizer Operations and Hi-Fert, reflecting the continued ramp-up of production at Queensland Fertilizer Operations.
Pro forma EBIT (pre hedging) for WMC Resources for 2002 was A$143.8 million compared to A$294.2 million in 2001. Copper / Uranium and Nickel’s pro forma EBIT (pre hedging) both declined but were partially offset by the improved result from Fertilizers. Copper / Uranium’s pro forma EBIT was affected by the lower sales volumes following the fire in the solvent extraction circuits, lower prices and increased amortisation and depreciation of $73.9 million.
The reduced pro forma currency and commodity hedging losses of A$12.5 million for 2002 compared to A$290.9 million in 2001, represents the effect of the fair value adjustment to the hedge book associated with the demerger.
Pro forma EBIT for WMC Resources for 2002 was A$131.3 million compared to A$3.3 million in 2001.
Nickel
Pro forma revenue increased to A$1,377.8 million in 2002, compared to A$1,342.4 million in 2001, in line with higher realised prices and higher sales volumes of concentrate and nickel metal, offset in part by reduced matte sales. The nickel refinery at Kwinana produced a record 65,055 tonnes of nickel metal in 2002, up from 61,324 tonnes in 2001, following the expansion completed in 2001, however a fire in the mist precipitator at the Kalgoorlie nickel smelter acid plant in February 2002 resulted in reduced production of nickel matte.
LME spot nickel prices averaged US$3.07 per pound in 2002, up almost 14% from the average US$2.70 per pound in 2001. Realised Australian dollar prices averaged A$5.55 per pound in 2002, up only 3% from the average 2001 price of A$5.41 per pound due to the weaker US dollar relative to the Australian dollar in 2002.
Nickel’s pro forma EBIT (pre hedging) decreased to A$257.7 million in 2002, compared with A$288.4 million in 2001. The lower pro forma EBIT in 2002 was principally due to higher total cost of sales. The average unit cost of nickel metal sales ( net of by-product credits ) for 2002 was A$4.17 per pound, compared to A$3.74 per pound in 2002, primarily reflecting increased purchases of concentrate from third parties.
Pro forma currency & commodity hedging losses of A$6.8 million in 2002 compared to the A$141.5 million in 2001 represents the effect of the fair value adjustment to the hedge book associated with the demerger.
Table of Contents

Copper / Uranium
Pro forma revenue decreased to A$855.4 million in 2002, compared to A$913.2 million in 2001, in line with lower sales reflecting reduced production and lower Australian dollar prices due to both lower copper prices and the weaker US dollar relative to the Australian dollar in 2002 compared to 2001. The 2002 pro forma revenue includes $90 million of insurance claims for lost production and sales in relation to the fire in the solvent extraction plant. Further insurance claim revenue of A$40 million in relation to the rebuild of the solvent extraction plant is not included in the pro forma revenue on the basis that it is a claim with respect to plant and equipment and is non-recurring.
Operating performance improved in the second half of 2002 following completion of programs to increase concentrate grade and improve throughput in the feed preparation area. However, production was lower than 2001 largely due to rebuilding the solvent extraction plant and completing maintenance repairs to cooling jackets in the smelter’s flash furnace.
The rebuild of the solvent extraction plant occurred during all of 2002 with the uranium circuit scheduled to be completed in the first half of 2003 and the copper circuit in the second half of 2003. The optimisation project to increase capacity to 235,000 tonnes of copper cathode was completed on schedule and budget in 2002. Production of refined copper is estimated to be approximately 185,000 tonnes in 2003 due to the major shutdown for the furnace rebuild in the second half of 2003. The plant is scheduled to operate at full capacity in 2004.
LME spot copper prices averaged US$0.71 per pound in 2002, down on the average price in 2001 of US$0.72 per pound. Australian dollar prices averaged A$1.31 per pound in 2002, down on the average price in 2001 of A$1.44 per pound, due to the weaker US dollar relative to the Australian dollar in 2002.
The increased pro forma depreciation and amortisation of A$255.8 million for 2002 compared with A$181.9 million in 2001 represents amortisation of A$26.6 million relating to the fair value uplift and accelerated depreciation of idle and inactive assets and the flash furnace in respect of the rebuild in 2003.
Copper / Uranium’s pro forma EBIT (pre hedging) decreased to A$41.2 million in 2002, compared to A$222.6 million in 2001. The decreased profit was due to lower sales volumes from reduced production, lower copper prices and increased amortisation and depreciation, offset by business interruption insurance claims.
The reduced pro forma currency & commodity hedging losses of A$5.3 million in 2002 compared to A$102.9 million in 2001 represents the effect of the fair value adjustment to the hedge book associated with the demerger.
Fertilizer
Pro forma revenue increased to A$433.3 million in 2002, compared to A$405.4 million in 2001, in line with the higher sales volumes offset in part by lower realised prices. Australian dollar realised prices averaged A$283 per tonne in 2002, down 2% from the average 2001 price of A$288 per tonne due to the weaker US dollar relative to the Australian dollar in 2002.
Fertilizer’s pro forma EBIT (pre hedging) improved from a loss of A$59.9 million in 2001 to a loss of A$27.9 million in 2002. The improved pro forma EBIT in 2002 was principally due to the improved production, and associated sales, as the Queensland Fertilizer Operation continued ramping up to, and in October 2002 reaching, design capacity.
Pro forma currency & commodity hedging losses of A$1.4 million in 2002 compared to the A$29.5 million in 2001 represents the effect of the fair value adjustment to the hedge book associated with the demerger.
Table of Contents

DISCUSSION OF 2002 PRO FORMA HISTORICAL v PRO FORMA FORECAST CASH FLOWS
Pro forma capital expenditure of A$476.0 million in 2002, was an increase of A$21.6 million relative to forecast. Increases in capital expenditure occurred across the three operating divisions but were greatest at Olympic Dam with higher expenditure on the rebuild of the Copper and Uranium SX circuits. The increase in capital expenditure combined with the reduced pro forma EBITDA relative to forecast, resulted in a pro forma net cash outflow for 2002 of A$30.3 million compared to a forecast net cash inflow of A$17.8 million.
PRO FORMA COMBINED CASH FLOWS OF WMC RESOURCES LTD(1)(Table 5) | PRO FORMA HISTORICAL | PRO FORMA FORECAST | |||||||||||||
Full Year 2001 | 1st Half 2002(2)(4) | 2nd Half 2002(2)(4) | Full Year 2002(2)(4) | Full Year 2002(2)(3)(4) | |||||||||||
(A$ Million) | |||||||||||||||
Pro forma EBITDA (excluding currency and commodity hedging (Table 1) | 775.4 |
| 328.6 |
| 334.5 |
| 663.1 |
| 683.4 |
| |||||
Movements in working capital | 218.3 |
| (249.4 | ) | 140.0 |
| (109.4 | ) | (98.3 | ) | |||||
Currency & commodity hedging payments | (328.7 | ) | (91.9 | ) | (66.2 | ) | (158.1 | ) | (157.2 | ) | |||||
Non cash items | (2.9 | ) | 18.8 |
| 13.5 |
| 32.3 |
| 28.0 |
| |||||
Capital expenditure | (357.0 | ) | (144.0 | ) | (332.0 | ) | (476.0 | ) | (454.4 | ) | |||||
Other investing cashflows | 38.3 |
| 3.3 |
| 1.8 |
| 5.1 |
| 7.7 |
| |||||
Pro forma net cashflow before borrowing costs, tax and financing activities | 343.4 |
| (134.6 | ) | 91.6 |
| (43.0 | ) | 9.2 |
| |||||
Net borrowing costs | N/A |
| (29.3 | ) | (29.2 | ) | (58.5 | ) | (58.1 | ) | |||||
Interest rate swap | N/A |
| 71.2 |
| — |
| 71.2 |
| 71.2 |
| |||||
Income tax paid | N/A |
| — |
| — |
| — |
| (4.5 | ) | |||||
Pro forma net cash flow before financing activities | N/A |
| (92.7 | ) | 62.4 |
| (30.3 | ) | 17.8 |
| |||||
Notes to Table 5
| (1) | The Pro Forma Combined Cash Flows of WMC Resources Ltd set out in Table 5, have been prepared on a consolidated entity basis for WMC Resources Ltd and its controlled entities and assumes the entities acquired by WMC Resources Ltd as part of the demerger (principally the copper / uranium and fertilizer businesses and the finance companies) were controlled entities for the full periods reported, i.e. from 1st January 2001. |
| (2) | The pro forma cashflows for the 2002 year exclude certain non-recurring cash outflows incurred by WMC Resources as a result of the Demerger. The transactions and the associated historical amounts include: |
| • | various demerger transaction costs amounting to A$74.7 million, costs relating to the refinancing of the debt (A$53.0 million) and advisory and other fees (A$21.7 million) |
| • | cash outflow of A$107.6 million in relation to the repurchase of outstanding US debt securities representing the difference between the market value of the securities and their face value. Most of this cash outflow will be mitigated by the benefit of lower interest rates which are expected to be obtained under the funding arrangements put in place to refinance the debt. |
| (3) | The 2002 full year pro forma forecast cashflows are as per “Table 4 PRO FORMA CONSOLIDATED CASHFLOWS OF WMC RESOURCES” on page 131 of the Scheme Booklet. |
| (4) | The 2002 half and full year pro forma historical and forecast cashflows have been prepared as if the net A$577 million allocation of approximately A$600 million of existing debt and A$23 million of cash from WMC Resources Ltd to Alumina Limited, which took place on or before the demerger, had occurred as at 1st January 2002. |
Table of Contents

RECONCILIATION TO 2002 STATEMENT OF FINANCIAL PERFORMANCE
The pro forma historical net profit for the year ended 31 December 2002 presented in Table 1 differs from the reported consolidated “net profit attributable to members of WMC Resources Ltd” in its Statement of Financial Performance prepared in accordance with theCorporations Act 2001 (Cth) for the year ended 31 December 2002.
The pro forma historical net profit includes the results of the entities acquired by WMC Resources Ltd as part of the demerger (principally the copper / uranium and fertilizer businesses and the finance companies) but excludes the results of discontinued operations. Adjustments have also been made to exclude the impact of significant non-recurring items and to present the transactions and events associated with the demerger, as if they had occurred on 1st January 2002.
WMC believes these normalisation adjustments enable a more meaningful analysis of WMC Resources Ltd’s underlying financial performance.
Table 6 below reconciles the pro forma historical net profit for the year ended 31 December 2002 to the net profit attributable to members of WMC Resources Ltd as presented in its Statement of Financial Performance.
RECONCILIATION OF 2002 PRO FORMA RESULTS TO 2002 STATEMENT OF FINANCIAL PERFORMANCE (Table 6) | Full Year 2002 | |||||
(A$ Million) | ||||||
Pro forma net profit (Table 1) | 75.4 |
| ||||
Adjustments for discontinued operations | ||||||
Profit from Gold Operations | (1.6 | ) | ||||
Profit on disposal of right to gold royalty (after tax) | 15.4 |
| ||||
Significant non-recurring items (after tax) | ||||||
Profit of disposal of Long Victor nickel mine | 9.4 |
| ||||
Olympic Dam insurance receivable (material damage) | 28.0 |
| ||||
Demerger and other normalised costs expensed | (47.4 | ) | ||||
Prior period overprovision of tax expense | 76.8 |
| ||||
Pro forma adjustments (after tax) | ||||||
Elimination of pro forma interest for period January – November 2002 | 36.3 |
| ||||
Amortisation of fair value adjustments | ||||||
Olympic Dam | 24.2 |
| ||||
Queensland Fertiliser Operations | (17.2 | ) | ||||
Results of activities for period January – November 2002 | ||||||
Copper / Uranium | ||||||
Insurance receivable (business interruption) | (72.0 | ) | ||||
Idle capacity charge | 92.4 |
| ||||
Ordinary operating activities | (52.4 | ) | (32.0 | ) | ||
Fertilizer | 37.8 |
| ||||
Exploration and new business | 35.5 |
| ||||
Other non-operational entities | 31.1 |
| ||||
Interest paid to WMC Limited group of companies | (399.7 | ) | ||||
Tax effect on applicable items above | 84.3 |
| ||||
Net profit attributable to members of WMC Resources Ltd (as per Statement of Financial Performance) | (43.7 | ) | ||||
Table of Contents

RECONCILIATION OF 2002 PRO FORMA HISTORICAL INCOME TAX BENEFIT
The pro forma historical income tax benefit for the year ended 31 December, 2002 of A$1.5 million differs from the prima facie income tax expense of A$22.2 million as set out below.
RECONCILIATION OF 2002 PRO FORMA HISTORICAL INCOME TAX BENEFIT (Table 7) | Full Year 2002 | ||
(A$ Million) | |||
Pro forma net profit (Table 1) | 73.9 |
| |
Prima facie income tax expense at 30% | (22.2 | ) | |
Items that varying the prima facie income tax expense: | |||
Rebateable and exempt dividends | 3.2 |
| |
Additional claim for research and development expenditure | 8.1 |
| |
Exempt income | 1.8 |
| |
Non-assessable capital gains/(losses) | 0.8 |
| |
Non-deductible depreciation and amortisation | (4.8 | ) | |
Non-deductible expenses | (0.4 | ) | |
Non-deductible foreign expenses | (5.5 | ) | |
Fair value adjustment arising for acquisition of entities | 210.8 |
| |
Net variations | 214.0 |
| |
Tax effect of the above variations at 30% | 64.2 |
| |
Future income tax benefits not brought to account | (51.5 | ) | |
Recognition of future income tax benefits not previously brought to account | 11.0 |
| |
Reduction in prima facie income tax | 23.7 |
| |
Pro forma income tax benefit (Table 1) | 1.5 |
| |
Table of Contents

INDEPENDENT REVIEW REPORT TO MEMBERS OF WMC RESOURCES LTD
![]()
PricewaterhouseCoopers | ||
ABN 52 780 433 757 | ||
333 Collins Street | ||
MELBOURNE VIC 3000 | ||
GPO Box 133IL | ||
MELBOURNE VIC 3001 | ||
DX 77 Melboume | ||
Australia | ||
www.pwcglobal.com/au | ||
Telephone +61 3 8603 1000 | ||
Facsimile +61 3 8603 1999 |
The Directors
WMC Resources Limited
Level 16
IBM Center
60 City Road
SOUTHBANK VIC 3006
26 February 2003
Independent Review Report
Dear Madam and Sirs
We have prepared this Independent Review Report (Report) on the pro forma historical financial information included in Tables 1,5,6 and 7 in the WMC Resources Ltd (WMCR) Special Purpose Report, which compares the pro forma forecast results included in the WMC Limited Scheme Booklet dated 28 October 2002 to the pro forma historical results for the year ended 31 December 2002.
Scope
You have requested PricewaterhouseCoopers to prepare a Report for inclusion in the Special Purpose Report of WMCR for the year ended 31 December 2002 covering the following information;
| 1. | The pro forma historical and forecast financial information set out in tables 1, 5, 6 and 7 of the Special Purpose Report (collectively, the ‘Financial Information’) consisting of: |
| (a) | the comparison of the pro forma combined historical results and combined cash flows of the demerged WMCR business to the forecasts included in section 7.12 of the WMC Limited Scheme Booklet date 28 October 2002 as set out in Tables 1 and 5; |
| (b) | the reconciliation of 2002 pro forma combined results to the 2002 consolidated Statement of WMCR for the year ended 31 December 2002 as set out in table 6; and |
| (c) | the reconciliation of 2002 pro forma historical income tax benefit to the prima facie income tax expense as set out in Table 7. |
Liability is limited by the Accountant’s Scheme under the Professional Standards Act 1994 (NSW)
Table of Contents

![]()
26 February 2003
The Financial Information has been prepared under Generally Accepted Accounting principles in Australia (A GAAP) on the basis that WMCR has been operating independently for reporting purposes since 1 January 2001. In preparing the Financial Information, the Directors of WMCR considered the need for it to be adjusted to reflect the pro forma transactions outlined in the Basis of Preparation note on page 2 of the Special Purpose Report, and to adjust for certain non-recurring items, also a outlined in the Basis of Preparation note.
Scope of review of Historical Financial Information
The Financial Information has been extracted from the consolidated audited financial statements of WMCR for the year ended 31 December 2002 and from the consolidated audited accounts of WMC Limited for the year ended 31 December 2001, the Half Year Report for WMC Limited for 30 June 2002, which was subject to independent review by the auditors, and the consolidated audited financial statements of Alumina Limited (formerly WMC Limited) for the year ended 31 December 2002. The forecast pro forma Financial Information has been extracted from the Scheme Booklet of WMC Limited dated 18 October 2002. In order to reflect the operations of WMCR, the Directors of WMCR have incorporated such adjustments as considered necessary. The Directors of the Company are responsible for the preparation of the Financial Information, including determination of the adjustments.
Although each of the entities included in the WMCR group did not prepare separate audited financial statements during the financial periods under review. PricewaterhouseCoopers has conducted audits of the consolidated financial statements of WMCR for the year ended 31 December 2002, Alumina Limited (previously WMC Limited) for the year ended 31 December 2002 and WMC Limited for the year ended 31 December 2001. These audits were conducted in accordance with Australian Auditing Standards to provide reasonable assurance as to whether the consolidated financial statements of WMCR, WMC Limited and Alumina Limited were free of material misstatement. An unqualified opinion was issued in respect of each year.
We have conducted our review of the Financial Information in accordance with Australian Auditing Standard AUS 902 “Review of Financial Reports”. We made such inquiries and performed such procedures as we, in our professional judgment, considered reasonable in the circumstances, including discussions with the Directors and management of WMCR.
These procedures do not provide all the evidence that would be required in an audit, thus the level of assurance provided is less than given in an audit. We have not performed an audit and, accordingly, we do not express an audit opinion on the Financial Information.
Table of Contents

![]()
26 February 2003
Review statement on Proforma Historical Financial Information
Based on our review, which is not an audit, nothing has come to our attention which causes us to believe that the Historical Financial Information:
| (a) | does not present fairly: |
| (i) | the Pro forma historical and forecast combined results (as represented in Table 1) and Combined Cashflows (as represented in Table 5) of the demerged WMCR Business for each of the years ended 31 December 2001 and 2002; and each of the half years ended 30 June 2002 and 31 December 2002; |
| (ii) | the Reconciliation of the 2002 Pro Forma Results from the Scheme Booklet dated 28 October 2002 to the 2002 consolidated Statement of Financial Performance of WMCR as set out in Table 6; and |
| (iii) | the Reconciliation of the 2002 Pro Forma Historical income tax benefit to the prima facie income tax expense as set out in Table 7. |
| (b) | has not been prepared in accordance with the recognition and measurement principles prescribed in Accounting Standards and other mandatory professional reporting requirements in Australia, and the accounting policies adopted by WMCR and the Basis of Prepaation on page 2 of the Special Purpose Report. |

PricewaterhouseCoopers
Chartered Accountants

Paul Bendall
Partner
Table of Contents
Table of Contents

WMC Resources Ltd
Full Year Results
December 2002
For additional information please contact:
David Hall
WMC Resources Ltd
(ABN 85 004 820 419)
60 City Road, Southbank, Victoria 3006, Australia
Email: david.hall@wmc.com
Telephone: +61 (0)3 9685 6081
Internet address: http://www.wmc.com
Fax: +61 (0)3 9685 6094
Table of Contents

BUSINESS PERFORMANCE
Explanation of Profit Release | 1 | |
Reconciliation of Legal entity to Pro Forma results | 3 | |
Environment Health and Safety | 4 | |
Production Summary | 4 | |
Copper | 5 | |
Nickel | 6 | |
Fertilizer | 7 | |
Real Average Annual Growth Rate — Peer Comparison | 8 | |
Hedging | 9 | |
Average Commodity Prices & Exchange Rates | 10 | |
WMC Resources Share Price | 10 | |
Business Strategy & Development | 11 | |
Definitions | 14 |
Table of Contents
Explanation of Profit Release
This advice sets out the form and basis of the various reports which will be presented as part of the release.
Preliminary Final ASX Report
Under the Corporations Act and in accordance with accounting standards, the company is required to present a report as its substantive financial report for the year. WMC Resources Ltd was a subsidiary company of the former WMC Limited owning the nickel business, and its required to present the accounts for the year ending 31 December 2002 on the basis that WMC Resources Ltd acquired the copper/uranium and fertilizer businesses and financing vehicles only as of the demerger date. Therefore, the financial statements presented reflect the results of the nickel operations and corporate activities for the full financial year but only include the results of the copper/uranium, fertilizer and finance activities for one month. In addition, as WMC Resources Ltd bore all the demerger costs they are reflected in these accounts.
Special Purpose Report
For illustrative purposes and to assist shareholders in understanding the performance of WMC Resources Ltd as compared with the forecast contained in the Scheme Booklet dated 28 October 2002, pro forma financial information in respect of the businesses now comprising WMC Resources Ltd (prepared on a basis consistent with that contained in the Scheme Booklet) is provided in the Special Purpose Report.
The Special Purpose Report, being the comparison of Scheme Booklet pro forma financial results with pro forma historical results for year ended 31 December 2002 has been lodged with the ASX together with the Preliminary Final ASX Report.
The pro forma basis reflects WMC Resources Ltd as though it had owned all of the businesses it acquired on demerger for the full year, reflects the accounting adjustments on demerger for the full year, and normalises one off items.
Discontinued businesses in the Alumina Limited Preliminary Final ASX Report
Alumina Limited, as the former WMC Limited, owned the operations of WMC Resources Ltd until the effective demerger date of 2 December 2002. The Alumina Limited financial statements reflect 11 months of WMC Resources Ltd operations as part of the discontinued businesses disclosure.
The attached table sets out the major differences in basis between the three disclosures. Reconciliations of the profit outcomes between each of the reports are detailed with the reports.
Table of Contents

Preliminary Final ASX Report | Special Purpose Report (Pro forma) | Discontinued Businesses (Alumina Limited Report) | ||||
Nickel Operations | 12 months of operations | 12 months of operations | 11 months of operations | |||
Copper Operations | 1 month of operations
Impactof fair value adjustment increases amortisation charge (1 month) | 12 months of operations
Impact of fair value adjustment increases amortisation charge (12 months) | 11 months of operations with no amortisation impact of fair value adjustment | |||
Queensland Fertilizer Operations | 1 month of operations
Impact of fair value adjustments decreases depreciation charge (1 month) | 12 months of operations
Impact of fair value adjustment decreases deprecation charge (12 months) | 11 months of operations with no amortisation impact of fair value adjustment | |||
Other Operations | Includes only those activities specific to WMC Resources Ltd post demerger | Excludes activities no longer undertaken | Includes all discontinued activities including those former WMC Limited activities | |||
Corporate | 12 months including costs of demerger but excludes 11 months of board of directors, share registry costs, etc | 12 months excluding costs of demerger. One offs normalised consistent with the Scheme Booklet approach | 11 months with no demerger costs | |||
Exploration | 12 months of operations | 12 months of operations | 11 months of operations | |||
Net Currency & Commodity Hedging | 11 months impact at historical rates and one month’s impact at fair valued rates. 1 month commodity hedging. | 12 months impact at relevant fair value rates | 11 months at historical rates | |||
Borrowing Costs | Net intercompany borrowing costs of the WMC Resources group for 11 months plus one month of external refinanced position post demerger | 12 months of WMC Resources Ltd post demerger debt i.e. adjusted for transfer of $600m to Alumina Limited and movement in interest rates | 11 months of actual interest charges prior to demerger | |||
Tax Expense | Tax effect of above amounts and tax adjustments relevant to the legal entity | Tax effect of above and other normalisations | Tax credit for 11 months excluding fair value adjustments for tax assets transferred to the new WMC Resources group | |||
Comparatives | No 2001 comparatives — general exemption under ASIC class order | 2001 as previously reported, adjusted for, EBIT from discontinued operations (eg gold, minerals and talc), gain on disposal of businesses and non recurring items. Refer Table 6 (page 137) of the Scheme Booklet | 12 months of operations including some non-WMC Resources on-going activities | |||
Table of Contents

Reconciliation of Legal entity to Pro Forma results
The principal reconciling items between the Legal entity result and Pro Forma results are as follows:
Reference | ||||||||
LEGAL ENTITY WMC Resources Ltd (loss after tax) | ASX Release | (43.7 | ) | |||||
11 months of Copper and Fertilizer operations not in legal entity | ||||||||
Copper | ||||||||
11 months excluding Business Interruption and Insurance | Special Purpose Report (pg 12) | 52.4 |
| |||||
Less: Fair value depreciation charge | Special Purpose Report (pg 12) | (24.2 | ) | |||||
Actuals on a Scheme Book basis | 28.2 |
| ||||||
Tax effect | (8.5 | ) | ||||||
11 months (after tax) | 19.7 |
| ||||||
Fertilizer | ||||||||
11 months of Operations | Special Purpose Report (pg 12) | (37.8 | ) | |||||
Less: Fair value depreciation charge | Special Purpose Report (pg 12) | 17.2 |
| |||||
Actuals on a Scheme Booklet basis | (20.6 | ) | ||||||
Tax effect | 6.2 |
| ||||||
11 months (after tax) | (14.4 | ) | ||||||
Significant items per ASX | ||||||||
Sale of gold royalty | ASX Release (Item 1.43) | 15.4 |
| |||||
Disposal of Long Victor mines | ASX Release (item 1.44) | 9.4 |
| |||||
Demerger costs | ASX Release (item 1.45) | (35.8 | ) | |||||
Insurance receivable (net of one month idle capacity) | ASX Release (item 1.46) | 37.0 |
| |||||
Tax credit | ASX Release (item 1.47) | 76.8 |
| |||||
Total Significant Items — Net Gain (after tax) | 102.8 |
| ||||||
Full Year of ODO idle capacity | Special Purpose Report (pg 7) | (97.6 | ) | |||||
Insurance recovery — Business Interruption (per Scheme Booklet) | 80.0 |
| ||||||
Net charge to P&L | (17.6 | ) | ||||||
Tax effect | 5.3 |
| ||||||
Difference (after tax) | (12.3 | ) | ||||||
Total Significant Items | (115.1 | ) | ||||||
Borrowing costs | ||||||||
— Legal entity | ASX Release (item 1.6) | 405.2 |
| |||||
— Pro Forma basis | Special Purpose Report (pg 4) | 57.4 |
| |||||
Difference | 347.8 |
| ||||||
Tax effect | (104.3 | ) | ||||||
Difference (after tax) | 243.5 |
| ||||||
Hedging activities | ||||||||
— Legal entity (only one month’s hedging) | ASX Release (pg 16) | (0.2 | ) | |||||
— Pro Forma basis | Special Purpose Report (pg 4) | 12.5 |
| |||||
Difference | (12.7 | ) | ||||||
Tax effect | 3.8 |
| ||||||
Difference (after tax) | (8.9 | ) | ||||||
Tax Charge - tax rate differentials and allowance for permanent items | (5.7 | ) | ||||||
PRO FORMA NET PROFIT | 75.4 |
| ||||||
Table of Contents

Environment Health and Safety
While our environment, health and safety performance improved during 2002, reductions in injury rates and environmental non-compliances were overshadowed by a fatality at our Mount Keith operation and a fire in the acid plant of the Kalgoorlie Nickel Smelter.
Company-wide injury rates were down 21 per cent from 2001 and continue to be less than one third of the Australian metalliferous mining industry average. Total injury rates have declined by 19 per cent year on year reduction over the last five years.
Environmental non-compliances reduced by 71 per cent from 2001 reflecting the impact of environmental investments, improvements in maintenance and operating practices and environmental awareness training.
We believe that environment, health and sfety performance translates to the bottom-line and accordingly are pleased with the ongoing positive trend.
This notwithstanding, the fatality significantly impacted our Mount Keith workforce and the fire in the acid plant was costly in both repairs and lost production, and we continue our efforts in developing our systems and controls to eliminate these types of incidents.
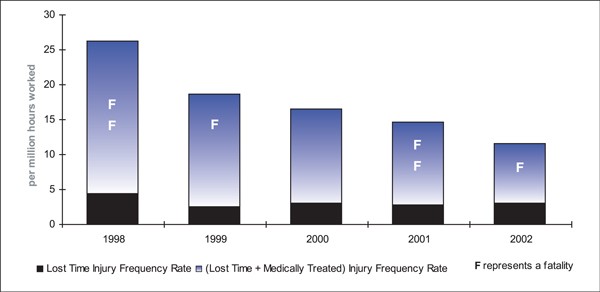
Production Summary
Calendar 1999 Full Year | Calendar 2000 Full Year | Calendar 2001 Full Year | Calendar 2002 Full Year | Scheme Booklet 2002 | ||||||
Nickel (contained nickel) (‘000 tonnes) | ||||||||||
– Concentrate | 88 | 107 | 105 | 106 | 107 | |||||
– Matte | 80 | 103 | 97 | 92 | 93 | |||||
– Metal | 53 | 61 | 61 | 65 | 66 | |||||
Gold (WMCR equity) (‘000 ounces)1 | 690 | 743 | 828 | 64 | 75 | |||||
Copper (‘000 tonnes) | 138 | 200 | 201 | 178 | 178 | |||||
Uranium (tonnes) | 3,221 | 4,539 | 4,379 | 2,890 | 2,841 | |||||
Fertilizer (‘000 tonnes) | ||||||||||
– Di-ammonium phosphate | 5 | 326 | 651 | 718 | 698 | |||||
– Mono-ammonium phosphate | - | - | 58 | 103 | 102 | |||||
Total Fertilizer | 5 | 326 | 709 | 821 | 800 | |||||
| 1 | Agnew and St Ives Gold Operations were sold on 30 November 2001. |
Table of Contents

Copper
Production
Calendar 2001 Full Year | 1st Half 2002 | 2nd Half 2002 | Calendar 2002 Full Year | Scheme Booklet 2002 | ||||||
Olympic Dam Operations | ||||||||||
Ore treated (‘000 tonnes) | 9,335.7 | 4,466.5 | 4,408.1 | 8,874.6 | 8,954.3 | |||||
Copper ore grade (%) | 2.47 | 2.53 | 2.61 | 2.57 | 2.41 | |||||
Copper produced (‘000 tonnes) | 200.5 | 87.8 | 90.3 | 178.1 | 178.2 | |||||
Uranium ore grade (kg/tonne) | 0.72 | 0.65 | 0.73 | 0.69 | 0.66 | |||||
Uranium produced (tonnes) | 4,379 | 1,192 | 1,698 | 2,891 | 2,841 | |||||
Gold ore grade (g/tonne) | 0.59 | 0.54 | 0.52 | 0.53 | 0.49 | |||||
Gold produced (‘000 ounces) | 113.4 | 37.6 | 26.7 | 64.30 | 74.70 | |||||
Silver ore grade (g/tonne) | 4.45 | 4.08 | 4.50 | 4.29 | 4.28 | |||||
Silver produced (‘000 ounces) | 912.9 | 321.3 | 322.7 | 644.0 | 692.8 | |||||
Sales
Calendar 2001 Full Year | 1st Half 2002 | 2nd Half 2002 | Calendar 2002 Full Year | Scheme Booklet 2002 | ||||||
Copper (‘000 tonnes) | 200.8 | 89.3 | 96.8 | 186.2 | 185.0 | |||||
Uranium Oxide (tonnes) | 4,534.0 | 1,245.7 | 2,642.4 | 3,888.1 | 3,888.0 | |||||
Table of Contents

Nickel
Production
Calendar 2001 Full Year | 1st Half 2002 | 2nd Half 2002 | Calendar 2002 Full Year | Scheme Booklet 2002 | ||||||
Kambalda nickel Operation1 | ||||||||||
Ore treated (‘000 tonnes) | 601.5 | 303.4 | 385.1 | 688.5 | 687.5 | |||||
Head grade (%) | 3.37 | 3.53 | 3.99 | 3.79 | 3.68 | |||||
Total Concentrate produced (‘000 tonnes) | 137.3 | 68.0 | 91.0 | 159.0 | 161.9 | |||||
Concentrate grade (%) | 13.6 | 14.3 | 14.9 | 14.6 | 14.2 | |||||
Nickel in concentrate (‘000 tonnes) | 18.6 | 9.7 | 13.5 | 23.2 | 23 | |||||
Leinster Nickel Operations | ||||||||||
Ore treated (‘000 tonnes) | 2,323.7 | 1,230.8 | 1,339.9 | 2,570.7 | 2,437.7 | |||||
Head grade (%) | 2.04 | 1.97 | 2.02 | 1.99 | 1.98 | |||||
Concentrate produced (‘000 tonnes) | 319.1 | 151.7 | 159.8 | 311.5 | 299.2 | |||||
Concentrate grade (%) | 11.9 | 12.6 | 13.0 | 12.8 | 12.7 | |||||
Nickel in concentrate (‘000 tonnes) | 38.0 | 19.2 | 20.8 | 40.0 | 38.0 | |||||
Mt Keith Nickel Operations | ||||||||||
Ore treated (‘000 tonnes) | 10,919.9 | 5,472.6 | 5,582.3 | 11,055.0 | 11,317.4 | |||||
Head grade (%) | 0.62 | 0.58 | 0.58 | 0.58 | 0.59 | |||||
Concentrate produced (‘000 tonnes) | 254.4 | 112.4 | 105.2 | 217.6 | 227.5 | |||||
Concentrate grade (%) | 18.8 | 19.2 | 20.5 | 19.8 | 20.0 | |||||
Nickel in concentrate (‘000 tonnes) | 47.9 | 21.6 | 21.6 | 43.2 | 45.5 | |||||
Kalgoorlie Nickel Smelter | ||||||||||
Concentrate treated (‘000 tonnes) | 704.3 | 300.1 | 340.3 | 640.5 | 647.3 | |||||
Nickel in concentrate treated from WMC sources (‘000 tonnes) | 81.5 | 33.1 | 38.6 | 71.7 | na | |||||
Nickel in concentrate treated from third party (‘000 tonnes) | 18.6 | 10.3 | 13.5 | 23.8 | na | |||||
Matte produced (‘000 tonnes) | 140.4 | 62.1 | 72.4 | 134.4 | 137.3 | |||||
Nickel in matte produced (‘000 tonnes) | 96.6 | 41.7 | 49.9 | 91.6 | 92.5 | |||||
Kwinana Nickel Refinery | ||||||||||
Matte treated (‘000 tonnes) | 94.2 | 49.0 | 51.7 | 100.7 | 103.8 | |||||
Refined nickel produced (‘000 tonnes) | 61.3 | 30.9 | 34.2 | 65.1 | 66 | |||||
| 1 | The Third party feed concentrate production figure for KNO in 2002 is 24,207t of contained nickel. |
Sales
Calendar 2001 Full Year | 1st Half 2002 | 2nd Half 2002 | Calendar 2002 Full Year | Scheme Booklet 2002 | ||||||
Nickel In Concentrate (‘000 tonnes) | 13.8 | 7.0 | 7.1 | 14.1 | 14.0 | |||||
Nickel In Matte (‘000 tonnes) | 34.6 | 9.5 | 16.2 | 25.7 | 25.0 | |||||
Metal (‘000 tonnes) | 61.1 | 31.0 | 33.8 | 64.8 | 66.0 | |||||
Total Nickel (‘000 tonnes) | 109.5 | 47.5 | 57.1 | 104.6 | 105.0 | |||||
Cobalt (tonnes) | 737 | 454 | 394 | 848 | 794 | |||||
Table of Contents

Fertilizer
Production
Calendar 2001 Full Year | 1st Half 2002 | 2nd Half 2002 | Calendar 2002 Full Year | Scheme Booklet 2002 | ||||||
Di-Ammonium phosphate (DAP) (tonnes) | 651,498 | 339,069 | 379,218 | 718,287 | 697,625 | |||||
Mono-Ammonium phosphate (MAP) (tonnes) | 57,947 | 59,108 | 43,605 | 102,713 | 102,449 | |||||
Total Fertilizer (tonnes) | 709,445 | 398,177 | 422,823 | 821,000 | 800,074 | |||||
Sales
Calendar 2001 Full Year | 1st Half 2002 | 2nd Half 2002 | Calendar 2002 Full Year | Scheme Booklet 2002 | ||||||
WMCR Product - Di-Ammonium Phosphate (DAP) (tonnes) | 536,625 | 291,743 | 314,101 | 605,844 | 572,480 | |||||
Hi Fert-Third Party (tonnes) | 134,277 | 215,780 | 77,745 | 293,525 | 303,832 | |||||
Total Sales Volume of QFO Products | 670,902 | 507,523 | 391,846 | 899,369 | 876,312 | |||||
Table of Contents

Real Average Annual Growth Rate — Peer Comparison
These charts show the average annualised return over the last year and the last five years for a US investor who has reinvested dividends on the date received. All returns have been adjusted for increased in prices (inflation) and are quoted in US dollars^.
WMC Resources’ objective is to deliver shareholder return in the top quartile of our peer group over any five-year time-frame.
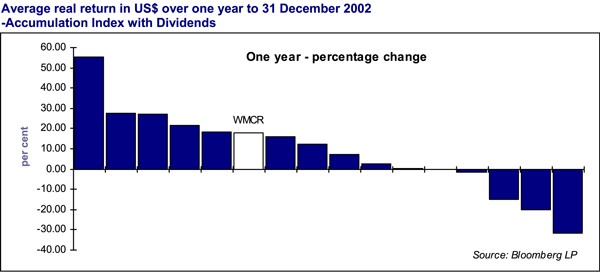
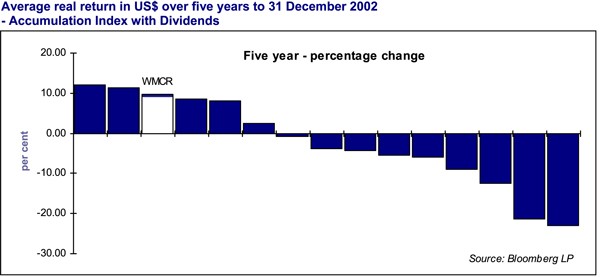
Anglo America | Freeport McMoran | Noranda | Potash Corp | |||
BHPBilliton | IMC Global (Agrico) | Nueva Grupo Mexico | Rio Tinto Plc | |||
Eramet | Inco | Outokumpu | Xstrata* | |||
Falconbridge | MIM | Phelps Dodge |
* Only published in 1 year table
^ The returns are derived from a composite of 49 weeks of WMC Limited and 3 weeks for WMC Resources Ltd
Table of Contents

Hedging
Commodity & Currency Hedging as at 31 December 2002
WMC Resources revenues vary significantly with movements in commodity prices and the AUD/USD exchange rate. There is an existing hedge position that will be continuously managed.
The demerger of WMC Limited in December 2002 required the hedge book to be re-valued to its fair value at the date of demerger. Subsequent to the demerger, the profit and loss for each hedge will be determined from the revised rate following the demerger fair value and the sport price at maturity. The cash flow impact from each hedge is determined by the contracted rate with third parties and the spot price at maturity.
Currency
Period | Forward Sale of US$ | Synthetic Forward Sale of US$ | Profit & Loss Rate A$/US$ | |||||||
Amount US$m | Cash Flow Rate A$/US$ | Amount US$m | Cash Flow Rate A$/US$ | |||||||
2003 | 196 | 0.6821 | 63 | 0.6479 | 0.5535 | |||||
2004 | 228 | 0.6753 | 73 | 0.6402 | 0.5452 | |||||
2005-2008 | 737 | 0.6740 | 345 | 0.6239 | 0.5426 | |||||
A synthetic forward consists of a bought US$ put and a written US$ call option. The written US$ call option has the potential to knock out above certain exchange rates.
Gold
Forward Sale of Gold | Profit & Loss Rate A$/oz | |||||
Period | Amount Ounces | Cash Flow Rate A$/oz | ||||
2003 | 85,028 | 547 | 580 | |||
2004 | 80,000 | 559 | 600 | |||
2005-2010 | 450,200 | 646 | 678 | |||
Gold production from Olympic Dam is delivered into the gold hedging positions.
Some foreign exchange and gold hedges were reversed as a result of the gold asset sale in 2001. The cash flow impact of these reversals has been deferred to the original settlement date as follows:
2003 | 2004 | 2005 | 2006 | 2007 | 2008 | |||||||
Deferred Cashflow (A$m) | (33.4) | (26.6) | (37.5) | (28.6) | (23.4) | (21.4) |
Scenario Tables
As WMC Resources’ hedge positions comprise a combination of limiting and non-limiting cover, at various price levels, any one exchange rate or spot price cannot be used to predict the outcome of WMC Resources; hedge position. The following table provide an estimate of the realised cash flow under various scenarios taking into account the hedged and unhedged exposures. All realised exchange rate and price estimates include applicable option premium.
Currency
A$/US$ | Estimated realised rate – A$/US$ | |||||
Rate at maturity | 2003 | 2004 | 2005-2008 | |||
0.65 | 0.6549 | 0.6544 | 0.6511 | |||
0.60 | 0.6145 | 0.6168 | 0.6083 | |||
0.55 | 0.5727 | 0.5776 | 0.5644 | |||
0.50 | 0.5295 | 0.5366 | 0.5195 | |||
Table of Contents

Average Commodity Prices & Exchange Rates
Financial Period Ended | Copper US$/lb | Nickel US$/lb | DAP US$/t | US$/A$1.00 | Uranium US$/t | |||||
31 December 1998 | ||||||||||
First Half | 0.78 | 2.35 | 206.44 | 0.6476 | 10.93 | |||||
Second Half | 0.72 | 1.85 | 206.95 | 0.6115 | 9.52 | |||||
Full Year | 0.75 | 2.09 | 206.82 | 0.6296 | 10.22 | |||||
31 December 1999 | ||||||||||
First Half | 0.65 | 2.24 | 194.24 | 0.6438 | 10.60 | |||||
Second Half | 0.77 | 3.21 | 158.77 | 0.6473 | 9.83 | |||||
Full Year | 0.71 | 2.74 | 177.59 | 0.6456 | 10.21 | |||||
31 December 2000 | ||||||||||
First Half | 0.80 | 4.28 | 146.46 | 0.6103 | 8.864 | |||||
Second Half | 0.84 | 3.57 | 160.99 | 0.5538 | 7.43 | |||||
Full Year | 0.82 | 3.92 | 154.12 | 0.5821 | 8.15 | |||||
31 December 2001 | ||||||||||
First Half | 0.78 | 3.00 | 152.79 | 0.5228 | 8.34 | |||||
Second Half | 0.66 | 2.41 | 141.08 | 0.5127 | 9.34 | |||||
Full Year | 0.72 | 2.70 | 146.82 | 0.5175 | 8.84 | |||||
31 December 2002 | ||||||||||
First Half | 0.72 | 2.97 | 155.00 | 0.5345 | 9.85 | |||||
Second Half | 0.71 | 3.15 | 160.00 | 0.5525 | 9.90 | |||||
Full Year | 0.71 | 3.07 | 157.00 | 0.5438 | 9.88 | |||||
Scheme Booklet | 0.71 | 3.03 | 157.00 | 0.5420 | na | |||||
As at 31 December 2002 | 0.70 | 3.22 | 149.00 | 0.5666 | 10.20 | |||||
2003 Forecast | ||||||||||
Scheme Booklet Forecast | 0.78 | 3.40 | 175.00 | 0.5800 | na | |||||
Long Term Consensus** | 0.77 | 3.54 | 165.13 | 0.6000 | 11.88 | |||||
** Average of nine brokers forecasts
WMC Resources Share Price
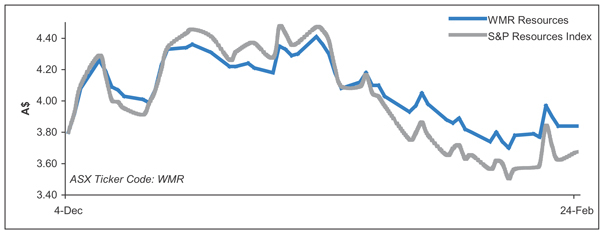
Table of Contents

Business Strategy & Development
Exploration
West Musgrave
During 2002, some $4.5 million was spent on drilling to test for additional high-grade nickel sulphides around the Nebo and Babel prospects, and on testing new targets in the immediate region. Analytical results from the drilling at Babel and Nebo are being integrated into the project database. Consolidation of all results from the 2002 work at Babel and Nebo is expected to be complete at the end of the first quarter of 2003. The drill tests of the regional targets did not yield any significant new mineralisation.
In addition, an extensive airborne electromagnetic survey was completed throughout the West Musgrave tenements during late 2002. Interpretation of results from this survey is underway and thus far one anomaly of interest has been identified, located approximately 30km south of Babel within WMC Resources tenements.
Our drilling and regional exploration efforts at the West Musgrave projects continued to be facilitated by a good working relationship with the local community and the Ngaanyatjarra Land Council.
Global Exploration
Exploration for nickel sulphide continued in Australia, North America and China.
In China, several new potential nickel opportunities were identified and agreements signed with Chinese partners covering defined areas in Sichuan and Yunnan Provinces.
Exploration for copper-gold and gold deposits continued in Mongolia and Peru.
In Mongolia, a drilling program to test for copper-gold deposits at the Khuvyn Khar prospect is scheduled to commence in February, 2003. The program will test six separate targets over a 30 square kilometer area. The Khuvyn Khar prospect is part of a mining venture agreement with Gallant Minerals Ltd. WMC Resources is earning a 90 per cent interest in the venture with Gallant retaining 10 per cent.
In Peru, promising gold and copper geochemical targets defined during 2002 are being prepared for follow-up upon resumption of the local field season in April, 2003.
Projects
Olympic Dam Expansion
In October 2002, we completed a scoping study that explored increasing annual copper production.
The study recommended a pre-feasibility study to develop and select a technically and economically viable expansion option. Started in January 2003, the pre-feasibility study will take about two years. The initial phase involves drilling the southern area of the deposit to obtain geological, resource, geo-technical, hydrological, rock temperature profile and mineralogical data. With the pre-feasibility study complete, a full feasibility study can begin to determine Olympic Dam’s future.
Table of Contents

Extraction Plant Enhancement (SX Rebuild)
The rebuild of the copper and uranium solvent extraction plants to world-class risk standards progressed during the year. At year end, the uranium plant was 81 per cent complete and the copper plant was 18 per cent complete, giving an overall 55 per cent completion for the project.
Our commitment to the highest safety and environmental standards in scoping the rebuild, as well as heightened regulatory obligations and our insurer’s improvement requirements, will result in this facility creating a benchmark standard.
The Uranium plant will be commissioned early April. The strong production and revenue contribution from the Uranium Solvent Extraction plant justified fast tracking the rebuild.
Our priority for 2003 is the smelter reline. Completion of the reline will position Olympic Dam to achieve full production capacity from 2004.
Given the pending commissioning of the uranium SX, the priority of the smelter reline in 2003 and the relative lower production contribution from the copper SX plant, continued fast-tracking of the copper SX rebuild is not justified.
Revised commissioning dates are early April 2003 for uranium SX and December 2003 for copper SX.
While we will continue to mitigate the impact of deferring the copper SX plant rebuild by operating the part of the plant not damaged by the fire, we expect copper output this year to be reduced by 5,000 tonnes to a target of 185,000 tonnes.
The extended timing will not impact the 2004 targeted production of 235,000 tonnes.
Yakabindie Nickel
In early 2001, WMC Resources announced the purchase of the Yakabindie Nickel Project from Rio Tinto for $27.1 million with another $15 million to be paid to Rio Tinto on our gaining approvals and committing to development. Located 22 kilometres south of Mount Keith, Yakabindie has long-term potential to complement WMC Resources’ existing assets and create further development options in the area. Including our existing resources at the adjacent North Six Mile mining lease, Yakabindie has an estimated resource of $287 million tonnes at 0.56 per cent nickel.
We intend drilling to further define the resource, with the results ultimately forming part of a pre-feasibility study into potential development of Yakabindie. Technology developed to increase nickel recovery at Mount Keith will be applied to Yakabindie, along with maximum use of the existing infrastructure at Mount Keith.
All work at Yakabindie is conducted in accordance with applicable heritage legislation which required, amongst other things, WMC Resources to obtain site heritage clearances prior to developing the resources.
In August 2002, an application was made to the Minister for Indigenous Affairs seeking formal permission for the development of the Yakabindie Nickel Project. Ministerial consent was given on 8 January 2003.
Corridor Sands
WMC Resources has agreed to acquire 100 per cent of the Corridor Sands titanium dioxide (Corridor Sands), located in Mozambique, from the Johannesburg-listed Southern Mining Corporation Limited.
The acquisition of Corridor Sands is consistent with WMC Resource’s strategy of growing shareholder value through the control of world-class resources, assets and market positions.
The agreement follows the successful completion of a feasibility study in July 2002 and discussions between the parties at various times since then regarding the future of the project.
Estimates suggest total mineral resources of 16.4 billion tonnes, containing an average of 5.3 per cent heavy minerals. One deposit alone contains measured and indicated mineral resources of 2.67 billion tonnes averaging 4.0 per cent ilmenite, a titanium oxide. Recent drilling suggests that the actual grade mined could be higher.
The titanium dioxide industry has demonstrated stable and attractive returns over many years, and WMC Resource’s participation in the industry will make an important contribution to our efforts to grow and increase the diversity of our earnings.
Table of Contents

Technical Delivery
WMC Resources applies technical excellence and innovation to improve existing operations and to create new opportunities. During 2002, we formed a new company-wide Technical Delivery Group, which includes the Belmont (Western Australia) laboratories, to share technical solutions across our business in an integrated and efficient way. This increased focus on technical outcomes recognises the importance of technology to our future.
Table of Contents

Definitions
ASX
Australian Stock Exchange Limited.
Commissioned
Bringing into operation of plant and/or equipment to a rate approximating its design capacity.
Consolidated
The 100% consolidation of entities controlled by WMC together with the equity method consolidation of corporate entities over which it exerts significant influence but not control. Unincorporated joint ventures are consolidated on a proportionate basis.
Di-ammonium Phosphate – DAP
A hi-analysis fertilizer used on broad-acre crops such as cereals, row crops, legumes, pastures, fodder and horticultural crops to provide the essential nutrients and phosphorus.
Frequency Rate (FR)
Number of lost time and medically treated injuries per million hours exposure
GAAP
Generally accepted accounting principles.
Interest Cover
Earnings before interest and taxes / Gross interest expense incurred (excluding interest expense related to cross currency swaps and interest rate swaps) before subtracting capitalised interest.
LME
London Metal Exchange.
Lost Time Injury (LTI)
An injury that results in at least one full shift being lost at some time (not necessarily immediately) after the shift during which the injury occurred, providing it is not a rostered day off.
Matte
The output of a smelter, being predominantly sulphides of the metal plus some impurities. This is typically fed to a refinery for pure metal production. Matte can be sold as a commercial product in its own right.
Medically Treated Injury (MTI)
Injuries that do not result in lost work days, but require medical treatment (including Restricted Work).
Mineral
A naturally occurring element or chemical compound.
Mono-ammonium Phosphate — MAP
Mono-ammounium phosphate is a fertilizer that assists with early crop growth and enhances phosphorous uptake in broad-acre crops. Oftern referred to as MAP.
Open Cut
A mine at the earth’s surface as distinct from an underground mine.
Operating Cashflow to Debt
Annualised operating cashflow / Net debt.
Table of Contents

RONA
Business Units | Operating Profit Before Tax and Significant Items/Net Assets | |
WMC Resources | Profit After Tax and Significant Items/Net Assets |
Sulphides
A compound of metal elements and sulphur.
Unit Cost of Sales
‘Unit Cost of Sales’ is ‘Total Cost of Sales’ less co-product revenue divided by product sold. ‘Total Cost of Sales’ includes all production and non product