UNITED STATES
SECURITIES AND EXCHANGE COMMISSION
Washington, D.C. 20549
FORM N-CSR
CERTIFIED SHAREHOLDER REPORT OF REGISTERED
MANAGEMENT INVESTMENT COMPANIES
Investment Company Act file number 811-21457
| | |
| Name of Fund: | | BlackRock Bond Allocation Target Shares |
| |
| Fund Address: | | 100 Bellevue Parkway, Wilmington, DE 19809 |
| |
| Name and address of agent for service: | | Donald C. Burke, Chief Executive Officer, BlackRock Bond Allocation Target Shares, 800 Scudders Mill Road, Plainsboro, NJ, 08536. Mailing address: P.O. Box 9011, Princeton, NJ, 08543-9011 |
Registrant’s telephone number, including area code: (800) 441-7762
Date of fiscal year end: 09/30/2007
Date of reporting period: 10/01/2006 – 09/30/2007
Item 1 – Report to Stockholders
EQUITIES FIXED INCOME REAL ESTATE LIQUIDITY ALTERNATIVES BLACKROCK SOLUTIONS
| | | | |
| BlackRock Bond Allocation | | | |  |
| Target Shares | | | |
ANNUAL REPORT | SEPTEMBER 30, 2007
Series S
Series C
Series M
NOT FDIC INSURED
MAY LOSE VALUE
NO BANK GUARANTEE
Table of Contents
A Letter to Shareholders
Dear Shareholder
The September reporting period took financial markets on a wild ride. While subprime mortgage woes dominated headlines for much of 2007, troubles intensified in the final months of the period, spawning a widespread “credit crunch” that crept into other areas of the market.
The U.S. Federal Reserve Board (“Fed”) and other countries’ central banks stepped in to inject liquidity into the markets and bolster investor confidence. The Fed cut the discount rate, the rate banks pay to borrow money directly from the Fed, from 6.25% to 5.25% in two moves in August and September. The central bankers also cut the more widely followed Federal Funds target rate, which had remained unchanged at 5.25% for over a year, to 4.75% in September. After a tumultuous summer, the dust began to settle toward period-end amid speculation that the worst of the credit crunch had passed.
Although heightened volatility and a weakening U.S. economy have been recurring themes throughout the past year, equity markets have displayed surprising resilience. Most recently, the credit turmoil dampened corporate merger-and-acquisition activity, a key source of strength for equity markets. However, market fundamentals have held firm, dividend payouts and share buybacks have continued to grow, and valuations remain attractive. These tailwinds generally have prevailed over the headwinds created by the slowing U.S. economy and troubled housing market.
In fixed income markets, mixed economic signals and the credit market debacle resulted in a flight to quality. At the height of the uncertainty, investors shunned bonds associated with the housing and credit markets in favor of higher-quality Treasury issues. The yield on 10-year Treasury issues, which touched 5.30% in June (its highest level in five years), fell to 4.59% by period-end, while prices correspondingly rose.
Against this backdrop, financial markets managed to post positive results for the 12-month period ended September 30, 2007:
| | | |
Total Returns as of September 30, 2007 | | 12-month | |
U.S. equities (Standard & Poor’s 500 Index) | | +16.44 | % |
Small cap U.S. equities (Russell 2000 Index) | | +12.34 | % |
International equities (MSCI Europe, Australasia, Far East Index) | | +24.86 | % |
Fixed income (Lehman Brothers U.S. Aggregate Index) | | + 5.14 | % |
Tax-exempt fixed income (Lehman Brothers Municipal Bond Index) | | + 3.10 | % |
High yield bonds (Lehman Brothers U.S. Corporate High Yield 2% Issuer Cap Index) | | + 7.62 | % |
Past performance is no guarantee of future results. Index performance shown for illustrative purposes only. You cannot invest directly in an index.
As you navigate market volatility, we encourage you to review your investment goals with your financial professional and to make portfolio changes, as needed. For more market insight, we invite you to view “What’s Ahead in 2007: Third Quarter Update” and “Are You Prepared for Volatility?” at www.blackrock.com/funds.
We thank you for entrusting BlackRock with your investment assets, and we look forward to continuing to serve you in the months and years ahead.
|
| Sincerely, |
|
 |
| Robert C. Doll, Jr. |
| Vice Chairman, BlackRock, Inc. |
THIS PAGE NOT PART OF YOUR FUND REPORT
Portfolio Summary | Series S Portfolio |
Management Commentary
How did the Portfolio perform?
| • | | The Portfolio’s total return lagged that of its benchmark for the one-year period. (The Merrill Lynch 1-3 Year Treasury Index is the de facto benchmark used for fund reporting purposes. However, comparisons of the Portfolio’s performance to that of the benchmark typically will not be meaningful because an investment in the BATS Series S Portfolio represents only a portion of a client’s investment in a broader short-duration account.) |
What factors influenced performance?
| • | | The first eight months of the fiscal year were relatively uneventful in comparison to the final four. Bond yields rose sharply (and prices fell) in early June, with the 10-year Treasury yield touching 5.33%, its highest level since 2001. This was largely based on stronger-than-expected economic readings, which led investors to believe that the Fed would keep short-term interest rates on hold for some time. Just weeks later, perceptions changed dramatically amid escalating troubles in the subprime mortgage market. |
| • | | Financial markets were highly volatile as fears spread about which investments might have exposure to the subprime segment. The liquidity of mortgage-backed securities began to decrease, which led to a wider liquidity crisis as banks restricted their short-term lending. The Fed and other countries’ central banks stepped in to inject liquidity into the markets and to bolster investor confidence. The Fed cut the discount rate from 6.25% to 5.25% and the federal funds rate from 5.25% to 4.75% in an effort to offset deteriorating credit conditions in the housing market and to help prevent any negative spillover in the economy. |
| • | | Despite the volatility, the long end of the curve held fairly steady year-over-year, while yields on the short end dropped dramatically (and prices correspondingly rose). Spread sectors, including mortgage-backed securities (MBS), commercial MBS (CMBS), investment-grade corporate bonds, asset-backed securities (ABS) and U.S. agency issues, which had outperformed Treasuries in the first half of the fiscal year, lost ground in the latter half as investors fled to the perceived safety of Treasury issues. |
| • | | The Portfolio’s bias toward a steepening yield curve benefited performance as short-term interest rates fell and the curve steepened. Our relatively short duration also contributed to results, as our lower interest-rate sensitivity offered some cushion from market volatility. |
| • | | The Portfolio’s position in spread sectors detracted from performance, particularly late in the period. Our benchmark is a 100% Treasury index, whereas the Portfolio has the ability to invest in spread assets in an effort to achieve yields above those offered by Treasuries alone. Our exposure to spread product detracted from performance amid the flight to quality that occurred late in the period. |
Describe recent portfolio activity.
| • | | The Portfolio continued to emphasize high-quality, short-duration assets, particularly CMBS, adjustable-rate mortgages (ARMs) and collateralized mortgage obligations (CMOs). We also maintained exposure to high-quality corporate bonds. As credit spreads widened across all fixed income assets late in the fiscal year, we took the opportunity to increase exposure to corporate bonds, which had become available at attractive prices. |
| • | | At period-end, the Portfolio continued to favor high-quality spread product, such as MBS, CMBS and ABS, with less exposure to corporate credit. The Portfolio had a neutral yield curve bias at period-end, and a modestly short duration relative to its benchmark. |
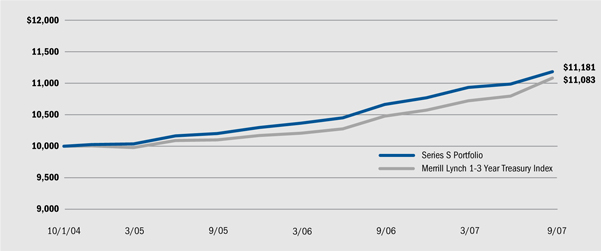
Total Return Based on a $10,000 Investment
| | | | | | |
2 | | ANNUAL REPORT | | SEPTEMBER 30, 2007 | | |
| | |
| Portfolio Summary (concluded) | | Series S Portfolio |
Performance Summary for the Period Ended September 30, 2007
| | | | | | |
| | | Average Annual Total Return | |
| | | 1 Year | | | From Inception | |
Series S Portfolio | | +4.88 | % | | +3.79 | % |
Merrill Lynch 1-3 Year Treasury Index | | +5.80 | % | | +3.49 | % |
The performance information above and on the previous page includes information relating to the Portfolio since the commencement of operations of the Portfolio on 10/1/04.
Past performance is not predictive of future results. The graph and table do not reflect the deduction of taxes that a shareholder would pay on Portfolio distributions or the redemption of shares.
Expense Example
As a shareholder of the Portfolio, you incur ongoing costs and other Portfolio expenses. However, BlackRock has agreed irrevocably to waive all fees and reimburse all expenses, except extraordinary expenses and interest expenses, incurred by the Portfolio. This Expense Example is intended to help you understand your ongoing costs (in dollars) of investing in the Portfolio and to compare these costs with the ongoing costs of investing in other mutual funds.
The Expense Example below is based on an investment of $1,000 invested at the beginning of the period and held for the entire period April 1, 2007 to September 30, 2007.
The information under “Actual Expenses,” together with the amount you invested, allows you to estimate actual expenses incurred over the reporting period. Simply divide your account value by $1,000 (for example, an $8,600 account value divided by $1,000 = 8.60) and multiply the result by the cost shown for your shares, in the row entitled “Expenses Incurred During Period,” to estimate the expenses incurred on your account during this period.
The information under “Hypothetical Expenses” provides information about hypothetical account values and hypothetical expenses based on the Portfolio’s actual expense ratio and an assumed rate of return of 5% per year before expenses, which is not the Portfolio’s actual return. The hypothetical account values and expenses may not be used to estimate the actual ending account balance or expense you incurred for the period. You may use this information to compare the ongoing costs of investing in the Portfolio and other funds. To do so, compare this 5% hypothetical example with the 5% hypothetical examples that appear in the shareholder reports of the other funds.
Please note that the expenses shown in the table are meant to highlight your ongoing costs only and do not reflect any transactional costs, such as front and back end sales charges (loads) or redemption fees, where applicable. Therefore, the hypothetical information is useful in comparing ongoing costs only, and will not help you determine the relative total costs of owning different funds. Participants in wrap-fee programs may pay a single aggregate fee to the program sponsor for all costs and expenses of the wrap-fee programs. In addition, if these transactional costs were included, your costs would have been higher.
| | | | | | | | | | | | | | | | |
| | | Actual | | Hypothetical |
| | | Beginning Account Value April 1, 2007 | | Ending Account Value September 30, 2007 | | Expenses Incurred During the Period | | Beginning Account Value April 1, 2007 | | Ending Account Value September 30, 2007 | | Expenses Incurred During the Period |
Series S Portfolio | | $ | 1,000.00 | | $ | 1,022.80 | | — | | $ | 1,000.00 | | $ | 1,025.00 | | — |
For shares of the Portfolio, expenses are equal to the annualized expense ratio of 0.00%, multiplied by the average account value over the period, multiplied by 183/365 (to reflect the one-half year period). BlackRock has agreed irrevocably to waive all fees and reimburse all expenses, except extraordinary expenses and interest expense, incurred by the Portfolio.
Portfolio Profile as of September 30, 2007
| | | |
Credit Quality (% of long-term investments)1,3 | | | |
AAA | | 97.3 | % |
AA | | 0.8 | |
A | | 1.7 | |
BBB | | 0.2 | |
| |
Portfolio Statistics3 | | | |
Average maturity (years) | | 1.84 | |
Effective Duration2 | | 0.83 | |
1 | Using the higher of Standard & Poor’s (“S&P’s”) or Moody’s Investors Service (“Moody’s”) ratings. |
2 | Duration measures a Portfolio’s price risk. Each year of duration represents an expected 1% change in the net asset value of the Portfolio for every 1% change in interest rates. Effective duration is typically calculated for bonds with embedded options and assumes that expected cash flows will fluctuate as interest rates change. |
Although the credit quality and statistics listed above were current as of the periods indicated, the Portfolio is actively managed and its composition will vary.
| | | | | | |
| | | ANNUAL REPORT | | SEPTEMBER 30, 2007 | | 3 |
Portfolio Summary | Series C Portfolio |
Management Commentary
How did the Portfolio perform?
| • | | The Portfolio’s total return outperformed that of its benchmark for the one-year period. (The Lehman Brothers U.S. Credit Index is the de facto benchmark used for fund reporting purposes. However, comparisons of the Portfolio’s performance to that of the benchmark typically will not be meaningful, because an investment in the BATS Series C Portfolio represents only a portion of a client’s investment in a broader fixed income account.) |
| • | | The first eight months of the fiscal year were relatively uneventful in comparison to the final four. Bond yields rose sharply (and prices fell) in early June, with the 10-year Treasury yield touching 5.33%, its highest level since 2001. This was largely based on stronger-than-expected economic readings, which led investors to believe that the Fed would keep short-term interest rates on hold for some time. Just weeks later, perceptions changed dramatically amid escalating troubles in the subprime mortgage market. |
| • | | Financial markets were highly volatile as fears spread about which investments might have exposure to the subprime segment. The liquidity of mortgage-backed securities began to decrease, which led to a wider liquidity crisis as banks restricted their short-term lending. The Fed and other countries’ central banks stepped in to inject liquidity into the markets and to bolster investor confidence. The Fed cut the discount rate from 6.25% to 5.25% and the federal funds rate from 5.25% to 4.75% in an effort to offset deteriorating credit conditions in the housing market and to help prevent any negative spillover in the economy. |
| • | | Spread sectors, including mortgage-backed securities (MBS), commercial MBS (CMBS), investment-grade corporate bonds, asset-backed securities (ABS) and U.S. agency issues, which had outperformed Treasuries in the first half of the fiscal year, lost ground in the latter half as investors fled to the perceived safety of Treasury issues. |
What factors influenced performance?
| • | | Spreads widened across fixed income sectors as investors diverted assets into Treasury securities, and our underweight exposure to corporate bonds proved advantageous. The Portfolio also benefited from favorable security selection within the corporate market. |
Describe recent Portfolio activity.
| • | | The Portfolio was primarily invested in investment-grade corporate credit with a small allocation to taxable municipal bonds. The Portfolio’s cash position increased as we became concerned about the severity of the credit and liquidity crisis. |
| • | | In the second half of the period, we reduced our large underweight to the investment-grade corporate market by adding bonds in both the new-issue and secondary markets. We continue to look to the new-issue calendar for potential opportunities, but will remain cautious in our approach. |
Describe Portfolio positioning at period-end.
| • | | Relative to its benchmark, the Portfolio remained underweight in the investment-grade corporate market. From a sector perspective, we are overweight financials and underweight utilities and non-corporate sectors. |
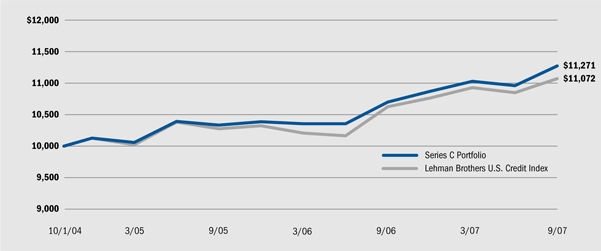
Total Return Based on a $10,000 Investment
| | | | | | |
4 | | ANNUAL REPORT | | SEPTEMBER 30, 2007 | | |
| | |
| Portfolio Summary (concluded) | | Series C Portfolio |
Performance Summary for the Period Ended September 30, 2007
| | | | | | |
| | | Average Annual Total Return | |
| | | 1 Year | | | From Inception | |
Series C Portfolio | | +5.37 | % | | +4.07 | % |
Lehman Brothers U.S. Credit Index | | +4.23 | % | | +3.45 | % |
The performance information above and on the previous page includes information relating to the Portfolio since the commencement of operations of the Portfolio on 10/1/04.
Past performance is not predictive of future results. The graph and table do not reflect the deduction of taxes that a shareholder would pay on Portfolio distributions or the redemption of shares.
Expense Example
As a shareholder of the Portfolio, you incur ongoing costs and other Portfolio expenses. However, BlackRock has agreed irrevocably to waive all fees and reimburse all expenses, except extraordinary expenses and interest expenses, incurred by the Portfolio. This Expense Example is intended to help you understand your ongoing costs (in dollars) of investing in the Portfolio and to compare these costs with the ongoing costs of investing in other mutual funds.
The Expense Example below is based on an investment of $1,000 invested at the beginning of the period and held for the entire period April 1, 2007 to September 30, 2007.
The information under “Actual Expenses,” together with the amount you invested, allows you to estimate actual expenses incurred over the reporting period. Simply divide your account value by $1,000 (for example, an $8,600 account value divided by $1,000 = 8.60) and multiply the result by the cost shown for your shares, in the row entitled “Expenses Incurred During Period,” to estimate the expenses incurred on your account during this period.
The information under “Hypothetical Expenses” provides information about hypothetical account values and hypothetical expenses based on the Portfolio’s actual expense ratio and an assumed rate of return of 5% per year before expenses, which is not the Portfolio’s actual return. The hypothetical account values and expenses may not be used to estimate the actual ending account balance or expense you incurred for the period. You may use this information to compare the ongoing costs of investing in the Portfolio and other funds. To do so, compare this 5% hypothetical example with the 5% hypothetical examples that appear in the shareholder reports of the other funds.
Please note that the expenses shown in the table are meant to highlight your ongoing costs only and do not reflect any transactional costs, such as front and back end sales charges (loads) or redemption fees, where applicable. Therefore, the hypothetical information is useful in comparing ongoing costs only, and will not help you determine the relative total costs of owning different funds. Participants in wrap-fee programs may pay a single aggregate fee to the program sponsor for all costs and expenses of the wrap-fee programs. In addition, if these transactional costs were included, your costs would have been higher.
| | | | | | | | | | | | | | | | | | |
| | | Actual | | Hypothetical |
| | | Beginning Account Value April 1, 2007 | | Ending Account Value September 30, 2007 | | Expenses Incurred During the Period | | Beginning Account Value April 1, 2007 | | Ending Account Value September 30, 2007 | | Expenses Incurred During the Period |
Series C Portfolio | | $ | 1,000.00 | | $ | 1,021.90 | | $ | 1.01 | | $ | 1,000.00 | | $ | 1,023.98 | | $ | 1.02 |
For shares of the Portfolio, expenses are equal to the annualized expense ratio of 0.20%, multiplied by the average account value over the period, multiplied by 183/365 (to reflect the one-half year period). BlackRock has agreed irrevocably to waive all fees and reimburse all expenses, except extraordinary expenses and interest expense, incurred by the Portfolio.
Portfolio Profile as of September 30, 2007
| | | |
Credit Quality (% of long-term investments)1,3 | | | |
AAA | | 26.0 | % |
AA | | 32.8 | |
A | | 24.1 | |
BBB | | 17.1 | |
| | |
Portfolio Statistics3 | | |
Average maturity (years) | | 9.80 |
Effective Duration2 | | 5.29 |
1 | Using the higher of S&P’s or Moody’s ratings. |
2 | Duration measures a Portfolio’s price risk. Each year of duration represents an expected 1% change in the net asset value of the Portfolio for every 1% change in interest rates. Effective duration is typically calculated for bonds with embedded options and assumes that expected cash flows will fluctuate as interest rates change. |
Although the credit quality and statistics listed above were current as of the periods indicated, the Portfolio is actively managed and its composition will vary.
| | | | | | |
| | | ANNUAL REPORT | | SEPTEMBER 30, 2007 | | 5 |
Portfolio Summary | Series M Portfolio |
Management Commentary
How did the Portfolio perform?
| • | | The Portfolio’s total return lagged that of its benchmark for the one-year period. (The Lehman Brothers MBS Index is the de facto benchmark used for fund reporting purposes. However, comparisons of the Portfolio’s performance to that of the benchmark typically will not be meaningful because an investment in the BATS Series M Portfolio represents only a portion of a client’s investment in a broader fixed income account.) |
What factors influenced performance?
| • | | The first eight months of the fiscal year were relatively uneventful in comparison to the final four. Bond yields rose sharply (and prices fell) in early June, with the 10-year Treasury yield touching 5.33%, its highest level since 2001. This was largely based on stronger-than-expected economic readings, which led investors to believe that the Fed would keep short-term interest rates on hold for some time. Just weeks later, perceptions changed dramatically amid escalating troubles in the subprime mortgage market. |
| • | | Financial markets were highly volatile as fears spread about which investments might have exposure to the subprime segment. The liquidity of mortgage-backed securities began to decrease, which led to a wider liquidity crisis as banks restricted their short-term lending. The Fed and other countries’ central banks stepped in to inject liquidity into the markets and to bolster investor confidence. The Fed cut the discount rate from 6.25% to 5.25% and the federal funds rate from 5.25% to 4.75% in an effort to offset deteriorating credit conditions in the housing market and to help prevent any negative spillover in the economy. |
| • | | Spread sectors, including mortgage-backed securities (MBS), commercial MBS (CMBS), investment-grade corporate bonds, asset-backed securities (ABS) and U.S. agency issues, which had outperformed Treasuries in the first half of the fiscal year, lost ground in the latter half as investors fled to the perceived safety of Treasury issues. |
| • | | The aforementioned financial crisis caused significant underperformance in illiquid mortgage securities regardless of quality. Spreads widened across fixed income sectors as investors diverted assets into Treasury securities. Given our focus on spread product, the Portfolio’s relative performance suffered accordingly. |
| • | | On the positive side, the Portfolio’s bias toward a steepening yield curve benefited performance as short-term interest rates fell and the curve steepened. Our relatively conservative (i.e., high quality) mortgage position also proved advantageous. |
Describe recent portfolio activity.
| • | | We changed the Portfolio’s structure significantly in the second half of the fiscal year to take advantage of liquidations of high-quality spread product. We were able to obtain these positions at relatively attractive prices. Purchases were focused on the highest-quality mortgage product, which we believe will suffer less and potentially benefit amid a continued slowdown in the housing market. |
| • | | We maintained exposure to 15- and 30-year bonds, with a preference for higher-coupon mortgage issues. We also maintained small, non-indexed positions in hybrid adjustable-rate mortgages (ARMs), collateralized mortgage obligations (CMOs) and ABS, while adding to positions in CMBS. |
Describe Portfolio positioning at period-end.
| • | | Based on the fundamentals, we believe current valuations for mortgages are attractive. At period-end, the Portfolio was positioned in high-quality MBS whose prices had decreased to levels we consider unsustainable. |
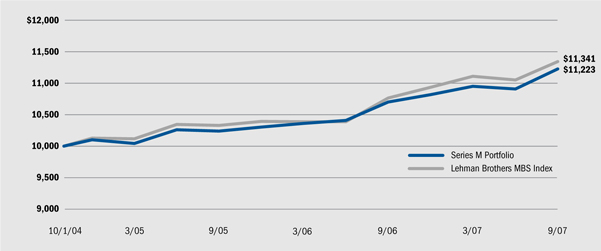
Total Return Based on a $10,000 Investment
| | | | | | |
6 | | ANNUAL REPORT | | SEPTEMBER 30, 2007 | | |
| | |
Portfolio Summary (concluded) | | Series M Portfolio |
Performance Summary for the Period Ended September 30, 2007
| | | | | | |
| | | Average Annual Total Return | |
| | | 1 Year | | | From Inception | |
Series M Portfolio | | +4.88 | % | | +3.92 | % |
Lehman Brothers MBS Index | | +5.39 | % | | +4.28 | % |
The performance information above and on the previous page includes information relating to the Portfolio since the commencement of operations of the Portfolio on 10/1/04.
Past performance is not predictive of future results. The graph and table do not reflect the deduction of taxes that a shareholder would pay on Portfolio distributions or the redemption of shares.
Expense Example
As a shareholder of the Portfolio, you incur ongoing costs and other Portfolio expenses. However, BlackRock has agreed irrevocably to waive all fees and reimburse all expenses, except extraordinary expenses and interest expenses, incurred by the Portfolio. This Expense Example is intended to help you understand your ongoing costs (in dollars) of investing in the Portfolio and to compare these costs with the ongoing costs of investing in other mutual funds.
The Expense Example below is based on an investment of $1,000 invested at the beginning of the period and held for the entire period April 1, 2007 to September 30, 2007.
The information under “Actual Expenses,” together with the amount you invested, allows you to estimate actual expenses incurred over the reporting period. Simply divide your account value by $1,000 (for example, an $8,600 account value divided by $1,000 = 8.60) and multiply the result by the cost shown for your shares, in the row entitled “Expenses Incurred During Period,” to estimate the expenses incurred on your account during this period.
The information under “Hypothetical Expenses” provides information about hypothetical account values and hypothetical expenses based on the Portfolio’s actual expense ratio and an assumed rate of return of 5% per year before expenses, which is not the Portfolio’s actual return. The hypothetical account values and expenses may not be used to estimate the actual ending account balance or expense you incurred for the period. You may use this information to compare the ongoing costs of investing in the Portfolio and other funds. To do so, compare this 5% hypothetical example with the 5% hypothetical examples that appear in the shareholder reports of the other funds.
Please note that the expenses shown in the table are meant to highlight your ongoing costs only and do not reflect any transactional costs, such as front and back end sales charges (loads) or redemption fees, where applicable. Therefore, the hypothetical information is useful in comparing ongoing costs only, and will not help you determine the relative total costs of owning different funds. Participants in wrap-fee programs may pay a single aggregate fee to the program sponsor for all costs and expenses of the wrap-fee program. In addition, if these transactional costs were included, your costs would have been higher.
| | | | | | | | | | | | | | | | |
| | | Actual | | Hypothetical |
| | | Beginning Account Value April 1, 2007 | | Ending Account Value September 30, 2007 | | Expenses Incurred During the Period | | Beginning Account Value April 1, 2007 | | Ending Account Value September 30, 2007 | | Expenses Incurred During the Period |
Series M Portfolio | | $ | 1,000.00 | | $ | 1,024.80 | | — | | $ | 1,000.00 | | $ | 1,025.00 | | — |
For shares of the Portfolio, expenses are equal to the annualized expense ratio of 0.00%, multiplied by the average account value over the period, multiplied by 183/365 (to reflect the one-half year period). BlackRock has agreed irrevocably to waive all fees and reimburse all expenses, except extraordinary expenses and interest expense, incurred by the Portfolio.
Portfolio Profile as of September 30, 2007
| | | |
Credit Quality (% of long-term investments)1,3 | | | |
AAA | | 100.0 | % |
| |
Portfolio Statistics3 | | | |
Average maturity (years) | | 5.05 | |
Effective Duration2 | | 4.58 | |
1 | Using the higher of S&P’s or Moody’s ratings. |
2 | Duration measures a Portfolio’s price risk. Each year of duration represents an expected 1% change in the net asset value of the Portfolio for every 1% change in interest rates. Effective duration is typically calculated for bonds with embedded options and assumes that expected cash flows will fluctuate as interest rates change. |
Although the credit quality and statistics listed above were current as of the periods indicated, the Portfolio is actively managed and its composition will vary.
| | | | | | |
| | | ANNUAL REPORT | | SEPTEMBER 30, 2007 | | 7 |
Schedule of Investments As of September 30, 2007
Series S Portfolio
(Percentages shown are based on Net Assets)
| | | | | | | | |
| | | Maturity | | Par (000) | | Value |
Trust Preferred Stocks — 1.4% | | | | | | | | |
Finance — 0.9% | | | | | | | | |
Bank of America Capital Trust XV, Capital Securities | | | | | | | | |
6.38%(b) | | 06/01/56 | | $ | 150 | | $ | 136,642 |
Goldman Sachs Capital Trust II, Unsecured Notes | | | | | | | | |
6.35%(b)(c) | | | | | 175 | | | 158,923 |
Lehman Brothers Holdings, Inc., Capital Securities | | | | | | | | |
6.37%(b)(c) | | | | | 125 | | | 117,336 |
| | | | | | | | |
| | | | | | | | 412,901 |
| | | | | | | | |
Yankee — 0.5% | | | | | | | | |
Finance — 0.5% | | | | | | | | |
Credit Suisse (Guernsey), Unsecured Notes | | | | | | | | |
6.25%(b)(c)(d) | | | | | 195 | | | 190,659 |
| | | | | | | | |
TOTAL TRUST PREFERRED STOCKS
(Cost $645,022) | | | | | | | | 603,560 |
| | | | | | | | |
Mortgage Pass-Throughs — 14.4% | | | | | | | | |
Federal Home Loan Mortgage Assoc. ARM | | | | | | | | |
4.40%(b) | | 06/01/33 | | | 53 | | | 52,327 |
Federal Home Loan Mortgage Corp. ARM | | | | | | | | |
4.99%(b) | | 07/01/34 | | | 71 | | | 71,038 |
4.75%(b) | | 04/01/35 | | | 138 | | | 137,735 |
4.72%(b) | | 08/01/35 | | | 714 | | | 705,898 |
6.04%(b) | | 11/01/36 | | | 1,142 | | | 1,159,540 |
5.98%(b) | | 01/01/37 | | | 1,170 | | | 1,174,138 |
Federal National Mortgage Assoc. 30 Year TBA | | | | | | | | |
6.00% | | 10/01/37 | | | 200 | | | 200,250 |
Federal National Mortgage Assoc. ARM | | | | | | | | |
4.05%(b) | | 10/01/33 | | | 202 | | | 200,577 |
4.27%(b) | | 01/01/34 | | | 327 | | | 324,831 |
4.78%(b) | | 07/01/34 | | | 102 | | | 100,824 |
4.86%(b) | | 06/01/35 | | | 267 | | | 265,547 |
4.64%(b) | | 07/01/35 | | | 283 | | | 281,226 |
5.33%(b) | | 10/01/35 | | | 394 | | | 390,790 |
Government National Mortgage Assoc. II ARM | | | | | | | | |
5.00%(b) | | 10/34-11/34 | | | 540 | | | 540,882 |
4.00%(b) | | 07/20/35 | | | 674 | | | 675,665 |
| | | | | | | | |
TOTAL MORTGAGE PASS-THROUGHS
(Cost $6,286,229) | | | | | | | | 6,281,268 |
| | | | | | | | |
Collateralized Mortgage Obligations — 25.0% | | | | | | | | |
Banc of America Funding Corp., Series 04-C, Class 4A1 | | | | | | | | |
5.83%(b) | | 12/20/34 | | | 40 | | | 39,585 |
Bear Stearns Mortgage Trust, Series 04-13, Class A1 | | | | | | | | |
5.50%(b) | | 11/25/34 | | | 31 | | | 31,344 |
Bear Stearns Mortgage Trust, Series 04-7, Class 4A | | | | | | | | |
5.22%(b) | | 10/25/34 | | | 104 | | | 105,045 |
Countrywide Alternative Loan Trust, Series 05-28CB, Class 1A5 | | | | | | | | |
5.50% | | 08/25/35 | | | 68 | | | 67,859 |
Federal Home Loan Mortgage Corp., Series 3128, Class BA | | | | | | | | |
5.00% | | 01/15/24 | | | 784 | | | 784,771 |
Federal Home Loan Mortgage Corp., Series 3162, Class 0A | | | | | | | | |
6.00% | | 10/15/26 | | | 833 | | | 843,200 |
Federal Home Loan Mortgage Corp., Series 3280, Class MA | | | | | | | | |
5.50% | | 05/15/26 | | | 3,313 | | | 3,332,950 |
Federal National Mortgage Assoc. Series 06-99, Class PA | | | | | | | | |
5.50% | | 05/25/30 | | | 1,630 | | | 1,637,695 |
Federal National Mortgage Assoc., Series 03-67, Class GL | | | | | | | | |
3.00% | | 01/25/25 | | | 1,098 | | | 1,082,500 |
Federal National Mortgage Assoc., Series 05, Class PA | | | | | | | | |
5.50% | | 09/25/24 | | | 361 | | | 361,247 |
Federal National Mortgage Assoc., Series 05-48, Class OH | | | | | | | | |
5.00% | | 07/25/26 | | | 331 | | | 330,684 |
Federal National Mortgage Assoc., Series 06, Class 0A | | | | | | | | |
6.00% | | 03/25/27 | | | 838 | | | 847,266 |
Federal National Mortgage Assoc., Series 06, Class JA | | | | | | | | |
5.50% | | 05/25/20 | | | 190 | | | 190,679 |
Federal National Mortgage Assoc., Series 3186, Class NA | | | | | | | | |
6.00% | | 07/15/27 | | | 442 | | | 448,430 |
First Union National Bank Commercial Mortgage Trust, Series 00-C1, Class A2 | | | | | | | | |
7.84% | | 03/15/10 | | | 275 | | | 290,948 |
Goldman Sachs Residential Mortgage Loan Trust, Series 05, Class 1A1 | | | | | | | | |
4.93%(b) | | 10/25/35 | | | 278 | | | 277,982 |
Structured Mortgage Loan Trust, Series 04-6, Class 4A1 | | | | | | | | |
4.84%(b) | | 06/25/34 | | | 59 | | | 58,581 |
Wells Fargo Mortgage Backed Securities Trust, Series 04-EE, Class 2A1 | | | | | | | | |
3.99%(b) | | 12/25/34 | | | 135 | | | 133,178 |
| | | | | | | | |
TOTAL COLLATERALIZED MORTGAGE OBLIGATIONS
(Cost $10,840,763) | | | | | | | | 10,863,944 |
| | | | | | | | |
Commercial Mortgage Backed Securities — 14.8% | | | | | | | | |
ARM Trust, Series 05-9, Class 5A1 | | | | | | | | |
5.40%(b) | | 11/25/35 | | | 39 | | | 38,941 |
Banc of America Mortgage Securities, Series 04-A, Class 2A2 | | | | | | | | |
4.10%(b) | | 02/25/34 | | | 241 | | | 237,541 |
Bear Stearns Commercial Mortgage Securities, Inc., Series 00-WF2, Class A2 | | | | | | | | |
7.32% | | 10/15/32 | | | 500 | | | 527,354 |
Chase Manhattan Bank-First Union National Bank, Series 99-1, Class A2 | | | | | | | | |
7.44% | | 08/15/31 | | | 659 | | | 682,409 |
Commercial Mortgage Asset Trust, Series 99-C1, Class A3 | | | | | | | | |
6.64% | | 01/17/32 | | | 289 | | | 294,721 |
Credit Suisse First Boston Mortgage Securities Corp., Series 02, Class A3 | | | | | | | | |
5.60% | | 07/15/35 | | | 250 | | | 253,864 |
See accompanying notes to financial statements.
| | | | | | |
8 | | ANNUAL REPORT | | SEPTEMBER 30, 2007 | | |
| | |
| Schedule of Investments (continued) | | Series S Portfolio |
| | (Percentages shown are based on Net Assets) |
| | | | | | | | |
| | | Maturity | | Par (000) | | Value |
Commercial Mortgage Backed Securities (Continued) | | | | | | | | |
First Union-Lehman Brothers-Bank of America Commercial Mortgage Trust, Series 98-C2, Class A2 | | | | | | | | |
6.56% | | 11/18/35 | | $ | 410 | | $ | 410,740 |
General Motors Acceptance Corp. Commercial Mortgage Securities, Inc., Series 98, Class A2 | | | | | | | | |
6.42% | | 05/15/35 | | | 233 | | | 233,913 |
General Motors Acceptance Corp. Commercial Mortgage Securities, Inc., Series 99, Class A2 | | | | | | | | |
6.18% | | 05/15/33 | | | 252 | | | 254,194 |
General Motors Acceptance Corp. Commercial Mortgage Securities, Inc., Series 00-C1, Class A2 | | | | | | | | |
7.72% | | 03/15/33 | | | 219 | | | 229,679 |
JPMorgan Chase Commercial Mortgage Securities Corp., Series 01, Class A3 | | | | | | | | |
6.43% | | 06/15/11 | | | 315 | | | 328,720 |
JPMorgan Chase Commercial Mortgage Securities Corp., Series 01-CIB2, Class A2 | | | | | | | | |
6.24% | | 10/15/10 | | | 125 | | | 125,983 |
JPMorgan Mortgage Trust, Series 07-A1, Class 4A1 | | | | | | | | |
4.07%(b) | | 07/25/35 | | | 927 | | | 913,228 |
Lehman Brothers-UBS Commercial Mortgage Trust, Series 03-C7, Class A2 | | | | | | | | |
4.06%(b) | | 08/15/10 | | | 830 | | | 818,656 |
Morgan Stanley Dean Witter Capital I, Inc., Series 01, Class A4 | | | | | | | | |
6.39% | | 07/15/33 | | | 275 | | | 286,398 |
Salomon Brothers Mortgage Securities VII, Series 99-C1, Class A2 | | | | | | | | |
7.15%(b) | | 01/18/09 | | | 154 | | | 156,679 |
Salomon Brothers Mortgage Securities VII, Series 00-C3, Class A2 | | | | | | | | |
6.59% | | 11/18/10 | | | 500 | | | 518,016 |
Salomon Brothers Mortgage Securities VII, Series 02-KEY2, Class A2 | | | | | | | | |
4.47% | | 03/18/36 | | | 113 | | | 111,709 |
| | | | | | | | |
TOTAL COMMERCIAL MORTGAGE BACKED SECURITIES
(Cost $6,404,906) | | | | | | | | 6,422,745 |
| | | | | | | | |
Asset Backed Securities — 15.4% | | | | | | | | |
Bear Stearns, Inc., Series 06-PC1, Class A1 | | | | | | | | |
5.21%(b) | | 01/25/29 | | | 46 | | | 45,479 |
Carrington Mortgage Loan Trust, Series 06-NC4, Class A1 | | | | | | | | |
5.18%(b) | | 10/25/36 | | | 336 | | | 334,479 |
Carrington Mortgage Loan Trust, Series 06-RFC1, Class A1 | | | | | | | | |
5.17%(b) | | 05/25/36 | | | 133 | | | 132,802 |
Chase Credit Card Master Trust, Series 02-7, Class A | | | | | | | | |
5.87%(b) | | 02/15/10 | | | 800 | | | 800,114 |
Chase Issuance Trust, Series 05, Class A5 | | | | | | | | |
5.77%(b) | | 02/15/12 | | | 900 | | | 897,036 |
Citibank Credit Card Issuance Trust, Series 06-A2, Class A2 | | | | | | | | |
4.85% | | 02/10/11 | | | 400 | | | 399,887 |
Citigroup Mortgage Loan Trust, Inc., Series 06-HE1, Class A1 | | | | | | | | |
5.19%(b) | | 01/25/36 | | | 6 | | | 6,252 |
Countrywide Certificates, Series 06-IM1, Class A1 | | | | | | | | |
5.22%(b) | | 09/25/28 | | | 15 | | | 14,867 |
Ford Credit Auto Owner Trust, Series 05-A, Class A3 | | | | | | | | |
3.48% | | 11/15/08 | | | 20 | | | 20,231 |
Ford Credit Auto Owner Trust, Series 06-A, Class A3 | | | | | | | | |
5.05% | | 03/15/10 | | | 448 | | | 446,962 |
GSAA Home Equity Trust, Series 04-11, Class 2A2 | | | | | | | | |
5.45%(b) | | 12/25/34 | | | 25 | | | 24,616 |
Honda Auto Receivables Owner Trust, Series 04-3, Class A3 | | | | | | | | |
2.91% | | 10/20/08 | | | 22 | | | 22,050 |
MBNA Credit Card Master Notes Trust, Series 03-A6, Class A6 | | | | | | | | |
2.75% | | 10/15/10 | | | 300 | | | 295,763 |
Nissan Auto Receivables Owner Trust, Series 05-A, Class A3 | | | | | | | | |
3.54% | | 10/15/08 | | | 32 | | | 32,000 |
Nissan Auto Receivables Owner Trust, Series 06-C, Class A3 | | | | | | | | |
5.44% | | 04/15/10 | | | 500 | | | 501,360 |
Residential Asset Mortgage Products, Inc., Series 05-RZ4, Class A1 | | | | | | | | |
5.25%(b) | | 11/25/35 | | | 145 | | | 144,828 |
Residential Asset Securities Corp., Series 06-EMX6, Class A1 | | | | | | | | |
5.19%(b) | | 10/25/30 | | | 332 | | | 330,087 |
Residential Asset Securities Corp., Series 06-KS7, Class A1 | | | | | | | | |
5.18%(b) | | 09/25/36 | | | 314 | | | 312,870 |
Structured Asset Investment Loan Trust, | | | | | | | | |
5.21%(b) | | 01/25/36 | | | 118 | | | 117,828 |
Structured Asset Securities Corp., Series 06-WF2, Class A1 | | | | | | | | |
5.16%(b) | | 07/25/36 | | | 161 | | | 160,783 |
Student Loan Marketing Assoc. Student Loan Trust, Series 05-6, Class A5B | | | | | | | | |
5.37%(b) | | 07/27/26 | | | 800 | | | 799,227 |
USAA Auto Owner Trust, Series 05-4, Class A4 | | | | | | | | |
4.89% | | 08/15/12 | | | 500 | | | 498,726 |
USAA Auto Owner Trust, Series 06-1, Class A3 | | | | | | | | |
5.01% | | 09/15/10 | | | 349 | | | 348,663 |
World Omni Auto Receivables Trust, Series 2005-B, Class A3 | | | | | | | | |
4.40% | | 04/20/09 | | | 42 | | | 42,133 |
| | | | | | | | |
TOTAL ASSET BACKED SECURITIES
(Cost $6,740,392) | | | | | | | | 6,729,043 |
| | | | | | | | |
Corporate Bonds — 1.2% | | | | | | | | |
Finance — 0.9% | | | | | | | | |
John Deere Capital Corp., Unsecured Notes | | | | | | | | |
4.50%(e) | | 08/25/08 | | | 400 | | | 397,245 |
| | | | | | | | |
Oil & Gas — 0.1% | | | | | | | | |
Anadarko Petroleum Corp., Senior Unsecured Notes | | | | | | | | |
6.09%(b) | | 09/15/09 | | | 50 | | | 49,711 |
| | | | | | | | |
See accompanying notes to financial statements.
| | | | | | |
| | | ANNUAL REPORT | | SEPTEMBER 30, 2007 | | 9 |
| | |
| Schedule of Investments (concluded) | | Series S Portfolio |
| | (Percentages shown are based on Net Assets) |
| | | | | | | | | | |
| | | Maturity | | Par (000) | | | Value | |
Corporate Bonds (Continued) | | | | | | | | | | |
Retail Merchandising — 0.1% | | | | | | | | | | |
May Department Stores Co., Debentures | | | | | | | | | | |
7.90% | | 10/15/07 | | $ | 25 | | | $ | 25,013 | |
| | | | | | | | | | |
Transportation — 0.1% | | | | | | | | | | |
Union Pacific Corp., Unsecured Notes | | | | | | | | | | |
6.79% | | 11/09/07 | | | 25 | | | | 25,030 | |
| | | | | | | | | | |
Yankee — 0.0% | | | | | | | | | | |
Energy & Utilities — 0.0% | | | | | | | | | | |
ConocoPhillips Funding Co. (Australia), Unsecured Notes | | | | | | | | | | |
5.46%(b)(d) | | 04/09/09 | | | 25 | | | | 24,912 | |
| | | | | | | | | | |
TOTAL CORPORATE BONDS
(Cost $522,469) | | | | | | | | | 521,911 | |
| | | | | | | | | | |
| | | |
| | | | | Par/Shares (000) | | | | |
Short Term Investments — 28.2% | | | | | | | | | | |
Federal Home Loan Bank, Discount Notes | | | | | | | | | | |
4.00%(f) | | 10/01/07 | | | 4,000 | | | | 4,000,000 | |
4.76%(f) | | 10/05/07 | | | 6,000 | | | | 5,996,833 | |
Galileo Money Market Fund, 4.72%(g) | | | | | 2,281 | | | | 2,280,599 | |
| | | | | | | | | | |
TOTAL SHORT TERM INVESTMENTS
(Cost $12,277,432) | | | | | | | | | 12,277,432 | |
| | | | | | | | | | |
| | | |
| | | | | Number of
Contracts | | | Value | |
Put Options Purchased — 0.0% | | | | | | | | | | |
December Euro-dollar futures, Strike Price | | | | | | | | | | |
$94.625, Expires 12/17/07 | | | | | 12 | | | $ | 750 | |
December Euro-dollar futures, Strike Price | | | | | | | | | | |
$94.875, Expires 12/17/07 | | | | | 12 | | | | 2,175 | |
| | | | | | | | | | |
TOTAL PUT OPTIONS PURCHASED | | | | | | | | | | |
(Cost $2,773) | | | | | | | | | 2,925 | |
| | | | | | | | | | |
TOTAL INVESTMENTS BEFORE OUTSTANDING OPTION WRITTEN — 100.4%
(Cost $43,719,986(a)) | | | | | | | | | 43,702,828 | |
| | | | | | | | | | |
Put Options Written — 0.0% | | | | | | | | | | |
December Euro-dollar futures, Strike Price | | | | | | | | | | |
$94.75, Expires 12/17/07 | | | | | | | | | | |
(Premiums received $2,327) | | | | | (24 | ) | | | (2,550 | ) |
| | | | | | | | | | |
TOTAL INVESTMENTS NET OF OUTSTANDING OPTION WRITTEN — 100.4% | | | | | | | | | | |
(Cost $43,717,659) | | | | | | | | | 43,700,278 | |
LIABILITIES IN EXCESS OF OTHER ASSETS — (0.4)% | | | | | | | | | (179,689 | ) |
| | | | | | | | | | |
NET ASSETS — 100.0% | | | | | | | | $ | 43,520,589 | |
| | | | | | | | | | |
(a) | Also cost for federal income tax purposes. The gross unrealized appreciation (depreciation) on a tax basis is as follows: |
| | | | |
Gross unrealized appreciation | | $ | 96,107 | |
Gross unrealized depreciation | | | (113,265 | ) |
| | | | |
| | $ | (17,158 | ) |
| | | | |
(b) | Variable rate security. Rate shown is the rate as of September 30, 2007. |
(c) | The security is a perpetual bond and has no stated maturity date. |
(d) | U.S. dollar denominated security issued by foreign domiciled entity. |
(e) | Security, or a portion thereof, pledged as collateral with a value of $347,590 on 164 long U.S. Treasury Note futures contracts, 1 short U.S. Treasury Bond futures contracts and 106 short U.S. Treasury Note futures contracts expiring December 2007. The notional value of such contracts on September 30, 2007 was $35,849,312, with an unrealized gain of $36,637 (including commissions of $596). |
(f) | The rate shown is the effective yield at the time of purchase. |
(g) | Represents current yield as of September 30, 2007. |
See accompanyins notes to financial statements.
| | | | | | |
10 | | ANNUAL REPORT | | SEPTEMBER 30, 2007 | | |
| | |
Schedule of Investments As of September 30, 2007 | | Series C Portfolio |
| | (Percentages shown are based on Net Assets) |
| | | | | | | | |
| | | Maturity | | Par (000) | | Value |
Trust Preferred Stocks — 2.9% | | | | | | | | |
Banks — 0.5% | | | | | | | | |
JPMorgan Chase Capital XXII, Capital Securities | | | | | | | | |
6.45% | | 02/02/37 | | $ | 200 | | $ | 184,312 |
JPMorgan Chase Capital XXIII, Capital Securities | | | | | | | | |
6.36%(b) | | 05/15/47 | | | 500 | | | 439,488 |
JPMorgan Chase Capital XXV, Captial Securities | | | | | | | | |
6.80% | | 10/01/37 | | | 875 | | | 876,333 |
State Street Capital Trust IV, Capital Securities | | | | | | | | |
6.69%(b) | | 06/15/37 | | | 1,075 | | | 972,873 |
| | | | | | | | |
| | | | | | | | 2,473,006 |
| | | | | | | | |
Finance — 0.9% | | | | | | | | |
Financial Security Assurance Holdings Ltd., Junior Subordinated Debentures | | | | | | | | |
6.40%(b)(c) | | 12/15/66 | | | 50 | | | 45,209 |
Lehman Brothers Holdings Capital Trust VII, Trust Preferred Securities | | | | | | | | |
5.86%(b)(d) | | | | | 4,070 | | | 3,877,550 |
PSEG Funding Trust, Inc., Capital Securities | | | | | | | | |
5.38% | | 11/16/07 | | | 25 | | | 24,964 |
Rabobank Capital Funding Trust II, Capital Securities | | | | | | | | |
5.26%(c)(d) | | | | | 75 | | | 70,918 |
| | | | | | | | |
| | | | | | | | 4,018,641 |
| | | | | | | | |
Insurance — 0.0% | | | | | | | | |
Lincoln National Corp., Capital Securities | | | | | | | | |
7.00%(b) | | 05/17/66 | | | 75 | | | 77,294 |
| | | | | | | | |
Yankee — 1.5% | | | | | | | | |
Banks — 0.6% | | | | | | | | |
Barclays Bank Plc (United Kingdom), Unsecured Notes | | | | | | | | |
5.93%(c)(d)(e) | | | | | 100 | | | 94,876 |
7.43%(b)(c)(d)(e) | | | | | 1,545 | | | 1,641,839 |
Royal Bank of Scotland Group Plc (United Kingdom), Subordinated Notes | | | | | | | | |
7.64%(b)(d)(e)(f) | | | | | 1,100 | | | 1,100,000 |
| | | | | | | | |
| | | | | | | | 2,836,715 |
| | | | | | | | |
Finance — 0.9% | | | | | | | | |
Credit Suisse (Guernsey), Unsecured Notes | | | | | | | | |
5.86%(b)(d)(e) | | | | | 4,760 | | | 4,502,398 |
| | | | | | | | |
TOTAL TRUST PREFERRED STOCKS | | | | | | | | |
(Cost $14,360,919) | | | | | | | | 13,908,054 |
| | | | | | | | |
U.S. Government & Agency Obligations — 22.5% | | | | | | | | |
U.S. Treasury Bonds | | | | | | | | |
4.75% | | 02/15/37 | | | 255 | | | 251,474 |
U.S. Treasury Inflation Protected Bonds | | | | | | | | |
2.38% | | 01/15/27 | | | 1,200 | | | 1,254,599 |
U.S. Treasury Notes | | | | | | | | |
4.75%(g) | | 02/15/10 | | | 103,760 | | | 105,527,136 |
| | | | | | | | |
TOTAL U.S. GOVERNMENT & AGENCY OBLIGATIONS
(Cost $105,660,407) | | | | | | | | 107,033,209 |
| | | | | | | | |
Corporate Bonds — 85.9% | | | | | | | | |
Aerospace — 0.9% | | | | | | | | |
Lockheed Martin Corp., Unsecured Notes | | | | | | | | |
6.15% | | 09/01/36 | | | 1,020 | | | 1,030,989 |
Northrop Grumman Corp., Debentures | | | | | | | | |
7.88% | | 03/01/26 | | | 1,000 | | | 1,183,566 |
Northrop Grumman Corp., Senior Debentures | | | | | | | | |
7.75% | | 02/15/31 | | | 75 | | | 87,996 |
Northrop Grumman Corp., Senior Unsecured Notes | | | | | | | | |
7.13% | | 02/15/11 | | | 2,000 | | | 2,123,534 |
Raytheon Co., Unsecured Notes | | | | | | | | |
5.38% | | 04/01/13 | | | 50 | | | 49,811 |
| | | | | | | | |
| | | | | | | | 4,475,896 |
| | | | | | | | |
Banks — 16.7% | | | | | | | | |
Bank of America Corp., Senior Unsecured Notes | | | | | | | | |
4.50% | | 08/01/10 | | | 5,000 | | | 4,950,005 |
5.38% | | 08/15/11 | | | 2,205 | | | 2,220,854 |
6.00% | | 09/01/17 | | | 3,000 | | | 3,069,567 |
Bank of America Corp., Subordinated Bank Notes | | | | | | | | |
6.10% | | 06/15/17 | | | 4,700 | | | 4,827,610 |
Bank of America Corp., Subordinated Notes | | | | | | | | |
7.40% | | 01/15/11 | | | 65 | | | 69,166 |
5.30% | | 03/15/17 | | | 3,000 | | | 2,910,027 |
Bank of Oklahoma N.A., Unsecured Notes | | | | | | | | |
5.75%(b) | | 05/15/17 | | | 1,650 | | | 1,661,362 |
BankBoston N.A., Subordinated Notes | | | | | | | | |
6.38% | | 03/25/08 | | | 400 | | | 401,837 |
Citigroup, Inc., Senior Unsecured Notes | | | | | | | | |
3.50% | | 02/01/08 | | | 500 | | | 497,150 |
5.30% | | 01/07/16 | | | 4,375 | | | 4,265,463 |
6.00% | | 08/15/17 | | | 1,500 | | | 1,534,834 |
5.88% | | 05/29/37 | | | 880 | | | 848,255 |
Citigroup, Inc., Subordinated Notes | | | | | | | | |
5.50% | | 02/15/17 | | | 75 | | | 73,659 |
5.88% | | 02/22/33 | | | 20 | | | 19,099 |
Citigroup, Inc., Unsecured Notes | | | | | | | | |
4.13% | | 02/22/10 | | | 65 | | | 63,841 |
4.63% | | 08/03/10 | | | 1,600 | | | 1,587,163 |
5.85% | | 12/11/34 | | | 1,300 | | | 1,253,648 |
FleetBoston Financial Corp., Senior Unsecured Notes | | | | | | | | |
4.20% | | 11/30/07 | | | 80 | | | 79,867 |
HSBC Bank USA, Subordinated Notes | | | | | | | | |
4.63% | | 04/01/14 | | | 9,750 | | | 9,099,402 |
Inter-American Development Bank, Bonds | | | | | | | | |
5.38% | | 11/18/08 | | | 5,000 | | | 5,044,495 |
JPMorgan Chase & Co., Senior Notes | | | | | | | | |
2.63% | | 06/30/08 | | | 5,000 | | | 4,903,850 |
JPMorgan Chase & Co., Senior Unsecured Notes | | | | | | | | |
3.70% | | 01/15/08 | | | 125 | | | 124,490 |
JPMorgan Chase Bank N.A., Subordinated Notes | | | | | | | | |
6.00% | | 07/17-10/17 | | | 8,075 | | | 8,152,670 |
M&I Marshall & Ilsley Bank, Senior Bank Notes | | | | | | | | |
5.82%(b) | | 06/16/10 | | | 2,500 | | | 2,508,300 |
Northern Trust Corp., Subordinated Notes | | | | | | | | |
4.60% | | 02/01/13 | | | 125 | | | 120,489 |
See accompanying notes to financial statements.
| | | | | | |
| | | ANNUAL REPORT | | SEPTEMBER 30, 2007 | | 11 |
| | |
| Schedule of Investments (continued) | | Series C Portfolio |
| | (Percentages shown are based on Net Assets) |
| | | | | | | | |
| | | Maturity | | Par (000) | | Value |
Corporate Bonds (Continued) | | | | | | | | |
Banks (Continued) | | | | | | | | |
State Street Corp., Subordinated Notes | | | | | | | | |
7.65% | | 06/15/10 | | $ | 50 | | $ | 53,136 |
SunTrust Bank, Inc., Senior Unsecured Notes | | | | | | | | |
4.00% | | 10/15/08 | | | 5,000 | | | 4,948,935 |
U.S. Bank N.A., Subordinated Bank Notes | | | | | | | | |
6.38% | | 08/01/11 | | | 2,500 | | | 2,603,745 |
U.S. Bank N.A., Senior Bank Notes | | | | | | | | |
4.40% | | 08/15/08 | | | 550 | | | 545,432 |
U.S. Central Credit Union, Unsecured Notes | | | | | | | | |
2.75% | | 05/30/08 | | | 50 | | | 49,159 |
Wachovia Corp., Senior Notes | | | | | | | | |
4.38% | | 06/01/10 | | | 300 | | | 295,434 |
Wachovia Corp., Senior Unsecured Notes | | | | | | | | |
5.75% | | 06/15/17 | | | 1,500 | | | 1,505,682 |
Wachovia Corp., Subordinated Notes | | | | | | | | |
5.25% | | 08/01/14 | | | 185 | | | 181,309 |
Wachovia Corp., Unsecured Notes | | | | | | | | |
5.81%(b) | | 03/15/11 | | | 2,500 | | | 2,480,530 |
5.30% | | 10/15/11 | | | 1,000 | | | 1,004,641 |
Wells Fargo & Co. Holdings Corp., Subordinated Notes | | | | | | | | |
6.25% | | 04/15/08 | | | 370 | | | 370,973 |
Wells Fargo & Co., Unsecured Notes | | | | | | | | |
4.88% | | 01/12/11 | | | 5,000 | | | 4,952,975 |
| | | | | | | | |
| | | | | | | | 79,279,054 |
| | | | | | | | |
Broadcasting — 1.0% | | | | | | | | |
Cox Communications, Inc., Senior Unsecured Notes | | | | | | | | |
7.13% | | 10/01/12 | | | 2,250 | | | 2,384,604 |
News America, Inc., Senior Debentures | | | | | | | | |
7.28% | | 06/30/28 | | | 75 | | | 78,905 |
News America, Inc., Senior Unsecured Notes | | | | | | | | |
6.40% | | 12/15/35 | | | 2,500 | | | 2,414,392 |
| | | | | | | | |
| | | | | | | | 4,877,901 |
| | | | | | | | |
Chemicals — 0.0% | | | | | | | | |
E. I. DuPont de Nemours & Co., Senior Debentures | | | | | | | | |
6.50% | | 01/15/28 | | | 40 | | | 41,323 |
| | | | | | | | |
Computer & Office Equipment — 0.8% | | | | | | | | |
IBM Corp., Unsecured Notes | | | | | | | | |
5.70% | | 09/14/17 | | | 3,575 | | | 3,593,729 |
| | | | | | | | |
Computer Software & Services — 0.7% | | | | | | | | |
Intuit, Inc., Senior Unsecured Notes | | | | | | | | |
5.75% | | 03/15/17 | | | 75 | | | 71,579 |
Oracle Corp., Unsecured Notes | | | | | | | | |
5.25% | | 01/15/16 | | | 3,100 | | | 3,018,591 |
| | | | | | | | |
| | | | | | | | 3,090,170 |
| | | | | | | | |
Energy & Utilities — 5.0% | | | | | | | | |
CenterPoint Energy, Inc., Senior Unsecured Notes | | | | | | | | |
5.95% | | 02/01/17 | | | 50 | | | 48,847 |
Cleveland Electric Illuminating Co., Senior Unsecured Notes | | | | | | | | |
5.65% | | 12/15/13 | | | 450 | | | 444,666 |
5.95% | | 12/15/36 | | | 25 | | | 23,245 |
Consumers Energy Co., First Mortgage Bonds | | | | | | | | |
5.38% | | 04/15/13 | | | 780 | | | 771,110 |
Consumers Energy Co., First Mortgage Notes | | | | | | | | |
5.50% | | 08/15/16 | | | 550 | | | 535,712 |
DTE Energy Co., Senior Unsecured Notes | | | | | | | | |
6.35% | | 06/01/16 | | | 1,550 | | | 1,596,725 |
Duke Energy Corp., First Mortgage Bonds | | | | | | | | |
3.75% | | 03/05/08 | | | 2,000 | | | 1,987,400 |
4.50% | | 04/01/10 | | | 1,250 | | | 1,237,294 |
Duke Energy Indiana, Inc., Senior Debentures | | | | | | | | |
5.00% | | 09/15/13 | | | 1,420 | | | 1,364,922 |
Energy East Corp., Unsecured Notes | | | | | | | | |
6.75% | | 07/15/36 | | | 2,050 | | | 2,092,332 |
Florida Power & Light Co., First Mortgage Bonds | | | | | | | | |
6.00% | | 06/01/08 | | | 60 | | | 60,280 |
5.85% | | 02/01/33 | | | 70 | | | 67,856 |
4.95% | | 06/01/35 | | | 750 | | | 638,201 |
Florida Power Corp., First Mortgage Bonds | | | | | | | | |
5.90% | | 03/01/33 | | | 1,000 | | | 960,814 |
6.35% | | 09/15/37 | | | 875 | | | 891,769 |
Georgia Power Co., Senior Unsecured Notes | | | | | | | | |
5.25% | | 12/15/15 | | | 1,050 | | | 1,020,702 |
Kiowa Power Partners LLC, Senior Secured Notes | | | | | | | | |
4.81%(c) | | 12/30/13 | | | 20 | | | 19,412 |
MidAmerican Energy Holdings Co., Debentures | | | | | | | | |
6.13% | | 04/01/36 | | | 25 | | | 24,270 |
MidAmerican Energy Holdings Co., Senior Unsecured Notes | | | | | | | | |
5.80% | | 10/15/36 | | | 75 | | | 70,808 |
NiSource Finance Corp., Unsecured Notes | | | | | | | | |
6.06%(b) | | 11/23/09 | | | 25 | | | 24,800 |
Ohio Edison Co., Senior Unsecured Notes | | | | | | | | |
6.88% | | 07/15/36 | | | 2,000 | | | 2,100,040 |
PECO Energy Co., First Mortgage Bonds | | | | | | | | |
5.95% | | 10/01/36 | | | 1,000 | | | 981,311 |
Progress Energy, Inc., Senior Unsecured Notes | | | | | | | | |
7.00% | | 10/30/31 | | | 100 | | | 106,315 |
Virginia Electric and Power Co., Senior Unsecured Notes | | | | | | | | |
6.00% | | 01/15/36 | | | 1,550 | | | 1,487,206 |
Virginia Electric and Power Co., Unsecured Notes | | | | | | | | |
5.40% | | 01/15/16 | | | 3,000 | | | 2,898,915 |
Xcel Energy, Inc., Senior Unsecured Notes | | | | | | | | |
6.50% | | 07/01/36 | | | 775 | | | 771,103 |
XTO Energy, Inc., Senior Unsecured Notes | | | | | | | | |
6.75% | | 08/01/37 | | | 1,500 | | | 1,565,145 |
| | | | | | | | |
| | | | | | | | 23,791,200 |
| | | | | | | | |
Entertainment & Leisure — 3.2% | | | | | | | | |
Comcast Cable Communications, Inc., Senior Notes | | | | | | | | |
7.63% | | 04/15/08 | | | 100 | | | 101,212 |
Comcast Cable Communications, Inc., Senior Unsecured Notes | | | | | | | | |
6.75% | | 01/30/11 | | | 4,115 | | | 4,268,066 |
Comcast Cable Holdings LLC, Senior Debentures | | | | | | | | |
7.88% | | 02/15/26 | | | 50 | | | 55,082 |
See accompanying notes to financial statements.
| | | | | | |
12 | | ANNUAL REPORT | | SEPTEMBER 30, 2007 | | |
| | |
| Schedule of Investments (continued) | | Series C Portfolio |
| | (Percentages shown are based on Net Assets) |
| | | | | | | | |
| | | Maturity | | Par (000) | | Value |
Corporate Bonds (Continued) | | | | | | | | |
Entertainment & Leisure (Continued) | | | | | | | | |
Comcast Corp., Unsecured Notes | | | | | | | | |
6.50% | | 11/15/35 | | $ | 3,000 | | $ | 2,962,341 |
Cox Communications, Inc., Unsecured Notes | | | | | | | | |
4.63% | | 06/01/13 | | | 3,000 | | | 2,829,825 |
Time Warner Cable, Inc., Unsecured Notes | | | | | | | | |
5.85%(c) | | 05/01/17 | | | 1,000 | | | 972,208 |
6.55%(c) | | 05/01/37 | | | 3,000 | | | 2,942,943 |
Time Warner Cos., Inc., Senior Debentures | | | | | | | | |
7.57% | | 02/01/24 | | | 95 | | | 102,447 |
Time Warner, Inc., Senior Unsecured Notes | | | | | | | | |
6.75% | | 04/15/11 | | | 100 | | | 103,939 |
6.88% | | 05/01/12 | | | 1,000 | | | 1,049,281 |
Turner Broadcasting Corp., Senior Notes | | | | | | | | |
8.38% | | 07/01/13 | | | 25 | | | 27,962 |
| | | | | | | | |
| | | | | | | | 15,415,306 |
| | | | | | | | |
Finance — 20.5% | | | | | | | | |
Allstate Life Global Funding Trust, Secured Notes | | | | | | | | |
4.50% | | 05/29/09 | | | 9,050 | | | 8,994,931 |
American Express Co., Senior Unsecured Notes | | | | | | | | |
4.75% | | 06/17/09 | | | 550 | | | 548,333 |
American General Finance Corp., Senior Unsecured Notes | | | | | | | | |
3.88%(h) | | 10/01/09 | | | 400 | | | 391,860 |
The Bear Stearns Cos., Inc., Notes | | | | | | | | |
4.00% | | 01/31/08 | | | 2,100 | | | 2,087,961 |
The Bear Stearns Cos., Inc., Senior Unsecured Notes | | | | | | | | |
6.95% | | 08/10/12 | | | 3,275 | | | 3,414,571 |
The Bear Stearns Cos., Inc., Unsecured Notes | | | | | | | | |
3.25% | | 03/25/09 | | | 500 | | | 482,502 |
6.40%(f) | | 10/02/17 | | | 1,325 | | | 1,312,624 |
Berkshire Hathaway Finance Corp., Senior Unsecured Notes | | | | | | | | |
4.13%(h) | | 01/15/10 | | | 15,975 | | | 15,710,981 |
BHP Billiton Finance Ltd., Senior Unsecured Notes | | | | | | | | |
5.40% | | 03/29/17 | | | 2,180 | | | 2,125,550 |
Boeing Capital Corp., Senior Unsecured Notes | | | | | | | | |
6.50% | | 02/15/12 | | | 50 | | | 52,712 |
Credit Suisse First Boston USA, Inc., Senior Unsecured Notes | | | | | | | | |
3.88% | | 01/15/09 | | | 5,000 | | | 4,936,510 |
General Electric Capital Corp., Senior Unsecured Notes | | | | | | | | |
6.13% | | 02/22/11 | | | 1,300 | | | 1,339,719 |
6.75% | | 03/15/32 | | | 90 | | | 99,088 |
General Electric Capital Corp., Unsecured Notes | | | | | | | | |
3.60% | | 10/15/08 | | | 95 | | | 93,567 |
5.00% | | 11/15/11 | | | 100 | | | 99,548 |
5.63% | | 09/15/17 | | | 1,500 | | | 1,499,589 |
6.15% | | 08/07/37 | | | 6,350 | | | 6,516,738 |
Golden West Financial Corp., Senior Unsecured Notes | | | | | | | | |
4.75% | | 10/01/12 | | | 6,825 | | | 6,667,288 |
The Goldman Sachs Group, Inc., Senior Unsecured Notes | | | | | | | | |
5.25% | | 10/15/13 | | | 12,425 | | | 12,138,765 |
The Goldman Sachs Group, Inc., Unsecured Notes | | | | | | | | |
5.35% | | 01/15/16 | | | 350 | | | 337,896 |
6.25% | | 09/01/17 | | | 1,500 | | | 1,532,835 |
Hartford Financial Services Group Inc., Senior Notes | | | | | | | | |
5.55% | | 08/16/08 | | | 2,500 | | | 2,505,820 |
Lehman Brothers Holdings, Inc., Senior Unsecured Notes | | | | | | | | |
7.00% | | 02/01/08 | | | 155 | | | 155,552 |
5.75% | | 07/18/11 | | | 150 | | | 150,473 |
7.39%(b) | | 09/15/22 | | | 1,200 | | | 1,201,092 |
Lehman Brothers Holdings, Inc., Unsecured Notes | | | | | | | | |
5.25% | | 02/06/12 | | | 430 | | | 421,098 |
6.00% | | 07/19/12 | | | 5,600 | | | 5,686,806 |
Morgan Stanley, Senior Notes | | | | | | | | |
5.63% | | 01/09/12 | | | 8,100 | | | 8,164,103 |
5.45% | | 01/09/17 | | | 300 | | | 289,287 |
5.55% | | 04/27/17 | | | 6,200 | | | 6,015,420 |
6.25% | | 08/28/17 | | | 2,250 | | | 2,297,698 |
Morgan Stanley, Senior Unsecured Notes | | | | | | | | |
6.75% | | 04/15/11 | | | 50 | | | 52,256 |
Morgan Stanley, Unsecured Notes | | | | | | | | |
5.05% | | 01/21/11 | | | 200 | | | 197,676 |
UnitedHealth Group, Inc., Unsecured Notes | | | | | | | | |
5.80% | | 03/15/36 | | | 45 | | | 41,815 |
| | | | | | | | |
| | | | | | | | 97,562,664 |
| | | | | | | | |
Food & Agriculture — 0.8% | | | | | | | | |
Kraft Foods, Inc., Senior Unsecured Notes | | | | | | | | |
5.63% | | 11/01/11 | | | 1,615 | | | 1,625,129 |
6.50% | | 08/11/17 | | | 2,075 | | | 2,143,374 |
| | | | | | | | |
| | | | | | | | 3,768,503 |
| | | | | | | | |
Insurance — 3.1% | | | | | | | | |
American General Corp., Senior Unsecured Notes | | | | | | | | |
7.50% | | 08/11/10 | | | 105 | | | 111,057 |
ASIF Global Financing, Unsecured Notes | | | | | | | | |
3.90%(c) | | 10/22/08 | | | 660 | | | 650,555 |
CHUBB Corp., Senior Unsecured Notes | | | | | | | | |
6.00% | | 05/11/37 | | | 1,400 | | | 1,336,642 |
John Hancock Financial Services, Inc., Senior Unsecured Notes | | | | | | | | |
5.63% | | 12/01/08 | | | 25 | | | 25,199 |
Lincoln National Corp., Senior Unsecured Notes | | | | | | | | |
6.15% | | 04/07/36 | | | 1,500 | | | 1,474,260 |
Marsh & McLennan Co., Inc., Senior Unsecured Notes | | | | | | | | |
5.15% | | 09/15/10 | | | 25 | | | 24,913 |
MetLife, Inc., Senior Notes | | | | | | | | |
5.38% | | 12/15/12 | | | 4,400 | | | 4,438,513 |
MetLife, Inc., Senior Unsecured Notes | | | | | | | | |
6.13% | | 12/01/11 | | | 1,200 | | | 1,243,288 |
Metropolitan Life Global Funding, Inc., Unsecured Notes | | | | | | | | |
2.60%(c) | | 06/19/08 | | | 50 | | | 49,059 |
4.25%(c) | | 07/30/09 | | | 200 | | | 197,794 |
New York Life Insurance Co., Unsecured Notes | | | | | | | | |
5.88%(c) | | 05/15/33 | | | 40 | | | 38,888 |
See accompanying notes to financial statements.
| | | | | | |
| | | ANNUAL REPORT | | SEPTEMBER 30, 2007 | | 13 |
| | |
| Schedule of Investments (continued) | | Series C Portfolio |
| | (Percentages shown are based on Net Assets) |
| | | | | | | | |
| | | Maturity | | Par (000) | | Value |
Corporate Bonds (Continued) | | | | | | |
Insurance (Continued) | | | | | | |
Protective Life Corp., Secured Notes | | | | | | | | |
3.70% | | 11/24/08 | | $ | 2,000 | | $ | 1,959,722 |
Prudential Financial, Inc., Unsecured Notes | | | | | | | | |
5.70% | | 12/14/36 | | | 1,375 | | | 1,267,025 |
TIAA Global Markets, Senior Unsecured Notes | | | | | | | | |
3.88%(c) | | 01/22/08 | | | 50 | | | 49,756 |
WellPoint, Inc., Unsecured Notes | | | | | | | | |
5.00% | | 12/15/14 | | | 1,825 | | | 1,737,322 |
| | | | | | | | |
| | | | | | | | 14,603,993 |
| | | | | | | | |
Manufacturing — 1.8% | | | | | | | | |
3M Co., Senior Unsecured Notes | | | | | | | | |
5.70% | | 03/15/37 | | | 1,375 | | | 1,344,258 |
Alcoa, Inc., Senior Unsecured Notes | | | | | | | | |
5.87% | | 02/23/22 | | | 130 | | | 123,807 |
Cisco Systems, Inc., Senior Unsecured Notes | | | | | | | | |
5.25% | | 02/22/11 | | | 1,550 | | | 1,564,418 |
Hewlett-Packard Co., Unsecured Notes | | | | | | | | |
5.25% | | 03/01/12 | | | 2,000 | | | 2,008,488 |
Honeywell International, Inc., Senior Unsecured Notes | | | | | | | | |
5.30% | | 03/15/17 | | | 1,835 | | | 1,788,407 |
Procter & Gamble Co., Unsecured Notes | | | | | | | | |
5.55% | | 03/05/37 | | | 1,870 | | | 1,786,542 |
| | | | | | | | |
| | | | | | | | 8,615,920 |
| | | | | | | | |
Medical & Medical Services — 0.4% | | | | | | | | |
Aetna, Inc., Senior Unsecured Notes | | | | | | | | |
6.63% | | 06/15/36 | | | 195 | | | 198,346 |
Hospira, Inc., Unsecured Notes | | | | | | | | |
6.05% | | 03/30/17 | | | 1,660 | | | 1,632,997 |
| | | | | | | | |
| | | | | | | | 1,831,343 |
| | | | | | | | |
Medical Instruments & Supplies — 0.2% | | | | | | | | |
Johnson & Johnson, Unsecured Notes | | | | | | | | |
5.55% | | 08/15/17 | | | 1,000 | | | 1,015,877 |
| | | | | | | | |
Metal & Mining—0.5% | | | | | | | | |
United States Steel Corp., Senior Unsecured Notes | | | | | | | | |
5.65% | | 06/01/13 | | | 2,450 | | | 2,402,913 |
| | | | | | | | |
Miscellaneous Services — 0.4% | | | | | | | | |
Kimberly-Clark Corp., Senior Notes | | | | | | | | |
6.13% | | 08/01/17 | | | 2,025 | | | 2,085,805 |
| | | | | | | | |
Motor Vehicles — 0.8% | | | | | | | | |
DaimlerChrysler N.A. Holding Corp., Notes | | | | | | | | |
4.75% | | 01/15/08 | | | 135 | | | 134,624 |
DaimlerChrysler N.A. Holding Corp., Senior Unsecured Notes | | | | | | | | |
5.75% | | 09/08/11 | | | 2,000 | | | 2,018,598 |
8.50% | | 01/18/31 | | | 1,500 | | | 1,859,366 |
Nissan Motor Acceptance Corp., Unsecured Notes | | | | | | | | |
4.63%(c) | | 03/08/10 | | | 25 | | | 24,741 |
| | | | | | | | |
| | | | | | | | 4,037,329 |
| | | | | | | | |
Oil & Gas — 1.4% | | | | | | | | |
Anadarko Petroleum Corp., Senior Unsecured Notes | | | | | | | | |
6.09%(b) | | 09/15/09 | | | 2,040 | | | 2,028,215 |
6.45% | | 09/15/36 | | | 2,775 | | | 2,731,985 |
Apache Corp., Unsecured Notes | | | | | | | | |
6.00% | | 01/15/37 | | | 940 | | | 904,836 |
Devon Financing Corp., Senior Unsecured Notes | | | | | | | | |
6.88% | | 09/30/11 | | | 90 | | | 95,139 |
Halliburton Co., Debentures | | | | | | | | |
7.60%(c) | | 08/15/96 | | | 10 | | | 11,188 |
Halliburton Co., Senior Unsecured Notes | | | | | | | | |
5.50% | | 10/15/10 | | | 25 | | | 25,290 |
Nakilat, Inc., Senior Unsecured Notes | | | | | | | | |
6.07%(c) | | 12/31/33 | | | 25 | | | 24,122 |
Valero Energy Corp., Unsecured Notes | | | | | | | | |
6.63% | | 06/15/37 | | | 875 | | | 888,025 |
| | | | | | | | |
| | | | | | | | 6,708,800 |
| | | | | | | | |
Paper & Forest Products — 0.2% | | | | | | | | |
Weyerhaeuser Co., Debentures | | | | | | | | |
7.13% | | 07/15/23 | | | 750 | | | 741,748 |
| | | | | | | | |
Pharmaceuticals — 4.3% | | | | | | | | |
Abbott Laboratories, Unsecured Notes | | | | | | | | |
5.60% | | 05/15/11 | | | 2,575 | | | 2,622,753 |
Bristol-Myers Squibb Co., Unsecured Notes | | | | | | | | |
5.88% | | 11/15/36 | | | 1,500 | | | 1,430,661 |
Eli Lilly & Co., Unsecured Notes | | | | | | | | |
5.20% | | 03/15/17 | | | 1,500 | | | 1,458,526 |
5.55% | | 03/15/37 | | | 2,975 | | | 2,785,204 |
Merck & Co. Inc., Unsecured Notes | | | | | | | | |
5.75% | | 11/15/36 | | | 3,500 | | | 3,303,877 |
Merck & Co., Inc., Senior Unsecured Notes | | | | | | | | |
4.38% | | 02/15/13 | | | 155 | | | 148,617 |
Teva Pharmaceutical Finance Co. LLC, Senior Unsecured Notes | | | | | | | | |
5.55% | | 02/01/16 | | | 2,400 | | | 2,331,478 |
Teva Pharmaceutical Finance Co. LLC, Unsecured Notes | | | | | | | | |
6.15% | | 02/01/36 | | | 1,000 | | | 950,135 |
Wyeth, Unsecured Notes | | | | | | | | |
5.50% | | 02/15/16 | | | 3,110 | | | 3,046,587 |
5.45% | | 04/01/17 | | | 1,500 | | | 1,466,349 |
5.95% | | 04/01/37 | | | 1,175 | | | 1,133,901 |
| | | | | | | | |
| | | | | | | | 20,678,088 |
| | | | | | | | |
Real Estate — 1.0% | | | | | | | | |
AvalonBay Communities, Inc., Senior Unsecured Notes (REIT) | | | | | | | | |
6.13% | | 11/01/12 | | | 100 | | | 102,648 |
AvalonBay Communities, Inc., Unsecured Notes (REIT) | | | | | | | | |
5.75% | | 09/15/16 | | | 1,600 | | | 1,554,714 |
Duke Realty LP, Senior Unsecured Notes | | | | | | | | |
5.63% | | 08/15/11 | | | 25 | | | 24,929 |
ERP Operating LP, Senior Notes | | | | | | | | |
6.58% | | 04/13/15 | | | 2,900 | | | 2,987,345 |
The Rouse Co., Unsecured Notes (REIT) | | | | | | | | |
5.38% | | 11/26/13 | | | 25 | | | 22,443 |
| | | | | | | | |
| | | | | | | | 4,692,079 |
| | | | | | | | |
See accompanying notes to financial statements.
| | | | | | |
14 | | ANNUAL REPORT | | SEPTEMBER 30, 2007 | | |
| | |
| Schedule of Investments (continued) | | Series C Portfolio |
| | (Percentages shown are based on Net Assets) |
| | | | | | | | |
| | | Maturity | | Par (000) | | Value |
Corporate Bonds (Continued) | | | | | | | | |
Retail Merchandising — 2.7% | | | | | | | | |
CVS Caremark Corp., Senior Unsecured Notes | | | | | | | | |
4.00% | | 09/15/09 | | $ | 75 | | $ | 73,471 |
CVS Caremark Corp., Unsecured Notes | | | | | | | | |
5.75% | | 06/01/17 | | | 3,450 | | | 3,367,376 |
Federated Department Stores, Inc., Senior Unsecured Notes | | | | | | | | |
6.63% | | 09/01/08 | | | 50 | | | 50,386 |
Home Depot, Inc., Senior Unsecured Notes | | | | | | | | |
4.63% | | 08/15/10 | | | 125 | | | 121,864 |
May Department Stores Co., Unsecured Notes | | | | | | | | |
4.80% | | 07/15/09 | | | 70 | | | 69,542 |
Target Corp., Senior Unsecured Notes | | | | | | | | |
7.50% | | 08/15/10 | | | 200 | | | 212,886 |
Wal-Mart Stores, Inc., Senior Unsecured Notes | | | | | | | | |
6.88% | | 08/10/09 | | | 2,000 | | | 2,067,382 |
Wal-Mart Stores, Inc., Unsecured Notes | | | | | | | | |
4.13% | | 07/01/10 | | | 4,210 | | | 4,124,785 |
5.00% | | 04/05/12 | | | 2,000 | | | 1,982,436 |
5.25% | | 09/01/35 | | | 675 | | | 591,962 |
| | | | | | | | |
| | | | | | | | 12,662,090 |
| | | | | | | | |
Telecommunications — 4.5% | | | | | | | | |
AT&T Broadband Corp., Unsecured Notes | | | | | | | | |
8.38% | | 03/15/13 | | | 1,000 | | | 1,120,838 |
AT&T, Inc., Unsecured Notes | | | | | | | | |
5.63% | | 06/15/16 | | | 1,500 | | | 1,487,262 |
6.50% | | 09/01/37 | | | 2,775 | | | 2,861,294 |
BellSouth Capital Funding Corp., Senior Unsecured Notes | | | | | | | | |
7.75% | | 02/15/10 | | | 3,130 | | | 3,313,296 |
6.55% | | 06/15/34 | | | 3,000 | | | 3,061,515 |
BellSouth Capital Funding Corp., Unsecured Notes | | | | | | | | |
5.66%(b) | | 08/15/08 | | | 5,000 | | | 4,995,285 |
Embarq Corp., Unsecured Notes | | | | | | | | |
8.00% | | 06/01/36 | | | 500 | | | 532,746 |
SBC Communications, Inc., Unsecured Notes | | | | | | | | |
6.45% | | 06/15/34 | | | 60 | | | 60,853 |
Sprint Capital Corp., Senior Unsecured Notes | | | | | | | | |
6.38% | | 05/01/09 | | | 100 | | | 101,556 |
8.38% | | 03/15/12 | | | 300 | | | 330,310 |
Sprint Nextel Corp., Unsecured Notes | | | | | | | | |
6.00% | | 12/01/16 | | | 55 | | | 52,829 |
Verizon Communications, Inc., Unsecured Notes | | | | | | | | |
6.25% | | 04/01/37 | | | 2,625 | | | 2,639,818 |
Verizon Global Funding Corp., Senior Unsecured Notes | | | | | | | | |
6.88% | | 06/15/12 | | | 600 | | | 639,646 |
Verizon Maryland, Inc., Senior Debentures | | | | | | | | |
6.13% | | 03/01/12 | | | 305 | | | 313,355 |
| | | | | | | | |
| | | | | | | | 21,510,603 |
| | | | | | | | |
Transportation — 1.2% | | | | | | | | |
Burlington North Santa Fe Corp., Debentures | | | | | | | | |
5.65% | | 05/01/17 | | | 1,075 | | | 1,053,171 |
Norfolk Southern Corp., Senior Unsecured Notes | | | | | | | | |
6.20% | | 04/15/09 | | | 100 | | | 101,572 |
8.63% | | 05/15/10 | | | 1,500 | | | 1,617,153 |
Union Pacific Corp., Unsecured Notes | | | | | | | | |
3.88% | | 02/15/09 | | | 100 | | | 97,943 |
United Technologies Corp., Senior Unsecured Notes | | | | | | | | |
6.35% | | 03/01/11 | | | 125 | | | 130,863 |
United Technologies Corp., Unsecured Notes | | | | | | | | |
6.05% | | 06/01/36 | | | 2,650 | | | 2,660,534 |
| | | | | | | | |
| | | | | | | | 5,661,236 |
| | | | | | | | |
Yankee — 13.8% | | | | | | | | |
Banks — 0.7% | | | | | | | | |
Royal Bank of Scotland Group Plc (United Kingdom), Subordinated Notes | | | | | | | | |
5.00%(e) | | 11/12/13 | | | 3,000 | | | 3,016,128 |
| | | | | | | | |
Energy & Utilities — 3.1% | | | | | | | | |
Canadian Natural Resources (Canada), Unsecured Notes | | | | | | | | |
5.70%(e) | | 05/15/17 | | | 220 | | | 214,759 |
6.25%(e) | | 03/15/38 | | | 1,110 | | | 1,070,784 |
ConocoPhillips Funding Co. (Australia), Unsecured Notes | | | | | | | | |
5.46%(b)(e) | | 04/09/09 | | | 25 | | | 24,912 |
ConocoPhillips Funding Co. (Canada), Unsecured Notes | | | | | | | | |
5.30%(e) | | 04/15/12 | | | 5,200 | | | 5,206,105 |
Nexen, Inc. (Canada), Unsecured Notes | | | | | | | | |
6.40%(e) | | 05/15/37 | | | 1,025 | | | 996,049 |
Petro-Canada (Canada), Senior Unsecured Notes | | | | | | | | |
5.35%(e) | | 07/15/33 | | | 1,000 | | | 872,927 |
Scottish Power Plc (United Kingdom), Unsecured Notes | | | | | | | | |
4.91%(e) | | 03/15/10 | | | 2,050 | | | 2,032,352 |
5.38%(e) | | 03/15/15 | | | 3,000 | | | 2,927,361 |
Suncor Energy, Inc. (Canada), Unsecured Notes | | | | | | | | |
6.50%(e) | | 06/15/38 | | | 1,025 | | | 1,048,621 |
Trans-Canada Pipelines (Canada), Debentures | | | | | | | | |
5.85%(e) | | 03/15/36 | | | 500 | | | 477,492 |
| | | | | | | | |
| | | | | | | | 14,871,362 |
| | | | | | | | |
Finance — 0.6% | | | | | | | | |
Eksportfinans ASA (Norway), Unsecured Notes | | | | | | | | |
4.38%(e) | | 07/15/09 | | | 100 | | | 99,758 |
EnCana Holdings Finance Corp. (Canada), Senior Unsecured Notes | | | | | | | | |
5.80%(e) | | 05/01/14 | | | 2,050 | | | 2,061,117 |
Rio Tinto Finance Ltd. (Australia), Unsecured Notes | | | | | | | | |
2.63%(e) | | 09/30/08 | | | 50 | | | 48,960 |
Xstrata Finance Ltd. (Canada), Unsecured Notes | | | | | | | | |
5.80%(c)(e) | | 11/15/16 | | | 375 | | | 372,904 |
| | | | | | | | |
| | | | | | | | 2,582,739 |
| | | | | | | | |
See accompanying notes to financial statements.
| | | | | | |
| | | ANNUAL REPORT | | SEPTEMBER 30, 2007 | | 15 |
| | |
| Schedule of Investments (continued) | | Series C Portfolio |
| | (Percentages shown are based on Net Assets) |
| | | | | | | | |
| | | Maturity | | Par (000) | | Value |
Corporate Bonds (Continued) | | | | | | | | |
Yankee (Continued) | | | | | | | | |
Food & Agriculture — 0.0% | | | | | | | | |
Cadbury Schweppes Plc (United Kingdom), Unsecured Notes | | | | | | | | |
3.88%(c)(e) | | 10/01/08 | | $ | 140 | | $ | 138,037 |
| | | | | | | | |
Manufacturing — 0.6% | | | | | | | | |
AstraZeneca Plc (United Kingdom), Unsecured Notes | | | | | | | | |
5.90%(e) | | 09/15/17 | | | 1,500 | | | 1,522,602 |
6.45%(e) | | 09/15/37 | | | 1,000 | | | 1,036,866 |
Siemens Financieringsmat (Netherlands), Unsecured Notes | | | | | | | | |
5.50%(c)(e) | | 02/16/12 | | | 100 | | | 101,164 |
| | | | | | | | |
| | | | | | 2,660,632 |
| | | | | | | | |
Metal & Mining — 0.1% | | | | | | | | |
Alcan, Inc. (Canada), Unsecured Notes | | | | | | | | |
6.13%(e) | | 12/15/33 | | | 525 | | | 504,139 |
Falconbridge Ltd. (Canada), Unsecured Notes | | | | | | | | |
6.00%(e) | | 10/15/15 | | | 75 | | | 75,763 |
| | | | | | | | |
| | | | | | | | 579,902 |
| | | | | | | | |
Oil & Gas — 2.0% | | | | | | | | |
ChevronTexaco Capital Co. (Canada), Senior Unsecured Notes | | | | | | | | |
3.38%(e) | | 02/15/08 | | | 100 | | | 99,359 |
Western Oil Sands, Inc. (Canada), Senior Secured Notes | | | | | | | | |
8.38%(e) | | 05/01/12 | | | 8,650 | | | 9,547,438 |
| | | | | | | | |
| | | | | | | | 9,646,797 |
| | | | | | | | |
Telecommunications — 6.3% | | | | | | | | |
America Movil SAB de CV (Mexico), Unsecured Notes | | | | | | | | |
6.38%(e) | | 03/01/35 | | | 1,500 | | | 1,472,652 |
British Telecommunications Group Plc (United Kingdom), Senior Unsecured Notes | | | | | | | | |
8.63%(b)(e) | | 12/15/30 | | | 750 | | | 993,152 |
Deutsche Telekom International Finance BV (Netherlands), Senior Unsecured Notes | | | | | | | | |
8.25%(e) | | 06/15/30 | | | 1,500 | | | 1,836,244 |
France Telecom (France), Senior Unsecured Notes | | | | | | | | |
8.50%(b)(e) | | 03/01/31 | | | 500 | | | 642,656 |
Rogers Wireless, Inc. (Canada), Senior Secured Notes | | | | | | | | |
7.50%(e) | | 03/15/15 | | | 2,125 | | | 2,277,405 |
Telecom Italia Capital (Italy), Senior Unsecured Notes | | | | | | | | |
4.00%(e) | | 01/15/10 | | | 75 | | | 73,021 |
5.25%(e) | | 11/15/13 | | | 5,210 | | | 5,056,295 |
7.20%(e) | | 07/18/36 | | | 1,500 | | | 1,587,372 |
Telecom Italia Capital (Italy), Unsecured Notes | | | | | | | | |
5.25%(e) | | 10/01/15 | | | 100 | | | 94,933 |
Telefonica Emisiones SAU (Spain), Senior Unsecured Notes | | | | | | | | |
7.05%(e) | | 06/20/36 | | | 2,500 | | | 2,662,952 |
Telefonica Europe BV (Netherlands), Senior Unsecured Notes | | | | | | | | |
7.75%(e) | | 09/15/10 | | | 1,600 | | | 1,708,480 |
Vodafone Group Plc (United Kingdom), Senior Unsecured Notes | | | | | | | | |
7.75%(e) | | 02/15/10 | | | 7,150 | | | 7,549,127 |
Vodafone Group Plc (United Kingdom), Unsecured Notes | | | | | | | | |
5.75%(e) | | 03/15/16 | | | 2,000 | | | 1,969,886 |
6.15%(e) | | 02/27/37 | | | 2,125 | | | 2,039,129 |
| | | | | | | | |
| | | | | | | | 29,963,304 |
| | | | | | | | |
Transportation — 0.4% | | | | | | | | |
Canadian National Railway Co. (Canada), Senior Unsecured Notes | | | | | | | | |
6.38%(e) | | 10/15/11 | | | 50 | | | 51,897 |
6.25%(e) | | 08/01/34 | | | 2,000 | | | 1,979,762 |
| | | | | | | | |
| | | | | | | | 2,031,659 |
| | | | | | | | |
TOTAL CORPORATE BONDS
(Cost $411,379,078) | | | | | | | | 408,634,130 |
| | | | | | | | |
Taxable Municipal Bond — 0.0% | | | | | | | | |
Illinois State Pension Funding General Obligation Bonds, Series 03 | | | | | | | | |
5.10% | | | | | | | | |
(Cost $119,165) | | 06/01/33 | | | 125 | | | 117,088 |
| | | | | | | | |
| | | |
| | | | | Number of Shares | | |
| | | | | | | | |
Short Term Investments — 1.3% | | | | | | | | |
Galileo Money Market Fund, 4.72%(i) | | | | | | | | |
(Cost $5,885,174) | | | | | 5,885,174 | | | 5,885,174 |
| | | | | | | | |
TOTAL INVESTMENTS BEFORE REPURCHASE AGREEMENTS — 112.6%
(Cost $537,404,743) | | | | | | | | 535,577,655 |
| | | | | | | | |
| | | |
| | | | | Par (000) | | |
| | | | | | | | |
Repurchase Agreement — 0.4% | | | | | | | | |
Credit Suisse Securities (USA) LLC | | | | | | | | |
4.23%(d) | | | | | | | | |
(Agreement dated 09/25/07 to be repurchased at $1,919,477, collateralized by $1,890,000 U.S. Treasury Notes 4.75% due 08/15/17. The value of the collateral is $1,926,323.) | | | | | | | | |
(Cost $1,918,350) | | $ | 1,918 | | | 1,918,350 |
| | | | | | | | |
See accompanying notes to financial statements.
| | | | | | |
16 | | ANNUAL REPORT | | SEPTEMBER 30, 2007 | | |
| | |
| Schedule of Investments (concluded) | | Series C Portfolio |
| | (Percentages shown are based on Net Assets) |
| | | | |
| | | Value | |
TOTAL INVESTMENTS IN SECURITIES — 113.0%
(Cost $539,323,093(a)) | | $ | 537,496,005 | |
PAYABLE FOR REVERSE REPURCHASE AGREEMENTS — (12.3)% | | | (58,702,375 | ) |
LIABILITIES IN EXCESS OF OTHER ASSETS — (0.7)% | | $ | (3,069,371 | ) |
| | | | |
NET ASSETS — 100.0% | | $ | 475,724,259 | |
| | | | |
(a) | Cost for federal income tax purposes is $539,357,315. The gross unrealized appreciation (depreciation) on a tax basis is as follows: |
| | | | |
| Gross unrealized appreciation | | $ | 3,024,000 | |
| Gross unrealized depreciation | | | (4,885,310 | ) |
| | | | |
| | $ | (1,861,310 | ) |
| | | | |
(b) | Variable rate security. Rate shown is the rate as of September 30, 2007. |
(c) | Security exempt from registration under Rule 144A of the Securities Act of 1933. These securities may be resold in transactions exempt from registration to qualified institutional investors. As of September 30, 2007, the Portfolio held 1.6% of its net assets, with a current market value of $7,445,613, in securities restricted as to resale. |
(d) | The security is a perpetual bond and has no stated maturity date. |
(e) | U.S. dollar denominated security issued by foreign domiciled entity. |
(g) | Security, or a portion thereof, with a market value of $105,527,136, has been pledged as collateral for reverse repurchase agreements. |
(h) | Security, or a portion thereof, pledged as collateral with a value of $2,314,627 on 201 short U.S. Treasury Note futures contracts and 131 short U.S. Treasury Bond futures contracts expiring December 2007. The notional value of such contracts on September 30, 2007 was $36,551,563, with unrealized gain of $44,573 (including commissions of $730). |
(i) | Represents current yield as of September 30, 2007. |
See accompanying notes to financial statements.
| | | | | | |
| | | ANNUAL REPORT | | SEPTEMBER 30, 2007 | | 17 |
| | |
| Schedule of Investments As of September 30, 2007 | | Series M Portfolio |
| | (Percentages shown are based on Net Assets) |
| | | | | | | | |
| | | Maturity | | Par (000) | | Value |
Mortgage Pass-Throughs — 25.5% | | | | | | |
Federal National Mortgage Assoc. | | | | | | | | |
5.00% | | 08/01/19 | | $ | 621 | | $ | 609,338 |
Federal National Mortgage Assoc. 30 Year TBA | | | | | | | | |
5.50% | | 10/11/37 | | | 125,000 | | | 122,421,875 |
| | | | | | | | |
TOTAL MORTGAGE PASS-THROUGHS
(Cost $123,907,242) | | | | | | | | 123,031,213 |
| | | | | | | | |
Collateralized Mortgage Obligations — 2.3% | | | | | | | | |
Federal National Mortgage Assoc., Series 03-86, Class DL | | | | | | | | |
4.00% | | 09/25/10 | | | 549 | | | 542,784 |
Federal National Mortgage Assoc., Series 07-32, Class KP | | | | | | | | |
5.50% | | 04/25/37 | | | 9,624 | | | 9,662,120 |
First Union National Bank Commercial Mortgage Trust, Series 99-C4, Class A2 | | | | | | | | |
7.39% | | 12/15/31 | | | 323 | | | 336,394 |
First Union National Bank Commercial Mortgage Trust, Series 00-C1, Class A2 | | | | | | | | |
7.84% | | 03/15/10 | | | 140 | | | 148,119 |
First Union National Bank Commercial Mortgage Trust, Series 01-C3, Class A3 | | | | | | | | |
6.42% | | 06/15/11 | | | 294 | | | 306,086 |
| | | | | | | | |
TOTAL COLLATERALIZED MORTGAGE OBLIGATIONS
(Cost $10,809,556) | | | | | | | | 10,995,503 |
| | | | | | | | |
Commercial Mortgage Backed Securities — 47.4% | | | | | | | | |
Banc of America Commercial Mortgage, Inc., Series 01-1, Class A2 | | | | | | | | |
6.50% | | 04/15/36 | | | 6,446 | | | 6,692,133 |
Banc of America Commercial Mortgage, Inc., Series 01-1, Class B | | | | | | | | |
6.67% | | 04/15/36 | | | 175 | | | 183,925 |
Banc of America Commercial Mortgage, Inc., Series 01-PB1, Class A2 | | | | | | | | |
5.79% | | 08/11/11 | | | 4,790 | | | 4,894,607 |
Banc of America Commercial Mortgage, Inc., Series 02-2, Class B | | | | | | | | |
5.27% | | 05/11/12 | | | 1,000 | | | 1,001,802 |
Banc of America Commercial Mortgage, Inc., Series 05-4, Class A5A | | | | | | | | |
4.93% | | 07/10/45 | | | 750 | | | 723,365 |
Banc of America Commercial Mortgage, Inc., Series 06-2, Class A4 | | | | | | | | |
5.93%(b) | | 05/10/45 | | | 3,580 | | | 3,648,810 |
Banc of America Commercial Mortgage, Inc., Series 06-4, Class A4 | | | | | | | | |
5.63%(b) | | 07/10/46 | | | 5,000 | | | 5,031,788 |
Banc of America Commercial Mortgage, Inc., Series 06-6, Class A4 | | | | | | | | |
5.36% | | 10/10/45 | | | 265 | | | 261,643 |
Banc of America Commercial Mortgage, Inc., Series 07-2, Class A4 | | | | | | | | |
5.87%(b) | | 04/10/49 | | | 6,000 | | | 6,053,507 |
Banc of America Commercial Mortgage, Inc., Series 07-3, Class A4 | | | | | | | | |
5.84% | | 05/10/17 | | | 3,950 | | | 3,969,970 |
Bear Stearns Commercial Mortgage Securities, Inc., Series 00-WF2, Class A2 | | | | | | | | |
7.32% | | 10/15/32 | | | 2,300 | | | 2,425,829 |
Bear Stearns Commercial Mortgage Securities, Inc., Series 04-T16, Class A6 | | | | | | | | |
4.75% | | 10/13/14 | | | 5,000 | | | 4,785,228 |
Bear Stearns Commercial Mortgage Securities, Inc., Series 05-PW10, Class A4 | | | | | | | | |
5.40%(b) | | 12/11/40 | | | 1,000 | | | 993,084 |
Bear Stearns Commercial Mortgage Securities, Inc., Series 05-PWR8, Class A4 | | | | | | | | |
4.67% | | 06/11/41 | | | 1,000 | | | 950,692 |
Bear Stearns Commercial Mortgage Securities, Inc., Series 06-PW11, Class AJ | | | | | | | | |
5.62%(b) | | 03/11/39 | | | 1,000 | | | 970,654 |
Bear Stearns Commercial Mortgage Securities, Inc., Series 06-PW13, Class A4 | | | | | | | | |
5.54% | | 09/11/41 | | | 775 | | | 775,336 |
Bear Stearns Commercial Mortgage Securities, Inc., Series 07-PW17, Class A4 | | | | | | | | |
5.69% | | 06/11/50 | | | 5,000 | | | 5,040,650 |
Chase Commercial Mortgage Securities Corp., Series 99-2, Class A2 | | | | | | | | |
7.20% | | 01/15/32 | | | 294 | | | 305,379 |
Chase Manhattan Bank-First Union National Bank, Series 99-1, Class A2 | | | | | | | | |
7.44% | | 08/15/31 | | | 376 | | | 389,948 |
Citigroup-Deutsche Bank Commercial Mortgage Trust, Series 06-CD3, Class A5 | | | | | | | | |
5.62% | | 10/15/48 | | | 500 | | | 502,341 |
Commercial Mortgage Asset Trust, Series 99-C1, Class A3 | | | | | | | | |
6.64% | | 01/17/32 | | | 193 | | | 196,480 |
Credit Suisse First Boston Mortgage Securities Corp., Series 01-CF2, Class A4 | | | | | | | | |
6.50% | | 01/15/11 | | | 500 | | | 520,198 |
Credit Suisse First Boston Mortgage Securities Corp., Series 02-CKN2, Class A2 | | | | | | | | |
5.94% | | 09/15/11 | | | 4,791 | | | 4,883,964 |
Credit Suisse Mortgage Capital Certificates, Series 07-C2, Class A3 | | | | | | | | |
5.54%(b) | | 01/15/49 | | | 5,000 | | | 4,966,084 |
Credit Suisse Mortgage Capital Certificates, Series 07-C3, Class A4 | | | | | | | | |
5.91%(b) | | 06/15/39 | | | 2,850 | | | 2,881,383 |
Credit Suisse Mortgage Captial Certificates, Series 06-C4, Class A3 | | | | | | | | |
5.47% | | 09/15/39 | | | 5,000 | | | 4,964,439 |
Donaldson, Lufkin & Jenrette, Inc., Commercial Mortgage Corp., Series 99-CG2, Class A1B | | | | | | | | |
7.30% | | 06/10/09 | | | 288 | | | 297,018 |
See accompanying notes to financial statements.
| | | | | | |
18 | | ANNUAL REPORT | | SEPTEMBER 30, 2007 | | |
| | |
| Schedule of Investments (continued) | | Series M Portfolio |
| | (Percentages shown are based on Net Assets) |
| | | | | | | | |
| | | Maturity | | Par (000) | | Value |
Commercial Mortgage Backed Securities (Continued) | | | | | | |
Donaldson, Lufkin & Jenrette, Inc., Commercial Mortgage Corp., Series 00-CKP1, Class A1B | | | | | | | | |
7.18% | | 11/10/33 | | $ | 906 | | $ | 951,545 |
First Union National Bank Commercial Mortgage Trust, Series 00-C2, Class A2 | | | | | | | | |
7.20% | | 10/15/32 | | | 5,500 | | | 5,796,363 |
First Union-Lehman Brothers-Bank of America Commercial Mortgage Trust, Series 98-C2, Class A2 | | | | | | | | |
6.56% | | 11/18/35 | | | 331 | | | 331,083 |
First Union-Lehman Brothers-Bank of America Commercial Mortgage Trust, Series 98-C2, Class B | | | | | | | | |
6.64% | | 03/18/11 | | | 250 | | | 255,071 |
General Electric Capital Commercial Mortgage Corp., Series 01-2, Class A4 | | | | | | | | |
6.29% | | 08/11/33 | | | 1,030 | | | 1,070,300 |
General Electric Capital Commercial Mortgage Corp., Series 04-C2, Class A4 | | | | | | | | |
4.89% | | 03/10/40 | | | 390 | | | 378,335 |
General Motors Acceptance Corp. Commercial Mortgage Securities, Inc., Series 99-C3, Class E | | | | | | | | |
8.08%(b) | | 08/15/09 | | | 5,000 | | | 5,265,560 |
General Motors Acceptance Corp. Commercial Mortgage Securities, Inc., Series 00-C1, Class A2 | | | | | | | | |
7.72% | | 03/15/33 | | | 341 | | | 357,278 |
General Motors Acceptance Corp. Commercial Mortgage Securities, Inc., Series 00-C2, Class A2 | | | | | | | | |
7.46% | | 06/16/10 | | | 2,514 | | | 2,642,694 |
General Motors Acceptance Corp. Commercial Mortgage Securities, Inc., Series 00-C2, Class B | | | | | | | | |
7.59%(c) | | 06/16/10 | | | 1,000 | | | 1,064,356 |
General Motors Acceptance Corp. Commercial Mortgage Securities, Inc., Series 00-C3, Class A2 | | | | | | | | |
6.96% | | 09/15/35 | | | 4,545 | | | 4,781,031 |
General Motors Acceptance Corp. Commercial Mortgage Securities, Inc., Series 01-C1, Class B | | | | | | | | |
6.67% | | 04/15/34 | | | 390 | | | 409,537 |
General Motors Acceptance Corp. Commercial Mortgage Securities, Inc., Series 02-C3, Class B | | | | | | | | |
5.10% | | 07/10/39 | | | 1,000 | | | 992,296 |
General Motors Acceptance Corp. Commercial Mortgage Securities, Inc., Series 03-C1, Class B | | | | | | | | |
4.19% | | 05/10/36 | | | 5,000 | | | 4,727,266 |
General Motors Acceptance Corp. Commercial Mortgage Securities, Inc., Series 03-C2, Class A2 | | | | | | | | |
5.48%(b) | | 05/10/40 | | | 3,465 | | | 3,496,394 |
Goldman Sachs Mortgage Securities Corp. II, Series 99-C1, Class B | | | | | | | | |
6.43% | | 11/18/30 | | | 6,000 | | | 6,066,798 |
Goldman Sachs Mortgage Securities Corp. II, Series 04-GG2, Class A6 | | | | | | | | |
5.40% | | 08/10/38 | | | 275 | | | 273,726 |
Goldman Sachs Mortgage Securities Corp. II, Series 05-GG4, Class A4 | | | | | | | | |
4.76% | | 07/10/39 | | | 300 | | | 286,230 |
Goldman Sachs Mortgage Securities Corp. II, Series 07-GG10, Class A4 | | | | | | | | |
5.99%(b) | | 08/10/45 | | | 5,000 | | | 5,085,072 |
Greenwich Capital Commercial Funding Corp., Series 02-C1, Class B | | | | | | | | |
5.10% | | 11/11/12 | | | 1,000 | | | 991,397 |
Greenwich Capital Commercial Funding Corp., Series 03-C1, Class A3 | | | | | | | | |
3.86% | | 07/05/35 | | | 250 | | | 239,439 |
Greenwich Capital Commercial Funding Corp., Series 05-GG3, Class A3 | | | | | | | | |
4.57% | | 08/10/42 | | | 70 | | | 68,345 |
Greenwich Capital Commercial Funding Corp., Series 05-GG5, Class AJ | | | | | | | | |
5.48%(b) | | 04/10/37 | | | 1,000 | | | 963,733 |
Greenwich Capital Commercial Funding Corp., Series 06-GG7, Class A4 | | | | | | | | |
6.11%(b) | | 07/10/38 | | | 8,085 | | | 8,335,585 |
Greenwich Capital Commercial Funding Corp., Series 07-GG9, Class A4 | | | | | | | | |
5.44% | | 03/10/39 | | | 3,000 | | | 2,964,594 |
Heller Financial Commercial Mortgage Asset, Series 99-PH1, Class B | | | | | | | | |
6.92%(b) | | 05/15/31 | | | 5,719 | | | 5,841,935 |
JPMorgan Chase Commercial Mortgage Finance Corp., Series 00-C10, Class A2 | | | | | | | | |
7.37% | | 08/15/32 | | | 453 | | | 472,895 |
JPMorgan Chase Commercial Mortgage Securities Corp., Series 01, Class A3 | | | | | | | | |
6.43% | | 06/15/11 | | | 4,945 | | | 5,160,382 |
JPMorgan Chase Commercial Mortgage Securities Corp., Series 01-C1, Class A3 | | | | | | | | |
5.86% | | 10/12/35 | | | 3,240 | | | 3,323,759 |
JPMorgan Chase Commercial Mortgage Securities Corp., Series 01-CIBC Class B | | | | | | | | |
6.45% | | 03/15/33 | | | 5,000 | | | 5,208,404 |
JPMorgan Chase Commercial Mortgage Securities Corp., Series 01-CIBC, Class A3 | | | | | | | | |
6.26% | | 03/15/33 | | | 229 | | | 236,132 |
JPMorgan Chase Commercial Mortgage Securities Corp., Series 05-CB12, Class A4 | | | | | | | | |
4.90% | | 09/12/37 | | | 280 | | | 269,511 |
JPMorgan Chase Commercial Mortgage Securities Corp., Series 06-LDP7, Class A4 | | | | | | | | |
6.07%(b) | | 04/15/45 | | | 3,505 | | | 3,603,930 |
JPMorgan Chase Commercial Mortgage Securities Corp., Series 06-LDP8, Class A4 | | | | | | | | |
5.40% | | 05/15/45 | | | 4,750 | | | 4,697,762 |
JPMorgan Chase Commercial Mortgage Securities Corp., Series 06-LDP9, Class A3 | | | | | | | | |
5.34%(b)(c) | | 05/15/47 | | | 800 | | | 784,971 |
JPMorgan Chase Commercial Mortgage Securities Corp., Series 07-CB19 Class A4 | | | | | | | | |
5.94%(b) | | 02/12/49 | | | 5,000 | | | 5,056,216 |
Lehman Brothers Commercial Conduit Mortgage Trust, Series 99-C1, Class A2 | | | | | | | | |
6.78% | | 04/15/09 | | | 5,088 | | | 5,184,903 |
Lehman Brothers-UBS Commercial Mortgage Trust, Series 00-C4, Class A2 | | | | | | | | |
7.37% | | 08/15/26 | | | 451 | | | 474,299 |
See accompanying notes to financial statements.
| | | | | | |
| | | ANNUAL REPORT | | SEPTEMBER 30, 2007 | | 19 |
| | |
| Schedule of Investments (continued) | | Series M Portfolio |
| | (Percentages shown are based on Net Assets) |
| | | | | | | | |
| | | Maturity | | Par
(000) | | Value |
Commercial Mortgage Backed Securities (Continued) | | | | | | |
Lehman Brothers-UBS Commercial Mortgage Trust, Series 01-WM, Class A1 | | | | | | | | |
6.16%(d) | | 07/14/11 | | $ | 742 | | $ | 759,332 |
Lehman Brothers-UBS Commercial Mortgage Trust, Series 04-C4, Class A4 | | | | | | | | |
5.29%(b) | | 06/15/29 | | | 220 | | | 220,202 |
Lehman Brothers-UBS Commercial Mortgage Trust, Series 06-C3, Class A4 | | | | | | | | |
5.66% | | 03/15/39 | | | 355 | | | 358,646 |
Lehman Brothers-UBS Commercial Mortgage Trust, Series 06-C6, Class A4 | | | | | | | | |
5.37% | | 09/15/39 | | | 1,000 | | | 988,407 |
Morgan Stanley Capital I, Inc., Series 99-FNV1, Class B | | | | | | | | |
6.66% | | 03/15/31 | | | 3,000 | | | 3,055,251 |
Morgan Stanley Captial, Inc., Series 07-T27, Class A4 | | | | | | | | |
5.80% | | 06/11/42 | | | 7,648 | | | 7,714,316 |
Salomon Brothers Mortgage Securities VII, Series 00-C1, Class A2 | | | | | | | | |
7.52% | | 12/18/09 | | | 260 | | | 270,606 |
Salomon Brothers Mortgage Securities VII, Series 00-C2, Class A2 | | | | | | | | |
7.46% | | 04/18/10 | | | 1,723 | | | 1,800,981 |
Salomon Brothers Mortgage Securities VII, Series 00-C3, Class A2 | | | | | | | | |
6.59% | | 11/18/10 | | | 5,690 | | | 5,895,018 |
Salomon Brothers Mortgage Securities VII, Series 01-C1, Class A3 | | | | | | | | |
6.43% | | 03/18/11 | | | 5,000 | | | 5,189,200 |
Salomon Brothers Mortgage Securities VII, Series 01-C2, Class A3 | | | | | | | | |
6.50% | | 10/13/11 | | | 5,990 | | | 6,265,775 |
TIAA Commercial Mortgage Trust, Series 07-C4, Class A1 | | | | | | | | |
5.70%(b) | | 08/15/39 | | | 3,896 | | | 3,944,688 |
TIAA Commercial Mortgage Trust, Series 07-C4, Class A3 | | | | | | | | |
6.10%(b) | | 08/15/39 | | | 5,000 | | | 5,126,172 |
TIAA Retail Commercial LLC, Series 01-C1A, Class A4 | | | | | | | | |
6.68%(d) | | 09/19/09 | | | 3,550 | | | 3,638,451 |
Wachovia Bank Commercial Mortgage Trust, Series 06-C25, Class A4 | | | | | | | | |
5.93%(b) | | 05/15/43 | | | 5,000 | | | 5,090,956 |
Wachovia Bank Commercial Mortgage Trust, Series 06-C25, Class A5 | | | | | | | | |
5.93%(b) | | 05/15/43 | | | 1,000 | | | 1,018,803 |
Wachovia Bank Commercial Mortgage Trust, Series 06-C26, Class A3 | | | | | | | | |
6.01% | | 06/15/45 | | | 500 | | | 515,698 |
Wachovia Bank Commercial Mortgage Trust, Series 06-C28, Class A2 | | | | | | | | |
5.50% | | 10/15/48 | | | 400 | | | 403,091 |
Wachovia Bank Commercial Mortgage Trust, Series 06-C29, Class A4 | | | | | | | | |
5.31% | | 11/15/48 | | | 5,000 | | | 4,901,987 |
Wachovia Bank Commercial Mortgage Trust, Series 07-C32 Class A3 | | | | | | | | |
5.93%(b) | | 06/01/49 | | | 5,000 | | | 5,046,912 |
| | | | | | | | |
TOTAL COMMERCIAL MORTGAGE BACKED SECURITIES
(Cost $226,688,337) | | | | | | | | 228,623,876 |
| | | | | | | | |
Asset Backed Securities — 16.2% | | | | | | |
Capital Auto Receivables Asset Trust, Series 06-1, Class A4 | | | | | | | | |
5.04% | | 05/17/10 | | | 2,825 | | | 2,820,842 |
Capital Auto Receivables Asset Trust, Series 06-2, Class A3A | | | | | | | | |
4.98%(c) | | 05/15/11 | | | 4,525 | | | 4,518,015 |
Capital Auto Receivables Asset Trust, Series 07-1, Class A3A | | | | | | | | |
5.00% | | 04/15/11 | | | 3,300 | | | 3,295,166 |
Chase Manhattan Auto Owner Trust, Series 05-B, Class A3 | | | | | | | | |
4.84% | | 07/15/09 | | | 84 | | | 83,565 |
Chase Manhattan Auto Owner Trust, Series 05-B, Class A4 | | | | | | | | |
4.88% | | 06/15/12 | | | 3,875 | | | 3,864,414 |
Chase Manhattan Auto Owner Trust, Series 06-B, Class A3 | | | | | | | | |
5.13% | | 05/15/11 | | | 8,000 | | | 8,000,087 |
Citibank Credit Card Master Trust I, Series 99-2, Class A | | | | | | | | |
5.88% | | 03/10/11 | | | 200 | | | 202,846 |
DaimlerChrysler Auto Trust, Series 06, Class A3 | | | | | | | | |
5.33% | | 08/08/10 | | | 743 | | | 743,250 |
DaimlerChrysler Auto Trust, Series 06-C, Class A3 | | | | | | | | |
5.02% | | 07/08/10 | | | 1,100 | | | 1,098,678 |
Ford Credit Auto Owner Trust, Series 05-A, Class A3 | | | | | | | | |
3.48% | | 11/15/08 | | | 8 | | | 7,781 |
Ford Credit Auto Owner Trust, Series 06-C, Class A3 | | | | | | | | |
5.16% | | 11/15/10 | | | 3,900 | | | 3,903,114 |
Harley-Davidson Motorcycle Trust, Series 05-3, Class A2 | | | | | | | | |
4.41% | | 06/15/12 | | | 6,675 | | | 6,494,715 |
Harley-Davidson Motorcycle Trust, Series 07-2, Class A3 | | | | | | | | |
5.10% | | 05/15/12 | | | 4,425 | | | 4,427,252 |
Honda Auto Receivables Owner Trust, Series 05-4, Class A4 | | | | | | | | |
4.60% | | 11/22/10 | | | 3,375 | | | 3,346,036 |
Honda Auto Receivables Owner Trust, Series 06-3, Class A3 | | | | | | | | |
5.12% | | 10/15/10 | | | 6,985 | | | 6,981,216 |
MBNA Master Credit Card Trust, Series 00-L, Class A | | | | | | | | |
6.50% | | 04/15/10 | | | 240 | | | 240,505 |
Nissan Auto Receivables Owner Trust, Series 06-C, Class A3 | | | | | | | | |
5.44% | | 04/15/10 | | | 4,735 | | | 4,747,878 |
Nissan Auto Receivables Owner Trust, Series 07-A, Class A3 | | | | | | | | |
5.10% | | 11/15/10 | | | 1,000 | | | 1,000,577 |
USAA Auto Owner Trust, Series 05-3, Class A4 | | | | | | | | |
4.63% | | 05/15/12 | | | 8,675 | | | 8,612,238 |
USAA Auto Owner Trust, Series 05-4, Class A3 | | | | | | | | |
4.83% | | 04/15/10 | | | 144 | | | 144,147 |
USAA Auto Owner Trust, Series 05-4, Class A4 | | | | | | | | |
4.89% | | 08/15/12 | | | 250 | | | 249,363 |
See accompanying notes to financial statements.
| | | | | | |
20 | | ANNUAL REPORT | | SEPTEMBER 30, 2007 | | |
| | |
| Schedule of Investments (concluded) | | Series M Portfolio |
| | (Percentages shown are based on Net Assets) |
| | | | | | | | | |
| | | Maturity | | Par (000) | | Value | |
Asset Backed Securities (Continued) | | | | | | | | | |
USAA Auto Owner Trust, Series 06-2, Class A4 | | | | | | | | | |
5.37% | | 02/15/12 | | $ | 1,150 | | $ | 1,156,388 | |
USAA Auto Owner Trust, Series 06-4, Class A3 | | | | | | | | | |
5.01% | | 06/15/11 | | | 8,000 | | | 7,993,606 | |
USAA Auto Owner Trust, Series 06-4, Class A4 | | | | | | | | | |
4.98% | | 10/15/12 | | | 3,400 | | | 3,386,186 | |
Wachovia Auto Owner Trust, Series 05-B, Class A4 | | | | | | | | | |
4.84% | | 04/20/11 | | | 500 | | | 498,303 | |
World Omni Auto Receivables Trust, Series 06-B, Class A4 | | | | | | | | | |
5.12% | | 06/15/12 | | | 500 | | | 500,027 | |
| | | | | | | | | |
TOTAL ASSET BACKED SECURITIES
(Cost $78,304,679) | | | | | | | | 78,316,195 | |
| | | | | | | | | |
| | | |
| | | | | Par/Shares
(000) | | | |
Short Term Investments — 33.1% | | | | | | | | | |
Federal Home Loan Bank, Discount Notes | | | | | | | | | |
4.00%(e) | | 10/01/07 | | | 29,000 | | | 29,000,000 | |
4.72%(e) | | 10/19/07 | | | 122,000 | | | 121,713,300 | |
Galileo Money Market Fund, 4.72%(f) | | | | | 8,876 | | | 8,876,331 | |
| | | | | | | | | |
TOTAL SHORT TERM INVESTMENTS
(Cost $159,589,631) | | | | | | | | 159,589,631 | |
| | | | | | | | | |
| | | |
| | | | | | | Value | |
TOTAL INVESTMENTS IN SECURITIES BEFORE AFFILIATED INVESTMENT — 124.5%
(Cost $599,299,445) | | | | | | | $ | 600,556,418 | |
| | | | | | | | | |
| | | |
| | | Maturity | | Par (000) | | | |
Affiliated Investment — 1.1% | | | | | | | | | |
Commercial Mortgage Backed Security — 1.1% | | | | | | | | | |
Merrill Lynch-Countrywide Commercial Mortgage Trust, Series 06-3, Class A4 | | | | | | | | | |
5.41% | | | | | | | | | |
(Cost $5,420,620) | | 07/12/46 | | $ | 5,475 | | | 5,423,783 | |
TOTAL INVESTMENTS IN SECURITIES — 125.6%
(Cost $604,720,065(a)) | | | | | | | | 605,980,201 | |
LIABILITIES IN EXCESS OF OTHER ASSETS — (25.6)% | | | | | | | | (123,554,597 | ) |
| | | | | | | | | |
NET ASSETS — 100.0% | | | | | | | $ | 482,425,604 | |
| | | | | | | | | |
(a) | Also cost for federal income tax purposes. The gross unrealized appreciation (depreciation) on a tax basis is as follows: |
| | | | |
Gross unrealized appreciation | | $ | 2,666,660 | |
Gross unrealized depreciation | | | (1,406,524 | ) |
| | | | |
| | $ | 1,260,136 | |
| | | | |
(b) | Variable rate security. Rate shown is the rate as of September 30, 2007. |
(c) | Security, or a portion thereof, pledged as collateral with a value of $2,365,528 on 383 long U.S. Treasury Note futures contracts, 406 long U.S. Treasury Bond futures contracts and 326 short U.S. Treasury Note futures contracts expiring December 2007. The notional value of such contracts on September 30, 2007 was $151,349,433, with unrealized loss of $179,699 (including commissions of $2,453). |
(d) | Security exempt from registration under Rule 144A of the Securities Act of 1933. These securities may be resold in transactions exempt from registration to qualified institutional investors. As of September 30, 2007, the Portfolio held 0.9% of its net assets, with a current market value of $4,397,783, in securities restricted as to resale. |
(e) | The rate shown is the effective yield at the time of purchase. |
(f) | Represents current yield as of September 30, 2007. |
See accompanying notes to financial statements.
| | | | | | |
| | | ANNUAL REPORT | | SEPTEMBER 30, 2007 | | 21 |
| | |
| Schedule of Investments | | BlackRock Bond Allocation Target Shares |
KEY TO INVESTMENT ABBREVIATIONS
| | ARM | Adjustable Rate Mortgage |
| | REIT | Real Estate Investment Trust |
See accompanying notes to financial statements.
| | | | | | |
22 | | ANNUAL REPORT | | SEPTEMBER 30, 2007 | | |
Statements of Assets and Liabilities
| | | | | | | | | | | | |
As of September 30, 2007 | | Series S Portfolio | | | Series C Portfolio | | | Series M Portfolio | |
Assets | | | | | | | | | | | | |
Investments at value - unaffiliated1 | | $ | 43,702,828 | | | $ | 537,496,005 | | | $ | 600,556,418 | |
Investments at value - affiliated2 | | | — | | | | — | | | | 5,423,783 | |
Dividends receivable | | | 7,712 | | | | 1,840 | | | | 31,150 | |
Interest receivable | | | 150,773 | | | | 6,664,223 | | | | 1,540,401 | |
Interest receivable - affiliated | | | — | | | | — | | | | 24,701 | |
Principal paydown receivable | | | 48,425 | | | | — | | | | — | |
Investments sold receivable | | | — | | | | 4,673,168 | | | | 1,246,431 | |
Capital shares sold receivable | | | 418,131 | | | | 1,210,340 | | | | 953,517 | |
Receivable from advisor | | | 42,492 | | | | 73,109 | | | | 62,148 | |
Prepaid expenses | | | 12,601 | | | | 14,937 | | | | 14,941 | |
Futures margin receivable | | | 8,036 | | | | 20,305 | | | | 21,314 | |
| | | | | | | | | | | | |
Total Assets | | | 44,390,998 | | | | 550,153,927 | | | | 609,874,804 | |
| | | | | | | | | | | | |
Liabilities | | | | | | | | | | | | |
Capital shares redeemed payable | | | 418,131 | | | | 407,961 | | | | 450,041 | |
Investments purchased payable | | | 200,771 | | | | 7,707,559 | | | | 124,713,247 | |
Distributions payable | | | 181,454 | | | | 2,111,542 | | | | 2,126,981 | |
Audit fees payable | | | 33,742 | | | | 34,369 | | | | 34,377 | |
Printing fees payable | | | 22,191 | | | | 16,858 | | | | 17,038 | |
Custodian fees payable | | | 3,387 | | | | 11,855 | | | | 10,583 | |
Administration fees payable | | | 2,568 | | | | 7,410 | | | | 5,782 | |
Options written, at fair value3 | | | 2,550 | | | | — | | | | — | |
Legal fees payable | | | 2,264 | | | | 30,341 | | | | 30,789 | |
Transfer agent fees payable | | | 2,095 | | | | 43,298 | | | | 42,812 | |
Other accrued expenses payable | | | 947 | | | | 14,738 | | | | 14,917 | |
Officers’ and trustees’ fees payable | | | 309 | | | | 2,594 | | | | 2,633 | |
Reverse repurchase agreements payable | | | — | | | | 58,702,375 | | | | — | |
Interest payable | | | — | | | | 159,605 | | | | — | |
Payable for financing transactions | | | — | | | | 5,179,163 | | | | — | |
| | | | | | | | | | | | |
Total Liabilities | | | 870,409 | | | | 74,429,668 | | | | 127,449,200 | |
| | | | | | | | | | | | |
Net Assets | | $ | 43,520,589 | | | $ | 475,724,259 | | | $ | 482,425,604 | |
| | | | | | | | | | | | |
Net Assets Consist of | | | | | | | | | | | | |
Capital paid in | | $ | 43,789,780 | | | $ | 478,056,804 | | | $ | 482,401,313 | |
Undistributed (distributions in excess of) net investment income | | | 83 | | | | 583 | | | | (50 | ) |
Accumulated net realized loss on investment transactions, futures and options | | | (288,530 | ) | | | (550,613 | ) | | | (1,056,096 | ) |
Net unrealized appreciation (depreciation) on investments, futures and options | | | 19,256 | | | | (1,782,515 | ) | | | 1,080,437 | |
| | | | | | | | | | | | |
Net Assets | | $ | 43,520,589 | | | $ | 475,724,259 | | | $ | 482,425,604 | |
| | | | | | | | | | | | |
Net Assets Value | | | | | | | | | | | | |
Shares outstanding, unlimited number of shares authorized, $0.001 par value | | | 4,446,268 | | | | 48,602,896 | | | | 49,597,288 | |
Net Asset Value | | $ | 9.79 | | | $ | 9.79 | | | $ | 9.73 | |
| | | | | | | | | | | | |
1 Cost of investments - unaffiliated | | $ | 43,719,986 | | | $ | 539,323,093 | | | $ | 599,299,445 | |
2 Cost of investments - affiliated | | | — | | | | — | | | | 5,420,620 | |
3 Premiums received - options written | | | 2,327 | | | | — | | | | — | |
See accompanying notes to financial statements.
| | | | | | |
| | | ANNUAL REPORT | | SEPTEMBER 30, 2007 | | 23 |
Statements of Operations
| | | | | | | | | | | | |
For the Year Ended September 30, 2007 | | Series S Portfolio | | | Series C Portfolio | | | Series M Portfolio | |
Investment Income | | | | | | | | | | | | |
Interest | | $ | 1,856,109 | | | $ | 11,766,213 | | | $ | 10,868,765 | |
Interest from affiliates (Note C) | | | — | | | | — | | | | 110,078 | |
Dividends | | | 60,350 | | | | 79,121 | | | | 204,795 | |
| | | | | | | | | | | | |
Total investment income | | | 1,916,459 | | | | 11,845,334 | | | | 11,183,638 | |
| | | | | | | | | | | | |
Expenses | | | | | | | | | | | | |
Legal and audit fees | | | 86,135 | | | | 104,118 | | | | 95,723 | |
Administration fees | | | 33,295 | | | | 61,298 | | | | 42,829 | |
Transfer agent fees | | | 19,651 | | | | 160,194 | | | | 159,538 | |
Registration fees and expenses | | | 19,557 | | | | 35,951 | | | | 35,902 | |
Custodian fees | | | 19,071 | | | | 41,210 | | | | 35,254 | |
Officers’ and trustees’ fees | | | 2,303 | | | | 9,188 | | | | 8,268 | |
Printing fees | | | — | | | | 5,357 | | | | 2,163 | |
Other | | | 3,312 | | | | 3,386 | | | | 2,954 | |
| | | | | | | | | | | | |
Total expenses excluding interest expense | | | 183,324 | | | | 420,702 | | | | 382,631 | |
Interest expense | | | — | | | | 413,521 | | | | — | |
| | | | | | | | | | | | |
Total expenses | | | 183,324 | | | | 834,223 | | | | 382,631 | |
Less expenses reimbursed by advisor | | | (183,324 | ) | | | (420,702 | ) | | | (382,631 | ) |
| | | | | | | | | | | | |
Net expenses | | | — | | | | 413,521 | | | | — | |
| | | | | | | | | | | | |
Net investment income | | | 1,916,459 | | | | 11,431,813 | | | | 11,183,638 | |
| | | | | | | | | | | | |
Realized and Unrealized Gain (Loss) | | | | | | | | | | | | |
Net realized gain (loss) from: | | | | | | | | | | | | |
Investment transactions | | | 48,107 | | | | (687,965 | ) | | | 4,264,366 | |
Futures | | | (279,460 | ) | | | 274,385 | | | | (5,298,036 | ) |
| | | | | | | | | | | | |
| | | (231,353 | ) | | | (413,580 | ) | | | (1,033,670 | ) |
| | | | | | | | | | | | |
Net change in unrealized appreciation/depreciation on: | | | | | | | | | | | | |
Investments - unaffiliated | | | (4,662 | ) | | | (1,798,643 | ) | | | 1,341,100 | |
Investments - affiliated | | | — | | | | — | | | | 3,163 | |
Futures | | | 31,802 | | | | 65,239 | | | | (181,175 | ) |
Options written | | | (223 | ) | | | — | | | | — | |
| | | | | | | | | | | | |
| | | 26,917 | | | | (1,733,404 | ) | | | 1,163,088 | |
| | | | | | | | | | | | |
Net gain (loss) on investments, futures and options written | | | (204,436 | ) | | | (2,146,984 | ) | | | 129,418 | |
| | | | | | | | | | | | |
Net increase in net assets resulting from operations | | $ | 1,712,023 | | | $ | 9,284,829 | | | $ | 11,313,056 | |
| | | | | | | | | | | | |
See accompanying notes to financial statements.
| | | | | | |
24 | | ANNUAL REPORT | | SEPTEMBER 30, 2007 | | |
Statements of Changes in Net Assets
| | | | | | | | | | | | | | | | | | | | | | | | |
| | | Series S Portfolio | | | Series C Portfolio | | | Series M Portfolio | |
| | | For the Year Ended September 30, | | | For the Year Ended September 30, | | | For the Year Ended September 30, | |
Increase in Net Assets: | | 2007 | | | 2006 | | | 2007 | | | 2006 | | | 2007 | | | 2006 | |
Operations | | | | | | | | | | | | | | | | | | | | | | | | |
Net investment income | | $ | 1,916,459 | | | $ | 723,778 | | | $ | 11,431,813 | | | $ | 522,374 | | | $ | 11,183,638 | | | $ | 291,669 | |
Net realized gain (loss) | | | (231,353 | ) | | | (33,947 | ) | | | (413,580 | ) | | | (127,568 | ) | | | (1,033,670 | ) | | | 4,556 | |
Net change in unrealized appreciation/depreciation | | | 26,917 | | | | 112,985 | | | | (1,733,404 | ) | | | 25,388 | | | | 1,163,088 | | | | 997 | |
| | | | | | | | | | | | | | | | | | | | | | | | |
Net increase in net assets resulting from operations | | | 1,712,023 | | | | 802,816 | | | | 9,284,829 | | | | 420,194 | | | | 11,313,056 | | | | 297,222 | |
| | | | | | | | | | | | | | | | | | | | | | | | |
Dividends to Shareholders from | | | | | | | | | | | | | | | | | | | | | | | | |
Net investment income | | | (1,903,719 | ) | | | (723,434 | ) | | | (11,431,861 | ) | | | (522,374 | ) | | | (11,206,935 | ) | | | (295,388 | ) |
| | | | | | | | | | | | | | | | | | | | | | | | |
Capital Share Transactions | | | | | | | | | | | | | | | | | | | | | | | | |
Shares sold | | | 29,653,618 | | | | 26,936,610 | | | | 518,257,883 | | | | 4,066,657 | | | | 517,022,087 | | | | 4,056,785 | |
Shares issued in reinvestment of dividends | | | 1,869 | | | | 846 | | | | 18,641 | | | | 686 | | | | 18,997 | | | | 716 | |
Shares redeemed | | | (15,890,504 | ) | | | (6,912,659 | ) | | | (53,769,756 | ) | | | (517,307 | ) | | | (43,222,826 | ) | | | (474,446 | ) |
| | | | | | | | | | | | | | | | | | | | | | | | |
Net increase in net assets resulting from capital share transactions | | | 13,764,983 | | | | 20,024,797 | | | | 464,506,768 | | | | 3,550,036 | | | | 473,818,258 | | | | 3,583,055 | |
| | | | | | | | | | | | | | | | | | | | | | | | |
Net Assets | | | | | | | | | | | | | | | | | | | | | | | | |
Total increase in net assets | | | 13,573,287 | | | | 20,104,179 | | | | 462,359,736 | | | | 3,447,856 | | | | 473,924,379 | | | | 3,584,889 | |
Beginning of year | | | 29,947,302 | | | | 9,843,123 | | | | 13,364,523 | | | | 9,916,667 | | | | 8,501,225 | | | | 4,916,336 | |
| | | | | | | | | | | | | | | | | | | | | | | | |
End of year | | $ | 43,520,589 | | | $ | 29,947,302 | | | $ | 475,724,259 | | | $ | 13,364,523 | | | $ | 482,425,604 | | | $ | 8,501,225 | |
| | | | | | | | | | | | | | | | | | | | | | | | |
End of year undistributed (distributions in excess of) net investment income | | $ | 83 | | | $ | — | | | $ | 583 | | | $ | 631 | | | $ | (50 | ) | | $ | — | |
See accompanying notes to financial statements.
| | | | | | |
| | | ANNUAL REPORT | | SEPTEMBER 30, 2007 | | 25 |
Financial Highlights For a Share Outstanding Throughout Each Period
| | | | | | | | | | | | | | | | | | | | | | | | | | | | | | | | | | | | |
| | | Series S Portfolio | | | Series C Portfolio | | | Series M Portfolio | |
| | | For the Year Ended September 30, | | | For the Year Ended September 30, | | | For the Year Ended September 30, | |
| | | 2007 | | | 2006 | | | 2005 | | | 2007 | | | 2006 | | | 2005 | | | 2007 | | | 2006 | | | 2005 | |
Per Share Operating Performance | | | | | | | | | | | | | | | | | | | | | | | | | | | | | | | | | | | | |
Net asset value, beginning of year | | $ | 9.84 | | | $ | 9.84 | | | $ | 10.00 | | | $ | 9.79 | | | $ | 9.92 | | | $ | 10.00 | | | $ | 9.79 | | | $ | 9.83 | | | | 10.00 | |
| | | | | | | | | | | | | | | | | | | | | | | | | | | | | | | | | | | | |
Net investment income1 | | | 0.52 | | | | 0.43 | | | | 0.35 | | | | 0.51 | | | | 0.47 | | | | 0.41 | | | | 0.51 | | | | 0.48 | | | | 0.40 | |
Net realized and unrealized gain (loss) on investments and futures contracts | | | (0.06 | ) | | | — | | | | (0.16 | ) | | | — | | | | (0.14 | ) | | | (0.08 | ) | | | (0.05 | ) | | | (0.05 | ) | | | (0.17 | ) |
Dividends from net investment income | | | (0.51 | ) | | | (0.43 | ) | | | (0.35 | ) | | | (0.51 | ) | | | (0.46 | ) | | | (0.41 | ) | | | (0.52 | ) | | | (0.47 | ) | | | (0.40 | ) |
| | | | | | | | | | | | | | | | | | | | | | | | | | | | | | | | | | | | |
Net asset value, end of year | | $ | 9.79 | | | $ | 9.84 | | | $ | 9.84 | | | $ | 9.79 | | | $ | 9.79 | | | $ | 9.92 | | | $ | 9.73 | | | $ | 9.79 | | | $ | 9.83 | |
| | | | | | | | | | | | | | | | | | | | | | | | | | | | | | | | | | | | |
Total Investment Return | | | | | | | | | | | | | | | | | | | | | | | | | | | | | | | | | | | | |
Total return | | | 4.88 | % | | | 4.51 | % | | | 2.00 | % | | | 5.37 | % | | | 3.51 | % | | | 3.34 | % | | | 4.88 | % | | | 4.54 | % | | | 2.37 | % |
| | | | | | | | | | | | | | | | | | | | | | | | | | | | | | | | | | | | |
Ratios/Supplemental Data | | | | | | | | | | | | | | | | | | | | | | | | | | | | | | | | | | | | |
Net assets, end of year (in thousands) | | $ | 43,521 | | | $ | 29,947 | | | $ | 9,843 | | | $ | 475,724 | | | $ | 13,365 | | | $ | 9,917 | | | $ | 482,426 | | | $ | 8,501 | | | $ | 4,916 | |
Ratio of net expenses to average net assets | | | 0.00 | % | | | 0.00 | % | | | 0.00 | % | | | 0.19 | % | | | 0.00 | % | | | 0.00 | % | | | 0.00 | % | | | 0.00 | % | | | 0.00 | % |
Ratio of net expenses to average net assets (excluding interest expense) | | | 0.00 | % | | | 0.00 | % | | | 0.00 | % | | | 0.00 | % | | | 0.00 | % | | | 0.00 | % | | | 0.00 | % | | | 0.00 | % | | | 0.00 | % |
Ratio of total net expenses to average net assets (excluding reimbursements) | | | 0.51 | % | | | 1.28 | % | | | 2.72 | % | | | 0.39 | % | | | 1.60 | % | | | 3.02 | % | | | 0.18 | % | | | 2.05 | % | | | 3.93 | % |
Ratio of net investment income to average net assets | | | 5.28 | % | | | 4.49 | % | | | 3.54 | % | | | 5.31 | % | | | 4.81 | % | | | 4.12 | % | | | 5.28 | % | | | 4.86 | % | | | 4.03 | % |
Ratio of net investment income to average net assets (excluding reimbursements) | | | 4.77 | % | | | 3.21 | % | | | 0.82 | % | | | 5.11 | % | | | 3.21 | % | | | 1.10 | % | | | 5.10 | % | | | 2.81 | % | | | 0.10 | % |
Portfolio turnover rate | | | 53 | % | | | 52 | % | | | 17 | % | | | 70 | % | | | 42 | % | | | 50 | % | | | 7 | % | | | 23 | % | | | 36 | % |
1 | Calculated using the average shares outstanding method. |
See accompanying notes to financial statements.
| | | | | | |
26 | | ANNUAL REPORT | | SEPTEMBER 30, 2007 | | |
Notes to Financial Statements
(A) Organization
BlackRock Bond Allocation Target Shares (“BATS” or the “Fund”) was organized as a Delaware statutory trust on March 5, 2003 and is registered under the Investment Company Act of 1940, as amended, as an open-ended management investment company. Pursuant to this authority, the Board of Trustees (the “Board”) has authorized the issuance of an unlimited number of shares in five investment portfolios, three of which, Series S, Series C and Series M (the “Portfolios”), commenced operations on October 1, 2004. As of September 30, 2007, Series P and Series I had not commenced operations.
Investors may only purchase shares in the five investment portfolios described herein by entering into a wrap-fee program or other managed account. Participants in wrap-fee programs pay a single aggregate fee to the program sponsor for all costs and expenses of the wrap-fee programs including investment advice and portfolio execution.
(B) Summary of Significant Accounting Policies
The following is a summary of significant accounting policies followed by the Fund in the preparation of its financial statements.
Investment Valuation—Valuation of investments held by each Portfolio is as follows: fixed income investments are valued by using market quotations or prices provided by market makers; a portion of the fixed income investments are valued utilizing one or more pricing services approved by the Board. Futures are valued at the last sales price prior to 4:00 p.m. (Eastern time), as quoted on the principal exchange or board of trade on which such futures are traded, or in the absence of a sale, the mean between the last bid and asked prices prior to 4:00 p.m. (Eastern time). Effective September 4, 2007, exchange traded options are valued at the mean between the last bid and asked prices prior to 4:00 p.m. (Eastern time) and previously were valued at the last sales price prior to 4:00 p.m. (Eastern Time). The amortized cost method of valuation will be used with respect to debt obligations with 60 days or less remaining to maturity unless the investment advisor under the supervision of the Board determines that such method does not represent fair value. Investments in open-end investment companies are valued at net asset value per share. In the event that application of these methods of valuation results in a price for an investment which is deemed not to be representative of the market value of such investment, the investment will be valued by, under the direction of or in accordance with a method approved by the Board as reflecting fair value (“Fair Value Assets”). The investment advisor will submit its recommendations regarding the valuation and/or valuation methodologies for Fair Value Assets to the Portfolios’ valuation committee. Such valuation committee may accept, modify or reject any recommendations. The pricing of all Fair Value Assets shall be subsequently reported to the Board or a committee thereof. As of September 30, 2007, there were no Fair Value Assets.
When determining the price for Fair Value Assets, the investment advisor shall seek to determine the price that a Portfolio might reasonably expect to receive from the current sale of that asset in an arm’s-length transaction. Fair value determinations shall be based upon all available factors that the investment advisor deems relevant.
In September 2006, Statement of Financial Accounting Standards No. 157, “Fair Value Measurements” (“FAS 157”), was issued and is effective for fiscal years beginning after November 15, 2007. FAS 157 defines fair value, establishes a framework for measuring fair value and expands disclosures about fair value measurements. At this time, management is evaluating the implications of FAS 157 and its impact on the Portfolios’ financial statements, if any, has not been determined.
In addition, in February 2007, the Financial Accounting Standards Board issued Statement of Financial Accounting Standards No. 159, “The Fair Value Option for Financial Assets and Financial Liabilities” (“FAS 159”), which is effective for fiscal years beginning after November 15, 2007. Early adoption is permitted as of the beginning of a fiscal year that begins on or before November 15, 2007, provided the entity also elects to apply the provisions of FAS 157. FAS 159 permits entities to choose to measure many financial instruments and certain other items at fair value that are not currently required to be measured at fair value. FAS 159 also establishes presentation and disclosure requirements designed to facilitate comparisons between entities that choose different measurement attributes for similar types of assets and liabilities. At this time, management is evaluating the implications of FAS 159 and its impact on the Portfolios’ financial statements, if any, has not been determined.
Dividends to Shareholders—Dividends from net investment income are declared by each Portfolio each day on “settled” shares (i.e. shares for which the Portfolio has received payment) and are paid monthly. Over the course of a year, substantially all of the Portfolio’s net investment income will be declared as dividends. Net realized capital gains, if any, are distributed at least annually.
Investment Transactions and Investment Income—Investment transactions are accounted for on the trade date. The cost of investments sold and realized gains and losses thereon are determined by use of specific identification method, generally first-in first-out, for both financial reporting and federal income tax purposes. Interest income is recorded on the accrual basis. Discounts and premiums on debt securities are accreted or amortized, respectively, for book and tax purposes using the effective yield-to-maturity method over the term of the instrument. Paydown gains and losses on mortgage and asset-backed securities are presented as an adjustment to interest income.
Trust Preferred Stock—These securities are typically issued by corporations, generally in the form of interest-bearing notes with preferred securities characteristics, or by an affiliated business trust of a corporation, generally in the form of beneficial interests in subordinated debentures or similarly structured securities. The securities can be structured as either fixed or adjustable coupon securities that can have either a perpetual or stated maturity date. Dividends can be deferred without creating an event of default or acceleration, although maturity cannot take place unless all cumulative payment obligations have been met. The deferral of payments does not affect the purchase or sale of these securities in the open market. Payments on these securities are treated as interest rather
| | | | | | |
| | | ANNUAL REPORT | | SEPTEMBER 30, 2007 | | 27 |
| | |
| Notes to Financial Statements (continued) | | |
than dividends for Federal income tax purposes. These securities can have a rating that is slightly below that of the issuing company’s senior debt securities.
Asset-Backed Securities — The Portfolios may invest in asset-backed securities. Asset-backed securities are generally issued as pass-through certificates, which represent undivided fractional ownership interests in an underlying pool of assets, or as debt instruments, which are also known as collateralized obligations, and are generally issued as the debt of a special purpose entity organized solely for the purpose of owning such assets and issuing such debt. Asset-backed securities are often backed by a pool of assets representing the obligations of a number of different parties. The yield characteristics of certain asset-backed securities may differ from traditional debt securities. One such major difference is that all or a principal part of the obligations may be prepaid at any time because the underlying assets (i.e., loans) may be prepaid at any time. As a result, a decrease in interest rates in the market may result in increases in the level of prepayments as borrowers, particularly mortgagors, refinance and repay their loans. An increased prepayment rate with respect to an asset-backed security subject to such a prepayment feature will have the effect of shortening the maturity of the security. If a Portfolio has purchased such an asset-backed security at a premium, a faster than anticipated prepayment rate could result in a loss of principal to the extent of the premium paid.
Mortgage Pass-Through Securities — The Portfolios may purchase in the secondary market certain mortgage pass-through securities. There are a number of important differences among the agencies and instrumentalities of the U.S. Government that issue mortgage-related securities and among the securities that they issue. For example, mortgage-related securities guaranteed by the Government National Mortgage Association (“GNMA”) include Ginnie Maes, which are guaranteed as to the timely payment of principal and interest by GNMA and such guarantee is backed by the full faith and credit of the United States. However, mortgage-related securities issued by the Federal National Mortgage Association (“FNMA”) include FNMA guaranteed mortgage pass-through certificates (also known as “Fannie Maes”) which are solely the obligations of the FNMA, are not backed by or entitled to the full faith and credit of the United States and are supported by the right of the issuer to borrow from the Treasury.
Multiple Class Pass-Through Securities — The Portfolios may invest in multiple class pass-through securities, including collateralized mortgage obligations (“CMOs”) and commercial mortgage backed securities (“CMBS”). These multiple class securities may be issued by GNMA, U.S. Government agencies or instrumentalities or by trusts formed by private originators of, or investors in, mortgage loans. In general, these securities are debt obligations of a legal entity that are collateralized by, and multiple class pass-through securities represent direct ownership interests in, a pool of residential or commercial mortgage loans or mortgage pass-through securities, the payments on which are used to make payments on the multiple class pass-through securities. The markets for multiple class pass-through securities may be more illiquid than those of other securities.
Classes of multiple class pass-through securities include interest only (“IOs”), principal only (“POs”), planned amortization classes (“PACs”) and targeted amortization classes (“TACs”). IOs and POs are stripped mortgage-backed securities representing interests in a pool of mortgages the cash flow from which has been separated into interest and principal components. IOs receive the interest portion of the cash flow while POs receive the principal portion. IOs and POs can be extremely volatile in response to changes in interest rates. As interest rates rise and fall, the value of IOs tends to move in the same direction as interest rates. POs perform best when prepayments on the underlying mortgages rise since this increases the rate at which the investment is returned and the yield to maturity on the PO. When payments on mortgages underlying a PO are slow, the life of the PO is lengthened and the yield to maturity is reduced.
Repurchase Agreements — Money market instruments may be purchased from financial institutions, such as banks and non-bank dealers, subject to the seller’s agreement to repurchase them at an agreed upon date and price. Collateral for repurchase agreements may have longer maturities than the maximum permissible remaining maturity of portfolio investments, provided the repurchase agreements themselves mature in 13 months or less. The seller is required on a daily basis to maintain the value of the securities subject to the agreement at no less than the repurchase price. The agreements are conditioned upon the collateral being deposited under the U.S. Federal Reserve book entry system or held in a separate account by each Portfolios’ custodian or an authorized securities depository.
Reverse Repurchase Agreements — The Portfolios may enter into reverse repurchase agreements with qualified third party brokers-dealers. Interest on the value of the reverse repurchase agreements issued and outstanding is based upon competitive market rates at the time of issuance and is included within the related liability on the Statement of Assets and Liabilities. At the time a Portfolio enters into a reverse repurchase agreement, it identifies for segregation certain liquid securities having a value not less than the repurchase price, including accrued interest, of the reverse repurchase agreement.
Details of open reverse repurchase agreements at September 30, 2007 were as follows (please see corresponding underlying collateral chart):
| | | | | | | | | | | | | |
Portfolio/Counter Party | | Rate | | | Settlement Date | | Maturity Date (1) | | Net Closing Amount | | Par |
Series C | | | | | | | | | | | | | |
Lehman Brothers | | 4.190 | % | | 8/24/07 | | TBD | | $ | 29,488,946 | | $ | 29,362,500 |
| | 5.270 | | | 9/04/07 | | TBD | | | 1,120,248 | | | 1,116,000 |
| | 4.650 | | | 9/14/07 | | 10/11/07 | | | 306,691 | | | 305,625 |
| | 4.950 | | | 9/14/07 | | TBD | | | 2,402,273 | | | 2,397,000 |
| | 4.550 | | | 9/20/07 | | 10/04/07 | | | 5,115,285 | | | 5,106,250 |
| | 4.550 | | | 9/24/07 | | 10/11/07 | | | 4,083,756 | | | 4,075,000 |
| | 4.600 | | | 9/27/07 | | 10/11/07 | | | 16,369,230 | | | 16,340,000 |
| | | | | | | | | | | | | |
| | | | | | | | | | | | $ | 58,702,375 |
(1) | TBD - To be determined |
| | | | | | |
28 | | ANNUAL REPORT | | SEPTEMBER 30, 2007 | | |
| | |
| Notes to Financial Statements (continued) | | |
Details of underlying collateral for open reverse repurchase agreements at September 30, 2007 were as follows:
| | | | | | | | | | | | | |
Portfolio/Counter Party | | Description | | Rate | | | Maturity Date | | Par (000) | | Market Value |
Series C | | | | | | | | | | | | | |
Lehman Brothers | | U.S.
Treasury
Notes | | 4.75 | % | | 2/15/10 | | $ | 57,750 | | $ | 59,083,885 |
Futures Transactions — The Portfolios use futures contracts typically as a substitute for taking a position in the underlying asset and/or as part of a strategy designed to reduce exposure to other risks, such as interest rate or currency risk. The Portfolios may also use these instruments for leverage. These futures contracts obligate the Portfolios, at maturity, to take or make delivery of securities, the cash value of a securities index or a stated quantity of a foreign currency. Upon entering into a futures contract, the Portfolios are required to deposit cash or pledge securities as initial margin. Subsequent payments, which are dependent on the daily fluctuations in the value of the underlying security or securities, are made or received by the Portfolios each day (daily variation margin) and are recorded as cumulative unrealized gains or losses until the contracts are closed. When the contracts are closed, the Portfolios record a realized gain or loss equal to the difference between the proceeds from (or cost of) the closing transaction and the Portfolios’ basis in the contracts. Risks of entering into futures contracts include the possibility that there will not be a perfect price correlation between the futures contracts and the underlying securities. Second, it is possible that a lack of liquidity for futures contracts could exist in the market, resulting in an inability to liquidate a futures position prior to its maturity date. Third, the purchase of a futures contract involves the risk that the Portfolios could lose more than the original margin deposit required to initiate a futures transaction.
Option Puts and Calls — The Portfolios may write (sell) covered call options, buy call options, write secured put options and buy put options for the purpose of hedging or earning additional income, which may be deemed speculative. For the payment of a premium, the purchaser of an option obtains the right to buy (in the case of a call option) or to sell (in the case of a put option) the item which is the subject of the option at a stated exercise price for a specific period of time. These options may relate to particular securities, securities indices, or the yield differential between two securities. There is no limit on the amount of a Portfolio’s assets that can be put at risk through the use of options. In addition, unlisted options are not subject to the protections afforded purchasers of listed options issued by the Options Clearing Corporation, which performs the obligations of its members if they default. The primary risks associated with the use of options are (a) the imperfect correlation between the change in market value of the instruments held by a Portfolio and the price of the option; (b) losses caused by unanticipated market movements, which are potentially unlimited; (c) the advisor’s or sub-advisor’s inability to predict correctly the direction of securities prices, interest rates, currency exchange rates and other economic factors; and (d) the possibility that the counterparty will default in the performance of its obligations.
Written options transactions entered into during the year ended September 30, 2007 are summarized as follows:
| | | | | | | |
| | | Series S | |
| | | Number of Contracts | | | Premium | |
Balance at 9/30/06 | | — | | | $ | — | |
Written | | (24 | ) | | | (2,327 | ) |
Expired | | — | | | | — | |
Closed | | — | | | | — | |
| | | | | | | |
Balance at 9/30/07 | | (24 | ) | | $ | (2,327 | ) |
| | | | | | | |
Investing in Government Sponsored Enterprises — The Portfolios invest in securities issued by the Federal Home Loan Mortgage Corp. (“Freddie Mac”) and similar United States Government sponsored entities such as the Federal National Mortgage Assoc. (“Fannie Mae”) and the Federal Home Loan Banks (“FHLBs”). Freddie Mac, Fannie Mae and FHLBs, although chartered and sponsored by Congress, are not funded by Congressional appropriations and the debt and mortgage-backed securities issued by Freddie Mac, Fannie Mae and FHLBs are neither guaranteed nor insured by the United States Government.
Forward Commitments, When-Issued and Delayed Delivery Securities — The Portfolios may purchase securities on a when-issued basis and may purchase or sell securities on a forward commitment basis. Settlement of such transactions normally occurs within a month or more after the purchase or sale commitment is made. The Portfolios may purchase securities under such conditions only with the intention of actually acquiring them, but may enter into a separate agreement to sell the securities before the settlement date. Since the value of securities purchased may fluctuate prior to settlement, the Portfolios may be required to pay more at settlement than the security is worth. In addition, the purchaser is not entitled to any of the interest earned prior to settlement. Upon making a commitment to purchase a security on a when-issued forward commitment basis, the Portfolios will hold liquid assets worth at least the equivalent of the amount due.
TBA Purchase Commitments — The Portfolios may enter into To Be Announced (“TBA”) commitments to purchase or sell securities for a fixed price at a future date. TBA commitments are considered securities in themselves, and involve a risk of loss if the value of the security to be purchased or sold declines or increases prior to settlement date, which is in addition to the risk of decline in the value of a Portfolios’ other assets. Unsettled TBA commitments are valued at the current market value of the underlying securities, according to the procedures described under “Investment Valuation”.
Financing Transactions — The Portfolios may enter into financing transactions consisting of sales by a Portfolio of securities together with a commitment to repurchase similar securities at a future date. The difference between the selling price and the future purchase price is an adjustment to interest income. If the counterparty to whom the Portfolio sells the security becomes insolvent, a Portfolio’s right to repurchase the security may be restricted. The value of the security may change over the term of the financing transaction.
| | | | | | |
| | | ANNUAL REPORT | | SEPTEMBER 30, 2007 | | 29 |
| | |
| Notes to Financial Statements (continued) | | |
Estimates — The preparation of financial statements in conformity with accounting principles generally accepted in the United States of America (“generally accepted accounting principles”) requires the use of management estimates. Actual results could differ from the estimates and such differences could be material.
Other — Expenses that are directly related to one of the Portfolios are charged directly to that Portfolio. Other operating expenses are prorated to the Portfolios on the basis of relative net assets.
(C) Agreements and Other Transactions with Affiliates and Related Parties
Pursuant to an Investment Management Agreement, BlackRock Advisors, LLC (“BlackRock”), an indirect wholly-owned subsidiary of BlackRock, Inc., serves as investment advisor to the Fund. Merrill Lynch & Co., Inc. (“Merrill Lynch”) and The PNC Financial Services Group, Inc. (“PNC”) are principal owners of BlackRock, Inc. BlackRock does not receive direct compensation for its advisory services. BlackRock benefits from the Fund being an investment option in a wrap program for which BlackRock affiliates receive fees. BlackRock is contractually obligated to pay expenses it incurs in providing advisory services to the Fund and will reimburse the Fund for all of its expenses, except extraordinary expenses and interest expense.
PFPC Inc. (“PFPC”), an indirect wholly-owned subsidiary of PNC, acts as administrator for the Fund. For these services, PFPC receives administration and accounting services fees computed daily and payable monthly, at the following annual rates: (a) for accounting services, (i) $12,000 for each Portfolio’s first $250 million in average net assets, $12,000 for each Portfolio’s next $500 million in average net assets and 0.0025% for each Portfolio’s average net assets in excess of $750 million, and (ii) $200 per Portfolio per month, plus $0.65 per cusip per day; (b) for administration services, 0.005% of each Portfolio’s average net assets; and (c) out-of-pocket expenses.
PFPC Trust Company, an indirect wholly-owned subsidiary of PNC, serves as custodian for the Fund. For these services, the custodian receives 0.01% of each Portfolio’s first $10 billion of total net assets and 0.0075% of each Portfolio’s total net assets over $10 billion, as well as out-of-pocket expenses and certain transaction charges.
Pursuant to the Transfer Agent Agreement, PFPC serves as the transfer and dividend disbursing agent for the Fund. For its services, PFPC receives an annual fee of $15,000 per Portfolio, plus transaction fees, per account fees and disbursements.
As mentioned above, BlackRock will reimburse the Fund for all such administration, custodian and transfer agent services.
Pursuant to written agreements, certain affiliates provide certain Portfolios sub-accounting, recordkeeping, sub-transfer agency and other administrative services with respect to sub-accounts they service. For these services, affiliates receive an annual fee per shareholder account which will vary depending on share class. For the year ended September 30, 2007, the Portfolios paid the following fees in return for these services:
| | | |
Series S | | $ | 841 |
Series C | | | 73,309 |
Series M | | | 72,577 |
During the period ended September 30, 2007, Merrill Lynch, through their affiliated broker dealer, Merrill Lynch, Pierce, Fenner & Smith, Inc. (“MLPF&S”), earned commissions on transactions of securities for Series S in the amount of $88.
For the period ended September 30, 2007, long-term investments in companies considered to be an affiliate of the Portfolios were as follows:
Series M
Affiliated Investments - Merrill Lynch-Countrywide Commercial Mortgage Trust, Series 06-3, Class A4
| | | |
Beginning Par/Notional Amount | | $ | — |
Purchases | | | 5,475,000 |
Sales | | | — |
Ending Par/Notional Amount | | | 5,475,000 |
Net Realized Gain (Loss) | | | — |
Interest/Amortization Income | | | 110,078 |
Market Value of affiliates at September 30, 2007 | | | 5,423,783 |
(D) Purchases and Sales of Securities
For the period ended September 30, 2007, purchases and sales of securities, including paydowns, but excluding short-term and U.S. Government securities, were as follows:
| | | | | | |
| | | Purchases | | Sales |
Series S | | $ | 19,846,643 | | $ | 15,331,665 |
Series C | | | 657,159,573 | | | 137,754,155 |
Series M | | | 323,624,685 | | | 8,910,709 |
For the period ended September 30, 2007, purchases and sales of U.S. Government securities were as follows:
| | | | | | |
| | | Purchases | | Sales |
Series S | | $ | 1,939,376 | | $ | 2,043,741 |
Series C | | | 16,246,156 | | | 16,017,758 |
(E) Capital Shares
Transactions in capital shares for each year were as follows:
| | | | | | | | | | | | | | | | | | |
| | | Series S | | | Series C | | | Series M | |
| | | For the Year Ended September 30, | |
| | | 2007 | | | 2006 | | | 2007 | | | 2006 | | | 2007 | | | 2006 | |
| | | Shares | | | Shares | | | Shares | |
Shares sold | | 3,027,765 | | | 2,749,816 | | | 52,745,171 | | | 418,785 | | | 53,202,695 | | | 417,040 | |
Shares issued in reinvestment of dividends | | 191 | | | 86 | | | 1,899 | | | 71 | | | 1,954 | | | 73 | |
Shares redeemed | | (1,625,935 | ) | | (705,655 | ) | | (5,509,394 | ) | | (53,636 | ) | | (4,475,410 | ) | | (49,064 | ) |
| | | | | | | | | | | | | | | | | | |
Net increase | | 1,402,021 | | | 2,044,247 | | | 47,237,676 | | | 365,220 | | | 48,729,239 | | | 368,049 | |
| | | | | | | | | | | | | | | | | | |
| | | | | | |
30 | | ANNUAL REPORT | | SEPTEMBER 30, 2007 | | |
| | |
| Notes to Financial Statements (concluded) | | |
(F) Federal Tax Information
No provision is made for U.S. federal taxes as it is the Portfolios’ intention to continue to qualify for and elect the tax treatment applicable to regulated investment companies under Subchapter M of the Internal Revenue Code of 1986, as amended, and to make the requisite distributions to its shareholders which will be sufficient to relieve it from federal income and excise taxes.
Dividends from net investment income and distributions from net capital gains are determined in accordance with U.S. federal income tax regulations, which may differ from those amounts determined under accounting principles generally accepted in the United States. These book/tax differences are either temporary or permanent in nature. To the extent these differences are permanent, they are charged or credited to paid-in-capital, undistributed net investment income or accumulated net realized gain, as appropriate, in the period that the differences arise. The following permanent differences as of September 30, 2007, attributable to paydown adjustments, and other differences between financial and tax accounting, were reclassified to the following accounts:
| | | | | | | | |
| | | Increase (Decrease) Accumulated Net Realized Gain/(Loss) | | | Increase (Decrease) Undistributed Net Investment Income | |
Series S | | $ | 12,657 | | | $ | (12,657 | ) |
Series M | | | (23,247 | ) | | | 23,247 | |
The tax character of distributions paid during the years ended September 30, 2007 and September 30, 2006 was as follows:
| | | |
| | | Ordinary Income |
Series S | | | |
9/30/07 | | $ | 1,836,834 |
9/30/06 | | | 723,434 |
Series C | | | |
9/30/07 | | | 9,375,175 |
9/30/06 | | | 522,374 |
Series M | | | |
9/30/07 | | | 9,116,008 |
9/30/06 | | | 295,388 |
As of September 30, 2007, the tax components of distributable earnings/accumulated losses were as follows:
| | | | | | | | | | | |
| | | Undistributed Ordinary Income | | Capital Loss Carryforward | | | Unrealized Gains/Losses- Net * | |
Series S | | $ | 83 | | $ | (61,362 | ) | | $ | (207,912 | ) |
Series C | | | 583 | | | (133,671 | ) | | | (2,199,457 | ) |
Series M | | | — | | | (432 | ) | | | 24,723 | |
| * | The difference between book-basis and tax-basis net unrealized gain/losses is attributable primarily to the deferral of losses on wash sales, the deferral of post-October capital losses and the realization for tax purposes of unrealized gains/losses on certain futures contracts. |
As of September 30, 2007, the Portfolios had capital loss carryforwards available to offset future realized capital gains through the indicated expiration dates:
| | | | | | | | | | | | |
| | | Expiring September 30 |
| | | 2013 | | 2014 | | 2015 | | Total |
Series S | | $ | 167 | | $ | 37,311 | | $ | 23,884 | | $ | 61,362 |
Series C | | | — | | | 15,174 | | | 118,497 | | | 133,671 |
Series M | | | — | | | — | | | 432 | | | 432 |
In July 2006, the Financial Accounting Standards Board (“FASB”) released FASB Interpretation No. 48 (“FIN 48”) “Accounting for Uncertainty in Income Taxes”. FIN 48 provides guidance for how uncertain tax positions should be recognized, measured, presented and disclosed in the financial statements. FIN 48 requires the evaluation of tax positions taken in the course of preparing a Portfolios’ tax returns to determine whether the tax positions are “more-likely-than-not” of being sustained by the applicable tax authority. Tax benefits of positions not deemed to meet the more-likely-than-not threshold would be booked as a tax expense in the current year and recognized as: a liability for unrecognized tax benefits; a reduction of an income tax refund receivable; a reduction of deferred tax asset; an increase in deferred tax liability; or a combination thereof. Adoption of FIN 48 is required for the last net asset value calculation in the first required financial statement reporting period for fiscal years beginning after December 15, 2006. The impact on each of a Portfolio’s financial statements, if any, is currently being assessed.
| | | | | | |
| | | ANNUAL REPORT | | SEPTEMBER 30, 2007 | | 31 |
Report of Independent Registered Public Accounting Firm
To the Board of Trustees and Shareholders of BlackRock Bond Allocation Target Shares:
We have audited the accompanying statements of assets and liabilities, including the schedules of investments, of the Series S, Series C, and Series M Portfolios, three of the five portfolios constituting the BlackRock Bond Allocation Target Shares (the “Fund”), (collectively the “Portfolios”), as of September 30, 2007, and the related statements of operations for the year then ended, the statements of changes in net assets for each of the two years in the period then ended, and the financial highlights for each of the three years in the period then ended. These financial statements and financial highlights are the responsibility of the Fund’s management. Our responsibility is to express an opinion on these financial statements and financial highlights based on our audits.
We conducted our audits in accordance with the standards of the Public Company Accounting Oversight Board (United States). Those standards require that we plan and perform the audit to obtain reasonable assurance about whether the financial statements and financial highlights are free of material misstatement. The Fund is not required to have, nor were we engaged to perform, an audit of its internal control over financial reporting. Our audits included consideration of internal control over financial reporting as a basis for designing audit procedures that are appropriate in the circumstances, but not for the purpose of expressing an opinion on the effectiveness of the Fund’s internal control over financial reporting. Accordingly, we express no such opinion. An audit also includes examining, on a test basis, evidence supporting the amounts and disclosures in the financial statements, assessing the accounting principles used and significant estimates made by management, as well as evaluating the overall financial statement presentation. Our procedures included confirmation of securities owned as of September 30, 2007, by correspondence with the custodian and brokers; where replies were not received from brokers, we performed other auditing procedures. We believe that our audits provide a reasonable basis for our opinion.
In our opinion, the financial statements and financial highlights referred to above present fairly, in all material respects, the financial position of each of the Portfolios constituting the Fund as of September 30, 2007, the results of their operations for the year then ended, the changes in their net assets for each of the two years in the period then ended, and the financial highlights for each of the three years in the period then ended, in conformity with accounting principles generally accepted in the United States of America.
Deloitte & Touche LLP
Philadelphia, Pennsylvania
November 28, 2007
| | | | | | |
32 | | ANNUAL REPORT | | SEPTEMBER 30, 2007 | | |
Fund Management (Unaudited)
Information pertaining to the Trustees and officers of the Fund as of September 30, 2007 is set forth below. The statement of additional information (SAI) includes additional information about the Trustees and is available without charge, upon request, by calling (800) 441-7762.
| | | | | | | | | | |
Name, Address, and Year of Birth | | Position(s)
Held with
Fund | | Term of
Office(1)
and Length
of Time
Served | | Principal Occupation(s)
During Past Five Years | | Number of
Portfolios in Fund Complex(2)
Currently Overseen by Trustee | | Other Directorships Held by Trustee |
Interested Trustees |
| | | | | |
Richard S. Davis(3) BlackRock, Inc. 40 E. 52nd Street New York, NY 10022 1945 | | Trustee | | Since 2005 | | Managing Director, BlackRock, Inc. (since 2005); Chief Executive Officer, State Street Research & Management Company (2000-2005); Chairman of the Board of Trustees, State Street Research mutual funds (“SSR Funds”) (2000-2005); Senior Vice President, Metropolitan Life Insurance Company (1999-2000); Chairman, SSR Realty (2000-2004). | | 61 (includes 26 BlackRock Funds Portfolios, 30 BlackRock Funds II Portfolios and 5 Portfolios of BlackRock Bond Allocation Target Shares) | | None |
| | | | | |
Laurence D. Fink(4) BlackRock, Inc. 40 E. 52nd Street New York, NY 10022 1952 | | Trustee | | Since 2000 | | Chairman and Chief Executive Officer of BlackRock, Inc. since its formation in 1998 and of BlackRock, Inc.’s predecessor entities since 1988; Chairman of the Executive and Management Committees; formerly, Managing Director of the First Boston Corporation, Member of its Management Committee, Co-head of its Taxable Fixed Income Division and Head of its Mortgage and Real Estate Products Group; Chairman of the Board of several of BlackRock’s alternative investment vehicles; Director of several of BlackRock’s offshore funds; Member of the Board of Trustees of New York University, Chair of the Financial Affairs Committee and a member of the Executive Committee, the Ad Hoc Committee on Board Governance, and the Committee on Trustees; Co-Chairman of the NYU Hospitals Center Board of Trustees, Chairman of the Development/Trustee Stewardship Committee and Chairman of the Finance Committee; Trustee of The Boys’ Club of New York. | | 61 (includes 26 BlackRock Funds Portfolios, 30 BlackRock Funds II Portfolios and 5 Portfolios of BlackRock Bond Allocation Target Shares) | | Director, BlackRock, Inc. |
| | | | | | |
| | | ANNUAL REPORT | | SEPTEMBER 30, 2007 | | 33 |
| | |
| Fund Management (Unaudited) (continued) | | |
| | | | | | | | | | |
Name, Address,
and Year of Birth | | Position(s)
Held with
Fund | | Term of
Office(1)
and Length
of Time
Served | | Principal Occupation(s)
During Past Five Years | | Number of
Portfolios
in Fund
Complex(2)
Currently
Overseen
by Trustee | | Other
Directorships
Held by
Trustee |
Disinterested Trustees |
| | | | | |
Bruce R. Bond c/o BlackRock Funds 100 Bellevue Parkway
Wilmington, DE 19809 1946 | | Trustee | | Since 2005 | | Retired; Trustee and member of the Governance Committee, SSR Funds (1997-2005). | | 61 (includes 26 BlackRock Funds Portfolios, 30 BlackRock Funds II Portfolios and 5 Portfolios of BlackRock Bond Allocation Target Shares) | | Director, Avaya, Inc. (information technology). |
| | | | | |
Honorable Stuart E. Eizenstat c/o BlackRock Funds 100 Bellevue Parkway
Wilmington, DE 19809 1943 | | Trustee and Chairman of the Compliance Committee | | Since 2001 | | Partner and Head of International Practice, Covington & Burling (law firm) (2001-Present); Deputy Secretary of the Treasury (1999-2001); Under Secretary of State for Economic, Business and Agricultural Affairs (1997-1999); Under Secretary of Commerce for International Trade (1996-1997); U.S. Ambassador to the European Union (1993-1996). | | 61 (includes 26 BlackRock Funds Portfolios, 30 BlackRock Funds II Portfolios and 5 Portfolios of BlackRock Bond Allocation Target Shares) | | Director, UPS Corporation; Advisory Board member, The Coca-Cola Company; Advisory Board member, Group Menatep; Advisory Board member, BT Americas. |
| | | | | |
| | | | | | | | | | |
| | | | | |
Robert M. Hernandez c/o BlackRock Funds 100 Bellevue Parkway
Wilmington, DE 19809 1944 | | Trustee, Vice Chairman of the Board and Chairman of the Audit Committee | | Since 1996 | | Retired; Director (1991-2001), Vice Chairman and Chief Financial Officer (1994-2001), Executive Vice President- Accounting and Finance and Chief Financial Officer (1991-1994), USX Corporation (a diversified company principally engaged in energy and steel businesses). | | 61 (includes 26 BlackRock Funds Portfolios, 30 BlackRock Funds II Portfolios and 5 Portfolios of BlackRock Bond Allocation Target Shares) | | Lead Director, ACE Limited (insurance company); Director and Chairman of the Board, RTI International Metals, Inc.: Director, Eastman Chemical Company. |
| | | | | |
Dr. Matina Horner c/o BlackRock Funds 100 Bellevue Parkway
Wilmington, DE 19809 1939 | | Trustee and Chairperson of the Governance and Nominating Committee | | Since 2004 | | Retired; Executive Vice President of Teachers Insurance and Annuity Association and College Retirement Equities Fund (TIAA-CREF) (1989-2003). | | 61 (includes 26 BlackRock Funds Portfolios, 30 BlackRock Funds II Portfolios and 5 Portfolios of BlackRock Bond Allocation Target Shares) | | Member and Former Chair of the Board of the Massachusetts General Hospital Institute of Health Professions; Member and Former Chair of the Board of the Greenwall Foundation; Trustee, Century Foundation (formerly The Twentieth Century Fund); Director and Chair of the Audit Committee, N STAR (formerly called Boston Edison); Director, The Neiman Marcus Group; Honorary Trustee, Massachusetts General Hospital Corporation. |
| | | | | | |
34 | | ANNUAL REPORT | | SEPTEMBER 30, 2007 | | |
| | |
| Fund Management (Unaudited) (continued) | | |
| | | | | | | | | | |
Name, Address, and Year of Birth | | Position(s)
Held with
Fund | | Term of
Office(1)
and Length
of Time
Served | | Principal Occupation(s)
During Past Five Years | | Number of Portfolios in Fund Complex(2) Currently Overseen by Trustee | | Other Directorships Held by Trustee |
Disinterested Trustees (concluded) |
| | | | | |
Toby Rosenblatt c/o BlackRock Funds
100 Bellevue Parkway
Wilmington, DE 19809 1938 | | Trustee | | Since 2005 | | President (since 1999) and Vice President - General Partner (since 1990), Founders Investments Ltd.; Director, Forward Management, LLC since 2007; Director, ReFlow Management, LLC since 2007; Trustee, SSR Funds (1990-2005); Trustee, Metropolitan Series Funds, Inc. (2001-2005). | | 61 (includes 26 BlackRock Funds Portfolios, 30 BlackRock Funds II Portfolios and 5 Portfolios of BlackRock Bond Allocation Target Shares) | | Director, A.P. Pharma, Inc.; Trustee, The James Irvine Foundation (since 1997). |
| | | | | |
| | | | | |
| | | | | |
David R. Wilmerding, Jr. c/o BlackRock Funds
100 Bellevue Parkway
Wilmington, DE 19809 1935 | | Trustee and Chairperson of the Board | | Since 1996 | | Retired; Chairman, Wilmerding & Associates, Inc. (investment advisers) (until 2006); Chairman, Coho Partners, Ltd. (investment advisers) (2003-2006). | | 62 (includes 26 BlackRock Funds Portfolios, 30 BlackRock Funds II Portfolios, 5 Portfolios of BlackRock Bond Allocation Target Shares and 1 Portfolio of Chestnut Street Exchange Fund, which is managed by BlackRock Financial Management Inc. and BlackRock Institutional Management Corporation.) | | Director, Beaver Management Corporation (land management corporation); Managing General Partner, Chestnut Street Exchange Fund, Chairman since 2006; Director, Peoples First, Inc. (bank Holding Company) (2001-2004). |
| | | | | |
| | | | | |
| | | | | | |
| | | ANNUAL REPORT | | SEPTEMBER 30, 2007 | | 35 |
| | |
| Fund Management (Unaudited) (concluded) | | |
| | | | | | |
Name, Address,
and Year of Birth | | Position(s)
Held with
Fund | | Term of
Office(5)
and Length
of Time
Served | | Principal Occupation(s)
During Past Five Years |
Officers Who Are Not Trustees |
| | | |
Anne Ackerley BlackRock, Inc. 40 E. 52nd Street New York, NY 10022 1962 | | Vice President | | Since 2003 (previously served as Assistant Secretary since 2000) | | Managing Director, BlackRock, Inc. (since May 2000); First Vice President and Operating Officer, Mergers and Acquisitions Group (1997-2000), First Vice President and Operating Officer, Public Finance Group (1995-1997), and First Vice President, Emerging Markets Fixed Income Research (1994-1995), Merrill Lynch & Co. |
| | | |
Neal J. Andrews BlackRock, Inc. 40 E. 52nd Street New York, NY 10022 1966 | | Chief Financial Officer | | Since 2007 (previously served as Assistant Treasurer since 2006) | | Managing Director of BlackRock Inc. (since August 2006); Senior Vice President and Line of Business Head, Fund Accounting and Administration, PFPC Inc. (1992-2006). |
| | | |
Bart Battista BlackRock, Inc. 40 E. 52nd Street New York, NY 10022 1959 | | Chief Compliance Officer and Anti-Money Laundering Compliance Officer | | Since 2004 | | Chief Compliance Officer and Anti-Money Laundering Compliance Officer of BlackRock, Inc. (since 2004); Managing Director (since 2003), and Director (1998-2002) of BlackRock, Inc.; Compliance Officer at Moore Capital Management (1995-1998). |
| | | |
Donald C. Burke BlackRock, Inc. 40 E. 52nd Street New York, NY 10022 1960 | | President | | Since 2007 (previously served as Treasurer since 2006) | | Managing Director of BlackRock Inc. (since 2006); Managing Director of Merrill Lynch Investment Managers (“MLIM”) and Fund Asset Management (“FAM”) from (2006), First Vice President thereof (1997-2005) and Treasurer thereof (since 1999), Vice President of MLIM and FAM (1990-1997). |
| | | |
Jay Fife BlackRock, Inc. 40 E. 52nd Street New York, NY 10022 1970 | | Treasurer | | Since 2007 (previously served as Assistant Treasurer since 2006) | | Managing Director of BlackRock, Inc. since 2007; Director of BlackRock, Inc. from 2006 to 2007; Assistant Treasurer of the MLIM/FAM advised funds from 2005 to 2006; Director of MLIM Fund Services Group from 2001 to 2006. |
| | | |
Brian P. Kindelan BlackRock, Inc. 40 E. 52nd Street New York, NY 10022 1959 | | Secretary | | Since 1997 | | Managing Director and Senior Counsel (since January 2005), Director and Senior Counsel (2001-2004) and Vice President and Senior Counsel (1998-2000), BlackRock Advisors, LLC; Senior Counsel, PNC Bank Corp. (May 1995-April 1998). |
(1) | Each Trustee holds office for an indefinite term until the earlier of (1) the next meeting of shareholders at which Trustees are elected and until his or her successor is elected and qualified and (2) such time as such Trustee resigns or his or her term as a Trustee is terminated in accordance with the Fund’s Declaration of Trust. |
(2) | A Fund Complex means two or more registered investment companies that hold themselves out to investors as related companies for purposes of investment and investor services, that have a common investment advisor or that have an investment advisor that is an affiliated person of the investment advisor of any of the other registered investment companies. |
(3) | Mr. Davis is an interested person of the Fund due to his position at BlackRock, Inc. |
(4) | Mr. Fink is an interested person of the Fund due to his position at BlackRock, Inc. |
(5) | Each officer holds office for an indefinite term until the earlier of (1) the next meeting of trustees at which his or her successor is appointed and (2) such time as such officer resigns or his or her term as an officer is terminated in accordance with the Fund’s Declaration of Trust. |
| | | | | | |
36 | | ANNUAL REPORT | | SEPTEMBER 30, 2007 | | |
Additional Information (Unaudited)
(A) Special Meeting of Shareholders. The shareholders of each Portfolio voted on the following proposal, which was approved at a special shareholders meeting on September 7, 2007 for shareholders of record as of June 25, 2007. This proposal was part of the reorganization of the Fund’s Board of Trustees to take effect on or about November 1, 2007. A description of the proposal and number of shares voted were as follows:
| | | | |
To elect the Fund’s Board of Trustees | | Bond Allocation Target Shares |
| | | Votes For | | Votes
Withheld |
James H. Bodurtha | | 94,890,640 | | 2,700 |
Bruce R. Bond | | 94,890,640 | | 2,700 |
Donald W. Burton | | 94,890,640 | | 2,700 |
Richard S. Davis | | 94,890,640 | | 2,700 |
Stuart E. Eizenstat | | 94,890,640 | | 2,700 |
Laurence D. Fink | | 94,890,640 | | 2,700 |
Kenneth A. Froot | | 94,890,640 | | 2,700 |
Henry Gabbay | | 94,890,640 | | 2,700 |
Robert M. Hernandez | | 94,890,640 | | 2,700 |
John F. O’Brien | | 94,890,640 | | 2,700 |
Roberta Cooper Ramo | | 94,890,640 | | 2,700 |
Jean Margo Reid | | 94,890,640 | | 2,700 |
David H. Walsh | | 94,890,640 | | 2,700 |
Fred G. Weiss | | 94,890,640 | | 2,700 |
Richard R. West | | 94,890,640 | | 2,700 |
(B) Important Tax Information. The following information is provided with respect to the ordinary income distributions paid for the fiscal year ended September 30, 2007:
| | | | | | | | | |
| Interest Related Dividends for Non-U.S. Residents | |
Month Paid: | | BATS Series S | | | BATS Series C | | | BATS Series M | |
October 2006 - December 2006 | | 98.72 | % | | 97.66 | % | | 98.46 | % |
January 2007 - September 2007 | | 95.52 | % | | 99.21 | % | | 98.08 | % |
| | | | | | |
| | | ANNUAL REPORT | | SEPTEMBER 30, 2007 | | 37 |
[THIS PAGE INTENTIONALLY LEFT BLANK.]
| | |
| BlackRock Funds Information | | |
BlackRock Privacy Principles
BlackRock is committed to maintaining the privacy of its current and former fund investors and individual clients (collectively, “Clients”) and to safeguarding their non-public personal information. The following information is provided to help you understand what personal information BlackRock collects, how we protect that information and why in certain cases we share such information with select parties.
If you are located in a jurisdiction where specific laws, rules or regulations require BlackRock to provide you with additional or different privacy-related rights beyond what is set forth below, then BlackRock will comply with those specific laws, rules or regulations.
BlackRock obtains or verifies personal non-public information from and about you from different sources, including the following: (i) information we receive from you or, if applicable, your financial intermediary, on applications, forms or other documents; (ii) information about your transactions with us, our affiliates, or others; (iii) information we receive from a consumer reporting agency; and (iv) from visits to our Web sites.
BlackRock does not sell or disclose to non-affiliated third parties any non-public personal information about its Clients, except as permitted by law or as is necessary to respond to regulatory requests or to service Client accounts. These non-affiliated third parties are required to protect the confidentiality and security of this information and to use it only for its intended purpose.
We may share information with our affiliates to service your account or to provide you with information about other BlackRock products or services that may be of interest to you. In addition, BlackRock restricts access to non-public personal information about its Clients to those BlackRock employees with a legitimate business need for the information. BlackRock maintains physical, electronic and procedural safeguards that are designed to protect the non-public personal information of its Clients, including procedures relating to the proper storage and disposal of such information.
Availability of Additional Information
Important Notice Regarding Delivery of Shareholder Documents
The Fund will mail only one copy of shareholder documents, including prospectuses, annual and semi-annual reports and proxy statements, to shareholders with multiple accounts at the same address. This practice is commonly called “householding” and it is intended to reduce expenses and eliminate duplicate mailings of shareholder documents. Mailings of your shareholder documents may be householded indefinitely unless you instruct us otherwise. If you do not want the mailing of these documents to be combined with those for other members of your household, please contact the Fund at (800) 441-7762.
| | | | | | |
| | | ANNUAL REPORT | | SEPTEMBER 30, 2007 | | |
| | |
| BlackRock Funds Information (concluded) | | |
Availability of Additional Information (concluded)
Availability of Proxy Voting Policies and Procedures
The Fund has delegated proxy voting responsibilities to BlackRock and its affiliates, subject to the general oversight of the Fund’s Board of Trustees. A description of the policies and procedures that BlackRock and its affiliates use to determine how to vote proxies relating to portfolio securities is available without charge, upon request on our Web site at www.blackrock.com, by calling (800) 441-7762, or on the Web site of the Securities and Exchange Commission (the “Commission”) at http://www.sec.gov.
Availability of Proxy Voting Record
Information on how proxies relating to the Fund’s voting securities were voted (if any) by BlackRock during the most recent 12-month period ended June 30th is available (if any), upon request and without charge on our Web site at www.blackrock.com/funds, by calling (800) 441-7762 or on the Web site of the Commission at http://www.sec.gov.
Availability of Quarterly Portfolio Schedule
The Fund files its complete schedule of portfolio holdings for the first and third quarters of its fiscal year with the Commission on Form N-Q. The Fund’s Form N-Q is available on the Commission’s Web site at http://www.sec.gov and may be reviewed and copied at the Commission’s Public Reference Room in Washington, D.C. Information regarding the operation of the Public Reference Room may be obtained by calling (800) SEC-0330. The Fund’s Form N-Q may also be obtained upon request, without charge, by calling (800) 441-7762.
| | | | | | |
| | | ANNUAL REPORT | | SEPTEMBER 30, 2007 | | |
Investment Advisor
BlackRock Advisors, LLC
Wilmington, Delaware 19809
Custodian
PFPC Trust Company
Philadelphia, Pennsylvania 19153
Administrator and Transfer Agent
PFPC Inc.
Wilmington, Delaware 19809
Distributor
BlackRock Distributors, Inc.
King of Prussia, Pennsylvania 19406
Counsel
Simpson Thacher & Bartlett LLP
New York, New York 10017
Independent Registered Public Accounting Firm
Deloitte & Touche LLP
Philadelphia, Pennsylvania 19103
| | | | | | |
| | | ANNUAL REPORT | | SEPTEMBER 30, 2007 | | |
| | |
Shares of the Fund are not deposits or obligations of, or guaranteed or endorsed by PNC Bank, National Association or any other bank and shares are not federally insured by, guaranteed by, obligations of or otherwise supported by the U.S. Government, the Federal Deposit Insurance Corporation, the Federal Reserve Board, or any other governmental agency. Investments in shares of the fund involve investment risks, including the possible loss of the principal amount invested. | | |
| |
| BATS-9/07-AR | |  |
Item 2 – Code of Ethics – The registrant (or the “Fund”) has adopted a code of ethics, as of the end of the period covered by this report, applicable to the registrant’s principal executive officer, principal financial officer and principal accounting officer, or persons performing similar functions. During the period covered by this report, there have been no amendments to or waivers granted under the code of ethics. A copy of the code of ethics is available without charge at www.blackrock.com.
Item 3 – Audit Committee Financial Expert – The registrant’s board of directors or trustees, as applicable (the “board of directors”) has determined that (i) the registrant has the following audit committee financial experts serving on its audit committee and (ii) each audit committee financial expert is independent:
Robert M. Hernandez
Bruce R. Bond (not reappointed to the Audit Committee, effective November 1, 2007)
Peter S. Drotch (resigned effective January 22, 2007)
Dr. Matina Horner (term ended, effective November 1, 2007)
Toby Rosenblatt (term ended, effective November 1, 2007)
David R. Wilmerding, Jr. (term ended, effective November 1, 2007)
Fred G. Weiss (term began, effective November 1, 2007)
Richard R. West (term began, effective November 1, 2007)
Under applicable securities laws, a person determined to be an audit committee financial expert will not be deemed an “expert” for any purpose, including without limitation for the purposes of Section 11 of the Securities Act of 1933, as a result of being designated or identified as an audit committee financial expert. The designation or identification as an audit committee financial expert does not impose on such person any duties, obligations, or liabilities greater than the duties, obligations, and liabilities imposed on such person as a member of the audit committee and board of directors in the absence of such designation or identification.
Item 4 – Principal Accountant Fees and Services
| | | | | | | | | | | | | | | | | | | | | | | | |
| | | (a) Audit Fees | | (b) Audit-Related Fees1 | | (c) Tax Fees2 | | (d) All Other Fees3 |
Entity Name | | Current
Fiscal Year
End | | Previous
Fiscal Year
End | | Current
Fiscal Year
End | | Previous
Fiscal Year
End | | Current
Fiscal Year
End | | Previous
Fiscal Year
End | | Current
Fiscal Year
End | | Previous
Fiscal Year
End |
BlackRock Bond Allocation Target Shares, Series S | | $ | 27,600 | | $ | 28,980 | | $ | 4,500 | | $ | 4,500 | | $ | 6,100 | | $ | 3,625 | | $ | 1,042 | | $ | 0 |
BlackRock Bond Allocation Target Shares, Series C | | $ | 27,600 | | $ | 28,980 | | $ | 4,500 | | $ | 4,500 | | $ | 6,100 | | $ | 3,625 | | $ | 1,042 | | $ | 0 |
BlackRock Bond Allocation Target Shares, Series M | | $ | 27,600 | | $ | 28,980 | | $ | 4,500 | | $ | 4,500 | | $ | 6,100 | | $ | 3,625 | | $ | 1,042 | | $ | 0 |
| 1 | The nature of the services include assurance and related services reasonably related to the performance of the audit of financial statements not included in Audit Fees. |
| 2 | The nature of the services include tax compliance, tax advice and tax planning. |
| 3 | The nature of the services include a review of compliance procedures and attestation thereto. |
(e)(1) Audit Committee Pre-Approval Policies and Procedures:
The registrant has polices and procedures (the “Policy”) for the pre-approval by the registrant’s audit committee of Audit, Audit-Related, Tax and Other Services (as each is defined
in the Policy) provided by the Trust’s independent auditor (the “Independent Auditor”) to the registrant and other “Covered Entities” (as defined below). The term of any such pre-approval is 12 months from the date of pre-approval, unless the audit committee specifically provides for a different period. The amount of any such pre-approval is set forth in the appendices to the Policy (the “Service Pre-Approval Documents”). At its first meeting of each calendar year, the audit committee will review and re-approve the Policy and approve or re-approve the Service Pre-Approval Documents for that year, together with any changes deemed necessary or desirable by the audit committee. The audit committee may, from time to time, modify the nature of the services pre-approved, the aggregate level of fees pre-approved or both.
For the purposes of the Policy, “Covered Services” means (A) all engagements for audit and non-audit services to be provided by the Independent Auditor to the Trust and (B) all engagements for non-audit services related directly to the operations and financial reporting or the Trust to be provided by the Independent Auditor to any Covered Entity, “Covered Entities” means (1) the Advisor or (2) any entity controlling, controlled by or under common control with the Advisor that provides ongoing services to the Trust.
In the intervals between the scheduled meetings of the audit committee, the audit committee delegates pre-approval authority under this Policy to the Chairman of the audit committee (the “Chairman”). The Chairman shall report any pre-approval decisions under this Policy to the audit committee at its next scheduled meeting. At each scheduled meeting, the audit committee will review with the Independent Auditor the Covered Services pre-approved by the Chairman pursuant to delegated authority, if any, and the fees related thereto. Based on these reviews, the audit committee can modify, at its discretion, the pre-approval originally granted by the Chairman pursuant to delegated authority. This modification can be to the nature of services pre-approved, the aggregate level of fees approved, or both. Pre-approval of Covered Services by the Chairman pursuant to delegated authority is expected to be the exception rather than the rule and the audit committee may modify or withdraw this delegated authority at any time the audit committee determines that it is appropriate to do so.
Fee levels for all Covered Services to be provided by the Independent Auditor and pre-approved under this Policy will be established annually by the audit committee and set forth in the Service Pre-Approval Documents. Any increase in pre-approved fee levels will require specific pre-approval by the audit committee (or the Chairman pursuant to delegated authority).
The terms and fees of the annual Audit services engagement for the Trust are subject to the specific pre-approval of the audit committee. The audit committee (or the Chairman pursuant to delegated authority) will approve, if necessary, any changes in terms, conditions or fees resulting from changes in audit scope, Trust structure or other matters.
In addition to the annual Audit services engagement specifically approved by the audit committee, any other Audit services for the Trust not listed in the Service Pre-Approval Document for the respective period must be specifically pre-approved by the audit committee (or the Chairman pursuant to delegated authority).
Audit-Related services are assurance and related services that are not required for the audit, but are reasonably related to the performance of the audit or review of the financial statements of the registrant and, to the extent they are Covered Services, the other Covered Entities (as defined in the Joint Audit Committee Charter) or that are traditionally performed by the Independent Auditor. Audit-Related services that are Covered Services and are not listed in the Service Pre-Approval Document for the respective period must be specifically pre-approved by the audit committee (or the Chairman pursuant to delegated authority).
The audit committee believes that the Independent Auditor can provide Tax services to the Covered Entities such as tax compliance, tax planning and tax advice without impairing the auditor’s independence. However, the audit committee will not permit the retention of the Independent Auditor in connection with a transaction initially recommended by the Independent Auditor, the sole business purpose of which may be tax avoidance and the tax treatment of which may not be supported in the Internal Revenue Code and related regulations. Tax services that are Covered Services and are not listed in the Service Pre-Approval Document for the respective period must be specifically pre-approved by the audit committee (or the Chairman pursuant to delegated authority).
All Other services that are covered and are not listed in the Service Pre-Approval Document for the respective period must be specifically pre-approved by the audit committee (or the Chairman pursuant to delegated authority).
Requests or applications to provide Covered Services that require approval by the audit committee (or the Chairman pursuant to delegated authority) must be submitted to the audit committee or the Chairman, as the case may be, by both the Independent Auditor and the Chief Financial Officer of the respective Covered Entity, and must include a joint statement as to whether, in their view, (a) the request or application is consistent with the rules of the Securities and Exchange Commission (“SEC”) on auditor independence and (b) the requested service is or is not a non-audit service prohibited by the SEC. A request or application submitted to the Chairman between scheduled meetings of the audit committee should include a discussion as to why approval is being sought prior to the next regularly scheduled meeting of the audit committee.
(e)(2) None of the services described in each of Items 4(b) through (d) were approved by the audit committee pursuant to paragraph (c)(7)(i)(C) of Rule 2-01 of Regulation S-X.
(f) Not Applicable
(g) Affiliates’ Aggregate Non-Audit Fees:
Note: the following table does not include the aggregate non-audit fees of each Series, as presented above in Item 4(b) through Item 4(d).
| | | | | | |
Entity Name | | Current Fiscal Year
End | | Previous Fiscal Year
End |
BlackRock Bond Allocation Target Shares | | $ | 284,500 | | $ | 286,200 |
(h) The registrant’s audit committee has considered and determined that the provision of non-audit services that were rendered to the registrant’s investment adviser (not including any non-affiliated sub-adviser whose role is primarily portfolio management and is subcontracted with or overseen by the registrant’s investment adviser), and any entity controlling, controlled by, or under common control with the investment adviser that provides ongoing services to the registrant that were not pre-approved pursuant to paragraph (c)(7)(ii) of Rule 2-01 of Regulation S-X is compatible with maintaining the principal accountant’s independence.
Regulation S-X Rule 2-01(c)(7)(ii) – $284,500, 0%
Item 5 – Audit Committee of Listed Registrants – Not Applicable
Item 6 – Schedule of Investments – The registrant’s Schedule of Investments is included as part of the Report to Stockholders filed under Item 1 of this form.
Item 7 – Disclosure of Proxy Voting Policies and Procedures for Closed-End Management Investment Companies – Not Applicable
Item 8 – Portfolio Managers of Closed-End Management Investment Companies – Not Applicable
Item 9 – Purchases of Equity Securities by Closed-End Management Investment Company and Affiliated Purchasers – Not Applicable
Item 10 – Submission of Matters to a Vote of Security Holders – The registrant’s Nominating and Governance Committee will consider nominees to the Board recommended by shareholders when a vacancy becomes available. Shareholders who wish to recommend a nominee should send nominations which include biographical information and set forth the qualifications of the proposed nominee to the registrant’s Secretary. There have been no material changes to these procedures.
Item 11 – Controls and Procedures
11(a) – The registrant’s principal executive and principal financial officers or persons performing similar functions have concluded that the registrant’s disclosure controls and procedures (as defined in Rule 30a-3(c) under the Investment Company Act of 1940, as amended (the “1940 Act”)) are effective as of a date within 90 days of the filing of this report based on the evaluation of these controls and procedures required by Rule 30a-3(b) under the 1940 Act and Rule 15d-15(b) under the Securities and Exchange Act of 1934, as amended.
11(b) – There were no changes in the registrant’s internal control over financial reporting (as defined in Rule 30a-3(d) under the 1940 Act) that occurred during the second fiscal quarter of the period covered by this report that have materially affected, or are reasonably likely to materially affect, the registrant’s internal control over financial reporting.
Item 12 – Exhibits attached hereto
12(a)(1) – Code of Ethics – See Item 2
12(a)(2) – Certifications – Attached hereto
12(a)(3) – Not Applicable
12(b) – Certifications – Attached hereto
Pursuant to the requirements of the Securities Exchange Act of 1934 and the Investment Company Act of 1940, the registrant has duly caused this report to be signed on its behalf by the undersigned, thereunto duly authorized.
| | |
| BlackRock Bond Allocation Target Shares |
| |
| By: | | /s/ Donald C. Burke |
| | Donald C. Burke, |
| | President and Chief Executive Officer of BlackRock Bond Allocation Target Shares |
Date: November 20, 2007
Pursuant to the requirements of the Securities Exchange Act of 1934 and the Investment Company Act of 1940, this report has been signed below by the following persons on behalf of the registrant and in the capacities and on the dates indicated.
| | |
| By: | | /s/ Donald C. Burke |
| | Donald C. Burke, |
| | President and Chief Executive Officer (principal executive officer) of BlackRock Bond Allocation Target Shares |
Date: November 20, 2007
| | |
| By: | | /s/ Neal J. Andrews |
| | Neal J. Andrews, |
| | Chief Financial Officer (principal financial officer) of BlackRock Bond Allocation Target Shares |
Date: November 20, 2007