UNITED STATES
SECURITIES AND EXCHANGE COMMISSION
Washington, D.C. 20549
FORM N-CSR
CERTIFIED SHAREHOLDER REPORT OF REGISTERED
MANAGEMENT INVESTMENT COMPANIES
Investment Company Act file number 811-21457
Name of Fund: BlackRock Bond Allocation Target Shares
Series C Portfolio
Series M Portfolio
Series N Portfolio
Series S Portfolio
Fund Address: 100 Bellevue Parkway, Wilmington, DE 19809
Name and address of agent for service: Anne F. Ackerley, Chief Executive Officer, BlackRock Bond Allocation Target Shares, 55 East 52nd Street, New York, NY 10055.
Registrant’s telephone number, including area code: (800) 441-7762
Date of fiscal year end: 03/31/2010
Date of reporting period: 03/31/2010
| | | | |
| Item 1 | | – | | Report to Stockholders |
| | |
BlackRock Bond Allocation Target Shares ANNUAL REPORT | MARCH 31, 2010 | |  |
Series C Portfolio
Series M Portfolio
Series N Portfolio
Series S Portfolio
NOT FDIC INSURED
MAY LOSE VALUE
NO BANK GUARANTEE
Table of Contents
| | | | | | |
| 2 | | BLACKROCK BOND ALLOCATION TARGET SHARES | | MARCH 31, 2010 | | |
Dear Shareholder
The past year has seen a remarkable turnaround from the conditions that plagued the global economy and financial markets in 2008 through early 2009. In our opinion, the “Great Recession” likely ended at some point last summer, thanks primarily to massive fiscal and monetary stimulus. From that point, the global economy has moved into recovery mode and, we believe, is getting ready to start transitioning into an expansion.
Global equity markets bottomed in early 2009 and since that time have soared dramatically higher as investors were lured back into the markets by depressed valuations, desire for higher yields and increasing confidence that all-out financial disaster had been averted. There have been several corrections along the way and volatility levels have remained elevated — reflections of mixed economic data, lingering deflation issues (especially in Europe) and concerns over the future direction of interest rates. On balance, however, strong corporate earnings and a positive macro backdrop have helped keep the equity bull market intact. From a geographic perspective, US equities have generally outpaced their international counterparts in recent months, as the domestic economic recovery has been more pronounced.
Within fixed income markets, improving economic conditions, concerns over the US deficit and a lack of demand at recent Treasury auctions have recently conspired to push Treasury yields higher (and prices correspondingly lower). In this environment, Treasuries have dramatically underperformed other areas of the bond market, particularly the high yield sector, which has been benefiting from increased investor demand. Meanwhile, municipal bonds outperformed taxable sectors over the twelve-month period thanks to continued high demand levels, but have struggled in recent months against a weak fundamental backdrop marked by ongoing state and local budget problems. As in the taxable arena, high yield municipals have been outperforming the rest of the market.
Regarding cash investments, yields on money market securities remain near all-time lows (producing returns only marginally above zero percent), with the Federal Open Market Committee reiterating that economic circumstances are likely to necessitate an accommodative interest rate stance for an “extended period.”
Against this backdrop, the major market averages posted the following returns:
| | | | | | |
Total Returns as of March 31, 2010 | | 6-month | | | 12-month | |
US equities (S&P 500 Index) | | 11.75 | % | | 49.77 | % |
Small cap US equities (Russell 2000 Index) | | 13.07 | | | 62.76 | |
International equities (MSCI Europe, Australasia, Far East Index) | | 3.06 | | | 54.44 | |
3-month Treasury bill (BofA Merrill Lynch 3-Month Treasury Bill Index) | | 0.05 | | | 0.17 | |
US Treasury securities (BofA Merrill Lynch 10-Year US Treasury Index) | | (2.62 | ) | | (6.30 | ) |
Taxable fixed income (Barclays Capital US Aggregate Bond Index) | | 1.99 | | | 7.69 | |
Tax-exempt fixed income (Barclays Capital Municipal Bond Index) | | 0.28 | | | 9.69 | |
High yield bonds (Barclays Capital US Corporate High Yield 2% Issuer Capped Index) | | 10.97 | | | 55.64 | |
Past performance is no guarantee of future results. Index performance shown for illustrative purposes only. You cannot invest directly in an index.
Global financial markets continue to show signs of improvement, but questions about the strength and sustainability of the recovery abound. Through periods of uncertainty, as ever, BlackRock’s full resources are dedicated to the management of our clients’ assets. For additional market perspective and investment insight, visit www.blackrock.com/shareholdermagazine, where you’ll find the most recent issue of our award-winning Shareholder® magazine, as well as its quarterly companion newsletter, Shareholder Perspectives. As always, we thank you for entrusting BlackRock with your investments, and we look forward to your continued partnership in the months and years ahead.
|
| Sincerely, |
|
 |
| Rob Kapito |
| President, BlackRock Advisors, LLC |
THIS PAGE NOT PART OF YOUR FUND REPORT
| | |
| Fund Summary as of March 31, 2010 | | Series C Portfolio |
| |
Portfolio Management Commentary | | |
How did the Fund perform?
| | • | | The Fund’s total return underperformed that of its benchmark for the 12-month period. (The Fund compares its performance against the Barclays Capital US Credit Index. However, because shares of the Fund can be purchased or held only by or on behalf of certain separately managed account clients, comparisons of the Fund’s performance to that of the benchmark will differ from comparisons of the benchmark against the performance of the separately managed accounts.) |
What factors influenced performance?
| | • | | The Fund benefited from its allocation to investment-grade corporate credit during the period. In particular, the Fund’s exposure to the financials and industrials sectors of the market contributed to performance. |
| | • | | Overall duration management and yield curve positioning — both of which were traded tactically throughout the period — detracted from Fund performance. |
Describe recent portfolio activity.
| | • | | During the latter half of 2009 and through the end of the reporting period, we looked to increase the Fund’s allocation to investment-grade corporate credit. In doing so, we focused on high-quality industrials and utilities names as the credit markets continued to rally, with earnings and economic data surprising to the upside. |
Describe Fund positioning at period end.
| | • | | At period end, the Fund was almost fully invested in corporate bonds, with approximately 97% of assets invested in investment-grade credit, 1% in high yield securities and 2% in non-US government-guaranteed debt. We also held small out-of-index allocations in US Treasuries, agency debt and FDIC-guaranteed debt. We continue to focus on higher-quality names, favoring non-cyclical industries and companies with strong balance sheets. From a sector perspective, the Fund’s largest overweight relative to the benchmark is in industrials. We also hold an overweight in financials and an underweight in utilities. The Fund ended the period with a slightly short duration relative to the benchmark and a yield-curve-flattening bias. |
The views expressed reflect the opinions of BlackRock as of the date of this report and are subject to change based on changes in market, economic or other conditions. These views are not intended to be a forecast of future events and are no guarantee of future results.
Portfolio Information
| | | |
Portfolio Composition | | Percent of
Long-Term
Investments | |
Corporate Bonds | | 90 | % |
Preferred Securities | | 3 | |
Foreign Agency Obligations | | 3 | |
Taxable Municipal Bonds | | 2 | |
Foreign Government Obligations | | 2 | |
| | | |
Credit Quality Allocation1 | | Percent of
Long-Term
Investments | |
AAA/Aaa2 | | 2 | % |
AA/Aa | | 22 | |
A | | 42 | |
BBB/Baa | | 34 | |
| 1 | Using the higher of Standard & Poor’s (“S&P’s”) or Moody’s Investors Service (“Moody’s”) ratings. |
| 2 | Includes U.S. Government Sponsored Agency Securities and U.S. Treasury Obligations which are deemed AAA/Aaa by the investment advisor. |
| | | | | | |
| 4 | | BLACKROCK BOND ALLOCATION TARGET SHARES | | MARCH 31, 2010 | | |
| | |
| Fund Summary (concluded) | | Series C Portfolio |
| |
Total Return Based on a $10,000 Investment | | |
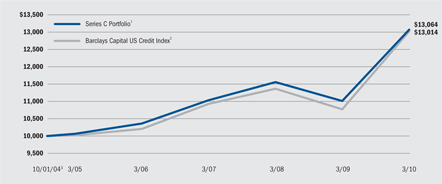
| 1 | The Fund is non-diversified and will primarily invest its assets in investment grade corporate fixed income securities. |
| 2 | An unmanaged index that includes publicly issued US corporate and specified foreign debentures and secured notes that meet the specified maturity, liquidity, and quality requirements. |
| 3 | Commencement of operations. |
Performance Summary for the Period Ended March 31, 2010
| | | | | | | | | | | | |
| | | | | | Average Annual Total Returns4 | |
| | | 6-Month
Total Returns | | | 1 Year | | | 5 Year | | | Since Inception5 | |
Series C Portfolio | | 3.55 | % | | 18.68 | % | | 5.37 | % | | 4.98 | % |
Barclays Capital US Credit Index | | 3.33 | | | 20.83 | | | 5.37 | | | 4.91 | |
| 4 | See “About Fund Performance” on page 12 for a detailed description of performance related information. |
| 5 | The Fund commenced operations on October 1, 2004. Past performance is not indicative of future results. |
Expense Example
| | | | | | | | | | | | | | | | | | |
| | | Actual | | Hypothetical7 |
| | | Beginning
Account Value
October 1, 2009 | | Ending
Account Value
March 31, 2010 | | Expenses Paid
During the Period6 | | Beginning
Account Value
October 1, 2009 | | Ending
Account Value
March 31, 2010 | | Expenses Paid
During the Period6 |
Series C Portfolio | | $ | 1,000 | | $ | 1,035.50 | | $ | 0.00 | | $ | 1,000 | | $ | 1,024.93 | | $ | 0.00 |
| 6 | For shares of the Fund, expenses are equal to the annualized expense ratio of 0.00%, multiplied by the average account value over the period, multiplied by 182/365 (to reflect the one-half year period shown). BlackRock has contractually agreed to waive all fees and pay or reimburse all direct expenses, except extraordinary expenses and interest expense, incurred by the Fund. This agreement has no fixed term. |
| 7 | Hypothetical 5% annual return before expenses is calculated by pro rating the number of days in the most recent fiscal half-year divided by 365. |
See “Disclosure of Expenses” on page 12 for further information on how expenses were calculated.
| | | | | | |
| | | BLACKROCK BOND ALLOCATION TARGET SHARES | | MARCH 31, 2010 | | 5 |
| | |
| Fund Summary as of March 31, 2010 | | Series M Portfolio |
| |
Portfolio Management Commentary | | |
How did the Fund perform?
| | • | | The Fund’s total return outperformed that of its benchmark for the 12-month period. (The Fund compares its performance against the Barclays Capital MBS Index. However, because shares of the Fund can be purchased or held only by or on behalf of certain separately managed account clients, comparisons of the Fund’s performance to that of the benchmark will differ from comparisons of the benchmark against the performance of the separately managed accounts.) |
What factors influenced performance?
| | • | | A combination of continued accommodative policy from the Federal Reserve (Fed) and improved economic fundamentals have kept market volatility low and demand for higher-yielding assets robust. The Fund’s exposure to spread assets, particularly commercial mortgage-backed securities (CMBS) and asset-backed securities (ABS), was the main driver of performance, as spread sectors outperformed during the period. |
| | • | | An underweight in agency mortgage-backed securities (MBS) detracted from Fund performance, as the sector benefited from government support through the Fed’s purchase program. The Fund’s duration management and yield curve positioning also detracted from performance over the 12 months. |
| | • | | The Fund’s cash position (18% at period end) served primarily to offset futures contracts and TBA trades and, therefore, did not have a material impact on performance during the six-month period. |
Describe recent portfolio activity.
| | • | | During the annual period, we reduced the Fund’s exposure to CMBS selling into strength as the market continued to rally. The proceeds from these sales were primarily allocated to agency MBS and ABS, which stood to benefit from continued government support. We also added exposure to agency and FDIC-guaranteed debt, which we believed was attractive versus US Treasuries. |
Describe Fund positioning at period end.
| | • | | Though the market has experienced a tremendous rally in spread assets, we continue to see value across the securitized sectors. Accordingly, at period end, the Fund holds non-index positions in CMBS and ABS. It also holds small allocations to agency and FDIC-guaranteed debt. The Fund ended the period with a long duration versus its benchmark and a yield-curve-flattening bias. |
The views expressed reflect the opinions of BlackRock as of the date of this report and are subject to change based on changes in market, economic or other conditions. These views are not intended to be a forecast of future events and are no guarantee of future results.
Portfolio Information
| | | |
Portfolio Composition | | Percent of
Long-Term
Investments | |
Non-Agency Mortgage-Backed Securities | | 42 | % |
U.S. Government Sponsored Agency Securities | | 26 | |
U.S. Treasury Obligations | | 17 | |
Asset-Backed Securities | | 15 | |
| | | |
Credit Quality Allocation1 | | Percent of
Long-Term
Investments | |
AAA/Aaa2 | | 99 | % |
AA | | 1 | |
| 1 | Using the higher of S&P’s or Moody’s ratings. |
| 2 | Includes U.S. Government Sponsored Agency Securities and U.S. Treasury Obligations which are deemed AAA/Aaa by the investment advisor. |
| | | | | | |
| 6 | | BLACKROCK BOND ALLOCATION TARGET SHARES | | MARCH 31, 2010 | | |
| | |
| Fund Summary (concluded) | | Series M Portfolio |
| |
Total Return Based on a $10,000 Investment | | |
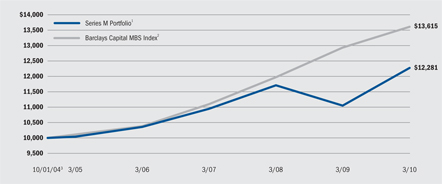
| 1 | The Fund is non-diversified and will primarily invest its assets in investment grade commercial and residential mortgage-backed securities, asset-backed securities, collateralized mortgage obligations, US Treasury and agency securities. |
| 2 | An index that includes the mortgage-backed pass-through securities of Government National Mortgage (GNMA), Federal National Mortgage Association (FNMA), and Federal Home Loan Mortgage Corporation (FHLMC) that meet the maturity and liquidity criteria. |
| 3 | Commencement of operations. |
Performance Summary for the Period Ended March 31, 2010
| | | | | | | | | | | | |
| | | | | | Average Annual Total Returns4 | |
| | | 6-Month
Total Returns | | | 1 Year | | | 5 Year | | | Since Inception5 | |
Series M Portfolio | | 2.61 | % | | 11.11 | % | | 4.11 | % | | 3.81 | % |
Barclays Capital MBS Index | | 2.12 | | | 5.21 | | | 6.13 | | | 5.77 | |
| 4 | See “About Fund Performance” on page 12 for a detailed description of performance related information. |
| 5 | The Fund commenced operations on October 1, 2004. |
Past performance is not indicative of future results.
Expense Example
| | | | | | | | | | | | | | | | | | |
| | | Actual | | Hypothetical7 |
| | | Beginning
Account Value
October 1, 2009 | | Ending
Account Value
March 31, 2010 | | Expenses Paid
During the Period6 | | Beginning
Account Value
October 1, 2009 | | Ending
Account Value
March 31, 2010 | | Expenses Paid
During the Period6 |
Series M Portfolio | | $ | 1,000 | | $ | 1,026.10 | | $ | 0.00 | | $ | 1,000 | | $ | 1,024.93 | | $ | 0.00 |
| 6 | For shares of the Fund, expenses are equal to the annualized expense ratio of 0.00%, multiplied by the average account value over the period, multiplied by 182/365 (to reflect the one-half year period shown). BlackRock has contractually agreed to waive all fees and pay or reimburse all direct expenses, except extraordinary expenses and interest expense, incurred by the Fund. This agreement has no fixed term. |
| 7 | Hypothetical 5% annual return before expenses is calculated by pro rating the number of days in the most recent fiscal half-year divided by 365. See “Disclosure of Expenses” on page 12 for further information on how expenses were calculated. |
| | | | | | |
| | | BLACKROCK BOND ALLOCATION TARGET SHARES | | MARCH 31, 2010 | | 7 |
| | |
| Fund Summary as of March 31, 2010 | | Series N Portfolio |
| |
Portfolio Management Commentary | | |
How did the Fund perform?
| | • | | For the 12-month period, the Fund’s total return outperformed both the S&P/Investortools Main Municipal Bond Index and the Barclays Capital Municipal Bond Index. (The Fund now compares its performance against the S&P/Investortools Main Municipal Bond Index. The Fund previously compared its performance against the Barclays Capital Municipal Bond Index. However, because shares of the Fund can be purchased or held only by or on behalf of certain separately managed account clients, comparisons of the Fund’s performance to that of the benchmarks will differ from comparisons of the benchmarks against the performance of the separately managed accounts.) |
What factors influenced performance?
| | • | | Fund performance benefited during the period from significant tightening in credit quality spreads. The Fund also benefited from its longer duration (sensitivity to interest rates) relative to the S&P/Investortools Main Municipal Bond Index, as long-term interest rates fell and bond prices correspondingly rose. Good trading opportunities enhanced performance as well, with opportunities involving well-received primary issues and derivatives (both long and short hedges). Finally, the Fund’s average coupon structure of more than 6% generated strong income accrual. |
| | • | | Cash reserves held by the Fund for liquidity purposes represented an opportunity loss during the reporting period, as longer-term assets generally appreciated in price while yields on cash were minimal. Some degree of cash reserve is considered prudent, however, because it allows the Fund to bid on attractive opportunities in the secondary market and participate in primary bond underwritings. |
Describe recent portfolio activity.
| | • | | Management efforts over the past year were concentrated on balancing total return performance results between improving income accrual and a competitive degree of asset appreciation. For most of the period, the Fund was fully invested to maximize accrual, yet we were attentive to trading opportunities, especially as they related to the limited primary issuance. |
| | • | | Patience with spread product positions was rewarded as credit spreads tightened. This provided the major contribution to Fund performance relative to the S&P/Investortools Main Municipal Bond Index, which tends to be more high-grade in nature. |
Describe Fund positioning at period end.
| | • | | Looking ahead, we will need to be alert to signals that the Federal Reserve’s (Fed’s) accommodative stance is nearing its end because a good portion of the longer duration stance is attributable to holdings in spread product (i.e., spread duration makes the Fund appear longer versus the S&P/Investortools Main Municipal Bond Index). If it appears likely that the Fed’s accommodation will be removed, we would need to take strategic steps to temper the Fund’s duration posture. These steps could include the sales of securities that have achieved a significant degree of outperformance, swaps into shorter-maturity bonds or cushion coupon securities, a hedge overlay or, most likely, a combination of these tactics. At period end, Fund management is comfortable with each credit held in the asset mix, and will be working closely with BlackRock’s municipal research group to monitor the underlying creditworthiness of each holding. |
The views expressed reflect the opinions of BlackRock as of the date of this report and are subject to change based on changes in market, economic or other conditions. These views are not intended to be a forecast of future events and are no guarantee of future results.
Portfolio Information
| | | |
Sector Allocation | | Percent of
Long-Term
Investments | |
County/City/Special District/School District | | 29 | % |
Utilities | | 25 | |
Health | | 20 | |
Housing | | 11 | |
Transportation | | 8 | |
Education | | 7 | |
| | | |
Credit Quality Allocation1 | | Percent of
Long-Term
Investments | |
AA/Aa | | 28 | % |
A | | 25 | |
BBB/Baa | | 28 | |
Less than BBB/Baa | | 19 | |
| 1 | Using the higher of S&P’s or Moody’s ratings. |
| | | | | | |
| 8 | | BLACKROCK BOND ALLOCATION TARGET SHARES | | MARCH 31, 2010 | | |
| | |
| Fund Summary (concluded) | | Series N Portfolio |
| |
Total Return Based on a $10,000 Investment | | |
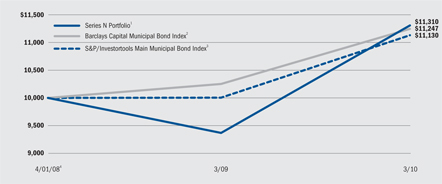
| 1 | The Fund is non-diversified and will primarily invest its assets in municipal bonds, the interest on which the management team believes is exempt from regular federal income tax. |
| 2 | An unmanaged index comprised of long-term revenue bonds, pre-refunded bonds, general obligation bonds and insured bonds. |
| 3 | The S&P/Investortools Main Municipal Bond Index is composed of bonds held by managed municipal bond fund customers of Standard & Poor’s Securities Pricing, Inc. that are priced daily. Bonds in the index must have an outstanding par value of at least $2 million and a remaining maturity of not less than 1 month. |
| 4 | Commencement of operations. |
Performance Summary for the Period Ended March 31, 2010
| | | | | | | | | |
| | | | | | Average Annual Total Returns5 | |
| | | 6 Month
Total Returns | | | 1 Year | | | Since Inception6 | |
Series N Portfolio | | 2.23 | % | | 20.74 | % | | 6.36 | % |
Barclays Capital Municipal Bond Index | | 0.28 | | | 9.69 | | | 6.06 | |
S&P/Investortools Main Municipal Bond Index | | 0.28 | | | 11.26 | | | 5.50 | |
| 5 | See “About Fund Performance” on page 12 for a detailed description of performance related information. |
| 6 | The Fund commenced operations on April 1, 2008. Past performance is not indicative of future results. |
Expense Example
| | | | | | | | | | | | | | | | | | | | | | | | | | | | | | |
| | | Actual | | Hypothetical9 |
| | | | | Including Interest
Expense
and Fees | | Excluding Interest
Expense
and Fees | | | | IncludingInterestExpense
and Fees | | Excluding Interest
Expense
and Fees |
| | | Beginning
Account
Value
October 1,
2009 | | Ending
Account
Value
March 31,
2010 | | Expenses
Paid
During
the
Period7 | | Ending
Account
Value
March 31,
2010 | | Expenses
Paid
During
the
Period8 | | Beginning
Account
Value
October 1,
2009 | | Ending
Account
Value
March 31,
2010 | | Expenses
Paid
During
the
Period7 | | Ending
Account
Value
March 31,
2010 | | Expenses
Paid
During
the
Period8 |
Series N Portfolio | | $ | 1,000 | | $ | 1,022.30 | | $ | 0.05 | | $ | 1,022.30 | | $ | 0.00 | | $ | 1,000 | | $ | 1,024.88 | | $ | 0.05 | | $ | 1,024.93 | | $ | 0.00 |
| 7 | For shares of the Fund, expenses are equal to the annualized expense ratio of 0.01%, multiplied by the average account value over the period, multiplied by 182/365 (to reflect the one-half year period shown). BlackRock has contractually agreed to waive all fees and pay or reimburse all direct expenses, except extraordinary expenses and interest expense, incurred by the Fund. This agreement has no fixed term. |
| 8 | For shares of the Fund, expenses are equal to the annualized expense ratio of 0.00%, multiplied by the average account value over the period, multiplied by 182/365 (to reflect the one-half year period shown). BlackRock has contractually agreed to waive all fees and pay or reimburse all direct expenses, except extraordinary expenses and interest expense, incurred by the Fund. This agreement has no fixed term. |
| 9 | Hypothetical 5% annual return before expenses is calculated by pro rating the number of days in the most recent fiscal half-year divided by 365. |
See “Disclosure of Expenses” on page 12 for further information on how expenses were calculated.
| | | | | | |
| | | BLACKROCK BOND ALLOCATION TARGET SHARES | | MARCH 31, 2010 | | 9 |
| | |
| Fund Summary as of March 31, 2010 | | Series S Portfolio |
| |
Portfolio Management Commentary | | |
How did the Fund perform?
| | • | | The Fund’s total return outperformed that of its benchmark for the 12-month period. (The Fund compares its performance against the BofA Merrill Lynch 1-3 Year Treasury Index. However, because shares of the Fund can be purchased or held only by or on behalf of certain separately managed account clients, comparisons of the Fund’s performance to that of the benchmark will differ from comparisons of the benchmark against the performance of the separately managed accounts.) |
What factors influenced performance?
| | • | | A combination of continued accommodative monetary policy from the Federal Reserve (Fed) and improved economic fundamentals has kept market volatility low and demand for higher-yielding assets robust. Accordingly, exposure to spread assets, particularly commercial mortgage-backed securities (CMBS), investment-grade corporates and non-agency mortgages, was the largest contributor to Fund performance as these sectors performed strongly during the period. Performance also benefited from exposure to asset-backed securities (ABS) and agency mortgages, which outperformed risk-free Treasuries. |
| | • | | In contrast, overall duration management, which was tactically traded throughout the period, detracted from performance. |
Describe recent portfolio activity.
| | • | | During the 12 months, we reduced exposure to Treasuries, agency debentures and agency mortgages, choosing to reallocate those assets into non-government spread sectors, which traded at attractive valuations early in the reporting period. In particular, we added exposure to CMBS, ABS and investment-grade corporates, sectors that were undervalued throughout most of the year. The Fund’s duration and yield curve positioning were traded tactically all through the period as well. |
Describe Fund positioning at period end.
| | • | | Though the market has experienced a tremendous rally in spread assets, we continue to see value across securitized sectors. Accordingly, the Fund holds non-index allocations in CMBS, investment-grade corporates and ABS, as well as agency and non-agency mortgages. At the period end, the Fund had a long duration versus its benchmark. |
The views expressed reflect the opinions of BlackRock as of the date of this report and are subject to change based on changes in market, economic or other conditions. These views are not intended to be a forecast of future events and are no guarantee of future results.
Portfolio Information
| | | |
Portfolio Composition | | Percent of
Long-Term
Investments | |
Corporate Bonds | | 47 | % |
Asset-Backed Securities | | 22 | |
Non-Agency Mortgage-Backed Securities | | 18 | |
Foreign Agency Obligations | | 6 | |
U.S. Government Sponsored Agency Securities | | 5 | |
Foreign Government Obligations | | 1 | |
Taxable Municipal Bonds | | 1 | |
| | | |
Credit Quality Allocation1 | | Percent of
Long-Term
Investments | |
AAA/Aaa2 | | 43 | % |
AA/Aa | | 20 | |
A | | 20 | |
BBB/Baa | | 17 | |
| 1 | Using the higher of S&P’s or Moody’s ratings. |
| 2 | Includes U.S. Government Sponsored Agency Securities and U.S. Treasury Obligations which are deemed AAA/Aaa by the investment advisor. |
| | | | | | |
| 10 | | BLACKROCK BOND ALLOCATION TARGET SHARES | | MARCH 31, 2010 | | |
| | |
| Fund Summary (concluded) | | Series S Portfolio |
| |
Total Return Based on a $10,000 Investment | | |
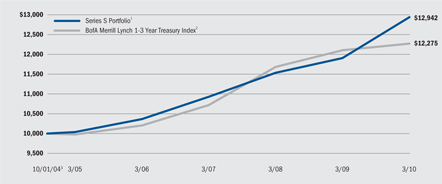
| 1 | The Fund is non-diversified and will primarily invest its assets in investment-grade fixed income securities, such as commercial and residential mortgage-backed securities, obligations of non-US governments and supra-national organizations, obligations of domestic and non-US corporations, asset-backed securities, US Treasury and agency securities, cash equivalent investments, repurchase and reverse repurchase agreements and dollar rolls. |
| 2 | An unmanaged index comprised of treasury securities with maturities from 1 to 2.99 years. |
| 3 | Commencement of operations. |
Performance Summary for the Period Ended March 31, 2010
| | | | | | | | | | | | |
| | | | | | Average Annual Total Returns4 | |
| | | 6-Month
Total Returns | | | 1 Year | | | 5 Year | | | Since Inception5 | |
Series S Portfolio | | 3.00 | % | | 8.68 | % | | 5.21 | % | | 4.81 | % |
BofA Merrill Lynch 1-3 Year Treasury Index | | 0.73 | | | 1.41 | | | 4.24 | | | 3.80 | |
| 4 | See “About Fund Performance” on page 12 for a detailed description of performance related information. |
| 5 | The Fund commenced operations on October 1, 2004. Past performance is not indicative of future results. |
Expense Example
| | | | | | | | | | | | | | | | | | | | | | | | | | | | | | |
| | | Actual | | Hypothetical8 |
| | | | | Including Interest
Expense | | Excluding Interest
Expense | | | | Including Interest
Expense | | Excluding Interest
Expense |
| | | Beginning
Account
Value
October 1,
2009 | | Ending
Account
Value
March 31,
2010 | | Expenses
Paid
During
the
Period6 | | Ending
Account
Value
March 31,
2010 | | Expenses
Paid
During
the
Period7 | | Beginning
Account
Value
October 1,
2009 | | Ending
Account
Value
March 31,
2010 | | Expenses
Paid
During
the
Period6 | | Ending
Account
Value
March 31,
2010 | | Expenses
Paid
During
the
Period7 |
Series S Portfolio | | $ | 1,000 | | $ | 1,030.00 | | $ | 0.10 | | $ | 1,030.00 | | $ | 0.00 | | $ | 1,000 | | $ | 1,024.83 | | $ | 0.10 | | $ | 1,024.93 | | $ | 0.00 |
| 6 | For shares of the Fund, expenses are equal to the annualized expense ratio of 0.02%, multiplied by the average account value over the period, multiplied by 182/365 (to reflect the one-half year period shown). BlackRock has contractually agreed to waive all fees and pay or reimburse all direct expenses, except extraordinary expenses and interest expense, incurred by the Fund. This agreement has no fixed term. |
| 7 | For shares of the Fund, expenses are equal to the annualized expense ratio of 0.00%, multiplied by the average account value over the period, multiplied by 182/365 (to reflect the one-half year period shown). BlackRock has contractually agreed to waive all fees and pay or reimburse all direct expenses, except extraordinary expenses and interest expense, incurred by the Fund. This agreement has no fixed term. |
| 8 | Hypothetical 5% annual return before expenses is calculated by pro rating the number of days in the most recent fiscal half-year divided by 365. |
See “Disclosure of Expenses” on page 12 for further information on how expenses were calculated.
| | | | | | |
| | | BLACKROCK BOND ALLOCATION TARGET SHARES | | MARCH 31, 2010 | | 11 |
About Fund Performance
Performance information reflects past performance and does not guarantee future results. Current performance may be lower or higher than the performance data quoted. Performance results do not reflect the deduction of taxes that a shareholder would pay on fund distributions or the redemption of fund shares. Figures shown in each of the performance tables on the previous pages assume reinvestment of all dividends and distributions, if any, at net asset value on the payable date. Investment return and principal value of shares will fluctuate so that shares, when redeemed, may be worth more or less than their original cost.
The performance information also reflects fee waivers and reimbursements that subsidize and reduce the total operating expenses of each Fund. The Funds’ returns would have been lower if there were no such waivers and reimbursements.
Disclosure of Expenses
Shareholders of these Funds may incur the following charges: (a) expenses related to transactions and (b) operating expenses including administration fees and other Fund expenses. The expense examples on the previous pages (which are based on a hypothetical investment of $1,000 invested on October 1, 2009 and held through March 31, 2010) are intended to assist shareholders both in calculating expenses based on an investment in each Fund and in comparing these expenses with similar costs of investing in other mutual funds.
The tables provide information about actual account values and actual expenses. In order to estimate the expenses a shareholder paid during the period covered by this report, shareholders can divide their account value by $1,000 and then multiply the result by the number corresponding to their Fund under the headings entitled “Expenses Paid During the Period.”
The tables also provide information about hypothetical account values and hypothetical expenses based on a Fund’s actual expense ratio and an assumed rate of return of 5% per year before expenses. In order to assist shareholders in comparing the ongoing expenses of investing in these Funds and other funds, compare the 5% hypothetical example with the 5% hypothetical examples that appear in other funds’ shareholder reports.
The expenses shown in the tables are intended to highlight shareholders’ ongoing costs only and do not reflect any transactional expenses, such as sales charges. Therefore, the hypothetical examples are useful in comparing ongoing expenses only, and will not help shareholders determine the relative total expenses of owning different funds. If these transactional expenses were included, shareholder expenses would have been higher.
| | | | | | |
| 12 | | BLACKROCK BOND ALLOCATION TARGET SHARES | | MARCH 31, 2010 | | |
The Benefits and Risks of Leveraging
The Funds may utilize leverage to seek to enhance their yields and net asset values (“NAVs”). However, these objectives cannot be achieved in all interest rate environments.
The Funds may utilize leverage through borrowings or through entering into reverse repurchase agreements and treasury rolls. The Series N Portfolio may also leverage its assets through the use of tender option bond (“TOB”) programs, as described in Note 1 of the Notes to Financial Statements. In general, the concept of leveraging is based on the premise that the cost of assets to be obtained through leverage will be based on short-term interest rates, which normally will be lower than the income earned by each Fund on its longer-term portfolio investments. To the extent that the total assets of each Fund (including the assets obtained through leverage) is invested in higher-yielding portfolio investments, each Fund’s shareholders will benefit from the incremental net income.
Furthermore, the value of the Funds’ investments generally varies inversely with the direction of long-term interest rates, although other factors can influence the value of portfolio investments. Changes in interest rates can influence the Funds’ NAVs positively or negatively in addition to the impact on the Funds’ performance from leverage.
The use of leverage may enhance opportunities for increased income to the Funds, but as described above, it also creates risks as short- or long-term interest rates fluctuate. Leverage also will generally cause greater changes in a Fund’s NAV and dividend rate than a comparable portfolio without leverage. If the income derived from securities purchased with assets received from leverage exceeds the cost of leverage, each Fund’s net income will be greater than if leverage had not been used. Conversely, if the income from the securities purchased is not sufficient to cover the cost of leverage, the Fund’s net income will be less than if leverage had not been used, and therefore the amount available for distribution to shareholders will be reduced. Each Fund may be required to sell portfolio securities at inopportune times or at distressed values in order to comply with regulatory requirements applicable to the use of leverage or as required by the terms of leverage instruments, which may cause a Fund to incur losses. The use of leverage may limit each Fund’s ability to invest in certain types of securities or use certain types of hedging strategies. Each Fund will incur expenses in connection with the use of leverage, all of which are borne by Fund shareholders and may reduce income.
Derivative Financial Instruments
The Funds may invest in various derivative instruments, including financial futures contracts, options and swaps, as specified in Note 2 of the Notes to Financial Statements, which constitute forms of economic leverage. Such instruments are used to obtain exposure to a market without owning or taking physical custody of securities or to hedge market, credit and/or interest rate risks. Such derivative instruments involve risks, including the imperfect correlation between the value of a derivative instrument and the underlying asset, possible default of the counterparty to the transaction or illiquidity of the derivative instrument.
A Fund’s ability to successfully use a derivative instrument depends on the investment advisor’s ability to accurately predict pertinent market movements, which cannot be assured. The use of derivative instruments may result in losses greater than if they had not been used, may require a Fund to sell or purchase portfolio securities at inopportune times or for distressed values, may limit the amount of appreciation a Fund can realize on an investment or may cause a Fund to hold a security that it might otherwise sell. The Funds’ investments in these instruments are discussed in detail in the Notes to Financial Statements.
| | | | | | |
| | | BLACKROCK BOND ALLOCATION TARGET SHARES | | MARCH 31, 2010 | | 13 |
| | |
| Schedule of Investments March 31, 2010 | | Series C Portfolio |
| | (Percentages shown are based on Net Assets) |
| | | | | | |
| | | Par
(000) | | Value |
Corporate Bonds | | | | | | |
Aerospace & Defense — 2.5% | | | | | | |
Honeywell International, Inc., | | | | | | |
5.30%, 3/15/17 | | $ | 2,755 | | $ | 2,951,908 |
Lockheed Martin Corp., | | | | | | |
6.15%, 9/01/36 | | | 1,020 | | | 1,079,312 |
Northrop Grumman Systems Corp., | | | | | | |
7.88%, 3/01/26 | | | 1,000 | | | 1,224,841 |
United Technologies Corp., | | | | | | |
6.05%, 6/01/36 | | | 3,650 | | | 3,827,361 |
| | | | | | |
| | | | | | 9,083,422 |
| | | | | | |
Air Freight & Logistics — 0.4% | | | | | | |
United Parcel Service, Inc., | | | | | | |
6.20%, 1/15/38 | | | 1,200 | | | 1,306,091 |
| | | | | | |
Automobiles — 0.6% | | | | | | |
Daimler Finance North America LLC, | | | | | | |
5.75%, 9/08/11 | | | 2,000 | | | 2,108,088 |
| | | | | | |
Beverages — 2.7% | | | | | | |
Anheuser-Busch InBev Worldwide, Inc., | | | | | | |
8.20%, 1/15/39(a) | | | 1,800 | | | 2,321,305 |
Bottling Group LLC, | | | | | | |
5.13%, 1/15/19 | | | 1,425 | | | 1,493,094 |
Diageo Finance BV, | | | | | | |
5.50%, 4/01/13 | | | 2,300 | | | 2,508,284 |
PepsiCo, Inc., | | | | | | |
7.90%, 11/01/18 | | | 1,250 | | | 1,548,191 |
SABMiller Plc, | | | | | | |
5.70%, 1/15/14(a) | | | 1,850 | | | 2,021,258 |
| | | | | | |
| | | | | | 9,892,132 |
| | | | | | |
Capital Markets — 7.8% | | | | | | |
Ameriprise Financial, Inc., | | | | | | |
5.30%, 3/15/20 | | | 325 | | | 328,783 |
The Bank of New York Mellon Corp.: | | | | | | |
4.50%, 4/01/13 | | | 1,000 | | | 1,067,868 |
5.45%, 5/15/19 | | | 1,550 | | | 1,643,842 |
The Goldman Sachs Group, Inc.: | | | | | | |
5.25%, 10/15/13 | | | 3,525 | | | 3,789,114 |
6.25%, 9/01/17 | | | 1,500 | | | 1,613,114 |
6.15%, 4/01/18 | | | 525 | | | 555,492 |
7.50%, 2/15/19 | | | 2,050 | | | 2,342,738 |
5.38%, 3/15/20 | | | 2,200 | | | 2,179,652 |
Morgan Stanley: | | | | | | |
5.63%, 1/09/12 | | | 7,400 | | | 7,837,828 |
6.25%, 8/28/17 | | | 885 | | | 928,900 |
7.30%, 5/13/19 | | | 1,625 | | | 1,795,315 |
5.63%, 9/23/19 | | | 400 | | | 398,590 |
5.50%, 1/26/20 | | | 2,125 | | | 2,078,545 |
Nomura Holdings, Inc., | | | | | | |
5.00%, 3/04/15 | | | 1,775 | | | 1,814,432 |
| | | | | | |
| | | | | | 28,374,213 |
| | | | | | |
Chemicals — 0.2% | | | | | | |
The Dow Chemical Co., | | | | | | |
8.55%, 5/15/19 | | | 450 | | | 544,383 |
| | | | | | |
Commercial Banks — 10.0% | | | | | | |
Barclays Bank Plc, | | | | | | |
2.50%, 1/23/13 | | | 1,275 | | | 1,276,521 |
HSBC Bank USA N.A., | | | | | | |
4.63%, 4/01/14 | | | 7,100 | | | 7,408,034 |
HSBC Holdings Plc, | | | | | | |
6.80%, 6/01/38 | | | 2,180 | | | 2,337,675 |
JPMorgan Chase Bank, N.A.: | | | | | | |
6.00%, 7/05/17 | | | 3,500 | | | 3,730,748 |
6.00%, 10/01/17 | | | 4,575 | | | 4,877,691 |
Lloyds TSB Bank Plc, | | | | | | |
5.80%, 1/13/20(a) | | | 1,325 | | | 1,292,787 |
The Northern Trust Corp., | | | | | | |
4.60%, 2/01/13 | | | 125 | | | 133,010 |
Rabobank Nederland NV, | | | | | | |
4.75%, 1/15/20(a) | | | 2,350 | | | 2,347,471 |
Royal Bank of Scotland Group Plc, | | | | | | |
5.00%, 11/12/13 | | | 3,000 | | | 2,933,097 |
Standard Chartered Plc, | | | | | | |
5.50%, 11/18/14(a) | | | 2,200 | | | 2,365,583 |
UBS AG, | | | | | | |
5.88%, 12/20/17 | | | 1,415 | | | 1,465,463 |
Wells Fargo & Co., | | | | | | |
4.38%, 1/31/13 | | | 5,015 | | | 5,292,550 |
Westpac Banking Corp., | | | | | | |
4.88%, 11/19/19 | | | 1,150 | | | 1,142,271 |
| | | | | | |
| | | | | | 36,602,901 |
| | | | | | |
Commercial Services & Supplies — 0.3% | | | | | | |
Tyco International Finance SA, | | | | | | |
8.50%, 1/15/19 | | | 1,000 | | | 1,240,163 |
| | | | | | |
Communications Equipment — 0.6% | | | | | | |
Cisco Systems, Inc.: | | | | | | |
5.90%, 2/15/39 | | | 700 | | | 710,678 |
5.50%, 1/15/40 | | | 675 | | | 647,305 |
Harris Corp., | | | | | | |
6.38%, 6/15/19 | | | 825 | | | 899,450 |
| | | | | | |
| | | | | | 2,257,433 |
| | | | | | |
Computers & Peripherals — 0.5% | | | | | | |
International Business Machines Corp., | | | | | | |
5.70%, 9/14/17 | | | 1,725 | | | 1,911,617 |
| | | | | | |
Consumer Finance — 0.5% | | | | | | |
SLM Corp., | | | | | | |
5.40%, 10/25/11 | | | 1,780 | | | 1,796,700 |
| | | | | | |
Diversified Financial Services — 8.6% | | | | | | |
Bank of America Corp.: | | | | | | |
5.38%, 8/15/11 | | | 2,205 | | | 2,317,656 |
6.50%, 8/01/16 | | | 7,700 | | | 8,323,662 |
Citigroup, Inc.: | | | | | | |
5.50%, 10/15/14 | | | 4,050 | | | 4,191,369 |
5.30%, 1/07/16 | | | 2,000 | | | 2,037,434 |
8.13%, 7/15/39 | | | 405 | | | 467,533 |
CME Group Index Services LLC, | | | | | | |
4.40%, 3/15/18(a) | | | 1,700 | | | 1,666,369 |
Crown Castle Towers LLC, | | | | | | |
6.11%, 1/15/20(a) | | | 1,450 | | | 1,516,758 |
General Electric Capital Corp.: | | | | | | |
2.80%, 1/08/13 | | | 2,200 | | | 2,226,569 |
5.63%, 9/15/17 | | | 1,000 | | | 1,052,929 |
6.75%, 3/15/32 | | | 1,075 | | | 1,137,329 |
6.15%, 8/07/37 | | | 3,000 | | | 2,933,718 |
HSBC Finance Corp., | | | | | | |
6.75%, 5/15/11 | | | 450 | | | 472,998 |
Iberdrola Finance Ireland Ltd., | | | | | | |
3.80%, 9/11/14(a) | | | 750 | | | 754,244 |
Icahn Enterprises LP/Icahn Enterprises Finance Corp., | | | | | | |
7.75%, 1/15/16(a) | | | 825 | | | 794,062 |
Portfolio Abbreviations
| | | | | | | | |
| To simplify the listings of portfolio holdings in the Schedules of Investments, the names and descriptions of many of the securities have been abbreviated according to the following list: | | ACA | | American Capital Access Corp. | | GO | | General Obligation Bonds |
| | AGC | | Assured Guaranty Ltd. | | IDA | | Industrial Development Authority |
| | AMBAC | | American Municipal Bond Assurance Corp. | | LIBOR | | London InterBank Offered Rate |
| | AMT | | Alternative Minimum Tax (subject to) | | M/F | | Multi-Family |
| | BHAC | | Berkshire Hathaway Assurance Corp. | | RB | | Revenue Bonds |
| | COP | | Certificates of Participation | | S/F | | Single Family |
| | | | | | USD | | US Dollar |
See Notes to Financial Statements.
| | | | | | |
| 14 | | BLACKROCK BOND ALLOCATION TARGET SHARES | | MARCH 31, 2010 | | |
| | |
| Schedule of Investments (continued) | | Series C portfolio |
| | (Percentages shown are based on Net Assets) |
| | | | | | |
| | | Par
(000) | | Value |
Corporate Bonds | | | | | | |
Diversified Financial Services (concluded) | | | | | | |
Merrill Lynch & Co., Inc., | | | | | | |
6.05%, 5/16/16 | | $ | 1,350 | | $ | 1,376,530 |
| | | | | | |
| | | | | | 31,269,160 |
| | | | | | |
Diversified Telecommunication Services — 5.3% | | | | | | |
AT&T Inc.: | | | | | | |
5.63%, 6/15/16 | | | 1,500 | | | 1,644,480 |
5.50%, 2/01/18 | | | 3,500 | | | 3,715,771 |
Qwest Corp., | | | | | | |
8.38%, 5/01/16 | | | 2,000 | | | 2,250,000 |
Telecom Italia Capital SA, | | | | | | |
5.25%, 11/15/13 | | | 3,710 | | | 3,885,947 |
Telefonica Emisiones SAU, | | | | | | |
7.05%, 6/20/36 | | | 1,075 | | | 1,211,966 |
Verizon Communications, Inc.: | | | | | | |
6.10%, 4/15/18 | | | 3,350 | | | 3,664,468 |
6.25%, 4/01/37 | | | 1,625 | | | 1,646,894 |
6.90%, 4/15/38 | | | 925 | | | 1,020,172 |
Verizon Maryland, Inc., | | | | | | |
6.13%, 3/01/12 | | | 305 | | | 327,039 |
| | | | | | |
| | | | | | 19,366,737 |
| | | | | | |
Electric Utilities — 4.9% | | | | | | |
Carolina Power & Light Co., | | | | | | |
6.30%, 4/01/38 | | | 750 | | | 807,379 |
The Cleveland Electric Illuminating Co., | | | | | | |
5.65%, 12/15/13 | | | 450 | | | 487,605 |
Duke Energy Carolinas LLC, | | | | | | |
5.25%, 1/15/18 | | | 450 | | | 473,925 |
Florida Power & Light Co., | | | | | | |
5.95%, 2/01/38 | | | 1,825 | | | 1,870,826 |
Jersey Central Power & Light Co., | | | | | | |
5.65%, 6/01/17 | | | 1,710 | | | 1,809,409 |
Kiowa Power Partners LLC, | | | | | | |
4.81%, 12/30/13(a) | | | 12 | | | 12,237 |
MidAmerican Energy Holdings Co.: | | | | | | |
5.30%, 3/15/18 | | | 2,170 | | | 2,260,804 |
5.75%, 4/01/18 | | | 1,475 | | | 1,558,724 |
Ohio Edison Co., | | | | | | |
6.40%, 7/15/16 | | | 190 | | | 208,626 |
PacifiCorp, | | | | | | |
6.00%, 1/15/39 | | | 1,300 | | | 1,336,594 |
Progress Energy, Inc., | | | | | | |
4.88%, 12/01/19 | | | 2,200 | | | 2,157,073 |
Virginia Electric & Power Co.: | | | | | | |
5.40%, 1/15/16 | | | 3,000 | | | 3,228,888 |
6.00%, 1/15/36 | | | 1,550 | | | 1,597,996 |
| | | | | | |
| | | | | | 17,810,086 |
| | | | | | |
Electronic Equipment & Instruments — 0.2% | | | | | | |
Agilent Technologies, Inc., | | | | | | |
4.45%, 9/14/12 | | | 850 | | | 890,767 |
| | | | | | |
Food & Staples Retailing — 2.3% | | | | | | |
CVS Caremark Corp., | | | | | | |
5.75%, 6/01/17 | | | 4,450 | | | 4,798,840 |
Tesco Plc, | | | | | | |
5.50%, 11/15/17(a) | | | 1,340 | | | 1,435,887 |
Wal-Mart Stores, Inc.: | | | | | | |
2.88%, 4/01/15 | | | 1,430 | | | 1,428,912 |
5.25%, 9/01/35 | | | 675 | | | 644,906 |
| | | | | | |
| | | | | | 8,308,545 |
| | | | | | |
Food Products — 2.5% | | | | | | |
General Mills, Inc., | | | | | | |
5.20%, 3/17/15 | | | 1,125 | | | 1,221,275 |
Kraft Foods, Inc.: | | | | | | |
6.50%, 8/11/17 | | | 2,075 | | | 2,324,318 |
5.38%, 2/10/20 | | | 3,700 | | | 3,760,514 |
6.50%, 11/01/31 | | | 375 | | | 386,000 |
6.88%, 2/01/38 | | | 1,375 | | | 1,487,516 |
| | | | | | |
| | | | | | 9,179,623 |
| | | | | | |
Gas Utilities — 0.3% | | | | | | |
Atmos Energy Corp., | | | | | | |
8.50%, 3/15/19 | | | 800 | | | 981,492 |
| | | | | | |
Health Care Equipment & Supplies — 1.9% | | | | | | |
CareFusion Corp., | | | | | | |
6.38%, 8/01/19 | | | 2,250 | | | 2,460,494 |
Covidien International Finance SA, | | | | | | |
6.00%, 10/15/17 | | | 2,300 | | | 2,522,283 |
Hospira, Inc., | | | | | | |
6.05%, 3/30/17 | | | 1,660 | | | 1,782,960 |
| | | | | | |
| | | | | | 6,765,737 |
| | | | | | |
Hotels, Restaurants & Leisure — 0.3% | | | | | | |
McDonald’s Corp., | | | | | | |
5.70%, 2/01/39 | | | 1,275 | | | 1,269,516 |
| | | | | | |
Industrial Conglomerates — 0.6% | | | | | | |
Holcim US Finance S.a.r.l. & Cie S.C.S., | | | | | | |
6.00%, 12/30/19(a) | | | 1,175 | | | 1,220,232 |
Hutchison Whampoa International Ltd., | | | | | | |
4.63%, 9/11/15(a) | | | 1,000 | | | 1,027,752 |
| | | | | | |
| | | | | | 2,247,984 |
| | | | | | |
Insurance — 5.5% | | | | | | |
Chubb Corp., | | | | | | |
6.00%, 5/11/37 | | | 400 | | | 410,283 |
Hartford Life Global Funding Trusts: | | | | | | |
5.20%, 2/15/11 | | | 575 | | | 595,081 |
0.35%, 1/17/12(b) | | | 1,350 | | | 1,316,517 |
Lincoln National Corp., | | | | | | |
6.15%, 4/07/36 | | | 1,500 | | | 1,430,924 |
Massachusetts Mutual Life Insurance Co., | | | | | | |
8.88%, 6/01/39(a) | | | 1,200 | | | 1,528,603 |
MetLife, Inc., | | | | | | |
5.38%, 12/15/12 | | | 4,400 | | | 4,760,492 |
Metropolitan Life Global Funding I, | | | | | | |
5.13%, 4/10/13(a) | | | 2,550 | | | 2,737,672 |
Pacific Life Insurance Co., | | | | | | |
9.25%, 6/15/39(a) | | | 1,230 | | | 1,524,129 |
Pricoa Global Funding I, | | | | | | |
5.40%, 10/18/12(a) | | | 2,125 | | | 2,291,685 |
Prudential Financial, Inc.: | | | | | | |
5.70%, 12/14/36 | | | 1,375 | | | 1,302,834 |
6.63%, 12/01/37 | | | 875 | | | 917,832 |
Teachers Insurance & Annuity Association of America, | | | | | | |
6.85%, 12/16/39(a) | | | 1,050 | | | 1,138,969 |
| | | | | | |
| | | | | | 19,955,021 |
| | | | | | |
Machinery — 1.3% | | | | | | |
Ingersoll-Rand Global Holding Co. Ltd., | | | | | | |
6.00%, 8/15/13 | | | 2,395 | | | 2,631,624 |
PACCAR, Inc., | | | | | | |
6.88%, 2/15/14 | | | 1,850 | | | 2,110,759 |
Siemens Financieringsmat, | | | | | | |
5.50%, 2/16/12(a) | | | 100 | | | 107,324 |
| | | | | | |
| | | | | | 4,849,707 |
| | | | | | |
Media — 8.9% | | | | | | |
Comcast Cable Communications Holdings, Inc., | | | | | | |
8.38%, 3/15/13 | | | 3,000 | | | 3,477,432 |
Comcast Corp.: | | | | | | |
6.50%, 11/15/35 | | | 1,375 | | | 1,408,379 |
6.55%, 7/01/39 | | | 1,725 | | | 1,785,130 |
Cox Communications, Inc.: | | | | | | |
7.13%, 10/01/12 | | | 2,250 | | | 2,514,737 |
4.63%, 6/01/13 | | | 5,000 | | | 5,286,470 |
8.38%, 3/01/39(a) | | | 1,000 | | | 1,250,700 |
News America, Inc.: | | | | | | |
7.28%, 6/30/28 | | | 1,075 | | | 1,154,379 |
6.40%, 12/15/35 | | | 2,500 | | | 2,552,880 |
6.90%, 8/15/39 | | | 900 | | | 982,488 |
TCM Sub LLC, | | | | | | |
3.55%, 1/15/15 (a) | | | 1,750 | | | 1,736,268 |
Thomson Reuters Corp., | | | | | | |
5.95%, 7/15/13 | | | 2,300 | | | 2,541,893 |
Time Warner Cable, Inc.: | | | | | | |
5.85%, 5/01/17 | | | 2,000 | | | 2,141,502 |
8.25%, 4/01/19 | | | 1,120 | | | 1,355,299 |
5.00%, 2/01/20 | | | 850 | | | 838,084 |
See Notes to Financial Statements.
| | | | | | |
| | | BLACKROCK BOND ALLOCATION TARGET SHARES | | MARCH 31, 2010 | | 15 |
| | |
| Schedule of Investments (continued) | | Series C Portfolio |
| | (Percentages shown are based on Net Assets) |
| | | | | | |
| | | Par
(000) | | Value |
Corporate Bonds | | | | | | |
Media (concluded) | | | | | | |
Time Warner, Inc.: | | | | | | |
6.88%, 5/01/12 | | $ | 1,000 | | $ | 1,099,955 |
4.88%, 3/15/20 | | | 2,300 | | | 2,247,174 |
Turner Broadcasting System, Inc., | | | | | | |
8.38%, 7/01/13 | | | 25 | | | 28,614 |
| | | | | | |
| | | | | | 32,401,384 |
| | | | | | |
Metals & Mining — 0.7% | | | | | | |
Anglo American Capital Plc, | | | | | | |
9.38%, 4/08/19(a) | | | 1,460 | | | 1,859,620 |
Newmont Mining Corp., | | | | | | |
6.25%, 10/01/39 | | | 675 | | | 674,980 |
Xstrata Canada Corp., | | | | | | |
6.00%, 10/15/15 | | | 75 | | | 80,904 |
| | | | | | |
| | | | | | 2,615,504 |
| | | | | | |
Multiline Retail — 0.1% | | | | | | |
Kohl’s Corp., | | | | | | |
6.88%, 12/15/37 | | | 460 | | | 512,635 |
| | | | | | |
Multi-Utilities — 0.5% | | | | | | |
CenterPoint Energy, Inc., | | | | | | |
6.50%, 5/01/18 | | | 850 | | | 900,040 |
Sempra Energy, | | | | | | |
6.50%, 6/01/16 | | | 975 | | | 1,089,257 |
| | | | | | |
| | | | | | 1,989,297 |
| | | | | | |
Oil, Gas & Consumable Fuels — 6.6% | | | | | | |
Anadarko Petroleum Corp., | | | | | | |
6.45%, 9/15/36 | | | 375 | | | 382,177 |
Canadian Natural Resources Ltd.: | | | | | | |
5.70%, 5/15/17 | | | 3,295 | | | 3,515,966 |
5.90%, 2/01/18 | | | 1,125 | | | 1,217,526 |
6.25%, 3/15/38 | | | 1,110 | | | 1,147,792 |
Cenovus Energy, Inc., | | | | | | |
6.75%, 11/15/39(a) | | | 3,200 | | | 3,470,608 |
CenterPoint Energy Resources Corp., | | | | | | |
7.88%, 4/01/13 | | | 325 | | | 372,144 |
ConocoPhillips: | | | | | | |
6.00%, 1/15/20 | | | 2,750 | | | 3,054,722 |
6.50%, 2/01/39 | | | 450 | | | 502,676 |
DCP Midstream LLC, | | | | | | |
5.35%, 3/15/20(a) | | | 750 | | | 751,521 |
Enterprise Products Operating LLC, | | | | | | |
5.25%, 1/31/20 | | | 1,700 | | | 1,715,449 |
Kinder Morgan Energy Partners LP, | | | | | | |
7.30%, 8/15/33 | | | 1,400 | | | 1,560,653 |
Shell International Finance BV, | | | | | | |
6.38%, 12/15/38 | | | 2,125 | | | 2,340,063 |
Valero Energy Corp., | | | | | | |
6.63%, 6/15/37 | | | 500 | | | 475,528 |
Williams Partners LP, | | | | | | |
5.25%, 3/15/20(a) | | | 1,850 | | | 1,853,770 |
XTO Energy, Inc., | | | | | | |
6.75%, 8/01/37 | | | 1,610 | | | 1,884,990 |
| | | | | | |
| | | | | | 24,245,585 |
| | | | | | |
Paper & Forest Products — 1.1% | | | | | | |
Celulosa Arauco y Constitucion SA, | | | | | | |
7.25%, 7/29/19 | | | 900 | | | 967,113 |
International Paper Co.: | | | | | | |
7.95%, 6/15/18 | | | 1,150 | | | 1,343,592 |
7.50%, 8/15/21 | | | 720 | | | 818,146 |
Weyerhaeuser Co., | | | | | | |
7.13%, 7/15/23 | | | 750 | | | 707,123 |
| | | | | | |
| | | | | | 3,835,974 |
| | | | | | |
Pharmaceuticals — 4.4% | | | | | | |
Bristol-Myers Squibb Co., | | | | | | |
5.88%, 11/15/36 | | | 900 | | | 923,873 |
Merck & Co, Inc., | | | | | | |
6.55%, 9/15/37 | | | 1,275 | | | 1,456,093 |
Roche Holding, Inc., | | | | | | |
6.00%, 3/01/19(a) | | | 2,400 | | | 2,652,300 |
Teva Pharmaceutical Finance Co. LLC: | | | | | | |
5.55%, 2/01/16 | | | 2,400 | | | 2,627,784 |
6.15%, 2/01/36 | | | 1,000 | | | 1,037,295 |
Watson Pharmaceuticals, Inc., | | | | | | |
5.00%, 8/15/14 | | | 1,025 | | | 1,067,238 |
Wyeth: | | | | | | |
5.50%, 2/15/16 | | | 3,110 | | | 3,469,221 |
5.45%, 4/01/17 | | | 1,500 | | | 1,641,770 |
5.95%, 4/01/37 | | | 1,175 | | | 1,230,199 |
| | | | | | |
| | | | | | 16,105,773 |
| | | | | | |
Real Estate Investment Trusts (REITs) — 0.6% | | | | | | |
AvalonBay Communities, Inc.: | | | | | | |
6.13%, 11/01/12 | | | 53 | | | 57,397 |
5.70%, 3/15/17 | | | 1,050 | | | 1,106,785 |
WEA Finance LLC / WT Finance Australia Ltd., | | | | | | |
5.75%, 9/02/15(a) | | | 1,075 | | | 1,131,420 |
| | | | | | |
| | | | | | 2,295,602 |
| | | | | | |
Road & Rail — 0.9% | | | | | | |
Burlington Northern Santa Fe Corp., | | | | | | |
5.65%, 5/01/17 | | | 425 | | | 455,532 |
Canadian National Railway Co., | | | | | | |
6.25%, 8/01/34 | | | 2,000 | | | 2,152,690 |
Canadian Pacific Railway Co., | | | | | | |
7.25%, 5/15/19 | | | 500 | | | 568,020 |
| | | | | | |
| | | | | | 3,176,242 |
| | | | | | |
Semiconductors & Semiconductor Equipment — 0.4% | | | | | | |
National Semiconductor Corp., | | | | | | |
3.95%, 4/15/15 | | | 1,350 | | | 1,334,840 |
| | | | | | |
Software — 1.2% | | | | | | |
Oracle Corp.: | | | | | | |
5.25%, 1/15/16 | | | 2,100 | | | 2,313,442 |
5.75%, 4/15/18 | | | 1,800 | | | 1,974,254 |
| | | | | | |
| | | | | | 4,287,696 |
| | | | | | |
Tobacco — 0.9% | | | | | | |
Altria Group, Inc., | | | | | | |
9.25%, 8/06/19 | | | 1,320 | | | 1,603,974 |
Philip Morris International, Inc., | | | | | | |
5.65%, 5/16/18 | | | 1,385 | | | 1,491,191 |
| | | | | | |
| | | | | | 3,095,165 |
| | | | | | |
Wireless Telecommunication Services — 3.5% | | | | | | |
America Movil SAB de CV: | | | | | | |
5.50%, 3/01/14 | | | 1,250 | | | 1,350,840 |
5.00%, 3/30/20(a) | | | 1,600 | | | 1,577,386 |
Cellco Partnership/Verizon Wireless Capital LLC, | | | | | | |
8.50%, 11/15/18 | | | 1,150 | | | 1,434,808 |
Rogers Communications, Inc.: | | | | | | |
7.50%, 3/15/15 | | | 2,125 | | | 2,480,304 |
6.80%, 8/15/18 | | | 1,525 | | | 1,734,762 |
Vodafone Group Plc: | | | | | | |
5.75%, 3/15/16 | | | 2,000 | | | 2,182,310 |
6.15%, 2/27/37 | | | 2,125 | | | 2,176,599 |
| | | | | | |
| | | | | | 12,937,009 |
| | | | | | |
Total Corporate Bonds — 89.6% | | | | | | 326,844,224 |
| | | | | | |
Foreign Agency Obligations | | | | | | |
CDP Financial, Inc., | | | | | | |
4.40%, 11/25/19(a) | | | 1,700 | | | 1,665,527 |
EDF SA, | | | | | | |
6.50%, 1/26/19(a) | | | 3,560 | | | 3,994,772 |
Eksportfinans ASA, | | | | | | |
5.50%, 5/25/16 | | | 1,200 | | | 1,321,696 |
Nakilat, Inc., | | | | | | |
6.07%, 12/31/33(a) | | | 25 | | | 22,752 |
See Notes to Financial Statements.
| | | | | | |
| 16 | | BLACKROCK BOND ALLOCATION TARGET SHARES | | MARCH 31, 2010 | | |
| | |
| Schedule of Investments (continued) | | Series C portfolio |
| | (Percentages shown are based on Net Assets) |
| | | | | | | |
| | | Par
(000) | | Value | |
Foreign Agency Obligations | | | | | | | |
Petrobras International Finance Co.: | | | | | | | |
5.88%, 3/01/18 | | $ | 2,350 | | $ | 2,454,220 | |
7.88%, 3/15/19 | | | 450 | | | 526,301 | |
6.88%, 1/20/40 | | | 150 | | | 154,828 | |
| | | | | | | |
Total Foreign Agency Obligations — 2.8% | | | | | | 10,140,096 | |
| | | | | | | |
Foreign Government Obligations | | | | | | | |
Mexico — 0.9% | | | | | | | |
United Mexican States: | | | | | | | |
5.88%, 2/17/14 | | | 1,775 | | | 1,980,012 | |
5.95%, 3/19/19 | | | 1,100 | | | 1,188,000 | |
| | | | | | | |
| | | | | | 3,168,012 | |
| | | | | | | |
Poland — 0.3% | | | | | | | |
Poland Government International Bond, | | | | | | | |
6.38%, 7/15/19 | | | 900 | | | 985,966 | |
| | | | | | | |
United Arab Emirates — 0.5% | | | | | | | |
Emirate of Abu Dhabi Notes, | | | | | | | |
6.75%, 4/08/19(a) | | | 1,750 | | | 1,991,245 | |
| | | | | | | |
Total Foreign Government Obligations — 1.7% | | | | | | 6,145,223 | |
| | | | | | | |
Preferred Securities | | | | | | | |
Capital Trusts | | | | | | | |
Commercial Banks — 0.3% | | | | | | | |
Rabobank Capital Funding II, | | | | | | | |
5.26%(a)(b)(c) | | | 75 | | | 66,893 | |
State Street Capital Trust IV, | | | | | | | |
1.26%, 6/15/37(b) | | | 1,075 | | | 806,400 | |
Wachovia Capital Trust III, | | | | | | | |
5.80%(b)(c) | | | 225 | | | 190,688 | |
| | | | | | | |
| | | | | | 1,063,981 | |
| | | | | | | |
Diversified Financial Services — 2.5% | | | | | | | |
Capital One Capital V, | | | | | | | |
10.25%, 8/15/39 | | | 1,670 | | | 1,978,424 | |
Credit Suisse/Guernsey, | | | | | | | |
5.86%(b)(c) | | | 4,760 | | | 4,462,500 | |
JPMorgan Chase Capital XXII, | | | | | | | |
6.45%, 2/02/37 | | | 200 | | | 185,682 | |
JPMorgan Chase Capital XXIII, | | | | | | | |
1.25%, 5/15/47(b) | | | 500 | | | 375,236 | |
JPMorgan Chase Capital XXVII, | | | | | | | |
7.00%, 11/01/39 | | | 1,225 | | | 1,250,117 | |
Lehman Brothers Holdings Capital Trust VII, | | | | | | | |
5.86%(b)(c)(d)(e) | | | 4,070 | | | 10,175 | |
USB Capital XIII Trust, | | | | | | | |
6.63%, 12/15/39 | | | 950 | | | 961,647 | |
| | | | | | | |
| | | | | | 9,223,781 | |
| | | | | | | |
Insurance — 0.3% | | | | | | | |
Lincoln National Corp., | | | | | | | |
7.00%, 5/17/66(b) | | | 75 | | | 68,250 | |
New York Life Insurance Co., | | | | | | | |
6.75%, 11/15/39(a) | | | 925 | | | 1,013,400 | |
| | | | | | | |
| | | | | | 1,081,650 | |
| | | | | | | |
Total Preferred Securities — 3.1% | | | | | | 11,369,412 | |
| | | | | | | |
Taxable Municipal Bonds | | | | | | | |
Metropolitan Transportation Authority, New York RB, | | | | | | | |
7.34%, 11/15/39 | | | 2,325 | | | 2,693,861 | |
State of California GO: | | | | | | | |
7.55%, 4/01/39 | | | 1,920 | | | 1,996,531 | |
7.35%, 11/01/39 | | | 475 | | | 473,314 | |
State of Illinois GO, | | | | | | | |
4.42%, 1/01/15 | | | 1,100 | | | 1,108,888 | |
| | | | | | | |
Total Taxable Municipal Bonds — 1.7% | | | | | | 6,272,594 | |
| | | | | | | |
U.S. Government Sponsored Agency Securities Agency Obligations — 0.3% | | | | | | | |
Fannie Mae, 6.35%, 10/09/19(f) | | | 2,250 | | | 1,316,452 | |
| | | | | | | |
U.S. Treasury Obligations — 0.5% | | | | | | | |
U.S. Treasury Notes, | | | | | | | |
3.63%, 2/15/20(g) | | | 1,725 | | | 1,695,622 | |
| | | | | | | |
Total Long-Term Investments
(Cost — $346,221,384) — 99.7% | | | | | | 363,783,623 | |
| | | | | | | |
| | |
| | | Shares | | | |
Short-Term Securities | | | | | | | |
Dreyfus Treasury Prime, 0.00%(h) | | | 1,537,497 | | | 1,537,497 | |
| | | | | | | |
Total Short-Term Securities
(Cost — $1,537,497) — 0.4% | | | | | | 1,537,497 | |
| | | | | | | |
Total Investments
(Cost — $347,758,881*) — 100.1% | | | | | | 365,321,120 | |
| | | | | | | |
Liabilities in Excess of Other Assets — (0.1)% | | | | | | (530,737 | ) |
| | | | | | | |
Net Assets — 100.0% | | | | | $ | 364,790,383 | |
| | | | | | | |
| * | The cost and unrealized appreciation (depreciation) of investments as of March 31, 2010, as computed for federal income tax purposes, were as follows: |
| | | | |
Aggregate cost | | $ | 347,758,881 | |
| | | | |
Gross unrealized appreciation | | $ | 23,114,098 | |
Gross unrealized depreciation | | | (5,551,859 | ) |
| | | | |
Net unrealized appreciation | | $ | 17,562,239 | |
| | | | |
| (a) | Security exempt from registration under Rule 144A of the Securities Act of 1933. These securities may be resold in transactions exempt from registration to qualified institutional investors. |
| (b) | Variable rate security. Rate shown is as of report date. |
| (c) | Security is perpetual in nature and has no stated maturity date. |
| (d) | Non-income producing security. |
| (e) | Issuer filed for bankruptcy and/or is in default of interest payments. |
| (f) | Represents a zero-coupon bond. Rate shown reflects the current yield as of report date. |
| (g) | All or a portion of security pledged as collateral for reverse repurchase agreements. |
| (h) | Represents the current yield as of report date. |
| • | | Investments in companies considered to be an affiliate of the Fund for purposes of Section 2(a)(3) of the Investment Company Act of 1940, were as follows: |
| | | | | | | |
Affiliate | | Net Activity | | | Income |
BlackRock Liquidity Funds, TempFund Institutional Class | | $ | (8,766,428 | ) | | $ | 1,710 |
See Notes to Financial Statements.
| | | | | | |
| | | BLACKROCK BOND ALLOCATION TARGET SHARES | | MARCH 31, 2010 | | 17 |
| | |
| Schedule of Investments (concluded) | | Series C portfolio |
| | (Percentages shown are based on Net Assets) |
| • | | Reverse repurchase agreements outstanding as of March 31, 2010 were as follows: |
| | | | | | | | | | | | | |
Counterparty | | Interest
Rate | | | Settlement
Date | | Maturity
Date | | Net Closing
Amount | | Par |
Barclays Bank, Plc | | 0.02 | % | | 3/30/10 | | Open | | $ | 1,696,970 | | $ | 1,696,969 |
| • | | Financial futures contracts purchased as of March 31, 2010 were as follows: |
| | | | | | | | | | | |
Contracts | | Issue | | Expiration Date | | Notional
Value | | Unrealized
Appreciation
(Depreciation) | |
| 116 | | U.S. Treasury Notes
(2 Year) | | June 2010 | | $ | 25,166,563 | | $ | 9,318 | |
| 73 | | U.S. Treasury Notes
(5 Year) | | June 2010 | | $ | 8,383,594 | | | (30,636 | ) |
| 29 | | CME Ultra Bond
(5 Year) | | June 2010 | | $ | 3,479,094 | | | (9,885 | ) |
| | | | | | | | | | | |
Total | | | | | | | | | $ | (31,203 | ) |
| | | | | | | | | | | |
| • | | Financial futures contracts sold as of March 31, 2010 were as follows: |
| | | | | | | | | | | |
Contracts | | Issue | | Expiration Date | | Notional
Value | | Unrealized
Appreciation
(Depreciation) | |
| 418 | | U.S. Treasury Notes
(10 Year) | | June 2010 | | $ | 48,592,500 | | | 28,623 | |
| 89 | | U.S. Treasury Bonds
(20 Year) | | June 2010 | | $ | 10,335,125 | | | (34,238 | ) |
| | | | | | | | | | | |
Total | | | | | | | | | $ | (5,615 | ) |
| | | | | | | | | | | |
| • | | For Fund compliance purposes, the Fund’s industry classifications refer to any one or more of the industry sub-classifications used by one or more widely recognized market indexes or ratings group indexes, and/or as defined by Fund management. This definition may not apply for purposes of this report, which may combine industry sub-classifications for reporting ease. |
| • | | Fair Value Measurements - Various inputs are used in determining the fair value of investments, which are as follows: |
| | • | | Level 1 - price quotations in active markets/exchanges for identical assets and liabilities |
| | • | | Level 2 - other observable inputs (including, but not limited to: quoted prices for similar assets or liabilities in markets that are active, quoted prices for identical or similar assets or liabilities in markets that are not active, inputs other than quoted prices that are observable for the assets or liabilities (such as interest rates, yield curves, volatilities, prepayment speeds, loss severities, credit risks and default rates) or other market–corroborated inputs) |
| | • | | Level 3 - unobservable inputs based on the best information available in the circumstances, to the extent observable inputs are not available (including the Fund’s own assumptions used in determining the fair value of investments) |
The inputs or methodologies used for valuing securities are not necessarily an indication of the risk associated with investing in those securities. For information about the Fund’s policy regarding valuation of investments and other significant accounting policies, please refer to Note 1 of the Notes to Financial Statements.
The following tables summarize the inputs used as of March 31, 2010 in determining the fair valuation of the Fund’s investments:
| | | | | | | | | | | |
| | | Investments in Securities |
Valuation Inputs | | Level 1 | | Level 2 | | Level 3 | | Total |
Assets: | | | | | | | | | | | |
Long-Term Investments1 | | | — | | $ | 363,783,623 | | — | | $ | 363,783,623 |
Short-Term Securities | | $ | 1,537,497 | | | — | | — | | | 1,537,497 |
| | | | | | | | | | | |
Total | | $ | 1,537,497 | | $ | 363,783,623 | | — | | $ | 365,321,120 |
| | | | | | | | | | | |
| 1 | See above Schedule of Investments for values in each security type. |
| | | | | | | | | | | | |
| | | Other Financial Instruments2 | |
Valuation Inputs | | Level 1 | | | Level 2 | | Level 3 | | Total | |
Assets | | $ | 37,941 | | | — | | — | | $ | 37,941 | |
Liabilities | | | (74,759 | ) | | — | | — | | | (74,759 | ) |
| | | | | | | | | | | | |
Total | | $ | (36,818 | ) | | — | | — | | $ | (36,818 | ) |
| | | | | | | | | | | | |
| 2 | Other financial instruments are financial futures contracts which are shown at the unrealized appreciation/depreciation on the instrument. |
See Notes to Financial Statements.
| | | | | | |
| 18 | | BLACKROCK BOND ALLOCATION TARGET SHARES | | MARCH 31, 2010 | | |
| | |
| Schedule of Investments March 31, 2010 | | Series M Portfolio |
| | (Percentages shown are based on Net Assets) |
| | | | | | |
| | | Par
(000) | | Value |
Asset-Backed Securities | | | | | | |
Ally Auto Receivables Trust, | | | | | | |
Series 2009-A, Class A2, 1.32%, 3/15/12(a) | | $ | 1,000 | | $ | 1,004,215 |
AmeriCredit Automobile Receivables Trust, | | | | | | |
Series 2009-1, Class A3, 3.04%, 10/15/13 | | | 1,200 | | | 1,230,072 |
Bank of America Auto Trust: | | | | | | |
Series 2009-2A, Class A2, 1.16%, 2/15/12(a) | | | 2,185 | | | 2,191,085 |
Series 2010-1A, Class A2, 0.75%, 6/15/12(a) | | | 4,825 | | | 4,828,135 |
Series 2009-2A, Class A3, 2.13%, 9/16/13(a) | | | 2,185 | | | 2,217,956 |
Capital Auto Receivables Asset Trust: | | | | | | |
Series 2007-1, Class A3A, 5.00%, 4/15/11 | | | 294 | | | 295,462 |
Series 2006-2, Class A3A, 4.98%, 5/15/11 | | | 398 | | | 400,638 |
Capital One Auto Finance Trust, | | | | | | |
Series 2006-B, Class A4, 0.25%, 7/15/13(b) | | | 3,204 | | | 3,192,987 |
CarMax Auto Owner Trust, | | | | | | |
Series 2009-1, Class A3, 4.12%, 3/15/13 | | | 2,680 | | | 2,772,014 |
Chase Issuance Trust, | | | | | | |
Series 2009-A7, Class A7, 0.68%, 9/15/10(b) | | | 3,000 | | | 3,004,475 |
Ford Credit Auto Owner Trust: | | | | | | |
Series 2009-D, Class A2, 1.21%, 1/15/12 | | | 1,000 | | | 1,002,751 |
Series 2009-A, Class A3A, 3.96%, 5/15/13 | | | 2,900 | | | 2,996,951 |
Series 2009-D, Class A3, 2.17%, 10/15/13 | | | 1,000 | | | 1,015,122 |
Series 2009-A, Class A4, 6.07%, 5/15/14 | | | 2,720 | | | 2,983,608 |
Harley-Davidson Motorcycle Trust: | | | | | | |
Series 2007-2, Class A3, 5.10%, 5/15/12 | | | 350 | | | 351,824 |
Series 2009-4, Class A2, 1.16%, 10/15/12 | | | 1,000 | | | 1,004,106 |
Series 2009-3, Class A4, 2.54%, 4/17/17 | | | 1,000 | | | 1,017,734 |
SLM Student Loan Trust: | | | | | | |
Series 2008-5, Class A2, 1.35%, 10/25/16(b) | | | 775 | | | 787,741 |
Series 2008-5, Class A3, 1.55%, 1/25/18(b) | | | 10,000 | | | 10,318,706 |
USAA Auto Owner Trust: | | | | | | |
Series 2006-2, Class A4, 5.37%, 2/15/12 | | | 394 | | | 395,243 |
Series 2006-4, Class A4, 4.98%, 10/15/12 | | | 2,856 | | | 2,910,616 |
Volkswagen Auto Loan Enhanced Trust, | | | | | | |
Series 2010-1, Class A2, 0.66%, 5/21/12 | | | 2,400 | | | 2,400,629 |
World Omni Auto Receivables Trust: | | | | | | |
Series 2006-B, Class A4, 5.12%, 6/15/12 | | | 282 | | | 287,691 |
Series 2007-BA, Class B, 5.98%, 4/15/15(a) | | | 3,635 | | | 3,844,994 |
| | | | | | |
Total Asset-Backed Securities — 14.5% | | | | | | 52,454,755 |
| | | | | | |
Non-Agency Mortgage-Backed Securities | | | | | | |
Commercial Mortgage-Backed Securities — 40.3% | | | | | | |
Banc of America Commercial Mortgage, Inc.: | | | | | | |
Series 2001-1, Class A2, 6.50%, 4/15/11 | | | 4,875 | | | 5,030,201 |
Series 2001-PB1, Class A2, 5.79%, 8/11/11 | | | 4,364 | | | 4,530,124 |
Bear Stearns Commercial Mortgage Securities: | | | | | | |
Series 2004-T16, Class A6, 4.75%, 10/13/14 | | | 7,355 | | | 7,494,001 |
Series 2000-WF2, Class A2, 7.32%, 10/15/32 | | | 1,455 | | | 1,469,852 |
Series 2005-PW10, Class A4, 5.41%, 12/11/40(b) | | | 1,000 | | | 1,023,919 |
Chase Commercial Mortgage Securities Corp., | | | | | | |
Series 2000-3, Class A2, 7.32%, 10/15/32 | | | 4,650 | | | 4,705,412 |
Citigroup/Deutsche Bank Commercial Mortgage Trust: | | | | | | |
Series 2006-CD3, Class A5, 5.62%, 10/15/48 | | | 500 | | | 511,607 |
Series 2008-C7, Class A2A, 6.03%, 12/10/49 | | | 5,000 | | | 5,261,750 |
Commercial Mortgage Asset Trust: | | | | | | |
Series 1999-C1, Class A3, 6.64%, 1/17/32 | | | 33 | | | 32,596 |
Series 2006-C8, Class A3, 5.31%, 12/10/46 | | | 5,000 | | | 5,060,433 |
Credit Suisse First Boston Mortgage Securities Corp.: | | | | | | |
Series 2001-CF2, Class A4, 6.51%, 1/15/11 | | | 841 | | | 863,708 |
Series 2002-CKN2, Class A2, 5.94%, 9/15/11 | | | 2,138 | | | 2,189,872 |
Credit Suisse Mortgage Capital Certificates: | | | | | | |
Series 2006-C1, Class A3, 5.55%, 2/15/39(b) | | | 4,820 | | | 4,999,156 |
Series 2006-C4, Class A3, 5.47%, 9/15/39 | | | 5,770 | | | 5,542,914 |
DLJ Commercial Mortgage Corp., | | | | | | |
Series 2000-CKP1, Class A1B, 7.18%, 11/10/33 | | | 989 | | | 997,956 |
First Union National Bank Commercial Mortgage: | | | | | | |
Series 2000-C2, Class A2, 7.20%, 9/15/10 | | | 2,634 | | | 2,663,817 |
Series 2001-C3, Class A3, 6.42%, 6/15/11 | | | 262 | | | 273,296 |
GE Capital Commercial Mortgage Corp.: | | | | | | |
Series 2001-2, Class A4, 6.29%, 8/11/33 | | | 3,205 | | | 3,344,230 |
Series 2004-C2, Class A4, 4.89%, 3/10/40 | | | 1,040 | | | 1,065,396 |
Series 2005-C1, Class A2, 4.35%, 6/10/48 | | | 2,946 | | | 2,980,087 |
GMAC Commercial Mortgage Securities, Inc.: | | | | | | |
Series 2000-C2, Class A2, 7.46%, 6/16/10(b) | | | 2,538 | | | 2,542,113 |
Series 2000-C3, Class A2, 6.96%, 11/15/10 | | | 4,216 | | | 4,296,419 |
Series 2002-C3, Class B, 5.10%, 7/10/39(b) | | | 1,000 | | | 1,011,516 |
Series 2003-C2, Class A2, 5.49%, 5/10/40(b) | | | 3,465 | | | 3,693,873 |
Greenwich Capital Commercial Funding Corp.: | | | | | | |
Series 2002-C1, Class B, 5.10%, 11/11/12(b) | | | 1,000 | | | 1,029,007 |
Series 2003-C1, Class A3, 3.86%, 7/05/35 | | | 250 | | | 255,656 |
Series 2007-GG9, Class A4, 5.44%, 3/10/39 | | | 3,000 | | | 2,917,495 |
Series 2005-GG3, Class A2, 4.31%, 8/10/42 | | | 2,690 | | | 2,733,495 |
Series 2005-GG3, Class A3, 4.57%, 8/10/42 | | | 1,335 | | | 1,355,699 |
JPMorgan Chase Commercial Mortgage Securities Corp.: | | | | | | |
Series 2001-CIB2, Class A3, 6.43%, 6/15/11 | | | 5,595 | | | 5,818,028 |
Series 2001-C1, Class A3, 5.86%, 10/12/11 | | | 3,240 | | | 3,388,890 |
Series 2001-CIBC, Class A3, 6.26%, 3/15/33 | | | 1,265 | | | 1,293,854 |
See Notes to Financial Statements.
| | | | | | |
| | | BLACKROCK BOND ALLOCATION TARGET SHARES | | MARCH 31, 2010 | | 19 |
| | |
| Schedule of Investments (continued) | | Series M portfolio |
| | (Percentages shown are based on Net Assets) |
| | | | | | | |
| | | Par
(000) | | Value | |
Non-Agency Mortgage-Backed Securities | | | | | | | |
Commercial Mortgage-Backed Securities (concluded) | | | | | | | |
Series 2001-CIB3, Class A3, 6.47%, 11/15/35 | | $ | 3,454 | | $ | 3,636,728 | |
Series 2005-CB12, Class A4, 4.90%, 9/12/37 | | | 280 | | | 285,040 | |
Series 2006-LDP7, Class A4, 5.87%, 4/15/45(b) | | | 2,105 | | | 2,173,153 | |
Series 2006-LDP9, Class A25, 5.30%, 5/15/47 | | | 4,820 | | | 4,943,664 | |
JPMorgan Commercial Mortgage Finance Corp., | | | | | | | |
Series 2000-C10, Class A2, 7.37%, 8/15/32(b) | | | 22 | | | 22,153 | |
LB-UBS Commercial Mortgage Trust: | | | | | | | |
Series 2001-WM, Class A1, 6.16%, 7/14/11(a) | | | 319 | | | 329,732 | |
Series 2000-C4, Class A2, 7.37%, 8/15/26 | | | 1,025 | | | 1,030,351 | |
Series 2003-C7, Class A2, 4.06%, 9/15/27 | | | 426 | | | 427,012 | |
Series 2004-C4, Class A4, 5.22%, 6/15/29(b) | | | 220 | | | 226,072 | |
Series 2005-C5, Class A2, 4.89%, 9/15/30 | | | 1,738 | | | 1,808,770 | |
Series 2006-C3, Class A4, 5.66%, 3/15/39(b) | | | 355 | | | 363,509 | |
Series 2007-C2, Class A2, 5.30%, 2/15/40 | | | 9,455 | | | 9,700,983 | |
Series 2007-C7, Class A2, 5.59%, 9/15/45 | | | 5,000 | | | 5,165,754 | |
Morgan Stanley Capital I, | | | | | | | |
Series 2007-IQ15, Class A2, 5.84%, 8/11/12(b) | | | 4,100 | | | 4,265,076 | |
Salomon Brothers Mortgage Securities VII, Inc.: | | | | | | | |
Series 2000-C2, Class A2, 7.46%, 4/18/10 | | | 172 | | | 171,354 | |
Series 2000-C3, Class A2, 6.59%, 11/18/10 | | | 2,422 | | | 2,445,026 | |
Series 2001-C1, Class A3, 6.43%, 3/18/11 | | | 4,104 | | | 4,231,769 | |
Series 2001-C2, Class A3, 6.50%, 10/13/11 | | | 5,551 | | | 5,833,056 | |
TIAA Seasoned Commercial Mortgage Trust, | | | | | | | |
Series 2007-C4, Class A1, 5.67%, 8/15/39(b) | | | 2,389 | | | 2,474,906 | |
Wachovia Bank Commercial Mortgage Trust, | | | | | | | |
Series 2006-C28, Class A2, 5.50%, 10/15/48 | | | 5,400 | | | 5,545,553 | |
| | | | | | | |
Total Non-Agency Mortgage-Backed Securities — 40.3% | | | | | | 145,456,033 | |
| | | | | | | |
U.S. Government Sponsored Agency Securities | | | | | | | |
Collateralized Mortgage Obligations — 1.7% | | | | | | | |
Freddie Mac: | | | | | | | |
Series 3128, Class BA, 5.00%, 1/15/24 | | | 95 | | | 97,122 | |
Series 3018, Class GN, 6.00%, 9/15/26 | | | 544 | | | 546,049 | |
Series 2864, Class NA, 5.50%, 10/15/27-1/15/31 | | | 3,457 | | | 3,558,136 | |
Series 2511, Class IG, 5.37%, 5/01/36(b) | | | 1,812 | | | 1,900,917 | |
| | | | | | | |
| | | | | | 6,102,224 | |
| | | | | | | |
Federal Deposit Insurance Corporation Guaranteed — 3.0% | | | | | | | |
Citibank, N.A., | | | | | | | |
1.38%, 8/10/11 | | | 5,325 | | | 5,368,015 | |
Citigroup Funding, Inc., | | | | | | | |
2.25%, 12/10/12 | | | 5,320 | | | 5,406,344 | |
| | | | | | | |
| | | | | | 10,774,359 | |
| | | | | | | |
Mortgage-Backed Securities — 20.7% | | | | | | | |
Fannie Mae Mortgage-Backed Securities: | | | | | | | |
3.50%, 8/25/14 | | | 6,700 | | | 6,767,730 | |
3.00%, 9/16/14 | | | 7,030 | | | 7,159,317 | |
Freddie Mac Mortgage-Backed Securities, | | | | | | | |
3.00%, 7/28/14 | | | 7,045 | | | 7,201,026 | |
Ginnie Mae Mortgage-Backed Securities, | | | | | | | |
5.50%, 4/01/40(c) | | | 50,725 | | | 53,657,539 | |
| | | | | | | |
| | | | | | 74,785,612 | |
| | | | | | | |
Total U.S. Government Sponsored Agency Securities — 25.4% | | | | | | 91,662,195 | |
| | | | | | | |
U.S. Treasury Obligations | | | | | | | |
U.S. Treasury Bonds: | | | | | | | |
3.50%, 2/15/39(d) | | | 10,000 | | | 8,092,190 | |
4.25%, 5/15/39 | | | 10,000 | | | 9,265,620 | |
4.50%, 8/15/39 | | | 15,700 | | | 15,160,313 | |
4.38%, 11/15/39 | | | 12,000 | | | 11,347,500 | |
U.S. Treasury Inflation Indexed Bonds, | | | | | | | |
1.75%, 1/15/28(d) | | | 2,315 | | | 2,266,444 | |
U.S. Treasury Notes, | | | | | | | |
3.63%, 2/15/20 | | | 13,210 | | | 12,985,020 | |
| | | | | | | |
Total U.S. Treasury Obligations — 16.4% | | | | | | 59,117,087 | |
| | | | | | | |
Total Long-Term Investments
(Cost — $345,791,694) — 96.6% | | | | | | 348,690,070 | |
| | | | | | | |
| | |
| | | Shares | | | |
Short-Term Securities | | | | | | | |
Dreyfus Treasury Prime, 0.00%(e) | | | 65,294,565 | | | 65,294,565 | |
| | | | | | | |
Total Short-Term Securities
(Cost — $65,294,565) — 18.1% | | | | | | 65,294,565 | |
| | | | | | | |
Total Investments (Cost — $411,086,259*) — 114.7% | | | | | | 413,984,635 | |
Liabilities in Excess of Other Assets — (14.7)% | | | | | | (53,081,164 | ) |
| | | | | | | |
Net Assets — 100.0% | | | | | $ | 360,903,471 | |
| | | | | | | |
| * | The cost and unrealized appreciation (depreciation) of investments as of March 31, 2010, as computed for federal income tax purposes, were as follows: |
| | | | |
Aggregate cost | | $ | 411,086,259 | |
| | | | |
Gross unrealized appreciation | | $ | 6,024,281 | |
Gross unrealized depreciation | | | (3,125,905 | ) |
| | | | |
Net unrealized appreciation | | $ | 2,898,376 | |
| | | | |
| (a) | Security exempt from registration under Rule 144A of the Securities Act of 1933. These securities may be resold in transactions exempt from registration to qualified institutional investors. |
| (b) | Variable rate security. Rate shown is as of report date. |
| (c) | Represents or includes a to-be-announced (“TBA”) transaction. Unsettled TBA transactions as of report date were as follows: |
| | | | | | | |
Counterparty | | Value | | Unrealized
Depreciation | |
Barclays Bank, Plc | | $ | 53,657,539 | | $ | (134,738 | ) |
| (d) | All or a portion of security pledged as collateral in connection with open financial futures contracts. |
| (e) | Represents the current yield as of report date. |
See Notes to Financial Statements.
| | | | | | |
| 20 | | BLACKROCK BOND ALLOCATION TARGET SHARES | | MARCH 31, 2010 | | |
| | |
| Schedule of Investments (concluded) | | Series M Portfolio |
| | |
| • | | Investments in companies considered to be an affiliate of the Fund for purposes of Section 2(a)(3) of the Investment Company Act of 1940, were as follows: |
| | | | | | | |
Affiliate | | Net Activity | | | Income |
BlackRock Liquidity Funds, TempFund Institutional Class | | $ | (39,578,631 | ) | | $ | 32,398 |
| • | | Financial futures contracts purchased as of March 31, 2010 were as follows: |
| | | | | | | | | | | |
Contracts | | Issue | | Expiration
Date | | Notional
Value | | Unrealized
Appreciation
(Depreciation) | |
| 501 | | U.S. Treasury
Notes (5 Year) | | June 2010 | | $ | 57,536,719 | | $ | (360,998 | ) |
| 460 | | U.S. Treasury
Bonds (20 Year) | | June 2010 | | $ | 53,417,500 | | | 152,670 | |
| | | | | | | | | | | |
Total | | | | | | | | | $ | (208,328 | ) |
| | | | | | | | | | | |
| • | | Financial futures contracts sold as of March 31, 2010 were as follows: |
| | | | | | | | | | | |
Contracts | | Issue | | Expiration
Date | | Notional
Value | | Unrealized
Depreciation | |
| 316 | | U.S. Treasury
Notes (2 Year) | | June 2010 | | $ | 68,557,187 | | $ | (2,331 | ) |
| 249 | | U.S. Treasury
Notes (10 Year) | | June 2010 | | $ | 28,946,250 | | | (46,234 | ) |
| | | | | | | | | | | |
Total | | | | | | | | | $ | (48,565 | ) |
| | | | | | | | | | | |
| • | | Fair Value Measurements - Various inputs are used in determining the fair value of investments, which are as follows: |
| | • | | Level 1 – price quotations in active markets/exchanges for identical assets and liabilities |
| | • | | Level 2 – other observable inputs (including, but not limited to: quoted prices for similar assets or liabilities in markets that are active, quoted prices for identical or similar assets or liabilities in markets that are not active, inputs other than quoted prices that are observable for the assets or liabilities (such as interest rates, yield curves, volatilities, prepayment speeds, loss severities, credit risks and default rates) or other market–corroborated inputs) |
| | • | | Level 3 – unobservable inputs based on the best information available in the circumstances, to the extent observable inputs are not available (including the Fund’s own assumptions used in determining the fair value of investments) |
The inputs or methodologies used for valuing securities are not necessarily an indication of the risk associated with investing in those securities. For information about the Fund’s policy regarding valuation of investments and other significant accounting policies, please refer to Note 1 of the Notes to Financial Statements.
The following tables summarize the inputs used as of March 31, 2010 in determining the fair valuation of the Fund’s investments:
| | | | | | | | | | | | |
| | | Investments in Securities |
Valuation Inputs | | Level 1 | | Level 2 | | Level 3 | | Total |
Assets: | | | | | | | | | | | | |
Asset-Backed Securities | | | — | | $ | 48,609,761 | | $ | 3,844,994 | | $ | 52,454,755 |
Non-Agency Mortgage-Backed Securities | | | — | | | 145,456,033 | | | — | | | 145,456,033 |
U.S. Government Sponsored Agency Securities | | | — | | | 91,662,195 | | | — | | | 91,662,195 |
U.S. Treasury Obligations | | | — | | | 59,117,087 | | | — | | | 59,117,087 |
Short-Term Securities | | $ | 65,294,565 | | | — | | | — | | | 65,294,565 |
| | | | | | | | | | | | |
Total | | $ | 65,294,565 | | $ | 344,845,076 | | $ | 3,844,994 | | $ | 413,984,635 |
| | | | | | | | | | | | |
| | | | | | | | | | | | |
| | | Other Financial Instruments1 | |
Valuation Inputs | | Level 1 | | | Level 2 | | Level 3 | | Total | |
Assets | | $ | 152,670 | | | — | | — | | $ | 152,670 | |
Liabilities | | | (409,563 | ) | | — | | — | | | (409,563 | ) |
| | | | | | | | | | | | |
Total | | $ | (256,893 | ) | | — | | — | | $ | (256,893 | ) |
| | | | | | | | | | | | |
| 1 | Other financial instruments are financial futures contracts which are shown at the unrealized appreciation/depreciation on the instrument. |
The following table is a reconciliation of level 3 investments for which significant unobservable inputs were used to determine fair value:
| | | | |
| | | Investments
in Securities
Asset-Backed
Securities | |
Balance, as of March 31, 2009 | | | — | |
Accrued discounts/premiums | | $ | (6,190 | ) |
Realized gain (loss) | | | — | |
Change in unrealized appreciation (depreciation)2 | | | 6,603 | |
Net purchases (sales) | | | 3,844,581 | |
Net transfers in/out of Level 3 | | | — | |
| | | | |
Balance, as of March 31, 2010 | | $ | 3,844,994 | |
| | | | |
| 2 | Included in the related net change in unrealized appreciation/depreciation in the Statement of Operations. The change in unrealized appreciation/depreciation on securities still held at March 31, 2010 was $6,603. |
See Notes to Financial Statements.
| | | | | | |
| | | BLACKROCK BOND ALLOCATION TARGET SHARES | | MARCH 31, 2010 | | 21 |
| | |
| Schedule of Investments March 31, 2010 | | Series N Portfolio |
| | (Percentages shown are based on Net Assets) |
| | | | | | |
| | | Par
(000) | | Value |
Municipal Bonds | | | | | | |
Arizona — 2.5% | | | | | | |
Pima County IDA, RB, Tucson Electric Power, Series A, | | | | | | |
6.38%, 9/01/29 | | $ | 250 | | $ | 255,740 |
| | | | | | |
California — 11.1% | | | | | | |
California Statewide Communities Development Authority, RB: | | | | | | |
Senior Living Southern California, | | | | | | |
6.63%, 11/15/24 | | | 110 | | | 114,716 |
John Muir Health, | | | | | | |
5.13%, 7/01/39 | | | 100 | | | 95,688 |
City of Chula Vista California, RB, San Diego Gas, Series A, Remarketed, | | | | | | |
5.88%, 2/15/34 | | | 125 | | | 137,096 |
State of California, GO, Various Purpose, | | | | | | |
6.50%, 4/01/33 | | | 485 | | | 531,322 |
Tuolumne Wind Project Authority, RB, Tuolumne Co. Project, Series A, | | | | | | |
5.88%, 1/01/29 | | | 250 | | | 270,668 |
| | | | | | |
| | | | | | 1,149,490 |
| | | | | | |
District of Columbia — 3.7% | | | | | | |
Metropolitan Washington Airports Authority, RB: Capital Appreciation, 2nd Senior Lien, Series B, (AGC), | | | |
6.10%, 10/01/31(a) | | | 1,000 | | | 274,750 |
First Senior Lien, Series A, | | | | | | |
5.25%, 10/01/44 | | | 100 | | | 102,633 |
| | | | | | |
| | | | | | 377,383 |
| | | | | | |
Florida — 18.5% | | | | | | |
Florida Housing Finance Corp., RB: | | | | | | |
Willow Lake Apartments, Series J-1, (AMBAC), AMT, | | | | | | |
5.35%, 7/01/27 | | | 100 | | | 92,357 |
Homeowner Mortgage, Series 1, AMT, | | | | | | |
6.00%, 7/01/39 | | | 425 | | | 447,899 |
Hillsborough County Aviation Authority, Florida, RB, Series A, (AGC), AMT, | | | | | | |
5.50%, 10/01/38 | | | 500 | | | 503,035 |
Hillsborough County IDA, RB, National Gypsum, Series B, AMT, | | | | | | |
7.13%, 4/01/30 | | | 250 | | | 201,598 |
Jacksonville Port Authority, RB, (AGC), AMT, | | | | | | |
6.00%, 11/01/38 | | | 400 | | | 409,172 |
Miami-Dade County School Board, Florida, COP, Series B, (AGC), | | | | | | |
5.25%, 5/01/31 | | | 250 | | | 257,285 |
| | | | | | |
| | | | | | 1,911,346 |
| | | | | | |
Illinois — 8.5% | | | | | | |
Illinois Finance Authority, RB: Edward Hospital, Series A, Remarketed, (AMBAC), | | | | | | |
6.25%, 2/01/33 | | | 400 | | | 416,784 |
Children’s Memorial Hospital, Series A, (AGC), | | | | | | |
5.25%, 8/15/33 | | | 250 | | | 251,667 |
Friendship Village of Schaumbu, | | | | | | |
7.13%, 2/15/39 | | | 210 | | | 206,443 |
| | | | | | |
| | | | | | 874,894 |
| | | | | | |
Kentucky — 1.2% | | | | | | |
Kentucky Economic Development Finance Authority, RB, Owensboro Medical Health Systems, Series A, | | | |
6.38%, 6/01/40 | | | 125 | | | 124,736 |
| | | | | | |
Louisiana — 2.5% | | | | | | |
Louisiana Local Government Environmental Facilities & Community Development Authority, RB, Westlake Chemical Corp. Projects, | | | | | | |
6.75%, 11/01/32 | | | 250 | | | 259,885 |
| | | | | | |
Michigan — 11.2% | | | | | | |
Advanced Technology Academy, RB, | | | | | | |
6.00%, 11/01/37 | | | 200 | | | 171,600 |
City of Detroit Michigan, RB, Senior Lien, Series B, Remarketed, (BHAC), | | | | | | |
5.50%, 7/01/35 | | | 500 | | | 517,375 |
County of Wayne Michigan, GO, Building Improvement, Series A, | | | | | | |
6.75%, 11/01/39 | | | 100 | | | 104,535 |
Michigan State Hospital Finance Authority, Refunding, RB, Henry Ford Health, | | | | | | |
5.75%, 11/15/39 | | | 375 | | | 365,602 |
| | | | | | |
| | | | | | 1,159,112 |
| | | | | | |
New Jersey — 3.7% | | | | | | |
New Jersey Health Care Facilities Financing Authority, RB, St. Joseph’s Healthcare System, | | | | | | |
6.63%, 7/01/38 | | | 185 | | | 188,204 |
New Jersey State Housing & Mortgage Finance Agency, RB, S/F Housing, Series X, AMT, | | | | | | |
5.38%, 4/01/30 | | | 195 | | | 199,160 |
| | | | | | |
| | | | | | 387,364 |
| | | | | | |
New York — 7.0% | | | | | | |
Chautauqua County Industrial Development Agency, RB, Dunkirk Power Project, (NRG Energy, Inc.), | | | | | | |
5.88%, 4/01/42 | | | 200 | | | 202,588 |
Long Island Power Authority, RB, Series A, | | | | | | |
6.25%, 4/01/33 | | | 250 | | | 287,475 |
Metropolitan Transportation Authority, RB, Series 2008C, | | | | | | |
6.50%, 11/15/28 | | | 200 | | | 230,318 |
| | | | | | |
| | | | | | 720,381 |
| | | | | | |
North Carolina — 2.9% | | | | | | |
North Carolina Medical Care Commission, North Carolina, RB, First Mortgage, Deerfield, Series A, | | | | | | |
6.00%, 11/01/33 | | | 200 | | | 195,064 |
North Carolina Municipal Power Agency No. 1 Catawba, North Carolina, RB, Series A, | | | | | | |
5.00%, 1/01/30 | | | 100 | | | 101,981 |
| | | | | | |
| | | | | | 297,045 |
| | | | | | |
Pennsylvania — 3.1% | | | | | | |
Allegheny County Hospital Development Authority, RB, West Penn, Series A, | | | | | | |
5.00%, 11/15/28 | | | 180 | | | 143,156 |
Pennsylvania Economic Development Financing Authority, RB, Reliant Energy, Series B, AMT, | | | | | | |
6.75%, 12/01/36(b) | | | 180 | | | 180,048 |
| | | | | | |
| | | | | | 323,204 |
| | | | | | |
Texas — 11.2% | | | | | | |
Bexar County Health Facilities Development Corp., RB, Army Retirement Residence Project, | | | | | | |
6.20%, 7/01/45 | | | 140 | | | 140,510 |
Brazos River Authority, Refunding, RB, TXU Electric Co. Project, Series C, AMT, | | | | | | |
5.75%, 5/01/36 | | | 200 | | | 192,500 |
Central Texas Regional Mobility Authority, RB, Senior Lien, | | | | | | |
5.75%, 1/01/25 | | | 155 | | | 154,831 |
Matagorda County Navigation District No. 1, Texas, Refunding, RB, Central Power & Light Co. Project, Series A, Remarketed, | | | | | | |
6.30%, 11/01/29 | | | 125 | | | 134,380 |
North Texas Tollway Authority, Refunding, RB, Toll 2nd Tier, Series F, | | | | | | |
6.13%, 1/01/31 | | | 90 | | | 94,768 |
Texas Private Activity Bonds Surface Transportation Corp., Senior Lien, NTE Mobility, | | | | | | |
6.88%, 12/31/39 | | | 200 | | | 207,902 |
See Notes to Financial Statements.
| | | | | | |
| 22 | | BLACKROCK BOND ALLOCATION TARGET SHARES | | MARCH 31, 2010 | | |
| | |
| Schedule of Investments (concluded) | | Series N Portfolio |
| | (Percentages shown are based on Net Assets) |
| | | | | | | |
Municipal Bonds | | Par
(000) | | Value | |
Texas (concluded) | | | | | | | |
Texas State Public Finance Authority Education, RB, KIPP, Inc., Series A, (ACA), | | | | | | | |
5.00%, 2/15/28 | | $ | 250 | | $ | 228,692 | |
| | | | | | | |
| | | | | | 1,153,583 | |
| | | | | | | |
Guam — 1.6% | | | | | | | |
Territory of Guam, GO, Series A, | | | | | | | |
7.00%, 11/15/39 | | | 150 | | | 160,344 | |
| | | | | | | |
Puerto Rico — 2.0% | | | | | | | |
Commonwealth of Puerto Rico, Refunding, RB, Public Improvement, Series C, | | | | | | | |
6.00%, 7/01/39 | | | 200 | | | 208,480 | |
| | | | | | | |
Total Municipal Bonds — 90.7% | | | | | | 9,362,987 | |
| | | | | | | |
Municipal Bonds Transferred to Tender Option Bond Trusts (c) | | | | | | | |
California — 4.2% | | | | | | | |
Bay Area Toll Authority, RB, San Francisco Bay Area, Series F-1, | | | | | | | |
5.63%, 4/01/44 | | | 400 | | | 432,388 | |
| | | | | | | |
Total Long-Term Investments
(Cost — $9,428,925) — 94.9% | | | | | | 9,795,375 | |
| | | | | | | |
| | |
| | | Shares | | | |
Short-Term Securities | | | | | | | |
Dreyfus Tax Exempt Cash Management, | | | | | | | |
0.08%(d) | | | 377,149 | | | 377,149 | |
| | | | | | | |
Total Short-Term Securities
(Cost — $377,149) — 3.6% | | | | | | 377,149 | |
| | | | | | | |
Total Investments
(Cost — $9,806,074*) — 98.5% | | | | | | 10,172,524 | |
Other Assets Less Liabilities — 3.4% | | | | | | 350,928 | |
Liability for Trust Certificates, Including Interest Expense and Fees Payable — (1.9)% | | | | | | (200,689 | ) |
| | | | | | | |
Net Assets — 100.0% | | | | | $ | 10,322,763 | |
| | | | | | | |
| * | The cost and unrealized appreciation (depreciation) of investments as of March 31, 2010, as computed for federal income tax purposes, were as follows: |
| | | | |
Aggregate cost | | $ | 9,607,459 | |
| | | | |
Gross unrealized appreciation | | $ | 404,399 | |
Gross unrealized depreciation | | | (39,334 | ) |
| | | | |
Net unrealized appreciation | | $ | 365,065 | |
| | | | |
| (a) | Represents a zero-coupon bond. Rate shown reflects the current yield as of report date. |
| (b) | Variable rate security. Rate shown is as of report date. |
| (c) | Securities represent bonds transferred to a tender option bond trust in exchange for which the Fund acquired residual interest certificates. These securities serve as collateral in a financing transaction. See Note 1 to the Notes to Financial Statements for details of municipal bonds transferred to tender option bond trusts. |
| (d) | Represents the current yield as of report date. |
| • | | Fair Value Measurements - Various inputs are used in determining the fair value of investments, which are as follows: |
| | • | | Level 1 - price quotations in active markets/exchanges for identical assets and liabilities |
| | • | | Level 2 - other observable inputs (including, but not limited to: quoted prices for similar assets or liabilities in markets that are active, quoted prices for identical or similar assets or liabilities in markets that are not active, inputs other than quoted prices that are observable for the assets or liabilities (such as interest rates, yield curves, volatilities, prepayment speeds, loss severities, credit risks and default rates) or other market–corroborated inputs) |
| | • | | Level 3 - unobservable inputs based on the best information available in the circumstances, to the extent observable inputs are not available (including the Fund’s own assumptions used in determining the fair value of investments) |
The inputs or methodologies used for valuing securities are not necessarily an indication of the risk associated with investing in those securities. For information about the Fund’s policy regarding valuation of investments and other significant accounting policies, please refer to Note 1 of the Notes to Financial Statements.
The following table summarizes the inputs used as of March 31, 2010 in determining the fair valuation of the Fund’s investments:
| | | | | | | | | | | |
| | | Investments in Securities |
Valuation Inputs | | Level 1 | | Level 2 | | Level 3 | | Total |
Assets: | | | | | | | | | | | |
Long-Term Investments1 | | | — | | $ | 9,795,375 | | — | | $ | 9,795,375 |
Short-Term Securities | | $ | 377,149 | | | — | | — | | | 377,149 |
| | | | | | | | | | | |
Total | | $ | 377,149 | | $ | 9,795,375 | | — | | $ | 10,172,524 |
| | | | | | | | | | | |
| 1 | See above Schedule of Investments for values in each state or political subdivision. |
See Notes to Financial Statements.
| | | | | | |
| | | BLACKROCK BOND ALLOCATION TARGET SHARES | | MARCH 31, 2010 | | 23 |
| | |
| Schedule of Investments March 31, 2010 | | Series S Portfolio |
| | (Percentages shown are based on Net Assets) |
| | | | | | |
| | | Par
(000) | | Value |
Asset-Backed Securities | | | | | | |
AH Mortgage Advance Trust, Series 2009-ADV2, Class A1, | | | | | | |
2.23%, 8/15/19(a)(b) | | $ | 480 | | $ | 478,800 |
Ally Auto Receivables Trust, Series 2009-B, Class A2, | | | | | | |
1.21%, 6/15/12(a) | | | 1,075 | | | 1,079,486 |
AmeriCredit Automobile Receivables Trust: | | | | | | |
Series 2008-1, Class A2, 4.23%, 6/06/12(b) | | | 477 | | | 482,469 |
Series 2008-2, Class A2, 4.23%, 8/06/12(b) | | | 333 | | | 340,626 |
Series 2009-1, Class A3, 3.04%, 10/15/13 | | | 990 | | | 1,014,809 |
Series 2010-1, Class A3, 1.66%, 3/17/14 | | | 610 | | | 610,196 |
BA Credit Card Trust, Series 2007-A2, Class A2, | | | | | | |
0.25%, 6/17/13(b) | | | 1,080 | | | 1,076,924 |
Bank of America Auto Trust: | | | | | | |
Series 2009-2A, Class A2, 1.16%, 2/15/12(a) | | | 635 | | | 636,768 |
Series 2009-1A, Class A3, 2.67%, 7/15/13(a) | | | 700 | | | 715,165 |
Series 2009-2A, Class A3, 2.13%, 9/15/13(a) | | | 805 | | | 817,142 |
Capital One Auto Finance Trust: | | | | | | |
Series 2006-C, Class A4, 0.26%, 5/15/13- 4/15/14(b) | | | 1,344 | | | 1,329,495 |
Series 2006-B, Class A4, 0.25%, 7/15/13(b) | | | 936 | | | 933,080 |
Capital One Multi-Asset Execution Trust: | | | | | | |
Series 2006-A2, Class A, 4.85%, 11/15/13 | | | 565 | | | 583,306 |
Series 2009-A2, Class A2, 3.20%, 4/15/14 | | | 780 | | | 800,068 |
Carrington Mortgage Loan Trust, Series 2006-NC4, Class A1, | | | | | | |
0.30%, 10/25/36(b) | | | 61 | | | 60,033 |
CenterPoint Energy Transition Bond Co. LLC, Series 2005-A, Class A2, | | | | | | |
4.97%, 8/01/14 | | | 580 | | | 609,223 |
Chase Issuance Trust, Series 2007-A15, Class A, | | | | | | |
4.96%, 9/17/12 | | | 1,000 | | | 1,020,403 |
Chrysler Financial Auto Securitization Trust, Series 2009-A, Class A3, | | | | | | |
2.82%, 1/15/16 | | | 410 | | | 419,668 |
CNH Equipment Trust: | | | | | | |
Series 2007-B, Class A3A, 5.40%, 10/17/11 | | | 61 | | | 61,298 |
Series 2009-C, Class A3, 1.85%, 12/16/13 | | | 1,105 | | | 1,112,198 |
Connecticut RRB Special Purpose Trust CL&P, Series 2001-1, Class A5, | | | | | | |
6.21%, 12/30/10 | | | 261 | | | 266,895 |
Daimler Chrysler Auto Trust, Series 2007-A, Class A4, | | | | | | |
5.28%, 3/08/13 | | | 625 | | | 656,351 |
Ford Credit Auto Owner Trust: | | | | | | |
Series 2009-D, Class A2, 1.21%, 1/15/12 | | | 435 | | | 436,197 |
Series 2009-A, Class A3B, 2.73%, 1/15/12(b) | | | 1,000 | | | 1,025,013 |
Series 2007-B, Class A4A, 5.24%, 7/15/12 | | | 970 | | | 1,018,639 |
Series 2006-B, Class D, 7.12%, 2/15/13(a) | | | 410 | | | 428,203 |
Series 2009-B, Class A3, 2.79%, 8/15/13 | | | 575 | | | 588,330 |
Series 2009-D, Class A3, 2.17%, 10/15/13 | | | 2,290 | | | 2,324,629 |
Series 2009-A, Class A4, 6.07%, 5/15/14 | | | 560 | | | 614,272 |
GSAA Trust, Series 2004-11, Class 2A2, | | | | | | |
0.57%, 12/25/34(b) | | | 13 | | | 9,671 |
Honda Auto Receivables Owner Trust: | | | | | | |
Series 2007-2, Class A4, 5.57%, 12/21/10 | | | 1,000 | | | 1,035,653 |
Series 2008-1, Class A3, 4.47%, 1/18/11 | | | 707 | | | 718,091 |
Series 2009-2, Class A3, 2.79%, 7/15/11 | | | 580 | | | 593,212 |
Mercedes-Benz Auto Receivables Trust, Series 2009-1, Class A3, | | | | | | |
1.67%, 1/15/14 | | | 1,110 | | | 1,120,638 |
Morgan Stanley Resecuritization Trust, Series 2010-F, Class A, | | | | | | |
0.48%, 6/17/13(a)(b) | | | 545 | | | 537,163 |
Ocwen Advance Receivables Backed Notes, Series 2010-1A, | | | | | | |
3.59%, 2/15/12(a) | | | 480 | | | 481,536 |
PECO Energy Transition Trust, Series 2001-A, Class A1, | | | | | | |
6.52%, 9/01/10 | | | 323 | | | 331,560 |
PG&E Energy Recovery Funding LLC: | | | | | | |
Series 2005-1, Class A4, 4.37%, 6/25/12 | | | 335 | | | 350,731 |
Series 2005-2, Class A2, 5.03%, 3/25/14 | | | 722 | | | 755,473 |
SLM Student Loan Trust: | | | | | | |
Series 2008-5, Class A2, 1.35%, 10/25/16(b) | | | 2,585 | | | 2,627,498 |
Series 2004-1, Class A2, 0.39%, 7/25/18(b) | | | 1,326 | | | 1,323,862 |
Series 2006-5, Class A3, 0.28%, 10/25/19(b) | | | 474 | | | 472,287 |
Turquoise Card Backed Securities Plc, Series 2007-1, Class A, | | | | | | |
0.27%, 6/15/12(b) | | | 500 | | | 499,421 |
USAA Auto Owner Trust, Series 2009-1, Class A2, | | | | | | |
2.64%, 8/15/11 | | | 300 | | | 301,045 |
| | | | | | |
Total Asset-Backed Securities — 22.9% | | | | | | 32,697,527 |
| | | | | | |
Corporate Bonds | | | | | | |
Aerospace & Defense — 0.4% | | | | | | |
BAE Systems Holdings, Inc., | | | | | | |
6.40%, 12/15/11(a) | | | 225 | | | 240,732 |
ITT Corp., | | | | | | |
4.90%, 5/01/14 | | | 375 | | | 398,252 |
| | | | | | |
| | | | | | 638,984 |
| | | | | | |
Beverages — 2.6% | | | | | | |
Anheuser-Busch InBev Worldwide, Inc.: | | | | | | |
3.00%, 10/15/12 | | | 1,025 | | | 1,052,510 |
2.50%, 3/26/13(a) | | | 875 | | | 876,688 |
Bottling Group LLC, | | | | | | |
6.95%, 3/15/14 | | | 750 | | | 868,282 |
Dr Pepper Snapple Group, Inc., | | | | | | |
2.35%, 12/21/12 | | | 870 | | | 876,169 |
| | | | | | |
| | | | | | 3,673,649 |
| | | | | | |
Capital Markets — 2.7% | | | | | | |
The Bank of New York Mellon Corp., | | | | | | |
4.30%, 5/15/14 | | | 750 | | | 789,520 |
The Goldman Sachs Group, Inc.: | | | | | | |
3.63%, 8/01/12 | | | 1,450 | | | 1,501,611 |
6.00%, 5/01/14 | | | 400 | | | 437,994 |
Morgan Stanley: | | | | | | |
6.60%, 4/01/12 | | | 455 | | | 493,661 |
6.00%, 5/13/14 | | | 575 | | | 621,079 |
| | | | | | |
| | | | | | 3,843,865 |
| | | | | | |
Commercial Banks — 7.2% | | | | | | |
American Express Bank FSB, | | | | | | |
5.50%, 4/16/13 | | | 275 | | | 294,518 |
ANZ National International Ltd., | | | | | | |
2.38%, 12/21/12(a) | | | 675 | | | 676,332 |
Asian Development Bank, | | | | | | |
3.63%, 9/05/13 | | | 170 | | | 178,788 |
Bank of Tokyo-Mitsubishi UFJ Ltd., | | | | | | |
2.60%, 1/22/13(a) | | | 945 | | | 951,873 |
Barclays Bank Plc, | | | | | | |
5.45%, 9/12/12 | | | 455 | | | 490,485 |
BNP Paribas, | | | | | | |
1.26%, 6/11/12(b) | | | 1,085 | | | 1,100,296 |
Credit Suisse New York: | | | | | | |
3.45%, 7/02/12 | | | 500 | | | 517,596 |
5.50%, 5/01/14 | | | 300 | | | 326,530 |
Lloyds TSB Bank Plc, | | | | | | |
4.38%, 1/12/15(a) | | | 1,060 | | | 1,044,929 |
Nordea Bank AB, | | | | | | |
2.50%, 11/13/12(a) | | | 665 | | | 671,292 |
Rabobank Nederland NV, | | | | | | |
2.65%, 8/17/12(a) | | | 1,650 | | | 1,683,297 |
Suncorp-Metway Ltd., | | | | | | |
0.63%, 12/17/10(a)(b) | | | 915 | | | 916,440 |
See Notes to Financial Statements.
| | | | | | |
| 24 | | BLACKROCK BOND ALLOCATION TARGET SHARES | | MARCH 31, 2010 | | |
| | |
| Schedule of Investments (continued) | | Series S Portfolio |
| | (Percentages shown are based on Net Assets) |
| | | | | | |
| | | Par
(000) | | Value |
Corporate Bonds | | | | | | |
Commercial Banks (concluded) | | | | | | |
Svenska Handelsbanken AB: | | | | | | |
2.88%, 9/14/12(a) | | $ | 250 | | $ | 254,736 |
4.88%, 6/10/14(a) | | | 325 | | | 342,084 |
U.S. Bancorp, | | | | | | |
4.20%, 5/15/14 | | | 800 | | | 839,354 |
| | | | | | |
| | | | | | 10,288,550 |
| | | | | | |
Commercial Services & Supplies — 0.5% | | | | | | |
Tyco International Finance SA, | | | | | | |
6.38%, 10/15/11 | | | 680 | | | 732,652 |
| | | | | | |
Consumer Finance — 1.5% | | | | | | |
American Express Credit Corp., | | | | | | |
7.30%, 8/20/13 | | | 425 | | | 477,026 |
Capital One Financial Corp.: | | | | | | |
5.70%, 9/15/11 | | | 1,000 | | | 1,045,148 |
4.80%, 2/21/12 | | | 595 | | | 617,983 |
| | | | | | |
| | | | | | 2,140,157 |
| | | | | | |
Containers & Packaging — 0.3% | | | | | | |
Temple-Inland, Inc.: | | | | | | |
7.88%, 5/01/12 | | | 200 | | | 215,468 |
6.63%, 1/15/16 | | | 170 | | | 178,398 |
| | | | | | |
| | | | | | 393,866 |
| | | | | | |
Diversified Financial Services — 3.6% | | | | | | |
Bank of America Corp., | | | | | | |
5.38%, 6/15/14 | | | 280 | | | 293,888 |
The Bear Stearns Cos. LLC, | | | | | | |
6.95%, 8/10/12 | | | 1,000 | | | 1,107,839 |
Countrywide Home Loans, Inc., | | | | | | |
4.00%, 3/22/11 | | | 505 | | | 519,175 |
General Electric Capital Corp., | | | | | | |
2.80%, 1/08/13(c) | | | 1,900 | | | 1,922,946 |
JPMorgan Chase & Co., | | | | | | |
4.75%, 5/01/13 | | | 800 | | | 852,707 |
TIAA Global Markets, Inc.: | | | | | | |
4.88%, 1/12/11(a) | | | 335 | | | 344,795 |
5.13%, 10/10/12(a) | | | 100 | | | 107,436 |
| | | | | | |
| | | | | | 5,148,786 |
| | | | | | |
Diversified Telecommunication Services — 3.5% | | | | | | |
BellSouth Corp.: | | | | | | |
6.00%, 10/15/11 | | | 705 | | | 754,603 |
4.75%, 11/15/12 | | | 700 | | | 746,388 |
France Telecom SA, | | | | | | |
4.38%, 7/08/14 | | | 425 | | | 447,993 |
Koninklijke KPN NV, | | | | | | |
8.00%, 10/01/10 | | | 515 | | | 533,051 |
Telefonica Emisiones SAU, | | | | | | |
5.98%, 6/20/11 | | | 400 | | | 420,479 |
TELUS Corp., | | | | | | |
8.00%, 6/01/11 | | | 336 | | | 361,609 |
Verizon Communications, Inc., | | | | | | |
5.25%, 4/15/13 | | | 845 | | | 923,160 |
Verizon Global Funding Corp., | | | | | | |
7.25%, 12/01/10 | | | 735 | | | 766,907 |
| | | | | | |
| | | | | | 4,954,190 |
| | | | | | |
Electric Utilities — 3.3% | | | | | | |
Duke Energy Indiana, Inc., | | | | | | |
5.00%, 9/15/13 | | | 715 | | | 755,920 |
Energy East Corp., | | | | | | |
6.75%, 6/15/12 | | | 616 | | | 678,078 |
Florida Power Corp., | | | | | | |
6.65%, 7/15/11 | | | 430 | | | 458,565 |
FPL Group Capital, Inc., | | | | | | |
5.63%, 9/01/11 | | | 800 | | | 845,350 |
MidAmerican Energy Holdings Co., | | | | | | |
3.15%, 7/15/12 | | | 800 | | | 819,914 |
Progress Energy, Inc., | | | | | | |
7.10%, 3/01/11 | | | 650 | | | 683,573 |
Rochester Gas & Electric Corp., | | | | | | |
6.95%, 4/01/11 | | | 445 | | | 467,210 |
| | | | | | |
| | | | | | 4,708,610 |
| | | | | | |
Electronic Equipment & Instruments — 0.3% | | | | | | |
Agilent Technologies, Inc.: | | | | | | |
4.45%, 9/14/12 | | | 285 | | | 298,669 |
5.50%, 9/14/15 | | | 135 | | | 144,715 |
| | | | | | |
| | | | | | 443,384 |
| | | | | | |
Food & Staples Retailing — 1.3% | | | | | | |
CVS Caremark Corp.: | | | | | | |
0.55%, 6/01/10(b) | | | 400 | | | 400,058 |
5.75%, 8/15/11 | | | 1,400 | | | 1,480,013 |
| | | | | | |
| | | | | | 1,880,071 |
| | | | | | |
Food Products — 1.3% | | | | | | |
Kraft Foods, Inc.: | | | | | | |
5.63%, 11/01/11 | | | 935 | | | 993,064 |
6.00%, 2/11/13 | | | 500 | | | 548,777 |
2.63%, 5/08/13 | | | 325 | | | 327,443 |
| | | | | | |
| | | | | | 1,869,284 |
| | | | | | |
Health Care Equipment & Supplies — 0.6% | | | | | | |
CareFusion Corp., | | | | | | |
4.13%, 8/01/12 | | | 750 | | | 782,245 |
| | | | | | |
Health Care Providers & Services — 0.6% | | | | | | |
Roche Holding, Inc., | | | | | | |
4.50%, 3/01/12(a) | | | 840 | | | 888,008 |
| | | | | | |
Insurance — 2.8% | | | | | | |
Allstate Financial Global Funding, | | | | | | |
6.50%, 6/14/11(a) | | | 740 | | | 776,335 |
Metropolitan Life Global Funding I: | | | | | | |
2.15%, 6/10/11(a)(b) | | | 625 | | | 635,280 |
5.13%, 4/10/13(a) | | | 1,400 | | | 1,503,036 |
New York Life Global Funding, | | | | | | |
4.65%, 5/09/13(a) | | | 125 | | | 133,822 |
Prudential Financial, Inc.: | | | | | | |
3.63%, 9/17/12 | | | 430 | | | 442,229 |
2.75%, 1/14/13 | | | 450 | | | 450,547 |
| | | | | | |
| | | | | | 3,941,249 |
| | | | | | |
Life Sciences Tools & Services — 0.6% | | | | | | |
Life Technologies Corp., | | | | | | |
3.38%, 3/01/13 | | | 850 | | | 854,696 |
| | | | | | |
Machinery — 0.3% | | | | | | |
Ingersoll-Rand Global Holding Co. Ltd., | | | | | | |
9.50%, 4/15/14 | | | 380 | | | 460,764 |
| | | | | | |
Media — 1.6% | | | | | | |
Cox Communications, Inc., | | | | | | |
7.13%, 10/01/12 | | | 900 | | | 1,005,895 |
Time Warner Cable, Inc.: | | | | | | |
5.40%, 7/02/12 | | | 1,000 | | | 1,073,501 |
6.20%, 7/01/13 | | | 228 | | | 251,596 |
| | | | | | |
| | | | | | 2,330,992 |
| | | | | | |
Metals & Mining — 0.9% | | | | | | |
Freeport-McMoRan Copper & Gold, Inc., | | | | | | |
3.69%, 4/01/15(b) | | | 380 | | | 383,800 |
Rio Tinto Finance USA Ltd., | | | | | | |
8.95%, 5/01/14 | | | 800 | | | 964,002 |
| | | | | | |
| | | | | | 1,347,802 |
| | | | | | |
Multi-Utilities — 0.3% | | | | | | |
CenterPoint Energy, Inc., | | | | | | |
6.85%, 6/01/15 | | | 375 | | | 409,516 |
| | | | | | |
Oil, Gas & Consumable Fuels — 4.5% | | | | | | |
Canadian Natural Resources Ltd., | | | | | | |
4.90%, 12/01/14 | | | 700 | | | 748,224 |
Cenovus Energy, Inc., | | | | | | |
4.50%, 9/15/14(a) | | | 650 | | | 678,144 |
ConocoPhillips, | | | | | | |
4.75%, 2/01/14 | | | 995 | | | 1,069,948 |
Devon OEI Operating, Inc., | | | | | | |
7.25%, 10/01/11 | | | 400 | | | 432,921 |
Enterprise Products Operating LLC: | | | | | | |
7.50%, 2/01/11 | | | 660 | | | 690,847 |
6.13%, 2/01/13 | | | 150 | | | 163,274 |
6.38%, 2/01/13 | | | 225 | | | 245,785 |
Rockies Express Pipeline LLC, | | | | | | |
6.25%, 7/15/13(a) | | | 535 | | | 582,126 |
See Notes to Financial Statements.
| | | | | | |
| | | BLACKROCK BOND ALLOCATION TARGET SHARES | | MARCH 31, 2010 | | 25 |
| | |
| Schedule of Investments (continued) | | Series S Portfolio |
| | (Percentages shown are based on Net Assets) |
| | | | | | |
| | | Par
(000) | | Value |
Corporate Bonds | | | | | | |
Oil, Gas & Consumable Fuels (concluded) | | | | | | |
Southeast Supply Header LLC, | | | | | | |
4.85%, 8/15/14(a) | | $ | 410 | | $ | 419,509 |
Statoil ASA: | | | | | | |
3.88%, 4/15/14 | | | 520 | | | 542,143 |
2.90%, 10/15/14 | | | 450 | | | 449,998 |
XTO Energy, Inc., | | | | | | |
7.50%, 4/15/12 | | | 325 | | | 364,111 |
| | | | | | |
| | | | | | 6,387,030 |
| | | | | | |
Pharmaceuticals — 1.4% | | | | | | |
Covidien International Finance SA, | | | | | | |
5.45%, 10/15/12 | | | 330 | | | 360,252 |
GlaxoSmithKline Capital, Inc., | | | | | | |
4.85%, 5/15/13 | | | 215 | | | 233,039 |
Novartis Capital Corp., | | | | | | |
4.13%, 2/10/14 | | | 850 | | | 899,987 |
Pfizer, Inc., | | | | | | |
4.45%, 3/15/12 | | | 445 | | | 471,696 |
| | | | | | |
| | | | | | 1,964,974 |
| | | | | | |
Real Estate Investment Trusts (REITs) — 0.3% | | | | | | |
AvalonBay Communities, Inc., | | | | | | |
6.13%, 11/01/12 | | | 132 | | | 142,950 |
WT Finance Australia Ltd./Westfield Capital/WEA Finance LLC, | | | | | | |
5.13%, 11/15/14(a) | | | 295 | | | 303,696 |
| | | | | | |
| | | | | | 446,646 |
| | | | | | |
Road & Rail — 1.8% | | | | | | |
Burlington Northern Santa Fe Corp.: | | | | | | |
5.90%, 7/01/12 | | | 375 | | | 407,275 |
4.30%, 7/01/13 | | | 205 | | | 215,473 |
CSX Corp., | | | | | | |
6.75%, 3/15/11 | | | 1,385 | | | 1,457,053 |
Union Pacific Corp., | | | | | | |
6.65%, 1/15/11 | | | 485 | | | 505,851 |
| | | | | | |
| | | | | | 2,585,652 |
| | | | | | |
Semiconductors & Semiconductor Equipment — 0.5% | | | | | | |
National Semiconductor Corp., | | | | | | |
6.15%, 6/15/12 | | | 690 | | | 746,157 |
| | | | | | |
Tobacco — 0.3% | | | | | | |
Altria Group, Inc., | | | | | | |
7.75%, 2/06/14 | | | 395 | | | 451,772 |
| | | | | | |
Wireless Telecommunication Services — 3.4% | | | | | | |
Cellco Partnership/Verizon Wireless Capital LLC, | | | | | | |
3.75%, 5/20/11(c) | | | 2,450 | | | 2,526,264 |
Crown Castle Towers LLC, | | | | | | |
4.52%, 1/15/15(a) | | | 670 | | | 679,056 |
Rogers Communications, Inc.: | | | | | | |
7.88%, 5/01/12 | | | 290 | | | 323,084 |
7.25%, 12/15/12 | | | 670 | | | 759,359 |
Vodafone Group Plc, | | | | | | |
5.00%, 12/16/13 | | | 500 | | | 539,629 |
| | | | | | |
| | | | | | 4,827,392 |
| | | | | | |
Total Corporate Bonds — 48.4% | | | | | | 69,140,943 |
| | | | | | |
Foreign Agency Obligations | | | | | | |
Achmea Hypotheekbank NV, | | | | | | |
3.20%, 11/03/14(a) | | | 350 | | | 354,463 |
Australia & New Zealand Banking Group Ltd., | | | | | | |
0.54%, 6/18/12(a)(b) | | | 800 | | | 797,905 |
CDP Financial, Inc., | | | | | | |
3.00%, 11/25/14(a) | | | 315 | | | 310,161 |
Danske Bank A/S, | | | | | | |
2.50%, 5/10/12(a) | | | 1,720 | | | 1,753,655 |
Dexia Credit Local: | | | | | | |
2.38%, 9/23/11(a) | | | 715 | | | 730,203 |
2.00%, 3/05/13(a) | | | 380 | | | 377,538 |
Eksportfinans ASA: | | | | | | |
5.00%, 2/14/12 | | | 300 | | | 320,143 |
3.00%, 11/17/14 | | | 460 | | | 461,767 |
FIH Erhvervsbank A/S: | | | | | | |
2.45%, 8/17/12(a) | | | 195 | | | 197,900 |
1.75%, 12/06/12(a) | | | 755 | | | 749,298 |
Kreditanstalt fuer Wiederaufbau, | | | | | | |
3.50%, 3/10/14 | | | 480 | | | 499,508 |
Landwirtschaftliche Rentenbank, | | | | | | |
4.13%, 7/15/13 | | | 500 | | | 532,213 |
LeasePlan Corp. NV, | | | | | | |
3.00%, 5/07/12(a) | | | 475 | | | 490,827 |
Macquarie Bank Ltd., | | | | | | |
4.10%, 12/17/13(a) | | | 1,300 | | | 1,382,497 |
| | | | | | |
Total Foreign Agency Obligations — 6.3% | | | | | | 8,958,078 |
| | | | | | |
Foreign Government Obligations | | | | | | |
Canada — 0.8% | | | | | | |
Province of Ontario Canada: | | | | | | |
0.70%, 5/22/12(b) | | | 560 | | | 564,470 |
4.10%, 6/16/14 | | | 600 | | | 640,974 |
| | | | | | |
Total Foreign Government Obligations — 0.8% | | | | | | 1,205,444 |
| | | | | | |
Non-Agency Mortgage-Backed Securities Collateralized Mortgage Obligations — 4.1% | | | | | | |
Arran Residential Mortgages Funding Plc: | | | | | | |
Series 2005-B, Class A1, 0.31%, 12/15/12(b) | | | 800 | | | 785,120 |
Series 2006-2A, Class A2B, 0.32%, 9/20/56(a)(b) | | | 386 | | | 381,227 |
Banc of America Funding Corp., Series 2004-C, Class 4A1, | | | | | | |
0.57%, 12/20/34(b) | | | 22 | | | 15,902 |
Banc of America Mortgage Securities, Series 04-A, Class 2A2, Series 2004-A, Class 2A2, | | | | | | |
3.52%, 2/25/34(b) | | | 236 | | | 203,069 |
Bear Stearns Adjustable Rate Mortgage Trust, Series 2004-7, Class 4A, | | | | | | |
3.82%, 10/25/34(b) | | | 293 | | | 224,668 |
Bear Stearns Alt-A Trust, Series 2004-13, Class A1, | | | | | | |
0.99%, 11/25/34(b) | | | 13 | | | 9,845 |
Countrywide Home Loan Mortgage Pass-Through Trust, Series 2004-HYB1, Class 2A, | | | | | | |
3.33%, 5/20/34(b) | | | 343 | | | 271,869 |
First Horizon Commercial Mortgage Trust, Series 2003-AR4, Class 2A1, | | | | | | |
2.92%, 12/25/33(b) | | | 108 | | | 101,692 |
First Horizon Mortgage Pass-Through Trust, Series 2004-AR6, Class 2A1, | | | | | | |
3.01%, 12/25/34(b) | | | 279 | | | 268,082 |
Structured Adjustable Rate Mortgage Loan Trust, Series 2004-6, Class 4A1, | | | | | | |
4.85%, 6/25/34(b) | | | 347 | | | 323,507 |
Thornburg Mortgage Securities Trust: | | | | | | |
Series 2006-5, Class A1, 0.37%, 8/25/11(b) | | | 1,304 | | | 1,272,624 |
Series 2006-6, Class A1, 0.36%, 11/25/11(b) | | | 819 | | | 798,794 |
Series 2007-2, Class A2A, 0.36%, 6/25/37(b) | | | 890 | | | 867,234 |
Wells Fargo Mortgage-Backed Securities Trust, Series 2005-AR2, Class 2A1, | | | | | | |
2.88%, 3/25/35(b) | | | 405 | | | 359,207 |
| | | | | | |
| | | | | | 5,882,840 |
| | | | | | |
See Notes to Financial Statements.
| | | | | | |
| 26 | | BLACKROCK BOND ALLOCATION TARGET SHARES | | MARCH 31, 2010 | | |
| | |
| Schedule of Investments (continued) | | Series S Portfolio |
| | (Percentages shown are based on Net Assets) |
| | | | | | |
| | | Par
(000) | | Value |
Non-Agency Mortgage-Backed Securities | | | | | | |
Commercial Mortgage-Backed Securities — 14.9% | | | | | | |
Banc of America Commercial Mortgage, Inc., Series 2002-PB2, Class A4, | | | | | | |
6.19%, 1/11/12 | | $ | 400 | | $ | 422,573 |
Bear Stearns Commercial Mortgage Securities: | | | | | | |
Series 2000-WF2, Class A2, 7.32%, 10/15/32(b) | | | 417 | | | 421,784 |
Series 2001-TOP2, Class A2, 6.48%, 2/15/35 | | | 1,639 | | | 1,687,900 |
Chase Commercial Mortgage Securities Corp., Series 2000-3, Class A2, | | | | | | |
7.32%, 9/15/10 | | | 715 | | | 723,910 |
Commercial Mortgage Asset Trust, Series 1999-C1, Class A3, | | | | | | |
6.64%, 1/17/32 | | | 49 | | | 48,894 |
Commercial Mortgage Pass-Through Certificates, Series 2001-J2A, Class A2, | | | | | | |
6.10%, 7/16/11(a) | | | 1,395 | | | 1,474,058 |
Credit Suisse First Boston Mortgage Securities Corp.: | | | | | | |
Series 2002-CKS4, Class A2, 5.18%, 8/15/12 | | | 880 | | | 925,037 |
Series 2002-CP3, Class A3, 5.60%, 7/15/35 | | | 250 | | | 264,696 |
DLJ Commercial Mortgage Corp., Series 2000-CKP1, Class A1B, | | | | | | |
7.18%, 11/10/33 | | | 299 | | | 301,604 |
FHLMC M/F Structured Pass-Through Certificates: | | | | | | |
Series K003, Class A1, 2.23%, 7/25/13 | | | 428 | | | 434,004 |
Series K003, Class A2, 3.61%, 6/25/14 | | | 420 | | | 435,869 |
First Union National Bank Commercial Mortgage: | | | | | | |
Series 2000-C2, Class A2, 7.20%, 9/15/10 | | | 690 | | | 698,096 |
Series 2001-C3, Class A3, 6.42%, 6/15/11 | | | 415 | | | 432,719 |
Series 2002-C1, Class A2, 6.14%, 1/12/12 | | | 670 | | | 704,882 |
GE Capital Commercial Mortgage Corp.: | | | | | | |
Series 2001-3, Class A2, 6.07%, 11/10/11 | | | 1,520 | | | 1,599,778 |
Series 2001-1, Class A2, 6.53%, 5/15/33 | | | 2,105 | | | 2,178,234 |
Series 2005-C1, Class A2, 4.35%, 6/10/48 | | | 508 | | | 513,808 |
GMAC Commercial Mortgage Securities, Inc.: | | | | | | |
Series 2000-C2, Class A2, 7.46%, 6/16/10(b) | | | 422 | | | 422,750 |
Series 2000-C3, Class A2, 6.96%, 11/15/10 | | | 700 | | | 713,707 |
Series 2003-C3, Class A3, 4.65%, 4/10/40 | | | 300 | | | 306,276 |
Greenwich Capital Commercial Funding Corp., Series 2002-C1, Class A2, | | | | | | |
4.11%, 3/11/12 | | | 143 | | | 146,322 |
JPMorgan Chase Commercial Mortgage Securities Corp.: | | | | | | |
Series 2001-CIB2, Class A2, 6.24%, 10/15/10 | | | 28 | | | 27,818 |
Series 2001-CIB2, Class A3, 6.43%, 6/15/11 | | | 1,050 | | | 1,091,855 |
Series 2001-CIB3, Class A3, 6.47%, 12/15/11 | | | 525 | | | 552,774 |
LB-UBS Commercial Mortgage Trust: | | | | | | |
Series 2000-C4, Class A2, 7.37%, 6/15/10 | | | 403 | | | 405,077 |
Series 2003-C7, Class A2, 4.06%, 8/15/10(b) | | | 380 | | | 381,097 |
Series 2001-WM, Class A1, 6.16%, 7/14/11(a) | | | 253 | | | 261,588 |
Series 2003-C7, Class A3, 4.56%, 7/15/12(b) | | | 295 | | | 299,930 |
Series 2005-C2, Class A2, 4.82%, 4/15/30 | | | 293 | | | 293,042 |
Series 2007-C2, Class A2, 5.30%, 2/15/40 | | | 800 | | | 820,813 |
Morgan Stanley Capital I, Series 2001-TOP3, Class A4, | | | | | | |
6.39%, 7/15/33 | | | 389 | | | 405,481 |
Salomon Brothers Mortgage Securities VII, Inc.: | | | | | | |
Series 2000-C3, Class A2, 6.59%, 11/18/10 | | | 422 | | | 425,633 |
Series 2002-KEY2, Class A2, 4.47%, 3/18/36 | | | 76 | | | 78,556 |
Wachovia Bank Commercial Mortgage Trust: | | | | | | |
Series 2005-C17, Class A2, 4.78%, 3/15/10 | | | 357 | | | 357,056 |
Series 2006-C23, Class APB, 5.45%, 1/15/45 | | | 550 | | | 571,569 |
Series 2006-C28, Class A2, 5.50%, 10/15/48 | | | 425 | | | 436,456 |
| | | | | | |
| | | | | | 21,265,646 |
| | | | | | |
Total Non-Agency Mortgage-Backed Securities — 19.0% | | | | | | 27,148,486 |
| | | | | | |
Taxable Municipal Bonds | | | | | | |
The Board of Trustees of The Leland Stanford Junior University, | | | | | | |
3.63%, 5/01/14 | | | 175 | | | 181,818 |
State of California Various Purposes GO, | | | | | | |
5.65%, 4/01/39 | | | 690 | | | 717,276 |
| | | | | | |
Total Taxable Municipal Bonds — 0.6% | | | | | | 899,094 |
| | | | | | |
U.S. Government Sponsored Agency Securities | | | | | | |
Collateralized Mortgage Obligations — 2.4% | | | | | | |
Fannie Mae: | | | | | | |
Series 2006-54, Class OA, 6.00%, 3/25/27 | | | 251 | | | 257,491 |
Series 2005-57, Class PA, 5.50%, 5/25/27 | | | 75 | | | 75,307 |
Series 2006-99, Class PA, 5.50%, 5/25/30 | | | 798 | | | 835,737 |
Freddie Mac: | | | | | | |
Series 3128, Class BA, 5.00%, 1/15/24 | | | 191 | | | 194,245 |
Series 3165, Class NA, 5.50%, 2/15/26-5/15/26 | | | 1,452 | | | 1,485,530 |
Series 3162, Class 0A, 6.00%, 10/15/26 | | | 229 | | | 234,433 |
Series 3186, Class NA, 6.00%, 7/15/27 | | | 318 | | | 322,030 |
| | | | | | |
| | | | | | 3,404,773 |
| | | | | | |
Mortgage-Backed Securities — 2.9% | | | | | | |
Fannie Mae Mortgage-Backed Securities: | | | | | | |
5.50%, 12/01/18-10/01/24(c) | | | 2,484 | | | 2,669,898 |
4.87%, 6/01/35(b) | | | 134 | | | 138,307 |
3.56%, 7/01/35(b) | | | 390 | | | 405,248 |
5.09%, 8/01/35(b) | | | 396 | | | 412,909 |
5.34%, 10/01/35(b) | | | 381 | | | 403,533 |
Freddie Mac Mortgage-Backed Securities: | | | | | | |
4.38%, 6/01/33(b) | | | 159 | | | 164,197 |
3.72%, 7/01/34(b) | | | 26 | | | 26,540 |
| | | | | | |
| | | | | | 4,220,632 |
| | | | | | |
Total U.S. Government Sponsored Agency Securities — 5.3% | | | | | | 7,625,405 |
| | | | | | |
Total Long-Term Investments
(Cost — $145,206,927) — 103.3% | | | | | | 147,674,977 |
| | | | | | |
See Notes to Financial Statements.
| | | | | | |
| | | BLACKROCK BOND ALLOCATION TARGET SHARES | | MARCH 31, 2010 | | 27 |
| | |
| Schedule of Investments (continued) | | Series S portfolio |
| | (Percentages shown are based on Net Assets) |
| | | | | | | |
| | | Shares | | | Value | |
Short-Term Securities | | | | | | | |
Dreyfus Treasury Prime, 0.00%(d) | | 3,333,818 | | | $ | 3,333,818 | |
| | | | | | | |
Total Short-Term Securities
(Cost — $3,333,818) — 2.3% | | | | | | 3,333,818 | |
| | | | | | | |
| | |
| | | Contracts | | | | |
Options Purchased | | | | | | | |
Exchange-Traded Put Options Purchased 3-month Euro-Dollar Futures, Strike Price USD 98.75, Expires 9/13/10 | | | | | | | |
(Cost — $68,777) — 0.0% | | 62 | | | | 2,712 | |
| | | | | | | |
Total Investments Before Outstanding Options Written | | | | | | | |
(Cost — $148,609,522*) — 105.6% | | | | | | 151,011,507 | |
| | | | | | | |
| | |
| | | Contracts | | | | |
Options Written | | | | | | | |
Exchange-Traded Put Options Written 3-month Euro-Dollar Futures, Strike Price USD 98.25, Expires 9/13/10 | | 62 | | | | (1,163 | ) |
| | | | | | | |
Over-the-Counter Put Swaptions Written | | | | | | | |
Receive a fixed rate of 2.750% and pay a floating rate based on 3-month LIBOR, Expires 5/24/10, Broker, Barclays Bank Plc | | 330 | (e) | | | (63 | ) |
| | | | | | | |
Total Options Written | | | | | | | |
(Premiums Received — $ 67,035) — (0.0)% | | | | | | (1,226 | ) |
| | | | | | | |
Total Investments Net of Outstanding Options Written — 105.6% | | | | | | 151,010,281 | |
Liabilities in Excess of Other Assets — (5.6)% | | | | | | (8,026,237 | ) |
| | | | | | | |
Net Assets — 100.0% | | | | | $ | 142,984,044 | |
| | | | | | | |
| * | The cost and unrealized appreciation (depreciation) of investments as of March 31, 2010, as computed for federal income tax purposes, were as follows: |
| | | | |
Aggregate cost | | $ | 148,609,522 | |
Gross unrealized appreciation | | $ | 2,828,840 | |
Gross unrealized depreciation | | | (426,855 | ) |
Net unrealized appreciation | | $ | 2,401,985 | |
| (a) | Security exempt from registration under Rule 144A of the Securities Act of 1933. These securities may be resold in transactions exempt from registration to qualified institutional investors. |
| (b) | Variable rate security. Rate shown is as of report date. |
| (c) | All or a portion of security pledged as collateral for reverse repurchase agreements. |
| (d) | Represents the current yield as of report date. |
| (e) | One contract represents a notional amount of $10,000. |
| • | | Investments in companies considered to be an affiliate of the Fund for purposes of Section 2(a)(3) of the Investment Company Act of 1940, were as follows: |
| | | | | | | |
Affiliate | | Net Activity | | | Income |
BlackRock Liquidity Funds, TempFund Institutional Class | | $ | (16,211,611 | ) | | $ | — |
| • | | Reverse repurchase agreements outstanding as of March 31, 2010 were as follows: |
| | | | | | | | | | | | | |
Counterparty | | Interest
Rate | | | Settlement
Date | | Maturity
Date | | Net Closing
Amount | | Par |
Credit Suisse International | | 0.20 | % | | 3/08/10 | | 4/13/10 | | $ | 1,646,329 | | $ | 1,646,000 |
Credit Suisse International | | 0.40 | % | | 3/10/10 | | Open | | $ | 2,426,985 | | | 2,426,419 |
JPMorgan Chase Bank, N.A. | | 0.21 | % | | 3/12/10 | | 4/13/10 | | $ | 932,174 | | | 932,000 |
Credit Suisse International | | 0.40 | % | | 3/16/10 | | Open | | $ | 1,834,637 | | | 1,834,331 |
| | | | | | | | | | | | | |
Total | | | | | | | | | | | | $ | 6,838,750 |
| | | | | | | | | | | | | |
| • | | Financial futures contracts purchased as of March 31, 2010 were as follows: |
| | | | | | | | | | | |
Contracts | | Issue | | Expiration
Date | | Notional
Value | | Unrealized
Depreciation | |
| 235 | | U.S. Treasury Notes (2 Year) | | June 2010 | | $ | 50,983,984 | | $ | (4,952 | ) |
| 42 | | U.S. Treasury Notes (5 Year) | | June 2010 | | $ | 4,823,438 | | | (31,041 | ) |
| | | | | | | | | | | |
Total | | | | | | | | | $ | (35,993 | ) |
| | | | | | | | | | | |
| • | | Financial futures contracts sold as of March 31, 2010 were as follows: |
| | | | | | | | | | |
Contracts | | Issue | | Expiration
Date | | Notional
Value | | Unrealized
Appreciation |
| 14 | | U.S. Treasury Bonds (20 Year) | | June 2010 | | $ | 1,625,750 | | $ | 1,781 |
| | | | | | | | | | |
| • | | Interest rate swaps outstanding as of March 31, 2010 were as follows: |
| | | | | | | | | | | | |
Fixed Rate | | Floating Rate | | Counterparty | | Expiration | | Notional
Amount
(000) | | Unrealized
Appreciation
(Depreciation) | |
0.80%(a) | | 3-month LIBOR | | JPMorgan Chase Bank, N.A. | | March 2011 | | USD 6,100 | | $ | 12,014 | |
1.13%(b) | | 3-month LIBOR | | Deutsche Bank AG | | January 2012 | | USD 7,900 | | | (24,391 | ) |
1.09%(b) | | 3-month LIBOR | | Barclays Bank, Plc | | March 2012 | | USD 9,900 | | | 8,676 | |
| | | | | | | | | | | | |
Total | | | | | | | | | | $ | (3,701 | ) |
| | | | | | | | | | | | |
| (a) | Fund pays floating interest rate and receives fixed rate. |
| (b) | Fund pays fixed interest rate and receives floating rate. |
See Notes to Financial Statements.
| | | | | | |
| 28 | | BLACKROCK BOND ALLOCATION TARGET SHARES | | MARCH 31, 2010 | | |
| | |
| Schedule of Investments (concluded) | | Series S Portfolio |
| | |
| • | | Credit default swaps on single-name issues - buy protection outstanding as of March 31, 2010 were as follows: |
| | | | | | | | | | | | |
Issuer | | Pay
Fixed
Rate | | Counterparty | | Expiration | | Notional
Amount
(000) | | Unrealized
Depreciation | |
| HJ Heinz Co. | | 1.00% | | Credit Suisse International | | December
2014 | | USD 600 | | $ | (970 | ) |
| Hershey Foods Co. | | 1.00% | | Goldman Sachs Bank USA | | December
2014 | | USD 600 | | | (7,326 | ) |
| | | | | | | | | | | | |
Total | | | | | | | | | | $ | (8,296 | ) |
| | | | | | | | | | | | |
| • | | For Fund compliance purposes, the Fund’s industry classifications refer to any one or more of the industry sub-classifications used by one or more widely recognized market indexes or ratings group indexes, and/or as defined by Fund management. This definition may not apply for purposes of this report, which may combine industry sub-classifications for reporting ease. |
| • | | Fair Value Measurements - Various inputs are used in determining the fair value of investments, which are as follows: |
| | • | | Level 1 – price quotations in active markets/exchanges for identical assets and liabilities |
| | • | | Level 2 – other observable inputs (including, but not limited to: quoted prices for similar assets or liabilities in markets that are active, quoted prices for identical or similar assets or liabilities in markets that are not active, inputs other than quoted prices that are observable for the assets or liabilities (such as interest rates, yield curves, volatilities, prepayment speeds, loss severities, credit risks and default rates) or other market–corroborated inputs) |
| | • | | Level 3 – unobservable inputs based on the best information available in the circumstances, to the extent observable inputs are not available (including the Fund’s own assumptions used in determining the fair value of investments) |
The inputs or methodologies used for valuing securities are not necessarily an indication of the risk associated with investing in those securities. For information about the Fund’s policy regarding valuation of investments and other significant accounting policies, please refer to Note 1 of the Notes to Financial Statements.
The following tables summarize the inputs used as of March 31, 2010 in determining the fair valuation of the Fund’s investments:
| | | | | | | | | | | | |
| | | Investments in Securities |
Valuation Inputs | | Level 1 | | Level 2 | | Level 3 | | Total |
Assets: | | | | | | | | | | | | |
Asset-Backed Securities | | | — | | $ | 31,200,028 | | $ | 1,497,499 | | $ | 32,697,527 |
Corporate Bonds | | | — | | | 69,140,943 | | | — | | | 69,140,943 |
Foreign Agency Obligations | | | — | | | 8,958,078 | | | — | | | 8,958,078 |
Foreign Government | | | | | | | | | | | | |
Obligations | | | — | | | 1,205,444 | | | — | | | 1,205,444 |
Non-Agency Mortgage-Backed | | | | | | | | | | | | |
Securities | | | — | | | 27,148,486 | | | — | | | 27,148,486 |
Taxable Municipal Bonds | | | — | | | 899,094 | | | — | | | 899,094 |
U.S. Government Sponsored Agency Securities | | | — | | $ | 7,625,405 | | | — | | $ | 7,625,405 |
Short-Term Securities | | $ | 3,333,818 | | | — | | | — | | | 3,333,818 |
| | | | | | | | | | | | |
Total | | $ | 3,333,818 | | $ | 146,177,478 | | $ | 1,497,499 | | $ | 151,008,795 |
| | | | | | | | | | | | |
| | | | | | | | | | | | | | |
| | | Other Financial Instruments1 | |
Valuation Inputs | | Level 1 | | | Level 2 | | | Level 3 | | Total | |
Assets | | $ | 4,493 | | | $ | 20,690 | | | — | | $ | 25,183 | |
Liabilities | | | (37,156 | ) | | | (32,750 | ) | | — | | | (69,906 | ) |
| | | | | | | | | | | | | | |
Total | | $ | (32,663 | ) | | $ | (12,060 | ) | | — | | $ | (44,723 | ) |
| | | | | | | | | | | | | | |
| 1 | Other financial instruments are financial futures contracts, swaps and options. Financial futures contracts and swaps are shown at the unrealized appreciation/depreciation on the instrument and options are shown at value. |
The following table is a reconciliation of level 3 investments for which significant unobservable inputs were used to determine fair value:
| | | | |
| | | Investments
in Securities
Asset-Backed
Securities | |
Balance, as of March 31, 2009 | | | — | |
Accrued discounts/premiums | | $ | 1,280 | |
Realized gain | | | — | |
Change in unrealized appreciation/depreciation2 | | | (292 | ) |
Net purchases | | | 1,496,511 | |
Net transfers in/out of Level 3 | | | — | |
| | | | |
Balance, as of March 31, 2010 | | $ | 1,497,499 | |
| | | | |
| 2 | Included in the related net change in unrealized appreciation/depreciation in the Statement of Operations. The change in unrealized appreciation/depreciation on securities still held at March 31, 2010 was $(292). |
See Notes to Financial Statements.
| | | | | | |
| | | BLACKROCK BOND ALLOCATION TARGET SHARES | | MARCH 31, 2010 | | 29 |
Statements of Assets and Liabilities
| | | | | | | | | | | | | | | | |
March 31, 2010 | | Series C
Portfolio | | | Series M
Portfolio | | | Series N
Portfolio | | | Series S
Portfolio | |
Assets | | | | | | | | | | | | | | | | |
Investments at value1 | | $ | 365,321,120 | | | $ | 413,984,635 | | | $ | 10,172,524 | | | $ | 151,011,507 | |
Cash pledged as collateral in connection with financial futures contracts | | | 698,000 | | | | — | | | | 9,000 | | | | 238,000 | |
Interest receivable | | | 5,191,137 | | | | 1,605,178 | | | | 188,118 | | | | 1,117,707 | |
Capital shares sold receivable | | | 1,177,539 | | | | 1,173,779 | | | | — | | | | 1,259,551 | |
Receivable from advisor | | | 42,213 | | | | 37,815 | | | | 14,599 | | | | 22,313 | |
Margin variation receivable | | | — | | | | 208,607 | | | | — | | | | 40,952 | |
Investments sold receivable | | | — | | | | — | | | | 230,617 | | | | 424,881 | |
Principal paydown receivable | | | — | | | | 284,416 | | | | — | | | | 387 | |
Dividends receivable | | | — | | | | — | | | | 20 | | | | — | |
Unrealized appreciation on swaps | | | — | | | | — | | | | — | | | | 20,690 | |
Prepaid expenses | | | 28,205 | | | | 29,215 | | | | 12,443 | | | | 14,582 | |
| | | | | | | | | | | | | | | | |
Total assets | | | 372,458,214 | | | | 417,323,645 | | | | 10,627,321 | | | | 154,150,570 | |
| | | | | | | | | | | | | | | | |
Accrued Liabilities | | | | | | | | | | | | | | | | |
Investments purchased payable | | | 2,754,958 | | | | 53,939,521 | | | | — | | | | — | |
Income dividends payable | | | 1,713,501 | | | | 1,152,309 | | | | 53,077 | | | | 415,507 | |
Reverse repurchase agreements payable | | | 1,696,969 | | | | — | | | | — | | | | 6,838,750 | |
Capital shares redeemed payable | | | 1,281,692 | | | | 1,217,182 | | | | — | | | | 3,794,715 | |
Margin variation payable | | | 109,115 | | | | — | | | | — | | | | — | |
Professional fees payable | | | 51,246 | | | | 51,473 | | | | 43,032 | | | | 41,019 | |
Other affiliates payable | | | 46,496 | | | | 44,575 | | | | 5,412 | | | | 17,038 | |
Officer’s and Trustees’ fees payable | | | 7,200 | | | | 7,129 | | | | 1,963 | | | | 6,031 | |
Interest expense and fees payable | | | — | | | | — | | | | 689 | | | | 1,247 | |
Swap premiums received | | | — | | | | — | | | | — | | | | 8,023 | |
Options written at value2 | | | — | | | | — | | | | — | | | | 1,226 | |
Unrealized depreciation on swaps | | | — | | | | — | | | | — | | | | 32,687 | |
Other accrued expenses payable | | | 6,654 | | | | 7,985 | | | | 385 | | | | 10,283 | |
| | | | | | | | | | | | | | | | |
Total accrued liabilities | | | 7,667,831 | | | | 56,420,174 | | | | 104,558 | | | | 11,166,526 | |
| | | | | | | | | | | | | | | | |
Other Liabilities | | | | | | | | | | | | | | | | |
Trust certificates3 | | | — | | | | — | | | | 200,000 | | | | — | |
| | | | | | | | | | | | | | | | |
Total Liabilities | | | 7,667,831 | | | | 56,420,174 | | | | 304,558 | | | | 11,166,526 | |
| | | | | | | | | | | | | | | | |
Net Assets | | $ | 364,790,383 | | | $ | 360,903,471 | | | $ | 10,322,763 | | | $ | 142,984,044 | |
| | | | | | | | | | | | | | | | |
Net Assets Consist of | | | | | | | | | | | | | | | | |
Paid-in capital | | $ | 373,988,969 | | | $ | 385,687,364 | | | $ | 10,199,786 | | | $ | 138,896,184 | |
Undistributed (distributions in excess of) net investment income | | | (157,187 | ) | | | 49,435 | | | | 31,967 | | | | (22,726 | ) |
Accumulated net realized gain (loss) | | | (26,566,820 | ) | | | (27,474,811 | ) | | | (275,440 | ) | | | 1,689,001 | |
Net unrealized appreciation/depreciation | | | 17,525,421 | | | | 2,641,483 | | | | 366,450 | | | | 2,421,585 | |
| | | | | | | | | | | | | | | | |
Net Assets | | $ | 364,790,383 | | | $ | 360,903,471 | | | $ | 10,322,763 | | | $ | 142,984,044 | |
| | | | | | | | | | | | | | | | |
Net Asset Value | | | | | | | | | | | | | | | | |
Shares outstanding4 | | | 37,172,490 | | | | 39,181,761 | | | | 1,019,820 | | | | 14,102,119 | |
| | | | | | | | | | | | | | | | |
Net asset value | | $ | 9.81 | | | $ | 9.21 | | | $ | 10.12 | | | $ | 10.14 | |
| | | | | | | | | | | | | | | | |
| | $ | 347,758,881 | | | $ | 411,086,259 | | | $ | 9,806,074 | | | $ | 148,609,522 | |
| | | — | | | | — | | | | — | | | $ | 67,035 | |
| 3 | Represents short-term floating rate certificates issued by tender option bond trusts. |
| 4 | Unlimited number of shares authorized, $0.001 par value. |
See Notes to Financial Statements.
| | | | | | |
| 30 | | BLACKROCK BOND ALLOCATION TARGET SHARES | | MARCH 31, 2010 | | |
Statements of Operations
| | | | | | | | | | | | | | | | |
Year Ended March 31, 2010 | | Series C Portfolio | | | Series M Portfolio | | | Series N Portfolio | | | Series S Portfolio | |
Investment Income | | | | | | | | | | | | | | | | |
Interest | | $ | 20,665,120 | | | $ | 15,161,661 | | | $ | 587,976 | | | $ | 4,218,894 | |
Dividends – affiliated | | | 1,710 | | | | 32,398 | | | | — | | | | — | |
Dividends | | | — | | | | — | | | | 314 | | | | — | |
| | | | | | | | | | | | | | | | |
Total income | | | 20,666,830 | | | | 15,194,059 | | | | 588,290 | | | | 4,218,894 | |
| | | | | | | | | | | | | | | | |
Expenses | | | | | | | | | | | | | | | | |
Transfer agent | | | 196,126 | | | | 196,038 | | | | 15,088 | | | | 23,761 | |
Professional | | | 92,258 | | | | 89,628 | | | | 61,201 | | | | 55,247 | |
Administration | | | 77,408 | | | | 60,739 | | | | 21,551 | | | | 56,433 | |
Registration | | | 38,503 | | | | 40,040 | | | | 21,192 | | | | 23,811 | |
Custodian | | | 27,158 | | | | 27,219 | | | | 3,065 | | | | 19,746 | |
Officer and Trustees | | | 23,828 | | | | 23,622 | | | | 5,279 | | | | 18,448 | |
Printing | | | 21,047 | | | | 20,648 | | | | 1,830 | | | | — | |
Miscellaneous | | | 16,093 | | | | 18,929 | | | | 2,909 | | | | 6,488 | |
| | | | | | | | | | | | | | | | |
Total expenses excluding interest expense and fees | | | 492,421 | | | | 476,863 | | | | 132,115 | | | | 203,934 | |
Interest expense and fees | | | 3,097 | | | | — | | | | 717 | 1 | | | 12,791 | |
| | | | | | | | | | | | | | | | |
Total expenses | | | 495,518 | | | | 476,863 | | | | 132,832 | | | | 216,725 | |
Less expenses reimbursed by advisor | | | (492,421 | ) | | | (476,863 | ) | | | (132,115 | ) | | | (203,934 | ) |
| | | | | | | | | | | | | | | | |
Total expenses after fees reimbursed | | | 3,097 | | | | — | | | | 717 | | | | 12,791 | |
| | | | | | | | | | | | | | | | |
Net investment income | | | 20,663,733 | | | | 15,194,059 | | | | 587,573 | | | | 4,206,103 | |
| | | | | | | | | | | | | | | | |
Realized and Unrealized Gain (Loss) | | | | | | | | | | | | | | | | |
Net realized gain (loss) from: | | | | | | | | | | | | | | | | |
Investments | | | 7,663,602 | | | | (11,347,788 | ) | | | (134,466 | ) | | | 1,216,425 | |
Options written | | | — | | | | — | | | | — | | | | 286,554 | |
Financial futures contracts | | | (2,868,972 | ) | | | 463,680 | | | | 7,992 | | | | 856,466 | |
Swaps | | | — | | | | — | | | | — | | | | 175,954 | |
| | | | | | | | | | | | | | | | |
| | | 4,794,630 | | | | (10,884,108 | ) | | | (126,474 | ) | | | 2,535,399 | |
| | | | | | | | | | | | | | | | |
Net change in unrealized appreciation/depreciation on: | | | | | | | | | | | | | | | | |
Investments | | | 38,629,597 | | | | 37,432,607 | | | | 1,376,660 | | | | 2,919,567 | |
Options written | | | — | | | | — | | | | — | | | | 52,357 | |
Financial futures contracts | | | (1,095,850 | ) | | | (4,420,314 | ) | | | — | | | | (390,751 | ) |
Swaps | | | — | | | | — | | | | — | | | | (11,997 | ) |
| | | | | | | | | | | | | | | | |
| | | 37,533,747 | | | | 33,012,293 | | | | 1,376,660 | | | | 2,569,176 | |
| | | | | | | | | | | | | | | | |
Total realized and unrealized gain | | | 42,328,377 | | | | 22,128,185 | | | | 1,250,186 | | | | 5,104,575 | |
| | | | | | | | | | | | | | | | |
Net Increase in Net Assets Resulting from Operations | | $ | 62,992,110 | | | $ | 37,322,244 | | | $ | 1,837,759 | | | $ | 9,310,678 | |
| | | | | | | | | | | | | | | | |
| 1 | Related to tender option bond trusts. Includes interest expense and fees incurred. |
See Notes to Financial Statements.
| | | | | | |
| | | BLACKROCK BOND ALLOCATION TARGET SHARES | | MARCH 31, 2010 | | 31 |
Statements of Changes in Net Assets
| | | | | | | | | | | | | | | | | | | | | | | | |
| | | Series C Portfolio | | | Series M Portfolio | |
Increase (Decrease) in Net Assets: | | Year Ended
March 31, 2010 | | | Period
October 1, 2008
to March 31,
2009 | | | Year Ended
September 30,
2008 | | | Year Ended
March 31, 2010 | | | Period
October 1, 2008
to March 31,
2009 | | | Year Ended
September 30,
2008 | |
Operations | | | | | | | | | | | | | | | | | | | | | | | | |
Net investment income | | $ | 20,663,733 | | | $ | 10,772,288 | | | $ | 27,241,023 | | | $ | 15,194,059 | | | $ | 10,663,179 | | | $ | 24,521,655 | |
Net realized gain (loss) | | | 4,794,630 | | | | (22,724,213 | ) | | | (8,086,624 | ) | | | (10,884,108 | ) | | | (14,954,435 | ) | | | 6,369,296 | |
Net change in unrealized appreciation/depreciation | | | 37,533,747 | | | | 33,287,398 | | | | (51,513,209 | ) | | | 33,012,293 | | | | (7,640,846 | ) | | | (23,810,401 | ) |
| | | | | | | | | | | | | | | | | | | | | | | | |
Net increase (decrease) in net assets resulting from operations | | | 62,992,110 | | | | 21,335,473 | | | | (32,358,810 | ) | | | 37,322,244 | | | | (11,932,102 | ) | | | 7,080,550 | |
| | | | | | | | | | | | | | | | | | | | | | | | |
Dividends and Distributions to Shareholders From | | | | | | | | | | | | | | | | | | | | | | | | |
Net investment income | | | (20,663,733 | ) | | | (10,772,288 | ) | | | (27,398,793 | ) | | | (15,669,386 | ) | | | (10,793,758 | ) | | | (24,742,027 | ) |
Net realized gain | | | — | | | | — | | | | — | | | | — | | | | (6,073,705 | ) | | | — | |
| | | | | | | | | | | | | | | | | | | | | | | | |
Decrease in net assets resulting from dividends and distributions to shareholders | | | (20,663,733 | ) | | | (10,772,288 | ) | | | (27,398,793 | ) | | | (15,669,386 | ) | | | (16,867,463 | ) | | | (24,742,027 | ) |
| | | | | | | | | | | | | | | | | | | | | | | | |
Capital Share Transactions | | | | | | | | | | | | | | | | | | | | | | | | |
Shares sold | | | 85,755,081 | | | | 68,969,940 | | | | 111,344,919 | | | | 95,656,405 | | | | 75,581,127 | | | | 105,312,211 | |
Shares issued in reinvestment of dividends and distributions | | | 1,023,024 | | | | 172,677 | | | | 79,033 | | | | 801,497 | | | | 283,339 | | | | 70,970 | |
Shares redeemed | | | (117,246,227 | ) | | | (107,481,234 | ) | | | (146,685,048 | ) | | | (106,428,771 | ) | | | (112,133,836 | ) | | | (155,856,891 | ) |
| | | | | | | | | | | | | | | | | | | | | | | | |
Net increase (decrease) in net assets derived from capital share transactions | | | (30,468,122 | ) | | | (38,338,617 | ) | | | (35,261,096 | ) | | | (9,970,869 | ) | | | (36,269,370 | ) | | | (50,473,710 | ) |
| | | | | | | | | | | | | | | | | | | | | | | | |
Net Assets | | | | | | | | | | | | | | | | | | | | | | | | |
Total increase (decrease) in net assets | | | 11,860,255 | | | | (27,775,432 | ) | | | (95,018,699 | ) | | | 11,681,989 | | | | (65,068,935 | ) | | | (68,135,187 | ) |
Beginning of period | | | 352,930,128 | | | | 380,705,560 | | | | 475,724,259 | | | | 349,221,482 | | | | 414,290,417 | | | | 482,425,604 | |
| | | | | | | | | | | | | | | | | | | | | | | | |
End of period | | $ | 364,790,383 | | | $ | 352,930,128 | | | $ | 380,705,560 | | | $ | 360,903,471 | | | $ | 349,221,482 | | | $ | 414,290,417 | |
| | | | | | | | | | | | | | | | | | | | | | | | |
Undistributed (distributions in excess of) net investment income | | $ | (157,187 | ) | | $ | (157,187 | ) | | $ | (157,187 | ) | | $ | 49,435 | | | $ | 48,620 | | | $ | — | |
| | | | | | | | | | | | | | | | | | | | | | | | |
See Notes to Financial Statements.
| | | | | | |
| 32 | | BLACKROCK BOND ALLOCATION TARGET SHARES | | MARCH 31, 2010 | | |
| | | | | | | | | | | | | | | | | |
| Series N Portfolio | | | Series S Portfolio | |
| Year Ended March 31, | | | Year Ended
March 31, 2010 | | | Period
October 1, 2008
to March 31,
2009 | | | Year Ended
September 30,
2008 | |
| 2010 | | 2009 | | | | |
| | | | | | | | | | | | | | | | | |
| $ | 587,573 | | $ | 518,508 | | | $ | 4,206,103 | | | $ | 912,529 | | | $ | 1,971,325 | |
| | (126,474) | | | (149,842 | ) | | | 2,535,399 | | | | 613,899 | | | | 198,924 | |
| | 1,376,660 | | | (1,010,210 | ) | | | 2,569,176 | | | | 186,151 | | | | (352,998 | ) |
| | | | | | | | | | | | | | | | | | |
| | 1,837,759 | | | (641,544 | ) | | | 9,310,678 | | | | 1,712,579 | | | | 1,817,251 | |
| | | | | | | | | | | | | | | | | | |
| | | | | | | | | | | | | | | | | |
| | (564,744) | | | (508,494 | ) | | | (4,372,743 | ) | | | (945,655 | ) | | | (1,987,779 | ) |
| | — | | | — | | | | (538,990 | ) | | | (638,290 | ) | | | — | |
| | | | | | | | | | | | | | | | | | |
| | (564,744) | | | (508,494 | ) | | | (4,911,733 | ) | | | (1,583,945 | ) | | | (1,987,779 | ) |
| | | | | | | | | | | | | | | | | | |
| | | | | | | | | | | | | | | | | |
| | — | | | 10,199,786 | | | | 97,047,559 | | | | 46,994,483 | | | | 33,491,857 | |
| | — | | | — | | | | 272,057 | | | | 34,717 | | | | 30,992 | |
| | — | | | — | | | | (45,843,071 | ) | | | (19,892,297 | ) | | | (17,029,893 | ) |
| | | | | | | | | | | | | | | | | | |
| | — | | | 10,199,786 | | | | 51,476,545 | | | | 27,136,903 | | | | 16,492,956 | |
| | | | | | | | | | | | | | | | | | |
| | | | | | | | | | | | | | | | | |
| | 1,273,015 | | | 9,049,748 | | | | 55,875,490 | | | | 27,265,537 | | | | 16,322,428 | |
| | 9,049,748 | | | — | | | | 87,108,554 | | | | 59,843,017 | | | | 43,520,589 | |
| | | | | | | | | | | | | | | | | | |
| $ | 10,322,763 | | $ | 9,049,748 | | | $ | 142,984,044 | | | $ | 87,108,554 | | | $ | 59,843,017 | |
| | | | | | | | | | | | | | | | | | |
| $ | 31,967 | | $ | 9,901 | | | $ | (22,726 | ) | | $ | 14,216 | | | $ | 84 | |
| | | | | | | | | | | | | | | | | | |
See Notes to Financial Statements.
| | | | | | |
| | | BLACKROCK BOND ALLOCATION TARGET SHARES | | MARCH 31, 2010 | | 33 |
Financial Highlights
| | | | | | | | | | | | | | | | | | | | | | | | |
| | | Series C Portfolio | |
| | | Year Ended March 31, | | | Period
October 1,
2008 to
March 31,
2009 | | | | |
| | | | | Year Ended September 30, | |
| | | 2010 | | | | 2008 | | | 2007 | | | 2006 | | | 20051 | |
Per Share Operating Performance | | | | | | | | | | | | | | | | | | | | | | | | |
Net asset value, beginning of period | | $ | 8.74 | | | $ | 8.48 | | | $ | 9.79 | | | $ | 9.79 | | | $ | 9.92 | | | $ | 10.00 | |
| | | | | | | | | | | | | | | | | | | | | | | | |
Net investment income2 | | | 0.53 | | | | 0.26 | | | | 0.58 | | | | 0.51 | | | | 0.47 | | | | 0.41 | |
Net realized and unrealized gain (loss) | | | 1.07 | | | | 0.26 | | | | (1.31 | ) | | | — | | | | (0.14 | ) | | | (0.08 | ) |
| | | | | | | | | | | | | | | | | | | | | | | | |
Net increase (decrease) from investment operations | | | 1.60 | | | | 0.52 | | | | (0.73 | ) | | | 0.51 | | | | 0.33 | | | | 0.33 | |
| | | | | | | | | | | | | | | | | | | | | | | | |
Dividends from net investment income | | | (0.53 | ) | | | (0.26 | ) | | | (0.58 | ) | | | (0.51 | ) | | | (0.46 | ) | | | (0.41 | ) |
| | | | | | | | | | | | | | | | | | | | | | | | |
Net asset value, end of period | | $ | 9.81 | | | $ | 8.74 | | | $ | 8.48 | | | $ | 9.79 | | | $ | 9.79 | | | $ | 9.92 | |
| | | | | | | | | | | | | | | | | | | | | | | | |
Total Investment Return3 | | | | | | | | | | | | | | | | | | | | | | | | |
Based on net asset value | | | 18.68 | % | | | 6.17 | %4 | | | (8.02 | )% | | | 5.37 | % | | | 3.51 | % | | | 3.34 | % |
| | | | | | | | | | | | | | | | | | | | | | | | |
Ratios to Average Net Assets | | | | | | | | | | | | | | | | | | | | | | | | |
Total expenses | | | 0.14 | % | | | 0.25 | %5 | | | 0.67 | % | | | 0.39 | % | | | 1.60 | % | | | 3.02 | % |
| | | | | | | | | | | | | | | | | | | | | | | | |
Total expenses after fees reimbursed | | | 0.00 | % | | | 0.09 | %5 | | | 0.55 | % | | | 0.19 | % | | | 0.00 | % | | | 0.00 | % |
| | | | | | | | | | | | | | | | | | | | | | | | |
Total expenses after fees reimbursed and excluding interest expense | | | 0.00 | % | | | 0.00 | %5 | | | 0.00 | % | | | 0.00 | % | | | 0.00 | % | | | 0.00 | % |
| | | | | | | | | | | | | | | | | | | | | | | | |
Net investment income | | | 5.64 | % | | | 5.96 | %5 | | | 5.96 | % | | | 5.31 | % | | | 4.81 | % | | | 4.12 | % |
| | | | | | | | | | | | | | | | | | | | | | | | |
Supplemental Data | | | | | | | | | | | | | | | | | | | | | | | | |
Net assets, end of period (000) | | $ | 364,790 | | | $ | 352,930 | | | $ | 380,706 | | | $ | 475,724 | | | $ | 13,365 | | | $ | 9,917 | |
| | | | | | | | | | | | | | | | | | | | | | | | |
Portfolio turnover | | | 51 | % | | | 16 | % | | | 51 | % | | | 70 | % | | | 42 | % | | | 50 | % |
| | | | | | | | | | | | | | | | | | | | | | | | |
| 1 | Commencement of operations was October 1, 2004. |
| 2 | Based on average shares outstanding. |
| 3 | Where applicable, total investment returns include the reinvestments of dividends and distributions. |
| 4 | Aggregate total investment return. |
See Notes to Financial Statements.
| | | | | | |
| 34 | | BLACKROCK BOND ALLOCATION TARGET SHARES | | MARCH 31, 2010 | | |
Financial Highlights
| | | | | | | | | | | | | | | | | | | | | | | | |
| | | Series M Portfolio | |
| | | Year Ended March 31, | | | Period
October 1,
2008 to
March 31,
2009 | | | Year Ended September 30, | |
| | | 2010 | | | | 2008 | | | 2007 | | | 2006 | | | 20051 | |
Per Share Operating Performance | | | | | | | | | | | | | | | | | | | | | | | | |
Net asset value, beginning of period | | $ | 8.66 | | | $ | 9.33 | | | $ | 9.73 | | | $ | 9.79 | | | $ | 9.83 | | | $ | 10.00 | |
| | | | | | | | | | | | | | | | | | | | | | | | |
Net investment income2 | | | 0.38 | | | | 0.26 | | | | 0.51 | | | | 0.51 | | | | 0.48 | | | | 0.40 | |
Net realized and unrealized gain (loss) | | | 0.55 | | | | (0.52 | ) | | | (0.39 | ) | | | (0.05 | ) | | | (0.05 | ) | | | (0.17 | ) |
| | | | | | | | | | | | | | | | | | | | | | | | |
Net increase (decrease) from investment operations | | | 0.93 | | | | (0.26 | ) | | | 0.12 | | | | 0.46 | | | | 0.43 | | | | 0.23 | |
| | | | | | | | | | | | | | | | | | | | | | | | |
Dividends and distributions from: | | | | | | | | | | | | | | | | | | | | | | | | |
Net investment income | | | (0.38 | ) | | | (0.26 | ) | | | (0.52 | ) | | | (0.52 | ) | | | (0.47 | ) | | | (0.40 | ) |
Net realized gain | | | — | | | | (0.15 | ) | | | — | | | | — | | | | — | | | | — | |
| | | | | | | | | | | | | | | | | | | | | | | | |
Total dividends and distributions | | | (0.38 | ) | | | (0.41 | ) | | | (0.52 | ) | | | (0.52 | ) | | | (0.47 | ) | | | (0.40 | ) |
| | | | | | | | | | | | | | | | | | | | | | | | |
Net asset value, end of period | | $ | 9.21 | | | $ | 8.66 | | | $ | 9.33 | | | $ | 9.73 | | | $ | 9.79 | | | $ | 9.83 | |
| | | | | | | | | | | | | | | | | | | | | | | | |
Total Investment Return3 | | | | | | | | | | | | | | | | | | | | | | | | |
Based on net asset value | | | 11.11 | % | | | (2.61 | )%4 | | | 1.12 | % | | | 4.88 | % | | | 4.54 | % | | | 2.37 | % |
| | | | | | | | | | | | | | | | | | | | | | | | |
Ratios to Average Net Assets | | | | | | | | | | | | | | | | | | | | | | | | |
Total expenses | | | 0.13 | % | | | 0.17 | %5 | | | 0.12 | % | | | 0.18 | % | | | 2.05 | % | | | 3.93 | % |
| | | | | | | | | | | | | | | | | | | | | | | | |
Total expenses after fees reimbursed | | | 0.00 | % | | | 0.00 | %5 | | | 0.01 | % | | | 0.00 | % | | | 0.00 | % | | | 0.00 | % |
| | | | | | | | | | | | | | | | | | | | | | | | |
Total expenses after fees reimbursed and excluding interest expense | | | 0.00 | % | | | 0.00 | %5 | | | 0.00 | % | | | 0.00 | % | | | 0.00 | % | | | 0.00 | % |
| | | | | | | | | | | | | | | | | | | | | | | | |
Net investment income | | | 4.27 | % | | | 6.14 | %5 | | | 5.29 | % | | | 5.28 | % | | | 4.86 | % | | | 4.03 | % |
| | | | | | | | | | | | | | | | | | | | | | | | |
Supplemental Data | �� | | | | | | | | | | | | | | | | | | | | | | | |
Net assets, end of period (000) | | $ | 360,903 | | | $ | 349,221 | | | $ | 414,290 | | | $ | 482,426 | | | $ | 8,501 | | | $ | 4,916 | |
| | | | | | | | | | | | | | | | | | | | | | | | |
Portfolio turnover | | | 178 | %6 | | | 21 | %7 | | | 197 | %8 | | | 7 | % | | | 23 | % | | | 36 | % |
| | | | | | | | | | | | | | | | | | | | | | | | |
| 1 | Commencement of operations was October 1, 2004. |
| 2 | Based on average shares outstanding. |
| 3 | Where applicable, total investment returns include the reinvestments of dividends and distributions. |
| 4 | Aggregate total investment return. |
| 6 | Includes mortgage dollar roll transactions; excluding these transactions the portfolio turnover would have been 83%. |
| 7 | Includes mortgage dollar roll transactions; excluding these transactions the portfolio turnover would have been 19%. |
| 8 | Includes TBA transactions, excluding these transactions, the portfolio turnover would have been 33%. |
See Notes to Financial Statements.
| | | | | | |
| | | BLACKROCK BOND ALLOCATION TARGET SHARES | | MARCH 31, 2010 | | 35 |
Financial Highlights
| | | | | | | | |
| | | Series N Portfolio | |
| | | Year Ended March 31, | |
| | | 2010 | | | 20091 | |
Per Share Operating Performance | | | | | | | | |
Net asset value, beginning of year | | $ | 8.87 | | | $ | 10.00 | |
| | | | | | | | |
Net investment income2 | | | 0.58 | | | | 0.51 | |
Net realized and unrealized gain (loss) | | | 1.22 | | | | (1.14 | ) |
| | | | | | | | |
Net increase (decrease) from investment operations | | | 1.80 | | | | (0.63 | ) |
| | | | | | | | |
Dividends from net investment income | | | (0.55 | ) | | | (0.50 | ) |
| | | | | | | | |
Net asset value, end of year | | $ | 10.12 | | | $ | 8.87 | |
| | | | | | | | |
Total Investment Return3 | | | | | | | | |
Based on net asset value | | | 20.74 | % | | | (6.32 | )%4 |
| | | | | | | | |
Ratios to Average Net Assets | | | | | | | | |
Total expenses5 | | | 1.34 | % | | | 1.93 | % |
| | | | | | | | |
Total expenses after fees reimbursed | | | 0.01 | % | | | 0.05 | % |
| | | | | | | | |
Total expenses after fees reimbursed and excluding interest expense and fees | | | 0.00 | % | | | 0.00 | % |
| | | | | | | | |
Net investment income | | | 5.94 | % | | | 5.50 | % |
| | | | | | | | |
Supplemental Data | | | | | | | | |
Net assets, end of year (000) | | $ | 10,323 | | | $ | 9,050 | |
| | | | | | | | |
Portfolio turnover | | | 64 | % | | | 48 | % |
| | | | | | | | |
| 1 | Commencement of operations was April 1, 2008. |
| 2 | Based on average shares outstanding. |
| 3 | Where applicable, total investment returns include the reinvestments of dividends and distributions. |
| 4 | Aggregate total investment return. |
| 5 | Interest expense and fees relate to tender option bond trusts. See Note 1 of the Notes to Financial Statements for details of municipal bonds transferred to tender option bond trusts. |
See Notes to Financial Statements.
| | | | | | |
| 36 | | BLACKROCK BOND ALLOCATION TARGET SHARES | | MARCH 31, 2010 | | |
Financial Highlights (concluded)
| | | | | | | | | | | | | | | | | | | | | | | | |
| | | Series S Portfolio | |
| | | Year Ended March 31, | | | Period October 1, 2008 to March 31, | | | Year Ended September 30, | |
| | 2010 | | | 2009 | | | 2008 | | | 2007 | | | 2006 | | | 20051 | |
Per Share Operating Performance | | | | | | | | | | | | | | | | | | | | | | | | |
Net asset value, beginning of period | | $ | 9.74 | | | $ | 9.75 | | | $ | 9.79 | | | $ | 9.84 | | | $ | 9.84 | | | $ | 10.00 | |
| | | | | | | | | | | | | | | | | | | | | | | | |
Net investment income2 | | | 0.37 | | | | 0.14 | | | | 0.42 | | | | 0.52 | | | | 0.43 | | | | 0.35 | |
Net realized and unrealized gain (loss) | | | 0.46 | | | | 0.09 | | | | (0.04 | ) | | | (0.06 | ) | | | — | | | | (0.16 | ) |
| | | | | | | | | | | | | | | | | | | | | | | | |
Net increase from investment operations | | | 0.83 | | | | 0.23 | | | | 0.38 | | | | 0.46 | | | | 0.43 | | | | 0.19 | |
| | | | | | | | | | | | | | | | | | | | | | | | |
Dividends and distributions from: | | | | | | | | | | | | | | | | | | | | | | | | |
Net investment income | | | (0.38 | ) | | | (0.14 | ) | | | (0.42 | ) | | | (0.51 | ) | | | (0.43 | ) | | | (0.35 | ) |
Net realized gain | | | (0.05 | ) | | | (0.10 | ) | | | — | | | | — | | | | — | | | | — | |
| | | | | | | | | | | | | | | | | | | | | | | | |
Total dividends and distributions | | | (0.43 | ) | | | (0.24 | ) | | | (0.42 | ) | | | (0.51 | ) | | | (0.43 | ) | | | (0.35 | ) |
| | | | | | | | | | | | | | | | | | | | | | | | |
Net asset value, end of period | | $ | 10.14 | | | $ | 9.74 | | | $ | 9.75 | | | $ | 9.79 | | | $ | 9.84 | | | $ | 9.84 | |
| | | | | | | | | | | | | | | | | | | | | | | | |
Total Investment Return3 | | | | | | | | | | | | | | | | | | | | | | | | |
Based on net asset value | | | 8.68 | % | | | 2.44 | %4 | | | 3.98 | % | | | 4.88 | % | | | 4.51 | % | | | 2.00 | % |
| | | | | | | | | | | | | | | | | | | | | | | | |
Ratios to Average Net Assets | | | | | | | | | | | | | | | | | | | | | | | | |
Total expenses | | | 0.19 | % | | | 0.31 | %5 | | | 0.33 | % | | | 0.51 | % | | | 1.28 | % | | | 2.72 | % |
| | | | | | | | | | | | | | | | | | | | | | | | |
Total expenses after fees reimbursed | | | 0.01 | % | | | 0.00 | %5 | | | 0.00 | % | | | 0.00 | % | | | 0.00 | % | | | 0.00 | % |
| | | | | | | | | | | | | | | | | | | | | | | | |
Total expenses after fees reimbursed and excluding interest expense | | | 0.00 | % | | | 0.00 | %5 | | | 0.00 | % | | | 0.00 | % | | | 0.00 | % | | | 0.00 | % |
| | | | | | | | | | | | | | | | | | | | | | | | |
Net investment income | | | 3.65 | % | | | 2.79 | %5 | | | 4.27 | % | | | 5.28 | % | | | 4.49 | % | | | 3.54 | % |
| | | | | | | | | | | | | | | | | | | | | | | | |
Supplemental Data | | | | | | | | | | | | | | | | | | | | | | | | |
Net assets, end of period (000) | | $ | 142,984 | | | $ | 87,109 | | | $ | 59,843 | | | $ | 43,521 | | | $ | 29,947 | | | $ | 9,843 | |
| | | | | | | | | | | | | | | | | | | | | | | | |
Portfolio turnover | | | 117 | %6 | | | 22 | % | | | 71 | %7 | | | 53 | % | | | 52 | % | | | 17 | % |
| | | | | | | | | | | | | | | | | | | | | | | | |
| 1 | Commencement of operations was October 1, 2004. |
| 2 | Based on average shares outstanding. |
| 3 | Where applicable, total investment returns include the reinvestments of dividends and distributions. |
| 4 | Aggregate total investment return. |
| 6 | Includes mortgage dollar roll transactions; excluding these transactions the portfolio turnover would have been 114%. |
| 7 | Includes TBA transactions, excluding these transactions, the portfolio turnover would have been 69%. |
See Notes to Financial Statements.
| | | | | | |
| | | BLACKROCK BOND ALLOCATION TARGET SHARES | | MARCH 31, 2010 | | 37 |
Notes to Financial Statements
1. Organization and Significant Accounting Policies:
BlackRock Bond Allocation Target Shares (the “Trust”), a Delaware statutory trust, is registered under the Investment Company Act of 1940, as amended (the “1940 Act”), as a non-diversified open-end management investment company. As of March 31, 2010, the Trust had 5 series, of which BlackRock Bond Allocation Target Shares Series C Portfolio (“Series C”), BlackRock Bond Allocation Target Shares Series M Portfolio (“Series M”) BlackRock Bond Allocation Target Shares Series N Portfolio (“Series N”) and BlackRock Bond Allocation Target Shares Series S Portfolio (“Series S”) (collectively the “Funds”) are included in these financial statements. The Funds’ financial statements are prepared in conformity with accounting principles generally accepted in the United States of America (“US GAAP”), which may require the use of management accruals and estimates. Actual results may differ from these estimates.
Shares of the Funds are offered to separate account clients of the investment advisor or certain of its affiliates. Participants in wrap-fee programs pay a single aggregate fee to the program sponsor for all costs and expenses of the wrap-fee programs including investment advice and portfolio execution.
The following is a summary of significant accounting policies followed by the Funds:
Valuation: The Funds’ policy is to fair value their financial instruments at market value. The Funds value their bond investments on the basis of last available bid prices or current market quotations provided by dealers or pricing services selected under the supervision of the Funds’ Board of Trustees (the “Board”). In determining the value of a particular investment, pricing services may use certain information with respect to transactions in such investments, quotations from dealers, pricing matrixes, market transactions in comparable investments, various relationships observed in the market between investments and calculated yield measures based on valuation technology commonly employed in the market for such investments. Asset-backed and mortgage-backed securities are valued by independent pricing services using models that consider estimated cash flows of each tranche of the security, establish a benchmark yield and develop an estimated tranche specific spread to the benchmark yield based on the unique attributes of the tranche. Financial futures contracts traded on exchanges are valued at their last sale price. Swap agreements are valued by utilizing quotes received daily by the Funds’ pricing service or through brokers, which are derived using daily swap curves and trades of underlying securities. To-be-announced (“TBA”) commitments are valued at the current market value of the underlying securities. Short-term securities with remaining maturities of 60 days or less may be valued at amortized cost, which approximates fair value. Investments in open-end investment companies are valued at net asset value each business day.
Exchange-traded options are valued at the mean between the last bid and ask prices at the close of the options market in which the options trade. An exchange-traded option for which there is no mean price is valued at the last bid (long positions) or ask (short positions) price. If no bid or ask price is available, the prior day’s price will be used, unless it is determined that such prior day’s price no longer reflects the fair value of the option. Over-the-counter (“OTC”) options and swaptions are valued by an independent pricing service using a mathematical model which incorporates a number of market data factors, such as the trades and prices of the underlying securities.
In the event that application of these methods of valuation results in a price for an investment which is deemed not to be representative of the market value of such investment or is not available, the investment will be valued by a method approved by the Board as reflecting fair value (“Fair Value Assets”). When determining the price for Fair Value Assets, the investment advisor seeks to determine the price that each Fund might reasonably expect to receive from the current sale of that asset in an arm’s-length transaction. Fair value determinations shall be based upon all available factors that the investment advisor deems relevant. The pricing of all Fair Value Assets is subsequently reported to the Board or a committee thereof.
Asset-Backed and Mortgage-Backed Securities: The Funds may invest in asset-backed securities. Asset-backed securities are generally issued as pass-through certificates, which represent undivided fractional ownership interests in an underlying pool of assets, or as debt instruments, which are also known as collateralized obligations, and are generally issued as the debt of a special purpose entity organized solely for the purpose of owning such assets and issuing such debt. Asset-backed securities are often backed by a pool of assets representing the obligations of a number of different parties. The yield characteristics of certain asset-backed securities may differ from traditional debt securities. One such major difference is that all or a principal part of the obligations may be prepaid at any time because the underlying assets (i.e., loans) may be prepaid at any time. As a result, a decrease in interest rates in the market may result in increases in the level of prepayments as borrowers, particularly mortgagors, refinance and repay their loans. An increased prepayment rate with respect to an asset-backed security subject to such a prepayment rate feature will have the effect of shortening the maturity of the security. If a Fund has purchased such an asset-backed security at a premium, a faster than anticipated prepayment rate could result in a loss of principal to the extent of the premium paid.
The Funds may purchase certain mortgage pass-through securities. There are a number of important differences among the agencies and instrumentalities of the US Government that issue mortgage-related securities and among the securities that they issue. For example, mortgage-related securities guaranteed by the Government National Mortgage Association (“GNMA”) are guaranteed as to the timely payment of principal and interest by GNMA and such guarantee is backed by the full faith and credit of the United States. However, mortgage-related securities issued by the Federal Home Loan Mortgage Corporation (“FHLMC”) and Federal National Mortgage Association (“FNMA”), including FNMA guaranteed Mortgage Pass-Through
| | | | | | |
| 38 | | BLACKROCK BOND ALLOCATION TARGET SHARES | | MARCH 31, 2010 | | |
Notes to Financial Statements (continued)
Certificates are solely the obligations of the FHLMC and FNMA, are not backed by or entitled to the full faith and credit of the United States and are supported by the right of the issuer to borrow from the Treasury.
Series S and Series M invest a significant portion of their assets in securities backed by commercial or residential mortgage loans or in issuers that hold mortgage and other asset-backed securities. Please see the Schedules of Investments for these securities. Changes in economic conditions, including delinquencies and/or defaults on assets underlying these securities, can affect the value, income and/or liquidity of such positions.
Multiple Class Pass-Through Securities: The Funds may invest in multiple class pass-through securities, including collateralized mortgage obligations (“CMOs”) and commercial mortgage-backed securities. These multiple class securities may be issued by GNMA, US Government agencies or instrumentalities or by trusts formed by private originators of, or investors in, mortgage loans. In general, CMOs are debt obligations of a legal entity that are collateralized by, and multiple class pass-through securities represent direct ownership interests in, a pool of residential or commercial mortgage loans or mortgage pass-through securities, the payments on which are used to make payments on the CMOs or multiple class pass-through securities. Classes of CMOs include interest only (“IOs”), principal only (“POs”), planned amortization classes and targeted amortization classes. IOs and POs are stripped mortgage-backed securities representing interests in a pool of mortgages, the cash flow from which has been separated into interest and principal components. IOs receive the interest portion of the cash flow while POs receive the principal portion. IOs and POs can be extremely volatile in response to changes in interest rates. As interest rates rise and fall, the value of IOs tends to move in the same direction as interest rates. POs perform best when prepayments on the underlying mortgages rise since this increases the rate at which the investment is returned and the yield to maturity on the PO. When payments on mortgages underlying a PO are slower than anticipated, the life of the PO is lengthened and the yield to maturity is reduced. If the underlying mortgage assets experience greater than anticipated pre-payments of principal, the Funds may not fully recoup their initial investments in IOs.
Capital Trusts: These securities are typically issued by corporations, generally in the form of interest-bearing notes with preferred securities characteristics, or by an affiliated business trust of a corporation, generally in the form of beneficial interests in subordinated debentures or similarly structured securities. The securities can be structured as either fixed or adjustable coupon securities that can have either a perpetual or stated maturity date. Interest can be deferred without creating an event of default or acceleration, although maturity cannot take place unless all cumulative payment obligations have been met. The deferral of payments does not affect the purchase or sale of these securities in the open market. Payments on these securities are treated as interest rather than dividends for federal income tax purposes. These securities can have a rating that is slightly below that of the issuing company’s senior debt securities.
Forward Commitments and When-Issued Delayed Delivery Securities: The Funds may purchase securities on a when-issued basis and may purchase or sell securities on a forward commitment basis. Settlement of such transactions normally occurs within a month or more after the purchase or sale commitment is made. The Funds may purchase securities under such conditions with the intention of actually acquiring them, but may enter into a separate agreement to sell the securities before the settlement date. Since the value of securities purchased may fluctuate prior to settlement, the Funds may be required to pay more at settlement than the security is worth. In addition, the purchaser is not entitled to any of the interest earned prior to settlement. When purchasing a security on a delayed-delivery basis, a Fund assumes the rights and risks of ownership of the security, including the risk of price and yield fluctuations. In the event of default by the counterparty, the Funds’ maximum amount of loss is the unrealized gain of the commitment, which is shown on the Schedules of Investments, if any.
Inflation-Indexed Bonds: Inflation-indexed bonds are fixed income securities whose principal value is periodically adjusted according to the rate of inflation. If the index measuring inflation falls, the principal value of inflation-indexed bonds will be adjusted downward, and consequently the interest payable on these securities (calculated with respect to a smaller principal amount) will be reduced. Repayment of the original bond principal upon maturity (as adjusted for inflation) is guaranteed in the case of US Treasury inflation-indexed bonds. For bonds that do not provide a similar guarantee, the adjusted principal value of the bond repaid at maturity may be less than the original principal.
Mortgage Dollar Roll Transactions: The Funds may sell mortgage-backed securities and simultaneously contract to repurchase substantially similar (same type, coupon and maturity) securities on a specific future date at an agreed-upon price. During the period between the sale and repurchase, the Funds will not be entitled to receive interest and principal payments on the securities sold. The Funds account for dollar roll transactions as purchases and sales and realize gains and losses on these transactions. Mortgage dollar rolls involve the risk that the market value of the securities that each Fund is required to purchase may decline below the agreed upon repurchase price of those securities.
Treasury Roll Transactions: A treasury roll transaction involves the sale of a Treasury security, with an agreement to repurchase the same security at an agreed upon price and date. Treasury rolls constitute a borrowing and the difference between the sale and repurchase price represents interest expense at an agreed upon rate. Whether such a transaction produces a positive impact on performance depends upon whether the income and gains on the securities purchased with the proceeds received from the sale of the security exceeds the interest expense incurred by the Funds. Treasury rolls are not considered purchases and sales and any gains or losses incurred on the treasury rolls will be deferred until the Treasury securities are disposed.
| | | | | | |
| | | BLACKROCK BOND ALLOCATION TARGET SHARES | | MARCH 31, 2010 | | 39 |
Notes to Financial Statements (continued)
Treasury roll transactions involve the risk that the market value of the securities that the Funds are required to purchase may decline below the agreed upon purchase price of those securities. If investment performance of securities purchased with proceeds from these transactions does not exceed the income, capital appreciation and gain or loss that would have been realized on the securities sold as part of the treasury roll, the use of this technique will adversely impact the investment performance of the Funds.
Reverse Repurchase Agreements: The Funds may enter into reverse repurchase agreements with qualified third party broker-dealers. In a reverse repurchase agreement, the Funds sell securities to a bank or broker-dealer and agree to repurchase the securities at a mutually agreed upon date and price. Certain agreements have no stated maturity and can be terminated by either party at any time. Interest on the value of the reverse repurchase agreements issued and outstanding is based upon competitive market rates determined at the time of issuance. The Funds may utilize reverse repurchase agreements when it is anticipated that the interest income to be earned from the investment of the proceeds of the transaction is greater than the interest expense of the transaction. Reverse repurchase agreements involve leverage risk and also the risk that the market value of the securities that a Fund is obligated to repurchase under the agreement may decline below the repurchase price. In the event the buyer of securities under a reverse repurchase agreement files for bankruptcy or becomes insolvent, the Funds’ use of the proceeds of the agreement may be restricted while the other party, or its trustee or receiver, determines whether or not to enforce the Funds’ obligation to repurchase the securities.
TBA Commitments: The Funds may enter into TBA commitments to purchase or sell securities for a fixed price at a future date. TBA commitments involve a risk of loss if the value of the security to be purchased or sold declines or increases prior to settlement date, which is in addition to the risk of decline in the value of the Funds’ other assets.
Municipal Bonds Transferred to Tender Option Bond Trusts: Series N may leverage its assets through the use of tender option bond trusts (“TOBs”). A TOB is established by a third party sponsor forming a special purpose entity, into which one or more funds, or an agent on behalf of the funds, transfers municipal bonds. Other funds managed by the investment advisor may also contribute municipal bonds to a TOB into which Series N has contributed bonds. A TOB typically issues two classes of beneficial interests: short-term floating rate certificates, which are sold to third party investors, and residual certificates (“TOB Residuals”), which are generally issued to the participating funds that made the transfer. The TOB Residuals held by Series N include the right of Series N (1) to cause the holders of a proportional share of the floating rate certificates to tender their certificates at par, and (2) to transfer, within seven days, a corresponding share of the municipal bonds from the TOB to Series N. The TOB may also be terminated without the consent of Series N upon the occurrence of certain events as defined in the TOB agreements. Such termination events may include the bankruptcy or default of the municipal bond, a substantial downgrade in credit quality of the municipal bond, the inability of the TOB to obtain quarterly or annual renewal of the liquidity support agreement, a substantial decline in the market value of the municipal bond or the inability to remarket the short-term floating rate certificates to third party investors.
The cash received by the TOB from the sale of the short-term floating rate certificates, less transaction expenses, is paid to Series N, which typically invests the cash in additional municipal bonds. Series N’s transfer of the municipal bonds to a TOB is accounted for as a secured borrowing, therefore the municipal bonds deposited into a TOB are presented in the Fund’s Schedule of Investments and the proceeds from the issuance of the short-term floating rate certificates are shown as trust certificates in the Statements of Assets and Liabilities.
Interest income from the underlying municipal bonds is recorded by Series N on an accrual basis. Interest expense incurred on the secured borrowing and other expenses related to remarketing, administration and trustee services to a TOB are reported as expenses of Series N. The floating rate certificates have interest rates that generally reset weekly and their holders have the option to tender certificates to the TOB for redemption at par at each reset date. At March 31, 2010, the aggregate value of the underlying municipal bonds transferred to TOBs, the related liability for trust certificates and the range of interest rates on the liability for trust certificates were as follows:
| | | | | | | | | |
| | | Underlying
Municipal Bonds
Transferred to TOBs | | Liability for
Trust
Certificates | | Interest Rate | |
Series N | | $ | 432,388 | | $ | 200,000 | | 0.28 | % |
Should short-term interest rates rise, Series N’s investments in TOBs may adversely affect Series N’s investment income and dividends to shareholders. Also, fluctuations in the market value of municipal bonds deposited into the TOB may adversely affect Series N’s net asset value per share.
Zero-Coupon Bonds: The Funds may invest in zero-coupon bonds, which are normally issued at a significant discount from face value and do not provide for periodic interest payments. Zero-coupon bonds may experience greater volatility in market value than similar maturity debt obligations which provide for regular interest payments.
Segregation and Collateralization: In cases in which the 1940 Act and the interpretive positions of the Securities and Exchange Commission (“SEC”) require that a Fund either delivers collateral or segregates assets in connection with certain investments (e.g., dollar rolls, TBAs beyond normal settlement, financial futures contracts, swaps and written options), or certain borrowings (e.g., reverse repurchase agreements) each Fund will, consistent with SEC rules and/or certain interpretive letters issued by the SEC, segregate collateral or designate on its books and records cash or other liquid securities having a market value at least equal to the amount that would otherwise be required to
| | | | | | |
| 40 | | BLACKROCK BOND ALLOCATION TARGET SHARES | | MARCH 31, 2010 | | |
Notes to Financial Statements (continued)
be physically segregated. Furthermore, based on requirements and agreements with certain exchanges and third party broker-dealers, each party has requirements to deliver/deposit securities as collateral for certain investments.
Investment Transactions and Investment Income: For financial reporting purposes, investment transactions are recorded on the dates the transactions are entered into (the trade dates). Realized gains and losses on investment transactions are determined on the identified cost basis. Dividend income is recorded on the ex-dividend dates. Interest income, including amortization of premium and accretion of discount on debt securities, is recognized on the accrual basis.
Dividends and Distributions: Dividends from net investment income are declared daily and paid monthly. Distributions of capital gains are recorded on the ex-dividend dates. The amount and timing of dividends and distributions are determined in accordance with federal income tax regulations, which may differ from US GAAP.
Income Taxes: It is the Funds’ policy to comply with the requirements of the Internal Revenue Code of 1986, as amended, applicable to regulated investment companies and to distribute substantially all of their taxable income to their shareholders. Therefore, no federal income tax provision is required.
The Funds file US federal and various state and local tax returns. No income tax returns are currently under examination. The statute of limitations on the Series C, Series M and Series S US federal tax returns remains open for each of the two years ended September 30, 2008 and for each of the two periods ended March 31, 2010. The statute of limitations on the Series N US federal tax returns remains open for each of the two periods ended March 31, 2010. The statutes of limitations on each Fund’s state and local tax returns may remain open for an additional year depending upon the jurisdiction. There are no uncertain tax positions that require recognition of a tax liability.
Recent Accounting Standard: In January 2010, Financial Accounting Standards Board issued amended guidance to improve disclosure about fair value measurements which will require additional disclosures about transfers into and out of Levels 1 and 2 and separate disclosures about purchases, sales, issuances and settlements in the reconciliation for fair value measurements using significant unobservable inputs (Level 3). It also clarifies existing disclosure requirements relating to the levels of disaggregation for fair value measurement and inputs and valuation techniques used to measure fair value. The amended guidance is effective for financial statements for fiscal years beginning after December 15, 2009, and interim periods within those fiscal years, except for disclosures about purchases, sales, issuances and settlements in the rollforward of activity in Level 3 fair value measurements, which are effective for fiscal years beginning after December 15, 2010 and for interim periods within those fiscal years. The impact of this guidance on the Funds’ financial statements and disclosures is currently being assessed.
Other: Expenses directly related a Fund are charged to that Fund. Other operating expenses shared by several funds are pro rated among those funds on the basis of relative net assets or other appropriate methods.
2. Derivative Financial Instruments:
The Funds may engage in various portfolio investment strategies both to increase the returns of the Funds and to economically hedge, or protect, their exposure to certain risks such as credit risk and interest rate risk. Losses may arise if the value of the contract decreases due to an unfavorable change in the price of the underlying instrument or if the counterparty does not perform under the contract. The Funds may mitigate counterparty risk through master netting agreements included within an International Swap and Derivatives Association, Inc. (“ISDA”) Master Agreement between a Fund and each of its counterparties. The ISDA Master Agreement allows each Fund to offset with its counterparty certain derivative financial instrument’s payables and/or receivables with collateral held with each counterparty. The amount of collateral moved to/from applicable counterparties is based upon minimum transfer amounts of up to $500,000. To the extent amounts due to the Funds from their counterparties are not fully collateralized contractually or otherwise, the Funds bear the risk of loss from counterparty non-performance. See Note 1 “Segregation and Collateralization” for information with respect to collateral practices. In addition, the Funds manage counterparty risk by entering into agreements only with counterparties that they believe have the financial resources to honor their obligations and by monitoring the financial stability of those counterparties.
The Funds’ maximum risk of loss from counterparty credit risk on OTC derivatives is generally the aggregate unrealized gain in excess of any collateral pledged by the counterparty to the Funds. For OTC options purchased, the Funds bear the risk of loss in the amount of the premiums paid and change in market value of the options should the counterparty not perform under the contracts. Options written by the Funds do not give rise to counterparty credit risk, as options written obligate the Funds to perform and not the counterparty. Certain ISDA Master Agreements allow counterparties to OTC derivatives to terminate derivative contracts prior to maturity in the event a Fund’s net assets decline by a stated percentage or a Fund fails to meet the terms of its ISDA Master Agreements, which would cause the Funds to accelerate payment of any net liability owed to the counterparty. Counterparty risk related to exchange-traded financial futures contracts and options is minimal because of the protection against defaults provided by the exchange on which they trade.
Financial Futures Contracts: The Funds may purchase or sell financial futures contracts and options on financial futures contracts to gain exposure to, or economically hedge against, changes in interest rates (interest rate risk). Financial futures contracts are contracts for delayed delivery of securities at a specific future date and at a specific price or yield. Pursuant to the contract, the Funds agree to receive from or pay to the broker an amount of cash equal to the daily fluctuation in value of
| | | | | | |
| | | BLACKROCK BOND ALLOCATION TARGET SHARES | | MARCH 31, 2010 | | 41 |
Notes to Financial Statements (continued)
the contract. Such receipts or payments are known as margin variation and are recognized by the Funds as unrealized gains or losses. When the contract is closed, the Funds record a realized gain or loss equal to the difference between the value of the contract at the time it was opened and the value at the time it was closed. The use of financial futures transactions involves the risk of an imperfect correlation in the movements in the price of financial futures contracts, interest rates and the underlying assets.
Options: The Funds may purchase and write call and put options to increase or decrease their exposure to underlying instruments (interest rate risk) and/or, in the case of options written, to generate gains from options premiums. A call option gives the purchaser of the option the right (but not the obligation) to buy, and obligates the seller to sell (when the option is exercised), the underlying instrument at the exercise price at any time or at a specified time during the option period. A put option gives the holder the right to sell and obligates the writer to buy the underlying instrument at the exercise price at any time or at a specified time during the option period. When a Fund purchases (writes) an option, an amount equal to the premium paid (received) by a Fund is reflected as an asset (liability). The amount of the asset (liability) is subsequently marked-to-market to reflect the current market value of the option purchased (written). When an instrument is purchased or sold through an exercise of an option, the related premium paid (or received) is added to (or deducted from) the basis of the instrument acquired or deducted from (or added to) the proceeds of the instrument sold. When an option expires (or a Fund enters into a closing transaction), a Fund realizes a gain or loss on the option to the extent of the premiums received or paid (or gain or loss to the extent the cost of the closing transaction exceeds the premium received or paid). When a Fund writes a call option, such option is “covered,” meaning that a Fund holds the underlying instrument subject to being called by the option counterparty, or cash in an amount sufficient to cover the obligation. When a Fund writes a put option, such option is covered by cash in an amount sufficient to cover the obligation.
Options on swaps (swaptions) are similar to options on securities except that instead of selling or purchasing the right to buy or sell a security, the writer or purchaser of the swap option is granting or buying the right to enter into a previously agreed upon interest rate swap agreement at any time before the expiration of the option.
In purchasing and writing options, a Fund bears the risk of an unfavorable change in the value of the underlying instrument or the risk that the Fund may not be able to enter into a closing transaction due to an illiquid market. Exercise of an option written could result in a Fund purchasing or selling a security at a price different from the current market value. The Funds may execute transactions in both listed and OTC options.
Swaps: The Funds may enter into swap agreements, in which a Fund and a counterparty agree to make periodic net payments on a specified notional amount. These periodic payments received or made by the Funds are recorded in the Statements of Operations as realized gains or losses, respectively. Any upfront fees paid are recorded as assets and any upfront fees received are recorded as liabilities and amortized over the term of the swap. Swaps are marked-to-market daily and changes in value are recorded as unrealized appreciation (depreciation). When the swap is terminated, the Funds will record a realized gain or loss equal to the difference between the proceeds from (or cost of) the closing transaction and the Funds’ basis in the contract, if any. Swap transactions involve, to varying degrees, elements of interest rate, credit and market risk in excess of the amounts recognized in the Statements of Assets and Liabilities. Such risks involve the possibility that there will be no liquid market for these agreements, that the counterparty to the agreements may default on its obligation to perform or disagree as to the meaning of the contractual terms in the agreements, and that there may be unfavorable changes in interest rates and/or market values associated with these transactions.
| | • | | Credit default swaps – The Funds may enter into credit default swaps to manage their exposure to the market or certain sectors of the market, to reduce their risk exposure to defaults of corporate and/or sovereign issuers or to create exposure to corporate and/or sovereign issuers to which they are not otherwise exposed (credit risk). The Funds enter into credit default agreements to provide a measure of protection against the default of an issuer (as buyer of protection) and/or gain credit exposure to an issuer to which they are not otherwise exposed (as seller of protection). The Funds may either buy or sell (write) credit default swaps on single-name issuers (corporate or sovereign) or traded indexes. Credit default swaps on single-name issuers are agreements in which the buyer pays fixed periodic payments to the seller in consideration for a guarantee from the seller to make a specific payment should a negative credit event take place (e.g., bankruptcy, failure to pay, obligation accelerators, repudiation, moratorium or restructuring). Credit default swaps on traded indexes are agreements in which the buyer pays fixed periodic payments to the seller in consideration for a guarantee from the seller to make a specific payment should a write-down, principal or interest shortfall or default of all or individual underlying securities included in the index occurs. As a buyer, if an underlying credit event occurs, a Fund will either receive from the seller an amount equal to the notional amount of the swap and deliver the referenced security or underlying securities comprising of an index or receive a net settlement of cash equal to the notional amount of the swap less the recovery value of the security or underlying securities comprising of an index. As a seller (writer), if an underlying credit event occurs, a Fund will either pay the buyer an amount equal to the notional amount of the swap and take delivery of the referenced security or underlying securities comprising of an index or pay a net settlement of cash equal to the notional amount of the swap less the recovery value of the security or underlying securities comprising of an index. |
| | • | | Interest rate swaps – The Funds may enter into interest rate swaps to manage duration, the yield curve or interest rate risk by economically hedging the value of the fixed rate bonds which may |
| | | | | | |
| 42 | | BLACKROCK BOND ALLOCATION TARGET SHARES | | MARCH 31, 2010 | | |
Notes to Financial Statements (continued)
| | decrease when interest rates rise (interest rate risk). Interest rate swaps are agreements in which one party pays a floating rate of interest on a notional principal amount and receives a fixed rate of interest on the same notional principal amount for a specified period of time. In more complex swaps, the notional principal amount may decline (or amortize) over time. |
Derivative Instruments Categorized by Risk Exposure:
| | | | | | | | | | | |
Fair Values of Derivative Instruments as of March 31, 2010 |
Asset Derivatives |
| | | Statements of Assets and Liabilities Location | | Series C | | Series M | | Series S |
Interest rate contracts | | Net unrealized appreciation/ depreciation*; Unrealized appreciation on swaps; Investments at value** | | $ | 37,941 | | $ | 152,670 | | $ | 25,183 |
| | | | | | | | | | | |
| | | | | | | | | | | |
Liability Derivatives |
| | | Statements of Assets and Liabilities Location | | Series C | | Series M | | Series S |
Interest rate contracts | | Net unrealized appreciation/ depreciation*; Unrealized depreciation on swaps; Options written at value | | $ | 74,759 | | $ | 409,563 | | $ | 61,610 |
Credit contracts | | Unrealized depreciation on swaps | | | — | | | — | | | 8,296 |
| | | | | | | | | | | |
Total | | | | $ | 74,759 | | $ | 409,563 | | $ | 69,906 |
| | | | | | | | | | | |
| * | Includes cumulative appreciation/depreciation of financial futures contracts as reported in the Schedules of Investments. Only current day’s margin variation is reported within the Statements of Assets and Liabilities. |
| ** | Includes options purchased at value as reported in the Schedules of Investments. |
| | | | | | | | | | | | | | | | |
The Effect of Derivative Instruments on the Statements of Operations Year Ended March 31, 2010 | |
Net Realized Gain (Loss) from | |
| | | Series C | | | Series M | | | Series N | | | Series S | |
Interest rate contracts: | | | | | | | | | | | | | | | | |
Financial futures contracts | | $ | (2,868,972 | ) | | $ | 463,680 | | | $ | 7,992 | | | $ | 856,466 | |
Options*** | | | — | | | | — | | | | — | | | | 305,059 | |
Swaps | | | — | | | | — | | | | — | | | | 179,454 | |
Credit contracts: | | | | | | | | | | | | | | | | |
Swaps | | | — | | | | — | | | | — | | | | (3,500 | ) |
| | | | | | | | | | | | | | | | |
Total | | $ | (2,868,972 | ) | | $ | 463,680 | | | $ | 7,992 | | | $ | 1,337,479 | |
| | | | | | | | | | | | | | | | |
|
Net Change in Unrealized Appreciation/Depreciation on | |
| | | | | | Series C | | | Series M | | | Series S | |
Interest rate contracts: | | | | | | | | | | | | | | | | |
Financial futures contracts | | | | | | $ | (1,095,850 | ) | | $ | (4,420,314 | ) | | $ | (390,751 | ) |
Options*** | | | | | | | — | | | | — | | | | (26,994 | ) |
Swaps | | | | | | | — | | | | — | | | | (3,701 | ) |
Credit contracts: | | | | | | | | | | | | | | | | |
Swaps | | | | | | | — | | | | — | | | | (8,296 | ) |
| | | | | | | | | | | | | | | | |
Total | | | | | | $ | (1,095,850 | ) | | $ | (4,420,314 | ) | | $ | (429,742 | ) |
| | | | | | | | | | | | | | | �� | |
| *** | Options purchased are included in the net realized gain (loss) from investments and net change in unrealized appreciation/depreciation on investments. |
| | | | | | |
| | | BLACKROCK BOND ALLOCATION TARGET SHARES | | MARCH 31, 2010 | | 43 |
Notes to Financial Statements (continued)
For the year ended March 31, 2010, the average quarterly balance of outstanding derivative financial instruments was as follows:
| | | | | | | | | |
| | | Series C | | Series M | | Series S |
Financial futures contracts: | | | | | | | | | |
Average number of contracts purchased | | | 83 | | | 1,706 | | | 182 |
Average number of contracts sold | | | 366 | | | 603 | | | 33 |
Average notional value of contracts purchased | | $ | 12,488,627 | | $ | 199,600,291 | | $ | 37,066,942 |
Average notional value of contracts sold | | $ | 43,093,094 | | $ | 92,467,855 | | $ | 3,866,244 |
Options: | | | | | | | | | |
Average number of contracts purchased | | | — | | | — | | | 594 |
Average number of contracts written | | | — | | | — | | | 1,453 |
Average notional value of contracts purchased | | | — | | | — | | $ | 13,278,125 |
Average notional value of contracts written | | | — | | | — | | $ | 22,034,375 |
Credit default swaps: | | | | | | | | | |
Average number of contracts – buy protection | | | — | | | — | | | 1 |
Average notional value – buy protection | | | — | | | — | | $ | 600,000 |
Interest rate swaps: | | | | | | | | | |
Average number of contracts – pays fixed rate | | | — | | | — | | | 1 |
Average number of contracts – receives fixed rate | | | — | | | — | | | 2 |
Average notional value – pays fixed rate | | | — | | | — | | $ | 6,375,000 |
Average notional value – receives fixed rate | | | — | | | — | | $ | 10,725,000 |
3. Investment Advisory Agreement and Other Transactions with Affiliates:
The PNC Financial Services Group, Inc. (“PNC”), Bank of America Corporation (“BAC”) and Barclays Bank PLC (“Barclays”) are the largest stockholders of BlackRock, Inc. (“BlackRock”). Due to the ownership structure, PNC is an affiliate of the Funds for 1940 Act purposes, but BAC and Barclays are not.
The Trust, on behalf of the Funds, entered into an Investment Advisory Agreement with BlackRock Advisors, LLC (the “Manager”), the Funds’ investment advisor, an indirect, wholly owned subsidiary of BlackRock to provide investment advisory services.
The Manager benefits from the Trust being an investment option in a wrap program for which affiliates of the Manager receive fees. The Manager is contractually obligated to pay expenses it incurs in providing advisory services to the Trust and will pay or reimburse the Trust for all of its direct expenses, except extraordinary expenses and interest expense. The Manager receives no advisory fee from the Trust under the Investment Advisory Agreement.
PFPC Trust Company, an indirect, wholly owned subsidiary of PNC, serves as custodian for each Fund. For these services, the custodian receives a fee computed daily and payable monthly, based on a percentage of the average daily gross assets of each Fund. The fee is paid at the following annual rates: 0.005% of the first $400 million, 0.004% of the next $1.6 billion and 0.003% of average daily gross assets in excess of $2 billion; plus per transaction charges and other miscellaneous fees incurred on behalf of each Fund.
The Funds have an arrangement with the custodian whereby fees may be reduced by credits earned on uninvested cash balances, which if applicable are shown as fees paid indirectly in the Statements of Operations. The custodian imposes fees on overdrawn cash balances, which can be offset by accumulated credits earned or may result in additional custody charges.
PNC Global Investment Servicing (U.S.) Inc. (“PNCGIS”), an indirect, wholly owned subsidiary of PNC and an affiliate of the Manager, acts as administrator for the Trust. For these services, PNCGIS receives administration and accounting services fees computed daily and payable monthly, at the following annual rates: (a) for accounting services, (i) $12,000 for each Fund’s first $250 million in average daily net assets, $12,000 for each Fund’s next $500 million in average daily net assets and 0.0025% for each Fund’s average daily net assets in excess of $750 million, and (ii) $200 per Fund per month, plus $0.65 per cusip per day; (b) for administration services, 0.005% of each Fund’s average daily net assets; and (c) out-of-pocket expenses.
PNCGIS serves as transfer and dividend disbursing agent. For its services, PNCGIS receives an annual fee of $15,000 per Fund, plus transaction fees, per account fees and disbursements.
As mentioned above, the Manager will reimburse the Trust for all such administration, custodian and transfer agent services.
Certain officers and/or trustees of the Trust are officers and/or directors of BlackRock or its affiliates. The Funds reimburse the Manager for compensation paid to the Trust’s Chief Compliance Officer.
| | | | | | |
| 44 | | BLACKROCK BOND ALLOCATION TARGET SHARES | | MARCH 31, 2010 | | |
Notes to Financial Statements (continued)
4. Investments:
Purchases and sales of investments including paydowns, mortgage dollar roll and TBA transactions and excluding short-term securities and US government securities for the year ended March 31, 2010, were as follows:
| | | | | | |
| | | Purchases | | Sales |
Series C | | $ | 175,401,085 | | $ | 200,935,962 |
Series M | | $ | 495,790,332 | | $ | 497,860,877 |
Series N | | $ | 6,006,122 | | $ | 6,180,921 |
Series S | | $ | 161,931,029 | | $ | 69,444,743 |
Purchases and sales of US government securities for the year ended March 31, 2010, were as follows:
| | | | | | |
| | | Purchases | | Sales |
Series C | | $ | 11,393,941 | | $ | 9,749,113 |
Series M | | $ | 119,252,193 | | $ | 105,364,691 |
Series S | | $ | 48,952,855 | | $ | 67,771,090 |
Purchases and sales of mortgage dollar rolls for the year ended March 31, 2010, were as follows:
| | | | | | |
| | | Purchases | | Sales |
Series M | | $ | 321,017,918 | | $ | 321,943,253 |
Series S | | $ | 4,321,980 | | $ | 4,335,102 |
Transactions in options written for the year ended March 31, 2010, were as follows:
| | | | | | | | | | | | | | |
| | | Series S | |
| | | Calls | | | Puts | |
| | | Contracts | | | Premiums
Received | | | Contracts | | | Premiums
Received | |
Options outstanding at beginning of year | | — | | | | — | | | 400 | | | $ | 22,200 | |
Options written | | 430 | | | $ | 221,665 | | | 1,550 | | | | 336,791 | |
Options expired | | — | | | | — | | | (1,120 | ) | | | (55,830 | ) |
Options closed | | (430 | ) | | $ | (221,665 | ) | | (438 | ) | | | (236,126 | ) |
Options outstanding at end of year | | — | | | | — | | | 392 | | | $ | 67,035 | |
5. Borrowings:
For the year ended March 31, 2010, the average amount of borrowings and the daily weighted average interest rate in TOBs were as follows:
| | | | | | |
| | | Average
Borrowings | | Daily
Weighted Average Interest
Rate | |
Series N | | $ | 156,178 | | 0.26 | % |
For the year ended March 31, 2010, the average amount of borrowings and the daily weighted average interest rate in treasury rolls and reverse repurchase agreements were as follows:
| | | | | | |
| | | Average
Borrowings | | Daily
Weighted Average Interest
Rate | |
Series C | | $ | 706,401 | | 0.62 | % |
Series S | | $ | 5,282,428 | | 0.30 | % |
6. Income Tax Information:
Reclassifications: Accounting principles generally accepted in the United States of America require that certain components of net assets be adjusted to reflect permanent differences between financial and tax reporting. These reclassifications have no effect on net assets or on net asset values per share. The following permanent differences as of March 31, 2010 attributable to paydowns, the accounting for swap agreements and amortization methods on fixed income securities were reclassified to the following accounts:
| | | | | | | | |
| | | Undistributed
(distributions
in excess of)
net investment
income | | | Accumulated
net realized
gain (loss) | |
Series M | | $ | 476,142 | | | $ | (476,142 | ) |
Series N | | $ | (763 | ) | | $ | 763 | |
Series S | | $ | 129,698 | | | $ | (129,698 | ) |
The tax character of distributions paid during the periods ended March 31, 2010, March 31, 2009 and September 30, 2008 was as follows:
| | | | | | | | | | | | |
| | | Series C | | Series M | | Series N | | Series S |
Tax-exempt income | | | | | | | | | | | | |
3/31/10 | | | — | | | — | | $ | 562,159 | | | — |
4/01/08 to 3/31/09 | | | — | | | — | | $ | 508,494 | | | — |
10/01/08 to 3/31/09 | | | — | | | — | | | — | | | — |
9/30/08 | | | — | | | — | | | — | | | — |
Ordinary income | | | | | | | | | | | | |
3/31/10 | | $ | 20,663,733 | | $ | 15,669,386 | | $ | 2,585 | | $ | 4,836,083 |
10/01/08 to 3/31/09 | | $ | 10,772,288 | | $ | 14,423,839 | | | — | | $ | 1,177,415 |
9/30/08 | | $ | 27,398,793 | | $ | 24,742,027 | | | — | | $ | 1,987,779 |
Long-term capital gain | | | | | | | | | | | | |
3/31/10 | | | — | | | — | | | — | | $ | 75,650 |
10/01/08 to 3/31/09 | | | — | | $ | 2,443,624 | | | — | | $ | 406,530 |
Total distributions | | | | | | | | | | | | |
3/31/10 | | $ | 20,663,733 | | $ | 15,669,386 | | $ | 564,744 | | $ | 4,911,733 |
4/01/08 to 3/31/09 | | | — | | | — | | $ | 508,494 | | | — |
10/01/08 to 3/31/09 | | $ | 10,772,288 | | $ | 16,867,463 | | | — | | $ | 1,583,945 |
9/30/08 | | $ | 27,398,793 | | $ | 24,742,027 | | | — | | $ | 1,987,779 |
| | | | | | |
| | | BLACKROCK BOND ALLOCATION TARGET SHARES | | MARCH 31, 2010 | | 45 |
Notes to Financial Statements (continued)
As of March 31, 2010, the tax components of accumulated net earnings (losses) were as follows:
| | | | | | | | | | | | | | | |
| | | Series C | | | Series M | | | Series N | | | Series S |
Undistributed ordinary income | | | — | | | $ | 49,435 | | | $ | 29,203 | | | $ | 1,289,543 |
Capital loss carryforward | | $ | (26,603,638 | ) | | | (27,731,704 | ) | | | (235,826 | ) | | | — |
Undistributed long-term capital gains | | | — | | | | — | | | | — | | | | 312,373 |
Net unrealized gains* | | | 17,405,052 | | | | 2,898,376 | | | | 329,600 | | | | 2,485,944 |
| | | | | | | | | | | | | | | |
Total | | $ | (9,198,586 | ) | | $ | (24,783,893 | ) | | $ | 122,977 | | | $ | 4,087,860 |
| | | | | | | | | | | | | | | |
| * | The difference between book-basis and tax-basis net unrealized gains is attributable primarily to the difference between book and tax amortization methods for premiums and discounts on fixed income securities, the deferral of post-October capital losses for tax purposes, the realization for tax purposes of unrealized gain/loss on certain futures contracts, the accounting for swap agreements and the treatment of residual interests in tender option bond trusts. |
As of March 31, 2010, Series C, Series M and Series N had capital loss carryforwards available to offset future realized capital gains through the indicated expiration dates:
| | | | | | | | | |
Expiring March 31, | | Series C | | Series M | | Series N |
2014 | | $ | 15,174 | | | — | | | — |
2015 | | | 118,497 | | | — | | | — |
2016 | | | 823,746 | | | — | | | — |
2017 | | | 17,377,457 | | | — | | $ | 65,327 |
2018 | | | 8,268,764 | | $ | 27,731,704 | | | 170,499 |
| | | | | | | | | |
Total | | $ | 26,603,638 | | $ | 27,731,704 | | $ | 235,826 |
| | | | | | | | | |
7. Concentration, Market and Credit Risk:
In the normal course of business, the Funds invest in securities and enter into transactions where risks exist due to fluctuations in the market (market risk) or failure of the issuer of a security to meet all its obligations (credit risk). The value of securities held by the Funds may decline in response to certain events, including those directly involving the issuers whose securities are owned by the Funds; conditions affecting the general economy; overall market changes; local, regional or global political, social or economic instability; and currency and interest rate and price fluctuations. Similar to credit risk, the Funds may be exposed to counterparty risk, or the risk that an entity with which the Funds have unsettled or open transactions may default. The Funds manage counterparty risk by entering into transactions only with counterparties that they believe have the financial resources to honor their obligations and by monitoring the financial stability of those counterparties. Financial assets, which potentially expose the Funds to credit and counterparty risks, consist principally of investments and cash due from counterparties. The extent of the Funds’ exposure to credit and counterparty risks with respect to these financial assets is generally approximated by their value as recorded in the Funds’ Statements of Assets and Liabilities, less any collateral held by the Funds.
Series N invests a significant portion of its assets in securities in the city, county & state and power sectors. Changes in economic conditions affecting the city, county & state and power sectors would have a greater impact on Series N and could affect the value, income and/or liquidity of positions in such securities.
8. Capital Shares Transactions:
Transactions in capital shares were as follows:
| | | | | | | | | |
Series C | | Year Ended
March 31,
2010 | | | Period
October 1, 2008
to
March 31, 2009 | | | Year Ended
September 30,
2008 | |
Shares sold | | 9,070,455 | | | 7,987,560 | | | 11,505,567 | |
Shares issued in reinvestment of dividends | | 106,680 | | | 19,927 | | | 8,434 | |
| | | | | | | | | |
Total issued | | 9,177,135 | | | 8,007,487 | | | 11,514,001 | |
Shares redeemed | | (12,396,010 | ) | | (12,534,818 | ) | | (15,198,201 | ) |
| | | | | | | | | |
Net decrease | | (3,218,875 | ) | | (4,527,331 | ) | | (3,684,200 | ) |
| | | | | | | | | |
| | | | | | |
| 46 | | BLACKROCK BOND ALLOCATION TARGET SHARES | | MARCH 31, 2010 | | |
Notes to Financial Statements (continued)
| | | | | | | | | |
Series M | | Year Ended
March 31,
2010 | | | Period
October 1, 2008
to
March 31, 2009 | | | Year Ended
September 30,
2008 | |
Shares sold | | 10,647,637 | | | 8,887,732 | | | 10,776,955 | |
Shares issued in reinvestment of dividends and distributions | | 88,504 | | | 32,998 | | | 7,355 | |
| | | | | | | | | |
Total issued | | 10,736,141 | | | 8,920,730 | | | 10,784,310 | |
Shares redeemed | | (11,869,093 | ) | | (13,019,873 | ) | | (15,967,742 | ) |
| | | | | | | | | |
Net decrease | | (1,132,952 | ) | | (4,099,143 | ) | | (5,183,432 | ) |
| | | | | | | | | |
| | | |
Series N | | Year Ended
March 31,
2010 | | | Year Ended
March 31, 2009 | | | | |
Shares sold | | — | | | 1,019,820 | | | | |
| | | | | | | | | |
Net increase | | — | | | 1,019,820 | | | | |
| | | | | | | | | |
| | | |
Series S | | Year Ended
March 31,
2010 | | | Period
October 1, 2008
to
March 31, 2009 | | | Year Ended
September 30,
2008 | |
Shares sold | | 9,701,108 | | | 4,852,518 | | | 3,415,519 | |
Shares issued in reinvestment of dividends and distributions | | 27,111 | | | 3,607 | | | 3,154 | |
| | | | | | | | | |
Total issued | | 9,728,219 | | | 4,856,125 | | | 3,418,673 | |
Shares redeemed | | (4,572,939 | ) | | (2,049,097 | ) | | (1,725,130 | ) |
| | | | | | | | | |
Net increase | | 5,155,280 | | | 2,807,028 | | | 1,693,543 | |
| | | | | | | | | |
9. Subsequent Events:
Management has evaluated the impact of all subsequent events on the Funds through the date the financial statements were issued and has determined that there were no subsequent events requiring adjustment or additional disclosure in the financial statements.
| | | | | | |
| | | BLACKROCK BOND ALLOCATION TARGET SHARES | | MARCH 31, 2010 | | 47 |
Report of Independent Registered Public Accounting Firm
To the Board of Trustees and Shareholders of BlackRock Bond Allocation Target Shares:
We have audited the accompanying statements of assets and liabilities, including the schedules of investments, of the Series C, Series M, Series N, and Series S Portfolios [four of the five portfolios constituting the BlackRock Bond Allocation Target Shares (the “Fund”), (collectively, “the Portfolios”)] as of March 31, 2010, and the related statements of operations for the year then ended, the statements of changes in net assets for the year then ended, for the period October 1, 2008 to March 31, 2009, and for the year ended September 30, 2008 for the Series C, Series M, and Series S Portfolios, and for each of the two years for the period ended March 31, 2010 for the Series N Portfolio, and the financial highlights for each of the periods presented. These financial statements and financial highlights are the responsibility of the Fund’s management. Our responsibility is to express an opinion on these financial statements and financial highlights based on our audits.
We conducted our audits in accordance with the standards of the Public Company Accounting Oversight Board (United States). Those standards require that we plan and perform the audit to obtain reasonable assurance about whether the financial statements and financial highlights are free of material misstatement. The Fund is not required to have, nor were we engaged to perform, an audit of its internal control over financial reporting. Our audits included consideration of internal control over financial reporting as a basis for designing audit procedures that are appropriate in the circumstances, but not for the purpose of expressing an opinion on the effectiveness of the Fund’s internal control over financial reporting. Accordingly, we express no such opinion. An audit also includes examining, on a test basis, evidence supporting the amounts and disclosures in the financial statements, assessing the accounting principles used and significant estimates made by management, as well as evaluating the overall financial statement presentation. Our procedures included confirmation of securities owned as of March 31, 2010, by correspondence with the custodian and brokers; where replies were not received from brokers, we performed other auditing procedures. We believe that our audits provide a reasonable basis for our opinion.
In our opinion, the financial statements and financial highlights referred to above present fairly, in all material respects, the financial position of each of the Portfolios constituting the Fund as of March 31, 2010, the results of their operations, the changes in their net assets, and the financial highlights for each of the periods presented, in conformity with accounting principles generally accepted in the United States of America.
Deloitte & Touche LLP
Philadelphia, Pennsylvania
May 25, 2010
Important Tax Information (Unaudited)
All of the net investment income distributions paid monthly by Series N during the taxable year ended March 31, 2010 qualifies as tax-exempt interest dividends for Federal income tax purposes.
The following information is provided with respect to the ordinary income dividends paid by the Funds for the fiscal year ended March 31, 2010:
| | | | | | |
Interest Related Dividends and Qualified Short-Term Gains for Non-US Residents | |
| | | April 2009 -
December 2009 | | | January 2010 -
March 2010 | |
Series C | | 74.42 | %* | | 69.40 | %* |
Series M | | 99.91 | %* | | 100.00 | %* |
Series S | | 91.11 | %* | | 81.64 | %* |
| | | |
Federal Obligation Interest** | |
Series M | | 13.10 | % |
Series S | | 1.32 | % |
| * | Represents the portion of the ordinary income dividends eligible for exemption from US withholding tax for nonresident aliens and foreign corporations. |
| ** | The law varies in each state as to whether and what percentage of ordinary income dividends attributable to Federal obligations is exempt from state income tax. We recommend that you consult your tax advisor to determine if any portion of the dividends you received is exempt from state income taxes. |
Additionally, Series S distributed Long-Term Capital Gains per share to shareholders of record on June 17, 2009 as follows.
| | | |
| | | Long-Term
Capital Gain |
Series S | | $ | 0.007876 |
| | | | | | |
| 48 | | BLACKROCK BOND ALLOCATION TARGET SHARES | | MARCH 31, 2010 | | |
Officers and Trustees
| | | | | | | | | | |
Name, Address, and Year of Birth | | Position(s)
Held with Fund | | Length of
Time Served
as a Trustee2 | | Principal Occupation(s) During Past 5 Years | | Number of BlackRock-
Advised Registered
Investment Companies
(“RICs”) Consisting of
Investment Portfolios
(“Portfolios”) Overseen | | Public Directorships |
Non-Interested Trustees1 | | | | | | |
| | | | | |
Robert M. Hernandez 55 East 52nd Street New York, NY 10055 1944 | | Chairman of the Board, Trustee and Member of the Audit Committee | | Since 2004 | | Director, Vice Chairman and Chief Financial Officer of USX Corporation (energy and steel business) from 1991 to 2001. | | 34 RICs consisting of 97 Portfolios | | ACE Limited (insurance company); Eastman Chemical Company (chemical); RTI International Metals, Inc. (metals); TYCO Electronics (electronics) |
| | | | | |
Fred G. Weiss 55 East 52nd Street New York, NY 10055 1941 | | Vice Chairman of the Board, Chairman of the Audit Committee and Trustee | | Since 2007 | | Managing Director, FGW Associates (consulting and investment company) since 1997; Director, Michael J. Fox Foundation for Parkinson’s Research since 2000; Director, BTG International Plc (a global technology commercialization company) from 2001 to 2007. | | 34 RICs consisting of 97 Portfolios | | Watson Pharmaceutical Inc. |
| | | | | |
James H. Bodurtha 55 East 52nd Street New York, NY 10055 1944 | | Trustee | | Since 2007 | | Director, The China Business Group, Inc. (consulting firm) since 1996 and Executive Vice President thereof from 1996 to 2003; Chairman of the Board, Berkshire Holding Corporation since 1980. | | 34 RICs consisting of 97 Portfolios | | None |
| | | | | |
Bruce R. Bond 55 East 52nd Street New York, NY 10055 1946 | | Trustee | | Since 2005 | | Trustee and Member of the Governance Committee, State Street Research Mutual Funds from 1997 to 2005; Board Member of Governance, Audit and Finance Committee, Avaya Inc. (computer equipment) from 2003 to 2007. | | 34 RICs consisting of 97 Portfolios | | None |
| | | | | |
Donald W. Burton 55 East 52nd Street New York, NY 10055 1944 | | Trustee | | Since 2007 | | Managing General Partner, The Burton Partnership, LP (an investment partnership) since 1979; Managing General Partner, The South Atlantic Venture Funds since 1983; Member of the Investment Advisory Council of the Florida State Board of Administration from 2001 to 2007. | | 34 RICs consisting of 97 Portfolios | | Knology, Inc. (telecommunications); Capital Southwest (financial) |
| | | | | |
Honorable Stuart E. Eizenstat 55 East 52nd Street New York, NY 10055 1943 | | Trustee | | Since 2004 | | Partner and Head of International Practice, Covington and Burling (law firm) since 2001; International Advisory Board Member, The Coca Cola Company since 2002; Advisory Board Member, BT Americas (telecommunications) since 2004; Member of the Board of Directors, Chicago Climate Exchange (environmental) since 2006; Member of the International Advisory Board GML (energy) since 2003. | | 34 RICs consisting of 97 Portfolios | | Alcatel-Lucent (telecommunications); Global Specialty Metallurgical (metallurgical industry); UPS Corporation (delivery service) |
| | | | | |
Kenneth A. Froot 55 East 52nd Street New York, NY 10055 1957 | | Trustee | | Since 2007 | | Professor, Harvard University since 1992. | | 34 RICs consisting of 97 Portfolios | | None |
| | | | | |
John F. O’Brien 55 East 52nd Street New York, NY 10055 1943 | | Trustee | | Since 2007 | | Trustee, Woods Hole Oceanographic Institute since 2003; Director, Allmerica Financial Corporation from 1995 to 2003; Director, ABIOMED from 1989 to 2006; Director, Ameresco, Inc. (energy solutions company) from 2006 to 2007. | | 34 RICs consisting of 97 Portfolios | | Cabot Corporation (chemicals); LKQ Corporation (auto parts manufacturing); TJX Companies, Inc. (retailer) |
| | | | | |
Roberta Cooper Ramo 55 East 52nd Street New York, NY 10055 1942 | | Trustee | | Since 2007 | | Shareholder, Modrall, Sperling, Roehl, Harris & Sisk, P.A. (law firm) since 1993; Chairman of the Board, Cooper’s Inc., (retail) since 2000; Director of ECMC Group (service provider to students, schools and lenders) since 2001; President, The American Law Institute (non-profit), since 2008; President, American Bar Association from 1995 to 1996. | | 34 RICs consisting of 97 Portfolios | | None |
| | | | | | |
| | | BLACKROCK BOND ALLOCATION TARGET SHARES | | MARCH 31, 2010 | | 49 |
Officers and Trustees (continued)
| | | | | | | | | | |
Name, Address, and Year of Birth | | Position(s)
Held with Fund | | Length of
Time Served
as a Trustee2 | | Principal Occupation(s) During Past 5 Years | | Number of BlackRock-
Advised Registered
Investment Companies
(“RICs”) Consisting of
Investment Portfolios
(“Portfolios”) Overseen | | Public Directorships |
Non-Interested Trustees1 (concluded) | | | | | | |
| | | | | |
David H. Walsh 55 East 52nd Street New York, NY 10055 1941 | | Trustee | | Since 2007 | | Director, National Museum of Wildlife Art since 2007; Director, Ruckleshaus Institute and Haub School of Natural Resources at the University of Wyoming from 2006 to 2008; Trustee, University of Wyoming Foundation since 2008; Director, The American Museum of Fly Fishing since 1997; Director, The National Audubon Society from 1998 to 2005. | | 34 RICs consisting of 97 Portfolios | | None |
| | | | | |
Richard R. West 55 East 52nd Street New York, NY 10055 1938 | | Trustee and Member of the Audit Committee | | Since 2007 | | Dean Emeritus, New York University’s Leonard N. Stern School of Business Administration since 1995. | | 34 RICs consisting of 97 Portfolios | | Bowne & Co., Inc. (financial printers); Vornado Realty Trust (real estate company); Alexander’s Inc. (real estate company) |
| 1 | Trustees serve until their resignation, removal or death, or until December 31 of the year in which they turn 72. |
| 2 | Date shown is the earliest date a person has served as a trustee for the Fund covered by this annual report. Following the combination of Merrill Lynch Investment Managers, L.P. (“MLIM”) and BlackRock, Inc. (“BlackRock”) in September 2006, the various legacy MLIM and legacy BlackRock Fund boards were realigned and consolidated into three new Fund boards in 2007. As a result, although the chart shows certain Trustees as joining the Fund’s board in 2007, each Trustee first became a member of the boards of other legacy MLIM or legacy BlackRock Funds as follows: James H. Bodurtha, 1995; Bruce R. Bond, 2005; Donald W. Burton, 2002; Stuart E. Eizenstat, 2001; Kenneth A. Froot, 2005; Robert M. Hernandez, 1996; John F. O’Brien, 2004; Roberta Cooper Ramo, 2000; David H. Walsh, 2003; Fred G. Weiss, 1998; and Richard R. West, 1978. |
| | | | | | | | | | |
Interested Trustees3 | | | | | | |
| | | | | |
Richard S. Davis 55 East 52nd Street New York, NY 10055 1945 | | Trustee | | Since 2005 | | Managing Director, BlackRock, Inc. since 2005; Chief Executive Officer, State Street Research & Management Company from 2000 to 2005; Chairman of the Board of Trustees, State Street Research Mutual Funds from 2000 to 2005; Chairman, SSR Realty from 2000 to 2004. | | 169 RICs consisting of 298 Portfolios | | None |
| | | | | |
Laurence D. Fink 55 East 52nd Street New York, NY 10055 1952 | | Trustee | | Since 2004 | | Chairman and Chief Executive Officer of BlackRock, Inc. since its formation in 1998 and of BlackRock, Inc.’s predecessor entities since 1988 and Chairman of the Executive and Management Committees; Formerly Managing Director, The First Boston Corporation, Member of its Management Committee, Co-head of its Taxable Fixed Income Division and Head of its Mortgage and Real Estate Products Group; Chairman of the Board of several of BlackRock’s alternative investment vehicles; Director of several of BlackRock’s offshore funds; Member of the Board of Trustees of New York University, Chair of the Financial Affairs Committee and a member of the Executive Committee, the Ad Hoc Committee on Board Governance, and the Committee on Trustees; Co-Chairman of the NYU Hospitals Center Board of Trustees, Chairman of the Development/Trustee Stewardship Committee and Chairman of the Finance Committee; Trustee, The Boys’ Club of New York. | | 34 RICs consisting of 97 Portfolios | | None |
| | | | | |
Henry Gabbay 55 East 52nd Street New York, NY 10055 1947 | | Trustee | | Since 2007 | | Consultant, BlackRock, Inc. from 2007 to 2008; Managing Director, BlackRock, Inc. from 1989 to 2007; Chief Administrative Officer, BlackRock Advisors, LLC from 1998 to 2007; President of BlackRock Funds and BlackRock Bond Allocation Target Shares from 2005 to 2007 and Treasurer of certain closed-end funds in the BlackRock fund complex from 1989 to 2006. | | 169 RICs consisting of 298 Portfolios | | None |
| 3 | Messrs. Davis and Fink are both “interested persons,” as defined in the Investment Company Act of 1940, of the Fund based on their positions with BlackRock, Inc. and its affiliates. Mr. Gabbay is an “interested person” of the Fund based on his former positions with BlackRock, Inc. and its affiliates as well as his ownership of BlackRock, Inc. and PNC securities. Trustees serve until their resignation, removal or death, or until December 31 of the year in which they turn 72. |
| | | | | | |
| | | BLACKROCK BOND ALLOCATION TARGET SHARES | | MARCH 31, 2010 | | 50 |
Officers and Trustees (concluded)
| | | | | | |
Name, Address, and Year of Birth | | Position(s)
Held with Fund | | Length of
Time Served | | Principal Occupation(s) During Past 5 Years |
Fund Officers1 | | |
| | | |
Anne F. Ackerley 55 East 52nd Street New York, NY 10055 1962 | | President and Chief Executive Officer | | Since 2009 | | Managing Director of BlackRock, Inc. since 2000; Vice President of the BlackRock-advised funds from 2007 to 2009; Chief Operating Officer of BlackRock’s Global Client Group (GCG) since 2009; Chief Operating Officer of BlackRock’s U.S. Retail Group from 2006 to 2009; Head of BlackRock’s Mutual Fund Group from 2000 to 2006. |
| | | |
Jeffery Holland, CFA 55 East 52nd Street New York, NY 10055 1971 | | Vice President | | Since 2009 | | Managing Director of BlackRock, Inc. since 2010; Director of BlackRock, Inc. from 2006 to 2009; Chief Operating Officer of BlackRock’s U.S. Retail Group since 2009; Co-head of Product Development and Management for BlackRock’s U.S. Retail Group from 2007 to 2009; Product Manager of Raymond James & Associates from 2003 to 2006. |
| | | |
Brendan Kyne 55 East 52nd Street New York, NY 10055 1977 | | Vice President | | Since 2009 | | Managing Director of BlackRock, Inc. since 2010; Director of BlackRock, Inc. from 2008 to 2009; Head of Product Development and Management for BlackRock’s U.S. Retail Group since 2009, co-head thereof from 2007 to 2009; Vice President of BlackRock, Inc. from 2005 to 2008. |
| | | |
Brian Schmidt 55 East 52nd Street New York, NY 10055 1958 | | Vice President | | Since 2009 | | Managing Director of BlackRock, Inc. since 2004; Various positions with U.S. Trust Company from 1991 to 2003 including Director from 2001 to 2003 and Senior Vice President from 1998 to 2003; Vice President, Chief Financial Officer and Treasurer of Excelsior Funds, Inc., Excelsior Tax-Exempt Funds, Inc. and Excelsior Funds Trust from 2001 to 2003. |
| | | |
Neal J. Andrews 55 East 52nd Street New York, NY 10055 1966 | | Chief Financial Officer | | Since 2007 | | Managing Director of BlackRock, Inc. since 2006; Senior Vice President and Line of Business Head of Fund Accounting and Administration at PNC Global Investment Servicing (U.S.) Inc. from 1992 to 2006. |
| | | |
Jay M. Fife 55 East 52nd Street New York, NY 10055 1970 | | Treasurer | | Since 2007 | | Managing Director of BlackRock, Inc. since 2007 and Director in 2006; Assistant Treasurer of the Merrill Lynch Investment Managers, L.P. (“MLIM”) and Fund Asset Management, L.P. advised funds from 2005 to 2006; Director of MLIM Fund Services Group from 2001 to 2006. |
| | | |
Brian P. Kindelan 55 East 52nd Street New York, NY 10055 1959 | | Chief Compliance Officer | | Since 2007 | | Chief Compliance Officer of the BlackRock-advised Funds since 2007; Managing Director and Senior Counsel of BlackRock, Inc. since 2005. |
| | | |
Howard B. Surloff 55 East 52nd Street New York, NY 10055 1965 | | Secretary | | Since 2007 | | Managing Director and General Counsel of U.S. Funds at BlackRock, Inc. since 2006; General Counsel (U.S.) of Goldman Sachs Asset Management, L.P. from 1993 to 2006. |
| 1 | Officers of the Trust serve at the pleasure of the Board. |
Further information about the Trust’s Officers and Trustees is available in the Trust’s Statement of Additional Information, which can be obtained without charge by calling 1-800-441-7762.
Investment Advisor
BlackRock Advisors, LLC
Wilmington, DE 19809
Legal Counsel
Willkie Farr & Gallagher LLP
New York, NY 10019
Accounting Agent, Administrator and Transfer Agent
PNC Global Investment Servicing (U.S.) Inc.
Wilmington, DE 19809
Independent Registered Public Accounting Firm
Deloitte & Touche LLP
Philadelphia, PA 19103
Custodian
PFPC Trust Company
Philadelphia, PA 19153
Address of the Trust
100 Bellevue Parkway
Wilmington, DE 19809
Distributor
BlackRock Investments, LLC
New York, NY 10022
| | | | | | |
| | | BLACKROCK BOND ALLOCATION TARGET SHARES | | MARCH 31, 2010 | | 51 |
Additional Information
General Information
Householding
The Funds will mail only one copy of shareholder documents, including annual and semi-annual reports and proxy statements, to shareholders with multiple accounts at the same address. This practice is commonly called “householding” and it is intended to reduce expenses and eliminate duplicate mailings of shareholder documents. Mailings of your shareholder documents may be householded indefinitely unless you instruct us otherwise. If you do not want the mailing of these documents to be combined with those for other members of your household, please contact the Funds at (800) 441-7762.
Availability of Quarterly Portfolio Schedule
The Funds file their complete schedule of portfolio holdings with the Securities and Exchange Commission (the “SEC”) for the first and third quarters of each fiscal year on Form N-Q. The Funds’ Forms N-Q are available on the SEC’s website at http://www.sec.gov and may also be reviewed and copied at the SEC’s Public Reference Room in Washington, D.C. Information on the operation of the Public Reference Room may be obtained by calling (800) SEC-0330. The Funds’ Forms N-Q may also be obtained upon request and without charge by calling (800) 441-7762.
Availability of Proxy Voting Policies and Procedures
A description of the policies and procedures that the Funds use to determine how to vote proxies relating to portfolio securities is available (1) without charge, upon request, by calling (800) 441-7762; (2) at www.blackrock.com and (3) on the SEC’s website at http:// www.sec.gov.
Availability of Proxy Voting Record
Information about how the Funds voted proxies relating to securities held in the Funds’ portfolios during the most recent 12-month period ended June 30 is available upon request and without charge (1) at www.blackrock.com or by calling (800) 441-7762 and (2) on the SEC’s website at http://www.sec.gov.
BlackRock Privacy Principles
BlackRock is committed to maintaining the privacy of its current and former fund investors and individual clients (collectively, “Clients”) and to safeguarding their nonpublic personal information. The following information is provided to help you understand what personal information BlackRock collects, how we protect that information and why in certain cases we share such information with select parties.
If you are located in a jurisdiction where specific laws, rules or regulations require BlackRock to provide you with additional or different privacy-related rights beyond what is set forth below, then BlackRock will comply with those specific laws, rules or regulations.
BlackRock obtains or verifies personal nonpublic information from and about you from different sources, including the following: (i) information we receive from you or, if applicable, your financial intermediary, on applications, forms or other documents; (ii) information about your transactions with us, our affiliates, or others; (iii) information we receive from a consumer reporting agency; and (iv) from visits to our websites.
BlackRock does not sell or disclose to non-affiliated third parties any nonpublic personal information about its Clients, except as permitted by law or as is necessary to respond to regulatory requests or to service Client accounts. These non-affiliated third parties are required to protect the confidentiality and security of this information and to use it only for its intended purpose.
We may share information with our affiliates to service your account or to provide you with information about other BlackRock products or services that may be of interest to you. In addition, BlackRock restricts access to nonpublic personal information about its Clients to those BlackRock employees with a legitimate business need for the information. BlackRock maintains physical, electronic and procedural safeguards that are designed to protect the nonpublic personal information of its Clients, including procedures relating to the proper storage and disposal of such information.
| | | | | | |
| 52 | | BLACKROCK BOND ALLOCATION TARGET SHARES | | MARCH 31, 2010 | | |
[THIS PAGE INTENTIONALLY LEFT BLANK.]
[THIS PAGE INTENTIONALLY LEFT BLANK.]
[THIS PAGE INTENTIONALLY LEFT BLANK.]

This report is transmitted to shareholders only. It is not authorized for use as an offer of sale or a solicitation of an offer to buy shares of the Funds unless accompanied or preceded by the Funds’ current prospectus. Past performance results shown in this report should not be considered a representation of future performance. Investment returns and principal value of shares will fluctuate so that shares, when redeemed, may be worth more or less than their original cost. Statements and other information herein are as dated and are subject to change.

BATS-3/10-AR
| | | | |
| Item 2 | | – | | Code of Ethics – The registrant (or the “Fund”) has adopted a code of ethics, as of the end of the period covered by this report, applicable to the registrant’s principal executive officer, principal financial officer and principal accounting officer, or persons performing similar functions. During the period covered by this report, there have been no amendments to or waivers granted under the code of ethics. A copy of the code of ethics is available without charge at www.blackrock.com. |
| | |
| Item 3 | | – | | Audit Committee Financial Expert – The registrant’s board of directors or trustees, as applicable (the “board of directors”) has determined that (i) the registrant has the following audit committee financial experts serving on its audit committee and (ii) each audit committee financial expert is independent: |
| | |
| | | | Robert M. Hernandez Fred G. Weiss Richard R. West |
| | |
| | | | Under applicable securities laws, a person determined to be an audit committee financial expert will not be deemed an “expert” for any purpose, including without limitation for the purposes of Section 11 of the Securities Act of 1933, as a result of being designated or identified as an audit committee financial expert. The designation or identification as an audit committee financial expert does not impose on such person any duties, obligations, or liabilities greater than the duties, obligations, and liabilities imposed on such person as a member of the audit committee and board of directors in the absence of such designation or identification. |
| | |
| Item 4 | | – | | Principal Accountant Fees and Services |
| | | | | | | | | | | | | | | | | | | | | | | | |
| | | (a) Audit Fees | | (b) Audit-Related Fees1 | | (c) Tax Fees2 | | (d) All Other Fees3 |
Entity Name | | Current
Fiscal Year
End | | Previous
Fiscal Year
End | | Current
Fiscal Year
End | | Previous
Fiscal Year
End | | Current
Fiscal Year
End | | Previous
Fiscal Year
End | | Current
Fiscal Year
End | | Previous
Fiscal Year
End |
Series C Portfolio | | $ | 32,100 | | $ | 32,100 | | $ | 0 | | $ | 0 | | $ | 6,100 | | $ | 6,100 | | $ | 104 | | $ | 1,028 |
Series M Portfolio | | $ | 32,100 | | $ | 32,100 | | $ | 0 | | $ | 0 | | $ | 6,100 | | $ | 6,100 | | $ | 96 | | $ | 1,028 |
Series N Portfolio | | $ | 32,200 | | $ | 32,200 | | $ | 0 | | $ | 0 | | $ | 6,100 | | $ | 6,100 | | $ | 3 | | $ | 1,028 |
Series S Portfolio | | $ | 32,100 | | $ | 32,100 | | $ | 0 | | $ | 0 | | $ | 6,100 | | $ | 6,100 | | $ | 21 | | $ | 1,028 |
| 1 | The nature of the services include assurance and related services reasonably related to the performance of the audit of financial statements not included in Audit Fees. |
| 2 | The nature of the services include tax compliance, tax advice and tax planning. |
| 3 | The nature of the services include a review of compliance procedures and attestation thereto. |
(e)(1) Audit Committee Pre-Approval Policies and Procedures:
The registrant’s audit committee (the “Committee”) has adopted policies and procedures with regard to the pre-approval of services. Audit, audit-related and tax compliance services provided to the registrant on an annual basis require specific pre-approval by the Committee. The Committee also must approve other non-audit services provided to the registrant and those non-audit services provided to the registrant’s affiliated service providers that relate directly to the operations and the financial reporting of the registrant. Certain of these non-audit services that the Committee believes are a) consistent with the SEC’s auditor independence rules and b) routine and recurring services that will not impair the independence of the independent accountants may be approved by the Committee without consideration on a specific case-by-case basis (“general pre-approval”). The term of any general pre-approval is 12 months from the date of the pre-approval, unless the Committee provides for a different period. Tax or other non-audit services provided to the registrant which have a direct impact on the operation or financial reporting of the registrant will only be
deemed pre-approved provided that any individual project does not exceed $10,000 attributable to the registrant or $50,000 for all of the registrants the Committee oversees. For this purpose, multiple projects will be aggregated to determine if they exceed the previously mentioned cost levels.
Any proposed services exceeding the pre-approved cost levels will require specific pre-approval by the Committee, as will any other services not subject to general pre-approval (e.g., unanticipated but permissible services). The Committee is informed of each service approved subject to general pre-approval at the next regularly scheduled in-person board meeting. At this meeting, an analysis of such services is presented to the Committee for ratification. The Committee may delegate to one or more of its members the authority to approve the provision of and fees for any specific engagement of permitted non-audit services, including services exceeding pre-approved cost levels.
(e)(2) None of the services described in each of Items 4(b) through (d) were approved by the audit committee pursuant to paragraph (c)(7)(i)(C) of Rule 2-01 of Regulation S-X.
(f) Not Applicable
(g) Affiliates’ Aggregate Non-Audit Fees:
| | | | | | |
Entity Name | | Current Fiscal Year
End | | Previous Fiscal Year
End |
Series C Portfolio | | $ | 16,981 | | $ | 414,628 |
Series M Portfolio | | $ | 16,973 | | $ | 414,628 |
Series N Portfolio | | $ | 16,880 | | $ | 414,628 |
Series S Portfolio | | $ | 16,898 | | $ | 414,628 |
(h) The registrant’s audit committee has considered and determined that the provision of non-audit services that were rendered to the registrant’s investment adviser (not including any non-affiliated sub-adviser whose role is primarily portfolio management and is subcontracted with or overseen by the registrant’s investment adviser), and any entity controlling, controlled by, or under common control with the investment adviser that provides ongoing services to the registrant that were not pre-approved pursuant to paragraph (c)(7)(ii) of Rule 2-01 of Regulation S-X is compatible with maintaining the principal accountant’s independence. Regulation S-X Rule 2-01(c)(7)(ii) – $10,777, 0%
| | | | |
| Item 5 | | – | | Audit Committee of Listed Registrants – Not Applicable |
| | |
| Item 6 | | – | | Investments (a) The registrant’s Schedule of Investments is included as part of the Report to Stockholders filed under Item 1 of this form. (b) Not Applicable due to no such divestments during the semi-annual period covered since the previous Form N-CSR filing. |
| | |
| Item 7 | | – | | Disclosure of Proxy Voting Policies and Procedures for Closed-End Management Investment Companies – Not Applicable |
| | |
| Item 8 | | – | | Portfolio Managers of Closed-End Management Investment Companies – Not Applicable |
| | | | |
| Item 9 | | – | | Purchases of Equity Securities by Closed-End Management Investment Company and Affiliated Purchasers – Not Applicable |
| | |
| Item 10 | | – | | Submission of Matters to a Vote of Security Holders – The registrant’s Nominating and Governance Committee will consider nominees to the board of directors recommended by shareholders when a vacancy becomes available. Shareholders who wish to recommend a nominee should send nominations that include biographical information and set forth the qualifications of the proposed nominee to the registrant’s Secretary. There have been no material changes to these procedures. |
| | |
| Item 11 | | – | | Controls and Procedures |
| | |
| 11(a) | | – | | The registrant’s principal executive and principal financial officers or persons performing similar functions have concluded that the registrant’s disclosure controls and procedures (as defined in Rule 30a-3(c) under the Investment Company Act of 1940, as amended (the “1940 Act”)) are effective as of a date within 90 days of the filing of this report based on the evaluation of these controls and procedures required by Rule 30a-3(b) under the 1940 Act and Rule 15(d)-15(b) under the Securities Exchange Act of 1934, as amended. |
| | |
| 11(b) | | – | | There were no changes in the registrant’s internal control over financial reporting (as defined in Rule 30a-3(d) under the 1940 Act) that occurred during the second fiscal quarter of the period covered by this report that have materially affected, or are reasonably likely to materially affect, the registrant’s internal control over financial reporting. |
| | |
| Item 12 | | – | | Exhibits attached hereto |
| | |
| 12(a)(1) | | – | | Code of Ethics – See Item 2 |
| | |
| 12(a)(2) | | – | | Certifications – Attached hereto |
| | |
| 12(a)(3) | | – | | Not Applicable |
| | |
| 12(b) | | – | | Certifications – Attached hereto |
Pursuant to the requirements of the Securities Exchange Act of 1934 and the Investment Company Act of 1940, the registrant has duly caused this report to be signed on its behalf by the undersigned, thereunto duly authorized.
| | | | | | |
BlackRock Bond Allocation Target Shares |
| | | |
| By: | | /s/ Anne F. Ackerley | | | | |
| | Anne F. Ackerley |
| | Chief Executive Officer of BlackRock Bond Allocation Target Shares |
Date: May 27, 2010
Pursuant to the requirements of the Securities Exchange Act of 1934 and the Investment Company Act of 1940, this report has been signed below by the following persons on behalf of the registrant and in the capacities and on the dates indicated.
| | | | | | |
| By: | | /s/ Anne F. Ackerley | | | | |
| | Anne F. Ackerley | | | | |
| | Chief Executive Officer (principal executive officer) of BlackRock Bond Allocation Target Shares |
Date: May 27, 2010
| | | | | | |
| By: | | /s/ Neal J. Andrews | | | | |
| | Neal J. Andrews |
| | Chief Financial Officer (principal financial officer) of BlackRock Bond Allocation Target Shares |
Date: May 27, 2010