UNITED STATES
SECURITIES AND EXCHANGE COMMISSION
Washington, D.C. 20549
FORM N-CSR
CERTIFIED SHAREHOLDER REPORT OF REGISTERED
MANAGEMENT INVESTMENT COMPANIES
Investment Company Act file number 811-21457
Name of Fund: BlackRock Bond Allocation Target Shares
Series C Portfolio
Series M Portfolio
Series N Portfolio
Series S Portfolio
Fund Address: 100 Bellevue Parkway, Wilmington, DE 19809
Name and address of agent for service: John M. Perlowski, Chief Executive Officer, BlackRock Bond Allocation Target Shares, 55 East 52nd Street, New York, NY 10055
Registrant’s telephone number, including area code: (800) 441-7762
Date of fiscal year end: 03/31/2011
Date of reporting period: 03/31/2011
| | | | |
| Item 1 | | – | | Report to Stockholders |
| | |
 | | March 31, 2011 |
Annual Report
BlackRock Bond Allocation Target Shares
Not FDIC Insured ¡ No Bank Guarantee ¡ May Lose Value
Table of Contents
| | | | | | |
| 2 | | BLACKROCK BOND ALLOCATION TARGET SHARES | | MARCH 31, 2011 | | |
Dear Shareholder
Over the past 12 months, we have seen a sluggish, stimulus-driven economic recovery at long last gain real traction, accelerate, and transition into a consumption-driven expansion. For the most part, 2010 was plagued with widely fluctuating economic data, but as the year drew to a close, it became clear that cyclical stimulus had beaten out structural problems as economic data releases generally became more positive and financial markets showed signs of continuing improvement. Although the sovereign debt crises and emerging market inflation that troubled the global economy in 2010 remain a challenge today, overall investor sentiment had improved considerably. In the first quarter of 2011, significant global events gave rise to new concerns about the future of the global economy. Political turmoil spread across the Middle East/North Africa (“MENA”) region, oil and other commodity prices soared, and markets recoiled as the nuclear crisis unfolded in the wake of a 9.0-magnitude earthquake and tsunami that struck Japan in March. These events shook investor confidence, but the global economic recovery would not be derailed.
In the United States, strength from the corporate sector and increasing consumer spending have been key drivers of economic growth, while the housing and labor markets have been the heaviest burdens. While housing has yet to show any meaningful sign of improvement, labor statistics have become increasingly positive in recent months.
Global equity markets experienced uneven growth and high volatility over the course of 2010, but ended the year strong. Following a strong start to 2011, the aforementioned headwinds brought high volatility back to equity markets. A pick up in inflationary pressures caused emerging market equities to underperform developed markets, where threats of inflation remained relatively subdued. Overall, equities posted strong returns for the 12-month period. US stocks outpaced most international markets and small cap stocks outperformed large caps as investors moved into higher-risk assets.
Fixed income markets saw yields trend lower over most of 2010, until the fourth quarter brought an abrupt reversal in sentiment and risk tolerance that drove yields sharply upward (pushing bond prices down) through year end. Improving economic data continued to pressure fixed income yields in 2011; however, escalating geopolitical risks have acted as a counterweight, restoring relative stability to yield movements. Global credit markets were surprisingly resilient in the face of major headwinds during the first quarter. Yield curves globally remained steep by historical standards and higher- risk sectors continued to outperform higher-quality assets.
The tax-exempt municipal market enjoyed a powerful rally during the period of low interest rates in 2010; however, when the yield trend reversed, the market was dealt an additional blow as it became evident that the Build America Bond program would expire at year end. In addition, negative headlines regarding fiscal challenges faced by state and local governments damaged investor confidence and further heightened volatility in the municipal market. Tax-exempt mutual funds experienced heavy outflows, resulting in wider quality spreads and further downward pressure on municipal bond prices. These headwinds began to abate in 2011 and the tax-exempt municipal market staged a mild rebound in the first quarter.
Cash investments, as represented by the 3-month Treasury bill, returned only a fraction over 0% for the 12-month period as short-term interest rates remained low. Yields on money market securities remain near all-time lows.
| | | | | | | | | | |
Total Returns as of March 31, 2011 | | 6-month | | 12-month |
US large cap equities (S&P 500 Index) | | | | 17.31 | % | | | | 15.65 | % |
US small cap equities (Russell 2000 Index) | | | | 25.48 | | | | | 25.79 | |
International equities (MSCI Europe, Australasia, Far East Index) | | | | 10.20 | | | | | 10.42 | |
3-month Treasury bill (BofA Merrill Lynch 3-Month Treasury Bill Index) | | | | 0.09 | | | | | 0.16 | |
US Treasury securities (BofA Merrill Lynch 10-Year US Treasury Index) | | | | (5.90 | ) | | | | 6.52 | |
US investment grade bonds (Barclays Capital US Aggregate Bond Index) | | | | (0.88 | ) | | | | 5.12 | |
Tax-exempt municipal bonds (Barclays Capital Municipal Bond Index) | | | | (3.68 | ) | | | | 1.63 | |
US high yield bonds (Barclays Capital US Corporate High Yield 2% Issuer Capped Index) | | | | 7.24 | | | | | 14.26 | |
Past performance is no guarantee of future results. Index performance shown for illustrative purposes only. You cannot invest directly in an index.
While no one can peer into a crystal ball and eliminate the uncertainties presented by the economic landscape and financial markets, BlackRock can offer investors the next best thing: partnership with the world’s largest asset management firm and a unique global perspective that allows us to identify trends early and capitalize on market opportunities. For additional market perspective and investment insight, visit www.blackrock.com/shareholdermagazine, where you’ll find the most recent issue of our award-winning Shareholder® magazine, as well as its quarterly companion newsletter, Shareholder Perspectives. As always, we thank you for entrusting BlackRock with your investments, and we look forward to your continued partnership in the months and years ahead.
Sincerely,
|
 |
Rob Kapito President, BlackRock Advisors, LLC |
| | | | | | |
| | | THIS PAGE NOT PART OF YOUR FUND REPORT | | 3 |
| | |
| Fund Summary as of March 31, 2011 | | Series C Portfolio |
Investment Objective
Series C Portfolio’s (the “Fund”) investment objective is to seek to maximize total return, consistent with income generation and prudent investment management.
Portfolio Management Commentary
How did the Fund perform?
| | • | | The Fund outperformed its benchmark, the Barclays Capital US Credit Index, for the 12-month period. Because shares of the Fund can be purchased or held only by or on behalf of certain separately managed account clients and represent only a portion of the broader separately managed account, comparisons of the Fund’s performance relative to its benchmark will differ from comparisons of the benchmark against the performance of the separately managed accounts. |
What factors influenced performance?
| | • | | The Fund’s exposure to investment grade corporate debt with an overweight bias to the financial sector had a positive impact on performance for the period. Despite macroeconomic concerns, investment grade credit rallied during the period, driven by strong earnings and well capitalized balance sheets. |
| | • | | The Fund’s modest allocation to US Treasury securities, which are not included in the benchmark index, slightly detracted from performance as investment grade credit rallied during the period. |
Describe recent portfolio activity.
| | • | | The Fund’s overall positioning did not change significantly over the 12-month period. We tactically increased the Fund’s allocation to US Treasury securities in order to mitigate some credit risk in the portfolio. |
Describe Fund positioning at period end.
| | • | | At period end, the Fund was slightly underweight investment grade corporate debt relative to the benchmark with modest out-of-index allocations to high yield and US Treasury and agency securities. The Fund ended the period with a portfolio duration that was neutral to the benchmark. |
The views expressed reflect the opinions of BlackRock as of the date of this report and are subject to change based on changes in market, economic or other conditions. These views are not intended to be a forecast of future events and are no guarantee of future results.
Portfolio Information
| | | | | |
Portfolio Composition | | Percent of
Long-Term
Investments |
Corporate Bonds | | | | 89 | % |
Taxable Municipal Bonds | | | | 3 | |
Preferred Securities | | | | 3 | |
Foreign Agency Obligations | | | | 2 | |
Foreign Government Obligations | | | | 2 | |
U.S. Treasury Obligations | | | | 1 | |
| | | | | |
Credit Quality Allocation1 | | Percent of
Long-Term
Investments |
AAA/Aaa2 | | | | 4 | % |
AA/Aa | | | | 16 | |
A | | | | 38 | |
BBB/Baa | | | | 42 | |
| 1 | Using the higher of Standard & Poor’s (“S&P’s”) or Moody’s Investors Service (“Moody’s”) ratings. |
| 2 | Includes US Government Sponsored Agency Securities and US Treasury Obligations which are deemed AAA/Aaa by the investment advisor. |
| | | | | | |
| 4 | | BLACKROCK BOND ALLOCATION TARGET SHARES | | MARCH 31, 2011 | | |
Total Return Based on a $10,000 Investment
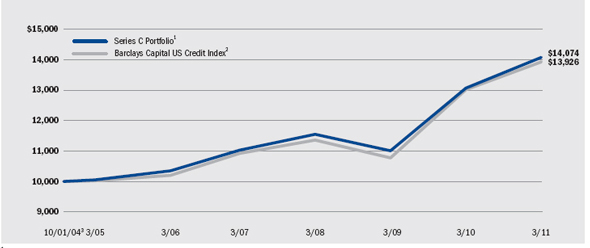
| | 1 | The Fund is non-diversified and will primarily invest its assets in investment grade fixed income securities, such as corporate bonds, notes and debentures, asset-backed securities, commercial and residential mortgage-backed securities, obligations of non-US governments and supranational organizations which are chartered to promote economic development, collateralized mortgage obligations, US Treasury and agency securities, cash equivalent investments, when-issued and delayed delivery securities, derivatives, repurchase agreements and reverse repurchase agreements. |
| | 2 | An unmanaged index that includes publicly issued US corporate and specified foreign debentures and secured notes that meet the specified maturity, liquidity, and quality requirements. |
| | 3 | Commencement of operations. |
Performance Summary for the Period Ended March 31, 2011
| | | | | | | | | | | | | | | | | | | | |
| | | 6-Month
Total Returns | | Average Annual Total Returns4 |
| | | | 1 Year | | 5 Years | | Since Inception5 |
Series C Portfolio | | | | (0.25 | )% | | | | 7.73 | % | | | | 6.33 | % | | | | 5.40 | % |
Barclays Capital US Credit Index | | | | (0.98 | ) | | | | 7.01 | | | | | 6.42 | | | | | 5.23 | |
| | 4 | See “About Fund Performance” on page 12 for a detailed description of performance related information. |
| | 5 | The Fund commenced operations on October 1, 2004. |
Past performance is not indicative of future results.
Expense Example
| | | | | | | | | | | | | | | | | | | | | | | | | | | | | | | | | | | |
| | | Actual | | Hypothetical7 | | |
| | | Beginning
Account Value
October 1,
2010 | | Ending
Account Value
March 31,
2011 | | Expenses
Paid During
the Period6 | | Beginning
Account Value
October 1,
2010 | | Ending
Account Value
March 31,
2011 | | Expenses
Paid During
the Period6 | | Annualized
Expense
Ratio |
Series C Portfolio | | | $ | 1,000.00 | | | | $ | 997.50 | | | | $ | 0.00 | | | | $ | 1,000.00 | | | | $ | 1,024.93 | | | | $ | 0.00 | | | | | 0.00 | % |
| | 6 | For shares of the Fund, expenses are equal to the annualized expense ratio, multiplied by the average account value over the period, multiplied by 182/365 (to reflect the one-half year period shown). BlackRock has contractually agreed to waive all fees and pay or reimburse all direct expenses, except extraordinary expenses and interest expense, incurred by the Fund. This agreement has no fixed term. |
| | 7 | Hypothetical 5% annual return before expenses is calculated by pro rating the number of days in the most recent fiscal half year divided by 365. |
See “Disclosure of Expenses” on page 12 for further information on how expenses were calculated.
| | | | | | |
| | | BLACKROCK BOND ALLOCATION TARGET SHARES | | MARCH 31, 2011 | | 5 |
| | |
| Fund Summary as of March 31, 2011 | | Series M Portfolio |
Investment Objective
Series M Portfolio’s (the “Fund”) investment objective is to seek to maximize total return, consistent with income generation and prudent investment management.
Portfolio Management Commentary
How did the Fund perform?
| | • | | The Fund outperformed its benchmark, the Barclays Capital MBS Index, for the 12-month period. Because shares of the Fund can be purchased or held only by or on behalf of certain separately managed account clients, comparisons of the Fund’s performance to its benchmark will differ from comparisons of the benchmark against the performance of the separately managed accounts. |
What factors influenced performance?
| | • | | The Fund’s exposure outside of the benchmark index in commercial mortgage-backed securities (CMBS) was the largest contributor to performance, as the sector continued to benefit from investor demand for yield, a favorable technical profile and improving economic conditions. An underweight in agency mortgage-backed securities (MBS) early in the period also added to performance, as the sector faced uncertainty relating to prepayments and the supply-and-demand backdrop. Out-of-index exposure to US Treasuries contributed positively to performance during the first half of the period, as the market saw a flight to quality and interest rates rallied across the yield curve. |
| | • | | An underweight in agency MBS later in the period detracted from performance, as the sector outperformed on low interest rate volatility and favorable prepayment data. Exposure to US Treasuries also detracted from performance during the latter half of the period, as did duration (interest rate sensitivity) and yield curve management activities. |
| | • | | The Fund uses interest rate derivatives, which may include futures contracts, options, swaps and swaptions, mainly for the purpose of managing risks relating to portfolio duration and yield curve positioning. As interest rates rose during the period, the Fund’s futures contracts had a negative impact on Fund returns. |
| | • | | The Fund’s cash position resulting from trading activity did not have a material impact on performance during the period. |
Describe recent portfolio activity.
| | • | | In the beginning of the period, the Fund took profits on positions in US government and government-related debt, which reduced exposures to US Treasuries and agency MBS following strong performance in those sectors. US Treasuries rallied on investors’ flight to quality, while favorable supply-and-demand conditions in the agency mortgage market drove agency MBS performance. |
| | • | | During the remainder of the period, we significantly increased exposure to agency MBS, purchasing select lower- and middle-coupon issues, as we believed they were attractively valued. We also reduced exposure to non-government spread sectors, namely CMBS and asset-backed securities (ABS), as we continued to manage risk in the portfolio. |
Describe Fund positioning at period end.
| | • | | At period end, the Fund was underweight relative to the benchmark in agency MBS, as we see attractive relative value in non-government spread sectors. Most notably, the Fund held out-of-index exposure to automotive and student loan ABS, as well as high-quality CMBS, where we continue to see value in select issues. While we find valuations within the agency MBS market attractive, we remain cautious given the possibility of rising rates and concurrent sales of agency MBS from the Fed’s balance sheet. The Fund ended the period with a long duration versus the benchmark. |
The views expressed reflect the opinions of BlackRock as of the date of this report and are subject to change based on changes in market, economic or other conditions. These views are not intended to be a forecast of future events and are no guarantee of future results.
Portfolio Information
| | | | | |
Portfolio Composition | | Percent of
Long-Term
Investments |
U.S. Government Sponsored Agency Securities | | | | 44 | % |
Non-Agency Mortgage-Backed Securities | | | | 29 | |
U.S. Treasury Obligations | | | | 16 | |
Asset-Backed Securities | | | | 11 | |
| | | | | |
Credit Quality Allocation1 | | Percent of
Long-Term
Investments |
AAA/Aaa2 | | | | 96 | % |
AA/Aa | | | | 1 | |
A | | | | 3 | |
| 1 | Using the higher of S&P’s or Moody’s ratings. |
| 2 | Includes US Government Sponsored Agency Securities and US Treasury Obligations which are deemed AAA/Aaa by the investment advisor. |
| | | | | | |
| 6 | | BLACKROCK BOND ALLOCATION TARGET SHARES | | MARCH 31, 2011 | | |
Total Return Based on a $10,000 Investment
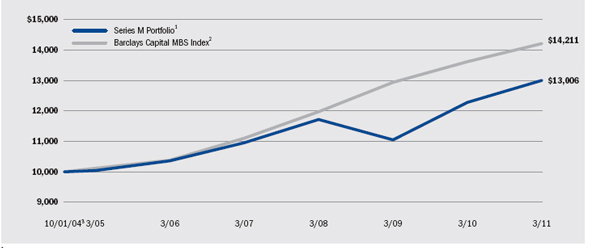
| | 1 | The Fund is non-diversified and will primarily invest its assets in investment grade commercial and residential mortgage-backed securities, asset- backed securities, collateralized mortgage obligations, US Treasury and agency securities, cash equivalent instruments, when-issued and delayed delivery securities, derivatives and dollar rolls. |
| | 2 | An unmanaged index that includes the mortgage-backed pass-through securities of Ginnie Mae, Fannie Mae and Freddie Mac that meet the maturity and liquidity criteria. |
| | 3 | Commencement of operations. |
Performance Summary for the Period Ended March 31, 2011
| | | | | | | | | | | | | | | | | | | | |
| | | 6-Month
Total Returns | | Average Annual Total Returns4 |
| | | | 1 Year | | 5 Years | | Since Inception5 |
Series M Portfolio | | | | (2.98 | )% | | | | 5.91 | % | | | | 4.66 | % | | | | 4.13 | % |
Barclays Capital MBS Index | | | | 0.83 | | | | | 4.37 | | | | | 6.48 | | | | | 5.56 | |
| | 4 | See “About Fund Performance” on page 12 for a detailed description of performance related information. |
| | 5 | The Fund commenced operations on October 1, 2004. |
Past performance is not indicative of future results.
Expense Example
| | | | | | | | | | | | | | | | | | | | | | | | | | | | | | | | | | | |
| | | Actual | | Hypothetical7 | | |
| | | Beginning
Account Value
October 1,
2010 | | Ending
Account Value
March 31,
2011 | | Expenses
Paid During
the Period6 | | Beginning
Account Value
October 1,
2010 | | Ending
Account Value
March 31,
2011 | | Expenses
Paid During
the Period6 | | Annualized
Expense
Ratio |
Series M Portfolio | | | $ | 1,000.00 | | | | $ | 970.20 | | | | $ | 0.00 | | | | $ | 1,000.00 | | | | $ | 1,024.93 | | | | $ | 0.00 | | | | | 0.00 | % |
| | 6 | For shares of the Fund, expenses are equal to the annualized expense ratio, multiplied by the average account value over the period, multiplied by 182/365 (to reflect the one-half year period shown). BlackRock has contractually agreed to waive all fees and pay or reimburse all direct expenses, except extraordinary expenses and interest expense, incurred by the Fund. This agreement has no fixed term. |
| | 7 | Hypothetical 5% annual return before expenses is calculated by pro rating the number of days in the most recent fiscal half year divided by 365. |
See “Disclosure of Expenses” on page 12 for further information on how expenses were calculated.
| | | | | | |
| | | BLACKROCK BOND ALLOCATION TARGET SHARES | | MARCH 31, 2011 | | 7 |
| | |
| Fund Summary as of March 31, 2011 | | Series N Portfolio |
Investment Objective
Series N Portfolio’s (the “Fund”) investment objective is to seek to maximize total return, consistent with income generation and prudent investment management.
Portfolio Management Commentary
| | • | | On March 18, 2011, the Board of Trustees of the Fund approved a proposal to close the Fund to new and subsequent investments and to liquidate the Fund. Accordingly, effective 4:00 p.m. (Eastern Time) on April 25, 2011, the Fund no longer accepted orders from new investors or existing shareholders to purchase Fund shares. On April 29, 2011, the net assets of the Fund were liquidated and each investor’s shares were redeemed at net asset value. |
How did the Fund perform?
| | • | | For the 12-month period, the Fund outperformed its benchmark, the S&P/Investortools Main Municipal Bond Index. Because shares of the Fund can be purchased or held only by or on behalf of certain separately managed account clients, comparisons of the Fund’s performance to its benchmark will differ from comparisons of the benchmark against the performance of the separately managed accounts. |
What factors influenced performance?
| | • | | The Fund benefited from its lower quality bias relative to the benchmark as credit quality spreads tightened significantly over the 12-month period. The Fund’s longer duration posture relative to the benchmark (higher sensitivity to interest rates) had a positive impact on performance earlier in the period, when long-term interest rates were falling. The Fund maintained a high average coupon structure, which generated a high level of income accrual. In addition, the Fund pursued opportunities to purchase attractive issues in the primary market amid a favorable supply-demand landscape, which enhanced performance throughout the period. |
| | • | | Cash reserves detracted slightly from performance given the low yields on cash in comparison to longer term investments. Maintaining some degree of cash in reserve may be advantageous because it enables the Fund to capitalize on attractive investment opportunities as they arise. |
| | • | | The Fund’s credit holdings in Detroit Waters and Michigan Hospitals for Henry Ford Medical Center detracted from performance as Michigan bonds underperformed the overall municipal market during the period. |
Describe recent portfolio activity.
| | • | | During the 12-month period, the Fund focused on generating total return by balancing an improving stream of income accrual with a competitive degree of asset appreciation. For most of the period, the Fund was fully invested to maximize income, yet we were highly attentive to trading opportunities, especially as the availability of primary issuance was limited. |
Describe Fund positioning at period end.
| | • | | At period end, the Fund was in the process of liquidating its holdings in preparation for its termination on April 29, 2011. |
The views expressed reflect the opinions of BlackRock as of the date of this report and are subject to change based on changes in market, economic or other conditions. These views are not intended to be a forecast of future events and are no guarantee of future results.
Portfolio Information
| | | | | |
Sector Allocation | | Percent of
Long-Term
Investments |
County/City/Special District/School District | | | | 25 | % |
Utilities | | | | 23 | |
Health | | | | 21 | |
Housing | | | | 13 | |
Transportation | | | | 12 | |
Education | | | | 5 | |
Corporate | | | | 1 | |
| | | | | |
Credit Quality Allocation1 | | Percent of
Long-Term
Investments |
AA/Aa | | | | 30 | % |
A | | | | 31 | |
BBB/Baa | | | | 18 | |
Less than BBB/Baa | | | | 21 | |
| | 1 | Using the higher of S&P’s or Moody’s ratings. |
| | | | | | |
| 8 | | BLACKROCK BOND ALLOCATION TARGET SHARES | | MARCH 31, 2011 | | |
Total Return Based on a $10,000 Investment
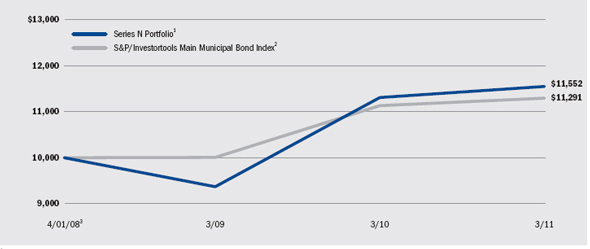
| | 1 | The Fund is non-diversified and will primarily invest its assets in municipal bonds, the interest on which the management team believes is exempt from regular federal income tax. |
| | 2 | An index composed of bonds held by managed municipal bond fund customers of Standard & Poor’s Securities Pricing, Inc. that are priced daily. Bonds in the index must have an outstanding par value of at least $2 million and a remaining maturity of not less than 1 month. |
| | 3 | Commencement of operations. |
Performance Summary for the Period Ended March 31, 2011
| | | | | | | | | | | | | | | |
| | | 6 Month
Total Returns | | Average Annual Total Returns4 |
| | | | 1 Year | | Since Inception5 |
Series N Portfolio | | | | (4.77 | )% | | | | 2.13 | % | | | | 4.93 | % |
S&P/Investortools Main Municipal Bond Index | | | | (3.89 | ) | | | | 1.45 | | | | | 4.13 | |
| | 4 | See “About Fund Performance” on page 12 for a detailed description of performance related information. |
| | 5 | The Fund commenced operations on April 1, 2008. |
Past performance is not indicative of future results.
Expense Example
| | | | | | | | | | | | | | | | | | | | | | | | | | | | | | | | | | | | | | | | | | | | | |
| | | Actual | | Hypothetical8 |
| | | | | | | Including
Interest Expense
and Fees | | Excluding
Interest Expense
and Fees | | | | Including
Interest Expense
and Fees | | Excluding
Interest Expense
and Fees |
| | | Beginning
Account Value
October 1,
2010 | | Ending
Account Value
March 31,
2011 | | Expenses
Paid During
the Period6 | | Expenses
Paid During
the Period7 | | Beginning
Account Value
October 1,
2010 | | Ending
Account Value
March 31,
2011 | | Expenses
Paid During
the Period6 | | Ending
Account Value
March 31,
2011 | | Expenses
Paid During
the Period7 |
Series N Portfolio | | | $ | 1,000.00 | | | | $ | 952.30 | | | | $ | 0.10 | | | | $ | 0.00 | | | | $ | 1,000.00 | | | | $ | 1,024.83 | | | | $ | 0.10 | | | | $ | 1,024.93 | | | | $ | 0.00 | |
| | 6 | For shares of the Fund, expenses are equal to the annualized expense ratio of 0.02%, multiplied by the average account value over the period, multiplied by 182/365 (to reflect the one-half year period shown). BlackRock has contractually agreed to waive all fees and pay or reimburse all direct expenses, except extraordinary expenses and interest expense, incurred by the Fund. This agreement has no fixed term. |
| | 7 | For shares of the Fund, expenses are equal to the annualized expense ratio of 0.00%, multiplied by the average account value over the period, multiplied by 182/365 (to reflect the one-half year period shown). BlackRock has contractually agreed to waive all fees and pay or reimburse all direct expenses, except extraordinary expenses and interest expense, incurred by the Fund. This agreement has no fixed term. |
| | 8 | Hypothetical 5% annual return before expenses is calculated by pro rating the number of days in the most recent fiscal half year divided by 365. |
See “Disclosure of Expenses” on page 12 for further information on how expenses were calculated.
| | | | | | |
| | | BLACKROCK BOND ALLOCATION TARGET SHARES | | MARCH 31, 2011 | | 9 |
| | |
| Fund Summary as of March 31, 2011 | | Series S Portfolio |
Investment Objective
Series S Portfolio’s (the “Fund”) investment objective is to seek to maximize total return, consistent with income generation and prudent investment management.
Portfolio Management Commentary
How did the Fund perform?
| | • | | The Fund outperformed its benchmark, the BofA Merrill Lynch 1-3 Year Treasury Index, for the 12-month period. Because shares of the Fund can be purchased or held only by or on behalf of certain separately managed account clients, comparisons of the Fund’s performance to its benchmark will differ from comparisons of the benchmark against the performance of the separately managed accounts. |
What factors influenced performance?
| | • | | The primary contributor to the Fund’s positive performance for the period was sector allocation. The Fund held positions in non-government-related spread sectors that are not included in the benchmark index, including investment grade corporate bonds, ABS, CMBS and residential MBS, all of which generated positive returns on an absolute basis and outperformed government-related sectors. Spread sectors broadly rallied throughout the 12-month period as fixed income investors were willing to increase their risk tolerance levels in exchange for higher yields and the potential for higher returns. |
| | • | | Conversely, the Fund’s yield curve positioning, as a part of the overall management of portfolio duration (sensitivity to interest rates), detracted from performance. |
Describe recent portfolio activity.
| | • | | Throughout the 12-month period, the Fund maintained diversified allocations across both government-owned/government-related debt and non-government spread sectors. Earlier in the period, we increased exposure to riskier names as investor risk tolerance and demand for yield increased. Later in the period, we reduced exposure to industries that are more vulnerable to an economic slowdown, such as hotels and gaming, and purchased corporate bonds of issuers that are poised for an upgrade in credit rating to investment grade across all rating agencies. The Fund’s duration and yield curve positioning were tactically traded throughout the period. |
Describe Fund positioning at period end.
| | • | | In addition to a core allocation to investment grade credit, the Fund also holds CMBS, ABS, agency MBS and non-agency residential MBS. The Fund ended the period with longer portfolio duration versus its benchmark. |
The views expressed reflect the opinions of BlackRock as of the date of this report and are subject to change based on changes in market, economic or other conditions. These views are not intended to be a forecast of future events and are no guarantee of future results.
Portfolio Information
| | | | | |
Portfolio Composition | | Percent of
Long-Term
Investments |
Corporate Bonds | | | | 41 | % |
U.S. Government Sponsored Agency Securities | | | | 19 | |
Asset-Backed Securities | | | | 18 | |
Non-Agency Mortgage-Backed Securities | | | | 17 | |
Foreign Agency Obligations | | | | 4 | |
Taxable Municipal Bonds | | | | 1 | |
| | | | | |
Credit Quality Allocation1 | | Percent of
Long-Term
Investments |
AAA/Aaa2 | | | | 53 | % |
AA/Aa | | | | 6 | |
A | | | | 13 | |
BBB/Baa | | | | 23 | |
Less than BBB/Baa | | | | 5 | |
| | 1 | Using the higher of S&P’s or Moody’s ratings. |
| | 2 | Includes US Government Sponsored Agency Securities and US Treasury Obligations which are deemed AAA/Aaa by the investment advisor. |
| | | | | | |
| 10 | | BLACKROCK BOND ALLOCATION TARGET SHARES | | MARCH 31, 2011 | | |
| | |
| | Series S Portfolio |
Total Return Based on a $10,000 Investment | | |
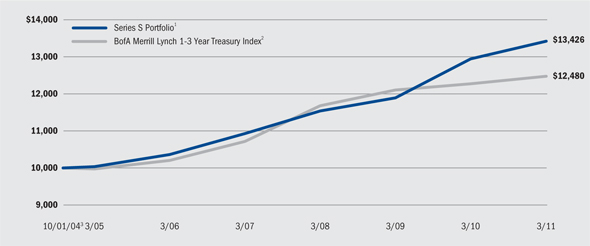
| | 1 | The Fund is non-diversified and will primarily invest its assets in investment grade fixed income securities, such as commercial and residential mortgage-backed securities, obligations of non-US governments and supra-national organizations which are chartered to promote economic development, obligations of domestic and non-US corporations, asset-backed securities, US Treasury and agency securities, cash equivalent investments, when-issued and delayed delivery securities, repurchase agreements, reverse repurchase agreements and dollar rolls. |
| | 2 | An unmanaged index comprised of Treasury securities with maturities from 1 to 2.99 years. |
| | 3 | Commencement of operations. |
Performance Summary for the Period Ended March 31, 2011
| | | | | | | | | | | | | | | | | | | | |
| | | 6-Month
Total Returns | | Average Annual Total Returns4 |
| | | | 1 Year | | 5 Years | | Since Inception5 |
Series S Portfolio | | | | 0.71 | % | | | | 3.73 | % | | | | 5.31 | % | | | | 4.64 | % |
BofA Merrill Lynch 1-3 Year Treasury Index | | | | (0.12 | ) | | | | 1.67 | | | | | 4.10 | | | | | 3.47 | |
| | 4 | See “About Fund Performance” on page 12 for a detailed description of performance related information. |
| | 5 | The Fund commenced operations on October 1, 2004. |
Past performance is not indicative of future results.
Expense Example
| | | | | | | | | | | | | | | | | | | | | | | | | | | | | | | | | | | | | | | | | | | | | |
| | | Actual | | Hypothetical8 |
| | | Beginning
Account Value
October 1,
2010 | | | | Including
Interest Expense | | Excluding
Interest Expense | | Beginning
Account Value
October 1,
2010 | | Including
Interest Expense | | Excluding
Interest Expense |
| | | | Ending
Account Value
March 31,
2011 | | Expenses
Paid During
the Period6 | | Expenses
Paid During
the Period7 | | | Ending
Account Value
March 31,
2011 | | Expenses
Paid During
the Period6 | | Ending
Account Value
March 31,
2011 | | Expenses
Paid During
the Period7 |
Series S Portfolio | | | $ | 1,000.00 | | | | $ | 1,007.10 | | | | $ | 0.20 | | | | $ | 0.00 | | | | $ | 1,000.00 | | | | $ | 1,024.73 | | | | $ | 0.20 | | | | $ | 1,024.93 | | | | $ | 0.00 | |
| | 6 | For shares of the Fund, expenses are equal to the annualized expense ratio of 0.04%, multiplied by the average account value over the period, multiplied by 182/365 (to reflect the one-half year period shown). BlackRock has contractually agreed to waive all fees and pay or reimburse all direct expenses, except extraordinary expenses and interest expense, incurred by the Fund. This agreement has no fixed term. |
| | 7 | For shares of the Fund, expenses are equal to the annualized expense ratio of 0.00%, multiplied by the average account value over the period, multiplied by 182/365 (to reflect the one-half year period shown). BlackRock has contractually agreed to waive all fees and pay or reimburse all direct expenses, except extraordinary expenses and interest expense, incurred by the Fund. This agreement has no fixed term. |
| | 8 | Hypothetical 5% annual return before expenses is calculated by pro rating the number of days in the most recent fiscal half year divided by 365. |
See “Disclosure of Expenses” on page 12 for further information on how expenses were calculated.
| | | | | | |
| | | BLACKROCK BOND ALLOCATION TARGET SHARES | | MARCH 31, 2011 | | 11 |
About Fund Performance
Performance information reflects past performance and does not guarantee future results. Current performance may be lower or higher than the performance data quoted. Performance results do not reflect the deduction of taxes that a shareholder would pay on Fund distributions or the redemption of Fund shares. Figures shown in each of the performance tables on the previous pages assume reinvestment of all dividends and distributions, if any, at net asset value on the payable date. Investment return and principal value of shares will fluctuate so that shares, when redeemed, may be worth more or less than their original cost.
The performance information also reflects fee waivers and reimbursements that subsidize and reduce the total operating expenses of each Fund. The Funds’ returns would have been lower if there were no such waivers and reimbursements.
Disclosure of Expenses
Shareholders of these Funds may incur the following charges: (a) expenses related to transactions and (b) operating expenses, including administration fees and other Fund expenses. The expense examples on the previous pages (which are based on a hypothetical investment of $1,000 invested on October 1, 2010 and held through March 31, 2011) are intended to assist shareholders both in calculating expenses based on an investment in each Fund and in comparing these expenses with similar costs of investing in other mutual funds.
The tables provide information about actual account values and actual expenses. In order to estimate the expenses a shareholder paid during the period covered by this report, shareholders can divide their account value by $1,000 and then multiply the result by the number corresponding to their Fund under the headings entitled “Expenses Paid During the Period.”
The tables also provide information about hypothetical account values and hypothetical expenses based on a Fund’s actual expense ratio and an assumed rate of return of 5% per year before expenses. In order to assist shareholders in comparing the ongoing expenses of investing in these Funds and other funds, compare the 5% hypothetical example with the 5% hypothetical examples that appear in other funds’ shareholder reports.
The expenses shown in the tables are intended to highlight shareholders’ ongoing costs only and do not reflect any transactional expenses, such as sales charges. Therefore, the hypothetical examples are useful in comparing ongoing expenses only, and will not help shareholders determine the relative total expenses of owning different funds. If these transactional expenses were included, shareholder expenses would have been higher.
| | | | | | |
| 12 | | BLACKROCK BOND ALLOCATION TARGET SHARES | | MARCH 31, 2011 | | |
The Benefits and Risks of Leveraging
The Funds may utilize leverage to seek to enhance their yields and net asset values (“NAVs”). However, these objectives cannot be achieved in all interest rate environments.
The Funds may utilize leverage by entering into reverse repurchase agreements and treasury roll transactions. The Series N Portfolio may also leverage its assets through the use of tender option bond (“TOB”) programs, as described in Note 1 of the Notes to Financial Statements. In general, the concept of leveraging is based on the premise that the financing cost of assets to be obtained from leverage, which will be based on short-term interest rates, will normally be lower than the income earned by each Fund on its longer-term portfolio investments. To the extent that the total assets of each Fund (including the assets obtained through leverage) are invested in higher-yielding portfolio investments, each Fund’s shareholders will benefit from the incremental net income.
Furthermore, the value of the Funds’ portfolio investments generally varies inversely with the direction of long-term interest rates, although other factors can influence the value of portfolio investments. Changes in interest rates can influence the Funds’ NAVs positively or negatively in addition to the impact on the Funds performance from leverage.
The use of leverage may enhance opportunities for increased income to the Funds, but as described above, it also creates risks as short- or long-term interest rates fluctuate. Leverage also will generally cause greater changes in a Fund’s NAV and dividend rate than a comparable portfolio without leverage. If the income derived from securities purchased with assets received from leverage exceeds the cost of leverage, each Fund’s net income will be greater than if leverage had not been used. Conversely, if the income from the securities purchased is not sufficient to cover the cost of leverage, the Fund’s net income will be less than if leverage had not been used, and therefore the amount available for distribution to shareholders will be reduced. Each Fund may be required to sell portfolio securities at inopportune times or at distressed values in order to comply with regulatory requirements applicable to the use of leverage or as required by the terms of leverage instruments, which may cause a Fund to incur losses. The use of leverage may limit each Fund’s ability to invest in certain types of securities or use certain types of hedging strategies. Each Fund will incur expenses in connection with the use of leverage, all of which are borne by Fund shareholders and may reduce income.
Derivative Financial Instruments
The Funds may invest in various derivative instruments, including financial futures contracts, swaps and options, as specified in Note 2 of the Notes to Financial Statements, which may constitute forms of economic leverage. Such instruments are used to obtain exposure to a market without owning or taking physical custody of securities or to hedge market, credit and/or interest rate risks. Such derivative instruments involve risks, including the imperfect correlation between the value of a derivative instrument and the underlying asset, possible default of the counterparty to the transaction or illiquidity of the derivative instrument. A Fund’s ability to use a derivative instrument successfully depends on the investment advisor’s ability to predict pertinent market movements accurately, which cannot be assured. The use of derivative instruments may result in losses greater than if they had not been used, may require a Fund to sell or purchase portfolio investments at inopportune times or for distressed values, may limit the amount of appreciation a Fund can realize on an investment, may result in lower dividends paid to shareholders or may cause a Fund to hold an investment that it might otherwise sell. The Funds’ investments in these instruments are discussed in detail in the Notes to Financial Statements.
| | | | | | |
| | | BLACKROCK BOND ALLOCATION TARGET SHARES | | MARCH 31, 2011 | | 13 |
| | |
| Schedule of Investments March 31, 2011 | | Series C Portfolio |
| | (Percentages shown are based on Net Assets) |
| | | | | | | | | | |
Corporate Bonds | | Par
(000) | | Value |
Aerospace & Defense – 0.7% | | | | | | | | | | |
Lockheed Martin Corp., 6.15%, 9/01/36 | | | $ | 345 | | | | $ | 375,477 | |
Northrop Grumman Systems Corp., 7.88%, | | | | | | | | | | |
3/01/26 | | | | 1,000 | | | | | 1,303,957 | |
United Technologies Corp., 6.05%, 6/01/36 | | | | 450 | | | | | 500,472 | |
| | | | | | | | | | |
| | | | | | | | | 2,179,906 | |
| | | | | | | | | | |
Airlines – 0.4% | | | | | | | | | | |
American Airlines Pass-Through Trust, 5.25%, | | | | | | | | | | |
7/31/21 | | | | 340 | | | | | 329,800 | |
Continental Airlines 2010-1 Class A | | | | | | | | | | |
Pass-Through Trust, 4.75%, 1/12/21 | | | | 1,000 | | | | | 980,000 | |
| | | | | | | | | | |
| | | | | | | | | 1,309,800 | |
| | | | | | | | | | |
Automobiles – 0.7% | | | | | | | | | | |
Daimler Finance North America LLC, 5.75%, | | | | | | | | | | |
9/08/11 | | | | 2,000 | | | | | 2,043,516 | |
| | | | | | | | | | |
Beverages – 1.2% | | | | | | | | | | |
Anheuser-Busch InBev Worldwide, Inc., 8.20%, | | | | | | | | | | |
1/15/39 | | | | 770 | | | | | 1,047,567 | |
Diageo Finance BV, 5.50%, 4/01/13 | | | | 2,300 | | | | | 2,490,362 | |
PepsiCo, Inc., 7.90%, 11/01/18 | | | | 268 | | | | | 340,162 | |
| | | | | | | | | | |
| | | | | | | | | 3,878,091 | |
| | | | | | | | | | |
Capital Markets – 6.4% | | | | | | | | | | |
Ameriprise Financial, Inc., 5.30%, 3/15/20 | | | | 325 | | | | | 344,495 | |
The Goldman Sachs Group, Inc.: | | | | | | | | | | |
5.25%, 10/15/13 | | | | 3,525 | | | | | 3,785,297 | |
6.25%, 9/01/17 | | | | 1,500 | | | | | 1,642,389 | |
6.15%, 4/01/18 | | | | 525 | | | | | 569,193 | |
7.50%, 2/15/19 | | | | 620 | | | | | 720,182 | |
5.38%, 3/15/20 | | | | 295 | | | | | 299,524 | |
6.00%, 6/15/20 | | | | 250 | | | | | 264,281 | |
6.25%, 2/01/41 | | | | 725 | | | | | 721,997 | |
Morgan Stanley: | | | | | | | | | | |
5.63%, 1/09/12 | | | | 5,175 | | | | | 5,373,073 | |
6.25%, 8/28/17 | | | | 885 | | | | | 961,893 | |
7.30%, 5/13/19 | | | | 1,625 | | | | | 1,827,733 | |
5.63%, 9/23/19 | | | | 400 | | | | | 408,534 | |
Nomura Holdings, Inc., 5.00%, 3/04/15 | | | | 1,175 | | | | | 1,216,666 | |
The Northern Trust Corp., 4.60%, 2/01/13 | | | | 125 | | | | | 132,809 | |
UBS AG: | | | | | | | | | | |
2.25%, 1/28/14 | | | | 1,126 | | | | | 1,128,115 | |
5.88%, 12/20/17 | | | | 665 | | | | | 726,151 | |
| | | | | | | | | | |
| | | | | | | | | 20,122,332 | |
| | | | | | | | | | |
Commercial Banks – 9.8% | | | | | | | | | | |
Associated Banc-Corp., 5.13%, 3/28/16 | | | | 1,490 | | | | | 1,495,655 | |
Barclays Bank Plc, 5.14%, 10/14/20 | | | | 1,500 | | | | | 1,419,477 | |
BNP Paribas, 3.60%, 2/23/16 | | | | 1,250 | | | | | 1,252,120 | |
Fifth Third Bancorp, 3.63%, 1/25/16 | | | | 800 | | | | | 799,295 | |
HSBC Bank USA, N.A., 4.63%, 4/01/14 | | | | 5,500 | | | | | 5,847,539 | |
HSBC Holdings Plc: | | | | | | | | | | |
5.10%, 4/05/21 | | | | 1,050 | | | | | 1,055,388 | |
6.80%, 6/01/38 | | | | 680 | | | | | 712,034 | |
ING Bank NV, 3.00%, 9/01/15 (a) | | | | 1,625 | | | | | 1,588,748 | |
Intesa Sanpaolo SpA, 6.50%, 2/24/21 (a) | | | | 1,075 | | | | | 1,128,127 | |
KeyCorp, 5.10%, 3/24/21 | | | | 550 | | | | | 546,605 | |
Lloyds TSB Bank Plc, 4.88%, 1/21/16 | | | | 875 | | | | | 902,234 | |
Macquarie Bank Ltd., 6.63%, 4/07/21 (a) | | | | 1,550 | | | | | 1,546,978 | |
Nordea Bank AB, 2.13%, 1/14/14 (a) | | | | 1,100 | | | | | 1,097,451 | |
Royal Bank of Scotland Group Plc, 5.00%, | | | | | | | | | | |
11/12/13 | | | | 3,000 | | | | | 3,048,606 | |
Standard Chartered Plc, 5.50%, 11/18/14 (a) | | | | 2,200 | | | | | 2,374,354 | |
SunTrust Banks, Inc., 3.60%, 4/15/16 | | | | 575 | | | | | 571,571 | |
Wells Fargo & Co.: | | | | | | | | | | |
4.38%, 1/31/13 | | | | 5,015 | | | | | 5,282,320 | |
3.68%, 6/15/16 (b) | | | | 300 | | | | | 301,773 | |
| | | | | | | | | | |
| | | | | | | | | 30,970,275 | |
| | | | | | | | | | |
Commercial Services & Supplies – 0.6% | | | | | | | | | | |
Aviation Capital Group Corp., 6.75%, | | | | | | | | | | |
4/06/21 (a) | | | | 1,575 | | | | | 1,574,815 | |
Tyco International Finance SA, 8.50%, | | | | | | | | | | |
1/15/19 | | | | 300 | | | | | 387,026 | |
| | | | | | | | | | |
| | | | | | | | | 1,961,841 | |
| | | | | | | | | | |
Consumer Finance – 1.7% | | | | | | | | | | |
Discover Bank: | | | | | | | | | | |
8.70%, 11/18/19 | | | | 650 | | | | | 778,741 | |
7.00%, 4/15/20 | | | | 1,250 | | | | | 1,375,253 | |
SLM Corp.: | | | | | | | | | | |
5.40%, 10/25/11 | | | | 1,780 | | | | | 1,816,093 | |
6.25%, 1/25/16 | | | | 1,400 | | | | | 1,459,500 | |
| | | | | | | | | | |
| | | | | | | | | 5,429,587 | |
| | | | | | | | | | |
Diversified Financial Services – 10.4% | | | | | | | | | | |
AngloGold Ashanti Holdings Plc: | | | | | | | | | | |
5.38%, 4/15/20 | | | | 1,000 | | | | | 1,014,334 | |
6.50%, 4/15/40 | | | | 600 | | | | | 600,919 | |
Bank of America Corp.: | | | | | | | | | | |
6.50%, 8/01/16 | | | | 3,330 | | | | | 3,685,058 | |
5.75%, 12/01/17 | | | | 2,080 | | | | | 2,191,511 | |
BP Capital Markets Plc, 3.13%, 10/01/15 | | | | 2,875 | | | | | 2,891,074 | |
Citigroup, Inc.: | | | | | | | | | | |
5.50%, 10/15/14 | | | | 4,050 | | | | | 4,368,330 | |
4.75%, 5/19/15 | | | | 785 | | | | | 822,840 | |
5.30%, 1/07/16 | | | | 1,000 | | | | | 1,060,037 | |
Portfolio Abbreviations
| | | | | | | | |
| To simplify the listings of portfolio holdings in the Schedules of Investments, the names and descriptions of many of the securities have been abbreviated according to the following list: | | ACA | | ACA Financial Guaranty Corp. | | GO | | General Obligation Bonds |
| | AGC | | Assured Guaranty Corp. | | IDA | | Industrial Development |
| | AMBAC | | American Municipal Bond | | | | Authority |
| | | | Assurance Corp. | | LIBOR | | London InterBank Offered |
| | AMT | | Alternative Minimum Tax | | | | Rate |
| | | | (subject to) | | RB | | Revenue Bonds |
| | BHAC | | Berkshire Hathaway Assurance | | S/F | | Single Family |
| | | | Corp. | | USD | | US Dollar |
See Notes to Financial Statements.
| | | | | | |
| 14 | | BLACKROCK BOND ALLOCATION TARGET SHARES | | MARCH 31, 2011 | | |
| | |
| Schedule of Investments (continued) | | Series C Portfolio |
| | (Percentages shown are based on Net Assets) |
| | | | | | | | | | |
Corporate Bonds | | Par
(000) | | Value |
Diversified Financial Services (concluded) | | | | | | | | | | |
CME Group Index Services LLC, 4.40%, | | | | | | | | | | |
3/15/18 (a) | | | $ | 1,700 | | | | $ | 1,738,440 | |
Crown Castle Towers LLC, 6.11%, 1/15/20 (a) | | | | 1,450 | | | | | 1,571,587 | |
General Electric Capital Corp.: | | | | | | | | | | |
2.80%, 1/08/13 | | | | 2,200 | | | | | 2,251,031 | |
6.75%, 3/15/32 | | | | 1,075 | | | | | 1,181,254 | |
6.15%, 8/07/37 | | | | 1,225 | | | | | 1,252,326 | |
Iberdrola Finance Ireland Ltd., 3.80%, | | | | | | | | | | |
9/11/14 (a) | | | | 750 | | | | | 761,309 | |
Icahn Enterprises LP/Icahn Enterprises Finance Corp., | | | | | | | | | | |
7.75%, 1/15/16 | | | | 825 | | | | | 847,688 | |
JPMorgan Chase & Co., 6.00%, 1/15/18 | | | | 2,150 | | | | | 2,357,441 | |
JPMorgan Chase Bank, N.A., 6.00%, 7/05/17 | | | | 1,427 | | | | | 1,567,377 | |
Merrill Lynch & Co., Inc.: | | | | | | | | | | |
6.05%, 5/16/16 | | | | 1,350 | | | | | 1,426,800 | |
7.75%, 5/14/38 | | | | 500 | | | | | 574,096 | |
SteelRiver Transmission Co. LLC, 4.71%, | | | | | | | | | | |
6/30/17 (a) | | | | 686 | | | | | 677,683 | |
| | | | | | | | | | |
| | | | | | | | | 32,841,135 | |
| | | | | | | | | | |
Diversified Telecommunication Services – 4.2% | | | | | | | | | | |
AT&T Inc., 6.50%, 9/01/37 | | | | 890 | | | | | 922,283 | |
Qwest Corp., 8.38%, 5/01/16 | | | | 2,000 | | | | | 2,380,000 | |
Telecom Italia Capital SA, 5.25%, 11/15/13 | | | | 1,360 | | | | | 1,436,081 | |
Telefonica Emisiones SAU, 7.05%, 6/20/36 | | | | 1,075 | | | | | 1,165,607 | |
Telefonica Moviles Chile SA, 2.88%, | | | | | | | | | | |
11/09/15 (a) | | | | 1,375 | | | | | 1,317,534 | |
Verizon Communications, Inc.: | | | | | | | | | | |
1.95%, 3/28/14 | | | | 3,025 | | | | | 3,027,523 | |
6.25%, 4/01/37 | | | | 1,625 | | | | | 1,663,415 | |
Verizon Global Funding Corp., 7.75%, | | | | | | | | | | |
12/01/30 | | | | 750 | | | | | 903,359 | |
Verizon Maryland, Inc., 6.13%, 3/01/12 | | | | 305 | | | | | 319,192 | |
| | | | | | | | | | |
| | | | | | | | | 13,134,994 | |
| | | | | | | | | | |
Electric Utilities – 4.6% | | | | | | | | | | |
Carolina Power & Light Co., 6.30%, 4/01/38 | | | | 750 | | | | | 844,395 | |
The Cleveland Electric Illuminating Co., 5.65%, | | | | | | | | | | |
12/15/13 | | | | 450 | | | | | 487,247 | |
Duke Energy Carolinas LLC, 5.25%, 1/15/18 | | | | 450 | | | | | 494,165 | |
Duke Energy Corp., 3.35%, 4/01/15 | | | | 1,700 | | | | | 1,736,280 | |
Florida Power & Light Co., 5.95%, 2/01/38 | | | | 1,075 | | | | | 1,156,891 | |
Jersey Central Power & Light Co., 5.65%, | | | | | | | | | | |
6/01/17 | | | | 1,710 | | | | | 1,869,233 | |
Kentucky Utilities Co., 5.13%, 11/01/40 (a) | | | | 1,050 | | | | | 1,004,857 | |
Kiowa Power Partners LLC, 4.81%, | | | | | | | | | | |
12/30/13 (a) | | | | 9 | | | | | 9,369 | |
Louisville Gas & Electric Co., 1.63%, | | | | | | | | | | |
11/15/15 (a) | | | | 299 | | | | | 284,135 | |
MidAmerican Energy Holdings Co.: | | | | | | | | | | |
5.30%, 3/15/18 | | | | 2,170 | | | | | 2,380,312 | |
5.75%, 4/01/18 | | | | 1,475 | | | | | 1,644,910 | |
Ohio Edison Co., 6.40%, 7/15/16 | | | | 190 | | | | | 212,149 | |
PacifiCorp, 6.00%, 1/15/39 | | | | 450 | | | | | 483,953 | |
Progress Energy, Inc., 4.88%, 12/01/19 | | | | 1,075 | | | | | 1,115,758 | |
Southern California Edison Co., 5.35%, | | | | | | | | | | |
7/15/35 | | | | 825 | | | | | 825,151 | |
| | | | | | | | | | |
| | | | | | | | | 14,548,805 | |
| | | | | | | | | | |
Energy Equipment & Services – 1.0% | | | | | | | | | | |
Ensco Plc, 3.25%, 3/15/16 | | | | 1,600 | | | | | 1,594,115 | |
Halliburton Co., 7.45%, 9/15/39 | | | | 800 | | | | | 1,010,671 | |
Transocean, Inc., 6.00%, 3/15/18 | | | | 600 | | | | | 647,806 | |
| | | | | | | | | | |
| | | | | | | | | 3,252,592 | |
| | | | | | | | | | |
Food & Staples Retailing – 1.9% | | | | | | | | | | |
CVS Caremark Corp., 5.75%, 6/01/17 | | | | 1,700 | | | | | 1,872,530 | |
Tesco Plc, 5.50%, 11/15/17 (a) | | | | 1,840 | | | | | 2,040,439 | |
Wal-Mart Stores, Inc.: | | | | | | | | | | |
2.88%, 4/01/15 | | | | 1,430 | | | | | 1,463,942 | |
5.25%, 9/01/35 | | | | 675 | | | | | 659,856 | |
| | | | | | | | | | |
| | | | | | | | | 6,036,767 | |
| | | | | | | | | | |
Food Products – 1.3% | | | | | | | | | | |
Kraft Foods, Inc.: | | | | | | | | | | |
6.50%, 8/11/17 | | | | 2,075 | | | | | 2,366,230 | |
5.38%, 2/10/20 | | | | 565 | | | | | 596,496 | |
6.50%, 11/01/31 | | | | 375 | | | | | 412,012 | |
6.88%, 2/01/38 | | | | 625 | | | | | 692,924 | |
| | | | | | | | | | |
| | | | | | | | | 4,067,662 | |
| | | | | | | | | | |
Gas Utilities – 0.3% | | | | | | | | | | |
Atmos Energy Corp., 8.50%, 3/15/19 | | | | 800 | | | | | 999,339 | |
| | | | | | | | | | |
Health Care Equipment & Supplies – 1.1% | | | | | | | | | | |
CareFusion Corp., 6.38%, 8/01/19 | | | | 695 | | | | | 776,899 | |
Covidien International Finance SA, 6.00%, | | | | | | | | | | |
10/15/17 | | | | 2,300 | | | | | 2,621,282 | |
| | | | | | | | | | |
| | | | | | | | | 3,398,181 | |
| | | | | | | | | | |
Health Care Providers & Services – 0.1% | | | | | | | | | | |
UnitedHealth Group, Inc., 5.70%, 10/15/40 | | | | 25 | | | | | 24,372 | |
WellPoint, Inc., 6.38%, 6/15/37 | | | | 375 | | | | | 403,292 | |
| | | | | | | | | | |
| | | | | | | | | 427,664 | |
| | | | | | | | | | |
Household Durables – 0.1% | | | | | | | | | | |
MDC Holdings, Inc., 5.63%, 2/01/20 | | | | 179 | | | | | 176,844 | |
| | | | | | | | | | |
Independent Power Producers & Energy Traders – 0.3% | | | | | | | | | | |
Constellation Energy Group, Inc., 7.60%, | | | | | | | | | | |
4/01/32 | | | | 900 | | | | | 1,021,723 | |
| | | | | | | | | | |
Industrial Conglomerates – 0.7% | | | | | | | | | | |
Holcim US Finance S.à r.l. & Cie S.C.S., 6.00%, | | | | | | | | | | |
12/30/19 (a) | | | | 1,175 | | | | | 1,231,475 | |
Hutchison Whampoa International Ltd., 4.63%, | | | | | | | | | | |
9/11/15 (a) | | | | 1,000 | | | | | 1,059,250 | |
| | | | | | | | | | |
| | | | | | | | | 2,290,725 | |
| | | | | | | | | | |
Insurance – 7.0% | | | | | | | | | | |
ACE INA Holdings, Inc., 2.60%, 11/23/15 | | | | 625 | | | | | 607,409 | |
Allied World Assurance Co. Holdings Ltd., | | | | | | | | | | |
5.50%, 11/15/20 | | | | 825 | | | | | 811,426 | |
American International Group, Inc., 6.40%, | | | | | | | | | | |
12/15/20 | | | | 960 | | | | | 1,024,602 | |
The Dai-ichi Life Insurance Co. Ltd., | | | | | | | | | | |
7.25% (a)(b) | | | | 1,050 | | | | | 1,037,982 | |
Hartford Life Global Funding Trusts, 0.40%, | | | | | | | | | | |
1/17/12 (b) | | | | 1,000 | | | | | 997,015 | |
Lincoln National Corp., 6.15%, 4/07/36 | | | | 900 | | | | | 926,832 | |
Massachusetts Mutual Life Insurance Co., | | | | | | | | | | |
8.88%, 6/01/39 (a) | | | | 1,200 | | | | | 1,641,071 | |
MetLife, Inc., 5.38%, 12/15/12 | | | | 4,400 | | | | | 4,697,013 | |
See Notes to Financial Statements.
| | | | | | |
| | | BLACKROCK BOND ALLOCATION TARGET SHARES | | MARCH 31, 2011 | | 15 |
| | |
| Schedule of Investments (continued) | | Series C Portfolio |
| | (Percentages shown are based on Net Assets) |
| | | | | | | | | | |
Corporate Bonds | | Par
(000) | | Value |
Insurance (concluded) | | | | | | | | | | |
Metropolitan Life Global Funding I, 5.13%, | | | | | | | | | | |
4/10/13 (a) | | | $ | 2,550 | | | | $ | 2,721,250 | |
Pacific Life Insurance Co., 9.25%, 6/15/39 (a) | | | | 1,230 | | | | | 1,616,762 | |
Pricoa Global Funding I, 5.40%, 10/18/12 (a) | | | | 2,125 | | | | | 2,254,674 | |
Prudential Financial, Inc.: | | | | | | | | | | |
5.70%, 12/14/36 | | | | 1,375 | | | | | 1,347,624 | |
8.88%, 6/15/38 (b) | | | | 850 | | | | | 1,003,000 | |
Teachers Insurance & Annuity Association of America, | | | | | | | | | | |
6.85%, 12/16/39 (a) | | | | 1,050 | | | | | 1,183,903 | |
| | | | | | | | | | |
| | | | | | | | | 21,870,563 | |
| | | | | | | | | | |
Life Sciences Tools & Services – 1.2% | | | | | | | | | | |
Agilent Technologies, Inc.: | | | | | | | | | | |
4.45%, 9/14/12 | | | | 850 | | | | | 881,367 | |
5.00%, 7/15/20 | | | | 875 | | | | | 894,493 | |
Life Technologies Corp., 3.50%, 1/15/16 | | | | 1,295 | | | | | 1,290,962 | |
Thermo Fisher Scientific, Inc., 4.50%, 3/01/21 | | | | 625 | | | | | 636,794 | |
| | | | | | | | | | |
| | | | | | | | | 3,703,616 | |
| | | | | | | | | | |
Machinery – 0.1% | | | | | | | | | | |
Ingersoll-Rand Global Holding Co. Ltd., 6.00%, | | | | | | | | | | |
8/15/13 | | | | 220 | | | | | 242,279 | |
Siemens Financieringsmat, 5.50%, 2/16/12 (a) | | | | 100 | | | | | 103,859 | |
| | | | | | | | | | |
| | | | | | | | | 346,138 | |
| | | | | | | | | | |
Media – 11.1% | | | | | | | | | | |
Comcast Cable Communications Holdings, Inc., | | | | | | | | | | |
8.38%, 3/15/13 | | | | 3,000 | | | | | 3,381,057 | |
Comcast Corp.: | | | | | | | | | | |
5.90%, 3/15/16 | | | | 955 | | | | | 1,062,291 | |
6.50%, 11/15/35 | | | | 1,375 | | | | | 1,423,423 | |
6.55%, 7/01/39 | | | | 925 | | | | | 959,216 | |
COX Communications, Inc.: | | | | | | | | | | |
7.13%, 10/01/12 | | | | 2,250 | | | | | 2,442,526 | |
4.63%, 6/01/13 | | | | 5,000 | | | | | 5,307,230 | |
8.38%, 3/01/39 (a) | | | | 625 | | | | | 793,345 | |
DIRECTV Holdings LLC/DIRECTV Financing Co., Inc.: | | | | | | | | | | |
3.50%, 3/01/16 | | | | 1,950 | | | | | 1,954,233 | |
5.20%, 3/15/20 | | | | 1,400 | | | | | 1,441,937 | |
Discovery Communications LLC: | | | | | | | | | | |
3.70%, 6/01/15 | | | | 1,175 | | | | | 1,213,847 | |
6.35%, 6/01/40 | | | | 205 | | | | | 212,781 | |
Grupo Televisa SA, 6.63%, 1/15/40 | | | | 900 | | | | | 953,575 | |
NBCUniversal Media LLC: | | | | | | | | | | |
2.88%, 4/01/16 (a) | | | | 587 | | | | | 573,444 | |
4.38%, 4/01/21 (a) | | | | 800 | | | | | 765,912 | |
5.95%, 4/01/41 (a) | | | | 475 | | | | | 455,177 | |
News America, Inc.: | | | | | | | | | | |
7.28%, 6/30/28 | | | | 1,075 | | | | | 1,187,372 | |
6.40%, 12/15/35 | | | | 1,025 | | | | | 1,054,570 | |
TCM Sub LLC, 3.55%, 1/15/15 (a) | | | | 1,750 | | | | | 1,771,509 | |
Thomson Reuters Corp., 5.95%, 7/15/13 | | | | 2,300 | | | | | 2,533,473 | |
Time Warner Cable, Inc.: | | | | | | | | | | |
5.85%, 5/01/17 | | | | 2,000 | | | | | 2,187,398 | |
8.25%, 4/01/19 | | | | 1,120 | | | | | 1,364,416 | |
5.00%, 2/01/20 | | | | 850 | | | | | 859,370 | |
Turner Broadcasting System, Inc., 8.38%, | | | | | | | | | | |
7/01/13 | | | | 25 | | | | | 28,498 | |
Virgin Media Secured Finance Plc, 6.50%, | | | | | | | | | | |
1/15/18 | | | | 820 | | | | | 895,850 | |
| | | | | | | | | | |
| | | | | | | | | 34,822,450 | |
| | | | | | | | | | |
Metals & Mining – 1.7% | | | | | | | | | | |
Cliffs Natural Resources, Inc., 4.80%, | | | | | | | | | | |
10/01/20 | | | | 1,200 | | | | | 1,184,707 | |
Freeport-McMoRan Copper & Gold, Inc., 8.38%, | | | | | | | | | | |
4/01/17 | | | | 800 | | | | | 882,000 | |
Rio Tinto Finance USA Ltd., 7.13%, 7/15/28 | | | | 1,025 | | | | | 1,236,445 | |
Southern Copper Corp., 6.75%, 4/16/40 | | | | 750 | | | | | 753,884 | |
Teck Resources Ltd., 10.25%, 5/15/16 | | | | 850 | | | | | 1,022,125 | |
Xstrata Canada Corp., 6.00%, 10/15/15 | | | | 75 | | | | | 82,520 | |
| | | | | | | | | | |
| | | | | | | | | 5,161,681 | |
| | | | | | | | | | |
Multiline Retail – 0.2% | | | | | | | | | | |
JC Penney Corp., Inc., 5.75%, 2/15/18 | | | | 550 | | | | | 554,125 | |
Kohl’s Corp., 6.88%, 12/15/37 | | | | 35 | | | | | 39,969 | |
| | | | | | | | | | |
| | | | | | | | | 594,094 | |
| | | | | | | | | | |
Multi-Utilities – 2.3% | | | | | | | | | | |
CenterPoint Energy, Inc., 6.50%, 5/01/18 | | | | 850 | | | | | 954,481 | |
Northern States Power Co., 6.20%, 7/01/37 | | | | 725 | | | | | 814,833 | |
Sempra Energy, 6.50%, 6/01/16 | | | | 975 | | | | | 1,112,767 | |
Virginia Electric & Power Co.: | | | | | | | | | | |
5.40%, 1/15/16 | | | | 3,000 | | | | | 3,334,920 | |
6.00%, 1/15/36 | | | | 900 | | | | | 967,027 | |
| | | | | | | | | | |
| | | | | | | | | 7,184,028 | |
| �� | | | | | | | | | |
Oil, Gas & Consumable Fuels – 4.7% | | | | | | | | | | |
Anadarko Petroleum Corp.: | | | | | | | | | | |
5.95%, 9/15/16 | | | | 1,705 | | | | | 1,853,991 | |
6.45%, 9/15/36 | | | | 375 | | | | | 374,516 | |
Canadian Natural Resources Ltd., 5.70%, | | | | | | | | | | |
5/15/17 | | | | 1,645 | | | | | 1,840,477 | |
Cenovus Energy, Inc., 6.75%, 11/15/39 | | | | 355 | | | | | 396,531 | |
DCP Midstream LLC, 5.35%, 3/15/20 (a) | | | | 750 | | | | | 779,468 | |
Enterprise Products Operating LLC: | | | | | | | | | | |
3.70%, 6/01/15 | | | | 500 | | | | | 515,144 | |
5.25%, 1/31/20 | | | | 900 | | | | | 934,025 | |
6.45%, 9/01/40 | | | | 800 | | | | | 831,277 | |
EOG Resources, Inc., 2.50%, 2/01/16 | | | | 1,000 | | | | | 976,322 | |
Kinder Morgan Energy Partners LP, 7.30%, | | | | | | | | | | |
8/15/33 | | | | 1,400 | | | | | 1,562,929 | |
Marathon Petroleum Corp., 6.50%, 3/01/41 (a) | | | | 422 | | | | | 426,373 | |
Schlumberger Norge AS, 4.20%, 1/15/21 (a) | | | | 975 | | | | | 975,412 | |
Shell International Finance BV: | | | | | | | | | | |
3.10%, 6/28/15 | | | | 950 | | | | | 973,456 | |
6.38%, 12/15/38 | | | | 800 | | | | | 904,074 | |
Valero Energy Corp., 6.63%, 6/15/37 | | | | 426 | | | | | 429,388 | |
Williams Partners LP: | | | | | | | | | | |
5.25%, 3/15/20 | | | | 800 | | | | | 834,538 | |
6.30%, 4/15/40 | | | | 225 | | | | | 233,652 | |
| | | | | | | | | | |
| | | | | | | | | 14,841,573 | |
| | | | | | | | | | |
Paper & Forest Products – 1.2% | | | | | | | | | | |
Celulosa Arauco y Constitucion SA, 7.25%, | | | | | | | | | | |
7/29/19 | | | | 900 | | | | | 1,037,381 | |
International Paper Co.: | | | | | | | | | | |
7.95%, 6/15/18 | | | | 1,150 | | | | | 1,383,536 | |
7.50%, 8/15/21 | | | | 720 | | | | | 844,978 | |
Inversiones CMPC SA, 4.75%, 1/19/18 (a) | | | | 575 | | | | | 565,763 | |
| | | | | | | | | | |
| | | | | | | | | 3,831,658 | |
| | | | | | | | | | |
Pharmaceuticals – 3.8% | | | | | | | | | | |
Merck & Co, Inc., 6.55%, 9/15/37 | | | | 625 | | | | | 738,618 | |
Roche Holding, Inc., 6.00%, 3/01/19 (a) | | | | 1,200 | | | | | 1,360,165 | |
See Notes to Financial Statements.
| | | | | | |
| 16 | | BLACKROCK BOND ALLOCATION TARGET SHARES | | MARCH 31, 2011 | | |
| | |
| Schedule of Investments (continued) | | Series C Portfolio |
| | (Percentages shown are based on Net Assets) |
| | | | | | | | | | |
Corporate Bonds | | Par
(000) | | Value |
Pharmaceuticals (concluded) | | | | | | | | | | |
Sanofi-Aventis SA, 2.63%, 3/29/16 | | | $ | 950 | | | | $ | 941,834 | |
Teva Pharmaceutical Finance Co. LLC: | | | | | | | | | | |
5.55%, 2/01/16 | | | | 2,400 | | | | | 2,671,500 | |
6.15%, 2/01/36 | | | | 1,000 | | | | | 1,090,503 | |
Watson Pharmaceuticals, Inc., 5.00%, | | | | | | | | | | |
8/15/14 | | | | 1,025 | | | | | 1,102,185 | |
Wyeth: | | | | | | | | | | |
5.50%, 2/15/16 | | | | 1,110 | | | | | 1,242,069 | |
5.45%, 4/01/17 | | | | 1,500 | | | | | 1,676,441 | |
5.95%, 4/01/37 | | | | 1,175 | | | | | 1,256,137 | |
| | | | | | | | | | |
| | | | | | | | | 12,079,452 | |
| | | | | | | | | | |
Real Estate Investment Trusts (REITs) – 1.1% | | | | | | | | | | |
AvalonBay Communities, Inc., 6.13%, | | | | | | | | | | |
11/01/12 | | | | 53 | | | | | 57,052 | |
HCP, Inc.: | | | | | | | | | | |
3.75%, 2/01/16 | | | | 525 | | | | | 527,654 | |
5.38%, 2/01/21 | | | | 725 | | | | | 732,164 | |
Plum Creek Timberlands LP, 4.70%, 3/15/21 | | | | 875 | | | | | 842,652 | |
ProLogis, 6.25%, 3/15/17 | | | | 525 | | | | | 568,846 | |
Weyerhaeuser Co., 7.13%, 7/15/23 | | | | 750 | | | | | 797,245 | |
| | | | | | | | | | |
| | | | | | | | | 3,525,613 | |
| | | | | | | | | | |
Road & Rail – 1.1% | | | | | | | | | | |
Asciano Finance Ltd., 5.00%, 4/07/18 (a) | | | | 600 | | | | | 596,748 | |
Burlington Northern Santa Fe LLC: | | | | | | | | | | |
5.65%, 5/01/17 | | | | 425 | | | | | 473,232 | |
5.75%, 5/01/40 | | | | 500 | | | | | 506,357 | |
Canadian National Railway Co., 6.25%, | | | | | | | | | | |
8/01/34 | | | | 1,100 | | | | | 1,235,993 | |
Canadian Pacific Railway Co., 7.25%, 5/15/19 | | | | 500 | | | | | 592,396 | |
| | | | | | | | | | |
| | | | | | | | | 3,404,726 | |
| | | | | | | | | | |
Software – 0.9% | | | | | | | | | | |
Oracle Corp.: | | | | | | | | | | |
5.25%, 1/15/16 | | | | 2,100 | | | | | 2,334,457 | |
5.38%, 7/15/40 (a) | | | | 475 | | | | | 462,325 | |
| | | | | | | | | | |
| | | | | | | | | 2,796,782 | |
| | | | | | | | | | |
Specialty Retail – 0.5% | | | | | | | | | | |
Best Buy Co., Inc., 5.50%, 3/15/21 | | | | 800 | | | | | 784,969 | |
The Home Depot, Inc., 5.88%, 12/16/36 | | | | 600 | | | | | 596,396 | |
| | | | | | | | | | |
| | | | | | | | | 1,381,365 | |
| | | | | | | | | | |
Tobacco – 0.8% | | | | | | | | | | |
Altria Group, Inc., 10.20%, 2/06/39 | | | | 720 | | | | | 1,021,523 | |
Philip Morris International, Inc., 5.65%, | | | | | | | | | | |
5/16/18 | | | | 1,385 | | | | | 1,541,783 | |
| | | | | | | | | | |
| | | | | | | | | 2,563,306 | |
| | | | | | | | | | |
Wireless Telecommunication Services – 3.1% | | | | | | | | | | |
Alltel Corp., 7.88%, 7/01/32 | | | | 470 | | | | | 607,514 | |
America Movil SAB de CV, 5.50%, 3/01/14 | | | | 1,250 | | | | | 1,363,579 | |
American Tower Corp., 4.63%, 4/01/15 | | | | 2,500 | | | | | 2,595,358 | |
Cellco Partnership/Verizon Wireless Capital LLC, | | | | | | | | | | |
8.50%, 11/15/18 | | | | 305 | | | | | 391,868 | |
Rogers Communications, Inc., 7.50%, 3/15/15 | | | | 2,125 | | | | | 2,508,454 | |
Vodafone Group Plc, 5.75%, 3/15/16 | | | | 2,000 | | | | | 2,233,320 | |
| | | | | | | | | | |
| | | | | | | | | 9,700,093 | |
| | | | | | | | | | |
Total Corporate Bonds – 88.3% | | | | | | | | | 277,898,917 | |
| | | | | | | | | | |
Foreign Agency Obligations | | | | | | | | | | |
CDP Financial, Inc., 4.40%, 11/25/19 (a) | | | | 1,700 | | | | | 1,715,258 | |
Nakilat, Inc., 6.07%, 12/31/33 (a) | | | | 25 | | | | | 24,875 | |
Petrobras International Finance Co.: | | | | | | | | | | |
3.88%, 1/27/16 | | | | 700 | | | | | 704,680 | |
5.88%, 3/01/18 | | | | 2,350 | | | | | 2,489,235 | |
7.88%, 3/15/19 | | | | 450 | | | | | 528,338 | |
6.88%, 1/20/40 | | | | 845 | | | | | 884,887 | |
| | | | | | | | | | |
Total Foreign Agency Obligations – 2.0% | | | | | | | | | 6,347,273 | |
| | | | | | | | | | |
Foreign Government Obligations | | | | | | | | | | |
Mexico – 1.0% | | | | | | | | | | |
United Mexican States: | | | | | | | | | | |
5.88%, 2/17/14 | | | | 1,775 | | | | | 1,953,388 | |
5.95%, 3/19/19 | | | | 1,100 | | | | | 1,225,950 | |
| | | | | | | | | | |
| | | | | | | | | 3,179,338 | |
| | | | | | | | | | |
United Arab Emirates – 0.7% | | | | | | | | | | |
Emirate of Abu Dhabi Notes, 6.75%, | | | | | | | | | | |
4/08/19 (a) | | | | 1,750 | | | | | 2,012,500 | |
| | | | | | | | | | |
Total Foreign Government Obligations – 1.7% | | | | | | | | | 5,191,838 | |
| | | | | | | | | | |
Preferred Securities | | | | | | | | | | |
Capital Trusts | | | | | | | | | | |
Capital Markets – 0.9% | | | | | | | | | | |
Credit Suisse AG/Guernsey, | | | | | | | | | | |
5.86% (b)(c) | | | | 2,000 | | | | | 1,940,000 | |
Lehman Brothers Holdings Capital Trust VII, | | | | | | | | | | |
5.86% (b)(c)(d)(e) | | | | 4,070 | | | | | 407 | |
State Street Capital Trust IV, | | | | | | | | | | |
1.31%, 6/15/37 (b) | | | | 1,075 | | | | | 887,033 | |
| | | | | | | | | | |
| | | | | | | | | 2,827,440 | |
| | | | | | | | | | |
Commercial Banks – 0.4% | | | | | | | | | | |
Rabobank Capital Funding Trust II, | | | | | | | | | | |
5.26% (a)(b)(c) | | | | 75 | | | | | 74,465 | |
USB Capital XIII Trust, | | | | | | | | | | |
6.63%, 12/15/39 | | | | 950 | | | | | 994,527 | |
Wachovia Capital Trust III, | | | | | | | | | | |
5.57%, 3/15/42 (b) | | | | 225 | | | | | 206,438 | |
| | | | | | | | | | |
| | | | | | | | | 1,275,430 | |
| | | | | | | | | | |
Consumer Finance – 0.3% | | | | | | | | | | |
Capital One Capital V, | | | | | | | | | | |
10.25%, 8/15/39 | | | | 820 | | | | | 889,700 | |
| | | | | | | | | | |
Diversified Financial Services – 0.6% | | | | | | | | | | |
JPMorgan Chase Capital XXII, | | | | | | | | | | |
6.45%, 2/02/37 | | | | 200 | | | | | 201,280 | |
JPMorgan Chase Capital XXVII, | | | | | | | | | | |
7.00%, 11/01/39 | | | | 1,225 | | | | | 1,262,211 | |
ZFS Finance USA Trust V, | | | | | | | | | | |
6.50%, 5/09/37 (a)(b) | | | | 500 | | | | | 501,250 | |
| | | | | | | | | | |
| | | | | | | | | 1,964,741 | |
| | | | | | | | | | |
See Notes to Financial Statements.
| | | | | | |
| | | BLACKROCK BOND ALLOCATION TARGET SHARES | | MARCH 31, 2011 | | 17 |
| | |
| Schedule of Investments (continued) | | Series C Portfolio |
| | (Percentages shown are based on Net Assets) |
| | | | | | | | | | |
Preferred Securities | | Par
(000) | | Value |
Insurance – 0.6% | | | | | | | | | | |
Lincoln National Corp., | | | | | | | | | | |
7.00%, 5/17/66 (b) | | | $ | 875 | | | | $ | 868,438 | |
New York Life Insurance Co., | | | | | | | | | | |
6.75%, 11/15/39 (a) | | | | 925 | | | | | 1,060,997 | |
| | | | | | | | | | |
| | | | | | | | | 1,929,435 | |
| | | | | | | | | | |
Total Preferred Securities – 2.8% | | | | | | | | | 8,886,746 | |
| | | | | | | | | | |
Taxable Municipal Bonds | | | | | | | | | | |
Chicago O’Hare International Airport RB, 6.40%, | | | | | | | | | | |
1/01/40 | | | | 1,000 | | | | | 959,960 | |
Los Angeles Department of Water & Power RB, | | | | | | | | | | |
6.57%, 7/01/45 | | | | 2,000 | | | | | 2,070,580 | |
Metropolitan Transportation Authority, New York RB, | | | | | | | | | | |
7.34%, 11/15/39 | | | | 2,325 | | | | | 2,635,550 | |
Municipal Electric Authority of Georgia RB, | | | | | | | | | | |
6.64%, 4/01/57 | | | | 1,200 | | | | | 1,141,188 | |
State of California GO, 7.55%, 4/01/39 | | | | 945 | | | | | 1,031,940 | |
State of Illinois GO, 4.42%, 1/01/15 | | | | 1,100 | | | | | 1,098,086 | |
| | | | | | | | | | |
Total Taxable Municipal Bonds – 2.8% | | | | | | | | | 8,937,304 | |
| | | | | | | | | | |
U.S. Government Sponsored Agency Securities Agency Obligations – 0.5% | | | | | | | | | | |
Fannie Mae, 4.59%, 10/09/19 (f) | | | | 2,250 | | | | | 1,528,594 | |
| | | | | | | | | | |
U.S. Treasury Obligations | | | | | | | | | | |
U.S. Treasury Bonds: | | | | | | | | | | |
3.88%, 8/15/40 | | | | 2,725 | | | | | 2,438,450 | |
4.25%, 11/15/40 | | | | 435 | | | | | 416,037 | |
| | | | | | | | | | |
Total U.S. Treasury Obligations – 0.9% | | | | | | | | | 2,854,487 | |
| | | | | | | | | | |
Total Long-Term Investments
(Cost – $299,201,101) – 99.0% | | | | | | | | | 311,645,159 | |
| | | | | | | | | | |
| | |
Short-Term Securities | | Shares | | |
Dreyfus Treasury Prime, 0.00% (g) | | | | 6,438,159 | | | | | 6,438,159 | |
| | | | | | | | | | |
Total Short-Term Securities
(Cost – $6,438,159) – 2.0% | | | | | | | | | 6,438,159 | |
| | | | | | | | | | |
| | |
Options Purchased | | Contracts | | |
Exchange-Traded Put Options Purchased – 0.1% | | | | | | | | | | |
Euro Dollar (1 Year) Mid-Curve, Strike Price USD
98, Expires 9/16/11 | | | | 200 | | | | | 105,000 | |
Euro Dollar (1 Year) Mid-Curve, Strike Price USD
98.25, Expires 9/16/11 | | | | 205 | | | | | 148,625 | |
| | | | | | | | | | |
| | | | | | | | | 253,625 | |
| | | | | | | | | | |
Over-the-Counter Dual Binary Options Purchased – 0.0% | | | | | | | | | | |
Receive 1% of notional amount at expiration date if 30 year swap is below or at 4.295% and 5 year swap is above or at 2.38% based on ISDAFIX, Expires 6/23/11, Broker Goldman Sachs Bank USA | | | | 25,000,000 | | | | | 47,500 | |
| | | | | | | | | | |
| | |
| | | Notional
Amount
(000) | | |
Over-the-Counter Call Swaptions Purchased – 0.0% | | | | | | | | | | |
Receive a fixed rate of 1.758% and pay a floating rate based on 3-month LIBOR, Expires 1/26/12, Broker Deutsche Bank AG | | | | 8,200 | | | | | 51,455 | |
| | | | | | | | | | |
Over-the-Counter Put Swaptions Purchased – 0.0% | | | | | | | | | | |
Pay a fixed rate of 1.758% and receive a floating rate based on 3-month LIBOR, Expires 1/26/12, Broker Deutsche Bank AG | | | | 8,200 | | | | | 66,624 | |
Pay a fixed rate of 2.500% and receive a floating rate based on 3-month LIBOR, Expires 1/26/12, Broker Deutsche Bank AG | | | | 3,900 | | | | | 15,944 | |
| | | | | | | | | | |
| | | | | | | | | 82,568 | |
| | | | | | | | | | |
Total Options Purchased
(Cost – $414,666) – 0.1% | | | | | | | | | 435,148 | |
| | | | | | | | | | |
Total Investments Before Options Written
(Cost – $306,053,926*) – 101.1% | | | | | | | | | 318,518,466 | |
| | | | | | | | | | |
| | |
Options Written | | Contracts | | |
Exchange-Traded Put Options Written – (0.0)% | | | | | | | | | | |
Euro Dollar (1 Year) Mid-Curve, Strike Price USD
97.75, Expires 9/16/11 | | | | 205 | | | | | (74,313 | ) |
| | | | | | | | | | |
| | |
| | | Notional
Amount
(000) | | |
Over-the-Counter Call Swaptions Written – (0.2)% | | | | | | | | | | |
Pay a fixed rate of 2.080% and receive a floating rate based on 3-month LIBOR, Expires 2/07/12, Broker Goldman Sachs Bank USA | | | $ | 8,200 | | | | | (83,025 | ) |
Pay a fixed rate of 4.705% and receive a floating rate based on 3-month LIBOR, Expires 3/24/14, Broker Citibank, N.A. | | | | 9,600 | | | | | (537,859 | ) |
| | | | | | | | | | |
| | | | | | | | | (620,884 | ) |
| | | | | | | | | | |
Over-the-Counter Put Swaptions Written – (0.2)% | | | | | | | | | | |
Receive a fixed rate of 2.080% and pay a floating rate based on 3-month LIBOR, Expires 2/07/12, Broker Goldman Sachs Bank USA | | | | 8,200 | | | | | (51,961 | ) |
Receive a fixed rate of 4.705% and pay a floating rate based on 3-month LIBOR, Expires 3/24/14, Broker Citibank, N.A. | | | | 9,600 | | | | | (590,295 | ) |
| | | | | | | | | | |
| | | | | | | | | (642,256 | ) |
| | | | | | | | | | |
Total Options Written | | | | | | | | | | |
(Premiums
Received – $1,362,701) – (0.4)% | | | | | | | | | (1,337,453 | ) |
| | | | | | | | | | |
Total Investments Net of Options Written – 100.7% | | | | | | | | | 317,181,013 | |
Liabilities in Excess of Other Assets – (0.7)% | | | | | | | | | (2,346,492 | ) |
| | | | | | | | | | |
Net Assets – 100.0% | | | | | | | | $ | 314,834,521 | |
| | | | | | | | | | |
See Notes to Financial Statements.
| | | | | | |
| 18 | | BLACKROCK BOND ALLOCATION TARGET SHARES | | MARCH 31, 2011 | | |
| | |
| Schedule of Investments (continued) | | Series C Portfolio |
| | |
| * | The cost and unrealized appreciation (depreciation) of investments as of March 31, 2011, as computed for federal income tax purposes, were as follows: |
| | | | | |
Aggregate cost | | | $ | 306,053,926 | |
| | | | | |
Gross unrealized appreciation | | | $ | 17,926,225 | |
Gross unrealized depreciation | | | | (5,461,685 | ) |
| | | | | |
Net unrealized appreciation | | | $ | 12,464,540 | |
| | | | | |
| (a) | Security exempt from registration under Rule 144A of the Securities Act of 1933. These securities may be resold in transactions exempt from registration to qualified institutional investors. |
| (b) | Variable rate security. Rate shown is as of report date. |
| (c) | Security is perpetual in nature and has no stated maturity date. |
| (d) | Non-income producing security. |
| (e) | Issuer filed for bankruptcy and/or is in default of interest payments. |
| (f) | Represents a zero-coupon bond. Rate shown reflects the current yield as of report date. |
| (g) | Represents the current yield as of report date. |
| | • | | Financial futures contracts purchased as of March 31, 2011 were as follows: |
| | | | | | | | | | | | | | | | | | | | | | | | | |
Contracts | | Issue | | Exchange | | Expiration
Date | | Notional
Value | | Unrealized
Appreciation
(Depreciation) |
249 | | |
| U.S.
Treasury
Notes
(2 Year) |
| | |
| Chicago
Mercantile |
| | | | June 2011 | | | | $ | 54,313,125 | | | | $ | 27,098 | |
26 | | |
| U.S.
Treasury
Notes (10
Year) |
| | |
| Chicago
Mercantile |
| | | | June 2011 | | | | $ | 3,094,812 | | | | | 65 | |
65 | | |
| Ultra
Treasury
Bonds |
| | |
| Chicago
Mercantile |
| | | | June 2011 | | | | $ | 8,031,563 | | | | | (12,193 | ) |
| | | | | | | | | | | | | | | | | | | | | | | | | |
Total | | | | | | | | | | | | | | | | | | | | | | | $ | 14,970 | |
| | | | | | | | | | | | | | | | | | | | | | | | | |
| | • | | Financial futures contracts sold as of March 31, 2011 were as follows: |
| | | | | | | | | | | | | | | | | | | | | | | | | |
Contracts | | Issue | | Exchange | | Expiration
Date | | Notional
Value | | Unrealized
Appreciation
(Depreciation) |
144 | | |
| U.S.
Treasury
Notes (5
Year) |
| | |
| Chicago
Mercantile |
| | | | June 2011 | | | | $ | 16,817,625 | | | | $ | 26,122 | |
14 | | |
| U.S.
Treasury
Bonds
(20 Year) |
| | |
| Chicago
Mercantile |
| | | | June 2011 | | | | $ | 1,682,625 | | | | | (13,862 | ) |
| | | | | | | | | | | | | | | | | | | | | | | | | |
Total | | | | | | | | | | | | | | | | | | | | | | | $ | 12,260 | |
| | | | | | | | | | | | | | | | | | | | | | | | | |
| | • | | Interest rate swaps outstanding as of March 31, 2011 were as follows: |
| | | | | | | | | | | | | | | | | | | | | | | | | | | | | | |
Fixed Rate | | Floating Rate | | Counterparty | | Expiration
Date | | Notional
Amount
(000) | | Unrealized
Appreciation
(Depreciation) |
0.68%(a) | | | | 3-month LIBOR | | | |
| Credit
Suisse
International |
| | | | 9/17/12 | | | | | USD | | | | | 39,500 | | | | $ | (26,457 | ) |
0.60%(a) | | | | 3-month LIBOR | | | |
| Citibank,
N.A. |
| | | | 10/01/12 | | | | | USD | | | | | 6,900 | | | | | (9,098 | ) |
3.61%(b) | | | | 3-month LIBOR | | | |
| Credit
Suisse
International |
| | | | 3/08/21 | | | | | USD | | | | | 1,600 | | | | | 12,342 | |
3.47%(b) | | | | 3-month LIBOR | | | |
| Deutsche
Bank AG |
| | | | 3/23/21 | | | | | USD | | | | | 2,900 | | | | | (17,945 | ) |
3.48%(a) | | | | 3-Month LIBOR | | | | | UBS AG | | | | | 9/17/40 | | | | | USD | | | | | 2,000 | | | | | 271,656 | |
3.31%(a) | | | | 3-month LIBOR | | | |
| Citibank,
N.A. |
| | | | 10/01/40 | | | | | USD | | | | | 1,800 | | | | | 272,619 | |
3.73%(a) | | | | 3-month LIBOR | | | |
| Credit
Suisse
International |
| | | | 11/05/40 | | | | | USD | | | | | 200 | | | | | 16,096 | |
| | | | | | | | | | | | | | | | | | | | | | | | | | | | | | |
Total | | | | | | | | | | | | | | | | | | | | | | | | | | | | $ | 519,213 | |
| | | | | | | | | | | | | | | | | | | | | | | | | | | | | | |
| (a) | Fund pays fixed interest rate and receives floating rate. |
| (b) | Fund pays floating interest rate and receives fixed rate. |
| | • | | Credit default swaps on traded indexes - buy protection outstanding as of March 31, 2011 were as follows: |
| | | | | | | | | | | | | | | | | | | | | | | | | | | | | | |
Index | | Pay
Fixed
Rate | | Counterparty | | Expiration
Date | | Notional
Amount
(000) | | Unrealized
Depreciation |
MCDX.NA | | | | | | | | | | | | | | | | | | | | | | | | | | | | | | |
Series 15 | | | | | | | | | | | | | | | | | | | | | | | | | | | | | | |
Version 1 | | | | 1.00 | % | | | | Citibank, N.A. | | | | | 12/20/15 | | | | | USD | | | | | 725 | | | | $ | (5,500 | ) |
MCDX.NA | | | | | | | | | | | | | | | | | | | | | | | | | | | | | | |
Series 15 | | | | | | | | | | | | | | | | | | | | | | | | | | | | | | |
Version 1 | | | | 1.00 | % | | | | Citibank, N.A. | | | | | 12/20/15 | | | | | USD | | | | | 900 | | | | | (6,248 | ) |
MCDX.NA | | | | | | | | | | | | | | | | | | | | | | | | | | | | | | |
Series 15 | | | | | | | | | | | | | | | | | | | | | | | | | | | | | | |
Version 1 | | | | 1.00 | % | | | | Deutsche Bank AG | | | | | 12/20/15 | | | | | USD | | | | | 725 | | | | | (5,757 | ) |
| | | | | | | | | | | | | | | | | | | | | | | | | | | | | | |
Total | | | | | | | | | | | | | | | | | | | | | | | | | | | | $ | (17,505 | ) |
| | | | | | | | | | | | | | | | | | | | | | | | | | | | | | |
| | • | | For Fund compliance purposes, the Fund’s industry classifications refer to any one or more of the industry sub-classifications used by one or more widely recognized market indexes or ratings group indexes, and/or as defined by Fund management. These definitions may not apply for purposes of this report, which may combine industry sub-classifications for reporting ease. |
See Notes to Financial Statements.
| | | | | | |
| | | BLACKROCK BOND ALLOCATION TARGET SHARES | | MARCH 31, 2011 | | 19 |
| | |
| Schedule of Investments (concluded) | | Series C Portfolio |
| | |
| | • | | Fair Value Measurements – Various inputs are used in determining the fair value of investments and derivative financial instruments. These inputs are summarized in three broad levels for financial statement purposes as follows: |
| | • | | Level 1 – price quotations in active markets/exchanges for identical assets and liabilities |
| | • | | Level 2 – other observable inputs (including, but not limited to: quoted prices for similar assets or liabilities in markets that are active, quoted prices for identical or similar assets or liabilities in markets that are not active, inputs other than quoted prices that are observable for the assets or liabilities (such as interest rates, yield curves, volatilities, prepayment speeds, loss severities, credit risks and default rates) or other market–corroborated inputs) |
| | • | | Level 3 – unobservable inputs based on the best information available in the circumstances, to the extent observable inputs are not available (including the Fund’s own assumptions used in determining the fair value of investments and derivative financial instruments) |
The inputs or methodologies used for valuing securities are not necessarily an indication of the risk associated with investing in those securities. For information about the Fund’s policy regarding valuation of investments and derivative financial instruments and other significant accounting policies, please refer to Note 1 of the Notes to Financial Statements.
The following tables summarize the inputs used as of March 31, 2011 in determining the fair valuation of the Fund’s investments and derivative financial instruments:
| | | | | | | | | | | | | | | | |
Valuation Inputs | | Level 1 | | | Level 2 | | | Level 3 | | | Total | |
Assets: | | | | | | | | | | | | | | | | |
Investments: | | | | | | | | | | | | | | | | |
Long-Term Investments1 | | | – | | | $ | 311,645,159 | | | | – | | | $ | 311,645,159 | |
Short-Term Securities | | $ | 6,438,159 | | | | – | | | | – | | | | 6,438,159 | |
| | | | | | | | | | | | | | | | |
Total | | $ | 6,438,159 | | | $ | 311,645,159 | | | | – | | | $ | 318,083,318 | |
| | | | | | | | | | | | | | | | |
| 1 | See above Schedule of Investments for values in each security type. |
| | | | | | | | | | | | | | | | | | | | |
Valuation Inputs | | Level 1 | | Level 2 | | Level 3 | | Total |
Derivative Financial Instruments2 | | | | | | | | | | | | | | | | | | | | |
Assets: | | | | | | | | | | | | | | | | | | | | |
Interest rate contracts | | | $ | 306,910 | | | | $ | 706,736 | | | | $ | 47,500 | | | | $ | 1,061,146 | |
Liabilities: | | | | | | | | | | | | | | | | | | | | |
Interest rate contracts | | | | (100,368 | ) | | | | (1,316,640 | ) | | | | – | | | | | (1,417,008 | ) |
Credit contracts | | | | – | | | | | (17,505 | ) | | | | – | | | | | (17,505 | ) |
| | | | | | | | | | | | | | | | | | | | |
Total | | | $ | 206,542 | | | | $ | (627,409 | ) | | | $ | 47,500 | | | | $ | (373,367 | ) |
| | | | | | | | | | | | | | | | | | | | |
| 2 | Derivative financial instruments are swaps, financial futures contracts and options. Swaps and financial futures contracts are valued at the unrealized appreciation/depreciation on the instrument and options are shown at value. |
See Notes to Financial Statements.
| | | | | | |
| 20 | | BLACKROCK BOND ALLOCATION TARGET SHARES | | MARCH 31, 2011 | | |
| | |
| Schedule of Investments March 31, 2011 | | Series M Portfolio |
| | (Percentages shown are based on Net Assets) |
| | | | | | | | | | |
Asset-Backed Securities | | Par
(000) | | Value |
Ally Auto Receivables Trust: | | | | | | | | | | |
Series 2009-A, Class A2, 1.32%, | | | | | | | | | | |
3/15/12 (a) | | | $ | 148 | | | | $ | 148,050 | |
Series 2009-B, Class A2, 1.21%, | | | | | | | | | | |
6/15/12 (a) | | | | 774 | | | | | 775,311 | |
AmeriCredit Automobile Receivables Trust, | | | | | | | | | | |
Series 2009-1, Class A3, 3.04%, 10/15/13 | | | | 1,200 | | | | | 1,216,751 | |
Bank of America Auto Trust: | | | | | | | | | | |
Series 2009-2A, Class A3, 2.13%, | | | | | | | | | | |
9/15/13 (a) | | | | 1,668 | | | | | 1,680,671 | |
Series 2010-1A, Class A2, 0.75%, | | | | | | | | | | |
6/15/12 (a) | | | | 699 | | | | | 698,763 | |
CarMax Auto Owner Trust, Series 2009-1, | | | | | | | | | | |
Class A3, 4.12%, 3/15/13 | | | | 1,853 | | | | | 1,881,265 | |
Ford Credit Auto Owner Trust: | | | | | | | | | | |
Series 2007-B, Class A4A, 5.24%, | | | | | | | | | | |
7/15/12 | | | | 1,356 | | | | | 1,372,315 | |
Series 2009-A, Class A3A, 3.96%, | | | | | | | | | | |
5/15/13 | | | | 1,528 | | | | | 1,549,008 | |
Series 2009-A, Class A4, 6.07%, | | | | | | | | | | |
5/15/14 | | | | 2,720 | | | | | 2,909,554 | |
Series 2009-D, Class A3, 2.17%, | | | | | | | | | | |
10/15/13 | | | | 865 | | | | | 873,785 | |
Harley-Davidson Motorcycle Trust: | | | | | | | | | | |
Series 2009-3, Class A4, 2.54%, | | | | | | | | | | |
4/17/17 | | | | 1,000 | | | | | 1,021,618 | |
Series 2009-4, Class A2, 1.16%, | | | | | | | | | | |
10/15/12 | | | | 220 | | | | | 219,838 | |
SLM Student Loan Trust: | | | | | | | | | | |
Series 2008-4, Class A4, 1.95%, | | | | | | | | | | |
1/24/17 (b) | | | | 7,350 | | | | | 7,656,902 | |
Series 2008-5, Class A2, 1.40%, | | | | | | | | | | |
10/25/16 (b) | | | | 676 | | | | | 684,366 | |
Series 2008-5, Class A3, 1.60%, | | | | | | | | | | |
1/25/18 (b) | | | | 10,000 | | | | | 10,276,141 | |
Volkswagen Auto Loan Enhanced Trust, | | | | | | | | | | |
Series 2010-1, Class A2, 0.66%, 5/21/12 | | | | 846 | | | | | 846,144 | |
World Omni Auto Receivables Trust, | | | | | | | | | | |
Series 2007-BA, Class B, 5.98%, 4/15/15 (a) | | | | 3,635 | | | | | 3,740,219 | |
| | | | | | | | | | |
Total Asset-Backed Securities – 12.0% | | | | | | | | | 37,550,701 | |
| | | | | | | | | | |
Non-Agency Mortgage-Backed Securities | | | | | | | | | | |
Commercial Mortgage-Backed Securities – 33.2% | | | | | | | | | | |
Banc of America Commercial Mortgage, Inc., | | | | | | | | | | |
Series 2001-PB1, Class A2, 5.79%, 8/11/11 | | | | 2,170 | | | | | 2,178,614 | |
Bear Stearns Commercial Mortgage Securities: | | | | | | | | | | |
Series 2001-TOP2, Class A2, 6.48%, | | | | | | | | | | |
2/15/35 | | | | 218 | | | | | 217,568 | |
Series 2004-T16, Class A6, 4.75%, | | | | | | | | | | |
10/13/14 (b) | | | | 7,355 | | | | | 7,734,700 | |
Series 2005-PW10, Class A4, 5.41%, | | | | | | | | | | |
12/11/40 (b) | | | | 1,000 | | | | | 1,069,713 | |
Citigroup/Deutsche Bank Commercial Mortgage Trust: | | | | | | | | | | |
Series 2006-CD3, Class A5, 5.62%, | | | | | | | | | | |
10/15/48 | | | | 500 | | | | | 537,452 | |
Series 2008-C7, Class A2A, 6.03%, | | | | | | | | | | |
12/10/49 | | | | 2,252 | | | | | 2,251,229 | |
Commercial Mortgage Asset Trust: | | | | | | | | | | |
Series 1999-C1, Class A3, 6.64%, | | | | | | | | | | |
1/17/32 | | | | 7 | | | | | 7,346 | |
Series 2006-C8, Class A3, 5.31%, | | | | | | | | | | |
12/10/46 | | | | 5,000 | | | | | 5,148,752 | |
Credit Suisse Mortgage Capital Certificates: | | | | | | | | | | |
Series 2006-C1, Class A3, 5.44%, | | | | | | | | | | |
2/15/39 (b) | | | | 4,820 | | | | | 5,053,697 | |
Series 2006-C4, Class A3, 5.47%, | | | | | | | | | | |
9/15/39 | | | | 5,770 | | | | | 6,108,843 | |
First Union National Bank Commercial Mortgage, | | | | | | | | | | |
Series 2001-C3, Class A3, 6.42%, 6/15/11 | | | | 79 | | | | | 79,503 | |
GE Capital Commercial Mortgage Corp.: | | | | | | | | | | |
Series 2001-2, Class A4, 6.29%, | | | | | | | | | | |
8/11/33 | | | | 2,120 | | | | | 2,128,455 | |
Series 2004-C2, Class A4, 4.89%, | | | | | | | | | | |
3/10/40 | | | | 1,040 | | | | | 1,100,132 | |
Series 2005-C1, Class A2, 4.35%, | | | | | | | | | | |
6/10/48 | | | | 2,711 | | | | | 2,715,446 | |
GMAC Commercial Mortgage Securities, Inc.: | | | | | | | | | | |
Series 2002-C3, Class B, 5.10%, | | | | | | | | | | |
7/10/39 (b) | | | | 1,000 | | | | | 1,034,744 | |
Series 2003-C2, Class A2, 5.47%, | | | | | | | | | | |
5/10/40 (b) | | | | 3,465 | | | | | 3,702,636 | |
Greenwich Capital Commercial Funding Corp.: | | | | | | | | | | |
Series 2002-C1, Class B, 5.10%, | | | | | | | | | | |
11/11/12 (b) | | | | 1,000 | | | | | 1,036,786 | |
Series 2003-C1, Class A3, 3.86%, | | | | | | | | | | |
7/05/35 | | | | 213 | | | | | 217,373 | |
Series 2005-GG3, Class A2, 4.31%, | | | | | | | | | | |
8/10/42 | | | | 2,518 | | | | | 2,519,854 | |
Series 2005-GG3, Class A3, 4.57%, | | | | | | | | | | |
8/10/42 | | | | 1,335 | | | | | 1,347,182 | |
Series 2007-GG9, Class A4, 5.44%, | | | | | | | | | | |
1/10/17 | | | | 3,000 | | | | | 3,175,390 | |
GS Mortgage Securities Corp. II, | | | | | | | | | | |
Series 2007-GG10, Class A4, 5.81%, 8/10/45 (b) | | | | 11,705 | | | | | 12,427,613 | |
JPMorgan Chase Commercial Mortgage Securities Corp.: | | | | | | | | | | |
Series 2001-C1, Class A3, 5.86%, | | | | | | | | | | |
10/12/11 | | | | 2,659 | | | | | 2,679,161 | |
Series 2001-CIB2, Class A3, 6.43%, | | | | | | | | | | |
6/15/11 | | | | 2,353 | | | | | 2,364,155 | |
Series 2001-CIB3, Class A3, 6.47%, | | | | | | | | | | |
12/15/11 | | | | 3,077 | | | | | 3,116,636 | |
Series 2005-CB12, Class A4, 4.90%, | | | | | | | | | | |
9/12/37 | | | | 280 | | | | | 296,867 | |
Series 2006-LDP7, Class A4, 5.86%, | | | | | | | | | | |
4/15/45 (b) | | | | 2,105 | | | | | 2,313,032 | |
Series 2006-LDP9, Class A25, 5.30%, | | | | | | | | | | |
5/15/47 | | | | 4,820 | | | | | 4,902,176 | |
LB-UBS Commercial Mortgage Trust: | | | | | | | | | | |
Series 2003-C7, Class A2, 4.06%, | | | | | | | | | | |
8/15/10 (b) | | | | 149 | | | | | 148,909 | |
Series 2004-C4, Class A4, 5.39%, | | | | | | | | | | |
6/15/29 (b) | | | | 220 | | | | | 235,714 | |
Series 2005-C5, Class A2, 4.89%, | | | | | | | | | | |
9/15/30 | | | | 1,548 | | | | | 1,554,245 | |
See Notes to Financial Statements.
| | | | | | |
| | | BLACKROCK BOND ALLOCATION TARGET SHARES | | MARCH 31, 2011 | | 21 |
| | |
| Schedule of Investments (continued) | | Series M Portfolio |
| | (Percentages shown are based on Net Assets) |
| | | | | | | | | | |
Non-Agency Mortgage-Backed Securities | | Par
(000) | | Value |
Commercial Mortgage-Backed Securities (concluded) | | | | | | | | | | |
Series 2006-C3, Class A4, 5.66%, | | | | | | | | | | |
3/15/39 (b) | | | $ | 355 | | | | $ | 382,785 | |
Series 2007-C2, Class A2, 5.30%, | | | | | | | | | | |
2/15/40 | | | | 8,998 | | | | | 9,182,262 | |
Morgan Stanley Capital I, Series 2007-IQ15, | | | | | | | | | | |
Class A2, 5.84%, 8/11/12 (b) | | | | 4,100 | | | | | 4,248,944 | |
Salomon Brothers Mortgage Securities VII, Inc., | | | | | | | | | | |
Series 2001-C2, Class A3, 6.50%, 10/13/11 | | | | 4,220 | | | | | 4,276,899 | |
TIAA Seasoned Commercial Mortgage Trust, | | | | | | | | | | |
Series 2007-C4, Class A1, 5.58%, 8/15/39 (b) | | | | 1,214 | | | | | 1,227,034 | |
Wachovia Bank Commercial Mortgage Trust, | | | | | | | | | | |
Series 2006-C28, Class A2, 5.50%, 10/15/48 | | | | 5,362 | | | | | 5,421,048 | |
| | | | | | | | | | |
Total Non-Agency Mortgage-Backed Securities – 33.2% | | | | | | | | | 104,142,895 | |
| | | | | | | | | | |
U.S. Government Sponsored Agency Securities | | | | | | | | | | |
Collateralized Mortgage Obligations – 0.8% | | | | | | | | | | |
Freddie Mac: | | | | | | | | | | |
Series 2511, Class IG, 5.35%, | | | | | | | | | | |
5/01/36 (b) | | | | 1,452 | | | | | 1,532,979 | |
Series 2864, Class NA, 5.50%, | | | | | | | | | | |
1/15/31 | | | | 785 | | | | | 827,275 | |
| | | | | | | | | | |
| | | | | | | | | 2,360,254 | |
| | | | | | | | | | |
Federal Deposit Insurance Corporation Guaranteed – 3.4% | | | | | | | | | | |
Citibank, N.A., 1.38%, 8/10/11 | | | | 5,325 | | | | | 5,347,812 | |
Citigroup Funding, Inc., 2.25%, 12/10/12 | | | | 5,320 | | | | | 5,454,197 | |
| | | | | | | | | | |
| | | | | | | | | 10,802,009 | |
| | | | | | | | | | |
Mortgage-Backed Securities – 45.3% | | | | | | | | | | |
Fannie Mae Mortgage-Backed Securities: | | | | | | | | | | |
3.00%, 9/16/14 | | | | 7,030 | | | | | 7,356,804 | |
3.50%, 4/01/26 (c) | | | | 33,135 | | | | | 33,238,547 | |
4.50%, 4/01/41 (c) | | | | 33,300 | | | | | 33,882,750 | |
5.00%, 4/01/41 (c) | | | | 33,200 | | | | | 34,725,125 | |
6.00%, 4/01/41 (c) | | | | 23,200 | | | | | 25,230,000 | |
Freddie Mac Mortgage-Backed Securities, | | | | | | | | | | |
3.00%, 7/28/14 (d) | | | | 7,045 | | | | | 7,362,286 | |
| | | | | | | | | | |
| | | | | | | | | 141,795,512 | |
| | | | | | | | | | |
Total U.S. Government Sponsored Agency Securities – 49.5% | | | | | | | | | 154,957,775 | |
| | | | | | | | | | |
U.S. Treasury Obligations | | | | | | | | | | |
U.S. Treasury Bonds: | | | | | | | | | | |
3.50%, 2/15/39 (d) | | | | 10,000 | | | | | 8,384,380 | |
4.25%, 5/15/39 (d) | | | | 10,000 | | | | | 9,592,190 | |
4.38%, 11/15/39 | | | | 12,000 | | | | | 11,739,372 | |
U.S. Treasury Inflation Indexed Bonds, 1.75%, | | | | | | | | | | |
1/15/28 | | | | 2,433 | | | | | 2,479,920 | |
U.S. Treasury Notes: | | | | | | | | | | |
3.63%, 2/15/20-2/15/21 | | | | 15,540 | | | | | 15,837,480 | |
2.63%, 8/15/20 | | | | 8,873 | | | | | 8,323,983 | |
| | | | | | | | | | |
Total U.S. Treasury Obligations – 18.0% | | | | | | | | | 56,357,325 | |
| | | | | | | | | | |
Total Long-Term Investments
(Cost – $346,620,640) – 112.7% | | | | | | | | | 353,008,696 | |
| | | | | | | | | | |
| | |
Short-Term Securities | | Shares | | |
Dreyfus Treasury Prime, 0.00% (e) | | | | 86,830,079 | | | | | 86,830,079 | |
| | | | | | | | | | |
Total Short-Term Securities
(Cost – $86,830,079) – 27.7% | | | | | | | | | 86,830,079 | |
| | | | | | | | | | |
Total Investments
(Cost – $433,450,719*) – 140.4% | | | | | | | | | 439,838,775 | |
Liabilities in Excess of Other Assets – (40.4)% | | | | | | | | | (126,494,025 | ) |
| | | | | | | | | | |
Net Assets – 100.0% | | | | | | | | $ | 313,344,750 | |
| | | | | | | | | | |
| * | The cost and unrealized appreciation (depreciation) of investments as of March 31, 2011, as computed for federal income tax purposes, were as follows: |
| | | | | |
Aggregate cost | | | $ | 433,450,719 | |
| | | | | |
Gross unrealized appreciation | | | $ | 8,190,243 | |
Gross unrealized depreciation | | | | (1,802,187 | ) |
| | | | | |
Net unrealized appreciation | | | $ | 6,388,056 | |
| | | | | |
| (a) | Security exempt from registration under Rule 144A of the Securities Act of 1933. These securities may be resold in transactions exempt from registration to qualified institutional investors. |
| (b) | Variable rate security. Rate shown is as of report date. |
| (c) | Represents or includes a TBA transaction. Unsettled TBA transactions as of report date were as follows: |
| | | | | | | | | | |
Counterparty | | Value | | Unrealized
Appreciation |
Credit Suisse International | | | $ | 33,882,750 | | | | $ | 144,387 | |
Deutsche Bank AG | | | $ | 59,955,125 | | | | $ | 158,004 | |
UBS AG | | | $ | 33,238,547 | | | | $ | 243,335 | |
| (d) | All or a portion of security pledged as collateral in connection with open financial futures contracts. |
| (e) | Represents the current yield as of report date. |
| | • | | Financial futures contracts purchased as of March 31, 2011 were as follows: |
| | | | | | | | | | | | | | | | | | | | | | | | | |
Contracts | | Issue | | Exchange | | Expiration
Date | | Notional
Value | | Unrealized
Appreciation
(Depreciation) |
198 | | |
| U.S. Treasury
Notes (2 Year) |
| | |
| Chicago
Mercantile |
| | | | June 2011 | | | | $ | 43,188,750 | | | | $ | 21,552 | |
1,378 | | |
| U.S. Treasury
Notes (5 Year) |
| | |
| Chicago
Mercantile |
| | | | June 2011 | | | | $ | 160,935,329 | | | | | 49,301 | |
146 | | |
| U.S. Treasury
Notes (10 Year) |
| | |
| Chicago
Mercantile |
| | | | June 2011 | | | | $ | 17,378,562 | | | | | (104,697 | ) |
276 | | |
| U.S. Treasury
Bonds (20 Year) |
| | |
| Chicago
Mercantile |
| | | | June 2011 | | | | $ | 33,171,750 | | | | | 269,700 | |
| | | | | | | | | | | | | | | | | | | | | | | | | |
Total | | | | | | | | | | | | | | | | | | | | | | | $ | 235,856 | |
| | | | | | | | | | | | | | | | | | | | | | | | | |
| | • | | Financial futures contracts sold as of March 31, 2011 were as follows: |
| | | | | | | | | | | | | | | | | | | |
Contracts | | Issue | | Exchange | | Expiration
Date | | Notional
Value | | Unrealized
Depreciation |
140 | | Ultra Treasury Bonds | | Chicago Mercantile | | | | June 2011 | | | | $ | 17,298,750 | | | | $ | (91,277 | ) |
See Notes to Financial Statements.
| | | | | | |
| 22 | | BLACKROCK BOND ALLOCATION TARGET SHARES | | MARCH 31, 2011 | | |
| | |
| Schedule of Investments (concluded) | | Series M Portfolio |
| | |
| | • | | Fair Value Measurements – Various inputs are used in determining the fair value of investments and derivative financial instruments. These inputs are summarized in three broad levels for financial statement purposes as follows: |
| | • | | Level 1 – price quotations in active markets/exchanges for identical assets and liabilities |
| | • | | Level 2 – other observable inputs (including, but not limited to: quoted prices for similar assets or liabilities in markets that are active, quoted prices for identical or similar assets or liabilities in markets that are not active, inputs other than quoted prices that are observable for the assets or liabilities (such as interest rates, yield curves, volatilities, prepayment speeds, loss severities, credit risks and default rates) or other market–corroborated inputs) |
| | • | | Level 3 – unobservable inputs based on the best information available in the circumstances, to the extent observable inputs are not available (including the Fund’s own assumptions used in determining the fair value of investments and derivative financial instruments) |
The inputs or methodologies used for valuing securities are not necessarily an indication of the risk associated with investing in those securities. For information about the Fund’s policy regarding valuation of investments and derivative financial instruments and other significant accounting policies, please refer to Note 1 of the Notes to Financial Statements.
The following tables summarize the inputs used as of March 31, 2011 in determining the fair valuation of the Fund’s investments and derivative financial instruments:
| | | | | | | | | | | | | | | | | | | | |
Valuation Inputs | | Level 1 | | Level 2 | | Level 3 | | Total |
Assets: | | | | | | | | | | | | | | | | | | | | |
Investments: | | | | | | | | | | | | | | | | | | | | |
Long-Term Investments: | | | | | | | | | | | | | | | | | | | | |
Asset-Backed Securities | | | | – | | | | $ | 37,550,701 | | | | | – | | | | $ | 37,550,701 | |
Non-Agency Mortgage-Backed Securities | | | | – | | | | | 104,142,895 | | | | | – | | | | | 104,142,895 | |
U.S. Government Sponsored Agency Securities | | | | – | | | | | 154,957,775 | | | | | – | | | | | 154,957,775 | |
U.S. Treasury Obligations | | | | – | | | | | 56,357,325 | | | | | – | | | | | 56,357,325 | |
Short-Term Securities | | | $ | 86,830,079 | | | | | – | | | | | – | | | | | 86,830,079 | |
| | | | | | | | | | | | | | | | | | | | |
Total | | | $ | 86,830,079 | | | | $ | 353,008,696 | | | | | – | | | | $ | 439,838,775 | |
| | | | | | | | | | | | | | | | | | | | |
| | | | |
Valuation Inputs | | Level 1 | | Level 2 | | Level 3 | | Total |
Derivative Financial Instruments1 | | | | | | | | | | | | | | | | | | | | |
Assets: | | | | | | | | | | | | | | | | | | | | |
Interest rate contracts | | | $ | 340,553 | | | | | – | | | | | – | | | | $ | 340,553 | |
Liabilities: | | | | | | | | | | | | | | | | | | | | |
Interest rate contracts | | | | (195,974 | ) | | | | – | | | | | – | | | | | (195,974 | ) |
| | | | | | | | | | | | | | | | | | | | |
Total | | | $ | 144,579 | | | | | – | | | | | – | | | | $ | 144,579 | |
| | | | | | | | | | | | | | | | | | | | |
| 1 | Derivative financial instruments are financial futures contracts which are valued at the unrealized appreciation/depreciation on the instrument. |
The following table is a reconciliation of Level 3 investments for which significant unobservable inputs were used in determining fair value:
| | | | | |
| | | Asset-Backed
Securities |
Assets: | | | | | |
Balance, as of March 31, 2010 | | | $ | 3,844,994 | |
Accrued discounts/premiums | | | | – | |
Net change in unrealized appreciation/depreciation | | | | – | |
Transfers in2 | | | | – | |
Transfers out2 | | | | (3,844,994 | ) |
| | | | | |
Balance, as of March 31, 2011 | | | | – | |
| | | | | |
| 2 | The Fund’s policy is to recognize transfers in and transfers out as of the beginning of the period of the event or the change in circumstances that caused the transfer. |
A reconciliation of Level 3 investments is presented when the Fund had a significant amount of Level 3 investments at the beginning and/or end of the year in relation to net assets.
See Notes to Financial Statements.
| | | | | | |
| | | BLACKROCK BOND ALLOCATION TARGET SHARES | | MARCH 31, 2011 | | 23 |
| | |
| Schedule of Investments (Liquidation Basis) March 31, 2011 | | Series N Portfolio |
| | (Percentages shown are based on Net Assets) |
| | | | | | | | | | |
Municipal Bonds | | Par
(000) | | Value |
Alabama – 1.5% | | | | | | | | | | |
Alabama State Docks Department, RB, 6.00%, | | | | | | | | | | |
10/01/40 | | | $ | 150 | | | | $ | 145,173 | |
| | | | | | | | | | |
California – 10.3% | | | | | | | | | | |
Bay Area Toll Authority, RB, San Francisco Bay Area, | | | | | | | | | | |
Series F-1, 5.63%, 4/01/44 | | | | 400 | | | | | 405,784 | |
California Statewide Communities Development Authority, RB, Senior Living Southern California, | | | | | | | | | | |
6.63%, 11/15/24 | | | | 110 | | | | | 114,116 | |
City of Chula Vista California, RB, San Diego Gas, | | | | | | | | | | |
Series A, Remarketed, 5.88%, 2/15/34 | | | | 125 | | | | | 128,619 | |
State of California, GO, Various Purpose, 6.50%, | | | | | | | | | | |
4/01/33 | | | | 105 | | | | | 112,634 | |
Tuolumne Wind Project Authority, RB, Tuolumne Co. Project, | | | | | | | | | | |
Series A, 5.88%, 1/01/29 | | | | 250 | | | | | 264,220 | |
| | | | | | | | | | |
| | | | | | | | | 1,025,373 | |
| | | | | | | | | | |
Florida – 13.7% | | | | | | | | | | |
Florida Housing Finance Corp., RB: | | | | | | | | | | |
Homeowner Mortgage, Series 1, (Ginnie Mae, Fannie Mae, Freddie Mac), AMT, | | | | | | | | | | |
6.00%, 7/01/39 | | | | 320 | | | | | 328,099 | |
Willow Lake Apartments, Series J-1, (AMBAC), AMT, | | | | | | | | | | |
5.35%, 7/01/27 | | | | 100 | | | | | 86,300 | |
Hillsborough County Aviation Authority, Florida, RB, | | | | | | | | | | |
Series A, (AGC), AMT, 5.50%, 10/01/38 | | | | 355 | | | | | 326,770 | |
Hillsborough County IDA, RB, National Gypsum, | | | | | | | | | | |
Series B, AMT, 7.13%, 4/01/30 | | | | 250 | | | | | 223,137 | |
Jacksonville Port Authority, RB, (AGC), AMT, | | | | | | | | | | |
6.00%, 11/01/38 | | | | 400 | | | | | 401,348 | |
| | | | | | | | | | |
| | | | | | | | | 1,365,654 | |
| | | | | | | | | | |
Illinois – 9.4% | | | | | | | | | | |
Illinois Finance Authority, RB: | | | | | | | | | | |
Children’s Memorial Hospital, Series A, (AGC), | | | | | | | | | | |
5.25%, 8/15/33 | | | | 250 | | | | | 236,160 | |
Edward Hospital, Series A, Remarketed, (AMBAC), | | | | | | | | | | |
6.25%, 2/01/33 | | | | 400 | | | | | 407,292 | |
Friendship Village of Schaumbu, | | | | | | | | | | |
7.13%, 2/15/39 | | | | 210 | | | | | 192,736 | |
Railsplitter Tobacco Settlement Authority, RB, | | | | | | | | | | |
6.00%, 6/01/28 | | | | 100 | | | | | 96,666 | |
| | | | | | | | | | |
| | | | | | | | | 932,854 | |
| | | | | | | | | | |
Kentucky – 1.1% | | | | | | | | | | |
Kentucky Economic Development Finance Authority, RB, Owensboro Medical Health Systems, | | | | | | | | | | |
Series A, 6.38%, 6/01/40 | | | | 115 | | | | | 107,583 | |
| | | | | | | | | | |
Louisiana – 2.6% | | | | | | | | | | |
Louisiana Local Government Environmental Facilities & Community Development Authority, RB, Westlake Chemical Corp. Projects, | | | | | | | | | | |
6.75%, 11/01/32 | | | | 250 | | | | | 254,623 | |
| | | | | | | | | | |
Maryland – 1.9% | | | | | | | | | | |
Maryland Economic Development Corp., Refunding, RB, CNX Marine Terminals, Inc., | | | | | | | | | | |
5.75%, 9/01/25 | | | | 200 | | | | | 186,140 | |
| | | | | | | | | | |
Michigan – 10.7% | | | | | | | | | | |
Advanced Technology Academy, RB, 6.00%, | | | | | | | | | | |
11/01/37 | | | | 200 | | | | | 162,518 | |
City of Detroit Michigan, RB, Senior Lien, | | | | | | | | | | |
Series B, Remarketed, (BHAC), 5.50%, 7/01/35 | | | | 500 | | | | | 490,760 | |
County of Wayne Michigan, GO, Building Improvement, | | | | | | | | | | |
Series A, 6.75%, 11/01/39 | | | | 95 | | | | | 94,515 | |
Michigan State Hospital Finance Authority, Refunding, RB, Henry Ford Health, 5.75%, | | | | | | | | | | |
11/15/39 | | | | 340 | | | | | 311,960 | |
| | | | | | | | | | |
| | | | | | | | | 1,059,753 | |
| | | | | | | | | | |
New Jersey – 3.4% | | | | | | | | | | |
New Jersey Health Care Facilities Financing Authority, RB, St. Joseph’s Healthcare System, | | | | | | | | | | |
6.63%, 7/01/38 | | | | 185 | | | | | 177,885 | |
New Jersey State Housing & Mortgage Finance Agency, RB, S/F Housing, | | | | | | | | | | |
Series X, AMT, 5.38%, 4/01/30 | | | | 165 | | | | | 162,588 | |
| | | | | | | | | | |
| | | | | | | | | 340,473 | |
| | | | | | | | | | |
New York – 7.4% | | | | | | | | | | |
Chautauqua County Industrial Development Agency, RB, Dunkirk Power Project, (NRG Energy, Inc.), | | | | | | | | | | |
5.88%, 4/01/42 | | | | 200 | | | | | 184,938 | |
Long Island Power Authority, RB, | | | | | | | | | | |
Series A, 6.25%, 4/01/33 | | | | 250 | | | | | 273,500 | |
Metropolitan Transportation Authority, RB, | | | | | | | | | | |
Series 2008C, 6.50%, 11/15/28 | | | | 75 | | | | | 83,155 | |
New York Liberty Development Corp., Refunding, 2nd Priority, RB, Bank of America, 6.38%, | | | | | | | | | | |
7/15/49 | | | | 100 | | | | | 99,096 | |
Port Authority of New York & New Jersey, RB, JFK International Air Terminal, | | | | | | | | | | |
6.00%, 12/01/36 | | | | 100 | | | | | 96,001 | |
| | | | | | | | | | |
| | | | | | | | | 736,690 | |
| | | | | | | | | | |
Texas – 3.8% | | | | | | | | | | |
Bexar County Health Facilities Development Corp., RB, Army Retirement Residence Project, | | | | | | | | | | |
6.20%, 7/01/45 | | | | 140 | | | | | 132,597 | |
North Texas Tollway Authority, Refunding, RB, Toll 2nd Tier, | | | | | | | | | | |
Series F, 6.13%, 1/01/31 | | | | 90 | | | | | 90,818 | |
Texas State Public Finance Authority Education, RB, KIPP, Inc., | | | | | | | | | | |
Series A, (ACA), 5.00%, 2/15/28 | | | | 175 | | | | | 153,041 | |
| | | | | | | | | | |
| | | | | | | | | 376,456 | |
| | | | | | | | | | |
Guam – 1.6% | | | | | | | | | | |
Territory of Guam, GO, | | | | | | | | | | |
Series A, 7.00%, 11/15/39 | | | | 150 | | | | | 153,783 | |
| | | | | | | | | | |
Total Long-Term Investments
(Cost – $6,764,894) – 67.4% | | | | | | | | | 6,684,555 | |
| | | | | | | | | | |
| | |
Short-Term Securities | | Shares | | |
Dreyfus Tax Exempt Cash Management, | | | | | | | | | | |
0.07% (a) | | | | 2,643,740 | | | | | 2,643,740 | |
| | | | | | | | | | |
Total Short-Term Securities
(Cost – $2,643,740) – 26.6% | | | | | | | | | 2,643,740 | |
| | | | | | | | | | |
Total Investments
(Cost – $9,408,634*) – 94.0% | | | | | | | | | 9,328,295 | |
Other Assets Less Liabilities – 6.0% | | | | | | | | | 598,042 | |
| | | | | | | | | | |
Net Assets – 100.0% | | | | | | | | $ | 9,926,337 | |
| | | | | | | | | | |
See Notes to Financial Statements.
| | | | | | |
| 24 | | BLACKROCK BOND ALLOCATION TARGET SHARES | | MARCH 31, 2011 | | |
| | |
| Schedule of Investments (Liquidation Basis) (concluded) | | Series N Portfolio |
| | |
| * | The cost and unrealized appreciation (depreciation) of investments as of March 31, 2011, as computed for federal income tax purposes, were as follows: |
| | | | | |
Aggregate cost | | | $ | 9,405,897 | |
| | | | | |
Gross unrealized appreciation | | | $ | 137,009 | |
Gross unrealized depreciation | | | | (214,611 | ) |
| | | | | |
Net unrealized depreciation | | | $ | (77,602 | ) |
| | | | | |
| (a) | Represents the current yield as of report date. |
| | • | | Fair Value Measurements – Various inputs are used in determining the fair value of investments. These inputs are summarized in three broad levels for financial statement purposes as follows: |
| | • | | Level 1 – price quotations in active markets/exchanges for identical assets and liabilities |
| | • | | Level 2 – other observable inputs (including, but not limited to: quoted prices for similar assets or liabilities in markets that are active, quoted prices for identical or similar assets or liabilities in markets that are not active, inputs other than quoted prices that are observable for the assets or liabilities (such as interest rates, yield curves, volatilities, prepayment speeds, loss severities, credit risks and default rates) or other market–corroborated inputs) |
| | • | | Level 3 – unobservable inputs based on the best information available in the circumstances, to the extent observable inputs are not available (including the Fund’s own assumptions used in determining the fair value of investments) |
The inputs or methodologies used for valuing securities are not necessarily an indication of the risk associated with investing in those securities. For information about the Fund’s policy regarding valuation of investments and other significant accounting policies, please refer to Note 1 of the Notes to Financial Statements.
The following table summarizes the inputs used as of March 31, 2011 in determining the fair valuation of the Fund’s investments:
| | | | | | | | | | | | | | | | | | | | |
Valuation Inputs | | Level 1 | | Level 2 | | Level 3 | | Total |
Assets: | | | | | | | | | | | | | | | | | | | | |
Investments: | | | | | | | | | | | | | | | | | | | | |
Long-Term Investments1 | | | | – | | | | $ | 6,684,555 | | | | | – | | | | $ | 6,684,555 | |
Short-Term Securities | | | $ | 2,643,740 | | | | | – | | | | | – | | | | | 2,643,740 | |
| | | | | | | | | | | | | | | | | | | | |
Total | | | $ | 2,643,740 | | | | $ | 6,684,555 | | | | | – | | | | $ | 9,328,295 | |
| | | | | | | | | | | | | | | | | | | | |
| 1 | See above Schedule of Investments for values in each state or political subdivision. |
See Notes to Financial Statements.
| | | | | | |
| | | BLACKROCK BOND ALLOCATION TARGET SHARES | | MARCH 31, 2011 | | 25 |
| | |
| Schedule of Investments March 31, 2011 | | Series S Portfolio |
| | (Percentages shown are based on Net Assets) |
| | | | | | | | | | |
Asset-Backed Securities | | Par
(000) | | Value |
Ally Auto Receivables Trust, Series 2010-5, | | | | | | | | | | |
Class A2, 0.80%, 3/15/13 | | | $ | 1,390 | | | | $ | 1,391,536 | |
AmeriCredit Automobile Receivables Trust: | | | | | | | | | | |
Series 2008-2, Class A2, 4.24%, | | | | | | | | | | |
8/06/12 (a) | | | | 1 | | | | | 1,057 | |
Series 2009-1, Class A3, 3.04%, | | | | | | | | | | |
10/15/13 | | | | 990 | | | | | 1,003,820 | |
Series 2010-1, Class A3, 1.66%, | | | | | | | | | | |
3/17/14 | | | | 610 | | | | | 614,320 | |
Series 2010-4, Class A3, 1.27%, | | | | | | | | | | |
4/08/15 | | | | 860 | | | | | 858,679 | |
Series 2011-1, Class A3, 1.39%, | | | | | | | | | | |
9/08/15 | | | | 330 | | | | | 329,847 | |
Bank of America Auto Trust: | | | | | | | | | | |
Series 2009-1A, Class A3, 2.67%, | | | | | | | | | | |
7/15/13 (b) | | | | 449 | | | | | 452,568 | |
Series 2009-2A, Class A3, 2.13%, | | | | | | | | | | |
9/15/13 (b) | | | | 615 | | | | | 619,195 | |
Capital One Auto Finance Trust: | | | | | | | | | | |
Series 2006-C, Class A4, 0.29%, | | | | | | | | | | |
5/15/13 (a) | | | | 631 | | | | | 628,954 | |
Series 2007-B, Class A4, 0.29%, | | | | | | | | | | |
4/15/14 (a) | | | | 536 | | | | | 534,572 | |
Capital One Multi-Asset Execution Trust, | | | | | | | | | | |
Series 2004-A8, Class A8, 0.39%, 8/15/14 (a) | | | | 1,220 | | | | | 1,220,012 | |
CenterPoint Energy Transition Bond Co. LLC, | | | | | | | | | | |
Series 2005-A, Class A2, 4.97%, 8/01/14 | | | | 319 | | | | | 328,048 | |
Chrysler Financial Auto Securitization Trust, | | | | | | | | | | |
Series 2009-A, Class A3, 2.82%, 1/15/16 | | | | 300 | | | | | 304,470 | |
Citibank Omni Master Trust: | | | | | | | | | | |
Series 2009-A8, Class A8, 2.36%, | | | | | | | | | | |
5/16/16 (a)(b) | | | | 1,500 | | | | | 1,522,651 | |
Series 2009-A12, Class A12, 3.35%, | | | | | | | | | | |
8/15/16 (b) | | | | 530 | | | | | 543,942 | |
Series 2009-A17, Class A17, 4.90%, | | | | | | | | | | |
11/15/18 (b) | | | | 440 | | | | | 470,566 | |
CNH Equipment Trust, Series 2009-C, Class A3, | | | | | | | | | | |
1.85%, 12/16/13 | | | | 962 | | | | | 966,627 | |
Daimler Chrysler Auto Trust, Series 2007-A, | | | | | | | | | | |
Class A4, 5.28%, 3/08/13 | | | | 784 | | | | | 799,754 | |
Discover Card Master Trust, Series 2009-A1, | | | | | | | | | | |
Class A1, 1.56%, 12/15/14 (a) | | | | 1,325 | | | | | 1,342,855 | |
Ford Credit Auto Lease Trust, Series 2010-B, | | | | | | | | | | |
Class A4, 1.04%, 1/15/13 (b) | | | | 800 | | | | | 799,198 | |
Ford Credit Auto Owner Trust: | | | | | | | | | | |
Series 2007-B, Class A4A, 5.24%, | | | | | | | | | | |
7/15/12 | | | | 756 | | | | | 765,026 | |
Series 2009-A, Class A4, 6.07%, | | | | | | | | | | |
5/15/14 | | | | 560 | | | | | 599,026 | |
Series 2009-D, Class A3, 2.17%, | | | | | | | | | | |
10/15/13 | | | | 1,980 | | | | | 2,000,967 | |
Ford Credit Floorplan Master Owner Trust: | | | | | | | | | | |
Series 2006-4, Class A, 0.51%, | | | | | | | | | | |
6/15/11 (a) | | | | 1,310 | | | | | 1,308,199 | |
Series 2010-1, Class A, 1.91%, | | | | | | | | | | |
12/15/14 (a)(b) | | | | 1,690 | | | | | 1,722,152 | |
GSAA Trust, Series 2004-11, Class 2A2, 0.57%, | | | | | | | | | | |
12/25/34 (a) | | | | 11 | | | | | 9,600 | |
Mercedes-Benz Auto Receivables Trust, | | | | | | | | | | |
Series 2009-1, Class A3, 1.67%, 1/15/14 | | | | 1,110 | | | | | 1,119,435 | |
Morgan Stanley Resecuritization Trust: | | | | | | | | | | |
Series 2010-F, Class A, 0.50%, | | | | | | | | | | |
6/17/13 (a)(b) | | | | 545 | | | | | 544,400 | |
Series 2010-F, Class B, 0.50%, | | | | | | | | | | |
6/17/13 (a)(b) | | | | 650 | | | | | 646,466 | |
PG&E Energy Recovery Funding LLC: | | | | | | | | | | |
Series 2005-1, Class A4, 4.37%, | | | | | | | | | | |
6/25/12 | | | | 216 | | | | | 221,545 | |
Series 2005-2, Class A2, 5.03%, | | | | | | | | | | |
3/25/14 | | | | 350 | | | | | 359,220 | |
Santander Consumer Acquired Receivables Trust: | | | | | | | | | | |
Series 2011-S1A, Class B, 1.66%, | | | | | | | | | | |
8/15/16 (b) | | | | 700 | | | | | 699,934 | |
Series 2011-S1A, Class C, 2.01%, | | | | | | | | | | |
8/15/16 (b) | | | | 650 | | | | | 649,977 | |
Santander Drive Auto Receivables Trust: | | | | | | | | | | |
Series 2007-3, Class A4A, 5.52%, | | | | | | | | | | |
10/15/14 | | | | 582 | | | | | 583,755 | |
Series 2010-1, Class A3, 1.84%, | | | | | | | | | | |
11/17/14 | | | | 655 | | | | | 662,131 | |
Series 2010-2, Class C, 3.89%, | | | | | | | | | | |
7/17/17 | | | | 965 | | | | | 991,231 | |
Series 2010-A, Class A2, 1.37%, | | | | | | | | | | |
8/15/13 (b) | | | | 997 | | | | | 999,524 | |
Series 2010-B, Class A3, 1.31%, | | | | | | | | | | |
2/17/14 (b) | | | | 820 | | | | | 822,772 | |
Series 2011-S1A, Class D, 3.10%, | | | | | | | | | | |
3/15/13 (b) | | | | 765 | | | | | 764,833 | |
SLC Student Loan Trust, Series 2006-A, | | | | | | | | | | |
Class A4, 0.42%, 1/15/19 (a) | | | | 540 | | | | | 527,002 | |
SLM Student Loan Trust: | | | | | | | | | | |
Series 2003-B, Class A2, 0.71%, | | | | | | | | | | |
3/15/22 (a) | | | | 672 | | | | | 640,897 | |
Series 2004-B, Class A2, 0.51%, | | | | | | | | | | |
6/15/21 (a) | | | | 396 | | | | | 379,201 | |
Series 2004-1, Class A2, 0.44%, | | | | | | | | | | |
7/25/18 (a) | | | | 831 | | | | | 830,493 | |
Series 2004-10, Class A4A, 0.69%, | | | | | | | | | | |
7/27/20 (a)(b) | | | | 533 | | | | | 533,404 | |
Series 2007-7, Class A2, 0.50%, | | | | | | | | | | |
1/25/16 (a) | | | | 1,302 | | | | | 1,298,484 | |
Series 2008-5, Class A2, 1.40%, | | | | | | | | | | |
10/25/16 (a) | | | | 2,754 | | | | | 2,786,031 | |
Series 2009-B, Class A1, 6.26%, | | | | | | | | | | |
7/15/42 (a)(b) | | | | 347 | | | | | 335,673 | |
Series 2010-C, Class A1, 1.91%, | | | | | | | | | | |
12/15/17 (a)(b) | | | | 613 | | | | | 617,213 | |
| | | | | | | | | | |
Total Asset-Backed Securities – 21.4% | | | | | | | | | 38,151,262 | |
| | | | | | | | | | |
Corporate Bonds | | | | | | | | | | |
Aerospace & Defense – 0.7% | | | | | | | | | | |
BAE Systems Holdings, Inc., 6.40%, | | | | | | | | | | |
12/15/11 (b) | | | | 875 | | | | | 909,759 | |
ITT Corp., 4.90%, 5/01/14 | | | | 375 | | | | | 401,129 | |
| | | | | | | | | | |
| | | | | | | | | 1,310,888 | |
| | | | | | | | | | |
See Notes to Financial Statements.
| | | | | | |
| 26 | | BLACKROCK BOND ALLOCATION TARGET SHARES | | MARCH 31, 2011 | | |
| | |
| Schedule of Investments (continued) | | Series S Portfolio |
| | (Percentages shown are based on Net Assets) |
| | | | | | | | | | |
Corporate Bonds | | Par
(000) | | Value |
Airlines – 1.0% | | | | | | | | | | |
American Airlines Pass-Through Trust, 5.25%, | | | | | | | | | | |
7/31/21 | | | $ | 420 | | | | $ | 407,400 | |
UAL Pass-Through Trust: | | | | | | | | | | |
10.40%, 11/01/16 | | | | 612 | | | | | 700,638 | |
9.75%, 1/15/17 | | | | 563 | | | | | 641,751 | |
| | | | | | | | | | |
| | | | | | | | | 1,749,789 | |
| | | | | | | | | | |
Beverages – 1.9% | | | | | | | | | | |
Anheuser-Busch Cos, Inc., 5.00%, 1/15/15 | | | | 365 | | | | | 397,101 | |
Anheuser-Busch InBev Worldwide, Inc.: | | | | | | | | | | |
3.00%, 10/15/12 | | | | 1,025 | | | | | 1,054,362 | |
2.50%, 3/26/13 | | | | 1,050 | | | | | 1,071,318 | |
Dr Pepper Snapple Group, Inc., 2.35%, | | | | | | | | | | |
12/21/12 | | | | 870 | | | | | 886,993 | |
| | | | | | | | | | |
| | | | | | | | | 3,409,774 | |
| | | | | | | | | | |
Capital Markets – 3.7% | | | | | | | | | | |
The Bank of New York Mellon Corp., 4.30%, | | | | | | | | | | |
5/15/14 | | | | 750 | | | | | 804,244 | |
Credit Suisse New York: | | | | | | | | | | |
3.45%, 7/02/12 (c) | | | | 1,300 | | | | | 1,339,456 | |
5.50%, 5/01/14 | | | | 560 | | | | | 613,820 | |
The Goldman Sachs Group, Inc.: | | | | | | | | | | |
6.00%, 5/01/14 (c) | | | | 274 | | | | | 300,877 | |
5.00%, 10/01/14 | | | | 286 | | | | | 304,850 | |
3.70%, 8/01/15 | | | | 690 | | | | | 695,091 | |
3.63%, 2/07/16 | | | | 520 | | | | | 515,086 | |
Morgan Stanley: | | | | | | | | | | |
6.60%, 4/01/12 | | | | 455 | | | | | 481,090 | |
6.00%, 5/13/14 | | | | 575 | | | | | 625,514 | |
4.00%, 7/24/15 | | | | 950 | | | | | 965,466 | |
| | | | | | | | | | |
| | | | | | | | | 6,645,494 | |
| | | | | | | | | | |
Chemicals – 0.6% | | | | | | | | | | |
Airgas, Inc., 2.85%, 10/01/13 | | | | 1,058 | | | | | 1,073,201 | |
| | | | | | | | | | |
Commercial Banks – 2.6% | | | | | | | | | | |
ANZ National International Ltd., 2.38%, | | | | | | | | | | |
12/21/12 (b) | | | | 675 | | | | | 683,754 | |
Rabobank Nederland NV, 2.65%, | | | | | | | | | | |
8/17/12 (b)(c) | | | | 1,650 | | | | | 1,686,965 | |
Regions Financial Corp., 4.88%, 4/26/13 | | | | 760 | | | | | 771,569 | |
Standard Chartered Plc, 5.50%, 11/18/14 (b) | | | | 150 | | | | | 161,888 | |
U.S. Bancorp, 4.20%, 5/15/14 | | | | 800 | | | | | 851,645 | |
Wells Fargo & Co., 3.68%, 6/15/16 (a) | | | | 500 | | | | | 502,955 | |
| | | | | | | | | | |
| | | | | | | | | 4,658,776 | |
| | | | | | | | | | |
Consumer Finance – 1.9% | | | | | | | | | | |
American Express Bank FSB, 5.50%, 4/16/13 | | | | 275 | | | | | 294,948 | |
American Express Credit Corp.: | | | | | | | | | | |
7.30%, 8/20/13 | | | | 425 | | | | | 475,220 | |
2.75%, 9/15/15 | | | | 885 | | | | | 869,010 | |
Capital One Financial Corp.: | | | | | | | | | | |
4.80%, 2/21/12 | | | | 595 | | | | | 615,269 | |
6.25%, 11/15/13 | | | | 1,000 | | | | | 1,100,407 | |
| | | | | | | | | | |
| | | | | | | | | 3,354,854 | |
| | | | | | | | | | |
Containers & Packaging – 0.7% | | | | | | | | | | |
Rock-Tenn Co., 9.25%, 3/15/16 | | | | 98 | | | | | 107,800 | |
Sealed Air Corp., 5.63%, 7/15/13 (b) | | | | 750 | | | | | 786,125 | |
Temple-Inland, Inc.: | | | | | | | | | | |
7.88%, 5/01/12 | | | | 200 | | | | | 213,338 | |
6.63%, 1/15/16 | | | | 170 | | | | | 184,951 | |
| | | | | | | | | | |
| | | | | | | | | 1,292,214 | |
| | | | | | | | | | |
Diversified Financial Services – 4.1% | | | | | | | | | | |
Bank of America Corp.: | | | | | | | | | | |
5.38%, 6/15/14 | | | | 260 | | | | | 278,225 | |
4.50%, 4/01/15 | | | | 933 | | | | | 968,836 | |
The Bear Stearns Cos. LLC, 6.95%, 8/10/12 (c) | | | | 1,000 | | | | | 1,076,604 | |
BP Capital Markets Plc: | | | | | | | | | | |
3.13%, 3/10/12 | | | | 200 | | | | | 204,396 | |
5.25%, 11/07/13 | | | | 955 | | | | | 1,032,797 | |
General Electric Capital Corp., 2.80%, | | | | | | | | | | |
1/08/13 (c) | | | | 1,900 | | | | | 1,944,072 | |
JPMorgan Chase & Co.: | | | | | | | | | | |
4.65%, 6/01/14 | | | | 660 | | | | | 705,441 | |
5.15%, 10/01/15 | | | | 600 | | | | | 642,724 | |
Novus USA Trust, Series 2010-1, 1.56%, | | | | | | | | | | |
11/18/11 (a)(b) | | | | 500 | | | | | 497,697 | |
| | | | | | | | | | |
| | | | | | | | | 7,350,792 | |
| | | | | | | | | | |
Diversified Telecommunication Services – 2.5% | | | | | | | | | | |
AT&T Inc., 4.95%, 1/15/13 | | | | 300 | | | | | 319,532 | |
Qwest Corp., 8.88%, 3/15/12 | | | | 1,055 | | | | | 1,128,850 | |
Telefonica Emisiones SAU, 5.98%, 6/20/11 | | | | 400 | | | | | 404,358 | |
TELUS Corp., 8.00%, 6/01/11 | | | | 185 | | | | | 187,208 | |
Verizon Communications, Inc., 5.25%, 4/15/13 | | | | 1,045 | | | | | 1,126,137 | |
Verizon New Jersey, Inc., 5.88%, 1/17/12 (c) | | | | 1,225 | | | | | 1,273,146 | |
| | | | | | | | | | |
| | | | | | | | | 4,439,231 | |
| | | | | | | | | | |
Electric Utilities – 1.6% | | | | | | | | | | |
Duke Energy Indiana, Inc., 5.00%, 9/15/13 | | | | 715 | | | | | 770,272 | |
Florida Power Corp., 6.65%, 7/15/11 | | | | 430 | | | | | 437,224 | |
MidAmerican Energy Holdings Co., 3.15%, | | | | | | | | | | |
7/15/12 | | | | 800 | | | | | 820,177 | |
NextEra Energy Capital Holdings, Inc., 5.63%, | | | | | | | | | | |
9/01/11 | | | | 800 | | | | | 816,031 | |
| | | | | | | | | | |
| | | | | | | | | 2,843,704 | |
| | | | | | | | | | |
Electronic Equipment, Instruments & Components – 0.4% | | | | | | | | | | |
Jabil Circuit, Inc., 7.75%, 7/15/16 | | | | 600 | | | | | 681,000 | |
| | | | | | | | | | |
Food & Staples Retailing – 0.8% | | | | | | | | | | |
CVS Caremark Corp., 5.75%, 8/15/11 | | | | 1,400 | | | | | 1,426,162 | |
| | | | | | | | | | |
Food Products – 1.6% | | | | | | | | | | |
Kraft Foods, Inc.: | | | | | | | | | | |
6.25%, 6/01/12 | | | | 421 | | | | | 446,574 | |
6.00%, 2/11/13 | | | | 1,505 | | | | | 1,628,374 | |
WM Wrigley Jr. Co., 2.45%, 6/28/12 (b) | | | | 800 | | | | | 802,717 | |
| | | | | | | | | | |
| | | | | | | | | 2,877,665 | |
| | | | | | | | | | |
Health Care Equipment & Supplies – 1.1% | | | | | | | | | | |
CareFusion Corp., 4.13%, 8/01/12 | | | | 1,500 | | | | | 1,549,459 | |
Covidien International Finance SA, 5.45%, | | | | | | | | | | |
10/15/12 | | | | 330 | | | | | 351,662 | |
| | | | | | | | | | |
| | | | | | | | | 1,901,121 | |
| | | | | | | | | | |
Hotels, Restaurants & Leisure – 0.5% | | | | | | | | | | |
Wyndham Worldwide Corp., 9.88%, 5/01/14 | | | | 746 | | | | | 877,407 | |
| | | | | | | | | | |
See Notes to Financial Statements.
| | | | | | |
| | | BLACKROCK BOND ALLOCATION TARGET SHARES | | MARCH 31, 2011 | | 27 |
| | |
| Schedule of Investments (continued) | | Series S Portfolio |
| | (Percentages shown are based on Net Assets) |
| | | | | | | | | | |
Corporate Bonds | | Par
(000) | | Value |
Household Durables – 0.7% | | | | | | | | | | |
MDC Holdings, Inc., 5.38%, 7/01/15 | | | $ | 420 | | | | $ | 431,398 | |
Newell Rubbermaid, Inc., 5.50%, 4/15/13 | | | | 735 | | | | | 788,634 | |
| | | | | | | | | | |
| | | | | | | | | 1,220,032 | |
| | | | | | | | | | |
Household Products – 0.3% | | | | | | | | | | |
Owens Corning, 6.50%, 12/01/16 | | | | 530 | | | | | 577,065 | |
| | | | | | | | | | |
Insurance – 3.7% | | | | | | | | | | |
The Allstate Corp., 6.20%, 5/16/14 | | | | 650 | | | | | 728,583 | |
Allstate Financial Global Funding, 6.50%, | | | | | | | | | | |
6/14/11 (b) | | | | 740 | | | | | 748,350 | |
American International Group, Inc., 3.65%, | | | | | | | | | | |
1/15/14 | | | | 1,000 | | | | | 1,017,140 | |
Lincoln National Corp., 4.30%, 6/15/15 | | | | 810 | | | | | 840,394 | |
MetLife, Inc., 6.75%, 6/01/16 | | | | 680 | | | | | 786,042 | |
Metropolitan Life Global Funding I, 5.13%, | | | | | | | | | | |
4/10/13 (b)(c) | | | | 1,400 | | | | | 1,494,020 | |
Prudential Financial, Inc.: | | | | | | | | | | |
3.63%, 9/17/12 | | | | 430 | | | | | 442,853 | |
2.75%, 1/14/13 | | | | 450 | | | | | 458,805 | |
| | | | | | | | | | |
| | | | | | | | | 6,516,187 | |
| | | | | | | | | | |
Life Sciences Tools & Services – 1.3% | | | | | | | | | | |
Agilent Technologies, Inc.: | | | | | | | | | | |
4.45%, 9/14/12 | | | | 885 | | | | | 917,658 | |
5.50%, 9/14/15 | | | | 135 | | | | | 146,825 | |
Life Technologies Corp.: | | | | | | | | | | |
3.38%, 3/01/13 | | | | 850 | | | | | 873,080 | |
4.40%, 3/01/15 | | | | 400 | | | | | 417,406 | |
| | | | | | | | | | |
| | | | | | | | | 2,354,969 | |
| | | | | | | | | | |
Machinery – 0.3% | | | | | | | | | | |
Ingersoll-Rand Global Holding Co. Ltd., 9.50%, | | | | | | | | | | |
4/15/14 | | | | 380 | | | | | 456,070 | |
| | | | | | | | | | |
Media – 5.0% | | | | | | | | | | |
Comcast Cable Communications Holdings, Inc., | | | | | | | | | | |
8.38%, 3/15/13 | | | | 1,039 | | | | | 1,170,973 | |
COX Communications, Inc.: | | | | | | | | | | |
7.13%, 10/01/12 | | | | 900 | | | | | 977,010 | |
5.45%, 12/15/14 | | | | 510 | | | | | 562,878 | |
DIRECTV Holdings LLC/DIRECTV Financing Co., Inc.: | | | | | | | | | | |
3.13%, 2/15/16 | | | | 960 | | | | | 946,078 | |
7.63%, 5/15/16 | | | | 650 | | | | | 716,625 | |
The Interpublic Group of Cos., Inc., 6.25%, | | | | | | | | | | |
11/15/14 | | | | 890 | | | | | 972,325 | |
NBCUniversal Media LLC, 2.10%, 4/01/14 (b) | | | | 900 | | | | | 895,819 | |
Time Warner Cable, Inc.: | | | | | | | | | | |
5.40%, 7/02/12 | | | | 1,000 | | | | | 1,051,526 | |
6.20%, 7/01/13 | | | | 728 | | | | | 800,407 | |
Virgin Media Secured Finance Plc, 6.50%, | | | | | | | | | | |
1/15/18 | | | | 650 | | | | | 710,125 | |
| | | | | | | | | | |
| | | | | | | | | 8,803,766 | |
| | | | | | | | | | |
Metals & Mining – 2.0% | | | | | | | | | | |
Anglo American Capital Plc, 2.15%, | | | | | | | | | | |
9/27/13 (b) | | | | 690 | | | | | 695,240 | |
Freeport-McMoRan Copper & Gold, Inc., 8.38%, | | | | | | | | | | |
4/01/17 | | | | 1,000 | | | | | 1,102,500 | |
Rio Tinto Finance USA Ltd.: | | | | | | | | | | |
8.95%, 5/01/14 | | | | 800 | | | | | 962,434 | |
1.88%, 11/02/15 | | | | 450 | | | | | 433,159 | |
Teck Resources Ltd., 10.75%, 5/15/19 | | | | 250 | | | | | 319,250 | |
| | | | | | | | | | |
| | | | | | | | | 3,512,583 | |
| | | | | | | | | | |
Multi-Utilities – 0.2% | | | | | | | | | | |
CenterPoint Energy, Inc., Series B, 6.85%, | | | | | | | | | | |
6/01/15 | | | | 375 | | | | | 421,920 | |
| | | | | | | | | | |
Oil, Gas & Consumable Fuels – 1.6% | | | | | | | | | | |
Canadian Natural Resources Ltd., 4.90%, | | | | | | | | | | |
12/01/14 | | | | 700 | | | | | 759,571 | |
Enterprise Products Operating LLC: | | | | | | | | | | |
4.60%, 8/01/12 | | | | 350 | | | | | 364,223 | |
6.13%, 2/01/13 | | | | 150 | | | | | 160,747 | |
6.38%, 2/01/13 | | | | 225 | | | | | 243,259 | |
9.75%, 1/31/14 | | | | 195 | | | | | 233,660 | |
Rockies Express Pipeline LLC, 6.25%, | | | | | | | | | | |
7/15/13 (b) | | | | 535 | | | | | 571,432 | |
Southeast Supply Header LLC, 4.85%, | | | | | | | | | | |
8/15/14 (b) | | | | 410 | | | | | 428,412 | |
| | | | | | | | | | |
| | | | | | | | | 2,761,304 | |
| | | | | | | | | | |
Paper & Forest Products – 1.5% | | | | | | | | | | |
Celulosa Arauco y Constitucion SA, 5.13%, | | | | | | | | | | |
7/09/13 | | | | 1,300 | | | | | 1,365,867 | |
Domtar Corp., 7.13%, 8/15/15 | | | | 470 | | | | | 514,650 | |
Georgia-Pacific LLC, 8.25%, 5/01/16 (b) | | | | 730 | | | | | 823,075 | |
| | | | | | | | | | |
| | | | | | | | | 2,703,592 | |
| | | | | | | | | | |
Real Estate Investment Trusts (REITs) – 0.1% | | | | | | | | | | |
AvalonBay Communities, Inc., 6.13%, | | | | | | | | | | |
11/01/12 | | | | 132 | | | | | 142,092 | |
| | | | | | | | | | |
Road & Rail – 2.0% | | | | | | | | | | |
Asciano Finance Ltd., 3.13%, 9/23/15 (b) | | | | 775 | | | | | 746,552 | |
Burlington Northern Santa Fe Corp.: | | | | | | | | | | |
5.90%, 7/01/12 | | | | 375 | | | | | 398,125 | |
4.30%, 7/01/13 | | | | 205 | | | | | 217,301 | |
CSX Corp., 5.50%, 8/01/13 | | | | 1,311 | | | | | 1,420,014 | |
Union Pacific Corp., 6.13%, 1/15/12 | | | | 700 | | | | | 728,405 | |
| | | | | | | | | | |
| | | | | | | | | 3,510,397 | |
| | | | | | | | | | |
Semiconductors & Semiconductor Equipment – 1.4% | | | | | | | | | | |
Analog Devices, Inc., 5.00%, 7/01/14 | | | | 475 | | | | | 516,247 | |
Broadcom Corp., 1.50%, 11/01/13 (b) | | | | 715 | | | | | 708,668 | |
Maxim Integrated Products, Inc., 3.45%, | | | | | | | | | | |
6/14/13 | | | | 605 | | | | | 626,047 | |
National Semiconductor Corp., 6.15%, | | | | | | | | | | |
6/15/12 | | | | 690 | | | | | 724,884 | |
| | | | | | | | | | |
| | | | | | | | | 2,575,846 | |
| | | | | | | | | | |
Specialty Retail – 0.6% | | | | | | | | | | |
Best Buy Co., Inc., 3.75%, 3/15/16 | | | | 360 | | | | | 355,354 | |
Macy’s Retail Holdings, Inc., 5.75%, 7/15/14 | | | | 743 | | | | | 795,010 | |
| | | | | | | | | | |
| | | | | | | | | 1,150,364 | |
| | | | | | | | | | |
Wireless Telecommunication Services – 2.8% | | | | | | | | | | |
America Movil SAB de CV, 5.50%, 3/01/14 | | | | 670 | | | | | 730,878 | |
See Notes to Financial Statements.
| | | | | | |
| 28 | | BLACKROCK BOND ALLOCATION TARGET SHARES | | MARCH 31, 2011 | | |
| | |
| Schedule of Investments (continued) | | Series S Portfolio |
| | (Percentages shown are based on Net Assets) |
| | | | | | | | | | |
Corporate Bonds | | Par
(000) | | Value |
Wireless Telecommunication Services (concluded) | | | | | | | | | | |
Cellco Partnership/Verizon Wireless Capital LLC: | | | | | | | | | | |
3.75%, 5/20/11 (c) | | | $ | 2,450 | | | | $ | 2,460,344 | |
5.25%, 2/01/12 | | | | 300 | | | | | 310,968 | |
Crown Castle Towers LLC, 4.52%, 1/15/15 (b) | | | | 670 | | | | | 693,955 | |
SBA Tower Trust, 4.25%, 4/15/15 (b) | | | | 255 | | | | | 265,715 | |
Vodafone Group Plc, 5.00%, 12/16/13 | | | | 500 | | | | | 542,547 | |
| | | | | | | | | | |
| | | | | | | | | 5,004,407 | |
| | | | | | | | | | |
Total Corporate Bonds – 49.2% | | | | | | | | | 87,602,666 | |
| | | | | | | | | | |
Foreign Agency Obligations | | | | | | | | | | |
Australia & New Zealand Banking Group Ltd., | | | | | | | | | | |
0.59%, 6/18/12 (a)(b) | | | | 800 | | | | | 800,938 | |
CDP Financial, Inc., 3.00%, 11/25/14 (b) | | | | 315 | | | | | 321,090 | |
Commonwealth Bank of Australia, 3.49%, | | | | | | | | | | |
8/13/14 (b) | | | | 885 | | | | | 914,998 | |
Danske Bank A/S, 2.50%, 5/10/12 (b)(c) | | | | 1,570 | | | | | 1,597,787 | |
Dexia Credit Local SA, 2.38%, 9/23/11 (b) | | | | 715 | | | | | 720,102 | |
Eksportfinans ASA: | | | | | | | | | | |
5.00%, 2/14/12 | | | | 300 | | | | | 311,602 | |
3.00%, 11/17/14 | | | | 460 | | | | | 473,351 | |
FIH Erhvervsbank A/S: | | | | | | | | | | |
2.45%, 8/17/12 (b) | | | | 195 | | | | | 198,546 | |
1.75%, 12/06/12 (b) | | | | 755 | | | | | 764,788 | |
Landwirtschaftliche Rentenbank, 4.13%, | | | | | | | | | | |
7/15/13 | | | | 500 | | | | | 533,399 | |
Macquarie Bank Ltd., 4.10%, 12/17/13 (b)(c) | | | | 1,300 | | | | | 1,386,769 | |
Petrobras International Finance Co.: | | | | | | | | | | |
7.75%, 9/15/14 | | | | 450 | | | | | 520,545 | |
3.88%, 1/27/16 | | | | 84 | | | | | 84,562 | |
| | | | | | | | | | |
Total Foreign Agency Obligations – 4.8% | | | | | | | | | 8,628,477 | |
| | | | | | | | | | |
Foreign Government Obligations | | | | | | | | | | |
Canada – 0.3% | | | | | | | | | | |
Province of Ontario Canada, 0.76%, | | | | | | | | | | |
5/22/12 (a) | | | | 560 | | | | | 562,591 | |
| | | | | | | | | | |
Non-Agency Mortgage-Backed Securities | | | | | | | | | | |
Collateralized Mortgage Obligations – 6.8% | | | | | | | | | | |
Arkle Master Issuer Plc: | | | | | | | | | | |
Series 2006-1A, Class 4A1, 0.40%, | | | | | | | | | | |
2/17/52 (a)(b) | | | | 638 | | | | | 636,746 | |
Series 2010-1A, Class 2A, 1.46%, | | | | | | | | | | |
2/17/15 (a)(b) | | | | 850 | | | | | 848,196 | |
Arran Residential Mortgages Funding Plc: | | | | | | | | | | |
Series 2006-2A, Class A2B, 0.36%, | | | | | | | | | | |
9/20/56 (a)(b) | | | | 473 | | | | | 470,766 | |
Series 2006-2X, Class A2B 0.35%, | | | | | | | | | | |
9/20/56 (a)(b) | | | | 715 | | | | | 712,082 | |
Series 2007-3A, Class A2B, 0.37%, | | | | | | | | | | |
9/16/56 (a)(b) | | | | 745 | | | | | 734,476 | |
Series 2010-1A, Class A1C, 1.51%, | | | | | | | | | | |
5/16/47 (a)(b) | | | | 928 | | | | | 928,197 | |
Banc of America Funding Corp., Series 2004-C, | | | | | | | | | | |
Class 4A1, 0.58%, 12/20/34 (a) | | | | 18 | | | | | 15,671 | |
Banc of America Mortgage Securities, | | | | | | | | | | |
Series 2004-A, Class 2A2, 2.86%, 2/25/34 (a) | | | | 199 | | | | | 178,882 | |
Bear Stearns Adjustable Rate Mortgage Trust, | | | | | | | | | | |
Series 2004-7, Class 4A, 3.04%, 10/25/34 (a) | | | | 228 | | | | | 207,364 | |
Bear Stearns Alt-A Trust, Series 2004-13, | | | | | | | | | | |
Class A1, 0.99%, 11/25/34 (a) | | | | 11 | | | | | 10,371 | |
Countrywide Home Loan Mortgage Pass-Through Trust, | | | | | | | | | | |
Series 2004-HYB1, Class 2A, 2.89%, 5/20/34 (a) | | | | 303 | | | | | 268,645 | |
First Horizon Asset Securities, Inc.: | | | | | | | | | | |
Series 2003-AR4, Class 2A1, 2.71%, | | | | | | | | | | |
12/25/33 (a) | | | | 89 | | | | | 87,662 | |
Series 2004-AR6, Class 2A1, 2.77%, | | | | | | | | | | |
12/25/34 (a) | | | | 237 | | | | | 226,446 | |
Fosse Master Issuer Plc, Series 2007-1A, | | | | | | | | | | |
Class A2, 0.37%, 10/18/54 (a)(b) | | | | 88 | | | | | 88,178 | |
Gracechurch Mortgage Financing Plc, | | | | | | | | | | |
Series 2007-1A, Class 3A1, 0.39%, 11/20/56 (a)(b) | | | | 848 | | | | | 837,160 | |
Holmes Master Issuer Plc: | | | | | | | | | | |
Series 2007-2A, Class 3A1, 0.38%, | | | | | | | | | | |
7/15/21 (a) | | | | 1,095 | | | | | 1,091,780 | |
Series 2007-2X, Class 3A1, 0.38%, | | | | | | | | | | |
7/15/21 (a) | | | | 400 | | | | | 398,824 | |
Structured Adjustable Rate Mortgage Loan Trust, | | | | | | | | | | |
Series 2004-6, Class 4A1, 4.84%, 6/25/34 (a) | | | | 293 | | | | | 267,961 | |
Thornburg Mortgage Securities Trust: | | | | | | | | | | |
Series 2006-5, Class A1, 0.37%, | | | | | | | | | | |
8/25/11 (a) | | | | 1,329 | | | | | 1,316,738 | |
Series 2006-6, Class A1, 0.36%, | | | | | | | | | | |
11/25/11 (a) | | | | 1,250 | | | | | 1,233,555 | |
Series 2007-1, Class A2B, 0.35%, | | | | | | | | | | |
3/25/37 (a) | | | | 578 | | | | | 560,436 | |
Series 2007-2, Class A2A, 0.38%, | | | | | | | | | | |
6/25/37 (a) | | | | 678 | | | | | 661,731 | |
Wells Fargo Mortgage Backed Securities Trust, | | | | | | | | | | |
Series 2005-AR2, Class 2A1, 2.74%, 3/25/35 (a) | | | | 340 | | | | | 305,620 | |
| | | | | | | | | | |
| | | | | | | | | 12,087,487 | |
| | | | | | | | | | |
Commercial Mortgage-Backed Securities – 13.3% | | | | | | | | | | |
Banc of America Commercial Mortgage, Inc.: | | | | | | | | | | |
Series 2002-PB2, Class A4, 6.19%, | | | | | | | | | | |
1/11/12 | | | | 372 | | | | | 381,304 | |
Series 2005-3, Class A2, 4.50%, | | | | | | | | | | |
7/10/43 | | | | 527 | | | | | 527,480 | |
Series 2007-3, Class A2, 5.66%, | | | | | | | | | | |
7/10/12 (a) | | | | 502 | | | | | 521,923 | |
Series 2007-5, Class A3, 5.62%, | | | | | | | | | | |
2/10/51 | | | | 1,120 | | | | | 1,181,759 | |
Bear Stearns Commercial Mortgage Securities: | | | | | | | | | | |
Series 2001-TOP2, Class A2, 6.48%, | | | | | | | | | | |
2/15/35 | | | | 320 | | | | | 320,009 | |
Series 2004-T16, Class A4, 4.32%, | | | | | | | | | | |
2/13/46 | | | | 901 | | | | | 906,576 | |
Series 2007-PR16, Class A2, 5.67%, | | | | | | | | | | |
6/11/12 (a) | | | | 1,075 | | | | | 1,099,421 | |
See Notes to Financial Statements
| | | | | | |
| | | BLACKROCK BOND ALLOCATION TARGET SHARES | | MARCH 31, 2011 | | 29 |
| | |
| Schedule of Investments (continued) | | Series S Portfolio |
| | (Percentages shown are based on Net Assets) |
| | | | | | | | | | |
Non-Agency Mortgage-Backed Securities | | Par
(000) | | Value |
Commercial Mortgage-Backed Securities (continued) | | | | | | | | | | |
Citigroup/Deutsche Bank Commercial Mortgage Trust, | | | | | | | | | | |
Series 2007-CD4, Class A2B, 5.21%, 3/11/12 | | | $ | 375 | | | | $ | 383,322 | |
Commercial Mortgage Asset Trust, | | | | | | | | | | |
Series 1999-C1, Class A3, 6.64%, 1/17/32 | | | | 11 | | | | | 11,018 | |
Commercial Mortgage Pass-Through Certificates, | | | | | | | | | | |
Series 2001-J2A, Class A2, 6.10%, 7/16/11 (b) | | | | 1,037 | | | | | 1,035,695 | |
Credit Suisse First Boston Mortgage Securities Corp.: | | | | | | | | | | |
Series 2002-CKS4, Class A2, 5.18%, | | | | | | | | | | |
11/15/36 | | | | 879 | | | | | 910,925 | |
Series 2002-CP3, Class A3, 5.60%, | | | | | | | | | | |
7/15/35 | | | | 250 | | | | | 259,600 | |
First Union National Bank Commercial Mortgage: | | | | | | | | | | |
Series 2001-C3, Class A3, 6.42%, | | | | | | | | | | |
6/15/11 | | | | 126 | | | | | 125,879 | |
Series 2002-C1, Class A2, 6.14%, | | | | | | | | | | |
1/12/12 | | | | 596 | | | | | 612,358 | |
GE Capital Commercial Mortgage Corp.: | | | | | | | | | | |
Series 2001-1, Class A2, 6.53%, | | | | | | | | | | |
5/15/33 | | | | 62 | | | | | 61,735 | |
Series 2001-3, Class A2, 6.07%, | | | | | | | | | | |
11/10/11 | | | | 1,459 | | | | | 1,483,714 | |
Series 2005-C1, Class A2, 4.35%, | | | | | | | | | | |
6/10/48 | | | | 467 | | | | | 468,180 | |
Series 2007-C1, Class A2, 5.42%, | | | | | | | | | | |
12/10/49 | | | | 1,209 | | | | | 1,227,874 | |
GMAC Commercial Mortgage Securities, Inc., | | | | | | | | | | |
Series 2003-C3, Class A3, 4.65%, 4/10/40 | | | | 55 | | | | | 56,526 | |
Greenwich Capital Commercial Funding Corp., | | | | | | | | | | |
Series 2002-C1, Class A2, 4.11%, 3/11/12 | | | | 76 | | | | | 77,001 | |
GS Mortgage Securities Corp. II, | | | | | | | | | | |
Series 2001-GL3A, Class A2, 6.45%, 8/05/18 (a)(b) | | | | 922 | | | | | 941,757 | |
JPMorgan Chase Commercial Mortgage Securities Corp.: | | | | | | | | | | |
Series 2001-CIB2, Class A3, 6.43%, | | | | | | | | | | |
6/15/11 | | | | 442 | | | | | 443,675 | |
Series 2001-CIB3, Class A3, 6.47%, | | | | | | | | | | |
12/15/11 | | | | 468 | | | | | 473,721 | |
Series 2002-C2, Class A2, 5.05%, | | | | | | | | | | |
12/12/34 | | | | 880 | | | | | 917,536 | |
LB-UBS Commercial Mortgage Trust: | | | | | | | | | | |
Series 2003-C7, Class A2, 4.06%, | | | | | | | | | | |
8/15/10 (a) | | | | 133 | | | | | 132,897 | |
Series 2003-C7, Class A3, 4.56%, | | | | | | | | | | |
7/15/12 (a) | | | | 295 | | | | | 299,840 | |
Series 2004-C8, Class A5, 4.72%, | | | | | | | | | | |
12/15/29 | | | | 1,675 | | | | | 1,697,466 | |
Series 2005-C2, Class A2, 4.82%, | | | | | | | | | | |
4/15/30 | | | | 44 | | | | | 43,911 | |
Series 2007-C2, Class A2, 5.30%, | | | | | | | | | | |
2/15/40 | | | | 761 | | | | | 776,923 | |
Morgan Stanley Capital I, Series 2003-IQ6, | | | | | | | | | | |
Class A4, 4.97%, 12/15/41 | | | | 2,500 | | | | | 2,653,606 | |
Morgan Stanley Dean Witter Capital I, | | | | | | | | | | |
Series 2001-TOP3, Class A4, 6.39%, 7/15/33 | | | | 221 | | | | | 221,529 | |
Salomon Brothers Mortgage Securities VII, Inc., | | | | | | | | | | |
Series 2002-KEY2, Class A2, 4.47%, 3/18/36 | | | | 60 | | | | | 61,364 | |
Wachovia Bank Commercial Mortgage Trust: | | | | | | | | | | |
Series 2002-C1, Class A4, 6.29%, | | | | | | | | | | |
4/15/34 | | | | 2,060 | | | | | 2,123,490 | |
Series 2005-C17, Class A2, 4.78%, | | | | | | | | | | |
3/15/42 | | | | 247 | | | | | 246,634 | |
Series 2006-C28, Class A2, 5.50%, | | | | | | | | | | |
10/15/48 | | | | 422 | | | | | 426,657 | |
Series 2007-C33, Class A4, 5.90%, | | | | | | | | | | |
7/15/17 (a) | | | | 570 | | | | | 610,369 | |
| | | | | | | | | | |
| | | | | | | | | 23,723,674 | |
| | | | | | | | | | |
Total Non-Agency Mortgage-Backed Securities – 20.1% | | | | | | | | | 35,811,161 | |
| | | | | | | | | | |
Taxable Municipal Bonds | | | | | | | | | | |
State of California GO: | | | | | | | | | | |
5.10%, 8/01/14 | | | | 170 | | | | | 174,165 | |
3.95%, 11/01/15 | | | | 175 | | | | | 174,821 | |
State of California Various Purposes GO, 5.65%, | | | | | | | | | | |
4/01/39 | | | | 740 | | | | | 776,031 | |
State of Illinois GO, 2.77%, 1/01/12 | | | | 1,100 | | | | | 1,105,566 | |
| | | | | | | | | | |
Total Taxable Municipal Bonds – 1.3% | | | | | | | | | 2,230,583 | |
| | | | | | | | | | |
U.S. Government Sponsored Agency Securities | | | | | | | | | | |
Collateralized Mortgage Obligations – 1.4% | | | | | | | | | | |
Fannie Mae: | | | | | | | | | | |
Series 2006-54, Class OA, 6.00%, | | | | | | | | | | |
3/25/27 | | | | 26 | | | | | 25,730 | |
Series 2006-99, Class PA, 5.50%, | | | | | | | | | | |
5/25/30 | | | | 514 | | | | | 524,135 | |
Freddie Mac, Series 3280, Class MA, 5.50%, | | | | | | | | | | |
5/15/26 | | | | 402 | | | | | 403,520 | |
Ginnie Mae: | | | | | | | | | | |
Series 2006-3, Class B, 5.09%, | | | | | | | | | | |
1/16/37 (a) | | | | 550 | | | | | 583,198 | |
Series 2006-68, Class B, 5.16%, | | | | | | | | | | |
6/16/31 (a) | | | | 800 | | | | | 867,246 | |
| | | | | | | | | | |
| | | | | | | | | 2,403,829 | |
| | | | | | | | | | |
Commercial Mortgage-Backed Securities – 0.4% | | | | | | | | | | |
Freddie Mac Multi-Family Structured | | | | | | | | | | |
Pass-Through Certificates: | | | | | | | | | | |
Series K003, Class A1, 2.23%, 7/25/13 | | | | 359 | | | | | 362,643 | |
Series K003, Class A2, 3.61%, 6/25/14 | | | | 420 | | | | | 435,511 | |
| | | | | | | | | | |
| | | | | | | | | 798,154 | |
| | | | | | | | | | |
Mortgage-Backed Securities – 23.2% | | | | | | | | | | |
Fannie Mae Mortgage-Backed Securities: | | | | | | | | | | |
5.50%, 12/01/18-4/01/41 (c)(d) | | | | 5,103 | | | | | 5,462,540 | |
5.00%, 7/01/19-3/01/26 (c) | | | | 10,094 | | | | | 10,800,416 | |
3.50%, 4/01/26 (d) | | | | 5,000 | | | | | 5,015,625 | |
2.74%, 6/01/35 (a) | | | | 98 | | | | | 102,363 | |
2.72%, 7/01/35 (a) | | | | 265 | | | | | 277,809 | |
2.58%, 8/01/35 (a) | | | | 244 | | | | | 254,022 | |
5.36%, 10/01/35 (a) | | | | 285 | | | | | 304,934 | |
4.00%, 4/01/41 (d) | | | | 4,400 | | | | | 4,328,500 | |
4.50%, 4/01/41 (d) | | | | 8,800 | | | | | 8,923,750 | |
See Notes to Financial Statements.
| | | | | | |
| 30 | | BLACKROCK BOND ALLOCATION TARGET SHARES | | MARCH 31, 2011 | | |
| | |
| Schedule of Investments (continued) | | Series S Portfolio |
| | (Percentages shown are based on Net Assets) |
| | | | | | | | | | |
U.S. Government Sponsored Agency Securities | | Par
(000) | | Value |
Mortgage-Backed Securities (concluded) | | | | | | | | | | |
Freddie Mac Mortgage-Backed Securities: | | | | | | | | | | |
5.00%, 1/01/19-9/01/21 (c) | | | $ | 2,844 | | | | $ | 3,044,470 | |
3.08%, 6/01/33 (a) | | | | 127 | | | | | 132,562 | |
2.75%, 7/01/34 (a) | | | | 25 | | | | | 25,035 | |
5.50%, 1/01/41 | | | | 2,412 | | | | | 2,608,572 | |
| | | | | | | | | | |
| | | | | | | | | 41,280,598 | |
| | | | | | | | | | |
Total U.S. Government Sponsored Agency Securities – 25.0% | | | | | | | | | 44,482,581 | |
| | | | | | | | | | |
U.S. Treasury Obligations – 0.7% | | | | | | | | | | |
U.S. Treasury Notes, 2.13%, 2/29/16 | | | | 1,175 | | | | | 1,171,328 | |
| | | | | | | | | | |
Total Long-Term Investments
(Cost – $217,067,218) – 122.8% | | | | | | | | | 218,640,649 | |
| | | | | | | | | | |
| | |
Short-Term Securities | | Shares | | |
Dreyfus Treasury Prime, 0.00% (e) | | | | 7,444,084 | | | | | 7,444,084 | |
| | | | | | | | | | |
Total Short-Term Securities
(Cost – $7,444,084) – 4.2% | | | | | | | | | 7,444,084 | |
| | | | | | | | | | |
Total Investments Before TBA Sale Commitments
(Cost – $224,511,302*) – 127.0% | | | | | | | | | 226,084,733 | |
| | | | | | | | | | |
| | |
TBA Sale Commitments (d) | | Par
(000) | | |
Fannie Mae Mortgage-Backed Securities, | | | | | | | | | | |
4.00%, 4/01/41 | | | $ | 4,400 | | | | | (4,328,500 | ) |
| | | | | | | | | | |
Total TBA Sale Commitments
(Proceeds – $4,287,938) – (2.4)% | | | | | | | | | (4,328,500 | ) |
| | | | | | | | | | |
Total Investments Net of TBA Sale Commitments – 124.6% | | | | | | | | | 221,756,233 | |
Liabilities in Excess of Other Assets – (24.6)% | | | | | | | | | (43,843,104 | ) |
| | | | | | | | | | |
Net Assets – 100.0% | | | | | | | | $ | 177,913,129 | |
| | | | | | | | | | |
| * | The cost and unrealized appreciation (depreciation) of investments as of March 31, 2011, as computed for federal income tax purposes, were as follows: |
| | | | | |
Aggregate cost | | | $ | 224,511,302 | |
| | | | | |
Gross unrealized appreciation | | | $ | 2,327,154 | |
Gross unrealized depreciation | | | | (753,723 | ) |
| | | | | |
Net unrealized appreciation | | | $ | 1,573,431 | |
| | | | | |
| (a) | Variable rate security. Rate shown is as of report date. |
| (b) | Security exempt from registration under Rule 144A of the Securities Act of 1933. These securities may be resold in transactions exempt from registration to qualified institutional investors. |
| (c) | All or a portion of security pledged as collateral for reverse repurchase agreements. |
| (d) | Represents or includes a TBA transaction. Unsettled TBA transactions as of report date were as follows: |
| | | | | | | | | | |
Counterparty | | Value | | Unrealized
Appreciation
(Depreciation) |
Citibank, N.A. | | | $ | 5,762,219 | | | | $ | 15,344 | |
Credit Suisse International | | | $ | 8,923,750 | | | | $ | (68,750 | ) |
JPMorgan Chase Bank, N.A. | | | $ | 853,250 | | | | $ | 3,375 | |
Deutsche Bank AG | | | $ | 1,706,500 | | | | $ | 6,250 | |
Morgan Stanley Capital Services, Inc. | | | $ | (3,368,594 | ) | | | $ | (19,719 | ) |
| (e) | Represents the current yield as of report date. |
| | • | | Reverse repurchase agreements outstanding as of March 31, 2011 were as follows: |
| | | | | | | | | | | | | | | | | | | | | | | | | |
Counterparty | | Interest
Rate | | Settlement
Date | | Maturity
Date | | Net Closing
Amount | | Par |
Credit Suisse International | | | | 0.40% | | | | | 10/20/10 | | | | | Open | | | | $ | 1,453,975 | | | | $ | 1,451,363 | |
Royal Bank of Scotland Plc | | | | 0.33% | | | | | 10/26/10 | | | | | Open | | | | $ | 1,656,365 | | | | | 1,654,000 | |
Credit Suisse International | | | | 0.40% | | | | | 10/29/10 | | | | | Open | | | | $ | 1,761,320 | | | | | 1,758,331 | |
Credit Suisse International | | | | 0.40% | | | | | 11/10/10 | | | | | Open | | | | $ | 1,301,874 | | | | | 1,299,838 | |
Credit Suisse International | | | | 0.40% | | | | | 11/10/10 | | | | | Open | | | | $ | 1,247,163 | | | | | 1,245,213 | |
Bank of America, N.A. | | | | 0.40% | | | | | 11/16/10 | | | | | Open | | | | $ | 1,570,940 | | | | | 1,568,587 | |
Bank of America, N.A. | | | | 0.40% | | | | | 11/16/10 | | | | | Open | | | | $ | 1,384,445 | | | | | 1,382,370 | |
Deutsche Bank AG | | | | 0.40% | | | | | 12/10/10 | | | | | Open | | | | $ | 1,060,556 | | | | | 1,059,250 | |
Deutsche Bank AG | | | | 0.40% | | | | | 2/28/11 | | | | | Open | | | | $ | 293,281 | | | | | 293,180 | |
BNP Paribas | | | | 0.25% | | | | | 3/10/11 | | | | | 4/14/11 | | | | $ | 10,605,577 | | | | | 10,603,000 | |
Bank of America, N.A. | | | | 0.27% | | | | | 3/16/11 | | | | | 4/13/11 | | | | $ | 4,138,869 | | | | | 4,138,000 | |
| | | | | | | | | | | | | | | | | | | | | | | | | |
Total | | | | | | | | | | | | | | | | | | | | | | | $ | 26,453,132 | |
| | | | | | | | | | | | | | | | | | | | | | | | | |
| | • | | Financial futures contracts purchased as of March 31, 2011 were as follows: |
| | | | | | | | | | | | | | | | |
| | | | | | | Expiration | | Notional | | Unrealized |
Contracts | | Issue | | Exchange | | Date | | Value | | Appreciation |
567 | | U.S. Treasury Notes (2 Year) | | Chicago Mercantile | | June 2011 | | | $ | 123,676,875 | | | | $ | 139,278 | |
| | • | | Financial futures contracts sold as of March 31, 2011 were as follows: |
| | | | | | | | | | | | | | | | | | | | | | | | | |
Contracts | | Issue | | Exchange | | Expiration
Date | | Notional
Value | | Unrealized
Appreciation
(Depreciation) |
168 | | |
| U.S. Treasury
Notes (5 Year) |
| | |
| Chicago
Mercantile |
| | | | June 2011 | | | | $ | 19,620,563 | | | | $ | 32,127 | |
56 | | |
| U.S. Treasury
Notes (10 Year) |
| | |
| Chicago
Mercantile |
| | | | June 2011 | | | | $ | 6,665,750 | | | | | (16,019 | ) |
| | | | | | | | | | | | | | | | | | | | | | | | | |
Total | | | | | | | | | | | | | | | | | | | | | | | $ | 16,108 | |
| | | | | | | | | | | | | | | | | | | | | | | | | |
See Notes to Financial Statements.
| | | | | | |
| | | BLACKROCK BOND ALLOCATION TARGET SHARES | | MARCH 31, 2011 | | 31 |
| | |
| Schedule of Investments (continued) | | Series S Portfolio |
| | |
| | • | | Interest rate swaps outstanding as of March 31, 2011 were as follows: |
| | | | | | | | | | | | | | | | | | | | | | | | | |
Fixed Rate | | Floating Rate | | Counterparty | | Expiration
Date | | Notional
Amount
(000) | | Unrealized
Appreciation
(Depreciation) |
0.63%(a) | | | | 3-month LIBOR | | | | | Deutsche Bank AG | | | | | 11/26/12 | | | | | USD 3,700 | | | | $ | 441 | |
0.78%(a) | | | | 3-month LIBOR | | | | | Deutsche Bank AG | | | | | 12/01/12 | | | | | USD 8,700 | | | | | (23,544 | ) |
| | | | | | | | | | | | | | | | | | | | | | | | | |
| Total | | | | | | | | | | | | | | | | | | | | | | | $ | (23,103 | ) |
| | | | | | | | | | | | | | | | | | | | | | | | | |
| (a) | Fund pays fixed interest rate and receives floating rate. |
| | • | | Credit default swaps on single-name issues – buy protection outstanding as of March 31, 2011 were as follows: |
| | | | | | | | | | | | | | | | | | | | | | | | | |
Issuer | | Pay
Fixed
Rate | | Counterparty | | Expiration
Date | | Notional
Amount
(000) | | Unrealized
Depreciation |
Macy’s, Inc. | | | | 1.00 | % | | | | Citibank, N.A. | | | | | 3/20/16 | | | | | USD 850 | | | | $ | (171 | ) |
Safeway, Inc. | | | | 1.00 | % | | | | Citibank, N.A. | | | | | 3/20/16 | | | | | USD 850 | | | | | (12,557 | ) |
Whirlpool Corp. | | | | 1.00 | % | | | | Citibank, N.A. | | | | | 3/20/16 | | | | | USD 525 | | | | | (139 | ) |
| | | | | | | | | | | | | | | | | | | | | | | | | |
Total | | | | | | | | | | | | | | | | | | | | | | | $ | (12,867 | ) |
| | | | | | | | | | | | | | | | | | | | | | | | | |
| | • | | For Fund compliance purposes, the Fund’s industry classifications refer to any one or more of the industry sub-classifications used by one or more widely recognized market indexes or ratings group indexes, and/or as defined by Fund management. |
These definitions may not apply for purposes of this report, which may combine industry sub-classifications for reporting ease.
| | • | | Fair Value Measurements – Various inputs are used in determining the fair value of investments and derivative financial instruments. These inputs are summarized in three broad levels for financial statement purposes as follows: |
| | • | | Level 1 – price quotations in active markets/exchanges for identical assets and liabilities |
| | • | | Level 2 – other observable inputs (including, but not limited to: quoted prices for similar assets or liabilities in markets that are active, quoted prices for identical or similar assets or liabilities in markets that are not active, inputs other than quoted prices that are observable for the assets or liabilities (such as interest rates, yield curves, volatilities, prepayment speeds, loss severities, credit risks and default rates) or other market–corroborated inputs) |
| | • | | Level 3 – unobservable inputs based on the best information available in the circumstances, to the extent observable inputs are not available (including the Fund’s own assumptions used in determining the fair value of investments and derivative financial instruments) |
The inputs or methodologies used for valuing securities are not necessarily an indication of the risk associated with investing in those securities. For information about the Fund’s policy regarding valuation of investments and derivative financial instruments and other significant accounting policies, please refer to Note 1 of the Notes to Financial Statements.
The following tables summarize the inputs used as of March 31, 2011 in determining the fair valuation of the Fund’s investments and derivative financial instruments:
| | | | | | | | | | | | | | | | | | | | |
Valuation Inputs | | Level 1 | | Level 2 | | Level 3 | | Total |
Assets: | | | | | | | | | | | | | | | | | | | | |
Investments: | | | | | | | | | | | | | | | | | | | | |
Long-Term Investments: | | | | | | | | | | | | | | | | | | | | |
Asset-Backed Securities | | | | – | | | | $ | 36,801,351 | | | | $ | 1,349,911 | | | | $ | 38,151,262 | |
Corporate Bonds | | | | – | | | | | 87,602,666 | | | | | – | | | | | 87,602,666 | |
Foreign Agency Obligations | | | | – | | | | | 8,628,477 | | | | | – | | | | | 8,628,477 | |
Foreign Government Obligations | | | | – | | | | | 562,591 | | | | | – | | | | | 562,591 | |
Non-Agency Mortgage-Backed Securities | | | | – | | | | | 34,974,001 | | | | | 837,160 | | | | | 35,811,161 | |
Taxable Municipal Bonds | | | | – | | | | | 2,230,583 | | | | | – | | | | | 2,230,583 | |
U.S. Government Sponsored Agency Securities | | | | – | | | | | 37,596,509 | | | | | 6,886,072 | | | | | 44,482,581 | |
U.S. Treasury Obligations | | | | – | | | | | 1,171,328 | | | | | – | | | | | 1,171,328 | |
Short-Term Securities | | | $ | 7,444,084 | | | | | – | | | | | – | | | | | 7,444,084 | |
Liabilities: | | | | | | | | | | | | | | | | | | | | |
Investments in Securities: | | | | | | | | | | | | | | | | | | | | |
TBA Sale Commitments | | | | – | | | | | (4,328,500 | ) | | | | – | | | | | (4,328,500 | ) |
| | | | | | | | | | | | | | | | | | | | |
Total | | | $ | 7,444,084 | | | | $ | 205,239,006 | | | | $ | 9,073,143 | | | | $ | 221,756,233 | |
| | | | | | | | | | | | | | | | | | | | |
| | | | |
Valuation Inputs | | Level 1 | | Level 2 | | Level 3 | | Total |
Derivative Financial Instruments1 | | | | | | | | | | | | | | | | | | | | |
Assets: | | | | | | | | | | | | | | | | | | | | |
Interest rate contracts | | | $ | 171,405 | | | | $ | 441 | | | | | – | | | | $ | 171,846 | |
Liabilities: | | | | | | | | | | | | | | | | | | | | |
Interest rate contracts | | | | (16,019 | ) | | | | (23,544 | ) | | | | – | | | | | (39,563 | ) |
Credit contracts | | | | – | | | | | (12,867 | ) | | | | – | | | | | (12,867 | ) |
| | | | | | | | | | | | | | | | | | | | |
Total | | | $ | 155,386 | | | | $ | (35,970 | ) | | | | – | | | | $ | 119,416 | |
| | | | | | | | | | | | | | | | | | | | |
| 1 | Derivative financial instruments are swaps and financial futures contracts which are valued at the unrealized appreciation/depreciation on the instrument. |
See Notes to Financial Statements.
| | | | | | |
| 32 | | BLACKROCK BOND ALLOCATION TARGET SHARES | | MARCH 31, 2011 | | |
| | |
| Schedule of Investments (concluded) | | Series S Portfolio |
| | |
The following table is a reconciliation of Level 3 investments for which significant unobservable inputs were used in determining fair value:
| | | | | | | | | | | | | | | | | | | | |
| | | Asset-Backed
Securities | | Non-Agency
Mortgage-Backed
Securities | | U.S Government
Sponsored
Agency
Securities | | Total |
Assets: | | | | | | | | | | | | | | | | | | | | |
Balance, as of March 31, 2010 | | | $ | 1,497,499 | | | | | – | | | | | – | | | | $ | 1,497,499 | |
Accrued discounts/premiums | | | | (29 | ) | | | $ | 741 | | | | $ | (9,195 | ) | | | | (8,483 | ) |
Realized loss | | | | (707 | ) | | | | – | | | | | – | | | | | (707 | ) |
Net change in unrealized appreciation/depreciation2 | | | | 2,800 | | | | | (109,371 | ) | | | | (237,434 | ) | | | | (344,005 | ) |
Purchases | | | | 1,349,911 | | | | | 945,790 | | | | | 7,132,701 | | | | | 9,428,402 | |
Sales | | | | (962,400 | ) | | | | – | | | | | – | | | | | (962,400 | ) |
Transfers in3 | | | | – | | | | | – | | | | | – | | | | | – | |
Transfers out3 | | | | (537,163 | ) | | | | – | | | | | – | | | | | (537,163 | ) |
| | | | | | | | | | | | | | | | | | | | |
Balance, as of March 31, 2011 | | | $ | 1,349,911 | | | | $ | 837,160 | | | | $ | 6,886,072 | | | | $ | 9,073,143 | |
| | | | | | | | | | | | | | | | | | | | |
| 2 | Included in the related net change in unrealized appreciation/depreciation in the Statements of Operations. The change in unrealized appreciation/depreciation on investments still held at March 31, 2011 was $(346,805). |
| 3 | The Fund’s policy is to recognize transfers in and transfers out as of the beginning of the period of the event or the change in circumstances that caused the transfer. |
A reconciliation of Level 3 investments is presented when the Fund had a significant amount of Level 3 investments at the beginning and/or end of the year in relation to net assets.
See Notes to Financial Statements.
| | | | | | |
| | | BLACKROCK BOND ALLOCATION TARGET SHARES | | MARCH 31, 2011 | | 33 |
| | |
| Statements of Assets and Liabilities | | |
| | |
| | | | | | | | | | | | | | | | | | | | |
March 31, 2011 | | Series C
Portfolio | | Series M
Portfolio | | Series N
Portfolio5 | | Series S
Portfolio |
Assets | | | | | | | | | | | | | | | | | | | | |
Investments at value1 | | | $ | 318,518,466 | | | | $ | 439,838,775 | | | | $ | 9,328,295 | | | | $ | 226,084,733 | |
Cash pledged as collateral for financial futures contracts | | | | – | | | | | – | | | | | – | | | | | 452,000 | |
Swap premiums paid | | | | 64,046 | | | | | – | | | | | – | | | | | 16,027 | |
TBA Sale commitments receivable | | | | – | | | | | – | | | | | – | | | | | 4,287,938 | |
Investments sold receivable | | | | 580,635 | | | | | 111,744 | | | | | 538,257 | | | | | 20,827,519 | |
Interest receivable | | | | 4,282,067 | | | | | 1,368,975 | | | | | 130,977 | | | | | 1,510,047 | |
Capital shares sold receivable | | | | 899,310 | | | | | 881,705 | | | | | – | | | | | 556,418 | |
Unrealized appreciation on swaps | | | | 572,713 | | | | | – | | | | | – | | | | | 441 | |
Margin variation receivable | | | | 46,517 | | | | | – | | | | | – | | | | | 51,450 | |
Receivable from advisor | | | | 29,033 | | | | | 22,406 | | | | | 18,583 | | | | | 35,269 | |
Dividends receivable | | | | 6 | | | | | 258 | | | | | 129 | | | | | 7 | |
Principal paydown receivable | | | | – | | | | | 32,377 | | | | | – | | | | | 387 | |
Prepaid expenses | | | | 26,131 | | | | | 26,826 | | | | | 11,450 | | | | | 13,493 | |
| | | | | | | | | | | | | | | | | | | | |
Total assets | | | | 325,018,924 | | | | | 442,283,066 | | | | | 10,027,691 | | | | | 253,835,729 | |
| | | | | | | | | | | | | | | | | | | | |
Accrued Liabilities | | | | | | | | | | | | | | | | | | | | |
Bank overdraft | | | | 2,940 | | | | | – | | | | | – | | | | | – | |
Investments purchased payable | | | | 5,665,565 | | | | | 126,847,916 | | | | | – | | | | | 44,385,643 | |
Reverse repurchase agreements payable | | | | – | | | | | – | | | | | – | | | | | 26,453,132 | |
Options written at value2 | | | | 1,337,453 | | | | | – | | | | | – | | | | | – | |
Cash received as collateral for financial futures contracts | | | | 411,000 | | | | | – | | | | | – | | | | | – | |
Income dividends payable | | | | 1,362,977 | | | | | 786,995 | | | | | 43,020 | | | | | 458,216 | |
Capital shares redeemed payable | | | | 1,197,219 | | | | | 1,066,686 | | | | | – | | | | | 142,053 | |
Unrealized depreciation on swaps | | | | 71,005 | | | | | – | | | | | – | | | | | 36,411 | |
Professional fees payable | | | | 69,353 | | | | | 67,127 | | | | | 49,359 | | | | | 54,619 | |
Other affiliates payable | | | | 14,923 | | | | | 12,032 | | | | | 4,579 | | | | | 13,070 | |
Officer’s and Trustees’ fees payable | | | | 8,253 | | | | | 8,214 | | | | | 1,971 | | | | | 7,759 | |
Margin variation payable | | | | 3,378 | | | | | 110,756 | | | | | – | | | | | – | |
Interest expense payable | | | | – | | | | | – | | | | | – | | | | | 25,895 | |
TBA sale commitments at value3 | | | | – | | | | | – | | | | | – | | | | | 4,328,500 | |
Other accrued expenses payable | | | | 40,337 | | | | | 38,590 | | | | | 2,425 | | | | | 17,302 | |
| | | | | | | | | | | | | | | | | | | | |
Total liabilities | | | | 10,184,403 | | | | | 128,938,316 | | | | | 101,354 | | | | | 75,922,600 | |
| | | | | | | | | | | | | | | | | | | | |
Net Assets | | | $ | 314,834,521 | | | | $ | 313,344,750 | | | | $ | 9,926,337 | | | | $ | 177,913,129 | |
| | | | | | | | | | | | | | | | | | | | |
Net Assets Consist of | | | | | | | | | | | | | | | | | | | | |
Paid-in capital | | | $ | 314,929,031 | | | | $ | 327,502,064 | | | | $ | 10,199,786 | | | | $ | 176,231,781 | |
Undistributed (distributions in excess of) net investment income | | | | (108,052 | ) | | | | 49,435 | | | | | 5,586 | | | | | 844 | |
Accumulated net realized gain (loss) | | | | (13,005,184 | ) | | | | (20,739,384 | ) | | | | (198,696 | ) | | | | 28,220 | |
Net unrealized appreciation/depreciation | | | | 13,018,726 | | | | | 6,532,635 | | | | | (80,339 | ) | | | | 1,652,284 | |
| | | | | | | | | | | | | | | | | | | | |
Net Assets | | | $ | 314,834,521 | | | | $ | 313,344,750 | | | | $ | 9,926,337 | | | | $ | 177,913,129 | |
| | | | | | | | | | | | | | | | | | | | |
Net Asset Value | | | | | | | | | | | | | | | | | | | | |
Shares outstanding4 | | | | 31,371,754 | | | | | 33,207,201 | | | | | 1,019,820 | | | | | 17,780,467 | |
| | | | | | | | | | | | | | | | | | | | |
Net asset value | | | $ | 10.04 | | | | $ | 9.44 | | | | $ | 9.73 | | | | $ | 10.01 | |
| | | | | | | | | | | | | | | | | | | | |
1 Investments at cost | | | $ | 306,053,926 | | | | $ | 433,450,719 | | | | $ | 9,408,634 | | | | $ | 224,511,302 | |
2 Premiums received | | | $ | 1,362,701 | | | | | – | | | | | – | | | | | – | |
3 Proceeds from TBA sale commitments | | | | – | | | | | – | | | | | – | | | | $ | 4,287,938 | |
4 Unlimited number of shares authorized, $0.001 par value | | | | | | | | | | | | | | | | | | | | |
5 Liquidation Basis | | | | | | | | | | | | | | | | | | | | |
See Notes to Financial Statements.
| | | | | | |
| 34 | | BLACKROCK BOND ALLOCATION TARGET SHARES | | MARCH 31, 2011 | | |
| | | | | | | | | | | | | | | | | | | | |
Year Ended March 31, 2011 | | Series C
Portfolio | | Series M
Portfolio | | Series N
Portfolio1 | | Series S
Portfolio |
Investment Income | | | | | | | | | | | | | | | | | | | | |
Interest | | | $ | 17,917,463 | | | | $ | 10,409,815 | | | | $ | 601,696 | | | | $ | 5,018,536 | |
Dividends | | | | 49 | | | | | 416 | | | | | 492 | | | | | 123 | |
| | | | | | | | | | | | | | | | | | | | |
Total income | | | | 17,917,512 | | | | | 10,410,231 | | | | | 602,188 | | | | | 5,018,659 | |
| | | | | | | | | | | | | | | | | | | | |
Expenses | | | | | | | | | | | | | | | | | | | | |
Transfer agent | | | | 168,825 | | | | | 166,096 | | | | | 15,502 | | | | | 33,535 | |
Administration | | | | 85,026 | | | | | 58,295 | | | | | 22,360 | | | | | 69,128 | |
Professional | | | | 78,023 | | | | | 75,594 | | | | | 48,964 | | | | | 62,231 | |
Registration | | | | 33,128 | | | | | 34,055 | | | | | 19,591 | | | | | 29,566 | |
Custodian | | | | 28,247 | | | | | 27,586 | | | | | 2,231 | | | | | 26,211 | |
Officer and Trustees | | | | 26,222 | | | | | 26,289 | | | | | 5,131 | | | | | 23,104 | |
Printing | | | | 20,501 | | | | | 21,723 | | | | | 2,744 | | | | | 3,910 | |
Miscellaneous | | | | 13,100 | | | | | 13,570 | | | | | 3,217 | | | | | 6,701 | |
| | | | | | | | | | | | | | | | | | | | |
Total expenses excluding interest expense and fees | | | | 453,072 | | | | | 423,208 | | | | | 119,740 | | | | | 254,386 | |
Interest expense and fees | | | | 9,821 | | | | | 21 | | | | | 1,694 | 2 | | | | 52,322 | |
| | | | | | | | | | | | | | | | | | | | |
Total expenses | | | | 462,893 | | | | | 423,229 | | | | | 121,434 | | | | | 306,708 | |
Less expenses reimbursed by advisor | | | | (452,885 | ) | | | | (423,023 | ) | | | | (119,735 | ) | | | | (254,314 | ) |
| | | | | | | | | | | | | | | | | | | | |
Total expenses after fees reimbursed | | | | 10,008 | | | | | 206 | | | | | 1,699 | | | | | 52,394 | |
| | | | | | | | | | | | | | | | | | | | |
Net investment income | | | | 17,907,504 | | | | | 10,410,025 | | | | | 600,489 | | | | | 4,966,265 | |
| | | | | | | | | | | | | | | | | | | | |
Realized and Unrealized Gain (Loss) | | | | | | | | | | | | | | | | | | | | |
Net realized gain (loss) from: | | | | | | | | | | | | | | | | | | | | |
Investments | | | | 16,477,786 | | | | | 720,388 | | | | | 75,025 | | | | | 1,366,974 | |
Options written | | | | 8,141 | | | | | – | | | | | – | | | | | 82,774 | |
Financial futures contracts | | | | (2,845,062 | ) | | | | 6,937,277 | | | | | 636 | | | | | 518,735 | |
Swaps | | | | (239,561 | ) | | | | – | | | | | – | | | | | (100,846 | ) |
| | | | | | | | | | | | | | | | | | | | |
| | | | 13,401,304 | | | | | 7,657,665 | | | | | 75,661 | | | | | 1,867,637 | |
| | | | | | | | | | | | | | | | | | | | |
Net change in unrealized appreciation/depreciation on: | | | | | | | | | | | | | | | | | | | | |
Investments | | | | (5,097,699 | ) | | | | 3,489,680 | | | | | (446,789 | ) | | | | (828,555 | ) |
TBA sale commitments | | | | – | | | | | – | | | | | – | | | | | (40,562 | ) |
Options written | | | | 25,248 | | | | | – | | | | | – | | | | | (65,809 | ) |
Financial futures contracts | | | | 64,048 | | | | | 401,472 | | | | | – | | | | | 189,598 | |
Swaps | | | | 501,708 | | | | | – | | | | | – | | | | | (23,973 | ) |
| | | | | | | | | | | | | | | | | | | | |
| | | | (4,506,695 | ) | | | | 3,891,152 | | | | | (446,789 | ) | | | | (769,301 | ) |
| | | | | | | | | | | | | | | | | | | | |
Total realized and unrealized gain (loss) | | | | 8,894,609 | | | | | 11,548,817 | | | | | (371,128 | ) | | | | 1,098,336 | |
| | | | | | | | | | | | | | | | | | | | |
Net Increase in Net Assets Resulting from Operations | | | $ | 26,802,113 | | | | $ | 21,958,842 | | | | $ | 229,361 | | | | $ | 6,064,601 | |
| | | | | | | | | | | | | | | | | | | | |
| 2 | Related to TOBs. Includes interest expense and fees incurred. |
See Notes to Financial Statements.
| | | | | | |
| | | BLACKROCK BOND ALLOCATION TARGET SHARES | | MARCH 31, 2011 | | 35 |
| | |
| Statements of Changes in Net Assets | | |
| | |
| | | | | | | | | | | | | | | | | | | | |
| | | Series C Portfolio | | Series M Portfolio |
| | | Year Ended March 31, | | Year Ended March 31, |
Increase (Decrease) in Net Assets: | | 2011 | | 2010 | | 2011 | | 2010 |
Operations | | | | | | | | | | | | | | | | | | | | |
Net investment income | | | $ | 17,907,504 | | | | $ | 20,663,733 | | | | $ | 10,410,025 | | | | $ | 15,194,059 | |
Net realized gain (loss) | | | | 13,401,304 | | | | | 4,794,630 | | | | | 7,657,665 | | | | | (10,884,108 | ) |
Net change in unrealized appreciation/depreciation | | | | (4,506,695 | ) | | | | 37,533,747 | | | | | 3,891,152 | | | | | 33,012,293 | |
| | | | | | | | | | | | | | | | | | | | |
Net increase in net assets resulting from operations | | | | 26,802,113 | | | | | 62,992,110 | | | | | 21,958,842 | | | | | 37,322,244 | |
| | | | | | | | | | | | | | | | | | | | |
Dividends and Distributions to Shareholders From | | | | | | | | | | | | | | | | | | | | |
Net investment income | | | | (17,698,037 | ) | | | | (20,663,733 | ) | | | | (11,332,263 | ) | | | | (15,669,386 | ) |
Net realized gain | | | | – | | | | | – | | | | | – | | | | | – | |
| | | | | | | | | | | | | | | | | | | | |
Decrease in net assets resulting from dividends and distributions to shareholders | | | | (17,698,037 | ) | | | | (20,663,733 | ) | | | | (11,332,263 | ) | | | | (15,669,386 | ) |
| | | | | | | | | | | | | | | | | | | | |
Capital Share Transactions | | | | | | | | | | | | | | | | | | | | |
Shares sold | | | | 75,043,585 | | | | | 85,755,081 | | | | | 80,501,806 | | | | | 95,656,405 | |
Shares issued in reinvestment of dividends and distributions | | | | 64,092 | | | | | 1,023,024 | | | | | 40,201 | | | | | 801,497 | |
Shares redeemed | | | | (134,167,615 | ) | | | | (117,246,227 | ) | | | | (138,727,307 | ) | | | | (106,428,771 | ) |
| | | | | | | | | | | | | | | | | | | | |
Net increase (decrease) in net assets derived from capital share transactions | | | | (59,059,938 | ) | | | | (30,468,122 | ) | | | | (58,185,300 | ) | | | | (9,970,869 | ) |
| | | | | | | | | | | | | | | | | | | | |
Net Assets | | | | | | | | | | | | | | | | | | | | |
Total increase (decrease) in net assets | | | | (49,955,862 | ) | | | | 11,860,255 | | | | | (47,558,721 | ) | | | | 11,681,989 | |
Beginning of year | | | | 364,790,383 | | | | | 352,930,128 | | | | | 360,903,471 | | | | | 349,221,482 | |
| | | | | | | | | | | | | | | | | | | | |
End of year | | | $ | 314,834,521 | | | | $ | 364,790,383 | | | | $ | 313,344,750 | | | | $ | 360,903,471 | |
| | | | | | | | | | | | | | | | | | | | |
Undistributed (distributions in excess of) net investment income | | | $ | (108,052 | ) | | | $ | (157,187 | ) | | | $ | 49,435 | | | | $ | 49,435 | |
| | | | | | | | | | | | | | | | | | | | |
See Notes to Financial Statements.
| | | | | | |
| 36 | | BLACKROCK BOND ALLOCATION TARGET SHARES | | MARCH 31, 2011 | | |
| | | | | | | | | | | | | | |
| Series N Portfolio | | | Series S Portfolio | |
| Year Ended March 31, | | | Year Ended March 31, | |
| 20111 | | | 2010 | | | 2011 | | | 2010 | |
| | | | | | | | | | | | | | |
| $ | 600,489 | | | $ | 587,573 | | | $ | 4,966,265 | | | $ | 4,206,103 | |
| | 75,661 | | | | (126,474 | ) | | | 1,867,637 | | | | 2,535,399 | |
| | (446,789 | ) | | | 1,376,660 | | | | (769,301 | ) | | | 2,569,176 | |
| | | | | | | | | | | | | | | |
| | 229,361 | | | | 1,837,759 | | | | 6,064,601 | | | | 9,310,678 | |
| | | | | | | | | | | | | | | |
| | | | | | | | | | | | | | |
| | (625,787 | ) | | | (564,744 | ) | | | (5,172,696 | ) | | | (4,372,743 | ) |
| | – | | | | – | | | | (3,298,417 | ) | | | (538,990 | ) |
| | | | | | | | | | | | | | | |
| | (625,787 | ) | | | (564,744 | ) | | | (8,471,113 | ) | | | (4,911,733 | ) |
| | | | | | | | | | | | | | | |
| | | | | | | | | | | | | | |
| | – | | | | – | | | | 118,848,528 | | | | 97,047,559 | |
| | – | | | | – | | | | 203,793 | | | | 272,057 | |
| | – | | | | – | | | | (81,716,724 | ) | | | (45,843,071 | ) |
| | | | | | | | | | | | | | | |
| | – | | | | – | | | | 37,335,597 | | | | 51,476,545 | |
| | | | | | | | | | | | | | | |
| | | | | | | | | | | | | | |
| | (396,426 | ) | | | 1,273,015 | | | | 34,929,085 | | | | 55,875,490 | |
| | 10,322,763 | | | | 9,049,748 | | | | 142,984,044 | | | | 87,108,554 | |
| | | | | | | | | | | | | | | |
| $ | 9,926,337 | | | $ | 10,322,763 | | | $ | 177,913,129 | | | $ | 142,984,044 | |
| | | | | | | | | | | | | | | |
| $ | 5,586 | | | $ | 31,967 | | | $ | 844 | | | $ | (22,726 | ) |
| | | | | | | | | | | | | | | |
See Notes to Financial Statements.
| | | | | | |
| | | BLACKROCK BOND ALLOCATION TARGET SHARES | | MARCH 31, 2011 | | 37 |
| | | | | | | | | | | | | | | | | | | | | | | | | | | | | | |
| | | Series C Portfolio |
| | | Year Ended March 31, | | Period
October 1,
2008 to
March 31, | | Year Ended September 30, |
| | | 2011 | | 2010 | | 2009 | | 2008 | | 2007 | | 2006 |
Per Share Operating Performance | | | | | | | | | | | | | | | | | | | | | | | | | | | | | | |
Net asset value, beginning of period | | | $ | 9.81 | | | | $ | 8.74 | | | | $ | 8.48 | | | | $ | 9.79 | | | | $ | 9.79 | | | | $ | 9.92 | |
| | | | | | | | | | | | | | | | | | | | | | | | | | | | | | |
Net investment income1 | | | | 0.53 | | | | | 0.53 | | | | | 0.26 | | | | | 0.58 | | | | | 0.51 | | | | | 0.47 | |
Net realized and unrealized gain (loss) | | | | 0.22 | | | | | 1.07 | | | | | 0.26 | | | | | (1.31 | ) | | | | – | | | | | (0.14 | ) |
| | | | | | �� | | | | | | | | | | | | | | | | | | | | | | | | |
Net increase (decrease) from investment operations | | | | 0.75 | | | | | 1.60 | | | | | 0.52 | | | | | (0.73 | ) | | | | 0.51 | | | | | 0.33 | |
| | | | | | | | | | | | | | | | | | | | | | | | | | | | | | |
Dividends from net investment income | | | | (0.52 | ) | | | | (0.53 | ) | | | | (0.26 | ) | | | | (0.58 | ) | | | | (0.51 | ) | | | | (0.46 | ) |
| | | | | | | | | | | | | | | | | | | | | | | | | | | | | | |
Net asset value, end of period | | | $ | 10.04 | | | | $ | 9.81 | | | | $ | 8.74 | | | | $ | 8.48 | | | | $ | 9.79 | | | | $ | 9.79 | |
| | | | | | | | | | | | | | | | | | | | | | | | | | | | | | |
Total Investment Return2 | | | | | | | | | | | | | | | | | | | | | | | | | | | | | | |
Based on net asset value | | | | 7.73 | % | | | | 18.68 | % | | | | 6.17 | %3 | | | | (8.02 | )% | | | | 5.37 | % | | | | 3.51 | % |
| | | | | | | | | | | | | | | | | | | | | | | | | | | | | | |
Ratios to Average Net Assets | | | | | | | | | | | | | | | | | | | | | | | | | | | | | | |
Total expenses | | | | 0.14 | % | | | | 0.14 | % | | | | 0.25 | %4 | | | | 0.67 | % | | | | 0.39 | % | | | | 1.60 | % |
| | | | | | | | | | | | | | | | | | | | | | | | | | | | | | |
Total expenses after fees reimbursed | | | | 0.00 | % | | | | 0.00 | % | | | | 0.09 | %4 | | | | 0.55 | % | | | | 0.19 | % | | | | 0.00 | % |
| | | | | | | | | | | | | | | | | | | | | | | | | | | | | | |
Total expenses after fees reimbursed and excluding interest expense | | | | 0.00 | % | | | | 0.00 | % | | | | 0.00 | %4 | | | | 0.00 | % | | | | 0.00 | % | | | | 0.00 | % |
| | | | | | | | | | | | | | | | | | | | | | | | | | | | | | |
Net investment income | | | | 5.24 | % | | | | 5.64 | % | | | | 5.96 | %4 | | | | 5.96 | % | | | | 5.31 | % | | | | 4.81 | % |
| | | | | | | | | | | | | | | | | | | | | | | | | | | | | | |
Supplemental Data | | | | | | | | | | | | | | | | | | | | | | | | | | | | | | |
Net assets, end of period (000) | | | $ | 314,835 | | | | $ | 364,790 | | | | $ | 352,930 | | | | $ | 380,706 | | | | $ | 475,724 | | | | $ | 13,365 | |
| | | | | | | | | | | | | | | | | | | | | | | | | | | | | | |
Portfolio turnover | | | | 55 | % | | | | 51 | % | | | | 16 | % | | | | 51 | % | | | | 70 | % | | | | 42 | % |
| | | | | | | | | | | | | | | | | | | | | | | | | | | | | | |
| | 1 | Based on average shares outstanding. |
| | 2 | Where applicable, total investment returns include the reinvestments of dividends and distributions. |
| | 3 | Aggregate total investment return. |
See Notes to Financial Statements.
| | | | | | |
| 38 | | BLACKROCK BOND ALLOCATION TARGET SHARES | | MARCH 31, 2011 | | |
| | | | | | | | | | | | | | | | | | | | | | | | | | | | | | |
| | | Series M Portfolio |
| | | Year Ended March 31, | | Period
October 1,
2008 to
March 31, | | Year Ended September 30, |
| | | 2011 | | 2010 | | 2009 | | 2008 | | 2007 | | 2006 |
Per Share Operating Performance | | | | | | | | | | | | | | | | | | | | | | | | | | | | | | |
Net asset value, beginning of period | | | $ | 9.21 | | | | $ | 8.66 | | | | $ | 9.33 | | | | $ | 9.73 | | | | $ | 9.79 | | | | $ | 9.83 | |
| | | | | | | | | | | | | | | | | | | | | | | | | | | | | | |
Net investment income1 | | | | 0.29 | | | | | 0.38 | | | | | 0.26 | | | | | 0.51 | | | | | 0.51 | | | | | 0.48 | |
Net realized and unrealized gain (loss) | | | | 0.26 | | | | | 0.55 | | | | | (0.52 | ) | | | | (0.39 | ) | | | | (0.05 | ) | | | | (0.05 | ) |
| | | | | | | | | | | | | | | | | | | | | | | | | | | | | | |
Net increase (decrease) from investment operations | | | | 0.55 | | | | | 0.93 | | | | | (0.26 | ) | | | | 0.12 | | | | | 0.46 | | | | | 0.43 | |
| | | | | | | | | | | | | | | | | | | | | | | | | | | | | | |
Dividends and distributions from: | | | | | | | | | | | | | | | | | | | | | | | | | | | | | | |
Net investment income | | | | (0.32 | ) | | | | (0.38 | ) | | | | (0.26 | ) | | | | (0.52 | ) | | | | (0.52 | ) | | | | (0.47 | ) |
Net realized gain | | | | – | | | | | – | | | | | (0.15 | ) | | | | – | | | | | – | | | | | – | |
| | | | | | | | | | | | | | | | | | | | | | | | | | | | | | |
Total dividends and distributions | | | | (0.32 | ) | | | | (0.38 | ) | | | | (0.41 | ) | | | | (0.52 | ) | | | | (0.52 | ) | | | | (0.47 | ) |
| | | | | | | | | | | | | | | | | | | | | | | | | | | | | | |
Net asset value, end of period | | | $ | 9.44 | | | | $ | 9.21 | | | | $ | 8.66 | | | | $ | 9.33 | | | | $ | 9.73 | | | | $ | 9.79 | |
| | | | | | | | | | | | | | | | | | | | | | | | | | | | | | |
Total Investment Return2 | | | | | | | | | | | | | | | | | | | | | | | | | | | | | | |
Based on net asset value | | | | 5.91 | % | | | | 11.11 | % | | | | (2.61 | )%3 | | | | 1.12 | % | | | | 4.88 | % | | | | 4.54 | % |
| | | | | | | | | | | | | | | | | | | | | | | | | | | | | | |
Ratios to Average Net Assets | | | | | | | | | | | | | | | | | | | | | | | | | | | | | | |
Total expenses | | | | 0.12 | % | | | | 0.13 | % | | | | 0.17 | %4 | | | | 0.12 | % | | | | 0.18 | % | | | | 2.05 | % |
| | | | | | | | | | | | | | | | | | | | | | | | | | | | | | |
Total expenses after fees reimbursed | | | | 0.00 | % | | | | 0.00 | % | | | | 0.00 | %4 | | | | 0.01 | % | | | | 0.00 | % | | | | 0.00 | % |
| | | | | | | | | | | | | | | | | | | | | | | | | | | | | | |
Total expenses after fees reimbursed and excluding interest expense | | | | 0.00 | % | | | | 0.00 | % | | | | 0.00 | %4 | | | | 0.00 | % | | | | 0.00 | % | | | | 0.00 | % |
| | | | | | | | | | | | | | | | | | | | | | | | | | | | | | |
Net investment income | | | | 3.04 | % | | | | 4.27 | % | | | | 6.14 | %4 | | | | 5.29 | % | | | | 5.28 | % | | | | 4.86 | % |
| | | | | | | | | | | | | | | | | | | | | | | | | | | | | | |
Supplemental Data | | | | | | | | | | | | | | | | | | | | | | | | | | | | | | |
Net assets, end of period (000) | | | $ | 313,345 | | | | $ | 360,903 | | | | $ | 349,221 | | | | $ | 414,290 | | | | $ | 482,426 | | | | $ | 8,501 | |
| | | | | | | | | | | | | | | | | | | | | | | | | | | | | | |
Portfolio turnover | | | | 301 | %5 | | | | 178 | %6 | | | | 21 | %7 | | | | 197 | %8 | | | | 7 | % | | | | 23 | % |
| | | | | | | | | | | | | | | | | | | | | | | | | | | | | | |
| | 1 | Based on average shares outstanding. |
| | 2 | Where applicable, total investment returns include the reinvestments of dividends and distributions. |
| | 3 | Aggregate total investment return. |
| | 5 | Includes mortgage dollar roll transactions; excluding these transactions the portfolio turnover would have been 92%. |
| | 6 | Includes mortgage dollar roll transactions; excluding these transactions the portfolio turnover would have been 83%. |
| | 7 | Includes mortgage dollar roll transactions; excluding these transactions the portfolio turnover would have been 19%. |
| | 8 | Includes TBA transactions; excluding these transactions the portfolio turnover would have been 33%. |
See Notes to Financial Statements.
| | | | | | |
| | | BLACKROCK BOND ALLOCATION TARGET SHARES | | MARCH 31, 2011 | | 39 |
| | | | | | | | | | | | | | | |
| | | Series N Portfolio |
| | | Year Ended March 31, |
| | | 20111 | | 2010 | | 20092 |
Per Share Operating Performance | | | | | | | | | | | | | | | |
Net asset value, beginning of year | | | $ | 10.12 | | | | $ | 8.87 | | | | $ | 10.00 | |
| | | | | | | | | | | | | | | |
Net investment income3 | | | | 0.59 | | | | | 0.58 | | | | | 0.51 | |
Net realized and unrealized gain (loss) | | | | (0.37 | ) | | | | 1.22 | | | | | (1.14 | ) |
| | | | | | | | | | | | | | | |
Net increase (decrease) from investment operations | | | | 0.22 | | | | | 1.80 | | | | | (0.63 | ) |
| | | | | | | | | | | | | | | |
Dividends from net investment income | | | | (0.61 | ) | | | | (0.55 | ) | | | | (0.50 | ) |
| | | | | | | | | | | | | | | |
Net asset value, end of year | | | $ | 9.73 | | | | $ | 10.12 | | | | $ | 8.87 | |
| | | | | | | | | | | | | | | |
Total Investment Return4 | | | | | | | | | | | | | | | |
Based on net asset value | | | | 2.13 | % | | | | 20.74 | % | | | | (6.32 | )%5 |
| | | | | | | | | | | | | | | |
Ratios to Average Net Assets | | | | | | | | | | | | | | | |
Total expenses | | | | 1.17 | % | | | | 1.34 | % | | | | 1.93 | % |
| | | | | | | | | | | | | | | |
Total expenses after fees reimbursed | | | | 0.02 | % | | | | 0.01 | % | | | | 0.05 | % |
| | | | | | | | | | | | | | | |
Total expenses after fees reimbursed and excluding interest expense and fees6 | | | | 0.00 | % | | | | 0.00 | % | | | | 0.00 | % |
| | | | | | | | | | | | | | | |
Net investment income | | | | 5.81 | % | | | | 5.94 | % | | | | 5.50 | % |
| | | | | | | | | | | | | | | |
Supplemental Data | | | | | | | | | | | | | | | |
Net assets, end of year (000) | | | $ | 9,926 | | | | $ | 10,323 | | | | $ | 9,050 | |
| | | | | | | | | | | | | | | |
Portfolio turnover | | | | 17 | % | | | | 64 | % | | | | 48 | % |
| | | | | | | | | | | | | | | |
| | 2 | Commencement of operations was April 1, 2008. |
| | 3 | Based on average shares outstanding. |
| | 4 | Where applicable, total investment returns include the reinvestments of dividends and distributions. |
| | 5 | Aggregate total investment return. |
| | 6 | Interest expense and fees relate to TOBs. See Note 1 of the Notes to Financial Statements for details of municipal bonds transferred to TOBs. |
See Notes to Financial Statements.
| | | | | | |
| 40 | | BLACKROCK BOND ALLOCATION TARGET SHARES | | MARCH 31, 2011 | | |
Financial Highlights (concluded)
| | | | | | | | | | | | | | | | | | | | | | | | | | | | | | |
| | | Series S Portfolio |
| | | | | | | Period
October 1, | | | | | | |
| | | Year Ended March 31, | | 2008 to
March 31, | | Year Ended September 30, |
| | | 2011 | | 2010 | | 2009 | | 2008 | | 2007 | | 2006 |
Per Share Operating Performance | | | | | | | | | | | | | | | | | | | | | | | | | | | | | | |
Net asset value, beginning of period | | | $ | 10.14 | | | | $ | 9.74 | | | | $ | 9.75 | | | | $ | 9.79 | | | | $ | 9.84 | | | | $ | 9.84 | |
| | | | | | | | | | | | | | | | | | | | | | | | | | | | | | |
Net investment income1 | | | | 0.29 | | | | | 0.37 | | | | | 0.14 | | | | | 0.42 | | | | | 0.52 | | | | | 0.43 | |
Net realized and unrealized gain (loss) | | | | 0.08 | | | | | 0.46 | | | | | 0.09 | | | | | (0.04 | ) | | | | (0.06 | ) | | | | – | |
| | | | | | | | | | | | | | | | | | | | | | | | | | | | | | |
Net increase from investment operations | | | | 0.37 | | | | | 0.83 | | | | | 0.23 | | | | | 0.38 | | | | | 0.46 | | | | | 0.43 | |
| | | | | | | | | | | | | | | | | | | | | | | | | | | | | | |
Dividends and distributions from: | | | | | | | | | | | | | | | | | | | | | | | | | | | | | | |
Net investment income | | | | (0.31 | ) | | | | (0.38 | ) | | | | (0.14 | ) | | | | (0.42 | ) | | | | (0.51 | ) | | | | (0.43 | ) |
Net realized gain | | | | (0.19 | ) | | | | (0.05 | ) | | | | (0.10 | ) | | | | – | | | | | – | | | | | – | |
| | | | | | | | | | | | | | | | | | | | | | | | | | | | | | |
Total dividends and distributions | | | | (0.50 | ) | | | | (0.43 | ) | | | | (0.24 | ) | | | | (0.42 | ) | | | | (0.51 | ) | | | | (0.43 | ) |
| | | | | | | | | | | | | | | | | | | | | | | | | | | | | | |
Net asset value, end of period | | | $ | 10.01 | | | | $ | 10.14 | | | | $ | 9.74 | | | | $ | 9.75 | | | | $ | 9.79 | | | | $ | 9.84 | |
| | | | | | | | | | | | | | | | | | | | | | | | | | | | | | |
Total Investment Return2 | | | | | | | | | | | | | | | | | | | | | | | | | | | | | | |
Based on net asset value | | | | 3.73 | % | | | | 8.68 | % | | | | 2.44 | %3 | | | | 3.98 | % | | | | 4.88 | % | | | | 4.51 | % |
| | | | | | | | | | | | | | | | | | | | | | | | | | | | | | |
Ratios to Average Net Assets | | | | | | | | | | | | | | | | | | | | | | | | | | | | | | |
Total expenses | | | | 0.18 | % | | | | 0.19 | % | | | | 0.31 | %4 | | | | 0.33 | % | | | | 0.51 | % | | | | 1.28 | % |
| | | | | | | | | | | | | | | | | | | | | | | | | | | | | | |
Total expenses after fees reimbursed | | | | 0.03 | % | | | | 0.01 | % | | | | 0.00 | %4 | | | | 0.00 | % | | | | 0.00 | % | | | | 0.00 | % |
| | | | | | | | | | | | | | | | | | | | | | | | | | | | | | |
Total expenses after fees reimbursed and excluding interest expense | | | | 0.00 | % | | | | 0.00 | % | | | | 0.00 | %4 | | | | 0.00 | % | | | | 0.00 | % | | | | 0.00 | % |
| | | | | | | | | | | | | | | | | | | | | | | | | | | | | | |
Net investment income | | | | 2.93 | % | | | | 3.65 | % | | | | 2.79 | %4 | | | | 4.27 | % | | | | 5.28 | % | | | | 4.49 | % |
| | | | | | | | | | | | | | | | | | | | | | | | | | | | | | |
Supplemental Data | | | | | | | | | | | | | | | | | | | | | | | | | | | | | | |
Net assets, end of period (000) | | | $ | 177,913 | | | | $ | 142,984 | | | | $ | 87,109 | | | | $ | 59,843 | | | | $ | 43,521 | | | | $ | 29,947 | |
| | | | | | | | | | | | | | | | | | | | | | | | | | | | | | |
Portfolio turnover | | | | 131 | %5 | | | | 117 | %6 | | | | 22 | % | | | | 71 | %7 | | | | 53 | % | | | | 52 | % |
| | | | | | | | | | | | | | | | | | | | | | | | | | | | | | |
| | 1 | Based on average shares outstanding. |
| | 2 | Where applicable, total investment returns include the reinvestments of dividends and distributions. |
| | 3 | Aggregate total investment return. |
| | 5 | Includes mortgage dollar roll transactions; excluding these transactions the portfolio turnover would have been 105%. |
| | 6 | Includes mortgage dollar roll transactions; excluding these transactions the portfolio turnover would have been 114%. |
| | 7 | Includes TBA transactions; excluding these transactions the portfolio turnover would have been 69%. |
See Notes to Financial Statements.
| | | | | | |
| | | BLACKROCK BOND ALLOCATION TARGET SHARES | | MARCH 31, 2011 | | 41 |
Notes to Financial Statements
1. Organization and Significant Accounting Policies:
BlackRock Bond Allocation Target Shares (the “Trust”) is registered under the Investment Company Act of 1940, as amended (the “1940 Act”), as a non-diversified, open-end management investment company. The Trust is organized as a Delaware statutory trust. As of March 31, 2011, the Trust has 5 series, of which BlackRock Bond Allocation Target Shares Series C Portfolio (“Series C”), BlackRock Bond Allocation Target Shares Series M Portfolio (“Series M”) BlackRock Bond Allocation Target Shares Series N Portfolio (“Series N”) and BlackRock Bond Allocation Target Shares Series S Portfolio (“Series S”) (collectively the “Funds” or individually as a “Fund”) are included in these financial statements. The Funds’ financial statements are prepared in conformity with accounting principles generally accepted in the United States of America (“US GAAP”), which may require management to make estimates and assumptions that affect the reported amounts and disclosures in the financial statements. Actual results could differ from those estimates.
Shares of the Funds are offered to separate account clients of the investment advisor or certain of its affiliates. Participants in wrap-fee programs pay a single aggregate fee to the program sponsor for all costs and expenses of the wrap-fee programs including investment advice and portfolio execution.
On March 18, 2011, the Trust’s Board of Trustees (the “Board”) approved a proposal to close Series N to new investors and liquidate Series N. Effective April 25, 2011, Series N no longer accepted orders from new investors or existing shareholders to purchase Series N shares.
The following is a summary of significant accounting policies followed by the Funds:
Valuation: US GAAP defines fair value as the price the Funds would receive to sell an asset or pay to transfer a liability in an orderly transaction between market participants at the measurement date. The Funds fair value their financial instruments at market value using independent dealers or pricing services under policies approved by the Board. The Funds value their bond investments on the basis of last available bid prices or current market quotations provided by dealers or pricing services. In determining the value of a particular investment, pricing services may use certain information with respect to transactions in such investments, quotations from dealers, pricing matrixes, market transactions in comparable investments, various relationships observed in the market between investments and calculated yield measures. Asset-backed and mortgage-backed securities are valued by independent pricing services using models that consider estimated cash flows of each tranche of the security, establish a benchmark yield and develop an estimated tranche specific spread to the benchmark yield based on the unique attributes of the tranche. Municipal investments (including commitments to purchase such investments on a “when-issued” basis) are valued on the basis of prices provided by dealers or pricing services. Financial futures contracts traded on exchanges are valued at their last sale price. Swap agreements are valued utilizing quotes received daily by the Funds’ pricing service or through brokers, which are derived using daily swap curves and models that incorporate a number of market data factors, such as discounted cash flows, and trades and values of the underlying reference instruments. TBA commitments are valued on the basis of last available bid prices or current market quotations provided by pricing services. Short-term securities with remaining maturities of 60 days or less may be valued at amortized cost, which approximates fair value. Investments in open-end registered investment companies are valued at net asset value each business day.
Exchange-traded options are valued at the mean between the last bid and ask prices at the close of the options market in which the options trade. An exchange-traded option for which there is no mean price is valued at the last bid (long positions) or ask (short positions) price. If no bid or ask price is available, the prior day’s price will be used, unless it is determined that the prior day’s price no longer reflects the fair value of the option. Over-the-counter (“OTC”) options and swaptions are valued by an independent pricing service using a mathematical model which incorporates a number of market data factors, such as the trades and prices of the underlying instruments.
In the event that application of these methods of valuation results in a price for an investment which is deemed not to be representative of the market value of such investment or is not available, the investment will be valued in accordance with a policy approved by the Board as reflecting fair value (“Fair Value Assets”). When determining the price for Fair Value Assets, the investment advisor seeks to determine the price that each Fund might reasonably expect to receive from the current sale of that asset in an arm’s-length transaction. Fair value determinations shall be based upon all available factors that the investment advisor deems relevant. The pricing of all Fair Value Assets is subsequently reported to the Board or a committee thereof.
Asset-Backed and Mortgage-Backed Securities: The Funds may invest in asset-backed securities. Asset-backed securities are generally issued as pass-through certificates, which represent undivided fractional ownership interests in an underlying pool of assets, or as debt instruments, which are also known as collateralized obligations, and are generally issued as the debt of a special purpose entity organized solely for the purpose of owning such assets and issuing such debt. Asset-backed securities are often backed by a pool of assets representing the obligations of a number of different parties. The yield characteristics of certain asset-backed securities may differ from traditional debt securities. One such major difference is that all or a principal part of the obligations may be prepaid at any time because the underlying assets (i.e., loans) may be prepaid at any time. As a result, a decrease in interest rates in the market may result in increases in the level of prepayments as borrowers, particularly mortgagors, refinance and repay their loans. An increased prepayment rate with respect to an asset-backed security subject to such a prepayment feature will have the effect of shortening the maturity of the security. If a Fund has purchased such an asset-backed security at a premium, a faster than anticipated prepayment rate could result in a loss of principal to the extent of the premium paid.
| | | | | | |
| 42 | | BLACKROCK BOND ALLOCATION TARGET SHARES | | MARCH 31, 2011 | | |
Notes to Financial Statements (continued)
The Funds may purchase certain mortgage pass-through securities. There are a number of important differences among the agencies and instrumentalities of the US government that issue mortgage-related securities and among the securities that they issue. For example, mortgage-related securities guaranteed by Ginnie Mae are guaranteed as to the timely payment of principal and interest by Ginnie Mae and such guarantee is backed by the full faith and credit of the United States. However, mortgage-related securities issued by Freddie Mac and Fannie Mae, including Freddie Mac and Fannie Mae guaranteed Mortgage Pass-Through Certificates, which are solely the obligations of Freddie Mac and Fannie Mae, are not backed by or entitled to the full faith and credit of the United States and are supported by the right of the issuer to borrow from the Treasury.
Multiple Class Pass-Through Securities: The Funds may invest in multiple class pass-through securities, including collateralized mortgage obligations (“CMOs”) and commercial mortgage-backed securities. These multiple class securities may be issued by Ginnie Mae, US government agencies or instrumentalities or by trusts formed by private originators of, or investors in, mortgage loans. In general, CMOs are debt obligations of a legal entity that are collateralized by, and multiple class pass-through securities represent direct ownership interests in, a pool of residential or commercial mortgage loans or mortgage pass-through securities (the “Mortgage Assets”), the payments on which are used to make payments on the CMOs or multiple pass-through securities. Classes of CMOs include interest only (“IOs”), principal only (“POs”), planned amortization classes and targeted amortization classes. IOs and POs are stripped mortgage-backed securities representing interests in a pool of mortgages, the cash flow from which has been separated into interest and principal components. IOs receive the interest portion of the cash flow while POs receive the principal portion. IOs and POs can be extremely volatile in response to changes in interest rates. As interest rates rise and fall, the value of IOs tends to move in the same direction as interest rates. POs perform best when prepayments on the underlying mortgages rise since this increases the rate at which the principal is returned and the yield to maturity on the PO. When payments on mortgages underlying a PO are slower than anticipated, the life of the PO is lengthened and the yield to maturity is reduced. If the underlying mortgage assets experience greater than anticipated pre-payments of principal, the Funds may not fully recoup their initial investments in IOs.
Capital Trusts: The Funds may invest in capital trusts. These securities are typically issued by corporations, generally in the form of interest-bearing notes with preferred securities characteristics, or by an affiliated business trust of a corporation, generally in the form of beneficial interests in subordinated debentures or similarly structured securities. The securities can be structured as either fixed or adjustable coupon securities that can have either a perpetual or stated maturity date. Dividends can be deferred without creating an event of default or acceleration, although maturity cannot take place unless all cumulative payment obligations have been met. The deferral of payments does not affect the purchase or sale of these securities in the open market. Payments on these securities are treated as interest rather than dividends for federal income tax purposes. These securities generally are rated below that of the issuing company’s senior debt securities.
Forward Commitments and When-Issued Delayed Delivery Securities: The Funds may purchase securities on a when-issued basis and may purchase or sell securities on a forward commitment basis. Settlement of such transactions normally occurs within a month or more after the purchase or sale commitment is made. The Funds may purchase securities under such conditions with the intention of actually acquiring them, but may enter into a separate agreement to sell the securities before the settlement date. Since the value of securities purchased may fluctuate prior to settlement, the Funds may be required to pay more at settlement than the security is worth. In addition, the Funds are not entitled to any of the interest earned prior to settlement. When purchasing a security on a delayed delivery basis, the Funds assume the rights and risks of ownership of the security, including the risk of price and yield fluctuations. In the event of default by the counterparty, the Funds’ maximum amount of loss is the unrealized appreciation of unsettled when-issued transactions, which is shown in the Schedules of Investments, if any.
Inflation-Indexed Bonds: The Funds may invest in inflation-indexed bonds. Inflation-indexed bonds are fixed income securities whose principal value is periodically adjusted according to the rate of inflation. If the index measuring inflation rises or falls, the principal value of inflation-indexed bonds will be adjusted upward or downward, and consequently the interest payable on these securities (calculated with respect to a larger or smaller principal amount) will be increased or reduced, respectively. Repayment of the original bond principal upon maturity (as adjusted for inflation) is guaranteed in the case of US Treasury inflation-indexed bonds. For bonds that do not provide a similar guarantee, the adjusted principal value of the bond repaid at maturity may be less than the original principal.
TBA Commitments: The Funds may enter into TBA commitments. TBA commitments are forward agreements for the purchase or sale of mortgage-backed securities for a fixed price, with payment and delivery on an agreed upon future settlement date. The specific securities to be delivered are not identified at the trade date; however, delivered securities must meet specified terms, including issuer, rate and mortgage terms. The Funds generally enter into TBA commitments with the intent to take possession of or deliver the underlying mortgage-backed securities but can extend the settlement or roll the transaction. TBA commitments involve a risk of loss if the value of the security to be purchased or sold declines or increases, respectively, prior to settlement date.
Mortgage Dollar Roll Transactions: The Funds may sell TBA mortgage-backed securities and simultaneously contract to repurchase substantially similar (same type, coupon and maturity) securities on a specific future date at an agreed-upon price. During the period between the sale and repurchase, the Funds will not be entitled to receive interest and principal payments on the securities sold. The Funds account for dollar roll transactions as purchases and sales and realize gains and losses on these transactions. These transactions may increase the Funds’ portfolio
| | | | | | |
| | | BLACKROCK BOND ALLOCATION TARGET SHARES | | MARCH 31, 2011 | | 43 |
Notes to Financial Statements (continued)
turnover rate. Mortgage dollar rolls involve the risk that the market value of the securities that the Funds are required to purchase may decline below the agreed upon repurchase price of those securities.
Treasury Roll Transactions: The Funds may enter into treasury roll transactions. In a treasury roll transaction, the Fund sells a Treasury security to a counterparty with a simultaneous agreement to repurchase the same security at an agreed upon price and future settlement date. The Fund receives cash from the sale of the Treasury security to use for other investment purposes. For US GAAP purposes, a treasury roll transaction is accounted for as a secured borrowing and not as a purchase or sale. The difference between the sale price and repurchase price represents net interest income or net interest expense reflective of an agreed upon rate between the Fund and the counterparty over the term of the borrowing. The Fund will benefit from the transaction if the income earned on the investment purchased with the cash received in the treasury roll transaction exceeds the interest expense incurred by the Fund. If the interest expense exceeds the income earned, the Fund’s net investment income and dividends to shareholders may be adversely impacted. Treasury roll transactions involve the risk that the market value of the securities that the Fund is required to repurchase may decline below the agreed upon repurchase price of those securities.
Reverse Repurchase Agreements: The Funds may enter into reverse repurchase agreements with qualified third party broker-dealers. In a reverse repurchase agreement, the Funds sell securities to a bank or broker-dealer and agree to repurchase the same securities at a mutually agreed upon date and price. Certain agreements have no stated maturity and can be terminated by either party at any time. Interest on the value of the reverse repurchase agreements issued and outstanding is based upon competitive market rates determined at the time of issuance. The Funds may utilize reverse repurchase agreements when it is anticipated that the interest income to be earned from the investment of the proceeds of the transaction is greater than the interest expense of the transaction. Reverse repurchase agreements involve leverage risk and also the risk that the market value of the securities that the Funds are obligated to repurchase under the agreement may decline below the repurchase price. In the event the buyer of securities under a reverse repurchase agreement files for bankruptcy or becomes insolvent, the Funds’ use of the proceeds of the agreement may be restricted while the other party, or its trustee or receiver, determines whether or not to enforce the Funds’ obligation to repurchase the securities.
Municipal Bonds Transferred to TOBs: Series N leverages its assets through the use of TOBs. A TOB is established by a third party sponsor forming a special purpose entity, into which one or more funds, or an agent on behalf of the funds, transfers municipal bonds. Other funds managed by the investment advisor may also contribute municipal bonds to a TOB into which Series N has contributed bonds. A TOB typically issues two classes of beneficial interests: short-term floating rate certificates, which are sold to third party investors, and residual certificates (“TOB Residuals”), which are generally issued to the participating funds that made the transfer. The TOB Residuals held by Series N include the right of Series N (1) to cause the holders of a proportional share of the short-term floating rate certificates to tender their certificates at par, including during instances of a rise in short-term interest rates, and (2) to transfer, within seven days, a corresponding share of the municipal bonds from the TOB to Series N. The TOB may also be terminated without the consent of Series N upon the occurrence of certain events as defined in the TOB agreements. Such termination events may include the bankruptcy or default of the municipal bond, a substantial downgrade in credit quality of the municipal bond, the inability of the TOB to obtain quarterly or annual renewal of the liquidity support agreement, a substantial decline in the market value of the municipal bond or the inability to remarket the short-term floating rate certificates to third party investors. During the year ended March 31, 2011, no TOBs that the Fund participated in were terminated without the consent of the Trusts.
The cash received by the TOB from the sale of the short-term floating rate certificates, less transaction expenses, is paid to Series N, which typically invests the cash in additional municipal bonds. Series N’s transfer of the municipal bonds to a TOB is accounted for as a secured borrowing, therefore the municipal bonds deposited into a TOB are presented in the Series N’s Schedule of Investments and the proceeds from the issuance of the short-term floating rate certificates are shown as trust certificates in the Statements of Assets and Liabilities.
Interest income, including amortization and accretion of premiums and discounts, from the underlying municipal bonds is recorded by Series N on an accrual basis. Interest expense incurred on the secured borrowing and other expenses related to remarketing, administration and trustee services to a TOB are shown as interest expense and fees in the Statements of Operations. The short-term floating rate certificates have interest rates that generally reset weekly and their holders have the option to tender certificates to the TOB for redemption at par at each reset date. At March 31, 2011, there were no underlying municipal bonds transferred to TOBs.
Zero-Coupon Bonds: The Funds may invest in zero-coupon bonds, which are normally issued at a significant discount from face value and do not provide for periodic interest payments. Zero-coupon bonds may experience greater volatility in market value than similar maturity debt obligations which provide for regular interest payments.
Segregation and Collateralization: In cases in which the 1940 Act and the interpretive positions of the Securities and Exchange Commission (“SEC”) require that a Fund either delivers collateral or segregates assets in connection with certain investments (e.g., dollar rolls, TBA sale commitments, financial futures contracts, swaps and options written), or certain borrowings (e.g., reverse repurchase agreements, treasury roll transactions and loan payable), each Fund will, consistent with SEC rules and/or certain interpretive letters issued by the SEC, segregate collateral or designate on its books and records cash or other liquid securities having a market value at least equal to the amount that would otherwise
| | | | | | |
| 44 | | BLACKROCK BOND ALLOCATION TARGET SHARES | | MARCH 31, 2011 | | |
Notes to Financial Statements (continued)
be required to be physically segregated. Furthermore, based on requirements and agreements with certain exchanges and third party broker-dealers, each party has requirements to deliver/deposit securities as collateral for certain investments.
Investment Transactions and Investment Income: For financial reporting purposes, investment transactions are recorded on the dates the transactions are entered into (the trade dates). Realized gains and losses on investment transactions are determined on the identified cost basis. Dividend income is recorded on the ex-dividend dates. Interest income, including amortization and accretion of premiums and discounts on debt securities, is recognized on the accrual basis.
Dividends and Distributions: Dividends from net investment income are declared daily and paid monthly. Distributions of capital gains are recorded on the ex-dividend dates. The amount and timing of dividends and distributions are determined in accordance with federal income tax regulations, which may differ from US GAAP.
Income Taxes: It is the Funds’ policy to comply with the requirements of the Internal Revenue Code of 1986, as amended, applicable to regulated investment companies and to distribute substantially all of their taxable income to their shareholders. Therefore, no federal income tax provision is required.
The Funds file US federal and various state and local tax returns. No income tax returns are currently under examination. The statute of limitations on the Series C, Series M and Series S US federal tax returns remains open for each of the two years ended September 30, 2008 and for each of the three periods ended March 31, 2011. The statute of limitations on the Series N US federal tax returns remains open for each of the three periods ended March 31, 2011. The statutes of limitations on each Fund’s state and local tax returns may remain open for an additional year depending upon the jurisdiction. Management does not believe there are any uncertain tax positions that require recognition of a tax liability.
Other: Expenses directly related to a Fund are charged to that Fund. Other operating expenses shared by several funds are pro rated among those funds on the basis of relative net assets or other appropriate methods.
The Funds have an arrangement with the custodian whereby fees may be reduced by credits earned on uninvested cash balances, which if applicable are shown as fees paid indirectly in the Statements of Operations. The custodian imposes fees on overdrawn cash balances, which can be offset by accumulated credits earned or may result in additional custody charges.
2. Derivative Financial Instruments:
The Funds engage in various portfolio investment strategies using derivative contracts both to increase the returns of the Funds and to economically hedge, or protect, their exposure to certain risks such as credit risk or interest rate risk. These contracts may be transacted on an exchange or OTC.
Losses may arise if the value of the contract decreases due to an unfavorable change in the market rates or values of the underlying instrument or if the counterparty does not perform under the contract. The Funds’ maximum risk of loss from counterparty credit risk on OTC derivatives is generally the aggregate unrealized gain netted against any collateral pledged by/posted to the counterparty. For OTC options purchased, the Funds bear the risk of loss in the amount of the premiums paid plus the positive change in market values net of any collateral received on the options should the counterparty fail to perform under the contracts. Options written by the Funds do not give rise to counterparty credit risk, as options written obligate the Funds to perform and not the counterparty. Counterparty risk related to exchange-traded financial futures contracts and options is deemed to be minimal due to the protection against defaults provided by the exchange on which these contracts trade.
The Funds may mitigate counterparty risk by procuring collateral and through netting provisions included within an International Swaps and Derivatives Association, Inc. (“ISDA”) Master Agreement implemented between a Fund and each of its respective counterparties. The ISDA Master Agreement allows each Fund to offset with each separate counterparty certain derivative financial instrument’s payables and/or receivables with collateral held. The amount of collateral moved to/from applicable counterparties is generally based upon minimum transfer amounts of up to $500,000. To the extent amounts due to the Funds from their counterparties are not fully collateralized contractually or otherwise, the Funds bear the risk of loss from counterparty nonperformance. See Note 1 “Segregation and Collateralization” for information with respect to collateral practices. In addition, the Funds manage counterparty risk by entering into agreements only with counterparties that they believe have the financial resources to honor their obligations and by monitoring the financial stability of those counterparties.
Certain ISDA Master Agreements allow counterparties to OTC derivatives to terminate derivative contracts prior to maturity in the event the Funds’ net assets decline by a stated percentage or the Funds fail to meet the terms of its ISDA Master Agreements, which would cause the Funds to accelerate payment of any net liability owed to the counterparty.
Financial Futures Contracts: The Funds purchase or sell financial futures contracts and options on financial futures contracts to gain exposure to, or economically hedge against, changes in interest rates (interest rate risk). Financial futures contracts are agreements between a Fund and counterparty to buy or sell a specific quantity of an underlying instrument at a specified price and at a specified date. Depending on the terms of the particular contract, futures contracts are settled either through physical delivery of the underlying instrument on the settlement date or by payment of a cash settlement amount on settlement date. Pursuant to the contract, the Funds agree to receive from or pay to the broker an amount of cash equal to the daily fluctuation in value of the
| | | | | | |
| | | BLACKROCK BOND ALLOCATION TARGET SHARES | | MARCH 31, 2011 | | 45 |
Notes to Financial Statements (continued)
contract. Such receipts or payments are known as margin variation and are recorded by the Funds as unrealized appreciation or depreciation. When the contract is closed, the Funds record a realized gain or loss equal to the difference between the value of the contract at the time it was opened and the value at the time it was closed. The use of financial futures contracts involves the risk of an imperfect correlation in the movements in the price of financial futures contracts, interest rates and the underlying assets.
Options: Series C and Series S purchase and write call and put options to increase or decrease their exposure to underlying instruments (including interest rate risk) and/or, in the case of options written, to generate gains from options premiums. A call option gives the purchaser of the option the right (but not the obligation) to buy, and obligates the seller to sell (when the option is exercised), the underlying instrument at the exercise price at any time or at a specified time during the option period. A put option gives the holder the right to sell and obligates the writer to buy the underlying instrument at the exercise price at any time or at a specified time during the option period. When a Fund purchases (writes) an option, an amount equal to the premium paid (received) by a Fund is reflected as an asset (liability). The amount of the asset (liability) is subsequently marked-to-market to reflect the current market value of the option purchased (written). When an instrument is purchased or sold through an exercise of an option, the related premium paid (or received) is added to (or deducted from) the basis of the instrument acquired or deducted from (or added to) the proceeds of the instrument sold. When an option expires (or a Fund enters into a closing transaction), a Fund realizes a gain or loss on the option to the extent of the premiums received or paid (or gain or loss to the extent the cost of the closing transaction exceeds the premiums received or paid). When a Fund writes a call option, such option is “covered,” meaning that a Fund holds the underlying instrument subject to being called by the option counterparty. When a Fund writes a put option, such option is covered by cash in an amount sufficient to cover the obligation.
Options on swaps (swaptions) are similar to options on securities except that instead of selling or purchasing the right to buy or sell a security, the writer or purchaser of the swap option is granting or buying the right to enter into a previously agreed upon interest rate or credit default swap agreement (interest rate risk and/or credit risk) at any time before the expiration of the option.
In purchasing and writing options, a Fund bears the risk of an unfavorable change in the value of the underlying instrument or the risk that a Fund may not be able to enter into a closing transaction due to an illiquid market. Exercise of a written option could result in a Fund purchasing or selling a security at a price different from the current market value.
Swaps: Series C and Series S enter into swap agreements, in which a Fund and a counterparty agree to make periodic net payments on a specified notional amount. These periodic payments received or made by a Fund is recorded in the Statements of Operations as realized gains or losses, respectively. Any upfront fees paid are recorded as assets and any upfront fees received are recorded as liabilities and amortized over the term of the swap. Swaps are marked-to-market daily and changes in value are recorded as unrealized appreciation (depreciation). When the swap is terminated, a Fund will record a realized gain or loss equal to the difference between the proceeds from (or cost of) the closing transaction and a Fund’s basis in the contract, if any. Generally, the basis of the contracts is the premium received or paid. Swap transactions involve, to varying degrees, elements of interest rate, credit and market risk in excess of the amounts recognized in the Statements of Assets and Liabilities. Such risks involve the possibility that there will be no liquid market for these agreements, that the counterparty to the agreements may default on its obligation to perform or disagree as to the meaning of the contractual terms in the agreements, and that there may be unfavorable changes in interest rates and/or market values associated with these transactions.
| | • | | Credit default swaps – Series S enters into credit default swaps to manage its exposure to the market or certain sectors of the market, to reduce its risk exposure to defaults of corporate and/or sovereign issuers or to create exposure to corporate and/or sovereign issuers to which it is not otherwise exposed (credit risk). A Fund enters into credit default swap agreements to provide a measure of protection against the default of an issuer (as buyer of protection) and/or gain credit exposure to an issuer to which it is not otherwise exposed (as seller of protection). A Fund may either buy or sell (write) credit default swaps on single-name issuers (corporate or sovereign), a combination or basket of single-name issuers or traded indexes. Credit default swaps on single-name issuers are agreements in which the buyer pays fixed periodic payments to the seller in consideration for a guarantee from the seller to make a specific payment should a negative credit event take place with respect to the referenced entity (e.g., bankruptcy, failure to pay, obligation accelerators, repudiation, moratorium or restructuring). Credit default swaps on traded indexes are agreements in which the buyer pays fixed periodic payments to the seller in consideration for a guarantee from the seller to make a specific payment should a write-down, principal or interest shortfall or default of all or individual underlying securities included in the index occurs. As a buyer, if an underlying credit event occurs, a Fund will either receive from the seller an amount equal to the notional amount of the swap and deliver the referenced security or underlying securities comprising the index or receive a net settlement of cash equal to the notional amount of the swap less the recovery value of the security or underlying securities comprising the index. As a seller (writer), if an underlying credit event occurs, a Fund will either pay the buyer an amount equal to the notional amount of the swap and take delivery of the referenced security or underlying securities comprising the index or pay a net settlement of cash equal to the notional amount of the swap less the recovery value of the security or underlying securities comprising the index. |
| | • | | Interest rate swaps – Series C and Series S enter into interest rate swaps to gain or reduce exposure to or manage duration, the yield curve or interest rate risk by economically hedging the value of the |
| | | | | | |
| 46 | | BLACKROCK BOND ALLOCATION TARGET SHARES | | MARCH 31, 2011 | | |
Notes to Financial Statements (continued)
| | fixed rate bonds which may decrease when interest rates rise (interest rate risk). Interest rate swaps are agreements in which one party pays a stream of interest payments, either fixed or floating rate, for another party’s stream of interest payments, either fixed or floating, on the same notional amount for a specified period of time. In more complex swaps, the notional principal amount may decline (or amortize) over time. |
Derivative Instruments Categorized by Risk Exposure:
|
Fair Values of Derivative Instruments as of March 31, 2011 |
| | | | | | | | | | | | | | | | | | | | |
| | | Asset Derivatives | | | | | | |
| | | Statements of Assets and Liabilities
Location | | Series C | | Series M | | Series S |
| | | | Net unrealized appreciation/ | | | | | | | | | | | | | | | | |
| | | | depreciation*; Unrealized | | | | | | | | | | | | | | | | |
| | | | appreciation on swaps; | | | | | | | | | | | | | | | | |
| | | | | | | | | | | | | | | | | | | | |
Interest rate contracts | | | | Investments at value** | | | | $ | 1,061,146 | | | | $ | 340,553 | | | | $ | 171,846 | |
| | | | | | | | | | | | | | | | | | | | |
| | | | |
| | | Liability Derivatives | | | | | | |
| | | Statements of Assets and Liabilities
Location | | Series C | | Series M | | Series S |
| | | | Net unrealized appreciation/ | | | | | | | | | | | | | | | | |
| | | | depreciation*; Unrealized | | | | | | | | | | | | | | | | |
| | | | depreciation on swaps; Options | | | | | | | | | | | | | | | | |
Interest rate contracts | | | | written at value | | | | $ | 1,417,008 | | | | $ | 195,974 | | | | $ | 39,563 | |
Credit contracts | | | | Unrealized depreciation on swaps | | | | | 17,505 | | | | | – | | | | | 12,867 | |
| | | | | | | | | | | | | | | | | | | | |
Total | | | | | | | | $ | 1,434,513 | | | | $ | 195,974 | | | | $ | 52,430 | |
| | | | | | | | | | | | | | | | | | | | |
| | * | Includes cumulative appreciation/depreciation on financial futures contracts as reported in the Schedules of Investments. Only current day’s margin variation is reported within the Statements of Assets and Liabilities. |
| | ** | Includes options purchased at value as reported in the Schedules of Investments. |
| | | | | | | | | | | | | | | | | | | | |
The Effect of Derivative Instruments in the Statements of Operations Year Ended March 31, 2011 |
Net Realized Gain (Loss) from |
| | | Series C | | Series M | | Series N | | Series S |
Interest rate contracts: | | | | | | | | | | | | | | | | | | | | |
Financial futures contracts | | | $ | (2,845,062 | ) | | | $ | 6,937,277 | | | | $ | 636 | | | | $ | 518,735 | |
Swaps | | | | (304,397 | ) | | | | – | | | | | – | | | | | (78,693 | ) |
Options** | | | | 33,538 | | | | | – | | | | | – | | | | | 7,965 | |
Credit contracts: | | | | | | | | | | | | | | | | | | | | |
Swaps | | | | 64,836 | | | | | – | | | | | – | | | | | (22,153 | ) |
Options** | | | | (36,226 | ) | | | | – | | | | | – | | | | | 20,191 | |
| | | | | | | | | | | | | | | | | | | | |
Total | | | $ | (3,087,311 | ) | | | $ | 6,937,277 | | | | $ | 636 | | | | $ | 446,045 | |
| | | | | | | | | | | | | | | | | | | | |
| | | | | | | | | | | | | | | |
Net Change in Unrealized Appreciation/Depreciation on |
| | | Series C | | Series M | | Series S |
Interest rate contracts: | | | | | | | | | | | | | | | |
Financial futures contracts | | | $ | 64,048 | | | | $ | 401,472 | | | | $ | 189,598 | |
Swaps | | | | 519,213 | | | | | – | | | | | (19,402 | ) |
Options** | | | | 45,730 | | | | | – | | | | | 256 | |
Credit contracts: | | | | | | | | | | | | | | | |
Swaps | | | | (17,505 | ) | | | | – | | | | | (4,571 | ) |
| | | | | | | | | | | | | | | |
Total | | | $ | 611,486 | | | | $ | 401,472 | | | | $ | 165,881 | |
| | | | | | | | | | | | | | | |
| | ** | Options purchased are included in the net realized gain (loss) from investments and net change in unrealized appreciation/depreciation on investments. |
| | | | | | |
| | | BLACKROCK BOND ALLOCATION TARGET SHARES | | MARCH 31, 2011 | | 47 |
Notes to Financial Statements (continued)
For the year ended March 31, 2011, the average quarterly balance of outstanding derivative financial instruments were as follows:
| | | | | | | | | | | | | | | | | | | | |
| | | Series C | | Series M | | Series N | | Series S |
Financial futures contracts: | | | | | | | | | | | | | | | | | | | | |
Average number of contracts purchased | | | | 380 | | | | | 1,347 | | | | | – | | | | | 458 | |
Average number of contracts sold | | | | 245 | | | | | 154 | | | | | 1 | | | | | 94 | |
Average notional value of contracts purchased | | | $ | 71,231,592 | | | | $ | 179,510,127 | | | | | – | | | | $ | 99,753,900 | |
Average notional value of contracts sold | | | $ | 30,144,095 | | | | $ | 25,525,008 | | | | $ | 30,461 | | | | $ | 11,096,594 | |
Options: | | | | | | | | | | | | | | | | | | | | |
Average number of option contracts purchased | | | | 1 | | | | | – | | | | | – | | | | | 1 | |
Average number of option contracts written | | | | 1 | | | | | – | | | | | – | | | | | 1 | |
Average notional value of option contracts purchased | | | | 24,838,281 | | | | | – | | | | | – | | | | | 3,777 | |
Average notional value of option contracts written | | | | 12,524,219 | | | | | – | | | | | – | | | | | 2,640,469 | |
Average number of swaption contracts purchased | | | | 1 | | | | | – | | | | | – | | | | | – | |
Average number of swaption contracts written | | | | 1 | | | | | – | | | | | – | | | | | 1 | |
Average notional value of swaption contracts purchased | | | | 11,325,000 | | | | | – | | | | | – | | | | | – | |
Average notional value of swaption contracts written | | | | 10,000,000 | | | | | – | | | | | – | | | | | 2,265,000 | |
Credit default swaps: | | | | | | | | | | | | | | | | | | | | |
Average number of contracts – buy protection | | | | 1 | | | | | – | | | | | – | | | | | 1 | |
Average notional value – buy protection | | | $ | 587,500 | | | | | – | | | | | – | | | | $ | 856,250 | |
Interest rate swaps: | | | | | | | | | | | | | | | | | | | | |
Average number of contracts – pays fixed rate | | | | 5 | | | | | – | | | | | – | | | | | 3 | |
Average number of contracts – receives fixed rate | | | | 2 | | | | | – | | | | | – | | | | | 2 | |
Average notional value – pays fixed rate | | | $ | 47,400,000 | | | | | – | | | | | – | | | | $ | 19,200,000 | |
Average notional value – receives fixed rate | | | $ | 17,750,000 | | | | | – | | | | | – | | | | $ | 10,600,000 | |
3. Investment Advisory Agreement and Other Transactions with Affiliates:
The PNC Financial Services Group, Inc. (“PNC”), Bank of America Corporation (“BAC”) and Barclays Bank PLC (“Barclays”) are the largest stockholders of BlackRock, Inc. (“BlackRock”). Due to the ownership structure, PNC is an affiliate of the Funds for 1940 Act purposes, but BAC and Barclays are not.
The Trust, on behalf of the Funds, entered into an Investment Advisory Agreement with BlackRock Advisors, LLC (the “Manager”), the Funds’ investment advisor, an indirect, wholly owned subsidiary of BlackRock, to provide investment advisory services.
The Manager benefits from the Trust being an investment option in a wrap program for which affiliates of the Manager receive fees. The Manager is contractually obligated to pay expenses it incurs in providing advisory services to the Trust and will pay or reimburse the Trust for all of its direct expenses, except extraordinary expenses and interest expense. The Manager receives no advisory fee from the Trust under the Investment Advisory Agreement.
PFPC Trust Company (“PTC”), serves as custodian for each Fund. On July 1, 2010, The Bank of New York Mellon Corporation purchased PTC, which prior to this date was an indirect, wholly owned subsidiary of PNC and an affiliate of the Manager. For these services, the custodian receives a fee computed daily and payable monthly, based on a percentage of the average daily gross assets of each Fund. The fee is paid at the following annual rates: 0.005% of the first $400 million, 0.004% of the next $1.6 billion and 0.003% of average daily gross assets in excess of $2 billion; plus per transaction charges and other miscellaneous fees incurred on behalf of each Fund. For the year ended March 31, 2011, the Funds paid the following to affiliates in return for these services, which are included in custodian in the Statements of Operations:
| | | | | |
Series C | | | $ | 6,840 | |
Series M | | | $ | 7,196 | |
Series N | | | $ | 769 | |
Series S | | | $ | 5,169 | |
BNY Mellon Investment Servicing (US) Inc. (“BNYMIS”) (formerly PNC Global Investment Servicing (U.S.) Inc. (“PNCGIS”)), serves as transfer agent and dividend disbursing agent. On July 1, 2010, The Bank of New York Mellon Corporation purchased PNCGIS, which prior to this date was an indirect, wholly owned subsidiary of PNC and an affiliate of the Manager. For its services, BNYMIS receives an annual fee of $15,000 per Fund, plus transaction fees, per account fees and disbursements. For the year ended March 31, 2011, the Funds paid the following to affiliates in return for these services, which are included in transfer agent in the Statements of Operations:
| | | | | |
Series C | | | $ | 16,408 | |
Series M | | | $ | 16,385 | |
Series N | | | $ | 3,762 | |
Series S | | | $ | 5,192 | |
BNYMIS acts as administrator for the Trust. For these services, BNYMIS receives administration and accounting services fees computed daily and payable monthly, at the following annual rates: (a) for accounting services, (i) $12,000 for each Fund’s first $250 million in average daily net assets, $12,000 for each Fund’s next $500 million in average daily net assets and 0.0025% for each Fund’s average daily net assets in excess of $750 million, and (ii) $200 per Fund per month, plus $0.65 per cusip per day; (b) for administration services, 0.005% of each Fund’s average daily net assets; and (c) out-of-pocket expenses. For the year ended March 31, 2011, the Funds paid the following to affiliates in
| | | | | | |
| 48 | | BLACKROCK BOND ALLOCATION TARGET SHARES | | MARCH 31, 2011 | | |
Notes to Financial Statements (continued)
return for these services, which are included in administration in the Statements of Operations:
| | | | | |
Series C | | | $ | 20,691 | |
Series M | | | $ | 15,186 | |
Series N | | | $ | 5,556 | |
Series S | | | $ | 16,514 | |
As mentioned above, the Manager will reimburse the Trust for all such administration, custodian and transfer agent services.
Certain officers and/or trustees of the Trust are officers and/or directors of BlackRock or its affiliates. The Funds reimburse the Manager for compensation paid to the Trust’s Chief Compliance Officer.
4. Investments:
Purchases and sales of investments including paydowns, mortgage dollar roll and TBA transactions and excluding short-term securities and US government securities for the year ended March 31, 2011, were as follows:
| | | | | | | | | | |
| | | Purchases | | Sales |
Series C | | | $ | 140,956,272 | | | | $ | 206,260,257 | |
Series M | | | $ | 932,472,497 | | | | $ | 928,950,198 | |
Series N | | | $ | 1,704,364 | | | | $ | 4,473,626 | |
Series S | | | $ | 234,949,113 | | | | $ | 165,601,968 | |
Purchases and sales of US government securities for the year ended March 31, 2011, were as follows:
| | | | | | | | | | |
| | | Purchases | | Sales |
Series C | | | $ | 44,996,820 | | | | $ | 43,187,295 | |
Series M | | | $ | 119,934,736 | | | | $ | 122,176,756 | |
Series S | | | $ | 69,855,454 | | | | $ | 71,304,625 | |
Purchases and sales of mortgage dollar rolls for the year ended March 31, 2011, were as follows:
| | | | | | | | | | |
| | | Purchases | | Sales |
Series M | | | $ | 726,451,216 | | | | $ | 728,425,777 | |
Series S | | | $ | 46,566,883 | | | | $ | 46,704,742 | |
Transactions in options written for the year ended March 31, 2011, were as follows:
| | | | | | | | | | | | | | | | | | | | | | | | | |
| | | Series C |
| | | Calls | | Puts |
| | | Swaptions
Notional (000) | | Premiums
Received | | Option
Contracts | | Swaptions
Notional (000) | | Premiums
Received |
Outstanding options, beginning of year | | | | – | | | | | – | | | | | – | | | | | – | | | | | – | |
Options written | | | $ | 25,500 | | | | $ | 647,170 | | | | | 370 | | | | $ | 29,900 | | | | $ | 849,443 | |
Options expired | | | | (5,310 | ) | | | | (9,293 | ) | | | | – | | | | | (2,680 | ) | | | | (10,050 | ) |
Options closed | | | | (2,390 | ) | | | | (4,183 | ) | | | | (165 | ) | | | | (9,420 | ) | | | | (110,386 | ) |
| | | | | | | | | | | | | | | | | | | | | | | | | |
Outstanding options, end of year | | | $ | 17,800 | | | | $ | 633,694 | | | | | 205 | | | | $ | 17,800 | | | | $ | 729,007 | |
| | | | | | | | | | | | | | | | | | | | | | | | | |
| |
| | | Series S |
| | | Calls | | Puts |
| | | Swaptions
Notional (000) | | Premiums
Received | | Option
Contracts | | Swaptions
Notional (000) | | Premiums
Received |
Outstanding options, beginning of year | | | | – | | | | | – | | | | | 62 | | | | $ | 3,300 | | | | $ | 67,035 | |
Options written | | | $ | 4,530 | | | | $ | 7,928 | | | | | – | | | | | 4,530 | | | | | 16,988 | |
Options expired | | | | (3,170 | ) | | | | (5,550 | ) | | | | – | | | | | (4,900 | ) | | | | (58,847 | ) |
Options closed | | | | (1,360 | ) | | | | (2,378 | ) | | | | (62 | ) | | | | (2,930 | ) | | | | (25,176 | ) |
| | | | | | | | | | | | | | | | | | | | | | | | | |
Outstanding options, end of year | | | | – | | | | | – | | | | | – | | | | | – | | | | | – | |
| | | | | | | | | | | | | | | | | | | | | | | | | |
5. Borrowings:
For the year ended March 31, 2011, the average amount of borrowings and the daily weighted average interest rate, including fees, in TOBs were as follows:
| | | | | | | | | | |
| | | Average
Borrowings | | Daily
Weighted Average Interest
Rate |
Series N | | | $ | 200,000 | | | | | 0.29 | % |
For the year ended March 31, 2011, the Funds’ daily average amount of outstanding transactions considered as borrowings from reverse repurchase agreements and treasury roll transactions and the daily weighted average interest rate were approximately as follows:
| | | | | | | | | | |
| | | Average
Borrowings | | Daily
Weighted Average Interest
Rate |
Series C | | | $ | 2,901,316 | | | | | 0.40 | % |
Series M | | | $ | 191,607 | | | | | 0.04 | % |
Series S | | | $ | 15,373,137 | | | | | 0.36 | % |
The Funds, along with certain other funds managed by the Manager and its affiliates, are a party to a $500 million credit agreement with a group of lenders, which expired in November 2010. The Funds may borrow under the credit agreement to fund shareholder redemptions. Effective November 2009, the credit agreement had the following terms: 0.02% upfront fee on the aggregate commitment amount which was allocated to the Funds based on their net assets as of October 31, 2009, a commitment fee of 0.10% per annum based on the Funds’ pro rata share of the unused portion of the credit agreement and interest at a rate equal to the higher of (a) the one-month LIBOR plus 1.25% per annum and (b) the Fed Funds rate plus 1.25% per annum on amounts borrowed. In addition, the Funds paid administration and arrangement fees which were allocated to the Funds based on their net assets as of October 31, 2009. Effective November 2010, the credit agreement was renewed until November 2011 with the following terms: a commitment fee of 0.08% per annum based on the Funds’ pro rata share of the unused portion of the credit agreement and interest at a rate equal to the higher of (a) the one-month LIBOR plus 1.00% per annum and (b) the Fed Funds rate plus 1.00% per annum on amounts borrowed. In addition, the Funds paid administration and arrangement fees which were allocated to the Funds based on their net assets as of October 31, 2010.
| | | | | | |
| | | BLACKROCK BOND ALLOCATION TARGET SHARES | | MARCH 31, 2011 | | 49 |
Notes to Financial Statements (continued)
The Funds did not borrow under the credit agreement during the year ended March 31, 2011.
6. Income Tax Information:
Reclassifications: US GAAP requires that certain components of net assets be adjusted to reflect permanent differences between financial and tax reporting. These reclassifications have no effect on net assets or net asset values per share. The following permanent differences as of March 31, 2011 attributable to net paydowns losses, the accounting for swap agreements and amortization methods on fixed income securities and the classification of settlement proceeds were reclassified to the following accounts:
| | | | | | | | | | |
| | | Undistributed
(distributions
in excess of)
net investment
income | | Accumulated
net realized
gain (loss) |
Series C | | | $ | (160,332 | ) | | | $ | 160,332 | |
Series M | | | $ | 922,238 | | | | $ | (922,238 | ) |
Series N | | | $ | (1,083 | ) | | | $ | 1,083 | |
Series S | | | $ | 230,001 | | | | $ | (230,001 | ) |
The tax character of distributions paid during the fiscal years ended March 31, 2011 and March 31, 2010 was as follows:
| | | | | | | | | | | | | | | | | | | | |
| | | Series C | | Series M | | Series N | | Series S |
Tax-exempt income | | | | | | | | | | | | | | | | | | | | |
3/31/11 | | | | – | | | | | – | | | | $ | 596,193 | | | | | – | |
3/31/10 | | | | – | | | | | – | | | | $ | 562,159 | | | | | – | |
Ordinary income | | | | | | | | | | | | | | | | | | | | |
3/31/11 | | | $ | 17,698,037 | | | | $ | 11,332,263 | | | | $ | 29,594 | | | | $ | 7,272,709 | |
3/31/10 | | | $ | 20,663,733 | | | | $ | 15,669,386 | | | | $ | 2,585 | | | | $ | 4,836,083 | |
Long-term capital gain | | | | | | | | | | | | | | | | | | | | |
3/31/11 | | | | – | | | | | – | | | | | – | | | | $ | 1,198,404 | |
3/31/10 | | | | – | | | | | – | | | | | – | | | | $ | 75,650 | |
Total distributions | | | | | | | | | | | | | | | | | | | | |
3/31/11 | | | $ | 17,698,037 | | | | $ | 11,332,263 | | | | $ | 625,787 | | | | $ | 8,471,113 | |
3/31/10 | | | $ | 20,663,733 | | | | $ | 15,669,386 | | | | $ | 564,744 | | | | $ | 4,911,733 | |
As of March 31, 2011, the tax components of accumulated net earnings (losses) were as follows:
| | | | | | | | | | | | | | | | | | | | |
| | | Series C | | Series M | | Series N | | Series S |
Undistributed tax-exempt income | | | | – | | | | | – | | | | $ | 617 | | | | | – | |
Undistributed ordinary income | | | | – | | | | $ | 49,435 | | | | | 847 | | | | $ | 114,042 | |
Undistributed long-term capital gains | | | | – | | | | | – | | | | | – | | | | | 43,101 | |
Capital loss carryforwards | | | $ | (12,921,631 | ) | | | | (12,583,025 | ) | | | | (197,311 | ) | | | | – | |
Net unrealized gains (losses)* | | | | 12,827,121 | | | | | (1,623,724 | ) | | | | (77,602 | ) | | | | 1,524,205 | |
| | | | | | | | | | | | | | | | | | | | |
Total | | | $ | (94,510 | ) | | | $ | (14,157,314 | ) | | | $ | (273,449 | ) | | | $ | 1,681,348 | |
| | | | | | | | | | | | | | | | | | | | |
| | * | The differences between book-basis and tax-basis net unrealized gains (losses) were attributable primarily to amortization methods for premiums and discounts on fixed income securities, the realization for tax purposes of unrealized gains/ losses on certain futures and options contracts, the deferral of post-October capital losses for tax purposes, the accounting for swap agreements and the treatment of residual interests in tender option bond trusts. |
As of March 31,2011, Series C, Series M and Series N had capital loss carryforwards available to offset future realized capital gains through the indicated expiration dates as follows:
| | | | | | | | | | | | | | | |
Expiring March 31, | | Series C | | Series M | | Series N* |
2017 | | | $ | 4,652,867 | | | | | – | | | | $ | 26,812 | |
2018 | | | | 8,268,764 | | | | $ | 12,583,025 | | | | | 170,499 | |
| | | | | | | | | | | | | | | |
Total | | | $ | 12,921,631 | | | | $ | 12,583,025 | | | | $ | 197,311 | |
| | | | | | | | | | | | | | | |
| | * | Due to the liquidation of the fund, the capital loss carryforwards were available to offset capital gains through the liquidation date. |
Under the recently enacted Regulated Investment Company Modernization Act of 2010, capital losses incurred by the Funds after March 31, 2011 will not be subject to expiration. In addition, these losses must be utilized prior to the losses incurred in pre-enactment taxable years.
7. Concentration, Market and Credit Risk:
Series M and Series S invested a significant portion of their assets in securities backed by commercial or residential mortgage loans or in issuers that hold mortgage and other asset-backed securities. Please see the Schedules of Investments for these securities. Changes in economic conditions, including delinquencies and/or defaults on assets underlying these securities, can affect the value, income and/or liquidity of such positions.
In the normal course of business, the Funds invest in securities and enter into transactions where risks exist due to fluctuations in the market (market risk) or failure of the issuer of a security to meet all its obligations (issuer credit risk). The value of securities held by the Funds may decline in response to certain events, including those directly involving the issuers whose securities are owned by the Funds; conditions affecting the general economy; overall market changes; local, regional or global political, social or economic instability; and currency and interest rate and price fluctuations. Similar to issuer credit risk, the Funds may be exposed to counterparty credit risk, or the risk that an entity with which the Funds have unsettled or open transactions may fail to or be unable to perform on its commitments. The Funds manage counterparty credit risk by entering into transactions only with counterparties that they believe have the financial resources to honor their obligations and by monitoring the financial stability of those counterparties. Financial assets, which potentially expose the Funds to market, issuer and counterparty credit risks, consist principally of financial instruments and receivables due from counterparties. The extent of the Funds’ exposure to market, issuer and counterparty credit risks with respect to these financial assets is generally approximated by their value recorded in the Funds’ Statements of Assets and Liabilities, less any collateral held by the Funds.
| | | | | | |
| 50 | | BLACKROCK BOND ALLOCATION TARGET SHARES | | MARCH 31, 2011 | | |
Notes to Financial Statements (concluded)
Series N invested a significant portion of its assets in securities in the County/City/Special District/School District, Utilities and Health sectors. Changes in economic conditions affecting the County/City/Special
District/School District, Utilities and Health sectors would have a greater impact on Series N and could affect the value, income and/or liquidity of positions in such securities.
8. Capital Shares Transactions:
Transactions in capital shares were as follows:
| | | | | | | | | | |
| | | Year Ended
March 31, 2011 | | Year Ended
March 31, 2010 |
| | |
Series C | | | | |
Shares sold | | | | 7,460,497 | | | | | 9,070,455 | |
Shares issued in reinvestment of dividends | | | | 6,310 | | | | | 106,680 | |
| | | | | | | | | | |
Total issued | | | | 7,466,807 | | | | | 9,177,135 | |
Shares redeemed | | | | (13,267,543 | ) | | | | (12,396,010 | ) |
| | | | | | | | | | |
Net decrease | | | | (5,800,736 | ) | | | | (3,218,875 | ) |
| | | | | | | | | | |
| | |
Series M | | | | |
Shares sold | | | | 8,414,576 | | | | | 10,647,637 | |
Shares issued in reinvestment of dividends | | | | 4,119 | | | | | 88,504 | |
| | | | | | | | | | |
Total issued | | | | 8,418,695 | | | | | 10,736,141 | |
Shares redeemed | | | | (14,393,255 | ) | | | | (11,869,093 | ) |
| | | | | | | | | | |
Net decrease | | | | (5,974,560 | ) | | | | (1,132,952 | ) |
| | | | | | | | | | |
| | |
Series S | | | | |
Shares sold | | | | 11,713,474 | | | | | 9,701,108 | |
Shares issued in reinvestment of dividends and distributions | | | | 20,090 | | | | | 27,111 | |
| | | | | | | | | | |
Total issued | | | | 11,733,564 | | | | | 9,728,219 | |
Shares redeemed | | | | (8,055,216 | ) | | | | (4,572,939 | ) |
| | | | | | | | | | |
Net increase | | | | 3,678,348 | | | | | 5,155,280 | |
| | | | | | | | | | |
There were no transactions in capital shares for Series N during the year ended March 31, 2011.
9. Subsequent Events:
Management’s evaluation of the impact of all subsequent events on the Funds’ financial statements was completed through the date the financial statements were issued and the following item was noted:
On April 29, 2011, all of the assets of Series N were liquidated completely, each investor’s shares were redeemed at net asset value on the date of liquidation, and Series N was terminated. In connection with the liquidation, Series N adopted the liquidation basis of accounting, which among other things, required Series N to record assets and liabilities at its net realizable value and to provide estimated costs of liquidating Series N to the extent that they are reasonably determinable.
| | | | | | |
| | | BLACKROCK BOND ALLOCATION TARGET SHARES | | MARCH 31, 2011 | | 51 |
Report of Independent Registered Public Accounting Firm
To the Board of Trustees and Shareholders of BlackRock Bond Allocation Target Shares:
We have audited the accompanying statements of assets and liabilities, including the schedules of investments, of the Series C Portfolio, Series M Portfolio, Series N Portfolio (in liquidation), and Series S Portfolio [four of the five portfolios constituting the BlackRock Bond Allocation Target Shares (the “Fund”), (collectively, the “Portfolios”)], as of March 31, 2011, and the related statements of operations for the year then ended, the statements of changes in net assets for each of the two years in the period then ended, and the financial highlights for each of the periods presented. These financial statements and financial highlights are the responsibility of the Fund’s management. Our responsibility is to express an opinion on these financial statements and financial highlights based on our audits.
We conducted our audits in accordance with the standards of the Public Company Accounting Oversight Board (United States). Those standards require that we plan and perform the audit to obtain reasonable assurance about whether the financial statements and financial highlights are free of material misstatement. The Fund is not required to have, nor were we engaged to perform, an audit of its internal control over financial reporting. Our audits included consideration of internal control over financial reporting as a basis for designing audit procedures that are appropriate in the circumstances, but not for the purpose of expressing an opinion on the effectiveness of the Fund’s internal control over financial reporting. Accordingly, we express no such opinion. An audit also includes examining, on a test basis, evidence supporting the amounts and disclosures in the financial statements, assessing the accounting principles used and significant estimates made by management, as well as evaluating the overall financial statement presentation. Our procedures included confirmation of securities owned as of March 31, 2011, by correspondence with the custodian and brokers; where replies were not received from brokers, we performed other auditing procedures. We believe that our audits provide a reasonable basis for our opinion.
As discussed in Note 1 to the financial statements, on March 18, 2011, the Board of Trustees approved a proposal to close Series N Portfolio to new investors and liquidate Series N Portfolio, which was completed on April 29, 2011. As a result, Series N Portfolio changed its basis of accounting from going concern to the liquidation basis.
In our opinion, the financial statements and financial highlights referred to above present fairly, in all material respects, the financial position of each of the Portfolios constituting the Fund as of March 31, 2011, the results of their operations for the year then ended, the changes in their net assets for each of the two years in the period then ended, and the financial highlights for each of the periods presented, in conformity with accounting principles generally accepted in the United States of America.
Deloitte & Touche LLP Philadelphia,
Pennsylvania
May 26, 2011
Important Tax Information (Unaudited)
All of the net investment income distributions paid monthly by Series N during the fiscal year ended March 31, 2011 qualify as tax-exempt interest dividends for Federal income tax purposes.
The following information is provided with respect to the ordinary income distributions paid by the Funds for the fiscal year ended March 31, 2011:
| | | | | | | | | | |
Interest Related Dividends and Qualified Short-Term Capital Gains for Non-US Residents * |
| | | April 2010 -
December 2010 | | January 2011 -
March 2011 |
Series C | | | | 76.21 | % | | | | 75.60 | % |
Series M | | | | 100.00 | % | | | | 99.57 | % |
Series S | | | | 89.92 | % | | | | 84.79 | % |
| | | | | | | | | | |
Federal Obligation Interest ** |
| | | April 2010 -
December 2010 | | January 2011 -
March 2011 |
Series M | | | | 20.92 | % | | | | 21.96 | % |
| * | Represents the portion of the taxable ordinary income dividends eligible for exemption from US withholding tax for nonresident aliens and foreign corporations. |
| ** | The law varies in each state as to whether and what percentage of ordinary income distributions attributable to Federal obligations is eligible for exemption from state income tax. We recommend that you consult your tax advisor to determine if any portion of the distributions you received is exempt from state income taxes. |
Additionally, Series S paid a long-term capital gain distribution of $0.06987 to shareholders of record on December 8, 2010.
| | | | | | |
| 52 | | BLACKROCK BOND ALLOCATION TARGET SHARES | | MARCH 31, 2011 | | |
Officers and Trustees
| | | | | | | | | | | | |
Name, Address, and Year of Birth | | Position(s) Held with the Trust | | Length
of Time
Served as
a Trustee2 | | | Principal Occupation(s) During Past 5 Years | | Number of BlackRock-
Advised Registered
Investment Companies
(“RICs”) Consisting of
Investment Portfolios
(“Portfolios”) Overseen | | Public Directorships |
Independent Trustees1 | | | | | | | | | | |
| | | | | |
Robert M. Hernandez 55 East 52nd Street New York, NY 10055 1944 | | Chairman of the Board, Trustee and Member of the Audit Committee | |
| Since
2004 |
| | Director, Vice Chairman and Chief Financial Officer of USX Corporation (energy and steel business) from 1991 to 2001. | | 34 RICs consisting of 97 Portfolios | | ACE Limited (insurance company); Eastman Chemical Company (chemicals); RTI International Metals, Inc. (metals); TYCO Electronics (electronics) |
| | | | | |
Fred G. Weiss 55 East 52nd Street New York, NY 10055 1941 | | Vice Chairman of the Board, Chairman of the Audit Committee and Trustee | |
| Since
2007 |
| | Managing Director, FGW Associates (consulting and investment company) since 1997; Director and Treasurer Michael J. Fox Foundation for Parkinson’s Research since 2000; Director, BTG International Plc (medical technology commercialization company) from 2001 to 2007. | | 34 RICs consisting of 97 Portfolios | | Watson Pharmaceutical Inc. |
| | | | | |
James H. Bodurtha 55 East 52nd Street New York, NY 10055 1944 | | Trustee | |
| Since
2007 |
| | Director, The China Business Group, Inc. (consulting firm) since 1996 and Executive Vice President thereof from 1996 to 2003; Chairman of the Board, Berkshire Holding Corporation since 1980. | | 34 RICs consisting of 97 Portfolios | | None |
| | | | | |
Bruce R. Bond 55 East 52nd Street New York, NY 10055 1946 | | Trustee | |
| Since
2005 |
| | Trustee and Member of the Governance Committee, State Street Research Mutual Funds from 1997 to 2005; Board Member of Governance, Audit and Finance Committee, Avaya Inc. (computer equipment) from 2003 to 2007. | | 34 RICs consisting of 97 Portfolios | | None |
| | | | | |
Donald W. Burton 55 East 52nd Street New York, NY 10055 1944 | | Trustee | |
| Since
2007 |
| | Managing General Partner, The Burton Partnership, LP (an investment partnership) since 1979; Managing General Partner, The South Atlantic Venture Funds since 1983; Director, Lifestyle Family Fitness (fitness industry) since 2006; Director, Idology, Inc. (technology solutions) since 2006; Member of the Investment Advisory Council of the Florida State Board of Administration from 2001 to 2007. | | 34 RICs consisting of 97 Portfolios | | Knology, Inc. (telecommunications); Capital Southwest (financial) |
| | | | | |
Honorable Stuart E. Eizenstat 55 East 52nd Street New York, NY 10055 1943 | | Trustee and Member of the Audit Committee | |
| Since
2004 |
| | Partner and Head of International Practice, Covington and Burling LLP (law firm) since 2001; International Advisory Board Member, The Coca Cola Company since 2002; Advisory Board Member, Veracity Worldwide, LLC (risk management) since 2007; Member of the Board of Directors, Chicago Climate Exchange (environmental) since 2006; Member of the International Advisory Board GML (energy) since 2003; Advisory Board Member, BT Americas (telecommunications) from 2004 to 2010. | | 34 RICs consisting of 97 Portfolios | | Alcatel-Lucent (telecommunications); Global Specialty Metallurgical (metallurgical industry); UPS Corporation (delivery service) |
| | | | | |
Kenneth A. Froot 55 East 52nd Street New York, NY 10055 1957 | | Trustee | |
| Since
2007 |
| | Professor, Harvard University since 1992. | | 34 RICs consisting of 97 Portfolios | | None |
| | | | | |
John F. O’Brien 55 East 52nd Street New York, NY 10055 1943 | | Trustee | |
| Since
2007 |
| | Chairman and Director, Woods Hole Oceanographic Institute since 2009 and Trustee thereof from 2003 to 2009; Director, Allmerica Financial Corporation from 1995 to 2003; Director, ABIOMED from 1989 to 2006; Director, Ameresco, Inc. (energy solutions company) from 2006 to 2007; Vice Chairman and Director, Boston Lyric Opera from 2002 to 2007. | | 34 RICs consisting of 97 Portfolios | | Cabot Corporation (chemicals); LKQ Corporation (auto parts manufacturing); TJX Companies, Inc. (retailer) |
| | | | | |
Roberta Cooper Ramo 55 East 52nd Street New York, NY 10055 1942 | | Trustee | |
| Since
2007 |
| | Shareholder, Modrall, Sperling, Roehl, Harris & Sisk, P.A. (law firm) since 1993; Chairman of the Board, Cooper’s Inc., (retail) since 2000; Director, ECMC Group (service provider to students, schools and lenders) since 2001; President, The American Law Institute (non-profit), since 2008; President, American Bar Association from 1995 to 1996. | | 34 RICs consisting of 97 Portfolios | | None |
| | | | | | |
| | | BLACKROCK BOND ALLOCATION TARGET SHARES | | MARCH 31, 2011 | | 53 |
Officers and Trustees (continued)
| | | | | | | | | | | | |
Name, Address, and Year of Birth | | Position(s) Held with the Trust | | Length of
Time
Served as
a Trustee2 | | | Principal Occupation(s) During Past 5 Years | | Number of BlackRock-
Advised Registered
Investment Companies
(“RICs”) Consisting of
Investment Portfolios
(“Portfolios”) Overseen | | Public Directorships |
Independent Trustees1 (concluded) | | | | | | | | | | |
| | | | | |
David H. Walsh 55 East 52nd Street New York, NY 10055 1941 | | Trustee | |
| Since
2007 |
| | Director, National Museum of Wildlife Art since 2007; Trustee, University of Wyoming Foundation since 2008; Director, Ruckleshaus Institute and Haub School of Natural Resources at the University of Wyoming from 2006 to 2008; Director, The American Museum of Fly Fishing since 1997; Director, The National Audubon Society from 1998 to 2005. | | 34 RICs consisting of 97 Portfolios | | None |
| | 1 | Trustees serve until their resignation, removal or death, or until December 31 of the year in which they turn 72. |
| | 2 | Date shown is the earliest date a person has served for the Trust covered by this annual report. Following the combination of Merrill Lynch Investment Managers, L.P. (“MLIM”) and BlackRock, Inc. (“BlackRock”) in September 2006, the various legacy MLIM and legacy BlackRock Fund boards were realigned and consolidated into three new fund boards in 2007. As a result, although the chart shows certain Trustees as joining the Trust’s Board in 2007, each Trustee first became a member of the board of other legacy MLIM or legacy BlackRock Funds as follows: James H. Bodurtha, 1995; Bruce R. Bond, 2005; Donald W. Burton, 2002; Stuart E. Eizenstat, 2001; Kenneth A. Froot, 2005; Robert M. Hernandez, 1996; John F. O’Brien, 2004; Roberta Cooper Ramo, 2000; David H. Walsh, 2003 and Fred G. Weiss, 1998. |
| | | | | | | | | | |
Interested Trustees3 | | | | | | | | |
| | | | | |
Richard S. Davis 55 East 52nd Street New York, NY 10055 1945 | | Trustee | | Since 2005 | | Managing Director, BlackRock, Inc. since 2005; Chief Executive Officer, State Street Research & Management Company from 2000 to 2005; Chairman of the Board of Trustees, State Street Research Mutual Funds from 2000 to 2005. | | 168 RICs consisting of 288 Portfolios | | None |
| | | | | |
Laurence D. Fink 55 East 52nd Street New York, NY 10055 1952 | | Trustee | | Since 2004 | | Chairman and Chief Executive Officer of BlackRock, Inc. since its formation in 1998 and of BlackRock, Inc.’s predecessor entities since 1988 and Chairman of the Executive and Management Committees; Formerly Managing Director, The First Boston Corporation, Member of its Management Committee, Co-head of its Taxable Fixed Income Division and Head of its Mortgage and Real Estate Products Group; Chairman of the Board of several of BlackRock’s alternative investment vehicles; Director of several of BlackRock’s offshore funds; Member of the Board of Trustees of New York University, Chair of the Financial Affairs Committee and a member of the Executive Committee, the Ad Hoc Committee on Board Governance, and the Committee on Trustees; Co-Chairman of the NYU Hospitals Center Board of Trustees; Chairman of the Development/Trustee Stewardship Committee and Chairman of the Finance Committee; Trustee, The Boys’ Club of New York. | | 34 RICs consisting of 97 Portfolios | | None |
| | | | | |
Henry Gabbay 55 East 52nd Street New York, NY 10055 1947 | | Trustee | | Since 2007 | | Consultant, BlackRock, Inc. from 2007 to 2008; Managing Director, BlackRock, Inc. from 1989 to 2007; Chief Administrative Officer, BlackRock Advisors, LLC from 1998 to 2007; President of BlackRock Funds and BlackRock Bond Allocation Target Shares from 2005 to 2007 and Treasurer of certain closed-end funds in the BlackRock fund complex from 1989 to 2006. | | 168 RICs consisting of 288 Portfolios | | None |
| | 3 | Messrs. Davis and Fink are both “interested persons,” as defined in the 1940 Act, of the Trust based on their positions with BlackRock, Inc. and its affiliates. Mr. Gabbay is an “interested person” of the Trust based on his former positions with BlackRock, Inc. and its affiliates as well as his ownership of BlackRock, Inc. and The PNC Financial Services Group, Inc. Trustees serve until their resignation, removal or death, or until December 31 of the year in which they turn 72. |
| | | | | | |
| 54 | | BLACKROCK BOND ALLOCATION TARGET SHARES | | MARCH 31, 2011 | | |
Officers and Trustees (concluded)
| | | | | | | | |
Name, Address, and Year of Birth | | Position(s)
Held with
the Trust | | Length
of Time
Served | | | Principal Occupation(s) During Past 5 Years |
Trust Officers1 | | | | | | |
| | | |
John M. Perlowski 55 East 52nd Street New York, NY 10055 1964 | | President
and Chief
Executive
Officer | |
| Since
2010 |
| | Managing Director of BlackRock, Inc. since 2009; Global Head of BlackRock Fund Administration since 2009; Managing Director and Chief Operating Officer of the Global Product Group at Goldman Sachs Asset Management, L.P. from 2003 to 2009; Treasurer of Goldman Sachs Mutual Funds from 2003 to 2009 and Senior Vice President thereof from 2007 to 2009; Director of Goldman Sachs Offshore Funds from 2002 to 2009; Director, Family Resource Network (charitable foundation) since 2009. |
| | | |
Brendan Kyne 55 East 52nd Street New York, NY 10055 1977 | | Vice
President | |
| Since
2009 |
| | Managing Director of BlackRock, Inc. since 2010; Director of BlackRock, Inc. from 2008 to 2009; Head of Product Development and Management for BlackRock’s U.S. Retail Group since 2009, Co-head thereof from 2007 to 2009; Vice President of BlackRock, Inc. from 2005 to 2008. |
| | | |
Brian Schmidt 55 East 52nd Street New York, NY 10055 1958 | | Vice
President | |
| Since
2009 |
| | Managing Director of BlackRock, Inc. since 2004; Various positions with U.S. Trust Company from 1991 to 2003 including Director from 2001 to 2003 and Senior Vice President from 1998 to 2003; Vice President, Chief Financial Officer and Treasurer of Excelsior Funds, Inc., Excelsior Tax-Exempt Funds, Inc. and Excelsior Funds Trust from 2001 to 2003. |
| | | |
Neal Andrews 55 East 52nd Street New York, NY 10055 1966 | | Chief
Financial
Officer | |
| Since
2007 |
| | Managing Director of BlackRock, Inc. since 2006; Senior Vice President and Line of Business Head of Fund Accounting and Administration at PNC Global Investment Servicing (U.S.) Inc. from 1992 to 2006. |
| | | |
Jay Fife 55 East 52nd Street New York, NY 10055 1970 | | Treasurer | |
| Since
2007 |
| | Managing Director of BlackRock, Inc. since 2007; Director of BlackRock, Inc. in 2006; Assistant Treasurer of the Merrill Lynch Investment Managers, L.P. (“MLIM”) and Fund Asset Management, L.P. advised funds from 2005 to 2006; Director of MLIM Fund Services Group from 2001 to 2006. |
| | | |
Brian Kindelan 55 East 52nd Street New York, NY 10055 1959 | | Chief
Compliance
Officer | |
| Since
2007 |
| | Chief Compliance Officer of the BlackRock-advised Funds since 2007; Managing Director and Senior Counsel of BlackRock, Inc. since 2005. |
| | | |
Ira P. Shapiro 55 East 52nd Street New York, NY 10055 1963 | | Secretary | |
| Since
2010 |
| | Managing Director of BlackRock, Inc. since 2009; Managing Director and Associate General Counsel of Barclays Global Investors from 2008 to 2009; Principal thereof from 2004 to 2008. |
| | 1 | Officers of the Trust serve at the pleasure of the Board of Trustees. |
Further information about the Trust’s Officers and Trustees is available in the Trust’s Statement of Additional Information, which can be obtained without charge by calling 1-800-441-7762.
| | | | | | |
Investment Advisor BlackRock Advisors, LLC Wilmington, DE 19809 | | Accounting Agent, Administrator and Transfer Agent BNY Mellon Investment Servicing (US) Inc. Wilmington, DE 19809 | | Custodian PFPC Trust Company Wilmington, DE 19809 | | Distributor BlackRock Investments, LLC New York, NY 10022 |
| | | |
Legal Counsel Willkie Farr & Gallagher LLP New York, NY 10019 | | Independent Registered Public Accounting Firm Deloitte & Touche LLP Philadelphia, PA 19103 | | Address of the Trust 100 Bellevue Parkway Wilmington, DE 19809 | | |
Effective November 10, 2010, Ira P. Shapiro became Secretary of the Trust.
Effective December 31, 2010, Richard R. West retired as Trustee of the Trust. The Board wishes Mr. West well in his retirement.
| | | | | | |
| | | BLACKROCK BOND ALLOCATION TARGET SHARES | | MARCH 31, 2011 | | 55 |
Additional Information
General Information
Householding
The Funds will mail only one copy of shareholder documents, including annual and semi-annual reports and proxy statements, to shareholders with multiple accounts at the same address. This practice is commonly called “householding” and it is intended to reduce expenses and eliminate duplicate mailings of shareholder documents. Mailings of your shareholder documents may be householded indefinitely unless you instruct us otherwise. If you do not want the mailing of these documents to be combined with those for other members of your household, please contact the Funds at (800) 441-7762.
Availability of Quarterly Portfolio Schedule
The Funds file their complete schedule of portfolio holdings with the Securities and Exchange Commission (the “SEC”) for the first and third quarters of each fiscal year on Form N-Q. The Funds’ Forms N-Q are available on the SEC’s website at http://www.sec.gov and may also be reviewed and copied at the SEC’s Public Reference Room in Washington, D.C. Information on how to access documents on the SEC’s website without charge may be obtained by calling (800) SEC-0330. The Funds’ Forms N-Q may also be obtained upon request and without charge by calling (800) 441-7762.
Availability of Proxy Voting Policies and Procedures
A description of the policies and procedures that the Funds use to determine how to vote proxies relating to portfolio securities is available (1) without charge, upon request, by calling (800) 441-7762; (2) at http://www.blackrock.com and (3) on the SEC’s website at http:// www.sec.gov.
Availability of Proxy Voting Record
Information about how the Funds voted proxies relating to securities held in the Funds’ portfolios during the most recent 12-month period ended June 30 is available upon request and without charge (1) at http://www.blackrock.com or by calling (800) 441-7762 and (2) on the SEC’s website at http://www.sec.gov.
BlackRock Privacy Principles
BlackRock is committed to maintaining the privacy of its current and former fund investors and individual clients (collectively, “Clients”) and to safeguarding their non-public personal information. The following information is provided to help you understand what personal information BlackRock collects, how we protect that information and why in certain cases we share such information with select parties.
If you are located in a jurisdiction where specific laws, rules or regulations require BlackRock to provide you with additional or different privacy-related rights beyond what is set forth below, then BlackRock will comply with those specific laws, rules or regulations.
BlackRock obtains or verifies personal non-public information from and about you from different sources, including the following: (i) information we receive from you or, if applicable, your financial intermediary, on applications, forms or other documents; (ii) information about your transactions with us, our affiliates, or others; (iii) information we receive from a consumer reporting agency; and (iv) from visits to our websites.
BlackRock does not sell or disclose to non-affiliated third parties any non-public personal information about its Clients, except as permitted by law or as is necessary to respond to regulatory requests or to service Client accounts. These non-affiliated third parties are required to protect the confidentiality and security of this information and to use it only for its intended purpose.
We may share information with our affiliates to service your account or to provide you with information about other BlackRock products or services that may be of interest to you. In addition, BlackRock restricts access to non-public personal information about its Clients to those BlackRock employees with a legitimate business need for the information. BlackRock maintains physical, electronic and procedural safeguards that are designed to protect the non-public personal information of its Clients, including procedures relating to the proper storage and disposal of such information.
| | | | | | |
| 56 | | BLACKROCK BOND ALLOCATION TARGET SHARES | | MARCH 31, 2011 | | |
[THIS PAGE INTENTIONALLY LEFT BLANK.]
[THIS PAGE INTENTIONALLY LEFT BLANK.]
[THIS PAGE INTENTIONALLY LEFT BLANK.]
This report is transmitted to shareholders only. It is not authorized for use as an offer of sale or a solicitation of an offer to buy shares of the Funds unless accompanied or preceded by the Funds’ current prospectus. Past performance results shown in this report should not be considered a representation of future performance. Investment returns and principal value of shares will fluctuate so that shares, when redeemed, may be worth more or less than their original cost. Statements and other information herein are as dated and are subject to change.

| | |
| BATS-3/11-AR | |  |
| | | | |
| Item 2 | | – | | Code of Ethics – The registrant (or the “Fund”) has adopted a code of ethics, as of the end of the period covered by this report, applicable to the registrant’s principal executive officer, principal financial officer, principal accounting officer, controller or persons performing similar functions. During the period covered by this report, there have been no amendments to or waivers granted under the code of ethics. A copy of the code of ethics is available without charge at www.blackrock.com. |
| | |
| Item 3 | | – | | Audit Committee Financial Expert – The registrant’s board of directors (the “board of directors”), has determined that (i) the registrant has the following audit committee financial experts serving on its audit committee and (ii) each audit committee financial expert is independent: |
| | |
| | | | Robert M. Hernandez |
| | |
| | | | Fred G. Weiss |
| | |
| | | | Stuart E. Eizenstat |
| | |
| | | | Under applicable securities laws, a person determined to be an audit committee financial expert will not be deemed an “expert” for any purpose, including without limitation for the purposes of Section 11 of the Securities Act of 1933, as a result of being designated or identified as an audit committee financial expert. The designation or identification of a person as an audit committee financial expert does not impose on such person any duties, obligations, or liabilities greater than the duties, obligations, and liabilities imposed on such person as a member of the audit committee and board of directors in the absence of such designation or identification. |
| | |
| Item 4 | | – | | Principal Accountant Fees and Services |
| | |
| | | | The following table presents fees billed by Deloitte & Touche LLP (“D&T”) in each of the last two fiscal years for the services rendered to the Fund: |
| | | | | | | | | | | | | | | | | | | | | | | | | | | | | | | | |
| | | (a) Audit Fees | | | (b) Audit-Related Fees1 | | | (c) Tax Fees2 | | | (d) All Other Fees3 | |
Entity Name | | Current
Fiscal Year
End | | | Previous
Fiscal Year
End | | | Current
Fiscal Year
End | | | Previous
Fiscal Year
End | | | Current
Fiscal Year
End | | | Previous
Fiscal Year
End | | | Current
Fiscal Year
End | | | Previous
Fiscal Year
End | |
Series C Portfolio | | $ | 34,200 | | | $ | 32,100 | | | $ | 0 | | | $ | 0 | | | $ | 14,100 | | | $ | 6,100 | | | $ | 0 | | | $ | 104 | |
Series M Portfolio | | $ | 33,100 | | | $ | 32,100 | | | $ | 0 | | | $ | 0 | | | $ | 14,100 | | | $ | 6,100 | | | $ | 0 | | | $ | 96 | |
Series N Portfolio | | $ | 33,200 | | | $ | 32,200 | | | $ | 0 | | | $ | 0 | | | $ | 26,200 | | | $ | 6,100 | | | $ | 0 | | | $ | 3 | |
Series S Portfolio | | $ | 34,200 | | | $ | 32,100 | | | $ | 0 | | | $ | 0 | | | $ | 14,100 | | | $ | 6,100 | | | $ | 0 | | | $ | 21 | |
The following table presents fees billed by D&T that were required to be approved by the registrant’s audit committee (the “Committee”) for services that relate directly to the operations or financial reporting of the Fund and that are rendered on behalf of BlackRock Advisors, LLC (“Investment Adviser” or “BlackRock”) and entities controlling, controlled by, or under common control with BlackRock (not including any sub-adviser whose role is primarily portfolio management and is subcontracted with or overseen by another investment adviser) that provide ongoing services to the Fund (“Fund Service Providers”):
| | | | | | | | |
| | | Current Fiscal Year
End | | | Previous Fiscal Year
End | |
(b) Audit-Related Fees1 | | $ | 0 | | | $ | 0 | |
(c) Tax Fees2 | | $ | 0 | | | $ | 0 | |
(d) All Other Fees3 | | $ | 3,030,000 | | | $ | 2,950,000 | |
| 1 | The nature of the services include assurance and related services reasonably related to the performance of the audit of financial statements not included in Audit Fees. |
| 2 | The nature of the services include tax compliance, tax advice and tax planning. |
| 3 | The nature of the services include a review of compliance procedures and attestation thereto. |
(e)(1) Audit Committee Pre-Approval Policies and Procedures:
The Committee has adopted policies and procedures with regard to the pre-approval of services. Audit, audit-related and tax compliance services provided to the registrant on an annual basis require specific pre-approval by the Committee. The Committee also must approve other non-audit services provided to the registrant and those non-audit services provided to the Fund Service Providers that relate directly to the operations and the financial reporting of the registrant. Certain of these non-audit services that the Committee believes are a) consistent with the SEC’s auditor independence rules and b) routine and recurring services that will not impair the independence of the independent accountants may be approved by the Committee without consideration on a specific case-by-case basis (“general pre-approval”). The term of any general pre-approval is 12 months from the date of the pre-approval, unless the Committee provides for a different period. Tax or other non-audit services provided to the registrant which have a direct impact on the operations or financial reporting of the registrant will only be deemed pre-approved provided that any individual project does not exceed $10,000 attributable to the registrant or $50,000 per project. For this purpose, multiple projects will be aggregated to determine if they exceed the previously mentioned cost levels.
Any proposed services exceeding the pre-approved cost levels will require specific pre-approval by the Committee, as will any other services not subject to general pre-approval (e.g., unanticipated but permissible services). The Committee is informed of each service approved subject to general pre-approval at the next regularly scheduled in-person board meeting. At this meeting, an analysis of such services is presented to the Committee for ratification. The Committee may delegate to the Committee Chairman the authority to approve the provision of and fees for any specific engagement of permitted non-audit services, including services exceeding pre-approved cost levels.
(e)(2) None of the services described in each of Items 4(b) through (d) were approved by the Committee pursuant to the de minimis exception in paragraph (c)(7)(i)(C) of Rule 2-01 of Regulation S-X.
(f) Not Applicable
(g) The aggregate non-audit fees paid to the accountant for services rendered by the accountant to the registrant and Investment Adviser (not including any non-affiliated sub-adviser whose role is primarily portfolio management and is sub-contracted with or overseen by the registrant’s investment adviser) and the Fund Services Providers were:
| | | | | | | | |
Entity Name | | Current Fiscal Year
End | | | Previous Fiscal Year
End | |
Series C Portfolio | | $ | 14,100 | | | $ | 16,981 | |
Series M Portfolio | | $ | 14,100 | | | $ | 16,973 | |
Series N Portfolio | | $ | 26,200 | | | $ | 16,880 | |
Series S Portfolio | | $ | 14,100 | | | $ | 16,898 | |
(h) The Committee has considered and determined that the provision of non-audit services that were rendered to the registrant’s Investment Adviser (not including any non-affiliated sub-adviser whose role is primarily portfolio management and is subcontracted with or overseen by the registrant’s
investment adviser), and The Fund Service Providers that were not pre-approved pursuant to paragraph (c)(7)(ii) of Rule 2-01 of Regulation S-X is compatible with maintaining the principal accountant’s independence.
| | | | |
| Item 5 | | – | | Audit Committee of Listed Registrants – Not Applicable |
| | |
| Item 6 | | – | | Investments |
| | |
| | | | (a) The registrant’s Schedule of Investments is included as part of the Report to Stockholders filed under Item 1 of this Form. |
| | |
| | | | (b) Not Applicable due to no such divestments during the semi-annual period covered since the previous Form N-CSR filing. |
| | |
| Item 7 | | – | | Disclosure of Proxy Voting Policies and Procedures for Closed-End Management Investment Companies – Not Applicable |
| | |
| Item 8 | | – | | Portfolio Managers of Closed-End Management Investment Companies – Not Applicable |
| | |
| Item 9 | | – | | Purchases of Equity Securities by Closed-End Management Investment Company and Affiliated Purchasers – Not Applicable |
| | |
| Item 10 | | – | | Submission of Matters to a Vote of Security Holders – There have been no material changes to these procedures. |
| | |
| Item 11 | | – | | Controls and Procedures |
| | |
| 11(a) | | – | | The registrant’s principal executive and principal financial officers, or persons performing similar functions, have concluded that the registrant’s disclosure controls and procedures (as defined in Rule 30a-3(c) under the Investment Company Act of 1940, as amended (the “1940 Act”)) are effective as of a date within 90 days of the filing of this report based on the evaluation of these controls and procedures required by Rule 30a-3(b) under the 1940 Act and Rule 15d-15(b) under the Securities Exchange Act of 1934, as amended. |
| | |
| 11(b) | | – | | There were no changes in the registrant’s internal control over financial reporting (as defined in Rule 30a-3(d) under the 1940 Act) that occurred during the second fiscal quarter of the period covered by this report that have materially affected, or are reasonably likely to materially affect, the registrant’s internal control over financial reporting. |
| | |
| Item 12 | | – | | Exhibits attached hereto |
| | |
| 12(a)(1) | | – | | Code of Ethics – See Item 2 |
| | |
| 12(a)(2) | | – | | Certifications – Attached hereto |
| | |
| 12(a)(3) | | – | | Not Applicable |
| | |
| 12(b) | | – | | Certifications – Attached hereto |
Pursuant to the requirements of the Securities Exchange Act of 1934 and the Investment Company Act of 1940, the registrant has duly caused this report to be signed on its behalf by the undersigned, thereunto duly authorized.
| | | | | | |
BlackRock Bond Allocation Target Shares | | |
| | | |
| By: | | /s/ John M. Perlowski | | | | |
| | John M. Perlowski | | | | |
| | Chief Executive Officer (principal executive officer) of | | |
| | BlackRock Bond Allocation Target Shares | | | | |
Date: June 3, 2011
Pursuant to the requirements of the Securities Exchange Act of 1934 and the Investment Company Act of 1940, this report has been signed below by the following persons on behalf of the registrant and in the capacities and on the dates indicated.
| | | | | | |
| By: | | /s/ John M. Perlowski | | | | |
| | John M. Perlowski | | | | |
| | Chief Executive Officer (principal executive officer) of | | |
| | BlackRock Bond Allocation Target Shares | | | | |
Date: June 3, 2011
| | | | | | |
| By: | | /s/ Neal J. Andrews | | | | |
| | Neal J. Andrews | | | | |
| | Chief Financial Officer (principal financial officer) of BlackRock Bond Allocation Target Shares | | |
Date: June 3, 2011