| |
| UNITED STATES |
| SECURITIES AND EXCHANGE COMMISSION |
| Washington, D.C. 20549 |
| |
| FORM N-CSR |
| |
| CERTIFIED SHAREHOLDER REPORT OF REGISTERED |
| |
| MANAGEMENT INVESTMENT COMPANIES |
| |
| Investment Company Act file number 811-21416 |
| |
| John Hancock Tax-Advantaged Dividend Income Fund |
| (Exact name of registrant as specified in charter) |
| |
| 601 Congress Street, Boston, Massachusetts 02210 |
| (Address of principal executive offices) (Zip code) |
| |
| Salvatore Schiavone |
| Treasurer |
| |
| 601 Congress Street |
| |
| Boston, Massachusetts 02210 |
| (Name and address of agent for service) |
| |
| Registrant's telephone number, including area code: 617-663-4497 |
| |
| |
| Date of fiscal year end: | October 31 |
| |
| | |
| Date of reporting period: | April 30, 2012 |
ITEM 1. SCHEDULE OF INVESTMENTS

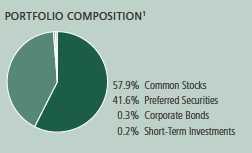
Portfolio summary
| | | | |
| Top 10 Issuers (30.5% of Total Investments on 4-30-12)1,2 | |
|
| Bank of America Corp. | 4.7% | | Spectra Energy Corp. | 2.9% |
| |
|
| Wells Fargo & Company | 3.3% | | CH Energy Group, Inc. | 2.8% |
| |
|
| Deutsche Bank | 3.2% | | Integrys Energy Group,Inc. | 2.8% |
| |
|
| OGE Energy Corp. | 3.0% | | ONEOK, Inc. | 2.6% |
| |
|
| DTE Energy Company | 2.9% | | FirstEnergy Corp. | 2.3% |
| |
|
| |
| Sector Composition1,3 | | | | |
|
| Utilities | 59.2% | | Industrials | 0.8% |
| |
|
| Financials | 24.4% | | Materials | 0.3% |
| |
|
| Energy | 9.9% | | Short-Term Investments | 0.2% |
| |
|
| Telecommunication Services | 5.2% | | | |
| | |
1 As a percentage of the Fund’s total investments on 4-30-12.
2 Cash and cash equivalents not included.
3 Sector investing is subject to greater risks than the market as a whole. Because the Fund may focus on particular sectors of the economy, its performance may depend on the performance of those sectors.
| |
| 6 | Tax-Advantaged Dividend Income Fund | Semiannual report |
Fund’s investments
As of 4-30-12 (unaudited)
| | |
| | Shares | Value |
| Common Stocks 85.4% (57.9% of Total Investments) | | $623,834,865 |
|
| (Cost $530,187,150) | | |
| | | |
| Energy 10.6% | | 77,417,505 |
| | | |
| Oil, Gas & Consumable Fuels 10.6% | | |
|
| BP PLC, ADR (L)(Z) | 187,500 | 8,139,375 |
|
| Chevron Corp. (Z) | 92,000 | 9,803,520 |
|
| ConocoPhillips | 142,500 | 10,207,275 |
|
| Royal Dutch Shell PLC, ADR | 69,000 | 4,936,260 |
|
| Spectra Energy Corp. (L)(Z) | 1,000,000 | 30,740,000 |
|
| Total SA, ADR (L)(Z) | 282,500 | 13,591,075 |
| | | |
| Industrials 1.2% | | 9,006,800 |
| | | |
| Industrial Conglomerates 1.2% | | |
|
| General Electric Company (L)(Z) | 460,000 | 9,006,800 |
| | | |
| Materials 0.4% | | 3,140,600 |
| | | |
| Metals & Mining 0.4% | | |
|
| Freeport-McMoRan Copper & Gold, Inc. | 82,000 | 3,140,600 |
| | | |
| Telecommunication Services 4.9% | | 35,533,730 |
| | | |
| Diversified Telecommunication Services 3.2% | | |
|
| AT&T, Inc. (Z) | 410,000 | 13,493,100 |
|
| Verizon Communications, Inc. (L)(Z) | 235,000 | 9,489,300 |
| | | |
| Wireless Telecommunication Services 1.7% | | |
|
| Vodafone Group PLC, ADR (L)(Z) | 451,000 | 12,551,330 |
| | | |
| Utilities 68.3% | | 498,736,230 |
| | | |
| Electric Utilities 22.0% | | |
|
| American Electric Power Company, Inc. (Z) | 595,000 | 23,109,800 |
|
| Duke Energy Corp. (L)(Z) | 707,500 | 15,161,725 |
|
| Entergy Corp. (Z) | 192,500 | 12,620,300 |
|
| FirstEnergy Corp. (Z) | 530,000 | 24,814,600 |
|
| Northeast Utilities | 657,500 | 24,176,275 |
|
| NV Energy, Inc. | 40,000 | 666,000 |
|
| PNM Resources, Inc. (Z) | 58,000 | 1,088,080 |
|
| Progress Energy, Inc. | 460,000 | 24,481,200 |
|
| Southern Company (Z) | 375,000 | 17,227,500 |
|
| UIL Holdings Corp. (C)(Z) | 510,000 | 17,528,700 |
| | |
| See notes to financial statements | Semiannual report | Tax-Advantaged Dividend Income Fund | 7 |
| | |
| | Shares | Value |
| Gas Utilities 8.3% | | |
|
| AGL Resources, Inc. | 70,000 | $2,760,100 |
|
| Atmos Energy Corp. (L)(Z) | 725,000 | 23,620,500 |
|
| Northwest Natural Gas Company (Z) | 132,500 | 6,055,250 |
|
| ONEOK, Inc. (Z) | 330,000 | 28,343,700 |
| | | |
| Multi-Utilities 38.0% | | |
|
| Alliant Energy Corp. | 160,000 | 7,238,400 |
|
| Ameren Corp. (L)(Z) | 555,000 | 18,198,450 |
|
| Black Hills Corp. (L)(Z) | 602,500 | 19,888,525 |
|
| CH Energy Group, Inc. (C)(Z) | 455,000 | 29,857,100 |
|
| Dominion Resources, Inc. (L)(Z) | 420,000 | 21,919,800 |
|
| DTE Energy Company (L)(Z) | 500,000 | 28,190,000 |
|
| Integrys Energy Group, Inc. (L)(Z) | 555,000 | 30,325,200 |
|
| National Grid PLC, ADR | 200,000 | 10,818,000 |
|
| NiSource, Inc. (Z) | 790,500 | 19,485,825 |
|
| OGE Energy Corp. | 595,000 | 32,106,200 |
|
| Public Service Enterprise Group, Inc. (L)(Z) | 360,000 | 11,214,000 |
|
| TECO Energy, Inc. | 200,000 | 3,604,000 |
|
| Vectren Corp. (Z) | 790,000 | 23,265,500 |
|
| Xcel Energy, Inc. (L)(Z) | 775,000 | 20,971,500 |
| |
| Preferred Securities 61.5% (41.6% of Total Investments) | | $449,103,251 |
|
| (Cost $448,642,559) | | |
| | | |
| Energy 4.0% | | 29,478,942 |
| | | |
| Oil, Gas & Consumable Fuels 4.0% | | |
|
| Apache Corp., Series D, 6.000% | 125,000 | 6,640,000 |
|
| Nexen, Inc., 7.350% (C)(Z) | 901,300 | 22,838,942 |
| | | |
| Financials 36.0% | | 263,004,318 |
| | | |
| Capital Markets 0.4% | | |
|
| Lehman Brothers Holdings, Inc., Depositary | | |
| Shares, Series C, 5.940% (I) | 274,760 | 2,747 |
|
| Lehman Brothers Holdings, Inc., Depositary | | |
| Shares, Series D, 5.670% (I) | 65,000 | 650 |
|
| Lehman Brothers Holdings, Inc., Depositary | | |
| Shares, Series F, 6.500% (I) | 219,300 | 219 |
|
| The Goldman Sachs Group, Inc., Series B, 6.200% | 123,000 | 3,083,610 |
| | | |
| Commercial Banks 12.6% | | |
|
| Barclays Bank PLC, Series 3, 7.100% | 30,000 | 742,200 |
|
| Barclays Bank PLC, Series 5, 8.125% (Z) | 515,000 | 13,153,100 |
|
| HSBC Holdings PLC, 8.125% (Z) | 50,000 | 1,317,000 |
|
| HSBC Holdings PLC, 8.000% (C)(Z) | 325,000 | 8,924,500 |
|
| Royal Bank of Scotland Group PLC, Series L, | | |
| 5.750% (Z) | 858,500 | 16,225,650 |
|
| Santander Finance Preferred SA Unipersonal, | | |
| Series 10, 10.500% | 277,000 | 7,246,320 |
|
| Santander Finance Preferred SA, Series 1, 6.410% | 15,500 | 325,345 |
|
| Santander Holdings USA, Inc., Series C, 7.300% | 111,610 | 2,790,250 |
| | |
| 8 | Tax-Advantaged Dividend Income Fund | Semiannual report | See notes to financial statements |
| | |
| | Shares | Value |
| Commercial Banks (continued) | | |
|
| US Bancorp (6.500% to 1-15-22, then 3 month | | |
| LIBOR + 4.468%), 6.500% | 204,500 | $5,533,770 |
|
| Wells Fargo & Company, 8.000% (L)(Z) | 1,207,000 | 35,654,780 |
| | | |
| Consumer Finance 1.8% | | |
|
| HSBC Finance Corp., Depositary Shares, | | |
| Series B, 6.360% (Z) | 397,574 | 9,824,053 |
|
| SLM Corp., Series A, 6.970% (Z) | 74,000 | 3,328,520 |
| | | |
| Diversified Financial Services 17.7% | | |
|
| Bank of America Corp., 6.700% (Z) | 500,000 | 12,200,000 |
|
| Bank of America Corp., 6.375% (Z) | 139,000 | 3,308,200 |
|
| Bank of America Corp., 6.625% (L)(Z) | 355,000 | 8,843,050 |
|
| Bank of America Corp., 8.200% (Z) | 135,000 | 3,418,200 |
|
| Bank of America Corp., Depositary Shares, | | |
| Series D, 6.204% (Z) | 240,000 | 5,755,200 |
|
| Bank of America Corp., Series MER, 8.625% (C)(Z) | 652,800 | 16,816,128 |
|
| Citigroup Capital VIII, 6.950% (L)(Z) | 540,000 | 13,429,800 |
|
| Citigroup, Inc., 8.125% | 270,400 | 7,803,744 |
|
| Deutsche Bank Capital Funding Trust VIII, | | |
| 6.375% (Z) | 282,000 | 6,649,560 |
|
| Deutsche Bank Contingent Capital Trust II, | | |
| 6.550% (Z) | 310,000 | 7,545,400 |
|
| Deutsche Bank Contingent Capital Trust III, | | |
| 7.600% (L)(Z) | 797,893 | 20,513,829 |
|
| ING Groep NV, 7.050% (Z) | 140,000 | 3,259,200 |
|
| ING Groep NV, 6.200% (Z) | 109,100 | 2,316,193 |
|
| JPMorgan Chase & Company, 8.625% (Z) | 140,000 | 3,725,400 |
|
| RBS Capital Funding Trust VII, 6.080% | 983,000 | 14,007,750 |
| | | |
| Insurance 3.5% | | |
|
| MetLife, Inc., Series B, 6.500% (L)(Z) | 995,500 | 25,186,150 |
| | | |
| Thrifts & Mortgage Finance 0.0% | | |
|
| Federal National Mortgage Association, Series S, 7.750% (I) | 60,000 | 73,800 |
| | | |
| Telecommunication Services 2.8% | | 20,034,690 |
| | | |
| Diversified Telecommunication Services 1.8% | | |
|
| Qwest Corp., 7.375% | 366,000 | 9,545,280 |
|
| Qwest Corp., 7.500% | 120,000 | 3,145,200 |
| | | |
| Wireless Telecommunication Services 1.0% | | |
|
| Telephone & Data Systems, Inc., 6.875% | 243,000 | 6,553,710 |
|
| United States Cellular Corp., 6.950% | 30,000 | 790,500 |
| | | |
| Utilities 18.7% | | 136,585,301 |
| | | |
| Electric Utilities 14.0% | | |
|
| Alabama Power Company, Class A, 5.300% | 186,780 | 4,839,469 |
|
| Carolina Power & Light Company, 5.440% (Z) | 111,493 | 11,128,395 |
|
| Duquesne Light Company, 6.500% (Z) | 427,000 | 21,189,875 |
|
| Entergy Arkansas, Inc., 4.560% (Z) | 9,388 | 883,645 |
|
| Entergy Arkansas, Inc., 6.450% (Z) | 110,000 | 2,763,750 |
|
| Entergy Mississippi, Inc., 4.920% (Z) | 8,190 | 791,615 |
| | |
| See notes to financial statements | Semiannual report | Tax-Advantaged Dividend Income Fund | 9 |
| | |
| | Shares | Value |
| Electric Utilities (continued) | | |
|
| Entergy Mississippi, Inc., 6.250% (Z) | 197,500 | $4,962,187 |
|
| Mississippi Power Company, 5.250% | 262,500 | 6,764,625 |
|
| NextEra Energy Capital Holdings, Inc., 5.700% | 80,000 | 2,063,992 |
|
| PPL Corp., 9.500% (C)(Z) | 285,000 | 15,216,150 |
|
| PPL Electric Utilities Corp., Depositary Shares, | | |
| 6.250% (Z) | 600,000 | 14,982,000 |
|
| Southern California Edison Company, | | |
| 6.125% (Z) | 50,000 | 5,026,565 |
|
| Southern California Edison Company, Series C, | | |
| 6.000% (Z) | 117,000 | 11,696,349 |
| | | |
| Independent Power Producers & Energy Traders 2.2% | | |
|
| Constellation Energy Group, Inc., Series A, | | |
| 8.625% (L)(Z) | 600,000 | 16,026,000 |
| | | |
| Multi-Utilities 2.5% | | |
|
| BGE Capital Trust II, 6.200% (Z) | 160,500 | 4,039,785 |
|
| Consolidated Edison Company of New York, | | |
| Inc., Series A, 5.000% | 25,180 | 2,642,892 |
|
| Consolidated Edison Company of New York, | | |
| Inc., Series C, 4.650% | 13,219 | 1,333,902 |
|
| DTE Energy Company, 6.500% | 130,000 | 3,580,205 |
|
| Interstate Power & Light Company, Series B, | | |
| 8.375% (Z) | 230,000 | 6,653,900 |
| |
| Corporate Bonds 0.4% (0.3% of Total Investments) | | $3,130,860 |
|
| (Cost $3,000,000) | | |
| | | |
| Utilities 0.4% | | 3,130,860 |
| | | |
| Southern California Edison Company (6.25% to 2-1-22, | | |
| then 3 month LIBOR + 4.199%) | 3,000,000 | 3,130,860 |
| |
| Short-Term Investments 0.3% (0.2% of Total Investments) | | $2,441,000 |
|
| (Cost $2,441,000) | | |
| | | |
| Repurchase Agreement 0.3% | | 2,441,000 |
| | | |
| Repurchase Agreement with State Street Corp. dated 4-30-12 at 0.010% | | |
| to be repurchased at $2,441,001 on 5-1-12, collateralized by $2,475,000 | | |
| Federal National Mortgage Association, 3.000% due 3-28-22 (valued at | | |
| $2,490,668, including interest) | 2,441,000 | 2,441,000 |
| |
| Total investments (Cost $984,270,709)† 147.6% | $1,078,509,976 |
|
| |
| Other assets and liabilities, net (47.6%) | | ($348,007,301) |
|
| |
| Total net assets 100.0% | | $730,502,675 |
|
The percentage shown for each investment category is the total value of the category as a percentage of the net assets of the Fund.
| | |
| 10 | Tax-Advantaged Dividend Income Fund | Semiannual report | See notes to financial statements |
Notes to Schedule of Investments
ADR American Depositary Receipts
LIBOR London Interbank Offered Rate
(C) All or a portion of this security is segregated as collateral for options. Total collateral value at 4-30-12 was $111,181,520.
(I) Non-income producing security.
(L) A portion of this security is a Lent security as of 4-30-12, and is part of segregated collateral pursuant to the Committed Facility Agreement. Total value of Lent securities at 4-30-12 was $287,883,506 (see footnote Z below).
(Z) A portion of this security is segregated as collateral pursuant to the Committed Facility Agreement. Total collateral value at 4-30-12 was $717,088,472.
† At 4-30-12, the aggregate cost of investment securities for federal income tax purposes was $994,405,377. Net unrealized appreciation aggregated $84,104,599, of which $145,792,824 related to appreciated investment securities and $61,688,225 related to depreciated investment securities.
| | |
| See notes to financial statements | Semiannual report | Tax-Advantaged Dividend Income Fund | 11 |
F I N A N C I A L S T A T E M E N T S
Financial statements
Statement of assets and liabilities 4-30-12 (unaudited)
This Statement of assets and liabilities is the Fund’s balance sheet. It shows the value of what the Fund owns, is due and owes. You’ll also find the net asset value for each common share.
| |
| Assets | |
|
| Investments, at value (Cost $984,270,709) | $1,078,509,976 |
| Cash | 3,730,454 |
| Cash segregated at custodian for swap contracts | 1,770,000 |
| Receivable for investments sold | 1,748,088 |
| Dividends and interest receivable | 2,064,105 |
| Other receivables and prepaid expenses | 124,892 |
| | |
| Total assets | 1,087,947,515 |
| |
| Liabilities | |
|
| Payable for investments purchased | 9,152,000 |
| Committed facility agreement payable | 344,000,000 |
| Written options, at value (Premiums received $1,659,651) | 2,006,400 |
| Swap contracts, at value | 2,115,661 |
| Interest payable | 35,881 |
| Payable to affiliates | |
| Accounting and legal services fees | 9,801 |
| Trustees’ fees | 44,038 |
| Other liabilities and accrued expenses | 81,059 |
| | |
| Total liabilities | 357,444,840 |
| |
| Net assets | |
|
| Paid-in capital | $705,004,523 |
| Undistributed net investment income | 3,006,106 |
| Accumulated net realized loss on investments, written options | |
| and swap agreements | (69,284,811) |
| Net unrealized appreciation (depreciation) on investments, written options | |
| and swap agreements | 91,776,857 |
| | |
| Net assets | $730,502,675 |
| |
| Net asset value per share | |
|
| Based on 37,734,746 shares of beneficial interest outstanding — unlimited | |
| number of shares authorized with no par value | $19.36 |
| | |
| 12 | Tax-Advantaged Dividend Income Fund | Semiannual report | See notes to financial statements |
F I N A N C I A L S T A T E M E N T S
Statement of operations For the six-month period ended 4-30-12
(unaudited)
This Statement of operations summarizes the Fund’s investment income earned, expenses incurred in operating the Fund and net gains (losses) for the period stated.
| |
| Investment income | |
|
| Dividends | $28,174,500 |
| Interest | 217,283 |
| Less foreign taxes withheld | (83,529) |
| | |
| Total investment income | 28,308,254 |
| |
| Expenses | |
|
| Investment management fees | 3,916,959 |
| Accounting and legal services fees | 69,055 |
| Transfer agent fees | 19,250 |
| Trustees’ fees | 28,584 |
| Printing and postage | 52,150 |
| Professional fees | 46,676 |
| Custodian fees | 45,203 |
| Registration and filing fees | 9,702 |
| Interest expense | 1,667,919 |
| Stock exchange listing fees | 16,959 |
| Other | 7,307 |
| | |
| Total expenses | 5,879,764 |
| Less expense reductions | (169,439) |
| | |
| Net expenses | 5,710,325 |
| | |
| Net investment income | 22,597,929 |
| |
| Realized and unrealized gain (loss) | |
|
| Net realized gain (loss) on | |
| Investments | 14,894,394 |
| Written options | (877,805) |
| Swap contracts | (472,172) |
| | |
| | 13,544,417 |
| Change in net unrealized appreciation (depreciation) of | |
| Investments | 28,273,637 |
| Written options | (209,098) |
| Swap contracts | (960,596) |
| | |
| | 27,103,943 |
| | |
| Net realized and unrealized gain | 40,648,360 |
| | |
| Increase in net assets from operations | $63,246,289 |
| | |
| See notes to financial statements | Semiannual report | Tax-Advantaged Dividend Income Fund | 13 |
F I N A N C I A L S T A T E M E N T S
Statements of changes in net assets
These Statements of changes in net assets show how the value of the Fund’s net assets has changed during the last two periods. The difference reflects earnings less expenses, any investment gains and losses, distributions, if any, paid to shareholders and the net of Fund share transactions.
| | |
| | Six months | |
| | ended | Year |
| | 4-30-12 | ended |
| | (unaudited) | 10-31-11 |
| |
| Increase (decrease) in net assets | | |
|
| From operations | | |
| Net investment income | $22,597,929 | $45,397,254 |
| Net realized gain | 13,544,417 | 14,383,305 |
| Change in net unrealized appreciation (depreciation) | 27,103,943 | 46,038,333 |
| | | |
| Increase in net assets resulting from operations | 63,246,289 | 105,818,892 |
| | | |
| Distributions to shareholders | | |
| From net investment income | (22,301,235) | (42,434,737) |
| | | |
| From Fund share transactions | | |
| Repurchased | — | (4,227,969) |
| | | |
| Total increase | 40,945,054 | 59,156,186 |
| | | |
| Net assets | | |
|
| Beginning of period | 689,557,621 | 630,401,435 |
| | | |
| End of period | $730,502,675 | $689,557,621 |
| | | |
| Undistributed net investment income | $3,006,106 | $2,709,412 |
| | | |
| Share activity | | |
|
| Shares outstanding | | |
| Beginning of period | 37,734,746 | 38,011,417 |
| Repurchased | — | 276,671 |
| | | |
| End of period | 37,734,746 | 37,734,746 |
| | |
| 14 | Tax-Advantaged Dividend Income Fund | Semiannual report | See notes to financial statements |
F I N A N C I A L S T A T E M E N T S
Statement of cash flows
This Statement of cash flows shows cash flow from operating and financing activities for the period stated.
| |
| | For the |
| | six-month |
| | period ended |
| | 4-30-12 |
| Cash flows from operating activities | |
|
| Net increase in net assets from operations | $63,246,289 |
| Adjustments to reconcile net increase in net assets from operations to net | |
| cash provided by operating activities: | |
| Long-term investments purchased | (66,195,074) |
| Long-term investments sold | 55,352,120 |
| Decrease in short term investments | 524,000 |
| Decrease in dividends and interest receivable | 366,803 |
| Increase in payable for investments purchased | 9,049,674 |
| Decrease in receivable for investments sold | 6,177,967 |
| Increase in cash segregated at custodian for swap contracts | (1,360,000) |
| Increase in other receivables and prepaid expenses | (28,199) |
| Increase in unrealized depreciation of swap contracts | 960,596 |
| Increase in payable for written options | 40,300 |
| Increase in payable to affiliates | 10,493 |
| Decrease in interest payable | (257) |
| Decrease in other liabilities and accrued expenses | (38,266) |
| Net change in unrealized (appreciation) depreciation on investments | (28,273,637) |
| Net realized gain on investments | (14,894,394) |
| | |
| Net cash provided by operating activities | $24,938,415 |
|
| Cash flows from financing activities | |
| Distributions to common shareholders | (22,301,235) |
| | |
| Net cash used in financing activities | ($22,301,235) |
| | |
| Net increase in cash | $2,637,180 |
| |
| Cash at beginning of period | $1,093,274 |
| | |
| Cash at end of period | $3,730,454 |
| | |
| Supplemental disclosure of cash flow information | |
|
| Cash paid for interest | $1,668,176 |
| | |
| See notes to financial statements | Semiannual report | Tax-Advantaged Dividend Income Fund | 15 |
Financial highlights
The Financial highlights show how the Fund’s net asset value for a share has changed during the period.
| | | | | | | |
| COMMON SHARES | | | | | | | |
| Period ended | 4-30-121 | 10-31-11 | 10-31-10 | 10-31-092 | 12-31-08 | 12-31-07 | 12-31-06 |
| |
| Per share operating performance | | | | | | |
|
| Net asset value, | | | | | | | |
| beginning of period | $18.27 | $16.58 | $12.87 | $12.48 | $19.99 | $22.90 | $19.93 |
| Net investment income3 | 0.60 | 1.20 | 1.10 | 0.88 | 1.13 | 1.26 | 1.434 |
| Net realized and | | | | | | | |
| unrealized gain (loss) | | | | | | | |
| on investments | 1.08 | 1.60 | 3.69 | 0.56 | (7.07) | (1.98) | 3.62 |
| Distributions to Auction | | | | | | | |
| Preferred Shares (APS)* | — | — | — | — | (0.15) | (0.41) | (0.39) |
| Total from investment | | | | | | | |
| operations | 1.68 | 2.80 | 4.79 | 1.44 | (6.09) | (1.13) | 4.66 |
| Less distributions to | | | | | | | |
| common shareholders | | | | | | | |
| From net | | | | | | | |
| investment income | (0.59) | (1.12) | (1.09) | (0.83) | (0.99) | (1.19) | (1.16) |
| From net realized gain | — | — | — | — | (0.15) | (0.59) | (0.53) |
| From tax return of capital | — | — | — | (0.23) | (0.44) | — | — |
| Total distributions | (0.59) | (1.12) | (1.09) | (1.06) | (1.58) | (1.78) | (1.69) |
| Anti-dilutive impact of | | | | | | | |
| repurchase plan | — | 0.015 | 0.015 | 0.015 | 0.165 | — | — |
| Net asset value, end | | | | | | | |
| of period | $19.36 | $18.27 | $16.58 | $12.87 | $12.48 | $19.99 | $22.90 |
| Per share market value, | | | | | | | |
| end of period | $17.79 | $16.64 | $15.41 | $11.35 | $10.30 | $17.90 | $20.32 |
| Total return at net | | | | | | | |
| asset value (%)6,7 | 9.558 | 18.16 | 39.49 | 15.348 | (29.97) | (4.19) | (25.67)9 |
| Total return at market | | | | | | | |
| value (%)6 | 10.528 | 15.79 | 47.01 | 23.248 | (35.46) | (3.32) | (32.21) |
| |
| Ratios and supplemental data | | | | | | |
|
| Net assets applicable to | | | | | | | |
| common shares, end | | | | | | | |
| of period (in millions) | $731 | $690 | $630 | $493 | $480 | $841 | $964 |
| Ratios (as a percentage | | | | | | | |
| of average net assets): | | | | | | | |
| Expenses before | | | | | | | |
| reductions (excluding | | | | | | | |
| interest expense) | 1.2010 | 1.2411 | 1.39 | 1.3910 | 1.42 | 1.2712 | 1.2812 |
| Interest expense | | | | | | | |
| (Note 8) | 0.4710 | 0.53 | 0.64 | 0.8710 | 0.87 | —12 | —12 |
| Expenses before | | | | | | | |
| reductions (including | | | | | | | |
| interest expense) | 1.6710 | 1.7711 | 2.03 | 2.2610 | 2.29 | 1.2712 | 1.2812 |
| Expenses net of | | | | | | | |
| fee waivers and | | | | | | | |
| credits (excluding | | | | | | | |
| interest expense) | 1.1510 | 1.0311 | 1.22 | 1.1410 | 1.12 | 0.99 | 1.00 |
| | |
| 16 | Tax-Advantaged Dividend Income Fund | Semiannual report | See notes to financial statements |
| | | | | | | |
| COMMON SHARES | | | | | | | |
| Period ended | 4-30-121 | 10-31-11 | 10-31-10 | 10-31-092 | 12-31-08 | 12-31-07 | 12-31-06 |
| |
| Ratios and supplemental data | | | | | | |
|
| Expenses net of | | | | | | | |
| fee waivers and | | | | | | | |
| credits (including | | | | | | | |
| interest expense) | 1.6310 | 1.5611 | 1.86 | 2.0110 | 1.99 | 0.9913 | 1.0013 |
| Net investment income | 6.4310 | 6.98 | 7.37 | 9.4410 | 7.02 | 5.6514 | 6.764,14 |
| Portfolio turnover (%) | 5 | 16 | 20 | 21 | 29 | 26 | 41 |
| |
| Senior securities | | | | | | | |
|
| Total value of APS | | | | | | | |
| outstanding | | | | | | | |
| (in millions) | — | — | — | — | — | $380 | $380 |
| Involuntary liquidation | | | | | | | |
| preference per unit | | | | | | | |
| (in thousands) | — | — | — | — | — | 25 | 25 |
| Average market value | | | | | | | |
| per unit (in thousands) | — | — | — | — | — | 25 | 25 |
| Asset coverage per unit15 | — | — | — | — | — | $81,737 | $88,352 |
| Total debt outstanding | | | | | | | |
| end of period (in | | | | | | | |
| millions) (Note 8) | $344 | $344 | $311 | $253 | $267 | — | — |
| Asset coverage per | | | | | | | |
| $1,000 of APS16 | — | — | — | — | — | $3,212 | $3,536 |
| Asset coverage per | | | | | | | |
| $1,000 of debt17 | $3,124 | $3,005 | $3,030 | $2,946 | $2,797 | — | — |
* Auction Preferred Shares (APS).
1 Six months ended 4-30-12. Unaudited.
2 For the ten-month period ended 10-31-09. The Fund changed its fiscal year end from December 31 to October 31.
3 Based on the average daily shares outstanding.
4 Net investment income per share and ratio of net investment income to average net assets reflects a special dividend received by the Fund, which amounted to $0.13 per share and 0.63% of average net assets.
5 The repurchase plan was completed at an average repurchase price of $15.28, $13.80, $10.29 and $14.92, respectively, for 276,671, 302,900 shares, 173,600 shares and 3,589,570 shares, respectively. The repurchases for the periods ended 10-31-11, 10-31-10, 10-31-09 and 12-31-08 were $4,227,969, $4,178,919, $1,786,938 and $53,556,991, respectively, and had a $0.01, $0.01, $0.01 and $0.16 NAV impact, respectively.
6 Total return based on net asset value reflects changes in the Fund’s net asset value during each period. Total return based on market value reflects changes in market value. Each figure assumes that dividend and capital gain distributions, if any, were reinvested. These figures will differ depending upon the level of any discount from or premium to net asset value at which the Fund’s shares traded during the period.
7 Total returns would have been lower had certain expenses not been reduced during the periods shown.
8 Not annualized.
9 Unaudited.
10 Annualized.
11 Includes non-recurring litigation fees which represent 0.02% and 0.14% of average net assets for the years ended 10-31-11 and 10-31-10, respectively. Insurance recovery expense reduction for the year ended 10-31-11 represents 0.11% of average net assets.
12 Ratios calculated on the basis of gross expenses relative to the average net assets of common shares that does not take into consideration expense reductions during the periods shown. Without the exclusion of preferred shares, the annualized ratio of expenses would have been 0.90% and 0.90% for the periods ended 12-31-07 and 12-31-06, respectively.
13 Ratios calculated on the basis of net expenses relative to the average net assets of common shares. Without the exclusion of preferred shares, the annualized ratio of expenses would have been 0.70% and 0.70% for the periods ended 12-31-07 and 12-31-06, respectively.
14 Ratios calculated on the basis of net investment income relative to the average net assets of common shares. Without the exclusion of preferred shares, the annualized ratio of net investment income would have been 4.03% and 4.74% for the periods ended 12-31-07 and 12-31-06, respectively.
15 Calculated by subtracting the Fund’s total liabilities from the Fund’s total assets and dividing that amount by the number of APS outstanding as of the applicable 1940 Act Evaluation Date, which may differ from the financial reporting date.
16 Asset coverage equals the total net assets plus APS divided by the APS of the Fund outstanding at period end.
17 Asset coverage equals the total net assets plus borrowings divided by the borrowings of the Fund outstanding at period end. As debt outstanding changes, level of invested assets may change accordingly. Asset coverage ratio provides a consistent measure of leverage.
| | |
| See notes to financial statements | Semiannual report | Tax-Advantaged Dividend Income Fund | 17 |
Notes to financial statements
(unaudited)
Note 1 — Organization
John Hancock Tax-Advantaged Dividend Income Fund (the Fund) is a closed-end management investment company organized as a Massachusetts business trust and registered under the Investment Company Act of 1940, as amended (the 1940 Act).
Note 2 — Significant accounting policies
The financial statements have been prepared in conformity with accounting principles generally accepted in the United States of America, which require management to make certain estimates and assumptions at the date of the financial statements. Actual results could differ from those estimates. Events or transactions occurring after the end of the fiscal period through the date that the financial statements were issued have been evaluated in the preparation of the financial statements. The following summarizes the significant accounting policies of the Fund:
Security valuation. Investments are stated at value as of the close of regular trading on the New York Stock Exchange (NYSE), normally at 4:00 P.M., Eastern Time. The Fund uses a three-tier hierarchy to prioritize the pricing assumptions, referred to as inputs, used in valuation techniques to measure fair value. Level 1 includes securities valued using quoted prices in active markets for identical securities. Level 2 includes securities valued using significant observable inputs. Observable inputs may include quoted prices for similar securities, interest rates, prepayment speeds and credit risk. Prices for securities valued using these inputs are received from independent pricing vendors and brokers and are based on an evaluation of the inputs described. Level 3 includes securities valued using significant unobservable inputs when market prices are not readily available or reliable, including the Fund’s own assumptions in determining the fair value of investments. Factors used in determining value may include market or issuer specific events, changes in interest rates and credit quality. The inputs or methodology used for valuing securities are not necessarily an indication of the risks associated with investing in those securities.
| |
| 18 | Tax-Advantaged Dividend Income Fund | Semiannual report |
The following is a summary of the values by input classification of the Fund’s investments as of April 30, 2012, by major security category or type:
| | | | |
| | | | | LEVEL 3 |
| | | | LEVEL 2 | SIGNIFICANT |
| | TOTAL MARKET | LEVEL 1 | SIGNIFICANT | UNOBSERVABLE |
| | VALUE AT 4-30-12 | QUOTED PRICE | OBSERVABLE INPUTS | INPUTS |
|
| Common Stocks | | | | |
| Energy | $77,417,505 | $77,417,505 | — | — |
| Industrials | 9,006,800 | 9,006,800 | — | — |
| Materials | 3,140,600 | 3,140,600 | — | — |
| Telecommunication | | | | |
| Services | 35,533,730 | 35,533,730 | — | — |
| Utilities | 498,736,230 | 498,736,230 | — | — |
| Preferred Securities | | | | |
| Energy | 29,478,942 | 29,478,942 | — | — |
| Financials | 263,004,318 | 263,000,921 | $3,397 | — |
| Telecommunication | | | | |
| Services | 20,034,690 | 20,034,690 | — | — |
| Utilities | 136,585,301 | 72,498,723 | 64,086,578 | — |
| Corporate Bonds | | | | |
| Utilities | 3,130,860 | — | 3,130,860 | — |
| Short-Term Investments | 2,441,000 | — | 2,441,000 | — |
| |
|
| Total Investments in | | | | |
| Securities | $1,078,509,976 | $1,008,848,141 | $69,661,835 | — |
| Other Financial | | | | |
| Instruments | | | | |
| Written Options | ($2,006,400) | ($2,006,400) | — | — |
| Interest Rate Swaps | ($2,115,661) | — | ($2,115,661) | — |
Changes in valuation techniques may result in transfers into or out of an assigned level within the disclosure hierarchy. During the six months ended April 30, 2012, there were no significant transfers between Level 1 and Level 2.
In order to value the securities, the Fund uses the following valuation techniques. Equity securities held by the Fund are valued at the last sale price or official closing price on the principal securities exchange on which they trade. In the event there were no sales during the day or closing prices are not available, then securities are valued using the last quoted bid or evaluated price. Options listed on an exchange are valued at the mean between the last bid and ask prices from the exchange on which they are principally traded. For options not listed on an exchange, an independent pricing source is used to value the options at the mean between the last bid and ask prices. Foreign securities and currencies are valued in U.S. dollars, based on foreign currency exchange rates supplied by an independent pricing service. Certain securities traded only in the over-the-counter market are valued at the last bid price quoted by brokers making markets in the securities at the close of trading. Certain short-term securities are valued at amortized cost. Other portfolio securities and assets, where market quotations are not readily available, are valued at fair value, as determined in good faith by the Fund’s Pricing Committee, following procedures established by the Board of Trustees.
Repurchase agreements. The Fund may enter into repurchase agreements. When the Fund enters into a repurchase agreement, it receives collateral which is held in a segregated account by the Fund’s custodian. The collateral amount is marked-to-market and monitored on a daily basis to ensure that the collateral held is in an amount not less than the principal amount of the repurchase agreement plus any accrued interest. In the event of a default by the counterparty, realization of the collateral proceeds could be delayed, during which time the collateral value may decline.
| |
| Semiannual report | Tax-Advantaged Dividend Income Fund | 19 |
Security transactions and related investment income. Investment security transactions are accounted for on a trade date plus one basis for daily net asset value calculations. However, for financial reporting purposes, investment transactions are reported on trade date. Interest income is accrued as earned. Dividend income is recorded on the ex-date, except for dividends of foreign securities where the dividend may not be known until after the ex-date. In those cases, dividend income is recorded when the Fund becomes aware of the dividends. Gains and losses on securities sold are determined on the basis of identified cost and may include proceeds from litigation.
Overdrafts. Pursuant to the custodian agreement, the Fund’s custodian may, in its discretion, advance funds to the Fund to make properly authorized payments. When such payments result in an overdraft, the Fund is obligated to repay the custodian for any overdraft, including any costs or expenses associated with the overdraft. The custodian may have a lien, security interest or security entitlement in any Fund property that is not otherwise segregated or pledged, to the maximum extent permitted by law, to the extent of any overdraft.
Expenses. Within the John Hancock Funds complex, expenses that are directly attributable to an individual fund are allocated to the fund. Expenses that are not readily attributable to a specific fund are allocated among all funds in an equitable manner, taking into consideration, among other things, the nature and type of expense and the fund’s relative net assets. Expense estimates are accrued in the period to which they relate and adjustments are made when actual amounts are known.
Federal income taxes. The Fund intends to continue to qualify as a regulated investment company by complying with the applicable provisions of the Internal Revenue Code and will not be subject to federal income tax on taxable income that is distributed to shareholders. Therefore, no federal income tax provision is required.
Under the Regulated Investment Company Modernization Act of 2010, the Fund is permitted to carry forward capital losses incurred in taxable years beginning after December 22, 2010 for an unlimited period. Any losses incurred during those taxable years will be required to be utilized prior to the losses incurred in pre-enactment taxable years. As a result of this ordering rule, pre-enactment capital loss carryforwards may be more likely to expire unused. Additionally, post-enactment capital losses that are carried forward will retain their character as either short-term or long-term capital losses rather than being considered all short-term as under previous law.
For federal income tax purposes, the Fund has a capital loss carryforward of $73,064,194 available to offset future net realized capital gains as of October 31, 2011, which expires as follows: October 31, 2017 — $73,064,194.
As of October 31, 2011, the Fund had no uncertain tax positions that would require financial statement recognition, derecognition or disclosure. The Fund’s federal tax returns are subject to examination by the Internal Revenue Service for a period of three years.
Distribution of income and gains. Distributions to shareholders from net investment income and net realized gains, if any, are recorded on the ex-date. The Fund generally declares and pays dividends monthly and capital gain distributions, if any, annually.
Such distributions, on a tax basis, are determined in conformity with income tax regulations, which may differ from accounting principles generally accepted in the United States of America.
Capital accounts within the financial statements are adjusted for permanent book-tax differences. These adjustments have no impact on net assets or the results of operations. Temporary book-tax differences, if any, will reverse in a subsequent period. Book-tax differences are primarily attributable to derivative transactions, wash sales loss deferrals and litigation proceeds.
| |
| 20 | Tax-Advantaged Dividend Income Fund | Semiannual report |
Statement of cash flows. Information on financial transactions that have been settled through the receipt and disbursement of cash is presented in the Statement of cash flows. The cash amount shown in the Statement of cash flows is the amount included in the Fund’s Statement of assets and liabilities and represents the cash on hand at its custodian and does not include any short-term investments or cash segregated at custodian for swap contracts.
New accounting pronouncements. In May 2011, Accounting Standards Update 2011-04 (ASU 2011-04), Amendments to Achieve Common Fair Value Measurement and Disclosure Requirements in U.S. GAAP and IFRSs, was issued and is effective during interim and annual periods beginning after December 15, 2011. ASU 2011-04 may result in additional disclosure for transfers between levels as well as expanded disclosure for securities categorized as Level 3 under the fair value hierarchy.
In December 2011, the Financial Accounting Standards Board issued Accounting Standards Update No. 2011-11 (ASU 2011-11), Disclosures about Offsetting Assets and Liabilities. The update creates new disclosure requirements requiring entities to disclose both gross and net information for derivatives and other financial instruments that are either offset in the Statement of assets and liabilities or subject to an enforceable master netting arrangement or similar agreement. The disclosure requirements are effective for annual reporting periods beginning on or after January 1, 2013 and interim periods within those annual periods. ASU 2011-11 may result in additional disclosure relating to the presentation of derivatives.
Note 3 — Derivative instruments
The Fund invests in derivatives in order to meet its investment objective. The use of derivatives may involve risks different from, or potentially greater than, the risks associated with investing directly in securities. Specifically, the Fund is exposed to the risk that the counterparty to an over-the-counter (OTC) derivatives contract will be unable or unwilling to make timely settlement payments or otherwise honor its obligations. OTC derivatives transactions typically can only be closed out with the other party to the transaction. If the counterparty defaults, the Fund will have contractual remedies, but there is no assurance that the counterparty will meet its contractual obligations or that the Fund will succeed in enforcing them.
The Fund has entered into collateral agreements with certain counterparties to mitigate counterparty risk on over-the-counter derivatives. Subject to established minimum levels, collateral is generally determined based on the net aggregate unrealized gain or loss on contracts with a particular counterparty. Collateral pledged to the Fund is held by the custodian bank for the benefit of the Fund and can be in the form of cash or debt securities issued by the U.S. government or related agencies; collateral posted by the Fund is held in a segregated account at the Fund’s custodian and is noted in the accompanying portfolio of investments, or if cash is posted, on the Statement of assets and liabilities. As of April 30, 2012, $1,770,000 was posted by the Fund for the benefit of counterparties.
Options. There are two types of options, a put option and a call option. Options are traded either over-the-counter or on an exchange. A call option gives the purchaser of the option the right to buy (and the seller the obligation to sell) the underlying instrument at the exercise price. A put option gives the purchaser of the option the right to sell (and the writer the obligation to buy) the underlying instrument at the exercise price. Writing puts and buying calls may increase the Fund’s exposure to changes in the value of the underlying instrument. Buying puts and writing calls may decrease the Fund’s exposure to such changes. Risks related to the use of options include the loss of the premium, possible illiquidity of the options markets, trading restrictions imposed by an exchange and movements in underlying security values, and for written options, potential losses in excess of the amounts recognized on the Statement of assets and liabilities.
| |
| Semiannual report | Tax-Advantaged Dividend Income Fund | 21 |
When the Fund purchases an option, the premium paid by the Fund is included in the Portfolio of Investments and subsequently “marked-to-market” to reflect current market value. If the purchased option expires, the Fund realizes a loss equal to the cost of the option. If the Fund exercises a call option, the cost of the securities acquired by exercising the call is increased by the premium paid to buy the call. If the Fund exercises a put option, it realizes a gain or loss from the sale of the underlying security and the proceeds from such sale are decreased by the premium paid. If the Fund enters into a closing sale transaction, the Fund realizes a gain or loss, depending on whether proceeds from the closing sale are greater or less than the original cost. When the Fund writes an option, the premium received is included as a liability and subsequently “marked-to-market” to reflect current market value of the option written. Premiums received from writing options that expire unexercised are recorded as realized gains. Premiums received from writing options which are exercised or are closed are added to or offset against the proceeds or amount paid on the transaction to determine the realized gain or loss. If a put option on a security is exercised, the premium received reduces the cost basis of the securities purchased by the Fund.
During the six months ended April 30, 2012, the Fund wrote option contracts to hedge against changes in securities markets and to generate potential income. The following tables summarize the Fund’s written options activities during the six months ended April 30, 2012 and the contracts held at April 30, 2012.
| | |
| | NUMBER OF | |
| | CONTRACTS | PREMIUM RECEIVED |
|
| Outstanding, beginning of period | 2,045 | $1,828,449 |
| Options written | 12,027 | 16,679,235 |
| Options expired | (4,825) | (5,156,295) |
| Options closed | (8,147) | (11,691,738) |
| Outstanding, end of period | 1,100 | $1,659,651 |
| | | | | | |
| | EXERCISE | | EXPIRATION | NUMBER OF | | |
| NAME OF ISSUER | PRICE | | DATE | CONTRACTS | PREMIUM | VALUE |
|
| CALLS | | | | | | |
| S&P 500 Index | $1,420 | | May 2012 | 580 | $335,224 | ($394,400) |
| S&P 500 Index | 1,375 | | May 2012 | 520 | 1,324,427 | (1,612,000) |
| Total | | | | 1,100 | $1,659,651 | ($2,006,400) |
Interest rate swaps. Interest rate swaps represent an agreement between a Fund and counterparty to exchange cash flows based on the difference between two interest rates applied to a notional amount. The payment flows are usually netted against each other, with the difference being paid by one party to the other. The Fund settles accrued net interest receivable or payable under the swap contracts at specified, future intervals. Upfront payments made/received by the Fund are amortized/accreted for financial reporting purposes, with the unamortized/unaccreted portion included in the Statement of assets and liabilities. Swaps are marked-to-market daily based upon values from third party vendors or broker quotations, and the change in value is recorded as unrealized appreciation/depreciation of swap contracts. A termination payment by the counterparty or the Fund is recorded as realized gain or loss, as well as the net periodic payments received or paid by the Fund.
Entering into swap agreements involves, to varying degrees, elements of credit, market and documentation risk that may amount to values that are in excess of the amounts recognized on the Statement of assets and liabilities. Such risks involve the possibility that there will be no liquid market for the swap, or that a counterparty may default on its obligation or delay payment under the swap terms. The counterparty may disagree or contest the terms of the swap. Market risks may also accompany the swap, including interest rate risk. The Fund may also suffer losses if it is unable to terminate or assign outstanding swaps or reduce its exposure through offsetting transactions.
| |
| 22 | Tax-Advantaged Dividend Income Fund | Semiannual report |
During the six months ended April 30, 2012, the Fund used interest rate swaps in anticipation of rising interest rates. The following table summarizes the interest rate swap contracts held as of April 30, 2012.
| | | | | | | |
| | USD | | PAYMENTS | PAYMENTS | | | |
| | NOTIONAL | | MADE | RECEIVED | MATURITY | | |
| COUNTERPARTY | AMOUNT | | BY FUND | BY FUND | DATE | MARKET VALUE | |
| |
| Morgan Stanley | $86,000,000 | | 1.4625% | 3-month | Aug 2016 | ($2,115,661) | |
| Capital Services | | | | LIBOR (a) | | | |
| | | | | | | | |
| (a) At 4-30-12, the 3-month LIBOR rate was 0.46585%. | | | | |
Interest rate swap positions at April 30, 2012 were entered into on August 5, 2011. No other interest rate swap activity occurred during the six months ended April 30, 2012.
Fair value of derivative instruments by risk category
The table below summarizes the fair value of derivatives held by the Fund at April 30, 2012 by risk category:
| | | | |
| | | FINANCIAL | ASSET | LIABILITY |
| | STATEMENT OF ASSETS AND | INSTRUMENTS | DERIVATIVES | DERIVATIVES |
| RISK | LIABILITIES LOCATION | LOCATION | FAIR VALUE | FAIR VALUE |
|
| Equity contracts | Payable for written options, | Written options | — | ($2,006,400) |
| | at value | | | |
| Interest rate contracts | Unrealized depreciation of | Interest rate | — | (2,115,661) |
| | swap contracts | swaps | | |
| Total | | | — | ($4,122,061) |
Effect of derivative instruments on the Statement of operations
The table below summarizes the net realized gain (loss) included in the net increase (decrease) in net assets from operations, classified by derivative instrument and risk category, for the six months ended April 30, 2012:
| | | | |
| | STATEMENT OF | | SWAP | |
| RISK | OPERATIONS LOCATION | WRITTEN OPTIONS | CONTRACTS | TOTAL |
|
| Equity contracts | Net realized gain (loss) | ($877,805) | — | ($877,805) |
| Interest rate | Net realized gain (loss) | — | ($472,172) | ($472,172) |
| contracts | | | | |
| Total | | ($877,805) | ($472,172) | ($1,349,977) |
The table below summarizes the net change in unrealized appreciation (depreciation) included in the net increase (decrease) in net assets from operations, classified by derivative instrument and risk category, for the six months ended April 30, 2012:
| | | | |
| | STATEMENT OF | | SWAP | |
| RISK | OPERATIONS LOCATION | WRITTEN OPTIONS | CONTRACTS | TOTAL |
|
| Equity contracts | Change in unrealized | ($209,098) | — | ($209,098) |
| | appreciation | | | |
| | (depreciation) | | | |
| Interest rate | Change in unrealized | — | ($960,596) | ($960,596) |
| contracts | appreciation | | | |
| | (depreciation) | | | |
| Total | | ($209,098) | ($960,596) | ($1,169,694) |
| |
| Semiannual report | Tax-Advantaged Dividend Income Fund | 23 |
Note 4 — Guarantees and indemnifications
Under the Fund’s organizational documents, its Officers and Trustees are indemnified against certain liabilities arising out of the performance of their duties to the Fund. Additionally, in the normal course of business, the Fund enters into contracts with service providers that contain general indemnification clauses. The Fund’s maximum exposure under these arrangements is unknown, as this would involve future claims that may be made against the Fund that have not yet occurred. The risk of material loss from such claims is considered remote.
Note 5 — Fees and transactions with affiliates
John Hancock Advisers, LLC (the Adviser) serves as investment adviser for the Fund. The Adviser is an indirect, wholly owned subsidiary of Manulife Financial Corporation (MFC).
Management fee. The Fund has an investment management agreement with the Adviser under which the Fund pays a daily management fee to the Adviser equivalent, on an annual basis, to 0.75% of the Fund’s average daily net assets and the value attributed to the Committed Facility Agreement (see Note 8) (collectively, managed assets). The Adviser has a subadvisory agreement with John Hancock Asset Management a division of Manulife Asset Management (US) LLC, an indirectly owned subsidiary of MFC and an affiliate of the Adviser, and Analytic Investors LLC. The Fund is not responsible for payment of the subadvisory fees.
The Adviser has contractually agreed to limit the Fund’s management fee to 0.70% of average daily managed assets from February 27, 2011 until February 27, 2012. Accordingly, the expense reductions related to the reduction in the management fee amounted to $169,439 for the six months ended April 30, 2012. Effective February 28, 2012, the agreement was not renewed.
The investment management fees, including the impact of the waivers and reimbursements described above, incurred for the six months ended April 30, 2012 were equivalent to a net annual effective rate of 0.72% of the Fund’s average daily managed assets.
Accounting and legal services. Pursuant to a service agreement, the Fund reimburses the Adviser for all expenses associated with providing the administrative, financial, legal, accounting and recordkeeping services to the Fund, including the preparation of all tax returns, periodic reports to shareholders and regulatory reports, among other services. These accounting and legal services fees incurred for the six months ended April 30, 2012 amounted to an annual rate of 0.02% of the Fund’s average daily net assets.
Trustee expenses. The Fund compensates each Trustee who is not an employee of the Adviser or its affiliates. These Trustees may, for tax purposes, elect to defer receipt of this compensation under the John Hancock Group of Funds Deferred Compensation Plan (the Plan). Deferred amounts are invested in various John Hancock funds and remain in the funds until distributed in accordance with the Plan. The investment of deferred amounts and the offsetting liability are included within Other receivables and prepaid expenses and Payable to affiliates — Trustees’ fees, respectively, in the accompanying Statement of assets and liabilities.
Note 6 — Fund share transactions
In December 2007, the Trustees approved a share repurchase plan, which has been subsequently reviewed and approved by the Board of Trustees each year in December. Under the current share repurchase plan, the Fund may repurchase in the open market up to 10% of its outstanding common shares as of December 31, 2011. The plan will remain in effect between January 1, 2012 and December 31, 2012.
| |
| 24 | Tax-Advantaged Dividend Income Fund | Semiannual report |
During the six months ended April 30, 2012, the Fund did not repurchase any shares under the repurchase plan. During the year ended October 31, 2011, the Fund repurchased 0.73% of its common shares outstanding under the repurchase plan. The weighted average discount per share on these repurchases amount to 9.3% for the year ended October 31, 2011. Shares repurchased and corresponding dollar amounts are included on the Statement of changes in net assets.
Note 7 — Leverage risk
The Fund utilizes a Committed Facility Agreement (CFA) to increase its assets available for investment. When the Fund leverages its assets, common shareholders bear the fees associated with the CFA and have the potential to benefit or be disadvantaged from the use of leverage. The Adviser’s fee is also increased in dollar terms from the use of leverage. Consequently, the Fund and the Adviser may have differing interests in determining whether to leverage the Fund’s assets. Leverage creates risks that may adversely affect the return for the shareholders of common shares, including:
• the likelihood of greater volatility of net asset value and market price of common shares
• fluctuations in the interest rate paid for the use of the credit facility
• increased operating costs, which may reduce the Fund’s total return
• the potential for a decline in the value of an investment acquired through leverage, while the Fund’s obligations under such leverage remains fixed
• the Fund is more likely to have to sell securities in a volatile market in order to meet asset coverage or other debt compliance requirements
To the extent the income or capital appreciation derived from securities purchased with funds received from leverage exceeds the cost of leverage, the Fund’s return will be greater than if leverage had not been used, conversely, returns would be lower if the cost of the leverage exceeds the income or capital appreciation derived.
In addition to the risk created by the Fund’s use of leverage, the Fund is subject to the risk that it would be unable to timely, or at all, obtain replacement financing if the CFA is terminated. Were this to happen, the Fund would be required to de-leverage, selling securities at a potentially inopportune time and incurring tax consequences. Further, the Fund’s ability to generate income from the use of leverage would be adversely affected.
Note 8 — Committed Facility Agreement
The Fund has entered into a CFA with a subsidiary of BNP Paribas (BNP) that allows it to borrow up to $344 million and to invest the borrowings in accordance with its investment practices.
Borrowings under the CFA are secured by the assets of the Fund as disclosed in the Fund’s investments. Interest charged is at the rate of one-month LIBOR plus 0.70% and is payable monthly. The Fund also pays a commitment fee of 0.60% per annum on the unused portion of the facility. As of April 30, 2012, the Fund had borrowings of $344,000,000 at an interest rate of 0.94%, which is reflected on the Statement of assets and liabilities. During the six months ended April 30, 2012, the average borrowings under the CFA and the effective average interest rate were $344,000,000 and 0.98%, respectively.
| |
| Semiannual report | Tax-Advantaged Dividend Income Fund | 25 |
The Fund may terminate the agreement with 30 days’ notice. If certain asset coverage and collateral requirements, minimum net assets or other covenants are not met, the CFA could be deemed in default and result in termination. Absent a default or a facility termination event, BNP is required to provide the Fund with 360 days’ notice prior to terminating or amending the CFA.
The Fund has an agreement with BNP that allows BNP to borrow a portion of the pledged collateral (Lent Securities) in an amount not to exceed the lesser of: (i) outstanding borrowings owed by the Fund to BNP and (ii) thirty-three and one-third percent of the Fund’s total assets. The Fund can designate any security within the pledged collateral as ineligible to be a Lent Security and can recall the Lent Securities. The Fund also has the right to apply and set-off an amount equal to one hundred percent (100%) of the then-current fair market value of such Lent Securities against the current borrowings under the CFA in the event that BNP fails to timely return the Lent Securities and in certain other circumstances. In such circumstance, however, the Fund may not be able to obtain replacement financing required to purchase replacement securities and, consequently, the Fund’s income generating potential may decrease. Even if the Fund is able to obtain replacement financing, it might not be able to purchase replacement securities at favorable prices. Income earned from Lent Securities is recorded as a component of interest income on the Statement of operations. During the six months ended April 30, 2012, the Fund recorded $162,949 in income from Lent Securities.
Note 9 — Purchase and sale of securities
Purchases and sales of securities, other than short-term securities, aggregated $66,195,074 and $55,352,120, respectively, for the six months ended April 30, 2012.
Note 10 — Industry or sector risk
From time to time the Fund may invest a large percentage of its assets in one or more particular industries or sectors of the economy. If a large percentage of the Fund’s assets are economically tied to a single or small number of industries or sectors of the economy, the Fund will be less diversified than a more broadly diversified fund, and it may cause the Fund to underperform if that industry or sector underperforms. In addition, focusing on a particular industry or sector may make the Fund’s net asset value more volatile. Further, a fund that invests in particular industries or sectors is particularly susceptible to the impact of market, economic, regulatory and other factors affecting those industries or sectors.
| |
| 26 | Tax-Advantaged Dividend Income Fund | Semiannual report |
Additional information
Unaudited
Investment objective and policy
The Fund’s investment objective is to provide a high level of after-tax total return from dividend income and gains and capital appreciation.
Under normal market conditions, the Fund will invest at least 80% of its assets (net assets plus borrowings for investment purposes) in dividend-paying common and preferred securities that the Adviser believes at the time of acquisition are eligible to pay dividends which, for individual shareholders, qualify for U.S. federal income taxation at rates applicable to long-term capital gains, which currently are taxed at a maximum rate of 15% (tax-advantaged dividends). Tax-advantaged dividends generally include dividends from domestic corporations and dividends from foreign corporations that meet certain specified criteria. The Fund generally can pass the tax treatment of tax-advantaged dividends it receives through to its common shareholders. The Fund may write (sell) covered call index options on up to 30% of the value of the Fund’s total assets.
Dividends and distributions
During the six months ended April 30, 2012, dividends from net investment income totaling $0.5910 per share were paid to shareholders. The dates of payments and the amounts per share were as follows:
| | | | | |
| | INCOME | | | | |
| PAYMENT DATE | DIVIDENDS | | | | |
| | | | |
| November 30, 2011 | $0.0985 | | | | |
| December 30, 2011 | 0.0985 | | | | |
| January 31, 2012 | 0.0985 | | | | |
| February 29, 2012 | 0.0985 | | | | |
| March 30, 2012 | 0.0985 | | | | |
| April 30, 2012 | 0.0985 | | | | |
| Total | $0.5910 | | | | |
Dividend reinvestment plan
The Fund’s Dividend Reinvestment Plan (the Plan) provides that distributions of dividends and capital gains are automatically reinvested in common shares of the Fund by Computershare Trust Company, N.A. (formerly known as The Bank of New York Mellon) (the Plan Agent). Every shareholder holding at least one full share of the Fund is entitled to participate in the Plan. In addition, every shareholder who became a shareholder of the Fund after June 30, 2011 and holds at least one full share of the Fund will be automatically enrolled in the Plan. Shareholders may withdraw from the Plan at any time and shareholders who do not participate in the Plan will receive all distributions in cash.
If the Fund declares a dividend or distribution payable either in cash or in common shares of the Fund and the market price of shares on the payment date for the distribution or dividend equals or exceeds the Fund’s net asset value per share (NAV), the Fund will issue common shares to participants at a value equal to the higher of NAV or 95% of the market price. The number of additional shares to be credited to each participant’s account will be determined by dividing the dollar amount of the distribution or dividend by the higher of NAV or 95% of the market price. If the market price is lower than NAV, or if dividends or distributions are payable only in cash, then participants will receive shares purchased by the Plan Agent on participants’ behalf on the New York Stock Exchange (the NYSE) or otherwise on the open market. If the market price exceeds NAV before the Plan Agent has completed its purchases, the average per share purchase price may exceed NAV, resulting in fewer shares being acquired than if the Fund had issued new shares.
| |
| Semiannual report | Tax-Advantaged Dividend Income Fund | 27 |
There are no brokerage charges with respect to common shares issued directly by the Fund. However, whenever shares are purchased or sold on the NYSE or otherwise on the open market, each participant will pay a pro rata portion of brokerage trading fees, currently $0.05 per share purchased or sold. Brokerage trading fees will be deducted from amounts to be invested.
The reinvestment of dividends and net capital gains distributions does not relieve participants of any income tax that may be payable on such dividends or distributions.
Shareholders participating in the Plan may buy additional shares of the Fund through the Plan at any time in amounts of at least $50 per investment, up to a maximum of $10,000, with a total calendar year limit of $100,000. Shareholders will be charged a $5 transaction fee plus $0.05 per share brokerage trading fee for each order. Purchases of additional shares of the Fund will be made on the open market. Shareholders who elect to utilize monthly electronic fund transfers to buy additional shares of the Fund will be charged a $2 transaction fee plus $0.05 per share brokerage trading fee for each automatic purchase. Shareholders can also sell Fund shares held in the Plan account at any time by contacting the Plan Agent by telephone, in writing or by visiting the Plan Agent’s Web site at www.computershare.com and clicking on EquityAccess & More. The Plan Agent will mail a check to you (less applicable brokerage trading fees) on settlement date, which is three business days after your shares have been sold. If you choose to sell your shares through your stockbroker, you will need to request that the Plan Agent electronically transfer your shares to your stockbroker through the Direct Registration System.
Shareholders participating in the Plan may withdraw from the Plan at any time by contacting the Plan Agent by telephone, in writing or by visiting the Plan Agent’s Web site at www.computershare.com and clicking on EquityAccess & More. Such termination will be effective immediately if the notice is received by the Plan Agent prior to any dividend or distribution record date; otherwise, such termination will be effective on the first trading day after the payment date for such dividend or distribution, with respect to any subsequent dividend or distribution. If you withdraw, your shares will be credited to your account; or, if you wish, the Plan Agent will sell your full and fractional shares and send you the proceeds, less a transaction fee of $5.00 and less brokerage trading fees of $0.05 per share. If a shareholder does not maintain at least one whole share of common stock in the Plan account, the Plan Agent may terminate such shareholder’s participation in the Plan after written notice. Upon termination, shareholders will be sent a check for the cash value of any fractional share in the Plan account, less any applicable broker commissions and taxes.
Shareholders who hold at least one full share of the Fund may join the Plan by notifying the Plan Agent by telephone, in writing or by visiting the Plan Agent’s Web site at www.computershare.com and clicking on EquityAccess & More. If received in proper form by the Plan Agent before the record date of a dividend, the election will be effective with respect to all dividends paid after such record date. If you wish to participate in the Plan and your shares are held in the name of a brokerage firm, bank or other nominee, please contact your nominee to see if it will participate in the Plan for you. If you wish to participate in the Plan, but your brokerage firm, bank or other nominee is unable to participate on your behalf, you will need to request that your shares be re-registered in your own name, or you will not be able to participate. The Plan Agent will administer the Plan on the basis of the number of shares certified from time to time by you as representing the total amount registered in your name and held for your account by your nominee.
Experience under the Plan may indicate that changes are desirable. Accordingly, the Fund and the Plan Agent reserve the right to amend or terminate the Plan. Participants generally will receive written notice at least 90 days before the effective date of any amendment. In the case of termination, participants will receive written notice at least 90 days before the record date for the payment of any dividend or distribution by the Fund.
| |
| 28 | Tax-Advantaged Dividend Income Fund | Semiannual report |
All correspondence or requests for additional information about the Plan should be directed to Computershare Trust Company, N.A., at the address stated below or by calling 1-800-852-0218, 1-201-680-6578 (For International Telephone Inquiries), and 1-201-680-6610 (For the Hearing Impaired (TDD)).
Shareholder communication and assistance
If you have any questions concerning the Fund, we will be pleased to assist you. If you hold shares in your own name and not with a brokerage firm, please address all notices, correspondence, questions or other communications regarding the Fund to the transfer agent at:
Computershare Trust Company, N.A.
Newport Office Center VII
480 Washington Boulevard
Jersey City, NJ 07310–1900
Telephone: 1-800-852-0218
If your shares are held with a brokerage firm, you should contact that firm, bank or other nominee for assistance.
Shareholder meeting
The Fund held its Annual Meeting of Shareholders on January 20, 2012. The following action was taken by the shareholders:
Proposal: Election of three (3) Trustees to serve for a three-year term ending at the Annual Meeting of Shareholders in 2015 or such earlier date as required by the by-laws of the Fund. Each nominee was reelected by the Fund’s shareholders and the votes cast with respect to each Trustee are set forth below.
| | | |
| | TOTAL VOTES | TOTAL VOTES WITHHELD | |
| | FOR THE NOMINEE | FROM THE NOMINEE | |
| |
| Stanley Martin | 29,638,881 | 997,562 | |
| John A. Moore | 29,631,967 | 1,004,476 | |
| John G. Vrysen | 29,654,849 | 981,594 | |
As of the Annual Meeting date, the terms of office of the following seven Trustees of the Fund had not ended and they remained in office: James F. Carlin, William H. Cunningham, Deborah C. Jackson, Hugh McHaffie, Patti McGill Peterson, Steven R. Pruchansky and Gregory A. Russo. Subsequent to the Annual Meeting date, Mr. Carlin resigned from the Board.
| |
| Semiannual report | Tax-Advantaged Dividend Income Fund | 29 |
More information
| | |
| Trustees | Officers | Investment adviser |
| Steven R. Pruchansky | Keith F. Hartstein | John Hancock Advisers, LLC |
| Chairman | President and | |
| William H. Cunningham | Chief Executive Officer | Subadviser |
| Deborah C. Jackson | | John Hancock Asset Management |
| Stanley Martin* | Andrew G. Arnott | a division of Manulife Asset |
| Hugh McHaffie† | Senior Vice President and | Management (US) LLC |
| Dr. John A. Moore* | Chief Operating Officer | |
| Vice Chairman | | Analytic Investors, LLC |
| Patti McGill Peterson* | Thomas M. Kinzler | |
| Gregory A. Russo | Secretary and Chief Legal Officer | Custodian |
| John G. Vrysen† | | State Street Bank and |
| Francis V. Knox, Jr. | Trust Company |
| *Member of the | Chief Compliance Officer | |
| Audit Committee | | Transfer agent |
| †Non-Independent Trustee | Charles A. Rizzo | Computershare Shareowner |
| Chief Financial Officer | Services, LLC |
| | | |
| | Salvatore Schiavone | Legal counsel |
| | Treasurer | K&L Gates LLP |
| | | |
| | | Stock symbol |
| | | Listed New York Stock |
| | | Exchange: HTD |
For shareholder assistance refer to page 29
| | |
| You can also contact us: | | |
| | 1-800-852-0218 | Regular mail: |
| | jhfunds.com | Computershare Shareowner Services, LLC |
| | | Newport Office Center VII |
| | | 480 Washington Boulevard |
| | | Jersey City, NJ 07310-1900 |
The Fund’s proxy voting policies and procedures, as well as the Fund’s proxy voting record for the most recent twelve-month period ended June 30, are available free of charge on the Securities and Exchange Commission (SEC) Web site at www.sec.gov or on our Web site.
The Fund’s complete list of portfolio holdings, for the first and third fiscal quarters, is filed with the SEC on Form N-Q. The Fund’s Form N-Q is available on our Web site and the SEC’s Web site, www.sec.gov, and can be reviewed and copied (for a fee) at the SEC’s Public Reference Room in Washington, DC. Call 1-202-551-8090 to receive information on the operation of the SEC’s Public Reference Room.
We make this information on your fund, as well as monthly portfolio holdings, and other fund details available on our Web site at www.jhfunds.com or by calling 1-800-852-0218.
The report is certified under the Sarbanes-Oxley Act, which requires closed-end funds and other public companies to affirm that, to the best of their knowledge, the information in their financial reports is fairly and accurately stated in all material respects.
| |
| 30 | Tax-Advantaged Dividend Income Fund | Semiannual report |

| |
| PRESORTED |
| STANDARD |
| U.S. POSTAGE |
| PAID |
| MIS |
1-800-852-0218
1-800-231-5469 TDD
1-800-843-0090 EASI-Line
www.jhfunds.com
ITEM 2. CODE OF ETHICS.
Not applicable.
ITEM 3. AUDIT COMMITTEE FINANCIAL EXPERT.
Not applicable at this time.
ITEM 4. PRINCIPAL ACCOUNTANT FEES AND SERVICES.
Not applicable at this time.
ITEM 5. AUDIT COMMITTEE OF LISTED REGISTRANTS.
Not applicable at this time.
ITEM 6. SCHEDULE OF INVESTMENTS.
(a) Not applicable.
(b) Not applicable.
ITEM 7. DISCLOSURE OF PROXY VOTING POLICIES AND PROCEDURES FOR CLOSED-END MANAGEMENT INVESTMENT COMPANIES.
Not applicable.
ITEM 8. PORTFOLIO MANAGERS OF CLOSED-END MANAGEMENT INVESTMENT COMPANIES.
Not applicable.
ITEM 9. PURCHASES OF EQUITY SECURITIES BY CLOSED-END MANAGEMENT INVESTMENT COMPANY AND AFFILIATED PURCHASERS.
(a) Not applicable.
(b)
| | | | |
| | | | Total number of | Maximum number of |
| | Total number of | | shares purchased | shares that may yet |
| | shares | Average price | as part of publicly | be purchased under |
| Period | purchased | per share | announced plans* | the plans |
|
| Nov-11 | - | - | - | 3,564,071 |
|
| Dec-11 | - | - | - | 3,773,475* |
|
| Jan-12 | - | - | - | 3,773,475 |
|
| Feb-12 | - | - | - | 3,773,475 |
|
| Mar-12 | - | - | - | 3,773,475 |
|
| Apr-12 | - | - | - | 3,773,475 |
|
| Total | - | - | | |
|
| *In December 2007, the Trustees approved a share repurchase plan, which has been |
| subsequently reviewed and approved by the Board of Trustees each year in December. Under |
| the current share repurchase plan, the Fund may purchase in the open market up to 10% of its |
| outstanding common shares as of December 31, 2011. The plan renewed by the Board in |
| December 2011 will remain in effect between January 1, 2012 and December 31, 2012. |
|
ITEM 10. SUBMISSION OF MATTERS TO A VOTE OF SECURITY HOLDERS.
The registrant has adopted procedures by which shareholders may recommend nominees to the registrant’s Board of Trustees. A copy of the procedures is filed as an exhibit to this Form N-CSR. See attached “John Hancock Funds – Nominating, Governance and Administration Committee Charter. ”
ITEM 11. CONTROLS AND PROCEDURES.
(a) Based upon their evaluation of the registrant's disclosure controls and procedures as conducted within 90 days of the filing date of this Form N-CSR, the registrant's principal executive officer and principal financial officer have concluded that those disclosure controls and procedures provide reasonable assurance that the material information required to be disclosed by the registrant on this report is recorded, processed, summarized and reported within the time periods specified in the Securities and Exchange Commission's rules and forms.
(b) There were no changes in the registrant's internal control over financial reporting that occurred during the registrant's most recent fiscal half-year (the registrant's second fiscal half-year in the case of an annual report) that have materially affected, or are reasonably likely to materially affect, the registrant's internal control over financial reporting.
ITEM 12. EXHIBITS.
(a) Separate certifications for the registrant's principal executive officer and principal financial officer, as required by Section 302 of the Sarbanes-Oxley Act of 2002 and Rule 30a-2(a) under the Investment Company Act of 1940, are attached.
(b) Separate certifications for the registrant's principal executive officer and principal financial officer, as required by 18 U.S.C. Section 1350, as adopted pursuant to Section 906 of the Sarbanes-Oxley Act of 2002, and Rule 30a-2(b) under the Investment Company Act of 1940, are attached. The certifications furnished pursuant to this paragraph are not deemed to be "filed" for purposes of Section 18 of the Securities Exchange Act of 1934, or otherwise subject to the liability of that section. Such certifications are not deemed to be incorporated by reference into any filing under the Securities Act of 1933 or the Securities Exchange Act of 1934, except to the extent that the Registrant specifically incorporates them by reference.
(c)(1) Submission of Matters to a Vote of Security Holders is attached. See attached “John Hancock Funds – Nominating, Governance and Administration Committee Charter. ”
(c)(2) Contact person at the registrant.
Pursuant to the requirements of the Securities Exchange Act of 1934 and the Investment Company Act of 1940, the registrant has duly caused this report to be signed on its behalf by the undersigned, thereunto duly authorized.
| |
| John Hancock Tax-Advantaged Dividend Income Fund |
| |
| |
| By: | Keith F. Hartstein |
| ------------------------------ |
| Keith F. Hartstein |
| President and Chief Executive Officer |
| |
| |
| Date: | June 26, 2012 |
Pursuant to the requirements of the Securities Exchange Act of 1934 and the Investment Company Act of 1940, this report has been signed below by the following persons on behalf of the registrant and in the capacities and on the dates indicated.
| |
| By: | /s/ Keith F. Hartstein |
| | ------------------------------- |
| | Keith F. Hartstein |
| | President and Chief Executive Officer |
| |
| |
| Date: | June 26, 2012 |
| |
| |
| |
| By: | /s/ Charles A. Rizzo |
| | ----------------------- |
| | Charles A. Rizzo |
| | Chief Financial Officer |
| |
| |
| Date: | June 26, 2012 |