UNITED STATES
SECURITIES AND EXCHANGE COMMISSION
WASHINGTON, D.C. 20549
FORM N-CSR
CERTIFIED SHAREHOLDER REPORT OF REGISTERED
MANAGEMENT INVESTMENT COMPANIES
Investment Company Act file number: 811-21497
ALLIANCEBERNSTEIN CORPORATE SHARES
(Exact name of registrant as specified in charter)
1345 Avenue of the Americas, New York, New York 10105
(Address of principal executive offices) (Zip code)
Joseph J. Mantineo
AllianceBernstein L.P.
1345 Avenue of the Americas
New York, New York 10105
(Name and address of agent for service)
Registrant’s telephone number, including area code: (800) 221-5672
Date of fiscal year end: April 30, 2010
Date of reporting period: April 30, 2010
| ITEM 1. | REPORTS TO STOCKHOLDERS. |
ANNUAL REPORT
AllianceBernstein
Corporate Income Shares

April 30, 2010
Annual Report
Investment Products Offered
| • | Are Not FDIC Insured |
| • | May Lose Value |
| • | Are Not Bank Guaranteed |
The investment return and principal value of an investment in the Fund will fluctuate as the prices of the individual securities in which it invests fluctuate, so that your shares, when redeemed, may be worth more or less than their original cost. You should consider the investment objectives, risks, charges and expenses of the Fund carefully before investing. For a free copy of the Fund’s prospectus, which contains this and other information, visit our web site at www.alliancebernstein.com or call your financial advisor or AllianceBernstein® at (800) 227-4618. Please read the prospectus carefully before you invest.
You may obtain performance information current to the most recent month-end by visiting www.alliancebernstein.com.
This shareholder report must be preceded or accompanied by the Fund’s prospectus for individuals who are not current shareholders of the Fund.
You may obtain a description of the Fund’s proxy voting policies and procedures, and information regarding how the Fund voted proxies relating to portfolio securities during the most recent 12-month period ended June 30, without charge. Simply visit AllianceBernstein’s web site at www.alliancebernstein.com, or go to the Securities and Exchange Commission’s (the “Commission”) web site at www.sec.gov, or call AllianceBernstein at (800) 227-4618.
The Fund files its complete schedule of portfolio holdings with the Commission for the first and third quarters of each fiscal year on Form N-Q. The Fund’s Forms N-Q are available on the Commission’s web site at www.sec.gov. The Fund’s Forms N-Q may also be reviewed and copied at the Commission’s Public Reference Room in Washington, DC; information on the operation of the Public Reference Room may be obtained by calling (800) SEC-0330. AllianceBernstein publishes full portfolio holdings for the Fund monthly at www.alliancebernstein.com.
AllianceBernstein Investments, Inc. (ABI) is the distributor of the AllianceBernstein family of mutual funds. ABI is a member of FINRA and is an affiliate of AllianceBernstein L.P., the manager of the funds.
AllianceBernstein® and the AB Logo are registered trademarks and service marks used by permission of the owner, AllianceBernstein L.P.
June 11, 2010
Annual Report
This report provides management’s discussion of fund performance for AllianceBernstein Corporate Income Shares (the “Fund”) for the annual reporting period ended April 30, 2010. Please note, shares of this Fund are offered exclusively through registered investment advisers approved by AllianceBernstein L.P. (the “Adviser”).
Investment Objective and Policies
The Fund’s investment objective is high current income.
The Fund invests, under normal circumstances, at least 80% of its net assets in US corporate bonds. The Fund may also invest in US Government securities (other than US Government securities that are mortgage-backed or asset-backed securities), repurchase agreements and forward contracts relating to US Government securities. The Fund normally invests all of its assets in securities that are rated, at the time of purchase, at least BBB- or the equivalent. The Fund will not invest in unrated corporate debt securities. The Fund has the flexibility to invest in long- and short-term fixed-income securities. In making decisions about whether to buy or sell securities, the Fund will consider, among other things, the strength of certain sectors of the fixed-income market relative to others, interest rates and other general market conditions and the credit quality of individual issuers. The Fund also may invest in convertible debt securities; invest up to 10% of its assets in inflation-protected securities; invest up to 5% of
its net assets in preferred stock; purchase and sell interest rate futures contracts and options; enter into swap transactions; invest in zero coupon securities and payment-in-kind debentures; and make secured loans of portfolio securities.
Investment Results
The table on page 4 shows the Fund’s performance compared to its benchmark, the Barclays Capital US Credit Bond Index, for the six- and 12-month periods ended April 30, 2010.
The Fund outperformed its benchmark for both the six- and 12-month periods as signs of a sustainable economic recovery helped prolong the global rally in the credit markets. Investment-grade security selection, specifically the Fund’s overweight in higher beta (more market-sensitive) securities and the financial industry, as well as an underweight in non-corporate issues, all contributed positively to relative performance.
Market Review and Investment Strategy
The global economic recovery broadened in late 2009 and continued into early 2010 as evidence emerged that the US and euro-area economies had returned to positive growth. The global economic recovery was driven by strong gains in emerging-market economies. Growth in Asia ex-Japan, Eastern Europe and the Middle East outpaced expectations, thanks to strong domestic demand. Import growth in emerging-market economies boomed, acting as an important
| ALLIANCEBERNSTEIN CORPORATE INCOME SHARES • | 1 |
catalyst in the recovery of industrialized economies.
Many fixed-income sectors staged historic recoveries during the annual reporting period, following the extreme risk aversion that seized the markets following the bankruptcy of Lehman Brothers in 2008. Investment-grade corporates rallied as investor risk aversion abated on signs that a sustainable global economic recovery was under way. Corporate earnings reached bottom after a two-year plunge, and positive earnings surprises increased as markets recovered.
During the annual reporting period ended April 30, 2010, investment-grade corporate spreads tightened 296 basis points to end the period at 143 basis points over neutral-duration Treasuries. As a sign that investors became less risk averse, longer maturity corporates outperformed shorter maturities and lower quality corporates outperformed higher quality tiers. The non-corporate part of the credit market also posted positive returns, however at a much less robust
pace. The non-corporate part of the benchmark, which is primarily comprised of US dollar denominated sovereigns, supranationals and local foreign government and agency issuers, rose strongly.
The Fund’s Corporate Income Shares Investment Team (the “Team”) remains positive on the outlook for investment-grade corporate debt. While spreads have tightened significantly, valuations still appear attractive thanks to declining fundamental risk in the sector. The Fund’s positions remain concentrated in higher-beta issues, although the Team has tempered some of the most aggressive overweights as the rally has proceeded. As spreads have tightened, the compensation for holding the highest-risk names became less generous. Spread dispersion—or the variability between the narrowest and widest spreads—in the corporate index compressed greatly. For this reason, the Team has toned down some of the Fund’s most aggressive overweights in higher market-sensitive issues in finance and other sectors, and further diversified the Fund’s corporate holdings.
| 2 | • ALLIANCEBERNSTEIN CORPORATE INCOME SHARES |
HISTORICAL PERFORMANCE
An Important Note About the Value of Historical Performance
The performance on the following pages represents past performance and does not guarantee future results. All fees and expenses related to the operation of the Fund have been deducted. Performance assumes reinvestment of distributions and does not account for taxes.
Benchmark Disclosure
The unmanaged Barclays Capital US Credit Bond Index does not reflect fees and expenses associated with the active management of a fund portfolio. The Index comprises the Barclays Capital US Corporate Bond Index and the Barclays Capital US Non-Corporate Credit Index (the non-native currency subcomponent of the Barclays Capital US Government-Related Index). An investor cannot invest directly in an index, and its results are not indicative of the performance for any specific investment, including the Fund.
A Word About Risk
Price fluctuation in the Fund’s securities may be caused by changes in the general level of interest rates or changes in bond credit quality ratings. Please note, as interest rates rise, existing bond prices fall and can cause the value of an investment in the Fund to decline. Changes in interest rates have a greater effect on bonds with longer maturities than those with shorter maturities. Similar to direct bond ownership, bond funds have the same interest rate, inflation and credit risks that are associated with the underlying bonds owned by the Fund. This Fund can utilize leverage as an investment strategy. When a fund borrows money or otherwise leverages its portfolio, it may be volatile because leverage tends to exaggerate the effect of any increase or decrease in the value of a Fund’s investments. The Fund may create leverage through the use of derivatives. High yield bonds, otherwise known as “junk bonds,” involve a greater risk of default and price volatility than other bonds. Investing in below-investment grade securities presents special risks, including credit risk. Investments in the Fund are not guaranteed because of fluctuation in the net asset value of the underlying fixed-income related investments. The Fund is subject to liquidity risk because derivatives and securities involving substantial interest rate and credit risk tend to involve greater liquidity risk. While the Fund invests principally in bonds and other fixed-income securities, in order to achieve its investment objective, the Fund may at times use certain types of investment derivatives, such as options, futures, forwards and swaps. These instruments involve risks different from, and in certain cases, greater than, the risks presented by more traditional investments. These risks are fully discussed in the Fund’s prospectus.
(Historical Performance continued on next page)
| ALLIANCEBERNSTEIN CORPORATE INCOME SHARES • | 3 |
Historical Performance
HISTORICAL PERFORMANCE
(continued from previous page)
THE FUND VS. ITS BENCHMARK PERIODS ENDED APRIL 30, 2010 | Returns | |||||
| 6 Months | 12 Months | |||||
AllianceBernstein Corporate Income Shares | 7.35% | 32.72% | ||||
Barclays Capital US Credit Bond Index | 4.46% | 19.55% | ||||
| Please keep in mind that high, double-digit returns are highly unusual and cannot be sustained. Investors should also be aware that these returns were primarily achieved during favorable market conditions. | ||||||
GROWTH OF A $10,000 INVESTMENT IN THE FUND
12/11/06* TO 4/30/10
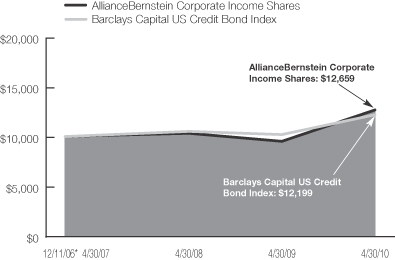
*Inception Date: 12/11/06.
This chart illustrates the total value of an assumed $10,000 investment in AllianceBernstein Corporate Income Shares (from 12/11/06 to 4/30/10) as compared to the performance of the Fund’s benchmark.
See Historical Performance and Benchmark disclosures on previous page.
(Historical Performance continued on next page)
| 4 | • ALLIANCEBERNSTEIN CORPORATE INCOME SHARES |
Historical Performance
HISTORICAL PERFORMANCE
(continued from previous page)
| AVERAGE ANNUAL RETURNS (WITH ANY APPLICABLE SALES CHARGES) AS OF THE MOST RECENT CALENDAR QUARTER-END (MARCH 31, 2010) | |||||
| Returns | |||||
1 Year | 34.20 | % | |||
Since Inception* | 6.74 | % | |||
The Fund’s current prospectus fee table shows the Fund’s total operating expense ratio as 0.35% and the Fund’s net expense ratio as 0.00%, reflecting the fact that the Adviser is absorbing all expenses of operating the Fund, except extraordinary expenses, and is waiving any fees from the Fund. The Fund is an integral part of “wrap fee” programs sponsored by investment advisers unaffiliated with the Fund or the Adviser. Typically, participants in these programs pay a “wrap” fee to their investment adviser for all costs and expenses of the wrap-fee program, including investment advice and portfolio execution. The Fund’s total operating expense ratio reflects the estimated portion of the wrap fee attributable to the management of the Fund. Absent reimbursements or waivers, performance would have been lower.
| *Inception | Date: 12/11/06. |
See Historical Performance disclosures on page 3.
(Historical Performance continued on next page)
| ALLIANCEBERNSTEIN CORPORATE INCOME SHARES • | 5 |
Historical Performance
FUND EXPENSES
(unaudited)
As a shareholder of the Fund, you incur various ongoing costs, including management fees and other Fund expenses. This example is intended to help you understand your ongoing costs (in dollars) of investing in the Fund and to compare these costs with the ongoing costs of investing in other mutual funds.
The Example is based on an investment of $1,000 invested at the beginning of the period and held for the entire period as indicated below.
Actual Expenses
The table below provides information about actual account values and actual expenses. You may use the information in this line, together with the amount you invested, to estimate the expenses that you paid over the period. Simply divide your account value by $1,000 (for example, an $8,600 account value divided by $1,000 = 8.6), then multiply the result by the number in the first line under the heading entitled “Expenses Paid During Period” to estimate the expenses you paid on your account during this period.
Hypothetical Example for Comparison Purposes
The table below provides information about hypothetical account values and hypothetical expenses based on the Fund’s actual expense ratio and an assumed annual rate of return of 5% before expenses, which is not the Fund’s actual return. The hypothetical account values and expenses may not be used to estimate the actual ending account balance or expenses you paid for the period. You may use this information to compare the ongoing costs of investing in the Fund and other funds by comparing this 5% hypothetical example with the 5% hypothetical examples that appear in the shareholder reports of other funds.
Please note that the expenses shown in the table are meant to highlight your ongoing costs only and do not reflect any transactional costs, such as sales charges (loads), or contingent deferred sales charges on redemptions. Therefore, the hypothetical example is useful in comparing ongoing costs only, and will not help you determine the relative total costs of owning different funds. In addition, if these transactional costs were included, your costs would have been higher.
| Beginning Account Value November 1, 2009 | Ending Account Value April 30, 2010 | Expenses Paid During Period* | ||||||||||||||||
| Actual | Hypothetical | Actual | Hypothetical** | Actual | Hypothetical | |||||||||||||
| Class A | $ | 1,000 | $ | 1,000 | $ | 1,073.50 | $ | 1,024.79 | $ | 0.00 | $ | 0.00 | ||||||
| * | Expenses are equal to the Fund’s annualized expense ratio of 0.00%. The Fund’s expenses are borne by the Adviser or it affiliates. |
| ** | Assumes 5% return before expenses. |
| 6 | • ALLIANCEBERNSTEIN CORPORATE INCOME SHARES |
Fund Expenses
PORTFOLIO SUMMARY
April 30, 2010 (unaudited)
PORTFOLIO STATISTICS
Net Assets ($mil): $34.0
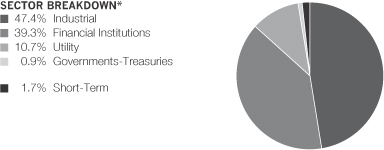
| * | All data are as of April 30, 2010. The Fund’s sector breakdown is expressed as a percentage of total investments and may vary over time. |
Please Note: The issuer classifications presented herein are based on the Barclays Capital Fixed Income Indices developed by Baryclays Capital. The fund components are divided either into duration, country, bond ratings or corporate sectors as classified by Barclays Capital. These sector classifications are broadly defined. The “Portfolio of Investments” section of the report reflects more specific industry information and is consistent with the investment restrictions discussed in the fund’s prospectus.
| ALLIANCEBERNSTEIN CORPORATE INCOME SHARES • | 7 |
Portfolio Summary
PORTFOLIO OF INVESTMENTS
April 30, 2010
| Principal Amount (000) | U.S. $ Value | |||||
CORPORATES – INVESTMENT GRADES – 90.9% | ||||||
Industrial – 44.9% | ||||||
Basic – 4.8% | ||||||
Alcoa, Inc. | $ | 130 | $ | 128,311 | ||
6.00%, 7/15/13 | 75 | 80,609 | ||||
Commercial Metals Co. | 140 | 148,794 | ||||
The Dow Chemical Co. | 195 | 222,393 | ||||
8.55%, 5/15/19 | 45 | 54,986 | ||||
Eastman Chemical Co. | 135 | 157,364 | ||||
Freeport-McMoRan Copper & Gold, Inc. | 170 | 185,088 | ||||
International Paper Co. | 180 | 213,584 | ||||
Lubrizol Corp. | 95 | 118,800 | ||||
The Mosaic Co. | 150 | 164,695 | ||||
Packaging Corp. of America | 95 | 102,186 | ||||
PPG Industries, Inc. | 45 | 51,197 | ||||
| 1,628,007 | ||||||
Capital Goods – 3.4% | ||||||
Caterpillar, Inc. | 280 | 318,483 | ||||
CRH America, Inc. | 170 | 182,421 | ||||
General Electric Co. | 230 | 244,628 | ||||
Owens Corning, Inc. | 100 | 120,733 | ||||
Republic Services, Inc. | 145 | 152,227 | ||||
Vulcan Materials Co. | 140 | 156,089 | ||||
| 1,174,581 | ||||||
Communications - Media – 5.9% | ||||||
CBS Corp. | 73 | 78,456 | ||||
7.875%, 7/30/30 | 85 | 96,477 | ||||
Comcast Cable Communications Holdings, Inc. | 145 | 195,774 | ||||
| 8 | • ALLIANCEBERNSTEIN CORPORATE INCOME SHARES |
Portfolio of Investments
| Principal Amount (000) | U.S. $ Value | |||||
Comcast Corp. | $ | 70 | $ | 77,962 | ||
Cox Communications, Inc. | 135 | 147,727 | ||||
DirecTV Holdings LLC / DirecTV Financing Co., Inc. | 155 | 163,874 | ||||
News America Holdings, Inc. | 200 | 256,396 | ||||
Omnicom Group, Inc. | 160 | 176,320 | ||||
RR Donnelley & Sons Co. | 160 | 164,961 | ||||
TCI Communications, Inc. | 150 | 176,417 | ||||
Time Warner Entertainment Co. LP | 135 | 155,800 | ||||
10.15%, 5/01/12 | 270 | 310,933 | ||||
| 2,001,097 | ||||||
Communications - Telecommunications – 5.2% | ||||||
American Tower Corp | 100 | 112,000 | ||||
Ameritech Capital Funding Corp. | 280 | 285,189 | ||||
Bellsouth Capital Funding Corp. | 395 | 420,941 | ||||
Embarq Corp. | 75 | 81,355 | ||||
7.082%, 6/01/16 | 75 | 82,712 | ||||
7.995%, 6/01/36 | 65 | 69,600 | ||||
Qwest Corp. | 55 | 60,637 | ||||
8.875%, 3/15/12 | 145 | 158,412 | ||||
US Cellular Corp. | 135 | 133,740 | ||||
Valor Telecommunications Enterprises | 55 | 56,238 | ||||
Verizon New York, Inc. | 290 | 321,977 | ||||
| 1,782,801 | ||||||
Consumer Cyclical - Automotive – 1.1% | ||||||
Daimler Finance North America LLC | 185 | 201,021 | ||||
Harley-Davidson Funding Corp. | 60 | 61,480 | ||||
Johnson Controls, Inc. | 105 | 114,441 | ||||
| 376,942 | ||||||
| ALLIANCEBERNSTEIN CORPORATE INCOME SHARES • | 9 |
Portfolio of Investments
| Principal Amount (000) | U.S. $ Value | |||||
Consumer Cyclical - Entertainment – 1.4% | ||||||
Historic TW, Inc. | $ | 80 | $ | 93,793 | ||
Turner Broadcasting System, Inc. | 165 | 193,740 | ||||
Viacom, Inc. | 175 | 196,360 | ||||
| 483,893 | ||||||
Consumer Cyclical - Other – 1.1% | ||||||
Marriott International, Inc/DE | 160 | 170,618 | ||||
MDC Holdings, Inc. | 43 | 44,521 | ||||
Toll Brothers Finance Corp. | 155 | 155,770 | ||||
| 370,909 | ||||||
Consumer Cyclical - Retailers – 1.5% | ||||||
Autozone, Inc. | 110 | 118,431 | ||||
CVS Caremark Corp. | 45 | 51,345 | ||||
Kohls Corp. | 140 | 158,621 | ||||
Nordstrom, Inc. | 160 | 186,043 | ||||
| 514,440 | ||||||
Consumer Non-Cyclical – 10.0% | ||||||
Allergan, Inc. | 135 | 153,091 | ||||
Altria Group, Inc. | 115 | 142,057 | ||||
9.70%, 11/10/18 | 115 | 144,623 | ||||
AmerisourceBergen Corp. | 135 | 149,883 | ||||
Anheuser-Busch Cos, Inc. | 210 | 223,890 | ||||
Avon Products, Inc. | 145 | 165,800 | ||||
Bristol-Myers Squibb Co. | 170 | 187,495 | ||||
Bunge Ltd. Finance Corp. | 150 | 158,683 | ||||
Cardinal Health, Inc. | 110 | 112,856 | ||||
ConAgra Foods, Inc. | 130 | 171,697 | ||||
| 10 | • ALLIANCEBERNSTEIN CORPORATE INCOME SHARES |
Portfolio of Investments
| Principal Amount (000) | U.S. $ Value | |||||
Fisher Scientific International, Inc. | $ | 140 | $ | 145,250 | ||
Fortune Brands, Inc. | 100 | 105,312 | ||||
Kraft Foods, Inc. | 135 | 146,272 | ||||
6.50%, 11/01/31 | 140 | 150,155 | ||||
The Kroger Co. | 180 | 218,020 | ||||
Mckesson Corp. | 105 | 125,435 | ||||
Quest Diagnostics, Inc. | 145 | 157,895 | ||||
Reynolds American, Inc. | 165 | 183,950 | ||||
Safeway, Inc. | 160 | 189,107 | ||||
Sara Lee Corp. | 155 | 161,772 | ||||
Universal Health Services, Inc. | 65 | 70,938 | ||||
Whirlpool Corp. | 130 | 152,154 | ||||
| 3,416,335 | ||||||
Energy – 5.8% | ||||||
Anadarko Petroleum Corp. | 225 | 249,764 | ||||
ConocoPhillips | 335 | 389,867 | ||||
Halliburton Co. | 240 | 290,168 | ||||
Hess Corp. | 154 | 188,043 | ||||
Marathon Oil Corp. | 150 | 178,531 | ||||
Nabors Industries, Inc. | 150 | 189,750 | ||||
Noble Energy, Inc. | 143 | 176,042 | ||||
Occidental Petroleum Corp. | 59 | 68,743 | ||||
Sunoco, Inc. | 110 | 111,734 | ||||
Williams Cos., Inc. | 120 | 143,645 | ||||
| 1,986,287 | ||||||
| ALLIANCEBERNSTEIN CORPORATE INCOME SHARES • | 11 |
Portfolio of Investments
| Principal Amount (000) | U.S. $ Value | |||||
Services – 0.5% | ||||||
The Western Union Co. | $ | 155 | $ | 172,520 | ||
Technology – 2.6% | ||||||
Computer Sciences Corp. | 125 | 132,954 | ||||
International Business Machine | 295 | 306,776 | ||||
Motorola, Inc. | 180 | 175,666 | ||||
Science Applications International Corp. | 50 | 54,714 | ||||
Xerox Corp. | 185 | 205,018 | ||||
| 875,128 | ||||||
Transportation - Airlines – 0.5% | ||||||
Southwest Airlines Co. | 150 | 156,637 | ||||
Transportation - Railroads – 0.6% | ||||||
CSX Corp. | 170 | 204,311 | ||||
Transportation - Services – 0.5% | ||||||
Fedex Corp. | 100 | 124,862 | ||||
Ryder System, Inc. | 28 | 29,843 | ||||
| 154,705 | ||||||
| 15,298,593 | ||||||
Financial Institutions – 35.7% | ||||||
Banking – 17.7% | ||||||
American Express Bank FSB | 135 | 145,921 | ||||
American Express Co. | 95 | 108,624 | ||||
8.125%, 5/20/19 | 120 | 146,975 | ||||
Bank of America Corp. | 400 | 396,729 | ||||
BB&T Corp. | 175 | 202,042 | ||||
The Bear Stearns Co., Inc. | 260 | 271,621 | ||||
Capital One Financial Corp. | 168 | 179,070 | ||||
7.375%, 5/23/14 | 60 | 69,346 | ||||
| 12 | • ALLIANCEBERNSTEIN CORPORATE INCOME SHARES |
Portfolio of Investments
| Principal Amount (000) | U.S. $ Value | |||||
Citigroup, Inc. | $ | 320 | $ | 319,258 | ||
5.00%, 9/15/14 | 415 | 420,087 | ||||
6.125%, 8/25/36 | 115 | 104,625 | ||||
Countrywide Financial Corp. | 318 | 330,509 | ||||
First Union Institutional Capital I | 360 | 375,828 | ||||
Goldman Sachs Group, Inc. | 275 | 264,057 | ||||
HSBC Bank USA | 145 | 152,434 | ||||
JPMorgan Chase Capital XXV | 300 | 300,754 | ||||
Manufacturers & Traders Trust Co. | 270 | 250,734 | ||||
Merrill Lynch & Co., Inc. | 100 | 92,490 | ||||
Morgan Stanley | 45 | 47,597 | ||||
5.375%, 10/15/15 | 195 | 202,017 | ||||
6.00%, 4/28/15 | 100 | 106,859 | ||||
6.625%, 4/01/18 | 185 | 196,146 | ||||
7.25%, 4/01/32 | 130 | 147,926 | ||||
National City Bank | 395 | 416,979 | ||||
SouthTrust Corp. | 145 | 155,385 | ||||
State Street Corp. | 95 | 99,701 | ||||
Union Bank of California | 290 | 307,032 | ||||
Wells Fargo & Co. | 110 | 116,280 | ||||
4.625%, 4/15/14 | 100 | 105,436 | ||||
| 6,032,462 | ||||||
Brokerage – 0.9% | ||||||
Ameriprise Financial, Inc. | 140 | 155,018 | ||||
Schwab Capital Trust I | 145 | 146,987 | ||||
| 302,005 | ||||||
Finance – 4.1% | ||||||
GE Capital Trust I | 345 | 330,338 | ||||
| ALLIANCEBERNSTEIN CORPORATE INCOME SHARES • | 13 |
Portfolio of Investments
| Principal Amount (000) | U.S. $ Value | |||||
General Electric Capital Corp. | $ | 90 | $ | 95,689 | ||
5.40%, 2/15/17 | 390 | 413,708 | ||||
HSBC Finance Capital Trust IX | 370 | 337,625 | ||||
SLM Corp. | 230 | 213,098 | ||||
| 1,390,458 | ||||||
Insurance – 10.1% | ||||||
Aetna, Inc. | 160 | 177,615 | ||||
The Allstate Corp. | 35 | 32,900 | ||||
Allstate Life Global Funding Trusts | 140 | 153,714 | ||||
Assurant, Inc. | 110 | 116,130 | ||||
Chubb Corp. | 130 | 142,185 | ||||
Cigna Corp. | 115 | 130,491 | ||||
Coventry Health Care, Inc. | 35 | 34,129 | ||||
6.125%, 1/15/15 | 20 | 20,393 | ||||
6.30%, 8/15/14 | 95 | 100,106 | ||||
Fund American Cos, Inc. | 105 | 109,317 | ||||
Genworth Financial, Inc. | 55 | 54,456 | ||||
6.515%, 5/22/18 | 115 | 115,989 | ||||
Guardian Life Insurance Co. of America | 75 | 85,383 | ||||
Hartford Financial Services Group, Inc. | 175 | 160,654 | ||||
Humana, Inc. | 165 | 175,820 | ||||
Lincoln National Corp. | 82 | 102,289 | ||||
Markel Corp. | 90 | 97,856 | ||||
Marsh & McLennan Cos, Inc. | 165 | 173,736 | ||||
MetLife, Inc. | 195 | 251,229 | ||||
Nationwide Mutual Insurance Co. | 120 | 143,542 | ||||
Principal Financial Group, Inc. | 135 | 153,525 | ||||
| 14 | • ALLIANCEBERNSTEIN CORPORATE INCOME SHARES |
Portfolio of Investments
| Principal Amount (000) | U.S. $ Value | |||||
Progressive Corp/The | $ | 110 | $ | 118,653 | ||
Prudential Financial, Inc. | 195 | 204,283 | ||||
Swiss Re Solutions Holding Corp. | 150 | 162,296 | ||||
The Travelers Cos, Inc. | 180 | 203,431 | ||||
UnitedHealth Group, Inc. | 140 | 147,761 | ||||
Wellpoint, Inc. | 20 | 21,702 | ||||
7.00%, 2/15/19 | 35 | 40,297 | ||||
| 3,429,882 | ||||||
REITS – 2.9% | ||||||
Duke Realty LP | 55 | 57,727 | ||||
ERP Operating LP | 165 | 174,786 | ||||
HCP, Inc. | 185 | 196,688 | ||||
Health Care REIT, Inc. | 145 | 155,792 | ||||
Regency Centers LP | 165 | 168,178 | ||||
Simon Property Group LP | 225 | 242,531 | ||||
| 995,702 | ||||||
| 12,150,509 | ||||||
Utility – 10.3% | ||||||
Electric – 6.1% | ||||||
Allegheny Energy Supply Co. LLC | 95 | 105,059 | ||||
Ameren Corp. | 165 | 192,702 | ||||
Consolidated Edison Co. of New York, Inc. | 115 | 128,119 | ||||
Constellation Energy Group, Inc. | 140 | 145,220 | ||||
Consumers Energy Co. | 165 | 179,318 | ||||
Dominion Resources, Inc. | 315 | 301,612 | ||||
| ALLIANCEBERNSTEIN CORPORATE INCOME SHARES • | 15 |
Portfolio of Investments
| Principal Amount (000) | U.S. $ Value | |||||
DTE Energy Co. | $ | 130 | $ | 142,715 | ||
FirstEnergy Corp. | 202 | 215,525 | ||||
Integrys Energy Group Inc | 120 | 112,200 | ||||
Nevada Power Co. | 125 | 144,681 | ||||
Nisource Finance Corp. | 145 | 153,747 | ||||
Potomac Electric Power Co. | 115 | 128,237 | ||||
Teco Finance, Inc. | 110 | 122,060 | ||||
| 2,071,195 | ||||||
Natural Gas – 4.2% | ||||||
AGL Capital Corp. | 105 | 107,577 | ||||
CenterPoint Energy Resources Corp. | 115 | 131,905 | ||||
Colorado Interstate Gas Co. | 115 | 131,187 | ||||
Duke Energy Field Services Corp. | 105 | 107,055 | ||||
Energy Transfer Partners LP | 190 | 207,508 | ||||
Enterprise Products Operating LP | 210 | 219,348 | ||||
Kinder Morgan Energy Partners LP | 95 | 109,209 | ||||
Plains All American Pipeline LP | 125 | 155,420 | ||||
Southern Union Co. | 60 | 68,519 | ||||
Spectra Energy Capital LLC | 155 | 187,269 | ||||
| 1,424,997 | ||||||
| 3,496,192 | ||||||
Total Corporates – Investment Grades | 30,945,294 | |||||
| 16 | • ALLIANCEBERNSTEIN CORPORATE INCOME SHARES |
Portfolio of Investments
| Principal Amount (000) | U.S. $ Value | |||||
CORPORATES – NON-INVESTMENT GRADES –5.1% | ||||||
Financial Institutions – 3.0% | ||||||
Banking – 2.3% | ||||||
BankAmerica Capital II | $ | 237 | $ | 237,888 | ||
RBS Capital Trust III | 500 | 305,000 | ||||
Union Planters Corp. | 176 | 179,759 | ||||
Zions Bancorporation | 75 | 72,000 | ||||
| 794,647 | ||||||
Finance – 0.2% | ||||||
International Lease Finance Corp. | 65 | 60,356 | ||||
Insurance – 0.5% | ||||||
American International Group, Inc. | 220 | 168,300 | ||||
| 1,023,303 | ||||||
Industrial – 1.8% | ||||||
Basic – 0.6% | ||||||
United States Steel Corp. | 105 | 103,688 | ||||
Weyerhaeuser Co. | 90 | 95,043 | ||||
| 198,731 | ||||||
Capital Goods – 0.9% | ||||||
Masco Corp. | 105 | 103,917 | ||||
Mohawk Industries, Inc. | 100 | 106,000 | ||||
Textron Financial Corp. | 95 | 98,921 | ||||
| 308,838 | ||||||
Consumer Cyclical - Other – 0.3% | ||||||
Sheraton Holding Corp. | 100 | 106,750 | ||||
| 614,319 | ||||||
| ALLIANCEBERNSTEIN CORPORATE INCOME SHARES • | 17 |
Portfolio of Investments
| Principal Amount (000) | U.S. $ Value | |||||
Utility – 0.3% | ||||||
Electric – 0.3% | ||||||
PPL Capital Funding, Inc. | $ | 105 | $ | 96,075 | ||
Total Corporates – Non-Investment Grades | 1,733,697 | |||||
GOVERNMENTS - TREASURIES – 1.0% | ||||||
Treasuries – 1.0% | ||||||
United States – 1.0% | ||||||
U.S. Treasury Bonds | 315 | 316,673 | ||||
SHORT-TERM INVESTMENTS – 1.6% | ||||||
Time Deposit – 1.6% | ||||||
State Street Time Deposit | 552 | 552,000 | ||||
Total Investments – 98.6% | 33,547,664 | |||||
Other assets less liabilities – 1.4% | 493,275 | |||||
Net Assets – 100.0% | $ | 34,040,939 | ||||
| (a) | Security is exempt from registration under Rule 144A of the Securities Act of 1933. These securities are considered liquid and may be resold in transactions exempt from registration, normally to qualified institutional buyers. At April 30, 2010, the aggregate market value of these securities amounted to $1,262,281 or 3.7% of net assets. |
| (b) | Variable rate coupon, rate shown as of April 30, 2010. |
| (c) | Coupon rate adjusts periodically based upon a predetermined schedule. Stated interest rate in effect at April 30, 2010. |
Glossary:
LP – Limited Partnership
REIT – Real Estate Investment Trust
See notes to financial statements.
| 18 | • ALLIANCEBERNSTEIN CORPORATE INCOME SHARES |
Portfolio of Investments
STATEMENT OF ASSETS & LIABILITIES
April 30, 2010
| Assets | ||||
Investments in securities, at value (cost $32,270,276) | $ | 33,547,664 | ||
Cash | 2,558 | |||
Interest receivable | 543,908 | |||
Receivable for shares of beneficial interest sold | 47,823 | |||
Total assets | 34,141,953 | |||
| Liabilities | ||||
Dividends payable | 53,494 | |||
Payable for shares of beneficial interest redeemed | 47,520 | |||
Total liabilities | 101,014 | |||
Net Assets | $ | 34,040,939 | ||
| Composition of Net Assets | ||||
Shares of beneficial interest, at par | $ | 33 | ||
Additional paid-in capital | 36,884,546 | |||
Undistributed net investment income | 74,130 | |||
Accumulated net realized loss on investment transactions | (4,195,158 | ) | ||
Net unrealized appreciation on investments | 1,277,388 | |||
| $ | 34,040,939 | |||
Net Asset Value Per Share—unlimited shares of beneficial interest authorized, $.00001 par value (based on 3,304,703 common shares outstanding) | $ | 10.30 | ||
See notes to financial statements.
| ALLIANCEBERNSTEIN CORPORATE INCOME SHARES • | 19 |
Statement of Assets & Liabilities
STATEMENT OF OPERATIONS
Year Ended April 30, 2010
| Investment Income | |||
Interest | $ | 3,087,579 | |
| Realized and Unrealized Gain on Investment Transactions | |||
Net realized gain on investment transactions | 148,192 | ||
Net change in unrealized appreciation/depreciation of investments | 11,746,902 | ||
Net gain on investment transactions | 11,895,094 | ||
Net Increase in Net Assets from Operations | $ | 14,982,673 | |
See notes to financial statements.
| 20 | • ALLIANCEBERNSTEIN CORPORATE INCOME SHARES |
Statement of Operations
STATEMENT OF CHANGES IN NET ASSETS
| Year Ended April 30, 2010 | Year Ended April 30, 2009 | |||||||
| Increase (Decrease) in Net Assets from Operations | ||||||||
Net investment income | $ | 3,087,579 | $ | 4,656,797 | ||||
Net realized gain (loss) on investment transactions | 148,192 | (3,348,583 | ) | |||||
Net change in unrealized appreciation/depreciation of investments | 11,746,902 | (8,031,893 | ) | |||||
Net increase (decrease) in net assets from operations | 14,982,673 | (6,723,679 | ) | |||||
| Dividends to Shareholders from | ||||||||
Net investment income | (3,087,579 | ) | (4,656,797 | ) | ||||
| Transactions in Shares of Beneficial Interest | ||||||||
Net decrease | (34,848,331 | ) | (18,455,698 | ) | ||||
Total decrease | (22,953,237 | ) | (29,836,174 | ) | ||||
| Net Assets | ||||||||
Beginning of period | 56,994,176 | 86,830,350 | ||||||
End of period (including undistributed net investment income of $74,130 and $73,418, respectively) | $ | 34,040,939 | $ | 56,994,176 | ||||
See notes to financial statements.
| ALLIANCEBERNSTEIN CORPORATE INCOME SHARES • | 21 |
Statement of Changes in Net Assets
NOTES TO FINANCIAL STATEMENTS
April 30, 2010
NOTE A
Significant Accounting Policies
AllianceBernstein Corporate Shares (the “Trust”) was organized as a Massachusetts business trust under the laws of The Commonwealth of Massachusetts by an Agreement and Declaration of Trust (“Declaration of Trust”) dated January 26, 2004. The Trust is registered under the Investment Company Act of 1940, as an open-end, diversified management investment company. The Trust operates as a “series” company currently having one separate portfolio: AllianceBernstein Corporate Income Shares (the “Portfolio”). AllianceBernstein Corporate Income Shares is considered to be a separate entity for financial reporting and tax purposes. The Portfolio commenced investment operations on December 11, 2006. Prior to the commencement of investment operations on December 11, 2006, the Portfolio had no operations other than the sale to the Adviser of 10,000 Portfolio shares for $10 each for the aggregate amount of $100,000 on May 17, 2006.
Shares of the Portfolio are offered exclusively to holders of accounts established under wrap-fee programs sponsored and maintained by certain registered investment advisers approved by the Adviser. The Portfolio’s shares may be purchased at the relevant net asset value without a sales charge or other fee. The financial statements have been prepared in conformity with U.S. generally accepted accounting principles (“U.S. GAAP”) which require management to make certain estimates and assumptions that affect the reported amounts of assets and liabilities in the financial statements and amounts of income and expenses during the reporting period. Actual results could differ from those estimates. The following is a summary of significant accounting policies followed by the Portfolio.
1. Security Valuation
Portfolio securities are valued at their current market value determined on the basis of market quotations or, if market quotations are not readily available or are deemed unreliable, at “fair value” as determined in accordance with procedures established by and under the general supervision of the Portfolio’s Board of Trustees.
In general, the market value of securities which are readily available and deemed reliable are determined as follows. Securities listed on a national securities exchange (other than securities listed on the NASDAQ Stock Market, Inc. (“NASDAQ”)) or on a foreign securities exchange are valued at the last sale price at the close of the exchange or foreign securities exchange. If there has been no sale on such day, the securities are valued at the mean of the closing bid and asked prices on such day. Securities listed on more than one exchange are valued by reference to the principal exchange on which the securities are traded; securities listed only on NASDAQ are valued in accordance with the NASDAQ Official Closing Price; listed put or call options are valued at the last sale price. If there has been no sale on that day, such securities will be valued at the closing
| 22 | • ALLIANCEBERNSTEIN CORPORATE INCOME SHARES |
Notes to Financial Statements
bid prices on that day; open futures contracts and options thereon are valued using the closing settlement price or, in the absence of such a price, the most recent quoted bid price. If there are no quotations available for the day of valuation, the last available closing settlement price is used; securities traded in the over-the-counter market (“OTC”) are valued at the mean of the current bid and asked prices as reported by the National Quotation Bureau or other comparable sources; U.S. government securities and other debt instruments having 60 days or less remaining until maturity are valued at amortized cost if their original maturity was 60 days or less; or by amortizing their fair value as of the 61st day prior to maturity if their original term to maturity exceeded 60 days; fixed-income securities, including mortgage backed and asset backed securities, may be valued on the basis of prices provided by a pricing service or at a price obtained from one or more of the major broker/dealers. In cases where broker/dealer quotes are obtained, AllianceBernstein L.P. (the “Adviser”) may establish procedures whereby changes in market yields or spreads are used to adjust, on a daily basis, a recently obtained quoted price on a security; and OTC and other derivatives are valued on the basis of a quoted bid price or spread from a major broker/dealer in such security. Investments in money market funds are valued at their net asset value each day.
Securities for which market quotations are not readily available (including restricted securities) or are deemed unreliable are valued at fair value. Factors considered in making this determination may include, but are not limited to, information obtained by contacting the issuer, analysts, analysis of the issuer’s financial statements or other available documents. In addition, the Portfolio may use fair value pricing for securities primarily traded in non-U.S. markets because most foreign markets close well before the Portfolio values its securities at 4:00 p.m., Eastern Time. The earlier close of these foreign markets gives rise to the possibility that significant events, including broad market moves, may have occurred in the interim and may materially affect the value of those securities.
2. Fair Value Measurements
In accordance with U.S. GAAP regarding fair value measurements, fair value is defined as the price that the Portfolio would receive to sell an asset or pay to transfer a liability in an orderly transaction between market participants at the measurement date. The U.S. GAAP disclosure requirements establish a framework for measuring fair value, and a three-level hierarchy for fair value measurements based upon the transparency of inputs to the valuation of an asset or liability. Inputs may be observable or unobservable and refer broadly to the assumptions that market participants would use in pricing the asset or liability. Observable inputs reflect the assumptions market participants would use in pricing the asset or liability based on market data obtained from sources independent of the Portfolio. Unobservable inputs reflect the Portfolio’s own assumptions about the assumptions that market participants would use in pricing the asset or liability based on the best information available in the circumstances. Each investment is assigned a level based upon the observability of the inputs
| ALLIANCEBERNSTEIN CORPORATE INCOME SHARES • | 23 |
Notes to Financial Statements
which are significant to the overall valuation. The three-tier hierarchy of inputs is summarized below.
| • | Level 1—quoted prices in active markets for identical investments |
| • | Level 2—other significant observable inputs (including quoted prices for similar investments, interest rates, prepayment speeds, credit risk, etc.) |
| • | Level 3—significant unobservable inputs (including the Portfolio’s own assumptions in determining the fair value of investments) |
The following table summarizes the valuation of the Portfolio’s investments by the above fair value hierarchy levels as of April 30, 2010:
Investments in | Level 1 | Level 2 | Level 3 | Total | ||||||||
Corporates—Investment Grades | $ | — | $ | 30,945,294 | $ | — | $ | 30,945,294 | ||||
Corporates—Non-Investment Grades | — | 1,733,697 | — | 1,733,697 | ||||||||
Governments—Treasuries | — | 316,673 | — | 316,673 | ||||||||
Short-Term Investments | — | 552,000 | — | 552,000 | ||||||||
Total Investments in Securities | — | 33,547,664 | — | 33,547,664 | ||||||||
Other Financial Instruments* | — | — | — | — | ||||||||
Total | $ | — | $ | 33,547,664 | $ | — | $ | 33,547,664 | ||||
| * | Other financial instruments are derivative instruments, such as futures, forwards and swap contracts, which are valued at the unrealized appreciation/depreciation on the instrument. |
3. Taxes
It is the Portfolio’s policy to meet the requirements of the Internal Revenue Code applicable to regulated investment companies and to distribute all of its investment company taxable income and net realized gains, if any, to shareholders. Therefore, no provisions for federal income or excise taxes are required.
In accordance with U.S. GAAP requirements regarding accounting for uncertainties in income taxes, management has analyzed the Portfolio’s tax positions taken on federal and state income tax returns for all open tax years (the current and the prior three tax years) and has concluded that no provision for income tax is required in the Portfolio’s financial statements.
4. Investment Income and Investment Transactions
Dividend income is recorded on the ex-dividend date or as soon as the Portfolio is informed of the dividend. Interest income is accrued daily. Investment transactions are accounted for on the date the securities are purchased or sold. Investment gains or losses are determined on the identified cost basis. The Portfolio amortizes premiums and accretes discounts as adjustments to interest income.
| 24 | • ALLIANCEBERNSTEIN CORPORATE INCOME SHARES |
Notes to Financial Statements
5. Dividends and Distributions
Dividends and distributions to shareholders, if any, are recorded on the ex-dividend date. Income dividends and capital gains distributions are determined in accordance with federal tax regulations and may differ from those determined in accordance with U.S. GAAP. To the extent these differences are permanent, such amounts are reclassified within the capital accounts based on their federal tax basis treatment; temporary differences do not require such reclassification.
NOTE B
Advisory Fee and Other Transactions with Affiliates
Under the terms of the Advisory Agreement, the Portfolio pays no advisory fee to the Adviser. The Adviser serves as investment manager and adviser of the Portfolio and continuously furnishes an investment program for the Portfolio and manages, supervises and conducts the affairs of the Portfolio, subject to the supervisions of the Portfolio’s Board of Trustees. The Advisory Agreement provides that the Adviser or an affiliate will furnish, or pay the expenses of the Portfolio for, office space, facilities and equipment, services of executive and other personnel of the Portfolio and certain administrative services.
The Portfolio has entered into a Distribution Agreement (the “Agreement”) with AllianceBernstein Investments, Inc., the Portfolio’s principal underwriter (the “Underwriter”), to permit the Underwriter to distribute the Portfolio’s shares, which are sold at their net asset value without any sales charge. The Underwriter receives no fee for this service. The Underwriter is a wholly owned subsidiary of the Adviser.
AllianceBernstein Investor Services, Inc. (“ABIS”), an indirect wholly-owned subsidiary of the Adviser, acts as the Portfolios’ registrar, transfer agent and dividend-disbursing agent. ABIS registers the transfer, issuance and redemption of Portfolio shares and disburses dividends and other distributions to Portfolio shareholders. ABIS receives no fee for these services.
NOTE C
Investment Transactions
Purchases and sales of investment securities (excluding short-term investments) for the year ended April 30, 2010 were as follows:
| Purchases | Sales | |||||
Investment securities (excluding | $ | 9,669,889 | $ | 42,868,616 | ||
U.S. government securities | 312,391 | 829,175 | ||||
| ALLIANCEBERNSTEIN CORPORATE INCOME SHARES • | 25 |
Notes to Financial Statements
The cost of investments for federal income tax purposes, gross unrealized appreciation and unrealized depreciation are as follows:
Cost | $ | 32,280,355 | ||
Gross unrealized appreciation | $ | 1,674,879 | ||
Gross unrealized depreciation | (407,570 | ) | ||
Net unrealized appreciation | $ | 1,267,309 | ||
NOTE D
Capital Stock
Transactions in shares of beneficial interest were as follows:
| Shares | Amount | |||||||||||||||||
| Year Ended April 30, 2010 | Year Ended April 30, 2009 | Year Ended April 30, 2010 | Year Ended April 30, 2009 | |||||||||||||||
| Class A | ||||||||||||||||||
Shares sold | 498,687 | 1,722,870 | $ | 4,670,365 | $ | 14,602,971 | ||||||||||||
Shares redeemed | (4,101,040 | ) | (3,898,891 | ) | (39,518,696 | ) | (33,058,669 | ) | ||||||||||
Net decrease | (3,602,353 | ) | (2,176,021 | ) | $ | (34,848,331 | ) | $ | (18,455,698 | ) | ||||||||
NOTE E
Risks Involved in Investing in the Portfolio
Interest Rate Risk and Credit Risk—Interest rate risk is the risk that changes in interest rates will affect the value of an Underlying Portfolio’s investments in fixed-income debt securities such as bonds or notes. Increases in interest rates may cause the value of the Portfolio’s investments to decline. Credit risk is the risk that the issuer or guarantor of a debt security, or the counterparty to a derivative contract, will be unable or unwilling to make timely principal and/or interest payments, or to otherwise honor its obligations. The degree of risk for a particular security may be reflected in its credit risk rating. Credit risk is greater for medium quality and lower-rated securities. Lower-rated debt securities and similar unrated securities (commonly known as “junk bonds”) have speculative elements or are predominantly speculative risks.
Indemnification Risk—In the ordinary course of business, the Portfolio enters into contracts that contain a variety of indemnifications. The Portfolio’s maximum exposure under these arrangements is unknown. However, the Portfolio has not had prior claims or losses pursuant to these indemnification provisions and expects the risk of loss thereunder to be remote. As such, the Portfolio has not accrued any liability in connection with these indemnification provisions.
| 26 | • ALLIANCEBERNSTEIN CORPORATE INCOME SHARES |
Notes to Financial Statements
NOTE F
Distributions to Shareholders
The tax character of distributions paid during the fiscal years ended April 30, 2010 and April 30, 2009 were as follows:
| 2010 | 2009 | |||||
Distributions paid from: | ||||||
Ordinary income | $ | 3,087,579 | $ | 4,656,797 | ||
Total taxable distributions | 3,087,579 | 4,656,797 | ||||
Total distributions paid | $ | 3,087,579 | $ | 4,656,797 | ||
As of April 30, 2010, the components of accumulated earnings/(deficit) on a tax basis were as follows:
Undistributed ordinary income | $ | 127,624 | ||
Accumulated capital and other losses | (4,185,079 | )(a) | ||
Unrealized appreciation/(depreciation) | 1,267,309 | (b) | ||
Total accumulated earnings/(deficit) | $ | (2,790,146 | )(c) | |
| (a) | On April 30, 2010, the Fund had capital loss carryforward of $4,185,079 of which $591,158 expires in 2016, $2,193,148 expires in 2017 and $1,400,773 expires in 2018. |
| (b) | The difference between book-basis and tax-basis unrealized appreciation/(depreciation) is attributable primarily to the tax deferral of losses on wash sales. |
| (c) | The difference between book-basis and tax-basis components of accumulated earnings/(deficit) is attributable primarily to dividends payable. |
During the current fiscal year, permanent differences due to consent fee reclassification resulted in an increase to both undistributed net investment income and accumulated net realized loss on investment transactions. This reclassification had no effect on net assets.
NOTE G
Legal Proceedings
On October 2, 2003, a purported class action complaint entitled Hindo, et al. v. AllianceBernstein Growth & Income Fund, et al. (“Hindo Complaint”) was filed against the Adviser, Alliance Capital Management Holding L.P. (“Alliance Holding”), Alliance Capital Management Corporation, AXA Financial, Inc., the AllianceBernstein Funds, certain officers of the Adviser (“AllianceBernstein defendants”), and certain other unaffiliated defendants, as well as unnamed Doe defendants. The Hindo Complaint was filed in the United States District Court for the Southern District of New York by alleged shareholders of two of the AllianceBernstein Funds. The Hindo Complaint alleges that certain of the AllianceBernstein defendants failed to disclose that they improperly allowed certain hedge funds and other unidentified parties to engage in “late trading” and “market timing” of AllianceBernstein Fund securities, violating Sections 11 and 15 of the Securities Act, Sections 10(b) and 20(a) of the Exchange Act and Sections 206 and 215 of the Advisers Act. Plaintiffs seek an unspecified amount of
| ALLIANCEBERNSTEIN CORPORATE INCOME SHARES • | 27 |
Notes to Financial Statements
compensatory damages and rescission of their contracts with the Adviser, including recovery of all fees paid to the Adviser pursuant to such contracts.
Following October 2, 2003, 43 additional lawsuits making factual allegations generally similar to those in the Hindo Complaint were filed in various federal and state courts against the Adviser and certain other defendants. On September 29, 2004, plaintiffs filed consolidated amended complaints with respect to four claim types: mutual fund shareholder claims; mutual fund derivative claims; derivative claims brought on behalf of Alliance Holding; and claims brought under ERISA by participants in the Profit Sharing Plan for Employees of the Adviser. All four complaints include substantially identical factual allegations, which appear to be based in large part on the Order of the SEC dated December 18, 2003 as amended and restated January 15, 2004 (“SEC Order”) and the New York State Attorney General Assurance of Discontinuance dated September 1, 2004 (“NYAG Order”).
On April 21, 2006, the Adviser and attorneys for the plaintiffs in the mutual fund shareholder claims, mutual fund derivative claims, and ERISA claims entered into a confidential memorandum of understanding containing their agreement to settle these claims. The agreement has been documented by a stipulation of settlement, which has been submitted for court approval. The settlement amount ($30 million), which the Adviser previously accrued and disclosed, has been disbursed. The derivative claims brought on behalf of Alliance Holding, in which plaintiffs seek an unspecified amount of damages, remain pending.
It is possible that these matters and/or other developments resulting from these matters could result in increased redemptions of the AllianceBernstein Mutual Funds’ shares or other adverse consequences to the AllianceBernstein Mutual Funds. This may require the AllianceBernstein Mutual Funds to sell investments held by those funds to provide for sufficient liquidity and could also have an adverse effect on the investment performance of the AllianceBernstein Mutual Funds. However, the Adviser believes that these matters are not likely to have a material adverse effect on its ability to perform advisory services relating to the AllianceBernstein Mutual Funds.
NOTE H
Subsequent Events
Management has evaluated subsequent events for possible recognition or disclosure in the financial statements through the date the financial statements are issued. Except as reported in Note I, management has determined that there are no material events that would require disclosure in the Portfolio’s financial statements through this date.
| 28 | • ALLIANCEBERNSTEIN CORPORATE INCOME SHARES |
Notes to Financial Statements
NOTE I
Change of Independent Registered Public Accounting Firm (unaudited)
On May 5, 2010, Ernst & Young LLP (“E&Y”) was selected as the Fund’s independent registered public accounting firm for the 2011 fiscal year. A majority of the Fund’s Board of Directors, including a majority of the Independent Directors, approved the appointment of E&Y. The predecessor independent registered public accounting firm’s reports on the Fund’s financial statements for each of the years ended April 30, 2009 and 2008 contained no adverse opinion or disclaimer of opinion and were not qualified or modified as to uncertainty, audit scope or accounting principles. During such fiscal periods and through May 5, 2010, there were no disagreements between the Fund and the predecessor independent registered public accounting firm on any matter of accounting principles or practices, financial statement disclosure, or auditing scope or procedures, which such agreements, if not resolved to the satisfaction of the predecessor independent registered public accounting firm, would have caused them to make reference to the subject matter of the disagreement in connection with their reports on the financial statements for such periods.
| ALLIANCEBERNSTEIN CORPORATE INCOME SHARES • | 29 |
Notes to Financial Statements
FINANCIAL HIGHLIGHTS
Selected Data For A Share Of Beneficial Interest Outstanding Throughout Each Period
| Year Ended April 30, | December 11, April 30, 2007 | |||||||||||
| 2010 | 2009 | 2008 | ||||||||||
Net asset value, beginning of period | $ 8.25 | $ 9.56 | $ 9.89 | $ 10.00 | ||||||||
Income From Investment Operations | ||||||||||||
Net investment income(b) | .59 | .57 | .56 | .21 | ||||||||
Net realized and unrealized gain (loss) on investment transactions | 2.05 | (1.31 | ) | (.33 | ) | (.11 | ) | |||||
Net increase (decrease) in net asset value from operations | 2.64 | (.74 | ) | .23 | .10 | |||||||
Less: Dividends | ||||||||||||
Dividends from net investment income | (.59 | ) | (.57 | ) | (.56 | ) | (.21 | ) | ||||
Net asset value, end of period | $ 10.30 | $ 8.25 | $ 9.56 | $ 9.89 | ||||||||
Total Return | ||||||||||||
Total investment return based on net asset value(c) | 32.72 | % | (7.76 | )% | 2.38 | % | 1.02 | % | ||||
Ratios/Supplemental Data | ||||||||||||
Net assets, end of period (000’s omitted) | $34,041 | $56,994 | $86,830 | $89,127 | ||||||||
Ratio to average net assets of: | ||||||||||||
Net investment income | 6.22 | % | 6.56 | % | 5.73 | % | 5.58 | %(d) | ||||
Portfolio turnover rate | 21 | % | 26 | % | 58 | % | 33 | % | ||||
| (a) | Commencement of operations. |
| (b) | Based on average shares outstanding. |
| (c) | Total investment return is calculated assuming an initial investment made at the net asset value at the beginning of the period, reinvestment of all dividends and distributions at net asset value during the period, and redemption on the last day of the period. Initial sales charges or contingent deferred sales charges are not reflected in the calculation of total investment return. Total return does not reflect the deduction of taxes that a shareholder would pay on fund distributions or the redemption of fund shares. Total investment return calculated for a period of less than one year is not annualized. |
| (d) | Annualized. |
See notes to financial statements.
| 30 | • ALLIANCEBERNSTEIN CORPORATE INCOME SHARES |
Financial Highlights
REPORT OF INDEPENDENT REGISTERED
PUBLIC ACCOUNTING FIRM
The Trustees and Shareholders
AllianceBernstein Corporate Income Shares
We have audited the accompanying statement of assets and liabilities, including the portfolio of investments, of AllianceBernstein Corporate Income Shares (the Portfolio) as of April 30, 2010, and the related statement of operations for the year then ended, the statement of changes in net assets for each of the years in the two-year period then ended, and the financial highlights for each of the years in the three-year period then ended and for the period from December 11, 2006 (commencement of operations) to April 30, 2007. These financial statements and financial highlights are the responsibility of the Portfolio’s management. Our responsibility is to express an opinion on these financial statements and financial highlights based on our audits.
We conducted our audits in accordance with the standards of the Public Company Accounting Oversight Board (United States). Those standards require that we plan and perform the audit to obtain reasonable assurance about whether the financial statements and financial highlights are free of material misstatement. An audit includes examining, on a test basis, evidence supporting the amounts and disclosures in the financial statements. Our procedures included confirmation of securities owned as of April 30, 2010, by correspondence with the custodian. An audit also includes assessing the accounting principles used and significant estimates made by management, as well as evaluating the overall financial statement presentation. We believe that our audits provide a reasonable basis for our opinion.
In our opinion, the financial statements and financial highlights referred to above present fairly, in all material respects, the financial position of AllianceBernstein Corporate Income Shares as of April 30, 2010, and the results of its operations for the year then ended, the changes in its net assets for each of the years in the two-year period then ended, and the financial highlights for each of the years in the three-year period then ended and for the period from December 11, 2006 to April 30, 2007, in conformity with U.S. generally accepted accounting principles.

New York, New York
June 24, 2010
| ALLIANCEBERNSTEIN CORPORATE INCOME SHARES • | 31 |
Report of Independent Registered Public Accounting Firm
TAX INFORMATION
(unaudited)
For foreign shareholders, the Fund designates 99.89% of its ordinary dividends as qualified interest related dividends.
| 32 | • ALLIANCEBERNSTEIN CORPORATE INCOME SHARES |
Tax Information
BOARD OF TRUSTEES
| William H. Foulk, Jr.(1), Chairman | Nancy P. Jacklin(1) | |
| John H. Dobkin(1) | Marshall C. Turner, Jr.(1) Earl D. Weiner(1) | |
| Michael J. Downey(1) | ||
| D. James Guzy(1) |
OFFICERS
Robert M. Keith, President and Chief Executive Officer Philip L. Kirstein, Senior Vice President and Independent Compliance Officer Douglas J. Peebles, Senior Vice President Lawrence J. Shaw(2) , Senior Vice President | Shawn E. Keegan(2) , Vice President Joel J. McKoan(2) , Vice President Emilie D. Wrapp, Secretary Joseph J. Mantineo, Treasurer and Chief Financial Officer Phyllis J. Clarke, Controller |
Custodian and Accounting Agent State Street Bank and Trust Company
Principal Underwriter AllianceBernstein Investments, Inc.
Transfer Agent AllianceBernstein Investor Services, Inc. | Legal Counsel Seward & Kissel LLP One Battery Park Plaza New York, NY 10004
Independent Registered Public Accounting Firm KPMG LLP 345 Park Avenue New York, NY 10154 |
| (1) | Member of the Audit Committee, the Governance and Nominating Committee and the Independent Directors Committee. Mr. Foulk is the sole member of the Fair Value Pricing Committee. |
| (2) | The day-to-day management of, and investment decisions for, the Fund’s portfolio are made by the Corporate Income Shares Investment Team. Messrs. Shawn E. Keegan, Joel J. McKoan and Lawrence J. Shaw are the investment professionals primarily responsible for the day-to-day management of the Fund’s portfolio. |
| ALLIANCEBERNSTEIN CORPORATE INCOME SHARES • | 33 |
Board of Trustees
TRUSTEES AND OFFICERS INFORMATION
Board of Trustees Information
The business and affairs of the Fund are managed under the direction of the Board of Trustees. Certain information concerning the Fund’s Trustees is set forth below.
| NAME, ADDRESS*, AGE, AND (YEAR FIRST ELECTED**) | PRINCIPAL OCCUPATION(S) DURING PAST 5 YEARS AND OTHER RELEVANT | PORTFOLIOS IN FUND COMPLEX OVERSEEN BY TRUSTEE | OTHER DIRECTORSHIPS HELD BY TRUSTEE IN PAST FIVE YEARS | |||
| DISINTERESTED TRUSTEES | ||||||
Chairman of the Board (2004) | Investment Adviser and an Independent Consultant since prior to 2005. Previously, he was Senior Manager of Barrett Associates, Inc., a registered investment adviser. He was formerly Deputy Comptroller and Chief Investment Officer of the State of New York and, prior thereto, Chief Investment Officer of the New York Bank for Savings. He has served as a director or trustee of various AllianceBernstein Funds since 1983 and has been Chairman of the AllianceBernstein Funds and of the Independent Directors Committee of such Funds since 2003. He is also active in a number of mutual fund related organizations and committees. | 92 | None | |||
John H. Dobkin, # (2004) | Independent Consultant since prior to 2005. Formerly, President of Save Venice, Inc. (preservation organization) from 2001-2002, Senior Advisor from June 1999-June 2000 and President of Historic Hudson Valley (historic preservation) from December 1989-May 1999. Previously, Director of the National Academy of Design. He has served as a director or trustee of various AllianceBernstein Funds since 1992, and as Chairman of the Audit Committees of a number of such Funds from 2001-2008. | 90 | None | |||
| 34 | • ALLIANCEBERNSTEIN CORPORATE INCOME SHARES |
Trustees and Officers Information
NAME, (YEAR FIRST ELECTED**) | PRINCIPAL OCCUPATION(S) DURING PAST 5 YEARS AND OTHER RELEVANT QUALIFICATIONS*** | PORTFOLIOS IN FUND COMPLEX OVERSEEN BY TRUSTEE | OTHER DIRECTORSHIPS HELD BY TRUSTEE IN PAST FIVE YEARS | |||
DISINTERESTED TRUSTEES (continued) | ||||||
Michael J. Downey, # (2005) | Private Investor since prior to 2005. Formerly, managing partner of Lexington Capital, LLC (investment advisory firm) from December 1997 until December 2003. From 1987 until 1993, Chairman and CEO of Prudential Mutual Fund Management, Director of the Prudential Mutual Funds, and member of the Executive Committee of Prudential Securities Inc. He has served as a director or trustee of the AllianceBernstein Funds since 2005, and is a director of two other registered investment companies (and Chairman of one of them). | 90 | Asia Pacific Fund, Inc. and The Merger Fund since prior to 2005 and Prospect Acquisition Corp. (financial services) since 2007 until 2009. | |||
D. James Guzy, # (2005) | Chairman of the Board of PLX Technology (semi-conductors) and of SRC Computers Inc., with which he has been associated since prior to 2005. He was a Director of the Intel Corporation (semi-conductors) from 1969 until 2008, and served as Chairman of the Finance Committee of such company for several years until May 2008. He has served as a director of one or more of the AllianceBernstein Funds since 1982. | 90 | Cirrus Logic Corporation (semi- conductors) and PLX Technology, Inc. (semi-conductors) since prior to 2005 and Intel Corporation (semi-conductors) since prior to 2005 until 2008 | |||
| ALLIANCEBERNSTEIN CORPORATE INCOME SHARES • | 35 |
Trustees and Officers Information
| NAME, ADDRESS*, AGE, AND (YEAR FIRST ELECTED**) | PRINCIPAL OCCUPATION(S) DURING PAST 5 YEARS AND OTHER RELEVANT QUALIFICATIONS*** | PORTFOLIOS IN FUND COMPLEX OVERSEEN BY TRUSTEE | OTHER DIRECTORSHIPS HELD BY TRUSTEE IN PAST FIVE YEARS | |||
DISINTERESTED TRUSTEES (continued) | ||||||
Nancy P. Jacklin, # (2006) | Professorial Lecturer at the Johns Hopkins School of Advanced International Studies since 2008. Formerly, U.S. Executive Director of the International Monetary Fund (December 2002-May 2006); Partner, Clifford Chance (1992-2002); Sector Counsel, International Banking and Finance, and Associate General Counsel, Citicorp (1985-1992); Assistant General Counsel (International), Federal Reserve Board of Governors (1982-1985); and Attorney Advisor, U.S. Department of the Treasury (1973-1982). Member of the Bar of the District of Columbia and of New York; and member of the Council on Foreign Relations. She has served as a director or trustee of the AllianceBernstein Funds since 2006. | 90 | None | |||
Marshall C. Turner, Jr., # (2005) | Private Investor since prior to 2005. He was Interim CEO of MEMC Electronic Materials, Inc. (semi-conductor and solar cell substrates) from November 2008 until March 2009. He was Chairman and CEO of Dupont Photomasks, Inc. (components of semi-conductor manufacturing), 2003-2005, and President and CEO, 2005-2006, after the company was renamed Toppan Photomasks, Inc. He has extensive experience in venture capital investing including prior service as general partner of three institutional venture capital partnerships, and serves on the boards of a number of education and science-related non-profit organizations. He has served as a director or trustee of one or more of the AllianceBernstein Funds since 1992. | 90 | Xilinx, Inc. (programmable logic semi-conductors) and MEMC Electronic Materials, Inc., (semi-conductor and solar cell substrates) since prior to 2005 | |||
| 36 | • ALLIANCEBERNSTEIN CORPORATE INCOME SHARES |
Trustees and Officers Information
| NAME, ADDRESS*, AGE, AND (YEAR FIRST ELECTED**) | PRINCIPAL OCCUPATION(S) DURING PAST 5 YEARS AND OTHER RELEVANT QUALIFICATIONS*** | PORTFOLIOS IN FUND COMPLEX OVERSEEN BY TRUSTEE | OTHER DIRECTORSHIPS HELD BY TRUSTEE IN PAST FIVE YEARS | |||
DISINTERESTED TRUSTEES (continued) | ||||||
Earl D. Weiner, # 70 (2007) | Of Counsel, and Partner prior to January 2007, of the law firm Sullivan & Cromwell LLP, and member of ABA Federal Regulation of Securities Committee Task Force to draft editions of the Fund Director’s Guidebook. He also serves as a director or trustee of various non-profit organizations and has served as Chairman or Vice Chairman of a number of them. He has served as a director or trustee of the AllianceBernstein Funds since 2007 and is Chairman of the Governance and Nominating Committees of most of the Funds. | 90 | None | |||
| * | The address for each of the Fund’s disinterested Trustees is c/o AllianceBernstein L.P., Attention: Philip L. Kirstein, 1345 Avenue of the Americas, New York, NY 10105. |
| ** | There is no stated term of office for the Fund’s Trustees. |
| *** | The information above includes each Trustee’s principal occupation during the last five years and other information relating to the experience, attributes, and skills relevant to each Trustee’s qualifications to serve as a Trustee, which led to the conclusion that each Trustee should serve as a Trustee for the Fund. |
| # | Member of the Audit Committee, the Governance and Nominating Committee and the Independent Directors Committee. |
| + | Member of the Fair Value Pricing Committee. |
| ALLIANCEBERNSTEIN CORPORATE INCOME SHARES • | 37 |
Trustees and Officers Information
Officer Information
Certain information concerning the Fund’s officers is set forth below.
NAME, ADDRESS,* AND AGE | POSITION(S) HELD WITH FUND | PRINCIPAL OCCUPATION DURING PAST 5 YEARS | ||
Robert M. Keith 50 | President and Chief Executive Officer | Senior Vice President of AllianceBernstein L.P. (the “Adviser”)** and the head of AllianceBernstein Investments, Inc. (“ABI”)** since July 2008; Director of ABI and President of the AllianceBernstein Mutual Funds. Previously, he served as Executive Managing Director of ABI from December 2006 to June 2008. Prior to joining ABI in 2006, Executive Managing Director of Bernstein Global Wealth Management, and prior thereto, Senior Managing Director and Global Head of Client Service and Sales of the Adviser’s institutional investment management business since 2004. Prior thereto, Managing Director and Head of North American Client Service and Sales in the Adviser’s institutional investment management business, with which he had been associated since prior to 2004. | ||
| Philip L. Kirstein 65 | Senior Vice President and Independent Compliance Officer | Senior Vice President and Independent Compliance Officer of the AllianceBernstein Funds, with which he has been associated since October 2004. Prior thereto, he was Of Counsel to Kirkpatrick & Lockhart, LLP from October 2003 to October 2004, and General Counsel of Merrill Lynch Investment Managers, L.P. prior to March 2003. | ||
| Douglas J. Peebles 44 | Senior Vice President | Senior Vice President of the Adviser,** with which he has been associated since prior to 2005. | ||
| Lawrence J. Shaw 59 | Senior Vice President | Senior Vice President of the Adviser,** with which he has been associated since prior to 2005. | ||
| Shawn E. Keegan 38 | Vice President | Vice President of the Adviser,** with which he has been associated since prior to 2005. | ||
Joel J. McKoan 52 | Vice President | Senior Vice President of the Adviser,** with which he has been associated since prior to 2005. | ||
| Emilie D. Wrapp 54 | Secretary | Senior Vice President, Assistant General Counsel and Assistant Secretary of ABI,** with which she has been associated since prior to 2005. | ||
| 38 | • ALLIANCEBERNSTEIN CORPORATE INCOME SHARES |
Trustees and Officers Information
NAME, ADDRESS,* AND AGE | POSITION(S) HELD WITH FUND | PRINCIPAL OCCUPATION DURING PAST 5 YEARS | ||
| Joseph J. Mantineo 51 | Treasurer and Chief Financial Officer | Senior Vice President of AllianceBernstein Investor Services, Inc. (“ABIS”),** with which he has been associated since prior to 2005. | ||
Phyllis J. Clarke 49 | Controller | Vice President of ABIS,** with which she has been associated since prior to 2005. |
| * | The address for each of the Fund’s Officers is 1345 Avenue of the Americas, New York, NY 10105. |
| ** | The Adviser, ABI and ABIS are affiliates of the Fund. |
| The Fund’s Statement of Additional Information (“SAI”) has additional information about the Fund’s Trustees and Officers and is available without charge upon request. Contact your financial representative or AllianceBernstein at 1-800-227-4618 for a free prospectus or SAI. |
| ALLIANCEBERNSTEIN CORPORATE INCOME SHARES • | 39 |
Trustees and Officers Information
Information Regarding the Review and Approval of the Fund’s Advisory Agreement
The disinterested trustees (the “trustees”) of AllianceBernstein Corporate Shares (the “Fund”) unanimously approved the continuance of the Advisory Agreement with the Adviser in respect of AllianceBernstein Corporate Income Shares (the “Portfolio”) at a meeting held on November 3-5, 2009.
Prior to approval of the continuance of the Advisory Agreement in respect of the Portfolio, the trustees had requested from the Adviser, and received and evaluated, extensive materials. They reviewed the proposed continuance of the Advisory Agreement with the Adviser and with experienced counsel who are independent of the Adviser, who advised on the relevant legal standards. The trustees also reviewed an independent evaluation prepared by the Fund’s Senior Officer (who is also the Fund’s Independent Compliance Officer) of the reasonableness of the advisory fee in the Advisory Agreement wherein the Senior Officer concluded that the contractual fee (zero) for the Portfolio was reasonable. The trustees also discussed the proposed continuance in private sessions with counsel and the Fund’s Senior Officer.
The trustees noted that the Portfolio is designed as a vehicle for the wrap fee account market (where investors pay fees to a wrap fee sponsor which pays investment fees and expenses from such fee). The trustees also noted that no advisory fee is payable by the Portfolio, that the Advisory Agreement does not include the reimbursement provision for certain administrative expenses included in the advisory agreements of most of the open-end AllianceBernstein Funds, and that the Adviser is responsible for payment of the Portfolio’s ordinary expenses. The trustees noted that the Fund acknowledges in the Advisory Agreement that the Adviser and its affiliates expect to receive compensation from third parties in connection with services provided under the Advisory Agreement. The trustees further noted that the Adviser receives payments from the wrap fee program sponsors (the “Sponsors”) that use the Portfolio as an investment vehicle for their clients.
The trustees considered their knowledge of the nature and quality of the services provided by the Adviser to the Portfolio gained from their experience as trustees or directors of most of the registered investment companies advised by the Adviser, their overall confidence in the Adviser’s integrity and competence they have gained from that experience, the Adviser’s initiative in identifying and raising potential issues with the trustees and its responsiveness, frankness and attention to concerns raised by the trustees in the past, including the Adviser’s willingness to consider and implement organizational and operational changes designed to improve investment results and the services provided to the AllianceBernstein Funds. The trustees noted that they have four regular meetings each year, at each of which they receive presentations from the Adviser on the investment results of the Portfolio and review extensive materials and information presented by the Adviser.
| 40 | • ALLIANCEBERNSTEIN CORPORATE INCOME SHARES |
The trustees also considered all other factors they believed relevant, including the specific matters discussed below. In their deliberations, the trustees did not identify any particular information that was all-important or controlling, and different trustees may have attributed different weights to the various factors. The trustees determined that the selection of the Adviser to manage the Portfolio, and the overall arrangements between the Portfolio and the Adviser as provided in the Advisory Agreement, including the advisory fee, were fair and reasonable in light of the services performed, expenses incurred and such other matters as the trustees considered relevant in the exercise of their business judgment. The material factors and conclusions that formed the basis for the trustees’ determination included the following:
Nature, Extent and Quality of Services Provided
The trustees considered the scope and quality of services provided by the Adviser under the Advisory Agreement, including the quality of the investment research capabilities of the Adviser and the other resources it has dedicated to performing services for the Portfolio. They also noted the professional experience and qualifications of the Portfolio’s portfolio management team and other senior personnel of the Adviser. The quality of administrative and other services, including the Adviser’s role in coordinating the activities of the Portfolio’s other service providers, also were considered. The trustees concluded that, overall, they were satisfied with the nature, extent and quality of services provided to the Portfolio under the Advisory Agreement.
Costs of Services Provided and Profitability
The trustees reviewed a schedule of the revenues, expenses and related notes indicating the profitability of the Portfolio to the Adviser for calendar years 2007 and 2008 that had been prepared with an expense allocation methodology arrived at in consultation with an independent consultant retained by the Fund’s Senior Officer. The trustees considered that while the Adviser does not receive any advisory fee from the Portfolio or expense reimbursement, it does receive fees paid by the Sponsors. They also noted that the Adviser bears certain costs in providing services to the Portfolio and in paying its ordinary expenses. The trustees reviewed the assumptions and methods of allocation used by the Adviser in preparing fund-specific profitability data and noted that there are a number of potentially acceptable allocation methodologies for information of this type. The trustees noted that the profitability information reflected all revenues and expenses of the Adviser’s relationship with the Portfolio. The trustees recognized that it is difficult to make comparisons of profitability between fund advisory contracts because comparative information is not generally publicly available and is affected by numerous factors, including, in the case of the Portfolio, the fact that it does not pay an advisory fee. The trustees focused on the profitability of the Adviser’s relationship with the Portfolio before taxes and distribution expenses. The trustees concluded that they were satisfied that the Adviser’s level of profitability from its relationship with the Portfolio was not unreasonable.
| ALLIANCEBERNSTEIN CORPORATE INCOME SHARES • | 41 |
Fall-Out Benefits
The trustees considered the benefits to the Adviser and its affiliates from their relationships with the Portfolio other than the fees payable to it by the Sponsors whose clients invest in the Portfolio. The trustees understood that the Adviser might derive reputational and other benefits from its association with the Portfolio.
Investment Results
In addition to the information reviewed by the trustees in connection with the meeting, the trustees receive detailed performance information for the Portfolio at each regular Board meeting during the year. At the November 2009 meeting, the trustees reviewed information prepared by Lipper showing the performance of the Portfolio as compared with that of funds selected by Lipper (the “Performance Universe”), and information prepared by the Adviser showing the Portfolio’s performance as compared with the Barclays Capital U.S. Credit Bond Index (the “Index”), in each case for the 1-year period ended July 31, 2009, and (in the case of comparisons with the Index) the since inception period (December 2006 inception). The directors noted that the Portfolio was in the 4th quintile of the Performance Universe for the 1-year period and that the Portfolio underperformed the Index in the 1-year and since inception periods. The directors also reviewed performance information for periods ended September 30, 2009 and noted that in the 3-month, year-to-date and 1-year periods, the Portfolio had outperformed the Index. Based on their review, the directors concluded that the Portfolio’s performance was satisfactory.
Advisory Fees and Other Expenses
The trustees considered the advisory fee rate paid by the Portfolio to the Adviser (zero) and information provided by Lipper showing the fees paid by other fund families under a wrap fee program similar to that of the Portfolio as well as expense ratio information. The trustees recognized that it is difficult to make comparisons of advisory fees because there are variations in the services that are included in the fees paid by other funds.
The trustees reviewed the fee arrangements between the Adviser and each of the current Sponsors and noted that such fees were negotiated on an arm’s length basis and were within the range of fees paid by wrap fee sponsors to other advisers of similar funds. The trustees noted that although the Adviser’s fee arrangements with the Sponsors vary, a portion of such fees (less the expenses of the Portfolio to be paid by the Adviser) may reasonably be viewed as compensating the Adviser for advisory services it provides to the Portfolio and that the Adviser believes that while the Sponsors pay the Adviser different fee rates, the rate of fee attributable to portfolio management at the Portfolio level is the same for all Sponsors. The trustees also considered the fee rate schedules used by other registered investment companies that invest in fixed income securities that are advised by the Adviser.
| 42 | • ALLIANCEBERNSTEIN CORPORATE INCOME SHARES |
The Adviser informed the trustees that there are no institutional products managed by it which have an investment style substantially similar to that of the Portfolio. The trustees reviewed the relevant fee information from the Adviser’s Form ADV and noted that the Adviser charged institutional clients higher fees than it charged the Sponsors for advising comparably sized institutional accounts using strategies that differ from those of the Portfolio but which involved investments in securities of the same type that the Portfolio invests in (i.e., fixed income taxable). The Adviser reviewed with the trustees the significantly greater scope of the services it provides the Portfolio relative to institutional clients. The Adviser also noted that because mutual funds are constantly issuing and redeeming shares, they are more difficult to manage than an institutional account, where the assets tend to be relatively stable. In light of these facts, the trustees did not place significant weight on these fee comparisons.
Since the Portfolio does not bear ordinary expenses, the trustees did not consider comparative expense information.
Economies of Scale
Since the Advisory Agreement does not provide for any compensation to be paid to the Adviser by the Portfolio and the Portfolio’s expense ratio is zero, the trustees did not consider the extent to which fee levels in the Advisory Agreement reflect economies of scale. They did note, however, that the fee payable to the Adviser by each of the current Sponsors declines at a breakpoint based on total assets managed by the Adviser for the Sponsors.
| ALLIANCEBERNSTEIN CORPORATE INCOME SHARES • | 43 |
THE FOLLOWING IS NOT PART OF THE SHAREHOLDER REPORT OR THE FINANCIAL STATEMENTS.
SUMMARY OF SENIOR OFFICER’S EVALUATION OF INVESTMENT ADVISORY AGREEMENT1
The following is a summary of the evaluation of the Investment Advisory Agreement between AllianceBernstein L.P. (the “Adviser”) and The AllianceBernstein Corporate Shares (the “Trust”) with respect to AllianceBernstein Corporate Income Shares (the “Portfolio”).2 The evaluation of the Investment Advisory Agreement was prepared by Philip L. Kirstein, the Senior Officer of the Trust, for the Trustees of the Trust, as required by the September 1, 2004 Assurance of Discontinuance (“AoD”) between the Adviser and the New York State Attorney General (the “NYAG”). The Senior Officer’s evaluation of the Investment Advisory Agreement is not meant to diminish the responsibility or authority of the Board of Trustees to perform its duties pursuant to Section 15 of the Investment Company Act of 1940 Act (the “40 Act”) and applicable state law. The purpose of the summary is to provide shareholders with a synopsis of the independent evaluation of the reasonableness of the advisory fees proposed to be paid by the Portfolio which was provided to the Trustees in connection with their review of the proposed approval of the continuance of the Investment Advisory Agreement.
The Senior Officer’s evaluation considered the following factors:
| 1. | Advisory fees charged to institutional and other clients of the Adviser for like services; |
| 2. | Advisory fees charged by other mutual fund companies for like services; |
| 3. | Costs to the Adviser and its affiliates of supplying services pursuant to the advisory agreement, excluding any intra-corporate profit; |
| 4. | Profit margins of the Adviser and its affiliates from supplying such services; |
| 5. | Possible economies of scale as the Portfolio grows larger; and |
| 6. | Nature and quality of the Adviser’s services including the performance of the Portfolio. |
PORTFOLIO’S EXEMPTION FROM ADVISORY FEES OR EXPENSES
The Adviser proposed that the Portfolio pays no advisory fee to the Adviser for receiving the services to be provided pursuant to the Investment Advisory Agreement. The Portfolio is designed to serve the needs of the Adviser’s separately managed account (“SMA”) clients, including UBS AG and
| 1 | It should be noted that the Senior Officer’s evaluation was completed on October 21, 2009. |
| 2 | Future references to the Portfolio do not include “AllianceBernstein.” |
| 44 | • ALLIANCEBERNSTEIN CORPORATE INCOME SHARES |
Smith Barney.3 Since SMA clients pay their wrap program provider a unitary fee for managing all investments of their portfolio, the Portfolio will not pay an advisory fee. The Adviser will also reimburse the Portfolio for all of its other operating expenses, except certain extraordinary expenses, taxes, brokerage costs and the interest on borrowed money.
The Portfolio’s net assets on September 30, 2009 and September 30, 2008 are set forth below:
| Portfolio | 09/30/09 Net Assets ($MM) | 09/30/08 Net Assets ($MM) | ||||
| Corporate Income Shares | $ | 57.3 | $ | 72.5 | ||
The Portfolio, which offers only one no-load class of shares, is distributed through its principal underwriter, AllianceBernstein Investments, Inc. (“ABI”). Since the Portfolio is reimbursed by the Adviser for its operating expenses, the Portfolio does not have a distribution plan pursuant to Rule 12b-1 under the 40 Act. Set forth below are the Portfolio’s annual operating expenses in percentages:
| Annual Operating Expenses | % | |
| Advisory Fees4 | 0.35% | |
| Distribution Fees | 0.00% | |
| Other Expenses | 0.00% | |
| Fee Waiver / Reimbursements | -0.35% | |
| Net Expenses | 0.00% |
| I. | ADVISORY FEES CHARGED TO INSTITUTIONAL AND OTHER CLIENTS |
The advisory fees charged to investment companies which the Adviser manages and sponsors are normally higher than those charged to similar sized institutional accounts, including pension plans and sub-advised investment companies. The fee differential reflects, among other things, different services provided to such clients, and different liabilities assumed. Services provided by the Adviser to the Portfolio that are not provided to non-investment company clients include providing office space and personnel to serve as Fund Officers, who among other responsibilities make the certifications required under the Sarbanes–Oxley Act of 2002, and coordinating with and monitoring the Portfolio’s third party service providers such as Fund counsel, auditors, custodians, transfer agents and pricing services. The accounting, administrative, legal and compliance requirements for investment companies are more costly than those for institutional client assets
| 3 | UBS AG and Smith Barney currently employ the Adviser as one of several investment managers, and compensate the Adviser on the basis of all SMA assets managed, which would include assets of Corporate Income Shares. The Adviser’s current agreements with UBS AG and Smith Barney provide for payments to the Adviser. |
| 4 | This amount reflects the portion of the wrap fee the expected initial client is expected to pay to the Adviser for managing and bearing all expenses of the Portfolio. |
| ALLIANCEBERNSTEIN CORPORATE INCOME SHARES • | 45 |
due to the greater complexities and time required for investment companies. The Adviser also believes that it incurs substantial entrepreneurial risk when offering a new mutual fund since establishing a new mutual fund requires a large upfront investment and it may take a long time for the fund to achieve profitability since the fund must be priced to scale from inception in order to be competitive and assets are acquired one account at a time. In addition, managing the cash flow of an investment company may be more difficult than that of a stable pool of assets, such as an institutional account with little cash movement in either direction, particularly, if the fund is in net redemption and the Adviser is frequently forced to sell securities to raise cash for redemptions. However, managing a fund with positive cash flow may be easier at times than managing a stable pool of assets. Finally, in recent years, investment advisers have been sued by institutional clients and have suffered reputational damage both by the attendant publicity and outcomes other than complete victories. Accordingly, the legal and reputational risks associated with institutional accounts are greater than previously thought, although arguably still not equal to those related to the mutual fund industry.
Notwithstanding the Adviser’s view that managing an investment company is not comparable to managing other institutional accounts because the services provided are different, it is worth considering information regarding the advisory fees charged to institutional accounts with substantially similar investment styles as the Portfolio. However, with respect to the Portfolio, the Adviser represented that there is no institutional product in the Adviser’s Form ADV that has a similar investment style as the Portfolio.
The Adviser represented that it does not sub-advise any registered investment company with a substantially similar investment style as the Portfolio.
| II. | MANAGEMENT FEES CHARGED BY OTHER MUTUAL FUND COMPANIES FOR LIKE SERVICES. |
Lipper, Inc. (“Lipper”), an analytical service that is not affiliated with the Adviser, compared the fee arrangements of the Portfolio with those of other investment companies receiving similar services from other investment advisers.5 Each peer selected by Lipper had a similar fee arrangement as the Portfolio, which is to say that with respect to the Portfolio’s peers, all fund expenses, including management fees6 were reimbursed by the investment adviser.7
| 5 | Only zero fee no-load funds that participated in a wrap fee program were considered for inclusion in the Fund’s EG, regardless of the Lipper investment classification/objective of the Funds’ peers. The Fund’s EG includes the Fund, which is classified by Lipper as “A-rated Corporate Debt”, two U.S. Mortgage funds and one TIPS fund. |
| 6 | “Management Fee” is the fee attributable to the management and bearing of expenses of the funds (not the management of the wrap fee program). In each case the advisory contract provides for an advisory or management fee of zero. |
| 7 | Each of the Portfolio’s peers had an estimated net operating expense ratio of 32 basis points before full reimbursement. |
| 46 | • ALLIANCEBERNSTEIN CORPORATE INCOME SHARES |
| III. | COSTS TO THE ADVISER AND ITS AFFILIATES OF SUPPLYING SERVICES PURSUANT TO THE ADVISORY FEE ARRANGEMENT, EXCLUDING ANY INTRA-CORPORATE PROFIT. |
The Adviser utilizes two profitability reporting systems, which operate independently but are aligned with each other, to estimate the Adviser’s profitability in connection with investment advisory services provided to the Portfolio. The Senior Officer has retained a consultant to provide independent advice regarding the alignment of the two profitability systems as well as the methodologies and allocations utilized by both profitability systems. See Section IV for additional discussion.
| IV. | PROFIT MARGINS OF THE ADVISER AND ITS AFFILIATES FOR SUPPLYING SUCH SERVICES. |
The profitability information for the Portfolio, prepared by the Adviser for the Board of Trustees, was reviewed by the Senior Officer and the consultant. The Portfolio does not pay an advisory fee to the Portfolio. However, the Adviser does profit indirectly through the advisory fees that it receives from SMA clients that invest in the Portfolio. The profitability of the Portfolio, which was positive in 2008, was calculated using a weighted average of the profitability of the SMA clients, in addition to any fund specific revenue or expense item.
AllianceBernstein Investments, Inc. (“ABI”) and AllianceBernstein Investor Services, Inc. (“ABIS”), affiliates of the Adviser, serve as the Portfolio’s underwriter and transfer agent, respectively. The courts have referred to this type of business relationships as “fall-out benefits” to the Adviser and indicated that such benefits should be factored into the evaluation of the total relationship between the Portfolio and the Adviser. Neither case law nor common business practice precludes the Adviser’s affiliates from earning a reasonable profit on this type of relationship provided the affiliates’ charges and services are competitive. However, neither ABI nor ABIS receive a fee for serving as the Portfolio’s underwriter and transfer agent.
| V. | POSSIBLE ECONOMIES OF SCALE |
The Adviser has indicated that economies of scale are being shared with shareholders through fee structures,8 subsidies and enhancement to services. Based on some of the professional literature that has considered economies of scale in the mutual fund industry, it is thought that to the extent economies of scale exist, they may more often exist across a fund family as opposed to a specific fund. This is because the costs incurred by the Adviser, such as investment research or technology for trading or compliance systems, can be spread across a greater asset base as the fund family increases in size. It is also possible that as the level of services required to operate a successful investment company has increased
| 8 | Fee structures include fee reductions, pricing at scale and breakpoints in advisory fee schedules. |
| ALLIANCEBERNSTEIN CORPORATE INCOME SHARES • | 47 |
over time, and advisory firms have made such investments in their business to provide services, there may be a sharing of economies of scale without a reduction in advisory fees.
An independent consultant, retained by the Senior Officer, provided the Board of Directors an update of the Deli9 study on advisory fees and various fund characteristics. The independent consultant first reiterated the results of his previous two dimensional comparison analysis (fund size and family size) with the Board of Trustees.10 The independent consultant then discussed the results of the regression model that was utilized to study the effects of various factors on advisory fees. The regression model output indicated that the bulk of the variation in fees predicted were explained by various factors, but substantially by fund assets under management (“AUM”), family AUM, index fund indicator and investment style. The independent consultant also compared the advisory fees of the AllianceBernstein Mutual Funds to similar funds managed by 19 other large asset managers, regardless of fund size and the large asset manager’s proportion of mutual fund assets to non-mutual fund assets.
| VI. | NATURE AND QUALITY OF THE ADVISER’S SERVICES INCLUDING THE PERFORMANCE OF THE PORTFOLIO. |
With assets under management of $498 billion as of September 30, 2009, the Adviser has the investment experience to manage the portfolio assets of the Portfolio and provide non-investment services (described in Section II) to the Portfolio.
The information below, prepared by Lipper, shows the 1 year gross performance return of the Portfolio relative to its Lipper Performance Universe (“PU”)11 for the period ended July 31, 2009:
| Portfolio Return (%) | PU Median (%) | PU Rank | ||||
1 Year | 8.30 | 8.35 | 10/16 |
| 9 | The Deli study was originally published in 2002 based on 1997 data. |
| 10 | The two dimensional analysis showed patterns of lower advisory fees for funds with larger asset sizes and funds from larger family sizes compared to funds with smaller asset sizes and funds from smaller family sizes, which according to the independent consultant is indicative of a sharing of economies of scale and scope. However, in less liquid and active markets, such is not the case, as the empirical analysis showed potential for diseconomies of scale in those markets. The empirical analysis also showed diminishing economies of scale and scope as funds surpassed a certain high level of assets. |
| 11 | A Performance Universe comprises all funds within the same investment classification/objective. The Portfolio’s PU consists of the Fund and all retail no-load A rated corporate debt funds, regardless of asset size or primary channel of distribution. A load specific restriction was implemented by Lipper at the request of the Senior Officer and the Adviser. |
| 48 | • ALLIANCEBERNSTEIN CORPORATE INCOME SHARES |
Set forth below are the 1 year and since inception net performance returns of the Portfolio (in bold) and its benchmark:12
| Periods Ending July 31, 2009 Annualized Net Performance | ||||
| 1 Year (%) | Since Inception (%) | |||
| Corporate Income Shares | 8.30 | 3.40 | ||
| Barclays Capital U.S. Credit Index | 8.69 | 4.43 | ||
| Inception Date: December 11, 2006 | ||||
CONCLUSION:
Based on the factors discussed above the Senior Officer’s conclusion is that the Investment Advisory Agreement for the Portfolio is reasonable and within the range of what would have been negotiated at arms-length in light of all the surrounding circumstances. This conclusion with respect to the Portfolio is based on an evaluation of all of these factors and no single factor was dispositive.
Dated: November 25, 2009
| 12 | The Adviser provided Portfolio and benchmark performance return information for periods through July 31, 2009. |
| ALLIANCEBERNSTEIN CORPORATE INCOME SHARES • | 49 |
THIS PAGE IS NOT PART OF THE SHAREHOLDER REPORT OR THE FINANCIAL STATEMENTS
ALLIANCEBERNSTEIN FAMILY OF FUNDS
Wealth Strategies Funds
Balanced Wealth Strategy
Wealth Appreciation Strategy
Conservative Wealth Strategy*
Tax-Managed Balanced Wealth Strategy
Tax-Managed Wealth Appreciation Strategy
Tax-Managed Conservative Wealth Strategy*
Blended Style Funds
U.S. Large Cap Portfolio
International Portfolio
Tax-Managed International Portfolio
Growth Funds
Domestic
Growth Fund
Large Cap Growth Fund
Small Cap Growth Portfolio
Small/Mid Cap Growth Fund
U.S. Strategic Research Portfolio*
Global & International
Global Growth Fund
Global Thematic Growth Fund
Greater China ‘97 Fund
International Growth Fund
Value Funds
Domestic
Balanced Shares
Core Opportunities Fund*
Growth & Income Fund
Small/Mid Cap Value Fund
Utility Income Fund
Value Fund
Global & International
Global Real Estate Investment Fund
Global Value Fund
International Value Fund
Taxable Bond Funds
Bond Inflation Strategy
Diversified Yield Fund
Global Bond Fund
High Income Fund
Intermediate Bond Portfolio
Short Duration Portfolio
Municipal Bond Funds
Arizona Municipal Bond Inflation Strategy California High Income Massachusetts Michigan | Minnesota National New Jersey New York Ohio Pennsylvania Virginia |
Intermediate Municipal Bond Funds
Intermediate California
Intermediate Diversified
Intermediate New York
Closed-End Funds
AllianceBernstein Global High Income Fund
AllianceBernstein Income Fund
AllianceBernstein National Municipal Income Fund
Alliance California Municipal Income Fund
Alliance New York Municipal Income Fund
The Ibero-America Fund*
Inflation Strategies
Multi-Asset Inflation Strategy
Retirement Strategies Funds
2000 Retirement Strategy | 2020 Retirement Strategy | 2040 Retirement Strategy | ||
2005 Retirement Strategy | 2025 Retirement Strategy | 2045 Retirement Strategy | ||
2010 Retirement Strategy | 2030 Retirement Strategy | 2050 Retirement Strategy | ||
2015 Retirement Strategy | 2035 Retirement Strategy | 2055 Retirement Strategy |
We also offer Exchange Reserves,** which serves as the money market fund exchange vehicle for the AllianceBernstein mutual funds.
You should consider the investment objectives, risks, charges and expenses of any AllianceBernstein fund/portfolio carefully before investing. For free copies of our prospectuses, which contain this and other information, visit us online at www.alliancebernstein.com or contact your financial advisor. Please read the prospectus carefully before investing.
| * | Prior to December 31, 2009, Conservative Wealth Strategy was named Wealth Preservation Strategy, and Tax-Managed Conservative Wealth Strategy was named Tax-Managed Wealth Preservation Strategy. U.S. Strategic Research Portfolio was incepted on December 23, 2009. Prior to January 20, 2010, The Ibero-America Fund was named The Spain Fund. Prior to March 1, 2010, Core Opportunities Fund was named the Focused Growth & Income Fund. |
| ** | An investment in the Fund is not a deposit in a bank and is not insured or guaranteed by the Federal Deposit Insurance Corporation or any other government agency. Although the Fund seeks to preserve the value of your investment at $1.00 per share, it is possible to lose money by investing in the Fund. |
| 50 | • ALLIANCEBERNSTEIN CORPORATE INCOME SHARES |
Alliancebernstein Family of Funds
NOTES
| ALLIANCEBERNSTEIN CORPORATE INCOME SHARES • | 51 |
NOTES
| 52 | • ALLIANCEBERNSTEIN CORPORATE INCOME SHARES |
ALLIANCEBERNSTEIN CORPORATE INCOME SHARES
1345 Avenue of the Americas
New York, NY 10105
800.221.5672
| CIS-0151-0410 |  | |
| ITEM 2. | CODE OF ETHICS. |
(a) The registrant has adopted a code of ethics that applies to its principal executive officer, principal financial officer and principal accounting officer. A copy of the registrant’s code of ethics is filed herewith as Exhibit 12(a)(1).
(b) During the period covered by this report, no material amendments were made to the provisions of the code of ethics adopted in 2(a) above.
(c) During the period covered by this report, no implicit or explicit waivers to the provisions of the code of ethics adopted in 2(a) above were granted.
| ITEM 3. | AUDIT COMMITTEE FINANCIAL EXPERT. |
The registrant’s Board of Directors has determined that independent director William H. Foulk, Jr. qualifies as an audit committee financial expert.
| ITEM 4. | PRINCIPAL ACCOUNTANT FEES AND SERVICES. |
(a) - (c) The following table sets forth the aggregate fees billed* by the independent registered public accounting firm KPMG LLP, for the Fund’s last two fiscal years, for professional services rendered for: (i) the audit of the Fund’s annual financial statements included in the Fund’s annual report to stockholders; (ii) assurance and related services that are reasonably related to the performance of the audit of the Fund’s financial statements and are not reported under (i), which include advice and education related to accounting and auditing issues, quarterly press release review (for those Funds that issue quarterly press releases), and preferred stock maintenance testing (for those Funds that issue preferred stock); and (iii) tax compliance, tax advice and tax return preparation.
| Audit Fees | Audit - Related Fees | Tax Fees | |||||||||
AB Corp Income Shares | 2009 | $ | 33,600 | $ | — | $ | 11,350 | ||||
| 2010 | $ | 32,990 | $ | — | $ | 17,990 | |||||
| * | The Fund’s Adviser absorbs all ordinary Fund expenses, including the Fund’s audit fees, audit-related fees and tax fees. |
(d) Not applicable.
(e) (1) Beginning with audit and non-audit service contracts entered into on or after May 6, 2003, the Fund’s Audit Committee policies and procedures require the pre-approval of all audit and non-audit services provided to the Fund by the Fund’s independent registered public accounting firm. The Fund’s Audit Committee policies and procedures also require pre-approval of all audit and non-audit services provided to the Adviser and Service Affiliates to the extent that these services are directly related to the operations or financial reporting of the Fund.
(e) (2) All of the amounts for Audit Fees, Audit-Related Fees and Tax Fees in the table under Item 4 (a) – (c) are for services pre-approved by the Fund’s Audit Committee.
(f) Not applicable.
(g) The following table sets forth the aggregate non-audit services provided to the Fund, the Fund’s Adviser and entities that control, are controlled by or under common control with the Adviser that provide ongoing services to the Fund (“Service Affiliates”):
| All Fees for Non-Audit Services Provided to the Portfolio, the Adviser and Service Affiliates | Pre-approved by the Audit Committee (Portion Comprised of Audit Related Fees) (Portion Comprised of Tax Fees) | ||||||||
AB Corp Income Shares | 2009 | $ | 183,043 | $ $ $ | 11,350 — (11,350 |
) | |||
| 2010 | $ | 192,022 | $ $ $ | 17,130 — (17,130 |
) | ||||
(h) The Audit Committee of the Fund has considered whether the provision of any non-audit services not pre-approved by the Audit Committee provided by the Fund’s independent auditor to the Adviser and Service Affiliates is compatible with maintaining the auditor’s independence.
| ITEM 5. | AUDIT COMMITTEE OF LISTED REGISTRANTS. |
Not applicable to the registrant.
| ITEM 6. | SCHEDULE OF INVESTMENTS. |
Please see Schedule of Investments contained in the Report to Shareholders included under Item 1 of this Form N-CSR.
| ITEM 7. | DISCLOSURE OF PROXY VOTING POLICIES AND PROCEDURES FOR CLOSED-END MANAGEMENT INVESTMENT COMPANIES. |
Not applicable to the registrant.
| ITEM 8. | PORTFOLIO MANAGERS OF CLOSED-END MANAGEMENT INVESTMENT COMPANIES. |
Not applicable to the registrant.
| ITEM 9. | PURCHASES OF EQUITY SECURITIES BY CLOSED-END MANAGEMENT INVESTMENT COMPANY AND AFFILIATED PURCHASERS. |
Not applicable to the registrant.
| ITEM 10. | SUBMISSION OF MATTERS TO A VOTE OF SECURITY HOLDERS. |
There have been no material changes to the procedures by which shareholders may recommend nominees to the Fund’s Board of Directors since the Fund last provided disclosure in response to this item.
| ITEM 11. | CONTROLS AND PROCEDURES. |
(a) The registrant’s principal executive officer and principal financial officer have concluded that the registrant’s disclosure controls and procedures (as defined in Rule 30a-3 (c) under the Investment Company Act of 1940, as amended) are effective at the reasonable assurance level based on their evaluation of these controls and procedures as of a date within 90 days of the filing date of this document.
(b) There were no significant changes in the registrant’s internal controls over financial reporting during the second fiscal quarter of the period that could significantly affect these controls subsequent to the date of their evaluation, including any corrective actions with regard to significant deficiencies and material weaknesses.
| ITEM 12. | EXHIBITS. |
The following exhibits are attached to this Form N-CSR:
EXHIBIT NO. | DESCRIPTION OF EXHIBIT | |
| 12 (a) (1) | Code of Ethics that is subject to the disclosure of Item 2 hereof | |
| 12 (b) (1) | Certification of Principal Executive Officer Pursuant to Section 302 of the Sarbanes-Oxley Act of 2002 | |
| 12 (b) (2) | Certification of Principal Financial Officer Pursuant to Section 302 of the Sarbanes-Oxley Act of 2002 | |
| 12 (c) | Certification of Principal Executive Officer and Principal Financial Officer Pursuant to Section 906 of the Sarbanes-Oxley Act of 2002 | |
SIGNATURES
Pursuant to the requirements of the Securities Exchange Act of 1934 and the Investment Company Act of 1940, the registrant has duly caused this report to be signed on its behalf by the undersigned, thereunto duly authorized.
| (Registrant): AllianceBernstein Corporate Shares | ||
| By: | /s/ ROBERT M. KEITH | |
| Robert M. Keith | ||
| President | ||
Date: June 29, 2010
Pursuant to the requirements of the Securities Exchange Act of 1934 and the Investment Company Act of 1940, this report has been signed below by the following persons on behalf of the registrant and in the capacities and on the dates indicated.
| By: | /s/ ROBERT M. KEITH | |
| Robert M. Keith | ||
| President |
Date: June 29, 2010
| By: | /s/ JOSEPH J. MANTINEO | |
| Joseph J. Mantineo | ||
| Treasurer and Chief Financial Officer |
Date: June 29, 2010