UNITED STATES
SECURITIES AND EXCHANGE COMMISSION
WASHINGTON, D.C. 20549
FORM N-CSR
CERTIFIED SHAREHOLDER REPORT OF REGISTERED
MANAGEMENT INVESTMENT COMPANIES
Investment Company Act file number: 811-21497
ALLIANCEBERNSTEIN CORPORATE SHARES
(Exact name of registrant as specified in charter)
1345 Avenue of the Americas, New York, New York 10105
(Address of principal executive offices) (Zip code)
Joseph J. Mantineo
AllianceBernstein L.P.
1345 Avenue of the Americas
New York, New York 10105
(Name and address of agent for service)
Registrant’s telephone number, including area code: (800) 221-5672
Date of fiscal year end: April 30, 2013
Date of reporting period: April 30, 2013
| ITEM 1. | REPORTS TO STOCKHOLDERS. |
ANNUAL REPORT
AllianceBernstein
Corporate Income Shares
April 30, 2013
Annual Report

Investment Products Offered
| • | Are Not FDIC Insured |
| • | May Lose Value |
| • | Are Not Bank Guaranteed |
Investors should consider the investment objectives, risks, charges and expenses of the Fund carefully before investing. For copies of our prospectus or summary prospectus, which contain this and other information, visit us online at www.alliancebernstein.com or contact your AllianceBernstein Investments representative. Please read the prospectus and/or summary prospectus carefully before investing.
This shareholder report must be preceded or accompanied by the Fund’s prospectus for individuals who are not current shareholders of the Fund.
You may obtain a description of the Fund’s proxy voting policies and procedures, and information regarding how the Fund voted proxies relating to portfolio securities during the most recent 12-month period ended June 30, without charge. Simply visit AllianceBernstein’s website at www.alliancebernstein.com, or go to the Securities and Exchange Commission’s (the “Commission”) website at www.sec.gov, or call AllianceBernstein at (800) 227-4618.
The Fund files its complete schedule of portfolio holdings with the Commission for the first and third quarters of each fiscal year on Form N-Q. The Fund’s Forms N-Q are available on the Commission’s website at www.sec.gov. The Fund’s Forms N-Q may also be reviewed and copied at the Commission’s Public Reference Room in Washington, DC; information on the operation of the Public Reference Room may be obtained by calling (800) SEC-0330.
AllianceBernstein Investments, Inc. (ABI) is the distributor of the AllianceBernstein family of mutual funds. ABI is a member of FINRA and is an affiliate of AllianceBernstein L.P., the manager of the funds.
AllianceBernstein® and the AB Logo are registered trademarks and service marks used by permission of the owner, AllianceBernstein L.P.
June 18, 2013
Annual Report
This report provides management’s discussion of fund performance for AllianceBernstein Corporate Income Shares (the “Fund”) for the annual reporting period ended April 30, 2013. Please note, shares of this Fund are offered exclusively through registered investment advisers approved by AllianceBernstein L.P. (the “Adviser”).
Investment Objective and Policies
The Fund’s investment objective is to earn high current income. The Fund invests, under normal circumstances, at least 80% of its net assets in U.S. corporate bonds. The Fund may also invest in U.S. government securities (other than U.S. government securities that are mortgage-backed or asset-backed securities), repurchase agreements and forward contracts relating to U.S. government securities. The Fund normally invests all of its assets in securities that are rated, at the time of purchase, at least BBB- or the equivalent. The Fund will not invest in unrated corporate debt securities. The Fund has the flexibility to invest in long- and short-term fixed-income securities. In making decisions about whether to buy or sell securities, the Adviser will consider, among other things, the strength of certain sectors of the fixed-income market relative to others, interest rates and other general market conditions and the credit quality of individual issuers. The Fund also may invest in convertible debt securities; invest up to 10% of its assets in inflation-protected securities; invest up to 5% of its net assets in preferred stock; purchase and sell interest rate futures contracts and options; enter
into swap transactions; invest in zero coupon securities and “payment-in-kind” debentures; make secured loans of portfolio securities, and invest in U.S. dollar-denominated fixed-income securities issued by non-U.S. companies.
Investment Results
The table on page 6 shows the Fund’s performance compared to its benchmark, the Barclays U.S. Credit Bond Index, for the six- and 12-month periods ended April 30, 2013.
The Fund generated positive returns and outperformed its benchmark for both periods. Yield curve positioning, specifically an overweight in intermediate maturity corporates, contributed positively for both periods. An underweight to the non-corporate part of the credit benchmark also added to returns for both periods, as corporate securities outperformed non-corporates. Within the Fund’s industry allocation, an overweight to financials, specifically banks, insurance and real estate investment trusts, was also additive, as was an underweight to consumer non-cyclicals. Overall security selection across several industries helped performance, particularly selection in the Fund’s bank and telecommunications holdings. An allocation to U.S. Treasuries held as a hedge against the Fund’s higher-volatility corporate positions detracted for both periods, as credit holdings outperformed.
The Fund utilized derivatives in the form of credit default swaps for investment purposes, which had an immaterial impact on performance during both periods.
| ALLIANCEBERNSTEIN CORPORATE INCOME SHARES • | 1 |
Market Review and Investment Strategy
Global equity and bond markets advanced during the 12-month period ended April 30, 2013, largely driven by improved investor sentiment and the gradual return to riskier assets. Policy and political developments, rather than an acceleration of economic growth, were the main drivers. The willingness of political leaders to address the structural flaws of the euro zone, along with the continued global monetary easing cycle led by the U.S. Federal Reserve (the “Fed”) and the European Central Bank (“ECB”), lifted investor confidence for much of the period.
In Europe, the threat of a worst-case outcome for the euro was reduced. The ECB’s Outright Monetary Transactions program and more support for Greece alleviated fears of a euro breakup. China’s slowdown appeared to have bottomed out; in the view of the Corporate Income Shares Investment Team (the “Team”), housing starts, corporate bond issuance and a steady yuan should support 7%-8% growth. In Japan, equity markets gained as the yen weakened amid expectations of a monetary policy shift following the Liberal Democratic Party’s victory in the December elections. U.S. financial markets continued to rebound, approaching new highs for the equity market late in the reporting period, despite investors’ concerns about slowing corporate earnings growth and continued political dysfunction. While the American Taxpayer Relief Act of 2012, passed by the Senate and House of Representatives in January 2013,
averted the most feared outcomes of the “fiscal cliff”, it did not tackle spending or debt-reduction issues which remain unresolved. Although risks remain, equity and bond markets around the world moved higher, helped by monetary policy actions and improved perceptions regarding the sovereign debt crisis in Europe.
In the Team’s view, the macro environment remains generally supportive for risk taking—with global growth anticipated to be slow but positive, and central banks remaining accommodative. Among industrials, fundamentals remain solid, but companies have been generally exhibiting mid- to late-cycle behavior. The Team believes that at this point in the cycle, security selection is critical to safeguard against the expected increase in idiosyncratic risk, as is a focus on diversification and liquidity. Spreads are at fair value levels, but positive supply/demand technicals remain supportive. The Team continues to look for opportunities to rotate holdings based on relative value, and to seek opportunities in the new issue market when valuations, in the Team’s view, are reasonable. The Fund’s industry allocation is overweight financials and underweight consumer non-cyclicals.
In the Team’s view, U.S. monetary policy could create additional market uncertainty in the coming year, as the Fed reverses certain of the measures taken as a result of the 2008 global financial crisis. The Federal Funds rate has been reduced to near zero percent and the Fed has, among other actions taken, purchased U.S. Treasury and mortgage-backed securities. The latter
| 2 | • ALLIANCEBERNSTEIN CORPORATE INCOME SHARES |
is commonly referred to as Quantitative Easing (“QE”). These policies have been beneficial to fixed-income securities, including the securities held in this Fund. When the Fed removes certain of these measures, there may be downward pressure on prices of fixed-income securities, including those held in the Fund. The timing and the
reversal of QE and the potential increase of the Federal Funds rate may impact the net asset value (“NAV”) of this Fund. The Fund is most sensitive to credit risk and is managed to attempt to reduce the impact of higher interest rates on NAV. These and other risks to the Fund are discussed further in this report.
| ALLIANCEBERNSTEIN CORPORATE INCOME SHARES • | 3 |
DISCLOSURES AND RISKS
Benchmark Disclosure
The unmanaged Barclays U.S. Credit Bond Index does not reflect fees and expenses associated with the active management of a fund. The Barclays U.S. Credit Bond Index represents the performance of the U.S. credit securities within the U.S. fixed-income market. An investor cannot invest directly in an index, and its results are not indicative of the performance for any specific investment, including the Fund.
A Word About Risk
Market Risk: The value of the Fund’s assets will fluctuate as the stock or bond market fluctuates. The value of the Fund’s investments may decline, sometimes rapidly and unpredictably, simply because of economic changes or other events that affect large portions of the market.
Credit Risk: An issuer or guarantor of a fixed-income security, or the counterparty to a derivatives or other contract, may be unable or unwilling to make timely payments of interest or principal, or to otherwise honor its obligations. The issuer or guarantor may default, causing a loss of the full principal amount of a security. The degree of risk for a particular security may be reflected in its credit rating. There is the possibility that the credit rating of a fixed-income security may be downgraded after purchase, which may adversely affect the value of the security. Investments in fixed-income securities with lower ratings tend to have a higher probability that an issuer will default or fail to meet its payment obligations.
Interest Rate Risk: Changes in interest rates will affect the value of investments in fixed-income securities. When interest rates rise, the value of investments in fixed-income securities tends to fall and this decrease in value may not be offset by higher income from new investments. Interest rate risk is generally greater for fixed-income securities with longer maturities or durations.
Inflation Risk: This is the risk that the value of assets or income from investments will be less in the future as inflation decreases the value of money. As inflation increases, the value of the Fund’s assets can decline as can the value of the Fund’s distributions. This risk is significantly greater for fixed-income securities with longer maturities.
Foreign (Non-U.S.) Risk: Investments in securities of non-U.S. issuers may involve more risk than those of U.S. issuers. These securities may fluctuate more widely in price and may be less liquid due to adverse market, economic, political, regulatory or other factors.
Derivatives Risk: Investments in derivatives may be illiquid, difficult to price, and leveraged so that small changes may produce disproportionate losses for the Fund, and may be subject to counterparty risk to a greater degree than more traditional investments.
Management Risk: The Fund is subject to management risk because it is an actively managed investment fund. The Adviser will apply its investment techniques and risk analyses in making investment decisions, but there is no guarantee that its techniques will produce the intended results.
These risks are fully discussed in the Fund’s prospectus.
An Important Note About Historical Performance
The performance shown on the following pages represents past performance and does not guarantee future results. Current performance may be lower or higher than the performance information shown. You may obtain performance information current to the most recent month-end by calling (800) 227-4618. The investment return and principal value of an investment in the Fund will
(Disclosures, Risks and Note about Historical Performance continued on next page)
| 4 | • ALLIANCEBERNSTEIN CORPORATE INCOME SHARES |
Disclosures and Risks
DISCLOSURES AND RISKS
(continued from previous page)
fluctuate, so that your shares, when redeemed, may be worth more or less than their original cost. Performance assumes reinvestment of distributions and does not account for taxes.
Investors should consider the investment objectives, risks, charges and expenses of the Fund carefully before investing. For copies of our prospectus and/or summary prospectus, which contain this and other information, visit us online at www.alliancebernstein.com or contact your AllianceBernstein Investments representative. Please read the prospectus and/or summary prospectus carefully before investing.
| ALLIANCEBERNSTEIN CORPORATE INCOME SHARES • | 5 |
Disclosures and Risks
HISTORICAL PERFORMANCE
THE FUND VS. ITS BENCHMARK PERIODS ENDED APRIL 30, 2013 | NAV Returns | |||||||||
| 6 Months | 12 Months | |||||||||
| AllianceBernstein Corporate Income Shares* | 2.20% | 9.53% | ||||||||
| ||||||||||
| Barclays U.S. Credit Bond Index | 1.54% | 7.49% | ||||||||
| ||||||||||
* Includes the impact of proceeds received and credited to the Fund resulting from class action settlements, which enhanced the performance of all share classes of the Fund for the 12-month periods ended April 30, 2013 by 0.03%. | ||||||||||
GROWTH OF A $10,000 INVESTMENT IN THE FUND
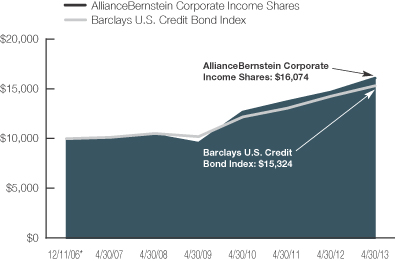
This chart illustrates the total value of an assumed $10,000 investment in AllianceBernstein Corporate Income Shares (from 12/11/06 to 4/30/13) as compared to the performance of the Fund’s benchmark.
| * | Inception date: 12/11/2006 |
See Disclosures, Risks and Note about Historical Performance on pages 4-5.
(Historical Performance continued on next page)
| 6 | • ALLIANCEBERNSTEIN CORPORATE INCOME SHARES |
Historical Performance
HISTORICAL PERFORMANCE
(continued from previous page)
| AVERAGE ANNUAL RETURNS AS OF APRIL 30, 2013 | ||||
| NAV Returns | ||||
1 Year | 9.53 | % | ||
5 Years | 9.21 | % | ||
Since Inception* | 7.71 | % | ||
| SEC AVERAGE ANNUAL RETURNS (WITH ANY APPLICABLE SALES CHARGES) AS OF THE MOST RECENT CALENDAR QUARTER-END (MARCH 31, 2013) | ||||
| SEC Returns | ||||
1 Year | 9.14 | % | ||
5 Years | 8.90 | % | ||
Since Inception* | 7.48 | % | ||
The prospectus fee table shows the fees and the Total Fund Operating Expenses of the Fund as 0.00% because the Adviser does not charge any fees or expenses and reimburses Fund operating expenses. Participants in a wrap fee program or other investment program eligible to invest in the Fund pay fees to the program sponsor and should review the program brochure or other literature provided by the sponsor for a discussion of fees and expenses charged.
| * | Inception date: 12/11/2006. |
See Disclosures, Risks and Note about Historical Performance on pages 4-5.
| ALLIANCEBERNSTEIN CORPORATE INCOME SHARES • | 7 |
Historical Performance
EXPENSE EXAMPLE
(unaudited)
As a shareholder of the Fund, you may incur various ongoing non-operating and extraordinary costs. This example is intended to help you understand your ongoing costs (in dollars) of investing in the Fund and to compare these costs with the ongoing costs of investing in other mutual funds.
The Example is based on an investment of $1,000 invested at the beginning of the period and held for the entire period as indicated below.
Actual Expenses
The table below provides information about actual account values and actual expenses. You may use the information in this line, together with the amount you invested, to estimate the expenses that you paid over the period. Simply divide your account value by $1,000 (for example, an $8,600 account value divided by $1,000 = 8.6), then multiply the result by the number in the first line under the heading entitled “Expenses Paid During Period” to estimate the expenses you paid on your account during this period.
Hypothetical Example for Comparison Purposes
The table below provides information about hypothetical account values and hypothetical expenses based on the Fund’s actual expense ratio and an assumed annual rate of return of 5% before expenses, which is not the Fund’s actual return. The hypothetical account values and expenses may not be used to estimate the actual ending account balance or expenses you paid for the period. You may use this information to compare the ongoing costs of investing in the Fund and other funds by comparing this 5% hypothetical example with the 5% hypothetical examples that appear in the shareholder reports of other funds.
Please note that the expenses shown in the table are meant to highlight your ongoing costs only and do not reflect any transactional costs, such as sales charges (loads), or contingent deferred sales charges on redemptions. Therefore, the hypothetical example is useful in comparing ongoing costs only, and will not help you determine the relative total costs of owning different funds. In addition, if these transactional costs were included, your costs would have been higher.
| Beginning Account Value November 1, 2012 | Ending Account Value April 30, 2013 | Expenses Paid During Period* | Annualized Expense Ratio* | |||||||||||||
Actual | $ | 1,000 | $ | 1,022.00 | $ | 0 | 0.00 | % | ||||||||
Hypothetical** | $ | 1,000 | $ | 1,024.79 | $ | 0 | 0.00 | % | ||||||||
| * | Expenses are equal to the Fund’s annualized expense ratio, multiplied by the average account value over the period, multiplied by 181/365 (to reflect the one-half year period). The Fund’s operating expense are borne by the Adviser or its affiliates. |
| ** | Assumes 5% annual return before expenses. |
| 8 | • ALLIANCEBERNSTEIN CORPORATE INCOME SHARES |
Expense Example
PORTFOLIO SUMMARY
April 30, 2013 (unaudited)
PORTFOLIO STATISTICS
Net Assets ($mil): $42.8
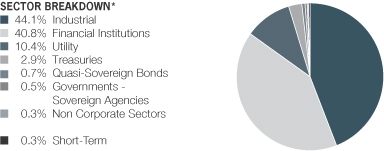
| * | All data are as of April 30, 2013. The Portfolio’s sector breakdown is expressed as a percentage of total investments and may vary over time. |
Please note: The issuer classifications presented herein are based on the Barclays Fixed Income Indices developed by Barclays. The Portfolio components are divided either into duration, country, bond ratings or corporate sectors as classified by Barclays. These sector classifications are broadly defined. The “Portfolio of Investments” section of the report reflects more specific industry information and is consistent with the investment restrictions discussed in the Portfolio’s prospectus.
| ALLIANCEBERNSTEIN CORPORATE INCOME SHARES • | 9 |
Portfolio Summary
PORTFOLIO OF INVESTMENTS
April 30, 2013
Principal Amount (000) | U.S. $ Value | |||||||
| ||||||||
CORPORATES – INVESTMENT | ||||||||
Industrial – 43.3% | ||||||||
Basic – 6.5% | ||||||||
Alpek SA de CV | $ | 200 | $ | 208,750 | ||||
AngloGold Ashanti Holdings PLC | 90 | 94,352 | ||||||
Barrick Gold Corp. | 165 | 165,336 | ||||||
Dow Chemical Co. (The) | ||||||||
3.00%, 11/15/22 | 170 | 170,069 | ||||||
5.25%, 11/15/41 | 60 | 67,832 | ||||||
7.375%, 11/01/29 | 145 | 197,247 | ||||||
Ecolab, Inc. | ||||||||
4.35%, 12/08/21 | 94 | 105,865 | ||||||
5.50%, 12/08/41 | 50 | 60,267 | ||||||
EI du Pont de Nemours & Co. | 110 | 122,239 | ||||||
Freeport-McMoRan Copper & Gold, Inc. | ||||||||
2.375%, 3/15/18(a) | 138 | 138,992 | ||||||
3.55%, 3/01/22 | 140 | 140,048 | ||||||
Georgia-Pacific LLC | 180 | 240,738 | ||||||
International Paper Co. | ||||||||
4.75%, 2/15/22 | 100 | 113,855 | ||||||
7.95%, 6/15/18 | 50 | 64,461 | ||||||
9.375%, 5/15/19 | 81 | 112,237 | ||||||
Newmont Mining Corp. | 170 | 167,761 | ||||||
Southern Copper Corp. | 140 | 134,878 | ||||||
Vale Overseas Ltd. | ||||||||
4.375%, 1/11/22 | 170 | 178,905 | ||||||
6.25%, 1/11/16 | 100 | 112,730 | ||||||
Xstrata Finance Canada Ltd. | 180 | 182,483 | ||||||
|
| |||||||
| 2,779,045 | ||||||||
|
| |||||||
Capital Goods – 2.7% | ||||||||
Boeing Co. (The) | 90 | 119,518 | ||||||
Embraer SA | 150 | 163,680 | ||||||
Ingersoll-Rand Global Holding Co., Ltd. | 135 | 145,806 | ||||||
John Deere Capital Corp. | 189 | 202,398 | ||||||
| 10 | • ALLIANCEBERNSTEIN CORPORATE INCOME SHARES |
Portfolio of Investments
| Principal Amount (000) | U.S. $ Value | |||||||
| ||||||||
Kennametal, Inc. | $ | 130 | $ | 131,628 | ||||
Lockheed Martin Corp. | 160 | 169,896 | ||||||
Owens Corning | 160 | 205,745 | ||||||
|
| |||||||
| 1,138,671 | ||||||||
|
| |||||||
Communications - Media – 5.2% | ||||||||
CBS Corp. | ||||||||
3.375%, 3/01/22 | 23 | 23,993 | ||||||
5.75%, 4/15/20 | 119 | 142,398 | ||||||
Comcast Cable Communications Holdings, Inc. 9.455%, 11/15/22 | 110 | 169,858 | ||||||
COX Communications, Inc. | 135 | 157,150 | ||||||
DirecTV Holdings LLC/DirecTV Financing Co., Inc. 3.80%, 3/15/22 | 290 | 304,590 | ||||||
Discovery Communications LLC | 84 | 91,156 | ||||||
Grupo Televisa SAB | 100 | 117,552 | ||||||
News America, Inc. | ||||||||
3.00%, 9/15/22 | 110 | 111,572 | ||||||
6.15%, 2/15/41 | 60 | 75,360 | ||||||
8.875%, 4/26/23 | 125 | 175,055 | ||||||
Omnicom Group, Inc. | 115 | 139,048 | ||||||
Reed Elsevier Capital, Inc. | 75 | 97,505 | ||||||
TCI Communications, Inc. | 150 | 213,792 | ||||||
Time Warner Cable, Inc. | ||||||||
4.00%, 9/01/21 | 40 | 43,310 | ||||||
4.50%, 9/15/42 | 100 | 95,116 | ||||||
5.50%, 9/01/41 | 25 | 27,033 | ||||||
5.875%, 11/15/40 | 30 | 33,409 | ||||||
6.55%, 5/01/37 | 39 | 47,071 | ||||||
WPP Finance 2010 | 155 | 157,954 | ||||||
|
| |||||||
| 2,222,922 | ||||||||
|
| |||||||
Communications - Telecommunications – 5.8% | ||||||||
America Movil SAB de CV | 130 | 149,654 | ||||||
American Tower Corp. | ||||||||
4.50%, 1/15/18 | 40 | 44,335 | ||||||
7.25%, 5/15/19 | 100 | 123,992 | ||||||
Ameritech Capital Funding Corp. | 130 | 152,952 | ||||||
| ALLIANCEBERNSTEIN CORPORATE INCOME SHARES • | 11 |
Portfolio of Investments
| Principal Amount (000) | U.S. $ Value | |||||||
| ||||||||
AT&T, Inc. | ||||||||
3.00%, 2/15/22 | $ | 200 | $ | 207,757 | ||||
3.875%, 8/15/21 | 230 | 255,249 | ||||||
BellSouth Corp. | 145 | 174,054 | ||||||
British Telecommunications PLC | 125 | 201,256 | ||||||
Cellco Partnership/Verizon Wireless Capital LLC 8.50%, 11/15/18 | 55 | 73,713 | ||||||
Deutsche Telekom International Finance BV | 190 | 202,971 | ||||||
Qwest Corp. | 160 | 188,306 | ||||||
Telefonica Emisiones SAU | 270 | 297,593 | ||||||
United States Cellular Corp. | 25 | 27,139 | ||||||
Verizon Communications, Inc. | 150 | 159,465 | ||||||
Verizon New York, Inc. | 170 | 220,933 | ||||||
|
| |||||||
| 2,479,369 | ||||||||
|
| |||||||
Consumer Cyclical - Automotive – 1.9% | ||||||||
Ford Motor Co. | 225 | 266,803 | ||||||
Ford Motor Credit Co. LLC | 375 | 418,176 | ||||||
Johnson Controls, Inc. | 105 | 117,083 | ||||||
|
| |||||||
| 802,062 | ||||||||
|
| |||||||
Consumer Cyclical - Entertainment – 1.0% | ||||||||
Time Warner, Inc. | ||||||||
3.40%, 6/15/22 | 110 | 116,047 | ||||||
4.70%, 1/15/21 | 60 | 69,169 | ||||||
6.25%, 3/29/41 | 130 | 162,036 | ||||||
Viacom, Inc. | 75 | 86,078 | ||||||
|
| |||||||
| 433,330 | ||||||||
|
| |||||||
Consumer Cyclical - Other – 1.0% | ||||||||
Carnival Corp. | 130 | 130,440 | ||||||
Host Hotels & Resorts LP | 91 | 92,820 | ||||||
Marriott International, Inc./DE | 101 | 106,262 | ||||||
| 12 | • ALLIANCEBERNSTEIN CORPORATE INCOME SHARES |
Portfolio of Investments
| Principal Amount (000) | U.S. $ Value | |||||||
| ||||||||
Wyndham Worldwide Corp. | $ | 115 | $ | 115,934 | ||||
|
| |||||||
| 445,456 | ||||||||
|
| |||||||
Consumer Cyclical - Restaurants – 0.2% | ||||||||
Yum! Brands, Inc. | 60 | 64,775 | ||||||
|
| |||||||
Consumer Cyclical - Retailers – 1.9% | ||||||||
AutoZone, Inc. | 110 | 122,319 | ||||||
CVS Caremark Corp. | 100 | 122,887 | ||||||
Dollar General Corp. | 105 | 105,305 | ||||||
Home Depot, Inc. (The) | ||||||||
5.40%, 9/15/40 | 80 | 98,493 | ||||||
5.875%, 12/16/36 | 30 | 38,859 | ||||||
Kohl’s Corp. | 85 | 98,983 | ||||||
Macy’s Retail Holdings, Inc. | 223 | 238,758 | ||||||
|
| |||||||
| 825,604 | ||||||||
|
| |||||||
Consumer Non - Cyclical – 5.6% | ||||||||
AbbVie, Inc. | 63 | 64,230 | ||||||
Actavis, Inc. | 130 | 129,709 | ||||||
Ahold Finance USA LLC | 75 | 99,218 | ||||||
Altria Group, Inc. | 270 | 310,133 | ||||||
9.25%, 8/06/19 | 22 | 30,695 | ||||||
9.70%, 11/10/18 | 26 | 36,449 | ||||||
Bristol-Myers Squibb Co. | 20 | 24,154 | ||||||
5.875%, 11/15/36 | 52 | 67,512 | ||||||
Express Scripts Holding Co. | 60 | 64,635 | ||||||
Grupo Bimbo SAB de CV | 100 | 110,708 | ||||||
Hershey Co. (The) | 148 | 152,142 | ||||||
Kimberly-Clark Corp. | 30 | 36,265 | ||||||
Kraft Foods Group, Inc. | 165 | 167,807 | ||||||
Kroger Co. (The) | 220 | 232,310 | ||||||
| ALLIANCEBERNSTEIN CORPORATE INCOME SHARES • | 13 |
Portfolio of Investments
| Principal Amount (000) | U.S. $ Value | |||||||
| ||||||||
Lorillard Tobacco Co. | $ | 100 | $ | 118,899 | ||||
8.125%, 6/23/19 | 60 | 76,818 | ||||||
McKesson Corp. | 105 | 137,540 | ||||||
Procter & Gamble Co. (The) | 55 | 73,352 | ||||||
6.45%, 1/15/26 | 20 | 27,821 | ||||||
Reynolds American, Inc. | 61 | 61,422 | ||||||
Tyson Foods, Inc. | 110 | 121,455 | ||||||
Whirlpool Corp. | 120 | 124,867 | ||||||
Wyeth LLC | 100 | 131,468 | ||||||
|
| |||||||
| 2,399,609 | ||||||||
|
| |||||||
Energy – 6.9% | ||||||||
Anadarko Petroleum Corp. | 170 | 195,480 | ||||||
6.375%, 9/15/17 | 35 | 41,893 | ||||||
6.45%, 9/15/36 | 80 | 102,242 | ||||||
Apache Corp. | 165 | 163,252 | ||||||
ConocoPhillips Holding Co. | 116 | 161,076 | ||||||
Encana Corp. | 160 | 172,331 | ||||||
Hess Corp. | 40 | 44,209 | ||||||
7.875%, 10/01/29 | 104 | 139,857 | ||||||
Lukoil International Finance BV | 100 | 113,500 | ||||||
Marathon Petroleum Corp. | 60 | 77,604 | ||||||
Nabors Industries, Inc. | 124 | 159,226 | ||||||
National Oilwell Varco, Inc. | 130 | 131,808 | ||||||
Noble Energy, Inc. | 68 | 76,015 | ||||||
8.25%, 3/01/19 | 48 | 63,099 | ||||||
Noble Holding International Ltd. | 90 | 101,087 | ||||||
Phillips 66 | 237 | 264,562 | ||||||
Suncor Energy, Inc. | 95 | 115,210 | ||||||
| 14 | • ALLIANCEBERNSTEIN CORPORATE INCOME SHARES |
Portfolio of Investments
| Principal Amount (000) | U.S. $ Value | |||||||
| ||||||||
Talisman Energy, Inc. | $ | 78 | $ | 83,097 | ||||
7.75%, 6/01/19 | 40 | 51,050 | ||||||
Transocean, Inc. | 100 | 119,782 | ||||||
6.50%, 11/15/20 | 90 | 106,727 | ||||||
Valero Energy Corp. | 120 | 146,881 | ||||||
6.625%, 6/15/37 | 67 | 84,332 | ||||||
Weatherford International Ltd./Bermuda | 75 | 79,861 | ||||||
5.125%, 9/15/20 | 85 | 94,627 | ||||||
9.625%, 3/01/19 | 45 | 59,502 | ||||||
|
| |||||||
| 2,948,310 | ||||||||
|
| |||||||
Technology – 2.3% | ||||||||
Cisco Systems, Inc. | 140 | 152,169 | ||||||
Hewlett-Packard Co. | 80 | 80,951 | ||||||
4.65%, 12/09/21 | 184 | 190,388 | ||||||
Motorola Solutions, Inc. | 170 | 176,945 | ||||||
Oracle Corp. | 105 | 125,191 | ||||||
Telefonaktiebolaget LM Ericsson | 120 | 127,260 | ||||||
Xerox Corp. | 100 | 115,917 | ||||||
|
| |||||||
| 968,821 | ||||||||
|
| |||||||
Transportation - Airlines – 0.3% | ||||||||
Southwest Airlines Co. | 130 | 146,642 | ||||||
|
| |||||||
Transportation - Railroads – 1.1% | ||||||||
Canadian Pacific Railway Co. | 80 | 101,889 | ||||||
CSX Corp. | 130 | 133,201 | ||||||
Norfolk Southern Corp. | 180 | 191,138 | ||||||
Union Pacific Corp. | 40 | 45,176 | ||||||
|
| |||||||
| 471,404 | ||||||||
|
| |||||||
Transportation - Services – 0.9% | ||||||||
Asciano Finance Ltd. | 39 | 42,908 | ||||||
FedEx Corp. | 40 | 52,593 | ||||||
| ALLIANCEBERNSTEIN CORPORATE INCOME SHARES • | 15 |
Portfolio of Investments
| Principal Amount (000) | U.S. $ Value | |||||||
| ||||||||
Penske Truck Leasing Co. LP/PTL | $ | 120 | $ | 130,119 | ||||
Ryder System, Inc. | 135 | 138,794 | ||||||
5.85%, 11/01/16 | 28 | 31,867 | ||||||
|
| |||||||
| 396,281 | ||||||||
|
| |||||||
| 18,522,301 | ||||||||
|
| |||||||
| Financial Institutions – 39.2% | ||||||||
Banking – 22.3% | ||||||||
ABN AMRO Bank NV | 255 | 276,728 | ||||||
Banco Bradesco SA/Cayman Islands | 200 | 220,016 | ||||||
Bank of America Corp. | 100 | 107,878 | ||||||
5.00%, 5/13/21 | 235 | 268,939 | ||||||
5.70%, 1/24/22 | 140 | 166,865 | ||||||
5.875%, 2/07/42 | 110 | 137,538 | ||||||
Series 1 | ||||||||
3.75%, 7/12/16 | 175 | 186,163 | ||||||
Bank of New York Mellon Corp. (The) | 70 | 76,719 | ||||||
Bank One Michigan | 440 | 625,298 | ||||||
Barclays Bank PLC | 125 | 134,722 | ||||||
BB&T Corp. | 200 | 233,853 | ||||||
BNP Paribas SA | 89 | 102,043 | ||||||
BNP Paribas/BNP Paribas US | 100 | 105,909 | ||||||
Capital One Bank USA NA | 300 | 305,257 | ||||||
Citigroup, Inc. | ||||||||
4.875%, 5/07/15 | 170 | 181,146 | ||||||
5.00%, 9/15/14 | 155 | 162,501 | ||||||
6.625%, 1/15/28 | 405 | 508,050 | ||||||
Countrywide Financial Corp. | 253 | 282,290 | ||||||
Deutsche Bank Financial LLC | 150 | 159,748 | ||||||
Fifth Third Bancorp | 31 | 32,890 | ||||||
Goldman Sachs Group, Inc. (The) | 130 | 132,489 | ||||||
| 16 | • ALLIANCEBERNSTEIN CORPORATE INCOME SHARES |
Portfolio of Investments
| Principal Amount (000) | U.S. $ Value | |||||||
| ||||||||
5.75%, 1/24/22 | $ | 185 | $ | 220,890 | ||||
6.00%, 6/15/20 | 320 | 385,532 | ||||||
6.125%, 2/15/33 | 2 | 2,393 | ||||||
6.75%, 10/01/37 | 115 | 131,937 | ||||||
Series G | 75 | 94,574 | ||||||
HSBC Holdings PLC | 110 | 121,851 | ||||||
JPMorgan Chase & Co. | ||||||||
4.50%, 1/24/22 | 157 | 177,333 | ||||||
4.95%, 3/25/20 | 220 | 255,978 | ||||||
Morgan Stanley | 280 | 326,185 | ||||||
Series G | 450 | 524,952 | ||||||
6.625%, 4/01/18 | 100 | 119,881 | ||||||
People’s United Financial, Inc. | 175 | 180,531 | ||||||
PNC Bank NA | 400 | 458,194 | ||||||
Rabobank Capital Funding Trust III | 100 | 101,250 | ||||||
Regions Financial Corp. | 225 | 224,164 | ||||||
Royal Bank of Scotland PLC (The) | 260 | 308,100 | ||||||
Santander Holdings USA, Inc./PA | 99 | 102,449 | ||||||
State Street Corp. | 240 | 272,831 | ||||||
SunTrust Bank/Atlanta GA | 145 | 180,679 | ||||||
UBS AG/Stamford CT | 130 | 154,699 | ||||||
Unicredit Luxembourg Finance SA | 100 | 103,539 | ||||||
Wachovia Bank NA | 550 | 685,305 | ||||||
|
| |||||||
| 9,540,289 | ||||||||
|
| |||||||
Brokerage – 0.5% | ||||||||
Nomura Holdings, Inc. | 214 | 215,123 | ||||||
|
| |||||||
Finance – 2.9% | ||||||||
GE Capital Trust I | 345 | 366,994 | ||||||
General Electric Capital Corp. | 140 | 169,654 | ||||||
Series G | 340 | 404,394 | ||||||
| ALLIANCEBERNSTEIN CORPORATE INCOME SHARES • | 17 |
Portfolio of Investments
| Principal Amount (000) | U.S. $ Value | |||||||
| ||||||||
HSBC Finance Capital Trust IX | $ | 170 | $ | 172,550 | ||||
SLM Corp. | 110 | 115,120 | ||||||
|
| |||||||
| 1,228,712 | ||||||||
|
| |||||||
Insurance – 8.0% | ||||||||
American International Group, Inc. | 230 | 287,775 | ||||||
8.175%, 5/15/58 | 65 | 87,912 | ||||||
Assurant, Inc. | 105 | 105,777 | ||||||
5.625%, 2/15/14 | 70 | 72,569 | ||||||
Berkshire Hathaway Finance Corp. | 85 | 101,889 | ||||||
Chubb Corp. (The) | 140 | 170,426 | ||||||
Cigna Corp. | 125 | 137,862 | ||||||
7.875%, 5/15/27 | 65 | 89,923 | ||||||
Coventry Health Care, Inc. | 55 | 59,339 | ||||||
Guardian Life Insurance Co. of America | 42 | 58,473 | ||||||
Hartford Financial Services | 140 | 160,485 | ||||||
5.50%, 3/30/20 | 100 | 119,519 | ||||||
6.10%, 10/01/41 | 45 | 56,717 | ||||||
Lincoln National Corp. | 50 | 57,356 | ||||||
8.75%, 7/01/19 | 82 | 111,720 | ||||||
Markel Corp. | 59 | 72,789 | ||||||
MetLife Capital Trust IV | 150 | 188,250 | ||||||
Metropolitan Life Global Funding I | 150 | 151,168 | ||||||
Nationwide Mutual Insurance Co. | 130 | 195,822 | ||||||
Principal Financial Group, Inc. | 170 | 172,688 | ||||||
Progressive Corp. (The) | 62 | 68,975 | ||||||
Prudential Financial, Inc. | 39 | 44,483 | ||||||
5.625%, 6/15/43 | 200 | 210,000 | ||||||
Series B | 75 | 88,990 | ||||||
| 18 | • ALLIANCEBERNSTEIN CORPORATE INCOME SHARES |
Portfolio of Investments
| Principal Amount (000) | U.S. $ Value | |||||||
| ||||||||
Swiss Re Solutions Holding Corp. | $ | 90 | $ | 118,457 | ||||
UnitedHealth Group, Inc. | 120 | 128,510 | ||||||
3.875%, 10/15/20 | 90 | 99,946 | ||||||
WellPoint, Inc. | 105 | 132,043 | ||||||
XL Group PLC | 75 | 93,216 | ||||||
|
| |||||||
| 3,443,079 | ||||||||
|
| |||||||
REITS – 5.5% | ||||||||
Boston Properties LP | 150 | 152,213 | ||||||
BRE Properties, Inc. | 175 | 177,837 | ||||||
DDR Corp. | 105 | 127,990 | ||||||
Digital Realty Trust LP | 140 | 142,741 | ||||||
Duke Realty LP | 55 | 67,807 | ||||||
Essex Portfolio LP | 56 | 56,350 | ||||||
HCP, Inc. | 110 | 134,063 | ||||||
Health Care REIT, Inc. | 107 | 109,138 | ||||||
5.25%, 1/15/22 | 100 | 116,073 | ||||||
Healthcare Trust of America Holdings LP | 140 | 142,573 | ||||||
Hospitality Properties Trust | 160 | 173,780 | ||||||
Kimco Realty Corp. | 70 | 89,092 | ||||||
Realty Income Corp. | 160 | 190,060 | ||||||
Ventas Realty LP/Ventas Capital Corp. | 156 | 157,763 | ||||||
4.25%, 3/01/22 | 129 | 140,860 | ||||||
Vornado Realty LP | 175 | 198,393 | ||||||
Washington Real Estate Investment Trust | 150 | 156,413 | ||||||
|
| |||||||
| 2,333,146 | ||||||||
|
| |||||||
| 16,760,349 | ||||||||
|
| |||||||
Utility – 10.2% | ||||||||
Electric – 5.3% | ||||||||
CMS Energy Corp. | 115 | 141,407 | ||||||
| ALLIANCEBERNSTEIN CORPORATE INCOME SHARES • | 19 |
Portfolio of Investments
| Principal Amount (000) | U.S. $ Value | |||||||
| ||||||||
Consolidated Edison Co. of New York, Inc. | $ | 100 | $ | 116,861 | ||||
Series 07-A | 30 | 41,221 | ||||||
Enersis SA/Cayman Island | 70 | 81,900 | ||||||
Exelon Corp. | 220 | 237,629 | ||||||
FirstEnergy Corp. | 100 | 101,929 | ||||||
Series B | 30 | 30,988 | ||||||
Series C | 82 | 98,097 | ||||||
Iberdrola Finance Ireland Ltd. | 125 | 136,830 | ||||||
Integrys Energy Group, Inc. | 120 | 127,200 | ||||||
MidAmerican Energy Holdings Co. | 100 | 128,981 | ||||||
Nisource Finance Corp. | 100 | 123,137 | ||||||
Oncor Electric Delivery Co. LLC | 115 | 144,230 | ||||||
Pacific Gas & Electric Co. | 50 | 54,218 | ||||||
PacifiCorp | 70 | 93,691 | ||||||
Potomac Electric Power Co. | 65 | 91,767 | ||||||
PPL Capital Funding, Inc. | 109 | 111,721 | ||||||
PSEG Power LLC | 23 | 25,166 | ||||||
System Energy Resources, Inc. | 97 | 102,461 | ||||||
Virginia Electric and Power Co. | 300 | 301,672 | ||||||
|
| |||||||
| 2,291,106 | ||||||||
|
| |||||||
Natural Gas – 4.9% | ||||||||
AGL Capital Corp. | 105 | 125,545 | ||||||
CenterPoint Energy Resources Corp. | 99 | 114,324 | ||||||
Colorado Interstate Gas Co. LLC | 15 | 17,187 | ||||||
DCP Midstream LLC | 90 | 118,874 | ||||||
| 20 | • ALLIANCEBERNSTEIN CORPORATE INCOME SHARES |
Portfolio of Investments
| Principal Amount (000) | U.S. $ Value | |||||||
| ||||||||
Enbridge Energy Partners LP | $ | 100 | $ | 108,087 | ||||
Energy Transfer Partners LP | 70 | 77,567 | ||||||
5.20%, 2/01/22 | 120 | 137,198 | ||||||
Enterprise Products Operating LLC | 150 | 177,946 | ||||||
Kinder Morgan Energy Partners LP | 175 | 189,645 | ||||||
7.40%, 3/15/31 | 145 | 191,712 | ||||||
ONEOK Partners LP | 240 | 245,249 | ||||||
Spectra Energy Capital LLC | 70 | 92,537 | ||||||
Spectra Energy Partners LP | 75 | 81,473 | ||||||
Williams Cos., Inc. (The) | 143 | 144,446 | ||||||
Williams Partners LP | 115 | 133,460 | ||||||
Williams Partners LP/Williams Partners Finance Corp. | 115 | 138,157 | ||||||
|
| |||||||
| 2,093,407 | ||||||||
|
| |||||||
| 4,384,513 | ||||||||
|
| |||||||
Non Corporate Sectors – 0.3% | ||||||||
Agencies - Not Government Guaranteed – 0.3% | ||||||||
Petrobras International Finance Co. – Pifco | 130 | 143,554 | ||||||
|
| |||||||
Total Corporates – Investment Grades | 39,810,717 | |||||||
|
| |||||||
GOVERNMENTS – TREASURIES – 2.8% | ||||||||
United States – 2.8% | ||||||||
U.S. Treasury Bonds | 145 | 140,650 | ||||||
3.00%, 5/15/42 | 66 | 67,578 | ||||||
3.125%, 2/15/42-2/15/43 | 375 | 393,569 | ||||||
4.625%, 2/15/40 | 195 | 263,920 | ||||||
5.375%, 2/15/31 | 241 | 344,547 | ||||||
|
| |||||||
Total Governments – Treasuries | 1,210,264 | |||||||
|
| |||||||
| Shares | ||||||||
PREFERRED STOCKS – 0.9% | ||||||||
Financial Institutions – 0.9% | ||||||||
Banking – 0.6% | ||||||||
US Bancorp | 9,000 | 252,540 | ||||||
|
| |||||||
| ALLIANCEBERNSTEIN CORPORATE INCOME SHARES • | 21 |
Portfolio of Investments
| Shares | U.S. $ Value | |||||||
| ||||||||
Insurance – 0.3% | ||||||||
Allstate Corp. (The) | 5,575 | $ | 148,295 | |||||
|
| |||||||
Total Preferred Stocks | 400,835 | |||||||
|
| |||||||
| Principal Amount (000) | ||||||||
QUASI-SOVEREIGNS – 0.7% | ||||||||
Quasi-Sovereign Bonds – 0.7% | ||||||||
Mexico – 0.7% | ||||||||
Comision Federal de Electricidad | $ | 200 | 226,000 | |||||
Pemex Project Funding Master Trust | 70 | 88,045 | ||||||
|
| |||||||
Total Quasi-Sovereigns | 314,045 | |||||||
|
| |||||||
GOVERNMENTS – SOVEREIGN AGENCIES – 0.5% | ||||||||
Brazil – 0.5% | ||||||||
Banco do Brasil SA/Cayman | 200 | 217,500 | ||||||
|
| |||||||
CORPORATES – NON-INVESTMENT GRADES – 0.4% | ||||||||
Industrial – 0.2% | ||||||||
Basic – 0.2% | ||||||||
Commercial Metals Co. | 80 | 88,400 | ||||||
|
| |||||||
Financial Institutions – 0.2% | ||||||||
Finance – 0.2% | ||||||||
International Lease Finance Corp. | 65 | 65,975 | ||||||
|
| |||||||
Total Corporates – Non-Investment Grades | 154,375 | |||||||
|
| |||||||
SHORT-TERM INVESTMENTS – 0.3% | ||||||||
Time Deposit – 0.3% | ||||||||
State Street Time Deposit | 108 | 107,650 | ||||||
|
| |||||||
Total Investments – 98.6% | 42,215,386 | |||||||
Other assets less liabilities – 1.4% | 583,637 | |||||||
|
| |||||||
Net Assets – 100.0% | $ | 42,799,023 | ||||||
|
| |||||||
| 22 | • ALLIANCEBERNSTEIN CORPORATE INCOME SHARES |
Portfolio of Investments
| (a) | Security is exempt from registration under Rule 144A of the Securities Act of 1933. These securities are considered liquid and may be resold in transactions exempt from registration, normally to qualified institutional buyers. At April 30, 2013, the aggregate market value of these securities amounted to $4,068,179 or 9.5% of net assets. |
| (b) | Variable rate coupon, rate shown as of April 30, 2013. |
Glossary:
REIT – Real Estate Investment Trust
See notes to financial statements.
| ALLIANCEBERNSTEIN CORPORATE INCOME SHARES • | 23 |
Portfolio of Investments
STATEMENT OF ASSETS & LIABILITIES
April 30, 2013
| Assets | ||||
Investments in securities, at value (cost $39,892,570) | $ | 42,215,386 | ||
Interest receivable | 512,183 | |||
Receivable for shares of beneficial interest sold | 297,161 | |||
Receivable for investment securities sold | 277,344 | |||
|
| |||
Total assets | 43,302,074 | |||
|
| |||
| Liabilities | ||||
Payable for investment securities purchased | 313,553 | |||
Dividends payable | 130,985 | |||
Payable for shares of beneficial interest redeemed | 58,513 | |||
|
| |||
Total liabilities | 503,051 | |||
|
| |||
Net Assets | $ | 42,799,023 | ||
|
| |||
| Composition of Net Assets | ||||
Shares of beneficial interest, at par | $ | 37 | ||
Additional paid-in capital | 41,591,503 | |||
Undistributed net investment income | 75,455 | |||
Accumulated net realized loss on investment transactions | (1,190,788 | ) | ||
Net unrealized appreciation on investments | 2,322,816 | |||
|
| |||
| $ | 42,799,023 | |||
|
| |||
Net Asset Value Per Share—unlimited shares of beneficial interest authorized, $.00001 par value (based on 3,749,214 common shares outstanding) | $ | 11.42 | ||
|
|
See notes to financial statements.
| 24 | • ALLIANCEBERNSTEIN CORPORATE INCOME SHARES |
Statement of Assets & Liabilities
STATEMENT OF OPERATIONS
Year Ended April 30, 2013
| Investment Income | ||||||||
Interest | $ | 1,768,951 | ||||||
Dividends | 5,251 | |||||||
|
| |||||||
Total investment income | 1,774,202 | |||||||
|
| |||||||
| Realized and Unrealized Gain on Investment Transactions | ||||||||
Net realized gain on: | ||||||||
Investment transactions | $ | 1,882,833 | ||||||
Swap contracts | 7,752 | |||||||
Net change in unrealized appreciation/depreciation of investments | 393,090 | |||||||
|
| |||||||
Net gain on investment transactions | 2,283,675 | |||||||
|
| |||||||
Net Increase in Net Assets from Operations | $ | 4,057,877 | ||||||
|
|
See notes to financial statements.
| ALLIANCEBERNSTEIN CORPORATE INCOME SHARES • | 25 |
Statement of Operations
STATEMENT OF CHANGES IN NET ASSETS
| Year Ended April 30, 2013 | Year Ended April 30, 2012 | |||||||
| Increase in Net Assets from Operations | ||||||||
Net investment income | $ | 1,774,202 | $ | 1,512,568 | ||||
Net realized gain on investment transactions | 1,890,585 | 573,462 | ||||||
Net change in unrealized appreciation/depreciation of investments | 393,090 | 316,495 | ||||||
|
|
|
| |||||
Net increase in net assets from operations | 4,057,877 | 2,402,525 | ||||||
Dividends to Shareholders from | ||||||||
Net investment income | (1,776,601 | ) | (1,512,562 | ) | ||||
| Transactions in Shares of Beneficial Interest | ||||||||
Net increase (decrease) | (6,330,460 | ) | 16,438,518 | |||||
|
|
|
| |||||
Total increase (decrease) | (4,049,184 | ) | 17,328,481 | |||||
| Net Assets | ||||||||
Beginning of period | 46,848,207 | 29,519,726 | ||||||
|
|
|
| |||||
End of period (including undistributed net investment income of $75,455 and $74,924, respectively) | $ | 42,799,023 | $ | 46,848,207 | ||||
|
|
|
| |||||
See notes to financial statements.
| 26 | • ALLIANCEBERNSTEIN CORPORATE INCOME SHARES |
Statement of Changes in Net Assets
NOTES TO FINANCIAL STATEMENTS
April 30, 2013
NOTE A
Significant Accounting Policies
AllianceBernstein Corporate Shares (the “Trust”) was organized as a Massachusetts business trust under the laws of The Commonwealth of Massachusetts by an Agreement and Declaration of Trust (“Declaration of Trust”) dated January 26, 2004. The Trust is registered under the Investment Company Act of 1940, as an open-end, diversified management investment company. The Trust operates as a “series” company currently offers four separate portfolios: AllianceBernstein Corporate Income Shares (the “Portfolio”), AllianceBernstein Municipal Income Shares, AllianceBernstein Taxable Multi-Sector Income Shares and AllianceBernstein Tax-Aware Real Return Income Shares. Each Portfolio is considered to be a separate entity for financial reporting and tax purposes. AllianceBernstein Tax-Aware Real Return Income Shares commenced operations on May 2, 2011. This report relates only to AllianceBernstein Corporate Income Shares.
Shares of the Portfolio are offered exclusively to holders of accounts established under wrap-fee programs sponsored and maintained by certain registered investment advisers approved by the AllianceBernstein L.P. (the “Adviser”). The Portfolio’s shares may be purchased at the relevant net asset value without a sales charge or other fee. The financial statements have been prepared in conformity with U.S. generally accepted accounting principles (“U.S. GAAP”) which require management to make certain estimates and assumptions that affect the reported amounts of assets and liabilities in the financial statements and amounts of income and expenses during the reporting period. Actual results could differ from those estimates. The following is a summary of significant accounting policies followed by the Portfolio.
1. Security Valuation
Portfolio securities are valued at their current market value determined on the basis of market quotations or, if market quotations are not readily available or are deemed unreliable, at “fair value” as determined in accordance with procedures established by and under the general supervision of the Trust’s Board of Trustees (the “Board”).
In general, the market value of securities which are readily available and deemed reliable are determined as follows: Securities listed on a national securities exchange (other than securities listed on the NASDAQ Stock Market, Inc. (“NASDAQ”)) or on a foreign securities exchange are valued at the last sale price at the close of the exchange or foreign securities exchange. If there has been no sale on such day, the securities are valued at the last traded price from the previous day. Securities listed on more than one exchange are valued by reference to the principal exchange on which the securities are traded; securities listed only on NASDAQ are valued in accordance with the NASDAQ Official Closing Price; listed or over the counter (“OTC”) market put or call options are valued at the mid level between the current bid and ask prices. If either a current bid or current ask price is unavailable, the Adviser will have discretion to determine the best valuation (e.g. last trade price in
| ALLIANCEBERNSTEIN CORPORATE INCOME SHARES • | 27 |
Notes to Financial Statements
the case of listed options); open futures contracts are valued using the closing settlement price or, in the absence of such a price, the most recent quoted bid price. If there are no quotations available for the day of valuation, the last available closing settlement price is used; U.S. government securities and other debt instruments having 60 days or less remaining until maturity are valued at amortized cost if their original maturity was 60 days or less; or by amortizing their fair value as of the 61st day prior to maturity if their original term to maturity exceeded 60 days; fixed-income securities, including mortgage backed and asset backed securities, may be valued on the basis of prices provided by a pricing service or at a price obtained from one or more of the major broker/dealers. In cases where broker/dealer quotes are obtained, the Adviser may establish procedures whereby changes in market yields or spreads are used to adjust, on a daily basis, a recently obtained quoted price on a security. Swaps and other derivatives are valued daily, primarily using independent pricing services, independent pricing models using market inputs, as well as third party broker-dealers or counterparties. Investments in money market funds are valued at their net asset value each day.
Securities for which market quotations are not readily available (including restricted securities) or are deemed unreliable are valued at fair value. Factors considered in making this determination may include, but are not limited to, information obtained by contacting the issuer, analysts, analysis of the issuer’s financial statements or other available documents. In addition, the Portfolio may use fair value pricing for securities primarily traded in non-U.S. markets because most foreign markets close well before the Portfolio values its securities at 4:00 p.m., Eastern Time. The earlier close of these foreign markets gives rise to the possibility that significant events, including broad market moves, may have occurred in the interim and may materially affect the value of those securities.
2. Fair Value Measurements
In accordance with U.S. GAAP regarding fair value measurements, fair value is defined as the price that the Portfolio would receive to sell an asset or pay to transfer a liability in an orderly transaction between market participants at the measurement date. U.S. GAAP establishes a framework for measuring fair value, and a three-level hierarchy for fair value measurements based upon the transparency of inputs to the valuation of an asset or liability (including those valued based on their market values as described in Note 1 above). Inputs may be observable or unobservable and refer broadly to the assumptions that market participants would use in pricing the asset or liability. Observable inputs reflect the assumptions market participants would use in pricing the asset or liability based on market data obtained from sources independent of the Portfolio. Unobservable inputs reflect the Portfolio’s own assumptions about the assumptions that market participants would use in pricing the asset or liability based on the best information available in the circumstances. Each investment is assigned a level based upon the observability of the inputs which are significant to the overall valuation. The three-tier hierarchy of inputs is summarized below.
| • | Level 1—quoted prices in active markets for identical investments |
| 28 | • ALLIANCEBERNSTEIN CORPORATE INCOME SHARES |
Notes to Financial Statements
| • | Level 2—other significant observable inputs (including quoted prices for similar investments, interest rates, prepayment speeds, credit risk, etc.) |
| • | Level 3—significant unobservable inputs (including the Portfolio’s own assumptions in determining the fair value of investments) |
The fair value of debt instruments, such as bonds, and over-the-counter derivatives is generally based on market price quotations, recently executed market transactions (where observable) or industry recognized modeling techniques and are generally classified as Level 2. Pricing vendor inputs to Level 2 valuations may include quoted prices for similar investments in active markets, interest rate curves, coupon rates, currency rates, yield curves, option adjusted spreads, default rates, credit spreads and other unique security features in order to estimate the relevant cash flows which is then discounted to calculate fair values. If these inputs are unobservable and significant to the fair value, these investments will be classified as Level 3. In addition, non-agency rated investments are classified as Level 3.
Other fixed income investments, including non-U.S. government and corporate debt, are generally valued using quoted market prices, if available, which are typically impacted by current interest rates, maturity dates and any perceived credit risk of the issuer. Additionally, in the absence of quoted market prices, these inputs are used by pricing vendors to derive a valuation based upon industry or proprietary models which incorporate issuer specific data with relevant yield/spread comparisons with more widely quoted bonds with similar key characteristics. Those investments for which there are observable inputs are classified as Level 2. Where the inputs are not observable, the investments are classified as Level 3.
The following table summarizes the valuation of the Portfolio’s investments by the above fair value hierarchy levels as of April 30, 2013:
Investments in | Level 1 | Level 2 | Level 3 | Total | ||||||||||||
Assets: | ||||||||||||||||
Corporates – Investment Grades | $ | 165,336 | $ | 39,645,381 | $ | – 0 | – | $ | 39,810,717 | |||||||
Governments – Treasuries | – 0 | – | 1,210,264 | – 0 | – | 1,210,264 | ||||||||||
Preferred Stocks | 400,835 | – 0 | – | – 0 | – | 400,835 | ||||||||||
Quasi-Sovereigns | – 0 | – | 314,045 | – 0 | – | 314,045 | ||||||||||
Governments – Sovereign Agencies | – 0 | – | 217,500 | – 0 | – | 217,500 | ||||||||||
Corporates – Non-Investment Grades | – 0 | – | 154,375 | – 0 | – | 154,375 | ||||||||||
Short-Term Investments | – 0 | – | 107,650 | – 0 | – | 107,650 | ||||||||||
|
|
|
|
|
|
|
| |||||||||
Total Investments in Securities | 566,171 | 41,649,215 | – 0 | – | 42,215,386 | |||||||||||
Other Financial Instruments* | – 0 | – | – 0 | – | – 0 | – | – 0 | – | ||||||||
|
|
|
|
|
|
|
| |||||||||
Total^ | $ | 566,171 | $ | 41,649,215 | $ | – 0 | – | $ | 42,215,386 | |||||||
|
|
|
|
|
|
|
| |||||||||
| * | Other financial instruments are derivative instruments, such as futures, forwards and swap contracts, which are valued at the unrealized appreciation/depreciation on the instrument. |
| ^ | There were no transfers between Level 1 and Level 2 during the reporting period. |
| ALLIANCEBERNSTEIN CORPORATE INCOME SHARES • | 29 |
Notes to Financial Statements
The Portfolio recognizes all transfers between levels of the fair value hierarchy assuming the financial instruments were transferred at the beginning of the reporting period.
The Adviser has established a Valuation Committee (the “Committee”) which is responsible for overseeing the pricing and valuation of all securities held in the Portfolio. The Committee operates under pricing and valuation policies and procedures established by the Adviser and approved by the Board, including pricing policies which set forth the mechanisms and processes to be employed on a daily basis to implement these policies and procedures. In particular, the pricing policies describe how to determine market quotations for securities and other instruments. The Committee’s responsibilities include: 1) fair value and liquidity determinations (and oversight of any third parties to whom any responsibility for fair value and liquidity determinations is delegated), and 2) regular monitoring of the Adviser’s pricing and valuation policies and procedures and modification or enhancement of these policies and procedures (or recommendation of the modification of these policies and procedures) as the Committee believes appropriate.
The Committee is also responsible for monitoring the implementation of the pricing policies by the Adviser’s Pricing Group (the “Pricing Group”) and a third party which performs certain pricing functions in accordance with the pricing policies. The Pricing Group is responsible for the oversight of the third party on a day-to-day basis. The Committee and the Pricing Group perform a series of activities to provide reasonable assurance of the accuracy of prices including: 1) periodic vendor due diligence meetings, review of methodologies, new developments and process at vendors, 2) daily compare of security valuation versus prior day for all securities that exceeded established thresholds, and 3) daily review of unpriced, stale, and variance reports with exceptions reviewed by senior management and the Committee.
In addition, several processes outside of the pricing process are used to monitor valuation issues including: 1) performance and performance attribution reports are monitored for anomalous impacts based upon benchmark performance, and 2) portfolio managers review all portfolios for performance and analytics (which are generated using the Adviser’s prices).
3. Taxes
It is the Portfolio’s policy to meet the requirements of the Internal Revenue Code applicable to regulated investment companies and to distribute all of its investment company taxable income and net realized gains, if any, to shareholders. Therefore, no provisions for federal income or excise taxes are required.
In accordance with U.S. GAAP requirements regarding accounting for uncertainties in income taxes, management has analyzed the Portfolio’s tax positions taken or expected to be taken on federal and state income tax returns
| 30 | • ALLIANCEBERNSTEIN CORPORATE INCOME SHARES |
Notes to Financial Statements
for all open tax years (the current and the prior three tax years) and has concluded that no provision for income tax is required in the Portfolio’s financial statements.
4. Investment Income and Investment Transactions
Dividend income is recorded on the ex-dividend date or as soon as the Portfolio is informed of the dividend. Interest income is accrued daily. Investment transactions are accounted for on the date the securities are purchased or sold. Investment gains or losses are determined on the identified cost basis. The Portfolio amortizes premiums and accretes discounts as adjustments to interest income.
5. Dividends and Distributions
Dividends and distributions to shareholders, if any, are recorded on the ex-dividend date. Income dividends and capital gains distributions are determined in accordance with federal tax regulations and may differ from those determined in accordance with U.S. GAAP. To the extent these differences are permanent, such amounts are reclassified within the capital accounts based on their federal tax basis treatment; temporary differences do not require such reclassification.
NOTE B
Advisory Fee and Other Transactions with Affiliates
Under the terms of the Advisory Agreement, the Portfolio pays no advisory fee to the Adviser and the Adviser reimburses or pays for the Portfolio’s operating expenses. The Portfolio is an integral part of separately managed accounts in wrap-fee programs. Typically, participants in these programs pay a fee to their investment adviser for all costs and expenses of the separately managed account, including costs and expenses associated with the Portfolio, and a fee is paid by their investment adviser to the Adviser. The Adviser serves as investment manager and adviser of the Portfolio and continuously furnishes an investment program for the Portfolio and manages, supervises and conducts the affairs of the Portfolio, subject to the supervisions of the Portfolio’s Board. The Advisory Agreement provides that the Adviser or an affiliate will furnish, or pay the expenses of the Portfolio for, office space, facilities and equipment, services of executive and other personnel of the Portfolio and certain administrative services.
The Portfolio has entered into a Distribution Agreement with AllianceBernstein Investments, Inc., the Portfolio’s principal underwriter (the “Underwriter”), to permit the Underwriter to distribute the Portfolio’s shares, which are sold at their net asset value without any sales charge. The Portfolio does not pay a fee for this service. The Underwriter is a wholly owned subsidiary of the Adviser.
AllianceBernstein Investor Services, Inc. (“ABIS”), a wholly-owned subsidiary of the Adviser, acts as the Portfolio’s registrar, transfer agent and dividend-disbursing agent. ABIS registers the transfer, issuance and redemption of Portfolio shares and disburses dividends and other distributions to Portfolio shareholders. The Portfolio does not pay a fee for this service.
| ALLIANCEBERNSTEIN CORPORATE INCOME SHARES • | 31 |
Notes to Financial Statements
NOTE C
Investment Transactions
Purchases and sales of investment securities (excluding short-term investments) for the year ended April 30, 2013 were as follows:
| Purchases | Sales | |||||||
Investment securities (excluding | $ | 33,256,305 | $ | 38,502,617 | ||||
U.S. government securities | 7,158,911 | 7,890,743 | ||||||
The cost of investments for federal income tax purposes, gross unrealized appreciation and unrealized depreciation are as follows:
Cost | $ | 39,894,541 | ||
|
| |||
Gross unrealized appreciation | $ | 2,357,565 | ||
Gross unrealized depreciation | (36,720 | ) | ||
|
| |||
Net unrealized appreciation | $ | 2,320,845 | ||
|
|
1. Derivative Financial Instruments
The Portfolio may use derivatives in an effort to earn income and enhance returns, to replace more traditional direct investments, to obtain exposure to otherwise inaccessible markets (collectively, “investment purposes”), or to hedge or adjust the risk profile of its portfolio.
The principal type of derivative utilized by the Portfolio, as well as the methods in which they may be used are:
| • | Swap Agreements |
The Portfolio may enter into swaps to hedge its exposure to interest rates, credit risk, or currencies. The Portfolio may also enter into swaps for non-hedging purposes as a means of gaining market exposures, including by making direct investments in foreign currencies. A swap is an agreement that obligates two parties to exchange a series of cash flows at specified intervals based upon or calculated by reference to changes in specified prices or rates for a specified amount of an underlying asset. The payment flows are usually netted against each other, with the difference being paid by one party to the other. In addition, collateral may be pledged or received by the Portfolio in accordance with the terms of the respective swap agreements to provide value and recourse to the Portfolio or its counterparties in the event of default, bankruptcy or insolvency by one of the parties to the swap agreement.
Risks may arise as a result of the failure of the counterparty to the swap contract to comply with the terms of the swap contract. The loss incurred by the failure of a counterparty is generally limited to the net interim payment to be received by the Portfolio, and/or the termination value at the end of the contract. Therefore, the Portfolio considers the creditworthiness of each
| 32 | • ALLIANCEBERNSTEIN CORPORATE INCOME SHARES |
Notes to Financial Statements
counterparty to a swap contract in evaluating potential counterparty risk. This risk is mitigated by having a netting arrangement between the Portfolio and the counterparty and by the posting of collateral by the counterparty to the Portfolio to cover the Portfolio’s exposure to the counterparty. Additionally, risks may arise from unanticipated movements in interest rates or in the value of the underlying securities. The Portfolio accrues for the interim payments on swap contracts on a daily basis, with the net amount recorded within unrealized appreciation/depreciation of swap contracts on the statement of assets and liabilities, where applicable. Once the interim payments are settled in cash, the net amount is recorded as realized gain/(loss) on swaps on the statement of operations, in addition to any realized gain/(loss) recorded upon the termination of swap contracts. Upfront premiums paid or received are recognized as cost or proceeds on the statement of assets and liabilities and are amortized on a straight line basis over the life of the contract. Amortized upfront premiums are included in net realized gain/(loss) from swaps on the statement of operations. Fluctuations in the value of swap contracts are recorded as a component of net change in unrealized appreciation/depreciation of swap contracts on the statement of operations.
Credit Default Swaps:
The Portfolio may enter into credit default swaps, including to manage its exposure to the market or certain sectors of the market, to reduce its risk exposure to defaults by corporate and sovereign issuers held by the Portfolio, or to create exposure to corporate or sovereign issuers to which it is not otherwise exposed. The Portfolio may purchase credit protection (“Buy Contract”) or provide credit protection (“Sale Contract”) on the referenced obligation of the credit default swap. During the term of the swap agreement, the Portfolio receives/(pays) fixed payments from/(to) the respective counterparty, calculated at the agreed upon rate applied to the notional amount. If the Portfolio is a buyer/(seller) of protection and a credit event occurs, as defined under the terms of the swap agreement, the Portfolio will either (i) receive from the seller/(pay to the buyer) of protection an amount equal to the notional amount of the swap contract (the “Maximum Payout Amount”) and deliver/(take delivery of) the referenced obligation or (ii) receive/(pay) a net settlement amount in the form of cash or securities equal to the notional amount of the swap less the recovery value of the referenced obligation.
Credit default swaps may involve greater risks than if a Portfolio had invested in the referenced obligation directly. Credit default swaps are subject to general market risk, liquidity risk, counterparty risk and credit risk. If the Portfolio is a buyer of protection and no credit event occurs, it will lose the payments it made to its counterparty. If the Portfolio is a seller of protection and a credit event occurs, the value of the referenced obligation received by the Portfolio coupled with the periodic payments
| ALLIANCEBERNSTEIN CORPORATE INCOME SHARES • | 33 |
Notes to Financial Statements
previously received, may be less than the Maximum Payout Amount it pays to the buyer, resulting in a net loss to the Portfolio.
During the year ended April 30, 2013, the Portfolio held credit default swaps for non-hedging purposes.
Implied credit spreads utilized in determining the market value of credit default swaps on issuers as of period end are disclosed in the portfolio of investments. The implied spreads serve as an indicator of the current status of the payment/performance risk and typically reflect the likelihood of default by the issuer of the referenced obligation. The implied credit spread of a particular reference obligation also reflects the cost of buying/selling protection and may reflect upfront payments required to be made to enter into the agreement. Widening credit spreads typically represent a deterioration of the referenced obligation’s credit soundness and greater likelihood of default or other credit event occurring as defined under the terms of the agreement. A credit spread identified as “Defaulted” indicates a credit event has occurred for the referenced obligation.
In certain circumstances Maximum Payout Amounts may be partially offset by recovery values of the respective referenced obligations, upfront premium received upon entering into the agreement, or net amounts received from settlement of buy protection credit default swap agreements entered into by the Portfolio for the same reference obligation with the same counterparty.
Documentation governing the Portfolio’s OTC derivatives may contain provisions for early termination of such transaction in the event the net assets of the Portfolio decline below specific levels set forth in the documentation (“net asset contingent features”). If these levels are triggered, the Portfolio’s counterparty has the right to terminate such transaction and require the Portfolio to pay or receive a settlement amount in connection with the terminated transaction. As of April 30, 2013, the Portfolio had no OTC derivatives with contingent features in net liability positions.
The effect of derivative instruments on the statement of operations for the year
| ||||||||
Derivative Type | Location of Gain or | Realized Gain or (Loss) on Derivatives | Change in Unrealized Appreciation or (Depreciation) | |||||
Credit contracts | Net realized gain (loss) on swap contracts; Net change in unrealized appreciation/depreciation of swap contracts | $ | 7,752 | |||||
|
|
| ||||||
Total | $ | 7,752 | ||||||
|
|
| ||||||
| 34 | • ALLIANCEBERNSTEIN CORPORATE INCOME SHARES |
Notes to Financial Statements
The following table represents the volume of the Portfolio’s derivative transactions during the year ended April 30, 2013:
Credit Default Swap Contracts: | ||||
Average notional amount of sale contracts | $ | 1,875,000 | (a) |
| (a) | Position was open 2 months during the year. |
NOTE D
Shares of Beneficial Interest
Transactions in shares of beneficial interest were as follows:
| Shares | Amount | |||||||||||||||||||
| Year Ended April 30, 2013 | Year Ended 2012 | Year Ended 2013 | Year Ended 2012 | |||||||||||||||||
|
| |||||||||||||||||||
| Class A | ||||||||||||||||||||
Shares sold | 1,477,058 | 2,516,409 | $ | 16,643,111 | $ | 26,905,353 | ||||||||||||||
| ||||||||||||||||||||
Shares redeemed | (2,054,764 | ) | (977,114 | ) | (22,973,571 | ) | (10,466,835 | ) | ||||||||||||
| ||||||||||||||||||||
Net increase (decrease) | (577,706 | ) | 1,539,295 | $ | (6,330,460 | ) | $ | 16,438,518 | ||||||||||||
| ||||||||||||||||||||
NOTE E
Risks Involved in Investing in the Portfolio
Interest Rate Risk and Credit Risk—Interest rate risk is the risk that changes in interest rates will affect the value of the Portfolio’s investments in fixed-income debt securities such as bonds or notes. Increases in interest rates may cause the value of the Portfolio’s investments to decline. Credit risk is the risk that the issuer or guarantor of a debt security, or the counterparty to a derivative contract, will be unable or unwilling to make timely principal and/or interest payments, or to otherwise honor its obligations. The degree of risk for a particular security may be reflected in its credit risk rating. Credit risk is greater for medium quality and lower-rated securities. Lower-rated debt securities and similar unrated securities (commonly known as “junk bonds”) have speculative elements or are predominantly speculative risks.
Indemnification Risk—In the ordinary course of business, the Portfolio enters into contracts that contain a variety of indemnifications. The Portfolio’s maximum exposure under these arrangements is unknown. However, the Portfolio has not had prior claims or losses pursuant to these indemnification provisions and expects the risk of loss thereunder to be remote. Therefore, the Portfolio has not accrued any liability in connection with these indemnification provisions.
| ALLIANCEBERNSTEIN CORPORATE INCOME SHARES • | 35 |
Notes to Financial Statements
NOTE F
Distributions to Shareholders
The tax character of distributions paid during the fiscal years ended April 30, 2013 and April 30, 2012 were as follows:
| 2013 | 2012 | |||||||
Distributions paid from: | ||||||||
Ordinary income | $ | 1,776,601 | $ | 1,512,562 | ||||
|
|
|
| |||||
Total taxable distributions | 1,776,601 | 1,512,562 | ||||||
|
|
|
| |||||
Total distributions paid | $ | 1,776,601 | $ | 1,512,562 | ||||
|
|
|
| |||||
As of April 30, 2013, the components of accumulated earnings/(deficit) on a tax basis were as follows:
Undistributed ordinary income | $ | 206,440 | ||
Accumulated capital and other losses | (1,188,817 | )(a) | ||
Unrealized appreciation/(depreciation) | 2,320,845 | (b) | ||
|
| |||
Total accumulated earnings/(deficit) | $ | 1,338,468 | (c) | |
|
|
| (a) | On April 30, 2013, the Portfolio had a capital loss carryforward of $1,188,817. During the fiscal year, the Portfolio utilized $1,862,470 of capital loss carryforwards to offset current year net realized gains. |
| (b) | The difference between book-basis and tax-basis unrealized appreciation/(depreciation) is attributable primarily to the tax deferral of losses on wash sales. |
| (c) | The difference between book-basis and tax-basis components of accumulated earnings/(deficit) is attributable primarily to dividends payable. |
For tax purposes, net capital losses may be carried over to offset future capital gains, if any. Funds are permitted to carry forward capital losses incurred in taxable years beginning after December 22, 2010 for an indefinite period. These post-enactment capital losses must be utilized prior to the pre-enactment capital losses, which are subject to expiration. Post-enactment capital loss carryforwards will retain their character as either short-term or long-term capital losses rather than being considered short-term as under previous regulation.
As of April 30, 2013, the Portfolio had a net capital loss carryforward of $1,188,817 which will expire as follows:
| SHORT-TERM AMOUNT | LONG-TERM AMOUNT | EXPIRATION | ||||||
| $ 1,188,817 | n/a | 2018 | ||||||
During the current fiscal year, permanent differences primarily due to consent fee reclassifications and the tax treatment of swaps resulted in a net increase in undistributed net investment income and a net increase in accumulated net realized loss on investment transactions. These reclassifications had no effect on net assets.
| 36 | • ALLIANCEBERNSTEIN CORPORATE INCOME SHARES |
Notes to Financial Statements
NOTE G
Recent Accounting Pronouncements
In December 2011, the Financial Accounting Standards Board (“FASB”) issued an Accounting Standards Update (“ASU”) related to disclosures about offsetting assets and liabilities in financial statements. The amendments in this update require an entity to disclose both gross and net information for derivatives and other financial instruments that are either offset in the statement of assets and liabilities or subject to an enforceable master netting arrangement or similar agreement. In January 2013, the FASB issued an ASU to clarify the scope of disclosures about offsetting assets and liabilities. The ASU limits the scope of the new balance sheet offsetting disclosures to derivatives, repurchase agreements and securities lending transactions. The ASU is effective during interim or annual reporting periods beginning on or after January 1, 2013. At this time, management is evaluating the implication of this ASU and its impact on the financial statements has not been determined.
NOTE H
Subsequent Events
Management has evaluated subsequent events for possible recognition or disclosure in the financial statements through the date the financial statements are issued. Management has determined that there are no material events that would require disclosure in the Portfolio’s financial statements through this date.
| ALLIANCEBERNSTEIN CORPORATE INCOME SHARES • | 37 |
Notes to Financial Statements
FINANCIAL HIGHLIGHTS
Selected Data For A Share Of Beneficial Interest Outstanding Throughout Each Period
| Year Ended April 30, | ||||||||||||||||||||
| 2013 | 2012 | 2011 | 2010 | 2009 | ||||||||||||||||
|
| |||||||||||||||||||
Net asset value, beginning of period | $ 10.83 | $ 10.59 | $ 10.30 | $ 8.25 | $ 9.56 | |||||||||||||||
|
|
|
| |||||||||||||||||
Income From Investment Operations | ||||||||||||||||||||
Net investment income(a) | .43 | .46 | .54 | .59 | .57 | |||||||||||||||
Net realized and unrealized gain (loss) on investment transactions | .59 | .27 | .29 | 2.05 | (1.31 | ) | ||||||||||||||
|
| |||||||||||||||||||
Net increase (decrease) in net asset value from operations | 1.02 | .73 | .83 | 2.64 | (.74 | ) | ||||||||||||||
|
| |||||||||||||||||||
Less: Dividends | ||||||||||||||||||||
Dividends from net investment income | (.43 | ) | (.49 | ) | (.54 | ) | (.59 | ) | (.57 | ) | ||||||||||
|
| |||||||||||||||||||
Net asset value, end of period | $ 11.42 | $ 10.83 | $ 10.59 | $ 10.30 | $ 8.25 | |||||||||||||||
|
| |||||||||||||||||||
Total Return | ||||||||||||||||||||
Total investment return based on net asset value(b) | 9.53 | %* | 7.02 | % | 8.28 | % | 32.72 | % | (7.76 | )% | ||||||||||
Ratios/Supplemental Data | ||||||||||||||||||||
Net assets, end of period (000’s omitted) | $42,799 | $46,848 | $29,520 | $34,041 | $56,994 | |||||||||||||||
Ratio to average net assets of: | ||||||||||||||||||||
Net investment income | 3.79 | % | 4.42 | % | 5.20 | % | 6.22 | % | 6.56 | % | ||||||||||
Portfolio turnover rate | 89 | % | 91 | % | 33 | % | 21 | % | 26 | % | ||||||||||
| (a) | Based on average shares outstanding. |
| (b) | Total investment return is calculated assuming an initial investment made at the net asset value at the beginning of the period, reinvestment of all dividends and distributions at net asset value during the period, and redemption on the last day of the period. Total return does not reflect the deduction of taxes that a shareholder would pay on fund distributions or the redemption of fund shares. Total investment return calculated for a period of less than one year is not annualized. |
| * | Includes the impact of proceeds received and credited to the Portfolio resulting from the class action settlements, which enhanced the Portfolio’s performance for the year ended April 30, 2013 by 0.03%. |
See notes to financial statements.
| 38 | • ALLIANCEBERNSTEIN CORPORATE INCOME SHARES |
Financial Highlights
REPORT OF INDEPENDENT REGISTERED
PUBLIC ACCOUNTING FIRM
To the Board of Trustees of AllianceBernstein Corporate Shares and Shareholders of AllianceBernstein Corporate Income Shares:
We have audited the accompanying statement of assets and liabilities of AllianceBernstein Corporate Income Shares (one of the series constituting AllianceBernstein Corporate Shares) (the “Fund”), including the portfolio of investments, as of April 30, 2013, and the related statement of operations for the year then ended, the statements of changes in net assets for each of the two years in the period then ended, and the financial highlights for each of the three years in the period then ended. These financial statements and financial highlights are the responsibility of the Fund’s management. Our responsibility is to express an opinion on these financial statements and financial highlights based on our audits. The financial highlights for each of the two years in the period ended April 30, 2010 were audited by other auditors whose report dated June 23, 2010 expressed an unqualified opinion on those financial highlights.
We conducted our audits in accordance with the standards of the Public Company Accounting Oversight Board (United States). Those standards require that we plan and perform the audit to obtain reasonable assurance about whether the financial statements and financial highlights are free of material misstatement. We were not engaged to perform an audit of the Fund’s internal control over financial reporting. Our audits included consideration of internal control over financial reporting as a basis for designing audit procedures that are appropriate in the circumstances, but not for the purpose of expressing an opinion on the effectiveness of the Fund’s internal control over financial reporting. Accordingly, we express no such opinion. An audit also includes examining, on a test basis, evidence supporting the amounts and disclosures in the financial statements and financial highlights, assessing the accounting principles used and significant estimates made by management, and evaluating the overall financial statement presentation. Our procedures included confirmation of securities owned as of April 30, 2013, by correspondence with the custodian and others, or by other appropriate auditing procedures where replies from others were not received. We believe that our audits provide a reasonable basis for our opinion.
In our opinion, the financial statements and financial highlights referred to above present fairly, in all material respects, the financial position of AllianceBernstein Corporate Income Shares of AllianceBernstein Corporate Shares at April 30, 2013, and the results of its operations for the year then ended, the changes in its net assets for each of the two years in the period then ended and the financial highlights for each of the three years in the period then ended, in conformity with U.S. generally accepted accounting principles.

New York, New York
June 27, 2013
| ALLIANCEBERNSTEIN CORPORATE INCOME SHARES • | 39 |
Report of Independent Registered Public Accounting Firm
2013 FEDERAL TAX INFORMATION
(unaudited)
For Federal income tax purposes, the following information is furnished with respect to the distributions paid by the Portfolio during the taxable year ended April 30, 2013. For foreign shareholders, 85.29% of ordinary dividends paid may be considered to be qualifying to be taxed as interest-related dividends.
| 40 | • ALLIANCEBERNSTEIN CORPORATE INCOME SHARES |
2013 Federal Tax Information
BOARD OF TRUSTEES
William H. Foulk, Jr.(1), Chairman John H. Dobkin(1) Michael J. Downey(1) D. James Guzy(1) Nancy P. Jacklin(1) | Robert M. Keith, President and Chief Executive Officer Garry L. Moody(1) Marshall C. Turner, Jr.(1) Earl D. Weiner(1) |
OFFICERS
Philip L. Kirstein, Senior Vice President and Independent Compliance Officer Douglas J. Peebles, Senior Vice President Shawn E. Keegan(2), Vice President | Ashish C. Shah(2), Vice President Emilie D. Wrapp, Secretary Joseph J. Mantineo, Treasurer and Chief Financial Officer Phyllis J. Clarke, Controller |
Custodian and Accounting Agent State Street Bank and Trust Company
Principal Underwriter AllianceBernstein Investments, Inc.
Transfer Agent AllianceBernstein Investor Services, Inc. | Legal Counsel Seward & Kissel LLP One Battery Park Plaza New York, NY 10004
Independent Registered Public Accounting Firm Ernst & Young LLP 5 Times Square New York, NY 10036 |
| (1) | Member of the Audit Committee, the Governance and Nominating Committee and the Independent Directors Committee. Mr. Foulk is the sole member of the Fair Value Pricing Committee. |
| (2) | The day-to-day management of, and investment decisions for, the Trust’s Portfolio are made by the Corporate Income Shares Investment Team. Messrs. Shawn E. Keegan and Ashish C. Shah are the investment professionals primarily responsible for the day-to-day management of the Trust’s Portfolio. |
| ALLIANCEBERNSTEIN CORPORATE INCOME SHARES • | 41 |
Board of Trustees
TRUSTEES AND OFFICERS INFORMATION
Board of Trustees Information
The business and affairs of the Trust are managed under the direction of the Board of Trustees. Certain information concerning the Trust’s Trustees is set forth below.
| NAME, ADDRESS*, AGE, AND (YEAR FIRST ELECTED**) | PRINCIPAL OCCUPATION(S) DURING PAST FIVE YEARS AND OTHER RELEVANT | PORTFOLIOS IN FUND COMPLEX OVERSEEN BY TRUSTEE | OTHER DIRECTORSHIPS HELD BY TRUSTEE IN PAST FIVE YEARS | |||||
| INTERESTED TRUSTEE | ||||||||
Robert M. Keith, # 53 (2010) | Senior Vice President of AllianceBernstein L.P. (the “Adviser”) and the head of AllianceBernstein Investments, Inc. (“ABI”) since July 2008; Director of ABI and President of the AllianceBernstein Mutual Funds. Previously, he served as Executive Managing Director of ABI from December 2006 to June 2008. Prior to joining ABI in 2006, Executive Managing Director of Bernstein Global Wealth Management, and prior thereto, Senior Managing Director and Global Head of Client Service and Sales of the Adviser’s institutional investment management business since 2004. Prior thereto, he was Managing Director and Head of North American Client Service and Sales in the Adviser’s institutional investment management business, with which he had been associated since prior to 2004. | 102 | None | |||||
| DISINTERESTED TRUSTEES | ||||||||
Chairman of the Board (2004) | Investment Adviser and an Independent Consultant since prior to 2008. Previously, he was Senior Manager of Barrett Associates, Inc., a registered investment adviser. He was formerly Deputy Comptroller and Chief Investment Officer of the State of New York and, prior thereto, Chief Investment Officer of the New York Bank for Savings. He has served as a director or trustee of various AllianceBernstein Funds since 1983 and has been Chairman of the AllianceBernstein Funds and of the Independent Directors Committee of such Funds since 2003. He is also active in a number of mutual fund related organizations and committees. | 102 | None | |||||
| 42 | • ALLIANCEBERNSTEIN CORPORATE INCOME SHARES |
Trustees and Officers Information
NAME, (YEAR FIRST ELECTED**) | PRINCIPAL OCCUPATION(S) DURING PAST FIVE YEARS AND OTHER RELEVANT QUALIFICATIONS*** | PORTFOLIOS IN FUND COMPLEX OVERSEEN BY TRUSTEE | OTHER DIRECTORSHIPS HELD BY TRUSTEE IN PAST FIVE YEARS | |||||
DISINTERESTED TRUSTEES (continued) | ||||||||
John H. Dobkin, ## (2004) | Independent Consultant since prior to 2008. Formerly, President of Save Venice, Inc. (preservation organization) from 2001-2002, Senior Advisor from June 1999-June 2000 and President of Historic Hudson Valley (historic preservation) from December 1989-May 1999. Previously, Director of the National Academy of Design. He has served as a director or trustee of various AllianceBernstein Funds since 1992, and as Chairman of the Audit Committees of a number of such Funds from 2001-2008. | 102 | None | |||||
Michael J. Downey, ## (2005) | Private Investor since prior to 2008. Formerly, managing partner of Lexington Capital, LLC (investment advisory firm) from December 1997 until December 2003. From 1987 until 1993, Chairman and CEO of Prudential Mutual Fund Management, director of the Prudential mutual funds, and member of the Executive Committee of Prudential Securities Inc. He has served as a director or trustee of the AllianceBernstein Funds since 2005, and is a director and Chairman of one other registered investment company. | 102 | Asia Pacific Fund, Inc. since prior to 2008. Prospect Acquisition Corp. (financial services) from 2007 until 2009 and The Merger Fund since prior to 2008 until 2013 | |||||
D. James Guzy, ## (2005) | Chairman of the Board of PLX Technology (semi-conductors) and of SRC Computers Inc., with which he has been associated since prior to 2008. He was a director of Intel Corporation (semi-conductors) from 1969 until 2008, and served as Chairman of the Finance Committee of such company for several years until May 2008. He has served as a director or trustee of one or more of the AllianceBernstein Funds since 1982. | 102 | PLX Technology (semi-conductors) since prior to 2008, Cirrus Logic Corporation (semi-conductors) since prior to 2008 until July 2011 and Intel Corporation (semi-conductors) until 2008 | |||||
| ALLIANCEBERNSTEIN CORPORATE INCOME SHARES • | 43 |
Trustees and Officers Information
| NAME, ADDRESS*, AGE, AND (YEAR FIRST ELECTED**) | PRINCIPAL OCCUPATION(S) DURING PAST FIVE YEARS AND OTHER RELEVANT QUALIFICATIONS*** | PORTFOLIOS IN FUND COMPLEX OVERSEEN BY TRUSTEE | OTHER DIRECTORSHIPS HELD BY TRUSTEE IN PAST FIVE YEARS | |||
DISINTERESTED TRUSTEES (continued) | ||||||
Nancy P. Jacklin, ## (2006) | Professorial Lecturer at the Johns Hopkins School of Advanced International Studies since 2008. Formerly, U.S. Executive Director of the International Monetary Fund (December 2002-May 2006); Partner, Clifford Chance (1992-2002); Sector Counsel, International Banking and Finance, and Associate General Counsel, Citicorp (1985-1992); Assistant General Counsel (International), Federal Reserve Board of Governors (1982-1985); and Attorney Advisor, U.S. Department of the Treasury (1973-1982). Member of the Bar of the District of Columbia and of New York; and member of the Council on Foreign Relations. She has served as a director or trustee of the AllianceBernstein Funds since 2006. | 102 | None | |||
| 44 | • ALLIANCEBERNSTEIN CORPORATE INCOME SHARES |
Trustees and Officers Information
| NAME, ADDRESS*, AGE, AND (YEAR FIRST ELECTED**) | PRINCIPAL OCCUPATION(S) DURING PAST FIVE YEARS AND OTHER RELEVANT QUALIFICATIONS*** | PORTFOLIOS IN FUND COMPLEX OVERSEEN BY TRUSTEE | OTHER DIRECTORSHIPS HELD BY TRUSTEE IN PAST FIVE YEARS | |||||
DISINTERESTED TRUSTEES (continued) | ||||||||
Garry L. Moody, ## 61 (2010) | Independent Consultant. Formerly, Partner, Deloitte & Touche LLP (1995-2008) where he held a number of senior positions, including Vice Chairman, and U.S. and Global Investment Management Practice Managing Partner; President, Fidelity Accounting and Custody Services Company (1993-1995); and Partner, Ernst & Young LLP (1975-1993), where he served as the National Director of Mutual Fund Tax Services and Managing Partner of its Chicago Office Tax department. He is a member of both the Governing Council of the Independent Directors Council (IDC), an organization of independent directors of mutual funds, and the Trustee Advisory Board of BoardIQ, a biweekly publication focused on issues and news affecting directors of mutual funds. He has served as a director or trustee, and as Chairman of the Audit Committee, of the AllianceBernstein Funds since 2008. | 102 | None | |||||
| ALLIANCEBERNSTEIN CORPORATE INCOME SHARES • | 45 |
Trustees and Officers Information
| NAME, ADDRESS*, AGE, AND (YEAR FIRST ELECTED**) | PRINCIPAL OCCUPATION(S) DURING PAST FIVE YEARS AND OTHER RELEVANT QUALIFICATIONS*** | PORTFOLIOS IN FUND COMPLEX OVERSEEN BY TRUSTEE | OTHER DIRECTORSHIPS HELD BY TRUSTEE IN PAST FIVE YEARS | |||||
DISINTERESTED TRUSTEES (continued) | ||||||||
Marshall C. Turner, Jr., ## (2005) | Private Investor since prior to 2008. Interim CEO of MEMC Electronic Materials, Inc. (semi-conductor and solar cell substrates) from November 2008 until March 2009. He was Chairman and CEO of Dupont Photomasks, Inc. (components of semi-conductor manufacturing), 2003-2005, and President and CEO, 2005-2006, after the company was acquired and renamed Toppan Photomasks, Inc. He has extensive experience in venture capital investing including prior service as general partner of three institutional venture capital partnerships, and serves on the boards of a number of education and science-related non-profit organizations. He has served as a director or trustee of one or more of the AllianceBernstein Funds since 1992. | 102 | Xilinx, Inc. (programmable logic semi-conductors) and MEMC Electronic Materials, Inc., (semi-conductor and solar cell substrates) since prior to 2008 | |||||
Earl D. Weiner, ## 73 (2007) | Of Counsel, and Partner prior to January 2007, of the law firm Sullivan & Cromwell LLP and member of ABA Federal Regulation of Securities Committee Task Force to draft editions of the Fund Director’s Guidebook. He also serves as a director or trustee of various non-profit organizations and has served as Chairman or Vice Chairman of a number of them. He has served as a director or trustee of the AllianceBernstein Funds since 2007 and is Chairman of the Governance and Nominating Committees of the Funds. | 102 | None | |||||
| 46 | • ALLIANCEBERNSTEIN CORPORATE INCOME SHARES |
Trustees and Officers Information
| * | The address for each of the Trust’s disinterested Trustees is c/o AllianceBernstein L.P., Attention: Philip L. Kirstein, 1345 Avenue of the Americas, New York, NY 10105. |
| ** | There is no stated term of office for the Trust’s Trustees. |
| *** | The information above includes each Trustee’s principal occupation during the last five years and other information relating to the experience, attributes, and skills relevant to each Trustee’s qualifications to serve as a Trustee, which led to the conclusion that each Trustee should serve as a Trustee for the Trust. |
| # | Mr. Keith is an “interested person” of the Trust, as defined in the 1940 Act, due to his position as a Senior Vice President of the Adviser. |
| ## | Member of the Audit Committee, the Governance and Nominating Committee and the Independent Directors Committee. |
| + | Member of the Fair Value Pricing Committee. |
| ALLIANCEBERNSTEIN CORPORATE INCOME SHARES • | 47 |
Trustees and Officers Information
Officer Information
Certain information concerning the Trust’s officers is set forth below.
NAME, ADDRESS,* AND AGE | POSITION(S) HELD WITH FUND | PRINCIPAL OCCUPATION DURING PAST FIVE YEARS | ||
Robert M. Keith 53 | President and Chief Executive Officer | See biography above. | ||
| Philip L. Kirstein 68 | Senior Vice President and Independent Compliance Officer | Senior Vice President and Independent Compliance Officer of the AllianceBernstein Funds, with which he has been associated since October 2004. Prior thereto, he was Of Counsel to Kirkpatrick & Lockhart, LLP from October 2003 to October 2004, and General Counsel of Merrill Lynch Investment Managers, L.P. since prior to March 2003. | ||
| Douglas J. Peebles 47 | Senior Vice President | Senior Vice President of the Adviser,** with which he has been associated since prior to 2008. | ||
| Shawn E. Keegan 41 | Vice President | Vice President of the Adviser,** with which he has been associated since prior to 2008. | ||
Ashish C. Shah 42 | Vice President | Senior Vice President of the Adviser,** with which he has been associated since May 2010. Previously, he was a Managing Director and Head of Global Credit Strategy at Barclays Capital from September 2008 until May 2010. Prior thereto, he served as the Head of Credit Strategy at Lehman Brothers, heading the Structured Credit/CDO and Credit Strategy groups since prior to 2008. | ||
| Emilie D. Wrapp 57 | Secretary | Senior Vice President, Assistant General Counsel and Assistant Secretary of ABI,** with which she has been associated since prior to 2008. | ||
| Joseph J. Mantineo 54 | Treasurer and Chief Financial Officer | Senior Vice President of AllianceBernstein Investor Services, Inc. (“ABIS”),** with which he has been associated since prior to 2008. | ||
Phyllis J. Clarke 52 | Controller | Vice President of ABIS,** with which she has been associated since prior to 2008. |
| * | The address for each of the Trust’s Officers is 1345 Avenue of the Americas, New York, NY 10105. |
| ** | The Adviser, ABI and ABIS are affiliates of the Trust. |
| The Trust’s Statement of Additional Information (“SAI”) has additional information about the Trust’s Trustees and Officers and is available without charge upon request. Contact your financial representative or AllianceBernstein at 1-800-227-4618 for a free prospectus or SAI. |
| 48 | • ALLIANCEBERNSTEIN CORPORATE INCOME SHARES |
Trustees and Officers Information
Information Regarding the Review and Approval of the Fund’s Advisory Agreement
The disinterested trustees (the “trustees”) of AllianceBernstein Corporate Shares (the “Fund”) unanimously approved the continuance of the Advisory Agreement with the Adviser in respect of AllianceBernstein Corporate Income Shares (the “Portfolio”) at a meeting held on November 6-8, 2012.
Prior to approval of the continuance of the Advisory Agreement in respect of the Portfolio, the trustees had requested from the Adviser, and received and evaluated, extensive materials. They reviewed the proposed continuance of the Advisory Agreement with the Adviser and with experienced counsel who are independent of the Adviser, who advised on the relevant legal standards. The trustees also reviewed an independent evaluation prepared by the Fund’s Senior Officer (who is also the Fund’s Independent Compliance Officer) of the reasonableness of the advisory fee, in which the Senior Officer concluded that the contractual fee (zero) for the Portfolio was reasonable. The trustees also discussed the proposed continuance in private sessions with counsel and the Fund’s Senior Officer.
The trustees noted that the Portfolio is designed as a vehicle for the wrap fee account market (where investors pay fees to a wrap fee sponsor which pays investment fees and expenses from such fee). The trustees also noted that no advisory fee is payable by the Portfolio, that the Advisory Agreement does not include the reimbursement provision for certain administrative expenses included in the advisory agreements of most of the open-end AllianceBernstein Funds, and that the Adviser is responsible for payment of the Portfolio’s ordinary expenses. The trustees noted that the Fund acknowledges in the Advisory Agreement that the Adviser and its affiliates expect to receive compensation from third parties in connection with services provided under the Advisory Agreement. The trustees further noted that the Adviser receives payments from the wrap fee program sponsors (the “Sponsors”) that use the Portfolio as an investment vehicle for their clients.
The trustees considered their knowledge of the nature and quality of the services provided by the Adviser to the Portfolio gained from their experience as trustees or directors of most of the registered investment companies advised by the Adviser, their overall confidence in the Adviser’s integrity and competence they have gained from that experience, the Adviser’s initiative in identifying and raising potential issues with the trustees and its responsiveness, frankness and attention to concerns raised by the trustees in the past, including the Adviser’s willingness to consider and implement organizational and operational changes designed to improve investment results and the services provided to the AllianceBernstein Funds. The trustees noted that they have four regular meetings each year, at each of which they receive presentations from the Adviser on the investment results of the Portfolio and review extensive materials and information presented by the Adviser.
| ALLIANCEBERNSTEIN CORPORATE INCOME SHARES • | 49 |
The trustees also considered all other factors they believed relevant, including the specific matters discussed below. In their deliberations, the trustees did not identify any particular information that was all-important or controlling, and different trustees may have attributed different weights to the various factors. The trustees determined that the selection of the Adviser to manage the Portfolio, and the overall arrangements between the Portfolio and the Adviser as provided in the Advisory Agreement, including the advisory fee, were fair and reasonable in light of the services performed, expenses incurred and such other matters as the trustees considered relevant in the exercise of their business judgment. The material factors and conclusions that formed the basis for the trustees’ determination included the following:
Nature, Extent and Quality of Services Provided
The trustees considered the scope and quality of services provided by the Adviser under the Advisory Agreement, including the quality of the investment research capabilities of the Adviser and the other resources it has dedicated to performing services for the Portfolio. They also noted the professional experience and qualifications of the Portfolio’s portfolio management team and other senior personnel of the Adviser. The quality of administrative and other services, including the Adviser’s role in coordinating the activities of the Portfolio’s other service providers, also were considered. The trustees concluded that, overall, they were satisfied with the nature, extent and quality of services provided to the Portfolio under the Advisory Agreement.
Costs of Services Provided and Profitability
The trustees reviewed a schedule of the revenues, expenses and related notes indicating the profitability of the Portfolio to the Adviser for calendar years 2010 and 2011 that had been prepared with an expense allocation methodology arrived at in consultation with an independent consultant retained by the Fund’s Senior Officer. The trustees considered that while the Adviser does not receive any advisory fee from the Portfolio or expense reimbursement, it does receive fees paid by the Sponsors. They also noted that the Adviser bears certain costs in providing services to the Portfolio and in paying its ordinary expenses. The trustees reviewed the assumptions and methods of allocation used by the Adviser in preparing fund-specific profitability data and noted that there are a number of potentially acceptable allocation methodologies for information of this type. The trustees noted that the profitability information reflected all revenues and expenses of the Adviser’s relationship with the Portfolio. The trustees recognized that it is difficult to make comparisons of the profitability of the Advisory Agreement with the profitability of advisory contracts for unaffiliated funds because comparative information is not generally publicly available and is affected by numerous factors, including, in the case of the Portfolio, the fact that it does not pay an advisory fee. The trustees focused on the profitability of the Adviser’s relationship with the Portfolio before taxes. The trustees noted that the Adviser’s relationship with the Portfolio was not profitable to it in 2010 or 2011.
| 50 | • ALLIANCEBERNSTEIN CORPORATE INCOME SHARES |
Fall-Out Benefits
The trustees considered the other benefits to the Adviser and its affiliates from their relationships with the Portfolio. The trustees noted that the Adviser is compensated by the Sponsors. The trustees understood that the Adviser might also derive reputational and other benefits from its association with the Portfolio.
Investment Results
In addition to the information reviewed by the trustees in connection with the meeting, the trustees receive detailed performance information for the Portfolio at each regular Board meeting during the year. At the November 2012 meeting, the trustees reviewed information prepared by Lipper showing the performance of the Portfolio as compared with that of funds selected by Lipper (the “Performance Universe”) for various periods ended July 31, 2012, and information prepared by the Adviser showing the Portfolio’s performance as compared with the Barclays Capital U.S. Credit Index (the “Index”) for the 1-, 3- and 5-year periods ended September 30, 2012, and the period since inception (December 2006 inception). The trustees noted that, on a gross return basis, the Portfolio was in the 4th quintile of the Performance Universe for the 1-year period, in the 2nd quintile of the Performance Universe for the 3-year period, and in the 3rd quintile of the Performance Universe for the 5-year period. The Portfolio lagged the Index in the 1-year period and outperformed the Index in all other periods. The trustees were cognizant that the Portfolio was neither designed nor offered as a standalone investment and was intended to serve solely as a component of certain separately managed accounts (“SMAs”). The Adviser had explained that this attribute made it difficult to select an appropriate benchmark for the Portfolio. The trustees had asked the Adviser to provide information showing the weighting of the Portfolio in representative SMAs and the overall performance of those SMAs versus their stated benchmarks. The materials provided to the trustees in respect of the Portfolio included its weighting in the AllianceBernstein Strategic Research Balanced SMA and the performance of that SMA relative to a blended index consisting of 50% Standard & Poor’s 500 Index and 50% Barclays Capital Government/Credit Index (the “BCG/CI”) and against the BCG/CI. The trustees noted that the SMA showed generally favorable performance relative to its two benchmarks. Based on their review, the trustees concluded that the Portfolio’s relative performance over time had been satisfactory.
Advisory Fees
The trustees considered the advisory fee rate paid by the Portfolio to the Adviser (zero) and information provided by Lipper showing the fees paid by other fund families used in wrap fee programs similar to that of the Portfolio. The trustees recognized that it is difficult to make comparisons of advisory fees because there are variations in the services that are included in the fees paid by other funds.
The trustees noted the unusual arrangements in the Advisory Agreement providing for no advisory fee but were cognizant that the Adviser is indirectly compen-
| ALLIANCEBERNSTEIN CORPORATE INCOME SHARES • | 51 |
sated by the Sponsors for its services to the Portfolio. The trustees reviewed the fee arrangements between the Adviser and each of the current Sponsors and noted that such fees were negotiated on an arm’s length basis and were within the range of fees paid by wrap fee sponsors to other advisers of similar funds. While the Adviser’s fee arrangements with the Sponsors vary, the trustees acknowledged the Adviser’s view that a portion of such fees (less the expenses of the Portfolio paid by the Adviser) may reasonably be viewed as compensating the Adviser for advisory services it provides to the Portfolio (the “implied fee”) and that the Adviser believes that while the Sponsors pay the Adviser different fee rates, the rate of fee attributable to portfolio management at the Portfolio level is the same for all Sponsors. The trustees also considered the fee rate schedules used by other registered investment companies that invest in fixed income securities that are advised by the Adviser. Based on their review, the trustees concluded that the advisory arrangements for the Portfolio, including the zero fee aspect of the Advisory Agreement with the Adviser, were satisfactory.
The Adviser informed the trustees that there were no institutional products managed by it that have a substantially similar investment style. The trustees reviewed the relevant advisory fee information from the Adviser’s Form ADV and the evaluation from the Fund’s Senior Officer. The trustees recognized that such information was of limited utility in light of the Portfolio’s unusual fee arrangement. The Adviser reviewed with the trustees the significantly greater scope of the services it provides the Portfolio relative to institutional clients. The Adviser noted that because mutual funds are constantly issuing and redeeming shares, they are more difficult to manage than an institutional account, where the assets tend to be relatively stable. In light of the substantial differences in services rendered by the Adviser to institutional clients as compared to funds such as the Portfolio, and the unusual fee structure for the other portfolios of the Fund and the Portfolio, the trustees considered these fee comparisons inapt and did not place significant weight on them in their deliberations.
Since the Portfolio does not bear ordinary expenses, the trustees did not consider comparative expense information.
Economies of Scale
Since the Advisory Agreement does not provide for any compensation to be paid to the Adviser by the Portfolio and the Portfolio’s expense ratio is zero, the trustees did not consider the extent to which fee levels in the Advisory Agreement reflect economies of scale. They did note, however, that the fee payable to the Adviser by each of the current Sponsors declines at a breakpoint based on total assets managed by the Adviser for the Sponsors.
| 52 | • ALLIANCEBERNSTEIN CORPORATE INCOME SHARES |
THE FOLLOWING IS NOT PART OF THE SHAREHOLDER REPORT OR THE FINANCIAL STATEMENTS
SUMMARY OF SENIOR OFFICER’S EVALUATION OF
INVESTMENT ADVISORY AGREEMENT1
The following is a summary of the evaluation of the Investment Advisory Agreement between AllianceBernstein L.P. (the “Adviser”) and The AllianceBernstein Corporate Shares (the “Trust”) with respect to AllianceBernstein Corporate Income Shares (the “Portfolio”).2 The evaluation of the Investment Advisory Agreement was prepared by Philip L. Kirstein, the Senior Officer of the Trust, for the Trustees of the Trust, as required by the September 1, 2004 Assurance of Discontinuance (“AoD”) between the Adviser and the New York State Attorney General (the “NYAG”). The Senior Officer’s evaluation of the Investment Advisory Agreement is not meant to diminish the responsibility or authority of the Board of Trustees to perform its duties pursuant to Section 15 of the Investment Company Act of 1940 Act (the “40 Act”) and applicable state law. The purpose of the summary is to provide shareholders with a synopsis of the independent evaluation of the reasonableness of the advisory fees proposed to be paid by the Portfolio which was provided to the Trustees in connection with their review of the proposed approval of the continuance of the Investment Advisory Agreement.
The Senior Officer’s evaluation considered the following factors:
| 1. | Advisory fees charged to institutional and other clients of the Adviser for like services; |
| 2. | Advisory fees charged by other mutual fund companies for like services; |
| 3. | Costs to the Adviser and its affiliates of supplying services pursuant to the advisory agreement, excluding any intra-corporate profit; |
| 4. | Profit margins of the Adviser and its affiliates from supplying such services; |
| 5. | Possible economies of scale as the Portfolio grows larger; and |
| 6. | Nature and quality of the Adviser’s services including the performance of the Portfolio. |
These factors, with the exception of the first factor, are generally referred to as the “Gartenberg factors,” which were articulated by the United States Court of Appeals for the Second Circuit in 1982. Gartenberg v. Merrill Lynch Asset Management, Inc., 694 F. 2d 923 (2d Cir. 1982). On March 30, 2010, the Supreme Court held the Gartenberg decision was correct in its basic formulation of what §36(b) requires: to face liability under §36(b), “an investment adviser must charge a fee that is so disproportionately large that it bears no reasonable
| 1 | The Senior Officer’s fee evaluation was completed on October 25, 2012 and discussed with the Board of Trustees on November 6-8, 2012. |
| 2 | Future references to the Portfolio do not include “AllianceBernstein.” |
| ALLIANCEBERNSTEIN CORPORATE INCOME SHARES • | 53 |
relationship to the services rendered and could not have been the product of arm’s length bargaining” Jones v. Harris Associates L.P., 130 S. Ct. 1418 (2010). In Jones, the Court stated the Gartenberg approach fully incorporates the correct understanding of fiduciary duty within the context of section 36(b) and noted with approval that “Gartenberg insists that all relevant circumstances be taken into account” and “uses the range of fees that might result from arm’s-length bargaining as the benchmark for reviewing challenged fees.”3
PORTFOLIO’S EXEMPTION FROM ADVISORY FEES OR EXPENSES
The Portfolio pays no advisory fee to the Adviser for receiving the services to be provided pursuant to the Investment Advisory Agreement. The Portfolio is designed to serve the needs of the Adviser’s separately managed account (“SMA”) clients.4 Since SMA clients pay their wrap program provider a unitary fee for managing all investments of their portfolio, the Portfolio will not pay an advisory fee. The Adviser will also reimburse the Portfolio for all of its other operating expenses, except certain extraordinary expenses, taxes, brokerage costs and the interest on borrowed money.
The Portfolio’s net assets on September 30, 2012 are set forth below:
| Portfolio | 9/30/12 Net Assets ($MM) | |
| Corporate Income Shares | $ 44.6 |
The Portfolio, which offers only one no-load class of shares, is distributed through its principal underwriter, AllianceBernstein Investments, Inc. (“ABI”). Since the Portfolio is reimbursed by the Adviser for its operating expenses, the Portfolio does not have a distribution plan pursuant to Rule 12b-1 under the 40 Act.
| I. | ADVISORY FEES CHARGED TO INSTITUTIONAL AND OTHER CLIENTS |
The advisory fees charged to investment companies which the Adviser manages and sponsors are normally higher than those charged to similar sized institutional accounts, including pension plans and sub-advised investment companies. The fee differential reflects, among other things, different services provided to such clients, and different liabilities assumed. Services provided by the Adviser to the Portfolio that are not provided to non-investment company clients include providing office space and personnel to serve as Fund Officers, who among other responsibilities make the certifications required under the Sarbanes–Oxley Act of 2002, and coordinating with and monitoring the Portfolio’s third party service providers such as Fund counsel, auditors, custodians, transfer agents and pricing services. The accounting, administrative, legal and compliance requirements for
| 3 | Jones v. Harris at 1427. |
| 4 | The SMA clients currently employ the Adviser as one of several investment managers, and compensate the Adviser on the basis of all SMA assets managed, which would include assets of Corporate Income Shares. |
| 54 | • ALLIANCEBERNSTEIN CORPORATE INCOME SHARES |
the Portfolio are more costly than those for institutional client assets due to the greater complexities and time required for investment companies. The Adviser also believes that it incurs substantial entrepreneurial risk when offering a new mutual fund since establishing a new mutual fund requires a large upfront investment and it may take a long time for the fund to achieve profitability since the fund must be priced to scale from inception in order to be competitive and assets are acquired one account at a time. In addition, managing the cash flow of an investment company may be more difficult than that of a stable pool of assets, such as an institutional account with little cash movement in either direction, particularly if the Portfolio is in net redemption and the Adviser is frequently forced to sell securities to raise cash for redemptions. However, managing a fund with positive cash flow may be easier at times than managing a stable pool of assets. Finally, in recent years, investment advisers have been sued by institutional clients and have suffered reputational damage both by the attendant publicity and outcomes other than complete victories. Accordingly, the legal and reputational risks associated with institutional accounts are greater than previously thought, although arguably still not equal to those related to the mutual fund industry.
Notwithstanding the Adviser’s view that managing an investment company is not comparable to managing other institutional accounts because the services provided are different, the Supreme Court has indicated consideration should be given to the advisory fees charged to institutional accounts with a similar investment style as the Portfolio.5 However, with respect to the Portfolio, the Adviser represented that there is no institutional product in the Adviser’s Form ADV that has a similar investment style as the Portfolio.
The Adviser represented that it does provide sub-advisory services to other companies that have a substantially similar investment style as the Portfolio.
| II. | MANAGEMENT FEES CHARGED BY OTHER MUTUAL FUND COMPANIES FOR LIKE SERVICES. |
Lipper, Inc., an analytical service that is not affiliated with the Adviser, compared the fees charged to the Portfolio to the fees charged to other investment
| 5 | The Supreme Court stated that “courts may give such comparisons the weight that they merit in light of the similarities and differences between the services that the clients in question require, but the courts must be wary of inapt comparisons.” Among the significant differences the Supreme Court noted that may exist between services provided to mutual funds and institutional accounts are “higher marketing costs.” Jones v. Harris at 1428. |
| ALLIANCEBERNSTEIN CORPORATE INCOME SHARES • | 55 |
companies for similar services by other investment advisers.6,7 Each peer selected by Lipper had a similar fee arrangement as the Portfolio, which is to say that with respect to the Portfolio’s peers, all of their fund expenses, including management fees,8 were reimbursed by their respective investment advisers.
As previously noted, the Portfolio does not pay an advisory fee to the Adviser since its SMA clients pay their wrap program provider a unitary fee for managing all investments of their portfolios. In addition, the Adviser reimburses the Portfolio for all of its operating expenses, except certain extraordinary expenses, taxes, brokerage costs and interest on borrowed money.
| III. | COSTS TO THE ADVISER AND ITS AFFILIATES OF SUPPLYING SERVICES PURSUANT TO THE ADVISORY FEE ARRANGEMENT, EXCLUDING ANY INTRA-CORPORATE PROFIT. |
The Adviser utilizes two profitability reporting systems, which operate independently but are aligned with each other, to estimate the Adviser’s profitability in connection with investment advisory services provided to the Portfolio. The Senior Officer has retained a consultant to provide independent advice regarding the alignment of the two profitability systems as well as the methodologies and allocations utilized by both profitability systems. See Section IV for additional discussion.
| IV. | PROFIT MARGINS OF THE ADVISER AND ITS AFFILIATES FOR SUPPLYING SUCH SERVICES. |
The profitability information for the Portfolio, prepared by the Adviser for the Board of Trustees, was reviewed by the Senior Officer and the consultant. The Portfolio does not pay an advisory fee to the Adviser. However, the Adviser does profit indirectly through the advisory fees that it receives from SMA clients that invest in the Portfolio. The Adviser’s profitability with respect to the Portfolio, which decreased in 2011 relative to 2010, was calculated using a weighted average of the profitability of the SMA clients, in addition to any fund specific revenue or expense items.
| 6 | The Supreme Court cautioned against accepting mutual fund fee comparisons without careful scrutiny since “these comparisons are problematic because these fees, like those challenged, may not be the product of negotiations conducted at arm’s length.” Jones v. Harris at 1429. |
| 7 | Only zero fee no-load funds that participated in a wrap fee program were considered for inclusion in the Portfolio’s EG, regardless of the Lipper investment classification/objective of the Funds’ peers. The Portfolio’s EG includes the Portfolio, which is classified by Lipper as “A-rated Corporate Debt”, two BBB-rated Corporate Debt Funds, one Multi-Sector Income Fund, one Short-Intermediate Investment Grade Debt Fund, two U.S. Mortgage Funds, three General Bond Funds, one General & Insured Municipal Debt Fund, one Intermediate Investment-Grade Debt Fund, one Inflation-Protected Bond Fund, two Global Income funds, and one Intermediate Municipal Debt Fund. |
| 8 | “Management Fee” is the fee attributable to the management and bearing of expenses of the funds (not the management of the wrap fee program). In each case, the advisory contract provides for an advisory or management fee of zero. |
| 56 | • ALLIANCEBERNSTEIN CORPORATE INCOME SHARES |
AllianceBernstein Investments, Inc. (“ABI”) and AllianceBernstein Investor Services, Inc. (“ABIS”), affiliates of the Adviser, serve as the Portfolio’s underwriter and transfer agent, respectively. The courts have referred to this type of business relationships as “fall-out benefits” to the Adviser and indicated that such benefits should be factored into the evaluation of the total relationship between the Portfolio and the Adviser. Neither case law nor common business practice precludes the Adviser’s affiliates from earning a reasonable profit on this type of relationship provided the affiliates’ charges and services are competitive. However, neither ABI nor ABIS receive a fee for serving as the Portfolio’s underwriter and transfer agent.
| V. | POSSIBLE ECONOMIES OF SCALE |
The Adviser has indicated that economies of scale are being shared with shareholders through pricing to scale, breakpoints, fee reductions/waivers and enhancement to services.
An independent consultant, retained by the Senior Officer, provided the Board of Trustees information on the Adviser’s firm-wide average costs from 2005 through 2011 and the potential economies of scale. The independent consultant noted that from 2005 through 2007 the Adviser experienced significant growth in assets under management (“AUM”). During this period, operating expenses increased, in part to keep up with growth, and in part reflecting market returns. However, from 2008 through the first quarter of 2009, AUM rapidly and significantly decreased due to declines in market value and client withdrawals. When AUM rapidly decreased, some operating expenses categories, including base compensation and office space, adjusted more slowly during this period, resulting in an increase in average costs. Since 2009, AUM has experienced less significant changes. The independent consultant noted that changes in operating expenses reflect changes in business composition and business practices in response to changes in financial markets. Finally, the independent consultant concluded that the increase in average cost and the decline in net operating margin across the Adviser since late 2008 are inconsistent with the view that there are currently reductions in average costs due to economies of scale that can be shared with the AllianceBernstein Mutual Funds managed by the Adviser through lower fees.
| ALLIANCEBERNSTEIN CORPORATE INCOME SHARES • | 57 |
In February 2008, the independent consultant provided the Board of Trustees an update of the Deli9 study on advisory fees and various fund characteristics.10 The independent consultant first reiterated the results of his previous two dimensional comparison analysis (fund size and family size) with the Board of Trustees.11 The independent consultant then discussed the results of the regression model that was utilized to study the effects of various factors on advisory fees. The regression model output indicated that the bulk of the variation in fees predicted were explained by various factors, but substantially by fund AUM, family AUM, index fund indicator and investment style. The independent consultant also compared the advisory fees of the AllianceBernstein Mutual Funds to similar funds managed by 19 other large asset managers, regardless of the fund size and each Adviser’s proportion of mutual fund assets to non-mutual fund assets.
| VI. | NATURE AND QUALITY OF THE ADVISER’S SERVICES INCLUDING THE PERFORMANCE OF THE PORTFOLIO. |
With assets under management of approximately $419 billion as of September 30, 2012, the Adviser has the investment experience to manage and provide non-investment services (described in Section I) to the Portfolio.
The information below, prepared by Lipper, shows the 1,3 and 5 year gross performance returns and rankings of the Portfolio relative to its Lipper Performance Universe (“PU”)12 for the period ended July 31, 2012:
Portfolio Return | PU Median (%) | PU Rank | ||||||||||
| Corporate Income Shares | ||||||||||||
1 Year | 8.95 | 8.95 | 7/15 | |||||||||
3 Year | 11.96 | 9.17 | 4/12 | |||||||||
5 Year | 8.93 | 8.06 | 4/12 | |||||||||
| 9 | The Deli study, originally published in 2002 based on 1997 data and updated for the February 2008 Presentation, may be of diminished value due to the age of the data used in the presentation and the changes experienced in the industry over the last four years. |
| 10 | As mentioned previously, the Supreme Court cautioned against accepting mutual fund fee comparisons without careful scrutiny since the fees may not be the product of negotiations conducted at arm’s length. See Jones V. Harris at 1429. |
| 11 | The two dimensional analysis showed patterns of lower advisory fees for funds with larger asset sizes and funds from larger family sizes compared to funds with smaller asset sizes and funds from smaller family sizes, which according to the independent consultant is indicative of a sharing of economies of scale and scope. However, in less liquid and active markets, such is not the case, as the empirical analysis showed potential for diseconomies of scale in those markets. The empirical analysis also showed diminishing economies of scale and scope as funds surpassed a certain high level of assets. |
| 12 | The Portfolio’s PU includes peers with the same Lipper investment classification/objective and load type as the Portfolio. |
| 58 | • ALLIANCEBERNSTEIN CORPORATE INCOME SHARES |
Set forth below are the 1 and 3 year and since inception net performance returns of the Portfolio (in bold)13 versus its benchmark.14 Portfolio and benchmark volatility and reward-to-variability ratio (“Sharpe Ratio”) information is also shown.15
Periods Ending July 31, 2012 Annualized Net Performance | ||||||||||||||||||||||||||||
1 Year (%) | 3 Year (%) | 5 Year | Annualized | Sharpe | Risk Period (Year) | |||||||||||||||||||||||
Since (%) | Volatility (%) | |||||||||||||||||||||||||||
| Corporate Income Shares | 8.95 | 11.96 | 8.93 | 7.87 | 7.58 | 1.04 | 5 | |||||||||||||||||||||
| Barclays Capital U.S. Credit Index | 9.87 | 9.70 | 8.09 | 7.18 | 3.81 | 2.39 | 5 | |||||||||||||||||||||
| Inception Date: December 11, 2006 | ||||||||||||||||||||||||||||
CONCLUSION:
Based on the factors discussed above the Senior Officer’s conclusion is that the Investment Advisory Agreement for the Portfolio is reasonable and within the range of what would have been negotiated at arm’s-length in light of all the surrounding circumstances. This conclusion with respect to the Portfolio is based on an evaluation of all of these factors and no single factor was dispositive.
Dated: December 3, 2012
| 13 | The performance returns of the Portfolio were provided Lipper. Lipper maintains its own database that includes the Portfolio’s performance returns. |
| 14 | The Adviser provided Portfolio and benchmark performance return information for the periods through July 31, 2012. |
| 15 | Portfolio and benchmark volatility and Sharpe Ratio information was obtained through Lipper LANA, a database maintained by Lipper. Volatility is a statistical measure of the tendency of a market price or yield to vary over time. A Sharpe Ratio is a risk adjusted measure of return that divides a fund’s return in excess of the riskless return by the fund’s standard deviation. A portfolio with a greater volatility would be viewed as more risky than a portfolio with equivalent performance but lower volatility; for that reason, a greater return would be demanded for the more risky fund. A portfolio with a higher Sharpe Ratio would be viewed as better performing than a fund with a lower Sharpe Ratio. |
| ALLIANCEBERNSTEIN CORPORATE INCOME SHARES • | 59 |
THIS PAGE IS NOT PART OF THE SHAREHOLDER REPORT OR THE FINANCIAL STATEMENTS
ALLIANCEBERNSTEIN FAMILY OF FUNDS
Wealth Strategies
Balanced Wealth Strategy
Conservative Wealth Strategy
Wealth Appreciation Strategy
Tax-Managed Balanced Wealth Strategy
Tax-Managed Conservative Wealth Strategy
Tax-Managed Wealth Appreciation Strategy
Asset Allocation/Multi-Asset Funds
Emerging Markets Multi-Asset Portfolio
International Portfolio
Tax-Managed International Portfolio
Growth Funds
Domestic
Discovery Growth Fund**
Growth Fund
Large Cap Growth Fund
Select US Equity Portfolio
Small Cap Growth Portfolio
Global & International
Global Thematic Growth Fund
International Discovery Equity Portfolio
International Growth Fund
Value Funds
Domestic
Core Opportunities Fund
Discovery Value Fund**
Equity Income Fund
Growth & Income Fund
Value Fund
Global & International
Emerging Markets Equity Portfolio
Global Value Fund
International Value Fund
Taxable Bond Funds
Bond Inflation Strategy
Global Bond Fund
High Income Fund
Intermediate Bond Portfolio
Limited Duration High Income Portfolio
Short Duration Portfolio
Municipal Bond Funds
Arizona Portfolio California Portfolio High Income Portfolio Massachusetts Portfolio Michigan Portfolio Minnesota Portfolio Municipal Bond Inflation Strategy | National Portfolio New Jersey Portfolio New York Portfolio Ohio Portfolio Pennsylvania Portfolio Virginia Portfolio |
Intermediate Municipal Bond Funds
Intermediate California Portfolio
Intermediate Diversified Portfolio
Intermediate New York Portfolio
Closed-End Funds
Alliance California Municipal Income Fund
Alliance New York Municipal Income Fund
AllianceBernstein Global High Income Fund
AllianceBernstein Income Fund
AllianceBernstein National Municipal Income Fund
Alternatives
Dynamic All Market Fund
Global Real Estate Investment Fund
Global Risk Allocation Fund**
Market Neutral Strategy-Global
Market Neutral Strategy-U.S.
Real Asset Strategy
Select US Long/Short Portfolio
Unconstrained Bond Fund
Retirement Strategies
2000 Retirement Strategy | 2020 Retirement Strategy | 2040 Retirement Strategy | ||
2005 Retirement Strategy | 2025 Retirement Strategy | 2045 Retirement Strategy | ||
2010 Retirement Strategy | 2030 Retirement Strategy | 2050 Retirement Strategy | ||
2015 Retirement Strategy | 2035 Retirement Strategy | 2055 Retirement Strategy |
We also offer Exchange Reserves,* which serves as the money market fund exchange vehicle for the AllianceBernstein mutual funds.
Investors should consider the investment objectives, risks, charges and expenses of the Fund carefully before investing. For copies of our prospectus or summary prospectus, which contain this and other information, visit us online at www.alliancebernstein.com or contact your AllianceBernstein investments representative. Please read the prospectus and/or summary prospectus carefully before investing.
| * | An investment in Exchange Reserves is not a deposit in a bank and is not insured or guaranteed by the Federal Deposit Insurance Corporation or any other government agency. Although the Fund seeks to preserve the value of your investment at $1.00 per share, it is possible to lose money by investing in the Fund. |
| ** | Prior to October 8, 2012, Global Risk Allocation Fund was named Balanced Shares. Prior to November 1, 2012, Discovery Growth Fund was named Small/Mid Cap Growth Fund and Discovery Value Fund was named Small/Mid Cap Value Fund. |
| 60 | • ALLIANCEBERNSTEIN CORPORATE INCOME SHARES |
AllianceBernstein Family of Funds
ALLIANCEBERNSTEIN CORPORATE INCOME SHARES
1345 Avenue of the Americas
New York, NY 10105
800.221.5672
| CIS-0151-0413 |  | |
ANNUAL REPORT
AllianceBernstein
Municipal Income Shares
April 30, 2013
Annual Report

Investment Products Offered
•Are Not FDIC Insured •May Lose Value •Are Not Bank Guaranteed |
Investors should consider the investment objectives, risks, charges and expenses of the Fund carefully before investing. For copies of our prospectus or summary prospectus, which contain this and other information, visit us online at www.alliancebernstein.com or contact your AllianceBernstein Investments representative. Please read the prospectus and/or summary prospectus carefully before investing.
This shareholder report must be preceded or accompanied by the Fund’s prospectus for individuals who are not current shareholders of the Fund.
You may obtain a description of the Fund’s proxy voting policies and procedures, and information regarding how the Fund voted proxies relating to portfolio securities during the most recent 12-month period ended June 30, without charge. Simply visit AllianceBernstein’s website at www.alliancebernstein.com, or go to the Securities and Exchange Commission’s (the “Commission”) website at www.sec.gov, or call AllianceBernstein at (800) 227-4618.
The Fund files its complete schedule of portfolio holdings with the Commission for the first and third quarters of each fiscal year on Form N-Q. The Fund’s Forms N-Q are available on the Commission’s website at www.sec.gov. The Fund’s Forms N-Q may also be reviewed and copied at the Commission’s Public Reference Room in Washington, DC; information on the operation of the Public Reference Room may be obtained by calling (800) SEC-0330.
AllianceBernstein Investments, Inc. (ABI) is the distributor of the AllianceBernstein family of mutual funds. ABI is a member of FINRA and is an affiliate of AllianceBernstein L.P., the manager of the funds.
AllianceBernstein® and the AB Logo are registered trademarks and service marks used by permission of the owner, AllianceBernstein L.P.
June 18, 2013
Annual Report
This report provides management’s discussion of fund performance for AllianceBernstein Municipal Income Shares (the “Fund”) for the annual reporting period ended April 30, 2013. Please note, shares of this Fund are offered exclusively through registered investment advisers approved by AllianceBernstein L.P. (the “Adviser”).
Investment Objectives and Policies
The investment objective of the Fund is to earn the highest level of current income, exempt from federal taxation, that is available consistent with what the Adviser considers to be an appropriate level of risk. The Fund pursues its objective by investing principally in high-yielding municipal securities that may be non-investment grade or investment grade. As a matter of fundamental policy, the Fund invests, under normal circumstances, at least 80% of its net assets in municipal securities that pay interest that is exempt from federal income tax. These securities may pay interest that is subject to the federal alternative minimum tax (“AMT”) for certain taxpayers.
The Fund may invest without limit in lower-rated securities (“junk bonds”), which may include securities having the lowest rating, and in unrated securities that, in the Adviser’s judgment, would be lower-rated securities if rated. The Fund may invest in fixed income securities with any maturity or duration. The Fund will seek to increase income for shareholders by investing in longer maturity bonds. Consistent with its objective of seeking a higher level of income, the Fund
may experience greater volatility and a higher risk of loss of principal than other municipal funds.
The Fund may also invest in tender option bond transactions (“TOBs”); forward commitments; zero coupon municipal securities and variable, floating and inverse floating rate municipal securities; certain types of mortgage related securities; and derivatives, such as options, futures, forwards and swaps.
The Fund may make short sales of securities or maintain a short position, and may use other investment techniques. The Fund may use leverage for investment purposes to increase income through the use of TOBs and derivative instruments, such as interest rate swaps.
Investment Results
The table on page 6 shows the Fund’s performance compared to its benchmark, the Barclays Municipal Bond Index, for the six- and 12-month periods ended April 30, 2013.
The Fund outperformed its benchmark for both the six- and 12-month periods. For both periods, the most significant contributor to outperformance was the Fund’s overweight to lower credit quality bonds. In addition, the Fund’s overweight to bonds maturing beyond 20 years benefited performance, as did an overweight to the healthcare sector and security selection within the healthcare and industrial revenue bond sectors. For the six-month period, security selection in the water sector detracted from returns. Security selection in the leasing sector detracted for the 12-month period.
| ALLIANCEBERNSTEIN MUNICIPAL INCOME SHARES • | 1 |
The Fund utilized derivatives in the form of credit default swaps for hedging purposes, which added to performance for both periods. Options on swaps were used for hedging purposes, which detracted from performance for the six-month period.
Market Review and Investment Strategy
Within the municipal market, medium- and lower-credit-quality bonds outperformed high-grade issues over both the six- and 12-month periods, as investor demand for income remained strong. Investors were also encouraged by evidence of steadily improving credit quality. Recent data shows municipal defaults falling to 0.01% of outstanding debt during the first two months of the first quarter, compared to an already low 0.11% in 2012. The Municipal Bond Investment Team (the “Team”) continues to target opportunities to buy medium- and lower-credit quality municipal bonds in order to supplement the Fund’s income and to attempt to reduce the Fund’s interest rate exposure, should interest rates rise. The Team believes these bonds should outperform if rates rise—the U.S. Federal Reserve has historically raised rates when the economy is strong in an attempt to control inflation, and medium- and lower-credit-quality bonds have historically performed well in a strong economy.
The Team believes the Fund is well-positioned with respect to interest rate risk. The Team has generally avoided highly rated, long-maturity bonds that have significant potential for loss of principal if interest rates rise. Instead
when buying highly rated bonds that are generally expected to perform in line with changes in overall yields, the Team has focused on shorter-maturity bonds that capture most of the yield of the longer-maturity bonds with less downside risk to principal. In the Team’s view, the extra yield for medium- and lower-credit-quality bonds is still high by historical standards. Where possible, the Team has added holdings of this type both to supplement the Fund’s income and to benefit overall performance when this extra yield, or credit spread, contracts.
The Fund may purchase municipal securities that are insured under policies issued by certain insurance companies. Historically, insured municipal securities typically received a higher credit rating, which meant that the issuer of the securities paid a lower interest rate. As a result of declines in the credit quality and associated downgrades of most fund insurers, insurance has less value than it did in the past. The market now values insured municipal securities primarily based on the credit quality of the issuer of the security with little value given to the insurance feature. In purchasing such insured securities, the Adviser evaluates the risk and return of municipal securities through its own research. If an insurance company’s rating is downgraded or the company becomes insolvent, the prices of municipal securities insured by the insurance company may decline. As of April 30, 2013, 0.44% of the Fund’s total investments were in insured bonds. There were no investments in pre-refunded/escrowed to maturity bonds as of that date.
| 2 | • ALLIANCEBERNSTEIN MUNICIPAL INCOME SHARES |
The Team believes that downgrades in insurance company ratings or insurance company insolvencies present limited risk to the Fund.
In the Team’s view, U.S. monetary policy could create additional market uncertainty in the coming year, as the Fed may reverse certain of the measures taken as a result of the 2008 global financial crisis. The Federal Funds rate has been reduced to near zero percent and the Fed has, among other actions taken, has purchased U.S. Treasury and mortgage-backed securities. The latter is commonly referred to as Quantitative Easing
(“QE”). These policies have been beneficial to fixed-income securities, including municipal bonds held in this Fund. When the Fed removes certain of these measures, there may be downward pressure on prices of fixed-income securities, including those held in the Fund. While the Team has pursued strategies it believes should benefit the Fund’s relative returns, the timing and the reversal of QE and the potential increase of the Federal Funds rate may impact the net asset value (“NAV”) of this Fund. These and other risks to the Fund are discussed further in this report.
| ALLIANCEBERNSTEIN MUNICIPAL INCOME SHARES • | 3 |
DISCLOSURES AND RISKS
Benchmark Disclosure
The unmanaged Barclays Municipal Bond Index does not reflect fees and expenses associated with the active management of a mutual fund portfolio. The Barclays Municipal Bond Index represents the performance of the long-term tax-exempt bond market consisting of investment grade bonds. An investor cannot invest directly in an index, and its results are not indicative of the performance for any specific investment, including the Fund.
A Word About Risk
Market Risk: The value of the Fund’s assets will fluctuate as the stock or bond market fluctuates. The value of the Fund’s investments may decline, sometimes rapidly and unpredictably, simply because of economic changes or other events that affect large portions of the market.
Credit Risk: An issuer or guarantor of a fixed-income security, or the counterparty to a derivatives or other contract, may be unable or unwilling to make timely payments of interest or principal, or to otherwise honor its obligations. The issuer or guarantor may default, causing a loss of the full principal amount of a security. The degree of risk for a particular security may be reflected in its credit rating. There is the possibility that the credit rating of a fixed-income security may be downgraded after purchase, which may adversely affect the value of the security. Investments in fixed income securities with lower ratings tend to have a higher probability that an issuer will default or fail to meet its payment obligations.
Municipal Market Risk: This is the risk that special factors may adversely affect the value of municipal securities and have a significant effect on the yield or value of the Fund’s investments in municipal securities. These factors include economic conditions, political or legislative changes, uncertainties related to the tax status of municipal securities, or the rights of investors in these securities. To the extent that the Fund invests more of its assets in a particular state’s municipal securities, the Fund may be vulnerable to events adversely affecting that state, including economic, political and regulatory occurrences, court decisions, terrorism and catastrophic natural disasters, such as hurricanes or earthquakes. The Fund’s investments in certain municipal securities with principal and interest payments that are made from the revenues of a specific project or facility, and not general tax revenues, may have increased risks. Factors affecting the project or facility, such as local business or economic conditions, could have a significant effect on the project’s ability to make payments of principal and interest on these securities.
Interest Rate Risk: Changes in interest rates will affect the value of investments in fixed-income securities. When interest rates rise, the value of investments in fixed-income securities tends to fall and this decrease in value may not be offset by higher income from new investments. Interest rate risk is generally greater for fixed-income securities with longer maturities or durations.
Inflation Risk: This is the risk that the value of assets or income from investments will be less in the future as inflation decreases the value of money. As inflation increases, the value of the Fund’s assets can decline as can the value of the Fund’s distributions. This risk is significantly greater for fixed-income securities with longer maturities.
Leverage Risk: To the extent the Fund uses leveraging techniques, its NAV may be more volatile because leverage tends to exaggerate the effect of changes in interest rates and any increase or decrease in the value of the Fund’s investments.
Liquidity Risk: Liquidity risk exists when particular investments, such as lower-rated securities, are difficult to purchase or sell, possibly preventing the Fund from selling out of these illiquid securities at an advantageous price. The Fund is subject to liquidity risk
(Disclosures, Risks and Note about Historical Performance continued on next page)
| 4 | • ALLIANCEBERNSTEIN MUNICIPAL INCOME SHARES |
Disclosures and Risks
DISCLOSURES AND RISKS
(continued from previous page)
because the market for municipal securities is generally smaller than many other markets. Derivatives and securities involving substantial market and credit risk tend to involve greater liquidity risk.
Derivatives Risk: Investments in derivatives may be illiquid, difficult to price, and leveraged so that small changes may produce disproportionate losses for the Fund, and may be subject to counterparty risk to a greater degree than more traditional investments.
Management Risk: The Fund is subject to management risk because it is an actively managed investment fund. The Adviser will apply its investment techniques and risk analyses in making investment decisions, but there is no guarantee that its techniques will produce the intended results.
These risks are fully discussed in the Fund’s prospectus.
An Important Note About Historical Performance
The performance shown on the following pages represents past performance and does not guarantee future results. Current performance may be lower or higher than the performance information shown. You may obtain performance information current to the most recent month-end by calling (800) 227-4618. The investment return and principal value of an investment in the Fund will fluctuate, so that your shares, when redeemed, may be worth more or less than their original cost. Performance assumes reinvestment of distributions and does not account for taxes.
Investors should consider the investment objectives, risks, charges and expenses of the Fund/Portfolio carefully before investing. For copies of our prospectus and/or summary prospectus, which contain this and other information, visit us online at www.alliancebernstein.com or contact your AllianceBernstein Investments representative. Please read the prospectus and/or summary prospectus carefully before investing.
| ALLIANCEBERNSTEIN MUNICIPAL INCOME SHARES • | 5 |
Disclosures and Risks
HISTORICAL PERFORMANCE
THE FUND VS. ITS BENCHMARK PERIODS ENDED APRIL 30, 2013 | NAV Returns | |||||||||
| 6 Months | 12 Months | |||||||||
| AllianceBernstein Municipal Income Shares | 3.47% | 11.98% | ||||||||
| ||||||||||
| Barclays Municipal Bond Index | 1.78% | 5.19% | ||||||||
| ||||||||||
| Please keep in mind that high, double-digit returns are highly unusual and cannot be sustained. Investors should also be aware that these returns were primarily achieved during favorable market conditions. | ||||||||||
GROWTH OF A $10,000 INVESTMENT IN THE FUND
9/1/2010* TO 4/30/2013
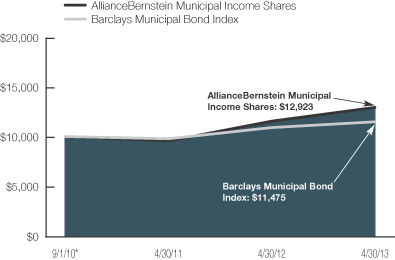
This chart illustrates the total value of an assumed $10,000 investment in AllianceBernstein Municipal Income Shares (from 9/1/2010* to 4/30/2013) as compared to the performance of its benchmark. The chart assumes the reinvestment of dividends and capital gains distributions.
| * | Inception date: 9/1/2010. |
See Disclosures, Risks and Note about Historical Performance on pages 4-5.
(Historical Performance continued on next page)
| 6 | • ALLIANCEBERNSTEIN MUNICIPAL INCOME SHARES |
Historical Performance
HISTORICAL PERFORMANCE
(continued from previous page)
| AVERAGE ANNUAL RETURNS AS OF APRIL 30, 2013 | ||||
| NAV Returns | ||||
1 Year | 11.98 | % | ||
Since Inception* | 10.12 | % | ||
| SEC AVERAGE ANNUAL RETURNS (WITH ANY APPLICABLE SALES CHARGES) AS OF THE MOST RECENT CALENDAR QUARTER-END (MARCH 31, 2013) | ||||
| SEC Returns | ||||
1 Year | 13.01 | % | ||
Since Inception* | 9.92 | % | ||
The prospectus fee table shows the fees and the total fund operating expenses of the Fund as 0.00% (excluding interest expense of 0.05%) because the Adviser does not charge any fees or expenses and reimburses or pays for Fund operating expenses. Participants in a wrap fee program or other investment program eligible to invest in the Fund pay fees to the program sponsor and should review the program brochure or other literature provided by the sponsor for a discussion of fees and expenses charged.
| * | Inception date: 9/1/2010. |
See Disclosures, Risks and Note about Historical Performance on pages 4-5.
| ALLIANCEBERNSTEIN MUNICIPAL INCOME SHARES • | 7 |
Historical Performance
EXPENSE EXAMPLE
(unaudited)
As a shareholder of the Fund, you may incur various ongoing non-operating and extraordinary costs. This example is intended to help you understand your ongoing costs (in dollars) of investing in the Fund and to compare these costs with the ongoing costs of investing in other mutual funds.
The Example is based on an investment of $1,000 invested at the beginning of the period and held for the entire period as indicated below.
Actual Expenses
The table below provides information about actual account values and actual expenses. You may use the information in this line, together with the amount you invested, to estimate the expenses that you paid over the period. Simply divide your account value by $1,000 (for example, an $8,600 account value divided by $1,000 = 8.6), then multiply the result by the number in the first line under the heading entitled “Expenses Paid During Period” to estimate the expenses you paid on your account during this period.
Hypothetical Example for Comparison Purposes
The table below provides information about hypothetical account values and hypothetical expenses based on the Fund’s actual expense ratio and an assumed annual rate of return of 5% before expenses, which is not the Fund’s actual return. The hypothetical account values and expenses may not be used to estimate the actual ending account balance or expenses you paid for the period. You may use this information to compare the ongoing costs of investing in the Fund and other funds by comparing this 5% hypothetical example with the 5% hypothetical examples that appear in the shareholder reports of other funds.
Please note that the expenses shown in the table are meant to highlight your ongoing costs only and do not reflect any transactional costs, such as sales charges (loads), or contingent deferred sales charges on redemptions. Therefore, the hypothetical example is useful in comparing ongoing costs only, and will not help you determine the relative total costs of owning different funds. In addition, if these transactional costs were included, your costs would have been higher.
| Beginning Account Value November 1, 2012 | Ending Account Value April 30, 2013 | Expenses Paid During Period* | Annualized Expense Ratio* | |||||||||||||
Actual | $ | 1,000 | $ | 1,034.70 | $ | 0.20 | 0.04 | % | ||||||||
Hypothetical** | $ | 1,000 | $ | 1,024.60 | $ | 0.20 | 0.04 | % | ||||||||
| * | Expenses equal to the Fund’s annualized expense ratio (interest expense incurred) multiplied by the average account value over the period, multiplied by 181/365 (to reflect the one-half year period). The Fund’s operating expenses are borne by the Adviser or its affiliates. |
| ** | Assumes 5% annual return before expenses. |
| 8 | • ALLIANCEBERNSTEIN MUNICIPAL INCOME SHARES |
Expense Example
PORTFOLIO SUMMARY
April 30, 2013 (unaudited)
PORTFOLIO STATISTICS
Net Assets ($mil): $205.3
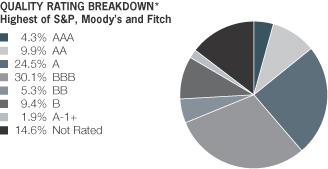
| * | All data are as of April 30, 2013. The Portfolio’s quality rating breakdown is expressed as a percentage of the Portfolio’s total investments in municipal securities and may vary over time. The Portfolio also enters into derivative transactions, which may be used for hedging or investments purposes (see “Portfolio of Investments” section of the report for additional details).The quality ratings are determined by using the Standard & Poor’s Ratings Services (“S&P”), Moody’s Investors Services, Inc.(“Moody’s”) and Fitch Ratings, Ltd.(“Fitch”). These ratings are a measure of the quality and safety of a bond or portfolio, based on the issuer’s financial condition. AAA is the highest (best) and D is the lowest (worst). If applicable, the pre-refunded category includes bonds which are secured by US Government Securities and therefore are deemed high-quality investment grade by the Adviser. If applicable, Not Applicable (N/A) includes non credit worthy investments; such as, equities, currency contracts, futures and options. If applicable, the Not Rated category includes bonds that are not rated by a Nationally Recognized Statistical Rating Organization. |
| ALLIANCEBERNSTEIN MUNICIPAL INCOME SHARES • | 9 |
Portfolio Summary
PORTFOLIO OF INVESTMENTS
April 30, 2013
| Principal Amount (000) | U.S. $ Value | |||||||
| ||||||||
MUNICIPAL OBLIGATIONS – 101.9% | ||||||||
Long-Term Municipal Bonds – 99.9% | ||||||||
Alabama – 2.3% | ||||||||
Cullman Cnty AL Hlth Care Auth | $ | 400 | $ | 438,432 | ||||
Jefferson Cnty AL LT Sch Wts | 65 | 64,361 | ||||||
Pell City AL Spl Care Fac Fin Auth | 3,600 | 4,025,562 | ||||||
Selma AL IDB | 200 | 225,020 | ||||||
|
| |||||||
| 4,753,375 | ||||||||
|
| |||||||
Alaska – 0.1% | ||||||||
Koyukuk AK Hlth Care Fac | 100 | 113,687 | ||||||
|
| |||||||
Arizona – 1.9% | ||||||||
Arizona Hlth Fac Auth | 200 | 203,052 | ||||||
5.20%, 10/01/37 | 350 | 345,691 | ||||||
Downtown Phoenix Hotel Corp. AZ FGIC | 150 | 151,778 | ||||||
Mohave Cnty AZ IDA | 100 | 127,687 | ||||||
Quechan Indian Tribe | 100 | 110,936 | ||||||
Salt Verde Fin Corp. Gas | 2,735 | 3,054,804 | ||||||
|
| |||||||
| 3,993,948 | ||||||||
|
| |||||||
California – 14.3% | ||||||||
Assn Bay Area Govt CA Non-Prof | 1,000 | 1,060,260 | ||||||
6.125%, 7/01/41 | 100 | 117,173 | ||||||
| 10 | • ALLIANCEBERNSTEIN MUNICIPAL INCOME SHARES |
Portfolio of Investments
| Principal Amount (000) | U.S. $ Value | |||||||
| ||||||||
California Ed Fac Auth | $ | 100 | $ | 109,631 | ||||
California GO | 1,005 | 1,121,962 | ||||||
California Mun Fin Auth | 85 | 100,479 | ||||||
California Mun Fin Auth | 1,025 | 1,045,941 | ||||||
California Mun Fin Auth | 765 | 780,338 | ||||||
California Poll Cntl Fin Auth | 4,400 | 4,497,064 | ||||||
California St Sch Fin Auth Edu | 750 | 789,000 | ||||||
California Statewide CDA | 530 | 569,458 | ||||||
California Statewide CDA | 100 | 104,881 | ||||||
California Statewide CDA | 100 | 116,499 | ||||||
California Statewide CDA | 140 | 158,878 | ||||||
California Statewide CDA | 750 | 810,403 | ||||||
California Statewide CDA | 100 | 100,123 | ||||||
Gilroy CA USD GO | 3,425 | 3,770,891 | ||||||
Golden St Tobacco Securitization CA | 3,245 | 2,830,516 | ||||||
| ALLIANCEBERNSTEIN MUNICIPAL INCOME SHARES • | 11 |
Portfolio of Investments
| Principal Amount (000) | U.S. $ Value | |||||||
| ||||||||
Met Wtr Dist Southern CA Wtr | $ | 5,000 | $ | 5,958,950 | ||||
Poway CA USD CFD #6 | 300 | 324,606 | ||||||
San Buenaventura CA Hosp | 100 | 122,427 | ||||||
San Diego CA Pub Fac Fin Auth | 400 | 471,220 | ||||||
San Francisco City/Cnty CA Redev CFD #6 | 1,000 | 1,070,200 | ||||||
San Jose CA Arpt | 100 | 104,450 | ||||||
Southern CA Logistics Arpt Auth Proj | 1,585 | 1,219,657 | ||||||
XLCA | 100 | 79,488 | ||||||
Tobacco Securitization Auth Southern CA | 510 | 457,521 | ||||||
Univ of California | 1,000 | 1,178,000 | ||||||
Upland CA Cmnty Redev Agy | 225 | 244,004 | ||||||
Vernon CA Elec Sys | 100 | 110,513 | ||||||
|
| |||||||
| 29,424,533 | ||||||||
|
| |||||||
Colorado – 1.4% | ||||||||
Colorado Hlth Fac Auth | 910 | 965,856 | ||||||
Park Creek Met Dist CO | 200 | 213,184 | ||||||
Plaza Met District #1 CO | 1,500 | 1,560,150 | ||||||
Regional Trnsp Dist CO | 200 | 231,430 | ||||||
|
| |||||||
| 2,970,620 | ||||||||
|
| |||||||
| 12 | • ALLIANCEBERNSTEIN MUNICIPAL INCOME SHARES |
Portfolio of Investments
| Principal Amount (000) | U.S. $ Value | |||||||
| ||||||||
Delaware – 0.7% | ||||||||
Delaware EDA | $ | 1,310 | $ | 1,405,551 | ||||
|
| |||||||
District of Columbia – 1.0% | ||||||||
District of Columbia | 400 | 438,768 | ||||||
District of Columbia | 100 | 109,935 | ||||||
District of Columbia | 1,420 | 1,475,820 | ||||||
District of Columbia | 100 | 121,087 | ||||||
|
| |||||||
| 2,145,610 | ||||||||
|
| |||||||
Florida – 6.3% | ||||||||
Alachua Cnty FL Hlth Fac Auth | 435 | 526,437 | ||||||
Alachua Cnty FL Hlth Fac Auth | 100 | 117,535 | ||||||
Atlantic Beach FL Hlth Care Fac | 1,750 | 1,857,432 | ||||||
Broward Cnty FL Arpt Sys | 2,000 | 2,228,540 | ||||||
Capital Trust Agy FL | 520 | 582,972 | ||||||
Lakeland FL ED Fac | 2,665 | 2,875,472 | ||||||
Martin Cnty FL Hlth Fac Auth | 600 | 680,754 | ||||||
Martin Cnty FL IDA | 1,000 | 1,006,690 | ||||||
| ALLIANCEBERNSTEIN MUNICIPAL INCOME SHARES • | 13 |
Portfolio of Investments
| Principal Amount (000) | U.S. $ Value | |||||||
| ||||||||
Miami Beach FL Hlth Fac Auth | $ | 1,250 | $ | 1,355,475 | ||||
6.75%, 11/15/21 | 170 | 183,235 | ||||||
Mid-Bay Brdg Auth FL | 300 | 383,358 | ||||||
Orange Cnty FL Hlth Fac Auth | 615 | 672,269 | ||||||
Palm Beach Cnty FL | 450 | 450,000 | ||||||
Palm Beach Cnty FL Hlth Fac Auth | 100 | 105,622 | ||||||
|
| |||||||
| 13,025,791 | ||||||||
|
| |||||||
Georgia – 0.1% | ||||||||
De Kalb Cnty GA Hosp Auth | 200 | 233,946 | ||||||
|
| |||||||
Hawaii – 1.0% | ||||||||
Hawaii Dept Budget & Finance | 200 | 218,184 | ||||||
5.25%, 11/15/37 | 1,655 | 1,812,126 | ||||||
|
| |||||||
| 2,030,310 | ||||||||
|
| |||||||
Idaho – 0.1% | ||||||||
Idaho Hsg & Fin Assn | ||||||||
7.00%, 2/01/36 | 200 | 225,540 | ||||||
|
| |||||||
Illinois – 4.9% | ||||||||
Chicago IL Brd of Ed GO | 4,300 | 4,678,486 | ||||||
Chicago IL HFA MFHR | 1,050 | 1,055,218 | ||||||
Chicago IL Transit Auth Fed Hwy Grant | 1,170 | 1,345,371 | ||||||
Illinois Finance Auth | 20 | 20,040 | ||||||
| 14 | • ALLIANCEBERNSTEIN MUNICIPAL INCOME SHARES |
Portfolio of Investments
| Principal Amount (000) | U.S. $ Value | |||||||
| ||||||||
Illinois Finance Auth | $ | 100 | $ | 102,913 | ||||
Illinois Finance Auth | 400 | 443,660 | ||||||
Illinois Finance Auth | 2,010 | 2,115,485 | ||||||
Illinois Finance Auth | 75 | 75,194 | ||||||
Illinois Finance Auth | 100 | 117,442 | ||||||
Illinois GO | 100 | 107,679 | ||||||
|
| |||||||
| 10,061,488 | ||||||||
|
| |||||||
Indiana – 5.2% | ||||||||
Indiana Finance Auth | 3,475 | 3,843,454 | ||||||
Indiana Finance Auth | 1,270 | 1,375,607 | ||||||
Indiana St Fin Auth | 3,500 | 3,657,525 | ||||||
Knox Cnty IN Econ Dev | 1,740 | 1,894,493 | ||||||
|
| |||||||
| 10,771,079 | ||||||||
|
| |||||||
Iowa – 0.9% | ||||||||
Iowa Finance Auth | 725 | 722,673 | ||||||
Tobacco Settlement Auth IA | ||||||||
Series 2005C | 1,155 | 1,133,678 | ||||||
|
| |||||||
| 1,856,351 | ||||||||
|
| |||||||
Kansas – 0.1% | ||||||||
Lenexa KS Hlth Care Fac | 225 | 229,718 | ||||||
|
| |||||||
| ALLIANCEBERNSTEIN MUNICIPAL INCOME SHARES • | 15 |
Portfolio of Investments
| Principal Amount (000) | U.S. $ Value | |||||||
| ||||||||
Kentucky – 0.7% | ||||||||
Kentucky Econ Dev Fin Auth | $ | 1,000 | $ | 1,029,120 | ||||
Kentucky Econ Dev Fin Auth | 200 | 235,488 | ||||||
6.375%, 6/01/40 | 100 | 119,754 | ||||||
|
| |||||||
| 1,384,362 | ||||||||
|
| |||||||
Louisiana – 1.9% | ||||||||
Jefferson Parish LA Hosp Svc Dist #2 | 940 | 1,099,790 | ||||||
Louisiana Loc Govt Envrn Fac & CDA | 400 | 472,496 | ||||||
Port New Orleans LA Brd of Com | 1,540 | 1,689,881 | ||||||
St John Baptist Parish LA | 650 | 693,615 | ||||||
|
| |||||||
| 3,955,782 | ||||||||
|
| |||||||
Maine – 1.1% | ||||||||
Maine Hlth & Hgr Ed Fac Auth | 2,000 | 2,163,800 | ||||||
|
| |||||||
Maryland – 1.9% | ||||||||
Maryland Hlth & Hgr Ed Fac Auth | 3,485 | 3,811,475 | ||||||
|
| |||||||
Massachusetts – 3.3% | ||||||||
Massachusetts Dev Fin Agy | 745 | 812,817 | ||||||
Massachusetts Sch Bldg Auth | 5,000 | 5,988,450 | ||||||
|
| |||||||
| 6,801,267 | ||||||||
|
| |||||||
| 16 | • ALLIANCEBERNSTEIN MUNICIPAL INCOME SHARES |
Portfolio of Investments
| Principal Amount (000) | U.S. $ Value | |||||||
| ||||||||
Michigan – 2.6% | ||||||||
Detroit MI City SD GO | $ | 120 | $ | 136,265 | ||||
Detroit MI Swr Disp | 400 | 439,300 | ||||||
Michigan Hosp Fin Auth | 300 | 318,947 | ||||||
Michigan Strategic Fund | 2,000 | 2,016,960 | ||||||
Tobacco Settlement Fin Corp. MI | 2,250 | 2,103,930 | ||||||
Wayne Cnty MI Arpt Auth | 300 | 323,880 | ||||||
|
| |||||||
| 5,339,282 | ||||||||
|
| |||||||
Minnesota – 0.4% | ||||||||
Duluth MN EDA | 815 | 874,691 | ||||||
|
| |||||||
Missouri – 0.1% | ||||||||
Missouri Hlth & Ed Fac Auth | 100 | 108,476 | ||||||
|
| |||||||
Nebraska – 1.1% | ||||||||
Central Plains Energy Proj Gas | 2,075 | 2,272,700 | ||||||
|
| |||||||
Nevada – 0.1% | ||||||||
Reno NV Hosp | 130 | 135,755 | ||||||
|
| |||||||
New Hampshire – 0.2% | ||||||||
New Hampshire Hlth & Ed Fac Auth | 415 | 442,286 | ||||||
|
| |||||||
| ALLIANCEBERNSTEIN MUNICIPAL INCOME SHARES • | 17 |
Portfolio of Investments
| Principal Amount (000) | U.S. $ Value | |||||||
| ||||||||
New Jersey – 3.3% | ||||||||
New Jersey EDA | $ | 2,490 | $ | 2,613,952 | ||||
7.00%, 11/15/30 | 220 | 220,777 | ||||||
New Jersey EDA | ||||||||
Series 2012A | 735 | 792,374 | ||||||
New Jersey Hlth Care Fac Fin Auth | ||||||||
5.00%, 7/01/25 | 100 | 111,231 | ||||||
Tobacco Settlement Fin Corp. NJ | ||||||||
Series 2007 1A | 3,455 | 3,060,923 | ||||||
|
| |||||||
| 6,799,257 | ||||||||
|
| |||||||
New Mexico – 0.5% | ||||||||
New Mexico Hosp Equip Loan Coun | ||||||||
5.50%, 7/01/42 | 1,060 | 1,097,704 | ||||||
|
| |||||||
New York – 9.5% | ||||||||
Build NYC Resource Corp. | ||||||||
5.00%, 8/01/42 | 900 | 999,036 | ||||||
Liberty NY Dev Corp. | ||||||||
5.25%, 10/01/35 | 1,325 | 1,577,333 | ||||||
Metropolitan Trnsp Auth NY | ||||||||
Series 2012E | 580 | 645,523 | ||||||
Series 2013A | 1,500 | 1,691,685 | ||||||
Metropolitan Trnsp Auth NY | ||||||||
5.00%, 11/15/31(b) | 190 | 221,375 | ||||||
Monroe Cnty NY IDC | ||||||||
Series 2013A | ||||||||
5.00%, 12/01/42 | 3,400 | 3,773,898 | ||||||
Nassau Cnty NY IDA | ||||||||
Series 2007A | 100 | 58,917 | ||||||
Nassau Cnty NY Local Econ Asst Corp. | ||||||||
5.00%, 7/01/37 | 300 | 324,960 | ||||||
| 18 | • ALLIANCEBERNSTEIN MUNICIPAL INCOME SHARES |
Portfolio of Investments
| Principal Amount (000) | U.S. $ Value | |||||||
| ||||||||
New York NY IDA | ||||||||
7.75%, 8/01/31 | $ | 100 | $ | 115,055 | ||||
New York St Dormitory Auth | ||||||||
Series 2012A | 1,525 | 1,823,236 | ||||||
New York St Liberty Dev Corp. | ||||||||
5.00%, 3/15/44 | 100 | 109,351 | ||||||
New York St Thruway Auth | ||||||||
Series 2012A | 500 | 590,965 | ||||||
Newburgh NY GO | ||||||||
Series A | 245 | 261,633 | ||||||
Niagara NY Dev Corp. | ||||||||
5.25%, 11/01/42 | 1,000 | 1,038,860 | ||||||
Orange Cnty NY Funding Corp. | ||||||||
6.50%, 1/01/46 | 1,125 | 1,126,474 | ||||||
Ulster Cnty NY IDA | ||||||||
5.25%, 9/15/16 | 50 | 41,439 | ||||||
Series A | 1,225 | 861,395 | ||||||
Westchester Cnty NY Local Dev Corp. | ||||||||
5.00%, 1/01/34 | 3,840 | 4,199,770 | ||||||
|
| |||||||
| 19,460,905 | ||||||||
|
| |||||||
North Carolina – 0.2% | ||||||||
North Carolina Med Care Comm | ||||||||
6.00%, 10/01/23 | 275 | 281,284 | ||||||
Series A | 100 | 101,432 | ||||||
|
| |||||||
| 382,716 | ||||||||
|
| |||||||
Ohio – 5.7% | ||||||||
Buckeye OH Tobacco Settlement Fin Auth | ||||||||
Series 2007A-2 | 3,715 | 3,292,270 | ||||||
Erie Cnty OH Hosp | ||||||||
5.25%, 8/15/46 | 1,115 | 1,174,262 | ||||||
Franklin Cnty OH Hlth Care Fac | ||||||||
5.625%, 7/01/47 | 2,300 | 2,273,964 | ||||||
| ALLIANCEBERNSTEIN MUNICIPAL INCOME SHARES • | 19 |
Portfolio of Investments
| Principal Amount (000) | U.S. $ Value | |||||||
| ||||||||
Hamilton Cnty OH Hlth Care | ||||||||
5.00%, 1/01/42 | $ | 1,030 | $ | 1,078,153 | ||||
Muskingum Cnty OH Hosp Fac | ||||||||
5.00%, 2/15/44(c) | 2,500 | 2,507,500 | ||||||
Pinnacle Cmnty Infra Fin Auth | ||||||||
Series 2004A | 1,000 | 1,012,000 | ||||||
S Estrn OH Port Auth Hosp Facs | ||||||||
6.00%, 12/01/42 | 300 | 332,472 | ||||||
|
| |||||||
| 11,670,621 | ||||||||
|
| |||||||
Oklahoma – 0.6% | ||||||||
Oklahoma Cnty OK Fin Auth | ||||||||
Series 2012A | 1,000 | 1,014,600 | ||||||
Oklahoma Dev Fin Auth | ||||||||
6.00%, 1/01/32 | 185 | 199,615 | ||||||
|
| |||||||
| 1,214,215 | ||||||||
|
| |||||||
Oregon – 0.1% | ||||||||
Salem OR Hosp Fac Auth Revenue | ||||||||
6.00%, 5/15/47 | 225 | 242,377 | ||||||
|
| |||||||
Pennsylvania – 2.2% | ||||||||
Allegheny Cnty PA Hgr Ed Bldg Auth | ||||||||
Series 2012A | ||||||||
5.00%, 9/01/35 | 230 | 253,203 | ||||||
Clairton PA Muni Auth | ||||||||
Series 2012B | ||||||||
5.00%, 12/01/37-12/01/42 | 580 | 609,176 | ||||||
Cumberland Cnty PA Mun Auth | ||||||||
5.25%, 1/01/41 | 750 | 769,890 | ||||||
6.125%, 1/01/45 | 180 | 197,312 | ||||||
Montgomery Cnty PA IDA | ||||||||
6.50%, 12/01/25 | 200 | 239,692 | ||||||
Norristown PA Area SD COP | ||||||||
5.00%, 4/01/32 | 100 | 104,680 | ||||||
North Eastern PA Hosp & ED Auth | ||||||||
Series 2012A | ||||||||
5.25%, 3/01/42 | 265 | 285,736 | ||||||
| 20 | • ALLIANCEBERNSTEIN MUNICIPAL INCOME SHARES |
Portfolio of Investments
| Principal Amount (000) | U.S. $ Value | |||||||
| ||||||||
Pennsylvania Econ Dev Fin Auth | ||||||||
Series 2012A | ||||||||
5.00%, 11/01/41 | $ | 1,620 | $ | 1,756,258 | ||||
Philadelphia Hosp & Hgr Ed Fac Auth | ||||||||
Series 2012A | ||||||||
5.625%, 7/01/42 | 270 | 292,580 | ||||||
|
| |||||||
| 4,508,527 | ||||||||
|
| |||||||
Puerto Rico – 1.9% | ||||||||
Puerto Rico Elec Pwr Auth | ||||||||
Series 2007T | ||||||||
5.00%, 7/01/37 | 1,200 | 1,167,108 | ||||||
Series 2012A | ||||||||
5.00%, 7/01/42 | 525 | 502,462 | ||||||
Puerto Rico GO | ||||||||
Series 2012A | ||||||||
5.00%, 7/01/41 | 180 | 170,123 | ||||||
5.50%, 7/01/39 | 485 | 488,080 | ||||||
Puerto Rico Ind Med & Envrn Poll Ctl Fac | ||||||||
5.375%, 4/01/42 | 335 | 340,554 | ||||||
Puerto Rico Pub Fin Corp. | ||||||||
Series B | ||||||||
6.00%, 8/01/26 | 100 | 104,889 | ||||||
Puerto Rico Sales Tax Fin Corp. | ||||||||
Series 2010C | ||||||||
5.00%, 8/01/35 | 1,000 | 1,023,720 | ||||||
|
| |||||||
| 3,796,936 | ||||||||
|
| |||||||
Rhode Island – 0.1% | ||||||||
Rhode Island Hlth & Ed Bldg Corp. | ||||||||
8.375%, 1/01/46 | 150 | 179,355 | ||||||
Tobacco Settlement Fin Corp. RI | ||||||||
6.25%, 6/01/42 | 100 | 102,364 | ||||||
|
| |||||||
| 281,719 | ||||||||
|
| |||||||
South Carolina – 0.2% | ||||||||
South Carolina St Public Svc Auth | ||||||||
AMBAC Series 2007A | ||||||||
5.00%, 1/01/32(b) | 400 | 443,944 | ||||||
|
| |||||||
South Dakota – 0.1% | ||||||||
Sioux Falls SD Hlth Fac | ||||||||
5.00%, 11/15/26 | 100 | 100,867 | ||||||
|
| |||||||
| ALLIANCEBERNSTEIN MUNICIPAL INCOME SHARES • | 21 |
Portfolio of Investments
| Principal Amount (000) | U.S. $ Value | |||||||
| ||||||||
Tennessee – 2.0% | ||||||||
Johnson City TN Hlth & Ed | $ | 2,790 | $ | 3,022,435 | ||||
5.50%, 7/01/36 | 200 | 212,292 | ||||||
Shelby Cnty TN Hlth ED & Hsg Fac Brd | 800 | 809,216 | ||||||
|
| |||||||
| 4,043,943 | ||||||||
|
| |||||||
Texas – 8.4% | ||||||||
Brazos River TX Hbr Nav Dist | 200 | 230,712 | ||||||
Central TX Regl Mobility Auth | 3,500 | 3,638,460 | ||||||
6.00%, 1/01/41 | 120 | 139,476 | ||||||
Clifton TX Hgr Ed Fac Auth | 530 | 569,029 | ||||||
Dallas Fort Worth TX Intl Arpt | 1,500 | 1,600,305 | ||||||
Gregg Cnty TX Hlth Fac Dev Corp. | 1,045 | 1,112,883 | ||||||
Houston TX Arpt Sys | 185 | 204,138 | ||||||
Houston TX Util Sys | 400 | 478,112 | ||||||
Love Field Arpt Modernization Corp. TX | 100 | 109,490 | ||||||
5.25%, 11/01/40 | 135 | 147,019 | ||||||
North Texas Ed Fin Corp. | 280 | 305,556 | ||||||
Red River TX Hlth Facs Dev Corp. | 1,040 | 1,088,766 | ||||||
Sanger TX Indl Dev | 600 | 641,622 | ||||||
| 22 | • ALLIANCEBERNSTEIN MUNICIPAL INCOME SHARES |
Portfolio of Investments
| Principal Amount (000) | U.S. $ Value | |||||||
| ||||||||
Tarrant Cnty TX Cult Ed Fac Fin Corp. | ||||||||
5.50%, 11/15/22 | $ | 200 | $ | 210,712 | ||||
Tarrant Cnty TX Cult Ed Fac Fin Corp. | ||||||||
Series 2009A | ||||||||
8.25%, 11/15/44 | 1,000 | 1,143,300 | ||||||
Texas MUN Gas ACQ & Supply Corp. III | ||||||||
5.00%, 12/15/31 | 350 | 376,250 | ||||||
Texas Private Acvty Bond Srfc Trnsp Corp. | ||||||||
7.00%, 6/30/40 | 660 | 807,919 | ||||||
Texas Private Acvty Bond Srfc Trnsp Corp. | ||||||||
6.875%, 12/31/39 | 200 | 240,574 | ||||||
Texas Trnsp Comm | ||||||||
Series 2012A | ||||||||
5.00%, 8/15/41 | 3,485 | 3,797,988 | ||||||
Travis Cnty TX Hlth Fac | ||||||||
Series A | ||||||||
7.00%, 1/01/32 | 200 | 211,364 | ||||||
Viridian Mun Mgmt Dist TX | ||||||||
9.00%, 12/01/37 | 75 | 85,899 | ||||||
|
| |||||||
| 17,139,574 | ||||||||
|
| |||||||
Utah – 0.2% | ||||||||
Timber Lakes UT Wtr Spl Svc Dist | ||||||||
8.125%, 6/15/31 | 100 | 111,852 | ||||||
Utah St Charter Sch Fin Auth | ||||||||
8.50%, 7/15/46 | 100 | 115,944 | ||||||
Utah St Charter Sch Fin Auth | ||||||||
8.25%, 7/15/46 | 100 | 113,227 | ||||||
Utah St Charter Sch Fin Auth | ||||||||
Series 2010A | ||||||||
7.00%, 7/15/45 | 100 | 113,641 | ||||||
|
| |||||||
| 454,664 | ||||||||
|
| |||||||
Vermont – 0.1% | ||||||||
Vermont EDA | 200 | 212,130 | ||||||
|
| |||||||
| ALLIANCEBERNSTEIN MUNICIPAL INCOME SHARES • | 23 |
Portfolio of Investments
| Principal Amount (000) | U.S. $ Value | |||||||
| ||||||||
Virginia – 7.4% | ||||||||
Chesapeake Trnsp Sys Toll Road | ||||||||
5.00%, 7/15/47 | $ | 300 | $ | 316,500 | ||||
Chesterfield Cnty VA EDA | 1,030 | 1,049,766 | ||||||
Fairfax Cnty VA EDA | 1,955 | 1,990,307 | ||||||
Tobacco Settlement Fin Corp. VA | 3,885 | 3,269,810 | ||||||
Virginia College Bldg Auth | 550 | 683,249 | ||||||
Virginia Small Business Fin Auth | 2,600 | 2,673,450 | ||||||
Virginia Small Business Fin Auth | 3,580 | 3,893,751 | ||||||
Virginia Trnsp Brd | 1,000 | 1,250,550 | ||||||
|
| |||||||
| 15,127,383 | ||||||||
|
| |||||||
Washington – 1.7% | ||||||||
Washington St GO | 1,000 | 1,213,330 | ||||||
Washington St HFC | 1,150 | 1,192,021 | ||||||
Washington St HFC | 1,065 | 1,071,011 | ||||||
|
| |||||||
| 3,476,362 | ||||||||
|
| |||||||
Wisconsin – 2.0% | ||||||||
Univ of Wisconsin Hosp & Clinic Auth | 3,695 | 4,165,595 | ||||||
|
| |||||||
Total Long-Term Municipal Bonds | 205,150,862 | |||||||
|
| |||||||
| 24 | • ALLIANCEBERNSTEIN MUNICIPAL INCOME SHARES |
Portfolio of Investments
| Principal Amount (000) | U.S. $ Value | |||||||
| ||||||||
Short-Term Municipal Notes – 2.0% | ||||||||
Mississippi – 2.0% | ||||||||
Mississippi Business Fin Corp. | $ | 4,000 | $ | 4,000,000 | ||||
|
| |||||||
Total Municipal Obligations | 209,150,862 | |||||||
|
| |||||||
| Notional Amount (000) | ||||||||
OPTIONS PURCHASED – PUTS – 0.5% | ||||||||
Swaptions – 0.5% | ||||||||
IRS USD RTP Swaption 3 Month USD – LIBOR | 3,000 | 108,211 | ||||||
IRS USD RTP Swaption 3 Month USD – LIBOR | 3,500 | 154,644 | ||||||
IRS USD RTP Swaption 3 Month USD – LIBOR | 4,000 | 219,015 | ||||||
IRS USD RTP Swaption 3 Month USD – LIBOR | 3,500 | 254,031 | ||||||
IRS USD RTP Swaption 3 Month USD – LIBOR | 3,500 | 263,105 | ||||||
|
| |||||||
Total Options Purchased-Puts | 999,006 | |||||||
|
| |||||||
| Shares | ||||||||
SHORT-TERM INVESTMENTS – 1.5% | ||||||||
Investment Companies – 1.5% | ||||||||
AllianceBernstein Fixed-Income Shares, Inc. – Government STIF Portfolio, 0.09%(f) | 3,061,754 | 3,061,754 | ||||||
|
| |||||||
Total Investments – 103.9% | $ | 213,211,622 | ||||||
Other assets less liabilities – (3.9)% | (7,953,833 | ) | ||||||
|
| |||||||
Net Assets – 100.0% | $ | 205,257,789 | ||||||
|
| |||||||
| ALLIANCEBERNSTEIN MUNICIPAL INCOME SHARES • | 25 |
Portfolio of Investments
| CREDIT DEFAULT SWAP CONTRACTS (see Note C) |
Swap Counterparty & Referenced Obligation | Fixed Rate (Pay) Receive | Implied Credit Spread at April 30, 2013 | Notional Amount (000) | Market Value | Upfront Premiums Paid (Received) | Unrealized Appreciation/ (Depreciation) | ||||||||||||||||||
Sales Contracts | ||||||||||||||||||||||||
Citibank, NA: | ||||||||||||||||||||||||
CDX-NAHY Series 18, 5 Year Index, 6/20/17* | 5.00 | % | 2.86 | % | $ | 1,980 | $ | 171,187 | $ | (77,140 | ) | $ | 248,327 | |||||||||||
| * | Termination date |
| (a) | Security is exempt from registration under Rule 144A of the Securities Act of 1933. These securities are considered liquid and may be resold in transactions exempt from registration, normally to qualified institutional buyers. At April 30, 2013, the aggregate market value of these securities amounted to $655,004 or 0.3% of net assets. |
| (b) | Security represents the underlying municipal obligation of an inverse floating rate obligation held by the Fund (see Note G). |
| (c) | When-Issued or delayed delivery security. |
| (d) | Variable Rate Demand Notes are instruments whose interest rates change on a specific date (such as coupon date or interest payment date) or whose interest rates vary with changes in a designated base rate (such as the prime interest rate). This instrument is payable on demand and is secured by letters of credit or other credit support agreements from major banks. |
| (e) | Non-income producing security. |
| (f) | Investment in affiliated money market mutual fund. The rate shown represents the 7-day yield as of period end. |
As of April 30, 2013, the Portfolio held 0.5% of net assets in insured bonds (of this amount 0.0% represents the Portfolio’s holding in pre-refunded or escrowed to maturity bonds).
Glossary:
AMBAC – Ambac Assurance Corporation
CDA – Community Development Authority
CFD – Community Facilities District
COP – Certificate of Participation
EDA – Economic Development Agency
FGIC – Financial Guaranty Insurance Company
GO – General Obligation
HFA – Housing Finance Authority
HFC – Housing Finance Corporation
IDA – Industrial Development Authority/Agency
IDB – Industrial Development Board
IDC – Industrial Development Corporation
IRS – Interest Rate Swap
LIBOR – London Interbank Offered Rates
MFHR – Multi-Family Housing Revenue
NPFGC-RE – National Public Finance Guarantee Corporation Reinsuring FGIC
RTP – Real Time Pricing
SD – School District
USD – Unified School District
XLCA – XL Capital Assurance Inc.
See notes to financial statements.
| 26 | • ALLIANCEBERNSTEIN MUNICIPAL INCOME SHARES |
Portfolio of Investments
STATEMENT OF ASSETS & LIABILITIES
April 30, 2013
| Assets | ||||
Investments in securities, at value | ||||
Unaffiliated issuers (cost $206,288,699) | $ | 210,149,868 | ||
Affiliated issuers (cost $3,061,754) | 3,061,754 | (a) | ||
Interest and dividends receivable | 2,889,156 | |||
Receivable for shares of beneficial interest sold | 2,731,769 | |||
Unrealized appreciation on credit default swap contracts | 248,327 | |||
Receivable for investment securities sold | 15,432 | |||
|
| |||
Total assets | 219,096,306 | |||
|
| |||
| Liabilities | ||||
Payable for investment securities purchased | 7,699,621 | |||
Payable for floating rate notes issued* | 4,685,000 | |||
Dividends payable | 696,967 | |||
Collateral received from broker | 580,000 | |||
Payable for shares of beneficial interest redeemed | 95,729 | |||
Premium received on credit default swap contracts | 77,140 | |||
Interest payable | 4,060 | |||
|
| |||
Total liabilities | 13,838,517 | |||
|
| |||
Net Assets | $ | 205,257,789 | ||
|
| |||
| Composition of Net Assets | ||||
Shares of beneficial interest, at par | $ | 183 | ||
Additional paid-in capital | 201,198,838 | |||
Distributions in excess of net investment income | (11,550 | ) | ||
Accumulated net realized loss on investment transactions | (39,178 | ) | ||
Net unrealized appreciation on investments | 4,109,496 | |||
|
| |||
| $ | 205,257,789 | |||
|
| |||
Net Asset Value Per Share — unlimited shares of beneficial interest authorized, $.00001 par value (based on 18,287,861 common shares outstanding) | $ | 11.22 | ||
|
|
| (a) | Includes investment of cash collateral of $580,000 received from broker for OTC derivatives. |
| * | Represents short-term floating rate certificates issued by tender option bond trusts (see Note G). |
See notes to financial statements.
| ALLIANCEBERNSTEIN MUNICIPAL INCOME SHARES • | 27 |
Statement of Assets & Liabilities
STATEMENT OF OPERATIONS
Year Ended April 30, 2013
| Investment Income | ||||||||
Interest | $ | 3,839,350 | ||||||
Dividends—Affiliated issuers | 2,452 | $ | 3,841,802 | |||||
|
| |||||||
| Expenses | ||||||||
Interest expense | 29,723 | |||||||
|
| |||||||
Total expenses | 29,723 | |||||||
|
| |||||||
Net investment income | 3,812,079 | |||||||
|
| |||||||
| Realized and Unrealized Gain on Investment Transactions | ||||||||
Net realized gain on: | ||||||||
Investment transactions | 153,494 | |||||||
Swap contracts | 88,548 | |||||||
Net change in unrealized appreciation/depreciation of: | ||||||||
Investments | 3,027,986 | |||||||
Swap contracts | 248,327 | |||||||
|
| |||||||
Net gain on investment transactions | 3,518,355 | |||||||
|
| |||||||
Net Increase in Net Assets from Operations | $ | 7,330,434 | ||||||
|
|
See notes to financial statements.
| 28 | • ALLIANCEBERNSTEIN MUNICIPAL INCOME SHARES |
Statement of Operations
STATEMENT OF CHANGES IN NET ASSETS
| Year Ended April 30, 2013 | Year Ended April 30, 2012 | |||||||
| Increase (Decrease) in Net Assets from Operations | ||||||||
Net investment income | $ | 3,812,079 | $ | 668,198 | ||||
Net realized gain (loss) on investment transactions | 242,042 | (62,369 | ) | |||||
Net change in unrealized appreciation/depreciation of investments | 3,276,313 | 1,476,618 | ||||||
|
|
|
| |||||
Net increase in net assets from operations | 7,330,434 | 2,082,447 | ||||||
Dividends to Shareholders from | ||||||||
Net investment income | (3,912,177 | ) | (668,198 | ) | ||||
| Transactions in Shares of Beneficial Interest | ||||||||
Net increase | 184,233,881 | 6,772,872 | ||||||
|
|
|
| |||||
Total increase | 187,652,138 | 8,187,121 | ||||||
Net Assets | ||||||||
Beginning of period | 17,605,651 | 9,418,530 | ||||||
|
|
|
| |||||
End of period (including distributions in excess of net investment income of ($11,550) and $0, respectively) | $ | 205,257,789 | $ | 17,605,651 | ||||
|
|
|
| |||||
See notes to financial statements.
| ALLIANCEBERNSTEIN MUNICIPAL INCOME SHARES • | 29 |
Statement of Changes in Net Assets
STATEMENT OF CASH FLOWS*
Year Ended April 30, 2013
| Increase (Decrease) in Cash from Operating Activities: | ||||||||
Interest and dividends received | $ | 1,651,698 | ||||||
Interest expense paid | (27,060 | ) | ||||||
Purchases of long-term investments | (186,246,188 | ) | ||||||
Proceeds from disposition of long-term investments | 5,942,611 | |||||||
Purchases of short-term investments, net | (4,932,959 | ) | ||||||
Proceeds from swap contracts, net | 745,688 | |||||||
|
| |||||||
Net decrease in cash from operating activities | $ | (182,866,210 | ) | |||||
| Financing Activities: | ||||||||
Cash dividends paid | (3,233,079 | ) | ||||||
Subscriptions of beneficial interest, net | 182,699,289 | |||||||
Increase in payable for floating rate notes issued | 3,400,000 | |||||||
Net increase in cash from financing activities | 182,866,210 | |||||||
|
| |||||||
Net increase in cash | – 0 | – | ||||||
Cash at beginning of period | – 0 | – | ||||||
|
| |||||||
Cash at end of period | $ | – 0 | – | |||||
|
| |||||||
| Reconciliation of Net Increase in Net Assets from Operations to Net Decrease in Cash from Operating Activities: | ||||||||
Net increase in net assets from operations | $ | 7,330,434 | ||||||
| Adjustments: | ||||||||
Decrease in interest and dividends receivable | $ | (2,609,488 | ) | |||||
Net accretion of bond discount and amortization of bond premium | 419,384 | |||||||
Decrease in interest payable | 2,663 | |||||||
Purchases of long-term investments | (186,246,188 | ) | ||||||
Proceeds from disposition of long-term investments | 5,942,611 | |||||||
Purchases of short-term investments, net | (4,932,959 | ) | ||||||
Proceeds on swap contracts, net | 745,688 | |||||||
Net realized gain on investment transactions | (242,042 | ) | ||||||
Net change in unrealized appreciation/depreciation of investments | (3,276,313 | ) | ||||||
|
| |||||||
Total adjustments | (190,196,644 | ) | ||||||
|
| |||||||
Net decrease in cash from operating activities | $ | (182,866,210 | ) | |||||
|
|
| * | In accordance with U.S. GAAP, the Portfolio has included a Statement of Cash Flows as a result of its substantial investment in Level 3 securities throughout the period. |
See notes to financial statements.
| 30 | • ALLIANCEBERNSTEIN MUNICIPAL INCOME SHARES |
Statement of Cash Flows
NOTES TO FINANCIAL STATEMENTS
April 30, 2013
NOTE A
Significant Accounting Policies
AllianceBernstein Corporate Shares (the “Trust”) was organized as a Massachusetts business trust under the laws of The Commonwealth of Massachusetts by an Agreement and Declaration of Trust (“Declaration of Trust”) dated January 26, 2004. The Trust is registered under the Investment Company Act of 1940, as an open-end, diversified management investment company. The Trust operates as a “series” company currently offering four separate portfolios: AllianceBernstein Corporate Income Shares, AllianceBernstein Municipal Income Shares (the “Portfolio”), AllianceBernstein Taxable Multi-Sector Income Shares and AllianceBernstein Tax-Aware Real Return Income Shares. AllianceBernstein Tax-Aware Real Return Income Shares commenced operations on May 2, 2011. Each Portfolio is considered to be a separate entity for financial reporting and tax purposes. This report relates only to AllianceBernstein Municipal Income Shares.
Shares of the Portfolio are offered exclusively to holders of accounts established under wrap-fee programs sponsored and maintained by certain registered investment advisers approved by AllianceBernstein L.P. (the “Adviser”). The Portfolio’s shares may be purchased at the relevant net asset value without a sales charge or other fee. The financial statements have been prepared in conformity with U.S. generally accepted accounting principles (“U.S. GAAP”) which require management to make certain estimates and assumptions that affect the reported amounts of assets and liabilities in the financial statements and amounts of income and expenses during the reporting period. Actual results could differ from those estimates. The following is a summary of significant accounting policies followed by the Portfolio.
1. Security Valuation
Portfolio securities are valued at their current market value determined on the basis of market quotations or, if market quotations are not readily available or are deemed unreliable, at “fair value” as determined in accordance with procedures established by and under the general supervision of the Trust’s Board of Trustees (the “Board”).
In general, the market value of securities which are readily available and deemed reliable are determined as follows: Securities listed on a national securities exchange (other than securities listed on the NASDAQ Stock Market, Inc. (“NASDAQ”)) or on a foreign securities exchange are valued at the last sale price at the close of the exchange or foreign securities exchange. If there has been no sale on such day, the securities are valued at the last traded price from the previous day. Securities listed on more than one exchange are valued by reference to the principal exchange on which the securities are traded; securities listed only on NASDAQ are valued in accordance with the NASDAQ Official Closing Price; listed or over the counter (“OTC”) market put or call options are valued at the mid level between the current bid and ask prices. If either a current
| ALLIANCEBERNSTEIN MUNICIPAL INCOME SHARES • | 31 |
Notes to Financial Statements
bid or current ask price is unavailable, the Adviser will have discretion to determine the best valuation (e.g. last trade price in the case of listed options); open futures contracts are valued using the closing settlement price or, in the absence of such a price, the most recent quoted bid price. If there are no quotations available for the day of valuation, the last available closing settlement price is used; U.S. government securities and other debt instruments having 60 days or less remaining until maturity are valued at amortized cost if their original maturity was 60 days or less; or by amortizing their fair value as of the 61st day prior to maturity if their original term to maturity exceeded 60 days; fixed-income securities, including mortgage backed and asset backed securities, may be valued on the basis of prices provided by a pricing service or at a price obtained from one or more of the major broker/dealers. In cases where broker/dealer quotes are obtained, the Adviser may establish procedures whereby changes in market yields or spreads are used to adjust, on a daily basis, a recently obtained quoted price on a security. Swaps and other derivatives are valued daily, primarily using independent pricing services, independent pricing models using market inputs, as well as third party broker-dealers or counterparties. Investments in money market funds are valued at their net asset value each day.
Securities for which market quotations are not readily available (including restricted securities) or are deemed unreliable are valued at fair value. Factors considered in making this determination may include, but are not limited to, information obtained by contacting the issuer, analysts, analysis of the issuer’s financial statements or other available documents. In addition, the Portfolio may use fair value pricing for securities primarily traded in non-U.S. markets because most foreign markets close well before the Portfolio values its securities at 4:00 p.m., Eastern Time. The earlier close of these foreign markets gives rise to the possibility that significant events, including broad market moves, may have occurred in the interim and may materially affect the value of those securities.
2. Fair Value Measurements
In accordance with U.S. GAAP regarding fair value measurements, fair value is defined as the price that the Portfolio would receive to sell an asset or pay to transfer a liability in an orderly transaction between market participants at the measurement date. U.S. GAAP establishes a framework for measuring fair value, and a three-level hierarchy for fair value measurements based upon the transparency of inputs to the valuation of an asset or liability (including those valued based on their market values as described in Note 1 above). Inputs may be observable or unobservable and refer broadly to the assumptions that market participants would use in pricing the asset or liability. Observable inputs reflect the assumptions market participants would use in pricing the asset or liability based on market data obtained from sources independent of the Portfolio. Unobservable inputs reflect the Portfolio’s own assumptions about the assumptions that market participants would use in pricing the asset or liability based on the best information available in the circumstances. Each investment is assigned a
| 32 | • ALLIANCEBERNSTEIN MUNICIPAL INCOME SHARES |
Notes to Financial Statements
level based upon the observability of the inputs which are significant to the overall valuation. The three-tier hierarchy of inputs is summarized below.
| • | Level 1—quoted prices in active markets for identical investments |
| • | Level 2—other significant observable inputs (including quoted prices for similar investments, interest rates, prepayment speeds, credit risk, etc.) |
| • | Level 3—significant unobservable inputs (including the Portfolio’s own assumptions in determining the fair value of investments) |
The fair value of debt instruments, such as bonds, and over-the-counter derivatives is generally based on market price quotations, recently executed market transactions (where observable) or industry recognized modeling techniques and are generally classified as Level 2. Pricing vendor inputs to Level 2 valuations may include quoted prices for similar investments in active markets, interest rate curves, coupon rates, currency rates, yield curves, option adjusted spreads, default rates, credit spreads and other unique security features in order to estimate the relevant cash flows which is then discounted to calculate fair values. If these inputs are unobservable and significant to the fair value, these investments will be classified as Level 3. In addition, non-agency rated investments are classified as Level 3.
Options and warrants are valued using market-based inputs to models, broker or dealer quotations, or alternative pricing sources with reasonable levels of price transparency, where such inputs and models are available. Alternatively the values may be obtained through unobservable management determined inputs and/or management’s proprietary models. Where models are used, the selection of a particular model to value an option or a warrant depends upon the contractual terms of, and specific risks inherent in, the option or warrant as well as the availability of pricing information in the market. Valuation models require a variety of inputs, including contractual terms, market prices, measures of volatility and correlations of such inputs. Exchange traded options will be classified as Level 2. For options or warrants that do not trade on exchange but trade in liquid markets, inputs can generally be verified and model selection does not involve significant management judgment. Options and warrants are classified within Level 2 on the fair value hierarchy when all of the significant inputs can be corroborated to market evidence. Otherwise such instruments are classified as Level 3.
Other fixed income investments, including non-U.S. government and corporate debt, are generally valued using quoted market prices, if available, which are typically impacted by current interest rates, maturity dates and any perceived credit risk of the issuer. Additionally, in the absence of quoted market prices, these inputs are used by pricing vendors to derive a valuation based upon industry or proprietary models which incorporate issuer specific data with relevant yield/spread comparisons with more widely quoted bonds with similar key characteristics. Those investments for which there are observable inputs are classified as Level 2. Where the inputs are not observable, the investments are classified as Level 3.
| ALLIANCEBERNSTEIN MUNICIPAL INCOME SHARES • | 33 |
Notes to Financial Statements
The following table summarizes the valuation of the Portfolio’s investments by the above fair value hierarchy levels as of April 30, 2013:
Investments in Securities: | Level 1 | Level 2 | Level 3 | Total | ||||||||||||
Assets: | ||||||||||||||||
Long-Term Municipal Bonds | $ | – 0 | – | $ | 174,561,225 | $ | 30,589,637 | $ | 205,150,862 | |||||||
Short-Term Municipal Notes | – 0 | – | 4,000,000 | – 0 | – | 4,000,000 | ||||||||||
Options Purchased—Puts | – 0 | – | 999,006 | – 0 | – | 999,006 | ||||||||||
Short-Term Investments | 3,061,754 | – 0 | – | – 0 | – | 3,061,754 | ||||||||||
|
|
|
|
|
|
|
| |||||||||
Total Investments in Securities | 3,061,754 | 179,560,231 | 30,589,637 | 213,211,622 | ||||||||||||
Other Financial Instruments*: | ||||||||||||||||
Assets: | ||||||||||||||||
Credit Default Swap Contracts | – 0 | – | 248,327 | – 0 | – | 248,327 | ||||||||||
Liabilities | – 0 | – | – 0 | – | – 0 | – | – 0 | – | ||||||||
|
|
|
|
|
|
|
| |||||||||
Total^ | $ | 3,061,754 | $ | 179,808,558 | $ | 30,589,637 | $ | 213,459,949 | ||||||||
|
|
|
|
|
|
|
| |||||||||
| * | Other financial instruments are derivative instruments, such as futures, forwards and swap contracts, which are valued at the unrealized appreciation/depreciation on the instrument. |
| ^ | There were no transfers between Level 1 and Level 2 during the reporting period. |
The Portfolio recognizes all transfers between levels of the fair value hierarchy assuming the financial instruments were transferred at the beginning of the reporting period.
The following is a reconciliation of investments in which significant unobservable inputs (Level 3) were used in determining fair value.
| Long-Term Municipal Bonds | Total | |||||||
Balance as of 4/30/12 | $ | 2,764,044 | $ | 2,764,044 | ||||
Accrued discounts/(premiums) | (3,478 | ) | (3,478 | ) | ||||
Realized gain (loss) | 44,758 | 44,758 | ||||||
Change in unrealized appreciation/depreciation | 915,132 | 915,132 | ||||||
Purchases | 27,527,577 | 27,527,577 | ||||||
Sales | (550,186 | ) | (550,186 | ) | ||||
Transfers in to Level 3 | – 0 | – | – 0 | – | ||||
Transfers out of Level 3 | (108,210 | ) | (108,210 | ) | ||||
|
|
|
| |||||
Balance as of 4/30/13+ | $ | 30,589,637 | $ | 30,589,637 | ||||
|
|
|
| |||||
Net change in unrealized appreciation/depreciation from Investments held as of 4/30/13* | $ | 927,756 | $ | 927,756 | ||||
|
|
|
| |||||
| + | There were de minimis transfers under 1% of net assets during the reporting period. |
| * | The unrealized appreciation/depreciation is included in net change in unrealized appreciation/depreciation of investments in the accompanying statement of operations. |
| 34 | • ALLIANCEBERNSTEIN MUNICIPAL INCOME SHARES |
Notes to Financial Statements
The following presents information about significant unobservable inputs related to the Portfolio with material categories of Level 3 investments at April 30, 2013:
Quantitative Information about Level 3 Fair Value Measurements | ||||||||||||
| Fair Value at 4/30/13 | Valuation Technique | Unobservable Input | Range/ Weighted Average | |||||||||
| Long-Term Municipal Bonds | $ | 30,589,637 |
| Third Party Vendor | Evaluated Quotes |
| $58.92-$121.02/ |
| ||||
| $101.97 | ||||||||||||
The Adviser has established a Valuation Committee (the “Committee”) which is responsible for overseeing the pricing and valuation of all securities held in the Portfolio. The Committee operates under pricing and valuation policies and procedures established by the Adviser and approved by the Board, including pricing policies which set forth the mechanisms and processes to be employed on a daily basis to implement these policies and procedures. In particular, the pricing policies describe how to determine market quotations for securities and other instruments. The Committee’s responsibilities include: 1) fair value and liquidity determinations (and oversight of any third parties to whom any responsibility for fair value and liquidity determinations is delegated), and 2) regular monitoring of the Adviser’s pricing and valuation policies and procedures and modification or enhancement of these policies and procedures (or recommendation of the modification of these policies and procedures) as the Committee believes appropriate.
The Committee is also responsible for monitoring the implementation of the pricing policies by the Adviser’s Pricing Group (the “Pricing Group”) and a third party which performs certain pricing functions in accordance with the pricing policies. The Pricing Group is responsible for the oversight of the third party on a day-to-day basis. The Committee and the Pricing Group perform a series of activities to provide reasonable assurance of the accuracy of prices including: 1) periodic vendor due diligence meetings, review of methodologies, new developments and process at vendors, 2) daily compare of security valuation versus prior day for all securities that exceeded established thresholds, and 3) daily review of unpriced, stale, and variance reports with exceptions reviewed by senior management and the Committee.
In addition, several processes outside of the pricing process are used to monitor valuation issues including: 1) performance and performance attribution reports are monitored for anomalous impacts based upon benchmark performance, and 2) portfolio managers review all portfolios for performance and analytics (which are generated using the Adviser’s prices).
3. Taxes
It is the Portfolio’s policy to meet the requirements of the Internal Revenue Code applicable to regulated investment companies and to distribute all of its
| ALLIANCEBERNSTEIN MUNICIPAL INCOME SHARES • | 35 |
Notes to Financial Statements
investment company taxable income and net realized gains, if any, to shareholders. Therefore, no provisions for federal income or excise taxes are required.
In accordance with U.S. GAAP requirements regarding accounting for uncertainties in income taxes, management has analyzed the Portfolio’s tax positions taken or expected to be taken on federal and state income tax returns for all open tax years (all years since inception of the Portfolio) and has concluded that no provision for income tax is required in the Portfolio’s financial statements.
4. Investment Income and Investment Transactions
Dividend income is recorded on the ex-dividend date or as soon as the Portfolio is informed of the dividend. Interest income is accrued daily. Investment transactions are accounted for on the date the securities are purchased or sold. Investment gains or losses are determined on the identified cost basis. The Portfolio amortizes premiums and accretes discounts as adjustments to interest income.
5. Dividends and Distributions
Dividends and distributions to shareholders, if any, are recorded on the ex-dividend date. Income dividends and capital gains distributions are determined in accordance with federal tax regulations and may differ from those determined in accordance with U.S. GAAP. To the extent these differences are permanent, such amounts are reclassified within the capital accounts based on their federal tax basis treatment; temporary differences do not require such reclassification.
NOTE B
Advisory Fee and Other Transactions with Affiliates
Under the terms of the Advisory Agreement, the Portfolio pays no advisory fee to the Adviser and the Adviser reimburses or pays for the Portfolio’s operating expenses. The Portfolio is an integral part of separately managed accounts in wrap-fee programs. Typically, participants in these programs pay a fee to their investment adviser for all costs and expenses of a separately managed account, including costs and expenses associated with the Portfolio, and a fee paid by their investment adviser to the Adviser. The Adviser serves as investment manager and adviser of the Portfolio and continuously furnishes an investment program for the Portfolio and manages, supervises and conducts the affairs of the Portfolio, subject to the supervisions of the Portfolio’s Board. The Advisory Agreement provides that the Adviser or an affiliate will furnish, or pay the expenses of the Portfolio for, office space, facilities and equipment, services of executive and other personnel of the Portfolio and certain administrative services.
The Portfolio has entered into a Distribution Agreement with AllianceBernstein Investments, Inc., the Portfolio’s principal underwriter (the “Underwriter”), to permit the Underwriter to distribute the Portfolio’s shares, which are sold at their net asset value without any sales charge. The Portfolio does not pay a fee for this service. The Underwriter is a wholly owned subsidiary of the Adviser.
| 36 | • ALLIANCEBERNSTEIN MUNICIPAL INCOME SHARES |
Notes to Financial Statements
AllianceBernstein Investor Services, Inc. (“ABIS”), a wholly-owned subsidiary of the Adviser, acts as the Portfolio’s registrar, transfer agent and dividend-disbursing agent. ABIS registers the transfer, issuance and redemption of Portfolio shares and disburses dividends and other distributions to Portfolio shareholders. The Portfolio does not pay a fee for this service.
The Portfolio may invest in the AllianceBernstein Fixed-Income Shares, Inc. — Government STIF Portfolio (“Government STIF Portfolio”), an open-end management investment company managed by the Adviser. The Government STIF Portfolio is offered as a cash management option to mutual funds and other institutional accounts of the Adviser, and is not available for direct purchase by members of the public. The Government STIF Portfolio pays no investment management fees but does bear its own expenses. A summary of the Portfolio’s transactions in shares of the Government STIF Portfolio for the year ended April 30, 2013 is as follows:
Market Value April 30, 2012 (000) | Purchases at Cost (000) | Sales Proceeds (000) | Market Value April 30, 2013 (000) | Dividend Income (000) | ||||||||||||
| $ 329 | $ | 131,981 | $ | 129,248 | $ | 3,062 | $ | 2 | ||||||||
NOTE C
Investment Transactions
Purchases and sales of investment securities (excluding short-term investments) for the year ended April 30, 2013 were as follows:
| Purchases | Sales | |||||||
Investment securities (excluding | $ | 192,684,163 | $ | 5,986,573 | ||||
U.S. government securities | – 0 | – | – 0 | – | ||||
The cost of investments for federal income tax purposes, gross unrealized appreciation and unrealized depreciation are as follows:
Cost | $ | 204,728,140 | ||
|
| |||
Gross unrealized appreciation | $ | 4,744,695 | ||
Gross unrealized depreciation | (950,273 | ) | ||
|
| |||
Net unrealized appreciation | $ | 3,794,422 | ||
|
|
1. Derivative Financial Instruments
The Portfolio may use derivatives in an effort to earn income and enhance returns, to replace more traditional direct investments, to obtain exposure to otherwise inaccessible markets (collectively, “investment purposes”), or to hedge or adjust the risk profile of its portfolio.
| ALLIANCEBERNSTEIN MUNICIPAL INCOME SHARES • | 37 |
Notes to Financial Statements
The principal types of derivatives utilized by the Portfolio, as well as the methods in which they may be used are:
| • | Option Transactions |
For hedging and investment purposes, the Portfolio may purchase and write (sell) put and call options on U.S. and foreign government securities and foreign currencies that are traded on U.S. and foreign securities exchanges and over-the-counter markets.
The risk associated with purchasing an option is that the Portfolio pays a premium whether or not the option is exercised. Additionally, the Portfolio bears the risk of loss of the premium and change in market value should the counterparty not perform under the contract. Put and call options purchased are accounted for in the same manner as portfolio securities. The cost of securities acquired through the exercise of call options is increased by premiums paid. The proceeds from securities sold through the exercise of put options are decreased by the premiums paid.
When the Portfolio writes an option, the premium received by the Portfolio is recorded as a liability and is subsequently adjusted to the current market value of the option written. Premiums received from written options which expire unexercised are recorded by the Portfolio on the expiration date as realized gains from options written. The difference between the premium received and the amount paid on effecting a closing purchase transaction, including brokerage commissions, is also treated as a realized gain, or if the premium received is less than the amount paid for the closing purchase transaction, as a realized loss. If a call option is exercised, the premium received is added to the proceeds from the sale of the underlying security or currency in determining whether the Portfolio has realized a gain or loss. If a put option is exercised, the premium received reduces the cost basis of the security or currency purchased by the Portfolio. In writing an option, the Portfolio bears the market risk of an unfavorable change in the price of the security or currency underlying the written option. Exercise of an option written by the Portfolio could result in the Portfolio selling or buying a security or currency at a price different from the current market value.
For the year ended April 30, 2013, the Portfolio had no transactions in written options.
During the year ended April 30, 2013, the Portfolio held purchased options for hedging purposes.
| • | Swap Agreements |
The Portfolio may enter into swaps to hedge its exposure to interest rates, credit risk, or currencies. The Portfolio may also enter into swaps for non-hedging purposes as a means of gaining market exposures, including by making direct investments in foreign currencies. A swap is an agreement
| 38 | • ALLIANCEBERNSTEIN MUNICIPAL INCOME SHARES |
Notes to Financial Statements
that obligates two parties to exchange a series of cash flows at specified intervals based upon or calculated by reference to changes in specified prices or rates for a specified amount of an underlying asset. The payment flows are usually netted against each other, with the difference being paid by one party to the other. In addition, collateral may be pledged or received by the Portfolio in accordance with the terms of the respective swap agreements to provide value and recourse to the Portfolio or its counterparties in the event of default, bankruptcy or insolvency by one of the parties to the swap agreement.
Risks may arise as a result of the failure of the counterparty to the swap contract to comply with the terms of the swap contract. The loss incurred by the failure of a counterparty is generally limited to the net interim payment to be received by the Portfolio, and/or the termination value at the end of the contract. Therefore, the Portfolio considers the creditworthiness of each counterparty to a swap contract in evaluating potential counterparty risk. This risk is mitigated by having a netting arrangement between the Portfolio and the counterparty and by the posting of collateral by the counterparty to the Portfolio to cover the Portfolio’s exposure to the counterparty. Additionally, risks may arise from unanticipated movements in interest rates or in the value of the underlying securities. The Portfolio accrues for the interim payments on swap contracts on a daily basis, with the net amount recorded within unrealized appreciation/depreciation of swap contracts on the statement of assets and liabilities, where applicable. Once the interim payments are settled in cash, the net amount is recorded as realized gain/(loss) on swaps on the statement of operations, in addition to any realized gain/(loss) recorded upon the termination of swap contracts. Upfront premiums paid or received are recognized as cost or proceeds on the statement of assets and liabilities and are amortized on a straight line basis over the life of the contract. Amortized upfront premiums are included in net realized gain/(loss) from swaps on the statement of operations. Fluctuations in the value of swap contracts are recorded as a component of net change in unrealized appreciation/depreciation of swap contracts on the statement of operations.
Credit Default Swaps:
The Portfolio may enter into credit default swaps, including to manage its exposure to the market or certain sectors of the market, to reduce its risk exposure to defaults by corporate and sovereign issuers held by the Portfolio, or to create exposure to corporate or sovereign issuers to which it is not otherwise exposed. The Portfolio may purchase credit protection (“Buy Contract”) or provide credit protection (“Sale Contract”) on the referenced obligation of the credit default swap. During the term of the swap agreement, the Portfolio receives/(pays) fixed payments from/(to) the respective counterparty, calculated at the agreed upon rate applied to the notional amount. If the Portfolio is a buyer/(seller) of protection and a
| ALLIANCEBERNSTEIN MUNICIPAL INCOME SHARES • | 39 |
Notes to Financial Statements
credit event occurs, as defined under the terms of the swap agreement, the Portfolio will either (i) receive from the seller/(pay to the buyer) of protection an amount equal to the notional amount of the swap contract (the “Maximum Payout Amount”) and deliver/(take delivery of) the referenced obligation or (ii) receive/(pay) a net settlement amount in the form of cash or securities equal to the notional amount of the swap less the recovery value of the referenced obligation.
Credit default swaps may involve greater risks than if a Portfolio had invested in the referenced obligation directly. Credit default swaps are subject to general market risk, liquidity risk, counterparty risk and credit risk. If the Portfolio is a buyer of protection and no credit event occurs, it will lose the payments it made to its counterparty. If the Portfolio is a seller of protection and a credit event occurs, the value of the referenced obligation received by the Portfolio coupled with the periodic payments previously received, may be less than the Maximum Payout Amount it pays to the buyer, resulting in a net loss to the Portfolio.
During the year ended April 30, 2013, the Portfolio held credit default swaps for hedging purposes.
Implied credit spreads utilized in determining the market value of credit default swaps on issuers as of period end are disclosed in the portfolio of investments. The implied spreads serve as an indicator of the current status of the payment/performance risk and typically reflect the likelihood of default by the issuer of the referenced obligation. The implied credit spread of a particular reference obligation also reflects the cost of buying/selling protection and may reflect upfront payments required to be made to enter into the agreement. Widening credit spreads typically represent a deterioration of the referenced obligation’s credit soundness and greater likelihood of default or other credit event occurring as defined under the terms of the agreement. A credit spread identified as “Defaulted” indicates a credit event has occurred for the referenced obligation.
At April 30, 2013, the Portfolio had a Sale Contract outstanding with a Maximum Payout Amount of $1,980,000 with net unrealized appreciation of $248,327, and a term of less than 5 years, as reflected in the portfolio of investments.
In certain circumstances Maximum Payout Amounts may be partially offset by recovery values of the respective referenced obligations, upfront premium received upon entering into the agreement, or net amounts received from settlement of buy protection credit default swap agreements entered into by the Portfolio for the same reference obligation with the same counterparty.
Documentation governing the Portfolio’s OTC derivatives may contain provisions for early termination of such transaction in the event the net assets
| 40 | • ALLIANCEBERNSTEIN MUNICIPAL INCOME SHARES |
Notes to Financial Statements
of the Portfolio decline below specific levels set forth in the documentation (“net asset contingent features”). If these levels are triggered, the Portfolio’s counterparty has the right to terminate such transaction and require the Portfolio to pay or receive a settlement amount in connection with the terminated transaction. As of April 30, 2013, the Portfolio had no OTC derivatives with contingent features in net liability positions.
At April 30, 2013, the Portfolio had entered into the following derivatives:
Asset Derivatives | Liability Derivatives | |||||||||
| Derivative Type | Statement of Assets and Liabilities Location | Fair Value | Statement of Assets and Liabilities Location | Fair Value | ||||||
Credit contracts | Unrealized appreciation on credit default swap contracts | $ | 248,327 | |||||||
Interest rate contracts | Investments in securities, at value | 999,006 | ||||||||
|
| |||||||||
Total | $ | 1,247,333 | ||||||||
|
| |||||||||
The effect of derivative instruments on the statement of operations for the year ended April 30, 2013:
Derivative Type | Location of Gain or (Loss) on | Realized Gain or (Loss) on Derivatives | Change in Unrealized Appreciation or (Depreciation) | |||||||
Credit contracts | Net realized gain (loss) on swap contracts; Net change in unrealized appreciation/depreciation of swap contracts | $ | 88,548 | $ | 248,327 | |||||
Interest rate contracts | Net realized gain (loss) on investment transactions; Net change in unrealized appreciation/depreciation of investments | – 0 | – | (310,206 | ) | |||||
|
|
|
| |||||||
Total | $ | 88,548 | $ | (61,879 | ) | |||||
|
|
|
| |||||||
| ALLIANCEBERNSTEIN MUNICIPAL INCOME SHARES • | 41 |
Notes to Financial Statements
The following table represents the volume of the Portfolio’s derivative transactions during the year ended April 30, 2013:
Credit Default Swap Contracts: | ||||
Average notional amount of sale contracts | $ | 1,981,818 | (a) | |
Purchased Swaptions: | ||||
Average monthly cost | $ | 688,275 | (b) | |
| (a) | Positions were open for eleven months during the period. |
| (b) | Positions were open for four months during the period. |
NOTE D
Shares of Beneficial Interest
Transactions in shares of beneficial interest were as follows:
| Shares | Amount | |||||||||||||||||||
Year Ended 2013 | Year Ended April 30, 2012 | Year Ended April 30, 2013 | Year Ended April 30, 2012 | |||||||||||||||||
|
| |||||||||||||||||||
| Class A | ||||||||||||||||||||
Shares sold | 20,906,243 | 658,809 | $ | 231,778,688 | $ | 6,786,551 | ||||||||||||||
| ||||||||||||||||||||
Shares redeemed | (4,295,561 | ) | (1,317 | ) | (47,544,807 | ) | (13,679 | ) | ||||||||||||
| ||||||||||||||||||||
Net increase | 16,610,682 | 657,492 | $ | 184,233,881 | $ | 6,772,872 | ||||||||||||||
| ||||||||||||||||||||
NOTE E
Risks Involved in Investing in the Portfolio
Municipal Market Risk and Concentration of Credit Risk—This is the risk that special factors may adversely affect the value of municipal securities and have a significant effect on the yield or value of the Portfolio’s investments in municipal securities. These factors include economic conditions, political or legislative changes, uncertainties related to the tax status of municipal securities, or the rights of investors in these securities. An issuer or guarantor of a fixed-income security, or the counterparty to a derivatives or other contract, may be unable or unwilling to make timely payments of interest or principal, or to otherwise honor its obligations. The issuer or guarantor may default, causing a loss of the full principal amount of a security. The degree of risk for a particular security may be reflected in its credit rating. There is the possibility that the credit rating of a fixed-income security may be downgraded after purchase, which may adversely affect the value of the security. To the extent that the Portfolio invests more of its assets in a particular state’s municipal securities, the Portfolio may be vulnerable to events adversely affecting that state, including economic, political and regulatory occurrences, court decisions, terrorism and catastrophic natural disasters, such as hurricanes or earthquakes. The Portfolio’s investments in certain municipal securities with principal and interest payments that are made from the revenues of a specific project or facility, and not general tax revenues, may have increased risks. Factors affecting the project or facility, such as local business
| 42 | • ALLIANCEBERNSTEIN MUNICIPAL INCOME SHARES |
Notes to Financial Statements
or economic conditions, could have a significant effect on the project’s ability to make payments of principal and interest on these securities.
Interest Rate Risk—Changes in interest rates will affect the value of investments in fixed-income securities. When interest rates rise, the value of investments in fixed-income securities tends to fall and this decrease in value may not be offset by higher income from new investments. Interest rate risk is generally greater for fixed-income securities with longer maturities or durations.
Inflation Risk—This is the risk that the value of assets or income from investments will be less in the future as inflation decreases the value of money. As inflation increases, the value of the Portfolio’s assets can decline as can the value of the Portfolio’s distributions. This risk is significantly greater for fixed-income securities with longer maturities.
Derivatives Risk—The Portfolios may enter into derivative transactions such as forwards, options, futures and swaps. Derivatives may be illiquid, difficult to price, and leveraged so that small changes may produce disproportionate losses for the Portfolios, and subject to counterparty risk to a greater degree than more traditional investments. Derivatives may result in significant losses, including losses that are far greater than the value of the derivatives reflected in the statement of assets and liabilities.
Financing and Related Transactions; Leverage and Other Risks—The Portfolio may utilize financial leverage, including tender option bond transactions, to seek to enhance the yield and net asset value. These objectives may not be achieved in all interest rate environments. Leverage creates certain risks for shareholders, including the likelihood of greater volatility of the net asset value. If income from the securities purchased from the funds made available by leverage is not sufficient to cover the cost of leverage, the Portfolio’s return will be less than if leverage had not been used. As a result, the amounts available for distribution as dividends and other distributions will be reduced. During periods of rising short-term interest rates, the interest paid on the floaters in tender option bond transactions would increase, which may adversely affect the Portfolio’s income and distribution to shareholders. A decline in distributions would adversely affect the Portfolio’s yield. If rising short-term rates coincide with a period of rising long-term rates, the value of the long-term municipal bonds purchased with the proceeds of leverage would decline, adversely affecting the net asset value.
In a tender option bond transaction, the Portfolio may transfer a highly rated fixed-rate municipal security to a broker, which, in turn, deposits the bond into a special purpose vehicle (typically, a trust) usually sponsored by the broker. The Portfolio receives cash and a residual interest security (sometimes referred to as an “inverse floater”) issued by the trust in return. The trust simultaneously issues securities, which pay an interest rate that is reset each week based on an index of high-grade short-term seven-day demand notes. These securities, sometimes
| ALLIANCEBERNSTEIN MUNICIPAL INCOME SHARES • | 43 |
Notes to Financial Statements
referred to as “floaters”, are bought by third parties, including tax-exempt money market funds, and can be tendered by these holders to a liquidity provider at par, unless certain events occur. The Portfolio continues to earn all the interest from the transferred bond less the amount of interest paid on the floaters and the expenses of the trust, which include payments to the trustee and the liquidity provider and organizational costs. The Portfolio also uses the cash received from the transaction for investment purposes or to retire other forms of leverage. Under certain circumstances, the trust may be terminated and collapsed, either by the Portfolio or upon the occurrence of certain events, such as a downgrade in the credit quality of the underlying bond, or in the event holders of the floaters tender their securities to the liquidity provider. See Note G to the Financial Statements “Floating Rate Notes Issued in Connection with Securities Held” for more information about tender option bond transactions.
The Portfolio may also purchase inverse floaters from a tender option bond trust in a secondary market transaction without first owning the underlying bond. The income received from an inverse floater varies inversely with the short-term interest rate paid on the floaters issued by the trust. The prices of inverse floaters are subject to greater volatility than the prices of fixed-income securities that are not inverse floaters. Investments in inverse floaters may amplify the risks of leverage. If short-term interest rates rise, the interest payable on the floaters would increase and income from the inverse floaters decrease.
Indemnification Risk—In the ordinary course of business, the Portfolio enters into contracts that contain a variety of indemnifications. The Portfolio’s maximum exposure under these arrangements is unknown. However, the Portfolio has not had prior claims or losses pursuant to these indemnification provisions and expects the risk of loss thereunder to be remote. Therefore, the Portfolio has not accrued any liability in connection with these indemnification provisions.
Tax Risk—There is no guarantee that all of the Portfolio’s income will remain exempt from federal or state income taxes. From time to time, the U.S. Government and the U.S. Congress consider changes in federal tax law that could limit or eliminate the federal tax exemption for municipal bond income, which would in effect reduce the income received by shareholders from the Portfolio by increasing taxes on that income. In such event, the Portfolio’s NAV could also decline as yields on municipal bonds, which are typically lower than those on taxable bonds, would be expected to increase to approximately the yield of comparable taxable bonds. Actions or anticipated actions affecting the tax exempt status of municipal bonds could also result in significant shareholder redemptions of Portfolio shares as investors anticipate adverse effects on the Portfolio or seek higher yields to offset the potential loss of the tax deduction. As a result, the Portfolio would be required to maintain higher levels of cash to meet the redemptions, which would negatively affect the Portfolio’s yield.
Duration Risk—Duration is the measure that relates the expected price volatility of a fixed-income security to changes in interest rates. The duration of a fixed-income
| 44 | • ALLIANCEBERNSTEIN MUNICIPAL INCOME SHARES |
Notes to Financial Statements
security may be shorter than or equal to full maturity of a fixed-income security. Fixed-income securities with longer durations have more risk and will decrease in price as interest rates rise. For example, a fixed-income security with a duration of three years will decrease in value by approximately 3% if interest rates increase by 1%.
Below Investment Grade Securities Risk—Investments in fixed-income securities with lower ratings (commonly known as “junk bonds”) tend to have a higher probability that an issuer will default or fail to meet its payment obligations. These securities may be subject to greater price volatility due to such factors as specific corporate developments, interest rate sensitivity, negative performance of the junk bond market generally and less secondary market liquidity.
NOTE F
Distributions to Shareholders
The tax character of distributions paid during the fiscal years ended April 30, 2013 and April 30, 2012 were as follows:
| 2013 | 2012 | |||||||
Distributions paid from: | ||||||||
Ordinary income | $ | 288,117 | $ | 8,792 | ||||
Tax-exempt income | 3,624,060 | 659,406 | ||||||
|
|
|
| |||||
Total distributions paid | $ | 3,912,177 | $ | 668,198 | ||||
|
|
|
| |||||
As of April 30, 2013, the components of accumulated earnings/(deficit) on a tax basis were as follows:
Undistributed tax-exempt income | $ | 856,604 | ||
Undistributed capital gains | 27,570 | (a) | ||
Unrealized appreciation/(depreciation) | 3,871,561 | (b) | ||
|
| |||
Total accumulated earnings/(deficit) | $ | 4,755,735 | (c) | |
|
|
| (a) | During the fiscal year ended April 30, 2013, the Portfolio utilized $190,000 of capital loss carryforwards to offset current year net realized gains. |
| (b) | The differences between book-basis and tax-basis unrealized appreciation/(depreciation) are attributable primarily to the tax treatment of tender option bonds and the tax treatment of swaps. |
| (c) | The difference between book-basis and tax-basis components of accumulated earnings/(deficit) is attributable primarily to dividends payable. |
For tax purposes, net capital losses may be carried over to offset future capital gains, if any. Funds are permitted to carry forward capital losses incurred in taxable years beginning after December 22, 2010 for an indefinite period, and such losses will retain their character as either short-term or long-term capital losses. As of April 30, 2013, the Portfolio did not have any capital loss carryforwards.
During the current fiscal year, permanent differences primarily due to the tax treatment of swaps resulted in a net decrease in distributions in excess of net investment
| ALLIANCEBERNSTEIN MUNICIPAL INCOME SHARES • | 45 |
Notes to Financial Statements
income and a net decrease in accumulated net realized gain on investment transactions. These reclassifications had no effect on net assets.
NOTE G
Floating Rate Notes Issued in Connection with Securities Held
The Portfolio may engage in tender option bond transactions in which the Portfolio may transfer a fixed rate bond (“Fixed Rate Bond”) to a broker for cash. The broker deposits the Fixed Rate Bond into a Special Purpose Vehicle (the “SPV”, which is generally organized as a trust), organized by the broker. The Portfolio buys a residual interest in the assets and cash flows of the SPV, often referred to as an inverse floating rate obligation (“Inverse Floater”). The SPV also issues floating rate notes (“Floating Rate Notes”) which are sold to third parties. The Floating Rate Notes pay interest at rates that generally reset weekly and their holders have the option to tender their notes to a liquidity provider for redemption at par. The Inverse Floater held by the Portfolio gives the Portfolio the right (1) to cause the holders of the Floating Rate Notes to tender their notes at par, and (2) to have the trustee transfer the Fixed Rate Bond held by the SPV to the Portfolio, thereby collapsing the SPV. The SPV may also be collapsed in certain other circumstances. In accordance with U.S. GAAP requirements regarding accounting for transfers and servicing of financial assets and extinguishments of liabilities, the Portfolio accounts for the transaction described above as a secured borrowing by including the Fixed Rate Bond in its portfolio of investments and the Floating Rate Notes as a liability under the caption “Payable for floating rate notes issued” in its statement of assets and liabilities. Interest expense related to the Portfolio’s liability with respect to Floating Rate Notes is recorded as incurred. The interest expense is also included in the Portfolio’s expense ratio. At April 30, 2013, the amount of the Fund’s Floating Rate Notes outstanding was $4,685,000 and the related interest rate was 0.24%.
The Portfolio may also purchase Inverse Floaters in the secondary market without first owning the underlying bond. Such an Inverse Floater is included in the Portfolio’s portfolio of investments but is not required to be treated as a secured borrowing and reflected in the Portfolio’s financial statements as a secured borrowing.
NOTE H
Recent Accounting Pronouncements
In December 2011, the Financial Accounting Standards Board (“FASB”) issued an Accounting Standards Update (“ASU”) related to disclosures about offsetting assets and liabilities in financial statements. The amendments in this update require an entity to disclose both gross and net information for derivatives and other financial instruments that are either offset in the statement of assets and liabilities or subject to an enforceable master netting arrangement or similar agreement. In January 2013, the FASB issued an ASU to clarify the scope of disclosures about offsetting assets and liabilities. The ASU limits the scope of the new balance sheet offsetting disclosures to derivatives, repurchase agreements
| 46 | • ALLIANCEBERNSTEIN MUNICIPAL INCOME SHARES |
Notes to Financial Statements
and securities lending transactions. The ASU is effective during interim or annual reporting periods beginning on or after January 1, 2013. At this time, management is evaluating the implication of this ASU and its impact on the financial statements has not been determined.
NOTE I
Subsequent Events
Management has evaluated subsequent events for possible recognition or disclosure in the financial statements through the date the financial statements are issued. Management has determined that there are no material events that would require disclosure in the Portfolio’s financial statements through this date.
| ALLIANCEBERNSTEIN MUNICIPAL INCOME SHARES • | 47 |
Notes to Financial Statements
FINANCIAL HIGHLIGHTS
Selected Data For A Share Of Beneficial Interest Outstanding Throughout Each Period
| Years Ended April 30, | September 1, April 30, | |||||||||||
| 2013 | 2012 | 2011 | ||||||||||
|
| |||||||||||
Net asset value, beginning of period | $ 10.50 | $ 9.24 | $ 10.00 | |||||||||
|
| |||||||||||
Income From Investment Operations | ||||||||||||
Net investment income(b) | .47 | .59 | .32 | |||||||||
Net realized and unrealized gain (loss) on investment transactions | .77 | † | 1.27 | (.77 | ) | |||||||
|
| |||||||||||
Net increase (decrease) in net asset value from operations | 1.24 | 1.86 | (.45 | ) | ||||||||
|
| |||||||||||
Less: Dividends | ||||||||||||
Dividends from net investment income | (.52 | ) | (.60 | ) | (.31 | ) | ||||||
|
| |||||||||||
Net asset value, end of period | $ 11.22 | $ 10.50 | $ 9.24 | |||||||||
|
| |||||||||||
Total Return | ||||||||||||
Total investment return based on net asset value(c) | 11.98 | % | 20.74 | % | (4.42 | )% | ||||||
Ratios/Supplemental Data | ||||||||||||
Net assets, end of period (000’s omitted) | $205,258 | $17,606 | $9,419 | |||||||||
Ratio to average net assets of: | ||||||||||||
Expenses | .03 | % | .05 | % | .02 | %(d) | ||||||
Expenses, excluding interest expense | .00 | % | .00 | % | .00 | %(d) | ||||||
Net investment income | 4.41 | % | 6.06 | % | 5.03 | %(d) | ||||||
Portfolio turnover rate | 7 | % | 17 | % | 14 | % | ||||||
| (a) | Commencement of operations. |
| (b) | Based on average shares outstanding. |
| (c) | Total investment return is calculated assuming an initial investment made at the net asset value at the beginning of the period, reinvestment of all dividends and distributions at net asset value during the period, and redemption on the last day of the period. Total return does not reflect the deduction of taxes that a shareholder would pay on portfolio distributions or the redemption of portfolio shares. Total investment return calculated for a period of less than one year is not annualized. |
| (d) | Annualized. |
| † | Due to timing of sales and repurchase of capital shares, the net realized and unrealized gain (loss) per share is not in accord with the Portfolio’s change in net realized and unrealized gain (loss) on investment transactions for the period. |
See notes to financial statements.
| 48 | • ALLIANCEBERNSTEIN MUNICIPAL INCOME SHARES |
Financial Highlights
REPORT OF INDEPENDENT REGISTERED
PUBLIC ACCOUNTING FIRM
To the Board of Trustees of AllianceBernstein Corporate Shares and Shareholders of AllianceBernstein Municipal Income Shares:
We have audited the accompanying statement of assets and liabilities of AllianceBernstein Municipal Income Shares (one of the series constituting AllianceBernstein Corporate Shares) (the “Fund”), including the portfolio of investments, as of April 30, 2013, and the related statements of operations and cash flows for the year then ended, the statements of changes in net assets for each of the two years in the period then ended, and the financial highlights for each of the two years in the period then ended and the period September 1, 2010 (commencement of operations) through April 30, 2011. These financial statements and financial highlights are the responsibility of the Fund’s management. Our responsibility is to express an opinion on these financial statements and financial highlights based on our audits.
We conducted our audits in accordance with the standards of the Public Company Accounting Oversight Board (United States). Those standards require that we plan and perform the audit to obtain reasonable assurance about whether the financial statements and financial highlights are free of material misstatement. We were not engaged to perform an audit of the Fund’s internal control over financial reporting. Our audits included consideration of internal control over financial reporting as a basis for designing audit procedures that are appropriate in the circumstances, but not for the purpose of expressing an opinion on the effectiveness of the Fund’s internal control over financial reporting. Accordingly, we express no such opinion. An audit also includes examining, on a test basis, evidence supporting the amounts and disclosures in the financial statements and financial highlights, assessing the accounting principles used and significant estimates made by management, and evaluating the overall financial statement presentation. Our procedures included confirmation of securities owned as of April 30, 2013, by correspondence with the custodian and others, or by other appropriate auditing procedures where replies from others were not received. We believe that our audits provide a reasonable basis for our opinion.
In our opinion, the financial statements and financial highlights referred to above present fairly, in all material respects, the financial position of AllianceBernstein Municipal Income Shares of AllianceBernstein Corporate Shares at April 30, 2013, and the results of its operations and cash flows for the year then ended, the changes in its net assets for each of the two years in the period then ended and the financial highlights for each of the two years in the period then ended and for the period September 1, 2010 (commencement of operations) through April 30, 2011, in conformity with U.S. generally accepted accounting principles.

New York, New York
June 27, 2013
| ALLIANCEBERNSTEIN MUNICIPAL INCOME SHARES • | 49 |
Report of Independent Registered Public Accounting Firm
BOARD OF TRUSTEES
| William H. Foulk, Jr.(1), Chairman | Robert M. Keith, President and Chief Executive Officer | |
| John H. Dobkin(1) | ||
| Michael J. Downey(1) | Garry L. Moody(1) | |
| D. James Guzy(1) | Marshall C. Turner, Jr.(1) | |
| Nancy P. Jacklin(1) | Earl D. Weiner(1) |
OFFICERS
Philip L. Kirstein, Senior Vice President and Independent Compliance Officer Michael G. Brooks(2), Vice President Robert “Guy” B. Davidson III(2), Vice President | Wayne D. Godlin(2), Vice President Terrance T. Hults(2), Vice President Emilie D. Wrapp, Secretary Joseph J. Mantineo, Treasurer and Chief Financial Officer Phyllis J. Clarke, Controller |
Custodian and Accounting Agent State Street Bank and Trust Company
Principal Underwriter AllianceBernstein Investments, Inc.
Transfer Agent AllianceBernstein Investor Services, Inc. | Legal Counsel Seward & Kissel LLP One Battery Park Plaza New York, NY 10004
Independent Registered Public Accounting Firm Ernst & Young LLP 5 Times Square New York, NY 10036 |
| (1) | Member of the Audit Committee, the Governance and Nominating Committee and the Independent Directors Committee. Mr. Foulk is the sole member of the Fair Value Pricing Committee. |
| (2) | The day-to-day management of, and investment decisions for, the Trust’s Portfolio are made by the Municipal Bond Investment Team. Messrs. Michael G. Brooks, Robert “Guy” B. Davidson III, Wayne D. Godlin and Terrance T. Hults are the investment professionals primarily responsible for the day-to-day management of the Trust’s Portfolio. |
| 50 | • ALLIANCEBERNSTEIN MUNICIPAL INCOME SHARES |
Board of Trustees
MANAGEMENT OF THE FUND
Board of Trustees Information
The business and affairs of the Trust are managed under the direction of the Board of Trustees. Certain information concerning the Trust’s Trustee is set forth below.
NAME, ADDRESS* AND AGE (YEAR FIRST ELECTED**) | PRINCIPAL OCCUPATION(S) DURING PAST FIVE YEARS AND OTHER RELEVANT QUALIFICATIONS*** | PORTFOLIOS IN FUND COMPLEX OVERSEEN BY TRUSTEE | OTHER DIRECTORSHIPS HELD BY TRUSTEE IN THE PAST FIVE YEARS | |||||
| INTERESTED TRUSTEE | ||||||||
Robert M. Keith, # 53 (2010) | Senior Vice President of AllianceBernstein L.P. (the “Adviser”) and the head of AllianceBernstein Investments, Inc. (“ABI”) since July 2008; Director of ABI and President of the AllianceBernstein Mutual Funds. Previously, he served as Executive Managing Director of ABI from December 2006 to June 2008. Prior to joining ABI in 2006, Executive Managing Director of Bernstein Global Wealth Management, and prior thereto, Senior Managing Director and Global Head of Client Service and Sales of the Adviser’s institutional investment management business since 2004. Prior thereto, he was Managing Director and Head of North American Client Service and Sales in the Adviser’s institutional investment management business, with which he had been associated since prior to 2004. | 102 | None | |||||
| ALLIANCEBERNSTEIN MUNICIPAL INCOME SHARES • | 51 |
Management of the Fund
NAME, ADDRESS* AND AGE (YEAR FIRST ELECTED**) | PRINCIPAL OCCUPATION(S) DURING PAST FIVE YEARS AND OTHER RELEVANT QUALIFICATIONS*** | PORTFOLIOS IN FUND COMPLEX OVERSEEN BY TRUSTEE | OTHER DIRECTORSHIPS HELD BY TRUSTEE IN THE PAST FIVE YEARS | |||||
| DISINTERESTED TRUSTEES | ||||||||
Chairman of the Board William H. Foulk, Jr., ##, + 80 (2010) | Investment Adviser and an Independent Consultant since prior to 2008. Previously, he was Senior Manager of Barrett Associates, Inc., a registered investment adviser. He was formerly Deputy Comptroller and Chief Investment Officer of the State of New York and, prior thereto, Chief Investment Officer of the New York Bank for Savings. He has served as a director or trustee of various AllianceBernstein Funds since 1983 and has been Chairman of the AllianceBernstein Funds and of the Independent Directors Committee of such Funds since 2003. He is also active in a number of mutual fund related organizations and committees. | 102 | None | |||||
John H. Dobkin, ## 71 (2010) | Independent Consultant since prior to 2008. Formerly, President of Save Venice, Inc. (preservation organization) from 2001-2002; Senior Advisor from June 1999-June 2000 and President of Historic Hudson Valley (historic preservation) from December 1989-May 1999. Previously, Director of the National Academy of Design. He has served as a director or trustee of various AllianceBernstein Funds since 1992, and as Chairman of the Audit Committees of a number of such Funds from 2001-2008. | 102 | None | |||||
| 52 | • ALLIANCEBERNSTEIN MUNICIPAL INCOME SHARES |
Management of the Fund
NAME, ADDRESS* AND AGE (YEAR FIRST ELECTED**) | PRINCIPAL OCCUPATION(S) DURING PAST FIVE YEARS AND OTHER RELEVANT QUALIFICATIONS*** | PORTFOLIOS IN FUND COMPLEX OVERSEEN BY TRUSTEE | OTHER DIRECTORSHIPS HELD BY TRUSTEE IN THE PAST FIVE YEARS | |||||
| DISINTERESTED TRUSTEES (continued) | ||||||||
Michael J. Downey, ## 69 (2010) | Private Investor since prior to 2008. Formerly, managing partner of Lexington Capital, LLC (investment advisory firm) from December 1997 until December 2003. From 1987 until 1993, Chairman and CEO of Prudential Mutual Fund Management, director of the Prudential mutual funds, and member of the Executive Committee of Prudential Securities Inc. He has served as a director or trustee of the AllianceBernstein Funds since 2005 and is a director and Chairman of one other registered investment company. | 102 | Asia Pacific Fund, Inc. since prior to 2008, Prospect Acquisition Corp. (financial services) from 2007 until 2009 and The Merger Fund since prior to 2008 until 2013 | |||||
D. James Guzy, ## 77 (2010) | Chairman of the Board of PLX Technology (semi-conductors) and of SRC Computers Inc., with which he has been associated since prior to 2008. He was a director of Intel Corporation (semi-conductors) from 1969 until 2008, and served as Chairman of the Finance Committee of such company for several years until May 2008. He has served as a director or trustee of one or more of the AllianceBernstein Funds since 1982. | 102 | PLX Technology (semi-conductors) since prior to 2008, Cirrus Logic Corporation (semi-conductors) since prior to 2008 until July 2011 and Intel Corporation (semi-conductors) until 2008 | |||||
| ALLIANCEBERNSTEIN MUNICIPAL INCOME SHARES • | 53 |
Management of the Fund
NAME, ADDRESS* AND AGE (YEAR FIRST ELECTED**) | PRINCIPAL OCCUPATION(S) DURING PAST FIVE YEARS AND OTHER RELEVANT QUALIFICATIONS*** | PORTFOLIOS IN FUND COMPLEX OVERSEEN BY TRUSTEE | OTHER DIRECTORSHIPS HELD BY TRUSTEE IN THE PAST FIVE YEARS | |||||
| DISINTERESTED TRUSTEES (continued) | ||||||||
Nancy P. Jacklin, ## 65 (2010) | Professorial Lecturer at the Johns Hopkins School of Advanced International Studies since 2008. Formerly, U.S. Executive Director of the International Monetary Fund (December 2002-May 2006); Partner, Clifford Chance (1992-2002); Sector Counsel, International Banking and Finance, and Associate General Counsel, Citicorp (1985-1992); Assistant General Counsel (International), Federal Reserve Board of Governors (1982-1985); and Attorney Advisor, U.S. Department of the Treasury (1973-1982). Member of the Bar of the District of Columbia and of New York; and member of the Council on Foreign Relations. She has served as a director or trustee of the AllianceBernstein Funds since 2006. | 102 | None | |||||
| 54 | • ALLIANCEBERNSTEIN MUNICIPAL INCOME SHARES |
Management of the Fund
NAME, ADDRESS* AND AGE (YEAR FIRST ELECTED**) | PRINCIPAL OCCUPATION(S) DURING PAST FIVE YEARS AND OTHER RELEVANT QUALIFICATIONS*** | PORTFOLIOS IN FUND COMPLEX OVERSEEN BY TRUSTEE | OTHER DIRECTORSHIPS HELD BY TRUSTEE IN THE PAST FIVE YEARS | |||||
| DISINTERESTED TRUSTEES (continued) | ||||||||
Garry L. Moody, ## 61 (2010) | Independent Consultant. Formerly, Partner, Deloitte & Touche LLP (1995-2008) where he held a number of senior positions, including Vice Chairman, and U.S. and Global Investment Management Practice Managing Partner; President, Fidelity Accounting and Custody Services Company (1993-1995); and Partner, Ernst & Young LLP (1975-1993), where he served as the National Director of Mutual Fund Tax Services and Managing Partner of its Chicago Office Tax department. He is a member of both the Governing Council of the Independent Directors Council (IDC), an organization of independent directors of mutual funds, and the Trustee Advisory Board of BoardIQ, a biweekly publication focused on issues and news affecting directors of mutual funds. He has served as a director or trustee, and as Chairman of the Audit Committee, of the AllianceBernstein Funds since 2008. | 102 | None | |||||
Marshall C. Turner, Jr., ## 71 (2010) | Private Investor since prior to 2008. Interim CEO of MEMC Electronic Materials, Inc. (semi-conductor and solar cell substrates) from November 2008 until March 2009. He was Chairman and CEO of Dupont Photomasks, Inc. (components of semi-conductor manufacturing), 2003-2005, and President and CEO, 2005-2006, after the company was acquired and renamed Toppan Photomasks, Inc. He has extensive experience in venture capital investing including prior service as general partner of three institutional venture capital partnerships, and serves on the boards of a number of education and science-related non-profit organizations. He has served as a director or trustee of one or more of the AllianceBernstein Funds since 1992. | 102 | Xilinx, Inc. (programmable logic semi-conductors) and MEMC Electronic Materials, Inc. (semi-conductor and solar cell substrates) since prior to 2008 | |||||
| ALLIANCEBERNSTEIN MUNICIPAL INCOME SHARES • | 55 |
Management of the Fund
NAME, ADDRESS* AND AGE (YEAR FIRST ELECTED**) | PRINCIPAL OCCUPATION(S) DURING PAST FIVE YEARS AND OTHER RELEVANT QUALIFICATIONS*** | PORTFOLIOS IN FUND COMPLEX OVERSEEN BY TRUSTEE | OTHER DIRECTORSHIPS HELD BY TRUSTEE IN THE PAST FIVE YEARS | |||||
| DISINTERESTED TRUSTEES (continued) | ||||||||
Earl D. Weiner, ## 73 (2010) | Of Counsel, and Partner prior to January 2007, of the law firm Sullivan & Cromwell LLP and member of ABA Federal Regulation of Securities Committee Task Force to draft editions of the Fund Director’s Guidebook. He also serves as a director or trustee of various non-profit organizations and has served as Chairman or Vice Chairman of a number of them. He has served as a director or trustee of the AllianceBernstein Funds since 2007 and is Chairman of the Governance and Nominating Committees of the Funds. | 102 | None | |||||
| * | The address for each of the Trust’s disinterested Trustees is c/o AllianceBernstein L.P., Attention: Philip L. Kirstein, 1345 Avenue of the Americas, New York, NY 10105. |
| ** | There is no stated term of office for the Trust’s Trustees. |
| *** | The information above includes each Trustee’s principal occupation during the last five years and other information relating to the experience, attributes, and skills relevant to each Trustee’s qualifications to serve as a Trustee, which led to the conclusion that each Trustee should serve as a Trustee for the Trust. |
| # | Mr. Keith is an “interested person” of the Trust, as defined in the 1940 Act, due to his position as a Senior Vice President of the Adviser. |
| ## | Member of the Audit Committee, the Governance and Nominating Committee and the Independent Directors Committee. |
| + | Member of the Fair Value Pricing Committee. |
| 56 | • ALLIANCEBERNSTEIN MUNICIPAL INCOME SHARES |
Management of the Fund
Officers
| NAME, ADDRESS* AND AGE | POSITION(S) HELD WITH FUND | PRINCIPAL OCCUPATION DURING PAST FIVE YEARS | ||
Robert M. Keith 53 | President and Chief Executive Officer | See biography above. | ||
Philip L. Kirstein 68 | Senior Vice President and Independent Compliance Officer | Senior Vice President and Independent Compliance Officer of the AllianceBernstein Funds, with which he has been associated since October 2004. Prior thereto, he was Of Counsel to Kirkpatrick & Lockhart, LLP from October 2003 to October 2004, and General Counsel of Merrill Lynch Investment Managers, L.P. since prior to March 2003. | ||
Michael G. Brooks 65 | Vice President | Senior Vice President of the Adviser**, with which he has been associated since prior to 2008. | ||
Robert “Guy” B. Davidson, III 52 | Vice President | Senior Vice President of the Adviser**, with which he has been associated since prior to 2008. | ||
Wayne D. Godlin 52 | Vice President | Senior Vice President of the Adviser** since December 2009. Prior thereto, he was an investment manager and a Managing Director of Van Kampen Asset Management with which he had been associated since prior to 2008. | ||
Terrance T. Hults 47 | Vice President | Senior Vice President of the Adviser**, with which he has been associated since prior to 2008. | ||
Emilie D. Wrapp 57 | Secretary | Senior Vice President, Assistant General Counsel and Assistant Secretary of ABI**, with which she has been associated since prior to 2008. | ||
Joseph J. Mantineo 54 | Treasurer and Chief Financial Officer | Senior Vice President of AllianceBernstein Investor Services, Inc. (“ABIS”)**, with which he has been associated since prior to 2008. | ||
Phyllis J. Clarke 52 | Controller | Vice President of ABIS**, with which she has been associated since prior to 2008. |
| * | The address for each of the Portfolio’s Officers is 1345 Avenue of the Americas, New York, NY 10105. |
| ** | The Adviser, ABI and ABIS are affiliates of the Fund. |
| The Trust’s Statement of Additional Information (“SAI”) has additional information about the Trust’s Trustees and Officers and is available without charge upon request. Contact your financial representative or AllianceBernstein at 1-800-227-4618 for a free prospectus or SAI. |
| ALLIANCEBERNSTEIN MUNICIPAL INCOME SHARES • | 57 |
Management of the Fund
Information Regarding the Review and Approval of the Fund’s Advisory Agreement
The disinterested trustees (the “trustees”) of AllianceBernstein Corporate Shares (the “Fund”) unanimously approved the continuance of the Fund’s Advisory Agreement with the Adviser in respect of AllianceBernstein Municipal Income Shares (the “Portfolio”) at a meeting held on November 6-8, 2012.
Prior to approval of the continuance of the Advisory Agreement in respect of the Portfolio, the trustees had requested from the Adviser, and received and evaluated, extensive materials. They reviewed the proposed continuance of the Advisory Agreement with the Adviser and with experienced counsel who are independent of the Adviser, who advised on the relevant legal standards. The trustees also reviewed an independent evaluation prepared by the Fund’s Senior Officer (who is also the Fund’s Independent Compliance Officer) of the reasonableness of the advisory fee, in which the Senior Officer concluded that the contractual fee (zero) for the Portfolio was reasonable. The trustees also discussed the proposed continuance in private sessions with counsel and the Fund’s Senior Officer.
The trustees noted that the Portfolio is designed as a vehicle for the wrap fee account market (where investors pay fees to a wrap fee sponsor which pays investment fees and expenses from such fee). The trustees also noted that no advisory fee is payable by the Portfolio, that the Advisory Agreement does not include the reimbursement provision for certain administrative expenses included in the advisory agreements of most of the open-end AllianceBernstein Funds, and that the Adviser is responsible for payment of the Portfolio’s ordinary expenses. The trustees noted that the Fund acknowledges in the Advisory Agreement that the Adviser and its affiliates expect to receive compensation from third parties in connection with services provided under the Advisory Agreement. The trustees further noted that the Adviser receives payments from the wrap fee program sponsors (the “Sponsors”) that use the Portfolio as an investment vehicle for their clients.
The trustees considered their knowledge of the nature and quality of the services provided by the Adviser to the Portfolio gained from their experience as trustees or directors of most of the registered investment companies advised by the Adviser, their overall confidence in the Adviser’s integrity and competence they have gained from that experience, the Adviser’s initiative in identifying and raising potential issues with the trustees and its responsiveness, frankness and attention to concerns raised by the trustees in the past, including the Adviser’s willingness to consider and implement organizational and operational changes designed to improve investment results and the services provided to the AllianceBernstein Funds. The trustees noted that they have four regular meetings each year, at each of which they receive presentations from the Adviser on the investment results of the Portfolio and review extensive materials and information presented by the Adviser.
| 58 | • ALLIANCEBERNSTEIN MUNICIPAL INCOME SHARES |
The trustees also considered all other factors they believed relevant, including the specific matters discussed below. In their deliberations, the trustees did not identify any particular information that was all-important or controlling, and different trustees may have attributed different weights to the various factors. The trustees determined that the selection of the Adviser to manage the Portfolio, and the overall arrangements between the Portfolio and the Adviser, as provided in the Advisory Agreement, including the advisory fee, were fair and reasonable in light of the services performed, expenses incurred and such other matters as the trustees considered relevant in the exercise of their business judgment. The material factors and conclusions that formed the basis for the trustees’ determination included the following:
Nature, Extent and Quality of Services Provided
The trustees considered the scope and quality of services provided by the Adviser under the Advisory Agreement, including the quality of the investment research capabilities of the Adviser and the other resources it has dedicated to performing services for the Portfolio. They also noted the professional experience and qualifications of the Portfolio’s portfolio management team and other senior personnel of the Adviser. The quality of administrative and other services, including the Adviser’s role in coordinating the activities of the Portfolio’s other service providers, also were considered. The trustees concluded that, overall, they were satisfied with the nature, extent and quality of services provided to the Portfolio under the Advisory Agreement.
Costs of Services Provided and Profitability
The trustees reviewed a schedule of the revenues, expenses and related notes indicating the profitability of the Portfolio to the Adviser for calendar years 2010 and 2011 that had been prepared with an expense allocation methodology arrived at in consultation with an independent consultant retained by the Fund’s Senior Officer. The trustees considered that while the Adviser does not receive any advisory fee from the Portfolio or expense reimbursement, it does receive fees paid by the Sponsors. They also noted that the Adviser bears certain costs in providing services to the Portfolio and in paying its ordinary expenses. The trustees reviewed the assumptions and methods of allocation used by the Adviser in preparing fund-specific profitability data and noted that there are a number of potentially acceptable allocation methodologies for information of this type. The trustees noted that the profitability information reflected all revenues and expenses of the Adviser’s relationship with the Portfolio. The trustees recognized that it is difficult to make comparisons of the profitability of the Advisory Agreement with the profitability of advisory contracts for unaffiliated funds because comparative information is not generally publicly available and is affected by numerous factors, including, in the case of the Portfolio, the fact that it does not pay an advisory fee. The trustees focused on the profitability of the Adviser’s relationship with the Portfolio before taxes. The trustees noted that the Adviser’s relationship with the Portfolio (September 2010 inception) was not profitable to it in 2010 or 2011.
| ALLIANCEBERNSTEIN MUNICIPAL INCOME SHARES • | 59 |
Fall-Out Benefits
The trustees considered the other benefits to the Adviser and its affiliates from their relationships with the Portfolio. The trustees noted that the Adviser is compensated by the Sponsors. The trustees understood that the Adviser might also derive reputational and other benefits from its association with the Portfolio.
Investment Results
In addition to the information reviewed by the trustees in connection with the meeting, the trustees receive detailed performance information for the Portfolio at each regular Board meeting during the year. At the November 2012 meeting, the trustees reviewed information prepared by Lipper showing the performance of the Portfolio as compared with that of funds selected by Lipper (the “Performance Universe”) for the 1-year period ended July 31, 2012, and information prepared by the Adviser showing the Portfolio’s performance as compared with the Barclays Capital Municipal Bond Index (the “Index”), for the one-year period ended September 30, 2012 and the period since inception (September 2010 inception). The trustees noted that, on a gross return basis, the Portfolio was in the 1st quintile of the Performance Universe for the 1-year period. The Portfolio outperformed the Index in both periods. The trustees were cognizant that the Portfolio was neither designed nor offered as a standalone investment and was intended to serve solely as a component of certain separately managed accounts (“SMAs”). The Adviser had explained that this attribute made it difficult to select an appropriate benchmark for the Portfolio. The trustees had asked the Adviser to provide information showing the weighting of the Portfolio in representative SMAs and the overall performance of those SMAs versus their stated benchmarks. The materials provided to the trustees in respect of the Portfolio included its weighting in the AllianceBernstein Tax-Aware Fixed Income SMA and the AllianceBernstein Municipal Income SMA and the performance of each of those SMAs relative to the Barclays Capital Municipal Bond Unhedged Index. The trustees noted that the Tax-Aware Fixed Income SMA showed generally favorable performance relative to its benchmark, and that the Municipal Income SMA had outperformed its benchmark in each period since inception on September 1, 2010. Based on their review, the trustees concluded that the Portfolio’s performance was satisfactory.
Advisory Fees
The trustees considered the advisory fee rate paid by the Portfolio to the Adviser (zero) and information provided by Lipper showing the fees paid by other fund families used in wrap fee programs similar to that of the Portfolio. The trustees recognized that it is difficult to make comparisons of advisory fees because there are variations in the services that are included in the fees paid by other funds.
The trustees noted the unusual arrangements in the Advisory Agreement providing for no advisory fee but were cognizant that the Adviser is indirectly compensated by the Sponsors for its services to the Portfolio. The trustees reviewed the
| 60 | • ALLIANCEBERNSTEIN MUNICIPAL INCOME SHARES |
fee arrangements between the Adviser and each of the current Sponsors and noted that such fees were negotiated on an arm’s length basis and were within the range of fees paid by wrap fee sponsors to other advisers of similar funds. While the Adviser’s fee arrangements with the Sponsors vary, the trustees acknowledged the Adviser’s view that a portion of such fees (less the expenses of the Portfolio paid by the Adviser) may reasonably be viewed as compensating the Adviser for advisory services it provides to the Portfolio (the “implied fee”) and that the Adviser believes that while the Sponsors pay the Adviser different fee rates, the rate of fee attributable to portfolio management at the Portfolio level is the same for all Sponsors. The trustees also considered the fee rate schedules used by other registered investment companies that invest in fixed income securities that are advised by the Adviser. Based on their review, the trustees concluded that the advisory arrangements for the Portfolio, including the zero fee aspect of the Advisory Agreement with the Adviser, were satisfactory.
The Adviser informed the trustees that there were no institutional products managed by it that have a substantially similar investment style. The trustees reviewed the relevant advisory fee information from the Adviser’s Form ADV and the evaluation from the Fund’s Senior Officer. The trustees recognized that such information was of limited utility in light of the Portfolio’s unusual fee arrangement. The Adviser reviewed with the trustees the significantly greater scope of the services it provides the Portfolio relative to institutional clients. The Adviser noted that because mutual funds are constantly issuing and redeeming shares, they are more difficult to manage than an institutional account, where the assets tend to be relatively stable. In light of the substantial differences in services rendered by the Adviser to institutional clients as compared to funds such as the Portfolio, and the unusual fee structure for the other portfolios of the Fund and the Portfolio, the trustees considered these fee comparisons inapt and did not place significant weight on them in their deliberations.
Since the Portfolio does not bear ordinary expenses, the trustees did not consider comparative expense information.
Economies of Scale
Since the Advisory Agreement does not provide for any compensation to be paid to the Adviser by the Portfolio and the Portfolio’s expense ratio is zero, the trustees did not consider the extent to which fee levels in the Advisory Agreement reflect economies of scale. They did note, however, that the fee payable to the Adviser by each of the current Sponsors declines at a breakpoint based on total assets managed by the Adviser for the Sponsors.
| ALLIANCEBERNSTEIN MUNICIPAL INCOME SHARES • | 61 |
THE FOLLOWING IS NOT PART OF THE SHAREHOLDER REPORT OR THE FINANCIAL STATEMENTS
SUMMARY OF SENIOR OFFICER’S EVALUATION OF INVESTMENT ADVISORY AGREEMENT1
The following is a summary of the evaluation of the Investment Advisory Agreement between AllianceBernstein L.P. (the “Adviser”) and The AllianceBernstein Corporate Shares (the “Trust”) with respect to AllianceBernstein Municipal Income Shares (the “Portfolio”).2 The evaluation of the Investment Advisory Agreement was prepared by Philip L. Kirstein, the Senior Officer of the Trust, for the Trustees of the Trust, as required by the September 1, 2004 Assurance of Discontinuance (“AoD”) between the Adviser and the New York State Attorney General (the “NYAG”). The Senior Officer’s evaluation of the Investment Advisory Agreement is not meant to diminish the responsibility or authority of the Board of Trustees to perform its duties pursuant to Section 15 of the Investment Company Act of 1940 Act (the “40 Act”) and applicable state law. The purpose of the summary is to provide shareholders with a synopsis of the independent evaluation of the reasonableness of the advisory fees proposed to be paid by the Portfolio which was provided to the Trustees in connection with their review of the proposed approval of the continuance of the Investment Advisory Agreement.
The Senior Officer’s evaluation considered the following factors:
| 1. | Advisory fees charged to institutional and other clients of the Adviser for like services; |
| 2. | Advisory fees charged by other mutual fund companies for like services; |
| 3. | Costs to the Adviser and its affiliates of supplying services pursuant to the advisory agreement, excluding any intra-corporate profit; |
| 4. | Profit margins of the Adviser and its affiliates from supplying such services; |
| 5. | Possible economies of scale as the Portfolio grows larger; and |
| 6. | Nature and quality of the Adviser’s services including the performance of the Portfolio. |
These factors, with the exception of the first factor, are generally referred to as the “Gartenberg factors,” which were articulated by the United States Court of Appeals for the Second Circuit in 1982. Gartenberg v. Merrill Lynch Asset Management, Inc., 694 F. 2d 923 (2d Cir. 1982). On March 30, 2010, the Supreme Court held the Gartenberg decision was correct in its basic formulation of what §36(b) requires: to face liability under §36(b), “an investment adviser must charge a fee that is so disproportionately large that it bears no reasonable
| 1 | The Senior Officer’s fee evaluation was completed on October 25, 2012 and discussed with the Board of Trustees on November 6-8, 2012. |
| 2 | Future references to the Portfolio do not include “AllianceBernstein.” |
| 62 | • ALLIANCEBERNSTEIN MUNICIPAL INCOME SHARES |
relationship to the services rendered and could not have been the product of arm’s length bargaining” Jones v. Harris Associates L.P., 130 S. Ct. 1418 (2010). In Jones, the Court stated the Gartenberg approach fully incorporates the correct understanding of fiduciary duty within the context of section 36(b) and noted with approval that “Gartenberg insists that all relevant circumstances be taken into account” and “uses the range of fees that might result from arm’s-length bargaining as the benchmark for reviewing challenged fees.”3
PORTFOLIO’S EXEMPTION FROM ADVISORY FEES OR EXPENSES
The Portfolio pays no advisory fee to the Adviser for receiving the services to be provided pursuant to the Investment Advisory Agreement. The Portfolio is designed to serve the needs of the Adviser’s separately managed account (“SMA”) clients.4 Since SMA clients pay their wrap program provider a unitary fee for managing all investments of their portfolio, the Portfolio will not pay an advisory fee. The Adviser will also reimburse the Portfolio for all of its other operating expenses, except certain extraordinary expenses, taxes, brokerage costs and the interest on borrowed money.
The Portfolio’s net assets on September 30, 2012 are set forth below:
| Portfolio | 9/30/12 Net Assets ($MM) | |||
Municipal Income Shares | $ | 56.8 | ||
The Portfolio, which offers only one no-load class of shares, is distributed through its principal underwriter, AllianceBernstein Investments, Inc. (“ABI”). Since the Portfolio is reimbursed by the Adviser for its operating expenses, the Portfolio does not have a distribution plan pursuant to Rule 12b-1 under the 40 Act.
| I. | ADVISORY FEES CHARGED TO INSTITUTIONAL AND OTHER CLIENTS |
The advisory fees charged to investment companies which the Adviser manages and sponsors are normally higher than those charged to similar sized institutional accounts, including pension plans and sub-advised investment companies. The fee differential reflects, among other things, different services provided to such clients, and different liabilities assumed. Services provided by the Adviser to the Portfolio that are not provided to non-investment company clients include providing office space and personnel to serve as Fund Officers, who among other responsibilities make the certifications required under the Sarbanes–Oxley Act of 2002, and coordinating with and monitoring the Portfolio’s third party service
| 3 | Jones v. Harris at 1427. |
| 4 | The SMA clients currently employ the Adviser as one of several investment managers, and compensate the Adviser on the basis of all SMA assets managed, which would include assets of Municipal Income Shares. |
| ALLIANCEBERNSTEIN MUNICIPAL INCOME SHARES • | 63 |
providers such as Fund counsel, auditors, custodians, transfer agents and pricing services. The accounting, administrative, legal and compliance requirements for the Portfolio are more costly than those for institutional client assets due to the greater complexities and time required for investment companies. The Adviser also believes that it incurs substantial entrepreneurial risk when offering a new mutual fund since establishing a new mutual fund requires a large upfront investment and it may take a long time for the fund to achieve profitability since the fund must be priced to scale from inception in order to be competitive and assets are acquired one account at a time. In addition, managing the cash flow of an investment company may be more difficult than that of a stable pool of assets, such as an institutional account with little cash movement in either direction, particularly if the Portfolio is in net redemption and the Adviser is frequently forced to sell securities to raise cash for redemptions. However, managing a fund with positive cash flow may be easier at times than managing a stable pool of assets. Finally, in recent years, investment advisers have been sued by institutional clients and have suffered reputational damage both by the attendant publicity and outcomes other than complete victories. Accordingly, the legal and reputational risks associated with institutional accounts are greater than previously thought, although arguably still not equal to those related to the mutual fund industry.
Notwithstanding the Adviser’s view that managing an investment company is not comparable to managing other institutional accounts because the services provided are different, the Supreme Court has indicated consideration should be given to the advisory fees charged to institutional accounts with a similar investment style as the Portfolio.5 However, with respect to the Portfolio, the Adviser represented that there is no institutional product in the Adviser’s Form ADV that has a similar investment style as the Portfolio.
The Adviser represented that it does provide sub-advisory services to other companies that have a substantially similar investment style as the Portfolio.
| II. | MANAGEMENT FEES CHARGED BY OTHER MUTUAL FUND COMPANIES FOR LIKE SERVICES. |
Lipper, Inc., an analytical service that is not affiliated with the Adviser, compared the fees charged to the Portfolio to the fees charged to other investment
| 5 | The Supreme Court stated that “courts may give such comparisons the weight that they merit in light of the similarities and differences between the services that the clients in question require, but the courts must be wary of inapt comparisons.” Among the significant differences the Supreme Court noted that may exist between services provided to mutual funds and institutional accounts are “higher marketing costs.” Jones v. Harris at 1428. |
| 64 | • ALLIANCEBERNSTEIN MUNICIPAL INCOME SHARES |
companies for similar services by other investment advisers.6, 7 Each peer selected by Lipper had a similar fee arrangement as the Portfolio, which is to say that with respect to the Portfolio’s peers, all of their fund expenses, including management fees,8 were reimbursed by their respective investment advisers.
As previously noted, the Portfolio does not pay an advisory fee to the Adviser since its SMA clients pay their wrap program provider a unitary fee for managing all investments of their portfolios. In addition, the Adviser reimburses the Portfolio for all of its operating expenses, except certain extraordinary expenses, taxes, brokerage costs and interest on borrowed money.
| III. | COSTS TO THE ADVISER AND ITS AFFILIATES OF SUPPLYING SERVICES PURSUANT TO THE ADVISORY FEE ARRANGEMENT, EXCLUDING ANY INTRA-CORPORATE PROFIT. |
The Adviser utilizes two profitability reporting systems, which operate independently but are aligned with each other, to estimate the Adviser’s profitability in connection with investment advisory services provided to the Portfolio. The Senior Officer has retained a consultant to provide independent advice regarding the alignment of the two profitability systems as well as the methodologies and allocations utilized by both profitability systems. See Section IV for additional discussion.
| IV. | PROFIT MARGINS OF THE ADVISER AND ITS AFFILIATES FOR SUPPLYING SUCH SERVICES. |
The profitability information for the Portfolio, prepared by the Adviser for the Board of Trustees, was reviewed by the Senior Officer and the consultant. The Portfolio does not pay an advisory fee to the Adviser. However, the Adviser does profit indirectly through the advisory fees that it receives from SMA clients that invest in the Portfolio. The Adviser’s profitability with respect to the Portfolio, which was negative in 2011 and 2010, was calculated using a weighted average of the profitability of the SMA clients, in addition to any fund specific revenue or expense items.
| 6 | The Supreme Court cautioned against accepting mutual fund fee comparisons without careful scrutiny since “these comparisons are problematic because these fees, like those challenged, may not be the product of negotiations conducted at arm’s length.” Jones v. Harris at 1429. |
| 7 | Only zero fee no-load funds that participated in a wrap fee program were considered for inclusion in the Portfolio’s EG, regardless of the Lipper investment classification/objective of the Funds’ peers. The Portfolio’s EG includes the Portfolio, one other General & Insured Municipal Debt Fund, two BBB-rated Corporate Debt Funds, one Multi-Sector Income Fund, one Short Intermediate Investment Grade Debt Fund, two U.S. Mortgage Funds, three General Bond Funds, one Intermediate Investment-Grade Debt Fund, one Inflation-Protected Bond Fund, two Global Income Funds, and one Intermediate Municipal Debt Fund. |
| 8 | “Management Fee” is the fee attributable to the management and bearing of expenses of the funds (not the management of the wrap fee program). In each case, the advisory contract provides for an advisory or management fee of zero. |
| ALLIANCEBERNSTEIN MUNICIPAL INCOME SHARES • | 65 |
AllianceBernstein Investments, Inc. (“ABI”) and AllianceBernstein Investor Services, Inc. (“ABIS”), affiliates of the Adviser, serve as the Portfolio’s underwriter and transfer agent, respectively. The courts have referred to this type of business relationships as “fall-out benefits” to the Adviser and indicated that such benefits should be factored into the evaluation of the total relationship between the Portfolio and the Adviser. Neither case law nor common business practice precludes the Adviser’s affiliates from earning a reasonable profit on this type of relationship provided the affiliates’ charges and services are competitive. However, neither ABI nor ABIS receive a fee for serving as the Portfolio’s underwriter and transfer agent.
| V. | POSSIBLE ECONOMIES OF SCALE |
The Adviser has indicated that economies of scale are being shared with shareholders through pricing to scale, breakpoints, fee reductions/waivers and enhancement to services.
An independent consultant, retained by the Senior Officer, provided the Board of Trustees information on the Adviser’s firm-wide average costs from 2005 through 2011 and the potential economies of scale. The independent consultant noted that from 2005 through 2007 the Adviser experienced significant growth in assets under management (“AUM”). During this period, operating expenses increased, in part to keep up with growth, and in part reflecting market returns. However, from 2008 through the first quarter of 2009, AUM rapidly and significantly decreased due to declines in market value and client withdrawals. When AUM rapidly decreased, some operating expenses categories, including base compensation and office space, adjusted more slowly during this period, resulting in an increase in average costs. Since 2009, AUM has experienced less significant changes. The independent consultant noted that changes in operating expenses reflect changes in business composition and business practices in response to changes in financial markets. Finally, the independent consultant concluded that the increase in average cost and the decline in net operating margin across the Adviser since late 2008 are inconsistent with the view that there are currently reductions in average costs due to economies of scale that can be shared with the AllianceBernstein Mutual Funds managed by the Adviser through lower fees.
In February 2008, the independent consultant provided the Board of Trustees an update of the Deli9 study on advisory fees and various fund characteristics.10 The independent consultant first reiterated the results of his previous two dimensional comparison analysis (fund size and family size) with the Board of
| 9 | The Deli study, originally published in 2002 based on 1997 data and updated for the February 2008 Presentation, may be of diminished value due to the age of the data used in the presentation and the changes experienced in the industry over the last four years. |
| 10 | As mentioned previously, the Supreme Court cautioned against accepting mutual fund fee comparisons without careful scrutiny since the fees may not be the product of negotiations conducted at arm’s length. See Jones V. Harris at 1429. |
| 66 | • ALLIANCEBERNSTEIN MUNICIPAL INCOME SHARES |
Trustees.11 The independent consultant then discussed the results of the regression model that was utilized to study the effects of various factors on advisory fees. The regression model output indicated that the bulk of the variation in fees predicted were explained by various factors, but substantially by fund AUM, family AUM, index fund indicator and investment style. The independent consultant also compared the advisory fees of the AllianceBernstein Mutual Funds to similar funds managed by 19 other large asset managers, regardless of the fund size and each Adviser’s proportion of mutual fund assets to non-mutual fund assets.
| VI. | NATURE AND QUALITY OF THE ADVISER’S SERVICES INCLUDING THE PERFORMANCE OF THE PORTFOLIO. |
With assets under management of approximately $419 billion as of September 30, 2012, the Adviser has the investment experience to manage and provide non-investment services (described in Section I) to the Portfolio.
The information below, prepared by Lipper, shows the 1 year gross performance return and ranking of the Portfolio relative to its Lipper Performance Universe (“PU”)12 for the period ended July 31, 2012:
Portfolio Return (%) | PU Median (%) | PU Rank | ||||||||
| Municipal Income Shares 1 Year | 18.81 | 12.32 | 1/35 | |||||||
Set forth below are the 1 year and since inception net performance returns of the Portfolio (in bold)13 versus its benchmark.14 Portfolio and benchmark volatility and reward-to-variability ratio (“Sharpe Ratio”) information is also shown.15
| 11 | The two dimensional analysis showed patterns of lower advisory fees for funds with larger asset sizes and funds from larger family sizes compared to funds with smaller asset sizes and funds from smaller family sizes, which according to the independent consultant is indicative of a sharing of economies of scale and scope. However, in less liquid and active markets, such is not the case, as the empirical analysis showed potential for diseconomies of scale in those markets. The empirical analysis also showed diminishing economies of scale and scope as funds surpassed a certain high level of assets. |
| 12 | The Portfolio’s PU includes peers with the same Lipper investment classification/objective and load type as the Portfolio. |
| 13 | The performance returns of the Portfolio were provided Lipper. Lipper maintains its own database that includes the Portfolio’s performance returns. |
| 14 | The Adviser provided Portfolio and benchmark performance return information for the periods through July 31, 2012. |
| 15 | Portfolio and benchmark volatility and Sharpe Ratio information was obtained through Lipper LANA, a database maintained by Lipper. Volatility is a statistical measure of the tendency of a market price or yield to vary over time. A Sharpe Ratio is a risk adjusted measure of return that divides a fund’s return in excess of the riskless return by the fund’s standard deviation. A portfolio with a greater volatility would be viewed as more risky than a portfolio with equivalent performance but lower volatility; for that reason, a greater return would be demanded for the more risky fund. A portfolio with a higher Sharpe Ratio would be viewed as better performing than a fund with a lower Sharpe Ratio. |
| ALLIANCEBERNSTEIN MUNICIPAL INCOME SHARES • | 67 |
Periods Ending July 31, 2012 Annualized Net Performance (%) | ||||||||||||||||||||
| 1 Year (%) | Since Inception (%) | Volatility (%) | Sharpe (%) | Risk Period (Year) | ||||||||||||||||
| Municipal Income Shares | 18.76 | 10.47 | 3.75 | 4.62 | 1 | |||||||||||||||
| Barclays Capital Municipal Bond Index | 10.51 | 5.90 | 3.15 | 3.04 | 1 | |||||||||||||||
| Inception Date: September 1, 2010 | ||||||||||||||||||||
CONCLUSION:
Based on the factors discussed above the Senior Officer’s conclusion is that the Investment Advisory Agreement for the Portfolio is reasonable and within the range of what would have been negotiated at arm’s-length in light of all the surrounding circumstances. This conclusion with respect to the Portfolio is based on an evaluation of all of these factors and no single factor was dispositive.
Dated: December 3, 2012
| 68 | • ALLIANCEBERNSTEIN MUNICIPAL INCOME SHARES |
THIS PAGE IS NOT PART OF THE SHAREHOLDER REPORT OR THE FINANCIAL STATEMENTS
ALLIANCEBERNSTEIN FAMILY OF FUNDS
Wealth Strategies
Balanced Wealth Strategy
Conservative Wealth Strategy
Wealth Appreciation Strategy
Tax-Managed Balanced Wealth Strategy
Tax-Managed Conservative Wealth Strategy
Tax-Managed Wealth Appreciation Strategy
Asset Allocation/Multi-Asset Funds
Emerging Markets Multi-Asset Portfolio
International Portfolio
Tax-Managed International Portfolio
Growth Funds
Domestic
Discovery Growth Fund**
Growth Fund
Large Cap Growth Fund
Select US Equity Portfolio
Small Cap Growth Portfolio
Global & International
Global Thematic Growth Fund
International Discovery Equity Portfolio
International Growth Fund
Value Funds
Domestic
Core Opportunities Fund
Discovery Value Fund**
Equity Income Fund
Growth & Income Fund
Value Fund
Global & International
Emerging Markets Equity Portfolio
Global Value Fund
International Value Fund
Taxable Bond Funds
Bond Inflation Strategy
Global Bond Fund
High Income Fund
Intermediate Bond Portfolio
Limited Duration High Income Portfolio
Short Duration Portfolio
Municipal Bond Funds
Arizona Portfolio California Portfolio High Income Portfolio Massachusetts Portfolio Michigan Portfolio Minnesota Portfolio Municipal Bond Inflation Strategy | National Portfolio New Jersey Portfolio New York Portfolio Ohio Portfolio Pennsylvania Portfolio Virginia Portfolio |
Intermediate Municipal Bond Funds
Intermediate California Portfolio
Intermediate Diversified Portfolio
Intermediate New York Portfolio
Closed-End Funds
Alliance California Municipal Income Fund
Alliance New York Municipal Income Fund
AllianceBernstein Global High Income Fund
AllianceBernstein Income Fund
AllianceBernstein National Municipal Income Fund
Alternatives
Dynamic All Market Fund
Global Real Estate Investment Fund
Global Risk Allocation Fund**
Market Neutral Strategy-Global
Market Neutral Strategy-U.S.
Real Asset Strategy
Select US Long/Short Portfolio
Unconstrained Bond Fund
Retirement Strategies
2000 Retirement Strategy | 2020 Retirement Strategy | 2040 Retirement Strategy | ||
2005 Retirement Strategy | 2025 Retirement Strategy | 2045 Retirement Strategy | ||
2010 Retirement Strategy | 2030 Retirement Strategy | 2050 Retirement Strategy | ||
2015 Retirement Strategy | 2035 Retirement Strategy | 2055 Retirement Strategy |
We also offer Exchange Reserves,* which serves as the money market fund exchange vehicle for the AllianceBernstein mutual funds.
Investors should consider the investment objectives, risks, charges and expenses of the Fund carefully before investing. For copies of our prospectus or summary prospectus, which contain this and other information, visit us online at www.alliancebernstein.com or contact your AllianceBernstein investments representative. Please read the prospectus and/or summary prospectus carefully before investing.
| * | An investment in Exchange Reserves is not a deposit in a bank and is not insured or guaranteed by the Federal Deposit Insurance Corporation or any other government agency. Although the Fund seeks to preserve the value of your investment at $1.00 per share, it is possible to lose money by investing in the Fund. |
| ** | Prior to October 8, 2012, Global Risk Allocation Fund was named Balanced Shares. Prior to November 1, 2012, Discovery Growth Fund was named Small/Mid Cap Growth Fund and Discovery Value Fund was named Small/Mid Cap Value Fund. |
| ALLIANCEBERNSTEIN MUNICIPAL INCOME SHARES • | 69 |
AllianceBernstein Family of Funds
NOTES
| 70 | • ALLIANCEBERNSTEIN MUNICIPAL INCOME SHARES |
NOTES
| ALLIANCEBERNSTEIN MUNICIPAL INCOME SHARES • | 71 |
NOTES
| 72 | • ALLIANCEBERNSTEIN MUNICIPAL INCOME SHARES |
NOTES
| ALLIANCEBERNSTEIN MUNICIPAL INCOME SHARES • | 73 |
NOTES
| 74 | • ALLIANCEBERNSTEIN MUNICIPAL INCOME SHARES |
NOTES
| ALLIANCEBERNSTEIN MUNICIPAL INCOME SHARES • | 75 |
NOTES
| 76 | • ALLIANCEBERNSTEIN MUNICIPAL INCOME SHARES |
ALLIANCEBERNSTEIN MUNICIPAL INCOME SHARES
1345 Avenue of the Americas
New York, NY 10105
800.221.5672
| MIS-0151-0413 |  | |
ANNUAL REPORT
AllianceBernstein
Taxable Multi-Sector Income Shares
April 30, 2013
Annual Report

Investment Products Offered
•Are Not FDIC Insured •May Lose Value •Are Not Bank Guaranteed |
Investors should consider the investment objectives, risks, charges and expenses of the Fund carefully before investing. For copies of our prospectus or summary prospectus, which contain this and other information, visit us online at www.alliancebernstein.com or contact your AllianceBernstein Investments representative. Please read the prospectus and/or summary prospectus carefully before investing.
This shareholder report must be preceded or accompanied by the Fund’s prospectus for individuals who are not current shareholders of the Fund.
You may obtain a description of the Fund’s proxy voting policies and procedures, and information regarding how the Fund voted proxies relating to portfolio securities during the most recent 12-month period ended June 30, without charge. Simply visit AllianceBernstein’s website at www.alliancebernstein.com, or go to the Securities and Exchange Commission’s (the “Commission”) website at www.sec.gov, or call AllianceBernstein at (800) 227-4618.
The Fund files its complete schedule of portfolio holdings with the Commission for the first and third quarters of each fiscal year on Form N-Q. The Fund’s Forms N-Q are available on the Commission’s website at www.sec.gov. The Fund’s Forms N-Q may also be reviewed and copied at the Commission’s Public Reference Room in Washington, DC; information on the operation of the Public Reference Room may be obtained by calling (800) SEC-0330.
AllianceBernstein Investments, Inc. (ABI) is the distributor of the AllianceBernstein family of mutual funds. ABI is a member of FINRA and is an affiliate of AllianceBernstein L.P., the manager of the funds.
AllianceBernstein® and the AB Logo are registered trademarks and service marks used by permission of the owner, AllianceBernstein L.P.
June 18, 2013
Annual Report
This report provides management’s discussion of fund performance for AllianceBernstein Taxable Multi-Sector Income Shares (the “Fund”) for the annual reporting period ended April 30, 2013. Please note, shares of this Fund are offered exclusively through registered investment advisers approved by AllianceBernstein L.P. (the “Adviser”).
Investment Objectives and Policies
The Fund’s investment objective is to generate income and price appreciation. The Fund invests, under normal circumstances, at least 80% of its net assets in fixed-income securities. The Fund may invest in a broad range of securities in both developed and emerging markets. The Fund may invest across all fixed-income sectors, including corporate and U.S. and non-U.S. government securities. The Fund may invest up to 50% of its assets in below investment grade bonds (“junk bonds”). The Fund expects to invest in readily marketable fixed-income securities with a range of maturities from short- to long-term.
The Fund may invest without limit in U.S. dollar-denominated foreign fixed-income securities and may invest up to 50% of its assets in non-U.S. dollar-denominated foreign fixed-income securities. These investments may include, in each case, developed and emerging market debt securities.
The Fund may invest in mortgage-related and other asset-backed securities, loan participations, inflation-protected securities, structured securities, variable, floating, and inverse floating rate instruments
and preferred stock, and may use other investment techniques. The Fund may use leverage for investment purposes. The Fund intends, among other things, to enter into transactions such as reverse repurchase agreements, forward contracts, and dollar rolls. The Fund may invest, without limit, in derivatives, such as options, futures, forwards, or swap agreements.
Currencies can have a dramatic effect on returns of non-U.S. dollar-denominated fixed-income securities, significantly adding to returns in some years and greatly diminishing them in others. The Adviser evaluates currency and fixed-income positions separately and may seek to hedge the currency exposure resulting from the Fund’s fixed-income securities positions when it finds the currency exposure unattractive. To hedge a portion of its currency risk, the Fund may from time to time invest in currency-related derivatives, including forward currency exchange contracts, futures, options on futures, swaps and options. The Adviser may also seek investment opportunities by taking long or short positions in currencies through the use of currency-related derivatives.
The Adviser selects securities for purchase or sale based on its assessment of the securities’ risk and return characteristics as well as the securities’ impact on the overall risk and return characteristics of the Fund. In making this assessment, the Adviser takes into account various factors including the credit quality and sensitivity to interest rates of the securities under consideration and of the Fund’s other holdings.
| ALLIANCEBERNSTEIN TAXABLE MULTI-SECTOR INCOME SHARES • | 1 |
Investment Results
The table on page 6 shows the Fund’s performance compared to its benchmark, the Barclays U.S. Aggregate ex-Government Bond Index, for the six- and 12-month periods ended April 30, 2013.
The Fund underperformed its benchmark for both periods. During the 12-month period, the Fund transitioned to a low-duration, high-grade investment focus which excludes government securities. Prior to the transition, the Fund’s investments focused primarily on corporate holdings. The Fund’s cash positions and shorter-than-benchmark duration positioning detracted for both periods. Security selection in both investment-grade corporate and commercial mortgage-backed securities (“CMBS”) holdings also detracted for both periods, while an underweight position to agency mortgages contributed positively.
Derivatives in the form of Treasury futures were utilized to manage duration and yield curve positioning during both periods. Yield curve positioning and duration management had an immaterial impact on performance for both periods.
Market Review and Investment Strategy
Global equity and bond markets advanced during the 12-month period ended April 30, 2013, largely driven by improved investor sentiment and the gradual return to riskier assets. As measured by the benchmark, U.S. fixed-income markets posted positive returns for the period with credit sectors outperforming government bonds. U.S.
Treasuries returned 2.56%, as measured within the Barclays U.S. Treasury Index, as Treasury yields ended the period relatively unchanged. Spreads in non-government sectors continued to tighten with investment-grade corporates, particularly financials, performing well. High-yield corporates posted strong returns as risk aversion ebbed and investors reached for yield.
Investors were relatively unaffected by fresh political and systemic concerns in the euro area. Policy and political developments, rather than an acceleration of global economic growth, were the main drivers. The willingness of political leaders to address the structural flaws of the euro zone, along with the continued global monetary easing cycle led by the U.S. Federal Reserve (the “Fed”) and the European Central Bank (“ECB”), lifted investor confidence for much of the period.
In Europe, the threat of a worst-case outcome for the euro was reduced. The ECB’s Outright Monetary Transactions program and more support for Greece alleviated fears of a euro breakup. China’s slowdown appeared to have bottomed out; in the view of the Core Fixed Income Team (the “Team”), housing starts, corporate bond issuance and a steady yuan should support 7%-8% growth. In Japan, equity markets gained as the yen weakened amid expectations of a monetary policy shift following the Liberal Democratic Party’s victory in the December elections. After appointing a new governor and deputy governor for the Bank of Japan (“BOJ”), the Japanese government began to implement
| 2 | • ALLIANCEBERNSTEIN TAXABLE MULTI-SECTOR INCOME SHARES |
Prime Minister Shinzo Abe’s aggressive stimulatory policies. This led to a weakening of the yen, while expectations that the BOJ would include longer-dated Japanese government bonds (“JGBs”) in its asset purchase program caused JGBs to rally.
U.S. financial markets continued to rebound, approaching new highs for the equity market late in the reporting period, despite investors’ concerns about slowing corporate earnings growth and continued political dysfunction. While the American Taxpayer Relief Act of 2012, passed by the Senate and House of Representatives in January 2013, averted the most feared outcomes of the “fiscal cliff”, it did not tackle spending or debt-reduction issues which remain unresolved.
In the Team’s view, U.S. monetary policy could create additional market
uncertainty in the coming year, as the Fed reverses certain of the measures taken as a result of the 2008 global financial crisis. The Federal Funds rate has been reduced to near zero percent and the Fed has, among other actions taken, purchased U.S. Treasury and mortgage-backed securities. The latter is commonly referred to as Quantitative Easing (“QE”). These policies have been beneficial to fixed-income securities, including the securities held in this Fund. When the Fed removes certain of these measures, there may be downward pressure on prices of fixed-income securities, including those held in the Fund. The timing and the reversal of QE and the potential increase of the Federal Funds rate may impact the net asset value (“NAV”) of this Fund. These and other risks to the Fund are discussed further in this report.
| ALLIANCEBERNSTEIN TAXABLE MULTI-SECTOR INCOME SHARES • | 3 |
DISCLOSURES AND RISKS
Benchmark Disclosure
The unmanaged Barclays U.S. Aggregate ex-Government Bond Index does not reflect fees and expenses associated with the active management of a fund. The Barclays U.S. Aggregate ex-Government Bond Index represents the performance of securities within the U.S. investment-grade fixed-rate bond market, with index components for corporate securities, mortgage pass-through securities, asset-backed securities, and commercial mortgage backed securities. An investor cannot invest directly in an index, and its results are not indicative of the performance for any specific investment, including the Fund.
A Word About Risk
Market Risk: The value of the Fund’s assets will fluctuate as the stock or bond market fluctuates. The value of the Fund’s investments may decline, sometimes rapidly and unpredictably, simply because of economic changes or other events that affect large portions of the market.
Interest Rate Risk: Changes in interest rates will affect the value of investments in fixed-income securities. When interest rates rise, the value of investments in fixed-income securities tend to fall and this decrease in value may not be offset by higher income from new investments. Interest rate risk is generally greater for fixed-income securities with longer maturities or durations.
Credit Risk: An issuer or guarantor of a fixed-income security, or the counterparty to a derivatives or other contract, may be unable or unwilling to make timely payments of interest or principal, or to otherwise honor its obligations. The issuer or guarantor may default causing a loss of the full principal amount of a security. The degree of risk for a particular security may be reflected in its credit rating. There is the possibility that the credit rating of a fixed-income security may be downgraded after purchase, which may adversely affect the value of the security. Investments in fixed-income securities with lower ratings tend to have a higher probability that an issuer will default or fail to meet its payment obligations.
Below Investment Grade Securities: Investments in fixed-income securities with lower ratings (commonly known as “junk bonds”) tend to have a higher probability that an issuer will default or fail to meet its payment obligations. These securities may be subject to greater price volatility due to such factors as specific corporate developments, interest rate sensitivity, negative perceptions of the junk bond market generally and less secondary market liquidity.
Inflation Risk: This is the risk that the value of assets or income from investments will be less in the future as inflation decreases the value of money. As inflation increases, the value of the Fund’s assets can decline as can the value of the Fund’s distributions. This risk is significantly greater for fixed-income securities with longer maturities.
Foreign (Non-U.S.) Risk: Investment in securities of non-U.S. issuers may involve more risk than those of U.S. issuers. These securities may fluctuate more widely in price and may be less liquid due to adverse market, economic, political, regulatory or other factors.
Emerging Market Risk: Investments in emerging market countries may have more risk because the markets are less developed and less liquid as well as being subject to increased economic, political, regulatory or other uncertainties.
Currency Risk: Fluctuations in currency exchange risk may negatively affect the value of the Fund’s investments or reduce its returns.
Prepayment Risk: The value of mortgage-related or asset-backed securities may be particularly sensitive to changes in prevailing interest rates. Early payments of principal on some mortgage-related securities may occur during periods of falling mortgage
(Disclosures, Risks and Note about Historical Performance continued on next page)
| 4 | • ALLIANCEBERNSTEIN TAXABLE MULTI-SECTOR INCOME SHARES |
Disclosures and Risks
DISCLOSURES AND RISKS
(continued from previous page)
interest rates and expose the Fund to a lower rate of return upon reinvestment of principal. Early payments associated with mortgage-related securities cause these securities to experience significantly greater price and yield volatility than is experienced by traditional fixed-income securities. During periods of rising interest rates, a reduction in prepayments may increase the effective life of mortgage-related securities, subjecting them to greater risk of decline in market value in response to rising interest rates. If the life of a mortgage-related security is inaccurately predicted, the Fund may not be able to realize the rate of return it expected.
Derivatives Risk: Investments in derivatives may be illiquid, difficult to price, and leveraged so that small changes may produce disproportionate losses for the Fund, and may be subject to counterparty risk to a greater degree than more traditional investments.
Leverage Risk: To the extent the Fund uses leveraging techniques, its NAV may be more volatile because leverage tends to exaggerate the effect of changes in interest rates and any increase or decrease in the value of the Fund’s investments.
Management Risk: The Fund is subject to management risk because it is an actively managed investment fund. The Adviser will apply its investment techniques and risk analyses in making investment decisions, but there is no guarantee that its techniques will produce the intended results.
These risks are fully discussed in the Fund’s prospectus.
An Important Note About Historical Performance
The investment return and principal value of an investment in the Fund will fluctuate, so that shares, when redeemed, may be worth more or less than their original cost. Performance shown on the following pages represents past performance and does not guarantee future results. Current performance may be lower or higher than the performance information shown. You may obtain performance information current to the most recent month-end by calling (800) 227-4618. Performance assumes reinvestment of distributions and does not account for taxes.
Investors should consider the investment objectives, risks, charges and expenses of the Fund carefully before investing. For copies of our prospectus and/or summary prospectus, which contain this and other information, visit us online at www.alliancebernstein.com or contact your AllianceBernstein Investments representative. Please read the prospectus and/or summary prospectus carefully before investing.
| ALLIANCEBERNSTEIN TAXABLE MULTI-SECTOR INCOME SHARES • | 5 |
Disclosures and Risks
HISTORICAL PERFORMANCE
| THE FUND VS. ITS BENCHMARK PERIODS ENDED APRIL 30, 2013 | NAV Returns | |||||||||
| 6 Months | 12 Months | |||||||||
AllianceBernstein Taxable Multi-Sector | 0.33% | 2.47% | ||||||||
| ||||||||||
Barclays U.S. Aggregate ex-Government | 1.00% | 4.51% | ||||||||
GROWTH OF A $10,000 INVESTMENT IN THE FUND
9/15/10* TO 4/30/13
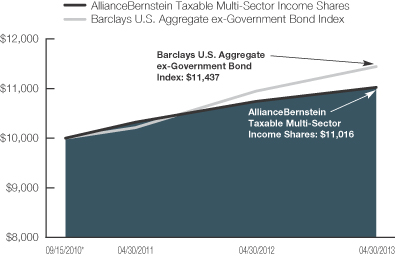
This chart illustrates the total value of an assumed $10,000 investment in AllianceBernstein Taxable Multi-Sector Income Shares (from 9/15/10* to 04/30/13) as compared to the performance of the Fund’s benchmark.
| * | Inception date: 9/15/2010. |
See Disclosures, Risks and Note about Historical Performance on pages 4-5.
(Historical Performance continued on next page)
| 6 | • ALLIANCEBERNSTEIN TAXABLE MULTI-SECTOR INCOME SHARES |
Historical Performance
HISTORICAL PERFORMANCE
(continued from previous page)
| AVERAGE ANNUAL RETURNS AS OF APRIL 30, 2013 | ||||
| NAV Returns | ||||
1 Year | 2.47 | % | ||
Since Inception* | 3.76 | % | ||
| SEC AVERAGE ANNUAL RETURNS (WITH ANY APPLICABLE SALES CHARGES) AS OF THE MOST RECENT CALENDAR QUARTER-END (MARCH 31, 2013) | ||||
| SEC Returns | ||||
1 Year | 3.54 | % | ||
Since Inception* | 3.80 | % | ||
The Fund’s current prospectus fee table shows the fees and the total fund operating expenses as 0.00% because the Adviser does not charge any fees or expenses and reimburses or pays Fund operating expenses. Participants in a wrap fee program or other investment program eligible to invest in the Fund pay fees to the program sponsor and should review the program brochure or other literature provided by the sponsor for a discussion of fees and expenses charged.
| * | Inception date: 9/15/2010. |
See Disclosures, Risks and Note about Historical Performance on pages 4-5.
| ALLIANCEBERNSTEIN TAXABLE MULTI-SECTOR INCOME SHARES • | 7 |
Historical Performance
EXPENSE EXAMPLE
(unaudited)
As a shareholder of the Fund, you may incur various ongoing non-operating and extraordinary costs. This example is intended to help you understand your ongoing costs (in dollars) of investing in the Fund and to compare these costs with the ongoing costs of investing in other mutual funds.
The Example is based on an investment of $1,000 invested at the beginning of the period and held for the entire period as indicated below.
Actual Expenses
The table below provides information about actual account values and actual expenses. You may use the information in this line, together with the amount you invested, to estimate the expenses that you paid over the period. Simply divide your account value by $1,000 (for example, an $8,600 account value divided by $1,000 = 8.6), then multiply the result by the number in the first line under the heading entitled “Expenses Paid During Period” to estimate the expenses you paid on your account during this period.
Hypothetical Example for Comparison Purposes
The table below provides information about hypothetical account values and hypothetical expenses based on the Fund’s actual expense ratio and an assumed annual rate of return of 5% before expenses, which is not the Fund’s actual return. The hypothetical account values and expenses may not be used to estimate the actual ending account balance or expenses you paid for the period. You may use this information to compare the ongoing costs of investing in the Fund and other funds by comparing this 5% hypothetical example with the 5% hypothetical examples that appear in the shareholder reports of other funds.
Please note that the expenses shown in the table are meant to highlight your ongoing costs only and do not reflect any transactional costs, such as sales charges (loads), or contingent deferred sales charges on redemptions. Therefore, the hypothetical example is useful in comparing ongoing costs only, and will not help you determine the relative total costs of owning different funds. In addition, if these transactional costs were included, your costs would have been higher.
| Beginning Account Value November 1, 2012 | Ending Account Value April 30, 2013 | Expenses Paid During Period* | Annualized Expense Ratio* | |||||||||||||
Actual | $ | 1,000 | $ | 1,003.30 | $ | – 0 | – | 0.00 | % | |||||||
Hypothetical** | $ | 1,000 | $ | 1,024.79 | $ | – 0 | – | 0.00 | % | |||||||
| * | Expenses are equal to the Portfolio’s annualized expense ratio multiplied by the average account value over the period, multiplied by 181/365 (to reflect the one-half year period). The Portfolio’s expenses are borne by the Adviser or its affiliates. |
| ** | Assumes 5% annual return before expenses. |
| 8 | • ALLIANCEBERNSTEIN TAXABLE MULTI-SECTOR INCOME SHARES |
Expense Example
PORTFOLIO SUMMARY
April 30, 2013 (unaudited)
PORTFOLIO STATISTICS
Net Assets ($mil): $67.8
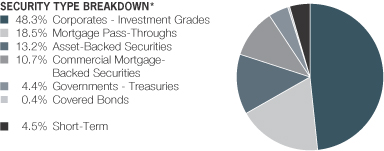
| * | All data are as of April 30, 2013. The Fund’s security type breakdown is expressed as a percentage of total investments and may vary over time. The Fund also enters into derivative transactions, which may be used for hedging or investment purposes (see “Portfolio of Investments” section of the report for additional details). |
| ALLIANCEBERNSTEIN TAXABLE MULTI-SECTOR INCOME SHARES • | 9 |
Portfolio Summary
PORTFOLIO OF INVESTMENTS
April 30, 2013
| Principal Amount (000) | U.S. $ Value | |||||||
| ||||||||
CORPORATES – INVESTMENT GRADES – 48.3% |
| |||||||
Industrial – 25.1% | ||||||||
Basic – 1.6% | ||||||||
Dow Chemical Co. (The) | $ | 335 | $ | 364,993 | ||||
Ecolab, Inc. | 355 | 364,364 | ||||||
PPG Industries, Inc. | 280 | 345,529 | ||||||
|
| |||||||
| 1,074,886 | ||||||||
|
| |||||||
Capital Goods – 1.6% | ||||||||
Caterpillar Financial Services Corp. | 365 | 368,788 | ||||||
Precision Castparts Corp. | 367 | 368,042 | ||||||
Republic Services, Inc. | 310 | 341,307 | ||||||
|
| |||||||
| 1,078,137 | ||||||||
|
| |||||||
Communications - Media – 2.9% | ||||||||
CBS Corp. | 365 | 372,668 | ||||||
DirecTV Holdings LLC/DirecTV Financing Co., Inc. | 340 | 358,504 | ||||||
NBCUniversal Enterprise, Inc. | 270 | 271,162 | ||||||
NBCUniversal Media LLC | 345 | 365,370 | ||||||
News Amer, Inc. | 240 | 257,953 | ||||||
Time Warner Cable, Inc. | 315 | 367,560 | ||||||
|
| |||||||
| 1,993,217 | ||||||||
|
| |||||||
Communications - Telecommunications – 2.5% |
| |||||||
AT&T, Inc. | ||||||||
1.40%, 12/01/17 | 300 | 301,355 | ||||||
5.625%, 6/15/16 | 320 | 364,685 | ||||||
Verizon Communications, Inc. | 366 | 369,816 | ||||||
Vodafone Group PLC | ||||||||
1.25%, 9/26/17 | 370 | 367,828 | ||||||
5.375%, 1/30/15 | 261 | 282,031 | ||||||
|
| |||||||
| 1,685,715 | ||||||||
|
| |||||||
Consumer Cyclical - Automotive – 1.8% | ||||||||
Daimler Finance North America LLC | 265 | 266,204 | ||||||
Nissan Motor Acceptance Corp. | 345 | 366,900 | ||||||
Toyota Motor Credit Corp. | 365 | 369,636 | ||||||
| 10 | • ALLIANCEBERNSTEIN TAXABLE MULTI-SECTOR INCOME SHARES |
Portfolio of Investments
| Principal Amount (000) | U.S. $ Value | |||||||
| ||||||||
Volkswagen International Finance NV | $ | 200 | $ | 200,834 | ||||
|
| |||||||
| 1,203,574 | ||||||||
|
| |||||||
Consumer Cyclical - Entertainment – 1.0% | ||||||||
Viacom, Inc. | 295 | 338,574 | ||||||
Walt Disney Co. (The) | 354 | 363,261 | ||||||
|
| |||||||
| 701,835 | ||||||||
|
| |||||||
Consumer Cyclical - Other – 0.5% | ||||||||
Carnival Corp. | 360 | 361,220 | ||||||
|
| |||||||
Consumer Cyclical - Retailers – 1.8% | ||||||||
CVS Caremark Corp. | 340 | 357,111 | ||||||
Wal-Mart Stores, Inc. | 595 | 596,247 | ||||||
Walgreen Co. | 245 | 246,534 | ||||||
|
| |||||||
| 1,199,892 | ||||||||
|
| |||||||
Consumer Non-Cyclical – 7.8% | ||||||||
AbbVie, Inc. | 305 | 310,956 | ||||||
Allergan, Inc./United States | 381 | 383,728 | ||||||
Altria Group, Inc. | 340 | 365,985 | ||||||
Amgen, Inc. | 355 | 369,481 | ||||||
Anheuser-Busch InBev Finance, Inc. | 370 | 371,601 | ||||||
Coca-Cola Enterprises, Inc. | 225 | 231,695 | ||||||
Eli Lilly & Co. | 355 | 366,610 | ||||||
Gilead Sciences, Inc. | ||||||||
2.40%, 12/01/14 | 300 | 308,174 | ||||||
3.05%, 12/01/16 | 340 | 364,956 | ||||||
Kroger Co. (The) | 320 | 342,031 | ||||||
McKesson Corp. | 367 | 368,773 | ||||||
Novartis Capital Corp. | 355 | 365,047 | ||||||
PepsiCo, Inc. | 370 | 371,465 | ||||||
Sanofi | 365 | 369,490 | ||||||
Thermo Fisher Scientific, Inc. | 350 | 364,382 | ||||||
|
| |||||||
| 5,254,374 | ||||||||
|
| |||||||
| ALLIANCEBERNSTEIN TAXABLE MULTI-SECTOR INCOME SHARES • | 11 |
Portfolio of Investments
| Principal Amount (000) | U.S. $ Value | |||||||
| ||||||||
Energy – 2.1% | ||||||||
BP Capital Markets PLC | $ | 370 | $ | 369,899 | ||||
Chevron Corp. | 370 | 371,724 | ||||||
ConocoPhillips | 355 | 366,625 | ||||||
Marathon Petroleum Corp. | 320 | 342,173 | ||||||
|
| |||||||
| 1,450,421 | ||||||||
|
| |||||||
Technology – 1.5% | ||||||||
Cisco Systems, Inc. | 350 | 363,790 | ||||||
Hewlett-Packard Co. | 365 | 367,058 | ||||||
Texas Instruments, Inc. | 305 | 308,441 | ||||||
|
| |||||||
| 1,039,289 | ||||||||
|
| |||||||
| 17,042,560 | ||||||||
|
| |||||||
Financial Institutions – 21.6% | ||||||||
Banking – 16.1% | ||||||||
ABN AMRO Bank NV | 350 | 350,610 | ||||||
Australia & New Zealand Banking Group Ltd. | 250 | 251,110 | ||||||
Bank of America Corp. | ||||||||
1.25%, 1/11/16 | 655 | 655,204 | ||||||
Series 1 | ||||||||
3.75%, 7/12/16 | 290 | 308,499 | ||||||
Bank of New York Mellon Corp. (The) | 310 | 309,492 | ||||||
Barclays Bank PLC | 380 | 401,429 | ||||||
BB&T Corp. | 300 | 326,849 | ||||||
Citigroup, Inc. | ||||||||
1.30%, 4/01/16 | 740 | 743,844 | ||||||
3.953%, 6/15/16 | 340 | 368,133 | ||||||
Fifth Third Bancorp | 345 | 369,036 | ||||||
Goldman Sachs Group, Inc. (The) | ||||||||
1.60%, 11/23/15 | 645 | 653,741 | ||||||
3.625%, 2/07/16 | 345 | 367,378 | ||||||
HSBC USA, Inc. | 390 | 401,793 | ||||||
ING Bank NV | 285 | 284,498 | ||||||
JPMorgan Chase & Co. | ||||||||
3.40%, 6/24/15 | 350 | 368,202 | ||||||
Series G | ||||||||
1.10%, 10/15/15 | 705 | 707,879 | ||||||
| 12 | • ALLIANCEBERNSTEIN TAXABLE MULTI-SECTOR INCOME SHARES |
Portfolio of Investments
| Principal Amount (000) | U.S. $ Value | |||||||
| ||||||||
KeyBank NA/Cleveland OH | $ | 250 | $ | 254,035 | ||||
Lloyds TSB Bank PLC | 225 | 248,511 | ||||||
Manufacturers & Traders Trust Co. | 310 | 312,118 | ||||||
Morgan Stanley | 530 | 533,805 | ||||||
3.80%, 4/29/16 | 345 | 367,086 | ||||||
PNC Funding Corp. | 345 | 364,329 | ||||||
Royal Bank of Canada | 365 | 370,305 | ||||||
Royal Bank of Scotland Group PLC | 254 | 261,635 | ||||||
SunTrust Banks, Inc. | 340 | 364,523 | ||||||
UBS AG/Stamford CT | 380 | 399,482 | ||||||
Wells Fargo & Co. | 190 | 193,332 | ||||||
3.676%, 6/15/16 | 334 | 361,060 | ||||||
|
| |||||||
| 10,897,918 | ||||||||
|
| |||||||
Brokerage – 0.6% | ||||||||
Nomura Holdings, Inc. | 425 | 427,231 | ||||||
|
| |||||||
Finance – 0.8% | ||||||||
General Electric Capital Corp. | 265 | 265,506 | ||||||
1.625%, 7/02/15 | 305 | 310,710 | ||||||
|
| |||||||
| 576,216 | ||||||||
|
| |||||||
Insurance – 3.3% | ||||||||
Berkshire Hathaway, Inc. | 365 | 371,274 | ||||||
Coventry Health Care, Inc. | 345 | 367,603 | ||||||
Hartford Financial Services Group, Inc. | 250 | 264,575 | ||||||
MetLife Institutional Funding II | 265 | 265,283 | ||||||
New York Life Global Funding | 250 | 250,659 | ||||||
Prudential Financial, Inc. | 330 | 359,497 | ||||||
WellPoint, Inc. | 351 | 365,585 | ||||||
|
| |||||||
| 2,244,476 | ||||||||
|
| |||||||
| ALLIANCEBERNSTEIN TAXABLE MULTI-SECTOR INCOME SHARES • | 13 |
Portfolio of Investments
| Principal Amount (000) | U.S. $ Value | |||||||
| ||||||||
REITS – 0.8% | ||||||||
HCP, Inc. | $ | 243 | $ | 260,304 | ||||
Health Care REIT, Inc. | 247 | 262,688 | ||||||
|
| |||||||
| 522,992 | ||||||||
|
| |||||||
| 14,668,833 | ||||||||
|
| |||||||
Utility – 1.6% | ||||||||
Electric – 0.4% | ||||||||
Consumers Energy Co. | 250 | 270,333 | ||||||
|
| |||||||
Natural Gas – 1.2% | ||||||||
Kinder Morgan Energy Partners LP | 201 | 214,811 | ||||||
TransCanada PipeLines Ltd. | 300 | 300,176 | ||||||
Williams Partners LP | 270 | 283,862 | ||||||
|
| |||||||
| 798,849 | ||||||||
|
| |||||||
| 1,069,182 | ||||||||
|
| |||||||
Total Corporates – Investment Grades | 32,780,575 | |||||||
|
| |||||||
MORTGAGE PASS-THROUGHS – 18.5% | ||||||||
Agency Fixed Rate 15-Year – 13.3% | ||||||||
Federal Home Loan Mortgage Corp. Gold | 356 | 376,176 | ||||||
Federal National Mortgage Association | 1,004 | 1,054,339 | ||||||
3.00%, 3/01/27-10/01/27 | 388 | 411,118 | ||||||
3.50%, 3/01/26-2/01/27 | 1,246 | 1,335,915 | ||||||
Series 2009 | ||||||||
4.00%, 9/01/24 | 162 | 175,345 | ||||||
Series 2010 | ||||||||
3.00%, 1/01/26 | 1,050 | 1,121,433 | ||||||
4.00%, 11/01/25 | 197 | 210,941 | ||||||
Series 2012 | ||||||||
3.00%, 12/01/22-8/01/27 | 2,334 | 2,473,228 | ||||||
Series 2013 | ||||||||
2.50%, 2/01/23-5/01/23 | 1,756 | 1,844,754 | ||||||
|
| |||||||
| 9,003,249 | ||||||||
|
| |||||||
Agency ARMs – 4.9% | ||||||||
Federal Home Loan Mortgage Corp. | 634 | 655,397 | ||||||
3.50%, 6/01/40(c) | 606 | 643,705 | ||||||
Series 2010 | ||||||||
3.953%, 5/01/40(c) | 653 | 698,097 | ||||||
| 14 | • ALLIANCEBERNSTEIN TAXABLE MULTI-SECTOR INCOME SHARES |
Portfolio of Investments
| Principal Amount (000) | U.S. $ Value | |||||||
| ||||||||
Federal National Mortgage Association | $ | 644 | $ | 679,598 | ||||
Series 2012 | ||||||||
2.426%, 8/01/42(b) | 628 | 655,671 | ||||||
|
| |||||||
| 3,332,468 | ||||||||
|
| |||||||
Agency Fixed Rate 30-Year – 0.3% | ||||||||
Federal National Mortgage Association | 139 | 151,501 | ||||||
Series 2008 | 45 | 48,812 | ||||||
|
| |||||||
| 200,313 | ||||||||
|
| |||||||
Total Mortgage Pass-Throughs | 12,536,030 | |||||||
|
| |||||||
ASSET-BACKED SECURITIES – 13.3% | ||||||||
Autos - Fixed Rate – 7.7% | ||||||||
Ally Auto Receivables Trust | 242 | 241,871 | ||||||
Ally Master Owner Trust | 300 | 303,965 | ||||||
Series 2013-1, Class A2 | ||||||||
1.00%, 2/15/18 | 180 | 180,635 | ||||||
AmeriCredit Automobile Receivables Trust | 150 | 150,984 | ||||||
Series 2012-3, Class A3 | ||||||||
0.96%, 1/09/17 | 168 | 169,073 | ||||||
Series 2012-4, Class A2 | ||||||||
0.49%, 4/08/16 | 228 | 228,216 | ||||||
Avis Budget Rental Car Funding AESOP LLC Series 2010-4A, Class A | 300 | 303,349 | ||||||
Series 2012-3A, Class A | ||||||||
2.10%, 3/20/19(a) | 260 | 267,327 | ||||||
Bank of America Auto Trust | 250 | 252,567 | ||||||
CarMax Auto Owner Trust | 225 | 229,515 | ||||||
Exeter Automobile Receivables Trust | 236 | 237,687 | ||||||
Fifth Third Auto Trust | 212 | 212,417 | ||||||
| ALLIANCEBERNSTEIN TAXABLE MULTI-SECTOR INCOME SHARES • | 15 |
Portfolio of Investments
| Principal Amount (000) | U.S. $ Value | |||||||
| ||||||||
Ford Credit Auto Lease Trust | $ | 250 | $ | 250,138 | ||||
Ford Credit Auto Owner Trust | 245 | 247,594 | ||||||
Hertz Vehicle Financing LLC | 350 | 377,069 | ||||||
Series 2013-1A, Class A1 | ||||||||
1.12%, 8/25/17(a) | 175 | 175,751 | ||||||
Hyundai Auto Lease Securitization Trust | 152 | 152,187 | ||||||
Mercedes-Benz Auto Lease Trust | 109 | 108,993 | ||||||
Mercedes-Benz Master Owner Trust | 315 | 315,663 | ||||||
Santander Drive Auto Receivables Trust | 126 | 125,880 | ||||||
Series 2012-5, Class A3 | 280 | 281,005 | ||||||
SMART Trust/Australia | 130 | 130,189 | ||||||
World Omni Automobile Lease Securitization Trust Series 2012-A, Class A3 | 260 | 261,249 | ||||||
|
| |||||||
| 5,203,324 | ||||||||
|
| |||||||
Credit Cards - Fixed Rate – 3.2% | ||||||||
American Express Credit Account Master Trust Series 2012-2, Class A | 250 | 251,094 | ||||||
Chase Issuance Trust | 225 | 227,605 | ||||||
Citibank Credit Card Issuance Trust | 205 | 228,595 | ||||||
Discover Card Master Trust | 200 | 201,257 | ||||||
Dryrock Issuance Trust | 200 | 200,231 | ||||||
| 16 | • ALLIANCEBERNSTEIN TAXABLE MULTI-SECTOR INCOME SHARES |
Portfolio of Investments
| Principal Amount (000) | U.S. $ Value | |||||||
| ||||||||
GE Capital Credit Card Master Note Trust | $ | 300 | $ | 302,771 | ||||
Series 2012-6, Class A | 300 | 304,257 | ||||||
World Financial Network Credit Card Master Trust Series 2012-B, Class A | 300 | 306,702 | ||||||
Series 2013-A, Class A | 150 | 151,804 | ||||||
|
| |||||||
| 2,174,316 | ||||||||
|
| |||||||
Autos - Floating Rate – 1.1% | ||||||||
BMW Floorplan Master Owner Trust | 300 | 300,845 | ||||||
Ford Credit Floorplan Master Owner Trust | 169 | 169,032 | ||||||
GE Dealer Floorplan Master Note Trust | 250 | 251,082 | ||||||
|
| |||||||
| 720,959 | ||||||||
|
| |||||||
Credit Cards - Floating Rate – 0.9% | ||||||||
GE Capital Credit Card Master Note Trust | 285 | 287,526 | ||||||
Gracechurch Card Funding PLC | 300 | 302,446 | ||||||
|
| |||||||
| 589,972 | ||||||||
|
| |||||||
Other ABS - Fixed Rate – 0.4% | ||||||||
CIT Equipment Collateral | 300 | 301,191 | ||||||
|
| |||||||
Total Asset-Backed Securities | 8,989,762 | |||||||
|
| |||||||
COMMERCIAL MORTGAGE-BACKED SECURITIES – 10.7% | ||||||||
Non-Agency Fixed Rate CMBS – 10.7% | ||||||||
Commercial Mortgage Pass Through Certificates | ||||||||
Series 2010-C1, Class A1 | 236 | 247,765 | ||||||
Series 2012-CR3, Class A1 | 138 | 137,679 | ||||||
Series 2012-CR4, Class A1 | 126 | 126,110 | ||||||
Series 2012-CR4, Class A2 | 400 | 408,803 | ||||||
| ALLIANCEBERNSTEIN TAXABLE MULTI-SECTOR INCOME SHARES • | 17 |
Portfolio of Investments
| Principal Amount (000) | U.S. $ Value | |||||||
| ||||||||
Series 2012-CR5, Class A1 | $ | 104 | $ | 103,531 | ||||
Series 2012-CR5, Class A2 | 655 | 667,275 | ||||||
Series 2013-CR6, Class A1 | 231 | 231,508 | ||||||
Series 2013-LC6, Class A1 | 142 | 141,969 | ||||||
DBUBS Mortgage Trust | 260 | 281,225 | ||||||
GS Mortgage Securities Corp. II | 139 | 138,915 | ||||||
Series 2013-GC10, Class A1 | 171 | 170,398 | ||||||
GS Mortgage Securities Trust | 625 | 656,875 | ||||||
JP Morgan Chase Commercial Mortgage Securities Corp. | 282 | 297,822 | ||||||
Series 2011-C3, Class A1 | ||||||||
1.875%, 2/15/46(a) | 146 | 148,300 | ||||||
Series 2012-C8, Class A2 | ||||||||
1.797%, 10/15/45 | 600 | 617,437 | ||||||
Series 2012-LC9, Class A1 | ||||||||
0.67%, 12/15/47 | 22 | 22,381 | ||||||
Series 2013-C10, Class A1 | ||||||||
0.73%, 12/15/47 | 119 | 118,613 | ||||||
Morgan Stanley Bank of America | 650 | 668,060 | ||||||
Series 2013-C7, Class A1 | ||||||||
0.738%, 2/15/46 | 235 | 234,221 | ||||||
Series 2013-C8, Class A1 | ||||||||
0.777%, 12/15/48 | 235 | 236,055 | ||||||
Morgan Stanley Capital I, Inc. | 148 | 149,176 | ||||||
Series 2011-C3, Class A1 | ||||||||
2.178%, 7/15/49 | 272 | 278,047 | ||||||
UBS-Barclays Commercial Mortgage Trust | 115 | 115,297 | ||||||
Series 2013-C5, Class A1 | ||||||||
0.779%, 3/10/46 | 233 | 233,306 | ||||||
WF-RBS Commercial Mortgage Trust | 121 | 123,597 | ||||||
| 18 | • ALLIANCEBERNSTEIN TAXABLE MULTI-SECTOR INCOME SHARES |
Portfolio of Investments
| Principal Amount (000) | U.S. $ Value | |||||||
| ||||||||
Series 2012-C10, Class A1 | ||||||||
0.734%, 12/15/45 | $ | 244 | $ | 244,060 | ||||
Series 2012-C9, Class A1 | ||||||||
0.673%, 11/15/45 | 156 | 156,166 | ||||||
Series 2013-C11, Class A1 | ||||||||
0.799%, 3/15/45 | 112 | 112,209 | ||||||
Series 2013-C12, Class A1 | ||||||||
0.735%, 3/15/48 | 201 | 201,349 | ||||||
|
| |||||||
Total Commercial Mortgage-Backed Securities (cost $7,276,866) | 7,268,149 | |||||||
|
| |||||||
GOVERNMENTS – TREASURIES – 4.4% | ||||||||
United States – 4.4% | ||||||||
U.S. Treasury Notes | 2,505 | 2,507,545 | ||||||
0.75%, 2/28/18 | 485 | 487,539 | ||||||
|
| |||||||
Total Governments – Treasuries | 2,995,084 | |||||||
|
| |||||||
COVERED BONDS – 0.4% | ||||||||
Norway – 0.4% | ||||||||
DNB Boligkreditt AS | 250 | 251,775 | ||||||
|
| |||||||
| Shares | ||||||||
SHORT-TERM INVESTMENTS – 4.5% | ||||||||
Investment Companies – 4.5% | ||||||||
AllianceBernstein Fixed-Income Shares, Inc.–Government STIF Portfolio, 0.09%(d) | 3,041,053 | 3,041,053 | ||||||
|
| |||||||
Total Investments – 100.1% | 67,862,428 | |||||||
Other assets less liabilities – (0.1)% | (71,158 | ) | ||||||
|
| |||||||
Net Assets – 100.0% | $ | 67,791,270 | ||||||
|
| |||||||
FUTURES CONTRACTS (see Note C)
| Type | Number of Contracts | Expiration Month | Original Value | Value at April 30, 2013 | Unrealized Appreciation/ (Depreciation) | |||||||||||||||
Sold Contracts | ||||||||||||||||||||
U.S. T-Note | 54 | June 2013 | $ | 6,685,527 | $ | 6,730,594 | $ | (45,067 | ) | |||||||||||
U.S. T-Note | 12 | June 2013 | 1,568,980 | 1,600,313 | (31,333 | ) | ||||||||||||||
|
| |||||||||||||||||||
| $ | (76,400 | ) | ||||||||||||||||||
|
| |||||||||||||||||||
| ALLIANCEBERNSTEIN TAXABLE MULTI-SECTOR INCOME SHARES • | 19 |
Portfolio of Investments
| (a) | Security is exempt from registration under Rule 144A of the Securities Act of 1933. These securities are considered liquid and may be resold in transactions exempt from registration, normally to qualified institutional buyers. At April 30, 2013, the aggregate market value of these securities amounted to $6,519,056 or 9.6% of net assets. |
| (b) | Floating Rate Security. Stated interest rate was in effect at April 30, 2013. |
| (c) | Variable rate coupon, rate shown as of April 30, 2013. |
| (d) | Investment in affiliated money market mutual fund. The rate shown represents the 7-day yield as of period end. |
Glossary:
ABS – Asset-Backed Securities
ARMs – Adjustable Rate Mortgages
CBT – Chicago Board of Trade
CMBS – Commercial Mortgage-Backed Securities
REIT – Real Estate Investment Trust
See notes to financial statements.
| 20 | • ALLIANCEBERNSTEIN TAXABLE MULTI-SECTOR INCOME SHARES |
Portfolio of Investments
STATEMENT OF ASSETS & LIABILITIES
April 30, 2013
| Assets | ||||
Investments in securities, at value | ||||
Unaffiliated issuers (cost $64,705,630) | $ | 64,821,375 | ||
Affiliated issuers (cost $3,041,053) | 3,041,053 | |||
Cash | 42,900 | (a) | ||
Receivable for shares of beneficial interest sold | 859,673 | |||
Receivable for investment securities sold | 730,020 | |||
Interest and dividends receivable | 255,836 | |||
Receivable for variation margin on futures contracts | 1,547 | |||
|
| |||
Total assets | 69,752,404 | |||
|
| |||
| Liabilities | ||||
Payable for investment securities purchased | 1,828,413 | |||
Payable for shares of beneficial interest redeemed | 67,078 | |||
Dividends payable | 65,643 | |||
|
| |||
Total liabilities | 1,961,134 | |||
|
| |||
Net Assets | $ | 67,791,270 | ||
|
| |||
| Composition of Net Assets | ||||
Shares of beneficial interest, at par | $ | 68 | ||
Additional paid-in capital | 67,843,890 | |||
Distributions in excess of net investment income | (65,643 | ) | ||
Accumulated net realized loss on investment transactions | (26,390 | ) | ||
Net unrealized appreciation on investments | 39,345 | |||
|
| |||
| $ | 67,791,270 | |||
|
| |||
Net Asset Value Per Share—unlimited shares of beneficial interest authorized, $.00001 par value | $ | 9.97 | ||
|
|
| (a) | An amount of $42,900 has been segregated to collateralize margin requirements for open futures contracts outstanding at April 30, 2013. |
See notes to financial statements.
| ALLIANCEBERNSTEIN TAXABLE MULTI-SECTOR INCOME SHARES • | 21 |
Statement of Assets & Liabilities
STATEMENT OF OPERATIONS
Year Ended April 30, 2013
| Investment Income | ||||||||
Interest | $ | 225,831 | ||||||
Dividends—Affiliated issuers | 1,089 | |||||||
|
| |||||||
Total investment income | $ | 226,920 | ||||||
|
| |||||||
| Realized and Unrealized Gain (Loss) on Investment Transactions | ||||||||
Net realized gain (loss) on: | ||||||||
Investment transactions | 352,273 | |||||||
Futures contracts | (26,792 | ) | ||||||
Net change in unrealized appreciation/ | ||||||||
Investments | (102,165 | ) | ||||||
Futures contracts | (76,400 | ) | ||||||
|
| |||||||
Net gain on investment transactions | 146,916 | |||||||
|
| |||||||
Net Increase in Net Assets from Operations | $ | 373,836 | ||||||
|
|
See notes to financial statements.
| 22 | • ALLIANCEBERNSTEIN TAXABLE MULTI-SECTOR INCOME SHARES |
Statement of Operations
STATEMENT OF CHANGES IN NET ASSETS
| Year Ended April 30, 2013 | Year Ended April 30, 2012 | |||||||
| Increase (Decrease) in Net Assets from Operations | ||||||||
Net investment income | $ | 226,920 | $ | 319,241 | ||||
Net realized gain (loss) on investment transactions | 325,481 | (19,310 | ) | |||||
Net change in unrealized appreciation/depreciation of investments | (178,565 | ) | 109,098 | |||||
|
|
|
| |||||
Net increase in net assets from operations | 373,836 | 409,029 | ||||||
| Dividends and Distributions to Shareholders from | ||||||||
Net investment income | (288,943 | ) | (321,730 | ) | ||||
Net realized gain on investment transactions | (311,600 | ) | – 0 | – | ||||
| Transactions in Shares of Beneficial Interest | ||||||||
Net increase (decrease) | 57,844,363 | (37,405 | ) | |||||
|
|
|
| |||||
Total increase | 57,617,656 | 49,894 | ||||||
| Net Assets | ||||||||
Beginning of period | 10,173,614 | 10,123,720 | ||||||
|
|
|
| |||||
End of period (including distributions in excess of net investment income of ($65,643) and undistributed net investment income of $600, respectively) | $ | 67,791,270 | $ | 10,173,614 | ||||
|
|
|
| |||||
See notes to financial statements.
| ALLIANCEBERNSTEIN TAXABLE MULTI-SECTOR INCOME SHARES • | 23 |
Statement of Changes in Net Assets
NOTES TO FINANCIAL STATEMENTS
April 30, 2013
NOTE A
Significant Accounting Policies
AllianceBernstein Corporate Shares (the “Trust”) was organized as a Massachusetts business trust under the laws of The Commonwealth of Massachusetts by an Agreement and Declaration of Trust (“Declaration of Trust”) dated January 26, 2004. The Trust is registered under the Investment Company Act of 1940, as an open-end, diversified management investment company. The Trust operates as a “series” company currently offering four separate portfolios: AllianceBernstein Corporate Income Shares, AllianceBernstein Municipal Income Shares, AllianceBernstein Taxable Multi-Sector Income Shares (the “Portfolio”), and AllianceBernstein Tax-Aware Real Return Income Shares. Each Portfolio is considered to be a separate entity for financial reporting and tax purposes. AllianceBernstein Tax-Aware Real Return Income Shares commenced operations on May 2, 2011. This report relates only to AllianceBernstein Taxable Multi-Sector Income Shares.
Shares of the Portfolio are offered exclusively to holders of accounts established under wrap-fee programs sponsored and maintained by certain registered investment advisers approved by AllianceBernstein L.P. (the “Adviser”). The Portfolio’s shares may be purchased at the relevant net asset value without a sales charge or other fee. The financial statements have been prepared in conformity with U.S. generally accepted accounting principles (“U.S. GAAP”) which require management to make certain estimates and assumptions that affect the reported amounts of assets and liabilities in the financial statements and amounts of income and expenses during the reporting period. Actual results could differ from those estimates. The following is a summary of significant accounting policies followed by the Portfolio.
1. Security Valuation
Portfolio securities are valued at their current market value determined on the basis of market quotations or, if market quotations are not readily available or are deemed unreliable, at “fair value” as determined in accordance with procedures established by and under the general supervision of the Trust’s Board of Trustees (the “Board”).
In general, the market value of securities which are readily available and deemed reliable are determined as follows: Securities listed on a national securities exchange (other than securities listed on the NASDAQ Stock Market, Inc. (“NASDAQ”)) or on a foreign securities exchange are valued at the last sale price at the close of the exchange or foreign securities exchange. If there has been no sale on such day, the securities are valued at the last traded price from the previous day. Securities listed on more than one exchange are valued by reference to the principal exchange on which the securities are traded; securities listed only on NASDAQ are valued in accordance with the NASDAQ Official Closing Price; listed or over the counter (“OTC”) market put or call options are
| 24 | • ALLIANCEBERNSTEIN TAXABLE MULTI-SECTOR INCOME SHARES |
Notes to Financial Statements
valued at the mid level between the current bid and ask prices. If either a current bid or current ask price is unavailable, the Adviser will have discretion to determine the best valuation (e.g. last trade price in the case of listed options); open futures contracts are valued using the closing settlement price or, in the absence of such a price, the most recent quoted bid price. If there are no quotations available for the day of valuation, the last available closing settlement price is used; U.S. government securities and other debt instruments having 60 days or less remaining until maturity are valued at amortized cost if their original maturity was 60 days or less; or by amortizing their fair value as of the 61st day prior to maturity if their original term to maturity exceeded 60 days; fixed-income securities, including mortgage backed and asset backed securities, may be valued on the basis of prices provided by a pricing service or at a price obtained from one or more of the major broker/dealers. In cases where broker/dealer quotes are obtained, the Adviser may establish procedures whereby changes in market yields or spreads are used to adjust, on a daily basis, a recently obtained quoted price on a security. Swaps and other derivatives are valued daily, primarily using independent pricing services, independent pricing models using market inputs, as well as third party broker-dealers or counterparties. Investments in money market funds are valued at their net asset value each day.
Securities for which market quotations are not readily available (including restricted securities) or are deemed unreliable are valued at fair value. Factors considered in making this determination may include, but are not limited to, information obtained by contacting the issuer, analysts, analysis of the issuer’s financial statements or other available documents. In addition, the Portfolio may use fair value pricing for securities primarily traded in non-U.S. markets because most foreign markets close well before the Portfolio values its securities at 4:00 p.m., Eastern Time. The earlier close of these foreign markets gives rise to the possibility that significant events, including broad market moves, may have occurred in the interim and may materially affect the value of those securities.
2. Fair Value Measurements
In accordance with U.S. GAAP regarding fair value measurements, fair value is defined as the price that the Portfolio would receive to sell an asset or pay to transfer a liability in an orderly transaction between market participants at the measurement date. U.S. GAAP establishes a framework for measuring fair value, and a three-level hierarchy for fair value measurements based upon the transparency of inputs to the valuation of an asset or liability (including those valued based on their market values as described in Note 1 above). Inputs may be observable or unobservable and refer broadly to the assumptions that market participants would use in pricing the asset or liability. Observable inputs reflect the assumptions market participants would use in pricing the asset or liability based on market data obtained from sources independent of the Portfolio.
| ALLIANCEBERNSTEIN TAXABLE MULTI-SECTOR INCOME SHARES • | 25 |
Notes to Financial Statements
Unobservable inputs reflect the Portfolio’s own assumptions about the assumptions that market participants would use in pricing the asset or liability based on the best information available in the circumstances. Each investment is assigned a level based upon the observability of the inputs which are significant to the overall valuation. The three-tier hierarchy of inputs is summarized below.
| • | Level 1—quoted prices in active markets for identical investments |
| • | Level 2—other significant observable inputs (including quoted prices for similar investments, interest rates, prepayment speeds, credit risk, etc.) |
| • | Level 3—significant unobservable inputs (including the Portfolio’s own assumptions in determining the fair value of investments) |
The fair value of debt instruments, such as bonds, and over-the-counter derivatives is generally based on market price quotations, recently executed market transactions (where observable) or industry recognized modeling techniques and are generally classified as Level 2. Pricing vendor inputs to Level 2 valuations may include quoted prices for similar investments in active markets, interest rate curves, coupon rates, currency rates, yield curves, option adjusted spreads, default rates, credit spreads and other unique security features in order to estimate the relevant cash flows which is then discounted to calculate fair values. If these inputs are unobservable and significant to the fair value, these investments will be classified as Level 3. In addition, non-agency rated investments are classified as Level 3.
Valuations of mortgage-backed or other asset backed securities, by pricing vendors, are based on both proprietary and industry recognized models and discounted cash flow techniques. Significant inputs to the valuation of these instruments are value of the collateral, the rates and timing of delinquencies, the rates and timing of prepayments, and default and loss expectations, which are driven in part by housing prices for residential mortgages. Significant inputs are determined based on relative value analyses, which incorporate comparisons to instruments with similar collateral and risk profiles, including relevant indices. Mortgage and asset backed securities for which management has collected current observable data through pricing services are generally categorized within Level 2. Those investments for which current observable data has not been provided are classified as Level 3.
Other fixed income investments, including non-U.S. government and corporate debt, are generally valued using quoted market prices, if available, which are typically impacted by current interest rates, maturity dates and any perceived credit risk of the issuer. Additionally, in the absence of quoted market prices, these inputs are used by pricing vendors to derive a valuation based upon industry or proprietary models which incorporate issuer specific data with relevant yield/spread comparisons with more widely quoted bonds with similar key characteristics. Those investments for which there are observable inputs are classified as Level 2. Where the inputs are not observable, the investments are classified as Level 3.
| 26 | • ALLIANCEBERNSTEIN TAXABLE MULTI-SECTOR INCOME SHARES |
Notes to Financial Statements
The following table summarizes the valuation of the Portfolio’s investments by the above fair value hierarchy levels as of April 30, 2013:
Investments in Securities: | Level 1 | Level 2 | Level 3 | Total | ||||||||||||
Assets: | ||||||||||||||||
Corporates – Investment Grades | $ | – 0 | – | $ | 32,780,575 | $ | – 0 | – | $ | 32,780,575 | ||||||
Mortgage Pass-Throughs | – 0 | – | 12,536,030 | – 0 | – | 12,536,030 | ||||||||||
Asset-Backed Securities | – 0 | – | 8,688,571 | 301,191 | 8,989,762 | |||||||||||
Commercial Mortgage-Backed Securities | – 0 | – | 7,268,149 | – 0 | – | 7,268,149 | ||||||||||
Governments – Treasuries | – 0 | – | 2,995,084 | – 0 | – | 2,995,084 | ||||||||||
Covered Bonds | – 0 | – | 251,775 | – 0 | – | 251,775 | ||||||||||
Short-Term Investments | 3,041,053 | – 0 | – | – 0 | – | 3,041,053 | ||||||||||
|
|
|
|
|
|
|
| |||||||||
Total Investments in Securities | 3,041,053 | 64,520,184 | 301,191 | 67,862,428 | ||||||||||||
Other Financial Instruments* : | ||||||||||||||||
Assets | – 0 | – | – 0 | – | – 0 | – | – 0 | – | ||||||||
Liabilities: | – 0 | – | – 0 | – | – 0 | – | – 0 | – | ||||||||
Futures Contracts | (76,400 | ) | – 0 | – | – 0 | – | (76,400 | )# | ||||||||
|
|
|
|
|
|
|
| |||||||||
Total^ | $ | 2,964,653 | $ | 64,520,184 | $ | 301,191 | $ | 67,786,028 | ||||||||
|
|
|
|
|
|
|
| |||||||||
| * | Other financial instruments are derivative instruments, such as futures, forwards and swap contracts, which are valued at the unrealized appreciation/depreciation on the instrument. |
| # | Only variation margin receivable/payable at period end is reported within the statement of assets and liabilities. This amount reflects cumulative appreciation/(depreciation) of futures contracts as reported in the portfolio of investments. |
| ^ | There were no transfers between Level 1 and Level 2 during the reporting period. |
The Portfolio recognizes all transfers between levels of the fair value hierarchy assuming the financial instruments were transferred at the beginning of the reporting period.
The following is a reconciliation of investments in which significant unobservable inputs (Level 3) were used in determining fair value.
| Asset-Backed Securities | Commercial Mortgage-Backed Securities | Total | ||||||||||
Balance as of 4/30/12 | $ | – 0 | – | $ | 480,985 | | $ | 480,985 | ||||
Accrued discounts/(premiums) | (41 | ) | (176 | ) | (217 | ) | ||||||
Realized gain (loss) | – 0 | – | 20,231 | 20,231 | ||||||||
Change in unrealized appreciation/depreciation | 29 | (19,823 | ) | (19,794 | ) | |||||||
Purchases | 301,203 | – 0 | – | 301,203 | ||||||||
Sales | – 0 | – | (481,217 | ) | (481,217 | ) | ||||||
Transfers in to Level 3 | – 0 | – | – 0 | – | – 0 | – | ||||||
Transfers out of Level 3 | – 0 | – | – 0 | – | – 0 | – | ||||||
|
|
|
|
|
| |||||||
Balance as of 4/30/13 | $ | 301,191 | $ | – 0 | – | $ | 301,191 | |||||
|
|
|
|
|
| |||||||
Net change in unrealized appreciation/depreciation from Investments held as of 4/30/13* | $ | 29 | $ | – 0 | – | $ | 29 | |||||
|
|
|
|
|
| |||||||
| * | The unrealized appreciation/depreciation is included in net change in unrealized appreciation/depreciation of investments in the accompanying statement of operations. |
| ALLIANCEBERNSTEIN TAXABLE MULTI-SECTOR INCOME SHARES • | 27 |
Notes to Financial Statements
The Adviser has established a Valuation Committee (the “Committee”) which is responsible for overseeing the pricing and valuation of all securities held in the Portfolio. The Committee operates under pricing and valuation policies and procedures established by the Adviser and approved by the Board, including pricing policies which set forth the mechanisms and processes to be employed on a daily basis to implement these policies and procedures. In particular, the pricing policies describe how to determine market quotations for securities and other instruments. The Committee’s responsibilities include: 1) fair value and liquidity determinations (and oversight of any third parties to whom any responsibility for fair value and liquidity determinations is delegated), and 2) regular monitoring of the Adviser’s pricing and valuation policies and procedures and modification or enhancement of these policies and procedures (or recommendation of the modification of these policies and procedures) as the Committee believes appropriate.
The Committee is also responsible for monitoring the implementation of the pricing policies by the Adviser’s Pricing Group (the “Pricing Group”) and a third party which performs certain pricing functions in accordance with the pricing policies. The Pricing Group is responsible for the oversight of the third party on a day-to-day basis. The Committee and the Pricing Group perform a series of activities to provide reasonable assurance of the accuracy of prices including: 1) periodic vendor due diligence meetings, review of methodologies, new developments and process at vendors, 2) daily compare of security valuation versus prior day for all securities that exceeded established thresholds, and 3) daily review of unpriced, stale, and variance reports with exceptions reviewed by senior management and the Committee.
In addition, several processes outside of the pricing process are used to monitor valuation issues including: 1) performance and performance attribution reports are monitored for anomalous impacts based upon benchmark performance, and 2) portfolio managers review all portfolios for performance and analytics (which are generated using the Adviser’s prices).
3. Taxes
It is the Portfolio’s policy to meet the requirements of the Internal Revenue Code applicable to regulated investment companies and to distribute all of its investment company taxable income and net realized gains, if any, to shareholders. Therefore, no provisions for federal income or excise taxes are required.
In accordance with U.S. GAAP requirements regarding accounting for uncertainties in income taxes, management has analyzed the Portfolio’s tax positions taken or expected to be taken on federal and state income tax returns for all open tax years (all years since inception of the Portfolio) and has concluded that no provision for income tax is required in the Portfolio’s financial statements.
| 28 | • ALLIANCEBERNSTEIN TAXABLE MULTI-SECTOR INCOME SHARES |
Notes to Financial Statements
4. Investment Income and Investment Transactions
Dividend income is recorded on the ex-dividend date or as soon as the Portfolio is informed of the dividend. Interest income is accrued daily. Investment transactions are accounted for on the date the securities are purchased or sold. Investment gains or losses are determined on the identified cost basis. The Portfolio amortizes premiums and accretes discounts as adjustments to interest income.
5. Dividends and Distributions
Dividends and distributions to shareholders, if any, are recorded on the ex-dividend date. Income dividends and capital gains distributions are determined in accordance with federal tax regulations and may differ from those determined in accordance with U.S. GAAP. To the extent these differences are permanent, such amounts are reclassified within the capital accounts based on their federal tax basis treatment; temporary differences do not require such reclassification.
NOTE B
Advisory Fee and Other Transactions with Affiliates
Under the terms of the Advisory Agreement, the Portfolio pays no advisory fee to the Adviser and the Adviser reimburses or pays for the Portfolio’s operating expenses. The Portfolio is an integral part of separately managed accounts in wrap-fee programs and other investment programs. Typically, participants in these programs pay a fee to their investment adviser for all costs and expenses of a separately managed account, including costs and expenses associated with the Portfolio, and a fee is paid by their investment adviser to the Adviser. The Adviser serves as investment manager and adviser of the Portfolio and continuously furnishes an investment program for the Portfolio and manages, supervises and conducts the affairs of the Portfolio, subject to the supervisions of the Portfolio’s Board. The Advisory Agreement provides that the Adviser or an affiliate will furnish, or pay the expenses of the Portfolio for, office space, facilities and equipment, services of executive and other personnel of the Portfolio and certain administrative services.
The Portfolio has entered into a Distribution Agreement with AllianceBernstein Investments, Inc., the Portfolio’s principal underwriter (the “Underwriter”), to permit the Underwriter to distribute the Portfolio’s shares, which are sold at their net asset value without any sales charge. The Portfolio does not pay a fee for this service. The Underwriter is a wholly owned subsidiary of the Adviser.
AllianceBernstein Investor Services, Inc. (“ABIS”), a wholly-owned subsidiary of the Adviser, acts as the Portfolio’s registrar, transfer agent and dividend-disbursing agent. ABIS registers the transfer, issuance and redemption of Portfolio shares and disburses dividends and other distributions to Portfolio shareholders. The Portfolio does not pay a fee for this service.
| ALLIANCEBERNSTEIN TAXABLE MULTI-SECTOR INCOME SHARES • | 29 |
Notes to Financial Statements
The Portfolio may invest in the AllianceBernstein Fixed-Income Shares, Inc.—Government STIF Portfolio (“Government STIF Portfolio”), an open-end management investment company managed by the Adviser. The Government STIF Portfolio is offered as a cash management option to mutual funds and other institutional accounts of the Adviser, and is not available for direct purchase by members of the public. The Government STIF Portfolio pays no investment management fees but does bear its own expenses. A summary of the Portfolio’s transactions in shares of the Government STIF Portfolio for the year ended April 30, 2013 is as follows:
Market Value April 30, 2012 (000) | Purchases at Cost (000) | Sales Proceeds (000) | Market Value April 30, 2013 (000) | Dividend Income (000) | ||||||||||||
| $ – 0 – | $ | 35,072 | $ | 32,031 | $ | 3,041 | $ | 1 | ||||||||
Brokerage commissions paid on investment transactions for the year ended April 30, 2013 amounted to $262, of which $0 and $0, respectively, was paid to Sanford C. Bernstein & Co. LLC and Sanford C. Bernstein Limited, affiliates of the Adviser.
NOTE C
Investment Transactions
Purchases and sales of investment securities (excluding short-term investments) for the year ended April 30, 2013 were as follows:
| Purchases | Sales | |||||||
Investment securities (excluding | $ | 51,997,785 | $ | 8,520,547 | ||||
U.S. government securities | 21,581,229 | 7,900,326 | ||||||
The cost of investments for federal income tax purposes, gross unrealized appreciation and unrealized depreciation (excluding futures transactions) are as follows:
Cost | $ | 67,746,683 | ||
|
| |||
Gross unrealized appreciation | $ | 151,213 | ||
Gross unrealized depreciation | (35,468 | ) | ||
|
| |||
Net unrealized appreciation | $ | 115,745 | ||
|
|
1. Derivative Financial Instruments
The Portfolio may use derivatives in an effort to earn income and enhance returns, to replace more traditional direct investments, to obtain exposure to otherwise inaccessible markets (collectively, “investment purposes”), or to hedge or adjust the risk profile of its portfolio.
| 30 | • ALLIANCEBERNSTEIN TAXABLE MULTI-SECTOR INCOME SHARES |
Notes to Financial Statements
The principal type of derivatives utilized by the Portfolio, as well as the methods in which they may be used are:
| • | Futures Contracts |
The Portfolio may buy or sell futures contracts for the purpose of hedging its portfolio against adverse effects of anticipated movements in the market or for investment purposes. The Portfolio bears the market risk that arises from changes in the value of these instruments and the imperfect correlation between movements in the price of the futures contracts and movements in the price of the securities hedged or used for cover.
At the time the Portfolio enters into a futures contract, the Portfolio deposits and maintains as collateral an initial margin with the broker, as required by the exchange on which the transaction is effected. Pursuant to the contract, the Portfolio agrees to receive from or pay to the broker an amount of cash equal to the daily fluctuation in the value of the contract. Such receipts or payments are known as variation margin and are recorded by the Portfolio as unrealized gains or losses. Risks may arise from the potential inability of a counterparty to meet the terms of the contract. The credit/counterparty risk for exchange-traded futures contracts is generally less than privately negotiated futures contracts, since the clearinghouse, which is the issuer or counterparty to each exchange-traded future, provides a guarantee of performance. This guarantee is supported by a daily payment system (i.e., margin requirements).When the contract is closed, the Portfolio records a realized gain or loss equal to the difference between the value of the contract at the time it was opened and the time it was closed.
Use of long futures contracts subjects the Portfolio to risk of loss in excess of the amounts shown on the statement of assets and liabilities, up to the notional value of the futures contracts. Use of short futures contracts subjects the Portfolio to unlimited risk of loss. Under some circumstances, futures exchanges may establish daily limits on the amount that the price of a futures contract can vary from the previous day’s settlement price, which could effectively prevent liquidation of unfavorable positions.
During the year ended April 30, 2013, the Portfolio held futures contracts for hedging purposes.
At April 30, 2013, the Portfolio had entered into the following derivatives:
Asset Derivatives | Liability Derivatives | |||||||||
Derivative Type | Statement of | Fair Value | Statement of | Fair Value | ||||||
Interest rate contracts | Receivable/Payable for variation margin on futures contracts | $ | 76,400 | * | ||||||
|
| |||||||||
Total | $ | 76,400 | ||||||||
|
| |||||||||
| * | Only variation margin receivable/payable at period end is reported within the statement of assets and liabilities. This amount reflects cumulative appreciation/(depreciation) of futures contracts as reported in the portfolio of investments. |
| ALLIANCEBERNSTEIN TAXABLE MULTI-SECTOR INCOME SHARES • | 31 |
Notes to Financial Statements
The effect of derivative instruments on the statement of operations for the year ended April 30, 2013:
Derivative Type | Location of Gain or (Loss) on | Realized Gain or (Loss) on Derivatives | Change in Unrealized Appreciation or (Depreciation) | |||||||
Interest rate contracts | Net realized gain (loss) on futures contracts; Net change in unrealized appreciation/depreciation of futures contracts | $ | (26,792 | ) | $ | (76,400 | ) | |||
|
|
|
| |||||||
Total | $ | (26,792 | ) | $ | (76,400 | ) | ||||
|
|
|
| |||||||
Futures Contracts: | ||||||||||
Average original value of sale contracts |
| $ | 3,599,903 | (a) | ||||||
| (a) | Positions were open for seven months during the year. |
NOTE D
Shares of Beneficial Interest
Transactions in shares of beneficial interest were as follows:
| Shares | Amount | |||||||||||||||||||
Year Ended 2013 | Year Ended April 30, 2012 | Year Ended April 30, 2013 | Year Ended April 30, 2012 | |||||||||||||||||
|
| |||||||||||||||||||
| Class A | ||||||||||||||||||||
Shares sold | 7,191,177 | – 0 | – | $ | 71,740,491 | $ | – 0 | – | ||||||||||||
| ||||||||||||||||||||
Shares redeemed | (1,390,841 | ) | (3,704 | ) | (13,896,128 | ) | (37,405 | ) | ||||||||||||
| ||||||||||||||||||||
Net increase (decrease) | 5,800,336 | (3,704 | ) | $ | 57,844,363 | $ | (37,405 | ) | ||||||||||||
| ||||||||||||||||||||
NOTE E
Risks Involved in Investing in the Portfolio
Interest Rate Risk and Credit Risk—Interest rate risk is the risk that changes in interest rates will affect the value of the Portfolio’s investments in fixed-income debt securities such as bonds or notes. Increases in interest rates may cause the value of the Portfolio’s investments to decline. Credit risk is the risk that the issuer or guarantor of a debt security, or the counterparty to a derivative contract, will be unable or unwilling to make timely principal and/or interest payments, or to otherwise honor its obligations. The degree of risk for a particular security may be reflected in its credit risk rating. Credit risk is greater for medium quality and lower-rated securities. Lower-rated debt securities and similar unrated securities (commonly known as “junk bonds”) have speculative elements or are predominantly speculative risks.
Indemnification Risk—In the ordinary course of business, the Portfolio enters into contracts that contain a variety of indemnifications. The Portfolio’s maximum exposure under these arrangements is unknown. However, the Portfolio
| 32 | • ALLIANCEBERNSTEIN TAXABLE MULTI-SECTOR INCOME SHARES |
Notes to Financial Statements
has not had prior claims or losses pursuant to these indemnification provisions and expects the risk of loss thereunder to be remote. Therefore, the Portfolio has not accrued any liability in connection with these indemnification provisions.
NOTE F
Distributions to Shareholders
The tax character of distributions paid during the fiscal years ended April 30, 2013 and April 30, 2012 were as follows:
| 2013 | 2012 | |||||||
Distributions paid from: | ||||||||
Ordinary income | $ | 421,184 | $ | 321,730 | ||||
Net long-term capital gains | 179,359 | – 0 | – | |||||
|
|
|
| |||||
Total taxable distributions paid | $ | 600,543 | $ | 321,730 | ||||
|
|
|
| |||||
As of April 30, 2013, the components of accumulated earnings/(deficit) on a tax basis were as follows:
Accumulated capital and other losses | $ | (102,790 | )(a) | |
Unrealized appreciation/(depreciation) | 115,745 | (b) | ||
|
| |||
Total accumulated earnings/(deficit) | $ | 12,955 | (c) | |
|
|
| (a) | During the fiscal year ended April 30, 2013, the Portfolio utilized $21,872 of capital loss carryforwards to offset current year net realized gains. As of April 30, 2013, the cumulative deferred loss on straddles was $3,262. At April 30, 2013, the Portfolio had a post-October short-term capital loss deferral of $39,440 and a post-October long-term capital loss deferral of $60,088. These losses are deemed to arise on May 1, 2013. |
| (b) | The difference between book-basis and tax-basis unrealized appreciation/(depreciation) is attributable primarily to the realization for tax purposes of gains/losses on certain derivative instruments. |
| (c) | The difference between book-basis and tax-basis components of accumulated earnings/(deficit) is attributable primarily to dividends payable. |
For tax purposes, net capital losses may be carried over to offset future capital gains, if any. Funds are permitted to carry forward capital losses incurred in taxable years beginning after December 22, 2010 for an indefinite period, and such losses will retain their character as either short-term or long-term capital losses. As of April 30, 2013, the Portfolio did not have any capital loss carryforwards.
During the current fiscal year, permanent differences primarily due to paydown gain/loss reclassifications and a dividend redesignation resulted in a net increase in distributions in excess of net investment income and a net decrease in accumulated net realized loss on investment transactions. These reclassifications had no effect on net assets.
| ALLIANCEBERNSTEIN TAXABLE MULTI-SECTOR INCOME SHARES • | 33 |
Notes to Financial Statements
NOTE G
Recent Accounting Pronouncements
In December 2011, the Financial Accounting Standards Board (“FASB”) issued an Accounting Standards Update (“ASU”) related to disclosures about offsetting assets and liabilities in financial statements. The amendments in this update require an entity to disclose both gross and net information for derivatives and other financial instruments that are either offset in the statement of assets and liabilities or subject to an enforceable master netting arrangement or similar agreement. In January 2013, the FASB issued an ASU to clarify the scope of disclosures about offsetting assets and liabilities. The ASU limits the scope of the new balance sheet offsetting disclosures to derivatives, repurchase agreements and securities lending transactions. The ASU is effective during interim or annual reporting periods beginning on or after January 1, 2013. At this time, management is evaluating the implication of this ASU and its impact on the financial statements has not been determined.
NOTE H
Subsequent Events
Management has evaluated subsequent events for possible recognition or disclosure in the financial statements through the date the financial statements are issued. Management has determined that there are no material events that would require disclosure in the Portfolio’s financial statements through this date.
| 34 | • ALLIANCEBERNSTEIN TAXABLE MULTI-SECTOR INCOME SHARES |
Notes to Financial Statements
FINANCIAL HIGHLIGHTS
Selected Data For A Share Of Beneficial Interest Outstanding Throughout Each Period
| Year Ended April 30, | September 15, 2010(a) to April 30, | |||||||||||
| 2013 | 2012 | 2011 | ||||||||||
|
| |||||||||||
Net asset value, beginning of period | $ 10.17 | $ 10.09 | $ 10.00 | |||||||||
|
| |||||||||||
Income From Investment Operations | ||||||||||||
Net investment income(b) | .10 | .32 | .24 | |||||||||
Net realized and unrealized gain on investment transactions | .15 | † | .08 | .09 | ||||||||
|
| |||||||||||
Net increase in net asset value from operations | .25 | .40 | .33 | |||||||||
|
| |||||||||||
Less: Dividends and Distributions | ||||||||||||
Dividends from net investment income | (.14 | ) | (.32 | ) | (.24 | ) | ||||||
Distributions from net realized gain on investment transactions | (.31 | ) | – 0 | – | – 0 | – | ||||||
|
| |||||||||||
Total dividends and distributions | (.45 | ) | (.32 | ) | (.24 | ) | ||||||
|
| |||||||||||
Net asset value, end of period | $ 9.97 | $ 10.17 | $ 10.09 | |||||||||
|
| |||||||||||
Total Return | ||||||||||||
Total investment return based on net asset value(c) | 2.47 | % | 4.05 | % | 3.31 | % | ||||||
Ratios/Supplemental Data | ||||||||||||
Net assets, end of period (000’s omitted) | $67,791 | $10,174 | $10,124 | |||||||||
Ratio to average net assets of: | ||||||||||||
Net investment income | 1.05 | % | 3.17 | % | 3.79 | %(d) | ||||||
Portfolio turnover rate | 66 | % | 156 | % | 10 | % | ||||||
| (a) | Commencement of operations. |
| (b) | Based on average shares outstanding. |
| (c) | Total investment return is calculated assuming an initial investment made at the net asset value at the beginning of the period, reinvestment of all dividends and distributions at net asset value during the period, and redemption on the last day of the period. Total return does not reflect the deduction of taxes that a shareholder would pay on portfolio distributions or the redemption of portfolio shares. Total investment return calculated for a period of less than one year is not annualized. |
| (d) | Annualized. |
| † | Due to timing of sales and repurchase of capital shares, the net realized and unrealized gain (loss) per share is not in accord with the Portfolio’s change in net realized and unrealized gain (loss) on investment transactions for the period. |
See notes to financial statements.
| ALLIANCEBERNSTEIN TAXABLE MULTI-SECTOR INCOME SHARES • | 35 |
Financial Highlights
REPORT OF INDEPENDENT REGISTERED
PUBLIC ACCOUNTING FIRM
To the Board of Trustees of AllianceBernstein Corporate Shares and Shareholders of AllianceBernstein Taxable Multi-Sector Income Shares:
We have audited the accompanying statement of assets and liabilities of AllianceBernstein Taxable Multi-Sector Income Shares (one of the series constituting AllianceBernstein Corporate Shares) (the “Fund”), including the portfolio of investments, as of April 30, 2013, and the related statement of operations for the year then ended, the statements of changes in net assets for each of the two years in the period then ended, and the financial highlights for each of the two years in the period then ended and the period September 15, 2010 (commencement of operations) through April 30, 2011. These financial statements and financial highlights are the responsibility of the Fund’s management. Our responsibility is to express an opinion on these financial statements and financial highlights based on our audits.
We conducted our audits in accordance with the standards of the Public Company Accounting Oversight Board (United States). Those standards require that we plan and perform the audit to obtain reasonable assurance about whether the financial statements and financial highlights are free of material misstatement. We were not engaged to perform an audit of the Fund’s internal control over financial reporting. Our audits included consideration of internal control over financial reporting as a basis for designing audit procedures that are appropriate in the circumstances, but not for the purpose of expressing an opinion on the effectiveness of the Fund’s internal control over financial reporting. Accordingly, we express no such opinion. An audit also includes examining, on a test basis, evidence supporting the amounts and disclosures in the financial statements and financial highlights, assessing the accounting principles used and significant estimates made by management, and evaluating the overall financial statement presentation. Our procedures included confirmation of securities owned as of April 30, 2013, by correspondence with the custodian and others, or by other appropriate auditing procedures where replies from others were not received. We believe that our audits provide a reasonable basis for our opinion.
In our opinion, the financial statements and financial highlights referred to above present fairly, in all material respects, the financial position of AllianceBernstein Taxable Multi-Sector Income Shares of AllianceBernstein Corporate Shares at April 30, 2013, and the results of its operations for the year then ended, the changes in its net assets for each of the two years in the period then ended and the financial highlights for each of the two years in the period then ended and for the period September 15, 2010 (commencement of operations) through April 30, 2011, in conformity with U.S. generally accepted accounting principles.

New York, New York
June 27, 2013
| 36 | • ALLIANCEBERNSTEIN TAXABLE MULTI-SECTOR INCOME SHARES |
Report of Independent Registered Public Accounting Firm
TAX INFORMATION
(unaudited)
For Federal income tax purposes, the following information is furnished with respect to the distributions paid by the Portfolio during the taxable year ended April 30, 2013. For foreign shareholders, 74.16% of ordinary dividends paid may be considered to be qualifying to be taxed as interest-related dividends.
| ALLIANCEBERNSTEIN TAXABLE MULTI-SECTOR INCOME SHARES • | 37 |
Tax Information
BOARD OF TRUSTEES
William H. Foulk, Jr.(1) , Chairman John H. Dobkin(1) Michael J. Downey(1) D. James Guzy(1) Nancy P. Jacklin(1) | Robert M. Keith, President and Chief Executive Officer Garry L. Moody(1) Marshall C. Turner, Jr.(1) Earl D. Weiner(1) |
OFFICERS
Philip L. Kirstein, Douglas J. Peebles(2), Paul J. DeNoon(2), Vice President Scott A. DiMaggio(2), Vice President | Shawn E. Keegan(2), Vice President Greg J. Wilensky(2), Vice President Emilie D. Wrapp, Secretary Joseph J. Mantineo, Treasurer and Chief Financial Officer Phyllis J. Clarke, Controller |
Custodian and Accounting Agent State Street Bank and Trust Company
Principal Underwriter AllianceBernstein Investments, Inc.
Transfer Agent AllianceBernstein Investor Services, Inc. | Legal Counsel Seward & Kissel LLP One Battery Park Plaza New York, NY 10004
Independent Registered Public Accounting Firm Ernst & Young LLP 5 Times Square New York, NY 10036 |
| (1) | Member of the Audit Committee, the Governance and Nominating Committee and the Independent Directors Committee. Mr. Foulk is the sole member of the Fair Value Pricing Committee. |
| (2) | The day-to-day management of, and investment decisions for, the Trust’s portfolio are made by the Adviser’s Core Fixed-Income Team. Messrs. Paul J. DeNoon, Scott A. DiMaggio, Shawn E. Keegan, Douglas J. Peebles, and Greg J. Wilensky are the investment professionals primarily responsible for the day-to-day management of the Trust’s portfolio. |
| 38 | • ALLIANCEBERNSTEIN TAXABLE MULTI-SECTOR INCOME SHARES |
Board of Trustees
TRUSTEES AND OFFICERS INFORMATION
Board of Trustees Information
The business and affairs of the Fund are managed under the direction of the Board of Trustees. Certain information concerning the Fund’s Trustees is set forth below.
| NAME, ADDRESS*, AGE, AND (YEAR FIRST ELECTED**) | PRINCIPAL OCCUPATION(S) DURING PAST FIVE YEARS AND OTHER RELEVANT | PORTFOLIOS IN FUND COMPLEX OVERSEEN BY TRUSTEE | OTHER DIRECTORSHIPS HELD BY TRUSTEE IN PAST FIVE YEARS | |||||
| INTERESTED TRUSTEE | ||||||||
Robert M. Keith, # 53 (2010) | Senior Vice President of AllianceBernstein L.P. (the “Adviser”) and the head of AllianceBernstein Investments, Inc. (“ABI”) since July 2008; Director of ABI and President of the AllianceBernstein Mutual Funds. Previously, he served as Executive Managing Director of ABI from December 2006 to June 2008. Prior to joining ABI in 2006, Executive Managing Director of Bernstein Global Wealth Management, and prior thereto, Senior Managing Director and Global Head of Client Service and Sales of the Adviser’s institutional investment management business since 2004. Prior thereto, he was Managing Director and Head of North American Client Service and Sales in the Adviser’s institutional investment management business, with which he had been associated since prior to 2004. | 102 | None | |||||
| DISINTERESTED TRUSTEES | ||||||||
Chairman of the Board William H. Foulk, Jr., ##, + 80 (2010) | Investment Adviser and an Independent Consultant since prior to 2008. Previously, he was Senior Manager of Barrett Associates, Inc., a registered investment adviser. He was formerly Deputy Comptroller and Chief Investment Officer of the State of New York and, prior thereto, Chief Investment Officer of the New York Bank for Savings. He has served as a director or trustee of various AllianceBernstein Funds since 1983 and has been Chairman of the AllianceBernstein Funds and of the Independent Directors Committee of such Funds since 2003. He is also active in a number of mutual fund related organizations and committees. | 102 | None | |||||
| ALLIANCEBERNSTEIN TAXABLE MULTI-SECTOR INCOME SHARES • | 39 |
Trustees and Officers Information
| NAME, ADDRESS*, AGE, AND (YEAR FIRST ELECTED**) | PRINCIPAL OCCUPATION(S) DURING PAST FIVE YEARS AND OTHER RELEVANT | PORTFOLIOS IN FUND COMPLEX OVERSEEN BY TRUSTEE | OTHER DIRECTORSHIPS HELD BY TRUSTEE IN PAST FIVE YEARS | |||||
| DISINTERESTED TRUSTEES (continued) | ||||||||
John H. Dobkin, ## 71 (2010) | Independent Consultant since prior to 2008. Formerly, President of Save Venice, Inc. (preservation organization) from 2001–2002; Senior Advisor from June 1999-June 2000 and President of Historic Hudson Valley (historic preservation) from December 1989-May 1999. Previously, Director of the National Academy of Design. He has served as a director or trustee of various AllianceBernstein Funds since 1992, and as Chairman of the Audit Committees of a number of such Funds from 2001-2008. | 102 | None | |||||
Michael J. Downey, ## 69 (2010) | Private Investor since prior to 2008. Formerly, managing partner of Lexington Capital, LLC (investment advisory firm) from December 1997 until December 2003. From 1987 until 1993, Chairman and CEO of Prudential Mutual Fund Management, director of the Prudential mutual funds, and member of the Executive Committee of Prudential Securities Inc. He has served as a director or trustee of the AllianceBernstein Funds since 2005 and is a director and Chairman of one other registered investment company. | 102 | Asia Pacific Fund, Inc. since prior to 2008, Prospect Acquisition Corp. (financial services) from 2007 until 2009 and The Merger Fund since prior to 2008 until 2013 | |||||
| 40 | • ALLIANCEBERNSTEIN TAXABLE MULTI-SECTOR INCOME SHARES |
Trustees and Officers Information
| NAME, ADDRESS*, AGE, AND (YEAR FIRST ELECTED**) | PRINCIPAL OCCUPATION(S) DURING PAST FIVE YEARS AND OTHER RELEVANT | PORTFOLIOS IN FUND COMPLEX OVERSEEN BY TRUSTEE | OTHER DIRECTORSHIPS HELD BY TRUSTEE IN PAST FIVE YEARS | |||||
| DISINTERESTED TRUSTEES (continued) | ||||||||
D. James Guzy, ## 77 (2010) | Chairman of the Board of PLX Technology (semi-conductors) and of SRC Computers Inc., with which he has been associated since prior to 2008. He was a director of Intel Corporation (semi-conductors) from 1969 until 2008, and served as Chairman of the Finance Committee of such company for several years until May 2008. He has served as a director or trustee of one or more of the AllianceBernstein Funds since 1982. | 102 | PLX Technology (semi-conductors) since prior to 2008, Cirrus Logic Corporation (semi-conductors) since prior to 2008 until July 2011 and Intel Corporation (semi-conductors) until 2008 | |||||
Nancy P. Jacklin, ## 65 (2010) | Professorial Lecturer at the Johns Hopkins School of Advanced International Studies since 2008. Formerly, U.S. Executive Director of the International Monetary Fund (December 2002-May 2006); Partner, Clifford Chance (1992-2002); Sector Counsel, International Banking and Finance, and Associate General Counsel, Citicorp (1985-1992); Assistant General Counsel (International), Federal Reserve Board of Governors (1982-1985); and Attorney Advisor, U.S. Department of the Treasury (1973-1982). Member of the Bar of the District of Columbia and of New York; and member of the Council on Foreign Relations. She has served as a director or trustee of the AllianceBernstein Funds since 2006. | 102 | None | |||||
| ALLIANCEBERNSTEIN TAXABLE MULTI-SECTOR INCOME SHARES • | 41 |
Trustees and Officers Information
| NAME, ADDRESS*, AGE, AND (YEAR FIRST ELECTED**) | PRINCIPAL OCCUPATION(S) DURING PAST FIVE YEARS AND OTHER RELEVANT | PORTFOLIOS IN FUND COMPLEX OVERSEEN BY TRUSTEE | OTHER DIRECTORSHIPS HELD BY TRUSTEE IN PAST FIVE YEARS | |||||
| DISINTERESTED TRUSTEES (continued) | ||||||||
Garry L. Moody, ## 61 (2010) | Independent Consultant. Formerly, Partner, Deloitte & Touche LLP (1995-2008) where he held a number of senior positions, including Vice Chairman, and U.S. and Global Investment Management Practice Managing Partner; President, Fidelity Accounting and Custody Services Company (1993-1995); and Partner, Ernst & Young LLP (1975-1993), where he served as the National Director of Mutual Fund Tax Services and Managing Partner of its Chicago Office Tax department. He is a member of both the Governing Council of the Independent Directors Council (IDC), an organization of independent directors of mutual funds, and the Trustee Advisory Board of BoardIQ, a biweekly publication focused on issues and news affecting directors of mutual funds. He has served as a director or trustee, and as Chairman of the Audit Committee, of the AllianceBernstein Funds since 2008. | 102 | None | |||||
| 42 | • ALLIANCEBERNSTEIN TAXABLE MULTI-SECTOR INCOME SHARES |
Trustees and Officers Information
| NAME, ADDRESS*, AGE, AND (YEAR FIRST ELECTED**) | PRINCIPAL OCCUPATION(S) DURING PAST FIVE YEARS AND OTHER RELEVANT | PORTFOLIOS IN FUND COMPLEX OVERSEEN BY TRUSTEE | OTHER DIRECTORSHIPS HELD BY TRUSTEE IN PAST FIVE YEARS | |||||
| DISINTERESTED TRUSTEES (continued) | ||||||||
Marshall C. Turner, Jr., ## 71 (2010) | Private Investor since prior to 2008. Interim CEO of MEMC Electronic Materials, Inc. (semi-conductor and solar cell substrates) from November 2008 until March 2009. He was Chairman and CEO of Dupont Photomasks, Inc. (components of semi-conductor manufacturing), 2003-2005, and President and CEO, 2005-2006, after the company was acquired and renamed Toppan Photomasks, Inc. He has extensive experience in venture capital investing including prior service as general partner of three institutional venture capital partnerships, and serves on the boards of a number of education and science-related non-profit organizations. He has served as a director or trustee of one or more of the AllianceBernstein Funds since 1992. | 102 | Xilinx, Inc. (programmable logic semi-conductors) and MEMC Electronic Materials, Inc. (semi-conductor and solar cell substrates), since prior to 2008 | |||||
Earl D. Weiner, ## 73 (2010) | Of Counsel, and Partner prior to January 2007, of the law firm Sullivan & Cromwell LLP and member of ABA Federal Regulation of Securities Committee Task Force to draft editions of the Fund Director’s Guidebook. He also serves as a director or trustee of various non-profit organizations and has served as Chairman or Vice Chairman of a number of them. He has served as a director or trustee of the AllianceBernstein Funds since 2007 and is Chairman of the Governance and Nominating Committees of the Funds. | 102 | None | |||||
| ALLIANCEBERNSTEIN TAXABLE MULTI-SECTOR INCOME SHARES • | 43 |
Trustees and Officers Information
| * | The address for each of the Trust’s disinterested Trustees is c/o AllianceBernstein L.P., Attention: Philip L. Kirstein, 1345 Avenue of the Americas, New York, NY 10105. |
| ** | There is no stated term of office for the Trust’s Trustees. |
| *** | The information above includes each Trustee’s principal occupation during the last five years and other information relating to the experience, attributes, and skills relevant to each Trustee’s qualifications to serve as a Trustee, which led to the conclusion that each Trustee should serve as a Trustee for the Trust. |
| # | Mr. Keith is an “interested person” of the Trust as defined in the 1940 Act, due to his position as a Senior Vice President of the Adviser. |
| ## | Member of the Audit Committee, the Governance and Nominating Committee and the Independent Directors Committee. |
| + | Member of the Fair Value Pricing Committee. |
| 44 | • ALLIANCEBERNSTEIN TAXABLE MULTI-SECTOR INCOME SHARES |
Trustees and Officers Information
Officer Information
Certain information concerning the Trust’s officers is set forth below.
NAME, ADDRESS,* AND AGE | POSITION(S) HELD WITH FUND | PRINCIPAL OCCUPATION DURING PAST FIVE YEARS | ||
| OFFICERS | ||||
| Robert M. Keith 53 | President and Chief Executive Officer | See biography above. | ||
| Philip L. Kirstein 68 | Senior Vice President and Independent Compliance Officer | Senior Vice President and Independent Compliance Officer of the AllianceBernstein Funds, with which he has been associated since October 2004. Prior thereto, he was Of Counsel to Kirkpatrick & Lockhart, LLP from October 2003 to October 2004, and General Counsel of Merrill Lynch Investment Managers, L.P. since prior to March 2003. | ||
Douglas J. Peebles 47 | Senior Vice President | Senior Vice President of the Adviser**, with which he has been associated since prior to 2008. | ||
Paul J. DeNoon 51 | Vice President | Senior Vice President of the Adviser**, with which he has been associated since prior to 2008. | ||
Scott A. DiMaggio 41 | Vice President | Senior Vice President of the Adviser**, with which he had been associated since prior to 2008. | ||
| Shawn E. Keegan 41 | Vice President | Vice President of the Adviser**, with which he has been associated since prior to 2008. | ||
Greg J. Wilensky 46 | Vice President | Senior Vice President of the Adviser**, with which he had been associated since prior to 2008. | ||
Emilie D. Wrapp 57 | Secretary | Senior Vice President, Assistant General Counsel and Assistant Secretary of ABI**, with which she has been associated since prior to 2008. | ||
Joseph J. Mantineo 54 | Treasurer and Chief Financial Officer | Senior Vice President of AllianceBernstein Investor Services, Inc. (“ABIS”)**, with which he has been associated since prior to 2008. | ||
Phyllis J. Clarke 52 | Controller | Vice President of ABIS**, with which she has been associated since prior to 2008. |
| * | The address for each of the Portfolio’s Officers is 1345 Avenue of the Americas, New York, NY 10105. |
| ** | The Adviser, ABI and ABIS are affiliates of the Fund. |
The Fund’s Statement of Additional Information (“SAI”) has additional information about the Fund’s Trustees and Officers and is available without charge upon request. Contact your financial representative or AllianceBernstein at 1-800-227-4618 for a free prospectus or SAI.
| ALLIANCEBERNSTEIN TAXABLE MULTI-SECTOR INCOME SHARES • | 45 |
Trustees and Officers Information
Information Regarding the Review and Approval of the Fund’s Advisory Agreement
The disinterested trustees (the “trustees”) of AllianceBernstein Corporate Shares (the “Fund”) unanimously approved the continuance of the Fund’s Advisory Agreement with the Adviser in respect of AllianceBernstein Taxable Multi-Sector Income Shares (the “Portfolio”) at a meeting held on November 6-8, 2012.
Prior to approval of the continuance of the Advisory Agreement in respect of the Portfolio, the trustees had requested from the Adviser, and received and evaluated, extensive materials. They reviewed the proposed continuance of the Advisory Agreement with the Adviser and with experienced counsel who are independent of the Adviser, who advised on the relevant legal standards. The trustees also reviewed an independent evaluation prepared by the Fund’s Senior Officer (who is also the Fund’s Independent Compliance Officer) of the reasonableness of the advisory fee, in which the Senior Officer concluded that the contractual fee (zero) for the Portfolio was reasonable. The trustees also discussed the proposed continuance in private sessions with counsel and the Fund’s Senior Officer.
The trustees noted that the Portfolio is designed as a vehicle for the wrap fee account market (where investors pay fees to a wrap fee sponsor which pays investment fees and expenses from such fee). The trustees also noted that no advisory fee is payable by the Portfolio, that the Advisory Agreement does not include the reimbursement provision for certain administrative expenses included in the advisory agreements of most of the open-end AllianceBernstein Funds, and that the Adviser is responsible for payment of the Portfolio’s ordinary expenses. The trustees noted that the Fund acknowledges in the Advisory Agreement that the Adviser and its affiliates expect to receive compensation from third parties in connection with services provided under the Advisory Agreement. The trustees further noted that the Adviser receives payments from the wrap fee program sponsors (the “Sponsors”) that use the Portfolio as an investment vehicle for their clients.
The trustees considered their knowledge of the nature and quality of the services to be provided by the Adviser to the Portfolio gained from their experience as trustees or directors of most of the registered investment companies advised by the Adviser, their overall confidence in the Adviser’s integrity and competence they have gained from that experience, the Adviser’s initiative in identifying and raising potential issues with the trustees and its responsiveness, frankness and attention to concerns raised by the trustees in the past, including the Adviser’s willingness to consider and implement organizational and operational changes designed to improve investment results and the services provided to the AllianceBernstein Funds. The trustees noted that they have four regular meetings each year, at each of which they receive presentations from the Adviser on the investment results of the Portfolio and review extensive materials and information presented by the Adviser.
| 46 | • ALLIANCEBERNSTEIN TAXABLE MULTI-SECTOR INCOME SHARES |
The trustees also considered all other factors they believed relevant, including the specific matters discussed below. In their deliberations, the trustees did not identify any particular information that was all-important or controlling, and different trustees may have attributed different weights to the various factors. The trustees determined that the selection of the Adviser to manage the Portfolio, and the overall arrangements between the Portfolio and the Adviser, as provided in the Advisory Agreement, including the advisory fee, were fair and reasonable in light of the services performed, expenses incurred and such other matters as the trustees considered relevant in the exercise of their business judgment. The material factors and conclusions that formed the basis for the trustees’ determination included the following:
Nature, Extent and Quality of Services Provided
The trustees considered the scope and quality of services provided by the Adviser under the Advisory Agreement, including the quality of the investment research capabilities of the Adviser and the other resources it has dedicated to performing services for the Portfolio. They also noted the professional experience and qualifications of the Portfolio’s portfolio management team and other senior personnel of the Adviser. The quality of administrative and other services, including the Adviser’s role in coordinating the activities of the Portfolio’s other service providers, also were considered. The trustees concluded that, overall, they were satisfied with the nature, extent and quality of services provided to the Portfolio under the Advisory Agreement.
Costs of Services Provided and Profitability
The trustees reviewed a schedule of the revenues, expenses and related notes indicating the profitability of the Portfolio to the Adviser for calendar years 2010 and 2011 that had been prepared with an expense allocation methodology arrived at in consultation with an independent consultant retained by the Fund’s Senior Officer. The trustees considered that while the Adviser does not receive any advisory fee from the Portfolio or expense reimbursement, it does receive fees paid by the Sponsors. They also noted that the Adviser bears certain costs in providing services to the Portfolio and in paying its ordinary expenses. The trustees reviewed the assumptions and methods of allocation used by the Adviser in preparing fund-specific profitability data and noted that there are a number of potentially acceptable allocation methodologies for information of this type. The trustees noted that the profitability information reflected all revenues and expenses of the Adviser’s relationship with the Portfolio. The trustees recognized that it is difficult to make comparisons of the profitability of the Advisory Agreement with the profitability of advisory contracts for unaffiliated funds because comparative information is not generally publicly available and is affected by numerous factors, including, in the case of the Portfolio, the fact that it does not pay an advisory fee. The trustees focused on the profitability of the Adviser’s relationship with the Portfolio before taxes. The trustees noted that the Adviser’s relationship with the Portfolio (September 2010 inception) was not profitable to it in 2010 or 2011.
| ALLIANCEBERNSTEIN TAXABLE MULTI-SECTOR INCOME SHARES • | 47 |
Fall-Out Benefits
The trustees considered the other benefits to the Adviser and its affiliates from their relationships with the Portfolio. The trustees noted that the Adviser is compensated by the Sponsors. The trustees understood that the Adviser might also derive reputational and other benefits from its association with the Portfolio.
Investment Results
In addition to the information reviewed by the trustees in connection with the meeting, the trustees receive detailed performance information for the Portfolio at each regular Board meeting during the year. At the November 2012 meeting, the trustees reviewed information prepared by Lipper showing the performance of the Portfolio as compared with that of funds selected by Lipper (the “Performance Universe”) for the 1-year period ended July 31, 2012, and information prepared by the Adviser showing the Portfolio’s performance as compared with the Barclays Capital U.S. Aggregate Index (ex Government) (the “Index”), for the 1-year period ended September 30, 2012 and the period since inception (September 2010 inception). The trustees noted that, on a gross return basis, the Portfolio was in the 4th quintile of the Performance Universe. The Portfolio lagged the Index in both periods. The trustees were cognizant that the Portfolio was neither designed nor offered as a standalone investment and was intended to serve solely as a component of certain separately managed accounts (“SMAs”). The Adviser had explained that this attribute made it difficult to select an appropriate benchmark for the Portfolio. The trustees had asked the Adviser to provide information showing the weighting of the Portfolio in representative SMAs and the overall performance of those SMAs versus their stated benchmarks. The materials provided to the trustees in respect of the Portfolio included its weighting in the AllianceBernstein Strategic Core Plus SMA, but that SMA had closed in March 2012 and therefore the trustees did not consider the SMA’s performance information to be relevant to their analysis. Based on their review and taking into account the short performance history of the Portfolio, the trustees concluded that the Portfolio’s performance was satisfactory.
Advisory Fees
The trustees considered the advisory fee rate paid by the Portfolio to the Adviser (zero) and information provided by Lipper showing the fees paid by other fund families used in wrap fee programs similar to that of the Portfolio. The trustees recognized that it is difficult to make comparisons of advisory fees because there are variations in the services that are included in the fees paid by other funds.
The trustees noted the unusual arrangements in the Advisory Agreement providing for no advisory fee but were cognizant that the Adviser is indirectly compensated by the Sponsors for its services to the Portfolio. The trustees reviewed the fee arrangements between the Adviser and each of the current Sponsors and noted that such fees were negotiated on an arm’s length basis and were within
| 48 | • ALLIANCEBERNSTEIN TAXABLE MULTI-SECTOR INCOME SHARES |
the range of fees paid by wrap fee sponsors to other advisers of similar funds. While the Adviser’s fee arrangements with the Sponsors vary, the trustees acknowledged the Adviser’s view that a portion of such fees (less the expenses of the Portfolio paid by the Adviser) may reasonably be viewed as compensating the Adviser for advisory services it provides to the Portfolio (the “implied fee”) and that the Adviser believes that while the Sponsors pay the Adviser different fee rates, the rate of fee attributable to portfolio management at the Portfolio level is the same for all Sponsors. The trustees also considered the fee rate schedules used by other registered investment companies that invest in fixed income securities that are advised by the Adviser. Based on their review, the trustees concluded that the advisory arrangements for the Portfolio, including the zero fee aspect of the Advisory Agreement with the Adviser, were satisfactory.
The trustees also considered the advisory fees the Adviser charges non-fund clients pursuing a similar investment style. For this purpose, the trustees reviewed the relevant advisory fee information from the Adviser’s Form ADV and the evaluation from the Fund’s Senior Officer. The trustees recognized that such information was of limited utility in light of the Portfolio’s unusual fee arrangement. The trustees noted that the Adviser may, in some cases, agree to fee rates with large institutional clients that are lower than those in the schedules reviewed by the trustees and that they had previously discussed with the Adviser its policies in respect of such arrangements.
The Adviser reviewed with the trustees the significantly greater scope of the services it provides the Portfolio relative to institutional clients. The Adviser noted that because mutual funds are constantly issuing and redeeming shares, they are more difficult to manage than an institutional account, where the assets tend to be relatively stable. In light of the substantial differences in services rendered by the Adviser to institutional clients as compared to funds such as the Portfolio, and the unusual fee structure for the other portfolios of the Fund and the Portfolio, the trustees considered these fee comparisons inapt and did not place significant weight on them in their deliberations.
Since the Portfolio does not bear ordinary expenses, the trustees did not consider comparative expense information.
Economies of Scale
Since the Advisory Agreement does not provide for any compensation to be paid to the Adviser by the Portfolio and the Portfolio’s expense ratio is zero, the trustees did not consider the extent to which fee levels in the Advisory Agreement reflect economies of scale. They did note, however, that the fee payable to the Adviser by each of the current Sponsors declines at a breakpoint based on total assets managed by the Adviser for the Sponsors.
| ALLIANCEBERNSTEIN TAXABLE MULTI-SECTOR INCOME SHARES • | 49 |
THE FOLLOWING IS NOT PART OF THE SHAREHOLDER REPORT OR THE FINANCIAL STATEMENTS
SUMMARY OF SENIOR OFFICER’S EVALUATION OF INVESTMENT ADVISORY AGREEMENT1
The following is a summary of the evaluation of the Investment Advisory Agreement between AllianceBernstein L.P. (the “Adviser”) and The AllianceBernstein Corporate Shares (the “Trust”) with respect to AllianceBernstein Taxable Multi-Sector Income Shares (the “Portfolio”).2 The evaluation of the Investment Advisory Agreement was prepared by Philip L. Kirstein, the Senior Officer of the Trust, for the Trustees of the Trust, as required by the September 1, 2004 Assurance of Discontinuance (“AoD”) between the Adviser and the New York State Attorney General (the “NYAG”). The Senior Officer’s evaluation of the Investment Advisory Agreement is not meant to diminish the responsibility or authority of the Board of Trustees to perform its duties pursuant to Section 15 of the Investment Company Act of 1940 Act (the “40 Act”) and applicable state law. The purpose of the summary is to provide shareholders with a synopsis of the independent evaluation of the reasonableness of the advisory fees proposed to be paid by the Portfolio which was provided to the Trustees in connection with their review of the proposed approval of the continuance of the Investment Advisory Agreement.
The Senior Officer’s evaluation considered the following factors:
| 1. | Advisory fees charged to institutional and other clients of the Adviser for like services; |
| 2. | Advisory fees charged by other mutual fund companies for like services; |
| 3. | Costs to the Adviser and its affiliates of supplying services pursuant to the advisory agreement, excluding any intra-corporate profit; |
| 4. | Profit margins of the Adviser and its affiliates from supplying such services; |
| 5. | Possible economies of scale as the Portfolio grows larger; and |
| 6. | Nature and quality of the Adviser’s services including the performance of the Portfolio. |
These factors, with the exception of the first factor, are generally referred to as the “Gartenberg factors,” which were articulated by the United States Court of Appeals for the Second Circuit in 1982. Gartenberg v. Merrill Lynch Asset Management, Inc., 694 F. 2d 923 (2d Cir. 1982). On March 30, 2010, the Supreme Court held the Gartenberg decision was correct in its basic formulation
| 1 | The Senior Officer’s fee evaluation was completed on October 25, 2012 and discussed with the Board of Trustees on November 6-8, 2012. |
| 2 | Future references to the Portfolio do not include “AllianceBernstein.” |
| 50 | • ALLIANCEBERNSTEIN TAXABLE MULTI-SECTOR INCOME SHARES |
of what §36(b) requires: to face liability under §36(b), “an investment adviser must charge a fee that is so disproportionately large that it bears no reasonable relationship to the services rendered and could not have been the product of arm’s length bargaining” Jones v. Harris Associates L.P., 130 S. Ct. 1418 (2010). In Jones, the Court stated the Gartenberg approach fully incorporates the correct understanding of fiduciary duty within the context of section 36(b) and noted with approval that “Gartenberg insists that all relevant circumstances be taken into account” and “uses the range of fees that might result from arm’s-length bargaining as the benchmark for reviewing challenged fees.”3
PORTFOLIO’S EXEMPTION FROM ADVISORY FEES OR EXPENSES
The Portfolio pays no advisory fee to the Adviser for receiving the services to be provided pursuant to the Investment Advisory Agreement. The Portfolio is designed to serve the needs of the Adviser’s separately managed account (“SMA”) clients.4 Since SMA clients pay their wrap program provider a unitary fee for managing all investments of their portfolio, the Portfolio will not pay an advisory fee. The Adviser will also reimburse the Portfolio for all of its other operating expenses, except certain extraordinary expenses, taxes, brokerage costs and the interest on borrowed money.
The Portfolio is designed as a component of an institutional fixed-income mandate, Core Plus (“Core Plus SMA”), for SMA clients. Core Plus SMA is modeled on the Adviser’s U.S. Strategic Core Plus investment mandate. Core Plus SMA uses a 60% allocation to direct investments in individual U.S. Government/U.S. agency securities, including pass-thru agency mortgage-backed securities, or cash investments, complemented by a 40% allocation to the Portfolio in order to achieve the approximate exposures of the U.S. Strategic Core Plus investment mandate. The Portfolio’s role as a component of Core Plus SMA calls for the Portfolio to utilize leverage in certain circumstances.
The Portfolio’s net assets on September 30, 2012 are set forth below:
| Portfolio | 9/30/12 Net Assets ($MM) | |||
Taxable Multi-Sector Income Shares | $ | 3.8 | ||
The Portfolio, which offers only one no-load class of shares, is distributed through its principal underwriter, AllianceBernstein Investments, Inc. (“ABI”). Since the Portfolio is reimbursed by the Adviser for its operating expenses, the Portfolio does not have a distribution plan pursuant to Rule 12b-1 under the 40 Act.
| 3 | Jones v. Harris at 1427. |
| 4 | The SMA clients currently employ the Adviser as one of several investment managers, and compensate the Adviser on the basis of all SMA assets managed, which would include assets of Taxable Multi-Sector Income Shares. |
| ALLIANCEBERNSTEIN TAXABLE MULTI-SECTOR INCOME SHARES • | 51 |
| I. | ADVISORY FEES CHARGED TO INSTITUTIONAL AND OTHER CLIENTS |
The advisory fees charged to investment companies which the Adviser manages and sponsors are normally higher than those charged to similar sized institutional accounts, including pension plans and sub-advised investment companies. The fee differential reflects, among other things, different services provided to such clients, and different liabilities assumed. Services provided by the Adviser to the Portfolio that are not provided to non-investment company clients include providing office space and personnel to serve as Fund Officers, who among other responsibilities make the certifications required under the Sarbanes–Oxley Act of 2002, and coordinating with and monitoring the Portfolio’s third party service providers such as Fund counsel, auditors, custodians, transfer agents and pricing services. The accounting, administrative, legal and compliance requirements for the Portfolio are more costly than those for institutional client assets due to the greater complexities and time required for investment companies. The Adviser also believes that it incurs substantial entrepreneurial risk when offering a new mutual fund since establishing a new mutual fund requires a large upfront investment and it may take a long time for the fund to achieve profitability since the fund must be priced to scale from inception in order to be competitive and assets are acquired one account at a time. In addition, managing the cash flow of an investment company may be more difficult than that of a stable pool of assets, such as an institutional account with little cash movement in either direction, particularly if the Portfolio is in net redemption and the Adviser is frequently forced to sell securities to raise cash for redemptions. However, managing a fund with positive cash flow may be easier at times than managing a stable pool of assets. Finally, in recent years, investment advisers have been sued by institutional clients and have suffered reputational damage both by the attendant publicity and outcomes other than complete victories. Accordingly, the legal and reputational risks associated with institutional accounts are greater than previously thought, although arguably still not equal to those related to the mutual fund industry.
Notwithstanding the Adviser’s view that managing an investment company is not comparable to managing other institutional accounts because the services provided are different, the Supreme Court has indicated consideration should be given to the advisory fees charged to institutional accounts with a similar investment style as the Portfolio.5 In addition to the AllianceBernstein Institutional fee schedule, set forth below is what would have been the effective advisory fee for the Portfolio had
| 5 | The Supreme Court stated that “courts may give such comparisons the weight that they merit in light of the similarities and differences between the services that the clients in question require, but the courts must be wary of inapt comparisons.” Among the significant differences the Supreme Court noted that may exist between services provided to mutual funds and institutional accounts are “higher marketing costs.” Jones v. Harris at 1428. |
| 52 | • ALLIANCEBERNSTEIN TAXABLE MULTI-SECTOR INCOME SHARES |
the AllianceBernstein Institutional fee schedule been applicable to the Portfolio versus the Portfolio’s advisory fees based on September 30, 2012 net assets.6
| Portfolio | Net Assets 9/30/12 ($MM) | AllianceBernstein (“AB”) Fee Schedule | Effective AB Inst. Adv. Fee | Portfolio Advisory Fee | ||||||
| Taxable Multi-Sector Income Shares | $3.8 | U.S. Strategic Core Plus 50 bp on 1st $30 million 20 bp on the balance Minimum Account Size: $25 m | 0.500% | 0.000% | ||||||
The Adviser manages AllianceBernstein Intermediate Bond Fund, Inc. (“Intermediate Bond Fund, Inc.”), a retail mutual fund that has a somewhat similar investment style as the Portfolio.7 Set forth in the table below is the advisory fee schedule of the Intermediate Bond Fund, Inc. and what would have been the effective advisory fee of the Portfolio had the advisory fee schedule of the retail mutual fund been applicable to the Portfolio based on September 30, 2012 net assets:
| Portfolio | AllianceBernstein Mutual Funds (“ABMF”) | Fee Schedule | ABMF Effective | |||
| Taxable Multi-Sector Income Shares | AllianceBernstein Intermediate Bond Fund, Inc. | 0.45% on first $2.5 billion 0.40% on next $2.5 billion 0.35% on the balance | 0.450% |
The Adviser also manages Sanford C. Bernstein Fund II—Intermediate Duration Institutional Portfolio (“SCB II”), which has a somewhat similar investment style as the Portfolio. Set forth in the table below is SCB II’s advisory fee schedule8 and
| 6 | The Adviser has indicated that with respect to institutional accounts with assets greater than $300 million, it will negotiate a fee schedule. Discounts that are negotiated vary based upon each client relationship. |
| 7 | The advisory fee schedule of AllianceBernstein Intermediate Bond Fund, Inc. was affected by the December 2003 settlement between the Adviser and the NYAG. The NYAG related master fee schedule, implemented in January 2004, contemplates eight categories with almost all of the AllianceBernstein funds in each category having the same advisory fee schedule. |
| 8 | Although a part of the AllianceBernstein Mutual Funds, SCB II’s advisory fee schedule was not affected by the Adviser’s settlement with the NYAG since its fee schedule had a lower breakpoint level ($1 billion) than the breakpoint level ($2.5 billion) of the High Income category of the NYAG related master schedule. The advisory fee schedule of the High Income category is as follows: 0.50% on the first $2.5 billion, 0.45% on the next $2.5 billion and 0.40% thereafter. |
| ALLIANCEBERNSTEIN TAXABLE MULTI-SECTOR INCOME SHARES • | 53 |
what would have been the effective fee of the Portfolio had SCB II’s advisory fee schedule been applicable to the Portfolio based on September 30, 2012 net assets:
| Portfolio | ABMF Fund | Fee Schedule | SCB Fund Effective Fee | |||
| Taxable Multi-Sector Income Shares | Sanford C. Bernstein Fund II – Intermediate Duration Institutional Portfolio9 | 50 bp on 1st $1 billion 45 bp on the balance | 0.500% |
The Adviser manages Sanford C. Bernstein Fund, Inc. (“SCB Fund”), an open-end management investment company. The Intermediate Duration Portfolio of SCB Fund has a somewhat similar investment style as the Portfolio. Set forth below is Intermediate Duration Portfolio’s advisory fee schedule and what would have been the effective advisory fee of the Portfolio had the fee schedule of Intermediate Duration Portfolio been applicable to the Portfolio based on September 30, 2012 net assets:
| Portfolio | SCB Fund Portfolio | Fee Schedule | SCB Fund Effective Fee | |||
| Taxable Multi-Sector Income Shares | Intermediate Duration Portfolio | 50 bp on 1st $1 billion 45 bp on next $2 billion 40 bp on next $2 billion 35 bp on next $2 billion 30 bp thereafter | 0.500% |
The adviser also manages the AllianceBernstein Variable Products Series Fund, Inc. (“AVPS”), which is available through variable annuity and variable life contracts offered by other financial institutions and offers policyholders the option to utilize certain AVPS portfolios as the investment option underlying their insurance contracts. Set forth below is the fee schedule of the AVPS portfolio that has a somewhat similar investment style as the Portfolio.10 Also shown is
| 9 | SCB II’s total expense ratio is capped at 0.45%, which reduces the fund’s advisory fees. |
| 10 | The AVPS portfolio was also affected by the settlement between the Adviser and the NYAG. |
| 54 | • ALLIANCEBERNSTEIN TAXABLE MULTI-SECTOR INCOME SHARES |
what would have been the effective advisory fee of the Portfolio had the AVPS fee schedule been applicable to the Portfolio based on September 30, 2012 net assets:
| Portfolio | AVPS Portfolio | Fee Schedule | AVPS Effective Fee | |||||
| Taxable Multi-Sector Income Shares | Intermediate Bond Portfolio | 0.45% on first $2.5 billion 0.40% on next $2.5 billion 0.35% on the balance | 0.450% | |||||
The Adviser provides sub-advisory investment services to certain other investment companies managed by other fund families. The Adviser charges the following fee for the sub-advisory relationship that has a somewhat similar investment style as the Portfolio. Also shown is what would have been the effective advisory fee of the Portfolio had the fee schedule of the sub-advisory relationship been applicable to the Portfolio based on September 30, 2012 net assets:
| Portfolio | Sub-advised Fund | Sub-advised Fund Fee Schedule | Sub-advised Management Fee | |||
| Taxable Multi-Sector Income Shares | Client #111 | 0.29% on first $100 million 0.20% thereafter | 0.216% |
It is fair to note that the services the Adviser provides pursuant to sub-advisory agreements are generally confined to the services related to the investment process; in other words, they are not as comprehensive as the services provided to the Portfolio by the Adviser. In addition to the extent that the sub-advisory relationship is with an affiliate of the Adviser, the fee schedule may not reflect arm’s-length bargaining or negotiations.
While it appears that the sub-advisory relationship is paying a lower fee than the investment companies managed by the Adviser, it is difficult to evaluate the relevance of such a fee due to the differences in the services provided, risks involved and other competitive factors between the investment companies and the sub-advisory relationship. There could be various business reasons why an investment adviser would be willing to provide a sub-advised relationship investment related services at a different fee level than an investment company it is sponsoring where the investment adviser is provided all the services, not just investment services, generally required by a registered investment company.
| 11 | This is the fee schedule of a fund managed by an affiliate of the Adviser. |
| ALLIANCEBERNSTEIN TAXABLE MULTI-SECTOR INCOME SHARES • | 55 |
| II. | MANAGEMENT FEES CHARGED BY OTHER MUTUAL FUND COMPANIES FOR LIKE SERVICES. |
Lipper, Inc., an analytical service that is not affiliated with the Adviser, compared the fees charged to the Portfolio to the fees charged to other investment companies for similar services by other investment advisers.12,13 Each peer selected by Lipper had a similar fee arrangement as the Portfolio, which is to say that with respect to the Portfolio’s peers, all of their fund expenses, including management fees,14 were reimbursed by their respective investment advisers.
As previously noted, the Portfolio does not pay an advisory fee to the Adviser since its SMA clients pay their wrap program provider a unitary fee for managing all investments of their portfolios. In addition, the Adviser reimburses the Portfolio for all of its operating expenses, except certain extraordinary expenses, taxes, brokerage costs and interest on borrowed money.
| III. | COSTS TO THE ADVISER AND ITS AFFILIATES OF SUPPLYING SERVICES PURSUANT TO THE ADVISORY FEE ARRANGEMENT, EXCLUDING ANY INTRA-CORPORATE PROFIT. |
The Adviser utilizes two profitability reporting systems, which operate independently but are aligned with each other, to estimate the Adviser’s profitability in connection with investment advisory services provided to the Portfolio. The Senior Officer has retained a consultant to provide independent advice regarding the alignment of the two profitability systems as well as the methodologies and allocations utilized by both profitability systems. See Section IV for additional discussion.
| 12 | The Supreme Court cautioned against accepting mutual fund fee comparisons without careful scrutiny since “these comparisons are problematic because these fees, like those challenged, may not be the product of negotiations conducted at arm’s length.” Jones v. Harris at 1429. |
| 13 | Only zero fee no-load funds that participated in a wrap fee program were considered for inclusion in the Portfolio’s EG, regardless of the Lipper investment classification/objective of the Funds’ peers. The Portfolio’s EG includes the Portfolio, one other Multi-Sector Income Fund, three General Bond Funds, two BBB-rated Corporate Debt Funds, one Short-Intermediate Investment Grade Debt Fund, two U.S. Mortgage Funds, one General & Insured Municipal Debt Fund, one Intermediate Investment-Grade Debt Fund, one Inflation-Protected Bond Fund, two Global Income Funds, and one Intermediate Municipal Debt Fund. |
| 14 | “Management Fee” is the fee attributable to the management and bearing of expenses of the funds (not the management of the wrap fee program). In each case, the advisory contract provides for an advisory or management fee of zero. |
| 56 | • ALLIANCEBERNSTEIN TAXABLE MULTI-SECTOR INCOME SHARES |
| IV. | PROFIT MARGINS OF THE ADVISER AND ITS AFFILIATES FOR SUPPLYING SUCH SERVICES. |
The profitability information for the Portfolio, prepared by the Adviser for the Board of Trustees, was reviewed by the Senior Officer and the consultant. The Portfolio does not pay an advisory fee to the Adviser. However, the Adviser does profit indirectly through the advisory fees that it receives from SMA clients that invest in the Portfolio. The Adviser’s profitability with respect to the Portfolio, which was negative in 2011, was calculated using a weighted average of the profitability of the SMA clients, in addition to any fund specific revenue or expense items.
AllianceBernstein Investments, Inc. (“ABI”) and AllianceBernstein Investor Services, Inc. (“ABIS”), affiliates of the Adviser, serve as the Portfolio’s underwriter and transfer agent, respectively. The courts have referred to this type of business relationships as “fall-out benefits” to the Adviser and indicated that such benefits should be factored into the evaluation of the total relationship between the Portfolio and the Adviser. Neither case law nor common business practice precludes the Adviser’s affiliates from earning a reasonable profit on this type of relationship provided the affiliates’ charges and services are competitive. However, neither ABI nor ABIS receive a fee for serving as the Portfolio’s underwriter and transfer agent.
| V. | POSSIBLE ECONOMIES OF SCALE |
The Adviser has indicated that economies of scale are being shared with shareholders through pricing to scale, breakpoints, fee reductions/waivers and enhancement to services.
An independent consultant, retained by the Senior Officer, provided the Board of Trustees information on the Adviser’s firm-wide average costs from 2005 through 2011 and the potential economies of scale. The independent consultant noted that from 2005 through 2007 the Adviser experienced significant growth in assets under management (“AUM”). During this period, operating expenses increased, in part to keep up with growth, and in part reflecting market returns. However, from 2008 through the first quarter of 2009, AUM rapidly and significantly decreased due to declines in market value and client withdrawals. When AUM rapidly decreased, some operating expenses categories, including base compensation and office space, adjusted more slowly during this period, resulting in an increase in average costs. Since 2009, AUM has experienced less significant changes. The independent consultant noted that changes in operating expenses reflect changes in business composition and business practices in response to changes in financial markets. Finally, the independent consultant concluded that the increase in average cost and the decline in net operating margin across the Adviser since late 2008 are inconsistent with the view that there are currently reductions in average costs due to economies of scale that can be shared with the AllianceBernstein Mutual Funds managed by the Adviser through lower fees.
| ALLIANCEBERNSTEIN TAXABLE MULTI-SECTOR INCOME SHARES • | 57 |
In February 2008, the independent consultant provided the Board of Trustees an update of the Deli15 study on advisory fees and various fund characteristics.16 The independent consultant first reiterated the results of his previous two dimensional comparison analysis (fund size and family size) with the Board of Trustees.17 The independent consultant then discussed the results of the regression model that was utilized to study the effects of various factors on advisory fees. The regression model output indicated that the bulk of the variation in fees predicted were explained by various factors, but substantially by fund AUM, family AUM, index fund indicator and investment style. The independent consultant also compared the advisory fees of the AllianceBernstein Mutual Funds to similar funds managed by 19 other large asset managers, regardless of the fund size and each Adviser’s proportion of mutual fund assets to non-mutual fund assets.
| VI. | NATURE AND QUALITY OF THE ADVISER’S SERVICES INCLUDING THE PERFORMANCE OF THE PORTFOLIO. |
With assets under management of approximately $419 billion as of September 30, 2012, the Adviser has the investment experience to manage and provide non-investment services (described in Section I) to the Portfolio.
| 15 | The Deli study, originally published in 2002 based on 1997 data and updated for the February 2008 Presentation, may be of diminished value due to the age of the data used in the presentation and the changes experienced in the industry over the last four years. |
| 16 | As mentioned previously, the Supreme Court cautioned against accepting mutual fund fee comparisons without careful scrutiny since the fees may not be the product of negotiations conducted at arm’s length. See Jones V. Harris at 1429. |
| 17 | The two dimensional analysis showed patterns of lower advisory fees for funds with larger asset sizes and funds from larger family sizes compared to funds with smaller asset sizes and funds from smaller family sizes, which according to the independent consultant is indicative of a sharing of economies of scale and scope. However, in less liquid and active markets, such is not the case, as the empirical analysis showed potential for diseconomies of scale in those markets. The empirical analysis also showed diminishing economies of scale and scope as funds surpassed a certain high level of assets. |
| 58 | • ALLIANCEBERNSTEIN TAXABLE MULTI-SECTOR INCOME SHARES |
The information below, prepared by Lipper, shows the 1 year gross performance return and ranking of the Portfolio relative to its Lipper Performance Universe (“PU”)18 for the period ended July 31, 2012:
Portfolio Return (%) | PU Median (%) | PU Rank | ||||||||
| Taxable Multi-Sector Income Shares 1 Year | 4.36 | 5.94 | 15/17 | |||||||
Set forth below are the 1 year and since inception net performance returns of the Portfolio (in bold)19 versus its benchmark.20 Portfolio and benchmark volatility and reward-to-variability ratio (“Sharpe Ratio”) information is also shown.21
Periods Ending July 31, 2012 Annualized Net Performance (%) | ||||||||||||||||||||
| 1 Year (%) | Since Inception (%) | Volatility (%) | Sharpe (%) | Risk Period (Year) | ||||||||||||||||
| Taxable Multi-Sector Income Shares | 4.36 | 5.05 | 2.96 | 1.43 | 1 | |||||||||||||||
| Barclays Capital US Aggregate ex Govt. Index | 7.10 | 6.25 | 2.15 | 3.18 | 1 | |||||||||||||||
| Inception Date: September 51, 2010 | ||||||||||||||||||||
CONCLUSION:
Based on the factors discussed above the Senior Officer’s conclusion is that the Investment Advisory Agreement for the Portfolio is reasonable and within the range of what would have been negotiated at arm’s-length in light of all the surrounding circumstances. This conclusion with respect to the Portfolio is based on an evaluation of all of these factors and no single factor was dispositive.
Dated: December 3, 2012
| 18 | The Portfolio’s PU includes peers with the same Lipper investment classification/objective and load type as the Portfolio. |
| 19 | The performance returns of the Portfolio were provided Lipper. Lipper maintains its own database that includes the Portfolio’s performance returns. |
| 20 | The Adviser provided Portfolio and benchmark performance return information for the periods through July 31, 2012. |
| 21 | Portfolio and benchmark volatility and Sharpe Ratio information was obtained through Lipper LANA, a database maintained by Lipper. Volatility is a statistical measure of the tendency of a market price or yield to vary over time. A Sharpe Ratio is a risk adjusted measure of return that divides a fund’s return in excess of the riskless return by the fund’s standard deviation. A portfolio with a greater volatility would be viewed as more risky than a portfolio with equivalent performance but lower volatility; for that reason, a greater return would be demanded for the more risky fund. A portfolio with a higher Sharpe Ratio would be viewed as better performing than a fund with a lower Sharpe Ratio. |
| ALLIANCEBERNSTEIN TAXABLE MULTI-SECTOR INCOME SHARES • | 59 |
THIS PAGE IS NOT PART OF THE SHAREHOLDER REPORT OR THE FINANCIAL STATEMENTS
ALLIANCEBERNSTEIN FAMILY OF FUNDS
Wealth Strategies
Balanced Wealth Strategy
Conservative Wealth Strategy
Wealth Appreciation Strategy
Tax-Managed Balanced Wealth Strategy
Tax-Managed Conservative Wealth Strategy
Tax-Managed Wealth Appreciation Strategy
Asset Allocation/Multi-Asset Funds
Emerging Markets Multi-Asset Portfolio
International Portfolio
Tax-Managed International Portfolio
Growth Funds
Domestic
Discovery Growth Fund**
Growth Fund
Large Cap Growth Fund
Select US Equity Portfolio
Small Cap Growth Portfolio
Global & International
Global Thematic Growth Fund
International Discovery Equity Portfolio
International Growth Fund
Value Funds
Domestic
Core Opportunities Fund
Discovery Value Fund**
Equity Income Fund
Growth & Income Fund
Value Fund
Global & International
Emerging Markets Equity Portfolio
Global Value Fund
International Value Fund
Taxable Bond Funds
Bond Inflation Strategy
Global Bond Fund
High Income Fund
Intermediate Bond Portfolio
Limited Duration High Income Portfolio
Short Duration Portfolio
Municipal Bond Funds
Arizona Portfolio California Portfolio High Income Portfolio Massachusetts Portfolio Michigan Portfolio Minnesota Portfolio Municipal Bond Inflation Strategy | National Portfolio New Jersey Portfolio New York Portfolio Ohio Portfolio Pennsylvania Portfolio Virginia Portfolio |
Intermediate Municipal Bond Funds
Intermediate California Portfolio
Intermediate Diversified Portfolio
Intermediate New York Portfolio
Closed-End Funds
Alliance California Municipal Income Fund
Alliance New York Municipal Income Fund
AllianceBernstein Global High Income Fund
AllianceBernstein Income Fund
AllianceBernstein National Municipal Income Fund
Alternatives
Dynamic All Market Fund
Global Real Estate Investment Fund
Global Risk Allocation Fund**
Market Neutral Strategy-Global
Market Neutral Strategy-U.S.
Real Asset Strategy
Select US Long/Short Portfolio
Unconstrained Bond Fund
Retirement Strategies
2000 Retirement Strategy | 2020 Retirement Strategy | 2040 Retirement Strategy | ||
2005 Retirement Strategy | 2025 Retirement Strategy | 2045 Retirement Strategy | ||
2010 Retirement Strategy | 2030 Retirement Strategy | 2050 Retirement Strategy | ||
2015 Retirement Strategy | 2035 Retirement Strategy | 2055 Retirement Strategy |
We also offer Exchange Reserves,* which serves as the money market fund exchange vehicle for the AllianceBernstein mutual funds.
Investors should consider the investment objectives, risks, charges and expenses of the Fund carefully before investing. For copies of our prospectus or summary prospectus, which contain this and other information, visit us online at www.alliancebernstein.com or contact your AllianceBernstein investments representative. Please read the prospectus and/or summary prospectus carefully before investing.
| * | An investment in Exchange Reserves is not a deposit in a bank and is not insured or guaranteed by the Federal Deposit Insurance Corporation or any other government agency. Although the Fund seeks to preserve the value of your investment at $1.00 per share, it is possible to lose money by investing in the Fund. |
| ** | Prior to October 8, 2012, Global Risk Allocation Fund was named Balanced Shares. Prior to November 1, 2012, Discovery Growth Fund was named Small/Mid Cap Growth Fund and Discovery Value Fund was named Small/Mid Cap Value Fund. |
| 60 | • ALLIANCEBERNSTEIN TAXABLE MULTI-SECTOR INCOME SHARES |
AllianceBernstein Family of Funds
ALLIANCEBERNSTEIN TAXABLE MULTI-SECTOR INCOME SHARES
1345 Avenue of the Americas
New York, NY 10105
800.221.5672
| TMSIS-0151-0413 |  | |
ANNUAL REPORT
AllianceBernstein
Tax-Aware Real Return Income Shares
April 30, 2013
Annual Report

Investment Products Offered
•Are Not FDIC Insured •May Lose Value •Are Not Bank Guaranteed |
Investors should consider the investment objectives, risks, charges and expenses of the Fund carefully before investing. For copies of our prospectus or summary prospectus, which contain this and other information, visit us online at www.alliancebernstein.com or contact your AllianceBernstein Investments representative. Please read the prospectus and/or summary prospectus carefully before investing.
This shareholder report must be preceded or accompanied by the Fund’s prospectus for individuals who are not current shareholders of the Fund.
You may obtain a description of the Fund’s proxy voting policies and procedures, and information regarding how the Fund voted proxies relating to portfolio securities during the most recent 12-month period ended June 30, without charge. Simply visit AllianceBernstein’s website at www.alliancebernstein.com, or go to the Securities and Exchange Commission’s (the “Commission”) website at www.sec.gov, or call AllianceBernstein at (800) 227-4618.
The Fund files its complete schedule of portfolio holdings with the Commission for the first and third quarters of each fiscal year on Form N-Q. The Fund’s Forms N-Q are available on the Commission’s website at www.sec.gov. The Fund’s Forms N-Q may also be reviewed and copied at the Commission’s Public Reference Room in Washington, DC; information on the operation of the Public Reference Room may be obtained by calling (800) SEC-0330. AllianceBernstein publishes full portfolio holdings for the Fund monthly at www.alliancebernstein.com.
AllianceBernstein Investments, Inc. (ABI) is the distributor of the AllianceBernstein family of mutual funds. ABI is a member of FINRA and is an affiliate of AllianceBernstein L.P., the manager of the funds.
AllianceBernstein® and the AB Logo are registered trademarks and service marks used by permission of the owner, AllianceBernstein L.P.
June 19, 2013
Annual Report
This report provides management’s discussion of fund performance for AllianceBernstein Tax-Aware Real Return Income Shares (the “Fund”) for the annual reporting period ended April 30, 2013. Please note, shares of this Fund are offered exclusively through registered investment advisers approved by AllianceBernstein L.P. (the “Adviser”).
Investment Objectives and Policies
The investment objective of the Fund is to maximize real after-tax return for investors subject to federal income taxation. The Fund pursues its objective by investing primarily in municipal securities that pay interest exempt from federal taxation and by using inflation protection derivatives instruments, such as inflation swap agreements, as described below. Municipal securities may pay interest that is subject to the federal alternative minimum tax (“AMT”) for certain taxpayers.
The Adviser selects securities for purchase or sale based on its assessment of the securities’ risk and return characteristics as well as the securities’ impact on the overall risk and return characteristics of the Fund. In making this assessment, the Adviser takes into account various factors including the credit quality and sensitivity to interest rates of the securities under consideration and of the Fund’s other holdings.
The Fund may invest in fixed-income securities with any maturity or duration and investment grade bonds subject to taxation if the Adviser determines that they offer higher after-tax returns than
comparable municipal bonds. While the Fund currently expects to invest principally in investment grade securities, the Fund may invest without limit in fixed-income securities that are not investment grade (“junk bonds”).
The Fund may make significant use of derivatives, including swaps, futures, options and forwards. To provide inflation protection, the Fund will enter into various kinds of inflation swap agreements. The Fund may use other inflation-protected instruments as well. Payments to the Fund pursuant to swap agreements will result in taxable income, either ordinary income or capital gains, rather than income exempt from federal taxation. Because the Fund is expected to be a significant vehicle for Separately Managed Account investors to achieve inflation protection for some or all of their overall accounts, the Fund may at times seek a substantial amount of inflation protection and, consequently, may generate substantial taxable income. It is expected that the Fund’s primary use of derivatives will be for the purposes of inflation protection.
The Fund may also invest in tender option bond transactions (“TOBs”); forward commitments; zero coupon municipal securities and variable, floating and inverse floating rate municipal securities; and certain types of mortgage related securities.
The Fund may make short sales of securities or maintain a short position, and may use other investment techniques. The Fund may use leverage for investment purposes to increase income
| ALLIANCEBERNSTEIN TAX-AWARE REAL RETURN INCOME SHARES • | 1 |
through the use of the cash made available by TOBs and derivative instruments, such as interest rate swaps, to make other investments in accordance with its investment objective.
Investment Results
The table on page 6 shows the Fund’s performance compared to its benchmark, the Barclays 1-10 Year Treasury Inflation-Protection Securities (“TIPS”) Index.
The Fund underperformed its benchmark for the six-month period, and outperformed for the 12-month period. In order to pursue the investment objective of after-tax returns net of inflation, the Fund invests in municipal bonds and uses derivatives for inflation protection. Over both the six- and 12-month periods, the Fund’s exposure to municipal bonds detracted from performance as rates fell more for Treasuries than municipal bonds. However, the Fund’s focus on A-rated municipals versus AA- and AAA-rated tax-exempts added to performance as medium-grade bonds outperformed the highest-quality bonds over both periods.
The Fund used derivatives, in the form of Consumer Price Index (“CPI”) swaps, total return swaps, and interest rate swaps for hedging purposes. CPI swaps detracted from performance, as they underperformed TIPS in the benchmark. The combination of total return swaps and interest rate swaps were generally neutral versus the benchmark.
Market Review and Investment Strategy
Within the municipal market, medium- and lower-credit-quality bonds outperformed high-grade issues over both six- and 12-month periods, as investor demand for income remained strong. Investors were also encouraged by evidence of steadily improving credit quality. Recent data shows municipal defaults falling to 0.01% of outstanding debt during the first two months of the first quarter, compared to an already low 0.11% in 2012. The Municipal Bond Investment Team (the “Team”) continues to target opportunities to buy medium- and lower-credit quality municipal bonds in order to supplement the Fund’s income and to attempt to reduce the Fund’s interest rate exposure, should interest rates rise. The Team believes these bonds should outperform if rates rise—the U.S. Federal Reserve (the “Fed”) has historically raised rates when the economy is strong in an attempt to control inflation, and medium- and lower-credit-quality bonds have historically performed well in a strong economy.
The Team believes the Fund is well-positioned with respect to interest rate risk. The Team has generally avoided long-maturity bonds that have significant potential for loss of principal if interest rates rise. Instead of buying highly rated bonds that are generally expected to perform in line with changes in overall yields, the Team has focused on shorter-maturity bonds that capture most of the yield of the longer-maturity bonds with less downside risk to principal. In the Team’s view, the extra yield for medium- and lower-
| 2 | • ALLIANCEBERNSTEIN TAX-AWARE REAL RETURN INCOME SHARES |
credit-quality bonds is still high by historical standards. Where possible, the Team has added to its holdings of this type both to supplement the Fund’s income and to benefit overall performance when this extra yield, or credit spread, contracts.
The Fund may purchase municipal securities that are insured under policies issued by certain insurance companies. Historically, insured municipal securities typically received a higher credit rating, which meant that the issuer of the securities paid a lower interest rate. As a result of declines in the credit quality and associated downgrades of most fund insurers, insurance has less value than it did in the past. The market now values insured municipal securities primarily based on the credit quality of the issuer of the security with little value given to the insurance feature. In purchasing such insured securities, the Adviser evaluates the risk and return of municipal securities through its own research. If an insurance company’s rating is downgraded or the company becomes insolvent, the prices of municipal securities insured by the insurance company may decline. As of April 30, 2013, 11.26% of the Fund’s investments were in insured bonds, of which 41.75% were in pre-refunded/escrowed to maturity bonds.
The Team believes that downgrades in insurance company ratings or insurance company insolvencies present limited risk to the Fund.
In the Team’s view, U.S. monetary policy could create additional market uncertainty in the coming year, as the Fed may reverse certain of the measures taken as a result of the 2008 global financial crisis. The Federal Funds rate has been reduced to near zero percent and the Fed has, among other actions taken, purchased U.S. Treasury and mortgage-backed securities. The latter is commonly referred to as Quantitative Easing (“QE”). These policies have been beneficial to fixed-income securities, including municipal bonds held in the Fund. When the Fed removes certain of these measures, there may be downward pressure on prices of fixed-income securities, including those held in the Fund. While the Team has pursued strategies it believes should benefit the Fund’s relative returns, the timing and the reversal of QE and the potential increase of the Federal Funds rate may impact the net asset value (“NAV”) of the Fund. These and other risks to the Fund are discussed further in this report.
| ALLIANCEBERNSTEIN TAX-AWARE REAL RETURN INCOME SHARES • | 3 |
DISCLOSURES AND RISKS
Benchmark Disclosure
The unmanaged Barclays 1-10 TIPS Year Index does not reflect fees and expenses associated with the active management of a mutual fund portfolio. The Barclays 1-10 Year TIPS Index represents the performance of inflation-protection securities issued by the U.S. Treasury. An investor cannot invest directly in an index, and its results are not indicative of the performance for any specific investment, including the Fund.
A Word About Risk
Market Risk: The value of the Fund’s assets will fluctuate as the stock or bond market fluctuates. The value of the Fund’s investments may decline, sometimes rapidly and unpredictably, simply because of economic changes or other events that affect large portions of the market.
Credit Risk: An issuer or guarantor of a fixed-income security, or the counterparty to a derivatives or other contract, may be unable or unwilling to make timely payments of interest or principal, or to otherwise honor its obligations. The issuer or guarantor may default causing a loss of the full principal amount of a security. The degree of risk for a particular security may be reflected in its credit rating. There is the possibility that the credit rating of a fixed-income security may be downgraded after purchase, which may adversely affect the value of the security. Investments in fixed income securities with lower ratings (commonly referred to as “junk bonds”) tend to have a higher probability that an issuer will default or fail to meet its payment obligations.
Municipal Market Risk: This is the risk that special factors may adversely affect the value of municipal securities and have a significant effect on the yield or value of the Fund’s investments in municipal securities. These factors include economic conditions, political or legislative changes, uncertainties related to the tax status of municipal securities, or the rights of investors in these securities. To the extent that the Fund invests more of its assets in a particular state’s municipal securities, the Fund may be vulnerable to events adversely affecting that state, including economic, political and regulatory occurrences, court decisions, terrorism and catastrophic natural disasters, such as hurricanes or earthquakes. The Fund’s investments in certain municipal securities with principal and interest payments that are made from the revenues of a specific project or facility, and not general tax revenues, may have increased risks. Factors affecting the project or facility, such as local business or economic conditions, could have a significant effect on the project’s ability to make payments of principal and interest on these securities.
Interest Rate Risk: Changes in interest rates will affect the value of investments in fixed-income securities. When interest rates rise, the value of investments in fixed income securities tends to fall and this decrease in value may not be offset by higher income from new investments. Interest rate risk is generally greater for fixed-income securities with longer maturities or durations.
Inflation Risk: This is the risk that the value of assets or income from investments will be less in the future as inflation decreases the value of money. As inflation increases, the value of the Fund’s assets can decline as can the value of the Fund’s distributions. This risk is significantly greater for fixed-income securities with longer maturities.
Derivatives Risk: The Fund’s investments in derivatives, such as swaps, futures, options and forwards, may be illiquid, difficult to price, and leveraged so that small changes may produce disproportionate losses for the Fund, and may be subject to counterparty risk to a greater degree than more traditional investments. The use of inflation protection derivatives to help meet the Fund’s investment objective may not be successful.
(Disclosures, Risks and Note about Historical Performance continued on next page)
| 4 | • ALLIANCEBERNSTEIN TAX-AWARE REAL RETURN INCOME SHARES |
Disclosures and Risks
DISCLOSURES AND RISKS
(continued from previous page)
Leverage Risk: To the extent the Fund uses leveraging techniques, its NAV may be more volatile because leverage tends to exaggerate the effect of changes in interest rates and any increase or decrease in the value of the Fund’s investments.
Liquidity Risk: Liquidity risk exists when particular investments, such as lower-rated securities, are difficult to purchase or sell, possibly preventing the Fund from selling out of these illiquid securities at an advantageous price. The Fund is subject to liquidity risk because the market for municipal securities is generally smaller than many other markets. Derivatives and securities involving substantial market and credit risk tend to involve greater liquidity risk.
Management Risk: The Fund is subject to management risk because it is an actively managed investment fund. The Adviser will apply its investment techniques and risk analyses in making investment decisions, but there is no guarantee that its techniques will produce the intended results.
These and other risks are more fully discussed in the Fund’s prospectus.
An Important Note About Historical Performance
The performance shown on the following pages represents past performance and does not guarantee future results. Current performance may be lower or higher than the performance information shown. You may obtain performance information current to the most recent month-end by calling (800) 227-4618. The investment return and principal value of an investment in the Fund will fluctuate, so that your shares, when redeemed, may be worth more or less than their original cost. Performance assumes reinvestment of distributions and does not account for taxes.
Investors should consider the investment objectives, risks, charges and expenses of the Fund carefully before investing. For copies of our prospectus or summary prospectus, which contain this and other information, visit us online at www.alliancebernstein.com or contact your AllianceBernstein Investments representative. Please read the prospectus and/or summary prospectus carefully before investing.
| ALLIANCEBERNSTEIN TAX-AWARE REAL RETURN INCOME SHARES • | 5 |
Disclosures and Risks
HISTORICAL PERFORMANCE
| THE FUND VS. ITS BENCHMARK PERIODS ENDED APRIL 30, 2013 | NAV Returns | |||||||||
| 6 Months | 12 Months | |||||||||
| AllianceBernstein Tax-Aware Real Return Income Shares | 0.33% | 3.06% | ||||||||
| ||||||||||
| Barclays 1-10 Year TIPS Index | 0.47% | 2.66% | ||||||||
GROWTH OF A $10,000 INVESTMENT IN THE FUND
5/2/2011* TO 4/30/2013
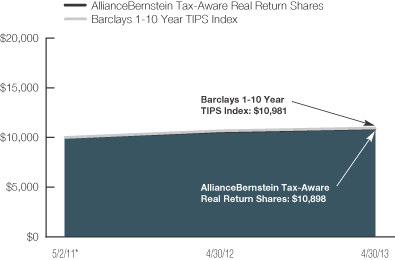
This chart illustrates the total value of an assumed $10,000 investment in AllianceBernstein Tax Aware Real Return (from 5/2/2011* to 4/30/2013) as compared to the performance of its benchmark. The chart assumes the reinvestment of dividends and capital gains distributions.
| * | Inception date: 5/2/2011. |
See Disclosures, Risks and Note about Historical Performance on pages 4-5.
(Historical Performance continued on next page)
| 6 | • ALLIANCEBERNSTEIN TAX-AWARE REAL RETURN INCOME SHARES |
Historical Performance
HISTORICAL PERFORMANCE
(continued from previous page)
| AVERAGE ANNUAL RETURNS AS OF APRIL 30, 2013 | ||||
| NAV Returns | ||||
1 Year | 3.06 | % | ||
Since Inception* | 4.40 | % | ||
| SEC AVERAGE ANNUAL RETURNS (WITH ANY APPLICABLE SALES CHARGES) AS OF THE MOST RECENT CALENDAR QUARTER-END (MARCH 31, 2013) | ||||
| SEC Returns | ||||
1 Year | 4.73 | % | ||
Since Inception* | 5.08 | % | ||
The prospectus fee table shows the fees and the total fund operating expenses as 0.00% because the Adviser does not charge any fees or expenses and reimburses Fund operating expenses. Participants in a wrap fee program or other investment program eligible to invest in the Fund pay fees to the program sponsor and should review the program brochure or other literature provided by the sponsor for a discussion of fees and expenses charged.
| * | Inception date: 5/2/2011. |
See Disclosures, Risks and Note about Historical Performance on pages 4-5.
| ALLIANCEBERNSTEIN TAX-AWARE REAL RETURN INCOME SHARES • | 7 |
Historical Performance
EXPENSE EXAMPLE
(unaudited)
As a shareholder of the Fund, you may incur various ongoing non-operating and extraordinary costs. This example is intended to help you understand your ongoing costs (in dollars) of investing in the Fund and to compare these costs with the ongoing costs of investing in other mutual funds.
The Example is based on an investment of $1,000 invested at the beginning of the period and held for the entire period as indicated below.
Actual Expenses
The table below provides information about actual account values and actual expenses. You may use the information in this line, together with the amount you invested, to estimate the expenses that you paid over the period. Simply divide your account value by $1,000 (for example, an $8,600 account value divided by $1,000 = 8.6), then multiply the result by the number in the first line under the heading entitled “Expenses Paid During Period” to estimate the expenses you paid on your account during this period.
Hypothetical Example for Comparison Purposes
The table below provides information about hypothetical account values and hypothetical expenses based on the Fund’s actual expense ratio and an assumed annual rate of return of 5% before expenses, which is not the Fund’s actual return. The hypothetical account values and expenses may not be used to estimate the actual ending account balance or expenses you paid for the period. You may use this information to compare the ongoing costs of investing in the Fund and other funds by comparing this 5% hypothetical example with the 5% hypothetical examples that appear in the shareholder reports of other funds.
Please note that the expenses shown in the table are meant to highlight your ongoing costs only and do not reflect any transactional costs, such as sales charges (loads), or contingent deferred sales charges on redemptions. Therefore, the hypothetical example is useful in comparing ongoing costs only, and will not help you determine the relative total costs of owning different funds. In addition, if these transactional costs were included, your costs would have been higher.
| Beginning Account Value November 1, 2012 | Ending Account Value April 30, 2013 | Expenses Paid During Period* | Annualized Expense Ratio* | |||||||||||||
Actual | $ | 1,000 | $ | 1,003.30 | $ | – 0 | – | 0.00 | % | |||||||
Hypothetical** | $ | 1,000 | $ | 1,024.79 | $ | – 0 | – | 0.00 | % | |||||||
| * | Expenses are equal to the Portfolio’s annualized expense ratio, multiplied by the average account value over the period, multiplied by 181/365 (to reflect the one-half year period). The Portfolio’s expenses are borne by the Adviser or its affiliates. |
| ** | Assumes 5% annual return before expenses. |
| 8 | • ALLIANCEBERNSTEIN TAX-AWARE REAL RETURN INCOME SHARES |
Expense Example
PORTFOLIO SUMMARY
April 30, 2013 (unaudited)
PORTFOLIO STATISTICS
Net Assets ($mil): $7.4
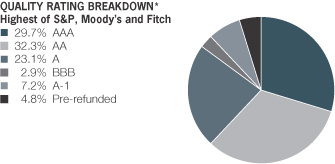
| * | All data are as of April 30, 2013. The Portfolio’s quality rating breakdown is expressed as a percentage of the Portfolio’s total investments in municipal securities and may vary over time. The Portfolio also enters into derivative transactions, which may be used for hedging or investment purposes (see “Portfolio of Investments” section of the report for additional details). The quality ratings are determined by using the Standard & Poor’s Ratings Services(“S&P”), Moody’s Investors Services, Inc.(“Moody’s”) and Fitch Ratings, Ltd.(“Fitch”). These ratings are a measure of the quality and safety of a bond or portfolio, based on the issuer’s financial condition. AAA is the highest (best) and D is the lowest (worst). If applicable, the pre-refunded category includes bonds which are secured by U.S. Government Securities and therefore are deemed high-quality investment grade by the Adviser. If applicable, Not Applicable (N/A) includes non credit worthy investments; such as, equities, currency contracts, futures and options. If applicable, the Not Rated category includes bonds that are not rated by a Nationally Recognized Statistical Rating Organization. |
| ALLIANCEBERNSTEIN TAX-AWARE REAL RETURN INCOME SHARES • | 9 |
Portfolio Summary
PORTFOLIO OF INVESTMENTS
April 30, 2013
| Principal Amount (000) | U.S. $ Value | |||||||
| ||||||||
MUNICIPAL OBLIGATIONS – 102.9% | ||||||||
Long-Term Municipal Bonds – 95.5% | ||||||||
Alaska – 3.3% | ||||||||
Anchorage AK GO | $ | 125 | $ | 137,567 | ||||
Valdez AK Marine Terminal | 100 | 110,644 | ||||||
|
| |||||||
| 248,211 | ||||||||
|
| |||||||
Arizona – 2.6% | ||||||||
Arizona Trnsp Brd Highway | 155 | 189,818 | ||||||
|
| |||||||
California – 6.7% | ||||||||
California Dept Wtr Res Pwr | 185 | 185,000 | ||||||
Los Angeles CA Wstwtr Sys | 180 | 220,104 | ||||||
San Francisco City/Cnty CA Arpt Commn | 80 | 95,626 | ||||||
|
| |||||||
| 500,730 | ||||||||
|
| |||||||
Colorado – 2.8% | ||||||||
Denver CO City & Cnty Arpt | 120 | 138,372 | ||||||
Series 2012B | 55 | 66,859 | ||||||
|
| |||||||
| 205,231 | ||||||||
|
| |||||||
Florida – 11.4% | ||||||||
Broward Cnty FL Sch Brd COP | 135 | 163,581 | ||||||
Citizens Ppty Ins Corp. FL | 145 | 161,388 | ||||||
Florida Brd of Ed GO | 75 | 88,008 | ||||||
| 10 | • ALLIANCEBERNSTEIN TAX-AWARE REAL RETURN INCOME SHARES |
Portfolio of Investments
| Principal Amount (000) | U.S. $ Value | |||||||
| ||||||||
Florida Mun Pwr Agy | $ | 140 | $ | 167,808 | ||||
Florida Ports Fin Commn | 100 | 108,032 | ||||||
Jacksonville FL Sales Tax | 50 | 60,185 | ||||||
Jacksonville FL Trnsp | 85 | 101,696 | ||||||
|
| |||||||
| 850,698 | ||||||||
|
| |||||||
Georgia – 0.6% | ||||||||
Georgia Mun Elec | 45 | 46,433 | ||||||
|
| |||||||
Indiana – 6.7% | ||||||||
Indiana Finance Auth (Indiana SRF) | 280 | 332,685 | ||||||
Indianapolis IN Loc Bond Bank | 100 | 103,178 | ||||||
Indianapolis IN Loc Bond Bank | 55 | 63,821 | ||||||
|
| |||||||
| 499,684 | ||||||||
|
| |||||||
Louisiana – 0.9% | ||||||||
Louisiana Citizens Ppty Ins Corp. | 70 | 70,265 | ||||||
|
| |||||||
Maryland – 6.3% | ||||||||
Baltimore MD GO | 250 | 286,763 | ||||||
Maryland GO | 170 | 184,895 | ||||||
|
| |||||||
| 471,658 | ||||||||
|
| |||||||
Massachusetts – 7.2% | ||||||||
Massachusetts Sch Bldg Auth | 335 | 370,637 | ||||||
Metropolitan Boston Trnsp Pkg Corp. MA | 140 | 165,010 | ||||||
|
| |||||||
| 535,647 | ||||||||
|
| |||||||
| ALLIANCEBERNSTEIN TAX-AWARE REAL RETURN INCOME SHARES • | 11 |
Portfolio of Investments
| Principal Amount (000) | U.S. $ Value | |||||||
| ||||||||
Michigan – 5.6% | ||||||||
Michigan Finance Auth | $ | 110 | $ | 139,222 | ||||
Michigan Finance Auth | 50 | 61,786 | ||||||
Series 2012B | 190 | 214,985 | ||||||
|
| |||||||
| 415,993 | ||||||||
|
| |||||||
New Jersey – 1.8% | ||||||||
New Jersey Trnsp Trust FD Auth | 135 | 135,848 | ||||||
|
| |||||||
New York – 9.2% | ||||||||
Long Island Pwr Auth NY | 100 | 102,277 | ||||||
New York NY Mun Wtr Fin Auth | 185 | 222,697 | ||||||
New York NY Trnsl Fin Auth | 175 | 214,760 | ||||||
Series 20131 | 70 | 80,767 | ||||||
New York St Dormitory Auth | 50 | 59,941 | ||||||
|
| |||||||
| 680,442 | ||||||||
|
| |||||||
North Carolina – 2.9% | ||||||||
North Carolina Cap Impt Lease | 185 | 214,885 | ||||||
|
| |||||||
Oklahoma – 4.3% | ||||||||
Oklahoma City OK GO | 300 | 320,103 | ||||||
|
| |||||||
Oregon – 2.2% | ||||||||
Tri-County Met Trnsp Dist OR Grant Prog | 140 | 166,165 | ||||||
|
| |||||||
Pennsylvania – 3.9% | ||||||||
Pennsylvania GO | 245 | 249,688 | ||||||
| 12 | • ALLIANCEBERNSTEIN TAX-AWARE REAL RETURN INCOME SHARES |
Portfolio of Investments
| Principal Amount (000) | U.S. $ Value | |||||||
| ||||||||
Philadelphia PA Gas Works | $ | 35 | $ | 36,708 | ||||
|
| |||||||
| 286,396 | ||||||||
|
| |||||||
Puerto Rico – 2.5% | ||||||||
Puerto Rico Elec Pwr Auth | 75 | 77,236 | ||||||
Puerto Rico Hwy & Trnsp Auth | 135 | 104,972 | ||||||
|
| |||||||
| 182,208 | ||||||||
|
| |||||||
Texas – 7.5% | ||||||||
Conroe TX ISD GO | 180 | 220,225 | ||||||
Houston TX Arpt Sys | 100 | 118,580 | ||||||
Lake Travis TX ISD GO | 120 | 151,844 | ||||||
North Texas Tollway Auth TX | 55 | 66,489 | ||||||
|
| |||||||
| 557,138 | ||||||||
|
| |||||||
Virginia – 2.9% | ||||||||
Fairfax Cnty VA Econ Dev Dist | 185 | 216,230 | ||||||
|
| |||||||
Washington – 4.2% | ||||||||
Central Puget Sound WA RTA | 165 | 202,004 | ||||||
Chelan Cnty WA PUD #1 | 90 | 108,198 | ||||||
|
| |||||||
| 310,202 | ||||||||
|
| |||||||
Total Long-Term Municipal Bonds | 7,103,985 | |||||||
|
| |||||||
Short-Term Municipal Notes – 7.4% | ||||||||
Mississippi – 4.0% | ||||||||
Mississippi Business Fin Corp. | 300 | 300,000 | ||||||
|
| |||||||
| ALLIANCEBERNSTEIN TAX-AWARE REAL RETURN INCOME SHARES • | 13 |
Portfolio of Investments
| Principal Amount (000) | U.S. $ Value | |||||||
| ||||||||
Texas – 3.4% | ||||||||
Lower Neches Valley Auth TX | $ | 250 | $ | 250,000 | ||||
|
| |||||||
Total Short-Term Municipal Notes | 550,000 | |||||||
|
| |||||||
Total Municipal Obligations | 7,653,985 | |||||||
|
| |||||||
CORPORATES–INVESTMENT GRADES – 3.2% | ||||||||
Financial Institutions – 2.0% | ||||||||
Banking – 1.6% | ||||||||
Bank of America Corp. | 25 | 26,661 | ||||||
Capital One Financial Corp. | 13 | 13,205 | ||||||
Citigroup, Inc. | 17 | 17,568 | ||||||
Goldman Sachs Group, Inc. (The) | 25 | 25,791 | ||||||
Morgan Stanley | 38 | 38,273 | ||||||
|
| |||||||
| 121,498 | ||||||||
|
| |||||||
Finance – 0.4% | ||||||||
General Electric Capital Corp. | 27 | 27,695 | ||||||
|
| |||||||
| 149,193 | ||||||||
|
| |||||||
Industrial – 1.0% | ||||||||
Consumer Cyclical - Automotive – 0.2% | ||||||||
Daimler Finance North America LLC | 14 | 14,450 | ||||||
|
| |||||||
Consumer Cyclical - Entertainment – 0.2% | ||||||||
Viacom, Inc. | 14 | 14,103 | ||||||
|
| |||||||
Consumer Non-Cyclical – 0.2% | ||||||||
Actavis, Inc. | 15 | 14,966 | ||||||
|
| |||||||
Technology – 0.4% | ||||||||
Hewlett-Packard Co. | 27 | 27,152 | ||||||
|
| |||||||
| 70,671 | ||||||||
|
| |||||||
| 14 | • ALLIANCEBERNSTEIN TAX-AWARE REAL RETURN INCOME SHARES |
Portfolio of Investments
| Principal Amount (000) | U.S. $ Value | |||||||
| ||||||||
Utility – 0.2% | ||||||||
Electric – 0.2% | ||||||||
Exelon Generation Co. LLC | $ | 13 | $ | 13,432 | ||||
|
| |||||||
Total Corporates – Investment Grades | 233,296 | |||||||
|
| |||||||
Total Investments – 106.1% | 7,887,281 | |||||||
Other assets less liabilities – (6.1)% | (449,988 | ) | ||||||
|
| |||||||
Net Assets – 100.0% | $ | 7,437,293 | ||||||
|
| |||||||
INTEREST RATE SWAP CONTRACTS (see Note C)
| Rate Type | ||||||||||||||||||||
| Swap Counterparty | Notional Amount (000) | Termination Date | Payments by the | Payments by the | Unrealized Appreciation/ (Depreciation) | |||||||||||||||
Barclays Bank PLC | $ | 4,100 | 1/14/16 | 0.520 | % | 3 Month LIBOR | $ | (4,523 | ) | |||||||||||
Barclays Bank PLC | 3,700 | 4/12/16 | 0.706 | % | 3 Month LIBOR | (13,382 | ) | |||||||||||||
Barclays Bank PLC | 4,000 | 1/14/20 | 1.395 | % | 3 Month LIBOR | (11,275 | ) | |||||||||||||
Citibank, NA | 250 | 7/07/23 | 2.035 | % | 3 Month LIBOR | (2,949 | ) | |||||||||||||
JPMorgan Chase Bank, NA | 2,400 | 9/13/17 | 1.098 | % | 3 Month LIBOR | (33,667 | ) | |||||||||||||
|
| |||||||||||||||||||
| $ | (65,796 | ) | ||||||||||||||||||
|
| |||||||||||||||||||
INFLATION (CPI) SWAP CONTRACTS (see Note C)
| Rate Type | ||||||||||||||||||||
| Swap Counterparty | Notional Amount (000) | Termination Date | Payments by the | Payments received by the Portfolio | Unrealized Appreciation/ (Depreciation) | |||||||||||||||
Barclays Bank PLC | $ | 200 | 1/31/27 | 2.628 | % | CPI | # | $ | 2,401 | |||||||||||
Citibank, NA | 300 | 7/19/22 | 2.400 | % | CPI | # | 4,635 | |||||||||||||
Citibank, NA | 100 | 12/07/22 | 2.748 | % | CPI | # | (1,401 | ) | ||||||||||||
Citibank, NA | 200 | 2/08/28 | 2.94 | % | CPI | # | (4,443 | ) | ||||||||||||
Deutsche Bank AG | 2,300 | 6/02/13 | 2.094 | % | CPI | # | (1,410 | ) | ||||||||||||
Deutsche Bank AG | 700 | 6/30/14 | 1.998 | % | CPI | # | (3,654 | ) | ||||||||||||
Deutsche Bank AG | 800 | 7/21/14 | 2.155 | % | CPI | # | (8,547 | ) | ||||||||||||
Deutsche Bank AG | 300 | 6/20/21 | 2.655 | % | CPI | # | (7,062 | ) | ||||||||||||
Deutsche Bank AG | 200 | 9/07/21 | 2.400 | % | CPI | # | 2,125 | |||||||||||||
JPMorgan Chase Bank, NA | 600 | 8/17/22 | 2.523 | % | CPI | # | 4,946 | |||||||||||||
JPMorgan Chase Bank, NA | 100 | 6/30/26 | 2.89 | % | CPI | # | (3,943 | ) | ||||||||||||
JPMorgan Chase Bank, NA | 200 | 7/21/26 | 2.935 | % | CPI | # | (9,349 | ) | ||||||||||||
JPMorgan Chase Bank, NA | 150 | 12/23/26 | 2.484 | % | CPI | # | 5,281 | |||||||||||||
JPMorgan Chase Bank, NA | 150 | 2/20/28 | 2.899 | % | CPI | # | (2,397 | ) | ||||||||||||
|
| |||||||||||||||||||
| $ | (22,818 | ) | ||||||||||||||||||
|
| |||||||||||||||||||
| # | Variable interest rate based on the rate of inflation as determined by the Consumer Price Index (CPI). |
| ALLIANCEBERNSTEIN TAX-AWARE REAL RETURN INCOME SHARES • | 15 |
Portfolio of Investments
TOTAL RETURN SWAP CONTRACTS (see Note C)
| Receive/Pay Total Return on Reference Index | Index | # of Shares or Units | Rate Paid by the Portfolio | Notional Amount (000) | Maturity Date | Counterparty | Unrealized Appreciation/ (Depreciation) | |||||||||||||||||||||
Receive Total Return on Reference Index |
| |||||||||||||||||||||||||||
Receive | BCIT3T | 8,500,000 | 0.49 | % | $ | 8,500 | 1/14/14 | Barclays Bank PLC | $ | (24,256 | ) | |||||||||||||||||
Receive | BCIT3T | 1,000,000 | 0.35 | % | 1,000 | 4/11/14 | Barclays Bank PLC | 7,138 | ||||||||||||||||||||
|
| |||||||||||||||||||||||||||
| $ | (17,118 | ) | ||||||||||||||||||||||||||
|
| |||||||||||||||||||||||||||
| (a) | Variable rate coupon, rate shown as of April 30, 2013. |
| (b) | Variable Rate Demand Notes are instruments whose interest rates change on a specific date (such as coupon date or interest payment date) or whose interest rates vary with changes in a designated base rate (such as the prime interest rate). This instrument is payable on demand and is secured by letters of credit or other credit support agreements from major banks. |
As of April 30, 2013, the Portfolio held 11.9%. of net assets in insured bonds (of this amount 41.8% represents the portfolio’s holding in pre-refunded or escrowed to maturity bonds).
Glossary:
AGM – Assured Guaranty Municipal
AMBAC – Ambac Assurance Corporation
BCIT3T – Barclays Capital US Inflation Linked Bonds 1 to 10 Year
COP – Certificate of Participation
ETM – Escrowed to Maturity
GO – General Obligation
ISD – Independent School District
LIBOR – London Interbank Offered Rates
NPFGC – National Public Finance Guarantee Corporation
NPFGC-RE – National Public Finance Guarantee Corporation Reinsuring FGIC
PUD – Public Utility District
RTA – Regional Transportation Authority
SRF – State Revolving Fund
See notes to financial statements.
| 16 | • ALLIANCEBERNSTEIN TAX-AWARE REAL RETURN INCOME SHARES |
Portfolio of Investments
STATEMENT OF ASSETS & LIABILITIES
April 30, 2013
| Assets | ||||
Investments in securities, at value (cost $7,593,341) | $ | 7,887,281 | ||
Interest and dividends receivable | 86,870 | |||
Unrealized appreciation on inflation swap contracts | 19,388 | |||
Unrealized appreciation on total return swap contracts | 7,138 | |||
|
| |||
Total assets | 8,000,677 | |||
|
| |||
| Liabilities | ||||
Due to custodian | 47,117 | |||
Payable for investment securities purchased | 374,019 | |||
Unrealized depreciation on interest rate swap contracts | 65,796 | |||
Unrealized depreciation on inflation swap contracts | 42,206 | |||
Unrealized depreciation on total return swap contracts | 24,256 | |||
Dividends payable | 9,990 | |||
|
| |||
Total liabilities | 563,384 | |||
|
| |||
Net Assets | $ | 7,437,293 | ||
|
| |||
| Composition of Net Assets | ||||
Shares of beneficial interest, at par | $ | 7 | ||
Additional paid-in capital | 7,131,695 | |||
Undistributed net investment income | 93,134 | |||
Accumulated net realized gain on investment transactions | 24,249 | |||
Net unrealized appreciation on investments | 188,208 | |||
|
| |||
| $ | 7,437,293 | |||
|
| |||
Net Asset Value Per Share—unlimited shares of beneficial interest authorized, $.00001 par value (based on 704,213 common shares outstanding) | $ | 10.56 | ||
|
|
See notes to financial statements.
| ALLIANCEBERNSTEIN TAX-AWARE REAL RETURN INCOME SHARES • | 17 |
Statement of Assets & Liabilities
STATEMENT OF OPERATIONS
Year Ended April 30, 2013
| Investment Income | ||||||||
Interest | $ | 150,350 | ||||||
Dividends—Affiliated issuers | 173 | |||||||
|
| |||||||
Total investment income | $ | 150,523 | ||||||
|
| |||||||
| Realized and Unrealized Gain (Loss) on Investment Transactions | ||||||||
Net realized gain on: | ||||||||
Investment transactions | 6,255 | |||||||
Swap contracts | 23,018 | |||||||
Net change in unrealized appreciation/depreciation of: | ||||||||
Investments | 97,917 | |||||||
Swap contracts | (86,691 | ) | ||||||
|
| |||||||
Net gain on investment transactions | 40,499 | |||||||
|
| |||||||
Net Increase in Net Assets from Operations | $ | 191,022 | ||||||
|
|
See notes to financial statements.
| 18 | • ALLIANCEBERNSTEIN TAX-AWARE REAL RETURN INCOME SHARES |
Statement of Operations
STATEMENT OF CHANGES IN NET ASSETS
| Year Ended April 30, 2013 | May 2, 2011(a) to April 30, 2012 | |||||||
| Increase in Net Assets from Operations | ||||||||
Net investment income | $ | 150,523 | $ | 107,656 | ||||
Net realized gain on investment transactions | 29,273 | 13,077 | ||||||
Net change in unrealized appreciation/depreciation of investments | 11,226 | 176,982 | ||||||
|
|
|
| |||||
Net increase in net assets from operations | 191,022 | 297,715 | ||||||
| Dividends and Distributions to Shareholders from | ||||||||
Net investment income | (73,672 | ) | (90,653 | ) | ||||
Net realized gain on investment transactions | (17,852 | ) | (969 | ) | ||||
| Transactions in Shares of Beneficial Interest | ||||||||
Net increase | 1,906,850 | 5,224,852 | ||||||
|
|
|
| |||||
Total increase | 2,006,348 | 5,430,945 | ||||||
| Net Assets | ||||||||
Beginning of period | 5,430,945 | – 0 | – | |||||
|
|
|
| |||||
End of period (including undistributed net investment income of $93,134 and $17,003, respectively) | $ | 7,437,293 | $ | 5,430,945 | ||||
|
|
|
| |||||
| (a) | Commencement of operations. |
See notes to financial statements.
| ALLIANCEBERNSTEIN TAX-AWARE REAL RETURN INCOME SHARES • | 19 |
Statement of Changes in Net Assets
NOTES TO FINANCIAL STATEMENTS
April 30, 2013
NOTE A
Significant Accounting Policies
AllianceBernstein Corporate Shares (the “Trust”) was organized as a Massachusetts business trust under the laws of The Commonwealth of Massachusetts by an Agreement and Declaration of Trust (“Declaration of Trust”) dated January 26, 2004. The Trust is registered under the Investment Company Act of 1940, as an open-end, diversified management investment company. The Trust operates as a “series” company currently offers four separate portfolios: AllianceBernstein Corporate Income Shares, AllianceBernstein Municipal Income Shares, AllianceBernstein Taxable Multi-Sector Income Shares and AllianceBernstein Tax-Aware Real Return Income Shares (the “Portfolio”). Each Portfolio is considered to be a separate entity for financial reporting and tax purposes. The Portfolio commenced operations on May 2, 2011. This report relates only to AllianceBernstein Tax-Aware Real Return Income Shares.
Shares of the Portfolio are offered exclusively to holders of accounts established under wrap-fee programs sponsored and maintained by certain registered investment advisers approved by AllianceBernstein L.P. (the “Adviser”). The Portfolio’s shares may be purchased at the relevant net asset value without a sales charge or other fee. The financial statements have been prepared in conformity with U.S. generally accepted accounting principles (“U.S. GAAP”) which require management to make certain estimates and assumptions that affect the reported amounts of assets and liabilities in the financial statements and amounts of income and expenses during the reporting period. Actual results could differ from those estimates. The following is a summary of significant accounting policies followed by the Portfolio.
1. Security Valuation
Portfolio securities are valued at their current market value determined on the basis of market quotations or, if market quotations are not readily available or are deemed unreliable, at “fair value” as determined in accordance with procedures established by and under the general supervision of the Trust’s Board of Trustees (the “Board”).
In general, the market value of securities which are readily available and deemed reliable are determined as follows: Securities listed on a national securities exchange (other than securities listed on the NASDAQ Stock Market, Inc. (“NASDAQ”)) or on a foreign securities exchange are valued at the last sale price at the close of the exchange or foreign securities exchange. If there has been no sale on such day, the securities are valued at the last traded price from the previous day. Securities listed on more than one exchange are valued by reference to the principal exchange on which the securities are traded; securities listed only on NASDAQ are valued in accordance with the NASDAQ Official Closing Price; listed or over the counter (“OTC”) market put or call options are valued at the mid level between the current bid and ask prices. If either a current bid or current ask price is unavailable, the Adviser will have discretion to determine the best valuation (e.g. last trade price in the case of listed options); open futures contracts are valued using the closing settlement price or, in the
| 20 | • ALLIANCEBERNSTEIN TAX-AWARE REAL RETURN INCOME SHARES |
Notes to Financial Statements
absence of such a price, the most recent quoted bid price. If there are no quotations available for the day of valuation, the last available closing settlement price is used; U.S. government securities and other debt instruments having 60 days or less remaining until maturity are valued at amortized cost if their original maturity was 60 days or less; or by amortizing their fair value as of the 61st day prior to maturity if their original term to maturity exceeded 60 days; fixed-income securities, including mortgage backed and asset backed securities, may be valued on the basis of prices provided by a pricing service or at a price obtained from one or more of the major broker/dealers. In cases where broker/dealer quotes are obtained, the Adviser may establish procedures whereby changes in market yields or spreads are used to adjust, on a daily basis, a recently obtained quoted price on a security. Swaps and other derivatives are valued daily, primarily using independent pricing services, independent pricing models using market inputs, as well as third party broker-dealers or counterparties. Investments in money market funds are valued at their net asset value each day.
Securities for which market quotations are not readily available (including restricted securities) or are deemed unreliable are valued at fair value. Factors considered in making this determination may include, but are not limited to, information obtained by contacting the issuer, analysts, analysis of the issuer’s financial statements or other available documents. In addition, the Portfolio may use fair value pricing for securities primarily traded in non-U.S. markets because most foreign markets close well before the Portfolio values its securities at 4:00 p.m., Eastern Time. The earlier close of these foreign markets gives rise to the possibility that significant events, including broad market moves, may have occurred in the interim and may materially affect the value of those securities.
2. Fair Value Measurements
In accordance with U.S. GAAP regarding fair value measurements, fair value is defined as the price that the Portfolio would receive to sell an asset or pay to transfer a liability in an orderly transaction between market participants at the measurement date. U.S. GAAP establishes a framework for measuring fair value, and a three-level hierarchy for fair value measurements based upon the transparency of inputs to the valuation of an asset or liability (including those valued based on their market values as described in Note 1 above). Inputs may be observable or unobservable and refer broadly to the assumptions that market participants would use in pricing the asset or liability. Observable inputs reflect the assumptions market participants would use in pricing the asset or liability based on market data obtained from sources independent of the Portfolio. Unobservable inputs reflect the Portfolio’s own assumptions about the assumptions that market participants would use in pricing the asset or liability based on the best information available in the circumstances. Each investment is assigned a level based upon the observability of the inputs which are significant to the overall valuation. The three-tier hierarchy of inputs is summarized below.
| • | Level 1—quoted prices in active markets for identical investments |
| ALLIANCEBERNSTEIN TAX-AWARE REAL RETURN INCOME SHARES • | 21 |
Notes to Financial Statements
| • | Level 2—other significant observable inputs (including quoted prices for similar investments, interest rates, prepayment speeds, credit risk, etc.) |
| • | Level 3—significant unobservable inputs (including the Portfolio’s own assumptions in determining the fair value of investments) |
The fair value of debt instruments, such as bonds, and over-the-counter derivatives is generally based on market price quotations, recently executed market transactions (where observable) or industry recognized modeling techniques and are generally classified as Level 2. Pricing vendor inputs to Level 2 valuations may include quoted prices for similar investments in active markets, interest rate curves, coupon rates, currency rates, yield curves, option adjusted spreads, default rates, credit spreads and other unique security features in order to estimate the relevant cash flows which is then discounted to calculate fair values. If these inputs are unobservable and significant to the fair value, these investments will be classified as Level 3. In addition, non-agency rated investments are classified as Level 3.
Other fixed income investments, including non-U.S. government and corporate debt, are generally valued using quoted market prices, if available, which are typically impacted by current interest rates, maturity dates and any perceived credit risk of the issuer. Additionally, in the absence of quoted market prices, these inputs are used by pricing vendors to derive a valuation based upon industry or proprietary models which incorporate issuer specific data with relevant yield/spread comparisons with more widely quoted bonds with similar key characteristics. Those investments for which there are observable inputs are classified as Level 2. Where the inputs are not observable, the investments are classified as Level 3.
The following table summarizes the valuation of the Portfolio’s investments by the above fair value hierarchy levels as of April 30, 2013:
Investments in Securities: | Level 1 | Level 2 | Level 3 | Total | ||||||||||||
Assets: | ||||||||||||||||
Long-Term Municipal Bonds | $ | – 0 | – | $ | 7,103,985 | $ | – 0 | – | $ | 7,103,985 | ||||||
Short-Term Municipal Notes | – 0 | – | 550,000 | – 0 | – | 550,000 | ||||||||||
Corporates – Investment Grades | – 0 | – | 233,296 | – 0 | – | 233,296 | ||||||||||
|
|
|
|
|
|
|
| |||||||||
Total Investments in Securities | – 0 | – | 7,887,281 | – 0 | – | 7,887,281 | ||||||||||
Other Financial Instruments*: | ||||||||||||||||
Assets: | ||||||||||||||||
Inflation (CPI) Swap Contracts | – 0 | – | 19,388 | – 0 | – | 19,388 | ||||||||||
Total Return Swap Contracts | – 0 | – | – 0 | – | 7,138 | 7,138 | ||||||||||
Liabilities: | ||||||||||||||||
Interest Rate Swap Contracts | – 0 | – | (65,796 | ) | – 0 | – | (65,796 | ) | ||||||||
Inflation (CPI) Swap Contracts | – 0 | – | (42,206 | ) | – 0 | – | (42,206 | ) | ||||||||
Total Return Swap Contracts | – 0 | – | – 0 | – | (24,256 | ) | (24,256 | ) | ||||||||
|
|
|
|
|
|
|
| |||||||||
Total^ | $ | – 0 | – | $ | 7,798,667 | $ | (17,118 | ) | $ | 7,781,549 | ||||||
|
|
|
|
|
|
|
| |||||||||
| * | Other financial instruments are derivative instruments, such as futures, forwards and swap contracts, which are valued at the unrealized appreciation/depreciation on the instrument. |
| ^ | There were no transfers between Level 1 and Level 2 during the reporting period. |
| 22 | • ALLIANCEBERNSTEIN TAX-AWARE REAL RETURN INCOME SHARES |
Notes to Financial Statements
The Portfolio recognizes all transfers between levels of the fair value hierarchy assuming the financial instruments were transferred at the beginning of the reporting period.
The following is a reconciliation of investments in which significant unobservable inputs (Level 3) were used in determining fair value.
| Total Return Swap Contracts | Total | |||||||
Balance as of 4/30/12 | $ | 124,207 | $ | 124,207 | ||||
Accrued discounts/(premiums) | – 0 | – | – 0 | – | ||||
Realized gain (loss) | 322,518 | 322,518 | ||||||
Change in unrealized appreciation/depreciation | (141,325 | ) | (141,325 | ) | ||||
Purchases | – 0 | – | – 0 | – | ||||
Sales | – 0 | – | – 0 | – | ||||
Settlements | (322,518 | ) | (322,518 | ) | ||||
Transfers in to Level 3 | – 0 | – | – 0 | – | ||||
Transfers out of Level 3 | – 0 | – | – 0 | – | ||||
|
|
|
| |||||
Balance as of 4/30/13 | $ | (17,118 | ) | $ | (17,118 | ) | ||
|
|
|
| |||||
Net change in unrealized appreciation/depreciation from Investments held as of 4/30/13* | $ | (17,118 | ) | $ | (17,118 | ) | ||
|
|
|
| |||||
| * | The unrealized appreciation/depreciation is included in net change in unrealized appreciation/depreciation of investments in the accompanying statement of operations. |
The Adviser has established a Valuation Committee (the “Committee”) which is responsible for overseeing the pricing and valuation of all securities held in the Portfolio. The Committee operates under pricing and valuation policies and procedures established by the Adviser and approved by the Board, including pricing policies which set forth the mechanisms and processes to be employed on a daily basis to implement these policies and procedures. In particular, the pricing policies describe how to determine market quotations for securities and other instruments. The Committee’s responsibilities include: 1) fair value and liquidity determinations (and oversight of any third parties to whom any responsibility for fair value and liquidity determinations is delegated), and 2) regular monitoring of the Adviser’s pricing and valuation policies and procedures and modification or enhancement of these policies and procedures (or recommendation of the modification of these policies and procedures) as the Committee believes appropriate.
The Committee is also responsible for monitoring the implementation of the pricing policies by the Adviser’s Pricing Group (the “Pricing Group”) and a third party which performs certain pricing functions in accordance with the pricing policies. The Pricing Group is responsible for the oversight of the third party on a day-to-day basis. The Committee and the Pricing Group perform a series of activities to provide reasonable assurance of the accuracy of prices including: 1) periodic vendor due diligence meetings, review of methodologies, new developments and process at vendors, 2) daily compare of security valuation
| ALLIANCEBERNSTEIN TAX-AWARE REAL RETURN INCOME SHARES • | 23 |
Notes to Financial Statements
versus prior day for all securities that exceeded established thresholds, and 3) daily review of unpriced, stale, and variance reports with exceptions reviewed by senior management and the Committee.
In addition, several processes outside of the pricing process are used to monitor valuation issues including: 1) performance and performance attribution reports are monitored for anomalous impacts based upon benchmark performance, and 2) portfolio managers review all portfolios for performance and analytics (which are generated using the Adviser’s prices).
3. Taxes
It is the Portfolio’s policy to meet the requirements of the Internal Revenue Code applicable to regulated investment companies and to distribute all of its investment company taxable income and net realized gains, if any, to shareholders. Therefore, no provisions for federal income or excise taxes are required.
In accordance with U.S. GAAP requirements regarding accounting for uncertainties in income taxes, management has analyzed the Portfolio’s tax positions taken or expected to be taken on federal and state income tax returns for all open tax years (all years since inception of the Portfolio) and has concluded that no provision for income tax is required in the Portfolio’s financial statements.
4. Investment Income and Investment Transactions
Dividend income is recorded on the ex-dividend date or as soon as the Portfolio is informed of the dividend. Interest income is accrued daily. Investment transactions are accounted for on the date the securities are purchased or sold. Investment gains or losses are determined on the identified cost basis. The Portfolio amortizes premiums and accretes discounts as adjustments to interest income.
5. Dividends and Distributions
Dividends and distributions to shareholders, if any, are recorded on the ex-dividend date. Income dividends and capital gains distributions are determined in accordance with federal tax regulations and may differ from those determined in accordance with U.S. GAAP. To the extent these differences are permanent, such amounts are reclassified within the capital accounts based on their federal tax basis treatment; temporary differences do not require such reclassification.
NOTE B
Advisory Fee and Other Transactions with Affiliates
Under the terms of the Advisory Agreement, the Portfolio pays no advisory fee to the Adviser and the Adviser reimburses or pays for the Portfolio’s operating expenses. The Portfolio is an integral part of separately managed accounts in wrap-fee programs. Typically, participants in these programs pay a fee to their investment adviser for all costs and expenses of the separately managed account, including costs and expenses associated with the Portfolio. The Adviser serves as investment manager and adviser of the Portfolio and continuously furnishes an
| 24 | • ALLIANCEBERNSTEIN TAX-AWARE REAL RETURN INCOME SHARES |
Notes to Financial Statements
investment program for the Portfolio and manages, supervises and conducts the affairs of the Portfolio, subject to the supervisions of the Portfolio’s Board. The Advisory Agreement provides that the Adviser or an affiliate will furnish, or pay the expenses of the Portfolio for, office space, facilities and equipment, services of executive and other personnel of the Portfolio and certain administrative services.
The Portfolio has entered into a Distribution Agreement with AllianceBernstein Investments, Inc., the Portfolio’s principal underwriter (the “Underwriter”), to permit the Underwriter to distribute the Portfolio’s shares, which are sold at their net asset value without any sales charge. The Portfolio does not pay a fee for this service. The Underwriter is a wholly owned subsidiary of the Adviser.
AllianceBernstein Investor Services, Inc. (“ABIS”), a wholly-owned subsidiary of the Adviser, acts as the Portfolio’s registrar, transfer agent and dividend-disbursing agent. ABIS registers the transfer, issuance and redemption of Portfolio shares and disburses dividends and other distributions to Portfolio shareholders. The Portfolio does not pay a fee for this service.
The Portfolio may invest in the AllianceBernstein Fixed-Income Shares, Inc.—Government STIF Portfolio (“Government STIF Portfolio”), an open-end management investment company managed by the Adviser. The Government STIF Portfolio is offered as a cash management option to mutual funds and other institutional accounts of the Adviser, and is not available for direct purchase by members of the public. The Government STIF Portfolio pays no investment management fees but does bear its own expenses. A summary of the Portfolio’s transactions in shares of the Government STIF Portfolio for the year ended April 30, 2013 is as follows:
Market Value April 30, 2012 (000) | Purchases at Cost (000) | Sales Proceeds (000) | Market Value April 30, 2013 (000) | Dividend Income (000) | ||||||||||||
| $ 21 | $ | 3,760 | $ | 3,781 | $ | – 0 | – | $ | – 0 | –* | ||||||
| * | Amount is less than $500. |
NOTE C
Investment Transactions
Purchases and sales of investment securities (excluding short-term investments) for the year ended April 30, 2013 were as follows:
| Purchases | Sales | |||||||
Investment securities (excluding | ||||||||
U.S. government securities) | $ | 3,588,192 | $ | 1,203,647 | ||||
U.S. government securities | – 0 | – | – 0 | – | ||||
| ALLIANCEBERNSTEIN TAX-AWARE REAL RETURN INCOME SHARES • | 25 |
Notes to Financial Statements
The cost of investments for federal income tax purposes, gross unrealized appreciation and unrealized depreciation (excluding swap transactions) are as follows:
Cost | $ | 7,593,341 | ||
|
| |||
Gross unrealized appreciation | $ | 295,082 | ||
Gross unrealized depreciation | (1,142 | ) | ||
|
| |||
Net unrealized appreciation | $ | 293,940 | ||
|
|
1. Derivative Financial Instruments
The Portfolio may use derivatives in an effort to earn income and enhance returns, to replace more traditional direct investments, to obtain exposure to otherwise inaccessible markets (collectively, “investment purposes”), or to hedge or adjust the risk profile of its portfolio.
The principal type of derivatives utilized by the Portfolio, as well as the methods in which they may be used are:
| • | Swap Agreements |
The Portfolio may enter into swaps to hedge its exposure to interest rates and credit risk or in order to take a “long” or “short” position with respect to an underlying referenced asset described below under “Total Return Swaps”. A swap is an agreement that obligates two parties to exchange a series of cash flows at specified intervals based upon or calculated by reference to changes in specified prices or rates for a specified amount of an underlying asset. The payment flows are usually netted against each other, with the difference being paid by one party to the other. In addition, collateral may be pledged or received by the Portfolio in accordance with the terms of the respective swap agreements to provide value and recourse to the Portfolio or its counterparties in the event of default, bankruptcy or insolvency by one of the parties to the swap agreement.
Risks may arise as a result of the failure of the counterparty to the swap contract to comply with the terms of the swap contract. The loss incurred by the failure of a counterparty is generally limited to the net interim payment to be received by the Portfolio, and/or the termination value at the end of the contract. Therefore, the Portfolio considers the creditworthiness of each counterparty to a swap contract in evaluating potential counterparty risk. This risk is mitigated by having a netting arrangement between the Portfolio and the counterparty and by the posting of collateral by the counterparty to the Portfolio to cover the Portfolio’s exposure to the counterparty. Additionally, risks may arise from unanticipated movements in interest rates or in the value of the underlying securities. The Portfolio accrues for the interim payments on swap contracts on a daily basis, with the net amount recorded within unrealized appreciation/depreciation of swap contracts on the statement of assets and liabilities, where applicable. Once the interim payments are settled in cash, the net amount is recorded as realized gain/(loss) on swaps on the
| 26 | • ALLIANCEBERNSTEIN TAX-AWARE REAL RETURN INCOME SHARES |
Notes to Financial Statements
statement of operations, in addition to any realized gain/(loss) recorded upon the termination of swap contracts. Upfront premiums paid or received are recognized as cost or proceeds on the statement of assets and liabilities and are amortized on a straight line basis over the life of the contract. Amortized upfront premiums are included in net realized gain/(loss) from swaps on the statement of operations. Fluctuations in the value of swap contracts are recorded as a component of net change in unrealized appreciation/depreciation of swap contracts on the statement of operations.
Interest Rate Swaps:
The Portfolio is subject to interest rate risk exposure in the normal course of pursuing its investment objectives. Because the Portfolio holds fixed rate bonds, the value of these bonds may decrease if interest rates rise. To help hedge against this risk and to maintain its ability to generate income at prevailing market rates, the Portfolio may enter into interest rate swap contracts. Interest rate swaps are agreements between two parties to exchange cash flows based on a notional amount. The Portfolio may elect to pay a fixed rate and receive a floating rate, or, receive a fixed rate and pay a floating rate on a notional amount.
In addition, a Portfolio may also enter into interest rate swap transactions to preserve a return or spread on a particular investment or portion of its portfolio, or protecting against an increase in the price of securities the Portfolio anticipates purchasing at a later date. Interest rate swaps involve the exchange by a Portfolio with another party of their respective commitments to pay or receive interest (e.g., an exchange of floating rate payments for fixed rate payments) computed based on a contractually-based principal (or “notional”) amount. Interest rate swaps are entered into on a net basis (i.e., the two payment streams are netted out, with the Portfolio receiving or paying, as the case may be, only the net amount of the two payments).
During the year ended April 30, 2013, the Portfolio held interest rate swaps for hedging purposes.
Inflation (CPI) Swaps:
Inflation swap agreements are contracts in which one party agrees to pay the cumulative percentage increase in a price index (the Consumer Price Index with respect to CPI swaps) over the term of the swap (with some lag on the inflation index), and the other pays a compounded fixed rate. Inflation swap agreements may be used to protect the net asset value, or NAV, of a Portfolio against an unexpected change in the rate of inflation measured by an inflation index since the value of these agreements is expected to increase if unexpected inflation increases.
During the year ended April 30, 2013, the Portfolio held inflation (CPI) swaps for hedging purposes.
| ALLIANCEBERNSTEIN TAX-AWARE REAL RETURN INCOME SHARES • | 27 |
Notes to Financial Statements
Total Return Swaps:
The Portfolio may enter into total return swaps in order to take a “long” or “short” position with respect to an underlying referenced asset. The Portfolio is subject to market price volatility of the underlying referenced asset. A total return swap involves commitments to pay interest in exchange for a market linked return based on a notional amount. To the extent that the total return of the security, group of securities or index underlying the transaction exceeds or falls short of the offsetting interest obligation, the Portfolio will receive a payment from or make a payment to the counterparty.
During the year ended April 30, 2013, the Portfolio held total return swaps for hedging purposes.
Documentation governing the Portfolio’s OTC derivatives may contain provisions for early termination of such transaction in the event the net assets of the Portfolio decline below specific levels set forth in the documentation (“net asset contingent features”). If these levels are triggered, the Portfolio’s counterparty has the right to terminate such transaction and require the Portfolio to pay or receive a settlement amount in connection with the terminated transaction. As of April 30, 2013, the Portfolio had OTC derivatives with contingent features in net liability positions in the amount of $105,732. If a trigger event had occurred at April 30, 2013, for those derivatives in a net liability position, an amount of $105,732 would be required to be posted by the Portfolio.
At April 30, 2013, the Portfolio had entered into the following derivatives:
Asset Derivatives | Liability Derivatives | |||||||||||
| Derivative Type | Statement of Assets and Liabilities Location | Fair Value | Statement of Assets and Liabilities Location | Fair Value | ||||||||
Interest rate contracts | Unrealized depreciation on interest rate swap contracts | $ | 65,796 |
| ||||||||
Interest rate contracts | Unrealized appreciation on inflation swap contracts | $ | 19,388 |
| Unrealized depreciation on inflation swap contracts |
| 42,206 |
| ||||
Equity contracts | Unrealized appreciation on total return swap contracts | 7,138 | Unrealized appreciation on total return swap contracts | 24,256 | ||||||||
|
|
|
| |||||||||
Total | $ | 26,526 | $ | 132,258 | ||||||||
|
|
|
| |||||||||
| 28 | • ALLIANCEBERNSTEIN TAX-AWARE REAL RETURN INCOME SHARES |
Notes to Financial Statements
The effect of derivative instruments on the statement of operations for the year ended April 30, 2013:
Derivative Type | Location of Gain or (Loss) on | Realized Gain or (Loss) on Derivatives | Change in Unrealized Appreciation or (Depreciation) | |||||||
Interest rate contracts | Net realized gain (loss) on swap contracts; Net change in unrealized appreciation/depreciation of swap contracts | $ | (299,500 | ) | $ | 51,799 | ||||
Interest rate contracts | Net realized gain (loss) on swap contracts; Net change in unrealized appreciation/depreciation of swap contracts | – 0 | – | 2,835 | ||||||
Equity contracts | Net realized gain (loss) on swap contracts; Net change in unrealized appreciation/depreciation of swap contracts | 322,518 | (141,325 | ) | ||||||
|
|
|
| |||||||
Total | $ | 23,018 | $ | (86,691 | ) | |||||
|
|
|
| |||||||
The following table represents the volume of the Portfolio’s derivative transactions during the year ended April 30, 2013:
Interest Rate Swap Contracts: | ||||
Average notional amount | $ | 11,473,077 | ||
Inflation Swap Contracts: | ||||
Average notional amount | $ | 5,715,385 | ||
Total Return Swap Contracts: | ||||
Average notional amount | $ | 7,853,846 |
NOTE D
Shares of Beneficial Interest
Transactions in shares of beneficial interest were as follows:
| Shares | Amount | |||||||||||||||||||
| Year Ended April 30, 2013 | May 2, 2011(a) to April 30, 2012 | Year Ended April 30, 2013 | May 2, 2011(a) to April 30, 2012 | |||||||||||||||||
|
| |||||||||||||||||||
Shares sold | 186,598 | 536,700 | $ | 1,960,240 | $ | 5,367,398 | ||||||||||||||
| ||||||||||||||||||||
Shares redeemed | (5,035 | ) | (14,050 | ) | (53,390 | ) | (142,546 | ) | ||||||||||||
| ||||||||||||||||||||
Net increase | 181,563 | 522,650 | $ | 1,906,850 | $ | 5,224,852 | ||||||||||||||
| ||||||||||||||||||||
| (a) | Commencement of operations. |
| ALLIANCEBERNSTEIN TAX-AWARE REAL RETURN INCOME SHARES • | 29 |
Notes to Financial Statements
NOTE E
Risks Involved in Investing in the Portfolio
Municipal Market Risk and Concentration of Credit Risk—This is the risk that special factors may adversely affect the value of municipal securities and have a significant effect on the yield or value of the Portfolio’s investments in municipal securities. These factors include economic conditions, political or legislative changes, uncertainties related to the tax status of municipal securities, or the rights of investors in these securities. To the extent that the Portfolio invests more of its assets in a particular state’s municipal securities, the Portfolio may be vulnerable to events adversely affecting that state, including economic, political and regulatory occurrences, court decisions, terrorism and catastrophic natural disasters, such as hurricanes or earthquakes. The Portfolio’s investments in certain municipal securities with principal and interest payments that are made from the revenues of a specific project or facility, and not general tax revenues, may have increased risks. Factors affecting the project or facility, such as local business or economic conditions, could have a significant effect on the project’s ability to make payments of principal and interest on these securities.
Derivatives Risk—The Portfolio may enter into derivative transactions such as forwards, options, futures and swaps. Derivatives may be illiquid, difficult to price, and leveraged so that small changes may produce disproportionate losses for the Portfolio, and subject to counterparty risk to a greater degree than more traditional investments. Derivatives may result in significant losses, including losses that are far greater than the value of the derivatives reflected in the statement of assets and liabilities.
Indemnification Risk—In the ordinary course of business, the Portfolio enters into contracts that contain a variety of indemnifications. The Portfolio’s maximum exposure under these arrangements is unknown. However, the Portfolio has not had prior claims or losses pursuant to these indemnification provisions and expects the risk of loss thereunder to be remote. Therefore, the Portfolio has not accrued any liability in connection with these indemnification provisions.
NOTE F
Distributions to Shareholders
The tax character of distributions paid during the fiscal year ended April 30, 2013 and the fiscal period ended April 30, 2012 were as follows:
| 2013 | 2012 | |||||||
Distributions paid from: | ||||||||
Ordinary income | $ | 17,361 | $ | 21,596 | ||||
Long-term capital gains | 5,046 | – 0 | – | |||||
|
|
|
| |||||
Total taxable distributions | 22,407 | 21,596 | ||||||
Tax-exempt distributions | 69,117 | 70,026 | ||||||
|
|
|
| |||||
Total distributions paid | $ | 91,524 | $ | 91,622 | ||||
|
|
|
| |||||
| 30 | • ALLIANCEBERNSTEIN TAX-AWARE REAL RETURN INCOME SHARES |
Notes to Financial Statements
As of April 30, 2013, the components of accumulated earnings/(deficit) on a tax basis were as follows:
Undistributed tax-exempt income | $ | 101,406 | ||
Undistributed ordinary income | 1,719 | |||
Undistributed capital gains | 24,249 | |||
Unrealized appreciation/(depreciation) | 188,208 | |||
|
| |||
Total accumulated earnings/(deficit) | $ | 315,582 | (a) | |
|
|
| (a) | The difference between book-basis and tax-basis components of accumulated earnings/(deficit) is attributable primarily to dividends payable. |
For tax purposes, net capital losses may be carried over to offset future capital gains, if any. Funds are permitted to carry forward capital losses incurred in taxable years beginning after December 22, 2010 for an indefinite period, and such losses will retain their character as either short-term or long-term capital losses. As of April 30, 2013, the Portfolio did not have any capital loss carryforwards.
During the current fiscal year, permanent differences primarily due to the tax treatment of swaps and a dividend redesignation resulted in a net decrease in undistributed net investment income and a net increase in accumulated net realized gain on investment transactions. These reclassifications had no effect on net assets.
NOTE G
Recent Accounting Pronouncements
In December 2011, the Financial Accounting Standards Board (“FASB”) issued an Accounting Standards Update (“ASU”) related to disclosures about offsetting assets and liabilities in financial statements. The amendments in this update require an entity to disclose both gross and net information for derivatives and other financial instruments that are either offset in the statement of assets and liabilities or subject to an enforceable master netting arrangement or similar agreement. In January 2013, the FASB issued an ASU to clarify the scope of disclosures about offsetting assets and liabilities. The ASU limits the scope of the new balance sheet offsetting disclosures to derivatives, repurchase agreements and securities lending transactions. The ASU is effective during interim or annual reporting periods beginning on or after January 1, 2013. At this time, management is evaluating the implication of this ASU and its impact on the financial statements has not been determined.
NOTE H
Subsequent Events
Management has evaluated subsequent events for possible recognition or disclosure in the financial statements through the date the financial statements are issued. Management has determined that there are no material events that would require disclosure in the Portfolio’s financial statements through this date.
| ALLIANCEBERNSTEIN TAX-AWARE REAL RETURN INCOME SHARES • | 31 |
Notes to Financial Statements
FINANCIAL HIGHLIGHTS
Selected Data For A Share Of Beneficial Interest Outstanding Throughout Each Period
| Year Ended April 30, 2013 | May 2, 2011(a) to April 30, 2012 | |||||||
Net asset value, beginning of period | $ | 10.39 | $ | 10.00 | ||||
|
| |||||||
Income From Investment Operations | ||||||||
Net investment income(b) | .24 | .21 | ||||||
Net realized and unrealized gain on investment transactions | .08 | .36 | ||||||
|
| |||||||
Net increase in net asset value from operations | .32 | .57 | ||||||
|
| |||||||
Less: Dividends and Distributions | ||||||||
Dividends from net investment income | (.12 | ) | (.18 | ) | ||||
Distributions from net realized gain on investment transactions | (.03 | ) | .00 | (c) | ||||
|
| |||||||
Total dividends and distributions | (.15 | ) | (.18 | ) | ||||
|
| |||||||
Net asset value, end of period | $ | 10.56 | $ | 10.39 | ||||
|
| |||||||
Total Return | ||||||||
Total investment return based on net asset value(d) | 3.06 | % | 5.74 | % | ||||
Ratios/Supplemental Data | ||||||||
Net assets, end of period (000’s omitted) | $ | 7,437 | $ | 5,431 | ||||
Ratio to average net assets of: | ||||||||
Net investment income | 2.29 | % | 2.07 | %(e) | ||||
Portfolio turnover rate | 19 | % | 25 | % | ||||
| (a) | Commencement of operations. |
| (b) | Based on average shares outstanding. |
| (c) | Amount is less than $0.005. |
| (d) | Total investment return is calculated assuming an initial investment made at the net asset value at the beginning of the period, reinvestment of all dividends and distributions at net asset value during the period, and redemption on the last day of the period. Total return does not reflect the deduction of taxes that a shareholder would pay on fund distributions or the redemption of fund shares. Total investment return calculated for a period of less than one year is not annualized. |
| (e) | Annualized. |
See notes to financial statements.
| 32 | • ALLIANCEBERNSTEIN TAX-AWARE REAL RETURN INCOME SHARES |
Financial Highlights
REPORT OF INDEPENDENT REGISTERED
PUBLIC ACCOUNTING FIRM
To the Board of Trustees of AllianceBernstein Corporate Shares and Shareholders of AllianceBernstein Tax-Aware Real Return Income Shares:
We have audited the accompanying statement of assets and liabilities of AllianceBernstein Tax-Aware Real Return Incomes Shares (one of the series constituting AllianceBernstein Corporate Shares) (the “Fund”), including the portfolio of investments, as of April 30, 2013, and the related statement of operations for the year then ended, and the statements of changes in net assets and the financial highlights for the year then ended and for the period May 2, 2011 (commencement of operations) through April 30, 2012. These financial statements and financial highlights are the responsibility of the Fund’s management. Our responsibility is to express an opinion on these financial statements and financial highlights based on our audits.
We conducted our audits in accordance with the standards of the Public Company Accounting Oversight Board (United States). Those standards require that we plan and perform the audit to obtain reasonable assurance about whether the financial statements and financial highlights are free of material misstatement. We were not engaged to perform an audit of the Fund’s internal control over financial reporting. Our audits included consideration of internal control over financial reporting as a basis for designing audit procedures that are appropriate in the circumstances, but not for the purpose of expressing an opinion on the effectiveness of the Fund’s internal control over financial reporting. Accordingly, we express no such opinion. An audit also includes examining, on a test basis, evidence supporting the amounts and disclosures in the financial statements and financial highlights, assessing the accounting principles used and significant estimates made by management, and evaluating the overall financial statement presentation. Our procedures included confirmation of securities owned as of April 30, 2013, by correspondence with the custodian and others, or by other appropriate auditing procedures where replies from others were not received. We believe that our audits provide a reasonable basis for our opinion.
In our opinion, the financial statements and financial highlights referred to above present fairly, in all material respects, the financial position of AllianceBernstein Tax-Aware Real Return Income Shares of AllianceBernstein Corporate Shares at April 30, 2013, and the results of its operations for the year then ended, and the changes in its net assets and financial highlights for the year then ended and for the period May 2, 2011 (commencement of operations) through April 30, 2012, in conformity with U.S. generally accepted accounting principles.

New York, New York
June 27, 2013
| ALLIANCEBERNSTEIN TAX-AWARE REAL RETURN INCOME SHARES • | 33 |
Report of Independent Registered Public Accounting Firm
2013 FEDERAL TAX INFORMATION
(unaudited)
For Federal income tax purposes, the following information is furnished with respect to the distributions paid by the Portfolio during the taxable period ended April 30, 2013. For foreign shareholders, 26.66% of ordinary dividends paid may be considered to be qualifying to be taxed as interest-related dividends.
| 34 | • ALLIANCEBERNSTEIN TAX-AWARE REAL RETURN INCOME SHARES |
2012 Federal Tax Information
BOARD OF TRUSTEES
| William H. Foulk, Jr.(1), Chairman | Robert M. Keith, President and Chief Executive Officer | |
| John H. Dobkin(1) | ||
| Michael J. Downey(1) | Garry L. Moody(1) | |
| D. James Guzy(1) | Marshall C. Turner, Jr.(1) | |
| Nancy P. Jacklin(1) | Earl D. Weiner(1) |
OFFICERS
Philip L. Kirstein, Senior Vice President and Independent Compliance Officer Michael G. Brooks(2), Vice President Fred S. Cohen(2) , Vice President Robert “Guy” B. Davidson III(2), Vice President | Wayne D. Godlin(2), Vice President Terrance T. Hults(2), Vice President Emilie D. Wrapp, Secretary Joseph J. Mantineo, Treasurer and Chief Financial Officer Phyllis J. Clarke, Controller |
Custodian and Accounting Agent State Street Bank and Trust Company
Principal Underwriter AllianceBernstein Investments, Inc.
Transfer Agent AllianceBernstein Investor Services, Inc. | �� | Legal Counsel Seward & Kissel LLP One Battery Park Plaza New York, NY 10004
Independent Registered Public Accounting Firm Ernst & Young LLP 5 Times Square New York, NY 10036 |
| (1) | Member of the Audit Committee, the Governance and Nominating Committee and the Independent Directors Committee. Mr. Foulk is the sole member of the Fair Value Pricing Committee. |
| (2) | The day-to-day management of, and investment decisions for, the Trust’s Portfolio are made by the Municipal Bond Investment Team. Messrs. Michael G. Brooks, Fred S. Cohen, Robert “Guy” B. Davidson III, Wayne D. Godlin and Terrance T. Hults are the investment professionals primarily responsible for the day-to-day management of the Trust’s Portfolio. |
| ALLIANCEBERNSTEIN TAX-AWARE REAL RETURN INCOME SHARES • | 35 |
Board of Trustees
MANAGEMENT OF THE FUND
Board of Trustees Information
The business and affairs of the Trust are managed under the direction of the Board of Trustees. Certain information concerning the Trust’s Trustee is set forth below.
NAME, ADDRESS* AND AGE (YEAR FIRST ELECTED**) | PRINCIPAL OCCUPATION(S) DURING PAST FIVE YEARS AND OTHER RELEVANT QUALIFICATIONS*** | PORTFOLIOS IN FUND COMPLEX OVERSEEN BY TRUSTEE | OTHER DIRECTORSHIPS HELD BY TRUSTEE IN THE PAST FIVE YEARS | |||||
| INTERESTED TRUSTEE | ||||||||
Robert M. Keith, # 53 (2010) | Senior Vice President of AllianceBernstein L.P. (the “Adviser”) and the head of AllianceBernstein Investments, Inc. (“ABI”) since July 2008; Director of ABI and President of the AllianceBernstein Mutual Funds. Previously, he served as Executive Managing Director of ABI from December 2006 to June 2008. Prior to joining ABI in 2006, Executive Managing Director of Bernstein Global Wealth Management, and prior thereto, Senior Managing Director and Global Head of Client Service and Sales of the Adviser’s institutional investment management business since 2004. Prior thereto, he was Managing Director and Head of North American Client Service and Sales in the Adviser’s institutional investment management business, with which he had been associated since prior to 2004. | 102 | None | |||||
| 36 | • ALLIANCEBERNSTEIN TAX-AWARE REAL RETURN INCOME SHARES |
Management of the Fund
NAME, ADDRESS* AND AGE (YEAR FIRST ELECTED**) | PRINCIPAL OCCUPATION(S) DURING PAST FIVE YEARS AND OTHER RELEVANT QUALIFICATIONS*** | PORTFOLIOS IN FUND COMPLEX OVERSEEN BY TRUSTEE | OTHER DIRECTORSHIPS HELD BY TRUSTEE IN THE PAST FIVE YEARS | |||||
| DISINTERESTED TRUSTEES | ||||||||
Chairman of the Board William H. Foulk, Jr., ##, + 80 (2010) | Investment Adviser and an Independent Consultant since prior to 2008. Previously, he was Senior Manager of Barrett Associates, Inc., a registered investment adviser. He was formerly Deputy Comptroller and Chief Investment Officer of the State of New York and, prior thereto, Chief Investment Officer of the New York Bank for Savings. He has served as a director or trustee of various AllianceBernstein Funds since 1983 and has been Chairman of the AllianceBernstein Funds and of the Independent Directors Committee of such Funds since 2003. He is also active in a number of mutual fund related organizations and committees. | 102 | None | |||||
John H. Dobkin, ## 71 (2010) | Independent Consultant since prior to 2008. Formerly, President of Save Venice, Inc. (preservation organization) from 2001-2002; Senior Advisor from June 1999-June 2000 and President of Historic Hudson Valley (historic preservation) from December 1989-May 1999. Previously, Director of the National Academy of Design. He has served as a director or trustee of various AllianceBernstein Funds since 1992, and as Chairman of the Audit Committees of a number of such Funds from 2001-2008. | 102 | None | |||||
| ALLIANCEBERNSTEIN TAX-AWARE REAL RETURN INCOME SHARES • | 37 |
Management of the Fund
NAME, ADDRESS* AND AGE (YEAR FIRST ELECTED**) | PRINCIPAL OCCUPATION(S) DURING PAST FIVE YEARS AND OTHER RELEVANT QUALIFICATIONS*** | PORTFOLIOS IN FUND COMPLEX OVERSEEN BY TRUSTEE | OTHER DIRECTORSHIPS HELD BY TRUSTEE IN THE PAST FIVE YEARS | |||||
| DISINTERESTED TRUSTEES (continued) | ||||||||
Michael J. Downey, ## 69 (2010) | Private Investor since prior to 2008. Formerly, managing partner of Lexington Capital, LLC (investment advisory firm) from December 1997 until December 2003. From 1987 until 1993, Chairman and CEO of Prudential Mutual Fund Management, director of the Prudential mutual funds, and member of the Executive Committee of Prudential Securities Inc. He has served as a director or trustee of the AllianceBernstein Funds since 2005 and is a director and Chairman of one other registered investment company. | 102 | Asia Pacific Fund, Inc. since prior to 2008, Prospect Acquisition Corp. (financial services) from 2007 until 2009 and The Merger Fund since prior to 2008 until 2013 | |||||
D. James Guzy, ## 77 (2010) | Chairman of the Board of PLX Technology (semi-conductors) and of SRC Computers Inc., with which he has been associated since prior to 2008. He was a director of Intel Corporation (semi-conductors) from 1969 until 2008, and served as Chairman of the Finance Committee of such company for several years until May 2008. He has served as a director or trustee of one or more of the AllianceBernstein Funds since 1982. | 102 | PLX Technology (semi-conductors) since prior to 2008, Cirrus Logic Corporation (semi-conductors) since prior to 2008 until July 2011 and Intel Corporation (semi-conductors) until 2008 | |||||
| 38 | • ALLIANCEBERNSTEIN TAX-AWARE REAL RETURN INCOME SHARES |
Management of the Fund
NAME, ADDRESS* AND AGE (YEAR FIRST ELECTED**) | PRINCIPAL OCCUPATION(S) DURING PAST FIVE YEARS AND OTHER RELEVANT QUALIFICATIONS*** | PORTFOLIOS IN FUND COMPLEX OVERSEEN BY TRUSTEE | OTHER DIRECTORSHIPS HELD BY TRUSTEE IN THE PAST FIVE YEARS | |||||
| DISINTERESTED TRUSTEES (continued) | ||||||||
Nancy P. Jacklin, ## 65 (2010) | Professorial Lecturer at the Johns Hopkins School of Advanced International Studies since 2008. Formerly, U.S. Executive Director of the International Monetary Fund (December 2002-May 2006); Partner, Clifford Chance (1992-2002); Sector Counsel, International Banking and Finance, and Associate General Counsel, Citicorp (1985-1992); Assistant General Counsel (International), Federal Reserve Board of Governors (1982-1985); and Attorney Advisor, U.S. Department of the Treasury (1973-1982). Member of the Bar of the District of Columbia and of New York; and member of the Council on Foreign Relations. She has served as a director or trustee of the AllianceBernstein Funds since 2006. | 102 | None | |||||
| ALLIANCEBERNSTEIN TAX-AWARE REAL RETURN INCOME SHARES • | 39 |
Management of the Fund
NAME, ADDRESS* AND AGE (YEAR FIRST ELECTED**) | PRINCIPAL OCCUPATION(S) DURING PAST FIVE YEARS AND OTHER RELEVANT QUALIFICATIONS*** | PORTFOLIOS IN FUND COMPLEX OVERSEEN BY TRUSTEE | OTHER DIRECTORSHIPS HELD BY TRUSTEE IN THE PAST FIVE YEARS | |||||
| DISINTERESTED TRUSTEES (continued) | ||||||||
Garry L. Moody, ## 61 (2010) | Independent Consultant. Formerly, Partner, Deloitte & Touche LLP (1995-2008) where he held a number of senior positions, including Vice Chairman, and U.S. and Global Investment Management Practice Managing Partner; President, Fidelity Accounting and Custody Services Company (1993-1995); and Partner, Ernst & Young LLP (1975-1993), where he served as the National Director of Mutual Fund Tax Services and Managing Partner of its Chicago Office Tax department. He is a member of both the Governing Council of the Independent Directors Council (IDC), an organization of independent directors of mutual funds, and the Trustee Advisory Board of BoardIQ, a biweekly publication focused on issues and news affecting directors of mutual funds. He has served as a director or trustee, and as Chairman of the Audit Committee, of the AllianceBernstein Funds since 2008. | 102 | None | |||||
| 40 | • ALLIANCEBERNSTEIN TAX-AWARE REAL RETURN INCOME SHARES |
Management of the Fund
NAME, ADDRESS* AND AGE (YEAR FIRST ELECTED**) | PRINCIPAL OCCUPATION(S) DURING PAST FIVE YEARS AND OTHER RELEVANT QUALIFICATIONS*** | PORTFOLIOS IN FUND COMPLEX OVERSEEN BY TRUSTEE | OTHER DIRECTORSHIPS HELD BY TRUSTEE IN THE PAST FIVE YEARS | |||||
| DISINTERESTED TRUSTEES (continued) | ||||||||
Marshall C. Turner, Jr., ## 71 (2010) | Private Investor since prior to 2008. Interim CEO of MEMC Electronic Materials, Inc. (semi-conductor and solar cell substrates) from November 2008 until March 2009. He was Chairman and CEO of Dupont Photomasks, Inc. (components of semi-conductor manufacturing), 2003-2005, and President and CEO, 2005-2006, after the company was acquired and renamed Toppan Photomasks, Inc. He has extensive experience in venture capital investing including prior service as general partner of three institutional venture capital partnerships, and serves on the boards of a number of education and science-related non-profit organizations. He has served as a director or trustee of one or more of the AllianceBernstein Funds since 1992. | 102 | Xilinx, Inc. (programmable logic semi-conductors) and MEMC Electronic Materials, Inc. (semi-conductor and solar cell substrates) since prior to 2008 | |||||
Earl D. Weiner, ## 73 (2010) | Of Counsel, and Partner prior to January 2007, of the law firm Sullivan & Cromwell LLP and member of ABA Federal Regulation of Securities Committee Task Force to draft editions of the Fund Director’s Guidebook. He also serves as a director or trustee of various non-profit organizations and has served as Chairman or Vice Chairman of a number of them. He has served as a director or trustee of the AllianceBernstein Funds since 2007 and is Chairman of the Governance and Nominating Committees of the Funds. | 102 | None | |||||
| ALLIANCEBERNSTEIN TAX-AWARE REAL RETURN INCOME SHARES • | 41 |
Management of the Fund
| * | The address for each of the Trust’s disinterested Trustees is c/o AllianceBernstein L.P., Attention: Philip L. Kirstein, 1345 Avenue of the Americas, New York, NY 10105. |
| ** | There is no stated term of office for the Trust’s Trustees. |
| *** | The information above includes each Trustee’s principal occupation during the last five years and other information relating to the experience, attributes, and skills relevant to each Trustee’s qualifications to serve as a Trustee, which led to the conclusion that each Trustee should serve as a Trustee for the Trust. |
| # | Mr. Keith is an “interested person” of the Trust, as defined in the 1940 Act, due to his position as a Senior Vice President of the Adviser. |
| ## | Member of the Audit Committee, the Governance and Nominating committee and the Independent Directors Committee. |
| † | Member of the Fair Value Pricing Committee. |
| 42 | • ALLIANCEBERNSTEIN TAX-AWARE REAL RETURN INCOME SHARES |
Management of the Fund
Officers
| NAME, ADDRESS* AND AGE | POSITION(S) HELD WITH FUND | PRINCIPAL OCCUPATION DURING PAST FIVE YEARS | ||
Robert M. Keith 53 | President and Chief Executive Officer | See biography above. | ||
Philip L. Kirstein 68 | Senior Vice President | Senior Vice President and Independent Compliance Officer of the AllianceBernstein Funds, with which he has been associated since October 2004. Prior thereto, he was Of Counsel to Kirkpatrick & Lockhart, LLP from October 2003 to October 2004, and General Counsel of Merrill Lynch Investment Managers, L.P. since prior to March 2003. | ||
Michael G. Brooks 65 | Vice President | Senior Vice President of the Adviser**, with which he has been associated since prior to 2008. | ||
Fred S. Cohen 55
| Vice President | Senior Vice President of the Adviser**, with which he has been associated since prior to 2008. | ||
Robert “Guy” B. Davidson, III 52 | Vice President | Senior Vice President of the Adviser**, with which he has been associated since prior to 2008. | ||
Wayne D. Godlin 52 | Vice President | Senior Vice President of the Adviser** since December 2009. Prior thereto, he was an investment manager and a Managing Director of Van Kampen Asset Management with which he had been associated since prior to 2008. | ||
Terrance T. Hults 47 | Vice President | Senior Vice President of the Adviser**, with which he has been associated since prior to 2008. | ||
Emilie D. Wrapp 57 | Secretary | Senior Vice President, Assistant General Counsel and Assistant Secretary of ABI**, with which she has been associated since prior to 2008. | ||
Joseph J. Mantineo 54 | Treasurer and Chief Financial Officer | Senior Vice President of AllianceBernstein Investor Services, Inc. (“ABIS”)**, with which he has been associated since prior to 2008. | ||
Phyllis J. Clarke 52 | Controller | Vice President of ABIS**, with which she has been associated since prior to 2008. |
| * | The address for each of the Portfolio’s Officers is 1345 Avenue of the Americas, New York, NY 10105. |
| ** | The Adviser, ABI and ABIS are affiliates of the Fund. |
| The Trust’s Statement of Additional Information (“SAI”) has additional information about the Trust’s Trustees and Officers and is available without charge upon request. Contact your financial representative or AllianceBernstein at 1-800-227-4618 for a free prospectus or SAI. |
| ALLIANCEBERNSTEIN TAX-AWARE REAL RETURN INCOME SHARES • | 43 |
Management of the Fund
Information Regarding the Review and Approval of the Fund’s Advisory Agreement
The disinterested trustees (the “trustees”) of AllianceBernstein Corporate Shares (the “Fund”) unanimously approved the continuance of the Fund’s Advisory Agreement with the Adviser in respect of AllianceBernstein Tax-Aware Real Return Income Shares (the “Portfolio”) at a meeting held on November 6-8, 2012.
Prior to approval of the continuance of the Advisory Agreement in respect of the Portfolio, the trustees had requested from the Adviser, and received and evaluated, extensive materials. They reviewed the proposed continuance of the Advisory Agreement with the Adviser and with experienced counsel who are independent of the Adviser, who advised on the relevant legal standards. The trustees also reviewed an independent evaluation prepared by the Fund’s Senior Officer (who is also the Fund’s Independent Compliance Officer) of the reasonableness of the advisory fee, in which the Senior Officer concluded that the contractual fee (zero) for the Portfolio was reasonable. The trustees also discussed the proposed continuance in private sessions with counsel and the Fund’s Senior Officer.
The trustees noted that the Portfolio is designed as a vehicle for the wrap fee account market (where investors pay fees to a wrap fee sponsor which pays investment fees and expenses from such fee). The trustees also noted that no advisory fee is payable by the Portfolio, that the Advisory Agreement does not include the reimbursement provision for certain administrative expenses included in the advisory agreements of most of the open-end AllianceBernstein Funds, and that the Adviser is responsible for payment of the Portfolio’s ordinary expenses. The trustees noted that the Fund acknowledges in the Advisory Agreement that the Adviser and its affiliates expect to receive compensation from third parties in connection with services provided under the Advisory Agreement. The trustees further noted that the Adviser receives payments from the wrap fee program sponsors (the “Sponsors”) that use the Portfolio as an investment vehicle for their clients.
The trustees considered their knowledge of the nature and quality of the services to be provided by the Adviser to the Portfolio gained from their experience as trustees or directors of most of the registered investment companies advised by the Adviser, their overall confidence in the Adviser’s integrity and competence they have gained from that experience, the Adviser’s initiative in identifying and raising potential issues with the trustees and its responsiveness, frankness and attention to concerns raised by the trustees in the past, including the Adviser’s willingness to consider and implement organizational and operational changes designed to improve investment results and the services provided to the AllianceBernstein Funds. The trustees noted that they have four regular meetings each year, at each of which they receive presentations from the Adviser on the investment results of the Portfolio and review extensive materials and information presented by the Adviser.
| 44 | • ALLIANCEBERNSTEIN TAX-AWARE REAL RETURN INCOME SHARES |
The trustees also considered all other factors they believed relevant, including the specific matters discussed below. In their deliberations, the trustees did not identify any particular information that was all-important or controlling, and different trustees may have attributed different weights to the various factors. The trustees determined that the selection of the Adviser to manage the Portfolio, and the overall arrangements between the Portfolio and the Adviser, as provided in the Advisory Agreement, including the advisory fee, were fair and reasonable in light of the services performed, expenses incurred and such other matters as the trustees considered relevant in the exercise of their business judgment. The material factors and conclusions that formed the basis for the trustees’ determination included the following:
Nature, Extent and Quality of Services Provided
The trustees considered the scope and quality of services provided by the Adviser under the Advisory Agreement, including the quality of the investment research capabilities of the Adviser and the other resources it has dedicated to performing services for the Portfolio. They also noted the professional experience and qualifications of the Portfolio’s portfolio management team and other senior personnel of the Adviser. The quality of administrative and other services, including the Adviser’s role in coordinating the activities of the Portfolio’s other service providers, also were considered. The trustees concluded that, overall, they were satisfied with the nature, extent and quality of services provided to the Portfolio under the Advisory Agreement.
Costs of Services Provided and Profitability
The trustees reviewed a schedule of the revenues, expenses and related notes indicating the profitability of the Portfolio to the Adviser for calendar year 2011 that had been prepared with an expense allocation methodology arrived at in consultation with an independent consultant retained by the Fund’s Senior Officer. The trustees considered that while the Adviser does not receive any advisory fee from the Portfolio or expense reimbursement, it does receive fees paid by the Sponsors. They also noted that the Adviser bears certain costs in providing services to the Portfolio and in paying its ordinary expenses. The trustees reviewed the assumptions and methods of allocation used by the Adviser in preparing fund-specific profitability data and noted that there are a number of potentially acceptable allocation methodologies for information of this type. The trustees noted that the profitability information reflected all revenues and expenses of the Adviser’s relationship with the Portfolio. The trustees recognized that it is difficult to make comparisons of the profitability of the Advisory Agreement with the profitability of advisory contracts for unaffiliated funds because comparative information is not generally publicly available and is affected by numerous factors, including, in the case of the Portfolio, the fact that it does not pay an advisory fee. The trustees focused on the profitability of the Adviser’s relationship with the Portfolio before taxes. The trustees noted that the Adviser’s relationship with the Portfolio (May 2011 inception) was not profitable to it in 2011.
| ALLIANCEBERNSTEIN TAX-AWARE REAL RETURN INCOME SHARES • | 45 |
Fall-Out Benefits
The trustees considered the other benefits to the Adviser and its affiliates from their relationships with the Portfolio. The trustees noted that the Adviser is compensated by the Sponsors. The trustees understood that the Adviser might also derive reputational and other benefits from its association with the Portfolio.
Investment Results
In addition to the information reviewed by the trustees in connection with the meeting, the trustees receive detailed performance information for the Portfolio at each regular Board meeting during the year. At the November 2012 meeting, the trustees reviewed information prepared by Lipper showing the performance of the Portfolio as compared with that of funds selected by Lipper (the “Performance Universe”) for the 1-year period ended July 31, 2012, and information prepared by the Adviser showing the Portfolio’s performance as compared with the Barclays Capital (BC) 1-10 Year Treasury Inflation Protected Securities (TIPS) Index (the “BC 1-10 Year TIPS Index”), for the 1-year period ended September 30, 2012, and the period since inception (May 2011 inception). The trustees noted that, on a gross return basis, the Portfolio was in the 5th quintile of the Performance Universe. The Portfolio outperformed the BC 1-10 Year TIPS Index in the 1-year period and lagged it in the period since inception. The trustees were cognizant that the Portfolio was neither designed nor offered as a standalone investment and was intended to serve solely as a component of certain separately managed accounts (“SMAs”). The Adviser had explained that this attribute made it difficult to select an appropriate benchmark for the Portfolio. The trustees had asked the Adviser to provide information showing the weighting of the Portfolio in representative SMAs and the overall performance of those SMAs versus their stated benchmarks. The materials provided to the trustees in respect of the Portfolio included its weighting in the AllianceBernstein Municipal Bond Inflation SMA, and the performance of that SMA relative to the BC 1-10 Year TIPS Index. The trustees noted that the Municipal Bond Inflation SMA showed generally favorable performance relative to its benchmark. Based on their review and taking into account the short performance history of the Portfolio, the trustees concluded that the Portfolio’s performance was acceptable.
Advisory Fees
The trustees considered the advisory fee rate paid by the Portfolio to the Adviser (zero) and information provided by Lipper showing the fees paid by other fund families used in wrap fee programs similar to that of the Portfolio. The trustees recognized that it is difficult to make comparisons of advisory fees because there are variations in the services that are included in the fees paid by other funds.
The trustees noted the unusual arrangements in the Advisory Agreement providing for no advisory fee but were cognizant that the Adviser is indirectly compensated by the Sponsors for its services to the Portfolio. The trustees reviewed the
| 46 | • ALLIANCEBERNSTEIN TAX-AWARE REAL RETURN INCOME SHARES |
fee arrangements between the Adviser and each of the current Sponsors and noted that such fees were negotiated on an arm’s length basis and were within the range of fees paid by wrap fee sponsors to other advisers of similar funds. While the Adviser’s fee arrangements with the Sponsors vary, the trustees acknowledged the Adviser’s view that a portion of such fees (less the expenses of the Portfolio paid by the Adviser) may reasonably be viewed as compensating the Adviser for advisory services it provides to the Portfolio (the “implied fee”) and that the Adviser believes that while the Sponsors pay the Adviser different fee rates, the rate of fee attributable to portfolio management at the Portfolio level is the same for all Sponsors. The trustees also considered the fee rate schedules used by other registered investment companies that invest in fixed income securities that are advised by the Adviser. Based on their review, the trustees concluded that the advisory arrangements for the Portfolio, including the zero fee aspect of the Advisory Agreement with the Adviser, were satisfactory.
The Adviser informed the trustees that there were no institutional products managed by it that have a substantially similar investment style. The trustees reviewed the relevant advisory fee information from the Adviser’s Form ADV and the evaluation from the Fund’s Senior Officer. The trustees recognized that such information was of limited utility in light of the Portfolio’s unusual fee arrangement. The Adviser reviewed with the trustees the significantly greater scope of the services it provides the Portfolio relative to institutional clients. The Adviser noted that because mutual funds are constantly issuing and redeeming shares, they are more difficult to manage than an institutional account, where the assets tend to be relatively stable. In light of the substantial differences in services rendered by the Adviser to institutional clients as compared to funds such as the Portfolio, and the unusual fee structure for the other portfolios of the Fund and the Portfolio, the trustees considered these fee comparisons inapt and did not place significant weight on them in their deliberations.
Since the Portfolio does not bear ordinary expenses, the trustees did not consider comparative expense information.
Economies of Scale
Since the Advisory Agreement does not provide for any compensation to be paid to the Adviser by the Portfolio and the Portfolio’s expense ratio is zero, the trustees did not consider the extent to which fee levels in the Advisory Agreement reflect economies of scale. They did note, however, that the fee payable to the Adviser by each of the current Sponsors declines at a breakpoint based on total assets managed by the Adviser for the Sponsors.
| ALLIANCEBERNSTEIN TAX-AWARE REAL RETURN INCOME SHARES • | 47 |
THE FOLLOWING IS NOT PART OF THE SHAREHOLDER REPORT OR THE FINANCIAL STATEMENTS
SUMMARY OF SENIOR OFFICER’S EVALUATION OF INVESTMENT ADVISORY AGREEMENT1
The following is a summary of the evaluation of the Investment Advisory Agreement between AllianceBernstein L.P. (the “Adviser”) and The AllianceBernstein Corporate Shares (the “Trust”) with respect to AllianceBernstein Tax-Aware Real Return Income Shares (the “Portfolio”).2 The evaluation of the Investment Advisory Agreement was prepared by Philip L. Kirstein, the Senior Officer of the Trust, for the Trustees of the Trust, as required by the September 1, 2004 Assurance of Discontinuance (“AoD”) between the Adviser and the New York State Attorney General (the “NYAG”). The Senior Officer’s evaluation of the Investment Advisory Agreement is not meant to diminish the responsibility or authority of the Board of Trustees to perform its duties pursuant to Section 15 of the Investment Company Act of 1940 Act (the “40 Act”) and applicable state law. The purpose of the summary is to provide shareholders with a synopsis of the independent evaluation of the reasonableness of the advisory fees proposed to be paid by the Portfolio which was provided to the Trustees in connection with their review of the proposed approval of the continuance of the Investment Advisory Agreement.
The Senior Officer’s evaluation considered the following factors:
| 1. | Advisory fees charged to institutional and other clients of the Adviser for like services; |
| 2. | Advisory fees charged by other mutual fund companies for like services; |
| 3. | Costs to the Adviser and its affiliates of supplying services pursuant to the advisory agreement, excluding any intra-corporate profit; |
| 4. | Profit margins of the Adviser and its affiliates from supplying such services; |
| 5. | Possible economies of scale as the Portfolio grows larger; and |
| 6. | Nature and quality of the Adviser’s services including the performance of the Portfolio. |
These factors, with the exception of the first factor, are generally referred to as the “Gartenberg factors,” which were articulated by the United States Court of Appeals for the Second Circuit in 1982. Gartenberg v. Merrill Lynch Asset Management, Inc., 694 F. 2d 923 (2d Cir. 1982). On March 30, 2010, the Supreme Court held the Gartenberg decision was correct in its basic formulation of what §36(b) requires: to face liability under §36(b), “an investment adviser
| 1 | The Senior Officer’s fee evaluation was completed on October 25, 2012 and discussed with the Board of Trustees on November 6-8, 2012. |
| 2 | Future references to the Portfolio do not include “AllianceBernstein.” |
| 48 | • ALLIANCEBERNSTEIN TAX-AWARE REAL RETURN INCOME SHARES |
must charge a fee that is so disproportionately large that it bears no reasonable relationship to the services rendered and could not have been the product of arm’s length bargaining” Jones v. Harris Associates L.P., 130 S. Ct. 1418 (2010). In Jones, the Court stated the Gartenberg approach fully incorporates the correct understanding of fiduciary duty within the context of section 36(b) and noted with approval that “Gartenberg insists that all relevant circumstances be taken into account” and “uses the range of fees that might result from arm’s-length bargaining as the benchmark for reviewing challenged fees.”3
PORTFOLIO’S EXEMPTION FROM ADVISORY FEES OR EXPENSES
The Portfolio pays no advisory fee to the Adviser for receiving the services to be provided pursuant to the Investment Advisory Agreement. The Portfolio is designed to serve the needs of the Adviser’s separately managed account (“SMA”) clients.4 Since SMA clients pay their wrap program provider a unitary fee for managing all investments of their portfolio, the Portfolio will not pay an advisory fee. The Adviser will also reimburse the Portfolio for all of its other operating expenses, except certain extraordinary expenses, taxes, brokerage costs and the interest on borrowed money.
The Portfolio’s net assets on September 30, 2012 are set forth below:
| Portfolio | 9/30/12 Net Assets ($MM) | |
| Tax-Aware Real Return Income Shares | $6.7 |
The Portfolio, which offers only one no-load class of shares, is distributed through its principal underwriter, AllianceBernstein Investments, Inc. (“ABI”). Since the Portfolio is reimbursed by the Adviser for its operating expenses, the Portfolio does not have a distribution plan pursuant to Rule 12b-1 under the 40 Act.
| I. | ADVISORY FEES CHARGED TO INSTITUTIONAL AND OTHER CLIENTS |
The advisory fees charged to investment companies which the Adviser manages and sponsors are normally higher than those charged to similar sized institutional accounts, including pension plans and sub-advised investment companies. The fee differential reflects, among other things, different services provided to such clients, and different liabilities assumed. Services provided by the Adviser to the Portfolio that are not provided to non-investment company clients include providing office space and personnel to serve as Fund Officers, who among other responsibilities make the certifications required under the Sarbanes–Oxley Act of
| 3 | Jones v. Harris at 1427. |
| 4 | The SMA clients currently employ the Adviser as one of several investment managers, and compensate the Adviser on the basis of all SMA assets managed, which would include assets of Tax-Aware Real Return Income Shares. |
| ALLIANCEBERNSTEIN TAX-AWARE REAL RETURN INCOME SHARES • | 49 |
2002, and coordinating with and monitoring the Portfolio’s third party service providers such as Fund counsel, auditors, custodians, transfer agents and pricing services. The accounting, administrative, legal and compliance requirements for the Portfolio are more costly than those for institutional client assets due to the greater complexities and time required for investment companies. The Adviser also believes that it incurs substantial entrepreneurial risk when offering a new mutual fund since establishing a new mutual fund requires a large upfront investment and it may take a long time for the fund to achieve profitability since the fund must be priced to scale from inception in order to be competitive and assets are acquired one account at a time. In addition, managing the cash flow of an investment company may be more difficult than that of a stable pool of assets, such as an institutional account with little cash movement in either direction, particularly if the Portfolio is in net redemption and the Adviser is frequently forced to sell securities to raise cash for redemptions. However, managing a fund with positive cash flow may be easier at times than managing a stable pool of assets. Finally, in recent years, investment advisers have been sued by institutional clients and have suffered reputational damage both by the attendant publicity and outcomes other than complete victories. Accordingly, the legal and reputational risks associated with institutional accounts are greater than previously thought, although arguably still not equal to those related to the mutual fund industry.
Notwithstanding the Adviser’s view that managing an investment company is not comparable to managing other institutional accounts because the services provided are different, the Supreme Court has indicated consideration should be given to the advisory fees charged to institutional accounts with a similar investment style as the Portfolio.5 However, with respect to the Portfolio, the Adviser represented that there is no institutional product in the Adviser’s Form ADV that has a similar investment style as the Portfolio.
| 5 | The Supreme Court stated that “courts may give such comparisons the weight that they merit in light of the similarities and differences between the services that the clients in question require, but the courts must be wary of inapt comparisons.” Among the significant .differences the Supreme Court noted that may exist between services provided to mutual funds and institutional accounts are “higher marketing costs.” Jones v. Harris at 1428. |
| 50 | • ALLIANCEBERNSTEIN TAX-AWARE REAL RETURN INCOME SHARES |
The Adviser manages AllianceBernstein Municipal Bond Inflation Strategy, a retail mutual fund that has a similar investment style as the Portfolio.6 Set forth in the table below is the advisory fee schedule of the retail mutual fund and what would have been the effective advisory fee of the Portfolio had the advisory fee schedule of the retail mutual fund been applicable to the Portfolio based on September 30, 2012 net assets:
| Portfolio | AllianceBernstein Mutual Funds (“ABMF”) | Fee Schedule | ABMF Effective | |||||
| Tax-Aware Real Return Income Shares | Municipal Bond Inflation Strategy | 0.50 bp on first $2.5 billion 0.45 bp on next $2.5 billion 0.40 bp on the balance | 0.500% | |||||
The Adviser represented that it does provide sub-advisory services to other companies that have a substantially similar investment style as the Portfolio.
| II. | MANAGEMENT FEES CHARGED BY OTHER MUTUAL FUND COMPANIES FOR LIKE SERVICES. |
Lipper, Inc., an analytical service that is not affiliated with the Adviser, compared the fees charged to the Portfolio to the fees charged to other investment companies for similar services by other investment advisers.7,8 Each peer selected by Lipper had a similar fee arrangement as the Portfolio, which is to say that with respect to the Portfolio’s peers, all of their fund expenses, including management fees,9 were reimbursed by their respective investment advisers.
As previously noted, the Portfolio does not pay an advisory fee to the Adviser since its SMA clients pay their wrap program provider a unitary fee for managing
| 6 | The advisory fee schedule of Municipal Bond Inflation Strategy is consistent with the NYAG related High Income category advisory fee schedule. The NYAG related master fee schedule, implemented in January 2004, contemplates eight categories with almost all of the AllianceBernstein funds in each category having the same advisory fee schedule. |
| 7 | The Supreme Court cautioned against accepting mutual fund fee comparisons without careful scrutiny since “these comparisons are problematic because these fees, like those challenged, may not be the product of negotiations conducted at arm’s length.” Jones v. Harris at 1429. |
| 8 | Only zero fee no-load funds that participated in a wrap fee program were considered for inclusion in the Portfolio’s EG, regardless of the Lipper investment classification/objective of the Funds’ peers. The Portfolio’s EG includes the Portfolio, one other Intermediate Municipal Debt Fund, one General & Insured Municipal Debt Fund, three General Bond Funds, two BBB-rated Corporate Debt Funds, one Multi-Sector Income Fund, one Short-Intermediate Investment Grade Debt Fund, two U.S. Mortgage Funds, one Inflation-Protected Bond Fund, two Global Income Funds and one Intermediate Investment-Grade Debt Fund. |
| 9 | “Management Fee” is the fee attributable to the management and bearing of expenses of the funds (not the management of the wrap fee program). In each case, the advisory contract provides for an advisory or management fee of zero. |
| ALLIANCEBERNSTEIN TAX-AWARE REAL RETURN INCOME SHARES • | 51 |
all investments of their portfolios. In addition, the Adviser reimburses the Portfolio for all of its operating expenses, except certain extraordinary expenses, taxes, brokerage costs and interest on borrowed money.
| III. | COSTS TO THE ADVISER AND ITS AFFILIATES OF SUPPLYING SERVICES PURSUANT TO THE ADVISORY FEE ARRANGEMENT, EXCLUDING ANY INTRA-CORPORATE PROFIT. |
The Adviser utilizes two profitability reporting systems, which operate independently but are aligned with each other, to estimate the Adviser’s profitability in connection with investment advisory services provided to the Portfolio. The Senior Officer has retained a consultant to provide independent advice regarding the alignment of the two profitability systems as well as the methodologies and allocations utilized by both profitability systems. See Section IV for additional discussion.
| IV. | PROFIT MARGINS OF THE ADVISER AND ITS AFFILIATES FOR SUPPLYING SUCH SERVICES. |
The profitability information for the Portfolio, prepared by the Adviser for the Board of Trustees, was reviewed by the Senior Officer and the consultant. The Portfolio does not pay an advisory fee to the Adviser. However, the Adviser does profit indirectly through the advisory fees that it receives from SMA clients that invest in the Portfolio. The Adviser’s profitability with respect to the Portfolio, which was negative in 2011, was calculated using a weighted average of the profitability of the SMA clients, in addition to any fund specific revenue or expense items.
AllianceBernstein Investments, Inc. (“ABI”) and AllianceBernstein Investor Services, Inc. (“ABIS”), affiliates of the Adviser, serve as the Portfolio’s underwriter and transfer agent, respectively. The courts have referred to this type of business relationships as “fall-out benefits” to the Adviser and indicated that such benefits should be factored into the evaluation of the total relationship between the Portfolio and the Adviser. Neither case law nor common business practice precludes the Adviser’s affiliates from earning a reasonable profit on this type of relationship provided the affiliates’ charges and services are competitive. However, neither ABI nor ABIS receive a fee for serving as the Portfolio’s underwriter and transfer agent.
| V. | POSSIBLE ECONOMIES OF SCALE |
The Adviser has indicated that economies of scale are being shared with shareholders through pricing to scale, breakpoints, fee reductions/waivers and enhancement to services.
An independent consultant, retained by the Senior Officer, provided the Board of Trustees information on the Adviser’s firm-wide average costs from 2005 through 2011 and the potential economies of scale. The independent consultant noted that from 2005 through 2007 the Adviser experienced significant growth
| 52 | • ALLIANCEBERNSTEIN TAX-AWARE REAL RETURN INCOME SHARES |
in assets under management (“AUM”). During this period, operating expenses increased, in part to keep up with growth, and in part reflecting market returns. However, from 2008 through the first quarter of 2009, AUM rapidly and significantly decreased due to declines in market value and client withdrawals. When AUM rapidly decreased, some operating expenses categories, including base compensation and office space, adjusted more slowly during this period, resulting in an increase in average costs. Since 2009, AUM has experienced less significant changes. The independent consultant noted that changes in operating expenses reflect changes in business composition and business practices in response to changes in financial markets. Finally, the independent consultant concluded that the increase in average cost and the decline in net operating margin across the Adviser since late 2008 are inconsistent with the view that there are currently reductions in average costs due to economies of scale that can be shared with the AllianceBernstein Mutual Funds managed by the Adviser through lower fees.
In February 2008, the independent consultant provided the Board of Trustees an update of the Deli10 study on advisory fees and various fund characteristics.11 The independent consultant first reiterated the results of his previous two dimensional comparison analysis (fund size and family size) with the Board of Trustees.12 The independent consultant then discussed the results of the regression model that was utilized to study the effects of various factors on advisory fees. The regression model output indicated that the bulk of the variation in fees predicted were explained by various factors, but substantially by fund AUM, family AUM, index fund indicator and investment style. The independent consultant also compared the advisory fees of the AllianceBernstein Mutual Funds to similar funds managed by 19 other large asset managers, regardless of the fund size and each Adviser’s proportion of mutual fund assets to non-mutual fund assets.
| 10 | The Deli study, originally published in 2002 based on 1997 data and updated for the February 2008 Presentation, may be of diminished value due to the age of the data used in the presentation and the changes experienced in the industry over the last four years. |
| 11 | As mentioned previously, the Supreme Court cautioned against accepting mutual fund fee comparisons without careful scrutiny since the fees may not be the product of negotiations conducted at arm’s length. See Jones V. Harris at 1429. |
| 12 | The two dimensional analysis showed patterns of lower advisory fees for funds with larger asset sizes and funds from larger family sizes compared to funds with smaller asset sizes and funds from smaller family sizes, which according to the independent consultant is indicative of a sharing of economies of scale and scope. However, in less liquid and active markets, such is not the case, as the empirical analysis showed potential for diseconomies of scale in those markets. The empirical analysis also showed diminishing economies of scale and scope as funds surpassed a certain high level of assets. |
| ALLIANCEBERNSTEIN TAX-AWARE REAL RETURN INCOME SHARES • | 53 |
| VI. | NATURE AND QUALITY OF THE ADVISER’S SERVICES INCLUDING THE PERFORMANCE OF THE PORTFOLIO. |
With assets under management of approximately $419 billion as of September 30, 2012, the Adviser has the investment experience to manage and provide non-investment services (described in Section I) to the Portfolio.
The information below, prepared by Lipper, shows the 1 year gross performance return and ranking of the Portfolio relative to its Lipper Performance Universe (“PU”)13 for the period ended July 31, 2012:
Portfolio Return | PU Median (%) | PU Rank | ||||||||
Tax-Aware Real Return Income Shares | ||||||||||
1 Year | 4.95 | 9.12 | 31/32 | |||||||
Set forth below are the 1 year and since inception net performance returns of the Portfolio (in bold)14 versus its benchmark.15 Portfolio and benchmark volatility and reward-to-variability ratio (“Sharpe Ratio”) information is also shown.16
Periods Ending July 31, 2012 Annualized Net Performance (%) | ||||||||||||||||||||
| 1 Year (%) | Since (%) | Volatility (%) | Sharpe (%) | Risk Period (Year) | ||||||||||||||||
| Tax-Aware Real Return Income Shares | 4.95 | 4.68 | 4.37 | 1.11 | 1 | |||||||||||||||
| Barclays Capital 1-10Yr TIPS Index | 4.84 | 6.52 | 3.24 | 2.23 | 1 | |||||||||||||||
| Inception Date: May 2, 2011 | ||||||||||||||||||||
| 13 | The Portfolio’s PU includes peers with the same Lipper investment classification/objective and load type as the Portfolio. |
| 14 | The performance returns of the Portfolio were provided Lipper. Lipper maintains its own database that includes the Portfolio’s performance returns. |
| 15 | The Adviser provided Portfolio and benchmark performance return information for the periods through July 31, 2012. |
| 16 | Portfolio and benchmark volatility and Sharpe Ratio information was obtained through Lipper LANA, a database maintained by Lipper. Volatility is a statistical measure of the tendency of a market price or yield to vary over time. A Sharpe Ratio is a risk adjusted measure of return that divides a fund’s return in excess of the riskless return by the fund’s standard deviation. A portfolio with a greater volatility would be viewed as more risky than a portfolio with equivalent performance but lower volatility; for that reason, a greater return would be demanded for the more risky fund. A portfolio with a higher Sharpe Ratio would be viewed as better performing than a fund with a lower Sharpe Ratio. |
| 54 | • ALLIANCEBERNSTEIN TAX-AWARE REAL RETURN INCOME SHARES |
CONCLUSION:
Based on the factors discussed above the Senior Officer’s conclusion is that the Investment Advisory Agreement for the Portfolio is reasonable and within the range of what would have been negotiated at arm’s-length in light of all the surrounding circumstances. This conclusion with respect to the Portfolio is based on an evaluation of all of these factors and no single factor was dispositive.
Dated: December 3, 2012
| ALLIANCEBERNSTEIN TAX-AWARE REAL RETURN INCOME SHARES • | 55 |
THIS PAGE IS NOT PART OF THE SHAREHOLDER REPORT OR THE FINANCIAL STATEMENTS
ALLIANCEBERNSTEIN FAMILY OF FUNDS
Wealth Strategies
Balanced Wealth Strategy
Conservative Wealth Strategy
Wealth Appreciation Strategy
Tax-Managed Balanced Wealth Strategy
Tax-Managed Conservative Wealth Strategy
Tax-Managed Wealth Appreciation Strategy
Asset Allocation/Multi-Asset Funds
Emerging Markets Multi-Asset Portfolio
International Portfolio
Tax-Managed International Portfolio
Growth Funds
Domestic
Discovery Growth Fund**
Growth Fund
Large Cap Growth Fund
Select US Equity Portfolio
Small Cap Growth Portfolio
Global & International
Global Thematic Growth Fund
International Discovery Equity Portfolio
International Growth Fund
Value Funds
Domestic
Core Opportunities Fund
Discovery Value Fund**
Equity Income Fund
Growth & Income Fund
Value Fund
Global & International
Emerging Markets Equity Portfolio
Global Value Fund
International Value Fund
Taxable Bond Funds
Bond Inflation Strategy
Global Bond Fund
High Income Fund
Intermediate Bond Portfolio
Limited Duration High Income Portfolio
Short Duration Portfolio
Municipal Bond Funds
Arizona Portfolio California Portfolio High Income Portfolio Massachusetts Portfolio Michigan Portfolio Minnesota Portfolio Municipal Bond Inflation Strategy | National Portfolio New Jersey Portfolio New York Portfolio Ohio Portfolio Pennsylvania Portfolio Virginia Portfolio |
Intermediate Municipal Bond Funds
Intermediate California Portfolio
Intermediate Diversified Portfolio
Intermediate New York Portfolio
Closed-End Funds
Alliance California Municipal Income Fund
Alliance New York Municipal Income Fund
AllianceBernstein Global High Income Fund
AllianceBernstein Income Fund
AllianceBernstein National Municipal Income Fund
Alternatives
Dynamic All Market Fund
Global Real Estate Investment Fund
Global Risk Allocation Fund**
Market Neutral Strategy-Global
Market Neutral Strategy-U.S.
Real Asset Strategy
Select US Long/Short Portfolio
Unconstrained Bond Fund
Retirement Strategies
2000 Retirement Strategy | 2020 Retirement Strategy | 2040 Retirement Strategy | ||
2005 Retirement Strategy | 2025 Retirement Strategy | 2045 Retirement Strategy | ||
2010 Retirement Strategy | 2030 Retirement Strategy | 2050 Retirement Strategy | ||
2015 Retirement Strategy | 2035 Retirement Strategy | 2055 Retirement Strategy |
We also offer Exchange Reserves,* which serves as the money market fund exchange vehicle for the AllianceBernstein mutual funds.
Investors should consider the investment objectives, risks, charges and expenses of the Fund carefully before investing. For copies of our prospectus or summary prospectus, which contain this and other information, visit us online at www.alliancebernstein.com or contact your AllianceBernstein investments representative. Please read the prospectus and/or summary prospectus carefully before investing.
| * | An investment in Exchange Reserves is not a deposit in a bank and is not insured or guaranteed by the Federal Deposit Insurance Corporation or any other government agency. Although the Fund seeks to preserve the value of your investment at $1.00 per share, it is possible to lose money by investing in the Fund. |
| ** | Prior to October 8, 2012, Global Risk Allocation Fund was named Balanced Shares. Prior to November 1, 2012, Discovery Growth Fund was named Small/Mid Cap Growth Fund and Discovery Value Fund was named Small/Mid Cap Value Fund. |
| 56 | • ALLIANCEBERNSTEIN TAX-AWARE REAL RETURN INCOME SHARES |
AllianceBernstein Family of Funds
NOTES
| ALLIANCEBERNSTEIN TAX-AWARE REAL RETURN INCOME SHARES • | 57 |
NOTES
| 58 | • ALLIANCEBERNSTEIN TAX-AWARE REAL RETURN INCOME SHARES |
NOTES
| ALLIANCEBERNSTEIN TAX-AWARE REAL RETURN INCOME SHARES • | 59 |
NOTES
| 60 | • ALLIANCEBERNSTEIN TAX-AWARE REAL RETURN INCOME SHARES |
ALLIANCEBERNSTEIN TAX-AWARE REAL RETURN INCOME SHARES
1345 Avenue of the Americas
New York, NY 10105
800.221.5672
| TARRIS-0151-0413 |  | |
ITEM 2. CODE OF ETHICS.
(a) The registrant has adopted a code of ethics that applies to its principal executive officer, principal financial officer and principal accounting officer. A copy of the registrant’s code of ethics is filed herewith as Exhibit 12(a)(1).
(b) During the period covered by this report, no material amendments were made to the provisions of the code of ethics adopted
in 2(a) above.
(c) During the period covered by this report, no implicit or explicit waivers to the provisions of the code of ethics adopted in
2(a) above were granted.
ITEM 3. AUDIT COMMITTEE FINANCIAL EXPERT.
The registrant’s Board of Directors has determined that independent directors William H. Foulk, Jr. and Garry L. Moody qualify as audit committee financial experts.
ITEM 4. PRINCIPAL ACCOUNTANT FEES AND SERVICES.
(a) - (c) The following table sets forth the aggregate fees billed* by the independent registered public accounting firm Ernst & Young LLP, for the Fund’s last two fiscal years, for professional services rendered for: (i) the audit of the Fund’s annual financial statements included in the Fund’s annual report to stockholders; (ii) assurance and related services that are reasonably related to the performance of the audit of the Fund’s financial statements and are not reported under (i), which include advice and education related to accounting and auditing issues, quarterly press release review (for those Funds that issue quarterly press releases), and preferred stock maintenance testing (for those Funds that issue preferred stock); and (iii) tax compliance, tax advice and tax return preparation.
| Audit Fees | Audit - Related Fees | Tax Fees | ||||||||||||||
AB Corp Income Shares | 2012 | $ | 32,500 | $ | 326 | $ | 11,475 | |||||||||
| 2013 | $ | 32,500 | $ | — | $ | 12,799 | ||||||||||
AB Taxable Multi-Sector Income Shares | 2012 | $ | 32,500 | $ | 326 | $ | 12,077 | |||||||||
| 2013 | $ | 32,500 | $ | — | $ | 13,763 | ||||||||||
AB Municipal Income Shares | 2012 | $ | 31,290 | $ | 326 | $ | 11,699 | |||||||||
| 2013 | $ | 31,290 | $ | — | $ | 14,609 | ||||||||||
Tax-Aware Real Return Shares | 2012 | $ | 23,470 | $ | 326 | $ | 10,732 | |||||||||
| 2013 | $ | 31,290 | $ | — | $ | 15,285 | ||||||||||
The Fund’s Adviser absorbs all ordinary Fund expenses, including the Fund’s audit fees, audit-related fees and tax fees.
(d) Not applicable.
(e) (1) Beginning with audit and non-audit service contracts entered into on or after May 6, 2003, the Fund’s Audit Committee policies and procedures require the pre-approval of all audit and non-audit services provided to the Fund by the Fund’s independent registered public accounting firm. The Fund’s Audit Committee policies and procedures also require pre-approval of all audit and non-audit services provided to the Adviser and Service Affiliates to the extent that these services are directly related to the operations or financial reporting of the Fund.
(e) (2) All of the amounts for Audit Fees, Audit-Related Fees and Tax Fees in the table under Item 4 (a) – (c) are for services pre-approved by the Fund’s Audit Committee.
(f) Not applicable.
(g) The following table sets forth the aggregate non-audit services provided to the Fund, the Fund’s Adviser and entities that control, are controlled by or under common control with the Adviser that provide ongoing services to the Fund (“Service Affiliates”):
| All Fees for Non-Audit Services Provided to the Portfolio, the Adviser and Service Affiliates | Pre-approved by the Audit Committee (Portion Comprised of Audit Related Fees) (Portion Comprised of Tax Fees) | |||||||||||
AB Corp Income Shares | 2012 | $ | 460,767 | * | $ | 11,801 | ||||||
| $ | (326 | ) | ||||||||||
| $ | (11,475 | ) | ||||||||||
| 2013 | $ | 437,671 | $ | 12,799 | ||||||||
| $ | — | |||||||||||
| $ | (12,799 | ) | ||||||||||
AB Taxable Multi-Sector Income Shares | 2012 | $ | 461,369 | * | $ | 12,403 | ||||||
| $ | (326 | ) | ||||||||||
| $ | (12,077 | ) | ||||||||||
| 2013 | $ | 438,634 | $ | 13,763 | ||||||||
| $ | — | |||||||||||
| $ | (13,763 | ) | ||||||||||
AB Municipal Income Shares | 2012 | $ | 460,991 | * | $ | 12,025 | ||||||
| $ | (326 | ) | ||||||||||
| $ | (11,699 | ) | ||||||||||
| 2013 | $ | 439,080 | $ | 14,609 | ||||||||
| $ | — | |||||||||||
| $ | (14,609 | ) | ||||||||||
AB Tax-Aware Real Return Shares | 2012 | $ | 460,024 | * | $ | 11,058 | ||||||
| $ | (326 | ) | ||||||||||
| $ | (10,732 | ) | ||||||||||
| 2013 | $ | 440,156 | $ | 15,285 | ||||||||
| $ | — | |||||||||||
| $ | (15,285 | ) | ||||||||||
* Revised (compared to the Fund’s N-CSR filing for its 2012 fiscal year end) to exclude fees paid by the Adviser on behalf of its offshore fund family
(h) The Audit Committee of the Fund has considered whether the provision of any non-audit services not pre-approved by the Audit Committee provided by the Fund’s independent registered public accounting firm to the Adviser and Service Affiliates is compatible with maintaining the auditor’s independence.
ITEM 5. AUDIT COMMITTEE OF LISTED REGISTRANTS.
Not applicable to the registrant.
ITEM 6. SCHEDULE OF INVESTMENTS.
Please see Schedule of Investments contained in the Report to Shareholders included under Item 1 of this Form N-CSR.
ITEM 7. DISCLOSURE OF PROXY VOTING POLICIES AND PROCEDURES FOR CLOSED-END MANAGEMENT INVESTMENT COMPANIES.
Not applicable to the registrant.
ITEM 8. PORTFOLIO MANAGERS OF CLOSED-END MANAGEMENT INVESTMENT COMPANIES.
Not applicable to the registrant.
ITEM 9. PURCHASES OF EQUITY SECURITIES BY CLOSED-END MANAGEMENT INVESTMENT COMPANY AND AFFILIATED PURCHASERS.
Not applicable to the registrant.
ITEM 10. SUBMISSION OF MATTERS TO A VOTE OF SECURITY HOLDERS.
There have been no material changes to the procedures by which shareholders may recommend nominees to the Fund’s Board of Directors since the Fund last provided disclosure in response to this item.
ITEM 11. CONTROLS AND PROCEDURES.
(a) The registrant’s principal executive officer and principal financial officer have concluded that the registrant’s disclosure controls and procedures (as defined in Rule 30a-3 (c) under the Investment Company Act of 1940, as amended) are effective at the reasonable assurance level based on their evaluation of these controls and procedures as of a date within 90 days of the filing date of this document.
(b) There were no significant changes in the registrant’s internal controls over financial reporting during the second fiscal quarter of the period that could significantly affect these controls subsequent to the date of their evaluation, including any corrective actions with regard to significant deficiencies and material weaknesses.
ITEM 12. EXHIBITS.
The following exhibits are attached to this Form N-CSR:
EXHIBIT NO. | DESCRIPTION OF EXHIBIT | |
12 (a) (1) | Code of Ethics that is subject to the disclosure of Item 2 hereof | |
12 (b) (1) | Certification of Principal Executive Officer Pursuant to Section 302 of the Sarbanes-Oxley Act of 2002 | |
12 (b) (2) | Certification of Principal Financial Officer Pursuant to Section 302 of the Sarbanes-Oxley Act of 2002 | |
12 (c) | Certification of Principal Executive Officer and Principal Financial Officer Pursuant to Section 906 of the Sarbanes-Oxley Act of 2002 | |
SIGNATURES
Pursuant to the requirements of the Securities Exchange Act of 1934 and the Investment Company Act of 1940, the registrant has duly caused this report to be signed on its behalf by the undersigned, thereunto duly authorized.
(Registrant): AllianceBernstein Corporate Shares
| By: | /s/ Robert M. Keith | |
| Robert M. Keith | ||
| President | ||
| Date: | June 21, 2013 | |
Pursuant to the requirements of the Securities Exchange Act of 1934 and the Investment Company Act of 1940, this report has been signed below by the following persons on behalf of the registrant and in the capacities and on the dates indicated.
| By: | /s/ Robert M. Keith | |
| Robert M. Keith | ||
| President | ||
| Date: | June 21, 2013 | |
| By: | /s/ Joseph J. Mantineo | |
| Joseph J. Mantineo | ||
| Treasurer and Chief Financial Officer | ||
| Date: | June 21, 2013 | |