UNITED STATES
SECURITIES AND EXCHANGE COMMISSION
WASHINGTON, D.C. 20549
FORM N-CSR
CERTIFIED SHAREHOLDER REPORT OF REGISTERED
MANAGEMENT INVESTMENT COMPANIES
Investment Company Act file number: 811-21497
ALLIANCEBERNSTEIN CORPORATE SHARES
(Exact name of registrant as specified in charter)
1345 Avenue of the Americas, New York, New York 10105
(Address of principal executive offices) (Zip code)
Joseph J. Mantineo
AllianceBernstein L.P.
1345 Avenue of the Americas
New York, New York 10105
(Name and address of agent for service)
Registrant’s telephone number, including area code: (800) 221-5672
Date of fiscal year end: April 30, 2011
Date of reporting period: April 30, 2011
| ITEM 1. | REPORTS TO STOCKHOLDERS. |
ANNUAL REPORT
AllianceBernstein
Corporate Income Shares

April 30, 2011
Annual Report
Investment Products Offered
| • | Are Not FDIC Insured |
| • | May Lose Value |
| • | Are Not Bank Guaranteed |
The investment return and principal value of an investment in the Fund will fluctuate as the prices of the individual securities in which it invests fluctuate, so that your shares, when redeemed, may be worth more or less than their original cost. You should consider the investment objectives, risks, charges and expenses of the Fund carefully before investing. For a free copy of the Fund’s prospectus, which contains this and other information, visit our website at www.alliancebernstein.com or call your financial advisor or AllianceBernstein® at (800) 227-4618. Please read the prospectus carefully before you invest.
You may obtain performance information current to the most recent month-end by visiting www.alliancebernstein.com.
This shareholder report must be preceded or accompanied by the Fund’s prospectus for individuals who are not current shareholders of the Fund.
You may obtain a description of the Fund’s proxy voting policies and procedures, and information regarding how the Fund voted proxies relating to portfolio securities during the most recent 12-month period ended June 30, without charge. Simply visit AllianceBernstein’s website at www.alliancebernstein.com, or go to the Securities and Exchange Commission’s (the “Commission”) website at www.sec.gov, or call AllianceBernstein at (800) 227-4618.
The Fund files its complete schedule of portfolio holdings with the Commission for the first and third quarters of each fiscal year on Form N-Q. The Fund’s Forms N-Q are available on the Commission’s website at www.sec.gov. The Fund’s Forms N-Q may also be reviewed and copied at the Commission’s Public Reference Room in Washington, DC; information on the operation of the Public Reference Room may be obtained by calling (800) SEC-0330. AllianceBernstein publishes full portfolio holdings for the Fund monthly at www.alliancebernstein.com.
AllianceBernstein Investments, Inc. (ABI) is the distributor of the AllianceBernstein family of mutual funds. ABI is a member of FINRA and is an affiliate of AllianceBernstein L.P., the manager of the funds.
AllianceBernstein® and the AB Logo are registered trademarks and service marks used by permission of the owner, AllianceBernstein L.P.
June 21, 2011
Annual Report
This report provides management’s discussion of fund performance for AllianceBernstein Corporate Income Shares (the “Fund”) for the annual reporting period ended April 30, 2011. Please note, shares of this Fund are offered exclusively through registered investment advisers approved by AllianceBernstein L.P. (the “Adviser”).
Investment Objective and Policies
The Fund’s investment objective is high current income.
The Fund invests, under normal circumstances, at least 80% of its net assets in U.S. corporate bonds. The Fund may also invest in U.S. Government securities (other than U.S. Government securities that are mortgage-backed or asset-backed securities), repurchase agreements, forward contracts relating to U.S. Government securities and U.S. dollar-denominated fixed-income securities issued by non-U.S. companies. The Fund normally invests all of its assets in securities that are rated, at the time of purchase, at least BBB- or the equivalent. The Fund will not invest in unrated corporate debt securities. The Fund has the flexibility to invest in long- and short-term fixed-income securities. In making decisions about whether to buy or sell securities, the Fund will consider, among other things, the strength of certain sectors of the fixed-income market relative to others, interest rates and other general market conditions and the credit quality of individual issuers. The Fund also may invest in convertible debt securities; invest up to 10% of its assets in
inflation-protected securities; invest up to 5% of its net assets in preferred stock; purchase and sell interest rate futures contracts and options; enter into swap transactions; invest in zero coupon securities and payment-in-kind debentures; and make secured loans of portfolio securities.
Investment Results
The table on page 4 shows the Fund’s performance compared to its benchmark, the Barclays Capital U.S. Credit Bond Index, for the six- and 12-month periods ended April 30, 2011.
The Corporate Income Shares Fund outperformed its benchmark for both the six- and 12-month periods. The Fund’s overweight to higher-beta securities—issues whose spreads tend to narrow or widen by more than the index average when the market moves—and overweight to financial sectors contributed positively to relative performance for both periods. The Fund’s modest exposure to high yield corporates was also a positive contributor for both periods. An underweight to sovereign/supranationals was positive for the six-month period, while a modest position in U.S. Treasuries detracted for both periods.
The Fund held no derivative positions during the reporting periods.
Market Review and Investment Strategy
The global economic recovery continued during the annual period, driven by strong gains in emerging-market
| ALLIANCEBERNSTEIN CORPORATE INCOME SHARES • | 1 |
economies. Import growth in emerging-market economies boomed, acting as an important catalyst in the recovery of industrialized economies. Despite a number of shocks late in the period—which included rising social unrest in North Africa and the Middle East, a major earthquake and nuclear crisis in Japan, as well as a spike in oil and commodity prices—the global economic expansion remained intact, and risk assets performed well. Positive economic momentum meant that government bond yields declined during the reporting period, stocks rallied and the credit markets followed.
Within the corporate market, lower-rated debt outperformed as investors were willing to take on added risk. Intermediate corporates outperformed longer maturity corporates. Return dispersion among industries decreased as credit markets continued to recover. All major industries posted solid positive returns, with financial-related and transportation industries outperforming. Financial related corporates were helped by strong performance in real estate investment trusts, insurance, brokerage and banking. Underperforming industries were centered in capital goods, as well as consumer cyclical and noncyclicals. Corporate spreads ground tighter by 5 basis points to end at 138 basis points over duration-neutral Treasuries, as measured by the benchmark. Yields on corporate securities declined.
The Corporate Income Shares Investment Team (the “Team”) continues to view investment-grade corporate debt—particularly in the United States—as attractive on a risk-adjusted basis. Yield spreads remain above average, especially among financials. Fundamentals in the sector are positive, and business confidence remains high. Furthermore, with near record amounts of cash on hand, U.S. corporations have strong balance sheets. As of April 30, 2011, 491 companies (98%) of the S&P 500 Stock Index (“S&P 500”) have reported that 68% beat estimates, 11% were in-line, and 21% were below estimates in first quarter 2011 earnings. The estimated earnings growth rate for the S&P 500 for the second quarter of 2011 is currently at 14.5%.
The Fund’s investment-grade corporate holdings remain concentrated in higher-beta issues. In recent quarters, the Team has tempered some of its most aggressive overweights in higher-beta, or higher volatility, issues, which include cyclical subsectors such as financials, consumer cyclicals and basic industry, further diversifying its corporate holdings. The Fund also remains overweight in BBB-rated corporates and retains modest positions in junior subordinated capital securities. Furthermore, the Team continues to focus its corporate holdings on five- to 10-year maturities.
| 2 | • ALLIANCEBERNSTEIN CORPORATE INCOME SHARES |
HISTORICAL PERFORMANCE
An Important Note About the Value of Historical Performance
The performance shown on the following pages represents past performance and does not guarantee future results. Current performance may be lower or higher than the performance information shown. You may obtain performance information current to the most recent month-end by calling (800) 227-4618. The investment return and principal value of an investment in the Fund will fluctuate, so that your shares, when redeemed, may be worth more or less than their original cost.
Investors should consider the investment objectives, risks, charges and expenses of the Fund carefully before investing. For copies of our prospectus or summary prospectus, which contain this and other information, visit us online at www.alliancebernstein.com or contact your AllianceBernstein Investments representative. Please read the prospectus and/or summary prospectus carefully before investing.
Benchmark Disclosure
The unmanaged Barclays Capital U.S. Credit Bond Index does not reflect fees and expenses associated with the active management of a fund portfolio. The Barclays Capital U.S. Credit Bond Index represents the performance of the U.S. credit securities within the U.S. fixed income market. An investor cannot invest directly in an index, and its results are not indicative of the performance for any specific investment, including the Fund.
A Word About Risk
Price fluctuation in the Fund’s securities may be caused by changes in the general level of interest rates or changes in bond credit quality ratings. Please note, as interest rates rise, existing bond prices fall and can cause the value of an investment in the Fund to decline. Changes in interest rates have a greater effect on bonds with longer maturities than those with shorter maturities. Similar to direct bond ownership, bond funds have the same interest rate, inflation and credit risks that are associated with the underlying bonds owned by the Fund. This Fund can utilize leverage as an investment strategy. When a fund borrows money or otherwise leverages its portfolio, it may be volatile because leverage tends to exaggerate the effect of any increase or decrease in the value of a Fund’s investments. The Fund may create leverage through the use of derivatives. High yield bonds, otherwise known as “junk bonds,” involve a greater risk of default and price volatility than other bonds. Investing in below-investment grade securities presents special risks, including credit risk. Investments in the Fund are not guaranteed because of fluctuation in the net asset value of the underlying fixed-income related investments. The Fund is subject to liquidity risk because derivatives and securities involving substantial interest rate and credit risk tend to involve greater liquidity risk. While the Fund invests principally in bonds and other fixed-income securities, in order to achieve its investment objective, the Fund may at times use certain types of investment derivatives, such as options, futures, forwards and swaps. These instruments involve risks different from, and in certain cases, greater than, the risks presented by more traditional investments. These risks are fully discussed in the Fund’s prospectus.
(Historical Performance continued on next page)
| ALLIANCEBERNSTEIN CORPORATE INCOME SHARES • | 3 |
Historical Performance
HISTORICAL PERFORMANCE
(continued from previous page)
THE FUND VS. ITS BENCHMARK PERIODS ENDED APRIL 30, 2011 | NAV Returns | |||||||||||
| 6 Months | 12 Months | |||||||||||
AllianceBernstein Corporate Income Shares | 2.07% | 8.28% | ||||||||||
Barclays Capital U.S. Credit Bond Index | 0.56% | 7.03% | ||||||||||
GROWTH OF A $10,000 INVESTMENT IN THE FUND
12/11/06* TO 4/30/11
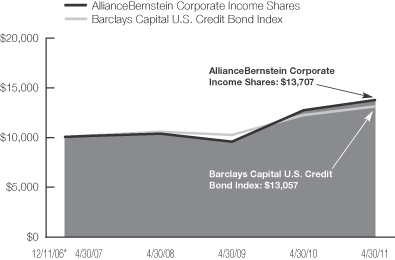
| * | Inception date: 12/11/06 |
This chart illustrates the total value of an assumed $10,000 investment in AllianceBernstein Corporate Income Shares (from 12/11/06 to 4/30/11) as compared to the performance of the Fund’s benchmark.
See Historical Performance and Benchmark disclosures on previous page.
(Historical Performance continued on next page)
| 4 | • ALLIANCEBERNSTEIN CORPORATE INCOME SHARES |
Historical Performance
HISTORICAL PERFORMANCE
(continued from previous page)
| AVERAGE ANNUAL RETURNS AS OF APRIL 30, 2011 | ||||||||
| NAV Returns | ||||||||
1 Year | 8.28 | % | ||||||
Since Inception* | 7.46 | % | ||||||
| SEC AVERAGE ANNUAL RETURNS (WITH ANY APPLICABLE SALES CHARGES) AS OF THE MOST RECENT CALENDAR QUARTER-END (MARCH 31, 2011) | ||||||||
| SEC Returns | ||||||||
1 Year | 8.38 | % | ||||||
Since Inception* | 7.12 | % | ||||||
The prospectus fee table shows the fees and the Total Fund Operating Expenses of the Fund as 0.00% because the Adviser does not charge any fees or expenses and reimburses or pays for Fund operating expenses. Participants in a wrap fee program eligible to invest in the Fund pay fees to the program sponsor and should review the wrap program brochure provided by the sponsor for a discussion of fees and expenses charged.
| * | Inception date: 12/11/06. |
See Historical Performance disclosures on page 3.
| ALLIANCEBERNSTEIN CORPORATE INCOME SHARES • | 5 |
Historical Performance
FUND EXPENSES
(unaudited)
As a shareholder of the Fund, you may incur various ongoing non-operating and extraordinary costs. This example is intended to help you understand your ongoing costs (in dollars) of investing in the Fund and to compare these costs with the ongoing costs of investing in other mutual funds.
The Example is based on an investment of $1,000 invested at the beginning of the period and held for the entire period as indicated below.
Actual Expenses
The table below provides information about actual account values and actual expenses. You may use the information in this line, together with the amount you invested, to estimate the expenses that you paid over the period. Simply divide your account value by $1,000 (for example, an $8,600 account value divided by $1,000 = 8.6), then multiply the result by the number in the first line under the heading entitled “Expenses Paid During Period” to estimate the expenses you paid on your account during this period.
Hypothetical Example for Comparison Purposes
The table below provides information about hypothetical account values and hypothetical expenses based on the Fund’s actual expense ratio and an assumed annual rate of return of 5% before expenses, which is not the Fund’s actual return. The hypothetical account values and expenses may not be used to estimate the actual ending account balance or expenses you paid for the period. You may use this information to compare the ongoing costs of investing in the Fund and other funds by comparing this 5% hypothetical example with the 5% hypothetical examples that appear in the shareholder reports of other funds.
Please note that the expenses shown in the table are meant to highlight your ongoing costs only and do not reflect any transactional costs, such as sales charges (loads), or contingent deferred sales charges on redemptions. Therefore, the hypothetical example is useful in comparing ongoing costs only, and will not help you determine the relative total costs of owning different funds. In addition, if these transactional costs were included, your costs would have been higher.
| Beginning Account Value November 1, 2010 | Ending Account Value April 30, 2011 | Expenses Paid During Period* | ||||||||||||||||||||||
| Actual | Hypothetical | Actual | Hypothetical** | Actual | Hypothetical | |||||||||||||||||||
| Class A | $ | 1,000 | $ | 1,000 | $ | 1,020.65 | $ | 1,024.79 | $ | 0.00 | $ | 0.00 | ||||||||||||
| * | Expenses are equal to the Fund’s annualized expense ratio of 0.00%. The Fund’s operating expenses are borne by the Adviser or its affiliates. |
| ** | Assumes 5% return before expenses. |
| 6 | • ALLIANCEBERNSTEIN CORPORATE INCOME SHARES |
Fund Expenses
PORTFOLIO SUMMARY
April 30, 2011 (unaudited)
PORTFOLIO STATISTICS
Net Assets ($mil): $29.5
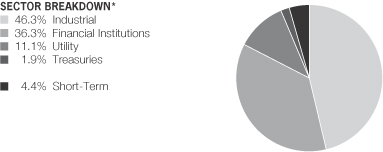
| * | All data are as of April 30, 2011. The Fund’s sector breakdown is expressed as a percentage of total investments and may vary over time. |
Please note: The issuer classifications presented herein are based on the Barclays Capital Fixed Income Indices developed by Barclays Capital. The Fund components are divided either into duration, country, bond ratings or corporate sectors as classified by Barclays Capital. These sector classifications are broadly defined. The “Portfolio of Investments” section of the report reflects more specific industry information and is consistent with the investment restrictions discussed in the Fund’s prospectus.
| ALLIANCEBERNSTEIN CORPORATE INCOME SHARES • | 7 |
Portfolio Summary
PORTFOLIO OF INVESTMENTS
April 30, 2011
| Principal Amount (000) | U.S. $ Value | |||||||
CORPORATES - INVESTMENT | ||||||||
Industrial – 43.1% | ||||||||
Basic – 5.4% | ||||||||
Alcoa, Inc. | $ | 130 | $ | 137,756 | ||||
AngloGold Ashanti Holdings PLC | 90 | 92,559 | ||||||
ArcelorMittal | 145 | 156,883 | ||||||
Commercial Metals Co. | 80 | 87,230 | ||||||
Dow Chemical Co. (The) | 195 | 237,874 | ||||||
International Paper Co. | 150 | 182,340 | ||||||
Lubrizol Corp. | 95 | 123,812 | ||||||
Mosaic Co. (The) | 80 | 86,200 | ||||||
Packaging Corp. of America | 95 | 102,045 | ||||||
PPG Industries, Inc. | 45 | 52,981 | ||||||
Teck Resources Ltd. | 130 | 142,741 | ||||||
Vale Overseas Ltd. | 100 | 112,775 | ||||||
6.875%, 11/21/36 | 80 | 85,918 | ||||||
| 1,601,114 | ||||||||
Capital Goods – 3.8% | ||||||||
Caterpillar, Inc. | 280 | 332,216 | ||||||
CRH America, Inc. | 130 | 138,793 | ||||||
General Electric Co. | 230 | 254,659 | ||||||
Ingersoll-Rand Global Holding Co., Ltd. | 85 | 102,351 | ||||||
Owens Corning | 100 | 119,252 | ||||||
Republic Services, Inc. | 145 | 157,670 | ||||||
| 1,104,941 | ||||||||
Communications - Media – 6.8% | ||||||||
CBS Corp. | 4 | 4,211 | ||||||
7.875%, 7/30/30 | 85 | 100,964 | ||||||
| 8 | • ALLIANCEBERNSTEIN CORPORATE INCOME SHARES |
Portfolio of Investments
| Principal Amount (000) | U.S. $ Value | |||||||
Comcast Cable Communications Holdings, Inc. | $ | 110 | $ | 152,820 | ||||
Comcast Corp. | 55 | 58,371 | ||||||
COX Communications, Inc. | 135 | 150,995 | ||||||
DirecTV Holdings LLC / DirecTV Financing Co., Inc. | 155 | 168,093 | ||||||
Grupo Televisa SA | 100 | 110,111 | ||||||
News America, Inc. | 165 | 217,696 | ||||||
Omnicom Group, Inc. | 115 | 129,668 | ||||||
Reed Elsevier Capital, Inc. | 75 | 95,723 | ||||||
RR Donnelley & Sons Co. | 160 | 167,066 | ||||||
TCI Communications, Inc. | 150 | 188,335 | ||||||
Time Warner Entertainment Co. LP | 50 | 55,198 | ||||||
10.15%, 5/01/12 | 270 | 294,394 | ||||||
WPP Finance UK | 100 | 117,652 | ||||||
| 2,011,297 | ||||||||
Communications - Telecommunications – 7.0% |
| |||||||
American Tower Corp. | 100 | 113,250 | ||||||
Ameritech Capital Funding Corp. | 280 | 297,726 | ||||||
Bellsouth Capital Funding Corp. | 395 | 421,564 | ||||||
British Telecommunications PLC | 95 | 134,035 | ||||||
Deutsche Telekom International Finance BV | 190 | 208,797 | ||||||
Embarq Corp. | 56 | 63,346 | ||||||
Qwest Corp. | 55 | 62,837 | ||||||
8.875%, 3/15/12 | 110 | 116,875 | ||||||
Telecom Italia Capital SA | 170 | 185,409 | ||||||
United States Cellular Corp. | 135 | 133,608 | ||||||
| ALLIANCEBERNSTEIN CORPORATE INCOME SHARES • | 9 |
Portfolio of Investments
| Principal Amount (000) | U.S. $ Value | |||||||
Verizon New York, Inc. | $ | 290 | $ | 331,498 | ||||
| 2,068,945 | ||||||||
Consumer Cyclical - Automotive – 1.1% | ||||||||
Daimler Finance North America LLC | 140 | 146,399 | ||||||
Harley-Davidson Funding Corp. | 60 | 65,020 | ||||||
Johnson Controls, Inc. | 105 | 117,245 | ||||||
| 328,664 | ||||||||
Consumer Cyclical - Entertainment – 1.3% | ||||||||
Time Warner, Inc. | 60 | 60,945 | ||||||
Turner Broadcasting System, Inc. | 165 | 188,644 | ||||||
Viacom, Inc. | 125 | 143,662 | ||||||
| 393,251 | ||||||||
Consumer Cyclical - Other – 1.1% | ||||||||
Marriott International, Inc. | 115 | 123,164 | ||||||
MDC Holdings, Inc. | 43 | 44,810 | ||||||
Toll Brothers Finance Corp. | 155 | 159,595 | ||||||
| 327,569 | ||||||||
Consumer Cyclical - Retailers – 1.9% | ||||||||
AutoZone, Inc. | 110 | 121,273 | ||||||
CVS Caremark Corp. | 160 | 185,643 | ||||||
Kohl’s Corp. | 85 | 98,646 | ||||||
Nordstrom, Inc. | 120 | 144,068 | ||||||
| 549,630 | ||||||||
Consumer Non-Cyclical – 5.1% | ||||||||
Ahold Finance USA LLC | 75 | 84,201 | ||||||
Altria Group, Inc. | 85 | 111,885 | ||||||
9.70%, 11/10/18 | 75 | 99,861 | ||||||
| 10 | • ALLIANCEBERNSTEIN CORPORATE INCOME SHARES |
Portfolio of Investments
| Principal Amount (000) | U.S. $ Value | |||||||
Avon Products, Inc. | $ | 90 | $ | 104,308 | ||||
Bristol-Myers Squibb Co. | 170 | 194,298 | ||||||
Bunge Ltd. Finance Corp. | 90 | 97,033 | ||||||
ConAgra Foods, Inc. | 100 | 133,910 | ||||||
Delhaize Group SA | 100 | 95,607 | ||||||
Fortune Brands, Inc. | 100 | 107,022 | ||||||
McKesson Corp. | 105 | 128,410 | ||||||
Newell Rubbermaid, Inc. | 80 | 85,981 | ||||||
Reynolds American, Inc. | 100 | 112,462 | ||||||
Whirlpool Corp. | 130 | 151,881 | ||||||
| 1,506,859 | ||||||||
Energy – 5.8% | ||||||||
Anadarko Petroleum Corp. | 165 | 184,303 | ||||||
Encana Corp. | 130 | 140,235 | ||||||
Hess Corp. | 154 | 194,122 | ||||||
Marathon Petroleum Corp. | 10 | 10,133 | ||||||
5.125%, 3/01/21(a) | 17 | 17,561 | ||||||
Nabors Industries, Inc. | 85 | 109,224 | ||||||
Nexen, Inc. | 100 | 116,038 | ||||||
Noble Energy, Inc. | 98 | 124,982 | ||||||
Petro-Canada | 135 | 153,166 | ||||||
Sunoco, Inc. | 110 | 118,539 | ||||||
Talisman Energy, Inc. | 80 | 98,799 | ||||||
Valero Energy Corp. | 115 | 149,388 | ||||||
Weatherford International Ltd./Bermuda | 110 | 142,656 | ||||||
| ALLIANCEBERNSTEIN CORPORATE INCOME SHARES • | 11 |
Portfolio of Investments
| Principal Amount (000) | U.S. $ Value | |||||||
Williams Cos., Inc. (The) | $ | 120 | $ | 152,037 | ||||
| 1,711,183 | ||||||||
Services – 0.4% | ||||||||
Western Union Co. (The) | 100 | 112,546 | ||||||
Technology – 2.2% | ||||||||
Agilent Technologies, Inc. | 13 | 13,544 | ||||||
Computer Sciences Corp. | 125 | 132,223 | ||||||
Harris Corp. | 90 | 98,272 | ||||||
Motorola Solutions, Inc. | 125 | 132,011 | ||||||
Science Applications International Corp. | 50 | 52,863 | ||||||
Xerox Corp. | 185 | 211,505 | ||||||
| 640,418 | ||||||||
Transportation - Airlines – 0.2% | ||||||||
Southwest Airlines Co. | 65 | 69,994 | ||||||
Transportation - Railroads – 0.3% | ||||||||
Canadian Pacific Railway Co. | 80 | 95,600 | ||||||
Transportation - Services – 0.7% | ||||||||
Asciano Finance Ltd. | 39 | 39,681 | ||||||
FedEx Corp. | 100 | 124,919 | ||||||
Ryder System, Inc. | 28 | 31,226 | ||||||
| 195,826 | ||||||||
| 12,717,837 | ||||||||
Financial Institutions – 35.3% | ||||||||
Banking – 18.5% | ||||||||
American Express Bank FSB | 135 | 145,139 | ||||||
American Express Co. | 45 | 53,316 | ||||||
Bank of America Corp. | 400 | 417,078 | ||||||
| 12 | • ALLIANCEBERNSTEIN CORPORATE INCOME SHARES |
Portfolio of Investments
| Principal Amount (000) | U.S. $ Value | |||||||
BankAmerica Capital II | $ | 137 | $ | 140,596 | ||||
Barclays Bank PLC | 100 | 102,887 | ||||||
BB&T Corp. | 120 | 141,301 | ||||||
Bear Stearns Cos. LLC (The) | 260 | 282,366 | ||||||
Capital One Financial Corp. | 168 | 186,998 | ||||||
Citigroup, Inc. | 250 | 262,317 | ||||||
5.00%, 9/15/14 | 305 | 322,964 | ||||||
6.125%, 8/25/36 | 115 | 113,604 | ||||||
Countrywide Financial Corp. | 253 | 273,759 | ||||||
Fifth Third Bancorp | 105 | 114,075 | ||||||
Goldman Sachs Group, Inc. (The) | 345 | 373,351 | ||||||
6.125%, 2/15/33 | 275 | 283,528 | ||||||
HSBC Bank USA NA/New York NY | 145 | 155,215 | ||||||
JPMorgan Chase & Co. | 175 | 179,338 | ||||||
4.95%, 3/25/20 | 235 | 241,454 | ||||||
KeyCorp | 110 | 120,298 | ||||||
Merrill Lynch & Co., Inc. | 100 | 97,932 | ||||||
Morgan Stanley | 475 | 485,246 | ||||||
7.25%, 4/01/32 | 130 | 156,277 | ||||||
PNC Funding Corp. | 110 | 111,014 | ||||||
Royal Bank of Scotland PLC (The) | 145 | 153,542 | ||||||
SouthTrust Corp. | 145 | 159,870 | ||||||
State Street Corp. | 95 | 106,172 | ||||||
UBS AG/Stamford CT | 170 | 189,769 | ||||||
Unicredit Luxembourg Finance SA | 100 | 101,960 | ||||||
| 5,471,366 | ||||||||
| ALLIANCEBERNSTEIN CORPORATE INCOME SHARES • | 13 |
Portfolio of Investments
| Principal Amount (000) | U.S. $ Value | |||||||
Brokerage – 0.7% | ||||||||
Jefferies Group, Inc. | $ | 95 | $ | 113,938 | ||||
Schwab Capital Trust I | 95 | 99,730 | ||||||
| 213,668 | ||||||||
Finance – 3.5% | ||||||||
GE Capital Trust I | 345 | 357,938 | ||||||
General Electric Capital Corp. | 235 | 258,136 | ||||||
HSBC Finance Capital Trust IX | 170 | 165,538 | ||||||
SLM Corp. | 230 | 238,214 | ||||||
| 1,019,826 | ||||||||
Insurance – 9.9% | ||||||||
Aflac, Inc. | 15 | 15,217 | ||||||
Allstate Corp. (The) | 35 | 35,962 | ||||||
American International Group, Inc. | 120 | 113,700 | ||||||
Assurant, Inc. | 110 | 117,556 | ||||||
Chubb Corp. | 130 | 146,909 | ||||||
CIGNA Corp. | 115 | 135,552 | ||||||
Coventry Health Care, Inc. | 95 | 101,677 | ||||||
Genworth Financial, Inc. | 115 | 116,531 | ||||||
Guardian Life Insurance Co. of America | 75 | 88,780 | ||||||
Hartford Financial Services Group, Inc. | 95 | 92,310 | ||||||
Humana, Inc. | 90 | 101,419 | ||||||
Lincoln National Corp. | 82 | 105,471 | ||||||
Markel Corp. | 90 | 103,009 | ||||||
Marsh & McLennan Cos., Inc. | 100 | 108,924 | ||||||
Metlife Capital Trust IV | 250 | 280,516 | ||||||
| 14 | • ALLIANCEBERNSTEIN CORPORATE INCOME SHARES |
Portfolio of Investments
| Principal Amount (000) | U.S. $ Value | |||||||
Nationwide Mutual Insurance Co. | $ | 120 | $ | 150,974 | ||||
OneBeacon US Holdings, Inc. | 38 | 39,748 | ||||||
Principal Financial Group, Inc. | 135 | 156,734 | ||||||
Prudential Financial, Inc. | 195 | 205,487 | ||||||
Swiss Re Solutions Holding Corp. | 150 | 164,919 | ||||||
Travelers Cos., Inc. (The) | 120 | 137,625 | ||||||
UnitedHealth Group, Inc. | 140 | 152,966 | ||||||
WellPoint, Inc. | 20 | 22,886 | ||||||
7.00%, 2/15/19 | 110 | 130,896 | ||||||
XL Group PLC | 105 | 106,486 | ||||||
| 2,932,254 | ||||||||
REITS – 2.7% | ||||||||
Duke Realty LP | 55 | 62,223 | ||||||
ERP Operating LP | 165 | 181,043 | ||||||
HCP, Inc. | 105 | 114,184 | ||||||
Health Care REIT, Inc. | 145 | 160,493 | ||||||
Regency Centers LP | 110 | 122,036 | ||||||
Simon Property Group LP | 160 | 159,423 | ||||||
| 799,402 | ||||||||
| 10,436,516 | ||||||||
Utility – 10.6% | ||||||||
Electric – 6.6% | ||||||||
Allegheny Energy Supply Co. LLC | 95 | 100,465 | ||||||
Ameren Corp. | 105 | 121,732 | ||||||
Constellation Energy Group, Inc. | 140 | 148,698 | ||||||
Consumers Energy Co. | 105 | 113,257 | ||||||
| ALLIANCEBERNSTEIN CORPORATE INCOME SHARES • | 15 |
Portfolio of Investments
| Principal Amount (000) | U.S. $ Value | |||||||
Dominion Resources, Inc./VA | $ | 235 | $ | 232,650 | ||||
DTE Energy Co. | 130 | 148,482 | ||||||
Enersis SA/Cayman Island | 70 | 81,500 | ||||||
FirstEnergy Corp. | 157 | 174,370 | ||||||
Integrys Energy Group, Inc. | 120 | 118,200 | ||||||
Nevada Power Co. | 125 | 148,829 | �� | |||||
Nisource Finance Corp. | 145 | 159,374 | ||||||
Oncor Electric Delivery Co. LLC | 115 | 133,465 | ||||||
Potomac Electric Power Co. | 115 | 133,282 | ||||||
Teco Finance, Inc. | 110 | 127,157 | ||||||
| 1,941,461 | ||||||||
Natural Gas – 4.0% | ||||||||
AGL Capital Corp. | 105 | 111,663 | ||||||
CenterPoint Energy Resources Corp. | 99 | 100,556 | ||||||
Colorado Interstate Gas Co. | 115 | 132,933 | ||||||
Energy Transfer Partners LP | 120 | 135,048 | ||||||
EQT Corp. | 80 | 96,752 | ||||||
Kinder Morgan Energy Partners LP | 95 | 108,978 | ||||||
Plains All American Pipeline LP/PAA Finance Corp. | 125 | 158,118 | ||||||
Southern Union Co. | 60 | 68,188 | ||||||
Spectra Energy Capital LLC | 120 | 148,072 | ||||||
Williams Partners LP | 115 | 122,304 | ||||||
| 1,182,612 | ||||||||
| 3,124,073 | ||||||||
Total Corporates - Investment Grades | 26,278,426 | |||||||
| 16 | • ALLIANCEBERNSTEIN CORPORATE INCOME SHARES |
Portfolio of Investments
| Principal Amount (000) | U.S. $ Value | |||||||
CORPORATES - NON-INVESTMENT GRADES – 3.4% | ||||||||
Industrial – 2.5% | ||||||||
Basic – 0.7% | ||||||||
United States Steel Corp. | $ | 105 | $ | 106,312 | ||||
Weyerhaeuser Co. | 90 | 105,722 | ||||||
| 212,034 | ||||||||
Capital Goods – 1.2% | ||||||||
Mohawk Industries, Inc. | 100 | 107,750 | ||||||
Textron Financial Corp. | 95 | 100,194 | ||||||
Vulcan Materials Co. | 140 | 147,530 | ||||||
| 355,474 | ||||||||
Consumer Cyclical - Other – 0.4% | ||||||||
Sheraton Holding Corp. | 100 | 113,500 | ||||||
Consumer Non-Cyclical – 0.2% | ||||||||
Universal Health Services, Inc. | 65 | 71,466 | ||||||
| 752,474 | ||||||||
Financial Institutions – 0.5% | ||||||||
Banking – 0.3% | ||||||||
Zions Bancorporation | 75 | 78,161 | ||||||
Finance – 0.2% | ||||||||
International Lease Finance Corp. | 65 | 66,625 | ||||||
| 144,786 | ||||||||
Utility – 0.4% | ||||||||
Electric – 0.4% | ||||||||
PPL Capital Funding, Inc. | 105 | 104,344 | ||||||
Total Corporates - Non-Investment Grades | 1,001,604 | |||||||
GOVERNMENTS - TREASURIES – 1.9% | ||||||||
United States – 1.9% | ||||||||
U.S. Treasury Bonds 4.625%, 2/15/40 | 540 | 559,659 | ||||||
| ALLIANCEBERNSTEIN CORPORATE INCOME SHARES • | 17 |
Portfolio of Investments
| Principal Amount (000) | U.S. $ Value | |||||||
SHORT-TERM INVESTMENTS – 4.3% | ||||||||
Time Deposit – 4.3% | ||||||||
State Street Time Deposit 0.01%, 5/02/11 | $ | 1,269 | $ | 1,269,067 | ||||
Total Investments – 98.6% | 29,108,756 | |||||||
Other assets less liabilities – 1.4% | 410,970 | |||||||
Net Assets – 100.0% | $ | 29,519,726 | ||||||
| (a) | Security is exempt from registration under Rule 144A of the Securities Act of 1933. These securities are considered liquid and may be resold in transactions exempt from registration, normally to qualified institutional buyers. At April 30, 2011, the aggregate market value of these securities amounted to $1,192,841 or 4.0% of net assets. |
Glossary:
REIT – Real Estate Investment Trust
See notes to financial statements.
| 18 | • ALLIANCEBERNSTEIN CORPORATE INCOME SHARES |
Portfolio of Investments
STATEMENT OF ASSETS & LIABILITIES
April 30, 2011
| Assets | ||||
Investments in securities, at value (cost $27,495,525) | $ | 29,108,756 | ||
Interest receivable | 457,718 | |||
Receivable for shares of beneficial interest sold | 3,245 | |||
Total assets | 29,569,719 | |||
| Liabilities | ||||
Dividends payable | 41,709 | |||
Payable for shares of beneficial interest redeemed | 8,284 | |||
Total liabilities | 49,993 | |||
Net Assets | $ | 29,519,726 | ||
| Composition of Net Assets | ||||
Shares of beneficial interest, at par | $ | 28 | ||
Additional paid-in capital | 31,483,454 | |||
Undistributed net investment income | 74,130 | |||
Accumulated net realized loss on investment transactions | (3,651,117 | ) | ||
Net unrealized appreciation on investments | 1,613,231 | |||
| $ | 29,519,726 | |||
Net Asset Value Per Share—unlimited shares of beneficial interest authorized, $.00001 par value (based on 2,787,625 common shares outstanding) | $ | 10.59 | ||
See notes to financial statements.
| ALLIANCEBERNSTEIN CORPORATE INCOME SHARES • | 19 |
Statement of Assets & Liabilities
STATEMENT OF OPERATIONS
Year Ended April 30, 2011
| Investment Income | ||||
Interest | $ | 1,634,477 | ||
| Realized and Unrealized Gain on Investment Transactions | ||||
Net realized gain on investment transactions | 544,041 | |||
Net change in unrealized appreciation/depreciation of investments | 335,843 | |||
Net gain on investment transactions | 879,884 | |||
Net Increase in Net Assets from Operations | $ | 2,514,361 | ||
See notes to financial statements.
| 20 | • ALLIANCEBERNSTEIN CORPORATE INCOME SHARES |
Statement of Operations
STATEMENT OF CHANGES IN NET ASSETS
| Year Ended April 30, 2011 | Year Ended April 30, 2010 | |||||||
| Increase in Net Assets from Operations | ||||||||
Net investment income | $ | 1,634,477 | $ | 3,087,579 | ||||
Net realized gain on investment transactions | 544,041 | 148,192 | ||||||
Net change in unrealized appreciation/depreciation of investments | 335,843 | 11,746,902 | ||||||
Net increase in net assets from operations | 2,514,361 | 14,982,673 | ||||||
| Dividends to Shareholders from | ||||||||
Net investment income | (1,634,477 | ) | (3,087,579 | ) | ||||
| Transactions in Shares of Beneficial Interest | ||||||||
Net decrease | (5,401,097 | ) | (34,848,331 | ) | ||||
Total decrease | (4,521,213 | ) | (22,953,237 | ) | ||||
| Net Assets | ||||||||
Beginning of period | 34,040,939 | 56,994,176 | ||||||
End of period (including undistributed net investment income of $74,130 and $74,130, respectively) | $ | 29,519,726 | $ | 34,040,939 | ||||
See notes to financial statements.
| ALLIANCEBERNSTEIN CORPORATE INCOME SHARES • | 21 |
Statement of Changes in Net Assets
NOTES TO FINANCIAL STATEMENTS
April 30, 2011
NOTE A
Significant Accounting Policies
AllianceBernstein Corporate Shares (the “Trust”) was organized as a Massachusetts business trust under the laws of The Commonwealth of Massachusetts by an Agreement and Declaration of Trust (“Declaration of Trust”) dated January 26, 2004. The Trust is registered under the Investment Company Act of 1940, as an open-end, diversified management investment company. The Trust operates as a “series” company currently having four separate portfolios: AllianceBernstein Corporate Income Shares (the “Portfolio”), AllianceBernstein Municipal Income Shares, AllianceBernstein Taxable Multi-Sector Income Shares and AllianceBernstein Tax-Aware Real Return Income Shares. Each Portfolio is considered to be a separate entity for financial reporting and tax purposes. AllianceBernstein Corporate Income Shares commenced operations on December 11, 2006. AllianceBernstein Municipal Income Shares commenced operations on September 1, 2010. AllianceBernstein Taxable Multi-Sector Income Shares commenced operations on September 15, 2010. AllianceBernstein Tax-Aware Real Return Income Shares commenced operations on May 2, 2011. This report relates only to AllianceBernstein Corporate Income Shares. Prior to the commencement of investment operations on December 11, 2006, the Portfolio had no operations other than the sale to the Adviser of 10,000 Portfolio shares for $10 each for the aggregate amount of $100,000 on May 17, 2006.
Shares of the Portfolio are offered exclusively to holders of accounts established under wrap-fee programs sponsored and maintained by certain registered investment advisers approved by AllianceBernstein L.P. (the “Adviser”). The Portfolio’s shares may be purchased at the relevant net asset value without a sales charge or other fee. The financial statements have been prepared in conformity with U.S. generally accepted accounting principles (“U.S. GAAP”) which require management to make certain estimates and assumptions that affect the reported amounts of assets and liabilities in the financial statements and amounts of income and expenses during the reporting period. Actual results could differ from those estimates. The following is a summary of significant accounting policies followed by the Portfolio.
1. Security Valuation
Portfolio securities are valued at their current market value determined on the basis of market quotations or, if market quotations are not readily available or are deemed unreliable, at “fair value” as determined in accordance with procedures established by and under the general supervision of the Trust’s Board of Trustees.
In general, the market value of securities which are readily available and deemed reliable are determined as follows. Securities listed on a national securities exchange (other than securities listed on the NASDAQ Stock Market, Inc. (“NASDAQ”)) or on a foreign securities exchange are valued at the last sale
| 22 | • ALLIANCEBERNSTEIN CORPORATE INCOME SHARES |
Notes to Financial Statements
price at the close of the exchange or foreign securities exchange. If there has been no sale on such day, the securities are valued at the mean of the closing bid and asked prices on such day. Securities listed on more than one exchange are valued by reference to the principal exchange on which the securities are traded; securities listed only on NASDAQ are valued in accordance with the NASDAQ Official Closing Price; listed put or call options are valued at the last sale price. If there has been no sale on that day, such securities will be valued at the closing bid prices on that day; open futures contracts and options thereon are valued using the closing settlement price or, in the absence of such a price, the most recent quoted bid price. If there are no quotations available for the day of valuation, the last available closing settlement price is used; securities traded in the over-the-counter market (“OTC”) are valued at the mean of the current bid and asked prices as reported by the National Quotation Bureau or other comparable sources; U.S. government securities and other debt instruments having 60 days or less remaining until maturity are valued at amortized cost if their original maturity was 60 days or less; or by amortizing their fair value as of the 61st day prior to maturity if their original term to maturity exceeded 60 days; fixed-income securities, including mortgage backed and asset backed securities, may be valued on the basis of prices provided by a pricing service or at a price obtained from one or more of the major broker/dealers. In cases where broker/dealer quotes are obtained, the Adviser may establish procedures whereby changes in market yields or spreads are used to adjust, on a daily basis, a recently obtained quoted price on a security; and OTC and other derivatives are valued on the basis of a quoted bid price or spread from a major broker/dealer in such security. Investments in money market funds are valued at their net asset value each day.
Securities for which market quotations are not readily available (including restricted securities) or are deemed unreliable are valued at fair value. Factors considered in making this determination may include, but are not limited to, information obtained by contacting the issuer, analysts, analysis of the issuer’s financial statements or other available documents. In addition, the Portfolio may use fair value pricing for securities primarily traded in non-U.S. markets because most foreign markets close well before the Portfolio values its securities at 4:00 p.m., Eastern Time. The earlier close of these foreign markets gives rise to the possibility that significant events, including broad market moves, may have occurred in the interim and may materially affect the value of those securities.
2. Fair Value Measurements
In accordance with U.S. GAAP regarding fair value measurements, fair value is defined as the price that the Portfolio would receive to sell an asset or pay to transfer a liability in an orderly transaction between market participants at the measurement date. The U.S. GAAP disclosure requirements establish a framework for measuring fair value, and a three-level hierarchy for fair value measurements based upon the transparency of inputs to the valuation of an asset or liability. Inputs may be observable or unobservable and refer broadly to the
| ALLIANCEBERNSTEIN CORPORATE INCOME SHARES • | 23 |
Notes to Financial Statements
assumptions that market participants would use in pricing the asset or liability. Observable inputs reflect the assumptions market participants would use in pricing the asset or liability based on market data obtained from sources independent of the Portfolio. Unobservable inputs reflect the Portfolio’s own assumptions about the assumptions that market participants would use in pricing the asset or liability based on the best information available in the circumstances. Each investment is assigned a level based upon the observability of the inputs which are significant to the overall valuation. The three-tier hierarchy of inputs is summarized below.
| • | Level 1—quoted prices in active markets for identical investments |
| • | Level 2—other significant observable inputs (including quoted prices for similar investments, interest rates, prepayment speeds, credit risk, etc.) |
| • | Level 3—significant unobservable inputs (including the Portfolio’s own assumptions in determining the fair value of investments) |
The following table summarizes the valuation of the Portfolio’s investments by the above fair value hierarchy levels as of April 30, 2011:
Investments in Securities | Level 1 | Level 2 | Level 3 | Total | ||||||||||||
Assets: | ||||||||||||||||
Corporates – Investment Grades | $ | — | $ | 26,278,426 | $ | — | $ | 26,278,426 | ||||||||
Corporates – Non-Investment Grades | — | 1,001,604 | — | 1,001,604 | ||||||||||||
Governments – Treasuries | — | 559,659 | — | 559,659 | ||||||||||||
Short-Term Investments | — | 1,269,067 | — | 1,269,067 | ||||||||||||
Total Investments in Securities | — | 29,108,756 | — | 29,108,756 | ||||||||||||
Other Financial Instruments* | — | — | — | — | ||||||||||||
Total | $ | — | $ | 29,108,756 | $ | — | $ | 29,108,756 | ||||||||
| * | Other financial instruments are derivative instruments, such as futures, forwards and swap contracts, which are valued at the unrealized appreciation/depreciation on the instrument. |
3. Taxes
It is the Portfolio’s policy to meet the requirements of the Internal Revenue Code applicable to regulated investment companies and to distribute all of its investment company taxable income and net realized gains, if any, to shareholders. Therefore, no provisions for federal income or excise taxes are required.
In accordance with U.S. GAAP requirements regarding accounting for uncertainties in income taxes, management has analyzed the Portfolio’s tax positions taken or expected to be taken on federal and state income tax returns for all open tax years (the current and the prior three tax years) and has concluded that no provision for income tax is required in the Portfolio’s financial statements.
4. Investment Income and Investment Transactions
Dividend income is recorded on the ex-dividend date or as soon as the Portfolio is informed of the dividend. Interest income is accrued daily. Investment transactions are accounted for on the date the securities are purchased or sold.
| 24 | • ALLIANCEBERNSTEIN CORPORATE INCOME SHARES |
Notes to Financial Statements
Investment gains or losses are determined on the identified cost basis. The Portfolio amortizes premiums and accretes discounts as adjustments to interest income.
5. Dividends and Distributions
Dividends and distributions to shareholders, if any, are recorded on the ex-dividend date. Income dividends and capital gains distributions are determined in accordance with federal tax regulations and may differ from those determined in accordance with U.S. GAAP. To the extent these differences are permanent, such amounts are reclassified within the capital accounts based on their federal tax basis treatment; temporary differences do not require such reclassification.
NOTE B
Advisory Fee and Other Transactions with Affiliates
Under the terms of the Advisory Agreement, the Portfolio pays no advisory fee to the Adviser and the Adviser reimburses or pays for the Portfolio’s operating expenses. The Portfolio is an integral part of separately managed accounts in wrap-fee programs. Typically, participants in these programs pay a fee to their investment adviser for all costs and expenses of the separately managed account, including costs and expenses associated with the Portfolio. The Adviser serves as investment manager and adviser of the Portfolio and continuously furnishes an investment program for the Portfolio and manages, supervises and conducts the affairs of the Portfolio, subject to the supervisions of the Portfolio’s Board of Trustees. The Advisory Agreement provides that the Adviser or an affiliate will furnish, or pay the expenses of the Portfolio for, office space, facilities and equipment, services of executive and other personnel of the Portfolio and certain administrative services.
The Portfolio has entered into a Distribution Agreement (the “Agreement”) with AllianceBernstein Investments, Inc., the Portfolio’s principal underwriter (the “Underwriter”), to permit the Underwriter to distribute the Portfolio’s shares, which are sold at their net asset value without any sales charge. The Portfolio does not pay a fee for this service. The Underwriter is a wholly owned subsidiary of the Adviser.
AllianceBernstein Investor Services, Inc. (“ABIS”), a wholly-owned subsidiary of the Adviser, acts as the Portfolios’ registrar, transfer agent and dividend-disbursing agent. ABIS registers the transfer, issuance and redemption of Portfolio shares and disburses dividends and other distributions to Portfolio shareholders. The Portfolio does not pay a fee for this service.
| ALLIANCEBERNSTEIN CORPORATE INCOME SHARES • | 25 |
Notes to Financial Statements
NOTE C
Investment Transactions
Purchases and sales of investment securities (excluding short-term investments) for the year ended April 30, 2011 were as follows:
| Purchases | Sales | |||||||
Investment securities (excluding | $ | 6,882,887 | $ | 13,072,474 | ||||
U.S. government securities | 2,784,329 | 2,506,968 | ||||||
The cost of investments for federal income tax purposes, gross unrealized appreciation and unrealized depreciation are as follows:
Cost | $ | 27,498,914 | ||
Gross unrealized appreciation | $ | 1,683,466 | ||
Gross unrealized depreciation | (73,624 | ) | ||
Net unrealized appreciation | $ | 1,609,842 | ||
NOTE D
Capital Stock
Transactions in shares of beneficial interest were as follows:
| Shares | Amount | |||||||||||||||||||||||
| Year Ended April 30, 2011 | Year Ended April 30, 2010 | Year Ended April 30, 2011 | Year Ended April 30, 2010 | |||||||||||||||||||||
| Class A | ||||||||||||||||||||||||
Shares sold | 210,476 | 498,687 | $ | 2,195,110 | $ | 4,670,365 | ||||||||||||||||||
Shares redeemed | (727,554 | ) | (4,101,040 | ) | (7,596,207 | ) | (39,518,696 | ) | ||||||||||||||||
Net decrease | (517,078 | ) | (3,602,353 | ) | $ | (5,401,097 | ) | $ | (34,848,331 | ) | ||||||||||||||
NOTE E
Risks Involved in Investing in the Portfolio
Interest Rate Risk and Credit Risk—Interest rate risk is the risk that changes in interest rates will affect the value of an Underlying Portfolio’s investments in fixed-income debt securities such as bonds or notes. Increases in interest rates may cause the value of the Portfolio’s investments to decline. Credit risk is the risk that the issuer or guarantor of a debt security, or the counterparty to a derivative contract, will be unable or unwilling to make timely principal and/or interest payments, or to otherwise honor its obligations. The degree of risk for a particular security may be reflected in its credit risk rating. Credit risk is greater for medium quality and lower-rated securities. Lower-rated debt securities and similar unrated securities (commonly known as “junk bonds”) have speculative elements or are predominantly speculative risks.
| 26 | • ALLIANCEBERNSTEIN CORPORATE INCOME SHARES |
Notes to Financial Statements
Indemnification Risk—In the ordinary course of business, the Portfolio enters into contracts that contain a variety of indemnifications. The Portfolio’s maximum exposure under these arrangements is unknown. However, the Portfolio has not had prior claims or losses pursuant to these indemnification provisions and expects the risk of loss thereunder to be remote. Therefore, the Portfolio has not accrued any liability in connection with these indemnification provisions.
NOTE F
Distributions to Shareholders
The tax character of distributions paid during the fiscal years ended April 30, 2011 and April 30, 2010 were as follows:
| 2011 | 2010 | |||||||
Distributions paid from: | ||||||||
Ordinary income | $ | 1,634,477 | $ | 3,087,579 | ||||
Total taxable distributions | 1,634,477 | 3,087,579 | ||||||
Total distributions paid | $ | 1,634,477 | $ | 3,087,579 | ||||
As of April 30, 2011, the components of accumulated earnings/(deficit) on a tax basis were as follows:
Undistributed ordinary income | $ | 115,839 | ||
Accumulated capital and other losses | (3,647,728 | )(a) | ||
Unrealized appreciation/(depreciation) | 1,609,842 | (b) | ||
Total accumulated earnings/(deficit) | $ | (1,922,047 | )(c) | |
| (a) | On April 30, 2011, the Fund had capital loss carryforwards of $3,647,728 of which $53,807 expires in 2016, $2,193,148 expires in 2017 and $1,400,773 expires in 2018. To the extent future capital gains are offset by capital loss carryforwards, such gains will not be distributed. During the fiscal year, the Fund utilized capital loss carryforwards of $537,351. |
| (b) | The difference between book-basis and tax-basis unrealized appreciation/(depreciation) is attributable primarily to the tax deferral of losses on wash sales. |
| (c) | The difference between book-basis and tax-basis components of accumulated earnings/(deficit) is attributable primarily to dividends payable. |
During the current fiscal year, the Fund had no permanent differences that may affect undistributed net investment income, accumulated net realized loss on investment transactions, and additional paid-in capital.
NOTE G
Subsequent Events
Management has evaluated subsequent events for possible recognition or disclosure in the financial statements through the date the financial statements are issued. Management has determined that there are no material events that would require disclosure in the Portfolio’s financial statements through this date.
| ALLIANCEBERNSTEIN CORPORATE INCOME SHARES • | 27 |
Notes to Financial Statements
FINANCIAL HIGHLIGHTS
Selected Data For A Share Of Beneficial Interest Outstanding Throughout Each Period
| Year Ended April 30, | December 11, | |||||||||||||||||||
| 2011 | 2010 | 2009 | 2008 | |||||||||||||||||
Net asset value, beginning of period | $ 10.30 | $ 8.25 | $ 9.56 | $ 9.89 | $ 10.00 | |||||||||||||||
Income From Investment Operations | ||||||||||||||||||||
Net investment income(b) | .54 | .59 | .57 | .56 | .21 | |||||||||||||||
Net realized and unrealized gain (loss) on investment transactions | .29 | 2.05 | (1.31 | ) | (.33 | ) | (.11 | ) | ||||||||||||
Net increase (decrease) in net asset value from operations | .83 | 2.64 | (.74 | ) | .23 | .10 | ||||||||||||||
Less: Dividends | ||||||||||||||||||||
Dividends from net investment income | (.54 | ) | (.59 | ) | (.57 | ) | (.56 | ) | (.21 | ) | ||||||||||
Net asset value, end of period | $ 10.59 | $ 10.30 | $ 8.25 | $ 9.56 | $ 9.89 | |||||||||||||||
Total Return | ||||||||||||||||||||
Total investment return based on net asset value(c) | 8.28 | % | 32.72 | % | (7.76 | )% | 2.38 | % | 1.02 | % | ||||||||||
Ratios/Supplemental Data | ||||||||||||||||||||
Net assets, end of period (000’s omitted) | $29,520 | $34,041 | $56,994 | $86,830 | $89,127 | |||||||||||||||
Ratio to average net assets of: | ||||||||||||||||||||
Net investment income | 5.20 | % | 6.22 | % | 6.56 | % | 5.73 | % | 5.58 | %(d) | ||||||||||
Portfolio turnover rate. | 33 | % | 21 | % | 26 | % | 58 | % | 33 | % | ||||||||||
| (a) | Commencement of operations. |
| (b) | Based on average shares outstanding. |
| (c) | Total investment return is calculated assuming an initial investment made at the net asset value at the beginning of the period, reinvestment of all dividends and distributions at net asset value during the period, and redemption on the last day of the period. Total return does not reflect the deduction of taxes that a shareholder would pay on fund distributions or the redemption of fund shares. Total investment return calculated for a period of less than one year is not annualized. |
| (d) | Annualized. |
See notes to financial statements.
| 28 | • ALLIANCEBERNSTEIN CORPORATE INCOME SHARES |
Financial Highlights
REPORT OF INDEPENDENT REGISTERED
PUBLIC ACCOUNTING FIRM
To the Board of Trustees of AllianceBernstein Corporate Shares and Shareholders of AllianceBernstein Corporate Income Shares:
We have audited the accompanying statement of assets and liabilities, including the portfolio of investments, of AllianceBernstein Corporate Income Shares (one of the portfolios constituting AllianceBernstein Corporate Shares) (the “Portfolio”), as of April 30, 2011, and the related statements of operations and changes in net assets, and the financial highlights for the year then ended. These financial statements and financial highlights are the responsibility of the Portfolio’s management. Our responsibility is to express an opinion on these financial statements and financial highlights based on our audit. The statement of changes in net assets for the year ended April 30, 2010 and the financial highlights for each of the periods presented prior to May 1, 2010 were audited by other auditors whose report dated June 24, 2010 expressed an unqualified opinion on that statement and financial highlights.
We conducted our audit in accordance with the standards of the Public Company Accounting Oversight Board (United States). Those standards require that we plan and perform the audit to obtain reasonable assurance about whether the financial statements and financial highlights are free of material misstatement. We were not engaged to perform an audit of the Portfolio’s internal control over financial reporting. Our audit included consideration of internal control over financial reporting as a basis for designing audit procedures that are appropriate in the circumstances, but not for the purpose of expressing an opinion on the effectiveness of the Portfolio’s internal control over financial reporting. Accordingly, we express no such opinion. An audit also includes examining, on a test basis, evidence supporting the amounts and disclosures in the financial statements and financial highlights, assessing the accounting principles used and significant estimates made by management, and evaluating the overall financial statement presentation. Our procedures included confirmation of securities owned as of April 30, 2011 by correspondence with the custodian and others or by other appropriate auditing procedures where replies from others were not received. We believe that our audit provides a reasonable basis for our opinion.
In our opinion, the financial statements and financial highlights referred to above present fairly, in all material respects, the financial position of AllianceBernstein Corporate Income Shares of AllianceBernstein Corporate Shares at April 30, 2011, and the results of its operations, changes in its net assets and the financial highlights for the year then ended, in conformity with U.S. generally accepted accounting principles.

New York, New York
June 24, 2011
| ALLIANCEBERNSTEIN CORPORATE INCOME SHARES • | 29 |
Report of Independent Registered Public Accounting Firm
FEDERAL TAX INFORMATION
(unaudited)
For Federal income tax purposes, the following information is furnished with respect to the distributions paid by the Fund during the taxable year ended April 30, 2011. For foreign shareholders, 96.86% of ordinary dividends paid may be considered to be qualifying to be taxed as interest-related dividends.
| 30 | • ALLIANCEBERNSTEIN CORPORATE INCOME SHARES |
Tax Information
RESULTS OF SHAREHOLDERS MEETING
(unaudited)
The Annual Meeting of Shareholders of AllianceBernstein Corporate Shares (the “Trust”)—AllianceBernstein Corporate Income Shares (the “Portfolio”) was held on November 5, 2010 (the “Meeting”). At the Meeting, with respect to the first item of business, the election of Trustees for the Trust, and with respect to the fifth item of business, changes to the Portfolio’s fundamental policy regarding commodities, the required number of outstanding shares was voted in favor of the proposals, and both proposals were approved. A description of each proposal and number of shares voted at the Meeting are as follows (the proposal numbers shown below correspond to the proposal numbers in the Trust’s proxy statement):
| Voted For | Withheld Authority | |||
1. The election of the Trustees, each such Trustee to serve a term of an indefinite duration and until his or her successor is duly elected and qualifies. | ||||
| John H. Dobkin | 4,054,833 | 0 | ||
| Michael J. Downey | 4,054,833 | 0 | ||
| William H. Foulk, Jr. | 4,054,833 | 0 | ||
| D. James Guzy | 4,054,833 | 0 | ||
| Nancy P. Jacklin | 4,054,833 | 0 | ||
| Robert M. Keith | 4,054,833 | 0 | ||
| Garry L. Moody | 4,054,833 | 0 | ||
| Marshall C. Turner, Jr. | 4,054,833 | 0 | ||
| Earl D. Weiner | 4,054,833 | 0 | ||
| Voted For | Voted Against | Abstained | Broker Non-Votes | |||||
5. Approve the amendment of the Portfolio’s fundamental policy regarding commodities. | 2,818,019 | 1,296 | 11,167 | 224,351 |
| ALLIANCEBERNSTEIN CORPORATE INCOME SHARES • | 31 |
Results of Shareholders Meeting
BOARD OF TRUSTEES
| William H. Foulk, Jr.(1), Chairman | Robert M. Keith, President and Chief Executive Officer Garry L. Moody(1) Marshall C. Turner, Jr.(1) Earl D. Weiner(1) | |
| John H. Dobkin(1) | ||
| Michael J. Downey(1) | ||
D. James Guzy(1) Nancy P. Jacklin(1) |
OFFICERS
Philip L. Kirstein, Senior Vice President and Independent Compliance Officer Douglas J. Peebles, Senior Vice President Shawn E. Keegan(2), Vice President | Joel J. McKoan(2), Vice President Ashish C. Shah(2), Vice President Emilie D. Wrapp, Secretary Joseph J. Mantineo, Treasurer and Chief Financial Officer Phyllis J. Clarke, Controller |
Custodian and Accounting Agent State Street Bank and Trust Company
Principal Underwriter AllianceBernstein Investments, Inc.
Transfer Agent AllianceBernstein Investor Services, Inc. | Legal Counsel Seward & Kissel LLP One Battery Park Plaza New York, NY 10004
Independent Registered Public Accounting Firm Ernst & Young LLP 5 Times Square New York, NY 10036 |
| (1) | Member of the Audit Committee, the Governance and Nominating Committee and the Independent Directors Committee. Mr. Foulk is the sole member of the Fair Value Pricing Committee. |
| (2) | The day-to-day management of, and investment decisions for, the Trust’s portfolio are made by the Corporate Income Shares Investment Team. Messrs. Shawn E. Keegan, Joel J. McKoan and Ashish C. Shah are the investment professionals primarily responsible for the day-to-day management of the Trust’s portfolio. |
| 32 | • ALLIANCEBERNSTEIN CORPORATE INCOME SHARES |
Board of Trustees
TRUSTEES AND OFFICERS INFORMATION
Board of Trustees Information
The business and affairs of the Trust are managed under the direction of the Board of Trustees. Certain information concerning the Trust’s Trustees is set forth below.
| NAME, ADDRESS*, AGE, AND (YEAR FIRST ELECTED**) | PRINCIPAL OCCUPATION(S) DURING PAST FIVE YEARS AND OTHER RELEVANT | PORTFOLIOS IN FUND COMPLEX OVERSEEN BY TRUSTEE | OTHER DIRECTORSHIPS HELD BY TRUSTEE IN PAST FIVE YEARS | |||||
| INTERESTED TRUSTEE | ||||||||
Robert M. Keith, # 51 (2010) | Senior Vice President of AllianceBernstein L.P. (the “Adviser”) and the head of AllianceBernstein Investments, Inc. (“ABI”) since July 2008; Director of ABI and President of the AllianceBernstein Mutual Funds. Previously, he served as Executive Managing Director of ABI from December 2006 to June 2008. Prior to joining ABI in 2006, Executive Managing Director of Bernstein Global Wealth Management, and prior thereto, Senior Managing Director and Global Head of Client Service and Sales of the Adviser’s institutional investment management business since 2004. Prior thereto, Managing Director and Head of North American Client Service and Sales in the Adviser’s institutional investment management business, with which he had been associated since prior to 2004. | 99 | None | |||||
| DISINTERESTED TRUSTEES | ||||||||
Chairman of the Board (2004) | Investment Adviser and an Independent Consultant since prior to 2006. Previously, he was Senior Manager of Barrett Associates, Inc., a registered investment adviser. He was formerly Deputy Comptroller and Chief Investment Officer of the State of New York and, prior thereto, Chief Investment Officer of the New York Bank for Savings. He has served as a director or trustee of various AllianceBernstein Funds since 1983 and has been Chairman of the AllianceBernstein Funds and of the Independent Directors Committee of such Funds since 2003. He is also active in a number of mutual fund related organizations and committees. | 99 | None | |||||
| ALLIANCEBERNSTEIN CORPORATE INCOME SHARES • | 33 |
Trustees and Officers Information
NAME, (YEAR FIRST ELECTED**) | PRINCIPAL OCCUPATION(S) DURING PAST FIVE YEARS AND OTHER RELEVANT QUALIFICATIONS*** | PORTFOLIOS IN FUND COMPLEX OVERSEEN BY TRUSTEE | OTHER DIRECTORSHIPS HELD BY TRUSTEE IN PAST FIVE YEARS | |||||
DISINTERESTED TRUSTEES (continued) | ||||||||
John H. Dobkin, ## (2004) | Independent Consultant since prior to 2006. Formerly, President of Save Venice, Inc. (preservation organization) from 2001-2002, Senior Advisor from June 1999-June 2000 and President of Historic Hudson Valley (historic preservation) from December 1989-May 1999. Previously, Director of the National Academy of Design. He has served as a director or trustee of various AllianceBernstein Funds since 1992, and as Chairman of the Audit Committees of a number of such Funds from 2001-2008. | 98 | None | |||||
Michael J. Downey, ## (2005) | Private Investor since prior to 2006. Formerly, managing partner of Lexington Capital, LLC (investment advisory firm) from December 1997 until December 2003. From 1987 until 1993, Chairman and CEO of Prudential Mutual Fund Management, director of the Prudential Mutual funds, and member of the Executive Committee of Prudential Securities Inc. He has served as a director or trustee of the AllianceBernstein Funds since 2005, and is a director of two other registered investment companies (and Chairman of one of them). | 98 | Asia Pacific Fund, Inc. and The Merger Fund since prior to 2006 and Prospect Acquisition Corp. (financial services) since 2007 until 2009 | |||||
D. James Guzy, ## (2005) | Chairman of the Board of PLX Technology (semi-conductors) and of SRC Computers Inc., with which he has been associated since prior to 2006. He was a director of Intel Corporation (semi-conductors) from 1969 until 2008, and served as Chairman of the Finance Committee of such company for several years until May 2008. He has served as a director or trustee of one or more of the AllianceBernstein Funds since 1982. | 98 | Cirrus Logic Corporation (semi- conductors) and PLX Technology, Inc. (semi-conductors) since prior to 2006 and Intel Corporation (semi-conductors) since prior to 2005 until 2008 | |||||
| 34 | • ALLIANCEBERNSTEIN CORPORATE INCOME SHARES |
Trustees and Officers Information
| NAME, ADDRESS*, AGE, AND (YEAR FIRST ELECTED**) | PRINCIPAL OCCUPATION(S) DURING PAST FIVE YEARS AND OTHER RELEVANT QUALIFICATIONS*** | PORTFOLIOS IN FUND COMPLEX OVERSEEN BY TRUSTEE | OTHER DIRECTORSHIPS HELD BY TRUSTEE IN PAST FIVE YEARS | |||||
DISINTERESTED TRUSTEES (continued) | ||||||||
Nancy P. Jacklin, ## (2006) | Professorial Lecturer at the Johns Hopkins School of Advanced International Studies since 2008. Formerly, U.S. Executive Director of the International Monetary Fund (December 2002-May 2006); Partner, Clifford Chance (1992-2002); Sector Counsel, International Banking and Finance, and Associate General Counsel, Citicorp (1985-1992); Assistant General Counsel (International), Federal Reserve Board of Governors (1982-1985); and Attorney Advisor, U.S. Department of the Treasury (1973-1982). Member of the Bar of the District of Columbia and of New York; and member of the Council on Foreign Relations. She has served as a director or trustee of the AllianceBernstein Funds since 2006. | 98 | None | |||||
Garry L. Moody, ## 59 (2010) | Independent Consultant. Formerly, Partner, Deloitte & Touche LLP (1995-2008) where he held a number of senior positions, including Vice Chairman, and U.S. and Global Investment Management Practice Managing Partner; President, Fidelity Accounting and Custody Services Company (1993-1995); and Partner, Ernst & Young LLP (1975-1993), where he served as the National Director of Mutual Fund Tax Services. He is also a member of the Governing Council of the Independent Directors Council (IDC), an organization of independent directors of mutual funds, and serves on that organization’s Education and Communications Committee. He has served as a director or trustee, and as Chairman of the Audit Committee, of most of the AllianceBernstein Funds since 2008. | 98 | None | |||||
| ALLIANCEBERNSTEIN CORPORATE INCOME SHARES • | 35 |
Trustees and Officers Information
| NAME, ADDRESS*, AGE, AND (YEAR FIRST ELECTED**) | PRINCIPAL OCCUPATION(S) DURING PAST FIVE YEARS AND OTHER RELEVANT QUALIFICATIONS*** | PORTFOLIOS IN FUND COMPLEX OVERSEEN BY TRUSTEE | OTHER DIRECTORSHIPS HELD BY TRUSTEE IN PAST FIVE YEARS | |||||
DISINTERESTED TRUSTEES (continued) | ||||||||
Marshall C. Turner, Jr., ## (2005) | Private Investor since prior to 2006. Interim CEO of MEMC Electronic Materials, Inc. (semi-conductor and solar cell substrates) from November 2008 until March 2009. He was Chairman and CEO of Dupont Photomasks, Inc. (components of semi-conductor manufacturing), 2003-2005, and President and CEO, 2005-2006, after the company was acquired and renamed Toppan Photomasks, Inc. He has extensive experience in venture capital investing including prior service as general partner of three institutional venture capital partnerships, and serves on the boards of a number of education and science-related non-profit organizations. He has served as a director or trustee of one or more of the AllianceBernstein Funds since 1992. | 98 | Xilinx, Inc. (programmable logic semi-conductors) and MEMC Electronic Materials, Inc., (semi-conductor and solar cell substrates) since prior to 2006 | |||||
Earl D. Weiner, ## 71 (2007) | Of Counsel, and Partner prior to January 2007, of the law firm Sullivan & Cromwell LLP and member of ABA Federal Regulation of Securities Committee Task Force to draft editions of the Fund Director’s Guidebook. He also serves as a director or trustee of various non-profit organizations and has served as Chairman or Vice Chairman of a number of them. He has served as a director or trustee of the AllianceBernstein Funds since 2007 and is Chairman of the Governance and Nominating Committees of most of the Funds. | 98 | None | |||||
| 36 | • ALLIANCEBERNSTEIN CORPORATE INCOME SHARES |
Trustees and Officers Information
| * | The address for each of the Trust’s disinterested Trustees is c/o AllianceBernstein L.P., Attention: Philip L. Kirstein, 1345 Avenue of the Americas, New York, NY 10105. |
| ** | There is no stated term of office for the Trust’s Trustees. |
| *** | The information above includes each Trustee’s principal occupation during the last five years and other information relating to the experience, attributes, and skills relevant to each Trustee’s qualifications to serve as a Trustee, which led to the conclusion that each Trustee should serve as a Trustee for the Trust. |
| # | Mr. Keith is an “interested person” of the Trust, as defined in the 1940 Act, due to his position as a Senior Vice President of the Adviser. |
| ## | Member of the Audit Committee, the Governance and Nominating Committee and the Independent Directors Committee. |
| + | Member of the Fair Value Pricing Committee. |
| ALLIANCEBERNSTEIN CORPORATE INCOME SHARES • | 37 |
Trustees and Officers Information
Officer Information
Certain information concerning the Trust’s officers is set forth below.
NAME, ADDRESS,* AND AGE | POSITION(S) HELD WITH FUND | PRINCIPAL OCCUPATION DURING PAST FIVE YEARS | ||
Robert M. Keith 51 | President and Chief Executive Officer | See above. | ||
| Philip L. Kirstein 66 | Senior Vice President and Independent Compliance Officer | Senior Vice President and Independent Compliance Officer of the AllianceBernstein Funds, with which he has been associated since October 2004. Prior thereto, he was Of Counsel to Kirkpatrick & Lockhart, LLP from October 2003 to October 2004, and General Counsel of Merrill Lynch Investment Managers, L.P. since prior to March 2003. | ||
| Douglas J. Peebles 45 | Senior Vice President | Senior Vice President of the Adviser,** with which he has been associated since prior to 2006. | ||
Ashish C. Shah 40 | Senior Vice President | Senior Vice President of the Adviser,** with which he has been associated since May 2010. Previously, he was a Managing Director and Head of Global Credit Strategy at Barclays Capital from September 2008 until May 2010. Prior thereto, he served as the Head of Credit Strategy at Lehman Brothers, heading the Structured Credit/CDO and Credit Strategy groups since prior to 2006. | ||
| Shawn E. Keegan 39 | Vice President | Vice President of the Adviser,** with which he has been associated since prior to 2006. | ||
Joel J. McKoan 53 | Vice President | Senior Vice President of the Adviser,** with which he has been associated since prior to 2006. | ||
| Emilie D. Wrapp 55 | Secretary | Senior Vice President, Assistant General Counsel and Assistant Secretary of ABI,** with which she has been associated since prior to 2006. | ||
| Joseph J. Mantineo 52 | Treasurer and Chief Financial Officer | Senior Vice President of AllianceBernstein Investor Services, Inc. (“ABIS”),** with which he has been associated since prior to 2006. | ||
Phyllis J. Clarke 50 | Controller | Vice President of ABIS,** with which she has been associated since prior to 2006. |
| * | The address for each of the Trust’s Officers is 1345 Avenue of the Americas, New York, NY 10105. |
| ** | The Adviser, ABI and ABIS are affiliates of the Trust. |
| The Trust’s Statement of Additional Information (“SAI”) has additional information about the Trust’s Trustees and Officers and is available without charge upon request. Contact your financial representative or AllianceBernstein at 1-800-227-4618 for a free prospectus or SAI. |
| 38 | • ALLIANCEBERNSTEIN CORPORATE INCOME SHARES |
Trustees and Officers Information
Information Regarding the Review and Approval of the Fund’s Advisory Agreement
The disinterested trustees (the “trustees”) of AllianceBernstein Corporate Shares (the “Fund”) unanimously approved the continuance of the Advisory Agreement with the Adviser in respect of AllianceBernstein Corporate Income Shares (the “Portfolio”) at a meeting held on November 2-4, 2010.
Prior to approval of the continuance of the Advisory Agreement in respect of the Portfolio, the trustees had requested from the Adviser, and received and evaluated, extensive materials. They reviewed the proposed continuance of the Advisory Agreement with the Adviser and with experienced counsel who are independent of the Adviser, who advised on the relevant legal standards. The trustees also reviewed an independent evaluation prepared by the Fund’s Senior Officer (who is also the Fund’s Independent Compliance Officer) of the reasonableness of the advisory fee in the Advisory Agreement wherein the Senior Officer concluded that the contractual fee (zero) for the Portfolio was reasonable. The trustees also discussed the proposed continuance in private sessions with counsel and the Fund’s Senior Officer.
The trustees noted that the Portfolio is designed as a vehicle for the wrap fee account market (where investors pay fees to a wrap fee sponsor which pays investment fees and expenses from such fee). The trustees also noted that no advisory fee is payable by the Portfolio, that the Advisory Agreement does not include the reimbursement provision for certain administrative expenses included in the advisory agreements of most of the open-end AllianceBernstein Funds, and that the Adviser is responsible for payment of the Portfolio’s ordinary expenses. The trustees noted that the Fund acknowledges in the Advisory Agreement that the Adviser and its affiliates expect to receive compensation from third parties in connection with services provided under the Advisory Agreement. The trustees further noted that the Adviser receives payments from the wrap fee program sponsors (the “Sponsors”) that use the Portfolio as an investment vehicle for their clients.
The trustees considered their knowledge of the nature and quality of the services provided by the Adviser to the Portfolio gained from their experience as trustees or directors of most of the registered investment companies advised by the Adviser, their overall confidence in the Adviser’s integrity and competence they have gained from that experience, the Adviser’s initiative in identifying and raising potential issues with the trustees and its responsiveness, frankness and attention to concerns raised by the trustees in the past, including the Adviser’s willingness to consider and implement organizational and operational changes designed to improve investment results and the services provided to the AllianceBernstein Funds. The trustees noted that they have four regular meetings each year, at each of which they receive presentations from the Adviser on the investment results of the Portfolio and review extensive materials and information presented by the Adviser.
| ALLIANCEBERNSTEIN CORPORATE INCOME SHARES • | 39 |
The trustees also considered all other factors they believed relevant, including the specific matters discussed below. In their deliberations, the trustees did not identify any particular information that was all-important or controlling, and different trustees may have attributed different weights to the various factors. The trustees determined that the selection of the Adviser to manage the Portfolio, and the overall arrangements between the Portfolio and the Adviser as provided in the Advisory Agreement, including the advisory fee, were fair and reasonable in light of the services performed, expenses incurred and such other matters as the trustees considered relevant in the exercise of their business judgment. The material factors and conclusions that formed the basis for the trustees’ determination included the following:
Nature, Extent and Quality of Services Provided
The trustees considered the scope and quality of services provided by the Adviser under the Advisory Agreement, including the quality of the investment research capabilities of the Adviser and the other resources it has dedicated to performing services for the Portfolio. They also noted the professional experience and qualifications of the Portfolio’s portfolio management team and other senior personnel of the Adviser. The quality of administrative and other services, including the Adviser’s role in coordinating the activities of the Portfolio’s other service providers, also were considered. The trustees concluded that, overall, they were satisfied with the nature, extent and quality of services provided to the Portfolio under the Advisory Agreement.
Costs of Services Provided and Profitability
The trustees reviewed a schedule of the revenues, expenses and related notes indicating the profitability of the Portfolio to the Adviser for calendar years 2008 and 2009 that had been prepared with an expense allocation methodology arrived at in consultation with an independent consultant retained by the Fund’s Senior Officer. The trustees considered that while the Adviser does not receive any advisory fee from the Portfolio or expense reimbursement, it does receive fees paid by the Sponsors. They also noted that the Adviser bears certain costs in providing services to the Portfolio and in paying its ordinary expenses. The trustees reviewed the assumptions and methods of allocation used by the Adviser in preparing fund-specific profitability data and noted that there are a number of potentially acceptable allocation methodologies for information of this type. The trustees noted that the profitability information reflected all revenues and expenses of the Adviser’s relationship with the Portfolio. The trustees recognized that it is difficult to make comparisons of profitability between fund advisory contracts because comparative information is not generally publicly available and is affected by numerous factors, including, in the case of the Portfolio, the fact that it does not pay an advisory fee. The trustees focused on the profitability of the Adviser’s relationship with the Portfolio before taxes and distribution expenses. The trustees concluded that they were satisfied that the Adviser’s level of profitability from its relationship with the Portfolio in 2008 was not
| 40 | • ALLIANCEBERNSTEIN CORPORATE INCOME SHARES |
unreasonable and noted that the Adviser’s relationship with the Portfolio was not profitable to it in 2009.
Fall-Out Benefits
The trustees considered the benefits to the Adviser and its affiliates from their relationships with the Portfolio other than the fees payable to it by the Sponsors whose clients invest in the Portfolio. The trustees also noted that the Adviser is compensated by the Sponsors whose clients invest in the Portfolio. The trustees understood that the Adviser might derive reputational and other benefits from its association with the Portfolio.
Investment Results
In addition to the information reviewed by the trustees in connection with the meeting, the trustees receive detailed performance information for the Portfolio at each regular Board meeting during the year. At the November 2010 meeting, the trustees reviewed information prepared by Lipper showing the performance of the Portfolio as compared with that of funds selected by Lipper (the “Performance Universe”), and information prepared by the Adviser showing the Portfolio’s performance as compared with the Barclays Capital U.S. Credit Index (the “Index”), in each case for the 1- and 3-year periods ended July 31, 2010, and (in the case of comparisons with the Index) the since inception period (December 2006 inception). The directors noted that the Portfolio was in the 1st quintile of the Performance Universe for the 1-year period, and in the 2nd quintile of the Performance Universe for the 3-year period. The Portfolio outperformed the Index in the 1- and 3-year and the since inception periods. Based on their review, the directors concluded that the Portfolio’s relative performance over time had been satisfactory.
Advisory Fees and Other Expenses
The trustees considered the advisory fee rate paid by the Portfolio to the Adviser (zero) and information provided by Lipper showing the fees paid by other fund families used in wrap fee programs similar to that of the Portfolio as well as expense ratio information. The trustees recognized that it is difficult to make comparisons of advisory fees because there are variations in the services that are included in the fees paid by other funds.
The trustees reviewed the fee arrangements between the Adviser and each of the current Sponsors and noted that such fees were negotiated on an arm’s length basis and were within the range of fees paid by wrap fee sponsors to other advisers of similar funds. The trustees noted that although the Adviser’s fee arrangements with the Sponsors vary, a portion of such fees (less the expenses of the Portfolio to be paid by the Adviser) may reasonably be viewed as compensating the Adviser for advisory services it provides to the Portfolio (the “implied fee”) and that the Adviser believes that while the Sponsors pay the Adviser different fee rates, the rate of fee attributable to portfolio management at the
| ALLIANCEBERNSTEIN CORPORATE INCOME SHARES • | 41 |
Portfolio level is the same for all Sponsors. The trustees also considered the fee rate schedules used by other registered investment companies that invest in fixed income securities that are advised by the Adviser. Based on their review, the trustees concluded that the advisory arrangements for the Portfolio, including the zero fee aspect of the Advisory Agreement with the Adviser, were satisfactory.
The Adviser informed the trustees that there are no institutional products managed by it which have an investment style substantially similar to that of the Portfolio. The trustees reviewed the relevant fee information from the Adviser’s Form ADV. The trustees recognized that comparisons of the institutional fee rate with the portion of the implied fee rate attributable to portfolio management were not practicable. The Adviser reviewed with the trustees the significantly greater scope of the services it provides the Portfolio relative to institutional clients. The Adviser also noted that because mutual funds are constantly issuing and redeeming shares, they are more difficult to manage than an institutional account, where the assets tend to be relatively stable. In light of the substantial differences in services rendered by the Adviser to institutional clients as compared to funds such as the Portfolio, and the unusual fee structure for the other portfolios of the Fund and the Portfolio, the trustees considered these fee comparisons inapt and did not place significant weight on them in their deliberations.
Since the Portfolio does not bear ordinary expenses, the trustees did not consider comparative expense information.
Economies of Scale
Since the Advisory Agreement does not provide for any compensation to be paid to the Adviser by the Portfolio and the Portfolio’s expense ratio is zero, the trustees did not consider the extent to which fee levels in the Advisory Agreement reflect economies of scale. They did note, however, that the fee payable to the Adviser by each of the current Sponsors declines at a breakpoint based on total assets managed by the Adviser for the Sponsors.
| 42 | • ALLIANCEBERNSTEIN CORPORATE INCOME SHARES |
THE FOLLOWING IS NOT PART OF THE SHAREHOLDER REPORT OR THE FINANCIAL STATEMENTS.
SUMMARY OF SENIOR OFFICER’S EVALUATION OF INVESTMENT ADVISORY AGREEMENT1
The following is a summary of the evaluation of the Investment Advisory Agreement between AllianceBernstein L.P. (the “Adviser”) and The AllianceBernstein Corporate Shares (the “Trust”) with respect to AllianceBernstein Corporate Income Shares (the “Portfolio”).2 The evaluation of the Investment Advisory Agreement was prepared by Philip L. Kirstein, the Senior Officer of the Trust, for the Trustees of the Trust, as required by the September 1, 2004 Assurance of Discontinuance (“AoD”) between the Adviser and the New York State Attorney General (the “NYAG”). The Senior Officer’s evaluation of the Investment Advisory Agreement is not meant to diminish the responsibility or authority of the Board of Trustees to perform its duties pursuant to Section 15 of the Investment Company Act of 1940 Act (the “40 Act”) and applicable state law. The purpose of the summary is to provide shareholders with a synopsis of the independent evaluation of the reasonableness of the advisory fees proposed to be paid by the Portfolio which was provided to the Trustees in connection with their review of the proposed approval of the continuance of the Investment Advisory Agreement.
The Senior Officer’s evaluation considered the following factors:
| 1. | Advisory fees charged to institutional and other clients of the Adviser for like services; |
| 2. | Advisory fees charged by other mutual fund companies for like services; |
| 3. | Costs to the Adviser and its affiliates of supplying services pursuant to the advisory agreement, excluding any intra-corporate profit; |
| 4. | Profit margins of the Adviser and its affiliates from supplying such services; |
| 5. | Possible economies of scale as the Portfolio grows larger; and |
| 6. | Nature and quality of the Adviser’s services including the performance of the Portfolio. |
These factors, with the exception of the first factor, are generally referred to as the “Gartenberg factors,” which were articulated by the United States Court of Appeals for the Second Circuit in 1982. The first factor is an additional factor required to be considered by the AoD. The Supreme Court recently held the Gartenberg decision was correct in its basic formulation of what Section 36(b) of
| 1 | It should be noted that the Senior Officer’s fee evaluation was completed on October 21, 2010 and discussed with the Board of Trustees on November 2-4, 2010. |
| 2 | Future references to the Portfolio do not include “AllianceBernstein.” |
| ALLIANCEBERNSTEIN CORPORATE INCOME SHARES • | 43 |
the 40 Act requires: to face liability under Section 36(b), “an investment adviser must charge a fee that is so disproportionately large that it bears no reasonable relationship to the services rendered and could not have been the product of arms length bargaining.” Jones v. Harris Associates L.P., (No. 08-586), slip op. at 9, 559 U.S. 2010. In the Jones decision, the Court stated the Gartenberg approach fully incorporates the correct understanding of fiduciary duty within the context of Section 36(b) and noted with approval that “Gartenberg insists that all relevant circumstances be taken into account” and “uses the range of fees that might result from arms-length bargaining as the benchmark for reviewing challenged fees.”3
PORTFOLIO’S EXEMPTION FROM ADVISORY FEES OR EXPENSES
The Adviser proposed that the Portfolio pays no advisory fee to the Adviser for receiving the services to be provided pursuant to the Investment Advisory Agreement. The Portfolio is designed to serve the needs of the Adviser’s separately managed account (“SMA”) clients.4 Since SMA clients pay their wrap program provider a unitary fee for managing all investments of their portfolio, the Portfolio will not pay an advisory fee. The Adviser will also reimburse the Portfolio for all of its other operating expenses, except certain extraordinary expenses, taxes, brokerage costs and the interest on borrowed money.
The Portfolio’s net assets on September 30, 2010 are set forth below:
| Portfolio | 09/30/10 Net Assets ($MM) | |||
| Corporate Income Shares | $ | 32.2 | ||
The Portfolio, which offers only one no-load class of shares, is distributed through its principal underwriter, AllianceBernstein Investments, Inc. (“ABI”). Since the Portfolio is reimbursed by the Adviser for its operating expenses, the Portfolio does not have a distribution plan pursuant to Rule 12b-1 under the 40 Act. Set forth below are the Portfolio’s annual operating expenses in percentages:
| Annual Operating Expenses | % | |||
| Advisory Fees5 | 0.35 | % | ||
| Distribution Fees & Other Exp. | 0.00 | % | ||
| Fee Waiver / Reimbursements | -0.35 | % | ||
| Net Expenses | 0.00 | % | ||
| 3 | Jones v. Harris at 11. |
| 4 | The SMA clients currently employ the Adviser as one of several investment managers, and compensate the Adviser on the basis of all SMA assets managed, which would include assets of Corporate Income Shares. The Adviser’s current agreements with the SMA clients provide for payments to the Adviser. |
| 5 | This amount reflects the portion of the wrap fee the expected initial client is expected to pay to the Adviser for managing and bearing all expenses of the Portfolio. |
| 44 | • ALLIANCEBERNSTEIN CORPORATE INCOME SHARES |
| I. | ADVISORY FEES CHARGED TO INSTITUTIONAL AND OTHER CLIENTS |
The advisory fees charged to investment companies which the Adviser manages and sponsors are normally higher than those charged to similar sized institutional accounts, including pension plans and sub-advised investment companies. The fee differential reflects, among other things, different services provided to such clients, and different liabilities assumed. Services provided by the Adviser to the Portfolio that are not provided to non-investment company clients include providing office space and personnel to serve as Fund Officers, who among other responsibilities make the certifications required under the Sarbanes-Oxley Act of 2002, and coordinating with and monitoring the Portfolio’s third party service providers such as Fund counsel, auditors, custodians, transfer agents and pricing services. The accounting, administrative, legal and compliance requirements for investment companies are more costly than those for institutional client assets due to the greater complexities and time required for investment companies. The Adviser also believes that it incurs substantial entrepreneurial risk when offering a new mutual fund since establishing a new mutual fund requires a large upfront investment and it may take a long time for the fund to achieve profitability since the fund must be priced to scale from inception in order to be competitive and assets are acquired one account at a time. In addition, managing the cash flow of an investment company may be more difficult than that of a stable pool of assets, such as an institutional account with little cash movement in either direction, particularly, if the fund is in net redemption and the Adviser is frequently forced to sell securities to raise cash for redemptions. However, managing a fund with positive cash flow may be easier at times than managing a stable pool of assets. Finally, in recent years, investment advisers have been sued by institutional clients and have suffered reputational damage both by the attendant publicity and outcomes other than complete victories. Accordingly, the legal and reputational risks associated with institutional accounts are greater than previously thought, although arguably still not equal to those related to the mutual fund industry.
Notwithstanding the Adviser’s view that managing an investment company is not comparable to managing other institutional accounts because the services provided are different, the Supreme Court has indicated consideration should be given to the advisory fees charged to institutional accounts with a similar investment style as the Portfolio.6 However, with respect to the Portfolio, the Adviser represented that there is no institutional product in the Adviser’s Form ADV that has a similar investment style as the Portfolio.
The Adviser represented that it does not sub-advise any registered investment company with a substantially similar investment style as the Portfolio.
| 6 | It should be noted that the Supreme Court stated that “courts may give such comparisons the weight that they merit in light of the similarities and differences between the services that the clients in question require, but the courts must be wary of inapt comparisons.” Among the significant differences the Supreme Court noted that may exist between services provided to mutual funds and institutional accounts are “higher marketing costs.” Jones v. Harris at 13. |
| ALLIANCEBERNSTEIN CORPORATE INCOME SHARES • | 45 |
| II. | MANAGEMENT FEES CHARGED BY OTHER MUTUAL FUND COMPANIES FOR LIKE SERVICES. |
Lipper, Inc., an analytical service that is not affiliated with the Adviser, compared the fees charged to the Funds with fees charged to other investment companies for similar services by other investment advisers.7,8 Each peer selected by Lipper had a similar fee arrangement as the Portfolio, which is to say that with respect to the Portfolio’s peers, all fund expenses, including management fees,9 were reimbursed by the investment adviser.
As previously noted, the Portfolio does not pay an advisory fee to the Adviser since its SMA clients pay their wrap program provider a unitary fee for managing all investments of their portfolios. In addition, the Adviser reimburses the Fund for all of its operating expenses, except certain extraordinary expenses, taxes, brokerage costs and interest on borrowed money.
| III. | COSTS TO THE ADVISER AND ITS AFFILIATES OF SUPPLYING SERVICES PURSUANT TO THE ADVISORY FEE ARRANGEMENT, EXCLUDING ANY INTRA-CORPORATE PROFIT. |
The Adviser utilizes two profitability reporting systems, which operate independently but are aligned with each other, to estimate the Adviser’s profitability in connection with investment advisory services provided to the Portfolio. The Senior Officer has retained a consultant to provide independent advice regarding the alignment of the two profitability systems as well as the methodologies and allocations utilized by both profitability systems. See Section IV for additional discussion.
| IV. | PROFIT MARGINS OF THE ADVISER AND ITS AFFILIATES FOR SUPPLYING SUCH SERVICES. |
The profitability information for the Portfolio, prepared by the Adviser for the Board of Trustees, was reviewed by the Senior Officer and the consultant. The Portfolio does not pay an advisory fee to the Adviser. However, the Adviser does profit indirectly through the advisory fees that it receives from SMA clients that invest in the Portfolio. The profitability of the Portfolio, which decreased in
| 7 | It should be noted that the Supreme Court stated, “Courts should not rely too heavily on comparisons with fees charged to mutual funds by other advisers. These comparisons are problematic because those fees, like those challenged, may not be the product of negotiations conducted at arms length.” Jones v. Harris at 14. |
| 8 | Only zero fee no-load funds that participated in a wrap fee program were considered for inclusion in the Fund’s EG, regardless of the Lipper investment classification/objective of the Funds’ peers. The Fund’s EG includes the Fund, which is classified by Lipper as “A-rated Corporate Debt”, two U.S. Mortgage funds, two General Bond funds, two Global Income funds and one TIPS fund. |
| 9 | “Management Fee” is the fee attributable to the management and bearing of expenses of the funds (not the management of the wrap fee program). In each case the advisory contract provides for an advisory or management fee of zero. |
| 46 | • ALLIANCEBERNSTEIN CORPORATE INCOME SHARES |
2009 relative to 2008, was calculated using a weighted average of the profitability of the SMA clients, in addition to any fund specific revenue or expense item.
AllianceBernstein Investments, Inc. (“ABI”) and AllianceBernstein Investor Services, Inc. (“ABIS”), affiliates of the Adviser, serve as the Portfolio’s underwriter and transfer agent, respectively. The courts have referred to this type of business relationships as “fall-out benefits” to the Adviser and indicated that such benefits should be factored into the evaluation of the total relationship between the Portfolio and the Adviser. Neither case law nor common business practice precludes the Adviser’s affiliates from earning a reasonable profit on this type of relationship provided the affiliates’ charges and services are competitive. However, neither ABI nor ABIS receive a fee for serving as the Portfolio’s underwriter and transfer agent.
| V. | POSSIBLE ECONOMIES OF SCALE |
The Adviser has indicated that economies of scale are being shared with shareholders through fee structures,10 subsidies and enhancement to services. Based on some of the professional literature that has considered economies of scale in the mutual fund industry, it is thought that to the extent economies of scale exist, they may more often exist across a fund family as opposed to a specific fund. This is because the costs incurred by the Adviser, such as investment research or technology for trading or compliance systems, can be spread across a greater asset base as the fund family increases in size. It is also possible that as the level of services required to operate a successful investment company has increased over time, and advisory firms have made such investments in their business to provide services, there may be a sharing of economies of scale without a reduction in advisory fees.
An independent consultant, retained by the Senior Officer, provided the Board of Trustees an update of the Deli11 study on advisory fees and various fund characteristics. The independent consultant first reiterated the results of his previous two dimensional comparison analysis (fund size and family size) with the Board of Trustees.12 The independent consultant then discussed the results of the regression model that was utilized to study the effects of various factors on advisory fees. The regression model output indicated that the bulk of the variation in
| 10 | Fee structures include fee reductions, pricing at scale and breakpoints in advisory fee schedules. |
| 11 | The Deli study was originally published in 2002 based on 1997 data. |
| 12 | The two dimensional analysis showed patterns of lower advisory fees for funds with larger asset sizes and funds from larger family sizes compared to funds with smaller asset sizes and funds from smaller family sizes, which according to the independent consultant is indicative of a sharing of economies of scale and scope. However, in less liquid and active markets, such is not the case, as the empirical analysis showed potential for diseconomies of scale in those markets. The empirical analysis also showed diminishing economies of scale and scope as funds surpassed a certain high level of assets. |
| ALLIANCEBERNSTEIN CORPORATE INCOME SHARES • | 47 |
fees predicted were explained by various factors, but substantially by fund assets under management (“AUM”), family AUM, index fund indicator and investment style. The independent consultant also compared the advisory fees of the AllianceBernstein Mutual Funds to similar funds managed by 19 other large asset managers, regardless of fund size and the large asset manager’s proportion of mutual fund assets to non-mutual fund assets.
| VI. | NATURE AND QUALITY OF THE ADVISER’S SERVICES INCLUDING THE PERFORMANCE OF THE PORTFOLIO. |
With assets under management of $484 billion as of September 30, 2010, the Adviser has the investment experience to manage the portfolio assets of the Portfolio and provide non-investment services (described in Section II) to the Portfolio.
The information below, prepared by Lipper, shows the 1, 3 year gross performance return of the Portfolio relative to its Lipper Performance Universe (“PU”)13 for the period ended July 31, 2010:
| Portfolio Return (%) | PU Median (%) | PU Rank | ||||||||||
1 year | 18.88 | 10.81 | 1/14 | |||||||||
3 year | 9.12 | 9.06 | 3/14 | |||||||||
Set forth below are the 1, 3 year and since inception net performance returns of the Portfolio (in bold) and its benchmark:14
| Periods Ending July 31, 2010 Annualized Net Performance (%) | ||||||||||||
1 Year (%) | 3 Year (%) | Since (%) | ||||||||||
| Corporate Income Shares | 18.90 | 9.12 | 7.45 | |||||||||
| Barclays Capital U.S. Credit Index | 12.60 | 7.97 | 6.60 | |||||||||
| Inception Date: December 11, 2006 | ||||||||||||
CONCLUSION:
Based on the factors discussed above the Senior Officer’s conclusion is that the Investment Advisory Agreement for the Portfolio is reasonable and within the range of what would have been negotiated at arms-length in light of all the surrounding circumstances. This conclusion with respect to the Portfolio is based on an evaluation of all of these factors and no single factor was dispositive.
Dated: November 22, 2010
| 13 | The Portfolio’s PU includes peers with the same Lipper investment classification/objective and load type as the Portfolio. |
| 14 | The Adviser provided Portfolio and benchmark performance return information for periods through July 31, 2010. |
| 48 | • ALLIANCEBERNSTEIN CORPORATE INCOME SHARES |
THIS PAGE IS NOT PART OF THE SHAREHOLDER REPORT OR THE FINANCIAL STATEMENTS
ALLIANCEBERNSTEIN FAMILY OF FUNDS
Wealth Strategies Funds
Balanced Wealth Strategy
Conservative Wealth Strategy
Wealth Appreciation Strategy
Tax-Managed Balanced Wealth Strategy
Tax-Managed Conservative Wealth Strategy
Tax-Managed Wealth Appreciation Strategy
Blended Style Funds
International Portfolio
Tax-Managed International Portfolio
U.S. Large Cap Portfolio
Growth Funds
Domestic
Growth Fund
Large Cap Growth Fund
Small Cap Growth Portfolio
Small/Mid Cap Growth Fund
U.S. Strategic Research Portfolio
Global & International
Global Growth Fund
Global Thematic Growth Fund
Greater China ’97 Fund
International Discovery Equity Portfolio
International Growth Fund
Value Funds
Domestic
Core Opportunities Fund
Equity Income Fund*
Growth & Income Fund
Small/Mid Cap Value Fund
Value Fund
Global & International
Global Real Estate Investment Fund
Global Value Fund
International Value Fund
Taxable Bond Funds
Bond Inflation Strategy
Global Bond Fund
High Income Fund
Intermediate Bond Portfolio
Short Duration Portfolio
Unconstrained Bond Fund*
Municipal Bond Funds
Arizona California High Income Massachusetts Michigan Minnesota Municipal Bond Inflation Strategy | National New Jersey New York Ohio Pennsylvania Virginia |
Intermediate Municipal Bond Funds
Intermediate California
Intermediate Diversified
Intermediate New York
Closed-End Funds
Alliance California Municipal Income Fund
Alliance New York Municipal Income Fund
AllianceBernstein Global High Income Fund
AllianceBernstein Income Fund
AllianceBernstein National Municipal Income Fund
The Ibero-America Fund
Alternatives
Market Neutral Strategy-Global
Market Neutral Strategy-U.S.
Real-Asset Strategy*
Balanced
Balanced Shares
Retirement Strategies Funds
2000 Retirement Strategy | 2020 Retirement Strategy | 2040 Retirement Strategy | ||
2005 Retirement Strategy | 2025 Retirement Strategy | 2045 Retirement Strategy | ||
2010 Retirement Strategy | 2030 Retirement Strategy | 2050 Retirement Strategy | ||
2015 Retirement Strategy | 2035 Retirement Strategy | 2055 Retirement Strategy |
We also offer Exchange Reserves,** which serves as the money market fund exchange vehicle for the AllianceBernstein mutual funds.
You should consider the investment objectives, risks, charges and expenses of any AllianceBernstein fund/portfolio carefully before investing. For free copies of our prospectuses, which contain this and other information, visit us online at www.alliancebernstein.com or contact your financial advisor. Please read the prospectus carefully before investing.
| * | Prior to August 31, 2010, Equity Income Fund was named Utility Income Fund. Prior to September 27, 2010, Real-Asset Strategy was named Multi-Asset Inflation Strategy. Prior to February 3, 2011, Unconstrained Bond Fund was named Diversified Yield Fund. |
| ** | An investment in the Fund is not a deposit in a bank and is not insured or guaranteed by the Federal Deposit Insurance Corporation or any other government agency. Although the Fund seeks to preserve the value of your investment at $1.00 per share, it is possible to lose money by investing in the Fund. |
| ALLIANCEBERNSTEIN CORPORATE INCOME SHARES • | 49 |
Alliancebernstein Family of Funds
NOTES
| 50 | • ALLIANCEBERNSTEIN CORPORATE INCOME SHARES |
NOTES
| ALLIANCEBERNSTEIN CORPORATE INCOME SHARES • | 51 |
NOTES
| 52 | • ALLIANCEBERNSTEIN CORPORATE INCOME SHARES |
ALLIANCEBERNSTEIN CORPORATE INCOME SHARES
1345 Avenue of the Americas
New York, NY 10105
800.221.5672
| CIS-0151-0411 |  | |
ANNUAL REPORT
AllianceBernstein
Taxable Multi-Sector Income Shares
April 30, 2011
Annual Report

Investment Products Offered
| • | Are Not FDIC Insured |
| • | May Lose Value |
| • | Are Not Bank Guaranteed |
The investment return and principal value of an investment in the Fund will fluctuate as the prices of the individual securities in which it invests fluctuate, so that your shares, when redeemed, may be worth more or less than their original cost. You should consider the investment objectives, risks, charges and expenses of the Fund carefully before investing. For a free copy of the Fund’s prospectus, which contains this and other information, visit our website at www.alliancebernstein.com or call your financial advisor or AllianceBernstein® at (800) 227-4618. Please read the prospectus carefully before you invest.
You may obtain performance information current to the most recent month-end by visiting www.alliancebernstein.com.
This shareholder report must be preceded or accompanied by the Fund’s prospectus for individuals who are not current shareholders of the Fund.
You may obtain a description of the Fund’s proxy voting policies and procedures, and information regarding how the Fund voted proxies relating to portfolio securities during the most recent 12-month period ended June 30, without charge. Simply visit AllianceBernstein’s website at www.alliancebernstein.com, or go to the Securities and Exchange Commission’s (the “Commission”) website at www.sec.gov, or call AllianceBernstein at (800) 227-4618.
The Fund files its complete schedule of portfolio holdings with the Commission for the first and third quarters of each fiscal year on Form N-Q. The Fund’s Forms N-Q are available on the Commission’s website at www.sec.gov. The Fund’s Forms N-Q may also be reviewed and copied at the Commission’s Public Reference Room in Washington, DC; information on the operation of the Public Reference Room may be obtained by calling (800) SEC-0330. AllianceBernstein publishes full portfolio holdings for the Fund monthly at www.alliancebernstein.com.
AllianceBernstein Investments, Inc. (ABI) is the distributor of the AllianceBernstein family of mutual funds. ABI is a member of FINRA and is an affiliate of AllianceBernstein L.P., the manager of the funds.
AllianceBernstein® and the AB Logo are registered trademarks and service marks used by permission of the owner, AllianceBernstein L.P.
June 23, 2011
Annual Report
This report provides management’s discussion of fund performance for AllianceBernstein Taxable Multi-Sector Income Shares (the “Fund”) for the period from September 15, 2010 (commencement of operations) to April 30, 2011. Please note, shares of this Fund are offered exclusively through registered investment advisers approved by AllianceBernstein L.P. (the “Adviser”).
Investment Objective and Policies
The investment objective of the Fund is to generate income and price appreciation. The Fund invests, under normal circumstances, at least 80% of its net assets in fixed-income securities. The Fund may invest in a broad range of securities in both developed and emerging markets. The Fund may invest across all fixed-income sectors, including corporate and U.S. and non-U.S. government securities. The Fund may invest up to 50% of its assets in below investment grade bonds (“junk bonds”). The Fund expects to invest in readily marketable fixed-income securities with a range of maturities from short- to long-term.
The Fund may invest without limit in U.S. dollar-denominated foreign fixed-income securities and may invest up to 50% of its assets in non-U.S. dollar-denominated foreign fixed-income securities. These investments may include, in each case, developed and emerging market debt securities.
The Fund may invest in mortgage-related and other asset-backed securities, loan participations, inflation-
protected securities, structured securities, variable, floating, and inverse floating rate instruments and preferred stock, and may use other investment techniques. The Fund may use leverage for investment purposes. The Fund intends, among other things, to enter into transactions such as reverse repurchase agreements, forward contracts, and dollar rolls. The Fund may invest, without limit, in derivatives, such as options, futures, forwards, or swap agreements. Currencies can have a dramatic effect on returns of non-U.S. dollar-denominated fixed-income securities, significantly adding to returns in some years and greatly diminishing them in others. The Adviser evaluates currency and fixed-income positions separately and may seek to hedge the currency exposure resulting from the Fund’s fixed-income securities positions when it finds the currency exposure unattractive. To hedge a portion of its currency risk, the Fund may from time to time invest in currency-related derivatives, including forward currency exchange contracts, futures, options on futures, swaps and options. The Adviser may also seek investment opportunities by taking long or short positions in currencies through the use of currency-related derivatives.
The Adviser selects securities for purchase or sale based on its assessment of the securities’ risk and return characteristics as well as the securities’ impact on the overall risk and return characteristics of the Fund. In making this assessment, the Adviser takes into account various factors including the credit quality
| ALLIANCEBERNSTEIN TAXABLE MULTI-SECTOR INCOME SHARES • | 1 |
and sensitivity to interest rates of the securities under consideration and of the Fund’s other holdings.
Investment Results
The table on page 5 shows the Fund’s performance compared to its benchmark, the Barclays Capital U.S. Aggregate ex Government Index, for the six-month period ended April 30, 2011, and the period since inception (September 15, 2010) through April 30, 2011.
The Fund outperformed its benchmark for both the six-month and since inception periods. For both periods, an overweight to commercial mortgage-backed securities (CMBS), investment-grade corporates and exposure to high yield all contributed positively. An underweight to mortgage-backed securities was also positive. Detracting for both periods was the Fund’s modest overweight to the non-corporate part of the credit market (sovereigns and quasi-sovereigns). The Fund’s overall yield curve structure, specifically an overweight in five- to 10-year maturities, also detracted for both periods as yields rose most in that area of the curve.
The Fund did not use derivatives during the six-month or since inception periods ended April 30, 2011.
Market Review
Despite a number of shocks during the period—which included rising social unrest in North Africa and the Middle East, and the natural disaster
in Japan—the global economic expansion remained intact, and risk assets performed well. Positive economic momentum meant that government bond yields rose, stocks rallied and the credit markets followed.
For the six-month period ended April 30, 2011, nongovernment securities outperformed, led by U.S. high yield corporates and CMBS. High yield securities performed well as strong revenue and earnings growth continued to help issuers deleverage, and default rates continued to fall. CMBS performed well, thanks to positive technicals, strong investor appetite for yield and signs of a stabilization of commercial real estate prices in core markets. Yield spreads on both of these sectors tightened significantly during the period. Mortgage-backed securities and investment grade corporates also outperformed governments however to a lesser extent. Government securities posted the weakest returns with agencies and U.S. Treasuries in negative territory, as economic growth continued to solidify despite recent world events, and investors became less risk averse.
During the six-month reporting period, the Fund’s investment management team, the Core Fixed-Income Team (the “Team”) continued to focus risk-taking in CMBS, investment grade corporates and high yield corporates with an underweight to mortgage-backed securities. Corporate securities continued to offer relatively attractive
| 2 | • ALLIANCEBERNSTEIN TAXABLE MULTI-SECTOR INCOME SHARES |
valuations along with solid fundamentals. Business confidence rebounded as economic growth broadened, and corporations, particularly in the U.S., maintained strong balance sheets and ample cash
flows to cover their debts. The Fund’s CMBS exposure was concentrated in select vintages of super-senior CMBS, which the Team believes remain attractively valued.
| ALLIANCEBERNSTEIN TAXABLE MULTI-SECTOR INCOME SHARES • | 3 |
HISTORICAL PERFORMANCE
An Important Note About the Value of Historical Performance
The performance shown on the following pages represents past performance and does not guarantee future results. Current performance may be lower or higher than the performance information shown. You may obtain performance information current to the most recent month-end by calling (800) 227-4618. The investment return and principal value of an investment in the Fund will fluctuate, so that your shares, when redeemed, may be worth more or less than their original cost.
Investors should consider the investment objectives, risks, charges and expenses of the Fund carefully before investing. For copies of our prospectus or summary prospectus, which contain this and other information, visit us online at www.alliancebernstein.com or contact your AllianceBernstein Investments representative. Please read the prospectus and/or summary prospectus carefully before investing.
Benchmark Disclosure
The unmanaged Barclays Capital U.S. Aggregate ex-Government Index does not reflect fees and expenses associated with the active management of a fund portfolio. The Barclays Capital U.S. Aggregate ex Government Index represents the performance of securities within the U.S. investment grade fixed rate bond market, with index components for corporate securities, mortgage pass-through securities, asset-backed securities, and commercial mortgage backed securities. An investor cannot invest directly in an index, and its results are not indicative of the performance for any specific investment, including the Fund.
A Word About Risk
As interest rates rise, bond prices fall and vice versa—long-term securities tend to rise and fall more than short-term securities. A bond’s credit rating reflects the issuer’s ability to make timely payments of interest or principal—the lower the rating, the higher the risk of default. If the issuer’s financial strength deteriorates, the issuer’s rating may be lowered and the bond’s value may decline. Investments in fixed-income securities with lower ratings (commonly known as “junk bonds”) tend to have a higher probability that an issuer will default or fail to meet its payment obligations. Prices for goods and services tend to rise over time, which may erode the purchasing power of investments. Non-U.S. securities may be more volatile because of political, regulatory, market and economic uncertainties associated with such securities. Fluctuations in currency exchange rates may negatively affect the value of the investment or reduce returns. These risks are magnified in emerging or developing markets. Investments in emerging market countries may have more risk because the markets are less developed and less liquid as well as being subject to increased economic, political, regulatory or other uncertainties. The value of mortgage-related or asset-backed securities may be particularly sensitive to changes in prevailing interest rates. Investing in derivative instruments such as options, futures, forwards or swaps can be riskier than traditional investments, and may be more volatile, especially in a down market. Trying to enhance investment returns by borrowing money or using other leverage tools—magnify both gains and losses, resulting in greater volatility. These risks are fully discussed in the Fund’s prospectus.
(Historical Performance continued on next page)
| 4 | • ALLIANCEBERNSTEIN TAXABLE MULTI-SECTOR INCOME SHARES |
Historical Performance
HISTORICAL PERFORMANCE
(continued from previous page)
THE FUND VS. ITS BENCHMARK PERIODS ENDED APRIL 30, 2011 | NAV Returns | |||||||||||
| 6 Months | Since Inception* | |||||||||||
AllianceBernstein Taxable Multi-Sector Income Shares | 2.57% | 3.31% | ||||||||||
Barclays Capital US Aggregate ex Government Index | 0.94% | 2.11% | ||||||||||
| * | Inception date: 9/15/10. |
GROWTH OF A $10,000 INVESTMENT IN THE FUND
9/15/10* – 4/30/11
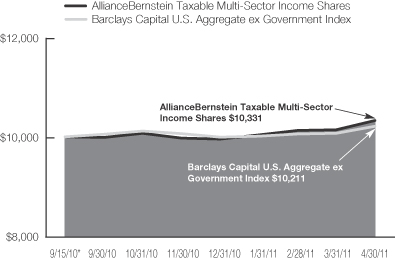
| * | Inception date: 9/15/10. |
This chart illustrates the total value of an assumed $10,000 investment in AllianceBernstein Taxable Multi-Sector Income Shares (from 9/15/10 to 4/30/11) as compared to the performance of the Fund’s benchmark.
See Historical Performance and Benchmark disclosures on previous page.
(Historical Performance continued on next page)
| ALLIANCEBERNSTEIN TAXABLE MULTI-SECTOR INCOME SHARES • | 5 |
Historical Performance
HISTORICAL PERFORMANCE
(continued from previous page)
| AVERAGE ANNUAL RETURNS AS OF APRIL 30, 2011 | ||||
| NAV Returns | ||||
6 Months | 2.57 | % | ||
Since Inception* | 3.31 | % | ||
SEC AVERAGE ANNUAL RETURNS (WITH ANY APPLICABLE SALES CHARGES) AS OF THE MOST RECENT CALENDAR QUARTER-END (MARCH 31, 2011) | ||||
| SEC Returns | ||||
6 Months | 1.52 | % | ||
Since Inception* | 1.43 | % | ||
The prospectus fee table shows the fees and the Total Fund Operating Expenses of the Fund as 0.00% because the Adviser does not charge any fees or expenses and reimburses, or pays for, Fund operating expenses. Participants in a wrap fee program eligible to invest in the Fund pay fees to the program sponsor and should review the wrap program brochure provided by the sponsor for a discussion of fees and expenses charged.
| * | Inception date: 9/15/10 |
See Historical Performance disclosures on page 4.
| 6 | • ALLIANCEBERNSTEIN TAXABLE MULTI-SECTOR INCOME SHARES |
Historical Performance
FUND EXPENSES
(unaudited)
As a shareholder of the Fund, you may incur various ongoing non-operating and extraordinary costs. This example is intended to help you understand your ongoing costs (in dollars) of investing in the Fund and to compare these costs with the ongoing costs of investing in other mutual funds.
The Example is based on an investment of $1,000 invested at the beginning of the period and held for the entire period as indicated below.
Actual Expenses
The table below provides information about actual account values and actual expenses. You may use the information in this line, together with the amount you invested, to estimate the expenses that you paid over the period. Simply divide your account value by $1,000 (for example, an $8,600 account value divided by $1,000 = 8.6), then multiply the result by the number in the first line under the heading entitled “Expenses Paid During Period” to estimate the expenses you paid on your account during this period.
Hypothetical Example for Comparison Purposes
The table below provides information about hypothetical account values and hypothetical expenses based on the Fund’s actual expense ratio and an assumed annual rate of return of 5% before expenses, which is not the Fund’s actual return. The hypothetical account values and expenses may not be used to estimate the actual ending account balance or expenses you paid for the period. You may use this information to compare the ongoing costs of investing in the Fund and other funds by comparing this 5% hypothetical example with the 5% hypothetical examples that appear in the shareholder reports of other funds.
Please note that the expenses shown in the table are meant to highlight your ongoing costs only and do not reflect any transactional costs, such as sales charges (loads), or contingent deferred sales charges on redemptions. Therefore, the hypothetical example is useful in comparing ongoing costs only, and will not help you determine the relative total costs of owning different funds. In addition, if these transactional costs were included, your costs would have been higher.
| Beginning Account Value November 1, 2010 | Ending Account Value April 30, 2011 | Expenses Paid During Period* | ||||||||||||||||||||||
| Actual | Hypothetical | Actual | Hypothetical** | Actual | Hypothetical | |||||||||||||||||||
| Class A | $ | 1,000 | $ | 1,000 | $ | 1,025.72 | $ | 1,024.79 | $ | 0.00 | $ | 0.00 | ||||||||||||
| * | Expenses are equal to the Fund’s annualized expense ratio of 0.00%. The Fund’s operating expenses are borne by the Adviser or its affiliates. |
| ** | Assumes 5% return before expenses. |
| ALLIANCEBERNSTEIN TAXABLE MULTI-SECTOR INCOME SHARES • | 7 |
Fund Expenses
PORTFOLIO SUMMARY
April 30, 2011 (unaudited)
PORTFOLIO STATISTICS
Net Assets ($mil): $10.1
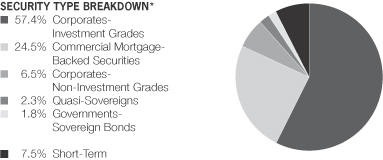
| * | All data are as of April 30, 2011. The Portfolio’s security type breakdown is expressed as a percentage of total investments and may vary over time. |
| 8 | • ALLIANCEBERNSTEIN TAXABLE MULTI-SECTOR INCOME SHARES |
Portfolio Summary
PORTFOLIO OF INVESTMENTS
April 30, 2011
| Principal Amount (000) | U.S. $ Value | |||||||
CORPORATES - INVESTMENT GRADES – 56.8% | ||||||||
Industrial – 25.5% | ||||||||
Basic – 5.2% | ||||||||
Alcoa, Inc. | $ | 15 | $ | 16,959 | ||||
AngloGold Ashanti Holdings PLC 5.375%, 4/15/20 | 25 | 25,711 | ||||||
ArcelorMittal | 75 | 81,146 | ||||||
ArcelorMittal USA, Inc. | 20 | 22,239 | ||||||
BHP Billiton Finance USA Ltd. | 35 | 41,835 | ||||||
Dow Chemical Co. (The) | 40 | 39,171 | ||||||
7.60%, 5/15/14 | 25 | 29,021 | ||||||
8.55%, 5/15/19 | 30 | 38,463 | ||||||
International Paper Co. | 20 | 21,924 | ||||||
7.50%, 8/15/21 | 20 | 23,872 | ||||||
7.95%, 6/15/18 | 30 | 36,468 | ||||||
Packaging Corp. of America | 15 | 16,112 | ||||||
PPG Industries, Inc. | 35 | 37,777 | ||||||
Rio Tinto Finance USA Ltd. | 45 | 52,780 | ||||||
Vale Canada Ltd. | 40 | 42,699 | ||||||
| 526,177 | ||||||||
Capital Goods – 1.8% | ||||||||
General Electric Co. | 55 | 60,897 | ||||||
Lafarge SA | 20 | 20,208 | ||||||
Owens Corning | 30 | 32,982 | ||||||
Republic Services, Inc. | 15 | 15,926 | ||||||
5.50%, 9/15/19 | 25 | 27,184 | ||||||
Tyco International Finance SA | 20 | 25,533 | ||||||
| 182,730 | ||||||||
Communications - Media – 3.1% | ||||||||
BSKYB Finance UK PLC | 25 | 27,784 | ||||||
| ALLIANCEBERNSTEIN TAXABLE MULTI-SECTOR INCOME SHARES • | 9 |
Portfolio of Investments
| Principal Amount (000) | U.S. $ Value | |||||||
CBS Corp. | $ | 25 | $ | 31,818 | ||||
Comcast Cable Communications Holdings, Inc. | 25 | 34,732 | ||||||
DirecTV Holdings LLC / DirecTV Financing Co., Inc. | 15 | 16,267 | ||||||
News America, Inc. | 10 | 10,676 | ||||||
9.25%, 2/01/13 | 25 | 28,408 | ||||||
Reed Elsevier Capital, Inc. | 20 | 25,526 | ||||||
RR Donnelley & Sons Co. | 10 | 10,442 | ||||||
7.625%, 6/15/20 | 45 | 47,486 | ||||||
Time Warner Cable, Inc. | 20 | 23,089 | ||||||
Time Warner Entertainment Co. LP | 45 | 56,944 | ||||||
| 313,172 | ||||||||
Communications - Telecommunications – 2.3% |
| |||||||
American Tower Corp. | 35 | 34,360 | ||||||
AT&T Corp. | 10 | 12,879 | ||||||
AT&T, Inc. | 19 | 19,125 | ||||||
Qwest Communications International, Inc. | 15 | 15,300 | ||||||
Qwest Corp. | 20 | 22,650 | ||||||
7.875%, 9/01/11 | 20 | 20,450 | ||||||
Telecom Italia Capital SA | 35 | 38,172 | ||||||
7.175%, 6/18/19 | 20 | 22,550 | ||||||
United States Cellular Corp. | 50 | 49,484 | ||||||
| 234,970 | ||||||||
Consumer Cyclical - Automotive – 0.9% | ||||||||
Daimler Finance North America LLC | 15 | 15,269 | ||||||
7.30%, 1/15/12 | 15 | 15,686 | ||||||
Harley-Davidson Funding Corp. | 30 | 32,510 | ||||||
Nissan Motor Acceptance Corp. | 30 | 31,541 | ||||||
| 95,006 | ||||||||
| 10 | • ALLIANCEBERNSTEIN TAXABLE MULTI-SECTOR INCOME SHARES |
Portfolio of Investments
| Principal Amount (000) | U.S. $ Value | |||||||
Consumer Cyclical - Entertainment – 1.4% | ||||||||
Time Warner, Inc. | $ | 45 | $ | 45,709 | ||||
Turner Broadcasting System, Inc. | 45 | 51,448 | ||||||
Viacom, Inc. | 40 | 44,200 | ||||||
| 141,357 | ||||||||
Consumer Cyclical - Other – 0.5% | ||||||||
Marriott International, Inc. Series J | 45 | 48,195 | ||||||
Consumer Cyclical - Retailers – 0.2% | ||||||||
CVS Caremark Corp. | 20 | 23,205 | ||||||
Consumer Non-Cyclical – 2.8% | ||||||||
Ahold Finance USA LLC | 45 | 50,521 | ||||||
Altria Group, Inc. | 30 | 39,944 | ||||||
Bunge Ltd. Finance Corp. | 40 | 42,486 | ||||||
5.875%, 5/15/13 | 30 | 32,282 | ||||||
Delhaize Group SA | 10 | 10,969 | ||||||
Diageo Capital PLC | 35 | 40,370 | ||||||
Fortune Brands, Inc. | 25 | 25,428 | ||||||
4.875%, 12/01/13 | 20 | 21,237 | ||||||
Kroger Co. (The) | 15 | 17,681 | ||||||
| 280,918 | ||||||||
Energy – 4.4% | ||||||||
Anadarko Petroleum Corp. | 65 | 72,604 | ||||||
6.45%, 9/15/36 | 10 | 10,304 | ||||||
Canadian Natural Resources Ltd. | 15 | 16,017 | ||||||
Hess Corp. | 15 | 18,908 | ||||||
8.125%, 2/15/19 | 10 | 12,657 | ||||||
Marathon Petroleum Corp. | 4 | 4,053 | ||||||
5.125%, 3/01/21(a) | 15 | 15,495 | ||||||
Nabors Industries, Inc. | 45 | 57,825 | ||||||
| ALLIANCEBERNSTEIN TAXABLE MULTI-SECTOR INCOME SHARES • | 11 |
Portfolio of Investments
| Principal Amount (000) | U.S. $ Value | |||||||
Noble Energy, Inc. | $ | 45 | $ | 57,390 | ||||
Noble Holding International Ltd. | 70 | 72,109 | ||||||
Valero Energy Corp. | 15 | 16,623 | ||||||
6.875%, 4/15/12 | 20 | 21,058 | ||||||
Weatherford International Ltd./Bermuda | 15 | 15,945 | ||||||
9.625%, 3/01/19 | 30 | 38,906 | ||||||
Williams Cos., Inc. (The) | 15 | 19,005 | ||||||
| 448,899 | ||||||||
Technology – 1.1% | ||||||||
Agilent Technologies, Inc. | 5 | 5,209 | ||||||
Computer Sciences Corp. | 25 | 26,725 | ||||||
Motorola Solutions, Inc. | 20 | 21,536 | ||||||
Xerox Corp. | 45 | 52,787 | ||||||
| 106,257 | ||||||||
Transportation - Airlines – 0.4% | ||||||||
Southwest Airlines Co. | 20 | 21,537 | ||||||
5.75%, 12/15/16 | 15 | 16,442 | ||||||
| 37,979 | ||||||||
Transportation - Railroads – 0.1% | ||||||||
Canadian Pacific Railway Co. | 10 | 11,521 | ||||||
Transportation - Services – 1.3% | ||||||||
Asciano Finance Ltd. | 70 | 68,424 | ||||||
Con-way, Inc. | 25 | 23,157 | ||||||
Ryder System, Inc. | 15 | 16,729 | ||||||
7.20%, 9/01/15 | 15 | 17,517 | ||||||
| 125,827 | ||||||||
| 2,576,213 | ||||||||
Financial Institutions – 24.8% | ||||||||
Banking – 13.8% | ||||||||
American Express Co. | 25 | 28,695 | ||||||
8.125%, 5/20/19 | 45 | 57,152 | ||||||
| 12 | • ALLIANCEBERNSTEIN TAXABLE MULTI-SECTOR INCOME SHARES |
Portfolio of Investments
| Principal Amount (000) | U.S. $ Value | |||||||
Bank of America Corp. | $ | 20 | $ | 20,991 | ||||
5.875%, 1/05/21 | 70 | 74,663 | ||||||
7.375%, 5/15/14 | 25 | 28,498 | ||||||
Series L | 60 | 63,903 | ||||||
BankAmerica Capital II | 20 | 20,525 | ||||||
Bear Stearns Cos. LLC (The) | 70 | 76,022 | ||||||
5.70%, 11/15/14 | 75 | 83,058 | ||||||
Citigroup, Inc. | 55 | 58,586 | ||||||
5.50%, 4/11/13 | 30 | 32,114 | ||||||
6.50%, 8/19/13 | 55 | 60,433 | ||||||
8.50%, 5/22/19 | 45 | 56,069 | ||||||
Compass Bank | 75 | 74,510 | ||||||
Countrywide Financial Corp. | 20 | 21,641 | ||||||
Goldman Sachs Group, Inc. (The) | 75 | 81,163 | ||||||
7.50%, 2/15/19 | 35 | 41,562 | ||||||
JPMorgan Chase & Co. | 30 | 29,635 | ||||||
M&I Marshall & Ilsley Bank | 30 | 31,980 | ||||||
Macquarie Group Ltd. | 45 | 45,897 | ||||||
Morgan Stanley | 100 | 102,157 | ||||||
National Capital Trust II | 10 | 10,018 | ||||||
Nationwide Building Society | 100 | 105,549 | ||||||
Royal Bank of Scotland PLC (The) | 25 | 26,473 | ||||||
Societe Generale | 100 | 100,898 | ||||||
Wachovia Corp. | 65 | 70,318 | ||||||
| 1,402,510 | ||||||||
Brokerage – 0.4% | ||||||||
Jefferies Group, Inc. | 14 | 14,088 | ||||||
6.875%, 4/15/21 | 20 | 21,925 | ||||||
| 36,013 | ||||||||
| ALLIANCEBERNSTEIN TAXABLE MULTI-SECTOR INCOME SHARES • | 13 |
Portfolio of Investments
| Principal Amount (000) | U.S. $ Value | |||||||
Finance – 2.0% | ||||||||
General Electric Capital Corp. | $ | 90 | $ | 95,949 | ||||
Series A | 20 | 20,439 | ||||||
HSBC Finance Corp. | 25 | 26,517 | ||||||
SLM Corp. | 55 | 57,444 | ||||||
| 200,349 | ||||||||
Insurance – 7.3% | ||||||||
Aegon NV | 5 | 5,281 | ||||||
Aetna, Inc. | 15 | 17,121 | ||||||
Aflac, Inc. | 5 | 5,072 | ||||||
Allied World Assurance Co. Holdings Ltd. | 10 | 11,364 | ||||||
Allstate Corp. (The) | 35 | 35,962 | ||||||
CIGNA Corp. | 15 | 15,810 | ||||||
Coventry Health Care, Inc. | 30 | 31,503 | ||||||
6.30%, 8/15/14 | 25 | 26,757 | ||||||
Genworth Financial, Inc. | 40 | 40,533 | ||||||
Hartford Financial Services Group, Inc. | 10 | 10,279 | ||||||
5.50%, 3/30/20 | 70 | 72,808 | ||||||
Humana, Inc. | 20 | 22,092 | ||||||
7.20%, 6/15/18 | 10 | 11,616 | ||||||
Liberty Mutual Group, Inc. | 15 | 15,912 | ||||||
Lincoln National Corp. | 10 | 12,862 | ||||||
Markel Corp. | 25 | 28,613 | ||||||
Massachusetts Mutual Life Insurance Co. | 25 | 34,830 | ||||||
MetLife, Inc. | 15 | 16,216 | ||||||
7.717%, 2/15/19 | 10 | 12,229 | ||||||
Nationwide Mutual Insurance Co. | 40 | 50,325 | ||||||
| 14 | • ALLIANCEBERNSTEIN TAXABLE MULTI-SECTOR INCOME SHARES |
Portfolio of Investments
| Principal Amount (000) | U.S. $ Value | |||||||
Principal Financial Group, Inc. | $ | 35 | $ | 40,635 | ||||
Prudential Financial, Inc. | 25 | 26,467 | ||||||
8.875%, 6/15/38 | 20 | 24,500 | ||||||
Series D | 25 | 29,771 | ||||||
UnitedHealth Group, Inc. | 55 | 62,189 | ||||||
WellPoint, Inc. | 35 | 35,398 | ||||||
7.00%, 2/15/19 | 10 | 11,900 | ||||||
XL Group PLC | 25 | 26,880 | ||||||
| 734,925 | ||||||||
Other Finance – 0.4% | ||||||||
ORIX Corp. | 40 | 40,909 | ||||||
REITS – 0.9% | ||||||||
HCP, Inc. | 44 | 45,736 | ||||||
Simon Property Group LP | 45 | 44,838 | ||||||
| 90,574 | ||||||||
| 2,505,280 | ||||||||
Utility – 4.1% | ||||||||
Electric – 1.9% | ||||||||
Allegheny Energy Supply Co. LLC | 40 | 41,357 | ||||||
Ameren Corp. | 25 | 28,984 | ||||||
FirstEnergy Corp. | 25 | 27,766 | ||||||
Nisource Finance Corp. | 50 | 57,551 | ||||||
Teco Finance, Inc. | 10 | 10,282 | ||||||
5.15%, 3/15/20 | 10 | 10,547 | ||||||
Wisconsin Energy Corp. | 20 | 20,100 | ||||||
| 196,587 | ||||||||
Natural Gas – 1.9% | ||||||||
DCP Midstream LLC | 10 | 10,505 | ||||||
| ALLIANCEBERNSTEIN TAXABLE MULTI-SECTOR INCOME SHARES • | 15 |
Portfolio of Investments
| Principal Amount (000) | U.S. $ Value | |||||||
Energy Transfer Partners LP | $ | 30 | $ | 34,546 | ||||
7.50%, 7/01/38 | 30 | 35,445 | ||||||
EQT Corp. | 25 | 30,235 | ||||||
TransCanada PipeLines Ltd. | 40 | 40,743 | ||||||
Williams Partners LP | 35 | 37,223 | ||||||
| 188,697 | ||||||||
Other Utility – 0.3% | ||||||||
Veolia Environnement SA | 30 | 33,833 | ||||||
| 419,117 | ||||||||
Non Corporate Sectors – 2.4% | ||||||||
Agencies - Not Government |
| |||||||
Gazprom OAO Via Gaz Capital SA | 130 | 140,920 | ||||||
Petrobras International Finance Co. - Pifco | 100 | 103,897 | ||||||
| 244,817 | ||||||||
Total Corporates - Investment Grades | 5,745,427 | |||||||
COMMERCIAL MORTGAGE-BACKED SECURITIES – 24.2% | ||||||||
Non-Agency Fixed Rate CMBS – 24.2% | ||||||||
Banc of America Commercial Mortgage, Inc. | 250 | 271,526 | ||||||
Series 2007-4, Class A4 | 220 | 242,593 | ||||||
Citigroup Commercial Mortgage Trust | 210 | 235,133 | ||||||
Commercial Mortgage Pass Through Certificates | 220 | 237,932 | ||||||
Greenwich Capital Commercial Funding Corp. | 220 | 238,383 | ||||||
Series 2007-GG9, Class A4 | 220 | 239,194 | ||||||
GS Mortgage Securities Corp. II | 215 | 234,253 | ||||||
| 16 | • ALLIANCEBERNSTEIN TAXABLE MULTI-SECTOR INCOME SHARES |
Portfolio of Investments
| Principal Amount (000) | U.S. $ Value | |||||||
JP Morgan Chase Commercial Mortgage Securities Corp. | $ | 220 | $ | 240,025 | ||||
Series 2007-LDPX, Class A3 | 250 | 270,943 | ||||||
Merrill Lynch/Countrywide Commercial Mortgage Trust | 220 | 239,781 | ||||||
Total Commercial Mortgage-Backed Securities | 2,449,763 | |||||||
CORPORATES - NON-INVESTMENT | ||||||||
Industrial – 5.0% | ||||||||
Basic – 0.8% | ||||||||
United States Steel Corp. | 80 | 81,000 | ||||||
Capital Goods – 1.0% | ||||||||
Building Materials Corp. of America | 6 | 6,083 | ||||||
Case New Holland, Inc. | 25 | 27,937 | ||||||
Mohawk Industries, Inc. | 60 | 64,650 | ||||||
| 98,670 | ||||||||
Communications - Media – 0.2% | ||||||||
CCO Holdings LLC/CCO Holdings Capital Corp. | 10 | 10,837 | ||||||
8.125%, 4/30/20 | 5 | 5,563 | ||||||
| 16,400 | ||||||||
Communications - Telecommunications – 0.4% | ||||||||
Cricket Communications, Inc. | 15 | 16,013 | ||||||
Windstream Corp. | 20 | 21,600 | ||||||
| 37,613 | ||||||||
Consumer Cyclical - Automotive – 0.3% | ||||||||
Ford Motor Co. | 30 | 34,211 | ||||||
Consumer Cyclical - Retailers – 0.6% | ||||||||
JC Penney Co., Inc. | 65 | 64,837 | ||||||
| ALLIANCEBERNSTEIN TAXABLE MULTI-SECTOR INCOME SHARES • | 17 |
Portfolio of Investments
| Principal Amount (000) | U.S. $ Value | |||||||
Consumer Non-Cyclical – 0.8% | ||||||||
HCA, Inc. | $ | 30 | $ | 33,300 | ||||
Universal Health Services, Inc. | 45 | 49,476 | ||||||
| 82,776 | ||||||||
Energy – 0.6% | ||||||||
Chesapeake Energy Corp. | 24 | 24,780 | ||||||
Tesoro Corp. | 30 | 30,975 | ||||||
| 55,755 | ||||||||
Technology – 0.3% | ||||||||
Freescale Semiconductor, Inc. | 30 | 33,300 | ||||||
| 504,562 | ||||||||
Financial Institutions – 0.8% | ||||||||
Finance – 0.1% | ||||||||
International Lease Finance Corp. | 10 | 10,187 | ||||||
Insurance – 0.7% | ||||||||
ING Capital Funding Trust III | 40 | 38,601 | ||||||
XL Group PLC | 35 | 33,250 | ||||||
| 71,851 | ||||||||
| 82,038 | ||||||||
Utility – 0.6% | ||||||||
Electric – 0.6% | ||||||||
AES Corp. (The) | 25 | 27,312 | ||||||
GenOn Energy, Inc. | 15 | 15,713 | ||||||
NRG Energy, Inc. | 20 | 20,750 | ||||||
| 63,775 | ||||||||
Total Corporates - Non-Investment Grades | 650,375 | |||||||
QUASI-SOVEREIGNS – 2.3% | ||||||||
Quasi-Sovereign Bonds – 2.3% | ||||||||
Malaysia – 1.0% | ||||||||
Petronas Capital Ltd. | 100 | 106,569 | ||||||
| 18 | • ALLIANCEBERNSTEIN TAXABLE MULTI-SECTOR INCOME SHARES |
Portfolio of Investments
| Principal Amount (000) | U.S. $ Value | |||||||
Russia – 1.3% | ||||||||
Russian Agricultural Bank OJSC Via RSHB | $ | 115 | $ | 128,800 | ||||
Total Quasi-Sovereigns | 235,369 | |||||||
GOVERNMENTS - SOVEREIGN BONDS – 1.8% |
| |||||||
Hungary – 0.7% | ||||||||
Hungary Government International Bond | 70 | 72,625 | ||||||
Poland – 0.6% | ||||||||
Poland Government International Bond | 55 | 56,031 | ||||||
Russia – 0.5% | ||||||||
Russian Foreign Bond - Eurobond | 48 | 55,544 | ||||||
Total Governments - Sovereign Bonds | 184,200 | |||||||
SHORT-TERM INVESTMENTS – 7.4% | ||||||||
Time Deposit – 7.4% | ||||||||
State Street Time Deposit | 750 | 749,725 | ||||||
Total Investments – 98.9% | 10,014,859 | |||||||
Other assets less liabilities – 1.1% | 108,861 | |||||||
Net Assets – 100.0% | $ | 10,123,720 | ||||||
| (a) | Security is exempt from registration under Rule 144A of the Securities Act of 1933. These securities are considered liquid and may be resold in transactions exempt from registration, normally to qualified institutional buyers. At April 30, 2011, the aggregate market value of these securities amounted to $1,094,251 or 10.8% of net assets. |
| (b) | Floating Rate Security. Stated interest rate was in effect at April 30, 2011. |
Glossary:
CMBS – Commercial Mortgage-Backed Securities
OJSC – Open Joint Stock Company
REIT – Real Estate Investment Trust
See notes to financial statements.
| ALLIANCEBERNSTEIN TAXABLE MULTI-SECTOR INCOME SHARES • | 19 |
Portfolio of Investments
STATEMENT OF ASSETS & LIABILITIES
April 30, 2011
| Assets | ||||
Investments in securities, at value (cost $9,906,047) | $ | 10,014,859 | ||
Interest receivable | 126,519 | |||
Total assets | 10,141,378 | |||
| Liabilities | ||||
Dividends payable | 11,592 | |||
Payable for investment securities purchased | 6,066 | |||
Total liabilities | 17,658 | |||
Net Assets | $ | 10,123,720 | ||
| Composition of Net Assets | ||||
Shares of beneficial interest, at par | $ | 10 | ||
Additional paid-in capital | 10,036,990 | |||
Undistributed net investment income | 600 | |||
Accumulated net realized loss on investment transactions | (22,692 | ) | ||
Net unrealized appreciation on investments | 108,812 | |||
| $ | 10,123,720 | |||
Net Asset Value Per Share—unlimited shares of beneficial interest authorized, $.00001 par value (based on 1,003,704 common shares outstanding) | $ | 10.09 | ||
See notes to financial statements.
| 20 | • ALLIANCEBERNSTEIN TAXABLE MULTI-SECTOR INCOME SHARES |
Statement of Assets & Liabilities
STATEMENT OF OPERATIONS
For the Period September 15, 2010(a) to April 30, 2011
| Investment Income | ||||
Interest | $ | 236,262 | ||
| Realized and Unrealized Gain (Loss) on Investment Transactions | ||||
Net realized loss on investment transactions | (22,092 | ) | ||
Net change in unrealized appreciation/depreciation of investments | 108,812 | |||
Net gain on investment transactions | 86,720 | |||
Net Increase in Net Assets from Operations | $ | 322,982 | ||
| (a) | Commencement of operations. |
See notes to financial statements.
| ALLIANCEBERNSTEIN TAXABLE MULTI-SECTOR INCOME SHARES • | 21 |
Statement of Operations
STATEMENT OF CHANGES IN NET ASSETS
| September 15, 2010(a) to April 30, 2011 | ||||
| Increase (Decrease) in Net Assets from Operations | ||||
Net investment income | $ | 236,262 | ||
Net realized loss on investment transactions | (22,092 | ) | ||
Net change in unrealized appreciation/depreciation of investments | 108,812 | |||
Net increase in net assets from operations | 322,982 | |||
| Dividends to Shareholders from | ||||
Net investment income | (236,262 | ) | ||
| Transactions in Shares of Beneficial Interest | ||||
Net increase | 10,037,000 | |||
Total increase | 10,123,720 | |||
| Net Assets | ||||
Beginning of period | – 0 | – | ||
End of period (including undistributed net investment income of $600) | $ | 10,123,720 | ||
| (a) | Commencement of operations. |
See notes to financial statements.
| 22 | • ALLIANCEBERNSTEIN TAXABLE MULTI-SECTOR INCOME SHARES |
Statement of Changes in Net Assets
NOTES TO FINANCIAL STATEMENTS
April 30, 2011
NOTE A
Significant Accounting Policies
AllianceBernstein Corporate Shares (the “Trust”) was organized as a Massachusetts business trust under the laws of The Commonwealth of Massachusetts by an Agreement and Declaration of Trust (“Declaration of Trust”) dated January 26, 2004. The Trust is registered under the Investment Company Act of 1940, as an open-end, diversified management investment company. The Trust operates as a “series” company currently having four separate portfolios: AllianceBernstein Corporate Income Shares, AllianceBernstein Municipal Income Shares, AllianceBernstein Taxable Multi-Sector Income Shares (the “Portfolio”) and AllianceBernstein Tax-Aware Real Return Income Shares. Each Portfolio is considered to be a separate entity for financial reporting and tax purposes. AllianceBernstein Corporate Income Shares commenced operations on December 11, 2006. AllianceBernstein Municipal Income Shares commenced operations on September 1, 2010. AllianceBernstein Taxable Multi-Sector Income Shares commenced operations on September 15, 2010. AllianceBernstein Tax-Aware Real Return Income Shares commenced operations on May 2, 2011. This report relates only to AllianceBernstein Taxable Multi-Sector Income Shares.
Shares of the Portfolio are offered exclusively to holders of accounts established under wrap-fee programs sponsored and maintained by certain registered investment advisers approved by AllianceBernstein L.P., (the “Adviser”). The Portfolio’s shares may be purchased at the relevant net asset value without a sales charge or other fee. The financial statements have been prepared in conformity with U.S. generally accepted accounting principles (“U.S. GAAP”) which require management to make certain estimates and assumptions that affect the reported amounts of assets and liabilities in the financial statements and amounts of income and expenses during the reporting period. Actual results could differ from those estimates. The following is a summary of significant accounting policies followed by the Portfolio.
1. Security Valuation
Portfolio securities are valued at their current market value determined on the basis of market quotations or, if market quotations are not readily available or are deemed unreliable, at “fair value” as determined in accordance with procedures established by and under the general supervision of the Trust’s Board of Trustees.
In general, the market value of securities which are readily available and deemed reliable are determined as follows. Securities listed on a national securities exchange (other than securities listed on the NASDAQ Stock Market, Inc. (“NASDAQ”)) or on a foreign securities exchange are valued at the last sale price at the close of the exchange or foreign securities exchange. If there has been no sale on such day, the securities are valued at the mean of the closing bid
| ALLIANCEBERNSTEIN TAXABLE MULTI-SECTOR INCOME SHARES • | 23 |
Notes to Financial Statements
and asked prices on such day. Securities listed on more than one exchange are valued by reference to the principal exchange on which the securities are traded; securities listed only on NASDAQ are valued in accordance with the NASDAQ Official Closing Price; listed put or call options are valued at the last sale price. If there has been no sale on that day, such securities will be valued at the closing bid prices on that day; open futures contracts and options thereon are valued using the closing settlement price or, in the absence of such a price, the most recent quoted bid price. If there are no quotations available for the day of valuation, the last available closing settlement price is used; securities traded in the over-the-counter market (“OTC”) are valued at the mean of the current bid and asked prices as reported by the National Quotation Bureau or other comparable sources; U.S. government securities and other debt instruments having 60 days or less remaining until maturity are valued at amortized cost if their original maturity was 60 days or less; or by amortizing their fair value as of the 61st day prior to maturity if their original term to maturity exceeded 60 days; fixed-income securities, including mortgage backed and asset backed securities, may be valued on the basis of prices provided by a pricing service or at a price obtained from one or more of the major broker/dealers. In cases where broker/dealer quotes are obtained, the Adviser may establish procedures whereby changes in market yields or spreads are used to adjust, on a daily basis, a recently obtained quoted price on a security; and OTC and other derivatives are valued on the basis of a quoted bid price or spread from a major broker/dealer in such security. Investments in money market funds are valued at their net asset value each day.
Securities for which market quotations are not readily available (including restricted securities) or are deemed unreliable are valued at fair value. Factors considered in making this determination may include, but are not limited to, information obtained by contacting the issuer, analysts, analysis of the issuer’s financial statements or other available documents. In addition, the Portfolio may use fair value pricing for securities primarily traded in non-U.S. markets because most foreign markets close well before the Portfolio values its securities at 4:00 p.m., Eastern Time. The earlier close of these foreign markets gives rise to the possibility that significant events, including broad market moves, may have occurred in the interim and may materially affect the value of those securities.
2. Fair Value Measurements
In accordance with U.S. GAAP regarding fair value measurements, fair value is defined as the price that the Portfolio would receive to sell an asset or pay to transfer a liability in an orderly transaction between market participants at the measurement date. The U.S. GAAP disclosure requirements establish a framework for measuring fair value, and a three-level hierarchy for fair value measurements based upon the transparency of inputs to the valuation of an asset or liability. Inputs may be observable or unobservable and refer broadly to the assumptions that market participants would use in pricing the asset or liability.
| 24 | • ALLIANCEBERNSTEIN TAXABLE MULTI-SECTOR INCOME SHARES |
Notes to Financial Statements
Observable inputs reflect the assumptions market participants would use in pricing the asset or liability based on market data obtained from sources independent of the Portfolio. Unobservable inputs reflect the Portfolio’s own assumptions about the assumptions that market participants would use in pricing the asset or liability based on the best information available in the circumstances. Each investment is assigned a level based upon the observability of the inputs which are significant to the overall valuation. The three-tier hierarchy of inputs is summarized below.
| • | Level 1—quoted prices in active markets for identical investments |
| • | Level 2—other significant observable inputs (including quoted prices for similar investments, interest rates, prepayment speeds, credit risk, etc.) |
| • | Level 3—significant unobservable inputs (including the Portfolio’s own assumptions in determining the fair value of investments) |
The following table summarizes the valuation of the Portfolio’s investments by the above fair value hierarchy levels as of April 30, 2011:
Investments in Securities | Level 1 | Level 2 | Level 3 | Total | ||||||||||||
Assets: | ||||||||||||||||
Corporates – Investment Grades | $ | — | $ | 5,726,302 | $ | 19,125 | $ | 5,745,427 | ||||||||
Commercial Mortgage-Backed Securities | — | 1,254,728 | 1,195,035 | 2,449,763 | ||||||||||||
Corporates – Non-Investment Grades | — | 650,375 | — | 650,375 | ||||||||||||
Quasi-Sovereigns | — | 235,369 | — | 235,369 | ||||||||||||
Governments – Sovereign Bonds | — | 184,200 | — | 184,200 | ||||||||||||
Short-Term Investments | — | 749,725 | — | 749,725 | ||||||||||||
Total Investments in Securities | — | 8,800,699 | 1,214,160 | 10,014,859 | ||||||||||||
Other Financial Instruments* | — | — | — | — | ||||||||||||
Total | $ | — | $ | 8,800,699 | $ | 1,214,160 | $ | 10,014,859 | ||||||||
| * | Other financial instruments are derivative instruments, such as futures, forwards and swap contracts, which are valued at the unrealized appreciation/depreciation on the instrument. |
| ALLIANCEBERNSTEIN TAXABLE MULTI-SECTOR INCOME SHARES • | 25 |
Notes to Financial Statements
Following is a reconciliation of investments in which significant unobservable inputs (Level 3) were used in determining fair value. The transfers between levels of the fair value hierarchy assumes the financial instrument was transferred at the end of the reporting period.
| Corporates - Investment Grades | Commercial Mortgage-Backed Securities | Total | ||||||||||
Balance as of 9/15/10(a) | $ | — | $ | — | $ | — | ||||||
Accrued discounts/(premiums) | — | (1,029 | ) | (1,029 | ) | |||||||
Realized gain (loss) | — | — | — | |||||||||
Change in unrealized appreciation/depreciation | 139 | 37,567 | 37,706 | |||||||||
Purchases | 18,986 | 1,158,497 | 1,177,483 | |||||||||
Sales | — | — | — | |||||||||
Transfers into Level 3 | — | — | — | |||||||||
Transfers out of Level 3 | — | — | — | |||||||||
Balance as of 4/30/11 | $ | 19,125 | $ | 1,195,035 | $ | 1,214,160 | ||||||
Net change in unrealized appreciation/depreciation from Investments held as of 4/30/11* | $ | 139 | $ | 37,567 | $ | 37,706 | ||||||
| * | The unrealized appreciation/depreciation is included in net change in unrealized appreciation/depreciation of investments in the accompanying statement of operations. |
| (a) | Commencement of operations. |
3. Taxes
It is the Portfolio’s policy to meet the requirements of the Internal Revenue Code applicable to regulated investment companies and to distribute all of its investment company taxable income and net realized gains, if any, to shareholders. Therefore, no provisions for federal income or excise taxes are required.
In accordance with U.S. GAAP requirements regarding accounting for uncertainties in income taxes, management has analyzed the Portfolio’s tax positions taken or expected to be taken on federal and state income tax returns for all open tax years and has concluded that no provision for income tax is required in the Portfolio’s financial statements.
4. Investment Income and Investment Transactions
Dividend income is recorded on the ex-dividend date or as soon as the Portfolio is informed of the dividend. Interest income is accrued daily. Investment transactions are accounted for on the date the securities are purchased or sold. Investment gains or losses are determined on the identified cost basis. The Portfolio amortizes premiums and accretes discounts as adjustments to interest income.
5. Dividends and Distributions
Dividends and distributions to shareholders, if any, are recorded on the ex-dividend date. Income dividends and capital gains distributions are
| 26 | • ALLIANCEBERNSTEIN TAXABLE MULTI-SECTOR INCOME SHARES |
Notes to Financial Statements
determined in accordance with federal tax regulations and may differ from those determined in accordance with U.S. GAAP. To the extent these differences are permanent, such amounts are reclassified within the capital accounts based on their federal tax basis treatment; temporary differences do not require such reclassification.
NOTE B
Advisory Fee and Other Transactions with Affiliates
Under the terms of the Advisory Agreement, the Portfolio pays no advisory fee to the Adviser and the Adviser reimburses or pays for the Portfolio’s operating expenses. The Portfolio is an integral part of separately managed accounts in wrap-fee programs. Typically, participants in these programs pay a fee to their investment adviser for all costs and expenses of the separately managed account, including costs and expenses associated with the Portfolio. The Adviser serves as investment manager and adviser of the Portfolio and continuously furnishes an investment program for the Portfolio and manages, supervises and conducts the affairs of the Portfolio, subject to the supervisions of the Portfolio’s Board of Trustees. The Advisory Agreement provides that the Adviser or an affiliate will furnish, or pay the expenses of the Portfolio for, office space, facilities and equipment, services of executive and other personnel of the Portfolio and certain administrative services.
The Portfolio has entered into a Distribution Agreement (the “Agreement”) with AllianceBernstein Investments, Inc., the Portfolio’s principal underwriter (the “Underwriter”), to permit the Underwriter to distribute the Portfolio’s shares, which are sold at their net asset value without any sales charge. The Portfolio does not pay a fee for this service. The Underwriter is a wholly owned subsidiary of the Adviser.
AllianceBernstein Investor Services, Inc. (“ABIS”), a wholly-owned subsidiary of the Adviser, acts as the Portfolios’ registrar, transfer agent and dividend-disbursing agent. ABIS registers the transfer, issuance and redemption of Portfolio shares and disburses dividends and other distributions to Portfolio shareholders. The Portfolio does not pay a fee for this service.
NOTE C
Investment Transactions
Purchases and sales of investment securities (excluding short-term investments) for the period ended April 30, 2011 were as follows:
| Purchases | Sales | |||||||
Investment securities (excluding | $ | 10,072,310 | $ | 833,167 | ||||
U.S. government securities | – 0 | – | – 0 | – | ||||
| ALLIANCEBERNSTEIN TAXABLE MULTI-SECTOR INCOME SHARES • | 27 |
Notes to Financial Statements
The cost of investments for federal income tax purposes, gross unrealized appreciation and unrealized depreciation are as follows:
Cost | $ | 9,906,047 | ||
Gross unrealized appreciation | $ | 160,504 | ||
Gross unrealized depreciation | (51,692 | ) | ||
Net unrealized appreciation | $ | 108,812 | ||
NOTE D
Shares of Beneficial Interest
Transactions in shares of beneficial interest were as follows:
| Shares | Amount | |||||||||||||||
| September 15, 2010(a) to April 30, 2011 | September 15, 2010(a) to April 30, 2011 | |||||||||||||||
| Class A | ||||||||||||||||
Shares sold | 1,003,704 | $ | 10,037,000 | |||||||||||||
Net increase | 1,003,704 | $ | 10,037,000 | |||||||||||||
| (a) | Commencement of operations. |
NOTE E
Risks Involved in Investing in the Portfolio
Interest Rate Risk and Credit Risk—Interest rate risk is the risk that changes in interest rates will affect the value of an Underlying Portfolio’s investments in fixed-income debt securities such as bonds or notes. Increases in interest rates may cause the value of the Portfolio’s investments to decline. Credit risk is the risk that the issuer or guarantor of a debt security, or the counterparty to a derivative contract, will be unable or unwilling to make timely principal and/or interest payments, or to otherwise honor its obligations. The degree of risk for a particular security may be reflected in its credit risk rating. Credit risk is greater for medium quality and lower-rated securities. Lower-rated debt securities and similar unrated securities (commonly known as “junk bonds”) have speculative elements or are predominantly speculative risks.
Indemnification Risk—In the ordinary course of business, the Portfolio enters into contracts that contain a variety of indemnifications. The Portfolio’s maximum exposure under these arrangements is unknown. However, the Portfolio has not had prior claims or losses pursuant to these indemnification provisions and expects the risk of loss thereunder to be remote. Therefore, the Portfolio has not accrued any liability in connection with these indemnification provisions.
| 28 | • ALLIANCEBERNSTEIN TAXABLE MULTI-SECTOR INCOME SHARES |
Notes to Financial Statements
NOTE F
Distributions to Shareholders
The tax character of distributions paid during the period ended April 30, 2011 was as follows:
| 2011 | ||||
Distributions paid from: | ||||
Ordinary income | $ | 236,262 | ||
Total taxable distributions | 236,262 | |||
Total distributions paid | $ | 236,262 | ||
As of April 30, 2011, the components of accumulated earnings/(deficit) on a tax basis were as follows:
Undistributed ordinary income | $ | 12,192 | ||
Accumulated capital and other gains/losses | (22,692 | )(a) | ||
Unrealized appreciation/(depreciation) | 108,812 | |||
Total accumulated earnings/(deficit) | $ | 98,312 | (b) | |
| (a) | On April 30, 2011, the Fund had a net capital loss carryforward of $610 which expires in the year 2019. To the extent future capital gains are offset by capital loss carryforwards, such gains will not be distributed. At April 30, 2011, the Fund had a post-October capital loss deferral of $22,082. For tax purposes, this loss is deemed to arise on May 1, 2011. |
| (b) | The difference between book-basis and tax-basis components of accumulated earnings/(deficit) is attributable primarily to dividends payable. |
During the current fiscal period, permanent differences were primarily due to a dividend reclassification that resulted in an increase in undistributed net investment income and an increase in accumulated net realized loss on investment transactions. This reclassification had no effect on net assets.
NOTE G
Subsequent Events
Management has evaluated subsequent events for possible recognition or disclosure in the financial statements through the date the financial statements are issued. Management has determined that there are no material events that would require disclosure in the Portfolio’s financial statements through this date.
| ALLIANCEBERNSTEIN TAXABLE MULTI-SECTOR INCOME SHARES • | 29 |
Notes to Financial Statements
FINANCIAL HIGHLIGHTS
Selected Data For A Share Of Beneficial Interest Outstanding Throughout Each Period
| September 15, 2010(a) to April 30, 2011 | ||||
Net asset value, beginning of period | $ 10.00 | |||
Income From Investment Operations | ||||
Net investment income(b) | .24 | |||
Net realized and unrealized gain on investment transactions | .09 | |||
Net increase in net asset value from operations | .33 | |||
Less: Dividends | ||||
Dividends from net investment income | (.24 | ) | ||
Net asset value, end of period | $ 10.09 | |||
Total Return | ||||
Total investment return based on net asset value(c) | 3.31 | % | ||
Ratios/Supplemental Data | ||||
Net assets, end of period (000’s omitted) | $10,124 | |||
Ratio to average net assets of: | ||||
Net investment income(d) | 3.79 | % | ||
Portfolio turnover rate | 10 | % | ||
| (a) | Commencement of operations. |
| (b) | Based on average shares outstanding. |
| (c) | Total investment return is calculated assuming an initial investment made at the net asset value at the beginning of the period, reinvestment of all dividends and distributions at net asset value during the period, and redemption on the last day of the period. Total return does not reflect the deduction of taxes that a shareholder would pay on portfolio distributions or the redemption of portfolio shares. Total investment return calculated for a period of less than one year is not annualized. |
| (d) | Annualized. |
See notes to financial statements.
| 30 | • ALLIANCEBERNSTEIN TAXABLE MULTI-SECTOR INCOME SHARES |
Financial Highlights
REPORT OF INDEPENDENT REGISTERED
PUBLIC ACCOUNTING FIRM
To the Board of Trustees of AllianceBernstein Corporate Shares and Shareholders of AllianceBernstein Taxable Multi-Sector Income Shares:
We have audited the accompanying statement of assets and liabilities of AllianceBernstein Taxable Multi-Sector Incomes Shares (one of the portfolios constituting AllianceBernstein Corporate Shares) (the “Portfolio”), including the portfolio of investments, as of April 30, 2011, and the related statements of operations and changes in net assets, and the financial highlights for the period September 15, 2010 (commencement of operations) through April 30, 2011. These financial statements and financial highlights are the responsibility of the Portfolio’s management. Our responsibility is to express an opinion on these financial statements and financial highlights based on our audit.
We conducted our audit in accordance with the standards of the Public Company Accounting Oversight Board (United States). Those standards require that we plan and perform the audit to obtain reasonable assurance about whether the financial statements and financial highlights are free of material misstatement. We were not engaged to perform an audit of the Portfolio’s internal control over financial reporting. Our audit included consideration of internal control over financial reporting as a basis for designing audit procedures that are appropriate in the circumstances, but not for the purpose of expressing an opinion on the effectiveness of the Portfolio’s internal control over financial reporting. Accordingly, we express no such opinion. An audit also includes examining, on a test basis, evidence supporting the amounts and disclosures in the financial statements and financial highlights, assessing the accounting principles used and significant estimates made by management, and evaluating the overall financial statement presentation. Our procedures included confirmation of securities owned as of April 30, 2011 by correspondence with the custodian and others or by other appropriate auditing procedures where replies from others were not received. We believe that our audit provides a reasonable basis for our opinion.
In our opinion, the financial statements and financial highlights referred to above present fairly, in all material respects, the financial position of AllianceBernstein Taxable Multi-Sector Income Shares of AllianceBernstein Corporate Shares at April 30, 2011, and the results of its operations, changes in its net assets and the financial highlights for the period September 15, 2010 (commencement of operations) through April 30, 2011, in conformity with U.S. generally accepted accounting principles.

New York, New York
June 24, 2011
| ALLIANCEBERNSTEIN TAXABLE MULTI-SECTOR INCOME SHARES • | 31 |
Report of Independent Registered Public Accounting Firm
2011 FEDERAL TAX INFORMATION
(unaudited)
For Federal income tax purposes, the following information is furnished with respect to the distributions paid by the Fund during the taxable period ended April 30, 2011. For foreign shareholders, 84.77% of ordinary dividends paid may be considered to be qualifying to be taxed as interest-related dividends.
| 32 | • ALLIANCEBERNSTEIN TAXABLE MULTI-SECTOR INCOME SHARES |
2011 Federal Tax Information
RESULTS OF SHAREHOLDERS MEETING
(unaudited)
The Annual Meeting of Shareholders of AllianceBernstein Corporate Shares (the “Trust”)–AllianceBernstein Taxable Multi-Sector Income Shares (the “Portfolio”) was held on November 5, 2010 (the “Meeting”). At the Meeting, with respect to the first item of business, the election of Trustees for the Trust, the required number of outstanding shares was voted in favor of the proposal, and the proposal was approved. A description of the proposal and number of shares voted at the Meeting are as follows (the proposal numbers shown below correspond to the proposal number in the Trust’s proxy statement):
| Voted For | Withheld Authority | |||
1. The election of the Trustees, each such Trustee to serve a term of an indefinite duration and until his or her successor is duly elected and qualifies. | ||||
| John H. Dobkin | 4,054,833 | 0 | ||
| Michael J. Downey | 4,054,833 | 0 | ||
| William H. Foulk, Jr. | 4,054,833 | 0 | ||
| D. James Guzy | 4,054,833 | 0 | ||
| Nancy P. Jacklin | 4,054,833 | 0 | ||
| Robert M. Keith | 4,054,833 | 0 | ||
| Garry L. Moody | 4,054,833 | 0 | ||
| Marshall C. Turner, Jr. | 4,054,833 | 0 | ||
| Earl D. Weiner | 4,054,833 | 0 | ||
| ALLIANCEBERNSTEIN TAXABLE MULTI-SECTOR INCOME SHARES • | 33 |
Results of Shareholders Meeting
BOARD OF TRUSTEES
William H. Foulk, Jr.(1) , Chairman John H. Dobkin(1) Michael J. Downey(1) D. James Guzy(1) Nancy P. Jacklin(1) | Robert M. Keith, President and Chief Executive Officer Garry L. Moody(1) Marshall C. Turner, Jr.(1) Earl D. Weiner(1) |
OFFICERS
Philip L. Kirstein, Douglas J. Peebles(2), Paul J. DeNoon(2), Vice President Scott A. DiMaggio(2), Vice President | Shawn E. Keegan(2), Vice President Greg J. Wilensky(2), Vice President Emilie D. Wrapp, Secretary Joseph J. Mantineo, Treasurer and Chief Financial Officer Phyllis J. Clarke, Controller |
Custodian and Accounting Agent State Street Bank and Trust Company
Principal Underwriter AllianceBernstein Investments, Inc.
Transfer Agent AllianceBernstein Investor Services, Inc. | Legal Counsel Seward & Kissel LLP One Battery Park Plaza New York, NY 10004
Independent Registered Public Accounting Firm Ernst & Young LLP 5 Times Square New York, NY 10036 |
| (1) | Member of the Audit Committee, the Governance and Nominating Committee and the Independent Directors Committee. Mr. Foulk is the sole member of the Fair Value Pricing Committee. |
| (2) | The day-to-day management of, and investment decisions for, the Trust’s portfolio are made by the Core Fixed-Income Team. Messrs. Paul J. DeNoon, Scott A. DiMaggio, Shawn E. Keegan, Douglas J. Peebles, and Greg J. Wilensky are the investment professionals primarily responsible for the day-to-day management of the Trust’s portfolio. |
| 34 | • ALLIANCEBERNSTEIN TAXABLE MULTI-SECTOR INCOME SHARES |
Board of Trustees
TRUSTEES AND OFFICERS INFORMATION
Board of Trustees Information
The business and affairs of the Fund are managed under the direction of the Board of Trustees. Certain information concerning the Fund’s Trustees is set forth below.
| NAME, ADDRESS*, AGE, AND (YEAR FIRST ELECTED**) | PRINCIPAL OCCUPATION(S) DURING PAST FIVE YEARS AND OTHER RELEVANT | PORTFOLIOS IN FUND COMPLEX OVERSEEN BY TRUSTEE | OTHER DIRECTORSHIPS HELD BY TRUSTEE IN PAST FIVE YEARS | |||||
| INTERESTED TRUSTEE | ||||||||
Robert M. Keith, # 51 (2010) | Senior Vice President of AllianceBernstein L.P. (the “Adviser”) and the head of AllianceBernstein Investments, Inc. (“ABI”) since July 2008; Director of ABI and President of the AllianceBernstein Mutual Funds. Previously, he served as Executive Managing Director of ABI from December 2006 to June 2008. Prior to joining ABI in 2006, Executive Managing Director of Bernstein Global Wealth Management, and prior thereto, Senior Managing Director and Global Head of Client Service and Sales of the Adviser’s institutional investment management business since 2004. Prior thereto, Managing Director and Head of North American Client Service and Sales in the Adviser’s institutional investment management business, with which he had been associated since prior to 2004. | 99 | None | |||||
| DISINTERESTED TRUSTEES | ||||||||
Chairman of the Board William H. Foulk, Jr., ##, + 78 (2010) | Investment Adviser and an Independent Consultant since prior to 2006. Previously, he was Senior Manager of Barrett Associates, Inc., a registered investment adviser. He was formerly Deputy Comptroller and Chief Investment Officer of the State of New York and, prior thereto, Chief Investment Officer of the New York Bank for Savings. He has served as a director or trustee of various AllianceBernstein Funds since 1983 and has been Chairman of the AllianceBernstein Funds and of the Independent Directors Committee of such Funds since 2003. He is also active in a number of mutual fund related organizations and committees. | 99 | None | |||||
| ALLIANCEBERNSTEIN TAXABLE MULTI-SECTOR INCOME SHARES • | 35 |
Trustees and Officers Information
| NAME, ADDRESS*, AGE, AND (YEAR FIRST ELECTED**) | PRINCIPAL OCCUPATION(S) DURING PAST FIVE YEARS AND OTHER RELEVANT | PORTFOLIOS IN FUND COMPLEX OVERSEEN BY TRUSTEE | OTHER DIRECTORSHIPS HELD BY TRUSTEE IN PAST FIVE YEARS | |||||
| DISINTERESTED TRUSTEES (continued) | ||||||||
John H. Dobkin, ## 69 (2010) | Independent Consultant since prior to 2006. Formerly, President of Save Venice, Inc. (preservation organization) from 2001–2002; Senior Advisor from June 1999-June 2000 and President of Historic Hudson Valley (historic preservation) from December 1989-May 1999. Previously, Director of the National Academy of Design. He has served as a director or trustee of various AllianceBernstein Funds since 1992, and as Chairman of the Audit Committees of a number of such Funds from 2001-2008. | 98 | None | |||||
Michael J. Downey, ## 67 (2010) | Private Investor since prior to 2006. Formerly, managing partner of Lexington Capital, LLC (investment advisory firm) from December 1997 until December 2003. From 1987 until 1993, Chairman and CEO of Prudential Mutual Fund Management, director of the Prudential Mutual funds, and member of the Executive Committee of Prudential Securities Inc. He has served as a director or trustee of the AllianceBernstein Funds since 2005 and is a director of two other registered investment companies (and Chairman of one of them). | 98 | Asia Pacific Fund, Inc. and The Merger Fund since prior to 2006, and Prospect Acquisition Corp. (financial services) since 2007 until 2009 | |||||
| 36 | • ALLIANCEBERNSTEIN TAXABLE MULTI-SECTOR INCOME SHARES |
Trustees and Officers Information
| NAME, ADDRESS*, AGE, AND (YEAR FIRST ELECTED**) | PRINCIPAL OCCUPATION(S) DURING PAST FIVE YEARS AND OTHER RELEVANT | PORTFOLIOS IN FUND COMPLEX OVERSEEN BY TRUSTEE | OTHER DIRECTORSHIPS HELD BY TRUSTEE IN PAST FIVE YEARS | |||||
| DISINTERESTED TRUSTEES (continued) | ||||||||
D. James Guzy, ## 75 (2010) | Chairman of the Board of PLX Technology (semi-conductors) and of SRC Computers Inc., with which he has been associated since prior to 2006. He was a director of Intel Corporation (semi-conductors) from 1969 until 2008, and served as Chairman of the Finance Committee of such company for several years until May 2008. He has served as a director or trustee of one or more of the AllianceBernstein Funds since 1982. | 98 | Cirrus Logic Corporation (semi-conductors) and PLX Technology (semi-conductors) since prior to 2006 and Intel Corporation (semi-conductors) since prior to 2006 until 2008 | |||||
Nancy P. Jacklin, ## 63 (2010) | Professorial Lecturer at the Johns Hopkins School of Advanced International Studies since 2008. Formerly, U.S. Executive Director of the International Monetary Fund (December 2002-May 2006); Partner, Clifford Chance (1992-2002); Sector Counsel, International Banking and Finance, and Associate General Counsel, Citicorp (1985-1992); Assistant General Counsel (International), Federal Reserve Board of Governors (1982-1985); and Attorney Advisor, U.S. Department of the Treasury (1973-1982). Member of the Bar of the District of Columbia and of New York; and member of the Council on Foreign Relations. She has served as a director or trustee of the AllianceBernstein Funds since 2006. | 98 | None | |||||
| ALLIANCEBERNSTEIN TAXABLE MULTI-SECTOR INCOME SHARES • | 37 |
Trustees and Officers Information
| NAME, ADDRESS*, AGE, AND (YEAR FIRST ELECTED**) | PRINCIPAL OCCUPATION(S) DURING PAST FIVE YEARS AND OTHER RELEVANT | PORTFOLIOS IN FUND COMPLEX OVERSEEN BY TRUSTEE | OTHER DIRECTORSHIPS HELD BY TRUSTEE IN PAST FIVE YEARS | |||||
| DISINTERESTED TRUSTEES (continued) | ||||||||
Garry L. Moody, ## 59 (2010) | Independent Consultant. Formerly, Partner, Deloitte & Touche LLP (1995-2008) where he held a number of senior positions, including Vice Chairman, and U.S. and Global Investment Management Practice Managing Partner; President, Fidelity Accounting and Custody Services Company (1993-1995); and Partner, Ernst & Young LLP (1975-1993), where he served as the National Director of Mutual Fund Tax Services. He is also a member of the Governing Council of the Independent Directors Council (IDC), an organization of independent directors of mutual funds, and serves on that organization’s Education and Communications Committee. He has served as a director or trustee, and as Chairman of the Audit Committee, of most of the AllianceBernstein Funds since 2008. | 98 | None | |||||
| 38 | • ALLIANCEBERNSTEIN TAXABLE MULTI-SECTOR INCOME SHARES |
Trustees and Officers Information
| NAME, ADDRESS*, AGE, AND (YEAR FIRST ELECTED**) | PRINCIPAL OCCUPATION(S) DURING PAST FIVE YEARS AND OTHER RELEVANT | PORTFOLIOS IN FUND COMPLEX OVERSEEN BY TRUSTEE | OTHER DIRECTORSHIPS HELD BY TRUSTEE IN PAST FIVE YEARS | |||||
| DISINTERESTED TRUSTEES (continued) | ||||||||
Marshall C. Turner, Jr., ## 69 (2010) | Private Investor since prior to 2006. Interim CEO of MEMC Electronic Materials, Inc. (semi-conductor and solar cell substrates) from November 2008 until March 2009. He was Chairman and CEO of Dupont Photomasks, Inc. (components of semi-conductor manufacturing), 2003-2005, and President and CEO, 2005-2006, after the company was acquired and renamed Toppan Photomasks, Inc. He has extensive experience in venture capital investing including prior service as general partner of three institutional venture capital partnerships, and serves on the boards of a number of education and science-related non-profit organizations. He has served as a director or trustee of one or more of the AllianceBernstein Funds since 1992. | 98 | Xilinx, Inc. (programmable logic semi-conductors) and MEMC Electronic Materials, Inc. (semi-conductor and solar cell substrates), since prior to 2006 | |||||
Earl D. Weiner, ## 71 (2010) | Of Counsel, and Partner prior to January 2007, of the law firm Sullivan & Cromwell LLP and member of ABA Federal Regulation of Securities Committee Task Force to draft editions of the Fund Director’s Guidebook. He also serves as a director or trustee of various non-profit organizations and has served as Chairman or Vice Chairman of a number of them. He has served as a director or trustee of the AllianceBernstein Funds since 2007 and is Chairman of the Governance and Nominating Committees of most of the Funds. | 98 | None | |||||
| ALLIANCEBERNSTEIN TAXABLE MULTI-SECTOR INCOME SHARES • | 39 |
Trustees and Officers Information
| * | The address for each of the Trust’s disinterested Trustees is c/o AllianceBernstein L.P., Attention: Philip L. Kirstein, 1345 Avenue of the Americas, New York, NY 10105. |
| ** | There is no stated term of office for the Trust’s Trustees. |
| *** | The information above includes each Trustee’s principal occupation during the last five years and other information relating to the experience, attributes, and skills relevant to each Trustee’s qualifications to serve as a Trustee, which led to the conclusion that each Trustee should serve as a Trustee for the Trust. |
| # | Mr. Keith is an “interested persons” of the Trust as defined in the 1940 Act, due to his position as a Senior Vice President of the Adviser. |
| ## | Member of the Audit Committee, the Governance and Nominating Committee and the Independent Directors Committee. |
| + | Member of the Fair Value Pricing Committee. |
| 40 | • ALLIANCEBERNSTEIN TAXABLE MULTI-SECTOR INCOME SHARES |
Trustees and Officers Information
Officer Information
Certain information concerning the Trust’s officers is set forth below.
NAME, ADDRESS,* AND AGE | POSITION(S) HELD WITH FUND | PRINCIPAL OCCUPATION DURING PAST FIVE YEARS | ||
| OFFICERS | ||||
| Robert M. Keith 51 | President and Chief Executive Officer | See above. | ||
| Philip L. Kirstein 66 | Senior Vice President | Senior Vice President and Independent Compliance Officer of the AllianceBernstein Mutual Funds, with which he has been associated since October 2004. Prior thereto, he was Of Counsel to Kirkpatrick & Lockhart, LLP from October 2003 to October 2004, and General Counsel of Merrill Lynch Investment Managers, L.P. since prior to March 2003. | ||
Douglas J. Peebles 45 | Senior Vice President | Senior Vice President of the Adviser**, with which he has been associated since prior to 2006. | ||
Paul J. DeNoon 49 | Vice President | Senior Vice President of the Adviser**, with which he has been associated since prior to 2006. | ||
Scott A. DiMaggio 39 | Vice President | Senior Vice President of the Adviser**, with which he had been associated since prior to 2006. | ||
Shawn E. Keegan 39 | Vice President | Vice President of the Adviser**, with which he has been associated since prior to 2006. | ||
Greg J. Wilensky 44 | Vice President | Senior Vice President of the Adviser**, with which he had been associated since prior to 2006. | ||
Emilie D. Wrapp 55 | Secretary | Senior Vice President, Assistant General Counsel and Assistant Secretary of ABI**, with which she has been associated since prior to 2006. | ||
Joseph J. Mantineo 52 | Treasurer and Chief Financial Officer | Senior Vice President of AllianceBernstein Investor Services, Inc. (“ABIS”)**, with which he has been associated since prior to 2006. | ||
Phyllis J. Clarke 50 | Controller | Vice President of ABIS**, with which she has been associated since prior to 2006. |
| * | The address for each of the Portfolio’s Officers is 1345 Avenue of the Americas, New York, NY 10105. |
| ** | The Adviser, ABI and ABIS are affiliates of the Fund. |
The Fund’s Statement of Additional Information (“SAI”) has additional information about the Fund’s Trustees and Officers and is available without charge upon request. Contact your financial representative or AllianceBernstein at 1-800-227-4618 for a free prospectus or SAI.
| ALLIANCEBERNSTEIN TAXABLE MULTI-SECTOR INCOME SHARES • | 41 |
Trustees and Officers Information
THE FOLLOWING IS NOT PART OF THE SHAREHOLDER REPORT OR THE FINANCIAL STATEMENTS
SUMMARY OF SENIOR OFFICER’S EVALUATION OF INVESTMENT ADVISORY AGREEMENT1
The following is a summary of the evaluation of the Investment Advisory Agreement between AllianceBernstein L.P., (the “Adviser”) and AllianceBernstein Corporate Shares (the “Trust”) in respect of AllianceBernstein Taxable Multi-Sector Income Shares (the “Portfolio”).2
The Portfolio is designed to serve the needs of the Adviser’s separately managed account (“SMA”) or “wrap fee” clients. Since SMA clients pay their wrap program provider a unitary fee for managing all investments in their portfolio, the Portfolio will not pay an advisory fee. The Adviser will also reimburse the Portfolio for all of its other operating expenses, except certain extraordinary expenses, taxes, brokerage costs and the interest on borrowed money and on other leveraging methods.
The Portfolio is designed as a component of an institutional fixed-income mandate, Core Plus (“Core Plus SMA”), to be made available to SMA clients. Core Plus SMA is modeled on the Adviser’s U.S. Strategic Core Plus investment mandate. Core Plus SMA is expected to use a 60% allocation to direct investments in individual U.S. Government/U.S. agency securities, including pass-thru agency mortgage-backed securities, or cash investments, complemented by a 40% allocation to the Portfolio in order to achieve the approximate exposures of the U.S. Strategic Core Plus investment mandate. The Portfolio’s role as a component of Core Plus SMA will call for the Portfolio to utilize leverage in certain circumstances.
The Adviser intends to manage the Portfolio in a multi-sector investment style. The Portfolio’s proposed investment objective is to generate income and price appreciation. The Portfolio will have the latitude to invest across all sectors, including corporate debt (both investment grade and non-investment grade), mortgage sector (both residential and commercial), U.S. Government/U.S agency,3 asset-backed, bank loans and Treasury Inflation-Protected Securities (“TIPS”), as well as foreign corporate debt and foreign government debt of developed and emerging countries. The Portfolio will have the flexibility to use active currency management and may utilize leverage, including the use of
| 1 | It should be noted that the information in the fee summary was completed on May 26, 2010 and presented to the Board of Trustees on June 9, 2010. |
| 2 | Future references to the Trust and the Portfolio do not include “AllianceBernstein.” References in the fee summary pertaining to performance and expense ratio rankings refer to the Class A shares of the Portfolio. |
| 3 | Since the Portfolio is designed as a multi-sector complement to Core Plus SMA’s U.S. Government/U.S. agency holdings, the Portfolio is expected to own only a small amount of U.S. Government /U.S. agency securities or even none at all. |
| 42 | • ALLIANCEBERNSTEIN TAXABLE MULTI-SECTOR INCOME SHARES |
reverse repurchase agreements, for investment purposes. The Portfolio will also be permitted to invest in derivatives, including futures, swaps, options, options on futures and currency transactions.
The evaluation of the Investment Advisory Agreement was prepared by Philip L. Kirstein, the Senior Officer of the Fund, for the Trustees of the Fund, as required by a September 2004 agreement between the Adviser and the New York State Attorney General (the ���NYAG”). The Senior Officer’s evaluation of the Investment Advisory Agreement is not meant to diminish the responsibility or authority of the Board of Trustees of the Fund to perform its duties pursuant to Section 15 of the Investment Company Act of 1940 (the “40 Act”) and applicable state law. The purpose of this summary is to provide shareholders with a synopsis of the independent evaluation of the reasonableness of the advisory fees proposed to be paid by the Portfolio which was provided to the Trustees in connection with their review of the proposed approval of the initial Investment Advisory Agreement. The Senior Officer’s evaluation considered the following factors:
| 1. | Advisory fees charged to institutional and other clients of the Adviser for like services; |
| 2. | Advisory fees charged by other mutual fund companies for like services; |
| 3. | Costs to the Adviser and its affiliates of supplying services pursuant to the advisory agreement, excluding any intra-corporate profit; |
| 4. | Profit margins of the Adviser and its affiliates from supplying such services; |
| 5. | Possible economies of scale as the Portfolio grows larger; and |
| 6. | Nature and quality of the Adviser’s services including the performance of the Portfolio. |
PORTFOLIO ADVISORY FEES, NET ASSETS & EXPENSE RATIOS
The Adviser proposed that the Portfolio pays no advisory fee to the Adviser for receiving the services to be provided pursuant to the Investment Advisory Agreement. As previously mentioned, the Portfolio is designed to serve the needs of the Adviser’s separately managed account (“SMA”) clients. Since SMA clients pay their wrap program provider a unitary fee for managing all investments of their portfolio, the Portfolio will not pay an advisory fee. The Adviser will also reimburse the Portfolio for all of its other operating expenses, except certain extraordinary expenses, taxes, brokerage costs and the interest on borrowed money or alternative sources of leverage.
The Portfolio will offer only one no-load class of shares, which will be distributed through its principal underwriter, AllianceBernstein Investments, Inc.
| ALLIANCEBERNSTEIN TAXABLE MULTI-SECTOR INCOME SHARES • | 43 |
(“ABI”). The Portfolio will not have a distribution plan pursuant to Rule 12b-1 under the 40 Act. Set forth below is the Portfolio’s anticipated annual operating expenses in percentages:
| Annual Operating Expenses | % | |||
| Management Fees4 | 0.35 | % | ||
| Distribution Fees | 0.00 | % | ||
| Other Expenses | 0.00 | % | ||
| Fee Waiver / Reimbursements | -0.35 | % | ||
| Net Expenses | 0.00 | % | ||
| I. | MANAGEMENT FEES CHARGED TO INSTITUTIONAL AND OTHER CLIENTS |
The advisory fees charged to investment companies which the Adviser manages and sponsors are normally higher than those charged to similar sized institutional accounts, including pension plans and sub-advised investment companies. The fee differential reflects, among other things, different services provided to such clients, and different liabilities assumed. Services to be provided by the Adviser to the Portfolio that are not provided to non-investment company clients include providing office space and personnel to serve as Fund Officers, who among other responsibilities make the certifications required under the Sarbanes–Oxley Act of 2002, and coordinating with and monitoring the Portfolio’s third party service providers such as Fund counsel, auditors, custodians, transfer agents and pricing services. The accounting, administrative, legal and compliance requirements for the Portfolio will be more costly than those for institutional client assets due to the greater complexities and time required for investment companies. The Adviser also believes that it incurs substantial entrepreneurial risk when offering a new mutual fund since establishing a new mutual fund requires a large upfront investment and it may take a long time for the fund to achieve profitability since the fund must be priced to scale from inception in order to be competitive and assets are acquired one account at a time. In addition, managing the cash flow of an investment company may be more difficult than managing that of a stable pool of assets, such as an institutional account with little cash movement in either direction, particularly, if a fund is in net redemption and the Adviser is frequently forced to sell securities to raise cash for redemptions. However, managing a fund with positive cash flow may be easier at times than managing a stable pool of assets. Finally, in recent years, investment advisers have been sued by institutional clients and have suffered reputational damage both by the attendant publicity and outcomes other than complete victories. Accordingly, the legal and reputational risks associated with institutional accounts are greater than previously thought, although still not equal to those related to the mutual fund industry.
| 4 | This amount reflects the portion of the wrap fee attributable to the management of the Portfolio. This amount also includes estimated operating expenses of the Portfolio that are paid by the Adviser. |
| 44 | • ALLIANCEBERNSTEIN TAXABLE MULTI-SECTOR INCOME SHARES |
Notwithstanding the Adviser’s view that managing an investment company is not comparable to managing other institutional accounts because the services provided are different, the Supreme Court has indicated consideration should be given to the advisory fee charged to institutional accounts that have a similar investment style as the Portfolio.5 The Portfolio is designed to complement Core Plus SMA, which is modeled after the institutional account, U.S. Strategic Core Plus. Set forth below is U.S. Strategic Core Plus’ advisory fee schedule. Also shown is what would have been the Portfolio’s effective advisory fee had the AllianceBernstein Institutional fee schedule been applicable to the Portfolio based on an initial estimate of the Portfolio’s net assets at $100 million:
| Portfolio | Initial Net Assets ($MIL) | AllianceBernstein (“AB”) Fee Schedule | Effective AB Inst. Adv. Fee | |||||
| Taxable Multi-Sector Income Shares | $100.0 | U.S. Strategic Core Plus Schedule 50 bp on 1st $30 million 20 bp on the balance Minimum account size: $25m | 0.290% | |||||
The Adviser manages AllianceBernstein Intermediate Bond Fund, Inc. (“Intermediate Bond Fund, Inc.”), a retail mutual fund that has a substantially similar investment style as the anticipated Core SMA Plus.6 Set forth in the table below is the advisory fee schedule of the Intermediate Bond Fund, Inc. and what would have been the effective advisory fee of the Portfolio had the advisory fee schedule of the retail mutual fund been applicable to the Portfolio based on an initial estimate of the Portfolio’s net assets at $100 million:
| Portfolio | AllianceBernstein Mutual Funds (“ABMF”) | Fee Schedule | Effective Fee | |||||
| Taxable Multi-Sector Income Shares | AllianceBernstein Intermediate Bond Fund, Inc. | 0.45% on first $2.5 billion 0.40% on next $2.5 billion 0.35% on the balance | 0.450% | |||||
| 5 | The Supreme Court recently held the Gartenberg decision was correct in its basic formulation of what §36(b) requires: to face liability under §36(b), “an investment adviser must charge a fee that is so disproportionately large that it bears no reasonable relationship to the services rendered and could not have been the product of arms length bargaining.” Jones v. Harris Associates L.P., (No. 08-586), slip op. at 9, 559 U.S. 2010. In the Jones v. Harris decision, the Supreme Court stated the Gartenberg approach fully incorporates the correct understanding of fiduciary duty within the context of section §36(b) and noted with approval that “Gartenberg insists that all relevant circumstances be taken into account” and “uses the range of fees that might result from arms-length bargaining as the benchmark for reviewing challenged fees.” Jones v. Harris at 11. |
| 6 | The advisory fee schedules of Intermediate Bond Fund, Inc. and AllianceBernstein Variable Product Series Fund, Inc.-Intermediate Bond Portfolio were affected by the December 2003 settlement between the Adviser and the NYAG. The NYAG related master fee schedule, implemented in January 2004, contemplates eight categories with almost all of the AllianceBernstein funds in each category having the same advisory fee schedule. |
| ALLIANCEBERNSTEIN TAXABLE MULTI-SECTOR INCOME SHARES • | 45 |
The adviser also manages the AllianceBernstein Variable Products Series Fund, Inc. (“AVPS”), which is available through variable annuity and variable life contracts offered by other financial institutions and offers policyholders the option to utilize certain AVPS portfolios as the investment option underlying their insurance contracts. AVPS – Intermediate Bond Portfolio has a substantially similar investment style as the anticipated Core SMA Plus and its advisory fee schedule is set forth in the table below.6 Also shown is what would have been the effective advisory fee of the Portfolio had the advisory fee schedule of the AVPS portfolio been applicable to the Portfolio based on an initial estimate of the Portfolio’s net assets at $100 million:
| Portfolio | AVPS Portfolio | Fee Schedule | Effective Fee | |||||
| Taxable Multi-Sector Income Shares | AVPS – Intermediate Bond Portfolio | 0.45% on first $2.5 billion 0.40% on next $2.5 billion 0.35% on the balance | 0.450% | |||||
The Adviser also manages Sanford C. Bernstein Fund II – Intermediate Duration Institutional Portfolio (“SCB II”), which has a substantially similar investment style as the anticipated Core Plus SMA. Set forth in the table below is SCB II’s advisory fee schedule7 and what would have been the effective fee of the Portfolio had SCB II’s advisory fee schedule been applicable to the Portfolio based on an initial estimate of the Portfolio’s assets at $100 million:
| Portfolio | ABMF Fund | Fee Schedule | SCB Fund Effective Fee | |||||
| Taxable Multi-Sector Income Shares8 | Sanford C. Bernstein Fund II – Intermediate Duration Institutional Portfolio | 50 bp on 1st $1 billion 45 bp on the balance | 0.500% | |||||
The Adviser manages the Sanford C. Bernstein Fund, Inc. (the “SCB Fund”), an open-end management investment company. Intermediate Duration Portfolio of the SCB Fund has a substantially similar investment style as the anticipated Core Plus SMA and its advisory fee schedule is set forth below. Also presented is what would have been the effective advisory fee of the Portfolio had the SCB Fund fee
| 7 | Although a part of the AllianceBernstein Mutual Funds, SCB II’s advisory fee schedule was not affected by the Adviser’s settlement with the NYAG since its fee schedule had a lower breakpoint level ($1 billion) than the breakpoint level ($2.5 billion) of the High Income category of the NYAG related master schedule. The advisory fee schedule of the High Income category is as follows: 0.50% on the first $2.5 billion, 0.45% on the next $2.5 billion and 0.40% thereafter. |
| 8 | SCB II has an expense cap of 0.45%, which effectively reduces the advisory fee. |
| 46 | • ALLIANCEBERNSTEIN TAXABLE MULTI-SECTOR INCOME SHARES |
schedule been applicable to the Portfolio based on an initial estimate of the Portfolio’s net assets at $100 million:
| Portfolio | SCB Fund Portfolio | Fee Schedule | SCB Fund Effective Fee | |||||
| Taxable Multi-Sector Income Shares | SCB Fund – Intermediate Duration Portfolio | 50 bp on 1st $1 billion 45 bp on next $2 billion 40 bp on next $2 billion 35 bp on next $2 billion 30 bp thereafter | 0.500% | |||||
The Adviser provides sub-advisory investment services to certain other investment companies managed by other fund families. The Adviser charges the following fees for each of these sub-advisory relationships. Also shown are what would have been the effective advisory fees of the Funds had the fee schedules of the sub-advisory relationships been applicable to those Funds based on an initial estimate of the Portfolio’s net assets at $100 million:
| Portfolio | Fee Schedule | Effective Sub-Adv. Fee | Portfolio Fee | |||||||||
| Taxable Multi-Sector Income Shares | Client #19 | 0.29% on 1st $100 million 0.20% on the balance | 0.290% | 0.450% | ||||||||
It is fair to note that the services the Adviser provides pursuant to sub-advisory agreements are generally confined to the services related to the investment process; in other words, they are not as comprehensive as the services provided to the Portfolio by the Adviser. In addition, to the extent that the sub-advisory relationship is with an affiliate of the Adviser, the fee schedule may not reflect arm’s-length bargaining or negotiations.
While it appears that the sub-advisory relationship is paying a lower fee than the Portfolio, it is difficult to evaluate the relevance of such fees due to differences in terms of the services provided, risks involved and other competitive factors between the Portfolio and sub-advisory relationship. There could be various business reasons why an investment adviser would be willing to manage a sub-advisory relationship for a different fee level than an investment company it is sponsoring where the investment adviser is providing all the services, not just investment, generally required by a registered investment company.
| 9 | This is the fee schedule of a fund managed by an affiliate of the Adviser. |
| ALLIANCEBERNSTEIN TAXABLE MULTI-SECTOR INCOME SHARES • | 47 |
| II. | MANAGEMENT FEES CHARGED BY OTHER MUTUAL FUND COMPANIES FOR LIKE SERVICES. |
Lipper, Inc. (“Lipper”), an analytical service that is not affiliated with the Adviser, compared the fee arrangements of the Portfolio with those of other investment companies receiving similar services from other investment advisers.10 Each peer selected by Lipper had a similar fee arrangement as the Portfolio, which is to say that with respect to the Portfolio’s peers, all fund expenses, including management fees11 were reimbursed by the investment adviser.12
| III. | COSTS TO THE ADVISER AND ITS AFFILIATES OF SUPPLYING SERVICES PURSUANT TO THE MANAGEMENT FEE ARRANGEMENT, EXCLUDING ANY INTRA-CORPORATE PROFIT. |
The Adviser utilizes two profitability reporting systems, which operate independently but are aligned with each other, to estimate the Adviser’s profitability in connection with investment advisory services provided to the Portfolio. The Senior Officer has retained an independent consultant to provide independent advice regarding the alignment of the two profitability systems as well as the methodologies and allocations utilized by both profitability systems. See Section IV for additional discussion.
| IV. | PROFIT MARGINS OF THE ADVISER AND ITS AFFILIATES FOR SUPPLYING SUCH SERVICES. |
The Portfolio has not yet commenced operations. Therefore, there is no historic profitability data with respect to the Adviser’s investment services to the Portfolio. A weighted average of the Adviser’s profitability in respect to the Portfolio’s SMA clients, in addition to any fund specific revenue or expense item, will be used to calculate the Portfolio’s profitability.
| V. | POSSIBLE ECONOMIES OF SCALE |
Although the Portfolio will not pay the Adviser an advisory fee, it is still worth considering information on possible economies of scale. The Adviser has indicated that economies of scale are being shared with shareholders through fee structures, subsidies and enhancement to services. Based on some of the
| 10 | Only zero fee no-load funds that participated in a wrap fee program were considered for inclusion in the Portfolio’s EG, regardless of the Lipper investment classification/objective of the Portfolio’s peers. The Portfolio’s EG includes the Portfolio, which is classified by Lipper as “Intermediate Investment Grade Debt Fund”, two U.S. Mortgage Funds and one Treasury Inflation-Protected Securities (“TIPS”) Fund, one General Bond Fund, and two Global Income Funds. |
| 11 | “Management Fee” is the fee attributable to the management and bearing of expenses of the funds (not the management of the wrap fee program). In each case the advisory contract provides for an advisory or management fee of zero. |
| 12 | In considering this section, it should be noted that the Supreme Court cautioned against accepting mutual fund fee comparisons without careful scrutiny since “these comparisons are problematic because these fees, like those challenged, may not be the product of the negotiations conducted at arms length.” Jones v. Harris at 14. |
| 48 | • ALLIANCEBERNSTEIN TAXABLE MULTI-SECTOR INCOME SHARES |
professional literature that has considered economies of scale in the mutual fund industry, it is thought that to the extent economies of scale exist, they may more often exist across a fund family as opposed to a specific fund. This is because the costs incurred by the Adviser, such as investment research or technology for trading or compliance systems can be spread across a greater asset base as the fund family increases in size. It is also possible that as the level of services required to operate a successful investment company has increased over time, and advisory firms make such investments in their business to provide services, there may be a sharing of economies of scale without a reduction in advisory fees.
An independent consultant, retained by the Senior Officer, provided the Board of Trustees an update of the Deli13 study on advisory fees and various fund char
acteristics.14 The independent consultant first reiterated the results of his previous two dimensional comparison analysis (fund size and family size) with the Board of Trustees.15 The independent consultant then discussed the results of the regression model that was utilized to study the effects of various factors on advisory fees. The regression model output indicated that the bulk of the variation in fees predicted were explained by various factors, but substantially by fund AUM, family AUM, index fund indicator and investment style. The independent consultant also compared the advisory fees of the AllianceBernstein Mutual Funds to similar funds managed by 19 other large asset managers, regardless of the fund size and each Adviser’s proportion of mutual fund assets to non-mutual fund assets.
| VI. | NATURE AND QUALITY OF THE ADVISER’S SERVICES, INCLUDING THE PERFORMANCE OF THE FUND |
With assets under management of approximately $501 billion as of April 30, 2010, the Adviser has the investment experience to manage and provide non-investment services (described in Section I) to the Portfolio.
Since the Portfolio has not yet commenced operations, the Portfolio has no performance history. However, the Adviser manages other investment companies that have a substantially similar investment style as the anticipated Core Plus
| 13 | The Deli study was originally published in 2002 based on 1997 data. |
| 14 | As mentioned previously, the Supreme Court cautioned against accepting mutual fund fee comparisons without careful scrutiny since the fees may not be the product of negotiations conducted at arms length. See Jones V. Harris at 14. |
| 15 | The two dimensional analysis showed patterns of lower advisory fees for funds with larger asset sizes and funds from larger family sizes compared to funds with smaller asset sizes and funds from smaller family sizes, which according to the independent consultant is indicative of a sharing of economies of scale and scope. However, in less liquid and active markets, such is not the case, as the empirical analysis showed potential for diseconomies of scale in those markets. The empirical analysis also showed diminishing economies of scale and scope as funds surpassed a certain high level of assets. |
| ALLIANCEBERNSTEIN TAXABLE MULTI-SECTOR INCOME SHARES • | 49 |
SMA, and their 1, 3, 5 and 10 net performance returns as of April 30, 2010, along with their benchmarks are set forth in the table below:
Periods Ending April 30, 2010 Annualized Net Performance (%) | ||||||||||||||||
1 Year (%) | 3 Year (%) | 5 Year (%) | 10 Year (%) | |||||||||||||
| AllianceBernstein Intermediate Bond Fund, Inc. – Class A Shares | 19.13 | 5.79 | 5.06 | 5.69 | ||||||||||||
| Barclays Capital U.S. Aggregate Bond Index | 8.30 | 6.32 | 5.38 | 6.43 | ||||||||||||
| Inception Date: July 1, 1999 | ||||||||||||||||
| AVPS – Intermediate Bond Portfolio – Class A Shares | 20.07 | 6.18 | 5.20 | 5.87 | ||||||||||||
| Barclays Capital U.S. Government Index | 2.18 | 6.14 | 5.06 | 6.06 | ||||||||||||
| Inception Date: September 17, 1992 | ||||||||||||||||
| Sanford C. Bernstein Fund II – Intermediate Duration Institutional Portfolio – Class I Shares | 17.93 | 6.46 | 5.58 | N/A | ||||||||||||
| Barclays Capital U.S. Aggregate Bond Index | 8.30 | 6.32 | 5.38 | N/A | ||||||||||||
| Inception Date: May 17, 2002 | ||||||||||||||||
| Sanford C. Bernstein Fund, Inc. – Intermediate Bond Portfolio – Private Client (“Bernstein”) Class Shares | 17.40 | 6.49 | 5.60 | 5.94 | ||||||||||||
| Barclays Capital U.S. Aggregate Bond Index | 8.30 | 6.32 | 5.38 | 6.43 | ||||||||||||
| Inception Date: January 17, 1989 | ||||||||||||||||
CONCLUSION:
Based on the factors discussed above the Senior Officer’s conclusion is that the proposed fee for the Portfolio is reasonable and within the range of what would have been negotiated at arm’s-length in light of all the surrounding circumstances. This conclusion in respect of the Portfolio is based on an evaluation of all of these factors and no single factor was dispositive.
Dated: June 28, 2010
| 50 | • ALLIANCEBERNSTEIN TAXABLE MULTI-SECTOR INCOME SHARES |
THIS PAGE IS NOT PART OF THE SHAREHOLDER REPORT OR THE FINANCIAL STATEMENTS
ALLIANCEBERNSTEIN FAMILY OF FUNDS
Wealth Strategies Funds
Balanced Wealth Strategy
Conservative Wealth Strategy
Wealth Appreciation Strategy
Tax-Managed Balanced Wealth Strategy
Tax-Managed Conservative Wealth Strategy
Tax-Managed Wealth Appreciation Strategy
Blended Style Funds
International Portfolio
Tax-Managed International Portfolio
U.S. Large Cap Portfolio
Growth Funds
Domestic
Growth Fund
Large Cap Growth Fund
Small Cap Growth Portfolio
Small/Mid Cap Growth Fund
U.S. Strategic Research Portfolio
Global & International
Global Growth Fund
Global Thematic Growth Fund
Greater China ’97 Fund
International Discovery Equity Portfolio
International Growth Fund
Value Funds
Domestic
Core Opportunities Fund
Equity Income Fund*
Growth & Income Fund
Small/Mid Cap Value Fund
Value Fund
Global & International
Global Real Estate Investment Fund
Global Value Fund
International Value Fund
Taxable Bond Funds
Bond Inflation Strategy
Global Bond Fund
High Income Fund
Intermediate Bond Portfolio
Short Duration Portfolio
Unconstrained Bond Fund*
Municipal Bond Funds
Arizona California High Income Massachusetts Michigan Minnesota Municipal Bond Inflation Strategy | National New Jersey New York Ohio Pennsylvania Virginia |
Intermediate Municipal Bond Funds
Intermediate California
Intermediate Diversified
Intermediate New York
Closed-End Funds
Alliance California Municipal Income Fund
Alliance New York Municipal Income Fund
AllianceBernstein Global High Income Fund
AllianceBernstein Income Fund
AllianceBernstein National Municipal Income Fund
The Ibero-America Fund
Alternatives
Market Neutral Strategy-Global
Market Neutral Strategy-U.S.
Real-Asset Strategy*
Balanced
Balanced Shares
Retirement Strategies Funds
2000 Retirement Strategy | 2020 Retirement Strategy | 2040 Retirement Strategy | ||
2005 Retirement Strategy | 2025 Retirement Strategy | 2045 Retirement Strategy | ||
2010 Retirement Strategy | 2030 Retirement Strategy | 2050 Retirement Strategy | ||
2015 Retirement Strategy | 2035 Retirement Strategy | 2055 Retirement Strategy |
We also offer Exchange Reserves,** which serves as the money market fund exchange vehicle for the AllianceBernstein mutual funds.
You should consider the investment objectives, risks, charges and expenses of any AllianceBernstein fund/portfolio carefully before investing. For free copies of our prospectuses, which contain this and other information, visit us online at www.alliancebernstein.com or contact your financial advisor. Please read the prospectus carefully before investing.
| * | Prior to August 31, 2010, Equity Income Fund was named Utility Income Fund. Prior to September 27, 2010, Real-Asset Strategy was named Multi-Asset Inflation Strategy. Prior to February 3, 2011, Unconstrained Bond Fund was named Diversified Yield Fund. |
| ** | An investment in the Fund is not a deposit in a bank and is not insured or guaranteed by the Federal Deposit Insurance Corporation or any other government agency. Although the Fund seeks to preserve the value of your investment at $1.00 per share, it is possible to lose money by investing in the Fund. |
| ALLIANCEBERNSTEIN TAXABLE MULTI-SECTOR INCOME SHARES • | 51 |
Alliancebernstein Family of Funds
NOTES
| 52 | • ALLIANCEBERNSTEIN TAXABLE MULTI-SECTOR INCOME SHARES |
ALLIANCEBERNSTEIN TAXABLE MULTI-SECTOR INCOME SHARES
1345 Avenue of the Americas
New York, NY 10105
800.221.5672
| TMSIS-0151-0411 |  | |
ANNUAL REPORT
AllianceBernstein
Municipal Income Shares
April 30, 2011
Annual Report

Investment Products Offered
| • | Are Not FDIC Insured |
| • | May Lose Value |
| • | Are Not Bank Guaranteed |
The investment return and principal value of an investment in the Fund will fluctuate as the prices of the individual securities in which it invests fluctuate, so that your shares, when redeemed, may be worth more or less than their original cost. You should consider the investment objectives, risks, charges and expenses of the Fund carefully before investing. For a free copy of the Fund’s prospectus, which contains this and other information, visit our website at www.alliancebernstein.com or call your financial advisor or AllianceBernstein® at (800) 227-4618. Please read the prospectus carefully before you invest.
You may obtain performance information current to the most recent month-end by visiting www.alliancebernstein.com.
This shareholder report must be preceded or accompanied by the Fund’s prospectus for individuals who are not current shareholders of the Fund.
You may obtain a description of the Fund’s proxy voting policies and procedures, and information regarding how the Fund voted proxies relating to portfolio securities during the most recent 12-month period ended June 30, without charge. Simply visit AllianceBernstein’s website at www.alliancebernstein.com, or go to the Securities and Exchange Commission’s (the “Commission”) website at www.sec.gov, or call AllianceBernstein at (800) 227-4618.
The Fund files its complete schedule of portfolio holdings with the Commission for the first and third quarters of each fiscal year on Form N-Q. The Fund’s Forms N-Q are available on the Commission’s website at www.sec.gov. The Fund’s Forms N-Q may also be reviewed and copied at the Commission’s Public Reference Room in Washington, DC; information on the operation of the Public Reference Room may be obtained by calling (800) SEC-0330. AllianceBernstein publishes full portfolio holdings for the Fund monthly at www.alliancebernstein.com.
AllianceBernstein Investments, Inc. (ABI) is the distributor of the AllianceBernstein family of mutual funds. ABI is a member of FINRA and is an affiliate of AllianceBernstein L.P., the manager of the funds.
AllianceBernstein® and the AB Logo are registered trademarks and service marks used by permission of the owner, AllianceBernstein L.P.
June 17, 2011
Annual Report
This report provides management’s discussion of fund performance for AllianceBernstein Municipal Income Shares (the “Fund”) for the period from September 1, 2010 (commencement of operations) through April 30, 2011. Please note, shares of this Fund are offered exclusively through registered investment advisers approved by AllianceBernstein L.P. (the “Adviser”).
Investment Objective and Policies
The investment objective of the Fund is to earn the highest level of current income, exempt from federal taxation, that is available consistent with what the Adviser considers to be an appropriate level of risk. The Fund pursues its objective by investing principally in high-yielding municipal securities that may be non-investment grade or investment grade. As a matter of fundamental policy, the Fund invests, under normal circumstances, at least 80% of its net assets in municipal securities that pay interest that is exempt from federal income tax. These securities may pay interest that is subject to the federal alternative minimum tax (“AMT”) for certain taxpayers.
The Adviser selects securities for purchase or sale based on its assessment of the securities’ risk and return characteristics as well as the securities’ impact on the overall risk and return characteristics of the Fund. In making this assessment, the Adviser takes into account various factors including the credit quality and sensitivity to interest rates of the securities under consideration and of the Fund’s other holdings.
The Fund may invest without limit in lower-rated securities (“junk bonds”), which may include securities having the lowest rating, and in unrated securities that, in the Adviser’s judgment, would be lower-rated securities if rated. The Fund may invest in fixed income securities with any maturity or duration. The Fund will seek to increase income for shareholders by investing in longer maturity bonds. Consistent with its objective of seeking a higher level of income, the Fund may experience greater volatility and a higher risk of loss of principal than other municipal funds.
The Fund may also invest in tender option bond transactions (“TOBs”); forward commitments; zero coupon municipal securities and variable, floating and inverse floating rate municipal securities; certain types of mortgage related securities; and derivatives, such as options, futures, forwards and swaps.
The Fund may make short sales of securities or maintain a short position, and may use other investment techniques. The Fund may use leverage for investment purposes to increase income through the use of TOBs and derivative instruments, such as interest rate swaps.
Investment Results
The table on page 4 shows the Fund’s performance compared to its benchmark, the Barclays Capital Municipal Bond Index, for the six-month period ended April 30, 2011, and from commencement of operations (September 1, 2010) through April 30, 2011.
| ALLIANCEBERNSTEIN MUNICIPAL INCOME SHARES • | 1 |
The Fund declined and underperformed its benchmark for the six-month period ended April 30, 2011, and since its inception. For both periods, while yield curve positioning was beneficial, the Fund’s relatively larger positions in lower-rated bonds detracted from performance as these bonds underperformed more highly rated bonds.
Leverage, due to the Fund’s use of TOBs, was beneficial to the Fund’s income since borrowing costs remain significantly below the average earnings on the Fund’s investments. Leverage detracted from the Fund’s total return, however, as it increased the Fund’s overall interest rate sensitivity and interest rates for bonds beyond the intermediate maturity range rose during both periods.
Market Review and Investment Strategy
Although cities and states still face significant stress as they work to close projected budget shortfalls, tax revenues are rising and municipalities are making the necessary hard decisions. The Fund continued to focus buying efforts on bonds backed by essential services, which the Fund’s investment manager, the Municipal Bond Investment Team (the “Team”)
believes are better insulated against the financial difficulties of state and local general obligation and related bonds.
The primary source of tax revenues for localities is property tax, and despite the sharp decline in housing values, growth of property tax revenue collections has remained positive. Bonds backed by fees for essential services such as electricity and water are resistant to budget troubles. Therefore, the Team continues to focus buying activity in these revenue bonds, which they have found to be well insulated from the budget battles and financial difficulties of state and local governments.
Today, due to weak demand and lingering credit-quality concerns, many investors want to buy only the highest rated, highest quality municipal bonds. This has created an opportunity to earn additional yield by buying certain lower-rated bonds that the Team’s research has identified as maintaining strong credit quality. In particular, where possible, the Team has emphasized BBB- and A-rated bonds to take advantage of this extra yield, which is high by historical standards.
| 2 | • ALLIANCEBERNSTEIN MUNICIPAL INCOME SHARES |
HISTORICAL PERFORMANCE
An Important Note About the Value of Historical Performance
The performance shown on the following pages represents past performance and does not guarantee future results. Current performance may be lower or higher than the performance information shown. You may obtain performance information current to the most recent month-end by calling (800) 227-4618. The investment return and principal value of an investment in the Fund will fluctuate, so that your shares, when redeemed, may be worth more or less than their original cost.
Investors should consider the investment objectives, risks, charges and expenses of the Fund/Portfolio carefully before investing. For copies of our prospectus or summary prospectus, which contain this and other information, visit us online at www.alliancebernstein.com or contact your AllianceBernstein Investments representative. Please read the prospectus and/or summary prospectus carefully before investing.
Benchmark Disclosure
The unmanaged Barclays Capital Municipal Bond Index does not reflect fees and expenses associated with the active management of a fund portfolio. The Barclays Capital Municipal Bond Index represents the performance of the long-term tax-exempt bond market consisting of investment grade bonds. An investor cannot invest directly in an index, and its results are not indicative of the performance for any specific investment, including the Fund.
A Word About Risk
The market values of the portfolio’s holdings rise and fall from day to day, so investments may lose value. A bond’s credit rating reflects the issuer’s ability to make timely payments of interest or principal—the lower the rating, the higher the risk of default. If the issuer’s financial strength deteriorates, the issuer’s rating may be lowered and the bond’s value may decline. Debt securities issued by state or local governments may be subject to special political, legal, economic and market factors that can have a significant effect on the portfolio’s yield or value. As interest rates rise, bond prices fall and vice versa—long-term securities tend to rise and fall more than short-term securities. Inflation rate risk is prices for goods and services tend to rise over time, which may erode the purchasing power of investments. Leverage risk is trying to enhance investment returns by borrowing money or using other leverage tools—magnify both gains and losses, resulting in greater volatility. Liquidity risk is the difficulty of purchasing or selling a security at an advantageous time or price. Investing in derivative instruments such as options, futures, forwards or swaps can be riskier than traditional investments, and may be more volatile, especially in a down market.
(Historical Performance continued on next page)
| ALLIANCEBERNSTEIN MUNICIPAL INCOME SHARES • | 3 |
Historical Performance
HISTORICAL PERFORMANCE
(continued from previous page)
THE FUND VS. ITS BENCHMARK PERIODS ENDED APRIL 30, 2011 | NAV Returns | |||||||||||
| 6 Months | Since Inception* | |||||||||||
AllianceBernstein Municipal Income Shares | -5.00% | -4.42% | ||||||||||
Barclays Capital Municipal Bond Index | -1.68% | -2.04% | ||||||||||
GROWTH OF A $10,000 INVESTMENT IN THE FUND
9/1/10* – 4/30/11
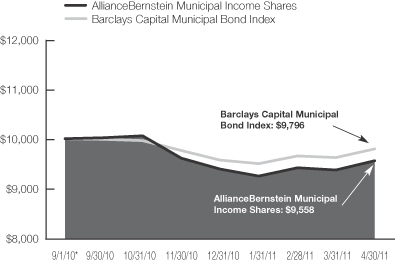
| * | Inception date: 9/1/10. |
This chart illustrates the total value of an assumed $10,000 investment in AllianceBernstein Municipal Income Shares (from 9/1/2010 to 4/30/11) as compared to the performance of the Fund’s benchmark.
See Historical Performance and Benchmark disclosures on previous page.
(Historical Performance continued on next page)
| 4 | • ALLIANCEBERNSTEIN MUNICIPAL INCOME SHARES |
Historical Performance
HISTORICAL PERFORMANCE
(continued from previous page)
| AVERAGE ANNUAL RETURNS AS OF APRIL 30, 2011 | ||||
| NAV Returns | ||||
6 Months | -5.00 | % | ||
Since Inception* | -4.42 | % | ||
| SEC AVERAGE ANNUAL RETURNS (WITH ANY APPLICABLE SALES CHARGES) AS OF THE MOST RECENT CALENDAR QUARTER-END (MARCH 31, 2011) | ||||
| | SEC Returns | | ||
6 Months | -6.50 | % | ||
Since Inception* | -6.27 | % | ||
The prospectus fee table shows the fees and the Total Fund Operating Expenses of the Fund as 0.00% because the Adviser does not charge any fees or expenses and reimburses, or pays for, the Fund’s operating expenses. Participants in a wrap fee program eligible to invest in the Fund pay fees to the program sponsor and should review the wrap program brochure provided by the sponsor for a discussion of fees and expenses charged.
| * | Inception Date: 9/1/10. |
See Historical Performance disclosures on page 3.
| ALLIANCEBERNSTEIN MUNICIPAL INCOME SHARES • | 5 |
Historical Performance
FUND EXPENSES
(unaudited)
As a shareholder of the Fund, you may incur various ongoing non-operating and extraordinary costs. This example is intended to help you understand your ongoing costs (in dollars) of investing in the Fund and to compare these costs with the ongoing costs of investing in other mutual funds.
The Example is based on an investment of $1,000 invested at the beginning of the period and held for the entire period as indicated below.
Actual Expenses
The table below provides information about actual account values and actual expenses. You may use the information in this line, together with the amount you invested, to estimate the expenses that you paid over the period. Simply divide your account value by $1,000 (for example, an $8,600 account value divided by $1,000 = 8.6), then multiply the result by the number in the first line under the heading entitled “Expenses Paid During Period” to estimate the expenses you paid on your account during this period.
Hypothetical Example for Comparison Purposes
The table below provides information about hypothetical account values and hypothetical expenses based on the Fund’s actual expense ratio and an assumed annual rate of return of 5% before expenses, which is not the Fund’s actual return. The hypothetical account values and expenses may not be used to estimate the actual ending account balance or expenses you paid for the period. You may use this information to compare the ongoing costs of investing in the Fund and other funds by comparing this 5% hypothetical example with the 5% hypothetical examples that appear in the shareholder reports of other funds.
Please note that the expenses shown in the table are meant to highlight your ongoing costs only and do not reflect any transactional costs, such as sales charges (loads), or contingent deferred sales charges on redemptions. Therefore, the hypothetical example is useful in comparing ongoing costs only, and will not help you determine the relative total costs of owning different funds. In addition, if these transactional costs were included, your costs would have been higher.
| Beginning Account Value November 1, 2010 | Ending Account Value April 30, 2011 | Expenses Paid During Period* | ||||||||||||||||||||||
| Actual | Hypothetical | Actual | Hypothetical** | Actual | Hypothetical | |||||||||||||||||||
| Class A | $ | 1,000 | $ | 1,000 | $ | 950.04 | $ | 1,024.70 | $ | 0.10 | $ | 0.10 | ||||||||||||
| * | Expenses equal to the Fund's annualized expense ratio of 0.02% represents interest expense incurred. The Fund's operating expenses are borne by the Adviser or its affiliates. |
| ** | Assumes 5% return before expenses. |
| 6 | • ALLIANCEBERNSTEIN MUNICIPAL INCOME SHARES |
Fund Expenses
PORTFOLIO SUMMARY
April 30, 2011 (unaudited)
PORTFOLIO STATISTICS
Net Assets ($mil): $9.4
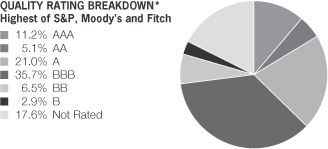
| * | All data are as of April 30, 2011. The Fund’s quality rating breakdown is expressed as a percentage of the Portfolio’s total investments in municipal securities and may vary over time. The quality ratings are determined by using the Standard & Poor’s Ratings Services, Moody’s Investors Services, Inc. and Fitch Ratings, Ltd. Quality breakdown is the measure of the quality and safety of a bond or portfolio, based on the issuer’s financial condition. AAA is the highest (best) and D is the lowest (worst). The Not Rated category includes bonds that are not rated by a Nationally Recognized Statistical Rating Organization. |
| ALLIANCEBERNSTEIN MUNICIPAL INCOME SHARES • | 7 |
Portfolio Summary
PORTFOLIO OF INVESTMENTS
April 30, 2011
| Principal Amount (000) | U.S. $ Value | |||||||
MUNICIPAL OBLIGATIONS – 104.8% | ||||||||
Long-Term Municipal Bonds – 104.8% | ||||||||
Alabama – 2.1% | ||||||||
Selma AL IDB | $ | 200 | $ | 193,834 | ||||
Arizona – 2.9% | ||||||||
Downtown Phoenix Hotel Corp. AZ | 150 | 112,154 | ||||||
Salt Verde Fin Corp. Gas | 200 | 164,246 | ||||||
| 276,400 | ||||||||
California – 10.6% | ||||||||
California GO | 300 | 279,558 | ||||||
California Mun Fin Auth | 85 | 86,429 | ||||||
California Statewide CDA | 100 | 100,615 | ||||||
Golden St Tobacco Sec CA | 100 | 60,733 | ||||||
Los Angeles CA Dept Arpts | 300 | 297,000 | ||||||
Turlock CA Hlth Fac COP | 210 | 169,926 | ||||||
| 994,261 | ||||||||
Colorado – 3.8% | ||||||||
Park Creek Met Dist CO | 200 | 177,834 | ||||||
Regional Trnsp Dist CO | 200 | 181,320 | ||||||
| 359,154 | ||||||||
| 8 | • ALLIANCEBERNSTEIN MUNICIPAL INCOME SHARES |
Portfolio of Investments
| Principal Amount (000) | U.S. $ Value | |||||||
District of Columbia – 1.1% | ||||||||
District of Columbia | $ | 100 | $ | 98,946 | ||||
Florida – 4.2% | ||||||||
Miami Beach FL Hlth Fac Auth | 200 | 204,512 | ||||||
Mid-Bay Brdg Auth FL | 100 | 100,207 | ||||||
Palm Beach Cnty FL Hlth Fac Auth | 100 | 90,055 | ||||||
| 394,774 | ||||||||
Georgia – 1.9% | ||||||||
De Kalb Cnty GA Hosp Auth | 200 | 180,124 | ||||||
Idaho – 2.1% | ||||||||
Idaho Hsg & Fin Assn | 200 | 197,654 | ||||||
Illinois – 7.9% | ||||||||
Illinois Finance Auth | 200 | 172,066 | ||||||
Illinois Finance Auth | 100 | 97,180 | ||||||
Illinois Finance Auth | 100 | 81,840 | ||||||
Illinois Finance Auth | 100 | 100,696 | ||||||
Illinois Finance Auth | 100 | 98,336 | ||||||
Illinois Finance Auth | 200 | 190,784 | ||||||
| 740,902 | ||||||||
| ALLIANCEBERNSTEIN MUNICIPAL INCOME SHARES • | 9 |
Portfolio of Investments
| Principal Amount (000) | U.S. $ Value | |||||||
Indiana – 1.7% | ||||||||
Indiana Finance Auth | $ | 200 | $ | 162,836 | ||||
Louisiana – 3.7% | ||||||||
Louisiana Loc Govt Envrn Fac & CDA | 200 | 186,674 | ||||||
Louisiana Pub Fac Auth | 200 | 162,346 | ||||||
| 349,020 | ||||||||
Massachusetts – 3.1% | ||||||||
Massachusetts Hlth & Ed Facs Auth | 100 | 90,306 | ||||||
Massachusetts Port Auth | 205 | 199,590 | ||||||
| 289,896 | ||||||||
Michigan – 5.1% | ||||||||
Kent MI Hosp Fin Auth | 40 | 36,453 | ||||||
Michigan Hosp Fin Auth | 200 | 178,124 | ||||||
Wayne Cnty MI Arpt Auth | 300 | 269,364 | ||||||
| 483,941 | ||||||||
Missouri – 0.9% | ||||||||
Missouri Hlth & Ed Fac Auth | 100 | 86,995 | ||||||
New Jersey – 3.9% | ||||||||
New Jersey EDA | 100 | 90,019 | ||||||
6.40%, 9/15/23 | 100 | 94,134 | ||||||
| 10 | • ALLIANCEBERNSTEIN MUNICIPAL INCOME SHARES |
Portfolio of Investments
| Principal Amount (000) | U.S. $ Value | |||||||
New Jersey Hlth Care Fac Fin Auth | $ | 100 | $ | 86,662 | ||||
Tobacco Settlement Fin Corp. NJ | 150 | 92,949 | ||||||
| 363,764 | ||||||||
New York – 2.1% | ||||||||
Nassau Cnty NY IDA | 100 | 94,192 | ||||||
New York NY IDA | 100 | 101,304 | ||||||
| 195,496 | ||||||||
North Carolina – 0.9% | ||||||||
North Carolina Med Care Comm | 100 | 85,695 | ||||||
Ohio – 6.7% | ||||||||
Buckeye OH Tob Stlmnt Fin Auth | 150 | 100,303 | ||||||
Butler Cnty OH Hosp Fac | 300 | 245,433 | ||||||
Erie Cnty OH Hosp | 210 | 163,445 | ||||||
Lorain Cnty OH Port Auth | 120 | 123,137 | ||||||
| 632,318 | ||||||||
Pennsylvania – 4.5% | ||||||||
Allegheny Cnty PA Hosp Dev Auth | 105 | 78,926 | ||||||
Cumberland Cnty PA Mun Auth | 180 | 156,600 | ||||||
Montgomery Cnty PA IDA | 200 | 192,350 | ||||||
| 427,876 | ||||||||
| ALLIANCEBERNSTEIN MUNICIPAL INCOME SHARES • | 11 |
Portfolio of Investments
| Principal Amount (000) | U.S. $ Value | |||||||
Puerto Rico – 1.9% | ||||||||
Puerto Rico Sales Tax Fin Corp. | $ | 200 | $ | 182,198 | ||||
Rhode Island – 0.9% | ||||||||
Tobacco Settlement Fin Corp. RI | 100 | 86,724 | ||||||
South Carolina – 2.2% | ||||||||
South Carolina Pub Svc Auth | 200 | 203,368 | ||||||
South Dakota – 0.8% | ||||||||
Sioux Falls SD Hlth Fac | 100 | 78,995 | ||||||
Tennessee – 1.8% | ||||||||
Johnson City TN Hlth & Ed | 200 | 172,064 | ||||||
Texas – 9.2% | ||||||||
Brazos River TX Hbr Nav Dist | 200 | 194,498 | ||||||
Tarrant Cnty TX Cult Ed Fac Fin Corp. | 200 | 183,942 | ||||||
Texas Private Acvty Bond Srfc Trnsp Corp. | 200 | 204,582 | ||||||
Texas Private Acvty Bond Srfc Trnsp Corp. | 200 | 203,164 | ||||||
Viridian Mun Mgmt Dist TX | 75 | 75,447 | ||||||
| 861,633 | ||||||||
Utah – 4.2% | ||||||||
Timber Lakes UT Wtr Spl Svc Dist | 100 | 98,768 | ||||||
Utah St Charter Sch Fin Auth | 100 | 99,095 | ||||||
Utah St Charter Sch Fin Auth | 100 | 97,851 | ||||||
| 12 | • ALLIANCEBERNSTEIN MUNICIPAL INCOME SHARES |
Portfolio of Investments
| Principal Amount (000) | U.S. $ Value | |||||||
Utah St Charter Sch Fin Auth | $ | 100 | $ | 97,331 | ||||
| 393,045 | ||||||||
Virginia – 1.8% | ||||||||
Tobacco Settlement Fin Corp. VA | 300 | 172,608 | ||||||
Washington – 12.8% | ||||||||
Washington St GO | 1,000 | 1,110,000 | ||||||
Washington St HFC | 140 | 96,313 | ||||||
| 1,206,313 | ||||||||
Total Investments – 104.8% | 9,870,834 | |||||||
Other assets less liabilities – (4.8)% | (452,304 | ) | ||||||
Net Assets – 100.0% | $ | 9,418,530 | ||||||
| (a) | Security represents the underlying municipal obligation of an inverse floating rate obligation held by the Fund (see Note G). |
As of April 30, 2011, the Portfolio held 6.2% of net assets in insured bonds (of this amount 0.0% represents the Portfolio’s holding in pre-refunded or escrowed to maturity bonds).
Glossary:
AMBAC – Ambac Assurance Corporation
CDA – Community Development Authority
COP – Certificate of Participation
EDA – Economic Development Agency
FGIC – Financial Guaranty Insurance Company
GO – General Obligation
HFC – Housing Finance Corporation
IDA – Industrial Development Authority/Agency
IDB – Industrial Development Board
NPFGC-RE – National Public Finance Guarantee Corporation Reinsuring FGIC
SD – School District
See notes to financial statements.
| ALLIANCEBERNSTEIN MUNICIPAL INCOME SHARES • | 13 |
Portfolio of Investments
STATEMENT OF ASSETS & LIABILITIES
April 30, 2011
| Assets | ||||
Investments in securities, at value (cost $10,514,269) | $ | 9,870,834 | ||
Interest receivable | 206,056 | |||
Total assets | 10,076,890 | |||
| Liabilities | ||||
Due to custodian | 75,902 | |||
Payable for floating rate notes issued* | 565,000 | |||
Dividends payable | 16,982 | |||
Interest payable | 476 | |||
Total liabilities | 658,360 | |||
Net Assets | $ | 9,418,530 | ||
| Composition of Net Assets | ||||
Shares of beneficial interest, at par | $ | 10 | ||
Additional paid-in capital | 10,192,258 | |||
Accumulated net realized loss on investment transactions | (130,303 | ) | ||
Net unrealized depreciation on investments | (643,435 | ) | ||
| $ | 9,418,530 | |||
Net Asset Value Per Share—unlimited shares of beneficial interest authorized, $.00001 par value (based on 1,019,687 common shares outstanding) | $ | 9.24 | ||
| * | Represents short-term floating rate certificates issued by tender option bond trusts (see Note G). |
See notes to financial statements.
| 14 | • ALLIANCEBERNSTEIN MUNICIPAL INCOME SHARES |
Statement of Assets & Liabilities
STATEMENT OF OPERATIONS
For the Period September 1, 2010(a) to April 30, 2011
| Investment Income | ||||||||
Interest | $ | 321,029 | ||||||
Dividends-Affiliated issuers | 5 | |||||||
Total income | $ | 321,034 | ||||||
| Expenses | ||||||||
Interest expense | 1,136 | |||||||
Total expenses | 1,136 | |||||||
Net investment income | 319,898 | |||||||
| Realized and Unrealized Loss on Investment Transactions | ||||||||
Net realized loss on investment transactions | (130,303 | ) | ||||||
Net change in unrealized appreciation/depreciation of investments | (643,435 | ) | ||||||
Net loss on investment transactions | (773,738 | ) | ||||||
Net Decrease in Net Assets from Operations | $ | (453,840 | ) | |||||
| (a) | Commencement of operations. |
See notes to financial statements.
| ALLIANCEBERNSTEIN MUNICIPAL INCOME SHARES • | 15 |
Statement of Operations
STATEMENT OF CHANGES IN NET ASSETS
| September 1, 2010(a) to April 30, 2011 | ||||
| Increase (Decrease) in Net Assets from Operations | ||||
Net investment income | $ | 319,898 | ||
Net realized loss on investment transactions | (130,303 | ) | ||
Net change in unrealized appreciation/depreciation of investments | (643,435 | ) | ||
Net decrease in net assets from operations | (453,840 | ) | ||
| Dividends to Shareholders from | ||||
Net investment income | (319,898 | ) | ||
| Transactions in Shares of Beneficial Interest | ||||
Net increase | 10,192,268 | |||
Total increase | 9,418,530 | |||
| Net Assets | ||||
Beginning of period | – 0 | – | ||
End of period (including undistributed net investment income of $0) | $ | 9,418,530 | ||
| (a) | Commencement of operations. |
See notes to financial statements.
| 16 | • ALLIANCEBERNSTEIN MUNICIPAL INCOME SHARES |
Statement of Changes in Net Assets
NOTES TO FINANCIAL STATEMENTS
April 30, 2011
NOTE A
Significant Accounting Policies
AllianceBernstein Corporate Shares (the “Trust”) was organized as a Massachusetts business trust under the laws of The Commonwealth of Massachusetts by an Agreement and Declaration of Trust (“Declaration of Trust”) dated January 26, 2004. The Trust is registered under the Investment Company Act of 1940, as an open-end, diversified management investment company. The Trust operates as a “series” company currently having four separate portfolios: AllianceBernstein Corporate Income Shares, AllianceBernstein Municipal Income Shares (the “Portfolio”), AllianceBernstein Taxable Multi-Sector Income Shares and AllianceBernstein Tax-Aware Real Return Income Shares. Each Portfolio is considered to be a separate entity for financial reporting and tax purposes. AllianceBernstein Corporate Income Shares commenced operations on December 11, 2006. AllianceBernstein Municipal Income Shares commenced operations on September 1, 2010. AllianceBernstein Taxable Multi-Sector Income Shares commenced operations on September 15, 2010. AllianceBernstein Tax-Aware Real Return Income Shares commenced operations on May 2, 2011. This report relates only to AllianceBernstein Municipal Income Shares.
Shares of the Portfolio are offered exclusively to holders of accounts established under wrap-fee programs sponsored and maintained by certain registered investment advisers approved by AllianceBernstein L.P. (the “Adviser”). The Portfolio’s shares may be purchased at the relevant net asset value without a sales charge or other fee. The financial statements have been prepared in conformity with U.S. generally accepted accounting principles (“U.S. GAAP”) which require management to make certain estimates and assumptions that affect the reported amounts of assets and liabilities in the financial statements and amounts of income and expenses during the reporting period. Actual results could differ from those estimates. The following is a summary of significant accounting policies followed by the Portfolio.
1. Security Valuation
Portfolio securities are valued at their current market value determined on the basis of market quotations or, if market quotations are not readily available or are deemed unreliable, at “fair value” as determined in accordance with procedures established by and under the general supervision of the Trust’s Board of Trustees.
In general, the market value of securities which are readily available and deemed reliable are determined as follows. Securities listed on a national securities exchange (other than securities listed on the NASDAQ Stock Market, Inc. (“NASDAQ”)) or on a foreign securities exchange are valued at the last sale price at the close of the exchange or foreign securities exchange. If there has been no sale on such day, the securities are valued at the mean of the closing bid and asked prices on such day. Securities listed on more than one exchange are valued by reference to the principal exchange on which the securities are traded;
| ALLIANCEBERNSTEIN MUNICIPAL INCOME SHARES • | 17 |
Notes to Financial Statements
securities listed only on NASDAQ are valued in accordance with the NASDAQ Official Closing Price; listed put or call options are valued at the last sale price. If there has been no sale on that day, such securities will be valued at the closing bid prices on that day; open futures contracts and options thereon are valued using the closing settlement price or, in the absence of such a price, the most recent quoted bid price. If there are no quotations available for the day of valuation, the last available closing settlement price is used; securities traded in the over-the-counter market (“OTC”) are valued at the mean of the current bid and asked prices as reported by the National Quotation Bureau or other comparable sources; U.S. government securities and other debt instruments having 60 days or less remaining until maturity are valued at amortized cost if their original maturity was 60 days or less; or by amortizing their fair value as of the 61st day prior to maturity if their original term to maturity exceeded 60 days; fixed-income securities, including mortgage backed and asset backed securities, may be valued on the basis of prices provided by a pricing service or at a price obtained from one or more of the major broker/dealers. In cases where broker/dealer quotes are obtained, the Adviser may establish procedures whereby changes in market yields or spreads are used to adjust, on a daily basis, a recently obtained quoted price on a security; and OTC and other derivatives are valued on the basis of a quoted bid price or spread from a major broker/dealer in such security. Investments in money market funds are valued at their net asset value each day.
Securities for which market quotations are not readily available (including restricted securities) or are deemed unreliable are valued at fair value. Factors considered in making this determination may include, but are not limited to, information obtained by contacting the issuer, analysts, analysis of the issuer’s financial statements or other available documents. In addition, the Portfolio may use fair value pricing for securities primarily traded in non-U.S. markets because most foreign markets close well before the Portfolio values its securities at 4:00 p.m., Eastern Time. The earlier close of these foreign markets gives rise to the possibility that significant events, including broad market moves, may have occurred in the interim and may materially affect the value of those securities.
2. Fair Value Measurements
In accordance with U.S. GAAP regarding fair value measurements, fair value is defined as the price that the Portfolio would receive to sell an asset or pay to transfer a liability in an orderly transaction between market participants at the measurement date. The U.S. GAAP disclosure requirements establish a framework for measuring fair value, and a three-level hierarchy for fair value measurements based upon the transparency of inputs to the valuation of an asset or liability. Inputs may be observable or unobservable and refer broadly to the assumptions that market participants would use in pricing the asset or liability. Observable inputs reflect the assumptions market participants would use in pricing the asset or liability based on market data obtained from sources independent of the Portfolio. Unobservable inputs reflect the Portfolio’s own
| 18 | • ALLIANCEBERNSTEIN MUNICIPAL INCOME SHARES |
Notes to Financial Statements
assumptions about the assumptions that market participants would use in pricing the asset or liability based on the best information available in the circumstances. Each investment is assigned a level based upon the observability of the inputs which are significant to the overall valuation. The three-tier hierarchy of inputs is summarized below.
| • | Level 1—quoted prices in active markets for identical investments |
| • | Level 2—other significant observable inputs (including quoted prices for similar investments, interest rates, prepayment speeds, credit risk, etc.) |
| • | Level 3—significant unobservable inputs (including the Portfolio’s own assumptions in determining the fair value of investments) |
The following table summarizes the valuation of the Portfolio’s investments by the above fair value hierarchy levels as of April 30, 2011:
Investments in Securities | Level 1 | Level 2 | Level 3 | Total | ||||||||||||
Assets: | ||||||||||||||||
Long-Term Municipal Bonds | $ | – 0 | – | $ | 9,870,834 | $ | – 0 | – | $ | 9,870,834 | ||||||
Total Investments in Securities | – 0 | – | 9,870,834 | – 0 | – | 9,870,834 | ||||||||||
Other Financial Instruments* | – 0 | – | – 0 | – | – 0 | – | – 0 | – | ||||||||
Total | $ | – 0 | – | $ | 9,870,834 | – 0 | – | $ | 9,870,834 | |||||||
| * | Other financial instruments are derivative instruments, such as futures, forwards and swap contracts, which are valued at the unrealized appreciation/depreciation on the instrument. |
3. Taxes
It is the Portfolio’s policy to meet the requirements of the Internal Revenue Code applicable to regulated investment companies and to distribute all of its investment company taxable income and net realized gains, if any, to shareholders. Therefore, no provisions for federal income or excise taxes are required.
In accordance with U.S. GAAP requirements regarding accounting for uncertainties in income taxes, management has analyzed the Portfolio’s tax positions taken or expected to be taken on federal and state income tax returns for all open tax years and has concluded that no provision for income tax is required in the Portfolio’s financial statements.
4. Investment Income and Investment Transactions
Dividend income is recorded on the ex-dividend date or as soon as the Portfolio is informed of the dividend. Interest income is accrued daily. Investment transactions are accounted for on the date the securities are purchased or sold. Investment gains or losses are determined on the identified cost basis. The Portfolio amortizes premiums and accretes discounts as adjustments to interest income.
| ALLIANCEBERNSTEIN MUNICIPAL INCOME SHARES • | 19 |
Notes to Financial Statements
5. Dividends and Distributions
Dividends and distributions to shareholders, if any, are recorded on the ex-dividend date. Income dividends and capital gains distributions are determined in accordance with federal tax regulations and may differ from those determined in accordance with U.S. GAAP. To the extent these differences are permanent, such amounts are reclassified within the capital accounts based on their federal tax basis treatment; temporary differences do not require such reclassification.
NOTE B
Advisory Fee and Other Transactions with Affiliates
Under the terms of the Advisory Agreement, the Portfolio pays no advisory fee to the Adviser and the Adviser reimburses or pays for the Portfolio’s operating expenses. The Portfolio is an integral part of separately managed accounts in wrap-fee programs. Typically, participants in these programs pay a fee to their investment adviser for all costs and expenses of the separately managed account, including costs and expenses associated with the Portfolio. The Adviser serves as investment manager and adviser of the Portfolio and continuously furnishes an investment program for the Portfolio and manages, supervises and conducts the affairs of the Portfolio, subject to the supervisions of the Portfolio’s Board of Trustees. The Advisory Agreement provides that the Adviser or an affiliate will furnish, or pay the expenses of the Portfolio for, office space, facilities and equipment, services of executive and other personnel of the Portfolio and certain administrative services.
The Portfolio has entered into a Distribution Agreement (the “Agreement”) with AllianceBernstein Investments, Inc., the Portfolio’s principal underwriter (the “Underwriter”), to permit the Underwriter to distribute the Portfolio’s shares, which are sold at their net asset value without any sales charge. The Portfolio does not pay a fee for this service. The Underwriter is a wholly owned subsidiary of the Adviser.
AllianceBernstein Investor Services, Inc. (“ABIS”), a wholly-owned subsidiary of the Adviser, acts as the Portfolios’ registrar, transfer agent and dividend-disbursing agent. ABIS registers the transfer, issuance and redemption of Portfolio shares and disburses dividends and other distributions to Portfolio shareholders. The Portfolio does not pay a fee for this service.
The Portfolio may invest in the AllianceBernstein Fixed-Income Shares, Inc.—Government STIF Portfolio, an open-end management investment company managed by the Adviser. The Government STIF Portfolio is offered as a cash management option to mutual funds and other institutional accounts of the Adviser, and is not available for direct purchase by members of the public. The Government STIF Portfolio pays no investment management fees but does bear
| 20 | • ALLIANCEBERNSTEIN MUNICIPAL INCOME SHARES |
Notes to Financial Statements
its own expenses. A summary of the Portfolio’s transactions in shares of the Government STIF Portfolio for the period ended April 30, 2011 is as follows:
Market Value September 1, 2010(a) (000) | Purchases at Cost (000) | Sales Proceeds (000) | Market Value April 30, 2011 (000) | Dividend Income (000) | ||||||||||||||
| $ | 0 | $ | 154 | $ | 154 | $ | 0 | $ | 0 | * | ||||||||
| (a) | Commencement of operations. |
| * | Amount is less than $500. |
NOTE C
Investment Transactions
Purchases and sales of investment securities (excluding short-term investments) for the period ended April 30, 2011 were as follows:
| Purchases | Sales | |||||||
Investment securities (excluding | $ | 11,789,551 | $ | 1,143,234 | ||||
U.S. government securities | – 0 | – | – 0 | – | ||||
The cost of investments for federal income tax purposes, gross unrealized appreciation and unrealized depreciation are as follows:
Cost | $ | 9,949,740 | ||
Gross unrealized appreciation | $ | 87,894 | ||
Gross unrealized depreciation | (732,276 | ) | ||
Net unrealized depreciation | $ | (644,382 | ) | |
NOTE D
Shares of Beneficial Interest
Transactions in shares of beneficial interest were as follows:
| Shares | Amount | |||||||||||||||
| September 1, 2010(a) to April 30, 2011 | September 1, 2010(a) to April 30, 2011 | |||||||||||||||
| Class A | ||||||||||||||||
Shares sold | 1,019,687 | $ | 10,192,268 | |||||||||||||
Net increase | 1,019,687 | $ | 10,192,268 | |||||||||||||
| (a) | Commencement of operations. |
NOTE E
Risks Involved in Investing in the Portfolio
Municipal Market Risk and Concentration of Credit Risk—This is the risk that special factors may adversely affect the value of municipal securities and have a significant effect on the yield or value of the Portfolio’s investments in municipal securities. These factors include economic conditions, political or legislative
| ALLIANCEBERNSTEIN MUNICIPAL INCOME SHARES • | 21 |
Notes to Financial Statements
changes, uncertainties related to the tax status of municipal securities, or the rights of investors in these securities. To the extent that the Portfolio invests more of its assets in a particular state’s municipal securities, the Portfolio may be vulnerable to events adversely affecting that state, including economic, political and regulatory occurrences, court decisions, terrorism and catastrophic natural disasters, such as hurricanes or earthquakes. The Portfolio’s investments in certain municipal securities with principal and interest payments that are made from the revenues of a specific project or facility, and not general tax revenues, may have increased risks. Factors affecting the project or facility, such as local business or economic conditions, could have a significant effect on the project’s ability to make payments of principal and interest on these securities.
Bond Insurer Risk—The Portfolio may purchase municipal securities that are insured under policies issued by certain insurance companies. Historically, insured municipal securities typically received a higher credit rating, which meant that the issuer of the securities paid a lower interest rate. As a result of declines in the credit quality and associated downgrades of most fund insurers, insurance has less value than it did in the past. The market now values insured municipal securities primarily based on the credit quality of the issuer of the security with little value given to the insurance feature. In purchasing such insured securities, the Adviser evaluates the risk and return of municipal securities through its own research.
The ratings of most insurance companies have been downgraded and it is possible that an insurance company may become insolvent. If an insurance company’s rating is downgraded or the company becomes insolvent, the prices of municipal securities insured by the insurance company may decline.
The Adviser believes that downgrades in insurance company ratings or insurance company insolvencies present limited risk to the Portfolio. The generally investment grade underlying credit quality of the insured municipal securities reduces the risk of a significant reduction in the value of the insured municipal security.
Financing and Related Transactions; Leverage and Other Risks—The Portfolio may utilize financial leverage, including tender option bond transactions, to seek to enhance the yield and net asset value. These objectives may not be achieved in all interest rate environments. Leverage creates certain risks for shareholders, including the likelihood of greater volatility of the net asset value. If income from the securities purchased from the funds made available by leverage is not sufficient to cover the cost of leverage, the Portfolio’s return will be less than if leverage had not been used. As a result, the amounts available for distribution as dividends and other distributions will be reduced. During periods of rising short-term interest rates, the interest paid on the floaters in tender option bond transactions would increase, which may adversely affect the Portfolio’s income and distribution to shareholders. A decline in distributions would adversely affect the
| 22 | • ALLIANCEBERNSTEIN MUNICIPAL INCOME SHARES |
Notes to Financial Statements
Portfolio’s yield and possibly the market value of its shares. If rising short-term rates coincide with a period of rising long-term rates, the value of the long-term municipal bonds purchased with the proceeds of leverage would decline, adversely affecting the net asset value and possibly the market value of the shares.
In a tender option bond transaction, the Portfolio may transfer a highly rated fixed-rate municipal security to a broker, which, in turn, deposits the bond into a special purpose vehicle (typically, a trust) usually sponsored by the broker. The Portfolio receives cash and a residual interest security (sometimes referred to as an “inverse floater”) issued by the trust in return. The trust simultaneously issues securities, which pay an interest rate that is reset each week based on an index of high-grade short-term seven-day demand notes. These securities, sometimes referred to as “floaters”, are bought by third parties, including tax-exempt money market funds, and can be tendered by these holders to a liquidity provider at par, unless certain events occur. The Portfolio continues to earn all the interest from the transferred bond less the amount of interest paid on the floaters and the expenses of the trust, which include payments to the trustee and the liquidity provider and organizational costs. The Portfolio also uses the cash received from the transaction for investment purposes or to retire other forms of leverage. Under certain circumstances, the trust may be terminated and collapsed, either by the Portfolio or upon the occurrence of certain events, such as a downgrade in the credit quality of the underlying bond, or in the event holders of the floaters tender their securities to the liquidity provider. See Note G to the Financial Statements “Floating Rate Notes Issued in Connection with Securities Held” for more information about tender option bond transactions.
The Portfolio may also purchase inverse floaters from a tender option bond trust in a secondary market transaction without first owning the underlying bond. The income received from an inverse floater varies inversely with the short-term interest rate paid on the floaters issued by the trust. The prices of inverse floaters are subject to greater volatility than the prices of fixed-income securities that are not inverse floaters. Investments in inverse floaters may amplify the risks of leverage. If short-term interest rates rise, the interest payable on the floaters would increase and income from the inverse floaters decrease.
Indemnification Risk—In the ordinary course of business, the Portfolio enters into contracts that contain a variety of indemnifications. The Portfolio’s maximum exposure under these arrangements is unknown. However, the Portfolio has not had prior claims or losses pursuant to these indemnification provisions and expects the risk of loss thereunder to be remote. Therefore, the Portfolio has not accrued any liability in connection with these indemnification provisions.
| ALLIANCEBERNSTEIN MUNICIPAL INCOME SHARES • | 23 |
Notes to Financial Statements
NOTE F
Distributions to Shareholders
The tax character of distributions paid during the period ended April 30, 2011 was as follows:
| 2011 | ||||
Distributions paid from: | ||||
Ordinary income | $ | 4,156 | ||
Tax-exempt income | 315,742 | |||
Total distributions paid | $ | 319,898 | ||
As of April 30, 2011, the components of accumulated earnings/(deficit) on a tax basis were as follows:
Undistributed tax-exempt income | $ | 16,982 | ||
Accumulated capital and other gains/losses | (129,356 | )(a) | ||
Unrealized appreciation/(depreciation) | (644,382 | )(b) | ||
Total accumulated earnings/(deficit) | $ | (756,756 | )(c) | |
| (a) | At April 30, 2011, the Fund had a post-October capital loss deferral of $129,356. For tax purposes, this loss is deemed to arise on May 1, 2011. |
| (b) | The difference between book-basis and tax-basis unrealized appreciation/(depreciation) is attributable primarily to the tax treatment of tender option bonds. |
| (c) | The difference between book-basis and tax-basis components of accumulated earnings/(deficit) is attributable primarily to dividends payable. |
During the current fiscal period, the Fund had no permanent differences that may affect undistributed net investment income, accumulated net realized loss on investment transactions, and additional paid-in capital.
NOTE G
Floating Rate Notes Issued in Connection with Securities Held
The Portfolio may engage in tender option bond transactions in which the Portfolio may transfer a fixed rate bond to a broker for cash. The broker deposits the fixed rate bond into a Special Purpose Vehicle (the “SPV”, which is generally organized as a trust), organized by the broker. The Portfolio buys a residual interest in the assets and cash flows of the SPV, often referred to as an inverse floating rate obligation (“Inverse Floater”). The SPV also issues floating rate notes (Floating Rate Notes) which are sold to third parties. The Floating Rate Notes pay interest at rates that generally reset weekly and their holders have the option to tender their notes to a liquidity provider for redemption at par. The Inverse Floater held by the Portfolio gives the Portfolio the right (1) to cause the holders of the Floating Rate Notes to tender their notes at par, and (2) to have the trustee transfer the Fixed Rate Bond held by the SPV to the Portfolio, thereby collapsing the SPV. The SPV may also be collapsed in certain other circumstances. In accordance with U.S. GAAP disclosure requirements regarding accounting for transfers and servicing of financial assets and extinguishments of
| 24 | • ALLIANCEBERNSTEIN MUNICIPAL INCOME SHARES |
Notes to Financial Statements
liabilities, the Portfolio accounts for the transaction described above as a secured borrowing by including the Fixed Rate Bond in its portfolio of investments and the Floating Rate Notes as a liability under the caption “Payable for floating rate notes issued” in its statement of assets and liabilities. Interest expense related to the Portfolio’s liability with respect to Floating Rate Notes is recorded as incurred. The interest expense is also included in the Portfolio’s expense ratio. At April 30, 2011, the amount of the Portfolio’s Floating Rate Notes outstanding was $565,000 and the related interest rate was 0.26%.
The Portfolio may also purchase Inverse Floaters in the secondary market without first owning the underlying bond. Such an Inverse Floater is included in the Portfolio’s portfolio of investments but is not required to be treated as a secured borrowing and reflected in the Portfolio’s financial statements as a secured borrowing.
NOTE H
Subsequent Events
Management has evaluated subsequent events for possible recognition or disclosure in the financial statements through the date the financial statements are issued. Management has determined that there are no material events that would require disclosure in the Portfolio’s financial statements through this date.
| ALLIANCEBERNSTEIN MUNICIPAL INCOME SHARES • | 25 |
Notes to Financial Statements
FINANCIAL HIGHLIGHTS
Selected Data For A Share Of Beneficial Interest Outstanding Throughout Each Period
| September 1, 2010(a) to April 30, 2011 | ||||
Net asset value, beginning of period | $10.00 | |||
Income From Investment Operations | ||||
Net investment income(b) | .32 | |||
Net realized and unrealized loss on investment transactions | (.77 | ) | ||
Net decrease in net asset value from operations | (.45 | ) | ||
Less: Dividends | ||||
Dividends from net investment income | (.31 | ) | ||
Net asset value, end of period | $9.24 | |||
Total Return | ||||
Total investment return based on net asset value(c) | (4.42 | )% | ||
Ratios/Supplemental Data | ||||
Net assets, end of period (000’s omitted) | $9,419 | |||
Ratio to average net assets of: | ||||
Expenses(d) | .02 | % | ||
Expenses, excluding interest expense(d) | .00 | % | ||
Net investment income(d) | 5.03 | % | ||
Portfolio turnover rate | 14 | % | ||
| (a) | Commencement of operations. |
| (b) | Based on average shares outstanding. |
| (c) | Total investment return is calculated assuming an initial investment made at the net asset value at the beginning of the period, reinvestment of all dividends and distributions at net asset value during the period, and redemption on the last day of the period. Total return does not reflect the deduction of taxes that a shareholder would pay on fund distributions or the redemption of fund shares. Total investment return calculated for a period of less than one year is not annualized. |
| (d) | Annualized. |
See notes to financial statements.
| 26 | • ALLIANCEBERNSTEIN MUNICIPAL INCOME SHARES |
Financial Highlights
REPORT OF INDEPENDENT REGISTERED
PUBLIC ACCOUNTING FIRM
To the Board of Trustees of AllianceBernstein Corporate Shares and Shareholders of AllianceBernstein Municipal Income Shares:
We have audited the accompanying statement of assets and liabilities of AllianceBernstein Municipal Incomes Shares (one of the portfolios constituting AllianceBernstein Corporate Shares) (the “Portfolio”), including the portfolio of investments, as of April 30, 2011, and the related statements of operations and changes in net assets, and the financial highlights for the period September 1, 2010 (commencement of operations) through April 30, 2011. These financial statements and financial highlights are the responsibility of the Portfolio’s management. Our responsibility is to express an opinion on these financial statements and financial highlights based on our audit.
We conducted our audit in accordance with the standards of the Public Company Accounting Oversight Board (United States). Those standards require that we plan and perform the audit to obtain reasonable assurance about whether the financial statements and financial highlights are free of material misstatement. We were not engaged to perform an audit of the Portfolio’s internal control over financial reporting. Our audit included consideration of internal control over financial reporting as a basis for designing audit procedures that are appropriate in the circumstances, but not for the purpose of expressing an opinion on the effectiveness of the Portfolio’s internal control over financial reporting. Accordingly, we express no such opinion. An audit also includes examining, on a test basis, evidence supporting the amounts and disclosures in the financial statements and financial highlights, assessing the accounting principles used and significant estimates made by management, and evaluating the overall financial statement presentation. Our procedures included confirmation of securities owned as of April 30, 2011 by correspondence with the custodian and others or by other appropriate auditing procedures where replies from others were not received. We believe that our audit provides a reasonable basis for our opinion.
In our opinion, the financial statements and financial highlights referred to above present fairly, in all material respects, the financial position of AllianceBernstein Municipal Income Shares of AllianceBernstein Corporate Shares at April 30, 2011, and the results of its operations, changes in its net assets and the financial highlights for the period September 1, 2010 (commencement of operations) through April 30, 2011, in conformity with
U.S. generally accepted accounting principles.

New York, New York
June 24, 2011
| ALLIANCEBERNSTEIN MUNICIPAL INCOME SHARES • | 27 |
Report of Independent Registered Public Accounting Firm
FEDERAL TAX INFORMATION
(unaudited)
For Federal income tax purposes, the following information is furnished with respect to the distributions paid by the Fund during the taxable period ended April 30, 2011.
The Portfolio designates $315,742 as exempt-interest dividends for the period ended April 30, 2011.
Shareholders should not use the above information to prepare their income tax returns. The information necessary to complete your income tax returns will be included with your Form 1099-DIV which will be sent to you separately in January 2012.
| 28 | • ALLIANCEBERNSTEIN MUNICIPAL INCOME SHARES |
Federal Tax Information
RESULTS OF SHAREHOLDERS MEETING
(unaudited)
The Annual Meeting of Shareholders of AllianceBernstein Corporate Shares (the “Trust”)—AllianceBernstein Municipal Income Shares (the “Portfolio”) was held on November 5, 2010 (the “Meeting”). At the Meeting, with respect to the first item of business, the election of Trustees for the Trust, and with respect to the fifth item of business, changes to the Portfolio’s fundamental policy regarding commodities, the required number of outstanding shares was voted in favor of the proposals, and both proposals were approved. A description of each proposal and number of shares voted at the Meeting are as follows (the proposal numbers shown below correspond to the proposal numbers in the Trust’s proxy statement):
| Voted For | Withheld Authority | |||
1. The election of the Trustees, each such Trustee to serve a term of an indefinite duration and until his or her successor is duly elected and qualifies. | ||||
| John H. Dobkin | 4,054,833 | 0 | ||
| Michael J. Downey | 4,054,833 | 0 | ||
| William H. Foulk, Jr. | 4,054,833 | 0 | ||
| D. James Guzy | 4,054,833 | 0 | ||
| Nancy P. Jacklin | 4,054,833 | 0 | ||
| Robert M. Keith | 4,054,833 | 0 | ||
| Garry L. Moody | 4,054,833 | 0 | ||
| Marshall C. Turner, Jr. | 4,054,833 | 0 | ||
| Earl D. Weiner | 4,054,833 | 0 | ||
Voted For | Voted Against | Abstained | Broker Non-Votes | |||||
5. Approve the amendment of the Portfolio’s fundamental policy regarding commodities. | 1,000,000 | 0 | 0 | 0 |
| ALLIANCEBERNSTEIN MUNICIPAL INCOME SHARES • | 29 |
Results of Shareholders Meeting
BOARD OF TRUSTEES
| William H. Foulk, Jr.(1), Chairman | Robert M. Keith, President and Chief Executive Officer | |
| John H. Dobkin(1) | ||
| Michael J. Downey(1) | Garry L. Moody(1) | |
| D. James Guzy(1) | Marshall C. Turner, Jr.(1) | |
| Nancy P. Jacklin(1) | Earl D. Weiner(1) |
OFFICERS
Philip L. Kirstein, Senior Vice President and Independent Compliance Officer Michael G. Brooks(2), Vice President Robert B. Davidson III(2) , Senior Vice President | Wayne D. Godlin(2), Vice President Terrance T. Hults(2), Vice President Emilie D. Wrapp, Secretary Joseph J. Mantineo, Treasurer and Chief Financial Officer Phyllis J. Clarke, Controller |
Custodian and Accounting Agent State Street Bank and Trust Company
Principal Underwriter AllianceBernstein Investments, Inc.
Transfer Agent AllianceBernstein Investor Services, Inc. | Legal Counsel Seward & Kissel LLP One Battery Park Plaza New York, NY 10004
Independent Registered Public Accounting Firm Ernst & Young LLP 5 Times Square New York, NY 10036 |
| (1) | Member of the Audit Committee, the Governance and Nominating Committee and the Independent Directors Committee. Mr. Foulk is the sole member of the Fair Value Pricing Committee. |
| (2) | The day-to-day management of, and investment decisions for, the Trust’s portfolio are made by the Municipal Bond Investment Team. Messrs. Michael G. Brooks, Robert B. Davidson III, Wayne D. Godlin and Terrance T. Hults are the investment professionals primarily responsible for the day-to-day management of the Trust’s portfolio. |
| 30 | • ALLIANCEBERNSTEIN MUNICIPAL INCOME SHARES |
Board of Trustees
MANAGEMENT OF THE FUND
Board of Trustees Information
The business and affairs of the Trust are managed under the direction of the Board of Trustees. Certain information concerning the Trust’s Trustee is set forth below.
NAME, ADDRESS* and AGE (YEAR FIRST ELECTED**) | PRINCIPAL OCCUPATION(S) DURING PAST FIVE YEARS AND OTHER RELEVANT QUALIFICATIONS*** | PORTFOLIOS IN FUND COMPLEX OVERSEEN BY TRUSTEE | OTHER DIRECTORSHIPS HELD BY TRUSTEE IN THE PAST FIVE YEARS | |||||
| INTERESTED TRUSTEE | ||||||||
Robert M. Keith, # 51 (2010) | Senior Vice President of AllianceBernstein L.P. (the “Adviser”) and the head of AllianceBernstein Investments, Inc. (“ABI”) since July 2008; Director of ABI and President of the AllianceBernstein Mutual Funds. Previously, he served as Executive Managing Director of ABI from December 2006 to June 2008. Prior to joining ABI in 2006, Executive Managing Director of Bernstein Global Wealth Management, and prior thereto, Senior Managing Director and Global Head of Client Service and Sales of the Adviser’s institutional investment management business since 2004. Prior thereto, Managing Director and Head of North American Client Service and Sales in the Adviser’s institutional investment management business, with which he had been associated since prior to 2004. | 99 | None | |||||
| ALLIANCEBERNSTEIN MUNICIPAL INCOME SHARES • | 31 |
Management of the Fund
NAME, ADDRESS* and AGE (YEAR FIRST ELECTED**) | PRINCIPAL OCCUPATION(S) DURING PAST FIVE YEARS AND OTHER RELEVANT QUALIFICATIONS*** | PORTFOLIOS IN FUND COMPLEX OVERSEEN BY TRUSTEE | OTHER DIRECTORSHIPS HELD BY TRUSTEE IN THE PAST FIVE YEARS | |||||
| DISINTERESTED TRUSTEES | ||||||||
Chairman of the Board William H. Foulk, Jr., ##, + 78 (2010) | Investment Adviser and an Independent Consultant since prior to 2006. Previously, he was Senior Manager of Barrett Associates, Inc., a registered investment adviser. He was formerly Deputy Comptroller and Chief Investment Officer of the State of New York and, prior thereto, Chief Investment Officer of the New York Bank for Savings. He has served as a director or trustee of various AllianceBernstein Funds since 1983 and has been Chairman of the AllianceBernstein Funds and of the Independent Directors Committee of such Funds since 2003. He is also active in a number of mutual fund related organizations and committees. | 99 | None | |||||
John H. Dobkin, ## 69 (2010) | Independent Consultant since prior to 2006. Formerly, President of Save Venice, Inc. (preservation organization) from 2001-2002; Senior Advisor from June 1999-June 2000 and President of Historic Hudson Valley (historic preservation) from December 1989-May 1999. Previously, Director of the National Academy of Design. He has served as a director or trustee of various AllianceBernstein Funds since 1992, and as Chairman of the Audit Committees of a number of such Funds from 2001-2008. | 98 | None | |||||
| 32 | • ALLIANCEBERNSTEIN MUNICIPAL INCOME SHARES |
Management of the Fund
NAME, ADDRESS* and AGE (YEAR FIRST ELECTED**) | PRINCIPAL OCCUPATION(S) DURING PAST FIVE YEARS AND OTHER RELEVANT QUALIFICATIONS*** | PORTFOLIOS IN FUND COMPLEX OVERSEEN BY TRUSTEE | OTHER DIRECTORSHIPS HELD BY TRUSTEE IN THE PAST FIVE YEARS | |||||
| DISINTERESTED TRUSTEES (continued) | ||||||||
Michael J. Downey, ## 67 (2010) | Private Investor since prior to 2006. Formerly, managing partner of Lexington Capital, LLC (investment advisory firm) from December 1997 until December 2003. From 1987 until 1993, Chairman and CEO of Prudential Mutual Fund Management, director of the Prudential Mutual funds, and member of the Executive Committee of Prudential Securities Inc. He has served as a director or trustee of the AllianceBernstein Funds since 2005 and is a director of two other registered investment companies (and Chairman of one of them). | 98 | Asia Pacific Fund, Inc. and The Merger Fund since prior to 2006, and Prospect Acquisition Corp. (financial services) since 2007 until 2009 | |||||
D. James Guzy, ## 75 (2010) | Chairman of the Board of PLX Technology (semi-conductors) and of SRC Computers Inc., with which he has been associated since prior to 2006. He was a director of Intel Corporation (semi-conductors) from 1969 until 2008, and served as Chairman of the Finance Committee of such company for several years until May 2008. He has served as a director or trustee of one or more of the AllianceBernstein Funds since 1982. | 98 | Cirrus Logic Corporation (semi-conductors) and PLX Technology (semi-conductors) since prior to 2006 and Intel Corporation (semi-conductors) since prior to 2006 until 2008 | |||||
| ALLIANCEBERNSTEIN MUNICIPAL INCOME SHARES • | 33 |
Management of the Fund
NAME, ADDRESS* and AGE (YEAR FIRST ELECTED**) | PRINCIPAL OCCUPATION(S) DURING PAST FIVE YEARS AND OTHER RELEVANT QUALIFICATIONS*** | PORTFOLIOS IN FUND COMPLEX OVERSEEN BY TRUSTEE | OTHER DIRECTORSHIPS HELD BY TRUSTEE IN THE PAST FIVE YEARS | |||||
| DISINTERESTED TRUSTEES (continued) | ||||||||
Nancy P. Jacklin, ## 63 (2010) | Professorial Lecturer at the Johns Hopkins School of Advanced International Studies since 2008. Formerly, U.S. Executive Director of the International Monetary Fund (December 2002-May 2006); Partner, Clifford Chance (1992-2002); Sector Counsel, International Banking and Finance, and Associate General Counsel, Citicorp (1985-1992); Assistant General Counsel (International), Federal Reserve Board of Governors (1982-1985); and Attorney Advisor, U.S. Department of the Treasury (1973-1982). Member of the Bar of the District of Columbia and of New York; and member of the Council on Foreign Relations. She has served as a director or trustee of the AllianceBernstein Funds since 2006. | 98 | None | |||||
| 34 | • ALLIANCEBERNSTEIN MUNICIPAL INCOME SHARES |
Management of the Fund
NAME, ADDRESS* and AGE (YEAR FIRST ELECTED**) | PRINCIPAL OCCUPATION(S) DURING PAST FIVE YEARS AND OTHER RELEVANT QUALIFICATIONS*** | PORTFOLIOS IN FUND COMPLEX OVERSEEN BY TRUSTEE | OTHER DIRECTORSHIPS HELD BY TRUSTEE IN THE PAST FIVE YEARS | |||||
| DISINTERESTED TRUSTEES (continued) | ||||||||
Garry L. Moody, ## 59 (2010) | Independent Consultant. Formerly, Partner, Deloitte & Touche LLP (1995-2008) where he held a number of senior positions, including Vice Chairman, and U.S. and Global Investment Management Practice Managing Partner; President, Fidelity Accounting and Custody Services Company (1993-1995); and Partner, Ernst & Young LLP (1975-1993), where he served as the National Director of Mutual Fund Tax Services. He is also a member of the Governing Council of the Independent Directors Council (IDC), an organization of independent directors of mutual funds, and serves on that organization’s Education and Communications Committee. He has served as a director or trustee, and as Chairman of the Audit Committee, of most of the AllianceBernstein Funds since 2008. | 98 | None | |||||
| ALLIANCEBERNSTEIN MUNICIPAL INCOME SHARES • | 35 |
Management of the Fund
NAME, ADDRESS* and AGE (YEAR FIRST ELECTED**) | PRINCIPAL OCCUPATION(S) DURING PAST FIVE YEARS AND OTHER RELEVANT QUALIFICATIONS*** | PORTFOLIOS IN FUND COMPLEX OVERSEEN BY TRUSTEE | OTHER DIRECTORSHIPS HELD BY TRUSTEE IN THE PAST FIVE YEARS | |||||
| DISINTERESTED TRUSTEES (continued) | ||||||||
Marshall C. Turner, Jr., ## 69 (2010) | Private Investor since prior to 2006. Interim CEO of MEMC Electronic Materials, Inc. (semi-conductor and solar cell substrates) from November 2008 until March 2009. He was Chairman and CEO of Dupont Photomasks, Inc. (components of semi-conductor manufacturing), 2003-2005, and President and CEO, 2005-2006, after the company was acquired and renamed Toppan Photomasks, Inc. He has extensive experience in venture capital investing including prior service as general partner of three institutional venture capital partnerships, and serves on the boards of a number of education and science-related non-profit organizations. He has served as a director or trustee of one or more of the AllianceBernstein Funds since 1992. | 98 | Xilinx, Inc. (programmable logic semi-conductors) and MEMC Electronic Materials, Inc. (semi-conductor and solar cell substrates) since prior to 2006 until March 2009 | |||||
Earl D. Weiner, ## 71 (2010) | Of Counsel, and Partner prior to January 2007, of the law firm Sullivan & Cromwell LLP and member of ABA Federal Regulation of Securities Committee Task Force to draft editions of the Fund Director’s Guidebook. He also serves as a director or trustee of various non-profit organizations and has served as Chairman or Vice Chairman of a number of them. He has served as a director or trustee of the AllianceBernstein Funds since 2007 and is Chairman of the Governance and Nominating Committees of most of the Funds. | 98 | None | |||||
| 36 | • ALLIANCEBERNSTEIN MUNICIPAL INCOME SHARES |
Management of the Fund
Officers
| NAME, ADDRESS* AND AGE | POSITION(S) HELD WITH FUND | PRINCIPAL OCCUPATION DURING PAST FIVE YEARS | ||
Robert M. Keith 51 | President and Chief Executive Officer | See above. | ||
Philip L. Kirstein 66 | Senior Vice President | Senior Vice President and Independent Compliance Officer of the AllianceBernstein Mutual Funds, with which he has been associated since October 2004. Prior thereto, he was Of Counsel to Kirkpatrick & Lockhart, LLP from October 2003 to October 2004, and General Counsel of Merrill Lynch Investment Managers, L.P. since prior to March 2003. | ||
Michael G. Brooks 63 | Vice President | Senior Vice President of the Adviser**, with which he has been associated since prior to 2006. | ||
Robert B. Davidson, III 50 | Senior Vice President | Senior Vice President of the Adviser**, with which he has been associated since prior to 2006. | ||
Wayne D. Godlin 50 | Vice President | Senior Vice President of the Adviser** since December 2009. Prior thereto, he was an investment manager and a Managing Director of Van Kampen Asset Management with which he had been associated since prior to 2006. | ||
Terrance T. Hults 45 | Vice President | Senior Vice President of the Adviser**, with which he has been associated since prior to 2006. | ||
Emilie D. Wrapp 55 | Secretary | Senior Vice President, Assistant General Counsel and Assistant Secretary of ABI**, with which she has been associated since prior to 2006. | ||
Joseph J. Mantineo 52 | Treasurer and Chief Financial Officer | Senior Vice President of AllianceBernstein Investor Services, Inc. (“ABIS”)**, with which he has been associated since prior to 2006. | ||
Phyllis J. Clarke 50 | Controller | Vice President of ABIS**, with which she has been associated since prior to 2006. |
| * | The address for each of the Portfolio’s Officers is 1345 Avenue of the Americas, New York, NY 10105. |
| ** | The Adviser, ABI and ABIS are affiliates of the Fund. |
| The Trust’s Statement of Additional Information (“SAI”) has additional information about the Trust’s Trustees and Officers and is available without charge upon request. Contact your financial representative or AllianceBernstein at 1-800-227-4618 for a free prospectus or SAI. |
| ALLIANCEBERNSTEIN MUNICIPAL INCOME SHARES • | 37 |
Management of the Fund
THE FOLLOWING IS NOT PART OF THE SHAREHOLDER REPORT OR THE FINANCIAL STATEMENTS
SUMMARY OF SENIOR OFFICER’S EVALUATION OF INVESTMENT ADVISORY AGREEMENT1
The following is a summary of the evaluation of the Investment Advisory Agreement between AllianceBernstein L.P. (the “Adviser”) and The AllianceBernstein Corporate Shares (the “Trust”) with respect to AllianceBernstein Municipal Income Shares (the “Portfolio”).2
Municipal Income Shares is designed to serve the needs of the Adviser’s separately managed account (“SMA”) or “wrap fee” clients. Since SMA clients pay their wrap program provider a unitary fee for managing all investments in their portfolio, the Portfolio will not pay an advisory fee. The Adviser will also reimburse the Portfolio for all of its other operating expenses, except certain extraordinary expenses, taxes, brokerage costs and the interest on borrowed money and on other leveraging methods.
The Portfolio’s investment objective is to earn the highest level of current income, exempt from federal taxation, that is available consistent without what the Adviser considers to be undue risk to principal or income. The Portfolio will invest principally in high yielding municipal securities that may be investment grade or non-investment grade. The Portfolio may also invest in longer maturity bonds, forward commitments, zero coupon municipal securities and variable, floating and invest floating municipal securities, certain types of mortgage related securities and derivative instruments, including tender option bonds (“TOBs”), options, futures, forwards and interest rate swaps. The use of TOBs and interest rate swaps will provide the Portfolio with operational leverage, which the Adviser anticipates, in the aggregate will approximate, under normal market conditions, 130% of the Portfolio’s net assets. The Portfolio may make short sales or maintain a short position, and may use other investment techniques.
The evaluation of the Investment Agreement was prepared by Philip L. Kirstein, the Senior Officer of the Trust, for the Trustees of the Fund, as required by the September 1, 2004 agreement between the Adviser and the New York State Attorney General (the “NYAG”). The Senior Officer’s evaluation of the Investment Advisory Agreement is not meant to diminish the responsibility or authority of the Board of Trustees of the Trust to perform its duties pursuant to Section 15 of the Investment Company Act of 1940 (the ‘40 Act) and applicable state law. The purpose of the summary is to provide shareholders with a synopsis of the independent evaluation of the Portfolio’s Investment Advisory
| 1 | It should be noted that the Senior Officer’s fee evaluation was completed on April 21, 2010 and presented to the Board of Trustees on May 4-6, 2010. |
| 2 | Future references to the Portfolio do not include “AllianceBernstein.” |
| 38 | • ALLIANCEBERNSTEIN MUNICIPAL INCOME SHARES |
Agreement, which was provided to the Trustees in connection with their review of the proposed Investment Advisory Agreement. The Senior Officer’s evaluation considered the following factors:
| 1. | Advisory fees charged to institutional and other clients of the Adviser for like services; |
| 2. | Advisory fees charged by other mutual fund companies for like services; |
| 3. | Costs to the Adviser and its affiliates of supplying services pursuant to the advisory agreements, excluding any intra-corporate profit; |
| 4. | Profit margins of the Adviser and its affiliates from supplying such services; |
| 5. | Possible economies of scale as the Portfolio grows larger; and |
| 6. | Nature and quality of the Adviser’s services including the performance of the Portfolio. |
PORTFOLIO ADVISORY FEES, EXPENSE CAPS, REIMBURSEMENTS, & RATIOS
The Adviser proposed that the Portfolio pays no advisory fee to the Adviser for receiving the services to be provided pursuant to the Investment Advisory Agreement. The Portfolio is designed to serve the needs of the Adviser’s separately managed account (“SMA”) clients. Since SMA clients pay their wrap program provider a unitary fee for managing all investments of their fund, the Portfolio will not pay an advisory fee. The Adviser will also reimburse the Portfolio for all of its other operating expenses, except certain extraordinary expenses, taxes, brokerage costs and the interest on borrowed money or alternative sources of leverage.
The Portfolio will offer only one no-load class of shares, which will be distributed through its principal underwriter, AllianceBernstein Investments, Inc. (“ABI”). Since the Portfolio will pay no advisory fees or expenses, the Portfolio will not have a distribution plan pursuant to Rule 12b-1 under the 40 Act. Set forth below is the Portfolio’s anticipated annual operating expenses in percentages:
| Annual Operating Expenses | % | |||
| Management Fees3 | 0.35 | % | ||
| Distribution Fees | 0.00 | % | ||
| Other Expenses | 0.00 | % | ||
| Fee Waiver / Reimbursements | -0.35 | % | ||
| Net Expenses | 0.00 | % | ||
| 3 | This amount reflects the portion of the wrap fee attributable to the management of the Portfolio. This amount also includes estimated operating expenses of the Portfolio that are paid by the Adviser. |
| ALLIANCEBERNSTEIN MUNICIPAL INCOME SHARES • | 39 |
| I. | ADVISORY FEES CHARGED TO INSTITUTIONAL AND OTHER CLIENTS |
The advisory fees charged to investment companies which the Adviser manages and sponsors are normally higher than those charged to similar sized institutional accounts, including pension plans and sub-advised investment companies. The fee differential reflects, among other things, different services provided to such clients, and different liabilities assumed. Services to be provided by the Adviser to the Portfolio that is not provided to non-investment company clients will include providing office space and personnel to serve as Portfolio Officers, who among other responsibilities make the certifications required under the Sarbanes-Oxley Act of 2002, and coordinating with and monitoring the Portfolio’s third party service providers such as Fund counsel, auditors, custodians, transfer agents and pricing services. The accounting, administrative, legal and compliance requirements for investment companies will be more costly than those for institutional client assets due to the greater complexities and time required for investment companies. The Adviser also believes that it incurs substantial entrepreneurial risk when offering a new mutual fund since establishing a new mutual fund requires a large upfront investment, and it may take a long time for the fund to achieve profitability since the fund must be priced to scale from inception in order to be competitive and assets are acquired one account at a time. In addition, managing the cash flow of an investment company may be more difficult than that of a stable pool of assets, such as an institutional account with little cash movement in either direction, particularly, if a fund is in net redemption and the Adviser is frequently forced to sell securities to raise cash for redemptions. However, managing a fund with positive cash flow may be easier at times than managing a stable pool of assets. Finally, in recent years, investment advisers have been sued by institutional clients and have suffered reputational damage both by the attendant publicity and outcomes other than complete victories. Accordingly, the legal and reputational risks associated with institutional accounts are greater than previously thought, although arguably still not equal to those related to the mutual fund industry.
Notwithstanding the Adviser’s view that managing an investment company is not comparable to managing other institutional accounts because the services provided are different, the Supreme Court has indicated consideration should be given to the advisory fees charged to institutional accounts that have a substantially similar investment style as the Portfolio.4 However, with respect to the
| 4 | The Supreme Court recently held the Gartenberg decision was correct in its basic formulation of what §36(b) requires: to face liability under §36(b), “an investment adviser must charge a fee that is so disproportionately large that it bears no reasonable relationship to the services rendered and could not have been the product of arms length bargaining.” Jones v. Harris Associates L.P., (No. 08-586), slip op. at 9, 559 U.S. 2010. In the Jones v. Harris decision, the Supreme Court stated the Gartenberg approach fully incorporates the correct understanding of fiduciary duty within the context of section 36(b) and noted with approval that “Gartenberg insists that all relevant circumstances be taken into account” and “uses the range of fees that might result from arms-length bargaining as the benchmark for reviewing challenged fees.” Jones v. Harris at 11. |
| 40 | • ALLIANCEBERNSTEIN MUNICIPAL INCOME SHARES |
Portfolio, the Adviser has represented that there is no category in the Form ADV for institutional products that have a substantially similar investment style as the Portfolio.
AllianceBernstein Municipal Income Fund, Inc.- High Income Municipal Portfolio (“High Income Municipal Portfolio”), a retail mutual fund managed by the Adviser has a substantially similar investment style as the Portfolio, and its advisory fee schedule is set forth below. Also shown is what would have been the effective advisory fee of the Portfolio had the retail mutual fund’s fee schedule been applicable to the Portfolio based on an initial estimate of the Portfolio’s net assets at $100 million.
| Portfolio | AllianceBernstein Mutual Fund | Fee Schedule | AllianceBernstein Mutual Fund Effective Fee | |||||
| Municipal Income Shares | Retail High Income Municipal | 0.50% on first $2.5 billion 0.45% on next $2.5 billion 0.40% on the balance | 0.500 | |||||
The Adviser represented that it does not sub-advise any registered investment company that has a similar investment strategy as the Portfolio.
| II. | MANAGEMENT FEES CHARGED BY OTHER MUTUAL FUNDS COMPANIES FOR LIKE SERVICES. |
Lipper, Inc. (“Lipper”), an analytical service that is not affiliated with the Adviser, compared the fee arrangements of the Portfolio with those of other investment companies receiving similar services from other investment advisers.5 Each peer selected by Lipper had a similar fee arrangement as the Portfolio, which is to say that with respect to the Portfolio’s peers, all fund expenses, including management fees6 were reimbursed by the investment adviser.
| III. | COSTS TO THE ADVISER AND ITS AFFILIATES OF SUPPLYING SERVICES PURSUANT TO THE ADVISORY FEE ARRANGEMENT, EXCLUDING ANY INTRA-CORPORATE PROFIT. |
The Adviser utilizes two profitability reporting systems, which operate independently but are aligned with each other, to estimate the Adviser’s profitability in connection with investment advisory services provided to the Portfolio. The Senior Officer has retained an independent consultant to provide
| 5 | Only zero fee no-load funds that participated in a wrap fee program were considered for inclusion in the Portfolio’s EG, regardless of the Lipper investment classification/objective of the Portfolio’s peers. The Portfolio’s EG includes the Portfolio, which is classified by Lip-per as “High Current Yield”, two U.S. Mortgage Funds and one Treasury Inflation-Protected Securities (“TIPS”) Fund, one General Bond Fund, and two General Income Funds. |
| 6 | “Management Fee” is the fee attributable to the management and bearing of expenses of the funds (not the management of the wrap fee program). In each case the advisory contract provides for an advisory or management fee of zero. |
| ALLIANCEBERNSTEIN MUNICIPAL INCOME SHARES • | 41 |
independent advice regarding the alignment of the two profitability systems as well as the methodologies and allocations utilized by both profitability systems. See Section IV for additional discussion.
| IV. | PROFIT MARGINS OF THE ADVISER AND ITS AFFILIATES FOR SUPPLYING SUCH SERVICES. |
The Portfolio has not yet commenced operations. Therefore there is no historic profitability data with respect to the Adviser’s investment services to the Portfolio.
The Portfolio does not pay an advisory fee to the Adviser. However, the Adviser will profit indirectly through the advisory fees that it will receive from future SMA clients that invest in the Portfolio. The profitability will be calculated using a weighted average of the profitability of the SMA clients, in addition to any fund specific revenue or expense item.
AllianceBernstein Investments, Inc. (“ABI”) and AllianceBernstein Investor Services, Inc. (“ABIS”), affiliates of the Adviser, will serve as the Portfolio’s underwriter and transfer agent, respectively. The courts have referred to this type of business relationships as “fall-out benefits” to the Adviser and indicated that such benefits should be factored into the evaluation of the total relationship between the Portfolio and the Adviser. Neither case law nor common business practice precludes the Adviser’s affiliates from earning a reasonable profit on this type of relationship provided the affiliates’ charges and services are competitive. However, neither ABI nor ABIS will receive a fee for serving as the Portfolio’s underwriter and transfer agent.
| V. | POSSIBLE ECONOMIES OF SCALE |
The Adviser has indicated that economies of scale are being shared with shareholders through fee structures,7 subsidies and enhancement to services. Based on some of the professional literature that has considered economies of scale in the mutual fund industry, it is thought that to the extent economies of scale exist, they may more often exist across a fund family as opposed to a specific fund. This is because the costs incurred by the Adviser, such as investment research or technology for trading or compliance systems, can be spread across a greater asset base as the fund family increases in size. It is also possible that as the level of services required to operate a successful investment company has increased over time, and advisory firms have made such investments in their business to provide services, there may be a sharing of economies of scale without a reduction in advisory fees.
An independent consultant, retained by the Senior Officer, provided the Board of Trustees an update of the Deli8 study on advisory fees and various fund
| 7 | Fee structures include fee reductions, pricing at scale and breakpoints in advisory fee schedules. |
| 8 | The Deli study was originally published in 2002 based on 1997 data. |
| 42 | • ALLIANCEBERNSTEIN MUNICIPAL INCOME SHARES |
characteristics.9 The independent consultant first reiterated the results of his previous two dimensional comparison analysis (fund size and family size) with the Board of Trustees.10 The independent consultant then discussed the results of the regression model that was utilized to study the effects of various factors on advisory fees. The regression model output indicated that the bulk of the variation in fees predicted were explained by various factors, but substantially by fund AUM, family AUM, index fund indicator and investment style. The independent consultant also compared the advisory fees of the AllianceBernstein Mutual Funds to similar funds managed by 19 other large asset managers, regardless of the fund size and each Adviser’s proportion of mutual fund assets to non-mutual fund assets.
| VI. | NATURE AND QUALITY OF THE ADVISER’S SERVICES INCLUDING THE PERFORMANCE OF THE PORTFOLIOS. |
With assets under management of $501 billion as of March 31, 2010, the Adviser has the investment experience to manage and provide non-investment services to the Portfolio.
Since the Portfolio has not yet commenced operations, the Portfolio has no performance history. However, the Adviser manages High Income Municipal Portfolio, which has a substantially similar investment style as the Portfolio. Set forth below are the year to date performance returns of the Class A shares of High Income Municipal Portfolio and its benchmark for the period January 29, 2010 through March 31, 2010:
| Fund | Jan. 29, 2010 – March 31, 2010 Net Performance (%) | |||
Retail High Income Municipal Portfolio | 0.10 | % | ||
| Barclays Capital Municipal Bond Index | 0.73 | % | ||
CONCLUSION:
Based on the factors discussed above the Senior Officer’s conclusion is that the proposed advisory fee for the Portfolio is reasonable and within the range of what would have been negotiated at arms-length in light of all the surrounding circumstances. This conclusion in respect of the Portfolio is based on an evaluation of all of these factors and no single factor was dispositive.
Dated: June 2, 2010
| 9 | As mentioned previously, the Supreme Court cautioned against accepting mutual fund fee comparisons without careful scrutiny since the fees may not be the product of negotiations conducted at arms length. See Jones v. Harris at 14. |
| 10 | The two dimensional analysis showed patterns of lower advisory fees for funds with larger asset sizes and funds from larger family sizes compared to funds with smaller asset sizes and funds from smaller family sizes, which according to the independent consultant is indicative of a sharing of economies of scale and scope. However, in less liquid and active markets, such is not the case, as the empirical analysis showed potential for diseconomies of scale in those markets. The empirical analysis also showed diminishing economies of scale and scope as funds surpassed a certain high level of assets. |
| ALLIANCEBERNSTEIN MUNICIPAL INCOME SHARES • | 43 |
THIS PAGE IS NOT PART OF THE SHAREHOLDER REPORT OR THE FINANCIAL STATEMENTS
ALLIANCEBERNSTEIN FAMILY OF FUNDS
Wealth Strategies Funds
Balanced Wealth Strategy
Conservative Wealth Strategy
Wealth Appreciation Strategy
Tax-Managed Balanced Wealth Strategy
Tax-Managed Conservative Wealth Strategy
Tax-Managed Wealth Appreciation Strategy
Blended Style Funds
International Portfolio
Tax-Managed International Portfolio
U.S. Large Cap Portfolio
Growth Funds
Domestic
Growth Fund
Large Cap Growth Fund
Small Cap Growth Portfolio
Small/Mid Cap Growth Fund
U.S. Strategic Research Portfolio
Global & International
Global Growth Fund
Global Thematic Growth Fund
Greater China ’97 Fund
International Discovery Equity Portfolio
International Growth Fund
Value Funds
Domestic
Core Opportunities Fund
Equity Income Fund*
Growth & Income Fund
Small/Mid Cap Value Fund
Value Fund
Global & International
Global Real Estate Investment Fund
Global Value Fund
International Value Fund
Taxable Bond Funds
Bond Inflation Strategy
Global Bond Fund
High Income Fund
Intermediate Bond Portfolio
Short Duration Portfolio
Unconstrained Bond Fund*
Municipal Bond Funds
Arizona California High Income Massachusetts Michigan Minnesota Municipal Bond Inflation Strategy | National New Jersey New York Ohio Pennsylvania Virginia |
Intermediate Municipal Bond Funds
Intermediate California
Intermediate Diversified
Intermediate New York
Closed-End Funds
Alliance California Municipal Income Fund
Alliance New York Municipal Income Fund
AllianceBernstein Global High Income Fund
AllianceBernstein Income Fund
AllianceBernstein National Municipal Income Fund
The Ibero-America Fund
Alternatives
Market Neutral Strategy-Global
Market Neutral Strategy-U.S.
Real-Asset Strategy*
Balanced
Balanced Shares
Retirement Strategies Funds
2000 Retirement Strategy | 2020 Retirement Strategy | 2040 Retirement Strategy | ||
2005 Retirement Strategy | 2025 Retirement Strategy | 2045 Retirement Strategy | ||
2010 Retirement Strategy | 2030 Retirement Strategy | 2050 Retirement Strategy | ||
2015 Retirement Strategy | 2035 Retirement Strategy | 2055 Retirement Strategy |
We also offer Exchange Reserves,** which serves as the money market fund exchange vehicle for the AllianceBernstein mutual funds.
You should consider the investment objectives, risks, charges and expenses of any AllianceBernstein fund/portfolio carefully before investing. For free copies of our prospectuses, which contain this and other information, visit us online at www.alliancebernstein.com or contact your financial advisor. Please read the prospectus carefully before investing.
| * | Prior to August 31, 2010, Equity Income Fund was named Utility Income Fund. Prior to September 27, 2010, Real-Asset Strategy was named Multi-Asset Inflation Strategy. Prior to February 3, 2011, Unconstrained Bond Fund was named Diversified Yield Fund. |
| ** | An investment in the Fund is not a deposit in a bank and is not insured or guaranteed by the Federal Deposit Insurance Corporation or any other government agency. Although the Fund seeks to preserve the value of your investment at $1.00 per share, it is possible to lose money by investing in the Fund. |
| 44 | • ALLIANCEBERNSTEIN MUNICIPAL INCOME SHARES |
AllianceBernstein Family of Funds
ALLIANCEBERNSTEIN MUNICIPAL INCOME SHARES
1345 Avenue of the Americas
New York, NY 10105
800.221.5672
| MIS-0151-0411 |  | |
| ITEM 2. | CODE OF ETHICS. |
(a) The registrant has adopted a code of ethics that applies to its principal executive officer, principal financial officer and principal accounting officer. A copy of the registrant’s code of ethics is filed herewith as Exhibit 12(a)(1).
(b) During the period covered by this report, no material amendments were made to the provisions of the code of ethics adopted in 2(a) above.
(c) During the period covered by this report, no implicit or explicit waivers to the provisions of the code of ethics adopted in 2(a) above were granted.
| ITEM 3. | AUDIT COMMITTEE FINANCIAL EXPERT. |
The registrant’s Board of Directors has determined that independent director William H. Foulk, Jr. qualifies as an audit committee financial expert.
| ITEM 4. | PRINCIPAL ACCOUNTANT FEES AND SERVICES. |
(a) - (c) The following table sets forth the aggregate fees billed* by the independent registered public accounting firms, KPMG LLP in 2010 and Ernst & Young LLP in 2011, for the Fund’s last two fiscal years, for professional services rendered for: (i) the audit of the Fund’s annual financial statements included in the Fund’s annual report to stockholders; (ii) assurance and related services that are reasonably related to the performance of the audit of the Fund’s financial statements and are not reported under (i), which include advice and education related to accounting and auditing issues, quarterly press release review (for those Funds that issue quarterly press releases), and preferred stock maintenance testing (for those Funds that issue preferred stock); and (iii) tax compliance, tax advice and tax return preparation.
| Audit Fees | Audit-Related Fees | Tax Fees | ||||||||||||
AB Corp Income Shares | 2010 | $ | 32,990 | $ | — | $ | 17,990 | |||||||
| 2011 | $ | 32,500 | $ | — | $ | 10,555 | ||||||||
AB Taxable Multi-Sector Income Shares | 2010 | $ | — | $ | — | $ | — | |||||||
| 2011 | $ | 24,375 | $ | — | $ | 10,731 | ||||||||
AB Municipal Income Shares | 2010 | $ | — | $ | — | $ | — | |||||||
| 2011 | $ | 23,468 | $ | — | $ | 10,731 | ||||||||
| * | The Fund’s Adviser absorbs all ordinary Fund expenses, including the Fund’s audit fees, audit-related fees and tax fees. |
(d) Not applicable.
(e) (1) Beginning with audit and non-audit service contracts entered into on or after May 6, 2003, the Fund’s Audit Committee policies and procedures require the pre-approval of all audit and non-audit services provided to the Fund by the Fund’s independent registered public accounting firm. The Fund’s Audit Committee policies and procedures also require pre-approval of all audit and non-audit services provided to the Adviser and Service Affiliates to the extent that these services are directly related to the operations or financial reporting of the Fund.
(e) (2) All of the amounts for Audit Fees, Audit-Related Fees and Tax Fees in the table under Item 4 (a) – (c) are for services pre-approved by the Fund’s Audit Committee.
(f) Not applicable.
(g) The following table sets forth the aggregate non-audit services provided to the Fund, the Fund’s Adviser and entities that control, are controlled by or under common control with the Adviser that provide ongoing services to the Fund (“Service Affiliates”):
| All Fees for Non-Audit Services Provided to the Portfolio, the Adviser and Service Affiliates | Total Amount of Foregoing Column Pre- approved by the Audit Committee (Portion Comprised of Audit Related Fees) (Portion Comprised of Tax Fees) | |||||||||
AB Corp Income Shares | 2010 | $ | 192,022 | $ | 17,130 | |||||
| $ | — | |||||||||
| $ | (17,130 | ) | ||||||||
| 2011 | $ | 721,174 | $ | 10,555 | ||||||
| $ | — | |||||||||
| $ | (10,555 | ) | ||||||||
AB Taxable Multi-Sector Income Shares | 2010 | $ | — | $ | — | |||||
| $ | — | |||||||||
| $ | — | |||||||||
| 2011 | $ | 728,127 | $ | 10,731 | ||||||
| $ | — | |||||||||
| $ | (10,731 | ) | ||||||||
AB Municipal Income Shares | 2010 | $ | — | $ | — | |||||
| $ | — | |||||||||
| $ | — | |||||||||
| 2011 | $ | 728,127 | $ | 10,731 | ||||||
| $ | — | |||||||||
| $ | (10,731 | ) | ||||||||
(h) The Audit Committee of the Fund has considered whether the provision of any non-audit services not pre-approved by the Audit Committee provided by the Fund’s independent registered public accounting firm to the Adviser and Service Affiliates is compatible with maintaining the auditor’s independence.
| ITEM 5. | AUDIT COMMITTEE OF LISTED REGISTRANTS. |
Not applicable to the registrant.
| ITEM 6. | SCHEDULE OF INVESTMENTS. |
Please see Schedule of Investments contained in the Report to Shareholders included under Item 1 of this Form N-CSR.
| ITEM 7. | DISCLOSURE OF PROXY VOTING POLICIES AND PROCEDURES FOR CLOSED-END MANAGEMENT INVESTMENT COMPANIES. |
Not applicable to the registrant.
| ITEM 8. | PORTFOLIO MANAGERS OF CLOSED-END MANAGEMENT INVESTMENT COMPANIES. |
Not applicable to the registrant.
| ITEM 9. | PURCHASES OF EQUITY SECURITIES BY CLOSED-END MANAGEMENT INVESTMENT COMPANY AND AFFILIATED PURCHASERS. |
Not applicable to the registrant.
| ITEM 10. | SUBMISSION OF MATTERS TO A VOTE OF SECURITY HOLDERS. |
There have been no material changes to the procedures by which shareholders may recommend nominees to the Fund’s Board of Directors since the Fund last provided disclosure in response to this item.
ITEM 11. CONTROLS AND PROCEDURES.
(a) The registrant’s principal executive officer and principal financial officer have concluded that the registrant’s disclosure controls and procedures (as defined in Rule 30a-3 (c) under the Investment Company Act of 1940, as amended) are effective at the reasonable assurance level based on their evaluation of these controls and procedures as of a date within 90 days of the filing date of this document.
(b) There were no significant changes in the registrant’s internal controls over financial reporting during the second fiscal quarter of the period that could significantly affect these controls subsequent to the date of their evaluation, including any corrective actions with regard to significant deficiencies and material weaknesses.
| ITEM 12. | EXHIBITS. |
The following exhibits are attached to this Form N-CSR:
EXHIBIT NO. | DESCRIPTION OF EXHIBIT | |
| 12 (a) (1) | Code of Ethics that is subject to the disclosure of Item 2 hereof | |
| 12 (b) (1) | Certification of Principal Executive Officer Pursuant to Section 302 of the Sarbanes-Oxley Act of 2002 | |
| 12 (b) (2) | Certification of Principal Financial Officer Pursuant to Section 302 of the Sarbanes-Oxley Act of 2002 | |
| 12 (c) | Certification of Principal Executive Officer and Principal Financial Officer Pursuant to Section 906 of the Sarbanes-Oxley Act of 2002 | |
SIGNATURES
Pursuant to the requirements of the Securities Exchange Act of 1934 and the Investment Company Act of 1940, the registrant has duly caused this report to be signed on its behalf by the undersigned, thereunto duly authorized.
(Registrant): AllianceBernstein Corporate Shares
| By: | /S/ ROBERT M. KEITH | |
Robert M. Keith President | ||
Date: June 29, 2011
Pursuant to the requirements of the Securities Exchange Act of 1934 and the Investment Company Act of 1940, this report has been signed below by the following persons on behalf of the registrant and in the capacities and on the dates indicated.
| By: | /S/ ROBERT M. KEITH | |
Robert M. Keith President | ||
Date: June 29, 2011
| By: | /S/ JOSEPH J. MANTINEO | |
| Joseph J. Mantineo | ||
| Treasurer and Chief Financial Officer | ||
Date: June 29, 2011