UNITED STATES
SECURITIES AND EXCHANGE COMMISSION
Washington, D.C. 20549
FORM N-CSR
CERTIFIED SHAREHOLDER REPORT OF REGISTERED
MANAGEMENT INVESTMENT COMPANIES
Investment Company Act file number | 811-21488 |
|
Cohen & Steers Utility Fund, Inc. |
(Exact name of registrant as specified in charter) |
|
280 Park Avenue, New York, NY | | 10017 |
(Address of principal executive offices) | | (Zip code) |
|
Adam M. Derechin Cohen & Steers Capital Management, Inc. 280 Park Avenue New York, New York 10017 |
(Name and address of agent for service) |
|
Registrant’s telephone number, including area code: | (212) 832-3232 | |
|
Date of fiscal year end: | December 31 | |
|
Date of reporting period: | June 30, 2006 | |
| | | | | | | | |
Item 1. Reports to Stockholders.
COHEN & STEERS UTILITY FUND, INC.
August 9, 2006
To Our Shareholders:
We are pleased to submit to you our report for the six months ended June 30, 2006. The net asset values per share at that date were $15.59, $15.54, and $15.55 for Class A, Class B and Class C shares, respectively. Class I shares had a net asset value of $15.61. In addition, a dividend was declared for shareholders of record on June 22, 2006 and paid on June 23, 2006 to all four classes of shares. The dividends were as follows: Class A—$0.07 per share, Class B—$0.045 per share, Class C—$0.045 per share and Class I—$0.08 per share.a
The total return, including income and change in net asset value, for Cohen & Steers Utility Fund and the comparative benchmarks were:
| | | Six Months Ended
6/30/06 | |
| Cohen & Steers Utility Fund—Class A | | | 3.17 | % | |
| Cohen & Steers Utility Fund—Class B | | | 2.91 | % | |
| Cohen & Steers Utility Fund—Class C | | | 2.91 | % | |
| Cohen & Steers Utility Fund—Class I | | | 3.37 | % | |
| S&P 1500 Utilities Indexb | | | 5.19 | % | |
| S&P 500 Indexb | | | 2.71 | % | |
The performance data quoted represent past performance. Past performance is no guarantee of future results. The investment return and the principal value of an investment will fluctuate and shares, if redeemed, may be worth more or less than their original cost. Current performance may be lower or higher than the performance data quoted. Total returns of the fund current to the most recent month-end can be obtained by visiting our Web site at cohenandsteers.com.
a Please note that distributions paid by the fund to shareholders are subject to recharacterization for tax purposes. The final tax treatment of these distributions is reported to shareholders after the close of each fiscal year.
b The S&P 1500 Utilities Index is an unmanaged market capitalization weighted index of 81 companies whose primary business involves the generation, transmission and/or distribution of electricity and/or natural gas. The S&P 500 Index is an unmanaged index of common stocks that is frequently used as a general measure of stock market performance.
1
COHEN & STEERS UTILITY FUND, INC.
Investment Review
Utility shares performed well during the first half of 2006, with a total return of 5.2% by the S&P 1500 Utilities Index compared with 2.7% for the S&P 500. The group benefited from a strong earnings growth outlook, corporate restructuring activity and its traditional safe haven status amidst continued equity market volatility and a slowing economy. This solid performance came in the face of utility investors' concerns over rising interest rates, political opposition to rising utility bills and volatility in commodity prices.
Several utilities have announced new initiatives this year that should support longer-term earnings growth. We believe this highlights the attractive fundamental environment for U.S. utilities and reflects the need to invest significant capital in our aging power and natural gas infrastructure. For example, shares of TXU Corp.—the fund's best-performing holding, and one of its largest—reacted favorably to their April 10 announcement of a $10 billion investment plan to build 11 new coal-fired power plants in Texas that could add more than $1 billion of incremental earnings by 2010. TXU shares rose 20.9% during the first half of 2006, which compares with 5.2% for the utility index over the same period.
In our view, utility shareholders stand to benefit from several value-creating restructurings announced during the first half of 2006. Duke Energy, also one of the fund's largest holdings, announced plans to separate their sizable electric power utilities from their natural gas pipeline and midstream business to unlock the higher standalone valuation afforded pure-play natural gas infrastructure companies. While we believe there is further upside, the shares delivered an attractive 9.4% return for the first half of the year.
In another move, management of Kinder Morgan announced a management buyout at a 20% premium to the prevailing stock price. Kinder Morgan shares were one of the top positive contributors to fund performance during the period (10.7%). Importantly, both Kinder Morgan and Duke Energy see significant further organic growth opportunities through new natural gas pipeline and power infrastructure investments.
The fund underperformed the S&P 1500 Utilities Index during the first half of 2006, largely due to weakness exhibited by some of the more commodity-oriented utilities that have been strong positive contributors to performance over the long term. The biggest contributors to performance relative to the index during the period were the German utilities E.ON AG and RWE AG. Both have benefited from attractive wholesale power pricing in continental Europe and have produced substantial earnings and dividend growth.
The fund's biggest detractor from performance was the lack of ownership of AES, a global power producer that was up 16.6%, reflecting strong first-quarter earnings and a broadly positive emerging-markets environment. The second-largest detractor was an overweight position in Edison International, which fell 9.4% year-to-date due to concerns about the company's ability to continue to grow earnings beyond 2007 in the event of a declining commodity-price environment.
Utilities demonstrated their safe haven characteristics as overall market conditions deteriorated in the beginning of May. They turned in a solid relative performance amid market concerns that a more hawkish Fed policy could lead to greater interest rate increases that could stifle economic growth and hurt corporate earnings.
2
COHEN & STEERS UTILITY FUND, INC.
Investment Outlook
Utility fundamentals remain positive, in our view, and we forecast attractive earnings growth principally from two main areas.
• First, companies with below-market contracts that roll off over the coming years will produce earnings growth as they sell their production in higher-priced commodity markets.
• Second, many utilities have investment opportunities throughout the power and natural gas infrastructure, in areas such as power generation, transmission and natural gas storage and transmission. The scale of these investments is significant. The Department of Energy estimates that up to $100 billion is needed to modernize our aging power transmission grid, to name one example. Overall, constructive regulation allows utilities to earn an attractive return on equity (ROE)—typically around 11.0%, but sometimes as high as 13.9%.
We believe attractive earnings growth should result from these wide-ranging investment opportunities and the ability to re-contract forward production in higher-priced energy markets. We expect that annual earnings growth over the next three years will be two- to three-times the long-term average of 3%. Further, we believe the price that investors must pay for this growth is very reasonable. Utility stocks trade at around 14 times 2007 earnings, which is just above the long-term average. In our opinion, a premium to the historical sector P/E multiple is warranted, considering the much-improved growth outlook.
We were also pleased to see the extension through 2010 of the maximum15% federal tax rate on qualified dividends, and believe the benefit of the lower tax rate has not been fully reflected in utility stocks.
Despite what we believe to be an attractive investment cycle for utilities, there are areas that warrant scrutiny.
Near-term power and natural gas prices have declined substantially since the beginning of the year as a result of high natural gas storage levels and lower demand—driven largely by demand destruction from higher prices and by mild winter weather. However, longer-term forward power and natural gas prices have been much more resilient. It is important to note that most utilities have hedged much of their anticipated power sales for 2006, but have the ability to re-price below market hedges in the outer years, which in our view provides for meaningful earnings growth potential.
Rising interest rates continue to be seen as a risk, although we believe there is a misperception in terms of the utility sector's longer-term interest rate sensitivity. For the 10-year period ending March 31, 2006, the correlation of total returns for the 10-year U.S. Treasury bond and utilities was a mere 0.06. Nonetheless, we expect that an end to the tightening cycle and a slowdown in GDP growth should ease interest rate concerns.
Another challenge for utilities: the political impact of higher customer bills. After several years of constructive regulation, politicians in some states, such as Illinois and Maryland, have opposed anticipated rate increases. While rates are heading higher in the near term as a result of rising energy costs, we expect that a substantial portion of rate increases through the end of the decade will be the result of incremental capital expenditures for essential infrastructure investment. We expect these issues to be resolved with some form of phase-in of higher rates over time to ease the burden on consumers.
3
COHEN & STEERS UTILITY FUND, INC.
Our investment strategy is to focus on attractively valued power and natural gas utilities with improving earnings and dividend growth potential. This includes utilities that in our view benefit from attractive fundamentals in the wholesale power market and regulated rate base growth opportunities from increased infrastructure investments.
Long-term macro trends should also favor utility stocks. As baby boomers continue to head toward retirement in record numbers, we believe high and growing dividends should attract investors seeking income. Furthermore, we expect to see continued consolidation of what is a highly fragmented industry. All of these factors, in our view, should lead to attractive stock price performance in the utility sector.
In closing, we believe that the fundamental outlook for the utility sector is strong and that the sector stands to benefit from a growing demand for more conservative income-producing equity investments.
| Sincerely, | |
|
 | |  | |
|
| MARTIN COHEN | | ROBERT H. STEERS | |
|
| Co-chairman | | Co-chairman | |
|
| | |  | |
|
| | | ROBERT S. BECKER | |
|
| | | Portfolio Manager | |
|
The views and opinions in the preceding commentary are as of the date stated and are subject to change. This material represents an assessment of the market environment at a specific point in time, should not be relied upon as investment advice and is not intended to predict or depict performance of any investment.
Visit Cohen & Steers online at cohenandsteers.com
For more information about any of our funds, visit cohenandsteers.com, where you'll find daily net asset values, fund fact sheets and portfolio highlights. You can also access newsletters, education tools and market updates covering REIT, utility and preferred securities sectors.
In addition, our Web site contains comprehensive information about our firm, including our most recent press releases, profiles of our senior investment professionals, and an overview of our investment approach.
4
COHEN & STEERS UTILITY FUND, INC.
Performance Review
Periods Ending June 30, 2006
| | | Class A Shares | | Class B Shares | | Class C Shares | | Class I Shares | |
| 1 Year (with sales charge) | | | 0.32 | %a | | | -0.58 | %b | | | 3.42 | %c | | | — | | |
| 1 Year (without sales charge) | | | 5.04 | % | | | 4.42 | % | | | 4.42 | % | | | 5.40 | % | |
Since Inceptione
(with sales charge) | | | 15.23 | %a | | | 15.73 | %d | | | 16.92 | % | | | — | | |
Since Inceptione
(without sales charge) | | | 17.70 | % | | | 16.89 | % | | | 16.92 | % | | | 18.08 | % | |
The performance data quoted represent past performance. Past performance is no guarantee of future results. The investment return and principal value of an investment will fluctuate and shares, when redeemed, may be worth more or less than their original cost. Current performance may be lower or higher than the performance data quoted. Performance information current to the most recent month-end can be obtained by visiting our Web site at cohenandsteers.com. The performance table does not reflect the deduction of taxes that a shareholder would pay on fund distributions or the redemption of fund shares.
a Reflects a 4.50% front-end sales charge.
b Reflects a contingent deferred sales charge of 5%.
c Reflects a contingent deferred sales charge of 1%.
d Reflects a contingent deferred sales charge of 3%.
e Inception date of May 3, 2004.
5
COHEN & STEERS UTILITY FUND, INC.
Expense Example (Unaudited)
As a shareholder of the fund, you incur two types of costs: (1) transaction costs, including sales charges (loads) on purchase payments and redemption fees; and (2) ongoing costs including management fees; distribution and/or service (12b-1); and other fund expenses. This example is intended to help you understand your ongoing costs (in dollars) of investing in the fund and to compare these costs with the ongoing costs of investing in other mutual funds.
The example is based on an investment of $1,000 invested at the beginning of the period and held for the entire period 01/01/06 – 06/30/06.
Actual Expenses
The first line of the table below provides information about actual account values and expenses. You may use the information in this line, together with the amount you invested, to estimate the expenses that you paid over the period. Simply divide your account value by $1,000 (for example, an $8,600 account value divided by $1,000 = 8.6), then multiply the result by the number in the first line under the heading entitled "Expenses Paid During Period" to estimate the expenses you paid on your account during this period.
Hypothetical Example for Comparison Purposes
The second line of the table below provides information about hypothetical account values and hypothetical expenses based on the fund's actual expense ratio and an assumed rate of return of 5% per year before expenses, which is not the fund's actual return. The hypothetical account values and expenses may not be used to estimate the actual ending account balance or expenses you paid for the period. You may use this information to compare the ongoing cost of investing in the fund and other funds. To do so, compare this 5% hypothetical example with the 5% hypothetical examples that appear in the shareholder reports of the other funds.
Please note that the expenses shown in the table are meant to highlight your ongoing costs only and do not reflect any transactional costs, such as sales charges (loads) and redemption fees Therefore, the second line of the table is useful in comparing ongoing costs only, and will not help you determine the relative total costs of owning different funds. In addition, if these transactional costs were included, your costs would have been higher.
6
COHEN & STEERS UTILITY FUND, INC.
Expense Example (Unaudited)—(Continued)
| | | Beginning
Account Value
01/01/06 | | Ending
Account Value
06/30/06 | | Expenses Paid
During Period*
01/01/06–
06/30/06 | |
| Class A | |
| Actual (3.17% return) | | $ | 1,000.00 | | | $ | 1,031.70 | | | $ | 7.55 | | |
| Hypothetical (5% annual return before expenses) | | $ | 1,000.00 | | | $ | 1,017.36 | | | $ | 7.50 | | |
| Class B | |
| Actual (2.91% return) | | $ | 1,000.00 | | | $ | 1,029.10 | | | $ | 10.81 | | |
| Hypothetical (5% annual return before expenses) | | $ | 1,000.00 | | | $ | 1,014.13 | | | $ | 10.74 | | |
| Class C | |
| Actual (2.91% return) | | $ | 1,000.00 | | | $ | 1,029.10 | | | $ | 10.81 | | |
| Hypothetical (5% annual return before expenses) | | $ | 1,000.00 | | | $ | 1,014.13 | | | $ | 10.74 | | |
| Class I | |
| Actual (3.37% return) | | $ | 1,000.00 | | | $ | 1,033.70 | | | $ | 5.80 | | |
| Hypothetical (5% annual return before expenses) | | $ | 1,000.00 | | | $ | 1,019.09 | | | $ | 5.76 | | |
* Expenses are equal to the fund's Class A, Class B, Class C and Class I annualized expense ratio of 1.50%, 2.15%, 2.15% and 1.15%, respectively, multiplied by the average account value over the period, multiplied by 181/365 (to reflect the one-half year period). If the fund had borne all of its expenses that were assumed by the advisor, the annualized expense ratios would have been 1.66%, 2.34%, 2.33% and 1.34%, respectively.
7
COHEN & STEERS UTILITY FUND, INC.
JUNE 30, 2006
Top Ten Holdings
(Unaudited)
| Security | | Market
Value | | % of
Net
Assets | |
| 1. Exelon Corp. | | $ | 9,066,260 | | | | 8.9 | % | |
| 2. Duke Energy Corp. | | | 9,050,424 | | | | 8.9 | | |
| 3. TXU Corp | | | 6,796,927 | | | | 6.6 | | |
| 4. FirstEnergy Corp. | | | 6,188,343 | | | | 6.1 | | |
| 5. PG&E Corp. | | | 5,153,811 | | | | 5.0 | | |
| 6. Entergy Corp. | | | 5,119,046 | | | | 5.0 | | |
| 7. Southern Co. | | | 4,740,964 | | | | 4.6 | | |
| 8. FPL Group | | | 4,716,741 | | | | 4.6 | | |
| 9. Edison International | | | 4,431,960 | | | | 4.3 | | |
| 10. PPL Corp. | | | 4,204,749 | | | | 4.1 | | |
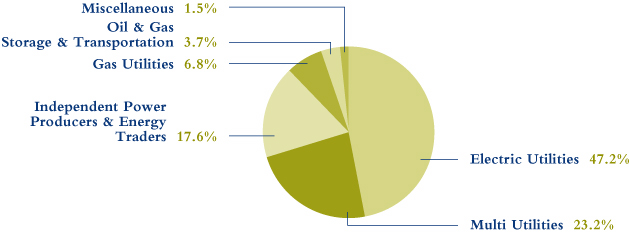
Sector Breakdown
(Based on Net Assets)
(Unaudited)
8
COHEN & STEERS UTILITY FUND, INC.
SCHEDULE OF INVESTMENTS
June 30, 2006 (Unaudited)
| | | | | Number
of Shares | | Value | |
| COMMON STOCK | | | 99.8 | % | | | | | | | | | |
| GAS UTILITIES | | | 6.8 | % | | | | | | | | | |
| AGL Resources | | | | | | | 27,196 | | | $ | 1,036,711 | | |
| Equitable Resources | | | | | | | 85,720 | | | | 2,871,620 | | |
| Questar Corp. | | | | | | | 31,639 | | | | 2,546,623 | | |
| Southern Union Co. | | | | | | | 20,000 | | | | 541,200 | | |
| | | | | | | | 6,996,154 | | |
| INDEPENDENT POWER PRODUCERS & ENERGY TRADERS | | | 17.6 | % | | | |
| Constellation Energy Group | | | | | | | 38,900 | | | | 2,120,828 | | |
| Duke Energy Corp. | | | | | | | 308,152 | | | | 9,050,424 | | |
| TXU Corp. | | | | | | | 113,680 | | | | 6,796,927 | | |
| | | | | | | | 17,968,179 | | |
| OIL & GAS REFINING & MARKETING | | | 1.3 | % | | | |
| Duke Energy Income Fund (Note 2) | | | | | | | 25,400 | | | | 267,357 | | |
| Duke Energy Income Fund, 144Aa (Note 2) | | | | | | | 23,000 | | | | 242,094 | | |
| Williams Partners LP | | | | | | | 27,000 | | | | 849,420 | | |
| | | | | | | | 1,358,871 | | |
| OIL & GAS STORAGE & TRANSPORTATION | | | 3.7 | % | | | |
| DCP Midstream Partners LP | | | | | | | 21,500 | | | | 606,300 | | |
| Kinder Morgan | | | | | | | 14,500 | | | | 1,448,405 | | |
| Teekay LNG Partners LP | | | | | | | 19,700 | | | | 598,880 | | |
| Williams Cos. (The) | | | | | | | 48,300 | | | | 1,128,288 | | |
| | | | | | | | 3,781,873 | | |
| UTILITIES | | | 70.4 | % | | | | | | | | | |
| ELECTRIC UTILITIES | | | 47.2 | % | | | |
| Cleco Corp. | | | | | | | 38,316 | | | | 890,847 | | |
| DPL | | | | | | | 106,700 | | | | 2,859,560 | | |
| E.ON AG (ADR) | | | | | | | 40,226 | | | | 1,542,667 | | |
| Edison International | | | | | | | 113,640 | | | | 4,431,960 | | |
| El Paso Electric Co.a | | | | | | | 53,400 | | | | 1,076,544 | | |
| Entergy Corp. | | | | | | | 72,354 | | | | 5,119,046 | | |
| Exelon Corp. | | | | | | | 159,533 | | | | 9,066,260 | | |
See accompanying notes to financial statements.
9
COHEN & STEERS UTILITY FUND, INC.
SCHEDULE OF INVESTMENTS—(Continued)
June 30, 2006 (Unaudited)
| | | | | Number
of Shares | | Value | |
| FirstEnergy Corp. | | | | | 114,155 | | | $ | 6,188,343 | | |
| FPL Group | | | | | 113,986 | | | | 4,716,741 | | |
| ITC Holdings Corp. | | | | | 47,200 | | | | 1,254,576 | | |
| Northeast Utilities | | | | | 43,000 | | | | 888,810 | | |
| PPL Corp. | | | | | 130,178 | | | | 4,204,749 | | |
| Scottish and Southern Energy PLC | | | | | 36,879 | | | | 784,944 | | |
| Scottish Power PLC (ADR) | | | | | 11,364 | | | | 490,243 | | |
| Southern Co. | | | | | 147,924 | | | | 4,740,964 | | |
| | | | | | | | 48,256,254 | | |
| MULTI UTILITIES | | | 23.2 | % | | | | | | | | | |
| Ameren Corp. | | | | | 62,644 | | | | 3,163,522 | | |
| CEZ AS | | | | | 35,721 | | | | 1,205,732 | | |
| CMS Energy Corp.a | | | | | 134,600 | | | | 1,741,724 | | |
| Consolidated Edison | | | | | 45,400 | | | | 2,017,576 | | |
| Dominion Resources | | | | | 23,844 | | | | 1,783,293 | | |
| NSTAR | | | | | 69,387 | | | | 1,984,468 | | |
| PG&E Corp. | | | | | 131,207 | | | | 5,153,811 | | |
| Public Service Enterprise Group | | | | | 26,143 | | | | 1,728,575 | | |
| RWE AG | | | | | 6,361 | | | | 529,249 | | |
| SCANA Corp. | | | | | 3,300 | | | | 127,314 | | |
| Sempra Energy | | | | | 58,468 | | | | 2,659,125 | | |
| Xcel Energy | | | | | 83,903 | | | | 1,609,260 | | |
| | | | | | | | 23,703,649 | | |
| TOTAL UTILITIES | | | | | | | | | 71,959,903 | | |
| TOTAL COMMON STOCK (Identified cost—$87,510,443) | | | | | | | | | 102,064,980 | | |
See accompanying notes to financial statements.
10
COHEN & STEERS UTILITY FUND, INC.
SCHEDULE OF INVESTMENTS—(Continued)
June 30, 2006 (Unaudited)
| | | | | Number
of Shares | | Value | |
| PREFERRED SECURITIES—$25 PAR VALUE | | | 0.6 | % | | | | | | | |
| MULTI UTILITIES | | | | | |
Aquila, 7.875%, due 3/1/32
(Identified cost—$610,478) | | | | | | | 24,300 | | | $ | 607,500 | | |
| TOTAL INVESTMENTS (Identified cost—$88,120,921) | | | 100.4 | % | | | | | 102,672,480 | | |
| LIABILITIES IN EXCESS OF OTHER ASSETS | | | (0.4 | )% | | | | | (449,004 | ) | |
| NET ASSETS | | | 100.0 | % | | | | $ | 102,223,476 | | |
Glossary of Portfolio Abbreviation
ADR American Depositary Receipt
Note: Percentages indicated are based on the net assets of the fund.
a Non-income producing security.
b Resale is restricted to qualified institutional investors; aggregate holdings equal 0.3% of net assets.
See accompanying notes to financial statements.
11
COHEN & STEERS UTILITY FUND, INC.
STATEMENT OF ASSETS AND LIABILITIES
June 30, 2006 (Unaudited)
| ASSETS: | |
| Investments in securities, at value (Identified cost—$88,120,921) | | $ | 102,672,480 | | |
| Cash | | | 494,357 | | |
| Receivable for investments sold | | | 3,090,990 | | |
| Dividends and interest receivable | | | 273,572 | | |
| Receivable for fund shares sold | | | 72,030 | | |
| Other assets | | | 4,929 | | |
| Total Assets | | | 106,608,358 | | |
| LIABILITIES: | |
| Payable for investment securities purchased. | | | 2,717,438 | | |
| Payable for fund shares redeemed | | | 1,279,094 | | |
| Payable for distribution fees | | | 40,311 | | |
| Payable to advisor | | | 38,114 | | |
| Payable for shareholder servicing fees | | | 14,269 | | |
| Payable to administrator | | | 1,783 | | |
| Other liabilities | | | 293,873 | | |
| Total Liabilities | | | 4,384,882 | | |
| NET ASSETS | | $ | 102,223,476 | | |
| NET ASSETS consist of: | |
| Paid-in capital | | $ | 86,880,814 | | |
| Undistributed net investment income | | | 682,474 | | |
| Accumulated undistributed net realized gain | | | 113,159 | | |
| Net unrealized appreciation | | | 14,547,029 | | |
| | | $ | 102,223,476 | | |
See accompanying notes to financial statements.
12
COHEN & STEERS UTILITY FUND, INC.
STATEMENT OF ASSETS AND LIABILITIES—(Continued)
June 30, 2006 (Unaudited)
| CLASS A SHARES: | |
| NET ASSETS | | $ | 55,776,419 | | |
| Shares issued and outstanding ($0.001 par value common stock outstanding) | | | 3,577,349 | | |
| Net asset value and redemption price per share | | $ | 15.59 | | |
| Maximum offering price per share ($15.59 ÷ 0.955)a | | $ | 16.32 | | |
| CLASS B SHARES: | |
| NET ASSETS | | $ | 8,337,251 | | |
| Shares issued and outstanding ($0.001 par value common stock outstanding) | | | 536,553 | | |
| Net asset value and offering price per shareb | | $ | 15.54 | | |
| CLASS C SHARES: | |
| NET ASSETS | | $ | 35,457,519 | | |
| Shares issued and outstanding ($0.001 par value common stock outstanding) | | | 2,280,443 | | |
| Net asset value and offering price per shareb | | $ | 15.55 | | |
| CLASS I SHARES: | |
| NET ASSETS | | $ | 2,652,287 | | |
| Shares issued and outstanding ($0.001 par value common stock outstanding) | | | 169,906 | | |
| Net asset value, offering, and redemption price per share | | $ | 15.61 | | |
a On investments of $100,000 or more, the offering price is reduced.
b Redemption price per share is equal to the net asset value per share less any applicable deferred sales charge which varies with the length of time shares are held.
See accompanying notes to financial statements.
13
COHEN & STEERS UTILITY FUND, INC.
STATEMENT OF OPERATIONS
For the Six Months Ended June 30, 2006 (Unaudited)
| Investment Income: | |
| Dividend income (net of $44,187 of foreign withholding tax) | | $ | 2,917,496 | | |
| Interest income | | | 53,495 | | |
| Total Income | | | 2,970,991 | | |
| Expenses: | |
| Advisory fees | | | 547,572 | | |
| Distribution fees—Class A | | | 113,958 | | |
| Distribution fees—Class B | | | 30,418 | | |
| Distribution fees—Class C | | | 165,105 | | |
| Shareholder servicing fees—Class A | | | 45,583 | | |
| Shareholder servicing fees—Class B | | | 10,139 | | |
| Shareholder servicing fees—Class C | | | 55,035 | | |
| Professional fees | | | 95,922 | | |
| Shareholder reporting expenses. | | | 89,414 | | |
| Registration and filing fees | | | 63,350 | | |
| Administration fees | | | 57,680 | | |
| Transfer agent fees | | | 45,250 | | |
| Directors' fees and expenses | | | 22,806 | | |
| Custodian fees and expenses | | | 22,710 | | |
| Line of credit fees | | | 8,280 | | |
| Miscellaneous | | | 9,123 | | |
| Total Expenses | | | 1,382,345 | | |
| Reduction of Expenses | | | (122,497 | ) | |
| Net Expenses | | | 1,259,848 | | |
| Net Investment Income | | | 1,711,143 | | |
| Net Realized and Unrealized Gain (Loss) on Investments: | |
| Net realized gain on: | |
| Investments | | | 320,474 | | |
| Foreign currency transactions | | | 27,353 | | |
| Net realized gain | | | 347,827 | | |
| Net change in unrealized appreciation on: | |
| Investments | | | 1,122,053 | | |
| Foreign currency translations | | | (4,341 | ) | |
| Net change in unrealized appreciation | | | 1,117,712 | | |
| Total net realized and unrealized gain | | | 1,465,539 | | |
| Net Increase in Net Assets Resulting from Operations | | $ | 3,176,682 | | |
See accompanying notes to financial statements.
14
COHEN & STEERS UTILITY FUND, INC.
STATEMENT OF CHANGES IN NET ASSETS (Unaudited)
| | | For the
Six Months Ended
June 30, 2006 | | For the
Year Ended
December 31, 2005 | |
| Change in Net Assets: | |
| From Operations: | |
| Net investment income | | $ | 1,711,143 | | | $ | 3,033,444 | | |
| Net realized gain (loss) | | | 347,827 | | | | (176,337 | ) | |
| Net change in unrealized appreciation. | | | 1,117,712 | | | | 10,954,862 | | |
| Net increase in net assets resulting from operations | | | 3,176,682 | | | | 13,811,969 | | |
| Dividends and Distributions to Shareholders from: | |
| Net investment income: | | | | | | | | | |
| Class A | | | (707,339 | ) | | | (2,162,776 | ) | |
| Class B | | | (48,380 | ) | | | (106,440 | ) | |
| Class C | | | (244,835 | ) | | | (702,728 | ) | |
| Class I | | | (28,115 | ) | | | (56,784 | ) | |
| Net realized gain on investments: | | | | | | | | | |
| Class A | | | — | | | | (19,379 | ) | |
| Class B | | | — | | | | (954 | ) | |
| Class C | | | — | | | | (6,297 | ) | |
| Class I | | | — | | | | (509 | ) | |
| Tax return of capital: | | | | | | | | | |
| Class A | | | — | | | | (136,993 | ) | |
| Class B | | | — | | | | (6,742 | ) | |
| Class C | | | — | | | | (44,512 | ) | |
| Class I | | | — | | | | (3,597 | ) | |
| Total dividends and distributions to shareholders | | | (1,028,669 | ) | | | (3,247,711 | ) | |
| Capital Stock Transactions: | |
Increase (decrease) in net assets from
fund share transactions | | | (73,458,163 | ) | | | 117,323,566 | | |
| Total increase (decrease) in net assets | | | (71,310,150 | ) | | | 127,887,824 | | |
| Net Assets: | |
| Beginning of period | | | 173,533,626 | | | | 45,645,802 | | |
| End of perioda | | $ | 102,223,476 | | | $ | 173,533,626 | | |
a Includes undistributed net investment income of $682,474 and $0, respectively.
See accompanying notes to financial statements.
15
COHEN & STEERS UTILITY FUND, INC.
FINANCIAL HIGHLIGHTS (Unaudited)
The following table includes selected data for a share outstanding throughout each period and other performance information derived from the financial statements. It should be read in conjunction with the financial statements and notes thereto.
| | | Class A | |
| Per Share Operating Performance: | | For the
Six Months Ended
June 30, 2006 | | For the
Year Ended
December 31, 2005 | | For the Period
May 3, 2004a
through
December 31, 2004 | |
| Net asset value, beginning of period | | $ | 15.25 | | | $ | 13.78 | | | $ | 11.46 | | |
| Income from investment operations: | |
| Net investment incomeb | | | 0.19 | | | | 0.38 | | | | 0.29 | | |
| Net realized and unrealized gain on investments | | | 0.29 | | | | 1.45 | | | | 2.20 | | |
| Total from investment operations | | | 0.48 | | | | 1.83 | | | | 2.49 | | |
| Less dividends and distributions to shareholders from: | |
| Net investment income | | | (0.14 | ) | | | (0.34 | ) | | | (0.14 | ) | |
| Net realized gain on investments | | | — | | | | (0.00 | )f | | | (0.02 | ) | |
| Tax return of capital | | | — | | | | (0.02 | ) | | | (0.01 | ) | |
| Total dividends and distributions to shareholders | | | (0.14 | ) | | | (0.36 | ) | | | (0.17 | ) | |
| Redemption fees retained by the funde | | | 0.00 | f | | | 0.00 | f | | | 2.32 | | |
| Net increase in net asset value | | | 0.34 | | | | 1.47 | | | | — | | |
| Net asset value, end of period | | $ | 15.59 | | | $ | 15.25 | | | $ | 13.78 | | |
| Total investment returnc | | | 3.17 | %d | | | 13.33 | % | | | 21.80 | %d | |
| Ratios/Supplemental Data: | |
| Net assets, end of period (in millions) | | $ | 55.8 | | | $ | 114.5 | | | $ | 26.9 | | |
Ratio of expenses to average daily net assets
(before expense reduction) | | | 1.66 | %e | | | 1.58 | % | | | 3.55 | %e | |
Ratio of expenses to average daily net assets
(net of expense reduction) | | | 1.50 | %e | | | 1.49 | % | | | 1.50 | %e | |
Ratio of net investment income to average daily net assets
(before expense reduction) | | | 2.36 | %e | | | 2.44 | % | | | 1.26 | %e | |
Ratio of net investment income to average daily net assets
(net of expense reduction) | | | 2.52 | %e | | | 2.53 | % | | | 3.31 | %e | |
| Portfolio turnover rate | | | 24 | %d | | | 45 | % | | | 16 | %d | |
a Commencement of operations.
b Calculation based on average shares outstanding.
c Does not reflect sales charges, which would reduce return.
d Not annualized.
e Annualized.
f Amount is less than $0.005.
See accompanying notes to financial statements.
16
COHEN & STEERS UTILITY FUND, INC.
FINANCIAL HIGHLIGHTS (Unaudited)—(Continued)
| | | Class B | |
| Per Share Operating Performance: | | For the
Six Months Ended
June 30, 2006 | | For the
Year Ended
December 31, 2005 | | For the Period
May 3, 2004a
through
December 31, 2004 | |
| Net asset value, beginning of period | | $ | 15.19 | | | $ | 13.74 | | | $ | 11.46 | | |
| Income from investment operations: | |
| Net investment incomeb | | | 0.16 | | | | 0.28 | | | | 0.21 | | |
| Net realized and unrealized gain on investments | | | 0.28 | | | | 1.45 | | | | 2.20 | | |
| Total from investment operations | | | 0.44 | | | | 1.73 | | | | 2.41 | | |
| Less dividends and distributions to shareholders from: | |
| Net investment income | | | (0.09 | ) | | | (0.26 | ) | | | (0.10 | ) | |
| Net realized gain on investments | | | — | | | | (0.00 | )f | | | (0.02 | ) | |
| Tax return of capital | | | — | | | | (0.02 | ) | | | (0.01 | ) | |
| Total dividends and distributions to shareholders | | | (0.09 | ) | | | (0.28 | ) | | | (0.13 | ) | |
| Redemption fees retained by the fund | | | 0.00 | f | | | 0.00 | f | | | — | | |
| Net increase in net asset value | | | 0.35 | | | | 1.45 | | | | 2.28 | | |
| Net asset value, end of period | | $ | 15.54 | | | $ | 15.19 | | | $ | 13.74 | | |
| Total investment returnc | | | 2.91 | %d | | | 12.59 | % | | | 21.08 | %d | |
| Ratios/Supplemental Data: | |
| Net assets, end of period (in millions) | | $ | 8.3 | | | $ | 7.7 | | | $ | 2.9 | | |
Ratio of expenses to average daily net assets
(before expense reduction) | | | 2.34 | %e | | | 2.23 | % | | | 4.66 | %e | |
Ratio of expenses to average daily net assets
(net of expense reduction) | | | 2.15 | %e | | | 2.14 | % | | | 2.15 | %e | |
Ratio of net investment income (loss) to average daily net assets
(before expense reduction) | | | 1.94 | %e | | | 1.76 | % | | | (0.11 | )%e | |
Ratio of net investment income to average daily net assets
(net of expense reduction) | | | 2.12 | %e | | | 1.85 | % | | | 2.39 | %e | |
| Portfolio turnover rate | | | 24 | %d | | | 45 | % | | | 16 | %d | |
a Commencement of operations.
b Calculation based on average shares outstanding.
c Does not reflect sales charges, which would reduce return.
d Not annualized.
e Annualized.
f Amount is less than $0.005.
See accompanying notes to financial statements.
17
COHEN & STEERS UTILITY FUND, INC.
FINANCIAL HIGHLIGHTS (Unaudited)—(Continued)
| | | Class C | |
| Per Share Operating Performance: | | For the
Six Months Ended
June 30, 2006 | | For the
Year Ended
December 31, 2005 | | For the Period
May 3, 2004a
through
December 31, 2004 | |
| Net asset value, beginning of period | | $ | 15.20 | | | $ | 13.75 | | | $ | 11.46 | | |
| Income from investment operations: | |
| Net investment income | | | 0.15 | | | | 0.28 | | | | 0.22 | | |
| Net realized and unrealized gain on investments | | | 0.29 | | | | 1.45 | | | | 2.20 | | |
| Total from investment operations | | | 0.44 | | | | 1.73 | | | | 2.42 | | |
| Less dividends and distributions to shareholders from: | |
| Net investment income | | | (0.09 | ) | | | (0.26 | ) | | | (0.10 | ) | |
| Net realized gain on investments | | | — | | | | (0.00 | )f | | | (0.02 | ) | |
| Tax return of capital | | | — | | | | (0.02 | ) | | | (0.01 | ) | |
| Total dividends and distributions to shareholders | | | (0.09 | ) | | | (0.28 | ) | | | (0.13 | ) | |
| Redemption fees retained by the fund | | | 0.00 | f | | | 0.00 | f | | | — | | |
| Net increase in net asset value | | | 0.35 | | | | 1.45 | | | | 2.29 | | |
| Net asset value, end of period | | $ | 15.55 | | | $ | 15.20 | | | $ | 13.75 | | |
| Total investment returnc | | | 2.91 | %d | | | 12.58 | % | | | 21.17 | %d | |
| Ratios/Supplemental Data: | |
| Net assets, end of period (in millions) | | $ | 35.5 | | | $ | 48.6 | | | $ | 14.6 | | |
Ratio of expenses to average daily net assets
(before expense reduction) | | | 2.33 | %e | | | 2.23 | % | | | 4.49 | %e | |
Ratio of expenses to average daily net assets
(net of expense reduction) | | | 2.15 | %e | | | 2.14 | % | | | 2.15 | %e | |
Ratio of net investment income to average daily net assets
(before expense reduction) | | | 1.80 | %e | | | 1.79 | % | | | 0.15 | %e | |
Ratio of net investment income to average daily net assets
(net of expense reduction) | | | 1.97 | %e | | | 1.87 | % | | | 2.49 | %e | |
| Portfolio turnover rate | | | 24 | %d | | | 45 | % | | | 16 | %d | |
a Commencement of operations.
b Calculation based on average shares outstanding.
c Does not reflect sales charges, which would reduce return.
d Not annualized.
e Annualized.
f Amount is less than $0.005.
See accompanying notes to financial statements.
18
COHEN & STEERS UTILITY FUND, INC.
FINANCIAL HIGHLIGHTS (Unaudited)—(Continued)
| | | Class I | |
| Per Share Operating Performance: | | For the
Six Months Ended
June 30, 2006 | | For the
Year Ended
December 31, 2005 | | For the Period
May 3, 2004a
through
December 31, 2004 | |
| Net asset value, beginning of period | | $ | 15.26 | | | $ | 13.78 | | | $ | 11.46 | | |
| Income from investment operations: | |
| Net investment incomeb | | | 0.24 | | | | 0.43 | | | | 0.27 | | |
| Net realized and unrealized gain on investments | | | 0.27 | | | | 1.45 | | | | 2.24 | | |
| Total from investment operations | | | 0.51 | | | | 1.88 | | | | 2.51 | | |
| Less dividends and distributions to shareholders from: | |
| Net investment income | | | (0.16 | ) | | | (0.38 | ) | | | (0.17 | ) | |
| Net realized gain on investments | | | — | | | | (0.00 | )f | | | (0.01 | ) | |
| Tax return of capital | | | — | | | | (0.02 | ) | | | (0.01 | ) | |
| Total dividends and distributions to shareholders | | | (0.16 | ) | | | (0.40 | ) | | | (0.19 | ) | |
| Redemption fees retained by the fund | | | 0.00 | f | | | 0.00 | f | | | — | | |
| Net increase in net asset value | | | 0.35 | | | | 1.48 | | | | 2.32 | | |
| Net asset value, end of period | | $ | 15.61 | | | $ | 15.26 | | | $ | 13.78 | | |
| Total investment return | | | 3.37 | %c | | | 13.73 | % | | | 21.98 | %c | |
| Ratios/Supplemental Data: | |
| Net assets, end of period (in millions) | | $ | 2.7 | | | $ | 2.7 | | | $ | 1.3 | | |
Ratio of expenses to average daily net assets
(before expense reduction) | | | 1.34 | %d | | | 1.24 | % | | | 9.33 | %d | |
Ratio of expenses to average daily net assets
(net of expense reduction) | | | 1.15 | %d | | | 1.14 | % | | | 1.15 | %d | |
Ratio of net investment income to average daily net assets
(before expense reduction) | | | 2.92 | %d | | | 2.80 | % | | | (4.92 | )%d | |
Ratio of net investment income to average daily net assets
(net of expense reduction) | | | 3.10 | %d | | | 2.89 | % | | | 3.26 | %d | |
| Portfolio turnover rate | | | 24 | %c | | | 45 | % | | | 16 | %c | |
a Commencement of operations.
b Calculation based on average shares outstanding.
c Not annualized.
d Annualized.
e Amount is less than $0.005.
See accompanying notes to financial statements.
19
COHEN & STEERS UTILITY FUND, INC.
NOTES TO FINANCIAL STATEMENTS (Unaudited)
Note 1. Significant Accounting Policies
Cohen & Steers Utility Fund, Inc. (the fund) was incorporated under the laws of the State of Maryland on January 13, 2004 and is registered under the Investment Company Act of 1940, as amended, as a nondiversified, open-end management investment company. The fund's investment objective is total return. The authorized shares of the fund are divided into four classes designated Class A, B, C, and I shares. Each of the fund's shares has equal dividend, liquidation and voting rights (except for matters relating to distributions and shareholder servicing of such shares). Class B shares automatically convert to Class A shares at the end of the month which precedes the eighth anniversary of the purchase date.
The following is a summary of significant accounting policies consistently followed by the fund in the preparation of its financial statements. The policies are in conformity with accounting principles generally accepted in the United States of America (GAAP). The preparation of the financial statements in accordance with GAAP requires management to make estimates and assumptions that affect the reported amounts of assets and liabilities at the date of the financial statements and the reported amounts of income and expenses during the reporting period. Actual results could differ from those estimates.
Portfolio Valuation: Investments in securities that are listed on the New York Stock Exchange are valued, except as indicated below, at the last sale price reflected at the close of the New York Stock Exchange on the business day as of which such value is being determined. If there has been no sale on such day, the securities are valued at the mean of the closing bid and asked prices for the day or, if no asked price is available, at the bid price.
Securities not listed on the New York Stock Exchange but listed on other domestic or foreign securities exchanges or admitted to trading on the National Association of Securities Dealers Automated Quotations, Inc. (Nasdaq) national market system are valued in a similar manner. Securities traded on more than one securities exchange are valued at the last sale price on the business day as of which such value is being determined as reflected on the tape at the close of the exchange representing the principal market for such securities.
Readily marketable securities traded in the over-the-counter market, including listed securities whose primary market is believed by Cohen & Steers Capital Management, Inc. to be over-the-counter, but excluding securities admitted to trading on the Nasdaq National List, are valued at the official closing prices as reported by Nasdaq, the National Quotation Bureau, or such other comparable sources as the Board of Directors deem appropriate to reflect their fair market value. If there has been no sale on such day, the securities are valued at the mean of the closing bid and asked prices for the day, or if no asked price is available, at the bid price. However, certain fixed-income securities may be valued on the basis of prices provided by a pricing service when such prices are believed by the Board of Directors to reflect the fair market value of such securities. Where securities are traded on more than one exchange and also over-the-coun ter, the securities will generally be valued using the quotations the Board of Directors believes most closely reflect the value of such securities.
20
COHEN & STEERS UTILITY FUND, INC.
NOTES TO FINANCIAL STATEMENTS (Unaudited)—(Continued)
Securities for which market prices are unavailable, or securities for which the advisor determines that bid and/or asked prices price does reflect market value, will be valued at fair value pursuant to procedures approved by the fund's Board of Directors. Circumstances in which market prices may be unavailable include, but are not limited to, when trading in a security is suspended, the exchange on which the security is traded is subject to an unscheduled close or disruption or material events occur after the close of the exchange on which the security is principally traded. In these circumstances, the fund determines fair value in a manner that fairly reflects the market value of the security on the valuation date based on consideration of any information or factors it deems appropriate. These may include recent transactions in comparable securities, information relating to the specific security and developments in the markets.
The fund's use of fair value pricing may cause the net asset value of fund shares to differ from the net asset value that would be calculated using market quotations. Fair value pricing involves subjective judgments and it is possible that the fair value determined for a security may be materially different than the value that could be realized upon the sale of that security.
Short-term debt securities, which have a maturity date of 60 days or less, are valued at amortized cost, which approximates value.
Security Transactions and Investment Income: Security transactions are recorded on trade date. Realized gains and losses on investments sold are recorded on the basis of identified cost. Interest income is recorded on the accrual basis. Discounts are accreted and premiums are amortized over the life of the respective securities. Dividend income is recorded on the ex-dividend date. The fund records distributions received in excess of income from underlying investments as a reduction of cost of investments and/or realized gain. Such amounts are based on estimates if actual amounts are not available, and actual amounts of income, realized gain and return of capital may differ from the estimated amounts. The fund adjusts the estimated amounts of the components of distributions (and consequently its net investment income) as an increase to unrealized appreciation/(depr eciation) and realized gain/(loss) on investments as necessary once the issuers provide information about the actual composition of the distributions. Income, expenses (other than expenses attributable to a specific class), and realized and unrealized gains or losses on investments are allocated to each class of shares based on its relative net assets.
Foreign Currency Translation and Forward Foreign Currency Contracts: The books and records of the fund are maintained in U.S. dollars as follows: (1) the foreign currency market value of investment securities, other assets and liabilities and forward foreign currency contracts (forward contracts) are translated at the exchange rates prevailing at the end of the period; and (2) purchases, sales, income and expenses are translated at the exchange rates prevailing on the respective dates of such transactions. The resultant exchange gains and losses are recorded as realized and unrealized gain/loss on foreign exchange transactions. Pursuant to U.S. federal income tax regulations, certain foreign exchange gains/losses included in realized and unrealized gain/loss are included in or are a reduction of ordinary income for federal income tax purposes. The fund does not is olate that portion of
21
COHEN & STEERS UTILITY FUND, INC.
NOTES TO FINANCIAL STATEMENTS (Unaudited)—(Continued)
the results of operations arising as a result of changes in the foreign exchange rates from the changes in the market prices of the securities. Forward contracts are valued daily at the appropriate exchange rates. The resultant unrealized exchange gains and losses are recorded as unrealized foreign currency gain or loss. The fund records realized gains or losses on delivery of the currency or at the time the forward contract is extinguished (compensated) by entering into a closing transaction prior to delivery.
Foreign Securities: The fund may directly purchase securities of foreign issuers. Investing in securities of foreign issuers involves special risks not typically associated with investing in securities of U.S. issuers. The risks include possible revaluation of currencies, the ability to repatriate funds, less complete financial information about companies and possible future adverse political and economic developments. Moreover, securities of many foreign issuers and their markets may be less liquid and their prices more volatile than those of securities of comparable U.S. issuers.
Dividends and Distributions to Shareholders: Dividends from net investment income and capital gain distributions are determined in accordance with U.S. federal income tax regulations, which may differ from GAAP. Dividends from net investment income are declared and paid quarterly. Net realized capital gains, unless offset by any available capital loss carryforward, are distributed to shareholders annually. Dividends and distributions to shareholders are recorded on the ex-dividend date and are automatically reinvested in full and fractional shares of the fund based on the net asset value per share at the close of business on the ex-dividend date unless the shareholder has elected to have them paid in cash.
Distributions paid by the fund are subject to recharacterization for tax purposes. Based upon the results of operations for the six months ended June 30, 2006, the advisor considers it likely that a portion of the dividends will be reclassified to return of capital and distributions of net realized capital gains upon the final determination of the fund's taxable income for the year.
Federal Income Taxes: It is the policy of the fund to continue to qualify as a regulated investment company, if such qualification is in the best interest of the shareholders, by complying with the requirements of Subchapter M of the Internal Revenue Code applicable to regulated investment companies, and by distributing substantially all of its taxable earnings to its shareholders. Accordingly, no provision for federal income or excise tax is necessary.
Note 2. Investment Advisory and Administration Fees and Other Transactions with Affiliates
Investment Advisory Fees: Cohen & Steers Capital Management, Inc. (the advisor) serves as the fund's investment advisor pursuant to an investment advisory agreement (the advisory agreement). Under the terms of the advisory agreement, the advisor provides the fund with the day-to-day investment decisions and generally manages the fund's investments in accordance with the stated policies of the fund, subject to the supervision of the fund's Board of Directors. For the services provided to the fund, the advisor receives a fee, accrued daily and paid monthly,
22
COHEN & STEERS UTILITY FUND, INC.
NOTES TO FINANCIAL STATEMENTS (Unaudited)—(Continued)
at the annual rate of 0.75% of the average daily net assets of the fund up to and including $1.5 billion and 0.65% of the average daily net asset above $1.5 billion.
For the six months ended June 30, 2006 and through December 31, 2006, the advisor has contractually agreed to waive its fee and/or reimburse the fund for expenses incurred to the extent necessary to maintain the fund's operating expenses at 1.50% for the Class A shares, 2.15% for the Class B shares and Class C shares and 1.15% for the Class I shares.
Administration Fees: The fund has entered into an administration agreement with the advisor under which the advisor performs certain administrative functions for the fund and receives a fee, accrued daily and paid monthly, at the annual rate of 0.02% of the fund's average daily net assets. For the six months ended June 30, 2006, the fund paid the advisor $14,602 in fees under this administration agreement. Additionally, the fund has retained State Street Bank and Trust Company as sub-administrator under a fund accounting and administration agreement.
Distribution Fees: Shares of the fund are distributed by Cohen & Steers Securities, LLC (the distributor), an affiliated entity of the advisor. The fund has adopted a distribution plan (the plan) pursuant to Rule 12b-1 under the Investment Company Act of 1940. The plan provides that the fund will pay the distributor a fee, accrued daily and paid monthly, at an annual rate of up to 0.25% of the average daily net assets attributable to the Class A shares and up to 0.75% of the average daily net assets attributable to the Class B and Class C shares.
For the six months ended June 30, 2006, the fund has been advised that the distributor received $5,792 in sales commissions from the sale of Class A shares and that the distributor also received $12,682 and $7,823 of contingent deferred sales charges relating to redemptions of Class B and Class C shares, respectively. The distributor has advised the fund that proceeds from the contingent deferred sales charge on the Class B and C shares are paid to the distributor and are used by the distributor to defray its expenses related to providing distribution-related services to the fund in connection with the sale of the Class B and C shares, including payments to dealers and other financial intermediaries for selling Class B and C shares and interest and other financing costs associated with Class B and C shares.
Shareholder Servicing Fees: The fund has adopted a shareholder services plan which provides that the fund may obtain the services of qualified financial institutions to act as shareholder servicing agents for their customers. For these services, the fund may pay the shareholder servicing agent a fee, accrued daily and paid monthly, at an annual rate of up to 0.10% of the average daily net asset value of the fund's Class A shares and up to 0.25% of the average daily net asset value of the fund's Class B and C shares.
Directors' and Officers' Fees: Certain directors and officers of the fund are also directors, officers, and/or employees of the advisor. The fund does not pay compensation to any affiliated directors and officers except for the Chief Compliance Officer, who received $1,114 from the fund for the six months ended June 30, 2006.
23
COHEN & STEERS UTILITY FUND, INC.
NOTES TO FINANCIAL STATEMENTS (Unaudited)—(Continued)
Note 3. Purchases and Sales of Securities
Purchases and sales of securities, excluding short-term investments, for the six months ended June 30, 2006 totaled $34,501,934 and $105,893,949 respectively.
Note 4. Income Tax Information
As of June 30, 2006, the federal tax cost and net unrealized appreciation were as follows:
| Cost for federal income tax purposes | | $ | 88,120,921 | | |
| Gross unrealized appreciation | | $ | 14,734,842 | | |
| Gross unrealized depreciation | | | (187,813 | ) | |
| Net unrealized appreciation | | $ | 14,547,029 | | |
Note 5. Capital Stock
The fund is authorized to issue 200 million shares of capital stock, at a par value of $0.001 per share. The Board of Directors of the fund may increase or decrease the aggregate number of shares of common stock that the fund has authority to issue. At June 30, 2006, Cohen & Steers Capital Management, Inc. owned 91,010 Class I shares or 1.4% of the fund. Transactions in fund shares were as follows:
| | | For the Six Months
Ended
June 30, 2006 | | For the Year
Ended
December 31, 2005 | |
| | | Shares | | Amount | | Shares | | Amount | |
| Class A: | |
| Sold | | | 316,220 | | | $ | 4,888,093 | | | | 6,021,568 | | | $ | 87,820,888 | | |
Issued as reinvestment of
dividends and distributions | | | 12,387 | | | | 189,083 | | | | 22,846 | | | | 350,107 | | |
| Redeemed | | | (4,261,974 | ) | | | (64,977,472 | ) | | | (486,507 | ) | | | (7,308,866 | ) | |
Redemption fees retained by the
funda | | | — | | | | 15,609 | | | | — | | | | 15,301 | | |
| Net increase (decrease) | | | (3,933,367 | ) | | $ | (59,884,687 | ) | | | 5,557,907 | | | $ | 80,877,430 | | |
24
COHEN & STEERS UTILITY FUND, INC.
NOTES TO FINANCIAL STATEMENTS (Unaudited)—(Continued)
| | | For the Six Months
Ended
June 30, 2006 | | For the Year
Ended
December 31, 2005 | |
| | | Shares | | Amount | | Shares | | Amount | |
| Class B: | |
| Sold | | | 63,976 | | | $ | 984,301 | | | | 324,528 | | | $ | 4,762,575 | | |
Issued as reinvestment of dividends
and distributions | | | 503 | | | | 7,652 | | | | 862 | | | | 13,125 | | |
| Redeemed | | | (36,930 | ) | | | (561,900 | ) | | | (25,167 | ) | | | (365,686 | ) | |
Redemption fees retained by the
funda | | | — | | | | 1,154 | | | | — | | | | 983 | | |
| Net increase | | | 27,549 | | | $ | 431,207 | | | | 300,223 | | | $ | 4,410,997 | | |
| Class C: | |
| Sold | | | 127,847 | | | $ | 1,966,032 | | | | 2,355,189 | | | $ | 34,117,442 | | |
Issued as reinvestment of dividends
and distributions | | | 1,238 | | | | 18,848 | | | | 3,081 | | | | 46,938 | | |
| Redeemed | | | (1,046,389 | ) | | | (15,919,864 | ) | | | (219,774 | ) | | | (3,298,391 | ) | |
Redemption fees retained by the
funda | | | — | | | | 6,904 | | | | — | | | | 6,238 | | |
| Net increase (decrease) | | | (917,304 | ) | | $ | (13,928,080 | ) | | | 2,138,496 | | | $ | 30,872,227 | | |
| Class I: | |
| Sold | | | 6,562 | | | $ | 101,876 | | | | 94,827 | | | $ | 1,374,290 | | |
Issued as reinvestment of dividends
and distributions | | | 860 | | | | 13,154 | | | | 3,978 | | | | 60,293 | | |
| Redeemed | | | (12,756 | ) | | | (192,025 | ) | | | (18,074 | ) | | | (272,014 | ) | |
Redemption fees retained by the
funda | | | — | | | | 392 | | | | — | | | | 343 | | |
| Net increase (decrease) | | | (5,334 | ) | | $ | (76,603 | ) | | | 80,731 | | | $ | 1,162,912 | | |
a The fund may charge a 1% redemption fee on shares sold within six months of the time of purchase.
25
COHEN & STEERS UTILITY FUND, INC.
NOTES TO FINANCIAL STATEMENTS (Unaudited)—(Continued)
Note 6. Borrowings
The fund, in conjunction with other Cohen & Steers funds, is a party to a $150,000,000 syndicated credit agreement (the credit agreement) with State Street Bank and Trust Company, as administrative agent and operations agent, and the lenders identified in the credit agreement, which expires December 2006. The fund pays a commitment fee of 0.125% per annum on its proportionate share of the unused portion of the credit agreement.
During the six months ended June 30, 2006, the fund did not utilize the line of credit.
Note 7. Other
In the normal course of business, the fund enters into contracts that provide general indemnifications. The fund's maximum exposure under these arrangements is dependent on claims that may be made against the fund in the future and, therefore, cannot be estimated; however, based on experience, the risk of material loss from such claims is considered remote.
In July 2006, the Financial Accounting Standards Board (FASB) issued Interpretation 48, Accounting for Uncertainty in Income Taxes—an interpretation of FASB Statement 109 (FIN 48). FIN 48 clarifies the accounting for income taxes by prescribing the minimum recognition threshold a tax position must meet before being recognized in the financial statements. FIN 48 is effective for fiscal years beginning after December 15, 2006. The fund will adopt FIN 48 during 2007 and the impact to the fund's financial statements, if any, is currently being assessed.
26
COHEN & STEERS UTILITY FUND, INC.
OTHER INFORMATION
A description of the policies and procedures that the fund uses to determine how to vote proxies relating to portfolio securities is available (i) without charge, upon request, by calling 800-330-7348, (ii) on our Web site at cohenandsteers.com or (iii) on the Securities and Exchange Commission's Web site at http://www.sec.gov. In addition, the fund's proxy voting record for the most recent 12-month period ended June 30 is available (i) without charge, upon request, by calling 800-330-7348 or (ii) on the SEC's Web site at http://www.sec.gov.
The fund files its complete schedule of portfolio holdings with the SEC for the first and third quarters of each fiscal year on Form N-Q. The fund's Forms N-Q are available (i) without charge, upon request by calling 800-330-7348, or (ii) on the SEC's Web site at http://www.sec.gov. In addition, the Forms N-Q may be reviewed and copied at the SEC's Public Reference Room in Washington, DC. Information on the operation of the Public Reference Room may be obtained by calling 800-SEC-0330.
Please note that the distributions paid by the fund to shareholders are subject to recharacterization for tax purposes. The fund may also pay distributions in excess of the fund's net investment company taxable income and this excess would be a tax-free return of capital distributed from the fund's assets. To the extent this occurs, the fund's shareholders of record will be notified of the estimated amount of capital returned to shareholders for each such distribution and this information will also be available at cohenandsteers.com. The final tax treatment of all distributions is reported to shareholders on their 1099-DIV forms, which are mailed after the close of each calendar year. Distributions of capital decrease the fund's total assets and, therefore, could have the effect of increasing the fund's expense ratio. In addition, in order to make these distributions, the fund may have to sell portfolio securities at a less than opportune ti me.
27
COHEN & STEERS UTILITY FUND, INC.
Meet the Cohen & Steers family of open-end funds:

• Designed for investors seeking maximum total return, investing primarily in REITs
• Symbol: CSRSX

• Designed for institutional investors seeking maximum total return, investing primarily in REITs
• Symbol: CSRIX

• Designed for investors seeking high current income, investing primarily in REITs
• Symbols: CSEIX, CSBIX, CSCIX, CSDIX

• Designed for investors seeking maximum capital appreciation, investing in a limited number of REITs and other real estate securities
• Symbols: CSFAX, CSFBX, CSFCX, CSSPX

• Designed for investors seeking maximum total return, investing primarily in international real estate securities
• Symbols: IRFAX, IRFCX, IRFIX

• Designed for investors seeking maximum total return, investing primarily in utilities
• Symbols: CSUAX, CSUBX, CSUCX, CSUIX

• Designed for investors seeking high current income and long-term growth of income and capital appreciation, investing primarily in dividend paying common stocks and preferred stocks.
• Symbols: DVFAX, DVFCX, DVFIX

• Designed for investors seeking maximum total return, investing primarily in real estate securities located in the Asia Pacific region
• Symbols: APFAX, APFCX, APFIX
Please consider the investment objectives, risks, charges and expenses of the fund carefully before investing. A prospectus containing this and other information can be obtained by calling 800-330-7348 or by visiting cohenandsteers.com. Please read the prospectus carefully before investing.
Cohen & Steers Securities, LLC, Distributor
28
COHEN & STEERS UTILITY FUND, INC.
OFFICERS AND DIRECTORS
Robert H. Steers
Director and co-chairman
Martin Cohen
Director and co-chairman
Bonnie Cohen
Director
George Grossman
Director
Richard E. Kroon
Director
Richard J. Norman
Director
Frank K. Ross
Director
Willard H. Smith Jr.
Director
C. Edward Ward, Jr.
Director
Adam Derechin
President and chief executive officer
Joseph M. Harvey
Vice president
Robert S. Becker
Vice president
William F. Scapell
Vice president
Lawrence B. Stoller
Secretary
Jay J. Chen
Treasurer and chief financial officer
Lisa D. Phelan
Chief compliance officer
John E. McLean
Assistant secretary
KEY INFORMATION
Investment Advisor
Cohen & Steers Capital Management, Inc.
280 Park Avenue
New York, NY 10017
(212) 832-3232
Subadministrator and Custodian
State Street Bank and Trust Company
225 Franklin Street
Boston, MA 02110
Transfer Agent
Boston Financial Data Services, Inc.
2 Heritage Drive
North Quincy, MA 02171
(800) 437-9912
Legal Counsel
Stroock & Stroock & Lavan LLP
180 Maiden Lane
New York, NY 10038
Distributor
Cohen & Steers Securities, LLC
280 Park Avenue
New York, NY 10017
Nasdaq Symbol: Class A—CSUAX
Class B—CSUBX
Class C—CSUCX
Class I— CSUIX
Web site: cohenandsteers.com
This report is authorized for delivery only to shareholders of Cohen & Steers Utility Fund, Inc. unless accompanied or preceded by the delivery of a currently effective prospectus setting forth details of the fund. Past performance is of course no guarantee of future results and your investment may be worth more or less at the time you sell.
29
COHEN & STEERS
UTILITY FUND
280 PARK AVENUE
NEW YORK, NY 10017

SEMIANNUAL REPORT
JUNE 30, 2006
Item 2. Code of Ethics.
Not applicable.
Item 3. Audit Committee Financial Expert.
Not applicable.
Item 4. Principal Accountant Fees and Services.
Not applicable.
Item 5. Audit Committee of Listed Registrants.
Not applicable.
Item 6. Schedule of Investments.
Included in Item 1 above.
Item 7. Disclosure of Proxy Voting Policies and Procedures for Closed-End Management Investment Companies.
Not applicable.
Item 8. Portfolio Managers of Closed-End Management Investment Companies.
Not applicable.
Item 9. Purchases of Equity Securities by Closed-End Management Investment Company and Affiliated Purchasers.
Not applicable.
Item 10. Submission of Matters to a Vote of Security Holders.
None.
Item 11. Controls and Procedures.
(a) The registrant’s principal executive officer and principal financial officer have concluded, based upon their evaluation of the registrant’s disclosure controls and procedures as conducted
within 90 days of the filing date of this report, that these disclosure controls and procedures provide reasonable assurance that material information required to be disclosed by the registrant in the report it files or submits on Form N-CSR is recorded, processed, summarized and reported within the time periods specified in the Securities and Exchange Commission’s rules and forms and that such material information is accumulated and communicated to the registrant’s management, including its principal executive officer and principal financial officer, as appropriate, in order to allow timely decisions regarding required disclosure.
(b) There were no changes in the registrant’s internal control over financial reporting that occurred during the second fiscal quarter of the period covered by this report that have materially affected, or are reasonably likely to materially affect, the registrant’s internal control over financial reporting.
Item 12. Exhibits.
(a)(1) Not applicable.
(a) (2) Certifications of principal executive officer and principal financial officer as required by Rule 30a-2(a) under the Investment Company Act of 1940.
(a)(3) Not applicable.
(b) Certifications of principal exe cutive officer and principal financial officer as required by Rule 30a- 2(b) under the Investment Company Act of 1940.
SIGNATURES
Pursuant to the requirements of the Securities Exchange Act of 1934 and the Investment Company Act of 1940, the registrant has duly caused this report to be signed on its behalf by the undersigned, thereunto duly authorized.
COHEN & STEERS UTILITY FUND, INC.
| By: | /s/ Adam M. Derechin | |
| | Name: Adam M. Derechin |
| | Title: President and Chief Executive Officer |
| | |
| Date: August 28, 2006 |
Pursuant to the requirements of the Securities Exchange Act of 1934 and the Investment Company Act of 1940, this report has been signed below by the following persons on behalf of the registrant and in the capacities and on the dates indicated.
| By: | /s/ Adam M. Derechin | |
| | Name: | Adam M. Derechin |
| | Title: | President and Chief Executive Officer
(principal executive officer) |
| | | |
| By: | /s/ Jay J. Chen | |
| | Name: | Jay J. Chen |
| | Title: | Treasurer
(principal financial officer) |
| | | |
| | | |
| Date: August 28, 2006 |
| | | | |