UNITED STATES
SECURITIES AND EXCHANGE COMMISSION
Washington, D.C. 20549
FORM N-CSR
CERTIFIED SHAREHOLDER REPORT OF REGISTERED
MANAGEMENT INVESTMENT COMPANIES
Investment Company Act file number | 811-21488 | |||||||
| ||||||||
Cohen & Steers Global Infrastructure Fund, Inc. | ||||||||
(Exact name of registrant as specified in charter) | ||||||||
| ||||||||
280 Park Avenue, New York, NY |
| 10017 | ||||||
(Address of principal executive offices) |
| (Zip code) | ||||||
| ||||||||
Adam M. Derechin Cohen & Steers Capital Management, Inc. 280 Park Avenue New York, New York 10017 | ||||||||
(Name and address of agent for service) | ||||||||
| ||||||||
Registrant’s telephone number, including area code: | (212) 832-3232 |
| ||||||
| ||||||||
Date of fiscal year end: | December 31 |
| ||||||
| ||||||||
Date of reporting period: | June 30, 2009 |
| ||||||
Item 1. Reports to Stockholders.
COHEN & STEERS GLOBAL INFRASTRUCTURE FUND, INC.
To Our Shareholders:
We would like to share with you our report for the six months ended June 30, 2009. The net asset values per share at that date were $10.34, $10.31, $10.31 and $10.36 for Class A, Class B, Class C and Class I shares, respectively.
The total returns, including income and change in net asset value, for the Fund and the comparative benchmarks were:
| Six Months Ended June 30, 2009 | |||||||
| Cohen & Steers Global Infrastructure Fund—Class A | –1.79 | % | |||||
| Cohen & Steers Global Infrastructure Fund—Class B | –2.09 | % | |||||
| Cohen & Steers Global Infrastructure Fund—Class C | –2.11 | % | |||||
| Cohen & Steers Global Infrastructure Fund—Class I | –1.65 | % | |||||
| UBS Global Infrastructure & Utilities 50/50 Indexa | –1.98 | % | |||||
| S&P 1500 Utilities Indexa | –1.74 | % | |||||
| S&P 500 Indexa | 3.16 | % | |||||
The performance data quoted represent past performance. Past performance is no guarantee of future results. The investment return and the principal value of an investment will fluctuate and shares, if redeemed, may be worth more or less than their original cost. Current performance may be lower or higher than the performance data quoted. Total returns of the Fund current to the most recent month-end can be obtained by visiting our Web site at cohenandsteers.com. Performance quoted does not reflect the deduction of the maximum 4.5% initial sales charge on Class A shares or the 5% and 1% maximum contingent deferred sales charge on Class B and Class C shares, respectively. If such charges were included, returns would have been lower.
Investment Review
In a turbulent period for equities, global infrastructure stocks generated negative total returns in the first half of 2009 and trailed the broad equity markets.
Stocks, including those of listed infrastructure companies, declined through much of the first quarter amid a weak global economy and mostly sluggish capital markets. All regions had sizable downturns. The United States
a The UBS Global Infrastructure & Utilities 50/50 Index tracks a 50% exposure to the global developed-market infrastructure sector. The S&P 1500 Utilities Index is an unmanaged market-capitalization-weighted index of 71 companies whose primary business involves the generation, transmission and/or distribution of electricity and/or natural gas. The S&P 500 Index is an unmanaged index of common stocks that is frequently used as a general measure of stock market performance.
1
COHEN & STEERS GLOBAL INFRASTRUCTURE FUND, INC.
was volatile as investors sought clarity on policy regarding banks and other economic issues. Europe struggled on concerns of a deepening recession and a deteriorating financial sector, and Asia Pacific fell, led by a weak Japanese market.
Conditions in the United States improved in mid-March on signs that the banking and financial system had stabilized. In addition, the Federal Reserve stated that it would make substantial purchases of long-term Treasury and mortgage-backed bonds. Treasury Secretary Geithner unveiled the details of the Public Private Investment Program. Infrastructure stocks rebounded, and the rally extended into the second quarter, when the first 'green shoots' of an economic recovery began to emerge.
Investors' increased appetite for risk was evident in April and May, with infrastructure stocks (which are considered defensive) turning in strong absolute returns but lagging the broader markets. The rally paused in June for stocks generally, including most infrastructure sub-sectors, as investors became more defensive again. In this environment, electric utilities and railways benefited when investors rotated into the least cyclical stocks. An undercurrent of strength from companies in developing markets remained, notably in Brazil and China, which benefited from continued strong internal demand.
Economically sensitive infrastructure sub-sectors—airports, ports and communications infrastructure companies—outperformed their defensive counterparts during the six months ended June 30, as investors responded favorably to global fiscal and monetary stimulus plans. Port operators (which had a total return of +29.8%)1 were top performers, rebounding from a steep sell-off in 2008 when global trade slowed significantly.
Communications infrastructure (+20.0%)—in particular, tower companies—benefited from the growth in data-intensive mobile devices and investment in mobile network capital expenditures.
Electric utilities (–7.2%), the largest sub-sector, underperformed as their defensive characteristics grew less appealing in March when investors moved into more cyclical groups. The railway sub-sector (–24.2%), which includes several Japanese companies, sold off after significantly outperforming in 2008. Investors rotated away from these stocks due to their defensive characteristics and the fact that passenger travel was more sensitive to the economy than expected.
Fund performance
The Fund's Class A shares had a negative total return for the six months ended June 30 but outperformed its benchmark.2 Overall stock selection was beneficial to relative performance, while our sub-sector weightings were a hindrance.
1 Sector returns as measured by the UBS Global 50/50 Infrastructure & Utilities Index.
2 The performance of other share classes may vary due to different expense structures.
2
COHEN & STEERS GLOBAL INFRASTRUCTURE FUND, INC.
Contributors to relative performance included our stock selection in electric utilities and toll roads. The portfolio's toll road holdings benefited significantly from our out-of-benchmark allocations in China and Brazil; both markets saw strong internal demand during the period. Stock selection and our overweight in gas pipeline companies also aided relative performance. We anticipated the stabilization of energy markets and increased our weight (to overweight) in the sub-sector. The toll road and gas pipeline sectors rose 6.4% and 8.5%, respectively, as measured by the index.
Our stock selection and underweight in communications infrastructure companies was the largest detractor from performance. We did not own a distressed communications holding company whose share price rose significantly when it was bought by a large institutional investor, and that had an adverse effect on returns. Our underweight in port operators also hampered relative return and reflected our more defensive position at the time the markets began to turn up.
Investment Outlook
We are closely monitoring the flow of economic data, and it is our view that the United States will surprise to the upside later this year and into 2010, which, along with potential growth in China, could aid a broader global turnaround.
Despite the recent increases in valuations, we still have a positive fundamental outlook for infrastructure stocks and continue to focus on those sectors that are best positioned to benefit from an economic recovery: toll roads, telecommunications infrastructure, ports, airports and gas pipelines. At the same time, we recognize that sectors can differ widely within themselves. A port that handles oil will behave differently than one handling bulk freight, and the performance of inter-city railroads and local commuter lines may not track one another at all. While we now have a bias toward improving economic conditions over the longer term, our allocations will take these stock-specific differences into account.
We are now modestly overweight the United States through our telecommunications holdings. While the United States is likely to play a major role in the global recovery, the developing markets, particularly China and Brazil, are attractive. Both countries have compelling demographics and rising living standards, which contributes to trends such as increased air travel and automobile usage. We favor transportation infrastructure in those economies. As always, our focus remains on well-capitalized companies that are likely to be part of, and profit from, the eventual recovery.
3
COHEN & STEERS GLOBAL INFRASTRUCTURE FUND, INC.
Sincerely,
 |  | ||||||
| MARTIN COHEN | ROBERT H. STEERS | ||||||
| Co-chairman | Co-chairman | ||||||
 |  | ||||||
| ROBERT S. BECKER | BEN MORTON | ||||||
| Portfolio Manager | Portfolio Manager | ||||||
The views and opinions in the preceding commentary are subject to change. This material represents an assessment of the market environment at a specific point in time, should not be relied upon as investment advice and is not intended to predict or depict performance of any investment.
Visit Cohen & Steers online at cohenandsteers.com
For more information about any of our funds, visit cohenandsteers.com, where you will find daily net asset values, fund fact sheets and portfolio highlights. You can also access newsletters, education tools and market updates covering the global real estate, listed infrastructure, utilities, large cap value and preferred securities sectors.
In addition, our Web site contains comprehensive information about our firm, including our most recent press releases, profiles of our senior investment professionals and an overview of our investment approach.
4
COHEN & STEERS GLOBAL INFRASTRUCTURE FUND, INC.
Performance Review (Unaudited)
Average Annual Total Returns—For the Periods Ended June 30, 2009
| Class A Shares | Class B Shares | Class C Shares | Class I Shares | ||||||||||||||||
| 1 Year (with sales charge) | –33.24 | %a | –33.98 | %b | –31.22 | %d | — | ||||||||||||
| 1 Year (without sales charge) | –30.09 | % | –30.51 | % | –30.53 | % | –29.85 | % | |||||||||||
| 5 Year (with sales charge) | 2.79 | %a | 2.73 | %c | 3.07 | % | — | ||||||||||||
| 5 Year (without sales charge) | 3.74 | % | 3.08 | % | 3.07 | % | 4.10 | % | |||||||||||
| Since Inceptione (with sales charge) | 3.69 | %a | 3.76 | %d | 4.07 | % | — | ||||||||||||
| Since Inceptione (without sales charge) | 4.62 | % | 3.93 | % | 4.07 | % | 4.97 | % | |||||||||||
The performance data quoted represent past performance. Past performance is no guarantee of future results. The investment return and principal value of an investment will fluctuate and shares, when redeemed, may be worth more or less than their original cost. Current performance may be lower or higher than the performance data quoted. Performance information current to the most recent month-end can be obtained by visiting our Web site at cohenandsteers.com. The performance table does not reflect the deduction of taxes that a shareholder would pay on Fund distributions or the redemption of Fund shares.
The gross and net expense ratios, respectively, for each class of shares as disclosed in the May 1, 2009 prospectuses were as follows: Class A—1.84% and 1.50%; Class B—2.46% and 2.15%; Class C—2.47% and 2.15%; and Class I—1.69% and 1.15%. Through December 31, 2009, the advisor has contractually agreed to waive its fee and/or reimburse the Fund for expenses incurred to the extent necessary to maintain the Fund's annual operating expenses at 1.50% for Class A shares, 2.15% for Class B, 2.15% for Class C shares and 1.15% for Class I shares.
a Reflects a 4.50% front-end sales charge.
b Reflects a contingent deferred sales charge of 5%.
c Reflects a contingent deferred sales charge of 2%.
d Reflects a contingent deferred sales charge of 1%.
e Inception date of May 3, 2004.
5
COHEN & STEERS GLOBAL INFRASTRUCTURE FUND, INC.
Expense Example (Unaudited)
As a shareholder of the Fund, you incur two types of costs: (1) transaction costs, including sales charges (loads) on purchase payments and redemption fees; and (2) ongoing costs including management fees; distribution and/or service (12b-1) fees; and other Fund expenses. This example is intended to help you understand your ongoing costs (in dollars) of investing in the Fund and to compare these costs with the ongoing costs of investing in other mutual funds.
The example is based on an investment of $1,000 invested at the beginning of the period and held for the entire period January 1, 2009—June 30, 2009.
Actual Expenses
The first line of the table below provides information about actual account values and expenses. You may use the information in this line, together with the amount you invested, to estimate the expenses that you paid over the period. Simply divide your account value by $1,000 (for example, an $8,600 account value divided by $1,000 = 8.6), then multiply the result by the number in the first line under the heading entitled "Expenses Paid During Period" to estimate the expenses you paid on your account during this period.
Hypothetical Example for Comparison Purposes
The second line of the table below provides information about hypothetical account values and hypothetical expenses based on the Fund's actual expense ratio and an assumed rate of return of 5% per year before expenses, which is not the Fund's actual return. The hypothetical account values and expenses may not be used to estimate the actual ending account balance or expenses you paid for the period. You may use this information to compare the ongoing cost of investing in the Fund and other funds. To do so, compare this 5% hypothetical example with the 5% hypothetical examples that appear in the shareholder reports of other funds.
Please note that the expenses shown in the table are meant to highlight your ongoing costs only and do not reflect any transactional costs, such as sales charges (loads) and redemption fees. Therefore, the second line of the table is useful in comparing ongoing costs only, and will not help you determine the relative total costs of owning different funds. In addition, if these transactional costs were included, your costs would have been higher.
6
COHEN & STEERS GLOBAL INFRASTRUCTURE FUND, INC.
Expense Example (Unaudited)—(Continued)
| Beginning Account Value January 1, 2009 | Ending Account Value June 30, 2009 | Expenses Paid During Period* January 1, 2009– June 30, 2009 | |||||||||||||
| Class A | |||||||||||||||
| Actual (–1.79% return) | $ | 1,000.00 | $ | 982.10 | $ | 7.37 | |||||||||
| Hypothetical (5% annual return before expenses) | $ | 1,000.00 | $ | 1,017.36 | $ | 7.50 | |||||||||
| Class B | |||||||||||||||
| Actual (–2.09% return) | $ | 1,000.00 | $ | 979.10 | $ | 10.55 | |||||||||
| Hypothetical (5% annual return before expenses) | $ | 1,000.00 | $ | 1,014.13 | $ | 10.74 | |||||||||
| Class C | |||||||||||||||
| Actual (–2.11% return) | $ | 1,000.00 | $ | 978.90 | $ | 10.55 | |||||||||
| Hypothetical (5% annual return before expenses) | $ | 1,000.00 | $ | 1,014.13 | $ | 10.74 | |||||||||
| Class I | |||||||||||||||
| Actual (–1.65% return) | $ | 1,000.00 | $ | 983.50 | $ | 5.66 | |||||||||
| Hypothetical (5% annual return before expenses) | $ | 1,000.00 | $ | 1,019.09 | $ | 5.76 | |||||||||
* Expenses are equal to the Fund's Class A, Class B, Class C and Class I annualized expense ratio of 1.50%, 2.15%, 2.15% and 1.15%, respectively, multiplied by the average account value over the period, multiplied by 181/365 (to reflect the one-half year period). If the Fund had borne all of its expenses that were assumed by the advisor, the annualized expense ratios would have been 1.94%, 2.61%, 2.60% and 1.60%, respectively.
7
COHEN & STEERS GLOBAL INFRASTRUCTURE FUND, INC.
JUNE 30, 2009
Top Ten Holdings
(Unaudited)
| Security | Value | % of Net Assets | |||||||||
| Vinci SA | $ | 4,061,156 | 5.5 | % | |||||||
| American Tower Corp. | 4,027,138 | 5.4 | |||||||||
| East Japan Railway Co | 3,955,525 | 5.3 | |||||||||
| Atlantia S.p.A. | 3,149,584 | 4.3 | |||||||||
| Central Japan Railway Co | 3,061,447 | 4.1 | |||||||||
| GDF Suez | 2,447,646 | 3.3 | |||||||||
| E.ON AG | 2,381,896 | 3.2 | |||||||||
| Crown Castle International Corp. | 2,125,770 | 2.9 | |||||||||
| SES SA | 1,883,509 | 2.5 | |||||||||
| RWE AG | 1,755,955 | 2.4 | |||||||||
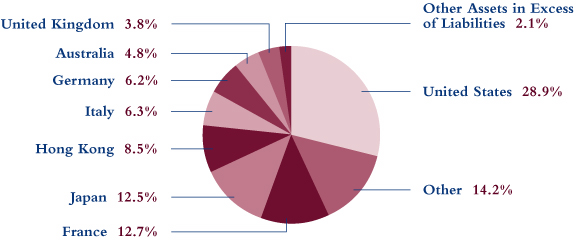
Country Breakdown
(Based on Net Assets)
(Unaudited)
8
COHEN & STEERS GLOBAL INFRASTRUCTURE FUND, INC.
SCHEDULE OF INVESTMENTS
June 30, 2009 (Unaudited)
| Number of Shares | Value | ||||||||||||||
| COMMON STOCK | 97.9 | % | |||||||||||||
| AUSTRALIA | 4.8 | % | |||||||||||||
| ENERGY—INTEGRATED OIL & GAS | 1.1 | % | |||||||||||||
| Origin Energy Ltd.a | 67,000 | $ | 788,883 | ||||||||||||
| INDUSTRIALS | 3.7 | % | |||||||||||||
| AIRPORT SERVICES | 1.2 | % | |||||||||||||
| Macquarie Airportsa | 487,700 | 906,656 | |||||||||||||
| HIGHWAYS & RAILTRACKS | 2.1 | % | |||||||||||||
| Macquarie Infrastructure Groupa | 419,000 | 481,668 | |||||||||||||
| Transurban Groupa | 326,500 | 1,097,030 | |||||||||||||
| 1,578,698 | |||||||||||||||
| RAILROADS | 0.4 | % | |||||||||||||
| Asciano Groupa,b | 280,000 | 299,108 | |||||||||||||
| TOTAL INDUSTRIALS | 2,784,462 | ||||||||||||||
| TOTAL AUSTRALIA | 3,573,345 | ||||||||||||||
| BRAZIL | 3.5 | % | |||||||||||||
| INDUSTRIALS | 3.1 | % | |||||||||||||
| HIGHWAYS & RAILTRACKS | 1.1 | % | |||||||||||||
| Cia de Concessoes Rodoviarias | 52,157 | 836,588 | |||||||||||||
| MARINE PORTS & SERVICES | 0.8 | % | |||||||||||||
| Santos Brasil Participacoes SA | 100,000 | 561,368 | |||||||||||||
| RAILROADS | 1.2 | % | |||||||||||||
| All America Latina Logistica | 145,000 | 893,161 | |||||||||||||
| TOTAL INDUSTRIALS | 2,291,117 | ||||||||||||||
| UTILITIES—ELECTRIC UTILITIES | 0.4 | % | |||||||||||||
| Cia de Transmissao de Energia Eletrica Paulista | 7,000 | 171,794 | |||||||||||||
| Cia Energetica de Minas Gerais (ADR) | 12,000 | 161,280 | |||||||||||||
| 333,074 | |||||||||||||||
| TOTAL BRAZIL | 2,624,191 | ||||||||||||||
See accompanying notes to financial statements.
9
COHEN & STEERS GLOBAL INFRASTRUCTURE FUND, INC.
SCHEDULE OF INVESTMENTS—(Continued)
June 30, 2009 (Unaudited)
| Number of Shares | Value | ||||||||||||||
| CANADA | 2.3 | % | |||||||||||||
| ENERGY—OIL & GAS STORAGE & TRANSPORTATION | |||||||||||||||
| Enbridge | 21,100 | $ | 732,146 | ||||||||||||
| TransCanada Corp. | 37,300 | 1,004,373 | |||||||||||||
| 1,736,519 | |||||||||||||||
| FINLAND | 0.5 | % | |||||||||||||
| UTILITIES—ELECTRIC UTILITIES | |||||||||||||||
| Fortum Oyja | 15,034 | 342,672 | |||||||||||||
| FRANCE | 12.7 | % | |||||||||||||
| CONSUMER DISCRETIONARY—CABLE & SATELLITE | 0.5 | % | |||||||||||||
| Eutelsat Communicationsa,b | 14,000 | 362,363 | |||||||||||||
| INDUSTRIALS | 6.9 | % | |||||||||||||
| AIRPORT SERVICES | 1.4 | % | |||||||||||||
| Aeroports De Parisa | 14,200 | 1,043,980 | |||||||||||||
| CONSTRUCTION & ENGINEERING | 5.5 | % | |||||||||||||
| Vinci SAa | 90,000 | 4,061,156 | |||||||||||||
| TOTAL INDUSTRIALS | 5,105,136 | ||||||||||||||
| UTILITIES | 5.3 | % | |||||||||||||
| ELECTRIC UTILITIES | 1.0 | % | |||||||||||||
| Electricite de Francea | 14,289 | 697,701 | |||||||||||||
| MULTI UTILITIES | 4.3 | % | |||||||||||||
| GDF Sueza | 65,389 | 2,447,646 | |||||||||||||
| Suez Environnement SAa | 43,500 | 762,303 | |||||||||||||
| 3,209,949 | |||||||||||||||
| TOTAL UTILITIES | 3,907,650 | ||||||||||||||
| TOTAL FRANCE | 9,375,149 | ||||||||||||||
| GERMANY | 6.2 | % | |||||||||||||
| INDUSTRIALS | 0.6 | % | |||||||||||||
| AIRPORT SERVICES | 0.3 | % | |||||||||||||
| Fraport AGa | 5,700 | 244,403 | |||||||||||||
See accompanying notes to financial statements.
10
COHEN & STEERS GLOBAL INFRASTRUCTURE FUND, INC.
SCHEDULE OF INVESTMENTS—(Continued)
June 30, 2009 (Unaudited)
| Number of Shares | Value | ||||||||||||||
| MARINE PORTS & SERVICES | 0.3 | % | |||||||||||||
| Hamburger Hafen und Logistik AGa | 5,000 | $ | 193,180 | ||||||||||||
| TOTAL INDUSTRIALS | 437,583 | ||||||||||||||
| UTILITIES | 5.6 | % | |||||||||||||
| ELECTRIC UTILITIES | 3.2 | % | |||||||||||||
| E.ON AGa | 67,100 | 2,381,896 | |||||||||||||
| MULTI UTILITIES | 2.4 | % | |||||||||||||
| RWE AGa | 22,267 | 1,755,955 | |||||||||||||
| TOTAL UTILITIES | 4,137,851 | ||||||||||||||
| TOTAL GERMANY | 4,575,434 | ||||||||||||||
| HONG KONG | 8.5 | % | |||||||||||||
| INDUSTRIALS | 5.3 | % | |||||||||||||
| CONSTRUCTION & ENGINEERING | 0.5 | % | |||||||||||||
| China Railway Construction Corp.a,b | 250,000 | 382,364 | |||||||||||||
| HIGHWAYS & RAILTRACKS | 3.8 | % | |||||||||||||
| Anhui Expressway Coa | 1,347,000 | 761,659 | |||||||||||||
| Shenzhen Expressway Co.a | 962,000 | 461,491 | |||||||||||||
| Sichuan Expressway Co. Ltda,b | 3,844,000 | 1,565,805 | |||||||||||||
| 2,788,955 | |||||||||||||||
| MARINE PORTS & SERVICES | 1.0 | % | |||||||||||||
| Dalian Port PDA Co Ltd.a | 1,836,000 | 739,038 | |||||||||||||
| TOTAL INDUSTRIALS | 3,910,357 | ||||||||||||||
| INFORMATION TECHNOLOGY—COMMUNICATIONS EQUIPMENT | 0.3 | % | |||||||||||||
| Beijing Enterprises Water Group Ltd.a,b | 1,000,000 | 206,474 | |||||||||||||
| TELECOMMUNICATION SERVICES—WIRELESS | 0.2 | % | |||||||||||||
| China Mobile Ltd. (ADR) | 3,400 | 170,272 | |||||||||||||
| UTILITIES | 2.7 | % | |||||||||||||
| ELECTRIC UTILITIES | 1.1 | % | |||||||||||||
| Cheung Kong Infrastructure Holdings Ltd.a | 100,000 | 348,385 | |||||||||||||
| CLP Holdings Ltd.a | 69,000 | 457,651 | |||||||||||||
| 806,036 | |||||||||||||||
See accompanying notes to financial statements.
11
COHEN & STEERS GLOBAL INFRASTRUCTURE FUND, INC.
SCHEDULE OF INVESTMENTS—(Continued)
June 30, 2009 (Unaudited)
| Number of Shares | Value | ||||||||||||||
| GAS UTILITIES | 1.6 | % | |||||||||||||
| Hong Kong and China Gas Co., Ltd.a | 178,100 | $ | 373,864 | ||||||||||||
| Xinao Gas Holdings Ltd.a | 459,000 | 785,935 | |||||||||||||
| 1,159,799 | |||||||||||||||
| TOTAL UTILITIES | 1,965,835 | ||||||||||||||
| TOTAL HONG KONG | 6,252,938 | ||||||||||||||
| ITALY | 6.3 | % | |||||||||||||
| INDUSTRIALS—HIGHWAYS & RAILTRACKS | 4.3 | % | |||||||||||||
| Atlantia S.p.A.a | 155,500 | 3,149,584 | |||||||||||||
| UTILITIES | 2.0 | % | |||||||||||||
| ELECTRIC UTILITIES | 1.2 | % | |||||||||||||
| Enel S.p.A.a | 189,696 | 926,077 | |||||||||||||
| GAS UTILITIES | 0.8 | % | |||||||||||||
| Snam Rete Gas S.p.A.a | 130,663 | 573,971 | |||||||||||||
| TOTAL UTILITIES | 1,500,048 | ||||||||||||||
| TOTAL ITALY | 4,649,632 | ||||||||||||||
| JAPAN | 12.5 | % | |||||||||||||
| INDUSTRIALS—RAILROADS | 9.5 | % | |||||||||||||
| Central Japan Railway Coa | 498 | 3,061,447 | |||||||||||||
| East Japan Railway Coa | 65,700 | 3,955,525 | |||||||||||||
| 7,016,972 | |||||||||||||||
| UTILITIES | 3.0 | % | |||||||||||||
| ELECTRIC UTILITIES | 2.1 | % | |||||||||||||
| Kansai Electric Power Co. (The)a | 26,900 | 593,372 | |||||||||||||
| Tokyo Electric Power Co. (The)a | 38,300 | 984,743 | |||||||||||||
| 1,578,115 | |||||||||||||||
See accompanying notes to financial statements.
12
COHEN & STEERS GLOBAL INFRASTRUCTURE FUND, INC.
SCHEDULE OF INVESTMENTS—(Continued)
June 30, 2009 (Unaudited)
| Number of Shares | Value | ||||||||||||||
| GAS UTILITIES | 0.9 | % | |||||||||||||
| Osaka Gas Co.a | 83,000 | $ | 264,562 | ||||||||||||
| Tokyo Gas Co.a | 106,000 | 378,678 | |||||||||||||
| 643,240 | |||||||||||||||
| TOTAL UTILITIES | 2,221,355 | ||||||||||||||
| TOTAL JAPAN | 9,238,327 | ||||||||||||||
| KOREA | 0.5 | % | |||||||||||||
| UTILITIES—ELECTRIC UTILITIES | |||||||||||||||
| Korea Electric Power Corp. (ADR)b | 32,000 | 368,000 | |||||||||||||
| LUXEMBOURG | 2.5 | % | |||||||||||||
| CONSUMER DISCRETIONARY—CABLE & SATELLITE | |||||||||||||||
| SES SAa | 98,500 | 1,883,509 | |||||||||||||
| MEXICO | 0.4 | % | |||||||||||||
| INDUSTRIALS—AIRPORT SERVICES | |||||||||||||||
| Grupo Aeroportuario del Sureste SAB de CV | 75,000 | 293,775 | |||||||||||||
| NETHERLANDS | 0.4 | % | |||||||||||||
| INDUSTRIALS—MARINE PORTS & SERVICES | |||||||||||||||
| Koninklijke Vopak NVa | 6,000 | 300,571 | |||||||||||||
| NEW ZEALAND | 0.4 | % | |||||||||||||
| INDUSTRIALS—AIRPORT SERVICES | |||||||||||||||
| Auckland International Airport Ltd.a | 300,000 | 311,369 | |||||||||||||
| SPAIN | 3.7 | % | |||||||||||||
| INDUSTRIALS—HIGHWAYS & RAILTRACKS | 1.5 | % | |||||||||||||
| Abertis Infraestructuras S.A.a | 59,500 | 1,123,630 | |||||||||||||
| UTILITIES | 2.2 | % | |||||||||||||
| ELECTRIC UTILITIES | 1.7 | % | |||||||||||||
| Iberdrola SAa | 105,000 | 856,227 | |||||||||||||
| Red Electrica de Espanaa | 9,000 | 407,966 | |||||||||||||
| 1,264,193 | |||||||||||||||
See accompanying notes to financial statements.
13
COHEN & STEERS GLOBAL INFRASTRUCTURE FUND, INC.
SCHEDULE OF INVESTMENTS—(Continued)
June 30, 2009 (Unaudited)
| Number of Shares | Value | ||||||||||||||
| GAS UTILITIES | 0.5 | % | |||||||||||||
| Enagasa | 16,000 | $ | 315,752 | ||||||||||||
| TOTAL UTILITIES | 1,579,945 | ||||||||||||||
| TOTAL SPAIN | 2,703,575 | ||||||||||||||
| UNITED KINGDOM | 3.8 | % | |||||||||||||
| TELECOMMUNICATION SERVICES—ALTERNATIVE CARRIERS | 1.5 | % | |||||||||||||
| Inmarsat PLCa | 120,500 | 1,083,863 | |||||||||||||
| UTILITIES | 2.3 | % | |||||||||||||
| ELECTRIC UTILITIES | 0.6 | % | |||||||||||||
| Scottish and Southern Energy PLCa | 25,867 | 486,668 | |||||||||||||
| MULTI UTILITIES | 1.7 | % | |||||||||||||
| Centrica PLCa | 190,800 | 701,578 | |||||||||||||
| National Grid PLCa | 62,000 | 559,470 | |||||||||||||
| 1,261,048 | |||||||||||||||
| TOTAL UTILITIES | 1,747,716 | ||||||||||||||
| TOTAL UNITED KINGDOM | 2,831,579 | ||||||||||||||
| UNITED STATES | 28.9 | % | |||||||||||||
| ENERGY—OIL & GAS STORAGE & TRANSPORTATION | 1.4 | % | |||||||||||||
| Energy Transfer Partners LP | 4,000 | 161,960 | |||||||||||||
| Enterprise Products Partners LP | 6,000 | 149,640 | |||||||||||||
| Williams Cos. (The) | 47,178 | 736,448 | |||||||||||||
| 1,048,048 | |||||||||||||||
| TELECOMMUNICATION SERVICES—WIRELESS | 9.8 | % | |||||||||||||
| American Tower Corp.b | 127,724 | 4,027,138 | |||||||||||||
| Crown Castle International Corp.b | 88,500 | 2,125,770 | |||||||||||||
| SBA Communications Corp.b | 44,800 | 1,099,392 | |||||||||||||
| 7,252,300 | |||||||||||||||
| UTILITIES | 17.7 | % | |||||||||||||
| ELECTRIC UTILITIES | 11.5 | % | |||||||||||||
| American Electric Power Co. | 48,421 | 1,398,883 | |||||||||||||
| DPL | 20,752 | 480,824 | |||||||||||||
See accompanying notes to financial statements.
14
COHEN & STEERS GLOBAL INFRASTRUCTURE FUND, INC.
SCHEDULE OF INVESTMENTS—(Continued)
June 30, 2009 (Unaudited)
| Number of Shares | Value | ||||||||||||||
| Duke Energy Corp. | 51,400 | $ | 749,926 | ||||||||||||
| Entergy Corp. | 12,604 | 977,062 | |||||||||||||
| Exelon Corp. | 13,444 | 688,467 | |||||||||||||
| FPL Group | 22,265 | 1,265,988 | |||||||||||||
| ITC Holdings Corp. | 12,010 | 544,774 | |||||||||||||
| Northeast Utilities | 16,508 | 368,293 | |||||||||||||
| NV Energy | 47,872 | 516,539 | |||||||||||||
| PPL Corp. | 14,072 | 463,813 | |||||||||||||
| Southern Co. | 32,453 | 1,011,235 | |||||||||||||
| 8,465,804 | |||||||||||||||
| GAS UTILITIES | 1.2 | % | |||||||||||||
| EQT Corp. | 14,834 | 517,855 | |||||||||||||
| Questar Corp. | 11,000 | 341,660 | |||||||||||||
| 859,515 | |||||||||||||||
| INDEPENDENT POWER PRODUCERS & ENERGY TRADERS | 0.2 | % | |||||||||||||
| Constellation Energy Group | 6,800 | 180,744 | |||||||||||||
| MULTI UTILITIES | 4.3 | % | |||||||||||||
| CenterPoint Energy | 35,000 | 387,800 | |||||||||||||
| CMS Energy Corp. | 31,000 | 374,480 | |||||||||||||
| PG&E Corp. | 15,655 | 601,778 | |||||||||||||
| Public Service Enterprise Group | 29,330 | 957,038 | |||||||||||||
| Sempra Energy | 10,000 | 496,300 | |||||||||||||
| Wisconsin Energy Corp. | 8,428 | 343,104 | |||||||||||||
| 3,160,500 | |||||||||||||||
| WATER UTILITIES | 0.5 | % | |||||||||||||
| American Water Works Co. | 20,000 | 382,200 | |||||||||||||
| TOTAL UTILITIES | 13,048,763 | ||||||||||||||
| TOTAL UNITED STATES | 21,349,111 | ||||||||||||||
| TOTAL COMMON STOCK (Identified cost—$79,145,243) | 72,409,696 | ||||||||||||||
See accompanying notes to financial statements.
15
COHEN & STEERS GLOBAL INFRASTRUCTURE FUND, INC.
SCHEDULE OF INVESTMENTS—(Continued)
June 30, 2009 (Unaudited)
| Number of Rights | Value | ||||||||||||||
| RIGHTS | 0.0 | % | |||||||||||||
| BRAZIL | |||||||||||||||
| Cia de Transmissao de Energia Eletrica Paulista, expire 7/17/09b (Identified cost—$0) | 71 | $ | 36 | ||||||||||||
| Number of Shares | |||||||||||||||
| SHORT-TERM INVESTMENTS | 0.3 | % | |||||||||||||
| MONEY MARKET FUNDS | |||||||||||||||
| Dreyfus Treasury Cash Management Fund, 0.001%c | 100,000 | 100,000 | |||||||||||||
| Federated U.S. Treasury Cash Reserves Fund, 0.00%c | 100,000 | 100,000 | |||||||||||||
| TOTAL SHORT-TERM INVESTMENTS (Identified cost—$200,000) | 200,000 | ||||||||||||||
| TOTAL INVESTMENTS (Identified cost—$79,345,243) | 98.2 | % | 72,609,732 | ||||||||||||
| OTHER ASSETS IN EXCESS OF LIABILITIES | 1.8 | % | 1,341,962 | ||||||||||||
| NET ASSETS | 100.0 | % | $ | 73,951,694 | |||||||||||
Glossary of Portfolio Abbreviation
ADR American Depositary Receipt
Note: Percentages indicated are based on the net assets of the Fund.
a Fair valued security. This security has been valued at its fair value as determined in good faith under procedures established by and under the general supervision of the Fund's Board of Directors. Aggregate fair value securities represent 62.0% of net assets of the Fund, all of which have been fair valued pursuant to foreign security fair value pricing procedures approved by the Board of Directors.
b Non-income producing security.
c Rate quoted represents the seven day yield of the fund.
See accompanying notes to financial statements.
16
COHEN & STEERS GLOBAL INFRASTRUCTURE FUND, INC.
STATEMENT OF ASSETS AND LIABILITIES
June 30, 2009 (Unaudited)
| ASSETS: | |||||||
| Investments in securities, at value (Identified cost—$79,345,243) | $ | 72,609,732 | |||||
| Cash | 94,314 | ||||||
| Foreign currency, at value (Identified cost—$23,590) | 23,315 | ||||||
| Receivable for: | |||||||
| Investment securities sold | 2,796,976 | ||||||
| Fund shares sold | 400,354 | ||||||
| Dividends and interest | 185,625 | ||||||
| Other assets | 439 | ||||||
| Total Assets | 76,110,755 | ||||||
| LIABILITIES: | |||||||
| Payable for: | |||||||
| Investment securities purchased | 1,347,018 | ||||||
| Dividends declared | 389,845 | ||||||
| Fund shares redeemed | 240,932 | ||||||
| Investment advisory fees | 52,839 | ||||||
| Directors' fees | 1,924 | ||||||
| Distribution fees | 1,659 | ||||||
| Administration fees | 1,196 | ||||||
| Shareholder servicing fees | 590 | ||||||
| Other liabilities | 123,058 | ||||||
| Total Liabilities | 2,159,061 | ||||||
| NET ASSETS | $ | 73,951,694 | |||||
| NET ASSETS consist of: | |||||||
| Paid-in-capital | $ | 96,735,422 | |||||
| Accumulated undistributed net investment income | 140,442 | ||||||
| Accumulated net realized loss | (16,188,479 | ) | |||||
| Net unrealized depreciation | (6,735,691 | ) | |||||
| $ | 73,951,694 | ||||||
See accompanying notes to financial statements.
17
COHEN & STEERS GLOBAL INFRASTRUCTURE FUND, INC.
STATEMENT OF ASSETS AND LIABILITIES—(Continued)
June 30, 2009 (Unaudited)
| CLASS A SHARES: | |||||||
| NET ASSETS | $ | 40,498,790 | |||||
| Shares issued and outstanding ($0.001 par value common stock outstanding) | 3,915,713 | ||||||
| Net asset value and redemption price per share | $ | 10.34 | |||||
| Maximum offering price per share ($10.34 ÷ 0.955)a | $ | 10.83 | |||||
| CLASS B SHARES: | |||||||
| NET ASSETS | $ | 4,775,029 | |||||
| Shares issued and outstanding ($0.001 par value common stock outstanding) | 463,266 | ||||||
| Net asset value and offering price per shareb | $ | 10.31 | |||||
| CLASS C SHARES: | |||||||
| NET ASSETS | $ | 21,625,367 | |||||
| Shares issued and outstanding ($0.001 par value common stock outstanding) | 2,096,833 | ||||||
| Net asset value and offering price per shareb | $ | 10.31 | |||||
| CLASS I SHARES: | |||||||
| NET ASSETS | $ | 7,052,508 | |||||
| Shares issued and outstanding ($0.001 par value common stock outstanding) | 680,536 | ||||||
| Net asset value, offering and redemption price per share | $ | 10.36 | |||||
a On investments of $100,000 or more, the offering price is reduced.
b Redemption price per share is equal to the net asset value per share less any applicable deferred sales charge which varies with the length of time shares are held.
See accompanying notes to financial statements.
18
COHEN & STEERS GLOBAL INFRASTRUCTURE FUND, INC.
STATEMENT OF OPERATIONS
For the Six Months Ended June 30, 2009 (Unaudited)
| Investment Income: | |||||||
| Dividend income (net of $204,455 of foreign withholding tax) | $ | 1,559,736 | |||||
| Expenses: | |||||||
| Investment advisory fees | 237,694 | ||||||
| Distribution fees—Class A | 40,055 | ||||||
| Distribution fees—Class B | 18,982 | ||||||
| Distribution fees—Class C | 75,377 | ||||||
| Administration fees | 51,356 | ||||||
| Custodian fees and expenses | 50,074 | ||||||
| Shareholder servicing fees—Class A | 16,022 | ||||||
| Shareholder servicing fees—Class B | 6,327 | ||||||
| Shareholder servicing fees—Class C | 25,126 | ||||||
| Shareholder reporting expenses | 43,665 | ||||||
| Registration and filing fees | 42,782 | ||||||
| Transfer agent fees and expenses | 34,339 | ||||||
| Directors' fees and expenses | 25,702 | ||||||
| Professional fees | 9,939 | ||||||
| Line of credit fees | 3,439 | ||||||
| Miscellaneous | 6,235 | ||||||
| Total Expenses | 687,114 | ||||||
| Reduction of Expenses (See Note 2) | (140,760 | ) | |||||
| Net Expenses | 546,354 | ||||||
| Net Investment Income | 1,013,382 | ||||||
| Net Realized and Unrealized Gain (Loss): | |||||||
| Net realized loss on: | |||||||
| Investments | (8,041,674 | ) | |||||
| Foreign currency transactions | (4,915 | ) | |||||
| Net realized loss | (8,046,589 | ) | |||||
| Net change in unrealized depreciation on: | |||||||
| Investments | 6,088,318 | ||||||
| Foreign currency translations | (2,613 | ) | |||||
| Net change in unrealized depreciation | 6,085,705 | ||||||
| Net realized and unrealized loss | (1,960,884 | ) | |||||
| Net Decrease in Net Assets Resulting from Operations | $ | (947,502 | ) | ||||
See accompanying notes to financial statements.
19
COHEN & STEERS GLOBAL INFRASTRUCTURE FUND, INC.
STATEMENT OF CHANGES IN NET ASSETS (Unaudited)
| For the Six Months Ended June 30, 2009 | For the Year Ended December 31, 2008 | ||||||||||
| Change in Net Assets: | |||||||||||
| From Operations: | |||||||||||
| Net investment income | $ | 1,013,382 | $ | 2,140,227 | |||||||
| Net realized loss | (8,046,589 | ) | (7,787,321 | ) | |||||||
| Net change in unrealized appreciation (depreciation) | 6,085,705 | (36,665,633 | ) | ||||||||
| Net decrease in net assets resulting from operations | (947,502 | ) | (42,312,727 | ) | |||||||
| Dividends and Distributions to Shareholders from: | |||||||||||
| Net investment income: | |||||||||||
| Class A | (576,505 | ) | (1,220,510 | ) | |||||||
| Class B | (49,649 | ) | (193,384 | ) | |||||||
| Class C | (239,225 | ) | (659,318 | ) | |||||||
| Class I | (109,264 | ) | (126,592 | ) | |||||||
| Tax return of capital: | |||||||||||
| Class A | — | (29,618 | ) | ||||||||
| Class B | — | (6,498 | ) | ||||||||
| Class C | — | (22,850 | ) | ||||||||
| Class I | — | (2,100 | ) | ||||||||
| Total dividends and distributions to shareholders | (974,643 | ) | (2,260,870 | ) | |||||||
| Capital Stock Transactions: | |||||||||||
| Increase in net assets from Fund share transactions | 9,738,666 | 17,173,166 | |||||||||
| Total increase (decrease) in net assets | 7,816,521 | (27,400,431 | ) | ||||||||
| Net Assets: | |||||||||||
| Beginning of period | 66,135,173 | 93,535,604 | |||||||||
| End of perioda | $ | 73,951,694 | $ | 66,135,173 | |||||||
a Includes undistributed net investment income of $140,442 and $101,703, respectively.
See accompanying notes to financial statements.
20
COHEN & STEERS GLOBAL INFRASTRUCTURE FUND, INC.
FINANCIAL HIGHLIGHTS (Unaudited)
The following table includes selected data for a share outstanding throughout each period and other performance information derived from the financial statements. It should be read in conjunction with the financial statements and notes thereto.
| Class A | |||||||||||||||||||||||||||
| For the Six Months Ended | Year Ended December 31, | For the Period May 3, 2004a through | |||||||||||||||||||||||||
| Per Share Operating Performance: | June 30, 2009 | 2008 | 2007 | 2006 | 2005 | December 31, 2004 | |||||||||||||||||||||
| Net asset value, beginning of period | $ | 10.68 | $ | 17.47 | $ | 16.60 | $ | 15.25 | $ | 13.78 | $ | 11.46 | |||||||||||||||
| Income from investment operations: | |||||||||||||||||||||||||||
| Net investment income | 0.17 | b | 0.38 | b | 0.18 | b | 0.39 | 0.38 | b | 0.29 | b | ||||||||||||||||
| Net realized and unrealized gain (loss) | (0.36 | ) | (6.77 | ) | 3.75 | 2.54 | 1.45 | 2.20 | |||||||||||||||||||
| Total from investment operations | (0.19 | ) | (6.39 | ) | 3.93 | 2.93 | 1.83 | 2.49 | |||||||||||||||||||
| Less dividends and distributions to shareholders from: | |||||||||||||||||||||||||||
| Net investment income | (0.15 | ) | (0.40 | ) | (0.17 | ) | (0.39 | ) | (0.34 | ) | (0.14 | ) | |||||||||||||||
| Net realized gain | — | — | (2.90 | ) | (1.19 | ) | (0.00 | )c | (0.02 | ) | |||||||||||||||||
| Tax return of capital | — | (0.00 | )c | — | (0.00 | )c | (0.02 | ) | (0.01 | ) | |||||||||||||||||
| Total dividends and distributions to shareholders | (0.15 | ) | (0.40 | ) | (3.07 | ) | (1.58 | ) | (0.36 | ) | (0.17 | ) | |||||||||||||||
| Redemption fees retained by the Fund | 0.00 | c | 0.00 | c | 0.01 | 0.00 | c | 0.00 | c | — | |||||||||||||||||
| Net increase (decrease) in net asset value | (0.34 | ) | (6.79 | ) | 0.87 | 1.35 | 1.47 | 2.32 | |||||||||||||||||||
| Net asset value, end of period | $ | 10.34 | $ | 10.68 | $ | 17.47 | $ | 16.60 | $ | 15.25 | $ | 13.78 | |||||||||||||||
| Total investment returnd | –1.79 | %e | –36.94 | % | 23.84 | % | 19.43 | % | 13.33 | % | 21.80 | %e | |||||||||||||||
| Ratios/Supplemental Data: | |||||||||||||||||||||||||||
| Net assets, end of period (in millions) | $ | 40.5 | $ | 32.0 | $ | 43.4 | $ | 47.0 | $ | 114.5 | $ | 26.9 | |||||||||||||||
| Ratio of expenses to average daily net assets (before expense reduction) | 1.94 | %f | 1.84 | % | 1.64 | % | 1.54 | % | 1.58 | % | 3.55 | %f | |||||||||||||||
| Ratio of expenses to average daily net assets (net of expense reduction) | 1.50 | %f | 1.50 | % | 1.50 | % | 1.50 | % | 1.49 | % | 1.50 | %f | |||||||||||||||
| Ratio of net investment income to average daily net assets (before expense reduction) | 3.05 | %f | 2.40 | % | 0.85 | % | 2.05 | % | 2.44 | % | 1.26 | %f | |||||||||||||||
| Ratio of net investment income to average daily net assets (net of expense reduction) | 3.49 | %f | 2.74 | % | 0.99 | % | 2.08 | % | 2.53 | % | 3.31 | %f | |||||||||||||||
| Portfolio turnover rate | 55 | %e | 211 | % | 102 | % | 56 | % | 45 | % | 16 | %e | |||||||||||||||
a Commencement of operations.
b Calculation based on average shares outstanding.
c Amount is less than $0.005.
d Does not reflect sales charges, which would reduce return.
e Not annualized.
f Annualized.
See accompanying notes to financial statements.
21
COHEN & STEERS GLOBAL INFRASTRUCTURE FUND, INC.
FINANCIAL HIGHLIGHTS (Unaudited)—(Continued)
| Class B | |||||||||||||||||||||||||||
| For the Six Months Ended | Year Ended December 31, | For the Period May 3, 2004a through | |||||||||||||||||||||||||
| Per Share Operating Performance: | June 30, 2009 | 2008 | 2007 | 2006 | 2005 | December 31, 2004 | |||||||||||||||||||||
| Net asset value, beginning of period | $ | 10.64 | $ | 17.39 | $ | 16.54 | $ | 15.19 | $ | 13.74 | $ | 11.46 | |||||||||||||||
| Income from investment operations: | |||||||||||||||||||||||||||
| Net investment income | 0.12 | b | 0.29 | b | 0.06 | b | 0.28 | 0.28 | b | 0.21 | b | ||||||||||||||||
| Net realized and unrealized gain (loss) | (0.34 | ) | (6.73 | ) | 3.74 | 2.54 | 1.45 | 2.20 | |||||||||||||||||||
| Total from investment operations | (0.22 | ) | (6.44 | ) | 3.80 | 2.82 | 1.73 | 2.41 | |||||||||||||||||||
| Less dividends and distributions to shareholders from: | |||||||||||||||||||||||||||
| Net investment income | (0.11 | ) | (0.31 | ) | (0.06 | ) | (0.28 | ) | (0.26 | ) | (0.10 | ) | |||||||||||||||
| Net realized gain | — | — | (2.90 | ) | (1.19 | ) | (0.00 | )c | (0.02 | ) | |||||||||||||||||
| Tax return of capital | — | (0.00 | )c | — | (0.00 | )c | (0.02 | ) | (0.01 | ) | |||||||||||||||||
| Total dividends and distributions to shareholders | (0.11 | ) | (0.31 | ) | (2.96 | ) | (1.47 | ) | (0.28 | ) | (0.13 | ) | |||||||||||||||
| Redemption fees retained by the Fund | 0.00 | c | 0.00 | c | 0.01 | 0.00 | c | 0.00 | c | — | |||||||||||||||||
| Net increase (decrease) in net asset value | (0.33 | ) | (6.75 | ) | 0.85 | 1.35 | 1.45 | 2.28 | |||||||||||||||||||
| Net asset value, end of period | $ | 10.31 | $ | 10.64 | $ | 17.39 | $ | 16.54 | $ | 15.19 | $ | 13.74 | |||||||||||||||
| Total investment returnd | –2.09 | %e | –37.35 | % | 23.14 | % | 18.66 | % | 12.59 | % | 21.08 | %e | |||||||||||||||
| Ratios/Supplemental Data: | |||||||||||||||||||||||||||
| Net assets, end of period (in millions) | $ | 4.8 | $ | 6.2 | $ | 12.0 | $ | 8.9 | $ | 7.7 | $ | 2.9 | |||||||||||||||
| Ratio of expenses to average daily net assets (before expense reduction) | 2.61 | %f | 2.46 | % | 2.29 | % | 2.14 | % | 2.23 | % | 4.66 | %f | |||||||||||||||
| Ratio of expenses to average daily net assets (net of expense reduction) | 2.15 | %f | 2.15 | % | 2.15 | % | 2.14 | % | 2.14 | % | 2.15 | %f | |||||||||||||||
| Ratio of net investment income (loss) to average daily net assets (before expense reduction) | 2.06 | %f | 1.74 | % | 0.21 | % | 1.35 | % | 1.76 | % | (0.11 | )%f | |||||||||||||||
| Ratio of net investment income to average daily net assets (net of expense reduction) | 2.52 | %f | 2.05 | % | 0.34 | % | 1.35 | % | 1.85 | % | 2.39 | %f | |||||||||||||||
| Portfolio turnover rate | 55 | %e | 211 | % | 102 | % | 56 | % | 45 | % | 16 | %e | |||||||||||||||
a Commencement of operations.
b Calculation based on average shares outstanding.
c Amount is less than $0.005.
d Does not reflect sales charges, which would reduce return.
e Not annualized.
f Annualized.
See accompanying notes to financial statements.
22
COHEN & STEERS GLOBAL INFRASTRUCTURE FUND, INC.
FINANCIAL HIGHLIGHTS (Unaudited)—(Continued)
| Class C | |||||||||||||||||||||||||||
| For the Six Months Ended | Year Ended December 31, | For the Period May 3, 2004a through | |||||||||||||||||||||||||
| Per Share Operating Performance: | June 30, 2009 | 2008 | 2007 | 2006 | 2005 | December 31, 2004 | |||||||||||||||||||||
| Net asset value, beginning of period | $ | 10.65 | $ | 17.40 | $ | 16.55 | $ | 15.20 | $ | 13.75 | $ | 11.46 | |||||||||||||||
| Income from investment operations: | |||||||||||||||||||||||||||
| Net investment income | 0.13 | b | 0.29 | b | 0.06 | b | 0.28 | 0.28 | b | 0.22 | b | ||||||||||||||||
| Net realized and unrealized gain (loss) | (0.35 | ) | (6.74 | ) | 3.74 | 2.54 | 1.45 | 2.20 | |||||||||||||||||||
| Total from investment operations | (0.22 | ) | (6.45 | ) | 3.80 | 2.82 | 1.73 | 2.42 | |||||||||||||||||||
| Less dividends and distributions to shareholders from: | |||||||||||||||||||||||||||
| Net investment income | (0.12 | ) | (0.30 | ) | (0.06 | ) | (0.28 | ) | (0.26 | ) | (0.10 | ) | |||||||||||||||
| Net realized gain | — | — | (2.90 | ) | (1.19 | ) | (0.00 | )c | (0.02 | ) | |||||||||||||||||
| Tax return of capital | — | (0.00 | )c | — | (0.00 | )c | (0.02 | ) | (0.01 | ) | |||||||||||||||||
| Total dividends and distributions to shareholders | (0.12 | ) | (0.30 | ) | (2.96 | ) | (1.47 | ) | (0.28 | ) | (0.13 | ) | |||||||||||||||
| Redemption fees retained by the Fund | 0.00 | c | 0.00 | c | 0.01 | 0.00 | c | 0.00 | c | — | |||||||||||||||||
| Net increase (decrease) in net asset value | (0.34 | ) | (6.75 | ) | 0.85 | 1.35 | 1.45 | 2.29 | |||||||||||||||||||
| Net asset value, end of period | $ | 10.31 | $ | 10.65 | $ | 17.40 | $ | 16.55 | $ | 15.20 | $ | 13.75 | |||||||||||||||
| Total investment returnd | –2.11 | %e | –37.35 | % | 23.04 | % | 18.70 | % | 12.58 | % | 21.17 | %e | |||||||||||||||
| Ratios/Supplemental Data: | |||||||||||||||||||||||||||
| Net assets, end of period (in millions) | $ | 21.6 | $ | 22.1 | $ | 36.6 | $ | 30.8 | $ | 48.6 | $ | 14.6 | |||||||||||||||
| Ratio of expenses to average daily net assets (before expense reduction) | 2.60 | %f | 2.47 | % | 2.28 | % | 2.19 | % | 2.23 | % | 4.49 | %f | |||||||||||||||
| Ratio of expenses to average daily net assets (net of expense reduction) | 2.15 | %f | 2.15 | % | 2.15 | % | 2.15 | % | �� | 2.14 | % | 2.15 | %f | ||||||||||||||
| Ratio of net investment income to average daily net assets (before expense reduction) | 2.25 | %f | 1.72 | % | 0.20 | % | 1.35 | % | 1.79 | % | 0.15 | %f | |||||||||||||||
| Ratio of net investment income to average daily net assets (net of expense reduction) | 2.70 | %f | 2.04 | % | 0.33 | % | 1.39 | % | 1.87 | % | 2.49 | %f | |||||||||||||||
| Portfolio turnover rate | 55 | %e | 211 | % | 102 | % | 56 | % | 45 | % | 16 | %e | |||||||||||||||
a Commencement of operations.
b Calculation based on average shares outstanding.
c Amount is less than $0.005.
d Does not reflect sales charges, which would reduce return.
e Not annualized.
f Annualized.
See accompanying notes to financial statements.
23
COHEN & STEERS GLOBAL INFRASTRUCTURE FUND, INC.
FINANCIAL HIGHLIGHTS (Unaudited)—(Continued)
| Class I | |||||||||||||||||||||||||||
| For the Six Months Ended | Year Ended December 31, | For the Period May 3, 2004a through | |||||||||||||||||||||||||
| Per Share Operating Performance: | June 30, 2009 | 2008 | 2007 | 2006 | 2005 | December 31, 2004 | |||||||||||||||||||||
| Net asset value, beginning of period | $ | 10.70 | $ | 17.51 | $ | 16.63 | $ | 15.26 | $ | 13.78 | $ | 11.46 | |||||||||||||||
| Income from investment operations: | |||||||||||||||||||||||||||
| Net investment income | 0.19 | b | 0.36 | b | 0.25 | b | 0.43 | 0.43 | b | 0.27 | b | ||||||||||||||||
| Net realized and unrealized gain (loss) | (0.37 | ) | (6.72 | ) | 3.76 | 2.56 | 1.45 | 2.24 | |||||||||||||||||||
| Total from investment operations | (0.18 | ) | (6.36 | ) | 4.01 | 2.99 | 1.88 | 2.51 | |||||||||||||||||||
| Less dividends and distributions to shareholders from: | |||||||||||||||||||||||||||
| Net investment income | (0.16 | ) | (0.45 | ) | (0.24 | ) | (0.43 | ) | (0.38 | ) | (0.17 | ) | |||||||||||||||
| Net realized gain | — | — | (2.90 | ) | (1.19 | ) | (0.00 | )c | (0.01 | ) | |||||||||||||||||
| Tax return of capital | — | (0.00 | )c | — | (0.00 | )c | (0.02 | ) | (0.01 | ) | |||||||||||||||||
| Total dividends and distributions to shareholders | (0.16 | ) | (0.45 | ) | (3.14 | ) | (1.62 | ) | (0.40 | ) | (0.19 | ) | |||||||||||||||
| Redemption fees retained by the Fund | 0.00 | c | 0.00 | c | 0.01 | 0.00 | c | 0.00 | c | — | |||||||||||||||||
| Net increase (decrease) in net asset value | (0.34 | ) | (6.81 | ) | 0.88 | 1.37 | 1.48 | 2.32 | |||||||||||||||||||
| Net asset value, end of period | $ | 10.36 | $ | 10.70 | $ | 17.51 | $ | 16.63 | $ | 15.26 | $ | 13.78 | |||||||||||||||
| Total investment return | –1.65 | %d | –36.73 | % | 24.36 | % | 19.81 | % | 13.73 | % | 21.98 | %d | |||||||||||||||
| Ratios/Supplemental Data: | |||||||||||||||||||||||||||
| Net assets, end of period (in millions) | $ | 7.1 | $ | 5.8 | $ | 1.5 | $ | 2.9 | $ | 2.7 | $ | 1.3 | |||||||||||||||
| Ratio of expenses to average daily net assets (before expense reduction) | 1.60 | %e | 1.69 | % | 1.31 | % | 1.14 | % | 1.24 | % | 9.33 | %e | |||||||||||||||
| Ratio of expenses to average daily net assets (net of expense reduction) | 1.15 | %e | 1.15 | % | 1.15 | % | 1.14 | % | 1.14 | % | 1.15 | %e | |||||||||||||||
| Ratio of net investment income (loss) to average daily net assets (before expense reduction) | 3.41 | %e | 2.24 | % | 1.20 | % | 2.36 | % | 2.80 | % | (4.92 | )%e | |||||||||||||||
| Ratio of net investment income to average daily net assets (net of expense reduction) | 3.85 | %e | 2.77 | % | 1.36 | % | 2.36 | % | 2.89 | % | 3.26 | %e | |||||||||||||||
| Portfolio turnover rate | 55 | %d | 211 | % | 102 | % | 56 | % | 45 | % | 16 | %d | |||||||||||||||
a Commencement of operations.
b Calculation based on average shares outstanding.
c Amount is less than $0.005.
d Not annualized.
e Annualized.
See accompanying notes to financial statements.
24
COHEN & STEERS GLOBAL INFRASTRUCTURE FUND, INC.
NOTES TO FINANCIAL STATEMENTS (Unaudited)
Note 1. Significant Accounting Policies
Cohen & Steers Global Infrastructure Fund, Inc. (the Fund), formerly Cohen & Steers Utility Fund, Inc., was incorporated under the laws of the State of Maryland on January 13, 2004 and is registered under the Investment Company Act of 1940, as amended, as a nondiversified, open-end management investment company. The Fund's investment objective is total return through investment in U.S. and non-U.S. infrastructure companies. The authorized shares of the Fund are divided into four classes designated Class A, B, C, and I shares. Class B shares are no longer offered except through dividend reinvestment and permitted exchanges by existing Class B shareholders. Each of the Fund's shares has equal dividend, liquidation and voting rights (except for matters relating to distributions and shareholder servicing of such shares). Class B shares automatically convert to Class A shares at the end of the month which precedes the eighth anniversary o f the purchase date.
The following is a summary of significant accounting policies consistently followed by the Fund in the preparation of its financial statements. The policies are in conformity with accounting principles generally accepted in the United States of America (GAAP). The preparation of the financial statements in accordance with GAAP requires management to make estimates and assumptions that affect the reported amounts of assets and liabilities at the date of the financial statements and the reported amounts of income and expenses during the reporting period. Actual results could differ from those estimates.
Portfolio Valuation: Investments in securities that are listed on the New York Stock Exchange are valued, except as indicated below, at the last sale price reflected at the close of the New York Stock Exchange on the business day as of which such value is being determined. If there has been no sale on such day, the securities are valued at the mean of the closing bid and asked prices for the day or, if no asked price is available, at the bid price.
Securities not listed on the New York Stock Exchange but listed on other domestic or foreign securities exchanges or admitted to trading on the National Association of Securities Dealers Automated Quotations, Inc. (Nasdaq) national market system are valued in a similar manner. Securities traded on more than one securities exchange are valued at the last sale price on the business day as of which such value is being determined as reflected on the tape at the close of the exchange representing the principal market for such securities.
Readily marketable securities traded in the over-the-counter market, including listed securities whose primary market is believed by Cohen & Steers Capital Management, Inc. (the advisor) to be over-the-counter are valued at the official closing prices as reported by Nasdaq, the Pink Sheets, or such other comparable sources as the Board of Directors deem appropriate to reflect their fair market value. If there has been no sale on such day, the securities are valued at the mean of the closing bid and asked prices for the day, or if no asked price is available, at the bid price. However, certain fixed-income securities may be valued on the basis of prices provided by a pricing service when such prices are believed by the Board of Directors to reflect the fair market value of such securities. Where securities are traded on more than one exchange and also over-the-counter, the securities will generally be valued using the quotations the Board of Directors believes most closely reflect the value of such securities.
25
COHEN & STEERS GLOBAL INFRASTRUCTURE FUND, INC.
NOTES TO FINANCIAL STATEMENTS (Unaudited)—(Continued)
Portfolio securities primarily traded on foreign markets are generally valued at the closing values of such securities on their respective exchanges or if after the close of the foreign markets, but prior to the close of business on the day the securities are being valued, market conditions change significantly, certain foreign securities may be fair valued pursuant to procedures established by the Board of Directors.
Securities for which market prices are unavailable, or securities for which the advisor determines that bid and/or asked price does not reflect market value, will be valued at fair value pursuant to procedures approved by the Fund's Board of Directors. Circumstances in which market prices may be unavailable include, but are not limited to, when trading in a security is suspended, the exchange on which the security is traded is subject to an unscheduled close or disruption or material events occur after the close of the exchange on which the security is principally traded. In these circumstances, the Fund determines fair value in a manner that fairly reflects the market value of the security on the valuation date based on consideration of any information or factors it deems appropriate. These may include recent transactions in comparable securities, information relating to the specific security and developments in the markets.
The Fund's use of fair value pricing may cause the net asset value of Fund shares to differ from the net asset value that would be calculated using market quotations. Fair value pricing involves subjective judgments and it is possible that the fair value determined for a security may be materially different than the value that could be realized upon the sale of that security.
Short-term debt securities, which have a maturity date of 60 days or less, are valued at amortized cost, which approximates value.
The Fund adopted Financial Accounting Standards Board Statement of Financial Accounting Standards No. 157, "Fair Value Measurements" ("FAS 157"), effective January 1, 2008. In accordance with FAS 157, fair value is defined as the price that the Fund would receive to sell an investment or pay to transfer a liability in an orderly transaction with an independent buyer in the principal market, or in the absence of a principal market the most advantageous market for the investment or liability. FAS 157 establishes a single definition of fair value, creates a three-tier hierarchy as a framework for measuring fair value based on inputs used to value the Fund's investments, and requires additional disclosure about fair value. The hierarchy of inputs is summarized below.
• Level 1—quoted prices in active markets for identical investments
• Level 2—other significant observable inputs (including quoted prices for similar investments, interest rates, prepayment speeds, credit risk, etc.)
• Level 3—significant unobservable inputs (including the Fund's own assumptions in determining the fair value of investments)
The Fund adopted Financial Accounting Standards Board Statement of Financial Accounting Standards Staff Position No. 157-4 "Determining Fair Value When the Volume and Level of Activity for the Asset or Liability Have
26
COHEN & STEERS GLOBAL INFRASTRUCTURE FUND, INC.
NOTES TO FINANCIAL STATEMENTS (Unaudited)—(Continued)
Significantly Decreased and Identifying Transactions That Are Not Orderly" ("FSP 157-4"), effective June 15, 2009. FSP 157-4 provides additional guidance for estimating fair value in accordance with FAS 157, when the volume and level of activity for the asset or liability have significantly decreased as well as guidance on identifying circumstances that indicate a transaction is not orderly.
The inputs or methodology used for valuing securities are not necessarily an indication of the risk associated with investing in those securities.
The following is a summary of the inputs used as of June 30, 2009 in valuing the Fund's investments carried at value:
| Total | Quoted Prices In Active Market for Identical Assets (Level 1) | Significant Other Observable Inputs (Level 2) | Significant Unobservable Inputs (Level 3) | ||||||||||||||||
| Common Stock—Brazil | $ | 2,624,191 | $ | 2,624,191 | $ | — | — | ||||||||||||
| Common Stock—Canada | 1,736,519 | 1,736,519 | — | — | |||||||||||||||
| Common Stock—Hong Kong | 6,252,938 | 170,272 | 6,082,666 | — | |||||||||||||||
| Common Stock—Korea | 368,000 | 368,000 | — | — | |||||||||||||||
| Common Stock—Mexico | 293,775 | 293,775 | — | — | |||||||||||||||
| Common Stock—United States | 21,349,111 | 21,349,111 | — | — | |||||||||||||||
| Common Stock—Other Countries | 39,785,162 | — | 39,785,162 | — | |||||||||||||||
| Rights | 36 | 36 | — | — | |||||||||||||||
| Money Market Funds | 200,000 | — | 200,000 | — | |||||||||||||||
| Total Investments | $ | 72,609,732 | $ | 26,541,904 | $ | 46,067,828 | — | ||||||||||||
Security Transactions, Investment Income and Expense Allocations: Security transactions are recorded on trade date. Realized gains and losses on investments sold are recorded on the basis of identified cost. Interest income is recorded on the accrual basis. Discounts are accreted and premiums are amortized over the life of the respective securities. Dividend income is recorded on the ex-dividend date, except for certain dividends on foreign securities, which are recorded as soon as the Fund is informed after the ex-dividend date. Income, expenses (other than expenses attributable to a specific class), and realized and unrealized gains or losses on investments are allocated to each class of shares based on its relative net assets.
Foreign Currency Translations: The books and records of the Fund are maintained in U.S. dollars as follows: (1) the foreign currency market value of investment securities, other assets and liabilities and foreign currency contracts are translated at the exchange rates prevailing at the end of the period; and (2) purchases, sales, income and expenses are translated at the exchange rates prevailing on the respective dates of such transactions. The resultant exchange gains and losses are recorded as realized and unrealized gain/loss on foreign exchange
27
COHEN & STEERS GLOBAL INFRASTRUCTURE FUND, INC.
NOTES TO FINANCIAL STATEMENTS (Unaudited)—(Continued)
transactions. Pursuant to U.S. federal income tax regulations, certain foreign exchange gains/losses included in realized and unrealized gain/loss are included in or are a reduction of ordinary income for federal income tax purposes. The Fund does not isolate that portion of the results of operations arising as a result of changes in the foreign exchange rates from the changes in the market prices of the securities.
Foreign Securities: The Fund may directly purchase securities of foreign issuers. Investing in securities of foreign issuers involves special risks not typically associated with investing in securities of U.S. issuers. The risks include possible revaluation of currencies, the ability to repatriate funds, less complete financial information about companies and possible future adverse political and economic developments. Moreover, securities of many foreign issuers and their markets may be less liquid and their prices more volatile than those of securities of comparable U.S. issuers.
Dividends and Distributions to Shareholders: Dividends from net investment income and capital gain distributions are determined in accordance with U.S. federal income tax regulations, which may differ from GAAP. Dividends from net investment income, if any, are declared and paid semi-annually. Net realized capital gains, unless offset by any available capital loss carryforward, are typically distributed to shareholders at least annually. Dividends and distributions to shareholders are recorded on the ex-dividend date and are automatically reinvested in full and fractional shares of the Fund based on the net asset value per share at the close of business on the payable date unless the shareholder has elected to have them paid in cash.
Income Taxes: It is the policy of the Fund to continue to qualify as a regulated investment company, if such qualification is in the best interest of the shareholders, by complying with the requirements of Subchapter M of the Internal Revenue Code applicable to regulated investment companies, and by distributing substantially all of its taxable earnings to its shareholders. Accordingly, no provision for federal income or excise tax is necessary. The Fund has adopted the provisions of FASB Interpretation No. 48, Accounting for Uncertainty in Income Taxes (FIN 48). FIN 48 clarifies the accounting for income taxes by prescribing the minimum recognition threshold a tax position must meet before being recognized in the financial statements. An assessment of the Fund's tax positions has been made and it has been determined that there is no impact to the Fund's financial statements. Each of the Fund's federal tax returns for the prior three fiscal years remains subject to examination by the Internal Revenue Service.
Note 2. Investment Advisory and Administration Fees and Other Transactions with Affiliates
Investment Advisory Fees: The advisor serves as the Fund's investment advisor pursuant to an investment advisory agreement (the advisory agreement). Under the terms of the advisory agreement, the advisor provides the Fund with the day-to-day investment decisions and generally manages the Fund's investments in accordance with the stated policies of the Fund, subject to the supervision of the Fund's Board of Directors.
28
COHEN & STEERS GLOBAL INFRASTRUCTURE FUND, INC.
NOTES TO FINANCIAL STATEMENTS (Unaudited)—(Continued)
For the services provided to the Fund, the advisor receives a fee, accrued daily and paid monthly, at the annual rate of 0.75% of the average daily net assets of the Fund up to and including $1.5 billion and 0.65% of the average daily net assets above $1.5 billion.
For the six months ended June 30, 2009 and through December 31, 2009 the advisor has contractually agreed to waive its fee and/or reimburse the Fund for expenses incurred to the extent necessary to maintain the Fund's operating expenses at 1.50% for Class A shares, 2.15% for Class B shares and Class C shares and 1.15% for Class I shares.
Under subadvisory agreements with each of Cohen & Steers Asia Limited, Cohen & Steers UK Limited and Cohen & Steers Europe S.A. (collectively the subadvisors), affiliates of the advisor, the subadvisors are responsible for managing the Fund's investments in certain non-U.S. securities. For their services provided under the subadvisory agreement, the advisor (not the Fund) pays the subadvisors 16.3%, 6.3% and 6.3%, respectively, of the advisory fee received by the advisor from the Fund. For the six months ended June 30, 2009 the advisor paid the subadvisors $38,744, $14,975 and $14,975, respectively.
Administration Fees: The Fund has entered into an administration agreement with the advisor under which the advisor performs certain administrative functions for the Fund and receives a fee, accrued daily and paid monthly, at the annual rate of 0.02% of the Fund's average daily net assets. For the six months ended June 30, 2009 the Fund paid the advisor $6,338 in fees under this administration agreement. Additionally, the Fund pays State Street Bank and Trust Company as sub-administrator under a fund accounting and administration agreement.
Distribution Fees: Shares of the Fund are distributed by Cohen & Steers Securities, LLC (the distributor), an affiliated entity of the advisor. The Fund has adopted a distribution plan (the plan) pursuant to Rule 12b-1 under the Investment Company Act of 1940. The plan provides that the Fund will pay the distributor a fee, accrued daily and paid monthly, at an annual rate of up to 0.25% of the average daily net assets attributable to the Class A shares and up to 0.75% of the average daily net assets attributable to the Class B and Class C shares.
For six months ended June 30, 2009 the Fund has been advised that the distributor received $7,651 in sales commissions from the sale of Class A shares and that the distributor also received $319, $15,974, $5,731 of contingent deferred sales charges relating to redemptions of Class A, Class B and Class C shares, respectively. The distributor has advised the Fund that proceeds from the contingent deferred sales charges on the Class A, Class B and Class C shares are paid to the distributor and are used by the distributor to defray its expenses related to providing distribution related services to the Fund in connection with the sale of these classes, including payments to dealers and other financial intermediaries for selling these classes and interest and other financing costs associated with these classes.
29
COHEN & STEERS GLOBAL INFRASTRUCTURE FUND, INC.
NOTES TO FINANCIAL STATEMENTS (Unaudited)—(Continued)
Shareholder Servicing Fees: The Fund has adopted a shareholder services plan which provides that the Fund may obtain the services of qualified financial institutions to act as shareholder servicing agents for their customers. For these services, the Fund may pay the shareholder servicing agent a fee, accrued daily and paid monthly, at an annual rate of up to 0.10% of the average daily net asset value of the Fund's Class A shares and up to 0.25% of the average daily net asset value of the Fund's Class B and Class C shares
Directors' and Officers' Fees: Certain directors and officers of the Fund are also directors, officers, and/or employees of the advisor. The Fund does not pay compensation to any affiliated directors and officers except for the Chief Compliance Officer, who received $821 from the Fund for the six months ended June 30, 2009.
Note 3. Purchases and Sales of Securities
Purchases and sales of securities, excluding short-term investments, for the six months ended June 30, 2009 totaled $44,372,014 and $34,439,458, respectively.
Note 4. Income Tax Information
As of June 30, 2009 the federal tax cost and net unrealized depreciation on securities were as follows:
| Gross unrealized appreciation | $ | 3,331,760 | |||||
| Gross unrealized depreciation | (10,067,271 | ) | |||||
| Net unrealized depreciation | $ | (6,735,511 | ) | ||||
| Cost for federal income tax purposes | $ | 79,345,243 | |||||
As of December 31, 2008 the Fund had a net capital loss carryforward of $5,215,916, which will expire on December 31, 2016. This carryforward may be used to offset future capital gains to the extent provided by regulations.
30
COHEN & STEERS GLOBAL INFRASTRUCTURE FUND, INC.
NOTES TO FINANCIAL STATEMENTS (Unaudited)—(Continued)
Note 5. Capital Stock
The Fund is authorized to issue 200 million shares of capital stock, at a par value of $0.001 per share. The Board of Directors of the Fund may increase or decrease the aggregate number of shares of common stock that the Fund has authority to issue. Transactions in Fund shares were as follows:
| For the Six Months Ended June 30, 2009 | For the Year Ended December 31, 2008 | ||||||||||||||||||
| Shares | Amount | Shares | Amount | ||||||||||||||||
| CLASS A: | |||||||||||||||||||
| Sold | 1,443,485 | $ | 14,127,681 | 2,983,370 | $ | 43,442,803 | |||||||||||||
| Issued as reinvestment of dividends and distributions | 32,361 | 334,613 | 56,610 | 726,938 | |||||||||||||||
| Redeemed | (551,856 | ) | (5,234,016 | ) | (2,532,220 | ) | (33,341,484 | ) | |||||||||||
| Redemption fees retained by the Funda | — | 2,503 | — | 11,416 | |||||||||||||||
| Net increase | 923,990 | $ | 9,230,781 | 507,760 | $ | 10,839,673 | |||||||||||||
| CLASS B: | |||||||||||||||||||
| Sold | 6,470 | $ | 63,023 | 125,891 | $ | 1,724,200 | |||||||||||||
| Issued as reinvestment of dividends and distributions | 2,250 | 23,194 | 5,970 | 77,686 | |||||||||||||||
| Redeemed | (130,356 | ) | (1,236,552 | ) | (240,182 | ) | (3,123,282 | ) | |||||||||||
| Redemption fees retained by the Funda | — | 453 | — | 1,145 | |||||||||||||||
| Net decrease. | (121,636 | ) | $ | (1,149,882 | ) | (108,321 | ) | $ | (1,320,251 | ) | |||||||||
| CLASS C: | |||||||||||||||||||
| Sold | 451,447 | $ | 4,362,874 | 1,524,663 | $ | 22,672,361 | |||||||||||||
| Issued as reinvestment of dividends and distributions | 11,604 | 119,636 | 21,047 | 268,125 | |||||||||||||||
| Redeemed | (446,049 | ) | (4,226,084 | ) | (1,566,862 | ) | (20,936,390 | ) | |||||||||||
| Redemption fees retained by the Funda | — | 1,755 | — | 7,230 | |||||||||||||||
| Net increase (decrease) | 17,002 | $ | 258,181 | (21,152 | ) | $ | 2,011,326 | ||||||||||||
31
COHEN & STEERS GLOBAL INFRASTRUCTURE FUND, INC.
NOTES TO FINANCIAL STATEMENTS (Unaudited)—(Continued)
| For the Six Months Ended June 30, 2009 | For the Year Ended December 31, 2008 | ||||||||||||||||||
| Shares | Amount | Shares | Amount | ||||||||||||||||
| CLASS I: | |||||||||||||||||||
| Sold | 319,792 | $ | 3,121,809 | 753,392 | $ | 9,625,657 | |||||||||||||
| Issued as reinvestment of dividends and distributions | 10,362 | 107,356 | 10,795 | 127,451 | |||||||||||||||
| Redeemed | (191,729 | ) | (1,829,615 | ) | (308,588 | ) | (4,110,690 | ) | |||||||||||
| Redemption fees retained by the Funda | — | 36 | — | — | |||||||||||||||
| Net increase | 138,425 | $ | 1,399,586 | 455,599 | $ | 5,642,418 | |||||||||||||
a The Fund may charge a 2% redemption fee on shares sold within 60 days of the time of purchase. Redemption fees are paid directly to the Fund.
Note 6. Borrowings
The Fund, in conjunction with other Cohen & Steers funds, is a party to a $200,000,000 syndicated credit agreement (the credit agreement) with State Street Bank and Trust Company, as administrative agent and operations agent, and the lenders identified in the credit agreement, which expires December 2009. The Fund pays a commitment fee of 0.15% per annum on its proportionate share of the unused portion of the credit agreement.
During the six months ended June 30, 2009 the Fund did not borrow under the credit agreement.
Note 7. Other
In the normal course of business, the Fund enters into contracts that provide general indemnifications. The Fund's maximum exposure under these arrangements is dependent on claims that may be made against the Fund in the future and, therefore, cannot be estimated; however, based on experience, the risk of material loss from such claims is considered remote.
Note 8. Subsequent Events
In May 2009, the Financial Accounting Standards Board (FASB) issued Statement of Financial Accounting Standards No. 165, Subsequent Events (FAS 165), effective for interim or annual periods ending after June 15, 2009. The FASB has established general standards of accounting for and disclosure of events that occur after the balance sheet date but before financial statements are issued or are available to be issued.
32
COHEN & STEERS GLOBAL INFRASTRUCTURE FUND, INC.
NOTES TO FINANCIAL STATEMENTS (Unaudited)—(Continued)
With regard to the Fund's financial statements, subsequent to June 30, 2009 and through August 18, 2009, there have been no recognized subsequent events (subsequent events that provide additional evidence about conditions that existed at the date of the balance sheet) nor have there been any nonrecognized subsequent events (subsequent events that provide evidence about conditions that did not exist at the date of the balance sheet but arose after the balance sheet but before the financial statements are issued or are available to be issued).
33
COHEN & STEERS GLOBAL INFRASTRUCTURE FUND, INC.
OTHER INFORMATION
A description of the policies and procedures that the Fund uses to determine how to vote proxies relating to portfolio securities is available (i) without charge, upon request, by calling 800-330-7348, (ii) on our Web site at cohenandsteers.com or (iii) on the Securities and Exchange Commission's Web site at http://www.sec.gov. In addition, the Fund's proxy voting record for the most recent 12-month period ended June 30 is available (i) without charge, upon request, by calling 800-330-7348 or (ii) on the SEC's Web site at http://www.sec.gov.
The Fund files its complete schedule of portfolio holdings with the SEC for the first and third quarters of each fiscal year on Form N-Q. The Fund's Forms N-Q are available (i) without charge, upon request by calling 800-330-7348, or (ii) on the SEC's Web site at http://www.sec.gov. In addition, the Forms N-Q may be reviewed and copied at the SEC's Public Reference Room in Washington, DC. Information on the operation of the Public Reference Room may be obtained by calling 800-SEC-0330.
Please note that the distributions paid by the Fund to shareholders are subject to recharacterization for tax purposes. The Fund may also pay distributions in excess of the Fund's net investment company taxable income and this excess would be a tax-free return of capital distributed from the Fund's assets. The final tax treatment of all distributions is reported to shareholders on their 1099-DIV forms, which are mailed after the close of each calendar year.
34
COHEN & STEERS GLOBAL INFRASTRUCTURE FUND, INC.
Meet the Cohen & Steers family of open-end funds:
COHEN & STEERS
GLOBAL REALTY SHARES
• Designed for investors seeking total return, investing primarily in global real estate equity securities
• Symbols: CSFAX, CSFBX, CSFCX, CSSPX
COHEN & STEERS
INSTITUTIONAL GLOBAL REALTY SHARES
• Designed for institutional investors seeking total return, investing primarily in global real estate securities
• Symbol: GRSIX
COHEN & STEERS
REALTY SHARES
• Designed for investors seeking total return, investing primarily in REITs
• Symbol: CSRSX
COHEN & STEERS
INSTITUTIONAL REALTY SHARES
• Designed for institutional investors seeking total return, investing primarily in REITs
• Symbol: CSRIX
COHEN & STEERS
REALTY INCOME FUND
• Designed for investors seeking maximum total return, investing primarily in real estate securities with an emphasis on both income and capital appreciation
• Symbols: CSEIX, CSBIX, CSCIX, CSDIX
COHEN & STEERS
INTERNATIONAL REALTY FUND
• Designed for investors seeking total return, investing primarily in international real estate securities
• Symbols: IRFAX, IRFCX, IRFIX
COHEN & STEERS
ASIA PACIFIC REALTY SHARES
• Designed for investors seeking total return, investing primarily in real estate securities located in the Asia Pacific region
• Symbols: APFAX, APFCX, APFIX
COHEN & STEERS
GLOBAL INFRASTRUCTURE FUND
• Designed for investors seeking total return, investing primarily in global infrastructure securities
• Symbols: CSUAX, CSUBX, CSUCX, CSUIX
COHEN & STEERS
DIVIDEND VALUE FUND
• Designed for investors seeking high current income and long-term growth of income and capital appreciation, investing primarily in dividend paying common stocks and preferred stocks
• Symbols: DVFAX, DVFCX, DVFIX
Please consider the investment objectives, risks, charges and expenses of the fund carefully before investing. A prospectus containing this and other information can be obtained by calling 800-330-7348 or by visiting cohenandsteers.com. Please read the prospectus carefully before investing.
Cohen & Steers Securities, LLC, Distributor
35
COHEN & STEERS GLOBAL INFRASTRUCTURE FUND, INC.
OFFICERS AND DIRECTORS
Robert H. Steers
Director and co-chairman
Martin Cohen
Director and co-chairman
Bonnie Cohen
Director
George Grossman
Director
Richard E. Kroon
Director
Richard J. Norman
Director
Frank K. Ross
Director
Willard H. Smith Jr.
Director
C. Edward Ward, Jr.
Director
Adam M. Derechin
President and chief executive officer
Joseph M. Harvey
Vice president
Robert S. Becker
Vice president
Francis C. Poli
Secretary
James Giallanza
Treasurer and chief financial officer
Lisa D. Phelan
Chief compliance Officer
KEY INFORMATION
Investment Advisor
Cohen & Steers Capital Management, Inc.
280 Park Avenue
New York, NY 10017
(212) 832-3232
Subadministrator and Custodian
State Street Bank and Trust Company
One Lincoln Street
Boston, MA 02111
Transfer Agent
Boston Financial Data Services, Inc.
30 Dan Road
Canton, MA 02021
(800) 437-9912
Legal Counsel
Stroock & Stroock & Lavan LLP
180 Maiden Lane
New York, NY 10038
Distributor
Cohen & Steers Securities, LLC
280 Park Avenue
New York, NY 10017
Nasdaq Symbol: Class A—CSUAX
Class B—CSUBX
Class C—CSUCX
Class I— CSUIX
Web site: cohenandsteers.com
This report is authorized for delivery only to shareholders of Cohen & Steers Global Infrastructure Fund, Inc. unless accompanied or preceded by the delivery of a currently effective prospectus setting forth details of the Fund. Past performance is of course no guarantee of future results and your investment may be worth more or less at the time you sell.
36
COHEN & STEERS
GLOBAL INFRASTRUCTURE FUND
280 PARK AVENUE
NEW YORK, NY 10017
eDelivery NOW AVAILABLE
Stop traditional mail delivery; receive your shareholder reports and prospectus online.
Sign up at cohenandsteers.com
SEMIANNUAL REPORT
JUNE 30, 2009
CSUAXSAR
Item 2. Code of Ethics.
Not applicable.
Item 3. Audit Committee Financial Expert.
Not applicable.
Item 4. Principal Accountant Fees and Services.
Not applicable.
Item 5. Audit Committee of Listed Registrants.
Not applicable.
Item 6. Schedule of Investments.
Included in Item 1 above.
Item 7. Disclosure of Proxy Voting Policies and Procedures for Closed-End Management Investment Companies.
Not applicable.
Item 8. Portfolio Managers of Closed-End Management Investment Companies.
Not applicable.
Item 9. Purchases of Equity Securities by Closed-End Management Investment Company and Affiliated Purchasers.
Not applicable.
Item 10. Submission of Matters to a Vote of Security Holders.
None.
Item 11. Controls and Procedures.
(a) The registrant’s principal executive officer and principal financial officer have concluded, based upon their evaluation of the registrant’s disclosure controls and procedures as conducted within 90 days of the filing date of this report, that these disclosure controls and procedures provide reasonable assurance that material information required to be disclosed by the registrant in the report it files or submits on Form N-CSR is recorded, processed, summarized and reported within the time periods specified in the Securities and Exchange Commission’s rules and forms
and that such material information is accumulated and communicated to the registrant’s management, including its principal executive officer and principal financial officer, as appropriate, in order to allow timely decisions regarding required disclosure.
(b) There were no changes in the registrant’s internal control over financial reporting that occurred during the second fiscal quarter of the period covered by this report that have materially affected, or are reasonably likely to materially affect, the registrant’s internal control over financial reporting.
Item 12. Exhibits.
(a)(1) Not applicable.
(a) (2) Certifications of principal executive officer and principal financial officer as required by Rule 30a-2(a) under the Investment Company Act of 1940.
(a)(3) Not applicable.
(b) Certifications of principal executive officer and principal financial officer as required by Rule 30a- 2(b) under the Investment Company Act of 1940.
SIGNATURES
Pursuant to the requirements of the Securities Exchange Act of 1934 and the Investment Company Act of 1940, the registrant has duly caused this report to be signed on its behalf by the undersigned, thereunto duly authorized.
COHEN & STEERS GLOBAL INFRASTRUCTURE FUND, INC.
By: | /s/ | Adam M. Derechin |
| |
|
| Name: | Adam M. Derechin | |
|
| Title: | President and Chief Executive Officer | |
|
| |||
Date: August 25, 2009 | ||||
Pursuant to the requirements of the Securities Exchange Act of 1934 and the Investment Company Act of 1940, this report has been signed below by the following persons on behalf of the registrant and in the capacities and on the dates indicated.
By: | /s/ | Adam M. Derechin |
| |
|
| Name: | Adam M. Derechin | |
|
| Title: | President and Chief Executive Officer | |
|
|
| (principal executive officer) | |
By: | /s/ | James Giallanza |
| |
|
| Name: | James Giallanza | |
|
| Title: | Treasurer | |
|
|
| (principal financial officer) | |
|
|
| ||
|
|
| ||
Date: August 25, 2009 | ||||