UNITED STATES
SECURITIES AND EXCHANGE COMMISSION
Washington, D.C. 20549
FORM N-CSR
CERTIFIED SHAREHOLDER REPORT OF REGISTERED
MANAGEMENT INVESTMENT COMPANIES
| | |
Investment Company Act file number | | 811-21494 |
Nuveen Floating Rate Income Fund
(Exact name of registrant as specified in charter)
Nuveen Investments
333 West Wacker Drive
Chicago, IL 60606
(Address of principal executive offices) (Zip code)
Gifford R. Zimmerman
Nuveen Investments
333 West Wacker Drive
Chicago, IL 60606
(Name and address of agent for service)
Registrant’s telephone number, including area code: (312) 917-7700
Date of fiscal year end: July 31
Date of reporting period: July 31, 2019
Form N-CSR is to be used by management investment companies to file reports with the Commission not later than 10 days after the transmission to stockholders of any report that is required to be transmitted to stockholders under Rule 30e-1 under the Investment Company Act of 1940 (17 CFR 270.30e-1). The Commission may use the information provided on Form N-CSR in its regulatory, disclosure review, inspection, and policymaking roles.
A registrant is required to disclose the information specified by Form N-CSR, and the Commission will make this information public. A registrant is not required to respond to the collection of information contained in Form N-CSR unless the Form displays a currently valid Office of Management and Budget (“OMB”) control number. Please direct comments concerning the accuracy of the information collection burden estimate and any suggestions for reducing the burden to Secretary, Securities and Exchange Commission, 450 Fifth Street, NW, Washington, DC 20549-0609. The OMB has reviewed this collection of information under the clearance requirements of 44 U.S.C. ss. 3507.
ITEM 1. REPORTS TO STOCKHOLDERS.

Closed-End Funds
31 July 2019
Nuveen
Closed-End Funds
| | |
| NSL | | Nuveen Senior Income Fund |
| JFR | | Nuveen Floating Rate Income Fund |
| JRO | | Nuveen Floating Rate Income Opportunity Fund |
| JSD | | Nuveen Short Duration Credit Opportunities Fund |
| JQC | | Nuveen Credit Strategies Income Fund |
Beginning on January 1, 2021, as permitted by regulations adopted by the Securities and Exchange Commission, paper copies of the Funds’ annual and semi-annual shareholder reports will no longer be sent by mail, unless you specifically request paper copies of the reports. Instead, the reports will be made available on the Funds’ website (www.nuveen.com), and you will be notified by mail each time a report is posted and provided with a website link to access the report.
If you have already elected to receive shareholder reports electronically, you will not be affected by this change and you need not take any action. You may elect to receive shareholder reports and other communications from the Funds electronically anytime by contacting the financial intermediary (such as a broker-dealer or bank) through which you hold your Fund shares or, if you are a direct investor, by enrolling at www.nuveen.com/e-reports.
You may elect to receive all future shareholder reports in paper free of charge at any time by contacting your financial intermediary or, if you are a direct investor, (i) by calling 800-257-8787 and selecting option #2 or (ii) by logging into your Investor Center account at www.computershare.com/investor and clicking on “Communication Preferences.” Your election to receive reports in paper will apply to all funds held in your account with your financial intermediary or, if you are a direct investor, to all your directly held Nuveen Funds and any other directly held funds within the same group of related investment companies.
Annual Report
Life is Complex
Nuveen makes things e-simple.
It only takes a minute to sign up fore-Reports. Once enrolled, you’ll receive ane-mail as soon as your Nuveen Fund information is ready—no more waiting for delivery by regular mail. Just click on the link within thee-mail to see the report and save it on your computer if you wish.
Free e-Reports right to your email!
www.investordelivery.com
If you receive your Nuveen Fund dividends and statements from your financial advisor or brokerage account.
or
www.nuveen.com/client-access
If you receive your Nuveen Fund dividends and statements directly from Nuveen.
NOT FDIC INSURED MAY LOSE VALUE NO BANK GUARANTEE
Table of Contents
3
Chairman’s Letter to Shareholders

Dear Shareholders,
In recent months, economic pessimism has been rising. An unexpected escalation in U.S.- China trade tensions and an unpredictable Brexit outcome top the list of geopolitical concerns. Global macroeconomic data shows a further moderation in growth as a result of weaker export and manufacturing activity across the U.S., Europe and Asia. Notably, in the U.S., some of the more historically reliable leading economic indicators have turned bearish. Although these indicators do not predict the timing of an economic downturn, an inverted yield curve, which occurs when yields on long-term Treasury bonds fall below those of short-term Treasury bonds, and contracting manufacturing activity have preceded past U.S. recessions. U.S. economic growth forecasts and corporate earnings outlooks continue to be downgraded. In this environment, equity market volatility has increased while safe-haven assets, including government bonds and gold, have rallied strongly.
While these conditions have contributed to the market’s anxiety and certainly merit watching, it appears the likelihood of a near-term recession remains low. Consumer spending, buoyed by historically low unemployment and modest wage growth, has powered the economic recovery, even as business investment has been lackluster. Additionally, the sectors directly hit by trade, namely manufacturing and commodity-related businesses, represent a much smaller share of the overall economy than in the past. Central bank efforts to extend the economic cycle with lower interest rates encourages business and consumers to borrow at lower rates while markets have been encouraged by the expectation of easier financial conditions. Recession is not necessarily imminent if these factors can provide the economy with a measure of resilience, sustaining growth at a more subdued pace.
Outside the U.S., central banks and governments have been easing monetary conditions and rolling out fiscal spending programs to buffer slowing growth. The European Central Bank is widely expected to announce a stimulus plan at its September meeting, and China’s authorities remain committed to keeping economic growth rates steady with fiscal and monetary policy. Until there is more clarity on trade, however, the markets may experience bouts of risk-on, risk-off sentiment.
The opportunity set may be narrower, but there may still be scope for gains in this environment. Patience and maintaining perspective can help you weather periodic market volatility. We encourage you to work with your financial advisor to assess short-term market movements in the context of your time horizon, risk tolerance and investment goals. On behalf of the other members of the Nuveen Fund Board, we look forward to continuing to earn your trust in the months and years ahead.
Sincerely,

Terence J. Toth
Chairman of the Board
September 24, 2019
4
Portfolio Managers’ Comments
Nuveen Senior Income Fund (NSL)
Nuveen Floating Rate Income Fund (JFR)
Nuveen Floating Rate Income Opportunity Fund (JRO)
Nuveen Short Duration Credit Opportunities Fund (JSD)
Nuveen Credit Strategies Income Fund (JQC)
The Funds’ investment portfolios are managed by Symphony Asset Management, LLC (Symphony), an affiliate of Nuveen, LLC. During the reporting period, Scott Caraher and Jenny Rhee managed NSL, JFR JRO and JSD, while Scott Caraher, Jenny Rhee and Sutanto Widjaja managed JQC.
Effective September 3, 2019 (subsequent to the close of the reporting period), Bernard Wong, CFA, was added as portfolio manager to JQC and Sutanto Widjaja is no longer a portfolio manager to JQC.
Effective May 23, 2019, Scott Caraher and Jenny Rhee were added as portfolio managers to JQC. Jenny Rhee was also added as portfolio manager to NSL, JRO and JFR.
On October 1, 2018, Gunther Stein ceased serving as a portfolio manager for each of the Funds.
Here the team discusses economic and market conditions, their management strategies and the performance of the Funds for the twelve-month reporting period ended July 31, 2019.
What factors affected the U.S. economy and the markets during the twelve-month reporting period ended July 31, 2019?
The U.S. economy reached the tenth year of expansion since the previous recession ended in June 2009, marking the longest expansion in U.S. history. The Bureau of Economic Analysis “second” estimate of gross domestic product (GDP) growth came in at 2.0% (annualized) for the second quarter of 2019, a notable slowdown from 3.1% annualized growth in the first quarter of the year and below the 2.5% growth rate achieved in 2018. Strong consumer and government spending in the April to June 2019 quarter helped sustain the economy’s growth trend, despite weaker exports and reduced business investment.
Consumer spending, the largest driver of the economy, remained well supported by low unemployment, wage gains and tax cuts. As reported by the Bureau of Labor Statistics, the unemployment rate fell to 3.7% in July 2019 from 3.9%
This material is not intended to be a recommendation or investment advice, does not constitute a solicitation to buy, sell or hold a security or an investment strategy and is not provided in a fiduciary capacity. The information provided does not take into account the specific objectives or circumstances of any particular investor, or suggest any specific course of action. Investment decisions should be made based on an investor’s objectives and circumstances and in consultation with his or her advisors.
Certain statements in this report are forward-looking statements. Discussions of specific investments are for illustration only and are not intended as recommendations of individual investments. The forward-looking statements and other views expressed herein are those of the portfolio managers as of the date of this report. Actual future results or occurrences may differ significantly from those anticipated in any forward-looking statements and the views expressed herein are subject to change at any time, due to numerous market and other factors. The Funds disclaim any obligation to update publicly or revise any forward-looking statements or views expressed herein.
For financial reporting purposes, the ratings disclosed are the highest rating given by one of the following national rating agencies: Standard & Poor’s (S&P), Moody’s Investors Service, Inc. (Moody’s) or Fitch, Inc. (Fitch). This treatment of split-rated securities may differ from that used for other purposes, such as for Fund investment policies. Credit ratings are subject to change. AAA, AA, A and BBB are investment grade ratings, while BB, B, CCC, CC, C and D are below investment grade ratings. Holdings designated N/R are not rated by these national rating agencies.
Refer to the Glossary of Terms Used in this Report for further definition of the terms used within this section.
5
Portfolio Managers’ Comments(continued)
in July 2018 and job gains averaged around 187,000 per month for the past twelve months. As the jobs market has tightened, average hourly earnings grew at an annualized rate of 3.2% in July 2019. However, falling energy prices dampened inflation over the past twelve months. The Bureau of Labor Statistics said the Consumer Price Index (CPI) increased 1.8% over the twelve-month reporting period ended July 31, 2019 before seasonal adjustment.
Low mortgage rates and low inventory drove home prices moderately higher in this reporting period, despite declining new home sales and housing starts. The S&P CoreLogic Case-Shiller U.S. National Home Price Index, which covers all nine U.S. census divisions, was up 3.1% year-over-year in June 2019 (most recent data available at the time this report was prepared). The10-City and20-City Composites reported year-over-year increases of 1.8% and 2.1%, respectively.
As data pointed to slower momentum in the overall economy, the Federal Reserve (Fed) notably shifted its stance. Although the Fed had indicated in December 2018 that there could be two more rate hikes in 2019, global growth concerns kept the central bank on the sidelines. As expected by the markets, the Fed left rates unchanged throughout the first half of 2019 while speculation increased that the Fed’s next move would be a rate cut. At the July 2019 policy committee meeting, the Fed announced a 0.25% cut to its main policy rate and that it will stop shrinking its bond portfolio sooner than scheduled. Markets initially registered disappointment with the Fed’s explanation that the rate cut was a“mid-cycle adjustment,” rather than a prolonged easing period.
During the twelve-month reporting period, geopolitical news remained a prominent market driver. Tariff and trade policy topped the list of concerns, most prominently the U.S.-China relations. After several rounds of talks and a series of tariff increases, President Trump and President Xi agreed to another temporary trade truce in late June 2019 that halted additional tariff increases. The July negotiations ended without an agreement, and President Trump announced a 10% tariff on the remaining $300 billion worth of Chinese imports effective in September. (Subsequent to the close of the reporting period, he said the tariffs would be postponed untilmid-December). Additionally, the U.S. administration walked back its ban on U.S. companies doing business with Chinese tech giant Huawei. The agreed-upon trade deal between the U.S., Mexico and Canada to replace the North American Free Trade Agreement has yet to be ratified by the national congresses, while President Trump rescinded the threat to impose tariffs on Mexico if the country didn’t take more action to curb illegal immigration. Meanwhile, as agreed in July 2018, the U.S. and the European Union continued to withhold further tariffs. Markets grew increasingly worried that trade conflicts would dampen already slowing global growth, as negative sentiment could inhibit business, consumer and investor confidence and spending.
In the U.K., Prime Minister Theresa May was unable to secure a Brexit deal before the original March 29, 2019 deadline. The European Union extended the deadline to October 31, 2019, and Prime Minister May resigned effective June 7, 2019. As widely expected, Brexit hardliner Boris Johnson was voted leader of the Conservative Party and assumed premiership. Europe also contended with Italy’s eurosceptic coalition government and its challenging fiscal condition, the “yellow vest” protests in France, immigration policy concerns, Russian sanctions and political risk in Turkey. (Subsequent to the close of the reporting period, Italy’s Prime Minister unexpectedly resigned amid a growing rift with the coalition government over key domestic and fiscal policies.)
Elections around the world also remained a source of uncertainty. Markets continued to closely monitor the new administrations in Brazil and Mexico, as well as Argentina’s upcoming presidential election. (After the close of the reporting period, President Macri, who is considered the market-friendly candidate, suffered a surprising defeat in Argentina’s August primary vote.) In the U.K., the possibility of ano-deal Brexit increased under new Prime Minister Boris Johnson. Europe’s traditional centrist parties lost seats in the Parliamentary elections and populist parties saw marginal gains. The ruling parties in India and South Africa maintained their majorities, where slower economic growth could complicate their respective reform mandates.
The twelve-month reporting period was generally a positive environment for U.S. corporate credit, although there were a few periods of market instability. In particular, the fourth quarter of 2018 saw heavy redemptions from retail mutual funds and exchange-traded funds (ETFs) that caused significant volatility for loans. This was particularly acute within
6
larger, more liquid and higher quality assets. Throughout much of 2019, this trend normalized with loans moving back closer to fair value. This was particularly the case for those assets most affected during thesell-off in the fourth quarter 2018 as these deeply discounted names had more upside. Throughout the reporting period, the market also saw heavy outflows from retail investors. However, loans continued to see strong and consistent demand from institutional investors in particular from the collateralized loan obligation (CLO) market. Meanwhile, high yield funds saw stronger demand during much of the latter part of the reporting period as interest rate risk became more benign amid a more dovish Fed monetary policy that benefits fixed rate high yield bonds.
What strategies were used to manage the Funds during the twelve-month reporting period ended July 31, 2019?
NSL seeks to achieve a high level of current income, consistent with capital preservation by investing primarily in adjustable rate U.S dollar-denominated secured senior loans. The Fund invests at least 80% of its managed assets in adjustable rate senior secured loans. Up to 20% may include U.S. dollar denominated senior loans ofnon-U.S. borrowers, senior loans that are not secured, other debt securities and equity securities and warrants. The Fund uses leverage.
JFR seeks to achieve a high level of current income by investing in adjustable rate secured and unsecured senior loans and other debt instruments. The Fund invests at least 80% of its managed assets in adjustable rate loans, primarily senior loans, though the loans may include unsecured senior loans and secured and unsecured subordinated loans. At least 65% the Fund’s managed assets must include adjustable rate senior loans that are secured by specific collateral. The Fund uses leverage.
JRO seeks to achieve a high level of current income. The Fund invests at least 80% of its managed assets in adjustable rate loans, primarily senior loans, though the loans may include unsecured senior loans and secured and unsecured subordinated loans. At least 65% of the Fund’s managed assets must include adjustable rate senior loans that are secured by specific collateral. The Fund uses leverage.
JSD seeks to provide current income and the potential for capital appreciation. The Fund invests at least 70% of its managed assets in adjustable rate corporate debt instruments, including senior secured loans, second lien loans and other adjustable rate corporate debt instruments, at least 80% of “assets,” at time of purchase, in loans or securities in the issuing company’s capital structure that are senior to its common equity, including but not limited to debt securities, preferred securities and up to 30% of the Fund’s assets may include other types of debt instruments or short positions consisting primarily of high yield debt. The Fund maintains a portfolio with an average duration that does not exceed two years. The Fund uses leverage.
JQC’s primary investment objective is high current income and its secondary objective is total return. The Fund invests at least 70% of its managed assets in adjustable rate senior secured and second lien loans, at least 80% of “assets,” at time of purchase, in loans or securities in the issuing company’s capital structure that are senior to its common equity, including but not limited to debt securities, preferred securities and up to 30% opportunistically in other types of securities across a company’s capital structure, primarily income-oriented securities such as high yield debt, convertible securities and other forms of corporate debt. The Fund uses leverage.
How did the Funds perform during this twelve-month reporting period ended July 31, 2019?
The tables in the Performance Overview and Holding Summaries section of this report provide total return performance for each Fund for theone-year, five-year,ten-year and/or since inception periods ended July 31, 2019. The Fund’s total returns at net asset value (NAV) are compared with the performance of a corresponding market index.
The Funds’ total returns at NAV for the reporting period are as follows: NSL 1.81%, JFR 2.03%, JRO 1.94%, JSD 1.30% and JQC 3.43%. Over the same period the Credit Suisse Leveraged Loan Index returned 4.10%.
7
Portfolio Managers’ Comments(continued)
What other Fund factors impacted Fund Performance?
The senior loan portion of the Funds is invested predominantly in first-lien, senior secured corporate loans. Symphony prefers to focus on issuers that have strong asset coverage, defensible businesses and loans of larger issuance size. These loans are generally referred to as broadly syndicated loans. At the beginning of the reporting period, Symphony generally believed that these larger loan issuances offered better risk/return dynamics as the liquidity premium, or spread, between larger loans and smaller loans remained tight. This was further exacerbated following a liquidity drivensell-off late in 2018 which had a more pronounced impact on larger, better quality issuances within the loan market. Throughout the latter half of the reporting period, Symphony continued to focus on these issuances as the market normalized, which benefited these names that were particularly hurt in the volatile period towards the end of 2018.
The Funds also invest in high yield corporate bonds. High yield bonds are typically invested in opportunistically as Symphony sees value in these assets. Many of the same issuers of high yield bonds also have senior loans outstanding and in some cases, Symphony believes that the bonds of these issuers offer a better risk-returntrade-off versus the loans. Oftentimes, Symphony will invest in both the loans and the bonds of the same issuer.
The major allocation and security selection performance factors were similar in NSL, JFR, JRO and JSD. During the reporting period, an overweight exposure to BBB rated loans contributed to performance as these higher quality assets outperformed the overall loan market as measured by the Credit Suisse Leveraged Loan Index. The media/telecom sector as well as security selection within the retail sector benefited performance. An underweight to metals and mining and energy sectors also contributed to performance as these cyclical sectors lagged the overall loan market. This was particularly the case for metals and mining names which were the most prominent underperformers within the loan market during the reporting period. The Funds also benefited from their high yield bond exposure, as high yield bonds outperformed loans during the reporting period. For comparison, the Credit Suisse Leveraged Loan Index returned 4.10% while the high yield bond market (as measured by the ICE BofAML High Yield Index) returned 6.94% over the same time period.
Individual securities that contributed to performance included Albertson’s LLC, the grocery store operator, whose loans have benefited from improved sales, reduced debt and a successful issuance of debt to refinance existing liabilities. In addition, the debt of Sprint Corporation was a top contributor as the company was given approval for a proposed merger with another telecom operator. Lastly, the loans of PetSmart benefited performance. PetSmart successfully brought its online business public during the reporting period, which improved the issuer’s fundamental profile.
Several factors contributed to the Funds’ underperformance, including security selection within the financials sector. In particular, the loan of mortgage service company, Walter Investment Management Corporation, detracted from performance. The distressed issuer filed for bankruptcy during the reporting period and has most recently been in the process of looking for buyers for the company. Also detracting from performance were the loans of Catalina Marketing. Catalina has historically been involved in the print coupon business. It is currently in the process of restructuring its business to changing market dynamics. Lastly, the post reorganization equity of Avaya, Inc. detracted from performance for all four of the Funds. The stock of the issuer has been volatile following the issuer’s emergence from bankruptcy. For JSD, the first and second lien loans of education software company Skillsoft Corporation detracted from performance. Skillsoft was downgraded amid high levels of leverage and pending debt maturities. We continue to hold all the positions.
JQC has a differentiated mandate relative to the other Funds. The core loan bucket for JQC is generally comprised of higher credit quality issues and the Fund is generally allocated more toward the high yield market on a relative basis. This relative overweight to high yield bonds benefited the Fund given their general outperformance versus loans during the reporting period. JQC is also less exposed to post reorganization equity positions, generally resulting in lower volatility. Due to these circumstances, it outperformed the other four Funds during the reporting period. Relative to the Credit Suisse Leveraged Loan Index, JQC’s overweight exposure to BBB rated loans contributed to performance during the reporting period as these higher quality assets outperformed the overall loan market.
8
From a sector perspective, JQC had strong issuer selection within media/telecom, health care, consumer durables and retail, which helped absolute and relative performance. Top issues benefiting the Fund’s return during the reporting period included PetSmart Inc., Revlon Consumer Products Corporation, and iHeart Communications Inc. PetSmart successfully brought its online business public during the reporting period, improving the issuer’s credit fundamental profile. The loans and bonds of Revlon rose on the announcement of good financial performance and a significant cost optimization program. Lastly, cash flows related to the successful restructuring of radio station operator iHeart Communications added to performance during the reporting period. We continue to hold PetSmart Inc., Revlon Consumer Products Corporation and iHeart Communications.
Detracting from performance was security selection predominantly within the financials sector. In particular, the loan of mortgage service company, Walter Investment Management Corporation, detracted from performance. The distressed issuer had filed for bankruptcy during the reporting period and has most recently been in the process of looking for buyers for the company. Also detracting from performance were the loans of Catalina Marketing. Catalina, which has historically been involved in the print coupon business, is in the process of restructuring its business to changing market dynamics. Also of note, the post reorganization equity of Avaya Holdings Corporation, Fieldwood Energy LLC and Harvey Gulf International Marine, Inc. detracted from performance. The stock of Fieldwood Energy LLC has been volatile following the issuer’s emergence from bankruptcy. Exposure to Harvey Gulf International Marine, Inc., which operates service vessels to the offshore drilling industry, detracted from performance amid volatility in the oil market. We continue to hold all of these positions.
9
Fund Leverage
IMPACT OF THE FUNDS’ LEVERAGE STRATEGIES ON PERFORMANCE
One important factor impacting the returns of the Funds’ common shares relative to their comparative benchmarks was the Funds’ use of leverage through bank borrowings, Term Preferred Shares (Term Preferred) for NSL, JFR, JRO and JSD and reverse repurchase agreements for JQC. The Funds use leverage because our research has shown that, over time, leveraging provides opportunities for additional income and total return, particularly in the recent market environment where short-term market rates are at or near historical lows, meaning that the short-term rates the Fund has been paying on its leveraging instruments in recent years have been much lower than the interest the Fund has been earning on its portfolio securities that it has bought with the proceeds of that leverage.
However, use of leverage can expose Fund common shares to additional price volatility. When a Fund uses leverage, the Fund common shares will experience a greater increase in their net asset value if the securities acquired through the use of leverage increase in value, but will also experience a correspondingly larger decline in their net asset value if the securities acquired through leverage decline in value, which will make the shares’ net asset value more volatile, and total return performance more variable, over time.
In addition, common share income in levered funds will typically decrease in comparison to unlevered funds when short-term interest rates increase and increase when short-term interest rates decrease. Over the last few quarters, short-term interest rates have indeed increased from their extended lows after the 2007-09 financial crisis. This increase has reduced common share net income, and also reduced potential for long-term total returns. Nevertheless, the ability to effectively borrow at current short-term rates is still resulting in enhanced common share income, and management believes that the advantages of continuation of leverage outweigh the associated increase in risk and volatility described above.
The Funds’ use of leverage had a positive impact on total return performance during this reporting period.
During the current fiscal period, NSL, JFR, JRO and JSD used cancellable interest rate swaps in which each Fund received payments based uponpre-determined fixed rates and paidone-month LIBOR plus a fixed spread. After anon-callable period, the swap counterparty owns the right on future monthly dates to terminate the swap at par. The purpose of the cancellable interest rate swap is to convert a fixed rate Term Preferred Share issuance to floating rate, and the cancellation dates of the swap correspond to dates on which the Funds can call the Term Preferred Share issue. Collectively, these interest rate swap contracts had a negligible impact on the Funds’ total return performance during the period.
As of July 31, 2019, the Funds’ percentages of leverage are as shown in the accompanying table.
| | | | | | | | | | | | | | | | | | | | |
| | | NSL | | | JFR | | | JRO | | | JSD | | | JQC | |
Effective Leverage* | | | 38.15 | % | | | 37.66 | % | | | 37.20 | % | | | 38.56 | % | | | 37.57 | % |
Regulatory Leverage* | | | 38.15 | % | | | 37.66 | % | | | 37.20 | % | | | 38.56 | % | | | 29.42 | % |
| * | Effective leverage is a Fund’s effective economic leverage, and includes both regulatory leverage and the leverage effects of reverse repurchase agreements, certain derivatives and other investments in a Fund’s portfolio that increase the Fund’s investment exposure. Regulatory leverage consists of preferred shares issued or borrowings of a Fund. Both of these are part of a Fund’s capital structure. A Fund, however, may from time to time borrow on a typically transient basis in connection with its day-to-day operations, primarily in connection with the need to settle portfolio trades. Such incidental borrowings are excluded from the calculation of a Fund’s effective leverage ratio. Regulatory leverage is subject to asset coverage limits set forth in the Investment Company Act of 1940. |
10
THE FUNDS’ LEVERAGE
Bank Borrowings
As noted above, the Funds employ leverage through the use of bank borrowings. The Funds’ bank borrowing activities are as shown in the accompanying table.
| | | | | | | | | | | | | | | | | | | | | | | | | | | | | | | | | | | | |
| | | Current Reporting Period | | | | | | Subsequent to the Close of
the Reporting Period | |
| Fund | | August 1, 2018 | | | Draws | | | Paydowns | | | July 31, 2019 | | | Average Balance
Outstanding | | | | | | Draws | | | Paydowns | | | September 26, 2019 | |
NSL | | $ | 114,000,000 | | | $ | — | | | $ | — | | | $ | 114,000,000 | | | $ | 114,000,000 | | | | | | | $ | — | | | $ | — | | | $ | 114,000,000 | |
JFR | | $ | 254,300,000 | | | $ | 10,200,000 | | | $ | — | | | $ | 264,500,000 | | | $ | 261,509,863 | | | | | | | $ | — | | | $ | — | | | $ | 264,500,000 | |
JRO | | $ | 178,800,000 | | | $ | — | | | $ | — | | | $ | 178,800,000 | | | $ | 178,800,000 | | | | | | | $ | — | | | $ | — | | | $ | 178,800,000 | |
JSD | | $ | 72,000,000 | | | $ | — | | | $ | — | | | $ | 72,000,000 | | | $ | 72,000,000 | | | | | | | $ | — | | | $ | — | | | $ | 72,000,000 | |
JQC | | $ | 561,000,000 | | | $ | 25,000,000 | | | $ | (106,000,000 | ) | | $ | 480,000,000 | | | $ | 495,602,740 | | | | | | | $ | — | | | $ | (20,000,000 | ) | | $ | 460,000,000 | |
Refer to Notes to Financial Statements, Note 9 – Fund Leverage, Borrowings for further details.
Reverse Repurchase Agreements
As noted previously, in addition to bank borrowings, JQC also utilized reverse repurchase agreements, in which the Fund sells to a counterparty a security that it holds with a contemporaneous agreement to repurchase the same security at an agreed-upon price and date. The Fund’s transactions in reverse repurchase agreements are as shown in the accompanying table.
| | | | | | | | | | | | | | | | | | | | | | | | | | | | | | | | | | |
| Current Reporting Period | | | | | | Subsequent to the Close of
the Reporting Period | |
| August 1, 2018 | | | Sales | | | Purchases | | | July 31, 2019 | | | Average Balance
Outstanding | | | | | | Sales | | | Purchases | | | September 26, 2019 | |
| | $145,000,000 | | | | $70,000,000 | | | | $(2,000,000) | | | | $213,000,000 | | | | $194,890,411 | | | | | | | | $ — | | | | $ — | | | | $213,000,000 | |
Refer to Notes to Financial Statements, Note 9 – Fund Leverage, Reverse Repurchase Agreements for further details.
Term Preferred Shares
As noted previously, in addition to bank borrowings, the following Funds also issued Term Preferred. The Funds' transactions in Term Preferred are as shown in the accompanying table.
| | | | | | | | | | | | | | | | | | | | | | | | | | | | | | | | | | | | |
| | | Current Reporting Period | | | | | | Subsequent to the Close of
the Reporting Period | |
| Fund | | August 1, 2018 | | | Issuance | | | Redemptions | | | July 31, 2019 | | | Average Balance
Outstanding | | | | | | Issuance | | | Redemptions | | | September 26, 2019 | |
NSL | | $ | 43,000,000 | | | $ | — | | | $ | — | | | $ | 43,000,000 | | | $ | 43,000,000 | | | | | | | $ | — | | | $ | — | | | $ | 43,000,000 | |
JFR | | $ | 125,200,000 | | | $ | — | | | $ | (10,200,000 | ) | | $ | 115,000,000 | | | $ | 118,129,863 | | | | | | | $ | — | | | $ | — | | | $ | 115,000,000 | |
JRO | | $ | 84,000,000 | | | $ | — | | | $ | — | | | $ | 84,000,000 | | | $ | 84,000,000 | | | | | | | $ | — | | | $ | — | | | $ | 84,000,000 | |
JSD | | $ | 35,000,000 | | | $ | — | | | $ | — | | | $ | 35,000,000 | | | $ | 35,000,000 | | | | | | | $ | — | | | $ | — | | | $ | 35,000,000 | |
Refer to Notes to Financial Statements, Note 4 – Fund Shares, Preferred Shares for further details on Term Preferred.
11
Common Share Information
NSL, JFR, JRO and JSD COMMON SHARE DISTRIBUTION INFORMATION
The following information regarding NSL’s, JFR’s, JRO’s and JSD’s distributions is current as of July 31, 2019. Each Fund’s distribution levels may vary over time based on each Fund’s investment activity and portfolio investment value changes.
During the current reporting period, each Fund’s distributions to common shareholders were as shown in the accompanying table.
| | | | | | | | | | | | | | | | |
| | | Per Common Share Amounts | |
| Monthly Distribution(Ex-Dividend Date) | | NSL | | | JFR | | | JRO | | | JSD | |
August 2018 | | $ | 0.0335 | | | $ | 0.0575 | | | $ | 0.0580 | | | $ | 0.1005 | |
September | | | 0.0355 | | | | 0.0600 | | | | 0.0605 | | | | 0.1035 | |
October | | | 0.0355 | | | | 0.0600 | | | | 0.0605 | | | | 0.1035 | |
November | | | 0.0355 | | | | 0.0600 | | | | 0.0605 | | | | 0.1035 | |
December | | | 0.0355 | | | | 0.0600 | | | | 0.0605 | | | | 0.1035 | |
January | | | 0.0355 | | | | 0.0600 | | | | 0.0605 | | | | 0.1035 | |
February | | | 0.0365 | | | | 0.0615 | | | | 0.0625 | | | | 0.1035 | |
March | | | 0.0375 | | | | 0.0615 | | | | 0.0625 | | | | 0.1035 | |
April | | | 0.0375 | | | | 0.0615 | | | | 0.0625 | | | | 0.1035 | |
May | | | 0.0375 | | | | 0.0615 | | | | 0.0625 | | | | 0.1035 | |
June | | | 0.0375 | | | | 0.0615 | | | | 0.0625 | | | | 0.1035 | |
July 2019 | | | 0.0375 | | | | 0.0615 | | | | 0.0625 | | | | 0.1035 | |
Total Distributions from Net Investment Income | | $ | 0.4350 | | | $ | 0.7265 | | | $ | 0.7355 | | | $ | 1.2390 | |
| | | | | | | | | | | | | | | | | |
Current Distribution Rate* | | | 7.63 | % | | | 7.56 | % | | | 7.73 | % | | | 8.09 | % |
| * | Current distribution rate is based on the Fund’s current annualized monthly distribution divided by the Fund’s current market price. The Fund’s monthly distributions to its shareholders may be comprised of ordinary income, net realized capital gains and, if at the end of the fiscal year the Fund’s cumulative net ordinary income and net realized gains are less than the amount of the Fund’s distributions, a return of capital for tax purposes. |
NSL, JFR, JRO and JSD seek to pay regular monthly dividends out of their net investment income at a rate that reflects their past and projected net income performance. To permit each Fund to maintain a more stable monthly dividend, the Fund may pay dividends at a rate that may be more or less than the amount of net income actually earned by the Fund during the period. Distributions to shareholders are determined on a tax basis, which may differ from amounts recorded in the accounting records. In instances where the monthly dividend exceeds the earned net investment income, the Fund would report a negative undistributed net ordinary income. Refer to Note 6 – Income Tax Information for additional information regarding the amounts of undistributed net ordinary income and undistributed net long-term capital gains and the character of the actual distributions paid by the Fund during the period.
All monthly dividends paid by NSL, JFR, JRO and JSD during the current reporting period were paid from net investment income. If a portion of the Fund’s monthly distributions is sourced or comprised of elements other than net investment income, including capital gains and/or a return of capital, shareholders will be notified of those sources. For financial reporting purposes, the per share amounts of each Fund’s distributions for the reporting period are presented in this report’s Financial Highlights. For income tax purposes, distribution information for each Fund as of its most recent tax year end is presented in Note 6 – Income Tax Information within the Notes to Financial Statements of this report.
12
JQC DISTRIBUTION INFORMATION
The following information regarding JQC’s distributions is current as of July 31, 2019.
Effective with JQC’s January 2019 distribution, the Fund has implemented a capital return plan where a supplemental amount is expected to be included in the Fund’s regular monthly distribution. Under this program, the Fund’s regular monthly distribution is expected to include net investment income, return of capital and potentially capital gains for tax purposes.
The figures in the table below provide the sources (for tax purposes) of the Fund’s distributions as of July 31, 2019. These sources include amounts attributable to realized gains and/or returns of capital. The Fund attributes thesenon-income sources equally to each regular distribution throughout the fiscal year. The information shown below is for the distributions paid on common shares for all months in the current fiscal year. These amounts should not be used for tax reporting purposes, and the distribution sources may differ for financial reporting than for tax reporting. The final determination of the tax characteristics of all distributions paid in 2019 will be made in early 2020 and reported to you on Form1099-DIV. More details about the tax characteristics of the Fund’s distributions are available on www.nuveen.com/CEFdistributions.
Data as of July 31, 2019
| | | | | | | | | | | | | | | | | | | | | | | | | | | | |
Current Month
Percentage of Distributions | | | | | Calendar YTD
Per Share Amounts | |
Net
Investment
Income | | | Realized
Gains | | | Return of
Capital | | | | | Total
Distributions | | | Net
Investment
Income | | | Realized
Gains | | | Return of
Capital | |
| | 65.4% | | | | 0.0% | | | | 34.6% | | | | | | $0.9113 | | | | $0.5959 | | | | $0.000 | | | | $0.3154 | |
The following table provides information regarding Fund distributions and total return performance over various time periods. This information is intended to help you better understand whether Fund returns for the specified time periods were sufficient to meet Fund distributions.
Data as of July 31, 2019
| | | | | | | | | | | | | | | | | | | | | | | | | | | | |
| | | | | | | | Annualized | | | | | Cumulative | |
Inception
Date | | Latest
Monthly
Per Share
Distribution | | | | | Current
Distribution on
NAV | | | 1-Year
Return on
NAV | | | 5-Year
Return on
NAV | | | | | Calendar YTD
Distributions on
NAV | | | Calendar
YTD Return
on NAV | |
| 6/25/2003 | | | $0.1035 | | | | | | 14.63% | | | | 3.43% | | | | 3.31% | | | | | | 7.29% | | | | 9.29% | |
CHANGE IN METHOD OF PUBLISHING NUVEENCLOSED-END FUND DISTRIBUTION AMOUNTS
Beginning on or about November 1, 2019, the NuveenClosed-End Funds will be discontinuing the practice of announcing Fund distribution amounts and timing via press release. Instead, information about the NuveenClosed-End Funds’ monthly and quarterly periodic distributions to shareholders will be posted and can be found on Nuveen’s enhancedclosed-end fund resource page, which is atwww.nuveen.com/closed-end-fund-distributions, along with other Nuveenclosed-end fund product updates. Shareholders can expect regular distribution information to be posted on www.nuveen.com on the first business day of each month. To ensure that our shareholders have timely access to the latest information, a subscribe function can be activated at this link here, or at this web page(www.nuveen.com/en-us/people/about-nuveen/for-the-media).
13
Common Share Information(continued)
COMMON SHARE EQUITY SHELF PROGRAMS
During the current reporting period, the following Funds were authorized by the Securities and Exchange Commission to issue additional common shares through an equity shelf program (“Shelf Offering”). Under these programs, the Funds, subject to market conditions, may raise additional capital from time to time in varying amounts and offering methods at a net price at or above each Fund’s NAV per common share. The total amount of common shares authorized under these Shelf Offerings are as shown in the accompanying table.
| | | | | | | | |
| | | JFR | | | JRO | |
Additional authorized common shares | | | 12,900,000 | * | | | 8,500,000 | * |
| * | Represents additional authorized common shares for the period August 1, 2018 through November 30, 2018. |
Refer to Notes to Financial Statements, Note 4 – Fund Shares, Common Shares Equity Shelf Programs and Offering Costs for further details of Shelf Offerings and each Fund’s respective transactions.
COMMON SHARE REPURCHASES
During August 2019 (subsequent to the close of this reporting period), the Funds’ Board of Trustees reauthorized an open-market share repurchase program, allowing each Fund to repurchase an aggregate of up to approximately 10% of its outstanding shares.
As of July 31, 2019, and since the inception of the Funds’ repurchase programs, the Funds have cumulatively repurchased and retired their outstanding common shares as shown in the accompanying table.
| | | | | | | | | | | | | | | | | | | | |
| | | NSL | | | JFR | | | JRO | | | JSD | | | JQC | |
Common shares cumulatively repurchased and retired | | | 15,400 | | | | 147,593 | | | | 39,400 | | | | — | | | | 5,473,400 | |
Common shares authorized for repurchase | | | 3,860,000 | | | | 5,690,000 | | | | 4,055,000 | | | | 1,010,000 | | | | 13,575,000 | |
During the current reporting period, the following Funds repurchased and retired their common shares at a weighted average price per share and a weighted average discount per share as shown in the following table.
| | | | | | | | | | | | |
| | | NSL | | | JRO | | | JQC | |
Common shares repurchased and retired | | | 10,400 | | | | 20,000 | | | | 157,700 | |
Weighted average price per common share repurchased and retired | | | $5.41 | | | | $8.82 | | | | $7.43 | |
Weighted average discount per common share repurchased and retired | | | 15.29 | % | | | 16.68 | % | | | 16.16 | % |
OTHER COMMON SHARE INFORMATION
As of July 31, 2019, and during the current reporting period, the Funds’ common share prices were trading at a premium/(discount) to their common share NAVs as shown in the accompanying table.
| | | | | | | | | | | | | | | | | | | | |
| | | NSL | | | JFR | | | JRO | | | JSD | | | JQC | |
Common share NAV | | | $6.59 | | | | $11.04 | | | | $10.94 | | | | $16.89 | | | | $8.49 | |
Common share price | | | $5.90 | | | | $9.76 | | | | $9.70 | | | | $15.36 | | | | $7.68 | |
Premium/(Discount) to NAV | | | (10.47 | )% | | | (11.59 | )% | | | (11.33 | )% | | | (9.06 | )% | | | (9.54 | )% |
12-month average premium/(discount) to NAV | | | (11.41 | )% | | | (11.19 | )% | | | (10.96 | )% | | | (8.12 | )% | | | (11.21 | )% |
14
Risk Considerations
Fund shares are not guaranteed or endorsed by any bank or other insured depository institution, and are not federally insured by the Federal Deposit Insurance Corporation.
Nuveen Senior Income Fund (NSL)
Investing in closed-end funds involves risk; principal loss is possible. There is no guarantee the Fund’s investment objectives will be achieved. Closed-end fund shares may frequently trade at a discount or premium to their net asset value.Adjustable Rate Senior Loans may not be fully secured by collateral, generally do not trade on exchanges, and are typically issued by unrated or below-investment grade companies, and therefore are subject to greater liquidity and credit risk.Lower credit debt securities may be more likely to fail to make timely interest or principal payments.Leverage increases return volatility and magnifies the Fund’s potential return and its risks; there is no guarantee a fund’s leverage strategy will be successful. These and other risk considerations such asinterest rate risk are described in more detail on the Fund’s web page atwww.nuveen.com/NSL.
Nuveen Floating Rate Income Fund (JFR)
Investing in closed-end funds involves risk; principal loss is possible. There is no guarantee the Fund’s investment objectives will be achieved. Closed-end fund shares may frequently trade at a discount or premium to their net asset value.Adjustable Rate Senior Loans may not be fully secured by collateral, generally do not trade on exchanges, and are typically issued by unrated or below-investment grade companies, and therefore are subject to greater liquidity and credit risk.Lower credit debt securities may be more likely to fail to make timely interest or principal payments.Leverage increases return volatility and magnifies the Fund’s potential return and its risks; there is no guarantee a fund’s leverage strategy will be successful. These and other risk considerations such asinterest rate risk are described in more detail on the Fund’s web page atwww.nuveen.com/JFR.
Nuveen Floating Rate Income Opportunity Fund (JRO)
Investing in closed-end funds involves risk; principal loss is possible. There is no guarantee the Fund’s investment objectives will be achieved. Closed-end fund shares may frequently trade at a discount or premium to their net asset value.Adjustable Rate Senior Loans may not be fully secured by collateral, generally do not trade on exchanges, and are typically issued by unrated or below-investment grade companies, and therefore are subject to greater liquidity and credit risk.Lower credit debt securities may be more likely to fail to make timely interest or principal payments.Leverage increases return volatility and magnifies the Fund’s potential return and its risks; there is no guarantee a fund’s leverage strategy will be successful. These and other risk considerations such asinterest rate risk are described in more detail on the Fund’s web page atwww.nuveen.com/JRO.
Nuveen Short Duration Credit Opportunities Fund (JSD)
Investing in closed-end funds involves risk; principal loss is possible. There is no guarantee the Fund’s investment objectives will be achieved. Closed-end fund shares may frequently trade at a discount or premium to their net asset value.Adjustable Rate Senior Loans may not be fully secured by collateral, generally do not trade on exchanges, and are typically issued by unrated or below-investment grade companies, and therefore are subject to greater liquidity and credit risk.Lower credit debt securities may be more likely to fail to make timely interest or principal payments.Leverage increases return volatility and magnifies the Fund’s potential return and its risks; there is no guarantee a fund’s leverage strategy will be successful. These and other risk considerations such asinterest rate risk are described in more detail on the Fund’s web page atwww.nuveen.com/JSD.
Nuveen Credit Strategies Income Fund (JQC)
Investing in closed-end funds involves risk; principal loss is possible. There is no guarantee the Fund’s investment objectives will be achieved. Closed-end fund shares may frequently trade at a discount or premium to their net asset
15
Risk Considerations(continued)
value.Adjustable Rate Senior Loans may not be fully secured by collateral, generally do not trade on exchanges, and are typically issued by unrated or below-investment grade companies, and therefore are subject to greater liquidity and credit risk.Lower credit debt securities may be more likely to fail to make timely interest or principal payments.Common stock prices have often experienced significant volatility.Leverage increases return volatility and magnifies the Fund’s potential return and its risks; there is no guarantee a fund’s leverage strategy will be successful. These and other risk considerations such asinterest rate risk are described in more detail on the Fund’s web page atwww.nuveen.com/JQC.
16
THIS PAGE INTENTIONALLY LEFT BLANK
17
| | |
| NSL | | Nuveen Senior Income Fund Performance Overview and Holding Summaries as of July 31, 2019 |
Refer to Glossary of Terms Used in this Report for further definition of the terms used within this section.
Average Annual Total Returns as of July 31, 2019
| | | | | | | | | | | | |
| | | Average Annual | |
| | | 1-Year | | | 5-Year | | | 10-Year | |
| NSL at Common Share NAV | | | 1.81% | | | | 3.84% | | | | 8.50% | |
| NSL at Common Share Price | | | 3.60% | | | | 3.63% | | | | 8.74% | |
| Credit Suisse Leveraged Loan Index | | | 4.10% | | | | 4.02% | | | | 5.94% | |
Past performance is not predictive of future results. Current performance may be higher or lower than the data shown. Returns do not reflect the deduction of taxes that shareholders may have to pay on Fund distributions or upon the sale of Fund shares. Returns at NAV are net of Fund expenses, and assume reinvestment of distributions. Comparative index return information is provided for the Fund’s shares at NAV only. Indexes are not available for direct investment.
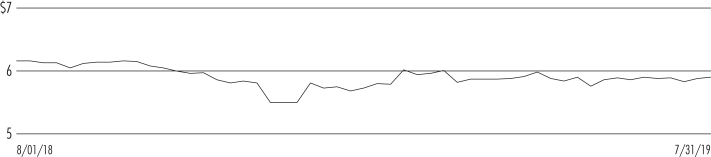
Common Share Price Performance —Weekly Closing Price
18
This data relates to the securities held in the Fund’s portfolio of investments as of the end of the reporting period. It should not be construed as a measure of performance for the Fund itself. Holdings are subject to change.
For financial reporting purposes, the ratings disclosed are the highest rating given by one of the following national rating agencies: Standard & Poor’s Group, Moody’s Investors Service, Inc. or Fitch, Inc. This treatment of split-rated securities may differ from that used for other purposes, such as for Fund investment policies. Credit ratings are subject to change. AAA, AA, A and BBB are investment grade ratings; BB, B, CCC, CC, C and D are below-investment grade ratings. Holdings designated N/R are not rated by these national rating agencies.
Fund Allocation
(% of net assets)
| | | | |
| Variable Rate Senior Loan Interests | | | 147.2% | |
| Corporate Bonds | | | 8.9% | |
| Common Stocks | | | 3.0% | |
| Common Stock Rights | | | 0.1% | |
| Convertible Bonds | | | 0.0% | |
| Warrants | | | 0.1% | |
| Short-Term Investment Companies | | | 5.3% | |
| Other Assets Less Liabilities | | | (3.1)% | |
| Net Assets Plus Borrowings and Term Preferred Shares, net of deferred offering costs | | | 161.5% | |
| Borrowings | | | (44.8)% | |
| Term Preferred Shares, net of deferred offering costs | | | (16.7)% | |
| Net Assets | | | 100% | |
Top Five Issuers
(% of total long-term
investments)
| | | | |
| Albertson’s LLC | | | 2.7% | |
| Intelsat Jackson Holdings, S.A. | | | 2.7% | |
| Sprint Corporation | | | 2.0% | |
| Dell International LLC | | | 1.9% | |
| Micro Focus International PLC | | | 1.8% | |
Portfolio Composition
(% of total investments)
| | | | |
| Media | | | 10.9% | |
| Software | | | 10.1% | |
| Hotels, Restaurants & Leisure | | | 9.8% | |
| Health Care Providers & Services | | | 5.7% | |
| Diversified Telecommunication Services | | | 5.3% | |
| Communications Equipment | | | 4.5% | |
| Food & Staples Retailing | | | 4.0% | |
| Technology Hardware, Storage & Peripherals | | | 3.1% | |
| IT Services | | | 2.6% | |
| Commercial Services & Supplies | | | 2.5% | |
| Wireless Telecommunication Services | | | 2.3% | |
| Pharmaceuticals | | | 2.1% | |
| Oil, Gas & Consumable Fuels | | | 2.0% | |
| Aerospace & Defense | | | 1.9% | |
| Diversified Consumer Services | | | 1.8% | |
| Road & Rail | | | 1.8% | |
| Professional Services | | | 1.6% | |
| Specialty Retail | | | 1.6% | |
| Airlines | | | 1.4% | |
| Health Care Equipment & Supplies | | | 1.4% | |
| Insurance | | | 1.3% | |
| Other | | | 19.1% | |
| Short-Term Investment Companies | | | 3.2% | |
Total | | | 100% | |
Portfolio Credit Quality
(% of total long-term fixed income investments)
| | | | |
| BBB | | | 12.2% | |
| BB or Lower | | | 87.7% | |
| N/R (not rated) | | | 0.1% | |
Total | | | 100% | |
19
| | |
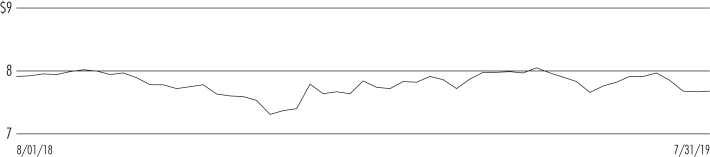
| JFR | | Nuveen Floating Rate Income Fund Performance Overview and Holding Summaries as of July 31, 2019 |
Refer to Glossary of Terms Used in this Report for further definition of the terms used within this section.
Average Annual Total Returns as of July 31, 2019
| | | | | | | | | | | | |
| | | Average Annual | |
| | | 1-Year | | | 5-Year | | | 10-Year | |
| JFR at Common Share NAV | | | 2.03% | | | | 3.91% | | | | 8.08% | |
| JFR at Common Share Price | | | 1.98% | | | | 3.35% | | | | 8.78% | |
| Credit Suisse Leveraged Loan Index | | | 4.10% | | | | 4.02% | | | | 5.94% | |
Past performance is not predictive of future results. Current performance may be higher or lower than the data shown. Returns do not reflect the deduction of taxes that shareholders may have to pay on Fund distributions or upon the sale of Fund shares. Returns at NAV are net of Fund expenses, and assume reinvestment of distributions. Comparative index return information is provided for the Fund’s shares at NAV only. Indexes are not available for direct investment.
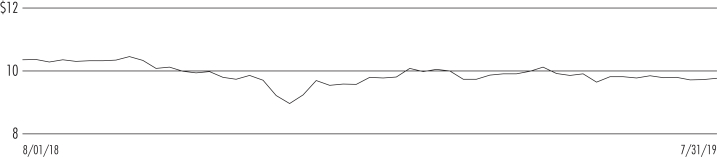
Common Share Price Performance —Weekly Closing Price
20
This data relates to the securities held in the Fund’s portfolio of investments as of the end of the reporting period. It should not be construed as a measure of performance for the Fund itself. Holdings are subject to change.
For financial reporting purposes, the ratings disclosed are the highest rating given by one of the following national rating agencies: Standard & Poor’s Group, Moody’s Investors Service, Inc. or Fitch, Inc. This treatment of split-rated securities may differ from that used for other purposes, such as for Fund investment policies. Credit ratings are subject to change. AAA, AA, A and BBB are investment grade ratings; BB, B, CCC, CC, C and D are below-investment grade ratings. Holdings designated N/R are not rated by these national rating agencies.
Fund Allocation
(% of net assets)
| | | | |
| Variable Rate Senior Loan Interests | | | 141.5% | |
| Corporate Bonds | | | 9.7% | |
| Common Stocks | | | 2.7% | |
| Long-Term Investment Companies | | | 1.7% | |
| Asset-Backed Securities | | | 1.0% | |
| Common Stock Rights | | | 0.1% | |
| Convertible Bonds | | | 0.0% | |
| Warrants | | | 0.1% | |
| Short-Term Investment Companies | | | 7.0% | |
| Other Assets Less Liabilities | | | (3.5)% | |
| Net Assets Plus Borrowings and Term Preferred Shares, net of deferred offering costs | | | 160.3% | |
| Borrowings | | | (42.1)% | |
| Term Preferred Shares, net of deferred offering costs | | | (18.2)% | |
Net Assets | | | 100% | |
Top Five Issuers
(% of total long-term investments)
| | | | |
| Albertson’s LLC | | | 2.7% | |
| Burger King Corporation | | | 2.3% | |
| Intelsat Jackson Holdings, S.A. | | | 2.2% | |
| Dell International LLC | | | 2.0% | |
| Sprint Corporation | | | 1.8% | |
Portfolio Composition
(% of total investments)
| | | | |
| Hotels, Restaurants & Leisure | | | 10.9% | |
| Media | | | 10.8% | |
| Software | | | 9.1% | |
| Health Care Providers & Services | | | 5.8% | |
| Diversified Telecommunication Services | | | 5.2% | |
| Communications Equipment | | | 4.8% | |
| Food & Staples Retailing | | | 4.0% | |
| Technology Hardware, Storage & Peripherals | | | 2.8% | |
| IT Services | | | 2.6% | |
| Commercial Services & Supplies | | | 2.3% | |
| Wireless Telecommunication Services | | | 2.3% | |
| Pharmaceuticals | | | 2.0% | |
| Oil, Gas & Consumable Fuels | | | 1.6% | |
| Road & Rail | | | 1.6% | |
| Aerospace & Defense | | | 1.5% | |
| Specialty Retail | | | 1.5% | |
| Capital Markets | | | 1.4% | |
| Insurance | | | 1.4% | |
| Diversified Consumer Services | | | 1.4% | |
| Professional Services | | | 1.4% | |
| Other | | | 19.6% | |
| Long-Term Investment Companies | | | 1.1% | |
| Asset-Backed Securities | | | 0.6% | |
| Short-Term Investment Companies | | | 4.3% | |
Total | | | 100% | |
Portfolio Credit Quality
(% of total long-term fixed income investments)
| | | | |
| BBB | | | 12.9% | |
| BB or Lower | | | 87.0% | |
| N/R (not rated) | | | 0.1% | |
Total | | | 100% | |
21
| | |
| JRO | | Nuveen Floating Rate Income Opportunity Fund Performance Overview and Holding Summaries as of July 31, 2019 |
Refer to Glossary of Terms Used in this Report for further definition of the terms used within this section.
Average Annual Total Returns as of July 31, 2019
| | | | | | | | | | | | |
| | | Average Annual | |
| | | 1-Year | | | 5-Year | | | 10-Year | |
| JRO at Common Share NAV | | | 1.94% | | | | 3.85% | | | | 8.74% | |
| JRO at Common Share Price | | | 2.19% | | | | 2.33% | | | | 9.19% | |
| Credit Suisse Leveraged Loan Index | | | 4.10% | | | | 4.02% | | | | 5.94% | |
Past performance is not predictive of future results. Current performance may be higher or lower than the data shown. Returns do not reflect the deduction of taxes that shareholders may have to pay on Fund distributions or upon the sale of Fund shares. Returns at NAV are net of Fund expenses, and assume reinvestment of distributions. Comparative index return information is provided for the Fund’s shares at NAV only. Indexes are not available for direct investment.
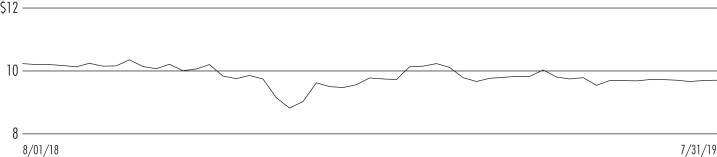
Common Share Price Performance —Weekly Closing Price
22
This data relates to the securities held in the Fund’s portfolio of investments as of the end of the reporting period. It should not be construed as a measure of performance for the Fund itself. Holdings are subject to change.
For financial reporting purposes, the ratings disclosed are the highest rating given by one of the following national rating agencies: Standard & Poor’s Group, Moody’s Investors Service, Inc. or Fitch, Inc. This treatment of split-rated securities may differ from that used for other purposes, such as for Fund investment policies. Credit ratings are subject to change. AAA, AA, A and BBB are investment grade ratings; BB, B, CCC, CC, C and D are below-investment grade ratings. Holdings designated N/R are not rated by these national rating agencies.
Fund Allocation
(% of net assets)
| | | | |
| Variable Rate Senior Loan Interests | | | 142.0% | |
| Corporate Bonds | | | 9.4% | |
| Common Stocks | | | 3.0% | |
| Asset-Backed Securities | | | 0.6% | |
| Common Stock Rights | | | 0.1% | |
| Convertible Bonds | | | 0.0% | |
| Warrants | | | 0.1% | |
| Short-Term Investment Companies | | | 8.2% | |
| Other Assets Less Liabilities | | | (4.4)% | |
| Net Assets Plus Borrowings and Term Preferred Shares, net of deferred offering costs | | | 159.0% | |
| Borrowings | | | (40.3)% | |
| Term Preferred Shares, net of deferred offering costs | | | (18.7)% | |
| Net Assets | | | 100% | |
Top Five Issuers
(% of total long-term investments)
| | | | |
| Burger King Corporation | | | 2.5% | |
| Intelsat Jackson Holdings, S.A. | | | 2.4% | |
| Albertson’s LLC | | | 2.3% | |
| Dell International LLC | | | 2.0% | |
| Scientific Games Corp. | | | 1.6% | |
Portfolio Composition
(% of total investments)
| | | | |
| Media | | | 11.3% | |
| Hotels, Restaurants & Leisure | | | 11.2% | |
| Software | | | 9.6% | |
| Health Care Providers & Services | | | 5.9% | |
| Diversified Telecommunication Services | | | 5.1% | |
| Communications Equipment | | | 4.7% | |
| Food & Staples Retailing | | | 3.6% | |
| IT Services | | | 2.9% | |
| Technology Hardware, Storage & Peripherals | | | 2.8% | |
| Commercial Services & Supplies | | | 2.5% | |
| Wireless Telecommunication Services | | | 2.0% | |
| Pharmaceuticals | | | 2.0% | |
| Oil, Gas & Consumable Fuels | | | 1.8% | |
| Road & Rail | | | 1.7% | |
| Aerospace & Defense | | | 1.7% | |
| Diversified Consumer Services | | | 1.6% | |
| Capital Markets | | | 1.5% | |
| Building Products | | | 1.5% | |
| Specialty Retail | | | 1.4% | |
| Other | | | 19.8% | |
| Asset-Backed Securities | | | 0.4% | |
| Short-Term Investment Companies | | | 5.0% | |
Total | | | 100% | |
Portfolio Credit Quality
(% of total long-term fixed income investments)
| | | | |
| BBB | | | 12.5% | |
| BB or Lower | | | 87.4% | |
| N/R (not rated) | | | 0.1% | |
Total | | | 100% | |
23
| | |
| JSD | | Nuveen Short Duration Credit Opportunities Fund Performance Overview and Holding Summaries as of July 31, 2019 |
Refer to the Glossary of Terms Used in this Report for further definition of the terms used within this section.
Average Annual Total Returns as of July 31, 2019
| | | | | | | | | | | | |
| | | Average Annual | |
| | | 1-Year | | | 5-Year | | | Since
Inception | |
| JSD at Common Share NAV | | | 1.30% | | | | 4.15% | | | | 5.95% | |
| JSD at Common Share Price | | | (0.30)% | | | | 4.18% | | | | 4.59% | |
| Credit Suisse Leveraged Loan Index | | | 4.10% | | | | 4.02% | | | | 4.50% | |
Since inception returns are from May 25, 2011. Past performance is not predictive of future results. Current performance may be higher or lower than the data shown. Returns do not reflect the deduction of taxes that shareholders may have to pay on Fund distributions or upon the sale of Fund shares. Returns at NAV are net of Fund expenses, and assume reinvestment of distributions. Comparative index return information is provided for the Fund’s shares at NAV only. Indexes are not available for direct investment.
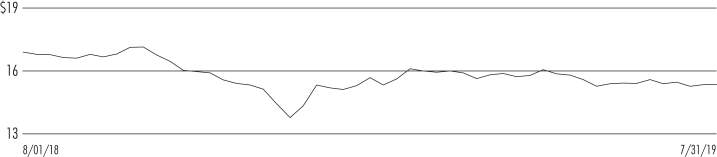
Common Share Price Performance —Weekly Closing Price
24
This data relates to the securities held in the Fund’s portfolio of investments as of the end of the reporting period. It should not be construed as a measure of performance for the Fund itself. Holdings are subject to change.
For financial reporting purposes, the ratings disclosed are the highest rating given by one of the following national rating agencies: Standard & Poor’s Group, Moody’s Investors Service, Inc. or Fitch, Inc. This treatment of split-rated securities may differ from that used for other purposes, such as for Fund investment policies. Credit ratings are subject to change. AAA, AA, A and BBB are investment grade ratings; BB, B, CCC, CC, C and D are below-investment grade ratings. Holdings designated N/R are not rated by these national rating agencies.
Fund Allocation
(% of net assets)
| | | | |
| Variable Rate Senior Loan Interests | | | 146.8% | |
| Corporate Bonds | | | 9.3% | |
| Common Stocks | | | 2.9% | |
| Common Stock Rights | | | 0.2% | |
| Convertible Bonds | | | 0.0% | |
| Warrants | | | 0.1% | |
| Short-Term Investment Companies | | | 9.1% | |
| Other Assets Less Liabilities | | | (5.8)% | |
| Net Assets Plus Borrowings and Term Preferred Shares, net of deferred offering costs | | | 162.6% | |
| Borrowings | | | (42.2)% | |
| Term Preferred Shares, net of deferred offering costs | | | (20.4)% | |
Net Assets | | | 100% | |
Top Five Issuers
(% of total long-term investments)
| | | | |
| Albertson’s LLC | | | 3.1% | |
| Intelsat Jackson Holdings, S.A. | | | 2.8% | |
| Scientific Games Corp. | | | 2.0% | |
| CenturyLink, Inc. | | | 1.8% | |
| Sprint Corporation | | | 1.7% | |
Portfolio Composition
(% of total investments)
| | | | |
| Media | | | 10.5% | |
| Software | | | 10.3% | |
| Hotels, Restaurants & Leisure | | | 9.1% | |
| Health Care Providers & Services | | | 6.8% | |
| Diversified Telecommunication Services | | | 4.9% | |
| Food & Staples Retailing | | | 3.8% | |
| Communications Equipment | | | 3.6% | |
| IT Services | | | 3.1% | |
| Oil, Gas & Consumable Fuels | | | 2.8% | |
| Technology Hardware, Storage & Peripherals | | | 2.7% | |
| Commercial Services & Supplies | | | 2.5% | |
| Aerospace & Defense | | | 1.9% | |
| Pharmaceuticals | | | 1.8% | |
| Wireless Telecommunication Services | | | 1.8% | |
| Health Care Equipment & Supplies | | | 1.7% | |
| Specialty Retail | | | 1.6% | |
| Road & Rail | | | 1.5% | |
| Professional Services | | | 1.5% | |
| Capital Markets | | | 1.5% | |
| Airlines | | | 1.4% | |
| Other | | | 19.8% | |
| Short-Term Investment Companies | | | 5.4% | |
Total | | | 100% | |
Portfolio Credit Quality
(% of total long-term fixed income investments)
| | | | |
| BBB | | | 9.8% | |
| BB or Lower | | | 90.1% | |
| N/R (not rated) | | | 0.1% | |
Total | | | 100% | |
25
| | |
| JQC | | Nuveen Credit Strategies Income Fund Performance Overview and Holding Summaries as of July 31, 2019 |
Refer to Glossary of Terms Used in this Report for further definition of the terms used within this section.
Average Annual Total Returns as of July 31, 2019
| | | | | | | | | | | | |
| | | Average Annual | |
| | | 1-Year | | | 5-Year | | | 10-Year | |
| JQC at Common Share NAV | | | 3.43% | | | | 3.31% | | | | 8.50% | |
| JQC at Common Share Price | | | 9.33% | | | | 4.67% | | | | 10.60% | |
| Credit Suisse Leveraged Loan Index | | | 4.10% | | | | 4.02% | | | | 5.94% | |
Past performance is not predictive of future results. Current performance may be higher or lower than the data shown. Returns do not reflect the deduction of taxes that shareholders may have to pay on Fund distributions or upon the sale of Fund shares. Returns at NAV are net of Fund expenses, and assume reinvestment of distributions. Comparative index return information is provided for the Fund’s shares at NAV only. Indexes are not available for direct investment.
Common Share Price Performance —Weekly Closing Price
26
This data relates to the securities held in the Fund’s portfolio of investments as of the end of the reporting period. It should not be construed as a measure of performance for the Fund itself. Holdings are subject to change.
For financial reporting purposes, the ratings disclosed are the highest rating given by one of the following national rating agencies: Standard & Poor’s Group, Moody’s Investors Service, Inc. or Fitch, Inc. This treatment of split-rated securities may differ from that used for other purposes, such as for Fund investment policies. Credit ratings are subject to change. AAA, AA, A and BBB are investment grade ratings; BB, B, CCC, CC, C and D are below-investment grade ratings. Holdings designated N/R are not rated by these national rating agencies.
Fund Allocation
(% of net assets)
| | | | |
| Variable Rate Senior Loan Interests | | | 121.0% | |
| Corporate Bonds | | | 31.8% | |
| Convertible Bonds | | | 2.1% | |
| Common Stocks | | | 1.1% | |
| Common Stock Rights | | | 0.2% | |
| Warrants | | | 0.0% | |
| Short-Term Investment Companies | | | 9.1% | |
| Other Assets Less Liabilities | | | (5.1)% | |
| Net Assets Plus Borrowings and Reverse Repurchase Agreements | | | 160.2% | |
| Borrowings | | | (41.7)% | |
| Reverse Repurchase Agreements | | | (18.5)% | |
Net Assets | | | 100% | |
Top Five Issuers
(% of total long-term
investments)
| | | | |
| Acelity | | | 1.8% | |
| American Airlines, Inc. | | | 1.7% | |
| Dell International LLC | | | 1.6% | |
| Tribune Media Company | | | 1.4% | |
| Vistra Operation Co. | | | 1.4% | |
Portfolio Composition
(% of total investments)
| | | | |
| Hotels, Restaurants & Leisure | | | 10.3% | |
| Health Care Providers & Services | | | 10.2% | |
| Media | | | 9.5% | |
| Software | | | 8.9% | |
| Diversified Telecommunication Services | | | 3.7% | |
| Health Care Equipment & Supplies | | | 3.1% | |
| Commercial Services & Supplies | | | 2.6% | |
| Wireless Telecommunication Services | | | 2.6% | |
| IT Services | | | 2.5% | |
| Airlines | | | 2.4% | |
| Chemicals | | | 2.0% | |
| Technology Hardware, Storage & Peripherals | | | 2.0% | |
| Food Products | | | 1.8% | |
| Internet Software & Services | | | 1.8% | |
| Personal Products | | | 1.7% | |
| Pharmaceuticals | | | 1.7% | |
| Capital Markets | | | 1.7% | |
| Household Products | | | 1.5% | |
| Professional Services | | | 1.5% | |
| Consumer Finance | | | 1.4% | |
| Real Estate Management & Development | | | 1.3% | |
| Food & Staples Retailing | | | 1.3% | |
| Other | | | 19.0% | |
| Short-Term Investment Companies | | | 5.5% | |
Total | | | 100% | |
Portfolio Credit Quality
(% of total long-term fixed income investments)
| | | | |
| BBB | | | 14.7% | |
| BB or Lower | | | 84.1% | |
| N/R (not rated) | | | 1.2% | |
Total | | | 100% | |
27
Shareholder Meeting Report
The annual meeting of shareholders was held in the offices of Nuveen on April 10, 2019 for NSL, JFR, JRO, JSD and JQC; at this meeting the shareholders were asked to elect Board Members.
| | | | | | | | | | | | | | | | | | | | | | | | | | | | | | | | | | | | |
| | | NSL | | | JFR | | | JRO | | | JSD | | | JQC | |
| | | Common and
Preferred
shares voting
together
as a class | | | Preferred
Shares | | | Common and
Preferred
shares voting
together
as a class | | | Preferred
Shares | | | Common and
Preferred
shares voting
together
as a class | | | Preferred
Shares | | | Common and
Preferred
shares voting
together
as a class | | | Preferred
Shares | | | Common
Shares | |
Approval of the Board Members was reached as follows: | | | | | | | | | | | | | | | | | | | | | | | | | | | | | | | | | | | | |
Judith M. Stockdale | | | | | | | | | | | | | | | | | | | | | | | | | | | | | | | | | | | | |
For | | | 33,979,005 | | | | — | | | | 49,918,832 | | | | — | | | | 34,611,891 | | | | — | | | | 8,917,809 | | | | — | | | | 97,306,914 | |
Withhold | | | 1,418,487 | | | | — | | | | 1,578,969 | | | | — | | | | 2,299,754 | | | | — | | | | 275,138 | | | | — | | | | 24,629,925 | |
Total | | | 35,397,492 | | | | — | | | | 51,497,801 | | | | — | | | | 36,911,645 | | | | — | | | | 9,192,947 | | | | — | | | | 121,936,839 | |
Carole E. Stone | | | | | | | | | | | | | | | | | | | | | | | | | | | | | | | | | | | | |
For | | | 34,086,171 | | | | — | | | | 49,917,933 | | | | — | | | | 34,692,366 | | | | — | | | | 8,931,905 | | | | — | | | | 92,643,282 | |
Withhold | | | 1,311,321 | | | | — | | | | 1,579,868 | | | | — | | | | 2,219,279 | | | | — | | | | 261,042 | | | | — | | | | 29,293,557 | |
Total | | | 35,397,492 | | | | — | | | | 51,497,801 | | | | — | | | | 36,911,645 | | | | — | | | | 9,192,947 | | | | — | | | | 121,936,839 | |
Margaret L. Wolff | | | | | | | | | | | | | | | | | | | | | | | | | | | | | | | | | | | | |
For | | | 34,017,513 | | | | — | | | | 49,989,122 | | | | — | | | | 34,646,845 | | | | — | | | | 8,922,407 | | | | — | | | | 97,378,067 | |
Withhold | | | 1,379,979 | | | | — | | | | 1,508,679 | | | | — | | | | 2,264,800 | | | | — | | | | 270,540 | | | | — | | | | 24,558,772 | |
Total | | | 35,397,492 | | | | — | | | | 51,497,801 | | | | — | | | | 36,911,645 | | | | — | | | | 9,192,947 | | | | — | | | | 121,936,839 | |
William C. Hunter | | | | | | | | | | | | | | | | | | | | | | | | | | | | | | | | | | | | |
For | | | — | | | | 26,728 | | | | — | | | | 55,000 | | | | — | | | | 65,719 | | | | — | | | | 4,619 | | | | 92,613,820 | |
Withhold | | | — | | | | 50 | | | | — | | | | — | | | | — | | | | 1,254 | | | | — | | | | 18,482 | | | | 29,323,019 | |
Total | | | — | | | | 26,778 | | | | — | | | | 55,000 | | | | — | | | | 66,973 | | | | — | | | | 23,101 | | | | 121,936,839 | |
Albin F. Moschner | | | | | | | | | | | | | | | | | | | | | | | | | | | | | | | | | | | | |
For | | | — | | | | 26,728 | | | | — | | | | 55,000 | | | | — | | | | 65,719 | | | | — | | | | 4,619 | | | | — | |
Withhold | | | — | | | | 50 | | | | — | | | | — | | | | — | | | | 1,254 | | | | — | | | | 18,482 | | | | — | |
Total | | | — | | | | 26,778 | | | | — | | | | 55,000 | | | | — | | | | 66,973 | | | | — | | | | 23,101 | | | | — | |
28
Report of Independent Registered Public Accounting Firm
To the Shareholders and Board of Trustees of
Nuveen Senior Income Fund
Nuveen Floating Rate Income Fund
Nuveen Floating Rate Income Opportunity Fund
Nuveen Short Duration Credit Opportunities Fund
Nuveen Credit Strategies Income Fund:
Opinion on the Financial Statements
We have audited the accompanying statements of assets and liabilities of Nuveen Senior Income Fund, Nuveen Floating Rate Income Fund, Nuveen Floating Rate Income Opportunity Fund, Nuveen Short Duration Credit Opportunities Fund and Nuveen Credit Strategies Income Fund (the “Funds”), including the portfolios of investments, as of July 31, 2019, the related statements of operations and cash flows for the year then ended, the statements of changes in net assets for each of the years in thetwo-year period then ended, and the related notes (collectively, the “financial statements”) and the financial highlights for each of the years in thefive-year period then ended. In our opinion, the financial statements and financial highlights present fairly, in all material respects, the financial position of the Funds as of July 31, 2019, the results of their operations and their cash flows for the year then ended, the changes in their net assets for each of the years in thetwo-year period then ended, and the financial highlights for each of the years in thefive-year period then ended, in conformity with U.S. generally accepted accounting principles.
Basis for Opinion
These financial statements and financial highlights are the responsibility of the Funds’ management. Our responsibility is to express an opinion on these financial statements and financial highlights based on our audits. We are a public accounting firm registered with the Public Company Accounting Oversight Board (United States) (PCAOB) and are required to be independent with respect to the Funds in accordance with the U.S. federal securities laws and the applicable rules and regulations of the Securities and Exchange Commission and the PCAOB.
We conducted our audits in accordance with the standards of the PCAOB. Those standards require that we plan and perform the audit to obtain reasonable assurance about whether the financial statements and financial highlights are free of material misstatement, whether due to error or fraud. Our audits included performing procedures to assess the risks of material misstatement of the financial statements and financial highlights, whether due to error or fraud, and performing procedures that respond to those risks. Such procedures included examining, on a test basis, evidence regarding the amounts and disclosures in the financial statements and financial highlights. Such procedures also included confirmation of securities owned as of July 31, 2019, by correspondence with custodians and brokers or other appropriate auditing procedures. Our audits also included evaluating the accounting principles used and significant estimates made by management, as well as evaluating the overall presentation of the financial statements and financial highlights. We believe that our audits provide a reasonable basis for our opinion.
/s/ KPMG LLP
We have served as the auditor of one or more Nuveen investment companies since 2014.
Chicago, Illinois
September 26, 2019
29
| | |
| NSL | | Nuveen Senior Income Fund Portfolio of Investments July 31, 2019 |
| | | | | | | | | | | | | | | | | | | | | | | | | | | | |
Principal
Amount (000) | | | Description (1) | | Coupon (2) | | | Reference
Rate (2) | | | Spread (2) | | | Maturity (3) | | | Ratings (4) | | | Value | |
| | | | |
| | | | LONG-TERM INVESTMENTS – 159.3% (96.8% of Total Investments) | | | | | | | | | | | | | |
| | | | |
| | | | VARIABLE RATE SENIOR LOAN INTERESTS – 147.2% (89.5% of Total Investments) (2) | | | | | | | | | | | | | |
| | | | |
| | | | Aerospace & Defense – 3.1% (1.9% of Total Investments) | | | | | | | | | | |
| | | | | | | |
| $ | 800 | | | MacDonald, Dettwiler and Associates, Ltd., Term Loan B | | | 4.990% | | | | 1-Month LIBOR | | | | 2.750% | | | | 10/04/24 | | | | BB | | | $ | 727,164 | |
| | 188 | | | Rexnord LLC/ RBS Global, Inc., Term Loan, First Lien | | | 4.234% | | | | 1-Month LIBOR | | | | 2.000% | | | | 8/21/24 | | | | BBB– | | | | 189,581 | |
| | 3,201 | | | Sequa Corporation, Term Loan B | | | 7.560% | | | | 3-Month LIBOR | | | | 5.000% | | | | 11/28/21 | | | | B– | | | | 3,166,684 | |
| | 1,152 | | | Sequa Corporation, Term Loan, Second Lien | | | 11.266% | | | | 3-Month LIBOR | | | | 9.000% | | | | 4/28/22 | | | | Caa2 | | | | 1,122,190 | |
| | 1,918 | | | Transdigm, Inc., Term Loan E | | | 4.830% | | | | 3-Month LIBOR | | | | 2.500% | | | | 5/30/25 | | | | Ba3 | | | | 1,906,024 | |
| | 485 | | | Transdigm, Inc., Term Loan F | | | 4.830% | | | | 3-Month LIBOR | | | | 2.500% | | | | 6/09/23 | | | | Ba3 | | | | 483,455 | |
| | 317 | | | Transdigm, Inc., Term Loan G, First Lien | | | 4.830% | | | | 3-Month LIBOR | | | | 2.500% | | | | 8/22/24 | | | | Ba3 | | | | 314,622 | |
| | 8,061 | | | Total Aerospace & Defense | | | | | | | | | | | | | | | | | | | | | | | 7,909,720 | |
| | | | |
| | | | Air Freight & Logistics – 0.7% (0.4% of Total Investments) | | | | | | | | | | |
| | | | | | | |
| | 792 | | | PAE Holding Corporation, Term Loan B | | | 7.830% | | | | 3-Month LIBOR | | | | 5.500% | | | | 10/20/22 | | | | B+ | | | | 794,583 | |
| | 1,083 | | | XPO Logistics, Inc., Term Loan B | | | 4.234% | | | | 1-Month LIBOR | | | | 2.000% | | | | 2/24/25 | | | | BBB– | | | | 1,086,336 | |
| | 1,875 | | | Total Air Freight & Logistics | | | | | | | | | | | | | | | | | | | | | | | 1,880,919 | |
| | | | |
| | | | Airlines – 2.3% (1.4% of Total Investments) | | | | | | | | | | |
| | | | | | | |
| | 690 | | | American Airlines, Inc., Replacement Term Loan | | | 4.379% | | | | 1-Month LIBOR | | | | 2.000% | | | | 10/10/21 | | | | BB+ | | | | 690,528 | |
| | 832 | | | American Airlines, Inc., Term Loan 2025 | | | 4.061% | | | | 3-Month LIBOR | | | | 1.750% | | | | 6/27/25 | | | | BB+ | | | | 817,134 | |
| | 1,230 | | | American Airlines, Inc., Term Loan B, (WI/DD) | | | TBD | | | | TBD | | | | TBD | | | | TBD | | | | BB+ | | | | 1,227,386 | |
| | 3,260 | | | American Airlines, Inc., Term Loan B | | | 4.325% | | | | 1-Month LIBOR | | | | 2.000% | | | | 12/14/23 | | | | BB+ | | | | 3,249,293 | |
| | 6,012 | | | Total Airlines | | | | | | | | | | | | | | | | | | | | | | | 5,984,341 | |
| | | | |
| | | | Auto Components – 1.3% (0.8% of Total Investments) | | | | | | | | | | |
| | | | | | | |
| | 842 | | | DexKo Global, Inc., Term Loan B | | | 5.734% | | | | 1-Month LIBOR | | | | 3.500% | | | | 7/24/24 | | | | B1 | | | | 840,218 | |
| | 1,500 | | | Johnson Controls Inc., Term Loan B | | | 5.734% | | | | 1-Month LIBOR | | | | 3.500% | | | | 4/30/26 | | | | Ba3 | | | | 1,502,348 | |
| | 974 | | | Superior Industries International, Inc., Term Loan B | | | 6.234% | | | | 1-Month LIBOR | | | | 4.000% | | | | 5/22/24 | | | | B1 | | | | 930,437 | |
| | 3,316 | | | Total Auto Components | | | | | | | | | | | | | | | | | | | | | | | 3,273,003 | |
| | | | |
| | | | Automobiles – 0.5% (0.3% of Total Investments) | | | | | | | | | | |
| | | | | | | |
| | 500 | | | Caliber Collision, Term Loan B | | | 5.860% | | | | 1-Month LIBOR | | | | 3.500% | | | | 2/05/26 | | | | B1 | | | | 503,750 | |
| | 739 | | | Navistar, Inc., Term Loan B | | | 5.830% | | | | 1-Month LIBOR | | | | 3.500% | | | | 11/06/24 | | | | Ba2 | | | | 741,986 | |
| | 1,239 | | | Total Automobiles | | | | | | | | | | | | | | | | | | | | | | | 1,245,736 | |
| | | | |
| | | | Beverages – 0.8% (0.5% of Total Investments) | | | | | | | | | | |
| | | | | | | |
| | 1,932 | | | Jacobs Douwe Egberts, Term Loan B | | | 4.438% | | | | 1-Month LIBOR | | | | 2.000% | | | | 11/01/25 | | | | Ba2 | | | | 1,936,079 | |
| | | | |
| | | | Biotechnology – 1.2% (0.7% of Total Investments) | | | | | | | | | | |
| | | | | | | |
| | 2,933 | | | Grifols, Inc., Term Loan B | | | 4.599% | | | | 1-Week LIBOR | | | | 2.250% | | | | 1/31/25 | | | | BB | | | | 2,945,344 | |
| | | | |
| | | | Building Products – 2.1% (1.3% of Total Investments) | | | | | | | | | | |
| | | | | | | |
| | 894 | | | ACProducts, Inc., Term Loan, First Lien | | | 7.734% | | | | 1-Month LIBOR | | | | 5.500% | | | | 2/15/24 | | | | B+ | | | | 854,128 | |
| | 394 | | | Fairmount, Initial Term Loan | | | 6.313% | | | | 3-Month LIBOR | | | | 4.000% | | | | 6/01/25 | | | | BB– | | | | 337,002 | |
| | 484 | | | Ply Gem Industries, Inc., Term Loan B | | | 6.119% | | | | 1-Month LIBOR | | | | 3.750% | | | | 4/12/25 | | | | B+ | | | | 474,150 | |
| | 3,681 | | | Quikrete Holdings, Inc., Term Loan B | | | 4.984% | | | | 1-Month LIBOR | | | | 2.750% | | | | 11/15/23 | | | | BB– | | | | 3,657,788 | |
| | 5,453 | | | Total Building Products | | | | | | | | | | | | | | | | | | | | | | | 5,323,068 | |
| | | | |
| | | | Capital Markets – 1.8% (1.1% of Total Investments) | | | | | | | | | | |
| | | | | | | |
| | 752 | | | Capital Automotive LP, Term Loan, First Lien, (DD1) | | | 4.740% | | | | 1-Month LIBOR | | | | 2.500% | | | | 3/25/24 | | | | B1 | | | | 752,035 | |
| | 1,741 | | | Capital Automotive LP, Term Loan, Second Lien | | | 8.234% | | | | 1-Month LIBOR | | | | 6.000% | | | | 3/24/25 | | | | B3 | | | | 1,753,345 | |
| | 2,003 | | | RPI Finance Trust, Term Loan B6 | | | 4.234% | | | | 1-Month LIBOR | | | | 2.000% | | | | 3/27/23 | | | | BBB– | | | | 2,016,287 | |
| | 4,496 | | | Total Capital Markets | | | | | | | | | | | | | | | | | | | | | | | 4,521,667 | |
30
| | | | | | | | | | | | | | | | | | | | | | | | | | | | |
Principal
Amount (000) | | | Description (1) | | Coupon (2) | | | Reference
Rate (2) | | | Spread (2) | | | Maturity (3) | | | Ratings (4) | | | Value | |
| | | | |
| | | | Chemicals – 0.9% (0.6% of Total Investments) | | | | | | | | | | |
| | | | | | | |
| $ | 673 | | | Ineos US Finance LLC, Term Loan | | | 4.258% | | | | 2-Month LIBOR | | | | 2.000% | | | | 4/01/24 | | | | BB+ | | | $ | 663,813 | |
| | 779 | | | Mineral Technologies, Inc., Term Loan B2 | | | 4.750% | | | | N/A | | | | 4.750% | | | | 5/07/21 | | | | BB+ | | | | 781,636 | |
| | 912 | | | Univar, Inc., Term Loan B | | | 4.484% | | | | 1-Month LIBOR | | | | 2.250% | | | | 7/01/24 | | | | BB+ | | | | 914,755 | |
| | 2,364 | | | Total Chemicals | | | | | | | | | | | | | | | | | | | | | | | 2,360,204 | |
| | | | |
| | | | Commercial Services & Supplies – 4.2% (2.5% of Total Investments) | | | | | | | | | | |
| | | | | | | |
| | 399 | | | ADS Waste Holdings, Inc., Term Loan B | | | 4.599% | | | | 1-Week LIBOR | | | | 2.250% | | | | 11/10/23 | | | | BB+ | | | | 400,212 | |
| | 634 | | | Brand Energy & Infrastructure Services, Inc., Term Loan B, First Lien | | | 6.730% | | | | 2-Month LIBOR | | | | 4.250% | | | | 6/21/24 | | | | B– | | | | 613,634 | |
| | 110 | | | Education Management LLC, Term Loan A, (5) | | | 0.000% | | | | N/A | | | | N/A | | | | 7/02/20 | | | | N/R | | | | 1,101 | |
| | 159 | | | Education Management LLC, Term Loan B, (5) | | | 0.000% | | | | N/A | | | | N/A | | | | 7/02/20 | | | | N/R | | | | 215 | |
| | 4,018 | | | Formula One Group, Term Loan B, (DD1) | | | 4.734% | | | | 1-Month LIBOR | | | | 2.500% | | | | 2/01/24 | | | | B+ | | | | 3,978,688 | |
| | 140 | | | Fort Dearborn Holding Company, Inc., Term Loan, First Lien | | | 6.313% | | | | 3-Month LIBOR | | | | 4.000% | | | | 10/19/23 | | | | B2 | | | | 136,474 | |
| | 1,241 | | | GFL Environmental, Term Loan | | | 5.234% | | | | 1-Month LIBOR | | | | 3.000% | | | | 5/30/25 | | | | B+ | | | | 1,233,400 | |
| | 217 | | | Insurance Auto Actions Inc., Term Loan | | | 4.625% | | | | 3-Month LIBOR | | | | 2.250% | | | | 5/22/26 | | | | BB | | | | 217,867 | |
| | 2,208 | | | iQor US, Inc., Term Loan, First Lien | | | 7.319% | | | | 3-Month LIBOR | | | | 5.000% | | | | 4/01/21 | | | | Caa1 | | | | 2,108,910 | |
| | 250 | | | iQor US, Inc., Term Loan, Second Lien | | | 11.069% | | | | 3-Month LIBOR | | | | 8.750% | | | | 4/01/22 | | | | Caa3 | | | | 201,250 | |
| | 200 | | | KAR Auction Services, Inc., Term Loan B5 | | | 4.875% | | | | 3-Month LIBOR | | | | 2.500% | | | | 3/09/23 | | | | BB | | | | 200,869 | |
| | 1,129 | | | Protection One, Inc., Term Loan | | | 4.984% | | | | 1-Month LIBOR | | | | 2.750% | | | | 5/02/22 | | | | BB– | | | | 1,129,573 | |
| | 350 | | | Robertshaw US Holding Corp., Term Loan B, (WI/DD) | | | TBD | | | | TBD | | | | TBD | | | | TBD | | | | B | | | | 326,375 | |
| | 169 | | | West Corporation, Incremental Term Loan B1 | | | 6.022% | | | | 3-Month LIBOR | | | | 3.500% | | | | 10/10/24 | | | | B1 | | | | 157,175 | |
| | 11,224 | | | Total Commercial Services & Supplies | | | | | | | | | | | | | | | | | | | | | | | 10,705,743 | |
| | | | |
| | | | Communications Equipment – 4.2% (2.6% of Total Investments) | | | | | | | | | | |
| | | | | | | |
| | 2,910 | | | Avaya, Inc., Term Loan B | | | 6.575% | | | | 1-Month LIBOR | | | | 4.250% | | | | 12/15/24 | | | | B | | | | 2,807,358 | |
| | 2,400 | | | CommScope, Inc., Term Loan B | | | 5.484% | | | | 1-Month LIBOR | | | | 3.250% | | | | 4/06/26 | | | | Ba1 | | | | 2,407,200 | |
| | 896 | | | Mitel US Holdings, Inc., Term Loan, First Lien | | | 6.734% | | | | 1-Month LIBOR | | | | 4.500% | | | | 11/30/25 | | | | B | | | | 874,389 | |
| | 317 | | | MultiPlan, Inc., Term Loan B | | | 5.080% | | | | 3-Month LIBOR | | | | 2.750% | | | | 6/07/23 | | | | B+ | | | | 308,381 | |
| | 1,039 | | | Plantronics, Term Loan B | | | 4.734% | | | | 1-Month LIBOR | | | | 2.500% | | | | 7/02/25 | | | | Ba1 | | | | 1,040,505 | |
| | 3,366 | | | Univision Communications, Inc., Term Loan C5 | | | 4.984% | | | | 1-Month LIBOR | | | | 2.750% | | | | 3/15/24 | | | | B | | | | 3,300,226 | |
| | 10,928 | | | Total Communications Equipment | | | | | | | | | | | | | | | | | | | | | | | 10,738,059 | |
| | | | |
| | | | Construction & Engineering – 0.9% (0.5% of Total Investments) | | | | | | | | | | |
| | | | | | | |
| | 950 | | | KBR, Inc, Term Loan B | | | 5.984% | | | | 1-Month LIBOR | | | | 3.750% | | | | 4/25/25 | | | | Ba3 | | | | 956,536 | |
| | 1,320 | | | Traverse Midstream Partners, Term Loan B | | | 6.260% | | | | 2-Month LIBOR | | | | 4.000% | | | | 9/27/24 | | | | B+ | | | | 1,295,732 | |
| | 2,270 | | | Total Construction & Engineering | | | | | | | | | | | | | | | | | | | | | | | 2,252,268 | |
| | | | |
| | | | Consumer Finance – 0.6% (0.3% of Total Investments) | | | | | | | | | | |
| | | | | | | |
| | 1,475 | | | Verscend Technologies, Tern Loan B | | | 6.734% | | | | 1-Month LIBOR | | | | 4.500% | | | | 8/27/25 | | | | B+ | | | | 1,484,769 | |
| | | | |
| | | | Containers & Packaging – 0.7% (0.4% of Total Investments) | | | | | | | | | | |
| | | | | | | |
| | 699 | | | Berry Global, Inc., Term Loan Q | | | 4.629% | | | | 1-Month LIBOR | | | | 2.250% | | | | 10/01/22 | | | | BBB– | | | | 699,355 | |
| | 1,000 | | | Berry Global, Inc., Term Loan U | | | 4.902% | | | | 1-Month LIBOR | | | | 2.500% | | | | 7/01/26 | | | | BBB– | | | | 1,000,470 | |
| | 1,699 | | | Total Containers & Packaging | | | | | | | | | | | | | | | | | | | | | | | 1,699,825 | |
| | | | |
| | | | Distributors – 0.2% (0.2% of Total Investments) | | | | | | | | | | |
| | | | | | | |
| | 772 | | | SRS Distribution, Inc., Term Loan B | | | 5.484% | | | | 1-Month LIBOR | | | | 3.250% | | | | 5/23/25 | | | | B3 | | | | 749,015 | |
| | | | |
| | | | Diversified Consumer Services – 2.9% (1.8% of Total Investments) | | | | | | | | | | |
| | | | | | | |
| | 3,514 | | | Cengage Learning Acquisitions, Inc., Term Loan B | | | 6.484% | | | | 1-Month LIBOR | | | | 4.250% | | | | 6/07/23 | | | | B | | | | 3,395,248 | |
| | 75 | | | Education Management LLC, Elevated Term Loan B, (5) | | | 7.830% | | | | 1-Month LIBOR | | | | 5.500% | | | | 7/02/20 | | | | N/R | | | | 939 | |
| | 2,702 | | | Houghton Mifflin, Term Loan B, First Lien | | | 5.234% | | | | 1-Month LIBOR | | | | 3.000% | | | | 5/28/21 | | | | B | | | | 2,596,626 | |
| | 1,493 | | | Refinitiv, Term Loan B | | | 5.984% | | | | 1-Month LIBOR | | | | 3.750% | | | | 10/01/25 | | | | B | | | | 1,493,433 | |
| | 7,784 | | | Total Diversified Consumer Services | | | | | | | | | | | | | | | | | | | | | | | 7,486,246 | |
| | | | |
| | | | Diversified Financial Services – 1.1% (0.6% of Total Investments) | | | | | | | | | | |
| | | | | | | |
| | 650 | | | Blackstone CQP, Term Loan | | | 5.887% | | | | 3-Month LIBOR | | | | 3.500% | | | | 9/30/24 | | | | B+ | | | | 653,455 | |
| | 843 | | | Getty Images, Inc., Initial Dollar Term Loan | | | 6.734% | | | | 1-Month LIBOR | | | | 4.500% | | | | 2/19/26 | | | | B2 | | | | 842,626 | |
| | 375 | | | Lions Gate Entertainment Corp., Term Loan B | | | 4.484% | | | | 1-Month LIBOR | | | | 2.250% | | | | 3/24/25 | | | | Ba2 | | | | 374,801 | |
31
| | |
| |
| NSL | | Nuveen Senior Income Fund(continued) |
| | Portfolio of Investments July 31, 2019 |
| | | | | | | | | | | | | | | | | | | | | | | | | | | | |
Principal
Amount (000) | | | Description (1) | | Coupon (2) | | | Reference
Rate (2) | | | Spread (2) | | | Maturity (3) | | | Ratings (4) | | | Value | |
| | | | |
| | | | Diversified Financial Services(continued) | | | | | | | | | | |
| | | | | | | |
| $ | 2,148 | | | Walter Investment Management Corporation, Term Loan B, First Lien, (5) | | | 0.000% | | | | N/A | | | | N/A | | | | 6/30/22 | | | | Ca | | | $ | 821,636 | |
| | 4,016 | | | Total Diversified Financial Services | | | | | | | | | | | | | | | | | | | | | | | 2,692,518 | |
| | | | |
| | | | Diversified Telecommunication Services – 8.6% (5.2% of Total Investments) | | | | | | | | | | |
| | | | | | | |
| | 1,018 | | | CenturyLink, Inc., Initial Term Loan A | | | 4.984% | | | | 1-Month LIBOR | | | | 2.750% | | | | 11/01/22 | | | | BBB– | | | | 1,019,250 | |
| | 5,528 | | | CenturyLink, Inc., Term Loan B | | | 4.984% | | | | 1-Month LIBOR | | | | 2.750% | | | | 1/31/25 | | | | BBB– | | | | 5,500,993 | |
| | 3,493 | | | Frontier Communications Corporation, Term Loan B | | | 5.990% | | | | 1-Month LIBOR | | | | 3.750% | | | | 1/14/22 | | | | B2 | | | | 3,458,091 | |
| | 236 | | | Intelsat Jackson Holdings, S.A., Term Loan B4 | | | 6.741% | | | | 1-Month LIBOR | | | | 4.500% | | | | 1/02/24 | | | | B1 | | | | 239,273 | |
| | 378 | | | Intelsat Jackson Holdings, S.A., Term Loan B5 | | | 6.625% | | | | N/A | | | | 6.625% | | | | 1/02/24 | | | | B1 | | | | 383,563 | |
| | 1,802 | | | Level 3 Financing, Inc., Term Loan B | | | 4.484% | | | | 1-Month LIBOR | | | | 2.250% | | | | 2/22/24 | | | | BBB– | | | | 1,806,324 | |
| | 3,474 | | | Numericable Group S.A., Term Loan B13 | | | 6.325% | | | | 1-Month LIBOR | | | | 4.000% | | | | 8/14/26 | | | | B | | | | 3,462,912 | |
| | 1,000 | | | Windstream Corporation, DIP Term Loan | | | 4.740% | | | | 1-Month LIBOR | | | | 2.500% | | | | 2/26/21 | | | | BBB– | | | | 1,007,500 | |
| | 5,000 | | | Ziggo B.V., Term Loan E | | | 4.825% | | | | 1-Month LIBOR | | | | 2.500% | | | | 4/15/25 | | | | B+ | | | | 4,976,375 | |
| | 21,929 | | | Total Diversified Telecommunication Services | | | | | | | | | | | | | | | | | | | | | | | 21,854,281 | |
| | | | |
| | | | Electric Utilities – 1.1% (0.6% of Total Investments) | | | | | | | | | | |
| | | | | | | |
| | 295 | | | EFS Cogen Holdings LLC, Term Loan B | | | 5.580% | | | | 3-Month LIBOR | | | | 3.250% | | | | 6/28/23 | | | | BB | | | | 294,757 | |
| | 600 | | | ExGen Renewables, Term Loan, (WI/DD) | | | TBD | | | | TBD | | | | TBD | | | | TBD | | | | B | | | | 581,751 | |
| | 1,084 | | | Vistra Operations Co., Term Loan B1 | | | 4.234% | | | | 1-Month LIBOR | | | | 2.000% | | | | 8/01/23 | | | | BBB– | | | | 1,086,718 | |
| | 765 | | | Vistra Operations Co., Term Loan B3 | | | 4.330% | | | | 3-Month LIBOR | | | | 2.000% | | | | 12/31/25 | | | | BBB– | | | | 767,593 | |
| | 2,744 | | | Total Electric Utilities | | | | | | | | | | | | | | | | | | | | | | | 2,730,819 | |
| | | | |
| | | | Electrical Equipment – 0.4% (0.3% of Total Investments) | | | | | | | | | | |
| | | | | | | |
| | 1,149 | | | TTM Technologies, Inc., Term Loan B | | | 4.902% | | | | 1-Month LIBOR | | | | 2.500% | | | | 9/28/24 | | | | BB+ | | | | 1,147,292 | |
| | | | |
| | | | Energy Equipment & Services – 0.8% (0.5% of Total Investments) | | | | | | | | | | |
| | | | | | | |
| | 2,148 | | | McDermott International, Term Loan | | | 7.234% | | | | 1-Month LIBOR | | | | 5.000% | | | | 5/12/25 | | | | Ba3 | | | | 2,057,930 | |
| | | | |
| | | | Equity Real Estate Investment Trust – 1.6% (1.0% of Total Investments) | | | | | | | | | | |
| | | | | | | |
| | 4,182 | | | Communications Sales & Leasing, Inc., Shortfall Term Loan | | | 7.234% | | | | 1-Month LIBOR | | | | 5.000% | | | | 10/24/22 | | | | Caa1 | | | | 4,076,609 | |
| | | | |
| | | | Food & Staples Retailing – 6.6% (4.0% of Total Investments) | | | | | | | | | | |
| | | | | | | |
| | 936 | | | Albertson’s LLC, Term Loan B6 | | | 5.234% | | | | 1-Month LIBOR | | | | 3.000% | | | | 6/22/23 | | | | BB | | | | 939,372 | |
| | 10,086 | | | Albertson’s LLC, Term Loan B7 | | | 5.234% | | | | 1-Month LIBOR | | | | 3.000% | | | | 11/17/25 | | | | BB | | | | 10,113,379 | |
| | 827 | | | Hearthside Group Holdings LLC, Term Loan B | | | 5.922% | | | | 1-Month LIBOR | | | | 3.688% | | | | 5/23/25 | | | | B | | | | 813,762 | |
| | 4,822 | | | US Foods, Inc., Term Loan B | | | 4.234% | | | | 1-Month LIBOR | | | | 2.000% | | | | 6/27/23 | | | | BBB– | | | | 4,823,700 | |
| | 16,671 | | | Total Food & Staples Retailing | | | | | | | | | | | | | | | | | | | | | | | 16,690,213 | |
| | | | |
| | | | Food Products – 0.2% (0.1% of Total Investments) | | | | | | | | | | |
| | | | | | | |
| | 9 | | | American Seafoods Group LLC, Term Loan B | | | 7.250% | | | | Prime | | | | 1.750% | | | | 8/21/23 | | | | BB– | | | | 9,023 | |
| | 589 | | | American Seafoods Group LLC, Term Loan B | | | 5.160% | | | | 1-Month LIBOR | | | | 2.750% | | | | 8/21/23 | | | | BB– | | | | 588,728 | |
| | 598 | | | Total Food Products | | | | | | | | | | | | | | | | | | | | | | | 597,751 | |
| | | | |
| | | | Health Care Equipment & Supplies – 2.2% (1.4% of Total Investments) | | | | | | | | | | |
| | | | | | | |
| | 1,433 | | | Acelity, Term Loan B | | | 5.580% | | | | 3-Month LIBOR | | | | 3.250% | | | | 2/02/24 | | | | B1 | | | | 1,439,268 | |
| | 399 | | | Air Methods Term Loan, First Lien, (DD1) | | | 5.830% | | | | 3-Month LIBOR | | | | 3.500% | | | | 4/22/24 | | | | B | | | | 338,140 | |
| | 566 | | | Greatbatch, New Term Loan B | | | 5.380% | | | | 1-Month LIBOR | | | | 3.000% | | | | 10/27/22 | | | | B+ | | | | 569,569 | |
| | 1,840 | | | Onex Carestream Finance LP, Term Loan, First Lien | | | 7.984% | | | | 1-Month LIBOR | | | | 5.750% | | | | 2/28/21 | | | | B1 | | | | 1,773,493 | |
| | 938 | | | Onex Carestream Finance LP, Term Loan, Second Lien | | | 11.734% | | | | 1-Month LIBOR | | | | 9.500% | | | | 6/07/21 | | | | B– | | | | 893,262 | |
| | 722 | | | Vyaire Medical, Inc., Term Loan B | | | 7.080% | | | | 3-Month LIBOR | | | | 4.750% | | | | 4/16/25 | | | | B3 | | | | 672,889 | |
| | 5,898 | | | Total Health Care Equipment & Supplies | | | | | | | | | | | | | | | | | | | | | | | 5,686,621 | |
| | | | |
| | | | Health Care Providers & Services – 9.1% (5.6% of Total Investments) | | | | | | | | | | |
| | | | | | | |
| | 2,051 | | | Air Medical Group Holdings, Inc., Term Loan B, (DD1) | | | 5.564% | | | | 1-Month LIBOR | | | | 3.250% | | | | 4/28/22 | | | | B1 | | | | 1,992,537 | |
| | 743 | | | Ardent Health, Term Loan, First Lien | | | 6.734% | | | | 1-Month LIBOR | | | | 4.500% | | | | 6/30/25 | | | | B1 | | | | 746,215 | |
| | 692 | | | Brightspring Health, Term Loan B | | | 6.880% | | | | 1-Month LIBOR | | | | 4.500% | | | | 3/05/26 | | | | B1 | | | | 696,648 | |
| | 470 | | | Civitas Solutions, Term Loan B | | | 6.490% | | | | 1-Month LIBOR | | | | 4.250% | | | | 3/09/26 | | | | B1 | | | | 473,105 | |
| | 29 | | | Civitas Solutions, Term Loan C | | | 6.490% | | | | 1-Month LIBOR | | | | 4.250% | | | | 3/09/26 | | | | B1 | | | | 29,459 | |
32
| | | | | | | | | | | | | | | | | | | | | | | | | | | | |
Principal
Amount (000) | | | Description (1) | | Coupon (2) | | | Reference
Rate (2) | | | Spread (2) | | | Maturity (3) | | | Ratings (4) | | | Value | |
| | | | |
| | | | Health Care Providers & Services(continued) | | | | | | | | | | |
| | | | | | | |
| $ | 922 | | | Concentra, Inc., Term Loan B | | | 5.210% | | | | 3-Month LIBOR | | | | 2.750% | | | | 6/01/22 | | | | B+ | | | $ | 924,271 | |
| | 427 | | | ConvaTec, Inc., Term Loan B | | | 4.580% | | | | 3-Month LIBOR | | | | 2.250% | | | | 10/25/23 | | | | BB | | | | 427,095 | |
| | 1,082 | | | Envision Healthcare Corporation, Initial Term Loan, (DD1) | | | 5.984% | | | | 1-Month LIBOR | | | | 3.750% | | | | 10/10/25 | | | | B+ | | | | 933,227 | |
| | 348 | | | HCA, Inc., Term Loan B11 | | | 4.080% | | | | 3-Month LIBOR | | | | 1.750% | | | | 3/17/23 | | | | BBB– | | | | 349,435 | |
| | 426 | | | Healogics, Inc., Term Loan, First Lien | | | 6.730% | | | | 3-Month LIBOR | | | | 4.250% | | | | 7/01/21 | | | | B3 | | | | 337,677 | |
| | 459 | | | Heartland Dental Care, Inc., Term Loan, First Lien | | | 5.984% | | | | 1-Month LIBOR | | | | 3.750% | | | | 4/30/25 | | | | B2 | | | | 442,741 | |
| | 10 | | | Heartland Dental Care, Inc., Delay Draw Facility, (6) | | | 3.750% | | | | N/A | | | | 3.750% | | | | 4/30/25 | | | | B2 | | | | 9,933 | |
| | 1,920 | | | Kindred at Home Hospice, Term Loan B | | | 6.000% | | | | 1-Month LIBOR | | | | 3.750% | | | | 7/02/25 | | | | B1 | | | | 1,933,000 | |
| | 3,404 | | | Lifepoint Health, Inc., Term Loan, (DD1) | | | 6.769% | | | | 1-Month LIBOR | | | | 4.500% | | | | 11/16/25 | | | | B+ | | | | 3,427,924 | |
| | 1,023 | | | Millennium Laboratories, Inc., Term Loan B, First Lien | | | 8.734% | | | | 1-Month LIBOR | | | | 6.500% | | | | 12/21/20 | | | | Caa3 | | | | 463,603 | |
| | 4,080 | | | Pharmaceutical Product Development, Inc., Term Loan B | | | 4.734% | | | | 1-Month LIBOR | | | | 2.500% | | | | 8/18/22 | | | | Ba3 | | | | 4,079,167 | |
| | 1,664 | | | Prospect Medical Holdings, Term Loan B1 | | | 7.875% | | | | 1-Month LIBOR | | | | 5.500% | | | | 2/22/24 | | | | B | | | | 1,662,869 | |
| | 117 | | | Quorum Health Corp., Term Loan B | | | 9.006% | | | | 3-Month LIBOR | | | | 6.750% | | | | 4/29/22 | | | | B1 | | | | 115,727 | |
| | 2,893 | | | Select Medical Corporation, Term Loan B, (DD1) | | | 4.850% | | | | 3-Month LIBOR | | | | 2.500% | | | | 3/06/25 | | | | Ba2 | | | | 2,891,383 | |
| | 1,358 | | | Team Health, Initial Term Loan | | | 4.984% | | | | 1-Month LIBOR | | | | 2.750% | | | | 2/06/24 | | | | B | | | | 1,193,626 | |
| | 148 | | | Vizient Inc., Term Loan B | | | 4.984% | | | | 1-Month LIBOR | | | | 2.750% | | | | 5/06/26 | | | | BB– | | | | 148,837 | |
| | 24,266 | | | Total Health Care Providers & Services | | | | | | | | | | | | | | | | | | | | | | | 23,278,479 | |
| | | | |
| | | | Health Care Technology – 1.4% (0.9% of Total Investments) | | | | | | | | | | |
| | | | | | | |
| | 3,672 | | | Emdeon, Inc., Term Loan, (DD1) | | | 4.734% | | | | 1-Month LIBOR | | | | 2.500% | | | | 3/01/24 | | | | B+ | | | | 3,670,124 | |
| | | | |
| | | | Hotels, Restaurants & Leisure – 15.7% (9.5% of Total Investments) | | | | | | | | | | |
| | | | | | | |
| | 1,016 | | | 24 Hour Fitness Worldwide, Inc., Term Loan B | | | 5.734% | | | | 1-Month LIBOR | | | | 3.500% | | | | 5/30/25 | | | | Ba3 | | | | 1,018,105 | |
| | 699 | | | Aramark Corporation, Term Loan | | | 4.080% | | | | 3-Month LIBOR | | | | 1.750% | | | | 3/11/25 | | | | BBB– | | | | 700,662 | |
| | 5,908 | | | Burger King Corporation, Term Loan B3 | | | 4.484% | | | | 1-Month LIBOR | | | | 2.250% | | | | 2/16/24 | | | | Ba3 | | | | 5,918,363 | |
| | 3,657 | | | Caesars Entertainment Operating Company, Inc., Term Loan B, (DD1) | | | 4.234% | | | | 1-Month LIBOR | | | | 2.000% | | | | 10/06/24 | | | | BB | | | | 3,653,772 | |
| | 3,239 | | | Caesars Resort Collection, Term Loan, First Lien, (DD1) | | | 4.984% | | | | 1-Month LIBOR | | | | 2.750% | | | | 12/23/24 | | | | BB | | | | 3,218,121 | |
| | 1,026 | | | CCM Merger, Inc., Term Loan B | | | 4.484% | | | | 1-Month LIBOR | | | | 2.250% | | | | 8/09/21 | | | | BB– | | | | 1,028,395 | |
| | 2,157 | | | CityCenter Holdings LLC, Term Loan B | | | 4.484% | | | | 1-Month LIBOR | | | | 2.250% | | | | 4/18/24 | | | | BB– | | | | 2,164,345 | |
| | 690 | | | ClubCorp Operations, Inc., Term Loan B | | | 5.080% | | | | 3-Month LIBOR | | | | 2.750% | | | | 9/18/24 | | | | B | | | | 638,250 | |
| | 1,325 | | | Equinox Holdings, Inc., Term Loan B1 | | | 5.234% | | | | 1-Month LIBOR | | | | 3.000% | | | | 3/08/24 | | | | B+ | | | | 1,329,369 | |
| | 488 | | | Four Seasons Holdings, Inc., Term Loan B | | | 4.234% | | | | 1-Month LIBOR | | | | 2.000% | | | | 11/30/23 | | | | BB | | | | 488,909 | |
| | 2,150 | | | Hilton Hotels, Term Loan B2 | | | 4.016% | | | | 1-Month LIBOR | | | | 1.750% | | | | 6/22/26 | | | | BBB– | | | | 2,159,610 | |
| | 2,286 | | | Intrawest Resorts Holdings, Inc., Term Loan B | | | 5.234% | | | | 1-Month LIBOR | | | | 3.000% | | | | 7/31/24 | | | | B | | | | 2,292,867 | |
| | 1,659 | | | Life Time Fitness, Inc., Term Loan B | | | 5.272% | | | | 3-Month LIBOR | | | | 2.750% | | | | 6/10/22 | | | | BB– | | | | 1,660,358 | |
| | 1,064 | | | MGM Growth Properties, Term Loan B | | | 4.234% | | | | 1-Month LIBOR | | | | 2.000% | | | | 3/21/25 | | | | BB+ | | | | 1,066,134 | |
| | 500 | | | MGM Resorts International, Term Loan A | | | 4.234% | | | | 1-Month LIBOR | | | | 2.000% | | | | 12/21/23 | | | | BB+ | | | | 498,282 | |
| | 500 | | | PCI Gaming, Term Loan B | | | 5.234% | | | | 1-Month LIBOR | | | | 3.000% | | | | 5/29/26 | | | | BB+ | | | | 504,330 | |
| | 5,616 | | | Scientific Games Corp., Initial Term Loan B5 | | | 4.984% | | | | 1-Month LIBOR | | | | 2.750% | | | | 8/14/24 | | | | Ba3 | | | | 5,596,000 | |
| | 877 | | | Seaworld Parks and Entertainment, Inc., Term Loan B5 | | | 5.234% | | | | 1-Month LIBOR | | | | 3.000% | | | | 4/01/24 | | | | B+ | | | | 879,333 | |
| | 2,419 | | | Stars Group Holdings, Term Loan B | | | 5.830% | | | | 3-Month LIBOR | | | | 3.500% | | | | 7/10/25 | | | | B+ | | | | 2,430,999 | |
| | 1,713 | | | Station Casino LLC, Term Loan B | | | 4.740% | | | | 1-Month LIBOR | | | | 2.500% | | | | 6/08/23 | | | | BB | | | | 1,719,084 | |
| | 993 | | | Wyndham International, Inc., Term Loan B | | | 3.984% | | | | 1-Month LIBOR | | | | 1.750% | | | | 5/30/25 | | | | BBB– | | | | 996,301 | |
| | 39,982 | | | Total Hotels, Restaurants & Leisure | | | | | | | | | | | | | | | | | | | | | | | 39,961,589 | |
| | | | |
| | | | Household Durables – 0.4% (0.2% of Total Investments) | | | | | | | | | | |
| | | | | | | |
| | 1,321 | | | Serta Simmons Holdings LLC, Term Loan, First Lien | | | 5.879% | | | | 1-Month LIBOR | | | | 3.500% | | | | 11/08/23 | | | | CCC+ | | | | 909,928 | |
| | | | |
| | | | Household Products – 0.3% (0.2% of Total Investments) | | | | | | | | | | |
| | | | | | | |
| | 733 | | | Reynolds Group Holdings, Inc., Term Loan, First Lien | | | 4.984% | | | | 1-Month LIBOR | | | | 2.750% | | | | 2/05/23 | | | | B+ | | | | 734,116 | |
| | | | |
| | | | Industrial Conglomerates – 0.3% (0.2% of Total Investments) | | | | | | | | | | |
| | | | | | | |
| | 741 | | | Education Advisory Board, Term Loan, First Lien | | | 6.381% | | | | 6-Month LIBOR | | | | 3.750% | | | | 11/15/24 | | | | B2 | | | | 735,537 | |
| | | | |
| | | | Insurance – 2.2% (1.3% of Total Investments) | | | | | | | | | | |
| | | | | | | |
| | 489 | | | Acrisure LLC, Term Loan B | | | 6.772% | | | | 3-Month LIBOR | | | | 4.250% | | | | 11/22/23 | | | | B | | | | 487,115 | |
| | 2,667 | | | Alliant Holdings I LLC, Term Loan B | | | 5.269% | | | | 1-Month LIBOR | | | | 3.000% | | | | 5/09/25 | | | | B | | | | 2,635,525 | |
33
| | |
| |
| NSL | | Nuveen Senior Income Fund(continued) |
| | Portfolio of Investments July 31, 2019 |
| | | | | | | | | | | | | | | | | | | | | | | | | | | | |
Principal
Amount (000) | | | Description (1) | | Coupon (2) | | | Reference
Rate (2) | | | Spread (2) | | | Maturity (3) | | | Ratings (4) | | | Value | |
| | | | |
| | | | Insurance(continued) | | | | | | | | | | |
| | | | | | | |
| $ | 723 | | | Asurion LLC, Term Loan B6 | | | 5.234% | | | | 1-Month LIBOR | | | | 3.000% | | | | 11/03/23 | | | | Ba3 | | | $ | 725,350 | |
| | 1,642 | | | Hub International Holdings, Inc., Term Loan B | | | 5.281% | | | | 3-Month LIBOR | | | | 3.000% | | | | 4/25/25 | | | | B | | | | 1,627,502 | |
| | 5,521 | | | Total Insurance | | | | | | | | | | | | | | | | | | | | | | | 5,475,492 | |
| | | | |
| | | | Interactive Media & Services – 1.0% (0.6% of Total Investments) | | | | | | | | | | |
| | | | | | | |
| | 1,625 | | | Rackspace Hosting, Inc., Refinancing Term B Loan, First Lien | | | 5.576% | | | | 3-Month LIBOR | | | | 3.000% | | | | 11/03/23 | | | | BB– | | | | 1,511,965 | |
| | 995 | | | WeddingWire, Inc., Term Loan | | | 6.734% | | | | 1-Month LIBOR | | | | 4.500% | | | | 12/19/25 | | | | B+ | | | | 998,731 | |
| | 2,620 | | | Total Interactive Media & Services | | | | | | | | | | | | | | | | | | | | | | | 2,510,696 | |
| | | | |
| | | | Internet Software & Services – 1.0% (0.6% of Total Investments) | | | | | | | | | | |
| | | | | | | |
| | 973 | | | Ancestry.com, Inc., Term Loan, First Lien | | | 5.490% | | | | 1-Month LIBOR | | | | 3.250% | | | | 10/19/23 | | | | B | | | | 973,312 | |
| | 1,043 | | | Dynatrace, Term Loan, First Lien | | | 5.234% | | | | 1-Month LIBOR | | | | 3.000% | | | | 8/22/25 | | | | B1 | | | | 1,045,899 | |
| | 56 | | | Dynatrace, Term Loan, Second Lien | | | 9.234% | | | | 1-Month LIBOR | | | | 7.000% | | | | 8/21/26 | | | | CCC+ | | | | 56,869 | |
| | 1,109 | | | SkillSoft Corporation, Term Loan, Second Lien | | | 10.506% | | | | 3-Month LIBOR | | | | 8.250% | | | | 4/28/22 | | | | CCC | | | | 407,519 | |
| | 3,181 | | | Total Internet Software & Services | | | | | | | | | | | | | | | | | | | | | | | 2,483,599 | |
| | | | |
| | | | IT Services – 4.3% (2.6% of Total Investments) | | | | | | | | | | |
| | | | | | | |
| | 504 | | | DTI Holdings, Inc., Replacement Term Loan B1 | | | 7.008% | | | | 2-Month LIBOR | | | | 4.750% | | | | 9/29/23 | | | | B– | | | | 465,731 | |
| | 627 | | | Gartner, Inc., Term Loan A | | | 3.984% | | | | 1-Month LIBOR | | | | 1.750% | | | | 3/21/22 | | | | BB+ | | | | 629,395 | |
| | 485 | | | GTT Communications, Inc., Term Loan, First Lien | | | 4.980% | | | | 1-Month LIBOR | | | | 2.750% | | | | 6/02/25 | | | | B2 | | | | 427,452 | |
| | 1,092 | | | Sabre, Inc., Term Loan B | | | 4.234% | | | | 1-Month LIBOR | | | | 2.000% | | | | 2/22/24 | | | | BB | | | | 1,096,520 | |
| | 427 | | | Science Applications International Corporation, Term Loan B | | | 3.984% | | | | 1-Month LIBOR | | | | 1.750% | | | | 10/31/25 | | | | BB+ | | | | 426,080 | |
| | 2,000 | | | Syniverse Holdings, Inc., Initial Term Loan, Second Lien | | | 11.325% | | | | 1-Month LIBOR | | | | 9.000% | | | | 3/11/24 | | | | CCC | | | | 1,435,000 | |
| | 1,911 | | | Syniverse Holdings, Inc., Term Loan C , (DD1) | | | 7.325% | | | | 1-Month LIBOR | | | | 5.000% | | | | 3/09/23 | | | | B2 | | | | 1,753,719 | |
| | 1,225 | | | Tempo Acquisition LLC, Term Loan B | | | 5.234% | | | | 1-Month LIBOR | | | | 3.000% | | | | 5/01/24 | | | | B1 | | | | 1,228,369 | |
| | 1,750 | | | Travelport LLC, Term Loan B | | | 7.541% | | | | 6-Month LIBOR | | | | 5.000% | | | | 5/29/26 | | | | B+ | | | | 1,704,605 | |
| | 1,231 | | | West Corporation, Term Loan B | | | 6.522% | | | | 3-Month LIBOR | | | | 4.000% | | | | 10/10/24 | | | | B1 | | | | 1,152,869 | |
| | 728 | | | WEX, Inc., Term Loan B3 | | | 4.484% | | | | 1-Month LIBOR | | | | 2.250% | | | | 5/15/26 | | | | BB– | | | | 729,632 | |
| | 11,980 | | | Total IT Services | | | | | | | | | | | | | | | | | | | | | | | 11,049,372 | |
| | | | |
| | | | Life Sciences Tools & Services – 0.6% (0.4% of Total Investments) | | | | | | | | | | |
| | | | | | | |
| | 222 | | | Inventiv Health, Inc, Term Loan B | | | 4.234% | | | | 1-Month LIBOR | | | | 2.000% | | | | 8/01/24 | | | | BB | | | | 222,334 | |
| | 1,353 | | | Parexel International Corp., Term Loan B, (DD1) | | | 4.984% | | | | 1-Month LIBOR | | | | 2.750% | | | | 9/27/24 | | | | B2 | | | | 1,307,720 | |
| | 1,575 | | | Total Life Sciences Tools & Services | | | | | | | | | | | | | | | | | | | | | | | 1,530,054 | |
| | | | |
| | | | Machinery – 1.5% (0.9% of Total Investments) | | | | | | | | | | |
| | | | | | | |
| | 731 | | | BJ’s Wholesale Club, Inc., Term Loan B | | | 5.075% | | | | 1-Month LIBOR | | | | 2.750% | | | | 2/01/24 | | | | B | | | | 732,967 | |
| | 975 | | | Gardner Denver, Inc., Term Loan B | | | 4.984% | | | | 1-Month LIBOR | | | | 2.750% | | | | 7/30/24 | | | | BB+ | | | | 978,369 | |
| | 829 | | | Gates Global LLC, Term Loan B | | | 4.984% | | | | 1-Month LIBOR | | | | 2.750% | | | | 4/01/24 | | | | B+ | | | | 827,319 | |
| | 943 | | | TNT Crane and Rigging Inc., Initial Term Loan, First Lien, (DD1) | | | 6.830% | | | | 3-Month LIBOR | | | | 4.500% | | | | 11/27/20 | | | | CCC+ | | | | 884,288 | |
| | 500 | | | TNT Crane and Rigging, Inc., Term Loan, Second Lien | | | 11.330% | | | | 3-Month LIBOR | | | | 9.000% | | | | 11/26/21 | | | | CCC– | | | | 368,750 | |
| | 3,978 | | | Total Machinery | | | | | | | | | | | | | | | | | | | | | | | 3,791,693 | |
| | | | |
| | | | Marine – 0.5% (0.3% of Total Investments) | | | | | | | | | | |
| | | | | | | |
| | 395 | | | American Commercial Lines LLC, Term Loan B, First Lien | | | 10.984% | | | | 1-Month LIBOR | | | | 8.750% | | | | 11/12/20 | | | | CCC+ | | | | 259,630 | |
| | 1,024 | | | Harvey Gulf International Marine, Inc., Exit Term Loan | | | 8.743% | | | | 3-Month LIBOR | | | | 6.000% | | | | 7/02/23 | | | | B | | | | 977,058 | |
| | 1,419 | | | Total Marine | | | | | | | | | | | | | | | | | | | | | | | 1,236,688 | |
| | | | |
| | | | Media – 13.4% (8.2% of Total Investments) | | | | | | | | | | |
| | | | | | | |
| | 301 | | | Advantage Sales & Marketing, Inc., Term Loan B2, First Lien, (WI/DD) | | | TBD | | | | TBD | | | | TBD | | | | TBD | | | | B2 | | | | 279,794 | |
| | 322 | | | Advantage Sales & Marketing, Inc., Term Loan, First Lien | | | 5.580% | | | | 3-Month LIBOR | | | | 3.250% | | | | 7/23/21 | | | | B2 | | | | 299,803 | |
| | 327 | | | Affinion Group Holdings, Inc., Consenting Term Loan, (cash 4.519%, PIK 1.750%) | | | 6.269% | | | | 1-Month LIBOR | | | | 4.000% | | | | 4/10/24 | | | | N/R | | | | 280,479 | |
34
| | | | | | | | | | | | | | | | | | | | | | | | | | | | |
Principal
Amount (000) | | | Description (1) | | Coupon (2) | | | Reference
Rate (2) | | | Spread (2) | | | Maturity (3) | | | Ratings (4) | | | Value | |
| | | | |
| | | | Media(continued) | | | | | | | | | | |
| | | | | | | |
| $ | 729 | | | AMC Entertainment, Inc., Term Loan B, (DD1) | | | 5.230% | | | | 6-Month LIBOR | | | | 3.000% | | | | 4/22/26 | | | | Ba2 | | | $ | 730,529 | |
| | 218 | | | Catalina Marketing Corporation, First Out Loan | | | 9.814% | | | | 1-Month LIBOR | | | | 7.500% | | | | 2/15/23 | | | | B2 | | | | 185,096 | |
| | 276 | | | Catalina Marketing Corporation, Last Out PIK Term Loan, (cash 3.314%, PIK 9.500%) | | | 3.314% | | | | 1-Month LIBOR | | | | 1.000% | | | | 8/15/23 | | | | Caa2 | | | | 130,926 | |
| | 235 | | | CBS Radio, Inc., Term Loan B | | | 4.991% | | | | 1-Month LIBOR | | | | 2.750% | | | | 11/18/24 | | | | BB | | | | 234,988 | |
| | 2,879 | | | Cequel Communications LLC, Term Loan B | | | 4.575% | | | | 1-Month LIBOR | | | | 2.250% | | | | 1/15/26 | | | | BB | | | | 2,875,433 | |
| | 3,009 | | | Charter Communications Operating Holdings LLC, Term Loan B | | | 4.330% | | | | 3-Month LIBOR | | | | 2.000% | | | | 4/30/25 | | | | BBB– | | | | 3,018,145 | |
| | 1,232 | | | Cineworld Group PLC, Term Loan B | | | 4.484% | | | | 1-Month LIBOR | | | | 2.250% | | | | 2/28/25 | | | | BB– | | | | 1,229,654 | |
| | 6,108 | | | Clear Channel Communications, Inc., Exit Term Loan, (DD1) | | | 6.579% | | | | 3-Month LIBOR | | | | 4.000% | | | | 5/01/26 | | | | BB– | | | | 6,161,608 | |
| | 1,486 | | | CSC Holdings LLC, Term Loan B | | | 4.825% | | | | 1-Month LIBOR | | | | 2.500% | | | | 1/25/26 | | | | BB | | | | 1,488,095 | |
| | 450 | | | CSC Holdings LLC, Refinancing Term Loan | | | 4.575% | | | | 1-Month LIBOR | | | | 2.250% | | | | 7/17/25 | | | | BB | | | | 449,437 | |
| | 1,589 | | | Cumulus Media, Inc., Exit Term Loan | | | 6.740% | | | | 1-Month LIBOR | | | | 4.500% | | | | 5/13/22 | | | | B | | | | 1,603,029 | |
| | 499 | | | EW Scripps, Term Loan B | | | 4.984% | | | | 1-Month LIBOR | | | | 2.750% | | | | 5/01/26 | | | | BB | | | | 500,309 | |
| | 415 | | | Gray Television, Inc., Term Loan B2 | | | 4.582% | | | | 3-Month LIBOR | | | | 2.250% | | | | 2/07/24 | | | | BB | | | | 415,803 | |
| | 914 | | | IMG Worldwide, Inc., Term Loan B | | | 4.990% | | | | 1-Month LIBOR | | | | 2.750% | | | | 5/18/25 | | | | B | | | | 892,782 | |
| | 2,042 | | | Intelsat Jackson Holdings, S.A., Term Loan B | | | 5.991% | | | | 1-Month LIBOR | | | | 3.750% | | | | 11/30/23 | | | | B1 | | | | 2,050,937 | |
| | 2,345 | | | McGraw-Hill Education Holdings LLC, Term Loan B | | | 6.234% | | | | 1-Month LIBOR | | | | 4.000% | | | | 5/02/22 | | | | B+ | | | | 2,249,109 | |
| | 965 | | | Meredith Corporation, Term Loan B1 | | | 4.984% | | | | 1-Month LIBOR | | | | 2.750% | | | | 1/31/25 | | | | BB | | | | 969,087 | |
| | 993 | | | Metro-Goldwyn-Mayer, Inc., Term Loan, First Lien | | | 4.740% | | | | 1-Month LIBOR | | | | 2.500% | | | | 7/03/25 | | | | BB | | | | 990,019 | |
| | 750 | | | Metro-Goldwyn-Mayer, Inc., Term Loan, Second Lien | | | 6.740% | | | | 1-Month LIBOR | | | | 4.500% | | | | 7/03/26 | | | | B2 | | | | 731,250 | |
| | 600 | | | Nexstar Broadcasting, Inc., Term Loan B, (WI/DD) | | | TBD | | | | TBD | | | | TBD | | | | TBD | | | | BB | | | | 600,876 | |
| | 256 | | | Nexstar Broadcasting, Inc., Term Loan B3 | | | 4.652% | | | | 1-Month LIBOR | | | | 2.250% | | | | 1/17/24 | | | | BB | | | | 255,002 | |
| | 1,284 | | | Nexstar Broadcasting, Inc., Term Loan B3 | | | 4.491% | | | | 1-Month LIBOR | | | | 2.250% | | | | 1/17/24 | | | | BB | | | | 1,280,082 | |
| | 842 | | | Sinclair Television Group, Term Loan B2 | | | 4.490% | | | | 1-Month LIBOR | | | | 2.250% | | | | 1/03/24 | | | | BB+ | | | | 842,411 | |
| | 1,065 | | | Springer Science & Business Media, Inc., Term Loan B13, First Lien | | | 5.734% | | | | 1-Month LIBOR | | | | 3.500% | | | | 8/15/22 | | | | B | | | | 1,068,050 | |
| | 517 | | | UPC Financing Partnership, Term Loan AR1, First Lien | | | 4.854% | | | | 1-Month LIBOR | | | | 2.500% | | | | 1/15/26 | | | | BB | | | | 517,044 | |
| | 1,897 | | | WideOpenWest Finance LLC, Term Loan B | | | 5.519% | | | | 1-Month LIBOR | | | | 3.250% | | | | 8/18/23 | | | | B | | | | 1,866,789 | |
| | 34,545 | | | Total Media | | | | | | | | | | | | | | | | | | | | | | | 34,196,566 | |
| | | | |
| | | | Multiline Retail – 1.0% (0.6% of Total Investments) | | | | | | | | | | |
| | | | | | | |
| | 1,584 | | | Belk, Inc., Term Loan B, First Lien | | | 7.285% | | | | 3-Month LIBOR | | | | 4.750% | | | | 12/12/22 | | | | B2 | | | | 1,290,023 | |
| | 864 | | | EG America LLC, Term Loan, First Lien | | | 6.330% | | | | 3-Month LIBOR | | | | 4.000% | | | | 2/07/25 | | | | B | | | | 857,046 | |
| | 449 | | | Hudson’s Bay Company, Term Loan B, First Lien | | | 5.638% | | | | 1-Month LIBOR | | | | 3.250% | | | | 9/30/22 | | | | BB | | | | 449,556 | |
| | 2,897 | | | Total Multiline Retail | | | | | | | | | | | | | | | | | | | | | | | 2,596,625 | |
| | | | |
| | | | Oil, Gas & Consumable Fuels – 2.9% (1.8% of Total Investments) | | | | | | | | | | |
| | | | | | | |
| | 1,080 | | | BCP Renaissance Parent, Term Loan B | | | 5.756% | | | | 3-Month LIBOR | | | | 3.500% | | | | 10/31/24 | | | | B+ | | | | 1,081,350 | |
| | 599 | | | California Resources Corporation, Term Loan | | | 12.616% | | | | 1-Month LIBOR | | | | 10.375% | | | | 12/31/21 | | | | B | | | | 602,931 | |
| | 2,130 | | | California Resources Corporation, Term Loan B | | | 6.991% | | | | 1-Month LIBOR | | | | 4.750% | | | | 12/31/22 | | | | B | | | | 2,036,812 | |
| | 1,546 | | | Fieldwood Energy LLC, Exit Term Loan | | | 7.506% | | | | 3-Month LIBOR | | | | 5.250% | | | | 4/11/22 | | | | B+ | | | | 1,427,756 | |
| | 1,678 | | | Fieldwood Energy LLC, Exit Term Loan, second Lien | | | 9.506% | | | | 3-Month LIBOR | | | | 7.250% | | | | 4/11/23 | | | | B+ | | | | 1,391,790 | |
| | 820 | | | Peabody Energy Corporation, Term Loan B | | | 4.984% | | | | 1-Month LIBOR | | | | 2.750% | | | | 3/31/25 | | | | BB | | | | 819,291 | |
| | 7,853 | | | Total Oil, Gas & Consumable Fuels | | | | | | | | | | | | | | | | | | | | | | | 7,359,930 | |
| | | | |
| | | | Personal Products – 1.4% (0.9% of Total Investments) | | | | | | | | | | |
| | | | | | | |
| | 1,807 | | | Coty, Inc., Term Loan A, (DD1) | | | 4.360% | | | | 1-Month LIBOR | | | | 2.000% | | | | 4/05/23 | | | | BB– | | | | 1,730,516 | |
| | 133 | | | Coty, Inc., Term Loan B | | | 4.610% | | | | 1-Month LIBOR | | | | 2.250% | | | | 4/07/25 | | | | BB– | | | | 128,526 | |
| | 2,173 | | | Revlon Consumer Products Corporation, Term Loan B, First Lien | | | 6.022% | | | | 3-Month LIBOR | | | | 3.500% | | | | 11/16/20 | | | | B3 | | | | 1,780,442 | |
| | 4,113 | | | Total Personal Products | | | | | | | | | | | | | | | | | | | | | | | 3,639,484 | |
| | | | |
| | | | Pharmaceuticals – 3.3% (2.0% of Total Investments) | | | | | | | | | | |
| | | | | | | |
| | 583 | | | Alphabet Holding Company, Inc., Initial Term Loan, First Lien | | | 5.734% | | | | 1-Month LIBOR | | | | 3.500% | | | | 9/26/24 | | | | B– | | | | 552,489 | |
| | 748 | | | Catalent Pharma Solutions, Inc., Dollar Term Loan B2 | | | 4.484% | | | | 1-Month LIBOR | | | | 2.250% | | | | 5/18/26 | | | | BB | | | | 752,804 | |
| | 2,342 | | | Concordia Healthcare Corp, Exit Term Loan | | | 7.825% | | | | 1-Month LIBOR | | | | 5.500% | | | | 9/06/24 | | | | B– | | | | 2,283,365 | |
35
| | |
| |
| NSL | | Nuveen Senior Income Fund(continued) |
| | Portfolio of Investments July 31, 2019 |
| | | | | | | | | | | | | | | | | | | | | | | | | | | | |
Principal
Amount (000) | | | Description (1) | | Coupon (2) | | | Reference
Rate (2) | | | Spread (2) | | | Maturity (3) | | | Ratings (4) | | | Value | |
| | | | |
| | | | Pharmaceuticals(continued) | | | | | | | | | | |
| | | | | | | |
| $ | 1,284 | | | Valeant Pharmaceuticals International, Inc., Term Loan B | | | 5.129% | | | | 1-Month LIBOR | | | | 2.750% | | | | 11/27/25 | | | | Ba2 | | | $ | 1,285,671 | |
| | 3,474 | | | Valeant Pharmaceuticals International, Inc., Term Loan, First Lien | | | 5.379% | | | | 1-Month LIBOR | | | | 3.000% | | | | 6/02/25 | | | | Ba2 | | | | 3,490,604 | |
| | 8,431 | | | Total Pharmaceuticals | | | | | | | | | | | | | | | | | | | | | | | 8,364,933 | |
| | | | |
| | | | Professional Services – 2.6% (1.6% of Total Investments) | | | | | | | | | | |
| | | | | | | |
| | 1,184 | | | Ceridian HCM Holding, Inc., Term Loan B | | | 5.234% | | | | 1-Month LIBOR | | | | 3.000% | | | | 4/30/25 | | | | B2 | | | | 1,192,481 | |
| | 750 | | | Dun & Bradstreet Corp., Initial Term Loan | | | 7.241% | | | | 1-Month LIBOR | | | | 5.000% | | | | 2/06/26 | | | | B2 | | | | 755,861 | |
| | 2,047 | | | Nielsen Finance LLC, Term Loan B4, (DD1) | | | 4.367% | | | | 1-Month LIBOR | | | | 2.000% | | | | 10/04/23 | | | | BBB– | | | | 2,046,306 | |
| | 718 | | | On Assignment, Inc., Term Loan B | | | 4.234% | | | | 1-Month LIBOR | | | | 2.000% | | | | 4/02/25 | | | | BB | | | | 719,861 | |
| | 2,341 | | | Skillsoft Corporation, Initial Term Loan, First Lien, (DD1) | | | 6.946% | | | | 6-Month LIBOR | | | | 4.750% | | | | 4/28/21 | | | | CCC+ | | | | 1,994,312 | |
| | 7,040 | | | Total Professional Services | | | | | | | | | | | | | | | | | | | | | | | 6,708,821 | |
| | | | |
| | | | Real Estate Management & Development – 1.6% (0.9% of Total Investments) | | | | | | | | | | |
| | | | | | | |
| | 1,419 | | | GGP, Initial Term Loan A2 | | | 4.484% | | | | 1-Month LIBOR | | | | 2.250% | | | | 8/28/23 | | | | BB+ | | | | 1,381,666 | |
| | 727 | | | Realogy Group LLC, Term Loan A | | | 4.522% | | | | 1-Month LIBOR | | | | 2.250% | | | | 2/08/23 | | | | Ba1 | | | | 709,307 | |
| | 981 | | | Realogy Group LLC, Term Loan B | | | 4.522% | | | | 1-Month LIBOR | | | | 2.250% | | | | 2/08/25 | | | | BB+ | | | | 937,277 | |
| | 969 | | | Trico Group, LLC, Initial Term Loan, First Lien | | | 9.330% | | | | 3-Month LIBOR | | | | 7.000% | | | | 2/02/24 | | | | B | | | | 936,281 | |
| | 4,096 | | | Total Real Estate Management & Development | | | | | | | | | | | | | | | | | | | | | | | 3,964,531 | |
| | | | |
| | | | Road & Rail – 3.0% (1.8% of Total Investments) | | | | | | | | | | |
| | | | | | | |
| | 3,250 | | | Avolon LLC, Term Loan B3 | | | 4.022% | | | | 1-Month LIBOR | | | | 1.750% | | | | 1/30/25 | | | | Baa2 | | | | 3,261,945 | |
| | 965 | | | Quality Distribution, Incremental Term Loan, First Lien | | | 7.830% | | | | 3-Month LIBOR | | | | 5.500% | | | | 8/18/22 | | | | B– | | | | 960,175 | |
| | 873 | | | Savage Enterprises LLC, Term Loan B | | | 6.880% | | | | 1-Month LIBOR | | | | 4.500% | | | | 8/01/25 | | | | B+ | | | | 877,049 | |
| | 2,479 | | | Uber Technologies, Inc., Term Loan | | | 6.325% | | | | 1-Month LIBOR | | | | 4.000% | | | | 4/04/25 | | | | B1 | | | | 2,491,995 | |
| | 7,567 | | | Total Road & Rail | | | | | | | | | | | | | | | | | | | | | | | 7,591,164 | |
| | | | |
| | | | Semiconductors & Semiconductor Equipment – 1.0% (0.6% of Total Investments) | | | | | | | | | | |
| | | | | | | |
| | 450 | | | Cabot Microelectronics, Term Loan B | | | 4.500% | | | | 1-Month LIBOR | | | | 2.250% | | | | 11/14/25 | | | | BB+ | | | | 452,241 | |
| | 296 | | | Lumileds, Term Loan B | | | 5.830% | | | | 3-Month LIBOR | | | | 3.500% | | | | 6/30/24 | | | | B+ | | | | 199,553 | |
| | 719 | | | Microchip Technology., Inc, Term Loan B | | | 4.240% | | | | 1-Month LIBOR | | | | 2.000% | | | | 5/29/25 | | | | Baa3 | | | | 719,513 | |
| | 1,070 | | | ON Semiconductor Corporation, Term Loan B3 | | | 3.984% | | | | 1-Month LIBOR | | | | 1.750% | | | | 3/31/23 | | | | Baa3 | | | | 1,069,697 | |
| | 2,535 | | | Total Semiconductors & Semiconductor Equipment | | | | | | | | | | | | | | | | | | | | | | | 2,441,004 | |
| | | | |
| | | | Software – 16.1% (9.8% of Total Investments) | | | | | | | | | | |
| | | | | | | |
| | 652 | | | Blackboard, Inc., Term Loan B4 | | | 7.300% | | | | 3-Month LIBOR | | | | 5.000% | | | | 6/30/21 | | | | B– | | | | 650,211 | |
| | 3,125 | | | BMC Software, Inc., Term Loan B | | | 6.580% | | | | 3-Month LIBOR | | | | 4.250% | | | | 10/02/25 | | | | B | | | | 3,012,420 | |
| | 1,000 | | | Compuware Corporation, Term Loan, First Lien | | | 6.234% | | | | 1-Month LIBOR | | | | 4.000% | | | | 8/22/25 | | | | B | | | | 1,004,859 | |
| | 1,500 | | | Datto, Inc., Term Loan | | | 6.580% | | | | 3-Month LIBOR | | | | 4.250% | | | | 4/02/26 | | | | B | | | | 1,515,000 | |
| | 898 | | | DiscoverOrg LLC, Term Loan B | | | 6.734% | | | | 1-Month LIBOR | | | | 4.500% | | | | 2/02/26 | | | | B | | | | 897,189 | |
| | 1,529 | | | Ellucian, Term Loan B, First Lien | | | 5.580% | | | | 3-Month LIBOR | | | | 3.250% | | | | 9/30/22 | | | | B | | | | 1,530,920 | |
| | 1,502 | | | Epicor Software Corporation, Term Loan B, (DD1) | | | 5.490% | | | | 1-Month LIBOR | | | | 3.250% | | | | 6/01/22 | | | | B2 | | | | 1,501,320 | |
| | 2,432 | | | Greeneden U.S. Holdings II LLC, Term Loan B | | | 5.484% | | | | 1-Month LIBOR | | | | 3.250% | | | | 12/01/23 | | | | B2 | | | | 2,423,692 | |
| | 5,263 | | | Infor (US), Inc., Term Loan B | | | 5.080% | | | | 3-Month LIBOR | | | | 2.750% | | | | 2/01/22 | | | | Ba3 | | | | 5,271,301 | |
| | 1,540 | | | Informatica, Term Loan B | | | 5.484% | | | | 1-Month LIBOR | | | | 3.250% | | | | 8/05/22 | | | | B1 | | | | 1,548,752 | |
| | 973 | | | Kronos Incorporated, Term Loan B | | | 5.579% | | | | 3-Month LIBOR | | | | 3.000% | | | | 11/01/23 | | | | B | | | | 974,831 | |
| | 437 | | | McAfee Holdings International, Inc., Term Loan, Second Lien | | | 10.741% | | | | 1-Month LIBOR | | | | 8.500% | | | | 9/29/25 | | | | B– | | | | 443,516 | |
| | 2,133 | | | McAfee LLC, Term Loan B | | | 5.991% | | | | 1-Month LIBOR | | | | 3.750% | | | | 9/30/24 | | | | B | | | | 2,135,808 | |
| | 617 | | | Micro Focus International PLC, New Term Loan | | | 4.734% | | | | 1-Month LIBOR | | | | 2.500% | | | | 6/21/24 | | | | BB– | | | | 613,008 | |
| | 4,164 | | | Micro Focus International PLC, Term Loan B | | | 4.734% | | | | 1-Month LIBOR | | | | 2.500% | | | | 6/21/24 | | | | BB– | | | | 4,139,795 | |
| | 2,614 | | | Micro Focus International PLC, Term Loan B2 | | | 4.484% | | | | 1-Month LIBOR | | | | 2.250% | | | | 11/19/21 | | | | BB– | | | | 2,613,584 | |
| | 929 | | | Misys, New Term Loan, Second Lien, (DD1) | | | 9.446% | | | | 1-Month LIBOR | | | | 7.250% | | | | 6/13/25 | | | | CCC+ | | | | 925,668 | |
| | 1,981 | | | Misys, New Term Loan, First Lien | | | 5.734% | | | | 1-Month LIBOR | | | | 3.500% | | | | 6/13/24 | | | | B | | | | 1,947,293 | |
| | 252 | | | Mitchell International, Inc., Initial Term Loan, First Lien | | | 5.484% | | | | 1-Month LIBOR | | | | 3.250% | | | | 11/29/24 | | | | B2 | | | | 239,786 | |
| | 300 | | | Mitchell International, Inc., Initial Term Loan, Second Lien | | | 9.484% | | | | 1-Month LIBOR | | | | 7.250% | | | | 12/01/25 | | | | CCC | | | | 282,750 | |
| | 700 | | | Perforce Software Inc., Term Loan, First Lien | | | 6.734% | | | | 1-Month LIBOR | | | | 4.500% | | | | 7/01/26 | | | | B2 | | | | 699,566 | |
| | 975 | | | RP Crown Parent LLC, Term Loan B | | | 4.984% | | | | 1-Month LIBOR | | | | 2.750% | | | | 10/15/23 | | | | B1 | | | | 974,756 | |
36
| | | | | | | | | | | | | | | | | | | | | | | | | | | | |
Principal
Amount (000) | | | Description (1) | | Coupon (2) | | | Reference
Rate (2) | | | Spread (2) | | | Maturity (3) | | | Ratings (4) | | | Value | |
| | | | |
| | | | Software(continued) | | | | | | | | | | |
| | | | | | | |
| $ | 2,034 | | | SS&C Technologies, Inc./ Sunshine Acquisition II, Inc., Term Loan B3 | | | 4.484% | | | | 1-Month LIBOR | | | | 2.250% | | | | 4/16/25 | | | | BB+ | | | $ | 2,036,607 | |
| | 1,385 | | | SS&C Technologies, Inc./ Sunshine Acquisition II, Inc., Term Loan B4 | | | 4.484% | | | | 1-Month LIBOR | | | | 2.250% | | | | 4/16/25 | | | | BB | | | | 1,386,598 | |
| | 1,805 | | | TIBCO Software, Inc., Term Loan B | | | 6.390% | | | | 1-Month LIBOR | | | | 4.000% | | | | 6/30/26 | | | | B1 | | | | 1,810,317 | |
| | 500 | | | Ultimate Software, Term Loan, First Lien | | | 6.080% | | | | 3-Month LIBOR | | | | 3.750% | | | | 5/04/26 | | | | B | | | | 504,648 | |
| | 41,240 | | | Total Software | | | | | | | | | | | | | | | | | | | | | | | 41,084,195 | |
| | | | |
| | | | Specialty Retail – 2.6% (1.6% of Total Investments) | | | | | | | | | | |
| | | | | | | |
| | 1,134 | | | Academy, Ltd., Term Loan B | | | 6.402% | | | | 1-Month LIBOR | | | | 4.000% | | | | 7/01/22 | | | | CCC+ | | | | 802,090 | |
| | 295 | | | Neiman Marcus Group Inc., The Cash Pay Extended | | | 8.380% | | | | 1-Month LIBOR | | | | 6.000% | | | | 10/25/23 | | | | CCC+ | | | | 254,066 | |
| | 1,455 | | | Petco Animal Supplies, Inc., Term Loan B1 | | | 5.506% | | | | 3-Month LIBOR | | | | 3.250% | | | | 1/26/23 | | | | B2 | | | | 1,133,468 | |
| | 3,175 | | | Petsmart Inc., Term Loan B, First Lien, (DD1) | | | 6.380% | | | | 1-Month LIBOR | | | | 4.000% | | | | 3/11/22 | | | | B | | | | 3,123,005 | |
| | 1,212 | | | Petsmart Inc., Term Loan B, (DD1) | | | 5.380% | | | | 1-Month LIBOR | | | | 3.000% | | | | 3/11/22 | | | | B2 | | | | 1,167,604 | |
| | 470 | | | Serta Simmons Holdings LLC, Term Loan, Second Lien | | | 10.314% | | | | 1-Month LIBOR | | | | 8.000% | | | | 11/08/24 | | | | CCC– | | | | 218,402 | |
| | 7,741 | | | Total Specialty Retail | | | | | | | | | | | | | | | | | | | | | | | 6,698,635 | |
| | | | |
| | | | Technology Hardware, Storage & Peripherals – 5.1% (3.1% of Total Investments) | | | | | | | | | | |
| | | | | | | |
| | 7,692 | | | Dell International LLC, Refinancing Term Loan B | | | 4.240% | | | | 1-Month LIBOR | | | | 2.000% | | | | 9/07/23 | | | | BBB– | | | | 7,721,411 | |
| | 5,219 | | | Western Digital, Term Loan B | | | 4.012% | | | | 1-Month LIBOR | | | | 1.750% | | | | 4/29/23 | | | | Baa2 | | | | 5,188,932 | |
| | 12,911 | | | Total Technology Hardware, Storage & Peripherals | | | | | | | | | | | | | | | | | | | | | | | 12,910,343 | |
| | | | |
| | | | Transportation Infrastructure – 0.8% (0.4% of Total Investments) | | | | | | | | | | |
| | | | | | | |
| | 498 | | | Atlantic Aviation FBO Inc., Term Loan | | | 5.990% | | | | 1-Month LIBOR | | | | 3.750% | | | | 12/06/25 | | | | BB | | | | 504,341 | |
| | 741 | | | Ceva Group PLC, Term Loan B | | | 7.330% | | | | 3-Month LIBOR | | | | 5.000% | | | | 8/04/25 | | | | B1 | | | | 652,781 | |
| | 262 | | | Standard Aero, Canadien Term Loan | | | 6.330% | | | | 3-Month LIBOR | | | | 4.000% | | | | 4/06/26 | | | | B | | | | 264,205 | |
| | 488 | | | Standard Aero, USD Term Loan B | | | 6.330% | | | | 3-Month LIBOR | | | | 4.000% | | | | 4/06/26 | | | | B | | | | 491,420 | |
| | 1,989 | | | Total Transportation Infrastructure | | | | | | | | | | | | | | | | | | | | | | | 1,912,747 | |
| | | | |
| | | | Wireless Telecommunication Services – 3.1% (1.9% of Total Investments) | | | | | | | | | | |
| | | | | | | |
| | 721 | | | Asurion LLC, Term Loan B4 | | | 5.234% | | | | 1-Month LIBOR | | | | 3.000% | | | | 8/04/22 | | | | Ba3 | | | | 722,721 | |
| | 1,693 | | | Sprint Corporation, Incremental Term Loan | | | 5.250% | | | | 1-Month LIBOR | | | | 3.000% | | | | 2/02/24 | | | | Ba2 | | | | 1,694,067 | |
| | 5,376 | | | Sprint Corporation, Term Loan, First Lien | | | 4.750% | | | | 1-Month LIBOR | | | | 2.500% | | | | 2/02/24 | | | | Ba2 | | | | 5,371,546 | |
| | 7,790 | | | Total Wireless Telecommunication Services | | | | | | | | | | | | | | | | | | | | | | | 7,788,334 | |
| $ | 384,905 | | | Total Variable Rate Senior Loan Interests (cost $381,164,808) | | | | | | | | | | | | | | | | | | | | 374,654,719 | |
| | | | | | | |
Principal
Amount (000) | | | Description (1) | | | | | | | | Coupon | | | Maturity | | | Ratings (4) | | | Value | |
| | | | |
| | | | CORPORATE BONDS – 8.9% (5.4% of Total Investments) | | | | | | | | | | | | | |
| | | | |
| | | | Communications Equipment – 3.1% (1.9% of Total Investments) | | | | | | | | | | |
| | | | | | | |
| $ | 115 | | | Avaya Inc, 144A, (5), (7) | | | | | | | | | | | 7.000% | | | | 4/01/19 | | | | N/R | | | $ | — | |
| | 2,895 | | | Avaya Inc, 144A, (5), (7) | | | | | | | | | | | 10.500% | | | | 3/01/21 | | | | N/R | | | | — | |
| | 3,995 | | | Intelsat Jackson Holdings SA | | | | | | | | | | | 5.500% | | | | 8/01/23 | | | | CCC+ | | | | 3,680,394 | |
| | 4,050 | | | Intelsat Jackson Holdings SA, 144A | | | | | | | | | | | 9.750% | | | | 7/15/25 | | | | CCC+ | | | | 4,191,750 | |
| | 11,055 | | | Total Communications Equipment | | | | | | | | | | | | | | | | | | | | | | | 7,872,144 | |
| | | | |
| | | | Containers & Packaging – 0.9% (0.6% of Total Investments) | | | | | | | | | | |
| | | | | | | |
| | 2,277 | | | Reynolds Group Issuer Inc | | | | | | | | | | | 5.750% | | | | 10/15/20 | | | | B+ | | | | 2,285,670 | |
| | | | |
| | | | Diversified Telecommunication Services – 0.2% (0.1% of Total Investments) | | | | | | | | | | |
| | | | | | | |
| | 535 | | | Consolidated Communications Inc | | | | | | | | | | | 6.500% | | | | 10/01/22 | | | | B3 | | | | 485,040 | |
| | | | |
| | | | Health Care Providers & Services – 0.2% (0.1% of Total Investments) | | | | | | | | | | |
| | | | | | | |
| | 350 | | | Tenet Healthcare Corp | | | | | | | | | | | 6.000% | | | | 10/01/20 | | | | BB | | | | 360,062 | |
| | 60 | | | Tenet Healthcare Corp | | | | | | | | | | | 8.125% | | | | 4/01/22 | | | | B– | | | | 64,050 | |
| | 90 | | | Tenet Healthcare Corp, 144A | | | | | | | | | | | 6.250% | | | | 2/01/27 | | | | Ba3 | | | | 93,150 | |
| | 500 | | | Total Health Care Providers & Services | | | | | | | | | | | | | | | | | | | | | | | 517,262 | |
37
| | |
| |
| NSL | | Nuveen Senior Income Fund(continued) |
| | Portfolio of Investments July 31, 2019 |
| | | | | | | | | | | | | | | | | | | | | | | | | | | | |
Principal
Amount (000) | | | Description (1) | | | | | | | | Coupon | | | Maturity | | | Ratings (4) | | | Value | |
| | | | |
| | | | Hotels, Restaurants & Leisure – 0.4% (0.3% of Total Investments) | | | | | | | | | | |
| | | | | | | |
| $ | 1,065 | | | Scientific Games International Inc | | | | | | | | | | | 10.000% | | | | 12/01/22 | | | | B– | | | $ | 1,110,284 | |
| | | | |
| | | | Media – 2.5% (1.5% of Total Investments) | | | | | | | | | | |
| | | | | | | |
| | 2,070 | | | AMC Entertainment Holdings Inc | | | | | | | | | | | 6.125% | | | | 5/15/27 | | | | B3 | | | | 1,853,944 | |
| | 100 | | | Charter Communications Operating LLC | | | | | | | | | | | 3.579% | | | | 7/23/20 | | | | BBB– | | | | 100,789 | |
| | 500 | | | Clear Channel Worldwide Holdings Inc, 144A | | | | | | | | | | | 9.250% | | | | 2/15/24 | | | | CCC+ | | | | 542,500 | |
| | 347 | | | DISH DBS Corp | | | | | | | | | | | 5.125% | | | | 5/01/20 | | | | BB– | | | | 350,904 | |
| | 2,122 | | | iHeartCommunications Inc, (5), (7) | | | | | | | | | | | 9.000% | | | | 12/15/19 | | | | N/R | | | | — | |
| | 1,524 | | | iHeartCommunications Inc, 144A, (5), (7) | | | | | | | | | | | 11.250% | | | | 3/01/21 | | | | N/R | | | | — | |
| | 2,430 | | | iHeartCommunications Inc, (5), (7) | | | | | | | | | | | 9.000% | | | | 3/01/21 | | | | N/R | | | | — | |
| | 9,172 | | | iHeartCommunications Inc, (5), (7) | | | | | | | | | | | 12.000% | | | | 8/01/21 | | | | N/R | | | | — | |
| | 2,874 | | | iHeartCommunications Inc | | | | | | | | | | | 8.375% | | | | 5/01/27 | | | | B– | | | | 3,024,535 | |
| | 595 | | | Intelsat Luxembourg SA | | | | | | | | | | | 8.125% | | | | 6/01/23 | | | | CCC– | | | | 480,284 | |
| | 21,734 | | | Total Media | | | | | | | | | | | | | | | | | | | | | | | 6,352,956 | |
| | | | |
| | | | Oil, Gas & Consumable Fuels – 0.3% (0.2% of Total Investments) | | | | | | | | | | |
| | | | | | | |
| | 794 | | | Denbury Resources Inc, 144A | | | | | | | | | | | 9.250% | | | | 3/31/22 | | | | B | | | | 696,735 | |
| | 140 | | | Denbury Resources Inc, 144A | | | | | | | | | | | 7.750% | | | | 2/15/24 | | | | B | | | | 102,550 | |
| | 934 | | | Total Oil, Gas & Consumable Fuels | | | | | | | | | | | | | | | | | | | | | | | 799,285 | |
| | | | |
| | | | Pharmaceuticals – 0.2% (0.1% of Total Investments) | | | | | | | | | | |
| | | | | | | |
| | 437 | | | Advanz Pharma Corp | | | | | | | | | | | 8.000% | | | | 9/06/24 | | | | B– | | | | 429,353 | |
| | | | |
| | | | Semiconductors & Semiconductor Equipment – 0.4% (0.2% of Total Investments) | | | | | | | | | | |
| | | | | | | |
| | 761 | | | Advanced Micro Devices Inc | | | | | | | | | | | 7.500% | | | | 8/15/22 | | | | BB– | | | | 860,881 | |
| | | | |
| | | | Wireless Telecommunication Services – 0.7% (0.4% of Total Investments) | | | | | | | | | | |
| | | | | | | |
| | 800 | | | Intelsat Connect Finance SA, 144A | | | | | | | | | | | 9.500% | | | | 2/15/23 | | | | CCC– | | | | 717,760 | |
| | 70 | | | Sprint Corp | | | | | | | | | | | 7.875% | | | | 9/15/23 | | | | B+ | | | | 77,787 | |
| | 955 | | | Sprint Corp | | | | | | | | | | | 7.125% | | | | 6/15/24 | | | | B+ | | | | 1,042,144 | |
| | 1,825 | | | Total Wireless Telecommunication Services | | | | | | | | | | | | | | | | | | | | | | | 1,837,691 | |
| $ | 41,123 | | | Total Corporate Bonds (cost $22,101,859) | | | | | | | | | | | | | | | | | | | | | | | 22,550,566 | |
| | | | | | | |
| Shares | | | Description (1) | | | | | | | | | | | | | | | | | Value | |
| | | | |
| | | | COMMON STOCKS – 3.0% (1.7% of Total Investments) | | | | | | | | | | | | | |
| | | | |
| | | | Diversified Consumer Services – 0.1% (0.0% of Total Investments) | | | | | | | | | | |
| | | | | | | |
| | 12,578 | | | Cengage Learning Holdings II Inc, (8), (9) | | | | | | | | | | | | | | | | | | | | | | $ | 156,848 | |
| | | | |
| | | | Energy Equipment & Services – 0.3% (0.2% of Total Investments) | | | | | | | | | | |
| | | | | | | |
| | 40,007 | | | Transocean Ltd | | | | | | | | | | | | | | | | | | | | | | | 243,243 | |
| | 1,961 | | | Vantage Drilling International, (8), (9) | | | | | | | | | | | | | | | | | | | | | | | 462,796 | |
| | | | Total Energy Equipment & Services | | | | | | | | | | | | | | | | | | | | | | | 706,039 | |
| | | | |
| | | | Health Care Providers & Services – 0.0% (0.0% of Total Investments) | | | | | | | | | | |
| | | | | | | |
| | 38,382 | | | Millennium Health LLC, (8), (9) | | | | | | | | | | | | | | | | | | | | | | | 384 | |
| | 35,750 | | | Millennium Health LLC, (7), (9) | | | | | | | | | | | | | | | | | | | | | | | 39,312 | |
| | 33,563 | | | Millennium Health LLC, (7), (9) | | | | | | | | | | | | | | | | | | | | | | | 33,549 | |
| | | | Total Health Care Providers & Services | | | | | | | | | | | | | | | | | | | | | | | 73,245 | |
| | | | |
| | | | Internet & Direct Marketing Retail – 0.0% (0.0% of Total Investments) | | | | | | | | | | |
| | | | | | | |
| | 5,388 | | | Catalina Marketing Corp, (8), (9) | | | | | | | | | | | | | | | | | | | | | | | 26,940 | |
| | | | |
| | | | Marine – 0.0% (0.0% of Total Investments) | | | | | | | | | | |
| | | | | | | |
| | 2,409 | | | HGIM Corp, (8), (9) | | | | | | | | | | | | | | | | | | | | | | | 33,726 | |
| | | | |
| | | | Media – 2.0% (1.2% of Total Investments) | | | | | | | | | | |
| | | | | | | |
| | 363,854 | | | Clear Channel Outdoor Holdings Inc, (9) | | | | | | | | | | | | | | | | | | | | | | | 1,102,478 | |
| | 45,105 | | | Cumulus Media Inc | | | | | | | | | | | | | | | | | | | | | | | 681,536 | |
| | 775,233 | | | Hibu plc, (8), (9) | | | | | | | | | | | | | | | | | | | | | | | 157,372 | |
38
| | | | | | | | | | | | | | | | | | | | | | | | | | | | |
| | | | | | | |
| Shares | | | Description (1) | | | | | | | | | | | | | | | | | Value | |
| | | | |
| | | | Media(continued) | | | | | | | | | | |
| | | | | | | |
| | 182,131 | | | iHeartMedia Inc, (9) | | | | | | | | | | | | | | | | | | | | | | $ | 2,724,680 | |
| | 6,268 | | | Metro-Goldwyn-Mayer Inc, (8) | | | | | | | | | | | | | | | | | | | | | | | 414,208 | |
| | 14,825 | | | Tribune Co, (7) | | | | | | | | | | | | | | | | | | | | | | | 8,154 | |
| | | | Total Media | | | | | | | | | | | | | | | | | | | | | | | 5,088,428 | |
| | | | |
| | | | Pharmaceuticals – 0.1% (0.0% of Total Investments) | | | | | | | | | | |
| | | | | | | |
| | 11,895 | | | Advanz Pharma Corp, (9) | | | | | | | | | | | | | | | | | | | | | | | 158,441 | |
| | | | |
| | | | Software – 0.5% (0.3% of Total Investments) | | | | | | | | | | |
| | | | | | | |
| | 111,207 | | | Avaya Holdings Corp, (9) | | | | | | | | | | | | | | | | | | | | | | | 1,338,932 | |
| | | | |
| | | | Specialty Retail – 0.0% (0.0% of Total Investments) | | | | | | | | | | |
| | | | | | | |
| | 5,454 | | | Gymboree Holding Corp, (8) | | | | | | | | | | | | | | | | | | | | | | | 2,727 | |
| | 14,849 | | | Gymboree Holding Corp, (8) | | | | | | | | | | | | | | | | | | | | | | | 7,425 | |
| | | | Total Specialty Retail | | | | | | | | | | | | | | | | | | | | | | | 10,152 | |
| | | | Total Common Stocks (cost $15,379,343) | | | | | | | | | | | | | | | | | | | | | | | 7,592,751 | |
| | | | | | | |
| Shares | | | Description (1) | | | | | | | | | | | | | | | | | Value | |
| | | | |
| | | | COMMON STOCK RIGHTS – 0.1% (0.1% of Total Investments) | | | | | | | | | | | | | |
| | | | |
| | | | Oil, Gas & Consumable Fuels – 0.1% (0.1% of Total Investments) | | | | | | | | | | |
| | | | | | | |
| | 1,425 | | | Fieldwood Energy LLC, (8), (9) | | | | | | | | | | | | | | | | | | | | | | $ | 42,394 | |
| | 7,052 | | | Fieldwood Energy LLC, (8), (9) | | | | | | | | | | | | | | | | | | | | | | | 209,797 | |
| | | | Total Common Stock Rights (cost $201,310) | | | | | | | | | | | | | | | | | | | | | | | 252,191 | |
| | | | | | | |
Principal
Amount (000) | | | Description (1) | | | | | | | | Coupon | | | Maturity | | | Ratings (4) | | | Value | |
| | | | |
| | | | CONVERTIBLE BONDS – 0.0% (0.0% of Total Investments) | | | | | | | | | | | | | |
| | | | |
| | | | Oil, Gas & Consumable Fuels – 0.0% (0.0% of Total Investments) | | | | | | | | | | |
| | | | | | | |
| $ | 100 | | | Denbury Resources Inc, 144A | | | | | | | | | | | 6.375% | | | | 12/31/24 | | | | B | | | $ | 60,778 | |
| $ | 100 | | | Total Convertible Bonds (cost $67,717) | | | | | | | | | | | | | | | | | | | | | | | 60,778 | |
| | | | | | | |
| Shares | | | Description (1) | | | | | | | | | | | | | | | | | Value | |
| | | | |
| | | | WARRANTS – 0.1% (0.1% of Total Investments) | | | | | | | | | | | | | |
| | | | |
| | | | Marine – 0.1% (0.1% of Total Investments) | | | | | | | | | | |
| | | | | | | |
| | 10,768 | | | HGIM Corp, (8) | | | | | | | | | | | | | | | | | | | | | | $ | 150,752 | |
| | | | |
| | | | Software – 0.0% (0.0% of Total Investments) | | | | | | | | | | |
| | | | | | | |
| | 11,806 | | | Avaya Holdings Corp, (8) | | | | | | | | | | | | | | | | | | | | | | | 8,855 | |
| | | | Total Warrants (cost $1,534,541) | | | | | | | | | | | | | | | | | | | | | | | 159,607 | |
| | | | Total Long-Term Investments (cost $420,449,578) | | | | | | | | | | | | | | | | | | | | 405,270,612 | |
| | | | | | | |
| Shares | | | Description (1) | | | | | | | | Coupon | | | | | | | | | Value | |
| | | | |
| | | | SHORT-TERM INVESTMENTS – 5.3% (3.2% of Total Investments) | | | | | | | | | | | | | |
| | | | |
| | | | INVESTMENT COMPANIES – 5.3% (3.2% of Total Investments) | | | | | | | | | | |
| | | | | | | |
| | 13,492,573 | | | BlackRock Liquidity FundsT-Fund Portfolio, (10) | | | | | | | | | | | 2.254% (11) | | | | | | | | | | | $ | 13,492,573 | |
| | | | Total Short-Term Investments (cost $13,492,573) | | | | | | | | | | | | 13,492,573 | |
| | | | Total Investments (cost $433,942,151) – 164.6% | | | | | | | | | | | | 418,763,185 | |
| | | | Borrowings – (44.8)% (12), (13) | | | | | | | | | | | | (114,000,000 | ) |
| | | | Term Preferred Shares, net of deferred offering costs – (16.7)% (14) | | | | | | | | | | | | (42,585,413 | ) |
| | | | Other Assets Less Liabilities – (3.1)% (15) | | | | | | | | | | | | (7,690,308 | ) |
| | | | Net Assets Applicable to Common Shares – 100% | | | | | | | | | | | $ | 254,487,464 | |
39
| | |
| |
| NSL | | Nuveen Senior Income Fund(continued) |
| | Portfolio of Investments July 31, 2019 |
Investment in Derivatives
Interest Rate Swaps – OTC Uncleared
| | | | | | | | | | | | | | | | | | | | | | | | | | | | | | | | |
| Counterparty | | Notional
Amount | | | Fund
Pay/Receive
Floating Rate | | | Floating Rate Index | | | Fixed Rate
(Annualized) | | | Fixed Rate
Payment
Frequency | | | Maturity
Date | | | Value | | | Unrealized
Appreciation
(Depreciation) | |
Morgan Stanley Capital Services LLC | | $ | 43,000,000 | | | | Pay | | | | 1-Month LIBOR | | | | 2.000 | %(16) | | | Monthly | | | | 11/01/21 | (17) | | $ | (167,345 | ) | | $ | (167,345 | ) |
For Fund portfolio compliance purposes, the Fund’s industry classifications refer to any one or more of the industrysub-classifications used by one or more widely recognized market indexes or ratings group indexes, and/or as defined by Fund management. This definition may not apply for purposes of this report, which may combine industrysub-classifications into sectors for reporting ease.
| (1) | All percentages shown in the Portfolio of Investments are based on net assets applicable to common shares unless otherwise noted. |
| (2) | Senior loans generally pay interest at rates which are periodically adjusted by reference to a base short-term, floating lending rate (Reference Rate) plus an assigned fixed rate (Spread). These floating lending rates are generally (i) the lending rate referenced by the London Inter-Bank Offered Rate (“LIBOR”), or (ii) the prime rate offered by one or more major United States banks. Senior loans may be considered restricted in that the Fund ordinarily is contractually obligated to receive approval from the agent bank and/or borrower prior to the disposition of a senior loan. The rate shown is the coupon as of the end of the reporting period. |
| (3) | Senior loans generally are subject to mandatory and/or optional prepayment. Because of these mandatory prepayment conditions and because there may be significant economic incentives for a borrower to prepay, prepayments of senior loans may occur. As a result, the actual remaining maturity of senior loans held may be substantially less than the stated maturities shown. |
| (4) | For financial reporting purposes, the ratings disclosed are the highest of Standard & Poor’s Group (“Standard & Poor’s”), Moody’s Investors Service, Inc. (“Moody’s”) or Fitch, Inc. (“Fitch”) rating. This treatment of split-rated securities may differ from that used for other purposes, such as for Fund investment policies. Ratings below BBB by Standard & Poor’s, Baa by Moody’s or BBB by Fitch are considered to be below investment grade. Holdings designated N/R are not rated by any of these national rating agencies. Ratings are not covered by the report of independent registered public accounting firm. |
| (5) | Defaulted security. A security whose issuer has failed to fully pay principal and/or interest when due, or is under the protection of bankruptcy. |
| (6) | Investment, or portion of investment, represents an outstanding unfunded senior loan commitment. See Notes to Financial Statements, Note 8 – Senior Loan Commitments for more information. |
| (7) | Investment valued at fair value using methods determined in good faith by, or at the discretion of, the Board. For fair value measurement disclosure purposes, investment classified as Level 3. See Notes to Financial Statements, Note 2 – Investment Valuation and Fair Value Measurements for more information. |
| (8) | For fair value measurement disclosure purposes, investment classified as Level 2. See Notes to Financial Statements, Note 2 – Investment Valuation and Fair Value Measurements for more information. |
| (9) | Non-income producing; issuer has not declared a dividend within the past twelve months. |
| (10) | A copy of the most recent financial statements for these investment companies can be obtained directly from the Securities and Exchange Commission on its website at http://www.sec.gov. |
| (11) | The rate shown is the annualizedseven-day subsidized yield as of the end of the reporting period. |
| (12) | Borrowings as a percentage of Total Investments is 27.2%. |
| (13) | The Fund segregates 100% of its eligible investments (excluding any investments separately pledged as collateral for specific investments in derivatives, when applicable) in the Portfolio of Investments as collateral for borrowings. |
| (14) | Term Preferred Shares, net of deferred offering costs as a percentage of Total Investments is 10.2%. |
| (15) | Other assets less liabilities includes the unrealized appreciation (depreciation) of certainover-the counter (“OTC”) derivatives as presented on the Statement of Assets and Liabilities, when applicable. The unrealized appreciation (depreciation) of OTC cleared and exchange-traded derivatives is recognized as part of cash collateral at brokers and/or the receivable or payable for variation margin as presented on the Statement of Assets and Liabilities, when applicable. |
| (16) | Effective November 1, 2019, the fixed rate paid by the Fund will increase according to a predetermined schedule as specified in the swap contract. Additionally, this fixed rate increase will continue to occur every twelve months on specific dates through the swap contract’s termination date. |
| (17) | This interest rate swap has an optional early termination date beginning on November 1, 2018 and monthly thereafter through the termination date as specified in the swap contract. |
| 144A | Investment is exempt from registration under Rule 144A of the Securities Act of 1933, as amended. These investments may only be resold in transactions exempt from registration, which are normally those transactions with qualified institutional buyers. |
| DD1 | Portion of investment purchased on a delayed delivery basis. |
| LIBOR | London Inter-Bank Offered Rate |
| PIK | Payment-in-kind (“PIK”) security. Depending on the terms of the security, income may be received in the form of cash, securities, or a combination of both. The PIK rate shown, where applicable, represents the annualized rate of the last PIK payment made by the issuer as of the end of the reporting period. |
| TBD | Senior loan purchased on a when-issued or delayed-delivery basis. Certain details associated with this purchase are not known prior to the settlement date of the transaction. In addition, senior loans typically trade without accrued interest and therefore a coupon rate is not available prior to settlement. At settlement, if still unknown, the borrower or counterparty will provide the Fund with the final coupon rate and maturity date. |
| WI/DD | Purchased on a when-issued or delayed delivery basis. |
See accompanying notes to financial statements.
40
| | |
| JFR | | Nuveen Floating Rate Income Fund Portfolio of Investments July 31, 2019 |
| | | | | | | | | | | | | | | | | | | | | | | | | | | | |
Principal
Amount (000) | | | Description (1) | | Coupon (2) | | | Reference
Rate (2) | | | Spread (2) | | | Maturity (3) | | | Ratings (4) | | | Value | |
| |
| | | | LONG-TERM INVESTMENTS – 156.8% (95.7% of Total Investments) | |
| |
| | | | VARIABLE RATE SENIOR LOAN INTERESTS – 141.5% (86.4% of Total Investments) (2) | |
| |
| | | | Aerospace & Defense – 2.5% (1.5% of Total Investments) | |
| | | | | | | |
| $ | 2,000 | | | MacDonald, Dettwiler and Associates, Ltd., Term Loan B | | | 4.990% | | | | 1-Month LIBOR | | | | 2.750% | | | | 10/04/24 | | | | BB | | | $ | 1,817,910 | |
| | 693 | | | Rexnord LLC/ RBS Global, Inc., Term Loan, First Lien | | | 4.234% | | | | 1-Month LIBOR | | | | 2.000% | | | | 8/21/24 | | | | BBB– | | | | 697,492 | |
| | 5,932 | | | Sequa Corporation, Term Loan B | | | 7.560% | | | | 3-Month LIBOR | | | | 5.000% | | | | 11/28/21 | | | | B– | | | | 5,867,632 | |
| | 2,134 | | | Sequa Corporation, Term Loan, Second Lien | | | 11.266% | | | | 3-Month LIBOR | | | | 9.000% | | | | 4/28/22 | | | | Caa2 | | | | 2,079,334 | |
| | 2,878 | | | Transdigm, Inc., Term Loan E | | | 4.830% | | | | 3-Month LIBOR | | | | 2.500% | | | | 5/30/25 | | | | Ba3 | | | | 2,859,036 | |
| | 970 | | | Transdigm, Inc., Term Loan F | | | 4.830% | | | | 3-Month LIBOR | | | | 2.500% | | | | 6/09/23 | | | | Ba3 | | | | 966,909 | |
| | 1,297 | | | Transdigm, Inc., Term Loan G, First Lien | | | 4.830% | | | | 3-Month LIBOR | | | | 2.500% | | | | 8/22/24 | | | | Ba3 | | | | 1,287,503 | |
| | 15,904 | | | Total Aerospace & Defense | | | | | | | | | | | | | | | | | | | | | | | 15,575,816 | |
| |
| | | | Air Freight & Logistics – 0.6% (0.4% of Total Investments) | |
| | | | | | | |
| | 1,583 | | | PAE Holding Corporation, Term Loan B | | | 7.830% | | | | 3-Month LIBOR | | | | 5.500% | | | | 10/20/22 | | | | B+ | | | | 1,589,167 | |
| | 2,166 | | | XPO Logistics, Inc., Term Loan B | | | 4.234% | | | | 1-Month LIBOR | | | | 2.000% | | | | 2/24/25 | | | | BBB– | | | | 2,172,671 | |
| | 3,749 | | | Total Air Freight & Logistics | | | | | | | | | | | | | | | | | | | | | | | 3,761,838 | |
| |
| | | | Airlines – 2.1% (1.3% of Total Investments) | |
| | | | | | | |
| | 1,416 | | | American Airlines, Inc., Replacement Term Loan | | | 4.379% | | | | 1-Month LIBOR | | | | 2.000% | | | | 10/10/21 | | | | BB+ | | | | 1,416,593 | |
| | 1,900 | | | American Airlines, Inc., Term Loan 2025 | | | 4.061% | | | | 3-Month LIBOR | | | | 1.750% | | | | 6/27/25 | | | | BB+ | | | | 1,865,758 | |
| | 2,640 | | | American Airlines, Inc., Term Loan B, (WI/DD) | | | TBD | | | | TBD | | | | TBD | | | | TBD | | | | BB+ | | | | 2,634,390 | |
| | 7,534 | | | American Airlines, Inc., Term Loan B | | | 4.325% | | | | 1-Month LIBOR | | | | 2.000% | | | | 12/14/23 | | | | BB+ | | | | 7,509,754 | |
| | 13,490 | | | Total Airlines | | | | | | | | | | | | | | | | | | | | | | | 13,426,495 | |
| |
| | | | Auto Components – 1.1% (0.7% of Total Investments) | |
| | | | | | | |
| | 1,404 | | | DexKo Global, Inc., Term Loan B | | | 5.734% | | | | 1-Month LIBOR | | | | 3.500% | | | | 7/24/24 | | | | B1 | | | | 1,400,363 | |
| | 3,500 | | | Johnson Controls Inc., Term Loan B | | | 5.734% | | | | 1-Month LIBOR | | | | 3.500% | | | | 4/30/26 | | | | Ba3 | | | | 3,505,477 | |
| | 1,949 | | | Superior Industries International, Inc., Term Loan B | | | 6.234% | | | | 1-Month LIBOR | | | | 4.000% | | | | 5/22/24 | | | | B1 | | | | 1,860,875 | |
| | 6,853 | | | Total Auto Components | | | | | | | | | | | | | | | | | | | | | | | 6,766,715 | |
| |
| | | | Automobiles – 0.4% (0.2% of Total Investments) | |
| | | | | | | |
| | 1,000 | | | Caliber Collision, Term Loan B | | | 5.860% | | | | 1-Month LIBOR | | | | 3.500% | | | | 2/05/26 | | | | B1 | | | | 1,007,500 | |
| | 1,478 | | | Navistar, Inc., Term Loan B | | | 5.830% | | | | 1-Month LIBOR | | | | 3.500% | | | | 11/06/24 | | | | Ba2 | | | | 1,483,971 | |
| | 2,478 | | | Total Automobiles | | | | | | | | | | | | | | | | | | | | | | | 2,491,471 | |
| |
| | | | Beverages – 0.6% (0.4% of Total Investments) | |
| | | | | | | |
| | 3,576 | | | Jacobs Douwe Egberts, Term Loan B | | | 4.438% | | | | 1-Month LIBOR | | | | 2.000% | | | | 11/01/25 | | | | Ba2 | | | | 3,584,476 | |
| |
| | | | Biotechnology – 0.9% (0.5% of Total Investments) | |
| | | | | | | |
| | 5,376 | | | Grifols, Inc., Term Loan B | | | 4.599% | | | | 1-Week LIBOR | | | | 2.250% | | | | 1/31/25 | | | | BB | | | | 5,399,798 | |
| |
| | | | Building Products – 2.0% (1.2% of Total Investments) | |
| | | | | | | |
| | 1,988 | | | ACProducts, Inc., Term Loan, First Lien | | | 7.734% | | | | 1-Month LIBOR | | | | 5.500% | | | | 2/15/24 | | | | B+ | | | | 1,898,063 | |
| | 563 | | | Fairmount, Initial Term Loan | | | 6.313% | | | | 3-Month LIBOR | | | | 4.000% | | | | 6/01/25 | | | | BB– | | | | 481,432 | |
| | 646 | | | Ply Gem Industries, Inc., Term Loan B | | | 6.119% | | | | 1-Month LIBOR | | | | 3.750% | | | | 4/12/25 | | | | B+ | | | | 632,200 | |
| | 9,511 | | | Quikrete Holdings, Inc., Term Loan B | | | 4.984% | | | | 1-Month LIBOR | | | | 2.750% | | | | 11/15/23 | | | | BB– | | | | 9,450,473 | |
| | 12,708 | | | Total Building Products | | | | | | | | | | | | | | | | | | | | | | | 12,462,168 | |
| |
| | | | Capital Markets – 2.3% (1.4% of Total Investments) | |
| | | | | | | |
| | 3,272 | | | Capital Automotive LP, Term Loan, First Lien, (DD1) | | | 4.740% | | | | 1-Month LIBOR | | | | 2.500% | | | | 3/25/24 | | | | B1 | | | | 3,271,679 | |
| | 3,482 | | | Capital Automotive LP, Term Loan, Second Lien | | | 8.234% | | | | 1-Month LIBOR | | | | 6.000% | | | | 3/24/25 | | | | B3 | | | | 3,506,690 | |
| | 7,712 | | | RPI Finance Trust, Term Loan B6 | | | 4.234% | | | | 1-Month LIBOR | | | | 2.000% | | | | 3/27/23 | | | | BBB– | | | | 7,761,840 | |
| | 14,466 | | | Total Capital Markets | | | | | | | | | | | | | | | | | | | | | | | 14,540,209 | |
41
| | |
| |
| JFR | | Nuveen Floating Rate Income Fund(continued) |
| | Portfolio of Investments July 31, 2019 |
| | | | | | | | | | | | | | | | | | | | | | | | | | | | |
Principal
Amount (000) | | | Description (1) | | Coupon (2) | | | Reference
Rate (2) | | | Spread (2) | | | Maturity (3) | | | Ratings (4) | | | Value | |
| |
| | | | Chemicals – 0.7% (0.4% of Total Investments) | |
| | | | | | | |
| $ | 1,199 | | | Ineos US Finance LLC, Term Loan | | | 4.258% | | | | 2-Month LIBOR | | | | 2.000% | | | | 4/01/24 | | | | BB+ | | | $ | 1,183,145 | |
| | 678 | | | Mineral Technologies, Inc., Term Loan B2 | | | 4.750% | | | | N/A | | | | 4.750% | | | | 5/07/21 | | | | BB+ | | | | 680,847 | |
| | 2,467 | | | Univar, Inc., Term Loan B | | | 4.484% | | | | 1-Month LIBOR | | | | 2.250% | | | | 7/01/24 | | | | BB+ | | | | 2,474,104 | |
| | 4,344 | | | Total Chemicals | | | | | | | | | | | | | | | | | | | | | | | 4,338,096 | |
| |
| | | | Commercial Services & Supplies – 3.8% (2.3% of Total Investments) | |
| | | | | | | |
| | 1,690 | | | ADS Waste Holdings, Inc., Term Loan B | | | 4.599% | | | | 1-Week LIBOR | | | | 2.250% | | | | 11/10/23 | | | | BB+ | | | | 1,695,893 | |
| | 1,156 | | | Brand Energy & Infrastructure Services, Inc., Term Loan B, First Lien | | | 6.730% | | | | 2-Month LIBOR | | | | 4.250% | | | | 6/21/24 | | | | B– | | | | 1,118,715 | |
| | 696 | | | Education Management LLC, Term Loan A, (5) | | | 0.000% | | | | N/A | | | | N/A | | | | 7/02/20 | | | | N/R | | | | 6,960 | |
| | 1,006 | | | Education Management LLC, Term Loan B, (5) | | | 0.000% | | | | N/A | | | | N/A | | | | 7/02/20 | | | | N/R | | | | 1,358 | |
| | 9,273 | | | Formula One Group, Term Loan B, (DD1) | | | 4.734% | | | | 1-Month LIBOR | | | | 2.500% | | | | 2/01/24 | | | | B+ | | | | 9,182,260 | |
| | 281 | | | Fort Dearborn Holding Company, Inc., Term Loan, First Lien | | | 6.313% | | | | 3-Month LIBOR | | | | 4.000% | | | | 10/19/23 | | | | B2 | | | | 272,948 | |
| | 2,481 | | | GFL Environmental, Term Loan | | | 5.234% | | | | 1-Month LIBOR | | | | 3.000% | | | | 5/30/25 | | | | B+ | | | | 2,466,800 | |
| | 325 | | | Insurance Auto Actions Inc., Term Loan | | | 4.625% | | | | 3-Month LIBOR | | | | 2.250% | | | | 5/22/26 | | | | BB | | | | 326,801 | |
| | 4,417 | | | iQor US, Inc., Term Loan, First Lien | | | 7.319% | | | | 3-Month LIBOR | | | | 5.000% | | | | 4/01/21 | | | | Caa1 | | | | 4,217,820 | |
| | 500 | | | iQor US, Inc., Term Loan, Second Lien | | | 11.069% | | | | 3-Month LIBOR | | | | 8.750% | | | | 4/01/22 | | | | Caa3 | | | | 402,500 | |
| | 301 | | | KAR Auction Services, Inc., Term Loan B5 | | | 4.875% | | | | 3-Month LIBOR | | | | 2.500% | | | | 3/09/23 | | | | BB | | | | 301,303 | |
| | 2,855 | | | Protection One, Inc., Term Loan | | | 4.984% | | | | 1-Month LIBOR | | | | 2.750% | | | | 5/02/22 | | | | BB– | | | | 2,855,134 | |
| | 850 | | | Robertshaw US Holding Corp., Term Loan B, (WI/DD) | | | TBD | | | | TBD | | | | TBD | | | | TBD | | | | B | | | | 792,625 | |
| | 339 | | | West Corporation, Incremental Term Loan B1 | | | 6.022% | | | | 3-Month LIBOR | | | | 3.500% | | | | 10/10/24 | | | | B1 | | | | 314,351 | |
| | 26,170 | | | Total Commercial Services & Supplies | | | | | | | | | | | | | | | | | | | | | | | 23,955,468 | |
| |
| | | | Communications Equipment – 5.5% (3.3% of Total Investments) | |
| | | | | | | |
| | 7,608 | | | Avaya, Inc., Term Loan B, (DD1) | | | 6.575% | | | | 1-Month LIBOR | | | | 4.250% | | | | 12/15/24 | | | | B | | | | 7,339,536 | |
| | 7,500 | | | CommScope, Inc., Term Loan B | | | 5.484% | | | | 1-Month LIBOR | | | | 3.250% | | | | 4/06/26 | | | | Ba1 | | | | 7,522,500 | |
| | 1,592 | | | Mitel US Holdings, Inc., Term Loan, First Lien | | | 6.734% | | | | 1-Month LIBOR | | | | 4.500% | | | | 11/30/25 | | | | B | | | | 1,554,469 | |
| | 707 | | | MultiPlan, Inc., Term Loan B | | | 5.080% | | | | 3-Month LIBOR | | | | 2.750% | | | | 6/07/23 | | | | B+ | | | | 688,328 | |
| | 2,078 | | | Plantronics, Term Loan B | | | 4.734% | | | | 1-Month LIBOR | | | | 2.500% | | | | 7/02/25 | | | | Ba1 | | | | 2,081,011 | |
| | 15,485 | | | Univision Communications, Inc., Term Loan C5 | | | 4.984% | | | | 1-Month LIBOR | | | | 2.750% | | | | 3/15/24 | | | | B | | | | 15,181,038 | |
| | 34,970 | | | Total Communications Equipment | | | | | | | | | | | | | | | | | | | | | | | 34,366,882 | |
| |
| | | | Construction & Engineering – 0.6% (0.4% of Total Investments) | |
| | | | | | | |
| | 1,900 | | | KBR, Inc, Term Loan B | | | 5.984% | | | | 1-Month LIBOR | | | | 3.750% | | | | 4/25/25 | | | | Ba3 | | | | 1,913,072 | |
| | 1,747 | | | Traverse Midstream Partners, Term Loan B | | | 6.260% | | | | 2-Month LIBOR | | | | 4.000% | | | | 9/27/24 | | | | B+ | | | | 1,715,090 | |
| | 3,647 | | | Total Construction & Engineering | | | | | | | | | | | | | | | | | | | | | | | 3,628,162 | |
| |
| | | | Consumer Finance – 0.5% (0.3% of Total Investments) | |
| | | | | | | |
| | 2,950 | | | Verscend Technologies, Tern Loan B | | | 6.734% | | | | 1-Month LIBOR | | | | 4.500% | | | | 8/27/25 | | | | B+ | | | | 2,969,538 | |
| |
| | | | Containers & Packaging – 0.7% (0.4% of Total Investments) | |
| | | | | | | |
| | 1,397 | | | Berry Global, Inc., Term Loan Q | | | 4.629% | | | | 1-Month LIBOR | | | | 2.250% | | | | 10/01/22 | | | | BBB– | | | | 1,398,709 | |
| | 3,000 | | | Berry Global, Inc., Term Loan U | | | 4.902% | | | | 1-Month LIBOR | | | | 2.500% | | | | 7/01/26 | | | | BBB– | | | | 3,001,410 | |
| | 4,397 | | | Total Containers & Packaging | | | | | | | | | | | | | | | | | | | | | | | 4,400,119 | |
| |
| | | | Distributors – 0.2% (0.1% of Total Investments) | |
| | | | | | | |
| | 1,544 | | | SRS Distribution, Inc., Term Loan B | | | 5.484% | | | | 1-Month LIBOR | | | | 3.250% | | | | 5/23/25 | | | | B3 | | | | 1,498,031 | |
| |
| | | | Diversified Consumer Services – 2.2% (1.4% of Total Investments) | |
| | | | | | | |
| | 5,775 | | | Cengage Learning Acquisitions, Inc., Term Loan B | | | 6.484% | | | | 1-Month LIBOR | | | | 4.250% | | | | 6/07/23 | | | | B | | | | 5,580,380 | |
| | 475 | | | Education Management LLC, Elevated Term Loan B, (5) | | | 7.734% | | | | 1-Month LIBOR | | | | 5.500% | | | | 7/02/20 | | | | N/R | | | | 5,940 | |
| | 5,664 | | | Houghton Mifflin, Term Loan B, First Lien | | | 5.234% | | | | 1-Month LIBOR | | | | 3.000% | | | | 5/28/21 | | | | B | | | | 5,441,772 | |
| | 2,985 | | | Refinitiv, Term Loan B | | | 5.984% | | | | 1-Month LIBOR | | | | 3.750% | | | | 10/01/25 | | | | B | | | | 2,986,866 | |
| | 14,899 | | | Total Diversified Consumer Services | | | | | | | | | | | | | | | | | | | | | | | 14,014,958 | |
| |
| | | | Diversified Financial Services – 1.0% (0.6% of Total Investments) | |
| | | | | | | |
| | 1,975 | | | Blackstone CQP, Term Loan | | | 5.887% | | | | 3-Month LIBOR | | | | 3.500% | | | | 9/30/24 | | | | B+ | | | | 1,985,497 | |
| | 1,595 | | | Getty Images, Inc., Initial Dollar Term Loan | | | 6.734% | | | | 1-Month LIBOR | | | | 4.500% | | | | 2/19/26 | | | | B2 | | | | 1,594,319 | |
| | 749 | | | Lions Gate Entertainment Corp., Term Loan B | | | 4.484% | | | | 1-Month LIBOR | | | | 2.250% | | | | 3/24/25 | | | | Ba2 | | | | 749,603 | |
42
| | | | | | | | | | | | | | | | | | | | | | | | | | | | |
Principal
Amount (000) | | | Description (1) | | Coupon (2) | | | Reference
Rate (2) | | | Spread (2) | | | Maturity (3) | | | Ratings (4) | | | Value | |
| |
| | | | Diversified Financial Services(continued) | |
| | | | | | | |
| $ | 4,820 | | | Walter Investment Management Corporation, Term Loan B, First Lien, (5) | | | 0.000% | | | | N/A | | | | N/A | | | | 6/30/22 | | | | Ca | | | $ | 1,843,626 | |
| | 9,139 | | | Total Diversified Financial Services | | | | | | | | | | | | | | | | | | | | | | | 6,173,045 | |
| |
| | | | Diversified Telecommunication Services – 7.7% (4.7% of Total Investments) | |
| | | | | | | |
| | 2,081 | | | CenturyLink, Inc., Initial Term Loan A | | | 4.984% | | | | 1-Month LIBOR | | | | 2.750% | | | | 11/01/22 | | | | BBB– | | | | 2,084,830 | |
| | 11,394 | | | CenturyLink, Inc., Term Loan B | | | 4.984% | | | | 1-Month LIBOR | | | | 2.750% | | | | 1/31/25 | | | | BBB– | | | | 11,338,048 | |
| | 7,248 | | | Frontier Communications Corporation, Term Loan B | | | 5.990% | | | | 1-Month LIBOR | | | | 3.750% | | | | 1/14/22 | | | | B2 | | | | 7,176,714 | |
| | 465 | | | Intelsat Jackson Holdings, S.A., Term Loan B4 | | | 6.741% | | | | 1-Month LIBOR | | | | 4.500% | | | | 1/02/24 | | | | B1 | | | | 470,594 | |
| | 744 | | | Intelsat Jackson Holdings, S.A., Term Loan B5 | | | 6.625% | | | | N/A | | | | 6.625% | | | | 1/02/24 | | | | B1 | | | | 754,379 | |
| | 6,283 | | | Level 3 Financing, Inc., Term Loan B | | | 4.484% | | | | 1-Month LIBOR | | | | 2.250% | | | | 2/22/24 | | | | BBB– | | | | 6,296,555 | |
| | 6,948 | | | Numericable Group S.A., Term Loan B13 | | | 6.325% | | | | 1-Month LIBOR | | | | 4.000% | | | | 8/14/26 | | | | B | | | | 6,925,824 | |
| | 1,250 | | | Windstream Corporation, DIP Term Loan | | | 4.740% | | | | 1-Month LIBOR | | | | 2.500% | | | | 2/26/21 | | | | BBB– | | | | 1,259,375 | |
| | 12,000 | | | Ziggo B.V., Term Loan E | | | 4.825% | | | | 1-Month LIBOR | | | | 2.500% | | | | 4/15/25 | | | | B+ | | | | 11,943,300 | |
| | 48,413 | | | Total Diversified Telecommunication Services | | | | | | | | | | | | | | | | | | | | | | | 48,249,619 | |
| |
| | | | Electric Utilities – 0.9% (0.5% of Total Investments) | |
| | | | | | | |
| | 589 | | | EFS Cogen Holdings LLC, Term Loan B | | | 5.580% | | | | 3-Month LIBOR | | | | 3.250% | | | | 6/28/23 | | | | BB | | | | 589,515 | |
| | 1,333 | | | ExGen Renewables, Term Loan, (WI/DD) | | | TBD | | | | TBD | | | | TBD | | | | TBD | | | | B | | | | 1,292,780 | |
| | 2,168 | | | Vistra Operations Co., Term Loan B1 | | | 4.234% | | | | 1-Month LIBOR | | | | 2.000% | | | | 8/01/23 | | | | BBB– | | | | 2,173,435 | |
| | 1,593 | | | Vistra Operations Co., Term Loan B3 | | | 4.330% | | | | 3-Month LIBOR | | | | 2.000% | | | | 12/31/25 | | | | BBB– | | | | 1,597,912 | |
| | 5,683 | | | Total Electric Utilities | | | | | | | | | | | | | | | | | | | | | | | 5,653,642 | |
| |
| | | | Electrical Equipment – 0.4% (0.2% of Total Investments) | |
| | | | | | | |
| | 2,269 | | | TTM Technologies, Inc., Term Loan B | | | 4.902% | | | | 1-Month LIBOR | | | | 2.500% | | | | 9/28/24 | | | | BB+ | | | | 2,265,218 | |
| |
| | | | Energy Equipment & Services – 0.7% (0.5% of Total Investments) | |
| | | | | | | |
| | 4,938 | | | McDermott International, Term Loan | | | 7.234% | | | | 1-Month LIBOR | | | | 5.000% | | | | 5/12/25 | | | | Ba3 | | | | 4,730,125 | |
| |
| | | | Equity Real Estate Investment Trust – 1.3% (0.8% of Total Investments) | |
| | | | | | | |
| | 8,544 | | | Communications Sales & Leasing, Inc., Shortfall Term Loan | | | 7.234% | | | | 1-Month LIBOR | | | | 5.000% | | | | 10/24/22 | | | | Caa1 | | | | 8,329,031 | |
| |
| | | | Food & Staples Retailing – 6.6% (4.0% of Total Investments) | |
| | | | | | | |
| | 2,918 | | | Albertson’s LLC, Term Loan B5 | | | 5.311% | | | | 3-Month LIBOR | | | | 3.000% | | | | 12/21/22 | | | | BB | | | | 2,928,116 | |
| | 1,873 | | | Albertson’s LLC, Term Loan B6 | | | 5.234% | | | | 1-Month LIBOR | | | | 3.000% | | | | 6/22/23 | | | | BB | | | | 1,878,744 | |
| | 21,412 | | | Albertson’s LLC, Term Loan B7 | | | 5.234% | | | | 1-Month LIBOR | | | | 3.000% | | | | 11/17/25 | | | | BB | | | | 21,468,900 | |
| | 1 | | | Del Monte Foods Company, Term Loan, First Lien | | | 7.750% | | | | Prime | | | | 2.250% | | | | 2/18/21 | | | | CCC+ | | | | 456 | |
| | 219 | | | Del Monte Foods Company, Term Loan, First Lien | | | 5.771% | | | | 3-Month LIBOR | | | | 3.250% | | | | 2/18/21 | | | | CCC+ | | | | 172,183 | |
| | 1,655 | | | Hearthside Group Holdings LLC, Term Loan B | | | 5.922% | | | | 1-Month LIBOR | | | | 3.688% | | | | 5/23/25 | | | | B | | | | 1,627,524 | |
| | 13,303 | | | US Foods, Inc., Term Loan B | | | 4.234% | | | | 1-Month LIBOR | | | | 2.000% | | | | 6/27/23 | | | | BBB– | | | | 13,308,832 | |
| | 41,381 | | | Total Food & Staples Retailing | | | | | | | | | | | | | | | | | | | | | | | 41,384,755 | |
| |
| | | | Food Products – 0.2% (0.1% of Total Investments) | |
| | | | | | | |
| | 20 | | | American Seafoods Group LLC, Term Loan B | | | 7.250% | | | | Prime | | | | 1.750% | | | | 8/21/23 | | | | BB– | | | | 19,850 | |
| | 1,295 | | | American Seafoods Group LLC, Term Loan B | | | 5.160% | | | | 1-Month LIBOR | | | | 2.750% | | | | 8/21/23 | | | | BB– | | | | 1,295,203 | |
| | 1,315 | | | Total Food Products | | | | | | | | | | | | | | | | | | | | | | | 1,315,053 | |
| |
| | | | Health Care Equipment & Supplies – 1.9% (1.2% of Total Investments) | |
| | | | | | | |
| | 3,279 | | | Acelity, Term Loan B | | | 5.580% | | | | 3-Month LIBOR | | | | 3.250% | | | | 2/02/24 | | | | B1 | | | | 3,292,453 | |
| | 911 | | | Air Methods Term Loan, First Lien, (DD1) | | | 5.830% | | | | 3-Month LIBOR | | | | 3.500% | | | | 4/22/24 | | | | B | | | | 772,890 | |
| | 1,132 | | | Greatbatch, New Term Loan B | | | 5.380% | | | | 1-Month LIBOR | | | | 3.000% | | | | 10/27/22 | | | | B+ | | | | 1,139,138 | |
| | 3,454 | | | Onex Carestream Finance LP, Term Loan, First Lien | | | 7.984% | | | | 1-Month LIBOR | | | | 5.750% | | | | 2/28/21 | | | | B1 | | | | 3,328,938 | |
| | 2,351 | | | Onex Carestream Finance LP, Term Loan, Second Lien | | | 11.734% | | | | 1-Month LIBOR | | | | 9.500% | | | | 6/07/21 | | | | B– | | | | 2,239,290 | |
| | 1,443 | | | Vyaire Medical, Inc., Term Loan B | | | 7.080% | | | | 3-Month LIBOR | | | | 4.750% | | | | 4/16/25 | | | | B3 | | | | 1,345,778 | |
| | 12,570 | | | Total Health Care Equipment & Supplies | | | | | | | | | | | | | | | | 12,118,487 | |
| |
| | | | Health Care Providers & Services – 9.0% (5.5% of Total Investments) | |
| | | | | | | |
| | 1,865 | | | Acadia Healthcare, Inc., Term Loan B3 | | | 4.734% | | | | 1-Month LIBOR | | | | 2.500% | | | | 2/11/22 | | | | Ba2 | | | | 1,869,765 | |
43
| | |
| |
| JFR | | Nuveen Floating Rate Income Fund(continued) |
| | Portfolio of Investments July 31, 2019 |
| | | | | | | | | | | | | | | | | | | | | | | | | | | | |
Principal
Amount (000) | | | Description (1) | | Coupon (2) | | | Reference
Rate (2) | | | Spread (2) | | | Maturity (3) | | | Ratings (4) | | | Value | |
| |
| | | | Health Care Providers & Services(continued) | |
| | | | | | | |
| $ | 4,319 | | | Air Medical Group Holdings, Inc., Term Loan B, (DD1) | | | 5.564% | | | | 1-Month LIBOR | | | | 3.250% | | | | 4/28/22 | | | | B1 | | | $ | 4,195,832 | |
| | 1,486 | | | Ardent Health, Term Loan, First Lien | | | 6.734% | | | | 1-Month LIBOR | | | | 4.500% | | | | 6/30/25 | | | | B1 | | | | 1,492,431 | |
| | 1,384 | | | Brightspring Health, Term Loan B | | | 6.880% | | | | 1-Month LIBOR | | | | 4.500% | | | | 3/05/26 | | | | B1 | | | | 1,393,295 | |
| | 939 | | | Civitas Solutions, Term Loan B | | | 6.490% | | | | 1-Month LIBOR | | | | 4.250% | | | | 3/09/26 | | | | B1 | | | | 946,210 | |
| | 58 | | | Civitas Solutions, Term Loan C | | | 6.490% | | | | 1-Month LIBOR | | | | 4.250% | | | | 3/09/26 | | | | B1 | | | | 58,918 | |
| | 1,383 | | | Concentra, Inc., Term Loan B | | | 5.210% | | | | 3-Month LIBOR | | | | 2.750% | | | | 6/01/22 | | | | B+ | | | | 1,386,407 | |
| | 1,068 | | | ConvaTec, Inc., Term Loan B | | | 4.580% | | | | 3-Month LIBOR | | | | 2.250% | | | | 10/25/23 | | | | BB | | | | 1,067,738 | |
| | 162 | | | DaVita HealthCare Partners, Inc., Term Loan B | | | 5.130% | | | | 1-Month LIBOR | | | | 2.750% | | | | 6/24/21 | | | | BBB– | | | | 162,590 | |
| | 2,689 | | | Envision Healthcare Corporation, Initial Term Loan, (DD1) | | | 5.984% | | | | 1-Month LIBOR | | | | 3.750% | | | | 10/10/25 | | | | B+ | | | | 2,318,618 | |
| | 1,241 | | | HCA, Inc., Term Loan B10 | | | 4.330% | | | | 3-Month LIBOR | | | | 2.000% | | | | 3/13/25 | | | | BBB– | | | | 1,245,571 | |
| | 4,064 | | | HCA, Inc., Term Loan B11 | | | 4.080% | | | | 3-Month LIBOR | | | | 1.750% | | | | 3/17/23 | | | | BBB– | | | | 4,077,502 | |
| | 1,064 | | | Healogics, Inc., Term Loan, First Lien | | | 6.730% | | | | 3-Month LIBOR | | | | 4.250% | | | | 7/01/21 | | | | B3 | | | | 844,192 | |
| | 979 | | | Heartland Dental Care, Inc., Term Loan, First Lien | | | 5.984% | | | | 1-Month LIBOR | | | | 3.750% | | | | 4/30/25 | | | | B2 | | | | 944,349 | |
| | 22 | | | Heartland Dental Care, Inc., Delay Draw Facility, (6) | | | 3.750% | | | | N/A | | | | 3.750% | | | | 4/30/25 | | | | B2 | | | | 21,187 | |
| | 3,840 | | | Kindred at Home Hospice, Term Loan B | | | 6.000% | | | | 1-Month LIBOR | | | | 3.750% | | | | 7/02/25 | | | | B1 | | | | 3,866,000 | |
| | 7,269 | | | Lifepoint Health, Inc., Term Loan, (DD1) | | | 6.769% | | | | 1-Month LIBOR | | | | 4.500% | | | | 11/16/25 | | | | B+ | | | | 7,321,281 | |
| | 2,314 | | | Millennium Laboratories, Inc., Term Loan B, First Lien | | | 8.734% | | | | 1-Month LIBOR | | | | 6.500% | | | | 12/21/20 | | | | Caa3 | | | | 1,049,031 | |
| | 10,763 | | | Pharmaceutical Product Development, Inc., Term Loan B | | | 4.734% | | | | 1-Month LIBOR | | | | 2.500% | | | | 8/18/22 | | | | Ba3 | | | | 10,760,785 | |
| | 3,129 | | | Prospect Medical Holdings, Term Loan B1 | | | 7.875% | | | | 1-Month LIBOR | | | | 5.500% | | | | 2/22/24 | | | | B | | | | 3,127,373 | |
| | 265 | | | Quorum Health Corp., Term Loan B | | | 9.006% | | | | 3-Month LIBOR | | | | 6.750% | | | | 4/29/22 | | | | B1 | | | | 262,934 | |
| | 5,354 | | | Select Medical Corporation, Term Loan B, (DD1) | | | 4.850% | | | | 3-Month LIBOR | | | | 2.500% | | | | 3/06/25 | | | | Ba2 | | | | 5,350,851 | |
| | 2,715 | | | Team Health, Initial Term Loan | | | 4.984% | | | | 1-Month LIBOR | | | | 2.750% | | | | 2/06/24 | | | | B | | | | 2,387,252 | |
| | 370 | | | Vizient Inc., Term Loan B | | | 4.984% | | | | 1-Month LIBOR | | | | 2.750% | | | | 5/06/26 | | | | BB– | | | | 372,094 | |
| | 58,742 | | | Total Health Care Providers & Services | | | | | | | | | | | | | | | | 56,522,206 | |
| |
| | | | Health Care Technology – 1.4% (0.9% of Total Investments) | |
| | | | | | | |
| | 8,931 | | | Emdeon, Inc., Term Loan, (DD1) | | | 4.734% | | | | 1-Month LIBOR | | | | 2.500% | | | | 3/01/24 | | | | B+ | | | | 8,926,217 | |
| |
| | | | Hotels, Restaurants & Leisure – 17.5% (10.7% of Total Investments) | |
| | | | | | | |
| | 2,539 | | | 24 Hour Fitness Worldwide, Inc., Term Loan B | | | 5.734% | | | | 1-Month LIBOR | | | | 3.500% | | | | 5/30/25 | | | | Ba3 | | | | 2,545,262 | |
| | 1,166 | | | Aramark Corporation, Term Loan | | | 4.080% | | | | 3-Month LIBOR | | | | 1.750% | | | | 3/11/25 | | | | BBB– | | | | 1,167,769 | |
| | 988 | | | Arby’s Restaurant Group, Inc., Term Loan B | | | 5.556% | | | | 3-Month LIBOR | | | | 3.250% | | | | 2/05/25 | | | | B | | | | 984,942 | |
| | 788 | | | Boyd Gaming Corporation, Refinancing Term Loan B | | | 4.624% | | | | 1-Week LIBOR | | | | 2.250% | | | | 9/15/23 | | | | BB | | | | 789,377 | |
| | 22,179 | | | Burger King Corporation, Term Loan B3 | | | 4.484% | | | | 1-Month LIBOR | | | | 2.250% | | | | 2/16/24 | | | | Ba3 | | | | 22,217,408 | |
| | 8,785 | | | Caesars Entertainment Operating Company, Inc., Term Loan B, (DD1) | | | 4.234% | | | | 1-Month LIBOR | | | | 2.000% | | | | 10/06/24 | | | | BB | | | | 8,777,045 | |
| | 10,556 | | | Caesars Resort Collection, Term Loan, First Lien, (DD1) | | | 4.984% | | | | 1-Month LIBOR | | | | 2.750% | | | | 12/23/24 | | | | BB | | | | 10,488,332 | |
| | 500 | | | Carrols Restaurant Group Inc., Term Loan B | | | 5.500% | | | | 1-Month LIBOR | | | | 3.250% | | | | 4/30/26 | | | | B | | | | 502,187 | |
| | 885 | | | CCM Merger, Inc., Term Loan B | | | 4.484% | | | | 1-Month LIBOR | | | | 2.250% | | | | 8/09/21 | | | | BB– | | | | 887,306 | |
| | 4,559 | | | CityCenter Holdings LLC, Term Loan B | | | 4.484% | | | | 1-Month LIBOR | | | | 2.250% | | | | 4/18/24 | | | | BB– | | | | 4,574,305 | |
| | 1,640 | | | ClubCorp Operations, Inc., Term Loan B | | | 5.080% | | | | 3-Month LIBOR | | | | 2.750% | | | | 9/18/24 | | | | B | | | | 1,517,000 | |
| | 4,007 | | | Equinox Holdings, Inc., Term Loan B1 | | | 5.234% | | | | 1-Month LIBOR | | | | 3.000% | | | | 3/08/24 | | | | B+ | | | | 4,019,784 | |
| | 975 | | | Four Seasons Holdings, Inc., Term Loan B | | | 4.234% | | | | 1-Month LIBOR | | | | 2.000% | | | | 11/30/23 | | | | BB | | | | 977,818 | |
| | 10,743 | | | Hilton Hotels, Term Loan B2 | | | 4.016% | | | | 1-Month LIBOR | | | | 1.750% | | | | 6/22/26 | | | | BBB– | | | | 10,788,358 | |
| | 3,810 | | | Intrawest Resorts Holdings, Inc., Term Loan B | | | 5.234% | | | | 1-Month LIBOR | | | | 3.000% | | | | 7/31/24 | | | | B | | | | 3,821,444 | |
| | 2,983 | | | Life Time Fitness, Inc., Term Loan B | | | 5.272% | | | | 3-Month LIBOR | | | | 2.750% | | | | 6/10/22 | | | | BB– | | | | 2,985,602 | |
| | 3,304 | | | MGM Growth Properties, Term Loan B | | | 4.234% | | | | 1-Month LIBOR | | | | 2.000% | | | | 3/21/25 | | | | BB+ | | | | 3,310,045 | |
| | 1,250 | | | MGM Resorts International, Term Loan A | | | 4.234% | | | | 1-Month LIBOR | | | | 2.000% | | | | 12/21/23 | | | | BB+ | | | | 1,245,706 | |
| | 1,000 | | | PCI Gaming, Term Loan B | | | 5.234% | | | | 1-Month LIBOR | | | | 3.000% | | | | 5/29/26 | | | | BB+ | | | | 1,008,660 | |
| | 13,774 | | | Scientific Games Corp., Initial Term Loan B5 | | | 4.984% | | | | 1-Month LIBOR | | | | 2.750% | | | | 8/14/24 | | | | Ba3 | | | | 13,724,057 | |
| | 3,158 | | | Seaworld Parks and Entertainment, Inc., Term Loan B5 | | | 5.234% | | | | 1-Month LIBOR | | | | 3.000% | | | | 4/01/24 | | | | B+ | | | | 3,166,174 | |
| | 5,227 | | | Stars Group Holdings, Term Loan B | | | 5.830% | | | | 3-Month LIBOR | | | | 3.500% | | | | 7/10/25 | | | | B+ | | | | 5,252,960 | |
| | 3,426 | | | Station Casino LLC, Term Loan B | | | 4.740% | | | | 1-Month LIBOR | | | | 2.500% | | | | 6/08/23 | | | | BB | | | | 3,438,169 | |
| | 1,985 | | | Wyndham International, Inc., Term Loan B | | | 3.984% | | | | 1-Month LIBOR | | | | 1.750% | | | | 5/30/25 | | | | BBB– | | | | 1,992,603 | |
| | 110,227 | | | Total Hotels, Restaurants & Leisure | | | | | | | | | | | | | | | | | | | | | | | 110,182,313 | |
44
| | | | | | | | | | | | | | | | | | | | | | | | | | | | |
Principal
Amount (000) | | | Description (1) | | Coupon (2) | | | Reference
Rate (2) | | | Spread (2) | | | Maturity (3) | | | Ratings (4) | | | Value | |
| |
| | | | Household Durables – 0.4% (0.2% of Total Investments) | |
| | | | | | | |
| $ | 3,495 | | | Serta Simmons Holdings LLC, Term Loan, First Lien | | | 5.879% | | | | 1-Month LIBOR | | | | 3.500% | | | | 11/08/23 | | | | CCC+ | | | $ | 2,406,952 | |
| |
| | | | Household Products – 0.8% (0.5% of Total Investments) | |
| | | | | | | |
| | 983 | | | Energizer Holdings, Term Loan B | | | 4.688% | | | | 1-Month LIBOR | | | | 2.250% | | | | 12/17/25 | | | | BB+ | | | | 982,809 | |
| | 3,764 | | | Reynolds Group Holdings, Inc., Term Loan, First Lien | | | 4.984% | | | | 1-Month LIBOR | | | | 2.750% | | | | 2/05/23 | | | | B+ | | | | 3,769,639 | |
| | 4,747 | | | Total Household Products | | | | | | | | | | | | | | | | | | | | | | | 4,752,448 | |
| |
| | | | Industrial Conglomerates – 0.2% (0.1% of Total Investments) | |
| | | | | | | |
| | 1,481 | | | Education Advisory Board, Term Loan, First Lien | | | 6.381% | | | | 6-Month LIBOR | | | | 3.750% | | | | 11/15/24 | | | | B2 | | | | 1,471,074 | |
| |
| | | | Insurance – 2.3% (1.4% of Total Investments) | |
| | | | | | | |
| | 978 | | | Acrisure LLC, Term Loan B | | | 6.772% | | | | 3-Month LIBOR | | | | 4.250% | | | | 11/22/23 | | | | B | | | | 974,229 | |
| | 6,088 | | | Alliant Holdings I LLC, Term Loan B | | | 5.269% | | | | 1-Month LIBOR | | | | 3.000% | | | | 5/09/25 | | | | B | | | | 6,014,986 | |
| | 3,976 | | | Asurion LLC, Term Loan B6 | | | 5.234% | | | | 1-Month LIBOR | | | | 3.000% | | | | 11/03/23 | | | | Ba3 | | | | 3,989,429 | |
| | 3,335 | | | Hub International Holdings, Inc., Term Loan B | | | 5.281% | | | | 3-Month LIBOR | | | | 3.000% | | | | 4/25/25 | | | | B | | | | 3,305,224 | |
| | 14,377 | | | Total Insurance | | | | | | | | | | | | | | | | | | | | | | | 14,283,868 | |
| |
| | | | Interactive Media & Services – 1.0% (0.6% of Total Investments) | |
| | | | | | | |
| | 4,272 | | | Rackspace Hosting, Inc., Refinancing Term B Loan, First Lien, (DD1) | | | 5.576% | | | | 3-Month LIBOR | | | | 3.000% | | | | 11/03/23 | | | | BB– | | | | 3,975,814 | |
| | 1,990 | | | WeddingWire, Inc., Term Loan | | | 6.734% | | | | 1-Month LIBOR | | | | 4.500% | | | | 12/19/25 | | | | B+ | | | | 1,997,462 | |
| | 6,262 | | | Total Interactive Media & Services | | | | | | | | | | | | | | | | | | | | | | | 5,973,276 | |
| |
| | | | Internet Software & Services – 0.8% (0.5% of Total Investments) | |
| | | | | | | |
| | 1,945 | | | Ancestry.com, Inc., Term Loan, First Lien | | | 5.490% | | | | 1-Month LIBOR | | | | 3.250% | | | | 10/19/23 | | | | B | | | | 1,946,624 | |
| | 2,209 | | | Dynatrace, Term Loan, First Lien | | | 5.234% | | | | 1-Month LIBOR | | | | 3.000% | | | | 8/22/25 | | | | B1 | | | | 2,214,483 | |
| | 110 | | | Dynatrace, Term Loan, Second Lien | | | 9.234% | | | | 1-Month LIBOR | | | | 7.000% | | | | 8/21/26 | | | | CCC+ | | | | 110,847 | |
| | 2,448 | | | SkillSoft Corporation, Term Loan, Second Lien | | | 10.506% | | | | 3-Month LIBOR | | | | 8.250% | | | | 4/28/22 | | | | CCC | | | | 899,621 | |
| | 6,712 | | | Total Internet Software & Services | | | | | | | | | | | | | | | | | | | | | | | 5,171,575 | |
| |
| | | | IT Services – 4.3% (2.6% of Total Investments) | |
| | | | | | | |
| | 1,008 | | | DTI Holdings, Inc., Replacement Term Loan B1 | | | 7.008% | | | | 2-Month LIBOR | | | | 4.750% | | | | 9/29/23 | | | | B– | | | | 931,461 | |
| | 1,610 | | | Gartner, Inc., Term Loan A | | | 3.984% | | | | 1-Month LIBOR | | | | 1.750% | | | | 3/21/22 | | | | BB+ | | | | 1,616,013 | |
| | 1,942 | | | GTT Communications, Inc., Term Loan, First Lien | | | 4.980% | | | | 1-Month LIBOR | | | | 2.750% | | | | 6/02/25 | | | | B2 | | | | 1,709,807 | |
| | 636 | | | Presidio, Inc., Term Loan B | | | 5.069% | | | | 3-Month LIBOR | | | | 2.750% | | | | 2/02/24 | | | | B+ | | | | 636,846 | |
| | 3,605 | | | Sabre, Inc., Term Loan B | | | 4.234% | | | | 1-Month LIBOR | | | | 2.000% | | | | 2/22/24 | | | | BB | | | | 3,620,123 | |
| | 853 | | | Science Applications International Corporation, Term Loan B | | | 3.984% | | | | 1-Month LIBOR | | | | 1.750% | | | | 10/31/25 | | | | BB+ | | | | 852,160 | |
| | 3,500 | | | Syniverse Holdings, Inc., Initial Term Loan, Second Lien | | | 11.325% | | | | 1-Month LIBOR | | | | 9.000% | | | | 3/11/24 | | | | CCC | | | | 2,511,250 | |
| | 5,165 | | | Syniverse Holdings, Inc., Term Loan C, (DD1) | | | 7.325% | | | | 1-Month LIBOR | | | | 5.000% | | | | 3/09/23 | | | | B2 | | | | 4,740,531 | |
| | 2,450 | | | Tempo Acquisition LLC, Term Loan B | | | 5.234% | | | | 1-Month LIBOR | | | | 3.000% | | | | 5/01/24 | | | | B1 | | | | 2,456,738 | |
| | 3,750 | | | Travelport LLC, Term Loan B | | | 7.541% | | | | 6-Month LIBOR | | | | 5.000% | | | | 5/29/26 | | | | B+ | | | | 3,652,725 | |
| | 2,710 | | | West Corporation, Term Loan B | | | 6.522% | | | | 3-Month LIBOR | | | | 4.000% | | | | 10/10/24 | | | | B1 | | | | 2,538,713 | |
| | 1,455 | | | WEX, Inc., Term Loan B3 | | | 4.484% | | | | 1-Month LIBOR | | | | 2.250% | | | | 5/15/26 | | | | BB– | | | | 1,459,265 | |
| | 28,684 | | | Total IT Services | | | | | | | | | | | | | | | | | | | | | | | 26,725,632 | |
| |
| | | | Life Sciences Tools & Services – 0.8% (0.5% of Total Investments) | |
| | | | | | | |
| | 445 | | | Inventiv Health, Inc, Term Loan B | | | 4.234% | | | | 1-Month LIBOR | | | | 2.000% | | | | 8/01/24 | | | | BB | | | | 444,668 | |
| | 4,591 | | | Parexel International Corp., Term Loan B, (DD1) | | | 4.984% | | | | 1-Month LIBOR | | | | 2.750% | | | | 9/27/24 | | | | B2 | | | | 4,439,301 | |
| | 5,036 | | | Total Life Sciences Tools & Services | | | | | | | | | | | | | | | | | | | | | | | 4,883,969 | |
| |
| | | | Machinery – 1.1% (0.7% of Total Investments) | |
| | | | | | | |
| | 1,003 | | | BJ’s Wholesale Club, Inc., Term Loan B | | | 5.075% | | | | 1-Month LIBOR | | | | 2.750% | | | | 2/01/24 | | | | B | | | | 1,006,493 | |
| | 2,349 | | | Gardner Denver, Inc., Term Loan B | | | 4.984% | | | | 1-Month LIBOR | | | | 2.750% | | | | 7/30/24 | | | | BB+ | | �� | | 2,357,802 | |
| | 1,451 | | | Gates Global LLC, Term Loan B | | | 4.984% | | | | 1-Month LIBOR | | | | 2.750% | | | | 4/01/24 | | | | B+ | | | | 1,447,808 | |
| | 1,888 | | | TNT Crane and Rigging Inc., Initial Term Loan, First Lien, (DD1) | | | 6.830% | | | | 3-Month LIBOR | | | | 4.500% | | | | 11/27/20 | | | | CCC+ | | | | 1,769,794 | |
| | 850 | | | TNT Crane and Rigging, Inc., Term Loan, Second Lien | | | 11.330% | | | | 3-Month LIBOR | | | | 9.000% | | | | 11/26/21 | | | | CCC– | | | | 626,875 | |
| | 7,541 | | | Total Machinery | | | | | | | | | | | | | | | | | | | | | | | 7,208,772 | |
45
| | |
| |
| JFR | | Nuveen Floating Rate Income Fund(continued) |
| | Portfolio of Investments July 31, 2019 |
| | | | | | | | | | | | | | | | | | | | | | | | | | | | |
Principal
Amount (000) | | | Description (1) | | Coupon (2) | | | Reference
Rate (2) | | | Spread (2) | | | Maturity (3) | | | Ratings (4) | | | Value | |
| |
| | | | Marine – 0.6% (0.3% of Total Investments) | |
| | | | | | | |
| $ | 790 | | | American Commercial Lines LLC, Term Loan B, First Lien | | | 10.984% | | | | 1-Month LIBOR | | | | 8.750% | | | | 11/12/20 | | | | CCC+ | | | $ | 519,261 | |
| | 3,119 | | | Harvey Gulf International Marine, Inc., Exit Term Loan | | | 8.743% | | | | 3-Month LIBOR | | | | 6.000% | | | | 7/02/23 | | | | B | | | | 2,975,160 | |
| | 3,909 | | | Total Marine | | | | | | | | | | | | | | | | | | | | | | | 3,494,421 | |
| |
| | | | Media – 13.1% (8.0% of Total Investments) | |
| | | | | | | |
| | 497 | | | Advantage Sales & Marketing, Inc., Term Loan B2, First Lien, (WI/DD) | | | TBD | | | | TBD | | | | TBD | | | | TBD | | | | B2 | | | | 461,110 | |
| | 531 | | | Advantage Sales & Marketing, Inc., Term Loan, First Lien | | | 5.580% | | | | 3-Month LIBOR | | | | 3.250% | | | | 7/23/21 | | | | B2 | | | | 494,086 | |
| | 655 | | | Affinion Group Holdings, Inc., Consenting Term Loan, (cash 4.519%, PIK 1.750%) | | | 6.269% | | | | 1-Month LIBOR | | | | 4.000% | | | | 4/10/24 | | | | N/R | | | | 560,958 | |
| | 1,762 | | | AMC Entertainment, Inc., Term Loan B, (DD1) | | | 5.230% | | | | 6-Month LIBOR | | | | 3.000% | | | | 4/22/26 | | | | Ba2 | | | | 1,766,220 | |
| | 748 | | | Catalina Marketing Corporation, First Out Loan | | | 9.814% | | | | 1-Month LIBOR | | | | 7.500% | | | | 2/15/23 | | | | B2 | | | | 634,431 | |
| | 945 | | | Catalina Marketing Corporation, Last Out PIK Term Loan, (cash 3.314%, PIK 9.500%) | | | 3.314% | | | | 1-Month LIBOR | | | | 1.000% | | | | 8/15/23 | | | | Caa2 | | | | 448,757 | |
| | 570 | | | CBS Radio, Inc., Term Loan B | | | 4.991% | | | | 1-Month LIBOR | | | | 2.750% | | | | 11/18/24 | | | | BB | | | | 570,686 | |
| | 6,128 | | | Cequel Communications LLC, Term Loan B | | | 4.575% | | | | 1-Month LIBOR | | | | 2.250% | | | | 1/15/26 | | | | BB | | | | 6,120,199 | |
| | 5,446 | | | Charter Communications Operating Holdings LLC, Term Loan B | | | 4.330% | | | | 3-Month LIBOR | | | | 2.000% | | | | 4/30/25 | | | | BBB– | | | | 5,461,381 | |
| | 2,464 | | | Cineworld Group PLC, Term Loan B | | | 4.484% | | | | 1-Month LIBOR | | | | 2.250% | | | | 2/28/25 | | | | BB– | | | | 2,459,308 | |
| | 14,269 | | | Clear Channel Communications, Inc., Exit Term Loan, (DD1) | | | 6.579% | | | | 3-Month LIBOR | | | | 4.000% | | | | 5/01/26 | | | | BB– | | | | 14,394,188 | |
| | 3,469 | | | CSC Holdings LLC, Term Loan B | | | 4.825% | | | | 1-Month LIBOR | | | | 2.500% | | | | 1/25/26 | | | | BB | | | | 3,473,054 | |
| | 1,000 | | | CSC Holdings LLC, Refinancing Term Loan | | | 4.575% | | | | 1-Month LIBOR | | | | 2.250% | | | | 7/17/25 | | | | BB | | | | 998,750 | |
| | 3,730 | | | Cumulus Media, Inc., Exit Term Loan | | | 6.740% | | | | 1-Month LIBOR | | | | 4.500% | | | | 5/13/22 | | | | B | | | | 3,761,852 | |
| | 998 | | | EW Scripps, Term Loan B | | | 4.984% | | | | 1-Month LIBOR | | | | 2.750% | | | | 5/01/26 | | | | BB | | | | 1,000,617 | |
| | 830 | | | Gray Television, Inc., Term Loan B2 | | | 4.582% | | | | 3-Month LIBOR | | | | 2.250% | | | | 2/07/24 | | | | BB | | | | 831,605 | |
| | 995 | | | Gray Television, Inc., Term Loan C | | | 4.832% | | | | 3-Month LIBOR | | | | 2.500% | | | | 1/02/26 | | | | BB | | | | 998,905 | |
| | 2,743 | | | IMG Worldwide, Inc., Term Loan B | | | 4.990% | | | | 1-Month LIBOR | | | | 2.750% | | | | 5/18/25 | | | | B | | | | 2,678,345 | |
| | 4,033 | | | Intelsat Jackson Holdings, S.A., Term Loan B | | | 5.991% | | | | 1-Month LIBOR | | | | 3.750% | | | | 11/30/23 | | | | B1 | | | | 4,050,404 | |
| | 4,838 | | | McGraw-Hill Education Holdings LLC, Term Loan B | | | 6.234% | | | | 1-Month LIBOR | | | | 4.000% | | | | 5/02/22 | | | | B+ | | | | 4,640,143 | |
| | 2,315 | | | Meredith Corporation, Term Loan B1 | | | 4.984% | | | | 1-Month LIBOR | | | | 2.750% | | | | 1/31/25 | | | | BB | | | | 2,325,808 | |
| | 1,985 | | | Metro-Goldwyn-Mayer, Inc., Term Loan, First Lien | | | 4.740% | | | | 1-Month LIBOR | | | | 2.500% | | | | 7/03/25 | | | | BB | | | | 1,980,038 | |
| | 1,250 | | | Metro-Goldwyn-Mayer, Inc., Term Loan, Second Lien | | | 6.740% | | | | 1-Month LIBOR | | | | 4.500% | | | | 7/03/26 | | | | B2 | | | | 1,218,750 | |
| | 1,500 | | | Nexstar Broadcasting, Inc., Term Loan B, (WI/DD) | | | TBD | | | | TBD | | | | TBD | | | | TBD | | | | BB | | | | 1,502,190 | |
| | 635 | | | Nexstar Broadcasting, Inc., Term Loan B3 | | | 4.652% | | | | 1-Month LIBOR | | | | 2.250% | | | | 1/17/24 | | | | BB | | | | 633,664 | |
| | 3,190 | | | Nexstar Broadcasting, Inc., Term Loan B3 | | | 4.491% | | | | 1-Month LIBOR | | | | 2.250% | | | | 1/17/24 | | | | BB | | | | 3,180,928 | |
| | 529 | | | Red Ventures, Term Loan B | | | 5.234% | | | | 1-Month LIBOR | | | | 3.000% | | | | 11/08/24 | | | | BB– | | | | 531,634 | |
| | 3,511 | | | Sinclair Television Group, Term Loan B2 | | | 4.490% | | | | 1-Month LIBOR | | | | 2.250% | | | | 1/03/24 | | | | BB+ | | | | 3,513,303 | |
| | 673 | | | Sinclair Television Group, Term Loan B2, (WI/DD) | | | TBD | | | | TBD | | | | TBD | | | | TBD | | | | BB+ | | | | 675,460 | |
| | 577 | | | Sinclair Television Group, Term Loan B2, (WI/DD) | | | TBD | | | | TBD | | | | TBD | | | | TBD | | | | BB+ | | | | 578,965 | |
| | 2,130 | | | Springer Science & Business Media, Inc., Term Loan B13, First Lien | | | 5.734% | | | | 1-Month LIBOR | | | | 3.500% | | | | 8/15/22 | | | | B | | | | 2,136,101 | |
| | 2,066 | | | UPC Financing Partnership, Term Loan AR1, First Lien | | | 4.854% | | | | 1-Month LIBOR | | | | 2.500% | | | | 1/15/26 | | | | BB | | | | 2,068,175 | |
| | 6,203 | | | WideOpenWest Finance LLC, Term Loan B | | | 5.519% | | | | 1-Month LIBOR | | | | 3.250% | | | | 8/18/23 | | | | B | | | | 6,104,776 | |
| | 83,215 | | | Total Media | | | | | | | | | | | | | | | | | | | | | | | 82,254,791 | |
| |
| | | | Multiline Retail – 1.3% (0.8% of Total Investments) | |
| | | | | | | |
| | 71 | | | 99 Cents Only Stores, Term Loan B2, Second Lien, (cash 7.402%, PIK 1.500%) | | | 8.902% | | | | Prime | | | | 4.000% | | | | 1/13/22 | | | | CCC+ | | | | 64,038 | |
| | 1,330 | | | 99 Cents Only Stores, Term Loan B2, Second Lien, (cash 7.752%, PIK 1.500%) | | | 9.022% | | | | 3-Month LIBOR | | | | 6.500% | | | | 1/13/22 | | | | CCC+ | | | | 1,199,585 | |
| | 1,701 | | | 99 Cents Only Stores, Term Loan B2, Second Lien, (cash 7.651%, PIK 1.500%) | | | 9.151% | | | | 6-Month LIBOR | | | | 6.500% | | | | 1/13/22 | | | | CCC+ | | | | 1,534,207 | |
| | 3,178 | | | Belk, Inc., Term Loan B, First Lien | | | 7.285% | | | | 3-Month LIBOR | | | | 4.750% | | | | 12/12/22 | | | | B2 | | | | 2,587,649 | |
| | 1,975 | | | EG America LLC, Term Loan, First Lien | | | 6.330% | | | | 3-Month LIBOR | | | | 4.000% | | | | 2/07/25 | | | | B | | | | 1,958,962 | |
| | 899 | | | Hudson’s Bay Company, Term Loan B, First Lien | | | 5.638% | | | | 1-Month LIBOR | | | | 3.250% | | | | 9/30/22 | | | | BB | | | | 899,112 | |
| | 9,154 | | | Total Multiline Retail | | | | | | | | | | | | | | | | | | | | | | | 8,243,553 | |
46
| | | | | | | | | | | | | | | | | | | | | | | | | | | | |
Principal
Amount (000) | | | Description (1) | | Coupon (2) | | | Reference
Rate (2) | | | Spread (2) | | | Maturity (3) | | | Ratings (4) | | | Value | |
| |
| | | | Oil, Gas & Consumable Fuels – 2.4% (1.5% of Total Investments) | |
| | | | | | | |
| $ | 1,440 | | | BCP Renaissance Parent, Term Loan B | | | 5.756% | | | | 3-Month LIBOR | | | | 3.500% | | | | 10/31/24 | | | | B+ | | | $ | 1,441,800 | |
| | 1,397 | | | California Resources Corporation, Term Loan | | | 12.616% | | | | 1-Month LIBOR | | | | 10.375% | | | | 12/31/21 | | | | B | | | | 1,406,838 | |
| | 5,040 | | | California Resources Corporation, Term Loan B | | | 6.991% | | | | 1-Month LIBOR | | | | 4.750% | | | | 12/31/22 | | | | B | | | | 4,819,500 | |
| | 3,333 | | | Fieldwood Energy LLC, Exit Term Loan | | | 7.506% | | | | 3-Month LIBOR | | | | 5.250% | | | | 4/11/22 | | | | B+ | | | | 3,077,484 | |
| | 3,651 | | | Fieldwood Energy LLC, Exit Term Loan, Second Lien | | | 9.506% | | | | 3-Month LIBOR | | | | 7.250% | | | | 4/11/23 | | | | B+ | | | | 3,027,533 | |
| | 1,442 | | | Peabody Energy Corporation, Term Loan B | | | 4.984% | | | | 1-Month LIBOR | | | | 2.750% | | | | 3/31/25 | | | | BB | | | | 1,440,841 | |
| | 16,303 | | | Total Oil, Gas & Consumable Fuels | | | | | | | | | | | | | | | | | | | | | | | 15,213,996 | |
| |
| | | | Personal Products – 1.8% (1.1% of Total Investments) | |
| | | | | | | |
| | 7,652 | | | Coty, Inc., Term Loan A, (DD1) | | | 4.360% | | | | 1-Month LIBOR | | | | 2.000% | | | | 4/05/23 | | | | BB– | | | | 7,326,938 | |
| | 265 | | | Coty, Inc., Term Loan B | | | 4.610% | | | | 1-Month LIBOR | | | | 2.250% | | | | 4/07/25 | | | | BB– | | | | 257,053 | |
| | 4,347 | | | Revlon Consumer Products Corporation, Term Loan B, First Lien | | | 6.022% | | | | 3-Month LIBOR | | | | 3.500% | | | | 11/16/20 | | | | B3 | | | | 3,560,884 | |
| | 12,264 | | | Total Personal Products | | | | | | | | | | | | | | | | | | | | | | | 11,144,875 | |
| |
| | | | Pharmaceuticals – 3.0% (1.9% of Total Investments) | |
| | | | | | | |
| | 1,303 | | | Alphabet Holding Company, Inc., Initial Term Loan, First Lien | | | 5.734% | | | | 1-Month LIBOR | | | | 3.500% | | | | 9/26/24 | | | | B– | | | | 1,236,076 | |
| | 1,247 | | | Catalent Pharma Solutions, Inc., Dollar Term Loan B2 | | | 4.484% | | | | 1-Month LIBOR | | | | 2.250% | | | | 5/18/26 | | | | BB | | | | 1,254,674 | |
| | 5,478 | | | Concordia Healthcare Corp, Exit Term Loan | | | 7.825% | | | | 1-Month LIBOR | | | | 5.500% | | | | 9/06/24 | | | | B– | | | | 5,339,690 | |
| | 3,250 | | | Valeant Pharmaceuticals International, Inc., Term Loan B | | | 5.129% | | | | 1-Month LIBOR | | | | 2.750% | | | | 11/27/25 | | | | Ba2 | | | | 3,253,391 | |
| | 7,914 | | | Valeant Pharmaceuticals International, Inc., Term Loan, First Lien | | | 5.379% | | | | 1-Month LIBOR | | | | 3.000% | | | | 6/02/25 | | | | Ba2 | | | | 7,951,699 | |
| | 19,192 | | | Total Pharmaceuticals | | | | | | | | | | | | | | | | | | | | | | | 19,035,530 | |
| |
| | | | Professional Services – 2.3% (1.4% of Total Investments) | |
| | | | | | | |
| | 2,239 | | | Ceridian HCM Holding, Inc., Term Loan B | | | 5.234% | | | | 1-Month LIBOR | | | | 3.000% | | | | 4/30/25 | | | | B2 | | | | 2,256,307 | |
| | 1,600 | | | Dun & Bradstreet Corp., Initial Term Loan | | | 7.241% | | | | 1-Month LIBOR | | | | 5.000% | | | | 2/06/26 | | | | B2 | | | | 1,612,504 | |
| | 4,876 | | | Nielsen Finance LLC, Term Loan B4, (DD1) | | | 4.367% | | | | 1-Month LIBOR | | | | 2.000% | | | | 10/04/23 | | | | BBB– | | | | 4,874,868 | |
| | 1,197 | | | On Assignment, Inc., Term Loan B | | | 4.234% | | | | 1-Month LIBOR | | | | 2.000% | | | | 4/02/25 | | | | BB | | | | 1,199,768 | |
| | 4,994 | | | Skillsoft Corporation, Initial Term Loan, First Lien, (DD1) | | | 6.946% | | | | 6-Month LIBOR | | | | 4.750% | | | | 4/28/21 | | | | CCC+ | | | | 4,254,455 | |
| | 14,906 | | | Total Professional Services | | | | | | | | | | | | | | | | | | | | | | | 14,197,902 | |
| |
| | | | Real Estate Management & Development – 1.5% (0.9% of Total Investments) | |
| | | | | | | |
| | 4,730 | | | GGP, Initial Term Loan A2 | | | 4.484% | | | | 1-Month LIBOR | | | | 2.250% | | | | 8/28/23 | | | | BB+ | | | | 4,605,553 | |
| | 1,453 | | | Realogy Group LLC, Term Loan A | | | 4.522% | | | | 1-Month LIBOR | | | | 2.250% | | | | 2/08/23 | | | | Ba1 | | | | 1,418,613 | |
| | 1,834 | | | Realogy Group LLC, Term Loan B | | | 4.522% | | | | 1-Month LIBOR | | | | 2.250% | | | | 2/08/25 | | | | BB+ | | | | 1,752,239 | |
| | 1,938 | | | Trico Group, LLC, Initial Term Loan, First Lien | | | 9.330% | | | | 3-Month LIBOR | | | | 7.000% | | | | 2/02/24 | | | | B | | | | 1,872,562 | |
| | 9,955 | | | Total Real Estate Management & Development | | | | | | | | | | | | | | | | | | | | | | | 9,648,967 | |
| |
| | | | Road & Rail – 2.7% (1.6% of Total Investments) | |
| | | | | | | |
| | 7,445 | | | Avolon LLC, Term Loan B3 | | | 4.022% | | | | 1-Month LIBOR | | | | 1.750% | | | | 1/30/25 | | | | Baa2 | | | | 7,472,593 | |
| | 1,930 | | | Quality Distribution, Incremental Term Loan, First Lien | | | 7.830% | | | | 3-Month LIBOR | | | | 5.500% | | | | 8/18/22 | | | | B– | | | | 1,920,350 | |
| | 1,746 | | | Savage Enterprises LLC, Term Loan B | | | 6.880% | | | | 1-Month LIBOR | | | | 4.500% | | | | 8/01/25 | | | | B+ | | | | 1,754,097 | |
| | 4,957 | | | Uber Technologies, Inc., Term Loan | | | 6.325% | | | | 1-Month LIBOR | | | | 4.000% | | | | 4/04/25 | | | | B1 | | | | 4,983,991 | |
| | 740 | | | Uber Technologies, Inc., Term Loan | | | 5.769% | | | | 1-Month LIBOR | | | | 3.500% | | | | 7/13/23 | | | | B1 | | | | 743,392 | |
| | 16,818 | | | Total Road & Rail | | | | | | | | | | | | | | | | | | | | | | | 16,874,423 | |
| |
| | | | Semiconductors & Semiconductor Equipment – 0.8% (0.5% of Total Investments) | |
| | | | | | | |
| | 901 | | | Cabot Microelectronics, Term Loan B | | | 4.500% | | | | 1-Month LIBOR | | | | 2.250% | | | | 11/14/25 | | | | BB+ | | | | 904,482 | |
| | 801 | | | Lumileds, Term Loan B | | | 5.830% | | | | 3-Month LIBOR | | | | 3.500% | | | | 6/30/24 | | | | B+ | | | | 540,328 | |
| | 1,725 | | | Microchip Technology., Inc, Term Loan B | | | 4.240% | | | | 1-Month LIBOR | | | | 2.000% | | | | 5/29/25 | | | | Baa3 | | | | 1,726,831 | |
| | 2,021 | | | ON Semiconductor Corporation, Term Loan B3 | | | 3.984% | | | | 1-Month LIBOR | | | | 1.750% | | | | 3/31/23 | | | | Baa3 | | | | 2,020,539 | |
| | 5,448 | | | Total Semiconductors & Semiconductor Equipment | | | | | | | | | | | | 5,192,180 | |
47
| | |
| |
| JFR | | Nuveen Floating Rate Income Fund(continued) |
| | Portfolio of Investments July 31, 2019 |
| | | | | | | | | | | | | | | | | | | | | | | | | | | | |
Principal
Amount (000) | | | Description (1) | | Coupon (2) | | | Reference
Rate (2) | | | Spread (2) | | | Maturity (3) | | | Ratings (4) | | | Value | |
| |
| | | | Software – 14.3% (8.8% of Total Investments) | |
| | | | | | | |
| $ | 1,610 | | | Blackboard, Inc., Term Loan B4 | | | 7.300% | | | | 3-Month LIBOR | | | | 5.000% | | | | 6/30/21 | | | | B– | | | $ | 1,605,873 | |
| | 7,509 | | | BMC Software, Inc., Term Loan B | | | 6.580% | | | | 3-Month LIBOR | | | | 4.250% | | | | 10/02/25 | | | | B | | | | 7,237,248 | |
| | 2,124 | | | Compuware Corporation, Term Loan, First Lien | | | 6.234% | | | | 1-Month LIBOR | | | | 4.000% | | | | 8/22/25 | | | | B | | | | 2,134,485 | |
| | 3,100 | | | Datto, Inc., Term Loan | | | 6.580% | | | | 3-Month LIBOR | | | | 4.250% | | | | 4/02/26 | | | | B | | | | 3,131,000 | |
| | 2,145 | | | DiscoverOrg LLC, Term Loan B | | | 6.734% | | | | 1-Month LIBOR | | | | 4.500% | | | | 2/02/26 | | | | B | | | | 2,143,285 | |
| | 3,497 | | | Ellucian, Term Loan B, First Lien | | | 5.580% | | | | 3-Month LIBOR | | | | 3.250% | | | | 9/30/22 | | | | B | | | | 3,501,910 | |
| | 3,744 | | | Epicor Software Corporation, Term Loan B, (DD1) | | | 5.490% | | | | 1-Month LIBOR | | | | 3.250% | | | | 6/01/22 | | | | B2 | | | | 3,740,782 | |
| | 4,378 | | | Greeneden U.S. Holdings II LLC, Term Loan B | | | 5.484% | | | | 1-Month LIBOR | | | | 3.250% | | | | 12/01/23 | | | | B2 | | | | 4,362,646 | |
| | 12,034 | | | Infor (US), Inc., Term Loan B | | | 5.080% | | | | 3-Month LIBOR | | | | 2.750% | | | | 2/01/22 | | | | Ba3 | | | | 12,053,668 | |
| | 3,629 | | | Informatica, Term Loan B | | | 5.484% | | | | 1-Month LIBOR | | | | 3.250% | | | | 8/05/22 | | | | B1 | | | | 3,650,077 | |
| | 1,460 | | | Kronos Incorporated, Term Loan B | | | 5.579% | | | | 3-Month LIBOR | | | | 3.000% | | | | 11/01/23 | | | | B | | | | 1,462,247 | |
| | 875 | | | McAfee Holdings International, Inc., Term Loan, Second Lien | | | 10.741% | | | | 1-Month LIBOR | | | | 8.500% | | | | 9/29/25 | | | | B– | | | | 887,031 | |
| | 4,572 | | | McAfee LLC, Term Loan B | | | 5.991% | | | | 1-Month LIBOR | | | | 3.750% | | | | 9/30/24 | | | | B | | | | 4,576,732 | |
| | 1,110 | | | Micro Focus International PLC, New Term Loan | | | 4.734% | | | | 1-Month LIBOR | | | | 2.500% | | | | 6/21/24 | | | | BB– | | | | 1,103,415 | |
| | 7,495 | | | Micro Focus International PLC, Term Loan B | | | 4.734% | | | | 1-Month LIBOR | | | | 2.500% | | | | 6/21/24 | | | | BB– | | | | 7,451,630 | |
| | 7,117 | | | Micro Focus International PLC, Term Loan B2 | | | 4.484% | | | | 1-Month LIBOR | | | | 2.250% | | | | 11/19/21 | | | | BB– | | | | 7,117,087 | |
| | 2,018 | | | Misys, New Term Loan, Second Lien, (DD1) | | | 9.446% | | | | 1-Month LIBOR | | | | 7.250% | | | | 6/13/25 | | | | CCC+ | | | | 2,010,498 | |
| | 4,710 | | | Misys, New Term Loan, First Lien | | | 5.734% | | | | 1-Month LIBOR | | | | 3.500% | | | | 6/13/24 | | | | B | | | | 4,630,882 | |
| | 504 | | | Mitchell International, Inc., Initial Term Loan, First Lien | | | 5.484% | | | | 1-Month LIBOR | | | | 3.250% | | | | 11/29/24 | | | | B2 | | | | 479,573 | |
| | 667 | | | Mitchell International, Inc., Initial Term Loan, Second Lien | | | 9.484% | | | | 1-Month LIBOR | | | | 7.250% | | | | 12/01/25 | | | | CCC | | | | 628,333 | |
| | 1,700 | | | Perforce Software Inc., Term Loan, First Lien | | | 6.734% | | | | 1-Month LIBOR | | | | 4.500% | | | | 7/01/26 | | | | B2 | | | | 1,698,946 | |
| | 1,950 | | | RP Crown Parent LLC, Term Loan B | | | 4.984% | | | | 1-Month LIBOR | | | | 2.750% | | | | 10/15/23 | | | | B1 | | | | 1,949,512 | |
| | 4,146 | | | SS&C Technologies, Inc./ Sunshine Acquisition II, Inc., Term Loan B3 | | | 4.484% | | | | 1-Month LIBOR | | | | 2.250% | | | | 4/16/25 | | | | BB+ | | | | 4,151,220 | |
| | 2,823 | | | SS&C Technologies, Inc./ Sunshine Acquisition II, Inc., Term Loan B4 | | | 4.484% | | | | 1-Month LIBOR | | | | 2.250% | | | | 4/16/25 | | | | BB | | | | 2,826,304 | |
| | 4,584 | | | TIBCO Software, Inc., Term Loan B | | | 6.390% | | | | 1-Month LIBOR | | | | 4.000% | | | | 6/30/26 | | | | B1 | | | | 4,598,347 | |
| | 1,000 | | | Ultimate Software, Term Loan, First Lien | | | 6.080% | | | | 3-Month LIBOR | | | | 3.750% | | | | 5/04/26 | | | | B | | | | 1,009,295 | |
| | 90,501 | | | Total Software | | | | | | | | | | | | | | | | | | | | | | | 90,142,026 | |
| |
| | | | Specialty Retail – 2.4% (1.5% of Total Investments) | |
| | | | | | | |
| | 2,313 | | | Academy, Ltd., Term Loan B | | | 6.402% | | | | 1-Month LIBOR | | | | 4.000% | | | | 7/01/22 | | | | CCC+ | | | | 1,635,886 | |
| | 623 | | | Neiman Marcus Group Inc., The Cash Pay Extended | | | 8.380% | | | | 1-Month LIBOR | | | | 6.000% | | | | 10/25/23 | | | | CCC+ | | | | 536,802 | |
| | 3,471 | | | Petco Animal Supplies, Inc., Term Loan B1 | | | 5.506% | | | | 3-Month LIBOR | | | | 3.250% | | | | 1/26/23 | | | | B2 | | | | 2,703,300 | |
| | 6,623 | | | Petsmart Inc., Term Loan B, First Lien, (DD1) | | | 6.380% | | | | 1-Month LIBOR | | | | 4.000% | | | | 3/11/22 | | | | B | | | | 6,513,969 | |
| | 2,972 | | | Petsmart Inc., Term Loan B, (DD1) | | | 5.380% | | | | 1-Month LIBOR | | | | 3.000% | | | | 3/11/22 | | | | B2 | | | | 2,863,753 | |
| | 1,534 | | | Serta Simmons Holdings LLC, Term Loan, Second Lien | | | 10.314% | | | | 1-Month LIBOR | | | | 8.000% | | | | 11/08/24 | | | | CCC– | | | | 713,445 | |
| | 17,536 | | | Total Specialty Retail | | | | | | | | | | | | | | | | | | | | | | | 14,967,155 | |
| |
| | | | Technology Hardware, Storage & Peripherals – 4.6% (2.8% of Total Investments) | |
| | | | | | | |
| | 19,400 | | | Dell International LLC, Refinancing Term Loan B | | | 4.240% | | | | 1-Month LIBOR | | | | 2.000% | | | | 9/07/23 | | | | BBB– | | | | 19,474,269 | |
| | 9,527 | | | Western Digital, Term Loan B | | | 4.012% | | | | 1-Month LIBOR | | | | 1.750% | | | | 4/29/23 | | | | Baa2 | | | | 9,470,954 | |
| | 28,927 | | | Total Technology Hardware, Storage & Peripherals | | | | | | | | | | | | 28,945,223 | |
| |
| | | | Trading Companies & Distributors – 0.0% (0.0% of Total Investments) | |
| | | | | | | |
| | 282 | | | HD Supply Waterworks, Ltd., Term Loan B | | | 5.270% | | | | 3-Month LIBOR | | | | 2.750% | | | | 8/01/24 | | | | B+ | | | | 282,660 | |
| |
| | | | Transportation Infrastructure – 0.6% (0.4% of Total Investments) | |
| | | | | | | |
| | 995 | | | Atlantic Aviation FBO Inc., Term Loan | | | 5.990% | | | | 1-Month LIBOR | | | | 3.750% | | | | 12/06/25 | | | | BB | | | | 1,008,681 | |
| | 1,481 | | | Ceva Group PLC, Term Loan B | | | 7.330% | | | | 3-Month LIBOR | | | | 5.000% | | | | 8/04/25 | | | | B1 | | | | 1,305,563 | |
| | 524 | | | Standard Aero, Canadien Term Loan | | | 6.330% | | | | 3-Month LIBOR | | | | 4.000% | | | | 4/06/26 | | | | B | | | | 528,409 | |
| | 976 | | | Standard Aero, USD Term Loan B | | | 6.330% | | | | 3-Month LIBOR | | | | 4.000% | | | | 4/06/26 | | | | B | | | | 982,841 | |
| | 3,976 | | | Total Transportation Infrastructure | | | | | | | | | | | | | | | | | | | | | | | 3,825,494 | |
| |
| | | | Wireless Telecommunication Services – 3.1% (1.9% of Total Investments) | |
| | | | | | | |
| | 3,963 | | | Asurion LLC, Term Loan B4 | | | 5.234% | | | | 1-Month LIBOR | | | | 3.000% | | | | 8/04/22 | | | | Ba3 | | | | 3,974,965 | |
| | 4,232 | | | Sprint Corporation, Incremental Term Loan | | | 5.250% | | | | 1-Month LIBOR | | | | 3.000% | | | | 2/02/24 | | | | Ba2 | | | | 4,235,168 | |
48
| | | | | | | | | | | | | | | | | | | | | | | | | | | | |
Principal
Amount (000) | | | Description (1) | | Coupon (2) | | | Reference
Rate (2) | | | Spread (2) | | | Maturity (3) | | | Ratings (4) | | | Value | |
| |
| | | | Wireless Telecommunication Services(continued) | |
| | | | | | | |
| $ | 11,241 | | | Sprint Corporation, Term Loan, First Lien | | | 4.750% | | | | 1-Month LIBOR | | | | 2.500% | | | | 2/02/24 | | | | Ba2 | | | $ | 11,231,414 | |
| | 19,436 | | | Total Wireless Telecommunication Services | | | | | | | | | | | | | | | | 19,441,547 | |
| $ | 913,830 | | | Total Variable Rate Senior Loan Interests (cost $902,546,455) | | | | | | | | | | | | | | | | 888,812,260 | |
| | | | | | | |
Principal
Amount (000) | | | Description (1) | | | | | | | | Coupon | | | Maturity | | | Ratings (4) | | | Value | |
| |
| | | | CORPORATE BONDS – 9.7% (5.9% of Total Investments) | |
| |
| | | | Communications Equipment – 2.5% (1.5% of Total Investments) | |
| | | | | | | |
| $ | 210 | | | Avaya Inc, 144A, (5), (7) | | | | | | | | | | | 7.000% | | | | 4/01/19 | | | | N/R | | | $ | — | |
| | 5,150 | | | Avaya Inc, 144A, (5), (7) | | | | | | | | | | | 10.500% | | | | 3/01/21 | | | | N/R | | | | — | |
| | 8,702 | | | Intelsat Jackson Holdings SA | | | | | | | | | | | 5.500% | | | | 8/01/23 | | | | CCC+ | | | | 8,016,718 | |
| | 7,080 | | | Intelsat Jackson Holdings SA, 144A | | | | | | | | | | | 9.750% | | | | 7/15/25 | | | | CCC+ | | | | 7,327,800 | |
| | 21,142 | | | Total Communications Equipment | | | | | | | | | | | | | | | | | | | | | | | 15,344,518 | |
| |
| | | | Containers & Packaging – 0.9% (0.6% of Total Investments) | |
| | | | | | | |
| | 5,717 | | | Reynolds Group Issuer Inc / Reynolds Group Issuer LLC / Reynolds Group Issuer Lu | | | | | | | | | | | 5.750% | | | | 10/15/20 | | | | B+ | | | | 5,738,491 | |
| |
| | | | Diversified Telecommunication Services – 0.8% (0.5% of Total Investments) | |
| | | | | | | |
| | 1,185 | | | Consolidated Communications Inc | | | | | | | | | | | 6.500% | | | | 10/01/22 | | | | B3 | | | | 1,074,342 | |
| | 3,350 | | | CSC Holdings LLC, 144A | | | | | | | | | | | 10.875% | | | | 10/15/25 | | | | B | | | | 3,815,884 | |
| | 4,535 | | | Total Diversified Telecommunication Services | | | | | | | | | | | | | | | | 4,890,226 | |
| |
| | | | Health Care Providers & Services – 0.5% (0.3% of Total Investments) | |
| | | | | | | |
| | 830 | | | Tenet Healthcare Corp | | | | | | | | | | | 6.000% | | | | 10/01/20 | | | | BB | | | | 853,862 | |
| | 910 | | | Tenet Healthcare Corp | | | | | | | | | | | 8.125% | | | | 4/01/22 | | | | B– | | | | 971,425 | |
| | 1,365 | | | Tenet Healthcare Corp, 144A | | | | | | | | | | | 6.250% | | | | 2/01/27 | | | | Ba3 | | | | 1,412,775 | |
| | 3,105 | | | Total Health Care Providers & Services | | | | | | | | | | | | | | | | 3,238,062 | |
| |
| | | | Hotels, Restaurants & Leisure – 0.4% (0.2% of Total Investments) | |
| | | | | | | |
| | 2,210 | | | Scientific Games International Inc | | | | | | | | | | | 10.000% | | | | 12/01/22 | | | | B– | | | | 2,303,969 | |
| |
| | | | Media – 2.7% (1.6% of Total Investments) | |
| | | | | | | |
| | 4,575 | | | AMC Entertainment Holdings Inc | | | | | | | | | | | 6.125% | | | | 5/15/27 | | | | B3 | | | | 4,097,485 | |
| | 1,000 | | | CCO Holdings LLC / CCO Holdings Capital Corp | | | | | | | | | | | 5.750% | | | | 9/01/23 | | | | BB+ | | | | 1,020,000 | |
| | 200 | | | Charter Communications Operating LLC / Charter Communications Operating Capital | | | | | | | | | | | 3.579% | | | | 7/23/20 | | | | BBB– | | | | 201,577 | |
| | 1,250 | | | Clear Channel Worldwide Holdings Inc, 144A | | | | | | | | | | | 9.250% | | | | 2/15/24 | | | | CCC+ | | | | 1,356,250 | |
| | 645 | | | DISH DBS Corp | | | | | | | | | | | 5.125% | | | | 5/01/20 | | | | BB– | | | | 652,256 | |
| | 2,000 | | | DISH DBS Corp | | | | | | | | | | | 5.875% | | | | 7/15/22 | | | | BB– | | | | 2,021,540 | |
| | 4,812 | | | iHeartCommunications Inc, (5), (7) | | | | | | | | | | | 9.000% | | | | 12/15/19 | | | | N/R | | | | — | |
| | 1,762 | | | iHeartCommunications Inc, 144A, (5), (7) | | | | | | | | | | | 11.250% | | | | 3/01/21 | | | | N/R | | | | — | |
| | 8,250 | | | iHeartCommunications Inc, (5), (7) | | | | | | | | | | | 9.000% | | | | 3/01/21 | | | | N/R | | | | — | |
| | 16,459 | | | iHeartCommunications Inc, (5), (7) | | | | | | | | | | | 12.000% | | | | 8/01/21 | | | | N/R | | | | — | |
| | 6,462 | | | iHeartCommunications Inc | | | | | | | | | | | 8.375% | | | | 5/01/27 | | | | B– | | | | 6,800,648 | |
| | 1,045 | | | Intelsat Luxembourg SA | | | | | | | | | | | 8.125% | | | | 6/01/23 | | | | CCC– | | | | 843,524 | |
| | 48,460 | | | Total Media | | | | | | | | | | | | | | | | | | | | | | | 16,993,280 | |
| |
| | | | Oil, Gas & Consumable Fuels – 0.2% (0.1% of Total Investments) | |
| | | | | | | |
| | 1,442 | | | Denbury Resources Inc, 144A | | | | | | | | | | | 9.250% | | | | 3/31/22 | | | | B | | | | 1,265,355 | |
| | 245 | | | Denbury Resources Inc, 144A | | | | | | | | | | | 7.750% | | | | 2/15/24 | | | | B | | | | 179,463 | |
| | 1,687 | | | Total Oil, Gas & Consumable Fuels | | | | | | | | | | | | | | | | | | | | | | | 1,444,818 | |
| |
| | | | Pharmaceuticals – 0.2% (0.1% of Total Investments) | |
| | | | | | | |
| | 1,165 | | | Advanz Pharma Corp | | | | | | | | | | | 8.000% | | | | 9/06/24 | | | | B– | | | | 1,144,613 | |
| |
| | | | Real Estate Management & Development – 0.4% (0.3% of Total Investments) | |
| | | | | | | |
| | 2,875 | | | Realogy Group LLC, 144A | | | | | | | | | | | 5.250% | | | | 12/01/21 | | | | B | | | | 2,767,187 | |
49
| | |
| |
| JFR | | Nuveen Floating Rate Income Fund(continued) |
| | Portfolio of Investments July 31, 2019 |
| | | | | | | | | | | | | | | | | | | | | | | | | | | | |
Principal
Amount (000) | | | Description (1) | | | | | | | | Coupon | | | Maturity | | | Ratings (4) | | | Value | |
| |
| | | | Semiconductors & Semiconductor Equipment – 0.4% (0.3% of Total Investments) | |
| | | | | | | |
| $ | 1,564 | | | Advanced Micro Devices Inc | | | | | | | | | | | 7.500% | | | | 8/15/22 | | | | BB– | | | $ | 1,769,275 | |
| | 930 | | | Advanced Micro Devices Inc | | | | | | | | | | | 7.000% | | | | 7/01/24 | | | | BB– | | | | 969,525 | |
| | 2,494 | | | Total Semiconductors & Semiconductor Equipment | | | | | | | | | | | | | | | | 2,738,800 | |
| |
| | | | Wireless Telecommunication Services – 0.7% (0.4% of Total Investments) | |
| | | | | | | |
| | 1,395 | | | Intelsat Connect Finance SA, 144A | | | | | | | | | | | 9.500% | | | | 2/15/23 | | | | CCC– | | | | 1,251,594 | |
| | 750 | | | Level 3 Financing Inc | | | | | | | | | | | 5.375% | | | | 8/15/22 | | | | BB | | | | 753,750 | |
| | 1,105 | | | Sprint Corp | | | | | | | | | | | 7.875% | | | | 9/15/23 | | | | B+ | | | | 1,227,931 | |
| | 835 | | | Sprint Corp | | | | | | | | | | | 7.125% | | | | 6/15/24 | | | | B+ | | | | 911,194 | |
| | 4,085 | | | Total Wireless Telecommunication Services | | | | | | | | | | | | 4,144,469 | |
| $ | 97,475 | | | Total Corporate Bonds (cost $59,894,585) | | | | | | | | | | | | 60,748,433 | |
| | | | | | | |
| Shares | | | Description (1) | | | | | | | | | | | | | | | | | Value | |
| |
| | | | COMMON STOCKS – 2.7% (1.6% of Total Investments) | |
| |
| | | | Diversified Consumer Services – 0.0% (0.0% of Total Investments) | |
| | | | | | | |
| | 18,448 | | | Cengage Learning Holdings II Inc, (8), (9) | | | | | | | | | | | | | | | | | | | | | | $ | 230,047 | |
| |
| | | | Energy Equipment & Services – 0.2% (0.1% of Total Investments) | |
| | | | | | | |
| | 83,230 | | | Transocean Ltd | | | | | | | | | | | | | | | | | | | | | | | 506,038 | |
| | 2,712 | | | Vantage Drilling International, (8), (9) | | | | | | | | | | | | | | | | | | | | | | | 640,032 | |
| | | | Total Energy Equipment & Services | | | | | | | | | | | | | | | | 1,146,070 | |
| |
| | | | Health Care Providers & Services – 0.0% (0.0% of Total Investments) | |
| | | | | | | |
| | 74,059 | | | Millennium Health LLC, (8), (9) | | | | | | | | | | | | | | | | | | | | | | | 741 | |
| | 68,990 | | | Millennium Health LLC, (7), (9) | | | | | | | | | | | | | | | | | | | | | | | 75,865 | |
| | 64,762 | | | Millennium Health LLC, (7), (9) | | | | | | | | | | | | | | | | | | | | | | | 64,734 | |
| | | | Total Health Care Providers & Services | | | | | | | | | | | | | | | | 141,340 | |
| |
| | | | Internet & Direct Marketing Retail – 0.0% (0.0% of Total Investments) | |
| | | | | | | |
| | 17,539 | | | Catalina Marketing Corp, (8), (9) | | | | | | | | | | | | | | | | | | | | | | | 87,695 | |
| |
| | | | Marine – 0.0% (0.0% of Total Investments) | |
| | | | | | | |
| | 7,338 | | | HGIM Corp, (8), (9) | | | | | | | | | | | | | | | | | | | | | | | 102,732 | |
| |
| | | | Media – 1.9% (1.2% of Total Investments) | |
| | | | | | | |
| | 813,624 | | | Clear Channel Outdoor Holdings Inc, (9) | | | | | | | | | | | | | | | | | | | | | | | 2,465,281 | |
| | 105,851 | | | Cumulus Media Inc | | | | | | | | | | | | | | | | | | | | | | | 1,599,408 | |
| | 1,973,746 | | | Hibu plc, (8), (9) | | | | | | | | | | | | | | | | | | | | | | | 400,670 | |
| | 394,504 | | | iHeartMedia Inc, (9) | | | | | | | | | | | | | | | | | | | | | | | 5,901,780 | |
| | 26,045 | | | Metro-Goldwyn-Mayer Inc, (8) | | | | | | | | | | | | | | | | | | | | | | | 1,721,132 | |
| | 45,942 | | | Tribune Co, (7) | | | | | | | | | | | | | | | | | | | | | | | 25,268 | |
| | | | Total Media | | | | | | | | | | | | | | | | | | | | | | | 12,113,539 | |
| |
| | | | Pharmaceuticals – 0.1% (0.0% of Total Investments) | |
| | | | | | | |
| | 34,047 | | | Advanz Pharma Corp, (9) | | | | | | | | | | | | | | | | | | | | | | | 453,506 | |
| |
| | | | Software – 0.5% (0.3% of Total Investments) | |
| | | | | | | |
| | 238,317 | | | Avaya Holdings Corp, (9) | | | | | | | | | | | | | | | | | | | | | | | 2,869,337 | |
| |
| | | | Specialty Retail – 0.0% (0.0% of Total Investments) | |
| | | | | | | |
| | 10,908 | | | Gymboree Holding Corp, (8) | | | | | | | | | | | | | | | | | | | | | | | 5,454 | |
| | 29,698 | | | Gymboree Holding Corp, (8) | | | | | | | | | | | | | | | | | | | | | | | 14,849 | |
| | | | Total Specialty Retail | | | | | | | | | | | | | | | | | | | | | | | 20,303 | |
| | | | Total Common Stocks (cost $34,532,002) | | | | | | | | | | | | | | | | 17,164,569 | |
50
| | | | | | | | | | | | | | | | | | | | | | | | | | | | |
| Shares | | | Description (1), (10) | | | | | | | | | | | | | | | | | Value | |
| |
| | | | INVESTMENT COMPANIES – 1.7% (1.1% of Total Investments) | |
| | | | | | | |
| | 353,668 | | | Eaton Vance Floating-Rate Income Trust | | | | | | | | | | | | | | | | | | | | | | $ | 4,767,444 | |
| | 968,586 | | | Eaton Vance Senior Income Trust | | | | | | | | | | | | | | | | | | | | | | | 6,102,092 | |
| | | | Total Investment Companies (cost $11,981,509) | | | | | | | | | | | | | | | | 10,869,536 | |
| | | | | | | |
Principal
Amount (000) | | | Description (1) | | | | | | | | Coupon | | | Maturity | | | Ratings (4) | | | Value | |
| |
| | | | ASSET-BACKED SECURITIES – 1.0% ( 0.6% of Total Investments) | |
| | | | | |
| $ | 1,200 | | | Bristol Park CLO LTD, Series2016-1A, 144A,(3-Month LIBOR reference rate + 7.250% spread), (11) | | | | 9.553% | | | | 4/15/29 | | | | Ba3 | | | $ | 1,201,290 | |
| | 500 | | | Carlyle Global Market Strategies Collateralized Loan Obligations, Series2013-2A, 144A,(3-Month LIBOR reference rate + 5.250% spread), (11) | | | | 7.550% | | | | 1/18/29 | | | | BB– | | | | 458,765 | |
| | 1,200 | | | Dryden 50 Senior Loan Fund, Series2017-50A,(3-Month LIBOR reference rate + 6.260% spread), (11) | | | | 8.563% | | | | 7/15/30 | | | | Ba3 | | | | 1,166,081 | |
| | 1,250 | | | Gilbert Park CLO LTD, Series2017-1A,(3-Month LIBOR reference rate + 6.400% spread), (11) | | | | 9.187% | | | | 10/15/30 | | | | Ba3 | | | | 1,219,681 | |
| | 1,500 | | | Madison Park Funding Limited, Collateralized Loan Obligations, Series2012-10A, 144A,(3-Month LIBOR reference rate + 6.400% spread), (11) | | | | 8.678% | | | | 1/20/29 | | | | BB– | | | | 1,476,687 | |
| | 600 | | | Neuberger Berman Loan Advisers CLO 28 Limited, Series2018-28A,(3-Month LIBOR reference rate + 5.600% spread), (11) | | | | 7.878% | | | | 4/20/30 | | | | BB– | | | | 564,026 | |
| $ | 6,250 | | | Total Asset-Backed Securities (cost $6,208,034) | | | | | | | | | | | | | | | | 6,086,530 | |
| | | | | | | |
| Shares | | | Description (1) | | | | | | | | | | | | | | | | | Value | |
| |
| | | | COMMON STOCK RIGHTS – 0.1% (0.0% of Total Investments) | |
| |
| | | | Oil, Gas & Consumable Fuels – 0.1% (0.0% of Total Investments) | |
| | | | | | | |
| | 2,637 | | | Fieldwood Energy LLC, (8), (9) | | | | | | | | | | | | | | | | | | | | | | $ | 78,451 | |
| | 13,053 | | | Fieldwood Energy LLC, (8), (9) | | | | | | | | | | | | | | | | | | | | | | | 388,327 | |
| | | | Total Common Stock Rights (cost $372,582) | | | | | | | | | | | | | | | | 466,778 | |
| | | | | | | |
Principal
Amount (000) | | | Description (1) | | | | | | | | Coupon | | | Maturity | | | Ratings (4) | | | Value | |
| |
| | | | CONVERTIBLE BONDS – 0.0% (0.0% of Total Investments) | |
| |
| | | | Oil, Gas & Consumable Fuels – 0.0% (0.0% of Total Investments) | |
| | | | | | | |
| $ | 175 | | | Denbury Resources Inc, 144A | | | | | | | | | | | 6.375% | | | | 12/31/24 | | | | B | | | $ | 106,361 | |
| $ | 175 | | | Total Convertible Bonds (cost $118,505) | | | | | | | | | | | | | | | | 106,361 | |
| | | | | | | |
| Shares | | | Description (1) | | | | | | | | | | | | | | | | | Value | |
| |
| | | | WARRANTS – 0.1% (0.1% of Total Investments) | |
| | | | |
| | | | Marine – 0.1% (0.1% of Total Investments) | | | | | | | | | | |
| | | | | | | |
| | 32,786 | | | HGIM Corp, (8) | | | | | | | | | | | | | | | | | | | | | | $ | 459,004 | |
| | | | |
| | | | Software – 0.0% (0.0% of Total Investments) | | | | | | | | | | |
| | | | | | | |
| | 21,002 | | | Avaya Holdings Corp, (8) | | | | | | | | | | | | | | | | | | | | | | | 15,752 | |
| | | | Total Warrants (cost $3,226,750) | | | | | | | | | | | | | | | | 474,756 | |
| | | | Total Long-Term Investments (cost $1,018,880,422) | | | | | | | | | | | | | | | | 984,729,223 | |
| | | | | | | |
| Shares | | | Description (1) | | | | | | | | Coupon | | | | | | | | | Value | |
| |
| | | | SHORT-TERM INVESTMENTS – 7.0% (4.3% of Total Investments) | |
| |
| | | | INVESTMENT COMPANIES – 7.0% (4.3% of Total Investments) | |
| | | | | | | |
| | 43,812,049 | | | BlackRock Liquidity FundsT-Fund Portfolio, (10) | | | | | | | | | | | 2.254% (12) | | | | | | | | | | | $ | 43,812,049 | |
| | | | Total Short-Term Investments (cost $43,812,049) | | | | 43,812,049 | |
| | | | Total Investments (cost $1,062,692,471) – 163.8% | | | | 1,028,541,272 | |
| | | | Borrowings – (42.1)% (13), (14) | | | | (264,500,000 | ) |
| | | | Term Preferred Shares, net of deferred offering costs – (18.2)% (15) | | | | (114,075,264 | ) |
| | | | Other Assets Less Liabilities – (3.5)% (16) | | | | (21,747,562 | ) |
| | | | Net Assets Applicable to Common Shares – 100% | | | $ | 628,218,446 | |
51
| | |
| |
| JFR | | Nuveen Floating Rate Income Fund(continued) |
| | Portfolio of Investments July 31, 2019 |
Investment in Derivatives
Interest Rate Swaps – OTC Uncleared
| | | | | | | | | | | | | | | | | | | | | | | | | | | | | | | | |
| Counterparty | | Notional
Amount | | | Fund
Pay/Receive
Floating Rate | | | Floating Rate Index | | | Fixed Rate
(Annualized) | | | Fixed Rate
Payment
Frequency | | | Maturity
Date | | | Value | | | Unrealized
Appreciation
(Depreciation) | |
Morgan Stanley Capital Services LLC | | $ | 25,000,000 | | | | Pay | | | | 1-Month LIBOR | | | | 3.700 | %(17) | | | Monthly | | | | 1/01/22 | (18) | | $ | (1,936 | ) | | $ | (1,936 | ) |
Morgan Stanley Capital Services LLC | | | 35,000,000 | | | | Pay | | | | 1-Month LIBOR | | | | 5.750 | | | | Monthly | | | | 6/01/24 | (19) | | | 40,047 | | | | 40,047 | |
Morgan Stanley Capital Services LLC | | | 55,000,000 | | | | Pay | | | | 1-Month LIBOR | | | | 4.000 | | | | Monthly | | | | 1/01/27 | (20) | | | 470,110 | | | | 470,110 | |
Total | | $ | 115,000,000 | | | | | | | | | | | | | | | | | | | | | | | $ | 508,221 | | | $ | 508,221 | |
Total unrealized appreciation on interest rate swaps | | | | | | | | | | | | | | | $ | 510,157 | |
Total unrealized depreciation on interest rate swaps | | | | | | | | | | | | | | | $ | (1,936 | ) |
52
For Fund portfolio compliance purposes, the Fund’s industry classifications refer to any one or more of the industrysub-classifications used by one or more widely recognized market indexes or ratings group indexes, and/or as defined by Fund management. This definition may not apply for purposes of this report, which may combine industrysub-classifications into sectors for reporting ease.
| (1) | All percentages shown in the Portfolio of Investments are based on net assets applicable to common shares unless otherwise noted. |
| (2) | Senior loans generally pay interest at rates which are periodically adjusted by reference to a base short-term, floating lending rate (Reference Rate) plus an assigned fixed rate (Spread). These floating lending rates are generally (i) the lending rate referenced by the London Inter-Bank Offered Rate (“LIBOR”), or (ii) the prime rate offered by one or more major United States banks. Senior loans may be considered restricted in that the Fund ordinarily is contractually obligated to receive approval from the agent bank and/or borrower prior to the disposition of a senior loan. The rate shown is the coupon as of the end of the reporting period. |
| (3) | Senior Loans generally are subject to mandatory and/or optional prepayment. Because of these mandatory prepayment conditions and because there may be significant economic incentives for a borrower to prepay, prepayments of senior loans may occur. As a result, the actual remaining maturity of senior loans held may be substantially less than the stated maturities shown. |
| (4) | For financial reporting purposes, the ratings disclosed are the highest of Standard & Poor’s Group (“Standard & Poor’s”), Moody’s Investors Service, Inc. (“Moody’s”) or Fitch, Inc. (“Fitch”) rating. This treatment of split-rated securities may differ from that used for other purposes, such as for Fund investment policies. Ratings below BBB by Standard & Poor’s, Baa by Moody’s or BBB by Fitch are considered to be below investment grade. Holdings designated N/R are not rated by any of these national rating agencies. Ratings are not covered by the report of independent registered public accounting firm. |
| (5) | Defaulted security. A security whose issuer has failed to fully pay principal and/or interest when due, or is under the protection of bankruptcy. |
| (6) | Investment, or portion of investment, represents an outstanding unfunded senior loan commitment. See Notes to Financial Statements, Note 8 – Senior Loan Commitments for more information. |
| (7) | Investment valued at fair value using methods determined in good faith by, or at the discretion of, the Board. For fair value measurement disclosure purposes, investment classified as Level 3. See Notes to Financial Statements, Note 2 – Investment Valuation and Fair Value Measurements for more information. |
| (8) | For fair value measurement disclosure purposes, investment classified as Level 2. See Notes to Financial Statements, Note 2 – Investment Valuation and Fair Value Measurements for more information. |
| (9) | Non-income producing; issuer has not declared a dividend within the past twelve months. |
| (10) | A copy of the most recent financial statements for these investment companies can be obtained directly from the Securities and Exchange Commission on its website at http://www.sec.gov. |
| (11) | Variable rate security. The rate shown is the coupon as of the end of the reporting period. |
| (12) | The rate shown is the annualizedseven-day subsidized yield as of the end of the reporting period. |
| (13) | Borrowings as a percentage of Total Investments is 25.7%. |
| (14) | The Fund segregates 100% of its eligible investments (excluding any investments separately pledged as collateral for specific investments in derivatives, when applicable) in the Portfolio of Investments as collateral for borrowings. |
| (15) | Term Preferred Shares, net of deferred offering costs as a percentage of Total Investments is 11.1%. |
| (16) | Other assets less liabilities includes the unrealized appreciation (depreciation) of certainover-the counter (“OTC”) derivatives as presented on the Statement of Assets and Liabilities, when applicable. The unrealized appreciation (depreciation) of OTC cleared and exchange-traded derivatives is recognized as part of cash collateral at brokers and/or the receivable or payable for variation margin as presented on the Statement of Assets and Liabilities, when applicable. |
| (17) | Effective April 1, 2017, the fixed rate paid by the Fund increased according to a predetermined schedule as specified in the swap contract. Additionally, this fixed rate increase will continue to occur every three months on specific dates through the swap contract’s termination date. |
| (18) | This interest rate swap has an optional early termination date beginning on January 1, 2019 and monthly thereafter through the termination date as specified in the swap contract. |
| (19) | This interest rate swap has an optional early termination date beginning on June 1, 2020 and monthly thereafter through the termination date as specified in the swap contract. |
| (20) | This interest rate swap has an optional early termination date beginning on January 1, 2021 and monthly thereafter through the termination date as specified in the swap contract. |
| 144A | Investment is exempt from registration under Rule 144A of the Securities Act of 1933, as amended. These investments may only be resold in transactions exempt from registration, which are normally those transactions with qualified institutional buyers. |
| DD1 | Portion of investment purchased on a delayed delivery basis. |
| LIBOR | London Inter-Bank Offered Rate |
| PIK | Payment-in-kind (“PIK”) security. Depending on the terms of the security, income may be received in the form of cash, securities, or a combination of both. The PIK rate shown, where applicable, represents the annualized rate of the last PIK payment made by the issuer as of the end of the reporting period. |
| TBD | Senior loan purchased on a when-issued or delayed-delivery basis. Certain details associated with this purchase are not known prior to the settlement date of the transaction. In addition, senior loans typically trade without accrued interest and therefore a coupon rate is not available prior to settlement. At settlement, if still unknown, the borrower or counterparty will provide the Fund with the final coupon rate and maturity date. |
| WI/DD | Purchased on a when-issued or delayed delivery basis. |
See accompanying notes to financial statements.
53
| | |
| JRO | | Nuveen Floating Rate Income
Opportunity Fund Portfolio of Investments July 31, 2019 |
| | | | | | | | | | | | | | | | | | | | | | | | | | | | |
Principal
Amount (000) | | | Description (1) | | Coupon (2) | | | Reference
Rate (2) | | | Spread (2) | | | Maturity (3) | | | Ratings (4) | | | Value | |
| |
| | | | LONG-TERM INVESTMENTS – 155.2% (95.0% of Total Investments) | |
| |
| | | | VARIABLE RATE SENIOR LOAN INTERESTS – 142.0% (86.9% of Total Investments) (2) | |
| |
| | | | Aerospace & Defense – 2.7% (1.7% of Total Investments) | |
| | | | | | | |
| $ | 1,400 | | | MacDonald, Dettwiler and Associates, Ltd., Term Loan B | | | 4.990% | | | | 1-Month LIBOR | | | | 2.750% | | | | 10/04/24 | | | | BB | | | $ | 1,272,537 | |
| | 376 | | | Rexnord LLC/ RBS Global, Inc., Term Loan, First Lien | | | 4.234% | | | | 1-Month LIBOR | | | | 2.000% | | | | 8/21/24 | | | | BBB– | | | | 377,869 | |
| | 4,438 | | | Sequa Corporation, Term Loan B | | | 7.560% | | | | 3-Month LIBOR | | | | 5.000% | | | | 11/28/21 | | | | B– | | | | 4,390,026 | |
| | 1,597 | | | Sequa Corporation, Term Loan, Second Lien | | | 11.266% | | | | 3-Month LIBOR | | | | 9.000% | | | | 4/28/22 | | | | Caa2 | | | | 1,555,709 | |
| | 3,275 | | | Transdigm, Inc., Term Loan E | | | 4.830% | | | | 3-Month LIBOR | | | | 2.500% | | | | 5/30/25 | | | | Ba3 | | | | 3,253,973 | |
| | 728 | | | Transdigm, Inc., Term Loan F | | | 4.830% | | | | 3-Month LIBOR | | | | 2.500% | | | | 6/09/23 | | | | Ba3 | | | | 725,182 | |
| | 395 | | | Transdigm, Inc., Term Loan G, First Lien | | | 4.830% | | | | 3-Month LIBOR | | | | 2.500% | | | | 8/22/24 | | | | Ba3 | | | | 392,041 | |
| | 12,209 | | | Total Aerospace & Defense | | | | | | | | | | | | | | | | | | | | | | | 11,967,337 | |
| |
| | | | Air Freight & Logistics – 0.6% (0.4% of Total Investments) | |
| | | | | | | |
| | 1,055 | | | PAE Holding Corporation, Term Loan B | | | 7.770% | | | | 3-Month LIBOR | | | | 5.500% | | | | 10/20/22 | | | | B+ | | | | 1,059,445 | |
| | 1,444 | | | XPO Logistics, Inc., Term Loan B | | | 4.234% | | | | 1-Month LIBOR | | | | 2.000% | | | | 2/24/25 | | | | BBB– | | | | 1,448,447 | |
| | 2,499 | | | Total Air Freight & Logistics | | | | | | | | | | | | | | | | | | | | | | | 2,507,892 | |
| |
| | | | Airlines – 1.9% (1.1% of Total Investments) | |
| | | | | | | |
| | 854 | | | American Airlines, Inc., Replacement Term Loan | | | 4.379% | | | | 1-Month LIBOR | | | | 2.000% | | | | 10/10/21 | | | | BB+ | | | | 854,326 | |
| | 1,421 | | | American Airlines, Inc., Term Loan 2025 | | | 4.061% | | | | 3-Month LIBOR | | | | 1.750% | | | | 6/27/25 | | | | BB+ | | | | 1,395,309 | |
| | 1,850 | | | American Airlines, Inc., Term Loan B, (WI/DD) | | | TBD | | | | TBD | | | | TBD | | | | TBD | | | | BB+ | | | | 1,846,069 | |
| | 4,181 | | | American Airlines, Inc., Term Loan B | | | 4.325% | | | | 1-Month LIBOR | | | | 2.000% | | | | 12/14/23 | | | | BB+ | | | | 4,167,027 | |
| | 8,306 | | | Total Airlines | | | | | | | | | | | | | | | | | | | | | | | 8,262,731 | |
| |
| | | | Auto Components – 1.1% (0.7% of Total Investments) | |
| | | | | | | |
| | 1,123 | | | DexKo Global, Inc., Term Loan B | | | 5.734% | | | | 1-Month LIBOR | | | | 3.500% | | | | 7/24/24 | | | | B1 | | | | 1,120,290 | |
| | 2,400 | | | Johnson Controls Inc., Term Loan B | | | 5.734% | | | | 1-Month LIBOR | | | | 3.500% | | | | 4/30/26 | | | | Ba3 | | | | 2,403,756 | |
| | 1,461 | | | Superior Industries International, Inc., Term Loan B | | | 6.234% | | | | 1-Month LIBOR | | | | 4.000% | | | | 5/22/24 | | | | B1 | | | | 1,395,656 | |
| | 4,984 | | | Total Auto Components | | | | | | | | | | | | | | | | | | | | | | | 4,919,702 | |
| |
| | | | Automobiles – 0.4% (0.2% of Total Investments) | |
| | | | | | | |
| | 750 | | | Caliber Collision, Term Loan B | | | 5.860% | | | | 1-Month LIBOR | | | | 3.500% | | | | 2/05/26 | | | | B1 | | | | 755,625 | |
| | 985 | | | Navistar, Inc., Term Loan B | | | 5.830% | | | | 1-Month LIBOR | | | | 3.500% | | | | 11/06/24 | | | | Ba2 | | | | 989,314 | |
| | 1,735 | | | Total Automobiles | | | | | | | | | | | | | | | | | | | | | | | 1,744,939 | |
| |
| | | | Beverages – 0.7% (0.4% of Total Investments) | |
| | | | | | | |
| | 2,941 | | | Jacobs Douwe Egberts, Term Loan B | | | 4.438% | | | | 1-Month LIBOR | | | | 2.000% | | | | 11/01/25 | | | | Ba2 | | | | 2,947,750 | |
| |
| | | | Biotechnology – 0.9% (0.5% of Total Investments) | |
| | | | | | | |
| | 3,910 | | | Grifols, Inc., Term Loan B | | | 4.599% | | | | 1-Week LIBOR | | | | 2.250% | | | | 1/31/25 | | | | BB | | | | 3,927,126 | |
| |
| | | | Building Products – 2.4% (1.5% of Total Investments) | |
| | | | | | | |
| | 1,491 | | | ACProducts, Inc., Term Loan, First Lien | | | 7.734% | | | | 1-Month LIBOR | | | | 5.500% | | | | 2/15/24 | | | | B+ | | | | 1,423,547 | |
| | 563 | | | Fairmount, Initial Term Loan | | | 6.313% | | | | 3-Month LIBOR | | | | 4.000% | | | | 6/01/25 | | | | BB– | | | | 481,432 | |
| | 646 | | | Ply Gem Industries, Inc., Term Loan B | | | 6.119% | | | | 1-Month LIBOR | | | | 3.750% | | | | 4/12/25 | | | | B+ | | | | 632,200 | |
| | 8,322 | | | Quikrete Holdings, Inc., Term Loan B | | | 4.984% | | | | 1-Month LIBOR | | | | 2.750% | | | | 11/15/23 | | | | BB– | | | | 8,269,218 | |
| | 11,022 | | | Total Building Products | | | | | | | | | | | | | | | | | | | | | | | 10,806,397 | |
| |
| | | | Capital Markets – 2.5% (1.5% of Total Investments) | |
| | | | | | | |
| | 1,506 | | | Capital Automotive LP, Term Loan, First Lien, (DD1) | | | 4.740% | | | | 1-Month LIBOR | | | | 2.500% | | | | 3/25/24 | | | | B1 | | | | 1,506,231 | |
| | 2,321 | | | Capital Automotive LP, Term Loan, Second Lien | | | 8.234% | | | | 1-Month LIBOR | | | | 6.000% | | | | 3/24/25 | | | | B3 | | | | 2,337,794 | |
| | 1,990 | | | Distributed Power, Term Loan B | | | 5.139% | | | | 1-Month LIBOR | | | | 3.250% | | | | 10/31/25 | | | | B | | | | 1,962,637 | |
54
| | | | | | | | | | | | | | | | | | | | | | | | | | | | |
Principal
Amount (000) | | | Description (1) | | Coupon (2) | | | Reference
Rate (2) | | | Spread (2) | | | Maturity (3) | | | Ratings (4) | | | Value | |
| |
| | | | Capital Markets(continued) | |
| | | | | | | |
| $ | 5,216 | | | RPI Finance Trust, Term Loan B6 | | | 4.234% | | | | 1-Month LIBOR | | | | 2.000% | | | | 3/27/23 | | | | BBB– | | | $ | 5,249,762 | |
| | 11,033 | | | Total Capital Markets | | | | | | | | | | | | | | | | | | | | | | | 11,056,424 | |
| |
| | | | Chemicals – 0.4% (0.2% of Total Investments) | |
| | | | | | | |
| | 884 | | | Ineos US Finance LLC, Term Loan | | | 4.258% | | | | 2-Month LIBOR | | | | 2.000% | | | | 4/01/24 | | | | BB+ | | | | 871,545 | |
| | 376 | | | Mineral Technologies, Inc., Term Loan B2 | | | 4.750% | | | | N/A | | | | 4.750% | | | | 5/07/21 | | | | BB+ | | | | 377,426 | |
| | 415 | | | Univar, Inc., Term Loan B | | | 4.484% | | | | 1-Month LIBOR | | | | 2.250% | | | | 7/01/24 | | | | BB+ | | | | 416,565 | |
| | 1,675 | | | Total Chemicals | | | | | | | | | | | | | | | | | | | | | | | 1,665,536 | |
| |
| | | | Commercial Services & Supplies – 4.0% (2.5% of Total Investments) | |
| | | | | | | |
| | 1,293 | | | ADS Waste Holdings, Inc., Term Loan B | | | 4.599% | | | | 1-Week LIBOR | | | | 2.250% | | | | 11/10/23 | | | | BB+ | | | | 1,297,433 | |
| | 665 | | | Brand Energy & Infrastructure Services, Inc., Term Loan B, First Lien | | | 6.613% | | | | 2-Month LIBOR | | | | 4.250% | | | | 6/21/24 | | | | B– | | | | 643,616 | |
| | 220 | | | Education Management LLC, Term Loan A, (5) | | | 0.000% | | | | N/A | | | | N/A | | | | 7/02/20 | | | | N/R | | | | 2,202 | |
| | 318 | | | Education Management LLC, Term Loan B, (5) | | | 0.000% | | | | N/A | | | | N/A | | | | 7/02/20 | | | | N/R | | | | 429 | |
| | 6,546 | | | Formula One Group, Term Loan B, (DD1) | | | 4.734% | | | | 1-Month LIBOR | | | | 2.500% | | | | 2/01/24 | | | | B+ | | | | 6,481,456 | |
| | 187 | | | Fort Dearborn Holding Company, Inc., Term Loan, First Lien | | | 6.315% | | | | 3-Month LIBOR | | | | 4.000% | | | | 10/19/23 | | | | B2 | | | | 181,965 | |
| | 1,000 | | | Fort Dearborn Holding Company, Inc., Term Loan, Second Lien | | | 10.813% | | | | 3-Month LIBOR | | | | 8.500% | | | | 10/21/24 | | | | CCC | | | | 950,000 | |
| | 1,737 | | | GFL Environmental, Term Loan | | | 5.234% | | | | 1-Month LIBOR | | | | 3.000% | | | | 5/30/25 | | | | B+ | | | | 1,726,760 | |
| | 271 | | | Insurance Auto Actions Inc., Term Loan | | | 4.625% | | | | 3-Month LIBOR | | | | 2.250% | | | | 5/22/26 | | | | BB | | | | 272,334 | |
| | 3,092 | | | iQor US, Inc., Term Loan, First Lien | | | 7.319% | | | | 3-Month LIBOR | | | | 5.000% | | | | 4/01/21 | | | | Caa1 | | | | 2,952,474 | |
| | 333 | | | iQor US, Inc., Term Loan, Second Lien | | | 11.069% | | | | 3-Month LIBOR | | | | 8.750% | | | | 4/01/22 | | | | Caa3 | | | | 268,333 | |
| | 251 | | | KAR Auction Services, Inc., Term Loan B5 | | | 4.875% | | | | 3-Month LIBOR | | | | 2.500% | | | | 3/09/23 | | | | BB | | | | 251,086 | |
| | 1,955 | | | Protection One, Inc., Term Loan | | | 4.984% | | | | 1-Month LIBOR | | | | 2.750% | | | | 5/02/22 | | | | BB– | | | | 1,955,252 | |
| | 600 | | | Robertshaw US Holding Corp., Term Loan B, (WI/DD) | | | TBD | | | | TBD | | | | TBD | | | | TBD | | | | B | | | | 559,500 | |
| | 254 | | | West Corporation, Incremental Term Loan B1 | | | 6.022% | | | | 3-Month LIBOR | | | | 3.500% | | | | 10/10/24 | | | | B1 | | | | 235,763 | |
| | 18,722 | | | Total Commercial Services & Supplies | | | | | | | | | | | | | | | | | | | | | | | 17,778,603 | |
| |
| | | | Communications Equipment – 5.1% (3.1% of Total Investments) | |
| | | | | | | |
| | 6,224 | | | Avaya, Inc., Term Loan B, (DD1) | | | 6.575% | | | | 1-Month LIBOR | | | | 4.250% | | | | 12/15/24 | | | | B | | | | 6,004,051 | |
| | 6,250 | | | CommScope, Inc., Term Loan B | | | 5.484% | | | | 1-Month LIBOR | | | | 3.250% | | | | 4/06/26 | | | | Ba1 | | | | 6,268,750 | |
| | 1,393 | | | Mitel US Holdings, Inc., Term Loan, First Lien | | | 6.734% | | | | 1-Month LIBOR | | | | 4.500% | | | | 11/30/25 | | | | B | | | | 1,360,160 | |
| | 243 | | | MultiPlan, Inc., Term Loan B | | | 5.080% | | | | 3-Month LIBOR | | | | 2.750% | | | | 6/07/23 | | | | B+ | | | | 236,816 | |
| | 1,558 | | | Plantronics, Term Loan B | | | 4.734% | | | | 1-Month LIBOR | | | | 2.500% | | | | 7/02/25 | | | | Ba1 | | | | 1,560,758 | |
| | 7,406 | | | Univision Communications, Inc., Term Loan C5 | | | 4.984% | | | | 1-Month LIBOR | | | | 2.750% | | | | 3/15/24 | | | | B | | | | 7,260,496 | |
| | 23,074 | | | Total Communications Equipment | | | | | | | | | | | | | | | | | | | | | | | 22,691,031 | |
| |
| | | | Construction & Engineering – 0.7% (0.4% of Total Investments) | |
| | | | | | | |
| | 1,425 | | | KBR, Inc, Term Loan B | | | 5.984% | | | | 1-Month LIBOR | | | | 3.750% | | | | 4/25/25 | | | | Ba3 | | | | 1,434,804 | |
| | 1,747 | | | Traverse Midstream Partners, Term Loan B | | | 6.260% | | | | 2-Month LIBOR | | | | 4.000% | | | | 9/27/24 | | | | B+ | | | | 1,715,090 | |
| | 3,172 | | | Total Construction & Engineering | | | | | | | | | | | | | | | | | | | | | | | 3,149,894 | |
| |
| | | | Consumer Finance – 0.5% (0.3% of Total Investments) | |
| | | | | | | |
| | 2,213 | | | Verscend Technologies, Tern Loan B | | | 6.734% | | | | 1-Month LIBOR | | | | 4.500% | | | | 8/27/25 | | | | B+ | | | | 2,227,153 | |
| |
| | | | Containers & Packaging – 0.7% (0.4% of Total Investments) | |
| | | | | | | |
| | 1,048 | | | Berry Global, Inc., Term Loan Q | | | 4.629% | | | | 1-Month LIBOR | | | | 2.250% | | | | 10/01/22 | | | | BBB– | | | | 1,049,032 | |
| | 2,000 | | | Berry Global, Inc., Term Loan U | | | 4.902% | | | | 1-Month LIBOR | | | | 2.500% | | | | 7/01/26 | | | | BBB– | | | | 2,000,940 | |
| | 3,048 | | | Total Containers & Packaging | | | | | | | | | | | | | | | | | | | | | | | 3,049,972 | |
| |
| | | | Distributors – 0.2% (0.1% of Total Investments) | |
| | | | | | | |
| | 965 | | | SRS Distribution, Inc., Term Loan B | | | 5.484% | | | | 1-Month LIBOR | | | | 3.250% | | | | 5/23/25 | | | | B3 | | | | 936,269 | |
| |
| | | | Diversified Consumer Services – 2.6% (1.6% of Total Investments) | |
| | | | | | | |
| | 4,935 | | | Cengage Learning Acquisitions, Inc., Term Loan B | | | 6.484% | | | | 1-Month LIBOR | | | | 4.250% | | | | 6/07/23 | | | | B | | | | 4,768,125 | |
| | 150 | | | Education Management LLC, Elevated Term Loan B, (5) | | | 7.734% | | | | 1-Month LIBOR | | | | 5.500% | | | | 7/02/20 | | | | N/R | | | | 1,879 | |
| | 4,544 | | | Houghton Mifflin, Term Loan B, First Lien | | | 5.234% | | | | 1-Month LIBOR | | | | 3.000% | | | | 5/28/21 | | | | B | | | | 4,365,943 | |
55
| | |
| |
| JRO | | Nuveen Floating Rate Income Opportunity Fund(continued) |
| | Portfolio of Investments July 31, 2019 |
| | | | | | | | | | | | | | | | | | | | | | | | | | | | |
Principal
Amount (000) | | | Description (1) | | Coupon (2) | | | Reference
Rate (2) | | | Spread (2) | | | Maturity (3) | | | Ratings (4) | | | Value | |
| |
| | | | Diversified Consumer Services(continued) | |
| | | | | | | |
| $ | 2,239 | | | Refinitiv, Term Loan B | | | 5.984% | | | | 1-Month LIBOR | | | | 3.750% | | | | 10/01/25 | | | | B | | | $ | 2,240,149 | |
| | 11,868 | | | Total Diversified Consumer Services | | | | | | | | | | | | | | | | | | | | | | | 11,376,096 | |
| |
| | | | Diversified Financial Services – 1.0% (0.6% of Total Investments) | |
| | | | | | | |
| | 1,500 | | | Blackstone CQP, Term Loan | | | 5.887% | | | | 3-Month LIBOR | | | | 3.500% | | | | 9/30/24 | | | | B+ | | | | 1,507,973 | |
| | 1,082 | | | Getty Images, Inc., Initial Dollar Term Loan | | | 6.750% | | | | 1-Month LIBOR | | | | 4.500% | | | | 2/19/26 | | | | B2 | | | | 1,082,074 | |
| | 562 | | | Lions Gate Entertainment Corp., Term Loan B | | | 4.484% | | | | 1-Month LIBOR | | | | 2.250% | | | | 3/24/25 | | | | Ba2 | | | | 562,202 | |
| | 3,364 | | | Walter Investment Management Corporation, Term Loan B, First Lien, (5) | | | 0.000% | | | | N/A | | | | N/A | | | | 6/30/22 | | | | Ca | | | | 1,286,612 | |
| | 6,508 | | | Total Diversified Financial Services | | | | | | | | | | | | | | | | | | | | | | | 4,438,861 | |
| |
| | | | Diversified Telecommunication Services – 7.7% (4.7% of Total Investments) | |
| | | | | | | |
| | 1,388 | | | CenturyLink, Inc., Initial Term Loan A | | | 4.984% | | | | 1-Month LIBOR | | | | 2.750% | | | | 11/01/22 | | | | BBB– | | | | 1,389,887 | |
| | 8,537 | | | CenturyLink, Inc., Term Loan B | | | 4.984% | | | | 1-Month LIBOR | | | | 2.750% | | | | 1/31/25 | | | | BBB– | | | | 8,495,189 | |
| | 5,411 | | | Frontier Communications Corporation, Term Loan B | | | 5.990% | | | | 1-Month LIBOR | | | | 3.750% | | | | 1/14/22 | | | | B2 | | | | 5,357,511 | |
| | 383 | | | Intelsat Jackson Holdings, S.A., Term Loan B4 | | | 6.741% | | | | 1-Month LIBOR | | | | 4.500% | | | | 1/02/24 | | | | B1 | | | | 388,176 | |
| | 614 | | | Intelsat Jackson Holdings, S.A., Term Loan B5 | | | 6.625% | | | | N/A | | | | 6.625% | | | | 1/02/24 | | | | B1 | | | | 622,259 | |
| | 3,643 | | | Level 3 Financing, Inc., Term Loan B | | | 4.484% | | | | 1-Month LIBOR | | | | 2.250% | | | | 2/22/24 | | | | BBB– | | | | 3,650,803 | |
| | 4,466 | | | Numericable Group S.A., Term Loan B13 | | | 6.325% | | | | 1-Month LIBOR | | | | 4.000% | | | | 8/14/26 | | | | B | | | | 4,452,315 | |
| | 1,000 | | | Windstream Corporation, DIP Term Loan | | | 4.740% | | | | 1-Month LIBOR | | | | 2.500% | | | | 2/26/21 | | | | BBB– | | | | 1,007,500 | |
| | 9,000 | | | Ziggo B.V., Term Loan E | | | 4.825% | | | | 1-Month LIBOR | | | | 2.500% | | | | 4/15/25 | | | | B+ | | | | 8,957,475 | |
| | 34,442 | | | Total Diversified Telecommunication Services | | | | | | | | | | | | | | | | | | | | | | | 34,321,115 | |
| |
| | | | Electric Utilities – 1.0% (0.6% of Total Investments) | |
| | | | | | | |
| | 442 | | | EFS Cogen Holdings LLC, Term Loan B | | | 5.580% | | | | 3-Month LIBOR | | | | 3.250% | | | | 6/28/23 | | | | BB | | | | 442,136 | |
| | 1,000 | | | ExGen Renewables, Term Loan, (WI/DD) | | | TBD | | | | TBD | | | | TBD | | | | TBD | | | | B | | | | 969,585 | |
| | 1,626 | | | Vistra Operations Co., Term Loan B1 | | | 4.234% | | | | 1-Month LIBOR | | | | 2.000% | | | | 8/01/23 | | | | BBB– | | | | 1,630,076 | |
| | 1,273 | | | Vistra Operations Co., Term Loan B3 | | | 4.270% | | | | 3-Month LIBOR | | | | 2.000% | | | | 12/31/25 | | | | BBB– | | | | 1,276,843 | |
| | 4,341 | | | Total Electric Utilities | | | | | | | | | | | | | | | | | | | | | | | 4,318,640 | |
| |
| | | | Electrical Equipment – 0.4% (0.2% of Total Investments) | |
| | | | | | | |
| | 1,625 | | | TTM Technologies, Inc., Term Loan B | | | 4.902% | | | | 1-Month LIBOR | | | | 2.500% | | | | 9/28/24 | | | | BB+ | | | | 1,622,228 | |
| |
| | | | Energy Equipment & Services – 0.6% (0.4% of Total Investments) | |
| | | | | | | |
| | 2,962 | | | McDermott International, Term Loan | | | 7.234% | | | | 1-Month LIBOR | | | | 5.000% | | | | 5/12/25 | | | | Ba3 | | | | 2,838,075 | |
| |
| | | | Equity Real Estate Investment Trust – 1.3% (0.8% of Total Investments) | |
| | | | | | | |
| | 6,052 | | | Communications Sales & Leasing, Inc., Shortfall Term Loan | | | 7.234% | | | | 1-Month LIBOR | | | | 5.000% | | | | 10/24/22 | | | | Caa1 | | | | 5,899,664 | |
| |
| | | | Food & Staples Retailing – 5.9% (3.6% of Total Investments) | |
| | | | | | | |
| | 1,311 | | | Albertson’s LLC, Term Loan B6 | | | 5.234% | | | | 1-Month LIBOR | | | | 3.000% | | | | 6/22/23 | | | | BB | | | | 1,315,310 | |
| | 14,257 | | | Albertson’s LLC, Term Loan B7 | | | 5.234% | | | | 1-Month LIBOR | | | | 3.000% | | | | 11/17/25 | | | | BB | | | | 14,295,014 | |
| | 1,241 | | | Hearthside Group Holdings LLC, Term Loan B | | | 5.922% | | | | 1-Month LIBOR | | | | 3.688% | | | | 5/23/25 | | | | B | | | | 1,220,643 | |
| | 9,360 | | | US Foods, Inc., Term Loan B | | | 4.234% | | | | 1-Month LIBOR | | | | 2.000% | | | | 6/27/23 | | | | BBB– | | | | 9,364,600 | |
| | 26,169 | | | Total Food & Staples Retailing | | | | | | | | | | | | | | | | | | | | | | | 26,195,567 | |
| |
| | | | Food Products – 0.2% (0.1% of Total Investments) | |
| | | | | | | |
| | 14 | | | American Seafoods Group LLC, Term Loan B | | | 7.250% | | | | Prime | | | | 1.750% | | | | 8/21/23 | | | | BB– | | | | 14,436 | |
| | 942 | | | American Seafoods Group LLC, Term Loan B | | | 5.192% | | | | 1-Month LIBOR | | | | 2.750% | | | | 8/21/23 | | | | BB– | | | | 941,966 | |
| | 956 | | | Total Food Products | | | | | | | | | | | | | | | | | | | | | | | 956,402 | |
| |
| | | | Health Care Equipment & Supplies – 2.0% (1.2% of Total Investments) | |
| | | | | | | |
| | 1,715 | | | Acelity, Term Loan B | | | 5.580% | | | | 3-Month LIBOR | | | | 3.250% | | | | 2/02/24 | | | | B1 | | | | 1,722,372 | |
| | 683 | | | Air Methods Term Loan, First Lien, (DD1) | | | 5.830% | | | | 3-Month LIBOR | | | | 3.500% | | | | 4/22/24 | | | | B | | | | 579,668 | |
| | 849 | | | Greatbatch, New Term Loan B | | | 5.380% | | | | 1-Month LIBOR | | | | 3.000% | | | | 10/27/22 | | | | B+ | | | | 854,354 | |
| | 2,647 | | | Onex Carestream Finance LP, Term Loan, First Lien | | | 7.984% | | | | 1-Month LIBOR | | | | 5.750% | | | | 2/28/21 | | | | B1 | | | | 2,551,215 | |
| | 2,262 | | | Onex Carestream Finance LP, Term Loan, Second Lien | | | 11.734% | | | | 1-Month LIBOR | | | | 9.500% | | | | 6/07/21 | | | | B– | | | | 2,154,871 | |
| | 1,082 | | | Vyaire Medical, Inc., Term Loan B | | | 7.070% | | | | 3-Month LIBOR | | | | 4.750% | | | | 4/16/25 | | | | B3 | | | | 1,009,333 | |
| | 9,238 | | | Total Health Care Equipment & Supplies | | | | | | | | | | | | | | | | | | | | | | | 8,871,813 | |
56
| | | | | | | | | | | | | | | | | | | | | | | | | | | | |
Principal
Amount (000) | | | Description (1) | | Coupon (2) | | | Reference
Rate (2) | | | Spread (2) | | | Maturity (3) | | | Ratings (4) | | | Value | |
| |
| | | | Health Care Providers & Services – 9.2% (5.6% of Total Investments) | |
| | | | | | | |
| $ | 3,100 | | | Air Medical Group Holdings, Inc., Term Loan B, (DD1) | | | 5.564% | | | | 1-Month LIBOR | | | | 3.250% | | | | 4/28/22 | | | | B1 | | | $ | 3,012,077 | |
| | 1,239 | | | Ardent Health, Term Loan, First Lien | | | 6.734% | | | | 1-Month LIBOR | | | | 4.500% | | | | 6/30/25 | | | | B1 | | | | 1,243,900 | |
| | 1,154 | | | Brightspring Health, Term Loan B | | | 6.880% | | | | 1-Month LIBOR | | | | 4.500% | | | | 3/05/26 | | | | B1 | | | | 1,161,079 | |
| | 704 | | | Civitas Solutions, Term Loan B | | | 6.490% | | | | 1-Month LIBOR | | | | 4.250% | | | | 3/09/26 | | | | B1 | | | | 709,658 | |
| | 44 | | | Civitas Solutions, Term Loan C | | | 6.490% | | | | 1-Month LIBOR | | | | 4.250% | | | | 3/09/26 | | | | B1 | | | | 44,189 | |
| | 1,383 | | | Concentra, Inc., Term Loan B | | | 5.210% | | | | 3-Month LIBOR | | | | 2.750% | | | | 6/01/22 | | | | B+ | | | | 1,386,407 | |
| | 855 | | | ConvaTec, Inc., Term Loan B | | | 4.580% | | | | 3-Month LIBOR | | | | 2.250% | | | | 10/25/23 | | | | BB | | | | 854,191 | |
| | 3,023 | | | Envision Healthcare Corporation, Initial Term Loan, (DD1) | | | 5.984% | | | | 1-Month LIBOR | | | | 3.750% | | | | 10/10/25 | | | | B+ | | | | 2,606,052 | |
| | 744 | | | HCA, Inc., Term Loan B10 | | | 4.330% | | | | 3-Month LIBOR | | | | 2.000% | | | | 3/13/25 | | | | BBB– | | | | 747,343 | |
| | 2,237 | | | HCA, Inc., Term Loan B11 | | | 4.080% | | | | 3-Month LIBOR | | | | 1.750% | | | | 3/17/23 | | | | BBB– | | | | 2,245,086 | |
| | 638 | | | Healogics, Inc., Term Loan, First Lien | | | 6.730% | | | | 3-Month LIBOR | | | | 4.250% | | | | 7/01/21 | | | | B3 | | | | 506,515 | |
| | 589 | | | Heartland Dental Care, Inc., Term Loan, First Lien | | | 5.984% | | | | 1-Month LIBOR | | | | 3.750% | | | | 4/30/25 | | | | B2 | | | | 568,143 | |
| | 13 | | | Heartland Dental Care, Inc., Delay Draw Facility, (6) | | | 3.750% | | | | N/A | | | | 3.750% | | | | 4/30/25 | | | | B2 | | | | 12,747 | |
| | 3,203 | | | Kindred at Home Hospice, Term Loan B | | | 6.000% | | | | 1-Month LIBOR | | | | 3.750% | | | | 7/02/25 | | | | B1 | | | | 3,224,911 | |
| | 5,093 | | | Lifepoint Health, Inc., Term Loan, (DD1) | | | 6.769% | | | | 1-Month LIBOR | | | | 4.500% | | | | 11/16/25 | | | | B+ | | | | 5,129,486 | |
| | 1,598 | | | Millennium Laboratories, Inc., Term Loan B, First Lien | | | 8.734% | | | | 1-Month LIBOR | | | | 6.500% | | | | 12/21/20 | | | | Caa3 | | | | 724,403 | |
| | 7,411 | | | Pharmaceutical Product Development, Inc., Term Loan B | | | 4.734% | | | | 1-Month LIBOR | | | | 2.500% | | | | 8/18/22 | | | | Ba3 | | | | 7,409,466 | |
| | 2,285 | | | Prospect Medical Holdings, Term Loan B1 | | | 7.875% | | | | 1-Month LIBOR | | | | 5.500% | | | | 2/22/24 | | | | B | | | | 2,284,035 | |
| | 202 | | | Quorum Health Corp., Term Loan B | | | 9.006% | | | | 3-Month LIBOR | | | | 6.750% | | | | 4/29/22 | | | | B1 | | | | 199,966 | |
| | 4,294 | | | Select Medical Corporation, Term Loan B, (DD1) | | | 4.850% | | | | 3-Month LIBOR | | | | 2.500% | | | | 3/06/25 | | | | Ba2 | | | | 4,291,739 | |
| | 2,327 | | | Team Health, Initial Term Loan | | | 4.984% | | | | 1-Month LIBOR | | | | 2.750% | | | | 2/06/24 | | | | B | | | | 2,046,216 | |
| | 222 | | | Vizient Inc., Term Loan B | | | 4.984% | | | | 1-Month LIBOR | | | | 2.750% | | | | 5/06/26 | | | | BB– | | | | 223,256 | |
| | 42,358 | | | Total Health Care Providers & Services | | | | | | | | | | | | | | | | | | | | | | | 40,630,865 | |
| |
| | | | Health Care Technology – 1.4% (0.9% of Total Investments) | |
| | | | | | | |
| | 6,430 | | | Emdeon, Inc., Term Loan, (DD1) | | | 4.734% | | | | 1-Month LIBOR | | | | 2.500% | | | | 3/01/24 | | | | B+ | | | | 6,426,320 | |
| |
| | | | Hotels, Restaurants & Leisure – 17.9% (10.9% of Total Investments) | |
| | | | | | | |
| | 1,524 | | | 24 Hour Fitness Worldwide, Inc., Term Loan B | | | 5.734% | | | | 1-Month LIBOR | | | | 3.500% | | | | 5/30/25 | | | | Ba3 | | | | 1,527,157 | |
| | 933 | | | Aramark Corporation, Term Loan | | | 4.080% | | | | 3-Month LIBOR | | | | 1.750% | | | | 3/11/25 | | | | BBB– | | | | 934,215 | |
| | 741 | | | Arby’s Restaurant Group, Inc., Term Loan B | | | 5.550% | | | | 3-Month LIBOR | | | | 3.250% | | | | 2/05/25 | | | | B | | | | 738,707 | |
| | 17,309 | | | Burger King Corporation, Term Loan B3 | | | 4.484% | | | | 1-Month LIBOR | | | | 2.250% | | | | 2/16/24 | | | | Ba3 | | | | 17,339,368 | |
| | 8,233 | | | Caesars Entertainment Operating Company, Inc., Term Loan B, (DD1) | | | 4.234% | | | | 1-Month LIBOR | | | | 2.000% | | | | 10/06/24 | | | | BB | | | | 8,225,261 | |
| | 7,791 | | | Caesars Resort Collection, Term Loan, First Lien, (DD1) | | | 4.984% | | | | 1-Month LIBOR | | | | 2.750% | | | | 12/23/24 | | | | BB | | | | 7,741,470 | |
| | 350 | | | Carrols Restaurant Group Inc., Term Loan B | | | 5.500% | | | | 1-Month LIBOR | | | | 3.250% | | | | 4/30/26 | | | | B | | | | 351,531 | |
| | 794 | | | CCM Merger, Inc., Term Loan B | | | 4.484% | | | | 1-Month LIBOR | | | | 2.250% | | | | 8/09/21 | | | | BB– | | | | 795,321 | |
| | 3,241 | | | CityCenter Holdings LLC, Term Loan B | | | 4.484% | | | | 1-Month LIBOR | | | | 2.250% | | | | 4/18/24 | | | | BB– | | | | 3,251,231 | |
| | 1,190 | | | ClubCorp Operations, Inc., Term Loan B | | | 5.080% | | | | 3-Month LIBOR | | | | 2.750% | | | | 9/18/24 | | | | B | | | | 1,100,750 | |
| | 2,895 | | | Equinox Holdings, Inc., Term Loan B1 | | | 5.234% | | | | 1-Month LIBOR | | | | 3.000% | | | | 3/08/24 | | | | B+ | | | | 2,904,114 | |
| | 975 | | | Four Seasons Holdings, Inc., Term Loan B | | | 4.234% | | | | 1-Month LIBOR | | | | 2.000% | | | | 11/30/23 | | | | BB | | | | 977,818 | |
| | 5,976 | | | Hilton Hotels, Term Loan B2 | | | 4.016% | | | | 1-Month LIBOR | | | | 1.750% | | | | 6/22/26 | | | | BBB– | | | | 6,001,782 | |
| | 3,048 | | | Intrawest Resorts Holdings, Inc., Term Loan B | | | 5.234% | | | | 1-Month LIBOR | | | | 3.000% | | | | 7/31/24 | | | | B | | | | 3,057,156 | |
| | 2,430 | | | Life Time Fitness, Inc., Term Loan B | | | 5.272% | | | | 3-Month LIBOR | | | | 2.750% | | | | 6/10/22 | | | | BB– | | | | 2,432,149 | |
| | 2,235 | | | MGM Growth Properties, Term Loan B | | | 4.234% | | | | 1-Month LIBOR | | | | 2.000% | | | | 3/21/25 | | | | BB+ | | | | 2,239,003 | |
| | 900 | | | MGM Resorts International, Term Loan A | | | 4.234% | | | | 1-Month LIBOR | | | | 2.000% | | | | 12/21/23 | | | | BB+ | | | | 896,909 | |
| | 750 | | | PCI Gaming, Term Loan B | | | 5.234% | | | | 1-Month LIBOR | | | | 3.000% | | | | 5/29/26 | | | | BB+ | | | | 756,495 | |
| | 9,555 | | | Scientific Games Corp., Initial Term Loan B5 | | | 4.984% | | | | 1-Month LIBOR | | | | 2.750% | | | | 8/14/24 | | | | Ba3 | | | | 9,520,889 | |
| | 4,679 | | | Stars Group Holdings, Term Loan B | | | 5.830% | | | | 3-Month LIBOR | | | | 3.500% | | | | 7/10/25 | | | | B+ | | | | 4,702,813 | |
| | 2,569 | | | Station Casino LLC, Term Loan B | | | 4.740% | | | | 1-Month LIBOR | | | | 2.500% | | | | 6/08/23 | | | | BB | | | | 2,578,626 | |
| | 1,489 | | | Wyndham International, Inc., Term Loan B | | | 3.984% | | | | 1-Month LIBOR | | | | 1.750% | | | | 5/30/25 | | | | BBB– | | | | 1,494,452 | |
| | 79,607 | | | Total Hotels, Restaurants & Leisure | | | | | | | | | | | | | | | | | | | | | | | 79,567,217 | |
| |
| | | | Household Durables – 0.3% (0.2% of Total Investments) | |
| | | | | | | |
| | 2,028 | | | Serta Simmons Holdings LLC, Term Loan, First Lien | | | 5.865% | | | | 1-Month LIBOR | | | | 3.500% | | | | 11/08/23 | | | | CCC+ | | | | 1,397,124 | |
| |
| | | | Household Products – 0.2% (0.1% of Total Investments) | |
| | | | | | | |
| | 977 | | | Reynolds Group Holdings, Inc., Term Loan, First Lien | | | 4.984% | | | | 1-Month LIBOR | | | | 2.750% | | | | 2/05/23 | | | | B+ | | | | 978,822 | |
57
| | |
| |
| JRO | | Nuveen Floating Rate Income Opportunity Fund(continued) |
| | Portfolio of Investments July 31, 2019 |
| | | | | | | | | | | | | | | | | | | | | | | | | | | | |
Principal
Amount (000) | | | Description (1) | | Coupon (2) | | | Reference
Rate (2) | | | Spread (2) | | | Maturity (3) | | | Ratings (4) | | | Value | |
| |
| | | | Industrial Conglomerates – 0.2% (0.1% of Total Investments) | |
| | | | | | | |
| $ | 988 | | | Education Advisory Board, Term Loan, First Lien | | | 6.381% | | | | 6-Month LIBOR | | | | 3.750% | | | | 11/15/24 | | | | B2 | | | $ | 980,716 | |
| |
| | | | Insurance – 1.9% (1.2% of Total Investments) | |
| | | | | | | |
| | 733 | | | Acrisure LLC, Term Loan B | | | 6.772% | | | | 3-Month LIBOR | | | | 4.250% | | | | 11/22/23 | | | | B | | | | 730,672 | |
| | 3,797 | | | Alliant Holdings I LLC, Term Loan B | | | 5.269% | | | | 1-Month LIBOR | | | | 3.000% | | | | 5/09/25 | | | | B | | | | 3,751,428 | |
| | 1,807 | | | Asurion LLC, Term Loan B6 | | | 5.234% | | | | 1-Month LIBOR | | | | 3.000% | | | | 11/03/23 | | | | Ba3 | | | | 1,813,377 | |
| | 2,203 | | | Hub International Holdings, Inc., Term Loan B | | | 5.267% | | | | 3-Month LIBOR | | | | 3.000% | | | | 4/25/25 | | | | B | | | | 2,183,057 | |
| | 8,540 | | | Total Insurance | | | | | | | | | | | | | | | | | | | | | | | 8,478,534 | |
| |
| | | | Interactive Media & Services – 1.0% (0.5% of Total Investments) | |
| | | | | | | |
| | 3,092 | | | Rackspace Hosting, Inc., Refinancing Term B Loan, First Lien, (DD1) | | | 5.576% | | | | 3-Month LIBOR | | | | 3.000% | | | | 11/03/23 | | | | BB– | | | | 2,877,667 | |
| | 1,493 | | | WeddingWire, Inc., Term Loan | | | 6.734% | | | | 1-Month LIBOR | | | | 4.500% | | | | 12/19/25 | | | | B+ | | | | 1,498,097 | |
| | 4,585 | | | Total Interactive Media & Services | | | | | | | | | | | | | | | | | | | | | | | 4,375,764 | |
| |
| | | | Internet Software & Services – 0.9% (0.6% of Total Investments) | |
| | | | | | | |
| | 1,459 | | | Ancestry.com, Inc., Term Loan, First Lien | | | 5.490% | | | | 1-Month LIBOR | | | | 3.250% | | | | 10/19/23 | | | | B | | | | 1,459,968 | |
| | 1,731 | | | Dynatrace, Term Loan, First Lien | | | 5.234% | | | | 1-Month LIBOR | | | | 3.000% | | | | 8/22/25 | | | | B1 | | | | 1,735,467 | |
| | 97 | | | Dynatrace, Term Loan, Second Lien | | | 9.234% | | | | 1-Month LIBOR | | | | 7.000% | | | | 8/21/26 | | | | CCC+ | | | | 97,467 | |
| | 1,913 | | | SkillSoft Corporation, Term Loan, Second Lien | | | 10.520% | | | | 3-Month LIBOR | | | | 8.250% | | | | 4/28/22 | | | | CCC | | | | 702,970 | |
| | 5,200 | | | Total Internet Software & Services | | | | | | | | | | | | | | | | | | | | | | | 3,995,872 | |
| |
| | | | IT Services – 4.7% (2.9% of Total Investments) | |
| | | | | | | |
| | 672 | | | DTI Holdings, Inc., Replacement Term Loan B1 | | | 7.006% | | | | 2-Month LIBOR | | | | 4.750% | | | | 9/29/23 | | | | B– | | | | 620,974 | |
| | 1,119 | | | Gartner, Inc., Term Loan A | | | 3.984% | | | | 1-Month LIBOR | | | | 1.750% | | | | 3/21/22 | | | | BB+ | | | | 1,122,704 | |
| | 1,294 | | | GTT Communications, Inc., Term Loan, First Lien | | | 4.980% | | | | 1-Month LIBOR | | | | 2.750% | | | | 6/02/25 | | | | B2 | | | | 1,139,872 | |
| | 500 | | | Optiv Security, Inc., Term Loan, Second Lien | | | 9.484% | | | | 1-Month LIBOR | | | | 7.250% | | | | 1/31/25 | | | | Caa1 | | | | 440,835 | |
| | 611 | | | Presidio, Inc., Term Loan B | | | 5.066% | | | | 3-Month LIBOR | | | | 2.750% | | | | 2/02/24 | | | | B+ | | | | 611,373 | |
| | 3,605 | | | Sabre, Inc., Term Loan B | | | 4.234% | | | | 1-Month LIBOR | | | | 2.000% | | | | 2/22/24 | | | | BB | | | | 3,620,123 | |
| | 711 | | | Science Applications International Corporation, Term Loan B | | | 3.984% | | | | 1-Month LIBOR | | | | 1.750% | | | | 10/31/25 | | | | BB+ | | | | 710,134 | |
| | 3,500 | | | Syniverse Holdings, Inc., Initial Term Loan, Second Lien | | | 11.325% | | | | 1-Month LIBOR | | | | 9.000% | | | | 3/11/24 | | | | CCC | | | | 2,511,250 | |
| | 3,170 | | | Syniverse Holdings, Inc., Term Loan C, (DD1) | | | 7.325% | | | | 1-Month LIBOR | | | | 5.000% | | | | 3/09/23 | | | | B2 | | | | 2,910,075 | |
| | 1,715 | | | Tempo Acquisition LLC, Term Loan B | | | 5.234% | | | | 1-Month LIBOR | | | | 3.000% | | | | 5/01/24 | | | | B1 | | | | 1,719,716 | |
| | 2,500 | | | Travelport LLC, Term Loan B | | | 7.541% | | | | 6-Month LIBOR | | | | 5.000% | | | | 5/29/26 | | | | B+ | | | | 2,435,150 | |
| | 1,996 | | | West Corporation, Term Loan B | | | 6.522% | | | | 3-Month LIBOR | | | | 4.000% | | | | 10/10/24 | | | | B1 | | | | 1,869,088 | |
| | 970 | | | WEX, Inc., Term Loan B3 | | | 4.484% | | | | 1-Month LIBOR | | | | 2.250% | | | | 5/15/26 | | | | BB– | | | | 972,843 | |
| | 22,363 | | | Total IT Services | | | | | | | | | | | | | | | | | | | | | | | 20,684,137 | |
| |
| | | | Life Sciences Tools & Services – 0.7% (0.5% of Total Investments) | |
| | | | | | | |
| | 333 | | | Inventiv Health, Inc, Term Loan B | | | 4.234% | | | | 1-Month LIBOR | | | | 2.000% | | | | 8/01/24 | | | | BB | | | | 333,501 | |
| | 3,080 | | | Parexel International Corp., Term Loan B, (DD1) | | | 4.984% | | | | 1-Month LIBOR | | | | 2.750% | | | | 9/27/24 | | | | B2 | | | | 2,978,205 | |
| | 3,413 | | | Total Life Sciences Tools & Services | | | | | | | | | | | | | | | | | | | | | | | 3,311,706 | |
| |
| | | | Machinery – 1.3% (0.8% of Total Investments) | |
| | | | | | | |
| | 1,019 | | | BJ’s Wholesale Club, Inc., Term Loan B | | | 5.075% | | | | 1-Month LIBOR | | | | 2.750% | | | | 2/01/24 | | | | B | | | | 1,022,813 | |
| | 1,738 | | | Gardner Denver, Inc., Term Loan B | | | 4.984% | | | | 1-Month LIBOR | | | | 2.750% | | | | 7/30/24 | | | | BB+ | | | | 1,744,182 | |
| | 1,037 | | | Gates Global LLC, Term Loan B | | | 4.984% | | | | 1-Month LIBOR | | | | 2.750% | | | | 4/01/24 | | | | B+ | | | | 1,034,149 | |
| | 1,441 | | | TNT Crane and Rigging Inc., Initial Term Loan, First Lien, (DD1) | | | 6.830% | | | | 3-Month LIBOR | | | | 4.500% | | | | 11/27/20 | | | | CCC+ | | | | 1,350,471 | |
| | 650 | | | TNT Crane and Rigging, Inc., Term Loan, Second Lien | | | 11.330% | | | | 3-Month LIBOR | | | | 9.000% | | | | 11/26/21 | | | | CCC– | | | | 479,375 | |
| | 5,885 | | | Total Machinery | | | | | | | | | | | | | | | | | | | | | | | 5,630,990 | |
| |
| | | | Marine – 0.5% (0.3% of Total Investments) | |
| | | | | | | |
| | 527 | | | American Commercial Lines LLC, Term Loan B, First Lien | | | 10.984% | | | | 1-Month LIBOR | | | | 8.750% | | | | 11/12/20 | | | | CCC+ | | | | 346,174 | |
| | 2,007 | | | Harvey Gulf International Marine, Inc., Exit Term Loan | | | 8.743% | | | | 3-Month LIBOR | | | | 6.000% | | | | 7/02/23 | | | | B | | | | 1,914,394 | |
| | 2,534 | | | Total Marine | | | | | | | | | | | | | | | | | | | | | | | 2,260,568 | |
58
| | | | | | | | | | | | | | | | | | | | | | | | | | | | |
Principal
Amount (000) | | | Description (1) | | Coupon (2) | | | Reference
Rate (2) | | | Spread (2) | | | Maturity (3) | | | Ratings (4) | | | Value | |
| |
| | | | Media – 13.9% (8.6% of Total Investments) | |
| | | | | | | |
| $ | 277 | | | Advantage Sales & Marketing, Inc., Term Loan B2, First Lien, (WI/DD) | | | TBD | | | | TBD | | | | TBD | | | | TBD | | | | B2 | | | $ | 256,645 | |
| | 296 | | | Advantage Sales & Marketing, Inc., Term Loan, First Lien | | | 5.580% | | | | 3-Month LIBOR | | | | 3.250% | | | | 7/23/21 | | | | B2 | | | | 274,999 | |
| | 491 | | | Affinion Group Holdings, Inc., Consenting Term Loan, (cash 4.519%, PIK 1.750%) | | | 6.269% | | | | 1-Month LIBOR | | | | 4.000% | | | | 4/10/24 | | | | N/R | | | | 420,718 | |
| | 1,253 | | | AMC Entertainment, Inc., Term Loan B, (DD1) | | | 5.230% | | | | 6-Month LIBOR | | | | 3.000% | | | | 4/22/26 | | | | Ba2 | | | | 1,255,907 | |
| | 509 | | | Catalina Marketing Corporation, First Out Loan | | | 9.814% | | | | 1-Month LIBOR | | | | 7.500% | | | | 2/15/23 | | | | B2 | | | | 431,891 | |
| | 643 | | | Catalina Marketing Corporation, Last Out PIK Term Loan, (cash 3.314%, PIK 9.500%) | | | 3.314% | | | | 1-Month LIBOR | | | | 1.000% | | | | 8/15/23 | | | | Caa2 | | | | 305,493 | |
| | 369 | | | CBS Radio, Inc., Term Loan B | | | 4.991% | | | | 1-Month LIBOR | | | | 2.750% | | | | 11/18/24 | | | | BB | | | | 369,268 | |
| | 4,515 | | | Cequel Communications LLC, Term Loan B | | | 4.575% | | | | 1-Month LIBOR | | | | 2.250% | | | | 1/15/26 | | | | BB | | | | 4,508,974 | |
| | 4,178 | | | Charter Communications Operating Holdings LLC, Term Loan B | | | 4.330% | | | | 3-Month LIBOR | | | | 2.000% | | | | 4/30/25 | | | | BBB– | | | | 4,189,997 | |
| | 1,642 | | | Cineworld Group PLC, Term Loan B | | | 4.484% | | | | 1-Month LIBOR | | | | 2.250% | | | | 2/28/25 | | | | BB– | | | | 1,638,853 | |
| | 10,829 | | | Clear Channel Communications, Inc., Exit Term Loan, (DD1) | | | 6.579% | | | | 3-Month LIBOR | | | | 4.000% | | | | 5/01/26 | | | | BB– | | | | 10,924,160 | |
| | 2,379 | | | CSC Holdings LLC, Term Loan B | | | 4.825% | | | | 1-Month LIBOR | | | | 2.500% | | | | 1/25/26 | | | | BB | | | | 2,381,951 | |
| | 1,250 | | | CSC Holdings LLC, Refinancing Term Loan, (DD1) | | | 4.575% | | | | 1-Month LIBOR | | | | 2.250% | | | | 7/17/25 | | | | BB | | | | 1,248,438 | |
| | 2,651 | | | Cumulus Media, Inc., Exit Term Loan | | | 6.740% | | | | 1-Month LIBOR | | | | 4.500% | | | | 5/13/22 | | | | B | | | | 2,673,811 | |
| | 748 | | | EW Scripps, Term Loan B | | | 4.984% | | | | 1-Month LIBOR | | | | 2.750% | | | | 5/01/26 | | | | BB | | | | 750,463 | |
| | 553 | | | Gray Television, Inc., Term Loan B2 | | | 4.582% | | | | 3-Month LIBOR | | | | 2.250% | | | | 2/07/24 | | | | BB | | | | 554,404 | |
| | 746 | | | Gray Television, Inc., Term Loan C | | | 4.832% | | | | 3-Month LIBOR | | | | 2.500% | | | | 1/02/26 | | | | BB | | | | 749,179 | |
| | 1,829 | | | IMG Worldwide, Inc., Term Loan B | | | 4.990% | | | | 1-Month LIBOR | | | | 2.750% | | | | 5/18/25 | | | | B | | | | 1,785,563 | |
| | 3,252 | | | Intelsat Jackson Holdings, S.A., Term Loan B | | | 5.991% | | | | 1-Month LIBOR | | | | 3.750% | | | | 11/30/23 | | | | B1 | | | | 3,265,842 | |
| | 5,728 | | | McGraw-Hill Education Holdings LLC, Term Loan B | | | 6.234% | | | | 1-Month LIBOR | | | | 4.000% | | | | 5/02/22 | | | | B+ | | | | 5,493,146 | |
| | 1,350 | | | Meredith Corporation, Term Loan B1 | | | 4.984% | | | | 1-Month LIBOR | | | | 2.750% | | | | 1/31/25 | | | | BB | | | | 1,356,721 | |
| | 1,839 | | | Metro-Goldwyn-Mayer, Inc., Term Loan, First Lien, (DD1) | | | 4.740% | | | | 1-Month LIBOR | | | | 2.500% | | | | 7/03/25 | | | | BB | | | | 1,834,153 | |
| | 1,000 | | | Metro-Goldwyn-Mayer, Inc., Term Loan, Second Lien | | | 6.740% | | | | 1-Month LIBOR | | | | 4.500% | | | | 7/03/26 | | | | B2 | | | | 975,000 | |
| | 1,100 | | | Nexstar Broadcasting, Inc., Term Loan B, (WI/DD) | | | TBD | | | | TBD | | | | TBD | | | | TBD | | | | BB | | | | 1,101,606 | |
| | 471 | | | Nexstar Broadcasting, Inc., Term Loan B3 | | | 4.652% | | | | 1-Month LIBOR | | | | 2.250% | | | | 1/17/24 | | | | BB | | | | 469,572 | |
| | 2,364 | | | Nexstar Broadcasting, Inc., Term Loan B3 | | | 4.491% | | | | 1-Month LIBOR | | | | 2.250% | | | | 1/17/24 | | | | BB | | | | 2,357,206 | |
| | 397 | | | Red Ventures, Term Loan B | | | 5.234% | | | | 1-Month LIBOR | | | | 3.000% | | | | 11/08/24 | | | | BB– | | | | 398,725 | |
| | 2,325 | | | Sinclair Television Group, Term Loan B2 | | | 4.490% | | | | 1-Month LIBOR | | | | 2.250% | | | | 1/03/24 | | | | BB+ | | | | 2,326,240 | |
| | 485 | | | Sinclair Television Group, Term Loan B2, (WI/DD) | | | TBD | | | | TBD | | | | TBD | | | | TBD | | | | BB+ | | | | 486,331 | |
| | 415 | | | Sinclair Television Group, Term Loan B2, (WI/DD) | | | TBD | | | | TBD | | | | TBD | | | | TBD | | | | BB+ | | | | 416,855 | |
| | 1,420 | | | Springer Science & Business Media, Inc., Term Loan B13, First Lien | | | 5.734% | | | | 1-Month LIBOR | | | | 3.500% | | | | 8/15/22 | | | | B | | | | 1,424,067 | |
| | 1,033 | | | UPC Financing Partnership, Term Loan AR1, First Lien | | | 4.854% | | | | 1-Month LIBOR | | | | 2.500% | | | | 1/15/26 | | | | BB | | | | 1,034,087 | |
| | 4,313 | | | WideOpenWest Finance LLC, Term Loan B | | | 5.519% | | | | 1-Month LIBOR | | | | 3.250% | | | | 8/18/23 | | | | B | | | | 4,244,923 | |
| | 62,650 | | | Total Media | | | | | | | | | | | | | | | | | | | | | | | 61,905,188 | |
| |
| | | | Multiline Retail – 1.3% (0.8% of Total Investments) | |
| | | | | | | |
| | 47 | | | 99 Cents Only Stores, Term Loan B2, Second Lien, (cash 7.402%, PIK 1.500%) | | | 8.902% | | | | PRIME | | | | 4.000% | | | | 1/13/22 | | | | CCC+ | | | | 42,388 | |
| | 1,127 | | | 99 Cents Only Stores, Term Loan B2, Second Lien, (cash 7.651%, PIK 1.500%) | | | 9.151% | | | | 6-Month LIBOR | | | | 6.500% | | | | 1/13/22 | | | | CCC+ | | | | 1,016,419 | |
| | 881 | | | 99 Cents Only Stores, Term Loan B2, Second Lien, (cash 7.752%, PIK 1.500%) | | | 9.022% | | | | 3-Month LIBOR | | | | 6.500% | | | | 1/13/22 | | | | CCC+ | | | | 794,557 | |
| | 2,170 | | | Belk, Inc., Term Loan B, First Lien | | | 7.285% | | | | 3-Month LIBOR | | | | 4.750% | | | | 12/12/22 | | | | B2 | | | | 1,767,305 | |
| | 1,481 | | | EG America LLC, Term Loan, First Lien | | | 6.330% | | | | 3-Month LIBOR | | | | 4.000% | | | | 2/07/25 | | | | B | | | | 1,469,221 | |
| | 599 | | | Hudson’s Bay Company, Term Loan B, First Lien | | | 5.638% | | | | 1-Month LIBOR | | | | 3.250% | | | | 9/30/22 | | | | BB | | | | 599,408 | |
| | 6,305 | | | Total Multiline Retail | | | | | | | | | | | | | | | | | | | | | | | 5,689,298 | |
| |
| | | | Oil, Gas & Consumable Fuels – 2.5% (1.6% of Total Investments) | |
| | | | | | | |
| | 1,440 | | | BCP Renaissance Parent, Term Loan B | | | 5.756% | | | | 3-Month LIBOR | | | | 3.500% | | | | 10/31/24 | | | | B+ | | | | 1,441,799 | |
| | 998 | | | California Resources Corporation, Term Loan | | | 12.616% | | | | 1-Month LIBOR | | | | 10.375% | | | | 12/31/21 | | | | B | | | | 1,004,884 | |
| | 3,415 | | | California Resources Corporation, Term Loan B | | | 6.991% | | | | 1-Month LIBOR | | | | 4.750% | | | | 12/31/22 | | | | B | | | | 3,265,594 | |
| | 2,551 | | | Fieldwood Energy LLC, Exit Term Loan | | | 7.506% | | | | 3-Month LIBOR | | | | 5.250% | | | | 4/11/22 | | | | B+ | | | | 2,355,099 | |
| | 2,351 | | | Fieldwood Energy LLC, Exit Term Loan, Second Lien | | | 9.506% | | | | 3-Month LIBOR | | | | 7.250% | | | | 4/11/23 | | | | B+ | | | | 1,949,815 | |
59
| | |
| |
| JRO | | Nuveen Floating Rate Income Opportunity Fund(continued) |
| | Portfolio of Investments July 31, 2019 |
| | | | | | | | | | | | | | | | | | | | | | | | | | | | |
Principal
Amount (000) | | | Description (1) | | Coupon (2) | | | Reference
Rate (2) | | | Spread (2) | | | Maturity (3) | | | Ratings (4) | | | Value | |
| |
| | | | Oil, Gas & Consumable Fuels(continued) | |
| | | | | | | |
| $ | 1,200 | | | Peabody Energy Corporation, Term Loan B | | | 4.984% | | | | 1-Month LIBOR | | | | 2.750% | | | | 3/31/25 | | | | BB | | | $ | 1,198,341 | |
| | 11,955 | | | Total Oil, Gas & Consumable Fuels | | | | | | | | | | | | | | | | | | | | | | | 11,215,532 | |
| |
| | | | Personal Products – 1.3% (0.8% of Total Investments) | |
| | | | | | | |
| | 2,948 | | | Coty, Inc., Term Loan A, (DD1) | | | 4.360% | | | | 1-Month LIBOR | | | | 2.000% | | | | 4/05/23 | | | | BB– | | | | 2,823,180 | |
| | 199 | | | Coty, Inc., Term Loan B | | | 4.610% | | | | 1-Month LIBOR | | | | 2.250% | | | | 4/07/25 | | | | BB– | | | | 192,790 | |
| | 3,131 | | | Revlon Consumer Products Corporation, Term Loan B, First Lien | | | 6.022% | | | | 3-Month LIBOR | | | | 3.500% | | | | 11/16/20 | | | | B3 | | | | 2,565,138 | |
| | 6,278 | | | Total Personal Products | | | | | | | | | | | | | | | | | | | | | | | 5,581,108 | |
| |
| | | | Pharmaceuticals – 3.0% (1.8% of Total Investments) | |
| | | | | | | |
| | 958 | | | Alphabet Holding Company, Inc., Initial Term Loan, First Lien | | | 5.734% | | | | 1-Month LIBOR | | | | 3.500% | | | | 9/26/24 | | | | B– | | | | 908,329 | |
| | 998 | | | Catalent Pharma Solutions, Inc., Dollar Term Loan B2 | | | 4.484% | | | | 1-Month LIBOR | | | | 2.250% | | | | 5/18/26 | | | | BB | | | | 1,003,739 | |
| | 3,598 | | | Concordia Healthcare Corp, Exit Term Loan | | | 7.825% | | | | 1-Month LIBOR | | | | 5.500% | | | | 9/06/24 | | | | B– | | | | 3,507,309 | |
| | 2,141 | | | Valeant Pharmaceuticals International, Inc., Term Loan B | | | 5.129% | | | | 1-Month LIBOR | | | | 2.750% | | | | 11/27/25 | | | | Ba2 | | | | 2,142,891 | |
| | 5,606 | | | Valeant Pharmaceuticals International, Inc., Term Loan, First Lien | | | 5.379% | | | | 1-Month LIBOR | | | | 3.000% | | | | 6/02/25 | | | | Ba2 | | | | 5,632,570 | |
| | 13,301 | | | Total Pharmaceuticals | | | | | | | | | | | | | | | | | | | | | | | 13,194,838 | |
| |
| | | | Professional Services – 2.1% (1.3% of Total Investments) | |
| | | | | | | |
| | 1,058 | | | Ceridian HCM Holding, Inc., Term Loan B | | | 5.234% | | | | 1-Month LIBOR | | | | 3.000% | | | | 4/30/25 | | | | B2 | | | | 1,066,431 | |
| | 1,150 | | | Dun & Bradstreet Corp., Initial Term Loan | | | 7.241% | | | | 1-Month LIBOR | | | | 5.000% | | | | 2/06/26 | | | | B2 | | | | 1,158,987 | |
| | 3,350 | | | Nielsen Finance LLC, Term Loan B4, (DD1) | | | 4.367% | | | | 1-Month LIBOR | | | | 2.000% | | | | 10/04/23 | | | | BBB– | | | | 3,349,573 | |
| | 957 | | | On Assignment, Inc., Term Loan B | | | 4.234% | | | | 1-Month LIBOR | | | | 2.000% | | | | 4/02/25 | | | | BB | | | | 959,814 | |
| | 3,315 | | | Skillsoft Corporation, Initial Term Loan, First Lien, (DD1) | | | 6.946% | | | | 6-Month LIBOR | | | | 4.750% | | | | 4/28/21 | | | | CCC+ | | | | 2,824,238 | |
| | 9,830 | | | Total Professional Services | | | | | | | | | | | | | | | | | | | | | | | 9,359,043 | |
| |
| | | | Real Estate Management & Development – 1.4% (0.9% of Total Investments) | |
| | | | | | | |
| | 2,838 | | | GGP, Initial Term Loan A2 | | | 4.484% | | | | 1-Month LIBOR | | | | 2.250% | | | | 8/28/23 | | | | BB+ | | | | 2,763,332 | |
| | 969 | | | Realogy Group LLC, Term Loan A | | | 4.522% | | | | 1-Month LIBOR | | | | 2.250% | | | | 2/08/23 | | | | Ba1 | | | | 945,742 | |
| | 1,248 | | | Realogy Group LLC, Term Loan B | | | 4.522% | | | | 1-Month LIBOR | | | | 2.250% | | | | 2/08/25 | | | | BB+ | | | | 1,191,957 | |
| | 1,453 | | | Trico Group, LLC, Initial Term Loan, First Lien | | | 9.330% | | | | 3-Month LIBOR | | | | 7.000% | | | | 2/02/24 | | | | B | | | | 1,404,422 | |
| | 6,508 | | | Total Real Estate Management & Development | | | | | | | | | | | | | | | | | | | | | | | 6,305,453 | |
| |
| | | | Road & Rail – 2.8% (1.7% of Total Investments) | |
| | | | | | | |
| | 5,531 | | | Avolon LLC, Term Loan B3 | | | 4.022% | | | | 1-Month LIBOR | | | | 1.750% | | | | 1/30/25 | | | | Baa2 | | | | 5,551,230 | |
| | 1,448 | | | Quality Distribution, Incremental Term Loan, First Lien | | | 7.830% | | | | 3-Month LIBOR | | | | 5.500% | | | | 8/18/22 | | | | B– | | | | 1,440,263 | |
| | 1,091 | | | Savage Enterprises LLC, Term Loan B | | | 6.880% | | | | 1-Month LIBOR | | | | 4.500% | | | | 8/01/25 | | | | B+ | | | | 1,096,311 | |
| | 3,470 | | | Uber Technologies, Inc., Term Loan | | | 6.325% | | | | 1-Month LIBOR | | | | 4.000% | | | | 4/04/25 | | | | B1 | | | | 3,488,544 | |
| | 740 | | | Uber Technologies, Inc., Term Loan | | | 5.769% | | | | 1-Month LIBOR | | | | 3.500% | | | | 7/13/23 | | | | B1 | | | | 743,392 | |
| | 12,280 | | | Total Road & Rail | | | | | | | | | | | | | | | | | | | | | | | 12,319,740 | |
| |
| | | | Semiconductors & Semiconductor Equipment – 0.8% (0.5% of Total Investments) | |
| | | | | | | |
| | 676 | | | Cabot Microelectronics, Term Loan B | | | 4.500% | | | | 1-Month LIBOR | | | | 2.250% | | | | 11/14/25 | | | | BB+ | | | | 678,362 | |
| | 136 | | | Lumileds, Term Loan B | | | 5.799% | | | | 3-Month LIBOR | | | | 3.500% | | | | 6/30/24 | | | | B+ | | | | 92,108 | |
| | 1,150 | | | Microchip Technology., Inc, Term Loan B | | | 4.240% | | | | 1-Month LIBOR | | | | 2.000% | | | | 5/29/25 | | | | Baa3 | | | | 1,151,220 | |
| | 1,427 | | | ON Semiconductor Corporation, Term Loan B3 | | | 3.984% | | | | 1-Month LIBOR | | | | 1.750% | | | | 3/31/23 | | | | Baa3 | | | | 1,426,263 | |
| | 3,389 | | | Total Semiconductors & Semiconductor Equipment | | | | | | | | | | | | | | | | | | | | | | | 3,347,953 | |
| |
| | | | Software – 15.2% (9.3% of Total Investments) | |
| | | | | | | |
| | 1,233 | | | Blackboard, Inc., Term Loan B4 | | | 7.300% | | | | 3-Month LIBOR | | | | 5.000% | | | | 6/30/21 | | | | B– | | | | 1,229,760 | |
| | 5,779 | | | BMC Software, Inc., Term Loan B | | | 6.580% | | | | 3-Month LIBOR | | | | 4.250% | | | | 10/02/25 | | | | B | | | | 5,569,743 | |
| | 1,657 | | | Compuware Corporation, Term Loan, First Lien | | | 6.234% | | | | 1-Month LIBOR | | | | 4.000% | | | | 8/22/25 | | | | B | | | | 1,665,130 | |
| | 2,400 | | | Datto, Inc., Term Loan | | | 6.580% | | | | 3-Month LIBOR | | | | 4.250% | | | | 4/02/26 | | | | B | | | | 2,424,000 | |
| | 1,496 | | | DiscoverOrg LLC, Term Loan B | | | 6.734% | | | | 1-Month LIBOR | | | | 4.500% | | | | 2/02/26 | | | | B | | | | 1,495,315 | |
| | 2,071 | | | Ellucian, Term Loan B, First Lien | | | 5.580% | | | | 3-Month LIBOR | | | | 3.250% | | | | 9/30/22 | | | | B | | | | 2,073,778 | |
| | 2,571 | | | Epicor Software Corporation, Term Loan B, (DD1) | | | 5.490% | | | | 1-Month LIBOR | | | | 3.250% | | | | 6/01/22 | | | | B2 | | | | 2,568,782 | |
60
| | | | | | | | | | | | | | | | | | | | | | | | | | | | |
Principal
Amount (000) | | | Description (1) | | Coupon (2) | | | Reference
Rate (2) | | | Spread (2) | | | Maturity (3) | | | Ratings (4) | | | Value | |
| |
| | | | Software(continued) | |
| | | | | | | |
| $ | 2,919 | | | Greeneden U.S. Holdings II LLC, Term Loan B | | | 5.484% | | | | 1-Month LIBOR | | | | 3.250% | | | | 12/01/23 | | | | B2 | | | $ | 2,908,431 | |
| | 10,786 | | | Infor (US), Inc., Term Loan B | | | 5.080% | | | | 3-Month LIBOR | | | | 2.750% | | | | 2/01/22 | | | | Ba3 | | | | 10,803,655 | |
| | 2,501 | | | Informatica, Term Loan B | | | 5.484% | | | | 1-Month LIBOR | | | | 3.250% | | | | 8/05/22 | | | | B1 | | | | 2,515,521 | |
| | 1,216 | | | Kronos Incorporated, Term Loan B | | | 5.579% | | | | 3-Month LIBOR | | | | 3.000% | | | | 11/01/23 | | | | B | | | | 1,218,539 | |
| | 656 | | | McAfee Holdings International, Inc., Term Loan, Second Lien | | | 10.741% | | | | 1-Month LIBOR | | | | 8.500% | | | | 9/29/25 | | | | B– | | | | 665,273 | |
| | 3,352 | | | McAfee LLC, Term Loan B | | | 5.991% | | | | 1-Month LIBOR | | | | 3.750% | | | | 9/30/24 | | | | B | | | | 3,356,270 | |
| | 863 | | | Micro Focus International PLC, New Term Loan | | | 4.734% | | | | 1-Month LIBOR | | | | 2.500% | | | | 6/21/24 | | | | BB– | | | | 858,211 | |
| | 5,830 | | | Micro Focus International PLC, Term Loan B | | | 4.734% | | | | 1-Month LIBOR | | | | 2.500% | | | | 6/21/24 | | | | BB– | | | | 5,795,713 | |
| | 4,143 | | | Micro Focus International PLC, Term Loan B2 | | | 4.484% | | | | 1-Month LIBOR | | | | 2.250% | | | | 11/19/21 | | | | BB– | | | | 4,143,354 | |
| | 1,436 | | | Misys, New Term Loan, Second Lien, (DD1) | | | 9.446% | | | | 1-Month LIBOR | | | | 7.250% | | | | 6/13/25 | | | | CCC+ | | | | 1,430,311 | |
| | 3,196 | | | Misys, New Term Loan, First Lien | | | 5.734% | | | | 1-Month LIBOR | | | | 3.500% | | | | 6/13/24 | | | | B | | | | 3,141,684 | |
| | 378 | | | Mitchell International, Inc., Initial Term Loan, First Lien | | | 5.484% | | | | 1-Month LIBOR | | | | 3.250% | | | | 11/29/24 | | | | B2 | | | | 359,680 | |
| | 667 | | | Mitchell International, Inc., Initial Term Loan, Second Lien | | | 9.484% | | | | 1-Month LIBOR | | | | 7.250% | | | | 12/01/25 | | | | CCC | | | | 628,333 | |
| | 1,200 | | | Perforce Software Inc., Term Loan, First Lien | | | 6.734% | | | | 1-Month LIBOR | | | | 4.500% | | | | 7/01/26 | | | | B2 | | | | 1,199,256 | |
| | 1,462 | | | RP Crown Parent LLC, Term Loan B | | | 4.984% | | | | 1-Month LIBOR | | | | 2.750% | | | | 10/15/23 | | | | B1 | | | | 1,462,134 | |
| | 2,982 | | | SS&C Technologies, Inc./ Sunshine Acquisition II, Inc., Term Loan B3 | | | 4.484% | | | | 1-Month LIBOR | | | | 2.250% | | | | 4/16/25 | | | | BB+ | | | | 2,985,331 | |
| | 2,030 | | | SS&C Technologies, Inc./ Sunshine Acquisition II, Inc., Term Loan B4 | | | 4.484% | | | | 1-Month LIBOR | | | | 2.250% | | | | 4/16/25 | | | | BB | | | | 2,032,524 | |
| | 4,164 | | | TIBCO Software, Inc., Term Loan B | | | 6.390% | | | | 1-Month LIBOR | | | | 4.000% | | | | 6/30/26 | | | | B1 | | | | 4,177,403 | |
| | 750 | | | Ultimate Software, Term Loan, First Lien | | | 6.080% | | | | 3-Month LIBOR | | | | 3.750% | | | | 5/04/26 | | | | B | | | | 756,971 | |
| | 67,738 | | | Total Software | | | | | | | | | | | | | | | | | | | | | | | 67,465,102 | |
| |
| | | | Specialty Retail – 2.3% (1.4% of Total Investments) | |
| | | | | | | |
| | 1,791 | | | Academy, Ltd., Term Loan B | | | 6.397% | | | | 1-Month LIBOR | | | | 4.000% | | | | 7/01/22 | | | | CCC+ | | | | 1,266,625 | |
| | 472 | | | Neiman Marcus Group Inc., The Cash Pay Extended | | | 8.380% | | | | 1-Month LIBOR | | | | 6.000% | | | | 10/25/23 | | | | CCC+ | | | | 406,506 | |
| | 2,093 | | | Petco Animal Supplies, Inc., Term Loan B1 | | | 5.506% | | | | 3-Month LIBOR | | | | 3.250% | | | | 1/26/23 | | | | B2 | | | | 1,630,465 | |
| | 4,609 | | | Petsmart Inc., Term Loan B, First Lien, (DD1) | | | 6.380% | | | | 1-Month LIBOR | | | | 4.000% | | | | 3/11/22 | | | | B | | | | 4,532,605 | |
| | 2,085 | | | Petsmart Inc., Term Loan B , (DD1) | | | 5.380% | | | | 1-Month LIBOR | | | | 3.000% | | | | 3/11/22 | | | | B2 | | | | 2,008,471 | |
| | 1,203 | | | Serta Simmons Holdings LLC, Term Loan, Second Lien | | | 10.314% | | | | 1-Month LIBOR | | | | 8.000% | | | | 11/08/24 | | | | CCC– | | | | 559,636 | |
| | 12,253 | | | Total Specialty Retail | | | | | | | | | | | | | | | | | | | | | | | 10,404,308 | |
| |
| | | | Technology Hardware, Storage & Peripherals – 4.5% (2.8% of Total Investments) | |
| | | | | | | |
| | 13,709 | | | Dell International LLC, Refinancing Term Loan B | | | 4.240% | | | | 1-Month LIBOR | | | | 2.000% | | | | 9/07/23 | | | | BBB– | | | | 13,761,144 | |
| | 6,212 | | | Western Digital, Term Loan B | | | 4.012% | | | | 1-Month LIBOR | | | | 1.750% | | | | 4/29/23 | | | | Baa2 | | | | 6,176,213 | |
| | 19,921 | | | Total Technology Hardware, Storage & Peripherals | | | | | | | | | | | | | | | | | | | | | | | 19,937,357 | |
| |
| | | | Transportation Infrastructure – 0.6% (0.4% of Total Investments) | |
| | | | | | | |
| | 746 | | | Atlantic Aviation FBO Inc., Term Loan | | | 5.990% | | | | 1-Month LIBOR | | | | 3.750% | | | | 12/06/25 | | | | BB | | | | 756,511 | |
| | 926 | | | Ceva Group PLC, Term Loan B | | | 7.330% | | | | 3-Month LIBOR | | | | 5.000% | | | | 8/04/25 | | | | B1 | | | | 815,976 | |
| | 350 | | | Standard Aero, Canadien Term Loan | | | 6.330% | | | | 3-Month LIBOR | | | | 4.000% | | | | 4/06/26 | | | | B | | | | 352,273 | |
| | 650 | | | Standard Aero, USD Term Loan B | | | 6.330% | | | | 3-Month LIBOR | | | | 4.000% | | | | 4/06/26 | | | | B | | | | 655,227 | |
| | 2,672 | | | Total Transportation Infrastructure | | | | | | | | | | | | | | | | | | | | | | | 2,579,987 | |
| |
| | | | Wireless Telecommunication Services – 2.6% (1.6% of Total Investments) | |
| | | | | | | |
| | 1,801 | | | Asurion LLC, Term Loan B4 | | | 5.234% | | | | 1-Month LIBOR | | | | 3.000% | | | | 8/04/22 | | | | Ba3 | | | | 1,806,802 | |
| | 2,888 | | | Sprint Corporation, Incremental Term Loan | | | 5.250% | | | | 1-Month LIBOR | | | | 3.000% | | | | 2/02/24 | | | | Ba2 | | | | 2,889,997 | |
| | 6,843 | | | Sprint Corporation, Term Loan, First Lien | | | 4.750% | | | | 1-Month LIBOR | | | | 2.500% | | | | 2/02/24 | | | | Ba2 | | | | 6,836,513 | |
| | 11,532 | | | Total Wireless Telecommunication Services | | | | | | | | | | | | | | | | | | | | | | | 11,533,312 | |
| $ | 647,189 | | | Total Variable Rate Senior Loan Interests (cost $639,063,386) | | | | 630,034,071 | |
61
| | |
| |
| JRO | | Nuveen Floating Rate Income Opportunity Fund(continued) |
| | Portfolio of Investments July 31, 2019 |
| | | | | | | | | | | | | | | | | | | | | | | | | | | | |
Principal
Amount (000) | | | Description (1) | | | | | | | | Coupon | | | Maturity | | | Ratings (4) | | | Value | |
| |
| | | | CORPORATE BONDS – 9.4% (5.7% of Total Investments) | |
| |
| | | | Communications Equipment – 2.6% (1.6% of Total Investments) | |
| | | | | | | |
| $ | 155 | | | Avaya Inc, 144A, (5), (7) | | | | | | | | | | | 7.000% | | | | 4/01/19 | | | | N/R | | | $ | — | |
| | 3,830 | | | Avaya Inc, 144A, (5), (7) | | | | | | | | | | | 10.500% | | | | 3/01/21 | | | | N/R | | | | — | |
| | 6,472 | | | Intelsat Jackson Holdings SA | | | | | | | | | | | 5.500% | | | | 8/01/23 | | | | CCC+ | | | | 5,962,330 | |
| | 5,580 | | | Intelsat Jackson Holdings SA, 144A | | | | | | | | | | | 9.750% | | | | 7/15/25 | | | | CCC+ | | | | 5,775,300 | |
| | 16,037 | | | Total Communications Equipment | | | | | | | | | | | | | | | | | | | | | | | 11,737,630 | |
| |
| | | | Containers & Packaging – 0.9% (0.6% of Total Investments) | |
| | | | | | | |
| | 4,070 | | | Reynolds Group Issuer Inc | | | | | | | | | | | 5.750% | | | | 10/15/20 | | | | B+ | | | | 4,085,027 | |
| |
| | | | Diversified Telecommunication Services – 0.6% (0.4% of Total Investments) | |
| | | | | | | |
| | 865 | | | Consolidated Communications Inc | | | | | | | | | | | 6.500% | | | | 10/01/22 | | | | B3 | | | | 784,224 | |
| | 1,650 | | | CSC Holdings LLC, 144A | | | | | | | | | | | 10.875% | | | | 10/15/25 | | | | B | | | | 1,879,466 | |
| | 2,515 | | | Total Diversified Telecommunication Services | | | | | | | | | | | | | | | | | | | | | | | 2,663,690 | |
| |
| | | | Health Care Providers & Services – 0.6% (0.3% of Total Investments) | |
| | | | | | | |
| | 590 | | | Tenet Healthcare Corp | | | | | | | | | | | 6.000% | | | | 10/01/20 | | | | BB | | | | 606,963 | |
| | 705 | | | Tenet Healthcare Corp | | | | | | | | | | | 8.125% | | | | 4/01/22 | | | | B– | | | | 752,587 | |
| | 1,060 | | | Tenet Healthcare Corp, 144A | | | | | | | | | | | 6.250% | | | | 2/01/27 | | | | Ba3 | | | | 1,097,100 | |
| | 2,355 | | | Total Health Care Providers & Services | | | | | | | | | | | | | | | | | | | | | | | 2,456,650 | |
| |
| | | | Hotels, Restaurants & Leisure – 0.4% (0.3% of Total Investments) | |
| | | | | | | |
| | 1,691 | | | Scientific Games International Inc | | | | | | | | | | | 10.000% | | | | 12/01/22 | | | | B– | | | | 1,762,901 | |
| |
| | | | Media – 2.3% (1.4% of Total Investments) | |
| | | | | | | |
| | 3,270 | | | AMC Entertainment Holdings Inc | | | | | | | | | | | 6.125% | | | | 5/15/27 | | | | B3 | | | | 2,928,694 | |
| | 150 | | | Charter Communications Operating LLC | | | | | | | | | | | 3.579% | | | | 7/23/20 | | | | BBB– | | | | 151,183 | |
| | 750 | | | Clear Channel Worldwide Holdings Inc, 144A | | | | | | | | | | | 9.250% | | | | 2/15/24 | | | | CCC+ | | | | 813,750 | |
| | 495 | | | DISH DBS Corp | | | | | | | | | | | 5.125% | | | | 5/01/20 | | | | BB– | | | | 500,569 | |
| | 4,662 | | | iHeartCommunications Inc, (5), (7) | | | | | | | | | | | 9.000% | | | | 12/15/19 | | | | N/R | | | | — | |
| | 1,714 | | | iHeartCommunications Inc, 144A, (5), (7) | | | | | | | | | | | 11.250% | | | | 3/01/21 | | | | N/R | | | | — | |
| | 6,250 | | | iHeartCommunications Inc, (5), (7) | | | | | | | | | | | 9.000% | | | | 3/01/21 | | | | N/R | | | | — | |
| | 14,960 | | | iHeartCommunications Inc, (5), (7) | | | | | | | | | | | 12.000% | | | | 8/01/21 | | | | N/R | | | | — | |
| | 5,002 | | | iHeartCommunications Inc | | | | | | | | | | | 8.375% | | | | 5/01/27 | | | | B– | | | | 5,264,078 | |
| | 920 | | | Intelsat Luxembourg SA | | | | | | | | | | | 8.125% | | | | 6/01/23 | | | | CCC– | | | | 742,624 | |
| | 38,173 | | | Total Media | | | | | | | | | | | | | | | | | | | | | | | 10,400,898 | |
| |
| | | | Oil, Gas & Consumable Fuels – 0.2% (0.1% of Total Investments) | |
| | | | | | | |
| | 1,024 | | | Denbury Resources Inc, 144A | | | | | | | | | | | 9.250% | | | | 3/31/22 | | | | B | | | | 898,560 | |
| | 175 | | | Denbury Resources Inc, 144A | | | | | | | | | | | 7.750% | | | | 2/15/24 | | | | B | | | | 128,188 | |
| | 1,199 | | | Total Oil, Gas & Consumable Fuels | | | | | | | | | | | | | | | | | | | | | | | 1,026,748 | |
| |
| | | | Pharmaceuticals – 0.2% (0.1% of Total Investments) | |
| | | | | | | |
| | 733 | | | Advanz Pharma Corp | | | | | | | | | | | 8.000% | | | | 9/06/24 | | | | B– | | | | 720,173 | |
| |
| | | | Real Estate Management & Development – 0.5% (0.3% of Total Investments) | |
| | | | | | | |
| | 2,185 | | | Realogy Group LLC / RealogyCo-Issuer Corp, 144A | | | | | | | | | | | 5.250% | | | | 12/01/21 | | | | B | | | | 2,103,062 | |
| |
| | | | Semiconductors & Semiconductor Equipment – 0.4% (0.2% of Total Investments) | |
| | | | | | | |
| | 1,394 | | | Advanced Micro Devices Inc | | | | | | | | | | | 7.500% | | | | 8/15/22 | | | | BB– | | | | 1,576,963 | |
| |
| | | | Wireless Telecommunication Services – 0.7% (0.4% of Total Investments) | |
| | | | | | | |
| | 1,235 | | | Intelsat Connect Finance SA, 144A | | | | | | | | | | | 9.500% | | | | 2/15/23 | | | | CCC– | | | | 1,108,042 | |
| | 750 | | | Level 3 Financing Inc | | | | | | | | | | | 5.375% | | | | 8/15/22 | | | | BB | | | | 753,750 | |
| | 855 | | | Sprint Corp | | | | | | | | | | | 7.875% | | | | 9/15/23 | | | | B+ | | | | 950,119 | |
| | 240 | | | Sprint Corp | | | | | | | | | | | 7.125% | | | | 6/15/24 | | | | B+ | | | | 261,900 | |
| | 3,080 | | | Total Wireless Telecommunication Services | | | | | | | | | | | | | | | | | | | | | | | 3,073,811 | |
| $ | 73,432 | | | Total Corporate Bonds (cost $41,068,059) | | | | | | | | | | | | | | | | | | | | | | | 41,607,553 | |
62
| | | | | | | | | | | | | | | | | | | | | | | | | | | | |
| Shares | | | Description (1) | | | | | | | | | | | | | | | | | Value | |
| |
| | | | COMMON STOCKS – 3.0% (1.8% of Total Investments) | |
| |
| | | | Diversified Consumer Services – 0.1% (0.0% of Total Investments) | |
| | | | | | | |
| | 16,910 | | | Cengage Learning Holdings II Inc, (8), (9) | | | | | | | | | | | | | | | | | | | | | | $ | 210,867 | |
| |
| | | | Energy Equipment & Services – 0.2% (0.1% of Total Investments) | |
| | | | | | | |
| | 63,862 | | | Transocean Ltd | | | | | | | | | | | | | | | | | | | | | | | 388,281 | |
| | 2,534 | | | Vantage Drilling International, (8), (9) | | | | | | | | | | | | | | | | | | | | | | | 598,024 | |
| | | | Total Energy Equipment & Services | | | | | | | | | | | | | | | | | | | | | | | 986,305 | |
| |
| | | | Health Care Providers & Services – 0.0% (0.0% of Total Investments) | |
| | | | | | | |
| | 54,276 | | | Millennium Health LLC, (8), (9) | | | | | | | | | | | | | | | | | | | | | | | 543 | |
| | 50,560 | | | Millennium Health LLC, (7), (9) | | | | | | | | | | | | | | | | | | | | | | | 55,598 | |
| | 47,462 | | | Millennium Health LLC, (7), (9) | | | | | | | | | | | | | | | | | | | | | | | 47,442 | |
| | | | Total Health Care Providers & Services | | | | | | | | | | | | | | | | | | | | | | | 103,583 | |
| |
| | | | Internet & Direct Marketing Retail – 0.0% (0.0% of Total Investments) | |
| | | | | | | |
| | 12,030 | | | Catalina Marketing Corp, (8), (9) | | | | | | | | | | | | | | | | | | | | | | | 60,150 | |
| |
| | | | Marine – 0.0% (0.0% of Total Investments) | |
| | | | | | | |
| | 4,721 | | | HGIM Corp, (8), (9) | | | | | | | | | | | | | | | | | | | | | | | 66,094 | |
| |
| | | | Media – 2.1% (1.3% of Total Investments) | |
| | | | | | | |
| | 640,661 | | | Clear Channel Outdoor Holdings Inc, (9) | | | | | | | | | | | | | | | | | | | | | | | 1,941,203 | |
| | 75,235 | | | Cumulus Media Inc | | | | | | | | | | | | | | | | | | | | | | | 1,136,801 | |
| | 1,318,561 | | | Hibu plc, (8), (9) | | | | | | | | | | | | | | | | | | | | | | | 267,668 | |
| | 316,926 | | | iHeartMedia Inc, (9) | | | | | | | | | | | | | | | | | | | | | | | 4,741,213 | |
| | 23,363 | | | Metro-Goldwyn-Mayer Inc, (8) | | | | | | | | | | | | | | | | | | | | | | | 1,543,897 | |
| | 36,087 | | | Tribune Co, (7) | | | | | | | | | | | | | | | | | | | | | | | 19,848 | |
| | | | Total Media | | | | | | | | | | | | | | | | | | | | | | | 9,650,630 | |
| |
| | | | Pharmaceuticals – 0.1% (0.1% of Total Investments) | |
| | | | | | | |
| | 22,768 | | | Advanz Pharma Corp, (9) | | | | | | | | | | | | | | | | | | | | | | | 303,270 | |
| |
| | | | Software – 0.5% (0.3% of Total Investments) | |
| | | | | | | |
| | 193,243 | | | Avaya Holdings Corp, (9) | | | | | | | | | | | | | | | | | | | | | | | 2,326,646 | |
| |
| | | | Specialty Retail – 0.0% (0.0% of Total Investments) | |
| | | | | | | |
| | 8,181 | | | Gymboree Holding Corp, (8) | | | | | | | | | | | | | | | | | | | | | | | 4,091 | |
| | 22,273 | | | Gymboree Holding Corp, (8) | | | | | | | | | | | | | | | | | | | | | | | 11,136 | |
| | | | Total Specialty Retail | | | | | | | | | | | | | | | | | | | | | | | 15,227 | |
| | | | Total Common Stocks (cost $26,787,873) | | | | | | | | | | | | | | | | | | | | | | | 13,722,772 | |
| | | | | | | |
Principal
Amount (000) | | | Description (1) | | | | | | | | Coupon | | | Maturity | | | Ratings (4) | | | Value | |
| |
| | | | ASSET-BACKED SECURITIES – 0.6% ( 0.4% of Total Investments) | |
| | | | | | |
| $ | 675 | | | Bristol Park CLO LTD, Series2016-1A, 144A,(3-Month LIBOR reference rate + 7.250% spread), (10) | | | | | | | | 9.553% | | | | 4/15/29 | | | | Ba3 | | | $ | 675,726 | |
| | 800 | | | Dryden 50 Senior Loan Fund, Series2017-50A, 144A,(3-Month LIBOR reference rate + 6.260% spread), (10) | | | | | | | | 8.563% | | | | 7/15/30 | | | | Ba3 | | | | 777,387 | |
| | 750 | | | Gilbert Park CLO LTD, Series2017-1A,(3-Month LIBOR reference rate + 6.400% spread), (10) | | | | | | | | 9.187% | | | | 10/15/30 | | | | Ba3 | | | | 731,809 | |
| | 400 | | | Neuberger Berman Loan Advisers CLO 28 Limited, Series2018-28A, 144A,(3-Month LIBOR reference rate + 5.600% spread), (10) | | | | | | | | 7.878% | | | | 4/20/30 | | | | BB– | | | | 376,017 | |
| $ | 2,625 | | | Total Asset-Backed Securities (cost $2,600,363) | | | | | | | | | | | | | | | | | | | | | | | 2,560,939 | |
63
| | |
| |
| JRO | | Nuveen Floating Rate Income Opportunity Fund(continued) |
| | Portfolio of Investments July 31, 2019 |
| | | | | | | | | | | | | | | | | | | | | | | | | | | | |
| Shares | | | Description (1) | | | | | | | | | | | | | | | | | Value | |
| |
| | | | COMMON STOCK RIGHTS – 0.1% (0.1% of Total Investments) | |
| |
| | | | Oil, Gas & Consumable Fuels – 0.1% (0.1% of Total Investments) | |
| | | | | | | |
| | 2,721 | | | Fieldwood Energy LLC , (8), (9) | | | | | | | | | | | | | | | | | | | | | | $ | 80,950 | |
| | 13,466 | | | Fieldwood Energy LLC , (8), (9) | | | | | | | | | | | | | | | | | | | | | | | 400,613 | |
| | | | Total Common Stock Rights (cost $384,387) | | | | | | | | | | | | | | | | | | | | | | | 481,563 | |
| | | | | | | |
Principal
Amount (000) | | | Description (1) | | | | | | | | Coupon | | | Maturity | | | Ratings (4) | | | Value | |
| |
| | | | CONVERTIBLE BONDS – 0.0% (0.0% of Total Investments) | |
| |
| | | | Oil, Gas & Consumable Fuels – 0.0% (0.0% of Total Investments) | |
| | | | | | |
| $ | 125 | | | Denbury Resources Inc, 144A | | | | | | | | 6.375% | | | | 12/31/24 | | | | B | | | $ | 75,972 | |
| $ | 125 | | | Total Convertible Bonds (cost $84,647) | | | | | | | | | | | | | | | | | | | | | | | 75,972 | |
| | | | | | | |
| Shares | | | Description (1) | | | | | | | | | | | | | | | | | Value | |
| |
| | | | WARRANTS – 0.1% (0.1% of Total Investments) | |
| | | | |
| | | | Marine – 0.1% (0.1% of Total Investments) | | | | | | | | | | |
| | | | | | | |
| | 21,097 | | | HGIM Corp, (8) | | | | | | | | | | | | | | | | | | | | | | $ | 295,358 | |
| | | | |
| | | | Software – 0.0% (0.0% of Total Investments) | | | | | | | | | | |
| | | | | | | |
| | 15,619 | | | Avaya Holdings Corp, (8) | | | | | | | | | | | | | | | | | | | | | | | 11,714 | |
| | | | Total Warrants (cost $2,304,710) | | | | 307,072 | |
| | | | Total Long-Term Investments (cost $712,293,425) | | | | 688,789,942 | |
| | | | | | | |
| Shares | | | Description (1) | | | | | | | | Coupon | | | | | | | | | Value | |
| |
| | | | SHORT-TERM INVESTMENTS – 8.2% (5.0% of Total Investments) | |
| |
| | | | INVESTMENT COMPANIES – 8.2% (5.0% of Total Investments) | |
| | | | | | | |
| | 36,427,860 | | | BlackRock Liquidity FundsT-Fund Portfolio, (11) | | | | | | | | | | | 2.254% (12) | | | | | | | | | | | $ | 36,427,860 | |
| | | | Total Short-Term Investments (cost $36,427,860) | | | | 36,427,860 | |
| | | | Total Investments (cost $748,721,285) – 163.4% | | | | 725,217,802 | |
| | | | Borrowings – (40.3)% (13), (14) | | | | (178,800,000 | ) |
| | | | Term Preferred Shares, net of deferred offering costs – (18.7)% (15) | | | | (83,075,728 | ) |
| | | | Other Assets Less Liabilities – (4.4)% (16) | | | | (19,641,891 | ) |
| | | | Net Assets Applicable to Common Shares – 100% | | | $ | 443,700,183 | |
Investment in Derivatives
Interest Rate Swaps – OTC Uncleared
| | | | | | | | | | | | | | | | | | | | | | | | | | | | | | | | |
| Counterparty | | Notional
Amount | | | Fund
Pay/Receive
Floating Rate | | | Floating Rate Index | | | Fixed Rate
(Annualized) | | | Fixed Rate
Payment
Frequency | | | Maturity
Date | | | Value | | | Unrealized
Appreciation
(Depreciation) | |
Morgan Stanley Capital Services LLC | | $ | 8,000,000 | | | | Pay | | | | 1-Month LIBOR | | | | 3.000 | %(17) | | | Monthly | | | | 12/01/23 | (18) | | $ | (1,803 | ) | | $ | (1,803 | ) |
Morgan Stanley Capital Services LLC | | | 10,000,000 | | | | Pay | | | | 1-Month LIBOR | | | | 2.500 | %(19) | | | Monthly | | | | 1/01/22 | (20) | | | (18,112 | ) | | | (18,112 | ) |
Morgan Stanley Capital Services LLC | | | 21,000,000 | | | | Pay | | | | 1-Month LIBOR | | | | 2.500 | %(21) | | | Monthly | | | | 4/01/22 | (22) | | | (45,756 | ) | | | (45,756 | ) |
Morgan Stanley Capital Services LLC | | | 45,000,000 | | | | Pay | | | | 1-Month LIBOR | | | | 4.000 | % | | | Monthly | | | | 1/01/27 | (23) | | | 384,635 | | | | 384,635 | |
Total | | $ | 84,000,000 | | | | | | | | | | | | | | | | | | | | | | | $ | 318,964 | | | $ | 318,964 | |
Total unrealized appreciation on interest rate swaps | | | | | | | | | | | | | | | $ | 384,635 | |
Total unrealized depreciation on interest rate swaps | | | | | | | | | | | | | | | $ | (65,671 | ) |
64
For Fund portfolio compliance purposes, the Fund’s industry classifications refer to any one or more of the industrysub-classifications used by one or more widely recognized market indexes or ratings group indexes, and/or as defined by Fund management. This definition may not apply for purposes of this report, which may combine industrysub-classifications into sectors for reporting ease.
| (1) | All percentages shown in the Portfolio of Investments are based on net assets applicable to common shares unless otherwise noted. |
| (2) | Senior loans generally pay interest at rates which are periodically adjusted by reference to a base short-term, floating lending rate (Reference Rate) plus an assigned fixed rate (Spread). These floating lending rates are generally (i) the lending rate referenced by the London Inter-Bank Offered Rate (“LIBOR”), or (ii) the prime rate offered by one or more major United States banks. Senior loans may be considered restricted in that the Fund ordinarily is contractually obligated to receive approval from the agent bank and/or borrower prior to the disposition of a senior loan. The rate shown is the coupon as of the end of the reporting period. |
| (3) | Senior loans generally are subject to mandatory and/or optional prepayment. Because of these mandatory prepayment conditions and because there may be significant economic incentives for a borrower to prepay, prepayments of senior loans may occur. As a result, the actual remaining maturity of senior loans held may be substantially less than the stated maturities shown. |
| (4) | For financial reporting purposes, the ratings disclosed are the highest of Standard & Poor’s Group (“Standard & Poor’s”), Moody’s Investors Service, Inc. (“Moody’s”) or Fitch, Inc. (“Fitch”) rating. This treatment of split-rated securities may differ from that used for other purposes, such as for Fund investment policies. Ratings below BBB by Standard & Poor’s, Baa by Moody’s or BBB by Fitch are considered to be below investment grade. Holdings designated N/R are not rated by any of these national rating agencies. Ratings are not covered by the report of independent registered public accounting firm. |
| (5) | Defaulted security. A security whose issuer has failed to fully pay principal and/or interest when due, or is under the protection of bankruptcy. |
| (6) | Investment, or portion of investment, represents an outstanding unfunded senior loan commitment. See Notes to Financial Statements, Note 8 – Senior Loan Commitments for more information. |
| (7) | Investment valued at fair value using methods determined in good faith by, or at the discretion of, the Board. For fair value measurement disclosure purposes, investment classified as Level 3. See Notes to Financial Statements, Note 2 – Investment Valuation and Fair Value Measurements for more information. |
| (8) | For fair value measurement disclosure purposes, investment classified as Level 2. See Notes to Financial Statements, Note 2 – Investment Valuation and Fair Value Measurements for more information. |
| (9) | Non-income producing; issuer has not declared a dividend within the past twelve months. |
| (10) | Variable rate security. The rate shown is the coupon as of the end of the reporting period. |
| (11) | A copy of the most recent financial statements for these investment companies can be obtained directly from the Securities and Exchange Commission on its website at http://www.sec.gov. |
| (12) | The rate shown is the annualizedseven-day subsidized yield as of the end of the reporting period. |
| (13) | Borrowings as a percentage of Total Investments is 24.7%. |
| (14) | The Fund segregates 100% of its eligible investments (excluding any investments separately pledged as collateral for specific investments in derivatives, when applicable) in the Portfolio of Investments as collateral for borrowings. |
| (15) | Term Preferred Shares, net of deferred offering costs as a percentage of Total Investments is 11.5%. |
| (16) | Other assets less liabilities includes the unrealized appreciation (depreciation) of certainover-the counter (“OTC”) derivatives as presented on the Statement of Assets and Liabilities, when applicable. The unrealized appreciation (depreciation) of OTC cleared and exchange-traded derivatives is recognized as part of cash collateral at brokers and/or the receivable or payable for variation margin as presented on the Statement of Assets and Liabilities, when applicable. |
| (17) | Effective December 1, 2018, the fixed rate paid by the Fund increased according to a predetermined schedule as specified in the swap contract. Additionally, this fixed rate increase will continue to occur every two years on specific dates through the swap contract’s termination date. |
| (18) | This interest rate swap has an optional early termination date beginning on December 1, 2018 and monthly thereafter through the termination date as specified in the swap contract. |
| (19) | Effective January 1, 2020, the fixed rate paid by the Fund increased according to a predetermined schedule as specified in the swap contract. Additionally, this fixed rate increase will continue to occur every twelve months on specific dates through the swap contract’s termination date. |
| (20) | This interest rate swap has an optional early termination date beginning on January 1, 2019 and monthly thereafter through the termination date as specified in the swap contract. |
| (21) | Effective April 1, 2020, the fixed rate paid by the Fund increased according to a predetermined schedule as specified in the swap contract. Additionally, this fixed rate increase will continue to occur every twelve months on specific dates through the swap contract’s termination date. |
| (22) | This interest rate swap has an optional early termination date beginning on July 1, 2019 and monthly thereafter through the termination date as specified in the swap contract. |
| (23) | This interest rate swap has an optional early termination date beginning on January 1, 2021 and monthly thereafter through the termination date as specified in the swap contract. |
| 144A | Investment is exempt from registration under Rule 144A of the Securities Act of 1933, as amended. These investments may only be resold in transactions exempt from registration, which are normally those transactions with qualified institutional buyers. |
| DD1 | Portion of investment purchased on a delayed delivery basis. |
| LIBOR | London Inter-Bank Offered Rate |
| PIK | Payment-in-kind (“PIK”) security. Depending on the terms of the security, income may be received in the form of cash, securities, or a combination of both. The PIK rate shown, where applicable, represents the annualized rate of the last PIK payment made by the issuer as of the end of the reporting period. |
| TBD | Senior loan purchased on a when-issued or delayed-delivery basis. Certain details associated with this purchase are not known prior to the settlement date of the transaction. In addition, senior loans typically trade without accrued interest and therefore a coupon rate is not available prior to settlement. At settlement, if still unknown, the borrower or counterparty will provide the Fund with the final coupon rate and maturity date. |
| WI/DD | Purchased on a when-issued or delayed delivery basis. |
See accompanying notes to financial statements.
65
| | |
| JSD | | Nuveen Short Duration Credit
Opportunities Fund Portfolio of Investments July 31, 2019 |
| | | | | | | | | | | | | | | | | | | | | | | | | | | | |
Principal
Amount (000) | | | Description (1) | | Coupon (2) | | | Reference
Rate (2) | | | Spread (2) | | | Maturity (3) | | | Ratings (4) | | | Value | |
| |
| | | | LONG-TERM INVESTMENTS – 159.3% (94.6% of Total Investments) | |
| |
| | | | VARIABLE RATE SENIOR LOAN INTERESTS – 146.8% (87.2% of Total Investments) (2) | |
| | | | |
| | | | Aerospace & Defense – 3.1% (1.9% of Total Investments) | | | | | | | | | | |
| | | | | | | |
| $ | 550 | | | MacDonald, Dettwiler and Associates, Ltd., Term Loan B | | | 4.990% | | | | 1-Month LIBOR | | | | 2.750% | | | | 10/04/24 | | | | BB | | | $ | 499,925 | |
| | 2,373 | | | Sequa Corporation, Term Loan B | | | 7.560% | | | | 3-Month LIBOR | | | | 5.000% | | | | 11/28/21 | | | | B– | | | | 2,347,879 | |
| | 854 | | | Sequa Corporation, Term Loan, Second Lien | | | 11.266% | | | | 3-Month LIBOR | | | | 9.000% | | | | 4/28/22 | | | | Caa2 | | | | 832,026 | |
| | 1,642 | | | Transdigm, Inc., Term Loan F | | | 4.830% | | | | 3-Month LIBOR | | | | 2.500% | | | | 6/09/23 | | | | Ba3 | | | | 1,636,366 | |
| | 5,419 | | | Total Aerospace & Defense | | | | | | | | | | | | | | | | | | | | | | | 5,316,196 | |
| |
| | | | Air Freight & Logistics – 0.9% (0.5% of Total Investments) | |
| | | | | | | |
| | 792 | | | PAE Holding Corporation, Term Loan B | | | 7.770% | | | | 3-Month LIBOR | | | | 5.500% | | | | 10/20/22 | | | | B+ | | | | 794,583 | |
| | 722 | | | XPO Logistics, Inc., Term Loan B | | | 4.234% | | | | 1-Month LIBOR | | | | 2.000% | | | | 2/24/25 | | | | BBB– | | | | 724,224 | |
| | 1,514 | | | Total Air Freight & Logistics | | | | | | | | | | | | | | | | | | | | | | | 1,518,807 | |
| |
| | | | Airlines – 2.4% (1.4% of Total Investments) | |
| | | | | | | |
| | 700 | | | American Airlines, Inc., Replacement Term Loan | | | 4.379% | | | | 1-Month LIBOR | | | | 2.000% | | | | 10/10/21 | | | | BB+ | | | | 700,536 | |
| | 589 | | | American Airlines, Inc., Term Loan 2025 | | | 4.061% | | | | 3-Month LIBOR | | | | 1.750% | | | | 6/27/25 | | | | BB+ | | | | 578,175 | |
| | 1,475 | | | American Airlines, Inc., Term Loan B, (DD1) | | | 4.241% | | | | 1-Month LIBOR | | | | 2.000% | | | | 4/28/23 | | | | BB+ | | | | 1,471,764 | |
| | 1,305 | | | American Airlines, Inc., Term Loan B | | | 4.325% | | | | 1-Month LIBOR | | | | 2.000% | | | | 12/14/23 | | | | BB+ | | | | 1,300,453 | |
| | 4,069 | | | Total Airlines | | | | | | | | | | | | | | | | | | | | | | | 4,050,928 | |
| |
| | | | Auto Components – 1.3% (0.8% of Total Investments) | |
| | | | | | | |
| | 842 | | | DexKo Global, Inc., Term Loan B | | | 5.734% | | | | 1-Month LIBOR | | | | 3.500% | | | | 7/24/24 | | | | B1 | | | | 840,218 | |
| | 1,000 | | | Johnson Controls Inc., Term Loan B | | | 5.734% | | | | 1-Month LIBOR | | | | 3.500% | | | | 4/30/26 | | | | Ba3 | | | | 1,001,565 | |
| | 487 | | | Superior Industries International, Inc., Term Loan B | | | 6.234% | | | | 1-Month LIBOR | | | | 4.000% | | | | 5/22/24 | | | | B1 | | | | 465,219 | |
| | 2,329 | | | Total Auto Components | | | | | | | | | | | | | | | | | | | | | | | 2,307,002 | |
| |
| | | | Beverages – 0.7% (0.4% of Total Investments) | |
| | | | | | | |
| | 1,253 | | | Jacobs Douwe Egberts, Term Loan B | | | 4.438% | | | | 1-Month LIBOR | | | | 2.000% | | | | 11/01/25 | | | | Ba2 | | | | 1,255,722 | |
| |
| | | | Biotechnology – 1.1% (0.7% of Total Investments) | |
| | | | | | | |
| | 1,955 | | | Grifols, Inc., Term Loan B | | | 4.599% | | | | 1-Week LIBOR | | | | 2.250% | | | | 1/31/25 | | | | BB | | | | 1,963,563 | |
| |
| | | | Building Products – 1.8% (1.1% of Total Investments) | |
| | | | | | | |
| | 596 | | | ACProducts, Inc., Term Loan, First Lien | | | 7.734% | | | | 1-Month LIBOR | | | | 5.500% | | | | 2/15/24 | | | | B+ | | | | 569,419 | |
| | 225 | | | Fairmount, Initial Term Loan | | | 6.313% | | | | 3-Month LIBOR | | | | 4.000% | | | | 6/01/25 | | | | BB– | | | | 192,572 | |
| | 323 | | | Ply Gem Industries, Inc., Term Loan B | | | 6.119% | | | | 1-Month LIBOR | | | | 3.750% | | | | 4/12/25 | | | | B+ | | | | 316,100 | |
| | 2,049 | | | Quikrete Holdings, Inc., Term Loan B | | | 4.984% | | | | 1-Month LIBOR | | | | 2.750% | | | | 11/15/23 | | | | BB– | | | | 2,036,200 | |
| | 3,193 | | | Total Building Products | | | | | | | | | | | | | | | | | | | | | | | 3,114,291 | |
| |
| | | | Capital Markets – 2.5% (1.5% of Total Investments) | |
| | | | | | | |
| | 811 | | | Capital Automotive LP, Term Loan, First Lien, (DD1) | | | 4.740% | | | | 1-Month LIBOR | | | | 2.500% | | | | 3/25/24 | | | | B1 | | | | 811,422 | |
| | 1,741 | | | Capital Automotive LP, Term Loan, Second Lien | | | 8.234% | | | | 1-Month LIBOR | | | | 6.000% | | | | 3/24/25 | | | | B3 | | | | 1,753,345 | |
| | 1,673 | | | RPI Finance Trust, Term Loan B6 | | | 4.234% | | | | 1-Month LIBOR | | | | 2.000% | | | | 3/27/23 | | | | BBB– | | | | 1,683,523 | |
| | 4,225 | | | Total Capital Markets | | | | | | | | | | | | | | | | | | | | | | | 4,248,290 | |
| |
| | | | Chemicals – 0.6% (0.3% of Total Investments) | |
| | | | | | | |
| | 421 | | | Ineos US Finance LLC, Term Loan | | | 4.258% | | | | 2-Month LIBOR | | | | 2.000% | | | | 4/01/24 | | | | BB+ | | | | 415,466 | |
| | 546 | | | Univar, Inc., Term Loan B | | | 4.484% | | | | 1-Month LIBOR | | | | 2.250% | | | | 7/01/24 | | | | BB+ | | | | 547,105 | |
| | 967 | | | Total Chemicals | | | | | | | | | | | | | | | | | | | | | | | 962,571 | |
| |
| | | | Commercial Services & Supplies – 4.2% (2.5% of Total Investments) | |
| | | | | | | |
| | 447 | | | Brand Energy & Infrastructure Services, Inc., Term Loan B, First Lien | | | 6.613% | | | | 2-Month LIBOR | | | | 4.250% | | | | 6/21/24 | | | | B– | | | | 433,087 | |
| | 3,048 | | | Formula One Group, Term Loan B, (DD1) | | | 4.734% | | | | 1-Month LIBOR | | | | 2.500% | | | | 2/01/24 | | | | B+ | | | | 3,017,937 | |
66
| | | | | | | | | | | | | | | | | | | | | | | | | | | | |
Principal
Amount (000) | | | Description (1) | | Coupon (2) | | | Reference
Rate (2) | | | Spread (2) | | | Maturity (3) | | | Ratings (4) | | | Value | |
| |
| | | | Commercial Services & Supplies(continued) | |
| | | | | | | |
| $ | 94 | | | Fort Dearborn Holding Company, Inc., Term Loan, First Lien | | | 6.315% | | | | 3-Month LIBOR | | | | 4.000% | | | | 10/19/23 | | | | B2 | | | $ | 90,983 | |
| | 496 | | | GFL Environmental, Term Loan | | | 5.234% | | | | 1-Month LIBOR | | | | 3.000% | | | | 5/30/25 | | | | B+ | | | | 493,360 | |
| | 217 | | | Insurance Auto Actions Inc., Term Loan | | | 4.625% | | | | 3-Month LIBOR | | | | 2.250% | | | | 5/22/26 | | | | BB | | | | 217,868 | |
| | 1,767 | | | iQor US, Inc., Term Loan, First Lien | | | 7.319% | | | | 3-Month LIBOR | | | | 5.000% | | | | 4/01/21 | | | | Caa1 | | | | 1,687,128 | |
| | 167 | | | iQor US, Inc., Term Loan, Second Lien | | | 11.069% | | | | 3-Month LIBOR | | | | 8.750% | | | | 4/01/22 | | | | Caa3 | | | | 134,167 | |
| | 200 | | | KAR Auction Services, Inc., Term Loan B5 | | | 4.875% | | | | 3-Month LIBOR | | | | 2.500% | | | | 3/09/23 | | | | BB | | | | 200,869 | |
| | 503 | | | Protection One, Inc., Term Loan | | | 4.984% | | | | 1-Month LIBOR | | | | 2.750% | | | | 5/02/22 | | | | BB– | | | | 503,431 | |
| | 200 | | | Robertshaw US Holding Corp., Term Loan B, (WI/DD) | | | TBD | | | | TBD | | | | TBD | | | | TBD | | | | B | | | | 186,500 | |
| | 169 | | | West Corporation, Incremental Term Loan B1 | | | 6.022% | | | | 3-Month LIBOR | | | | 3.500% | | | | 10/10/24 | | | | B1 | | | | 157,175 | |
| | 7,308 | | | Total Commercial Services & Supplies | | | | | | | | | | | | | | | | 7,122,505 | |
| |
| | | | Communications Equipment – 3.1% (1.8% of Total Investments) | |
| | | | | | | |
| | 2,619 | | | Avaya, Inc., Term Loan B, (DD1) | | | 6.575% | | | | 1-Month LIBOR | | | | 4.250% | | | | 12/15/24 | | | | B | | | | 2,526,248 | |
| | 1,350 | | | CommScope, Inc., Term Loan B | | | 5.484% | | | | 1-Month LIBOR | | | | 3.250% | | | | 4/06/26 | | | | Ba1 | | | | 1,354,050 | |
| | 896 | | | Mitel US Holdings, Inc., Term Loan, First Lien | | | 6.734% | | | | 1-Month LIBOR | | | | 4.500% | | | | 11/30/25 | | | | B | | | | 874,389 | |
| | 519 | | | Plantronics, Term Loan B | | | 4.734% | | | | 1-Month LIBOR | | | | 2.500% | | | | 7/02/25 | | | | Ba1 | | | | 520,253 | |
| | 5,384 | | | Total Communications Equipment | | | | | | | | | | | | | | | | | | | | | | | 5,274,940 | |
| |
| | | | Construction & Engineering – 1.2% (0.7% of Total Investments) | |
| | | | | | | |
| | 713 | | | KBR, Inc, Term Loan B | | | 5.984% | | | | 1-Month LIBOR | | | | 3.750% | | | | 4/25/25 | | | | Ba3 | | | | 717,402 | |
| | 1,320 | | | Traverse Midstream Partners, Term Loan B | | | 6.260% | | | | 2-Month LIBOR | | | | 4.000% | | | | 9/27/24 | | | | B+ | | | | 1,295,732 | |
| | 2,033 | | | Total Construction & Engineering | | | | | | | | | | | | | | | | | | | | | | | 2,013,134 | |
| |
| | | | Consumer Finance – 0.4% (0.3% of Total Investments) | |
| | | | | | | |
| | 738 | | | Verscend Technologies, Tern Loan B | | | 6.734% | | | | 1-Month LIBOR | | | | 4.500% | | | | 8/27/25 | | | | B+ | | | | 742,385 | |
| |
| | | | Containers & Packaging – 0.8% (0.5% of Total Investments) | |
| | | | | | | |
| | 699 | | | Berry Global, Inc., Term Loan Q | | | 4.629% | | | | 1-Month LIBOR | | | | 2.250% | | | | 10/01/22 | | | | BBB– | | | | 699,355 | |
| | 750 | | | Berry Global, Inc., Term Loan U | | | 4.902% | | | | 1-Month LIBOR | | | | 2.500% | | | | 7/01/26 | | | | BBB– | | | | 750,352 | |
| | 1,449 | | | Total Containers & Packaging | | | | | | | | | | | | | | | | | | | | | | | 1,449,707 | |
| |
| | | | Distributors – 0.3% (0.2% of Total Investments) | |
| | | | | | | |
| | 579 | | | SRS Distribution, Inc., Term Loan B | | | 5.484% | | | | 1-Month LIBOR | | | | 3.250% | | | | 5/23/25 | | | | B3 | | | | 561,761 | |
| |
| | | | Diversified Consumer Services – 2.1% (1.2% of Total Investments) | |
| | | | | | | |
| | 1,815 | | | Cengage Learning Acquisitions, Inc., Term Loan B | | | 6.484% | | | | 1-Month LIBOR | | | | 4.250% | | | | 6/07/23 | | | | B | | | | 1,753,479 | |
| | 1,062 | | | Houghton Mifflin, Term Loan B, First Lien | | | 5.234% | | | | 1-Month LIBOR | | | | 3.000% | | | | 5/28/21 | | | | B | | | | 1,020,675 | |
| | 746 | | | Refinitiv, Term Loan B | | | 5.984% | | | | 1-Month LIBOR | | | | 3.750% | | | | 10/01/25 | | | | B | | | | 746,717 | |
| | 3,623 | | | Total Diversified Consumer Services | | | | | | | | | | | | | | | | | | | | | | | 3,520,871 | |
| |
| | | | Diversified Financial Services – 1.2% (0.7% of Total Investments) | |
| | | | | | | |
| | 425 | | | Blackstone CQP, Term Loan | | | 5.887% | | | | 3-Month LIBOR | | | | 3.500% | | | | 9/30/24 | | | | B+ | | | | 427,259 | |
| | 603 | | | Getty Images, Inc., Initial Dollar Term Loan | | | 6.750% | | | | 1-Month LIBOR | | | | 4.500% | | | | 2/19/26 | | | | B2 | | | | 603,178 | |
| | 375 | | | Lions Gate Entertainment Corp., Term Loan B | | | 4.484% | | | | 1-Month LIBOR | | | | 2.250% | | | | 3/24/25 | | | | Ba2 | | | | 374,801 | |
| | 1,741 | | | Walter Investment Management Corporation, Term Loan B, First Lien, (5) | | | 0.000% | | | | N/A | | | | N/A | | | | 6/30/22 | | | | Ca | | | | 665,766 | |
| | 3,144 | | | Total Diversified Financial Services | | | | | | | | | | | | | | | | | | | | | | | 2,071,004 | |
| |
| | | | Diversified Telecommunication Services – 8.1% (4.8% of Total Investments) | |
| | | | | | | |
| | 694 | | | CenturyLink, Inc., Initial Term Loan A | | | 4.984% | | | | 1-Month LIBOR | | | | 2.750% | | | | 11/01/22 | | | | BBB– | | | | 694,943 | |
| | 4,234 | | | CenturyLink, Inc., Term Loan B | | | 4.984% | | | | 1-Month LIBOR | | | | 2.750% | | | | 1/31/25 | | | | BBB– | | | | 4,212,830 | |
| | 3,013 | | | Frontier Communications Corporation, Term Loan B | | | 5.990% | | | | 1-Month LIBOR | | | | 3.750% | | | | 1/14/22 | | | | B2 | | | | 2,983,093 | |
| | 195 | | | Intelsat Jackson Holdings, S.A., Term Loan B4 | | | 6.741% | | | | 1-Month LIBOR | | | | 4.500% | | | | 1/02/24 | | | | B1 | | | | 197,344 | |
| | 312 | | | Intelsat Jackson Holdings, S.A., Term Loan B5 | | | 6.625% | | | | N/A | | | | 6.625% | | | | 1/02/24 | | | | B1 | | | | 316,350 | |
| | 200 | | | Level 3 Financing, Inc., Term Loan B | | | 4.484% | | | | 1-Month LIBOR | | | | 2.250% | | | | 2/22/24 | | | | BBB– | | | | 200,438 | |
| | 1,985 | | | Numericable Group S.A., Term Loan B13 | | | 6.325% | | | | 1-Month LIBOR | | | | 4.000% | | | | 8/14/26 | | | | B | | | | 1,978,807 | |
| | 1,250 | | | Windstream Corporation, DIP Term Loan | | | 4.740% | | | | 1-Month LIBOR | | | | 2.500% | | | | 2/26/21 | | | | BBB– | | | | 1,259,375 | |
| | 2,000 | | | Ziggo B.V., Term Loan E | | | 4.825% | | | | 1-Month LIBOR | | | | 2.500% | | | | 4/15/25 | | | | B+ | | | | 1,990,550 | |
| | 13,883 | | | Total Diversified Telecommunication Services | | | | | | | | | | | | | | | | 13,833,730 | |
67
| | |
| |
| JSD | | Nuveen Short Duration Credit Opportunities Fund(continued) |
| | Portfolio of Investments July 31, 2019 |
| | | | | | | | | | | | | | | | | | | | | | | | | | | | |
Principal
Amount (000) | | | Description (1) | | Coupon (2) | | | Reference
Rate (2) | | | Spread (2) | | | Maturity (3) | | | Ratings (4) | | | Value | |
| |
| | | | Electric Utilities – 1.4% (0.8% of Total Investments) | |
| | | | | | | |
| $ | 295 | | | EFS Cogen Holdings LLC, Term Loan B | | | 5.580% | | | | 3-Month LIBOR | | | | 3.250% | | | | 6/28/23 | | | | BB | | | $ | 294,757 | |
| | 400 | | | ExGen Renewables, Term Loan, (WI/DD) | | | TBD | | | | TBD | | | | TBD | | | | TBD | | | | B | | | | 387,834 | |
| | 1,084 | | | Vistra Operations Co., Term Loan B1 | | | 4.234% | | | | 1-Month LIBOR | | | | 2.000% | | | | 8/01/23 | | | | BBB– | | | | 1,086,718 | |
| | 640 | | | Vistra Operations Co., Term Loan B3 | | | 4.270% | | | | 3-Month LIBOR | | | | 2.000% | | | | 12/31/25 | | | | BBB– | | | | 642,140 | |
| | 2,419 | | | Total Electric Utilities | | | | | | | | | | | | | | | | | | | | | | | 2,411,449 | |
| |
| | | | Electrical Equipment – 0.5% (0.3% of Total Investments) | |
| | | | | | | |
| | 804 | | | TTM Technologies, Inc., Term Loan B | | | 4.902% | | | | 1-Month LIBOR | | | | 2.500% | | | | 9/28/24 | | | | BB+ | | | | 802,682 | |
| |
| | | | Energy Equipment & Services – 1.1% (0.7% of Total Investments) | |
| | | | | | | |
| | 1,975 | | | McDermott International, Term Loan | | | 7.234% | | | | 1-Month LIBOR | | | | 5.000% | | | | 5/12/25 | | | | Ba3 | | | | 1,892,050 | |
| |
| | | | Equity Real Estate Investment Trust – 1.7% (1.0% of Total Investments) | |
| | | | | | | |
| | 3,049 | | | Communications Sales & Leasing, Inc., Shortfall Term Loan | | | 7.234% | | | | 1-Month LIBOR | | | | 5.000% | | | | 10/24/22 | | | | Caa1 | | | | 2,972,660 | |
| | | | |
| | | | Food & Staples Retailing – 6.4% (3.8% of Total Investments) | | | | | | | | | | |
| | | | | | | |
| | 936 | | | Albertson’s LLC, Term Loan B6 | | | 5.234% | | | | 1-Month LIBOR | | | | 3.000% | | | | 6/22/23 | | | | BB | | | | 939,372 | |
| | 7,340 | | | Albertson’s LLC, Term Loan B7 | | | 5.234% | | | | 1-Month LIBOR | | | | 3.000% | | | | 11/17/25 | | | | BB | | | | 7,359,467 | |
| | 1 | | | Del Monte Foods Company, Term Loan, First Lien | | | 7.750% | | | | Prime | | | | 2.250% | | | | 2/18/21 | | | | CCC+ | | | | 607 | |
| | 293 | | | Del Monte Foods Company, Term Loan, First Lien | | | 5.776% | | | | 3-Month LIBOR | | | | 3.250% | | | | 2/18/21 | | | | CCC+ | | | | 229,579 | |
| | 2,460 | | | US Foods, Inc., Term Loan B | | | 4.234% | | | | 1-Month LIBOR | | | | 2.000% | | | | 6/27/23 | | | | BBB– | | | | 2,461,223 | |
| | 11,030 | | | Total Food & Staples Retailing | | | | | | | | | | | | | | | | | | | | | | | 10,990,248 | |
| | | | |
| | | | Food Products – 0.3% (0.2% of Total Investments) | | | | | | | | | | |
| | | | | | | |
| | 9 | | | American Seafoods Group LLC, Term Loan B | | | 7.250% | | | | Prime | | | | 1.750% | | | | 8/21/23 | | | | BB– | | | | 9,023 | |
| | 589 | | | American Seafoods Group LLC, Term Loan B | | | 5.192% | | | | 1-Month LIBOR | | | | 2.750% | | | | 8/21/23 | | | | BB– | | | | 588,728 | |
| | 598 | | | Total Food Products | | | | | | | | | | | | | | | | | | | | | | | 597,751 | |
| | | | |
| | | | Health Care Equipment & Supplies – 2.9% (1.7% of Total Investments) | | | | | | | | | | |
| | | | | | | |
| | 1,042 | | | Acelity, Term Loan B | | | 5.580% | | | | 3-Month LIBOR | | | | 3.250% | | | | 2/02/24 | | | | B1 | | | | 1,046,047 | |
| | 285 | | | Air Methods Term Loan, First Lien, (DD1) | | | 5.830% | | | | 3-Month LIBOR | | | | 3.500% | | | | 4/22/24 | | | | B | | | | 241,528 | |
| | 566 | | | Greatbatch, New Term Loan B | | | 5.380% | | | | 1-Month LIBOR | | | | 3.000% | | | | 10/27/22 | | | | B+ | | | | 569,569 | |
| | 1,668 | | | Onex Carestream Finance LP, Term Loan, First Lien | | | 7.984% | | | | 1-Month LIBOR | | | | 5.750% | | | | 2/28/21 | | | | B1 | | | | 1,607,532 | |
| | 849 | | | Onex Carestream Finance LP, Term Loan, Second Lien | | | 11.734% | | | | 1-Month LIBOR | | | | 9.500% | | | | 6/07/21 | | | | B– | | | | 808,843 | |
| | 722 | | | Vyaire Medical, Inc., Term Loan B | | | 7.070% | | | | 3-Month LIBOR | | | | 4.750% | | | | 4/16/25 | | | | B3 | | | | 672,889 | |
| | 5,132 | | | Total Health Care Equipment & Supplies | | | | | | | | | | | | | | | | 4,946,408 | |
| | | | |
| | | | Health Care Providers & Services – 10.8% (6.4% of Total Investments) | | | | | | | | | | |
| | | | | | | |
| | 1,448 | | | Air Medical Group Holdings, Inc., Term Loan B, (DD1) | | | 5.564% | | | | 1-Month LIBOR | | | | 3.250% | | | | 4/28/22 | | | | B1 | | | | 1,406,804 | |
| | 495 | | | Ardent Health, Term Loan, First Lien | | | 6.734% | | | | 1-Month LIBOR | | | | 4.500% | | | | 6/30/25 | | | | B1 | | | | 497,062 | |
| | 692 | | | Brightspring Health, Term Loan B | | | 6.880% | | | | 1-Month LIBOR | | | | 4.500% | | | | 3/05/26 | | | | B1 | | | | 696,648 | |
| | 235 | | | Civitas Solutions, Term Loan B | | | 6.490% | | | | 1-Month LIBOR | | | | 4.250% | | | | 3/09/26 | | | | B1 | | | | 236,553 | |
| | 15 | | | Civitas Solutions, Term Loan C | | | 6.490% | | | | 1-Month LIBOR | | | | 4.250% | | | | 3/09/26 | | | | B1 | | | | 14,730 | |
| | 765 | | | ConvaTec, Inc., Term Loan B | | | 4.580% | | | | 3-Month LIBOR | | | | 2.250% | | | | 10/25/23 | | | | BB | | | | 764,582 | |
| | 859 | | | Envision Healthcare Corporation, Initial Term Loan, (DD1) | | | 5.984% | | | | 1-Month LIBOR | | | | 3.750% | | | | 10/10/25 | | | | B+ | | | | 740,922 | |
| | 249 | | | HCA, Inc., Term Loan B11 | | | 4.080% | | | | 3-Month LIBOR | | | | 1.750% | | | | 3/17/23 | | | | BBB– | | | | 249,596 | |
| | 459 | | | Heartland Dental Care, Inc., Term Loan, First Lien | | | 5.984% | | | | 1-Month LIBOR | | | | 3.750% | | | | 4/30/25 | | | | B2 | | | | 442,741 | |
| | 10 | | | Heartland Dental Care, Inc., Delay Draw Facility, (6) | | | 3.750% | | | | N/A | | | | 3.750% | | | | 4/30/25 | | | | B2 | | | | 9,933 | |
| | 1,633 | | | Kindred at Home Hospice, Term Loan B | | | 6.000% | | | | 1-Month LIBOR | | | | 3.750% | | | | 7/02/25 | | | | B1 | | | | 1,644,071 | |
| | 2,620 | | | Lifepoint Health, Inc., Term Loan, (DD1) | | | 6.769% | | | | 1-Month LIBOR | | | | 4.500% | | | | 11/16/25 | | | | B+ | | | | 2,638,515 | |
| | 477 | | | Millennium Laboratories, Inc., Term Loan B, First Lien | | | 8.734% | | | | 1-Month LIBOR | | | | 6.500% | | | | 12/21/20 | | | | Caa3 | | | | 216,419 | |
| | 3,456 | | | Pharmaceutical Product Development, Inc., Term Loan B | | | 4.734% | | | | 1-Month LIBOR | | | | 2.500% | | | | 8/18/22 | | | | Ba3 | | | | 3,455,187 | |
| | 1,465 | | | Prospect Medical Holdings, Term Loan B1 | | | 7.875% | | | | 1-Month LIBOR | | | | 5.500% | | | | 2/22/24 | | | | B | | | | 1,463,749 | |
| | 117 | | | Quorum Health Corp., Term Loan B | | | 9.006% | | | | 3-Month LIBOR | | | | 6.750% | | | | 4/29/22 | | | | B1 | | | | 115,726 | |
| | 2,661 | | | Select Medical Corporation, Term Loan B, (DD1) | | | 4.850% | | | | 3-Month LIBOR | | | | 2.500% | | | | 3/06/25 | | | | Ba2 | | | | 2,659,733 | |
| | 1,164 | | | Team Health, Initial Term Loan | | | 4.984% | | | | 1-Month LIBOR | | | | 2.750% | | | | 2/06/24 | | | | B | | | | 1,023,108 | |
| | 148 | | | Vizient Inc., Term Loan B | | | 4.984% | | | | 1-Month LIBOR | | | | 2.750% | | | | 5/06/26 | | | | BB– | | | | 148,837 | |
| | 18,968 | | | Total Health Care Providers & Services | | | | | | | | | | | | | | | | 18,424,916 | |
68
| | | | | | | | | | | | | | | | | | | | | | | | | | | | |
Principal
Amount (000) | | | Description (1) | | Coupon (2) | | | Reference
Rate (2) | | | Spread (2) | | | Maturity (3) | | | Ratings (4) | | | Value | |
| | | | |
| | | | Health Care Technology – 1.2% (0.7% of Total Investments) | | | | | | | | | | |
| | | | | | | |
| $ | 1,991 | | | Emdeon, Inc., Term Loan, (DD1) | | | 4.734% | | | | 1-Month LIBOR | | | | 2.500% | | | | 3/01/24 | | | | B+ | | | $ | 1,989,608 | |
| | | | |
| | | | Hotels, Restaurants & Leisure – 14.9% (8.8% of Total Investments) | | | | | | | | | | |
| | | | | | | |
| | 1,016 | | | 24 Hour Fitness Worldwide, Inc., Term Loan B | | | 5.734% | | | | 1-Month LIBOR | | | | 3.500% | | | | 5/30/25 | | | | Ba3 | | | | 1,018,105 | |
| | 2,683 | | | Burger King Corporation, Term Loan B3 | | | 4.484% | | | | 1-Month LIBOR | | | | 2.250% | | | | 2/16/24 | | | | Ba3 | | | | 2,688,168 | |
| | 2,050 | | | Caesars Entertainment Operating Company, Inc., Term Loan B, (DD1) | | | 4.234% | | | | 1-Month LIBOR | | | | 2.000% | | | | 10/06/24 | | | | BB | | | | 2,048,279 | |
| | 3,894 | | | Caesars Resort Collection, Term Loan, First Lien, (DD1) | | | 4.984% | | | | 1-Month LIBOR | | | | 2.750% | | | | 12/23/24 | | | | BB | | | | 3,868,626 | |
| | 150 | | | Carrols Restaurant Group Inc., Term Loan B | | | 5.500% | | | | 1-Month LIBOR | | | | 3.250% | | | | 4/30/26 | | | | B | | | | 150,656 | |
| | 1,173 | | | CCM Merger, Inc., Term Loan B | | | 4.484% | | | | 1-Month LIBOR | | | | 2.250% | | | | 8/09/21 | | | | BB– | | | | 1,175,943 | |
| | 1,620 | | | CityCenter Holdings LLC, Term Loan B | | | 4.484% | | | | 1-Month LIBOR | | | | 2.250% | | | | 4/18/24 | | | | BB– | | | | 1,625,710 | |
| | 480 | | | ClubCorp Operations, Inc., Term Loan B | | | 5.080% | | | | 3-Month LIBOR | | | | 2.750% | | | | 9/18/24 | | | | B | | | | 444,000 | |
| | 1,462 | | | Equinox Holdings, Inc., Term Loan B1 | | | 5.234% | | | | 1-Month LIBOR | | | | 3.000% | | | | 3/08/24 | | | | B+ | | | | 1,466,598 | |
| | 177 | | | Hilton Hotels, Term Loan B2 | | | 4.016% | | | | 1-Month LIBOR | | | | 1.750% | | | | 6/22/26 | | | | BBB– | | | | 178,055 | |
| | 1,106 | | | Life Time Fitness, Inc., Term Loan B | | | 5.272% | | | | 3-Month LIBOR | | | | 2.750% | | | | 6/10/22 | | | | BB– | | | | 1,106,906 | |
| | 350 | | | MGM Resorts International, Term Loan A | | | 4.234% | | | | 1-Month LIBOR | | | | 2.000% | | | | 12/21/23 | | | | BB+ | | | | 348,798 | |
| | 500 | | | PCI Gaming, Term Loan B | | | 5.234% | | | | 1-Month LIBOR | | | | 3.000% | | | | 5/29/26 | | | | BB+ | | | | 504,330 | |
| | 995 | | | Penn National Gaming, Inc., Term Loan B | | | 4.484% | | | | 1-Month LIBOR | | | | 2.250% | | | | 10/15/25 | | | | BB | | | | 998,114 | |
| | 4,441 | | | Scientific Games Corp., Initial Term Loan B5 | | | 4.984% | | | | 1-Month LIBOR | | | | 2.750% | | | | 8/14/24 | | | | Ba3 | | | | 4,424,868 | |
| | 1,599 | | | Stars Group Holdings, Term Loan B | | | 5.830% | | | | 3-Month LIBOR | | | | 3.500% | | | | 7/10/25 | | | | B+ | | | | 1,607,373 | |
| | 1,713 | | | Station Casino LLC, Term Loan B | | | 4.740% | | | | 1-Month LIBOR | | | | 2.500% | | | | 6/08/23 | | | | BB | | | | 1,719,084 | |
| | 25,409 | | | Total Hotels, Restaurants & Leisure | | | | | | | | | | | | | | | | | | | | | | | 25,373,613 | |
| | | | |
| | | | Household Durables – 0.3% (0.2% of Total Investments) | | | | | | | | | | |
| | | | | | | |
| | 627 | | | Serta Simmons Holdings LLC, Term Loan, First Lien | | | 5.865% | | | | 1-Month LIBOR | | | | 3.500% | | | | 11/08/23 | | | | CCC+ | | | | 432,071 | |
| | | | |
| | | | Household Products – 1.0% (0.6% of Total Investments) | | | | | | | | | | |
| | | | | | | |
| | 1,623 | | | Reynolds Group Holdings, Inc., Term Loan, First Lien | | | 4.984% | | | | 1-Month LIBOR | | | | 2.750% | | | | 2/05/23 | | | | B+ | | | | 1,625,543 | |
| | | | |
| | | | Industrial Conglomerates – 0.4% (0.3% of Total Investments) | | | | | | | | | | |
| | | | | | | |
| | 741 | | | Education Advisory Board, Term Loan, First Lien | | | 6.381% | | | | 6-Month LIBOR | | | | 3.750% | | | | 11/15/24 | | | | B2 | | | | 735,537 | |
| | | | |
| | | | Insurance – 0.9% (0.5% of Total Investments) | | | | | | | | | | |
| | | | | | | |
| | 489 | | | Acrisure LLC, Term Loan B | | | 6.772% | | | | 3-Month LIBOR | | | | 4.250% | | | | 11/22/23 | | | | B | | | | 487,115 | |
| | 1,004 | | | Hub International Holdings, Inc., Term Loan B | | | 5.267% | | | | 3-Month LIBOR | | | | 3.000% | | | | 4/25/25 | | | | B | | | | 994,913 | |
| | 1,493 | | | Total Insurance | | | | | | | | | | | | | | | | | | | | | | | 1,482,028 | |
| | | | |
| | | | Interactive Media & Services – 1.3% (0.7% of Total Investments) | | | | | | | | | | |
| | | | | | | |
| | 1,332 | | | Rackspace Hosting, Inc., Refinancing Term Loan B, First Lien, (DD1) | | | 5.576% | | | | 3-Month LIBOR | | | | 3.000% | | | | 11/03/23 | | | | BB– | | | | 1,239,841 | |
| | 995 | | | WeddingWire, Inc., Term Loan | | | 6.734% | | | | 1-Month LIBOR | | | | 4.500% | | | | 12/19/25 | | | | B+ | | | | 998,731 | |
| | 2,327 | | | Total Interactive Media & Services | | | | | | | | | | | | | | | | | | | | | | | 2,238,572 | |
| | | | |
| | | | Internet Software & Services – 1.2% (0.7% of Total Investments) | | | | | | | | | | |
| | | | | | | |
| | 973 | | | Ancestry.com, Inc., Term Loan, First Lien | | | 5.490% | | | | 1-Month LIBOR | | | | 3.250% | | | | 10/19/23 | | | | B | | | | 973,312 | |
| | 660 | | | Dynatrace, Term Loan, First Lien | | | 5.234% | | | | 1-Month LIBOR | | | | 3.000% | | | | 8/22/25 | | | | B1 | | | | 661,877 | |
| | 37 | | | Dynatrace, Term Loan, Second Lien | | | 9.234% | | | | 1-Month LIBOR | | | | 7.000% | | | | 8/21/26 | | | | CCC+ | | | | 37,707 | |
| | 1,109 | | | SkillSoft Corporation, Term Loan, Second Lien | | | 10.520% | | | | 3-Month LIBOR | | | | 8.250% | | | | 4/28/22 | | | | CCC | | | | 407,519 | |
| | 2,779 | | | Total Internet Software & Services | | | | | | | | | | | | | | | | | | | | | | | 2,080,415 | |
| | | | |
| | | | IT Services – 5.1% (3.1% of Total Investments) | | | | | | | | | | |
| | | | | | | |
| | 336 | | | DTI Holdings, Inc., Replacement Term Loan B1 | | | 7.006% | | | | 2-Month LIBOR | | | | 4.750% | | | | 9/29/23 | | | | B– | | | | 310,487 | |
| | 627 | | | Gartner, Inc., Term Loan A | | | 3.984% | | | | 1-Month LIBOR | | | | 1.750% | | | | 3/21/22 | | | | BB+ | | | | 629,395 | |
| | 324 | | | GTT Communications, Inc., Term Loan, First Lien | | | 4.980% | | | | 1-Month LIBOR | | | | 2.750% | | | | 6/02/25 | | | | B2 | | | | 284,968 | |
| | 1,260 | | | Sabre, Inc., Term Loan B | | | 4.234% | | | | 1-Month LIBOR | | | | 2.000% | | | | 2/22/24 | | | | BB | | | | 1,265,201 | |
| | 1,500 | | | Syniverse Holdings, Inc., Initial Term Loan, Second Lien | | | 11.325% | | | | 1-Month LIBOR | | | | 9.000% | | | | 3/11/24 | | | | CCC | | | | 1,076,250 | |
| | 1,393 | | | Syniverse Holdings, Inc., Term Loan C, (DD1) | | | 7.325% | | | | 1-Month LIBOR | | | | 5.000% | | | | 3/09/23 | | | | B2 | | | | 1,278,987 | |
| | 980 | | | Tempo Acquisition LLC, Term Loan B | | | 5.234% | | | | 1-Month LIBOR | | | | 3.000% | | | | 5/01/24 | | | | B1 | | | | 982,695 | |
| | 1,250 | | | Travelport LLC, Term Loan B | | | 7.541% | | | | 6-Month LIBOR | | | | 5.000% | | | | 5/29/26 | | | | B+ | | | | 1,217,575 | |
| | 1,032 | | | West Corporation, Term Loan B | | | 6.522% | | | | 3-Month LIBOR | | | | 4.000% | | | | 10/10/24 | | | | B1 | | | | 966,491 | |
69
| | |
| |
| JSD | | Nuveen Short Duration Credit Opportunities Fund(continued) |
| | Portfolio of Investments July 31, 2019 |
| | | | | | | | | | | | | | | | | | | | | | | | | | | | |
Principal
Amount (000) | | | Description (1) | | Coupon (2) | | | Reference
Rate (2) | | | Spread (2) | | | Maturity (3) | | | Ratings (4) | | | Value | |
| | | | |
| | | | IT Services(continued) | | | | | | | | | | |
| | | | | | | |
| $ | 727 | | | WEX, Inc., Term Loan B3 | | | 4.484% | | | | 1-Month LIBOR | | | | 2.250% | | | | 5/15/26 | | | | BB– | | | $ | 729,632 | |
| | 9,429 | | | Total IT Services | | | | | | | | | | | | | | | | | | | | | | | 8,741,681 | |
| | | | |
| | | | Life Sciences Tools & Services – 0.4% (0.2% of Total Investments) | | | | | | | | | | |
| | | | | | | |
| | 664 | | | Parexel International Corp., Term Loan B, (DD1) | | | 4.984% | | | | 1-Month LIBOR | | | | 2.750% | | | | 9/27/24 | | | | B2 | | | | 641,727 | |
| | | | |
| | | | Machinery – 1.7% (1.0% of Total Investments) | | | | | | | | | | |
| | | | | | | |
| | 153 | | | BJ’s Wholesale Club, Inc., Term Loan B | | | 5.075% | | | | 1-Month LIBOR | | | | 2.750% | | | | 2/01/24 | | | | B | | | | 153,275 | |
| | 693 | | | Gardner Denver, Inc., Term Loan B | | | 4.984% | | | | 1-Month LIBOR | | | | 2.750% | | | | 7/30/24 | | | | BB+ | | | | 695,953 | |
| | 622 | | | Gates Global LLC, Term Loan B | | | 4.984% | | | | 1-Month LIBOR | | | | 2.750% | | | | 4/01/24 | | | | B+ | | | | 620,489 | |
| | 1,119 | | | TNT Crane and Rigging Inc., Initial Term Loan, First Lien, (DD1) | | | 6.830% | | | | 3-Month LIBOR | | | | 4.500% | | | | 11/27/20 | | | | CCC+ | | | | 1,049,232 | |
| | 400 | | | TNT Crane and Rigging, Inc., Term Loan, Second Lien | | | 11.330% | | | | 3-Month LIBOR | | | | 9.000% | | | | 11/26/21 | | | | CCC– | | | | 295,000 | |
| | 2,987 | | | Total Machinery | | | | | | | | | | | | | | | | | | | | | | | 2,813,949 | |
| | | | | |
| | | | Marine – 0.7% (0.4% of Total Investments) | | | | | | | | | | | | | |
| | | | | | | |
| | 395 | | | American Commercial Lines LLC, Term Loan B, First Lien | | | 10.984% | | | | 1-Month LIBOR | | | | 8.750% | | | | 11/12/20 | | | | CCC+ | | | | 259,630 | |
| | 969 | | | Harvey Gulf International Marine, Inc., Exit Term Loan | | | 8.743% | | | | 3-Month LIBOR | | | | 6.000% | | | | 7/02/23 | | | | B | | | | 924,171 | |
| | 1,364 | | | Total Marine | | | | | | | | | | | | | | | | | | | | | | | 1,183,801 | |
| | | | | |
| | | | Media – 12.9% (7.7% of Total Investments) | | | | | | | | | | | | | |
| | | | | | | |
| | 201 | | | Advantage Sales & Marketing, Inc., Term Loan B2, First Lien, (WI/DD) | | | TBD | | | | TBD | | | | TBD | | | | TBD | | | | B2 | | | | 186,171 | |
| | 214 | | | Advantage Sales & Marketing, Inc., Term Loan, First Lien | | | 5.580% | | | | 3-Month LIBOR | | | | 3.250% | | | | 7/23/21 | | | | B2 | | | | 199,485 | |
| | 327 | | | Affinion Group Holdings, Inc., Consenting Term Loan, (cash 4.519%, PIK 1.750%) | | | 6.269% | | | | 1-Month LIBOR | | | | 4.000% | | | | 4/10/24 | | | | N/R | | | | 280,479 | |
| | 499 | | | AMC Entertainment, Inc., Term Loan B, (DD1) | | | 5.230% | | | | 6-Month LIBOR | | | | 3.000% | | | | 4/22/26 | | | | Ba2 | | | | 500,375 | |
| | 73 | | | Catalina Marketing Corporation, First Out Loan | | | 9.814% | | | | 1-Month LIBOR | | | | 7.500% | | | | 2/15/23 | | | | B2 | | | | 61,699 | |
| | 92 | | | Catalina Marketing Corporation, Last Out PIK Term Loan, (cash 3.314%, PIK 9.500%) | | | 3.314% | | | | 1-Month LIBOR | | | | 1.000% | | | | 8/15/23 | | | | Caa2 | | | | 43,642 | |
| | 168 | | | CBS Radio, Inc., Term Loan B | | | 4.991% | | | | 1-Month LIBOR | | | | 2.750% | | | | 11/18/24 | | | | BB | | | | 167,849 | |
| | 411 | | | Cineworld Group PLC, Term Loan B | | | 4.484% | | | | 1-Month LIBOR | | | | 2.250% | | | | 2/28/25 | | | | BB– | | | | 410,227 | |
| | 4,359 | | | Clear Channel Communications, Inc., Exit Term Loan, (DD1) | | | 6.579% | | | | 3-Month LIBOR | | | | 4.000% | | | | 5/01/26 | | | | BB– | | | | 4,397,680 | |
| | 843 | | | CSC Holdings LLC, Term Loan B | | | 4.825% | | | | 1-Month LIBOR | | | | 2.500% | | | | 1/25/26 | | | | BB | | | | 843,920 | |
| | 500 | | | CSC Holdings LLC, Refinancing Term Loan, (DD1) | | | 4.575% | | | | 1-Month LIBOR | | | | 2.250% | | | | 7/17/25 | | | | BB | | | | 499,375 | |
| | 807 | | | Cumulus Media, Inc., Exit Term Loan | | | 6.740% | | | | 1-Month LIBOR | | | | 4.500% | | | | 5/13/22 | | | | B | | | | 813,907 | |
| | 499 | | | EW Scripps, Term Loan B | | | 4.984% | | | | 1-Month LIBOR | | | | 2.750% | | | | 5/01/26 | | | | BB | | | | 500,309 | |
| | 415 | | | Gray Television, Inc., Term Loan B2 | | | 4.582% | | | | 3-Month LIBOR | | | | 2.250% | | | | 2/07/24 | | | | BB | | | | 415,803 | |
| | 686 | | | IMG Worldwide, Inc., Term Loan B | | | 4.990% | | | | 1-Month LIBOR | | | | 2.750% | | | | 5/18/25 | | | | B | | | | 669,586 | |
| | 1,772 | | | Intelsat Jackson Holdings, S.A., Term Loan B | | | 5.991% | | | | 1-Month LIBOR | | | | 3.750% | | | | 11/30/23 | | | | B1 | | | | 1,779,536 | |
| | 2,671 | | | McGraw-Hill Education Holdings LLC, Term Loan B | | | 6.234% | | | | 1-Month LIBOR | | | | 4.000% | | | | 5/02/22 | | | | B+ | | | | 2,561,764 | |
| | 579 | | | Meredith Corporation, Term Loan B1 | | | 4.984% | | | | 1-Month LIBOR | | | | 2.750% | | | | 1/31/25 | | | | BB | | | | 581,452 | |
| | 894 | | | Metro-Goldwyn-Mayer, Inc., Term Loan, First Lien, (DD1) | | | 4.740% | | | | 1-Month LIBOR | | | | 2.500% | | | | 7/03/25 | | | | BB | | | | 892,139 | |
| | 400 | | | Metro-Goldwyn-Mayer, Inc., Term Loan, Second Lien | | | 6.740% | | | | 1-Month LIBOR | | | | 4.500% | | | | 7/03/26 | | | | B2 | | | | 390,000 | |
| | 600 | | | Nexstar Broadcasting, Inc., Term Loan B, (WI/DD) | | | TBD | | | | TBD | | | | TBD | | | | TBD | | | | BB | | | | 600,876 | |
| | 256 | | | Nexstar Broadcasting, Inc., Term Loan B3 | | | 4.652% | | | | 1-Month LIBOR | | | | 2.250% | | | | 1/17/24 | | | | BB | | | | 255,002 | |
| | 1,284 | | | Nexstar Broadcasting, Inc., Term Loan B3 | | | 4.491% | | | | 1-Month LIBOR | | | | 2.250% | | | | 1/17/24 | | | | BB | | | | 1,280,082 | |
| | 132 | | | Red Ventures, Term Loan B | | | 5.234% | | | | 1-Month LIBOR | | | | 3.000% | | | | 11/08/24 | | | | BB– | | | | 132,908 | |
| | 249 | | | Sinclair Television Group, Term Loan B2 | | | 4.490% | | | | 1-Month LIBOR | | | | 2.250% | | | | 1/03/24 | | | | BB+ | | | | 248,880 | |
| | 188 | | | Sinclair Television Group, Term Loan B2, (WI/DD) | | | TBD | | | | TBD | | | | TBD | | | | TBD | | | | BB+ | | | | 189,129 | |
| | 161 | | | Sinclair Television Group, Term Loan B2, (WI/DD) | | | TBD | | | | TBD | | | | TBD | | | | TBD | | | | BB+ | | | | 162,110 | |
| | 710 | | | Springer Science & Business Media, Inc., Term Loan B13, First Lien | | | 5.734% | | | | 1-Month LIBOR | | | | 3.500% | | | | 8/15/22 | | | | B | | | | 712,033 | |
| | 2,213 | | | WideOpenWest Finance LLC, Term Loan B | | | 5.519% | | | | 1-Month LIBOR | | | | 3.250% | | | | 8/18/23 | | | | B | | | | 2,178,190 | |
| | 22,203 | | | Total Media | | | | | | | | | | | | | | | | | | | | | | | 21,954,608 | |
70
| | | | | | | | | | | | | | | | | | | | | | | | | | | | |
Principal
Amount (000) | | | Description (1) | | Coupon (2) | | | Reference
Rate (2) | | | Spread (2) | | | Maturity (3) | | | Ratings (4) | | | Value | |
| | | | | |
| | | | Multiline Retail – 1.2% (0.7% of Total Investments) | | | | | | | | | | | | | |
| | | | | | | |
| $ | 1,494 | | | Belk, Inc., Term Loan B, First Lien | | | 7.285% | | | | 3-Month LIBOR | | | | 4.750% | | | | 12/12/22 | | | | B2 | | | $ | 1,216,221 | |
| | 617 | | | EG America LLC, Term Loan, First Lien | | | 6.330% | | | | 3-Month LIBOR | | | | 4.000% | | | | 2/07/25 | | | | B | | | | 612,175 | |
| | 299 | | | Hudson’s Bay Company, Term Loan B, First Lien | | | 5.638% | | | | 1-Month LIBOR | | | | 3.250% | | | | 9/30/22 | | | | BB | | | | 299,704 | |
| | 2,410 | | | Total Multiline Retail | | | | | | | | | | | | | | | | | | | | | | | 2,128,100 | |
| | | | | |
| | | | Oil, Gas & Consumable Fuels – 4.0% (2.4% of Total Investments) | | | | | | | | | | | | | |
| | | | | | | |
| | 1,080 | | | BCP Renaissance Parent, Term Loan B | | | 5.756% | | | | 3-Month LIBOR | | | | 3.500% | | | | 10/31/24 | | | | B+ | | | | 1,081,350 | |
| | 599 | | | California Resources Corporation, Term Loan | | | 12.616% | | | | 1-Month LIBOR | | | | 10.375% | | | | 12/31/21 | | | | B | | | | 602,931 | |
| | 1,665 | | | California Resources Corporation, Term Loan B | | | 6.991% | | | | 1-Month LIBOR | | | | 4.750% | | | | 12/31/22 | | | | B | | | | 1,592,156 | |
| | 923 | | | Fieldwood Energy LLC, Exit Term Loan | | | 7.506% | | | | 3-Month LIBOR | | | | 5.250% | | | | 4/11/22 | | | | B+ | | | | 852,637 | |
| | 1,456 | | | Fieldwood Energy LLC, Exit Term Loan, Second Lien | | | 9.506% | | | | 3-Month LIBOR | | | | 7.250% | | | | 4/11/23 | | | | B+ | | | | 1,207,727 | |
| | 1,000 | | | Oryx, Initial Term Loan | | | 6.269% | | | | 1-Month LIBOR | | | | 4.000% | | | | 5/22/26 | | | | B | | | | 998,955 | |
| | 519 | | | Peabody Energy Corporation, Term Loan B | | | 4.984% | | | | 1-Month LIBOR | | | | 2.750% | | | | 3/31/25 | | | | BB | | | | 518,815 | |
| | 7,242 | | | Total Oil, Gas & Consumable Fuels | | | | | | | | | | | | | | | | | | | | | | | 6,854,571 | |
| | | | | |
| | | | Personal Products – 1.5% (0.9% of Total Investments) | | | | | | | | | | | | | |
| | | | | | | |
| | 857 | | | Coty, Inc., Term Loan A, (WI/DD) | | | TBD | | | | TBD | | | | TBD | | | | TBD | | | | BB– | | | | 820,891 | |
| | 133 | | | Coty, Inc., Term Loan B | | | 4.610% | | | | 1-Month LIBOR | | | | 2.250% | | | | 4/07/25 | | | | BB– | | | | 128,527 | |
| | 1,916 | | | Revlon Consumer Products Corporation, Term Loan B, First Lien | | | 6.022% | | | | 3-Month LIBOR | | | | 3.500% | | | | 11/16/20 | | | | B3 | | | | 1,569,392 | |
| | 2,906 | | | Total Personal Products | | | | | | | | | | | | | | | | | | | | | | | 2,518,810 | |
| | | | | |
| | | | Pharmaceuticals – 2.9% (1.7% of Total Investments) | | | | | | | | | | | | | |
| | | | | | | |
| | 499 | | | Catalent Pharma Solutions, Inc., Dollar Term Loan B2 | | | 4.484% | | | | 1-Month LIBOR | | | | 2.250% | | | | 5/18/26 | | | | BB | | | | 501,870 | |
| | 1,697 | | | Concordia Healthcare Corp, Exit Term Loan | | | 7.825% | | | | 1-Month LIBOR | | | | 5.500% | | | | 9/06/24 | | | | B– | | | | 1,654,279 | |
| | 692 | | | Valeant Pharmaceuticals International, Inc., Term Loan B | | | 5.129% | | | | 1-Month LIBOR | | | | 2.750% | | | | 11/27/25 | | | | Ba2 | | | | 692,254 | |
| | 2,013 | | | Valeant Pharmaceuticals International, Inc., Term Loan, First Lien | | | 5.379% | | | | 1-Month LIBOR | | | | 3.000% | | | | 6/02/25 | | | | Ba2 | | | | 2,023,036 | |
| | 4,901 | | | Total Pharmaceuticals | | | | | | | | | | | | | | | | | | | | | | | 4,871,439 | |
| | | | | |
| | | | Professional Services – 2.5% (1.5% of Total Investments) | | | | | | | | | | | | | |
| | | | | | | |
| | 983 | | | Ceridian HCM Holding, Inc., Term Loan B | | | 5.234% | | | | 1-Month LIBOR | | | | 3.000% | | | | 4/30/25 | | | | B2 | | | | 990,368 | |
| | 500 | | | Dun & Bradstreet Corp., Initial Term Loan | | | 7.241% | | | | 1-Month LIBOR | | | | 5.000% | | | | 2/06/26 | | | | B2 | | | | 503,908 | |
| | 1,545 | | | Nielsen Finance LLC, Term Loan B4, (DD1) | | | 4.367% | | | | 1-Month LIBOR | | | | 2.000% | | | | 10/04/23 | | | | BBB– | | | | 1,544,664 | |
| | 1,456 | | | Skillsoft Corporation, Initial Term Loan, First Lien, (DD1) | | | 6.946% | | | | 6-Month LIBOR | | | | 4.750% | | | | 4/28/21 | | | | CCC+ | | | | 1,240,734 | |
| | 4,484 | | | Total Professional Services | | | | | | | | | | | | | | | | | | | | | | | 4,279,674 | |
| | | |
| | | | Real Estate Management & Development – 1.1% (0.7% of Total Investments) | | | | | | | |
| | | | | | | |
| | 1,419 | | | GGP, Initial Term Loan A2 | | | 4.484% | | | | 1-Month LIBOR | | | | 2.250% | | | | 8/28/23 | | | | BB+ | | | | 1,381,666 | |
| | 484 | | | Realogy Group LLC, Term Loan A | | | 4.522% | | | | 1-Month LIBOR | | | | 2.250% | | | | 2/08/23 | | | | Ba1 | | | | 472,871 | |
| | 1,903 | | | Total Real Estate Management & Development | | | | | | | | | | | | 1,854,537 | |
| | | | | |
| | | | Road & Rail – 2.6% (1.5% of Total Investments) | | | | | | | | | | | | | |
| | | | | | | |
| | 1,034 | | | Avolon LLC, Term Loan B3 | | | 4.022% | | | | 1-Month LIBOR | | | | 1.750% | | | | 1/30/25 | | | | Baa2 | | | | 1,037,728 | |
| | 965 | | | Quality Distribution, Incremental Term Loan, First Lien | | | 7.830% | | | | 3-Month LIBOR | | | | 5.500% | | | | 8/18/22 | | | | B– | | | | 960,175 | |
| | 655 | | | Savage Enterprises LLC, Term Loan B | | | 6.880% | | | | 1-Month LIBOR | | | | 4.500% | | | | 8/01/25 | | | | B+ | | | | 657,787 | |
| | 1,735 | | | Uber Technologies, Inc., Term Loan | | | 6.325% | | | | 1-Month LIBOR | | | | 4.000% | | | | 4/04/25 | | | | B1 | | | | 1,744,272 | |
| | 4,389 | | | Total Road & Rail | | | | | | | | | | | | | | | | | | | | | | | 4,399,962 | |
| | | |
| | | | Semiconductors & Semiconductor Equipment – 1.0% (0.6% of Total Investments) | | | | | | | |
| | | | | | | |
| | 451 | | | Cabot Microelectronics, Term Loan B | | | 4.500% | | | | 1-Month LIBOR | | | | 2.250% | | | | 11/14/25 | | | | BB+ | | | | 452,241 | |
| | 296 | | | Lumileds, Term Loan B | | | 5.799% | | | | 3-Month LIBOR | | | | 3.500% | | | | 6/30/24 | | | | B+ | | | | 199,553 | |
| | 287 | | | Microchip Technology., Inc, Term Loan B | | | 4.240% | | | | 1-Month LIBOR | | | | 2.000% | | | | 5/29/25 | | | | Baa3 | | | | 287,805 | |
| | 713 | | | ON Semiconductor Corporation, Term Loan B3 | | | 3.984% | | | | 1-Month LIBOR | | | | 1.750% | | | | 3/31/23 | | | | Baa3 | | | | 713,132 | |
| | 1,747 | | | Total Semiconductors & Semiconductor Equipment | | | | | | | | | | | | 1,652,731 | |
71
| | |
| |
| JSD | | Nuveen Short Duration Credit Opportunities Fund(continued) |
| | Portfolio of Investments July 31, 2019 |
| | | | | | | | | | | | | | | | | | | | | | | | | | | | |
Principal
Amount (000) | | | Description (1) | | Coupon (2) | | | Reference
Rate (2) | | | Spread (2) | | | Maturity (3) | | | Ratings (4) | | | Value | |
| | | | | |
| | | | Software – 16.8% (10.0% of Total Investments) | | | | | | | | | | | | | |
| | | | | | | |
| $ | 395 | | | Blackboard, Inc., Term Loan B4 | | | 7.300% | | | | 3-Month LIBOR | | | | 5.000% | | | | 6/30/21 | | | | B– | | | $ | 393,593 | |
| | 2,691 | | | BMC Software, Inc., Term Loan B | | | 6.580% | | | | 3-Month LIBOR | | | | 4.250% | | | | 10/02/25 | | | | B | | | | 2,593,923 | |
| | 632 | | | Compuware Corporation, Term Loan, First Lien | | | 6.234% | | | | 1-Month LIBOR | | | | 4.000% | | | | 8/22/25 | | | | B | | | | 634,666 | |
| | 1,000 | | | Datto, Inc., Term Loan | | | 6.580% | | | | 3-Month LIBOR | | | | 4.250% | | | | 4/02/26 | | | | B | | | | 1,010,000 | |
| | 598 | | | DiscoverOrg LLC, Term Loan B | | | 6.734% | | | | 1-Month LIBOR | | | | 4.500% | | | | 2/02/26 | | | | B | | | | 598,126 | |
| | 655 | | | Ellucian, Term Loan B, First Lien | | | 5.580% | | | | 3-Month LIBOR | | | | 3.250% | | | | 9/30/22 | | | | B | | | | 655,454 | |
| | 998 | | | Epicor Software Corporation, Term Loan B, (DD1) | | | 5.490% | | | | 1-Month LIBOR | | | | 3.250% | | | | 6/01/22 | | | | B2 | | | | 997,513 | |
| | 1,946 | | | Greeneden U.S. Holdings II LLC, Term Loan B | | | 5.484% | | | | 1-Month LIBOR | | | | 3.250% | | | | 12/01/23 | | | | B2 | | | | 1,938,954 | |
| | 2,329 | | | Infor (US), Inc., Term Loan B | | | 5.080% | | | | 3-Month LIBOR | | | | 2.750% | | | | 2/01/22 | | | | Ba3 | | | | 2,332,416 | |
| | 1,440 | | | Informatica, Term Loan B | | | 5.484% | | | | 1-Month LIBOR | | | | 3.250% | | | | 8/05/22 | | | | B1 | | | | 1,448,674 | |
| | 973 | | | Kronos Incorporated, Term Loan B | | | 5.579% | | | | 3-Month LIBOR | | | | 3.000% | | | | 11/01/23 | | | | B | | | | 974,831 | |
| | 437 | | | McAfee Holdings International, Inc., Term Loan, Second Lien | | | 10.741% | | | | 1-Month LIBOR | | | | 8.500% | | | | 9/29/25 | | | | B– | | | | 443,516 | |
| | 1,524 | | | McAfee LLC, Term Loan B | | | 5.991% | | | | 1-Month LIBOR | | | | 3.750% | | | | 9/30/24 | | | | B | | | | 1,525,577 | |
| | 308 | | | Micro Focus International PLC, New Term Loan | | | 4.734% | | | | 1-Month LIBOR | | | | 2.500% | | | | 6/21/24 | | | | BB– | | | | 306,504 | |
| | 2,082 | | | Micro Focus International PLC, Term Loan B | | | 4.734% | | | | 1-Month LIBOR | | | | 2.500% | | | | 6/21/24 | | | | BB– | | | | 2,069,897 | |
| | 1,688 | | | Micro Focus International PLC, Term Loan B2 | | | 4.484% | | | | 1-Month LIBOR | | | | 2.250% | | | | 11/19/21 | | | | BB– | | | | 1,687,965 | |
| | 671 | | | Misys, New Term Loan, Second Lien, (DD1) | | | 9.446% | | | | 1-Month LIBOR | | | | 7.250% | | | | 6/13/25 | | | | CCC+ | | | | 668,735 | |
| | 1,315 | | | Misys, New Term Loan, First Lien | | | 5.734% | | | | 1-Month LIBOR | | | | 3.500% | | | | 6/13/24 | | | | B | | | | 1,292,573 | |
| | 126 | | | Mitchell International, Inc., Initial Term Loan, First Lien | | | 5.484% | | | | 1-Month LIBOR | | | | 3.250% | | | | 11/29/24 | | | | B2 | | | | 119,893 | |
| | 133 | | | Mitchell International, Inc., Initial Term Loan, Second Lien | | | 9.484% | | | | 1-Month LIBOR | | | | 7.250% | | | | 12/01/25 | | | | CCC | | | | 125,667 | |
| | 450 | | | Perforce Software Inc., Term Loan, First Lien | | | 6.734% | | | | 1-Month LIBOR | | | | 4.500% | | | | 7/01/26 | | | | B2 | | | | 449,721 | |
| | 731 | | | RP Crown Parent LLC, Term Loan B | | | 4.984% | | | | 1-Month LIBOR | | | | 2.750% | | | | 10/15/23 | | | | B1 | | | | 731,067 | |
| | 1,420 | | | SS&C Technologies, Inc./ Sunshine Acquisition II, Inc., Term Loan B3 | | | 4.484% | | | | 1-Month LIBOR | | | | 2.250% | | | | 4/16/25 | | | | BB+ | | | | 1,421,485 | |
| | 967 | | | SS&C Technologies, Inc./ Sunshine Acquisition II, Inc., Term Loan B4 | | | 4.484% | | | | 1-Month LIBOR | | | | 2.250% | | | | 4/16/25 | | | | BB | | | | 967,800 | |
| | 992 | | | SS&C Technologies, Inc./ Sunshine Acquisition II, Inc., Term Loan B5 | | | 4.484% | | | | 1-Month LIBOR | | | | 2.250% | | | | 4/16/25 | | | | BB+ | | | | 993,758 | |
| | 1,728 | | | TIBCO Software, Inc., Term Loan B | | | 6.390% | | | | 1-Month LIBOR | | | | 4.000% | | | | 6/30/26 | | | | B1 | | | | 1,733,450 | |
| | 500 | | | Ultimate Software, Term Loan, First Lien | | | 6.080% | | | | 3-Month LIBOR | | | | 3.750% | | | | 5/04/26 | | | | B | | | | 504,647 | |
| | 28,729 | | | Total Software | | | | | | | | | | | | | | | | | | | | | | | 28,620,405 | |
| | | | | |
| | | | Specialty Retail – 2.7% (1.6% of Total Investments) | | | | | | | | | | | | | |
| | | | | | | |
| | 699 | | | Academy, Ltd., Term Loan B | | | 6.397% | | | | 1-Month LIBOR | | | | 4.000% | | | | 7/01/22 | | | | CCC+ | | | | 494,268 | |
| | 253 | | | Neiman Marcus Group Inc., The Cash Pay Extended | | | 8.380% | | | | 1-Month LIBOR | | | | 6.000% | | | | 10/25/23 | | | | CCC+ | | | | 217,588 | |
| | 1,069 | | | Petco Animal Supplies, Inc., Term Loan B1 | | | 5.506% | | | | 3-Month LIBOR | | | | 3.250% | | | | 1/26/23 | | | | B2 | | | | 833,004 | |
| | 2,079 | | | Petsmart Inc., Term Loan B, First Lien, (DD1) | | | 6.380% | | | | 1-Month LIBOR | | | | 4.000% | | | | 3/11/22 | | | | B | | | | 2,045,008 | |
| | 916 | | | Petsmart Inc., Term Loan B, (DD1) | | | 5.380% | | | | 1-Month LIBOR | | | | 3.000% | | | | 3/11/22 | | | | B2 | | | | 882,956 | |
| | 157 | | | Serta Simmons Holdings LLC, Term Loan, Second Lien | | | 10.314% | | | | 1-Month LIBOR | | | | 8.000% | | | | 11/08/24 | | | | CCC– | | | | 72,800 | |
| | 5,173 | | | Total Specialty Retail | | | | | | | | | | | | | | | | | | | | | | | 4,545,624 | |
| | | |
| | | | Technology Hardware, Storage & Peripherals – 4.5% (2.7% of Total Investments) | | | | | | | |
| | | | | | | |
| | 3,513 | | | Dell International LLC, Refinancing Term Loan B | | | 4.240% | | | | 1-Month LIBOR | | | | 2.000% | | | | 9/07/23 | | | | BBB– | | | | 3,526,233 | |
| | 4,151 | | | Western Digital, Term Loan B | | | 4.012% | | | | 1-Month LIBOR | | | | 1.750% | | | | 4/29/23 | | | | Baa2 | | | | 4,126,816 | |
| | 7,664 | | | Total Technology Hardware, Storage & Peripherals | | | | | | | | | | | | 7,653,049 | |
| | | | | |
| | | | Transportation Infrastructure – 0.7% (0.4% of Total Investments) | | | | | | | | | | | | | |
| | | | | | | |
| | 497 | | | Atlantic Aviation FBO Inc., Term Loan | | | 5.990% | | | | 1-Month LIBOR | | | | 3.750% | | | | 12/06/25 | | | | BB | | | | 504,341 | |
| | 741 | | | Ceva Group PLC, Term Loan B | | | 7.330% | | | | 3-Month LIBOR | | | | 5.000% | | | | 8/04/25 | | | | B1 | | | | 652,781 | |
| | 1,238 | | | Total Transportation Infrastructure | | | | | | | | | | | | | | | | | | | | | | | 1,157,122 | |
| | | | | |
| | | | Wireless Telecommunication Services – 2.4% (1.4% of Total Investments) | | | | | | | | | | | | | |
| | | | | | | |
| | 1,145 | | | Sprint Corporation, Incremental Term Loan | | | 5.250% | | | | 1-Month LIBOR | | | | 3.000% | | | | 2/02/24 | | | | Ba2 | | | | 1,146,016 | |
| | 2,933 | | | Sprint Corporation, Term Loan, First Lien | | | 4.750% | | | | 1-Month LIBOR | | | | 2.500% | | | | 2/02/24 | | | | Ba2 | | | | 2,929,934 | |
| | 4,078 | | | Total Wireless Telecommunication Services | | | | | | | | | | | | 4,075,950 | |
| $ | 257,541 | | | Total Variable Rate Senior Loan Interests (cost $253,863,313) | | | | | | | | | | | | 250,270,698 | |
72
| | | | | | | | | | | | | | | | | | | | | | | | | | | | |
Principal
Amount (000) | | | Description (1) | | | | | | | | Coupon | | | Maturity | | | Ratings (4) | | | Value | |
| | | | |
| | | | CORPORATE BONDS – 9.3% (5.6% of Total Investments) | | | | | | | | | | | | | |
| | | | |
| | | | Communications Equipment – 3.0% (1.8% of Total Investments) | | | | | | | | | | |
| | | | | | | |
| $ | 85 | | | Avaya Inc, 144A, (5), (7) | | | | | | | | | | | 7.000% | | | | 4/01/19 | | | | N/R | | | $ | — | |
| | 2,085 | | | Avaya Inc, 144A, (5), (7) | | | | | | | | | | | 10.500% | | | | 3/01/21 | | | | N/R | | | | — | |
| | 3,509 | | | Intelsat Jackson Holdings SA | | | | | | | | | | | 5.500% | | | | 8/01/23 | | | | CCC+ | | | | 3,232,666 | |
| | 1,790 | | | Intelsat Jackson Holdings SA, 144A | | | | | | | | | | | 9.750% | | | | 7/15/25 | | | | CCC+ | | | | 1,852,650 | |
| | 7,469 | | | Total Communications Equipment | | | | | | | | | | | | | | | | | | | | | | | 5,085,316 | |
| | | | |
| | | | Containers & Packaging – 0.9% (0.5% of Total Investments) | | | | | | | | | | |
| | | | | | | |
| | 1,502 | | | Reynolds Group Issuer Inc | | | | | | | | | | | 5.750% | | | | 10/15/20 | | | | B+ | | | | 1,507,570 | |
| | | | |
| | | | Diversified Telecommunication Services – 0.2% (0.1% of Total Investments) | | | | | | | | | | |
| | | | | | | |
| | 415 | | | Consolidated Communications Inc | | | | | | | | | | | 6.500% | | | | 10/01/22 | | | | B3 | | | | 376,246 | |
| | | | | |
| | | | Health Care Providers & Services – 0.6% (0.4% of Total Investments) | | | | | | | | | | | | | |
| | | | | | | |
| | 230 | | | Tenet Healthcare Corp | | | | | | | | | | | 6.000% | | | | 10/01/20 | | | | BB | | | | 236,613 | |
| | 325 | | | Tenet Healthcare Corp | | | | | | | | | | | 8.125% | | | | 4/01/22 | | | | B– | | | | 346,937 | |
| | 485 | | | Tenet Healthcare Corp, 144A | | | | | | | | | | | 6.250% | | | | 2/01/27 | | | | Ba3 | | | | 501,975 | |
| | 1,040 | | | Total Health Care Providers & Services | | | | | | | | | | | | | | | | 1,085,525 | |
| | | | | |
| | | | Hotels, Restaurants & Leisure – 0.5% (0.3% of Total Investments) | | | | | | | | | | | | | |
| | | | | | | |
| | 863 | | | Scientific Games International Inc | | | | | | | | | | | 10.000% | | | | 12/01/22 | | | | B– | | | | 899,695 | |
| | | | | |
| | | | Media – 2.8% (1.7% of Total Investments) | | | | | | | | | | | | | |
| | | | | | | |
| | 1,585 | | | AMC Entertainment Holdings Inc | | | | | | | | | | | 6.125% | | | | 5/15/27 | | | | B3 | | | | 1,419,566 | |
| | 100 | | | Charter Communications Operating LLC | | | | | | | | | | | 3.579% | | | | 7/23/20 | | | | BBB– | | | | 100,789 | |
| | 250 | | | Clear Channel Worldwide Holdings Inc, 144A | | | | | | | | | | | 9.250% | | | | 2/15/24 | | | | CCC+ | | | | 271,250 | |
| | 345 | | | DISH DBS Corp | | | | | | | | | | | 5.125% | | | | 5/01/20 | | | | BB– | | | | 348,881 | |
| | 2,835 | | | iHeartCommunications Inc, (5), (7) | | | | | | | | | | | 9.000% | | | | 12/15/19 | | | | N/R | | | | — | |
| | 795 | | | iHeartCommunications Inc, (5), (7) | | | | | | | | | | | 9.000% | | | | 3/01/21 | | | | N/R | | | | — | |
| | 6,046 | | | iHeartCommunications Inc, (5), (7) | | | | | | | | | | | 12.000% | | | | 8/01/21 | | | | N/R | | | | — | |
| | 2,131 | | | iHeartCommunications Inc | | | | | | | | | | | 8.375% | | | | 5/01/27 | | | | B– | | | | 2,242,751 | |
| | 420 | | | Intelsat Luxembourg SA | | | | | | | | | | | 8.125% | | | | 6/01/23 | | | | CCC– | | | | 339,024 | |
| | 14,507 | | | Total Media | | | | | | | | | | | | | | | | | | | | | | | 4,722,261 | |
| | | | | |
| | | | Oil, Gas & Consumable Fuels – 0.4% (0.3% of Total Investments) | | | | | | | | | | | | | |
| | | | | | | |
| | 755 | | | Denbury Resources Inc, 144A | | | | | | | | | | | 9.250% | | | | 3/31/22 | | | | B | | | | 662,512 | |
| | 140 | | | Denbury Resources Inc, 144A | | | | | | | | | | | 7.750% | | | | 2/15/24 | | | | B | | | | 102,550 | |
| | 895 | | | Total Oil, Gas & Consumable Fuels | | | | | | | | | | | | | | | | | | | | | | | 765,062 | |
| | | | | |
| | | | Pharmaceuticals – 0.2% (0.1% of Total Investments) | | | | | | | | | | | | | |
| | | | | | | |
| | 310 | | | Advanz Pharma Corp | | | | | | | | | | | 8.000% | | | | 9/06/24 | | | | B– | | | | 304,575 | |
| | | |
| | | | Semiconductors & Semiconductor Equipment – 0.1% (0.0% of Total Investments) | | | | | | | |
| | | | | | | |
| | 106 | | | Advanced Micro Devices Inc | | | | | | | | | | | 7.500% | | | | 8/15/22 | | | | BB– | | | | 119,913 | |
| | | | | |
| | | | Wireless Telecommunication Services – 0.6% (0.4% of Total Investments) | | | | | | | | | | | | | |
| | | | | | | |
| | 560 | | | Intelsat Connect Finance SA, 144A | | | | | | | | | | | 9.500% | | | | 2/15/23 | | | | CCC– | | | | 502,432 | |
| | 390 | | | Sprint Corp | | | | | | | | | | | 7.875% | | | | 9/15/23 | | | | B+ | | | | 433,387 | |
| | 120 | | | Sprint Corp | | | | | | | | | | | 7.125% | | | | 6/15/24 | | | | B+ | | | | 130,950 | |
| | 1,070 | | | Total Wireless Telecommunication Services | | | | | | | | | | | | 1,066,769 | |
| $ | 28,177 | | | Total Corporate Bonds (cost $15,563,684) | | | | | | | | | | | | 15,932,932 | |
| | | | | | | |
| Shares | | | Description (1) | | | | | | | | | | | | | | | | | Value | |
| | | | | |
| | | | COMMON STOCKS – 2.9% (1.6% of Total Investments) | | | | | | | | | | | | | | | | | |
| | | | | |
| | | | Diversified Consumer Services – 0.1% (0.0% of Total Investments) | | | | | | | | | | | | | |
| | | | | | | |
| | 9,343 | | | Cengage Learning Holdings II Inc, (8), (9) | | | | | | | | | | | | | | | | | | | | | | $ | 116,507 | |
73
| | |
| |
| JSD | | Nuveen Short Duration Credit Opportunities Fund(continued) |
| | Portfolio of Investments July 31, 2019 |
| | | | | | | | | | | | | | | | | | | | | | | | | | | | |
| | | | | | | |
| Shares | | | Description (1) | | | | | | | | | | | | | | | | | Value | |
| | | |
| | | | Energy Equipment & Services – 0.3% (0.2% of Total Investments) | | | | | | | |
| | | | | | | |
| | 28,730 | | | Transocean Ltd | | | | | | | | | | | | | | | | | | | | | | $ | 174,678 | |
| | 1,318 | | | Vantage Drilling International, (8), (9) | | | | | | | | | | | | | | | | | | | | | | | 311,048 | |
| | | | Total Energy Equipment & Services | | | | | | | | | | | | 485,726 | |
| | | | | |
| | | | Health Care Providers & Services – 0.0% (0.0% of Total Investments) | | | | | | | | | | | | | |
| | | | | | | |
| | 13,189 | | | Millennium Health LLC, (8), (9) | | | | | | | | | | | | | | | | | | | | | | | 132 | |
| | 12,290 | | | Millennium Health LLC, (7), (9) | | | | | | | | | | | | | | | | | | | | | | | 13,515 | |
| | 11,533 | | | Millennium Health LLC, (7), (9) | | | | | | | | | | | | | | | | | | | | | | | 11,528 | |
| | | | Total Health Care Providers & Services | | | | | | | | | | | | 25,175 | |
| | | | | |
| | | | Internet & Direct Marketing Retail – 0.0% (0.0% of Total Investments) | | | | | | | | | | | | | |
| | | | | | | |
| | 1,905 | | | Catalina Marketing Corp, (8), (9) | | | | | | | | | | | | | | | | | | | | | | | 9,525 | |
| | | | | |
| | | | Marine – 0.0% (0.0% of Total Investments) | | | | | | | | | | | | | |
| | | | | | | |
| | 2,279 | | | HGIM Corp, (8), (9) | | | | | | | | | | | | | | | | | | | | | | | 31,906 | |
| | | | | |
| | | | Media – 1.9% (1.1% of Total Investments) | | | | | | | | | | | | | |
| | | | | | | |
| | 272,893 | | | Clear Channel Outdoor Holdings Inc, (9) | | | | | | | | | | | | | | | | | | | | | | | 826,866 | |
| | 22,902 | | | Cumulus Media Inc | | | | | | | | | | | | | | | | | | | | | | | 346,049 | |
| | 135,343 | | | iHeartMedia Inc, (9) | | | | | | | | | | | | | | | | | | | | | | | 2,024,731 | |
| | | | Total Media | | | | | | | | | | | | | | | | | | | | | | | 3,197,646 | |
| | | | | |
| | | | Pharmaceuticals – 0.0% (0.0% of Total Investments) | | | | | | | | | | | | | |
| | | | | | | |
| | 4,093 | | | Advanz Pharma Corp, (9) | | | | | | | | | | | | | | | | | | | | | | | 54,519 | |
| | | | | |
| | | | Software – 0.6% (0.3% of Total Investments) | | | | | | | | | | | | | |
| | | | | | | |
| | 78,957 | | | Avaya Holdings Corp, (9) | | | | | | | | | | | | | | | | | | | | | | | 950,642 | |
| | | | | |
| | | | Specialty Retail – 0.0% (0.0% of Total Investments) | | | | | | | | | | | | | |
| | | | | | | |
| | 5,454 | | | Gymboree Holding Corp, (8) | | | | | | | | | | | | | | | | | | | | | | | 2,727 | |
| | 14,849 | | | Gymboree Holding Corp, (8) | | | | | | | | | | | | | | | | | | | | | | | 7,425 | |
| | | | Total Specialty Retail | | | | | | | | | | | | | | | | | | | | | | | 10,152 | |
| | | | Total Common Stocks (cost $9,180,534) | | | | | | | | | | | | 4,881,798 | |
| | | | | | | |
| Shares | | | Description (1) | | | | | | | | | | | | | | | | | Value | |
| | | | | |
| | | | COMMON STOCK RIGHTS – 0.2% (0.1% of Total Investments) | | | | | | | | | | | | | | | | | |
| | | |
| | | | Oil, Gas & Consumable Fuels – 0.2% (0.1% of Total Investments) | | | | | | | |
| | | | | | | |
| | 1,468 | | | Fieldwood Energy LLC, (8), (9) | | | | | | | | | | | | | | | | | | | | | | $ | 43,673 | |
| | 7,268 | | | Fieldwood Energy LLC, (8), (9) | | | | | | | | | | | | | | | | | | | | | | | 216,223 | |
| | | | Total Common Stock Rights (cost $207,458) | | | | | | | | | | | | 259,896 | |
| | | | | | | |
Principal
Amount (000) | | | Description (1) | | | | | | | | Coupon | | | Maturity | | | Ratings (4) | | | Value | |
| | | | | |
| | | | CONVERTIBLE BONDS – 0.0% (0.0% of Total Investments) | | | | | | | | | | | | | | | | | |
| | | |
| | | | Oil, Gas & Consumable Fuels – 0.0% (0.0% of Total Investments) | | | | | | | |
| | | | | | | |
| $ | 100 | | | Denbury Resources Inc, 144A | | | | | | | | | | | 6.375% | | | | 12/31/24 | | | | B | | | $ | 60,778 | |
| $ | 100 | | | Total Convertible Bonds (cost $67,717) | | | | | | | | | | | | 60,778 | |
| | | | | | | |
| Shares | | | Description (1) | | | | | | | | | | | | | | | | | Value | |
| | | | | |
| | | | WARRANTS – 0.1% (0.1% of Total Investments) | | | | | | | | | | | | | | | | | |
| | | | |
| | | | Marine – 0.1% (0.1% of Total Investments) | | | | | | | | | | |
| | | | | | | |
| | 10,185 | | | HGIM Corp, (8) | | | | | | | | | | | | | | | | | | | | | | $ | 142,590 | |
| | | | |
| | | | Software – 0.0% (0.0% of Total Investments) | | | | | | | | | | |
| | | | | | | |
| | 8,503 | | | Avaya Holdings Corp, (8) | | | | | | | | | | | | | | | | | | | | | | | 6,377 | |
| | | | Total Warrants (cost $972,568) | | | | | | | | | | | | | | | | | | | | | | | 148,967 | |
| | | | Total Long-Term Investments (cost $279,855,274) | | | | | | | | | | | | 271,555,069 | |
74
| | | | | | | | | | | | | | | | | | | | | | | | | | | | |
| Shares | | | Description (1) | | | | | | | | Coupon | | | | | | | | | Value | |
| | | | |
| | | | SHORT-TERM INVESTMENTS – 9.1% (5.4% of Total Investments) | | | | | | | | | | | | | |
| | | | |
| | | | INVESTMENT COMPANIES – 9.1% (5.4% of Total Investments) | | | | | | | | | | | | | |
| | | | | | | |
| | 15,566,819 | | | BlackRock Liquidity FundsT-Fund Portfolio, (10) | | | | | | | | | | | 2.254% (11) | | | | | | | | | | | $ | 15,566,819 | |
| | | | Total Short-Term Investments (cost $15,566,819) | | | | | | | | | | | | 15,566,819 | |
| | | | Total Investments (cost $295,422,093) – 168.4% | | | | | | | | | | | | 287,121,888 | |
| | | | Borrowings – (42.2)% (12), (13) | | | | | | | | | | | | (72,000,000 | ) |
| | | | Term Preferred Shares, net of deferred offering costs – (20.4)% (14) | | | | | | | | | | | | (34,757,373 | ) |
| | | | Other Assets Less Liabilities – (5.8)% (15) | | | | | | | | | | | | (9,877,017 | ) |
| | | | Net Assets Applicable to Common Shares – 100% | | | | | | | | | | | $ | 170,487,498 | |
Investments in Derivatives
Credit Default Swaps – OTC Cleared
| | | | | | | | | | | | | | | | | | | | | | | | | | | | | | | | | | | | |
| Referenced Entity | | Buy/Sell
Protection (16) | | | Notional
Amount | | | Fixed Rate
(Annualized) | | | Fixed Rate
Payment
Frequency | | | Maturity
Date | | | Premiums
Paid
(Received) | | | Value | | | Unrealized
Appreciation
(Depreciation) | | | Variation
Margin
Receivable/
(Payable) | |
Cardinal Health, Inc. | | | Buy | | | $ | 3,000,000 | | | | 1.000 | % | | | Quarterly | | | | 6/20/24 | | | $ | (6,824 | ) | | $ | 19,511 | | | $ | 26,334 | | | $ | (6,723 | ) |
Ford Motor Co. | | | Buy | | | | 2,000,000 | | | | 5.000 | | | | Quarterly | | | | 6/20/24 | | | | (198,567 | ) | | | (294,342 | ) | | | (95,775 | ) | | | (337 | ) |
Total | | | | | | $ | 5,000,000 | | | | | | | | | | | | | | | $ | (205,391 | ) | | $ | (274,831 | ) | | $ | (69,441 | ) | | $ | (7,060 | ) |
Total credit default swaps premiums paid | | | | | | | $ | — | | | | | | | | | | | | | |
Total credit default swaps premiums received | | | | | | | $ | (205,391 | ) | | | | | | | | | | | | |
Total receivable for variation margin on swap contracts | | | | | | | | | | | | | | | | | | | | | | | $ | — | |
Total payable for variation margin on swap contracts | | | | | | | | | | | | | | | | | | | | | | | $ | (7,060 | ) |
75
| | |
| |
| JSD | | Nuveen Short Duration Credit Opportunities Fund(continued) |
| | Portfolio of Investments July 31, 2019 |
For Fund portfolio compliance purposes, the Fund’s industry classifications refer to any one or more of the industrysub-classifications used by one or more widely recognized market indexes or ratings group indexes, and/or as defined by Fund management. This definition may not apply for purposes of this report, which may combine industrysub-classifications into sectors for reporting ease.
| (1) | All percentages shown in the Portfolio of Investments are based on net assets applicable to common shares unless otherwise noted. |
| (2) | Senior loans generally pay interest at rates which are periodically adjusted by reference to a base short-term, floating lending rate (Reference Rate) plus an assigned fixed rate (Spread). These floating lending rates are generally (i) the lending rate referenced by the London Inter-Bank Offered Rate (“LIBOR”), or (ii) the prime rate offered by one or more major United States banks. Senior loans may be considered restricted in that the Fund ordinarily is contractually obligated to receive approval from the agent bank and/or borrower prior to the disposition of a senior loan. The rate shown is the coupon as of the end of the reporting period. |
| (3) | Senior loans generally are subject to mandatory and/or optional prepayment. Because of these mandatory prepayment conditions and because there may be significant economic incentives for a borrower to prepay, prepayments of senior loans may occur. As a result, the actual remaining maturity of senior loans held may be substantially less than the stated maturities shown. |
| (4) | For financial reporting purposes, the ratings disclosed are the highest of Standard & Poor’s Group (“Standard & Poor’s”), Moody’s Investors Service, Inc. (“Moody’s”) or Fitch, Inc. (“Fitch”) rating. This treatment of split-rated securities may differ from that used for other purposes, such as for Fund investment policies. Ratings below BBB by Standard & Poor’s, Baa by Moody’s or BBB by Fitch are considered to be below investment grade. Holdings designated N/R are not rated by any of these national rating agencies. Ratings are not covered by the report of independent registered public accounting firm. |
| (5) | Defaulted security. A security whose issuer has failed to fully pay principal and/or interest when due, or is under the protection of bankruptcy. |
| (6) | Investment, or portion of investment, represents an outstanding unfunded senior loan commitment. See Notes to Financial Statements, Note 8 – Senior Loan Commitments for more information. |
| (7) | Investment valued at fair value using methods determined in good faith by, or at the discretion of, the Board. For fair value measurement disclosure purposes, investment classified as Level 3. See Notes to Financial Statements, Note 2 – Investment Valuation and Fair Value Measurements for more information. |
| (8) | For fair value measurement disclosure purposes, investment classified as Level 2. See Notes to Financial Statements, Note 2 – Investment Valuation and Fair Value Measurements for more information. |
| (9) | Non-income producing; issuer has not declared a dividend within the past twelve months. |
| (10) | A copy of the most recent financial statements for these investment companies can be obtained directly from the Securities and Exchange Commission on its website at http://www.sec.gov. |
| (11) | The rate shown is the annualizedseven-day subsidized yield as of the end of the reporting period. |
| (12) | Borrowings as a percentage of Total Investments is 25.1%. |
| (13) | The Fund segregates 100% of its eligible investments (excluding any investments separately pledged as collateral for specific investments in derivatives, when applicable) in the Portfolio of Investments as collateral for borrowings. |
| (14) | Term Preferred Shares, net of deferred offering costs as a percentage of Total Investments is 12.1%. |
| (15) | Other assets less liabilities includes the unrealized appreciation (depreciation) of certainover-the counter (“OTC”) derivatives as presented on the Statement of Assets and Liabilities, when applicable. The unrealized appreciation (depreciation) of OTC cleared and exchange-traded derivatives is recognized as part of cash collateral at brokers and/or the receivable or payable for variation margin as presented on the Statement of Assets and Liabilities, when applicable. |
| (16) | The Fund entered into the credit default swaps to gain investment exposure to the referenced entity. Selling protection has a similar credit risk position to owning the referenced entity. Buying protection has a similar credit risk position to selling the referenced entity short. |
| 144A | Investment is exempt from registration under Rule 144A of the Securities Act of 1933, as amended. These investments may only be resold in transactions exempt from registration, which are normally those transactions with qualified institutional buyers. |
| DD1 | Portion of investment purchased on a delayed delivery basis. |
| LIBOR | London Inter-Bank Offered Rate |
| PIK | Payment-in-kind (“PIK”) security. Depending on the terms of the security, income may be received in the form of cash, securities, or a combination of both. The PIK rate shown, where applicable, represents the annualized rate of the last PIK payment made by the issuer as of the end of the reporting period. |
| TBD | Senior loan purchased on a when-issued or delayed-delivery basis. Certain details associated with this purchase are not known prior to the settlement date of the transaction. In addition, senior loans typically trade without accrued interest and therefore a coupon rate is not available prior to settlement. At settlement, if still unknown, the borrower or counterparty will provide the Fund with the final coupon rate and maturity date. |
| WI/DD | Purchased on a when-issued or delayed delivery basis. |
See accompanying notes to financial statements.
76
| | |
| JQC | | Nuveen Credit Strategies Income Fund Portfolio of Investments July 31, 2019 |
| | | | | | | | | | | | | | | | | | | | | | | | | | | | |
Principal
Amount (000) | | | Description (1) | | Coupon (2) | | | Reference
Rate (2) | | | Spread (2) | | | Maturity (3) | | | Ratings (4) | | | Value | |
| | | | |
| | | | LONG-TERM INVESTMENTS – 156.2% (94.5% of Total Investments) | | | | | | | | | | | | | |
| |
| | | | VARIABLE RATE SENIOR LOAN INTERESTS – 121.0% (73.2% of Total Investments) (2) | |
| | | | |
| | | | Aerospace & Defense – 1.2% (0.7% of Total Investments) | | | | | | | | | | |
| | | | | | | |
| $ | 2,231 | | | Rexnord LLC/ RBS Global, Inc., Term Loan, First Lien | | | 4.234% | | | | 1-Month LIBOR | | | | 2.000% | | | | 8/21/24 | | | | BBB– | | | $ | 2,243,931 | |
| | 11,850 | | | Transdigm, Inc., Term Loan E | | | 4.830% | | | | 3-Month LIBOR | | | | 2.500% | | | | 5/30/25 | | | | Ba3 | | | | 11,773,804 | |
| | 14,081 | | | Total Aerospace & Defense | | | | | | | | | | | | | | | | | | | | | | | 14,017,735 | |
| | | | | |
| | | | Airlines – 3.6% (2.1% of Total Investments) | | | | | | | | | | | | | |
| | | | | | | |
| | 2,939 | | | American Airlines, Inc., Replacement Term Loan | | | 4.379% | | | | 1-Month LIBOR | | | | 2.000% | | | | 10/10/21 | | | | BB+ | | | | 2,941,024 | |
| | 12,592 | | | American Airlines, Inc., Term Loan 2025 | | | 4.061% | | | | 3-Month LIBOR | | | | 1.750% | | | | 6/27/25 | | | | BB+ | | | | 12,363,772 | |
| | 7,760 | | | American Airlines, Inc., Term Loan B | | | 4.241% | | | | 1-Month LIBOR | | | | 2.000% | | | | 4/28/23 | | | | BB+ | | | | 7,743,510 | |
| | 3,438 | | | American Airlines, Inc., Term Loan B | | | 4.325% | | | | 1-Month LIBOR | | | | 2.000% | | | | 12/14/23 | | | | BB+ | | | | 3,427,017 | |
| | 14,633 | | | United Air Lines, Inc., Term Loan B | | | 3.984% | | | | 1-Month LIBOR | | | | 1.750% | | | | 4/01/24 | | | | BBB– | | | | 14,643,853 | |
| | 41,362 | | | Total Airlines | | | | | | | | | | | | | | | | | | | | | | | 41,119,176 | |
| | | | | |
| | | | Auto Components – 0.8% (0.5% of Total Investments) | | | | | | | | | | | | | |
| | | | | | | |
| | 9,000 | | | Johnson Controls Inc., Term Loan B | | | 5.734% | | | | 1-Month LIBOR | | | | 3.500% | | | | 4/30/26 | | | | Ba3 | | | | 9,014,085 | |
| | | | | |
| | | | Automobiles – 1.3% (0.8% of Total Investments) | | | | | | | | | | | | | |
| | | | | | | |
| | 14,775 | | | Navistar, Inc., Term Loan B | | | 5.830% | | | | 1-Month LIBOR | | | | 3.500% | | | | 11/06/24 | | | | Ba2 | | | | 14,839,715 | |
| | | | | |
| | | | Beverages – 1.1% (0.7% of Total Investments) | | | | | | | | | | | | | |
| | | | | | | |
| | 12,846 | | | Jacobs Douwe Egberts, Term Loan B | | | 4.438% | | | | 1-Month LIBOR | | | | 2.000% | | | | 11/01/25 | | | | Ba2 | | | | 12,876,381 | |
| | | | | |
| | | | Building Products – 1.5% (0.9% of Total Investments) | | | | | | | | | | | | | |
| | | | | | | |
| | 17,766 | | | Quikrete Holdings, Inc., Term Loan B | | | 4.984% | | | | 1-Month LIBOR | | | | 2.750% | | | | 11/15/23 | | | | BB– | | | | 17,653,985 | |
| | | | | |
| | | | Capital Markets – 2.8% (1.7% of Total Investments) | | | | | | | | | | | | | |
| | | | | | | |
| | 11,111 | | | Capital Automotive LP, Term Loan, First Lien, (DD1) | | | 4.740% | | | | 1-Month LIBOR | | | | 2.500% | | | | 3/25/24 | | | | B1 | | | | 11,109,757 | |
| | 20,473 | | | RPI Finance Trust, Term Loan B6, (5) | | | 4.234% | | | | 1-Month LIBOR | | | | 2.000% | | | | 3/27/23 | | | | BBB– | | | | 20,605,936 | |
| | 31,584 | | | Total Capital Markets | | | | | | | | | | | | | | | | | | | | | | | 31,715,693 | |
| | | | | |
| | | | Chemicals – 3.3% (2.0% of Total Investments) | | | | | | | | | | | | | |
| | | | | | | |
| | 13,661 | | | Axalta Coating Systems, Term Loan, First Lien | | | 4.080% | | | | 3-Month LIBOR | | | | 1.750% | | | | 6/01/24 | | | | BBB– | | | | 13,613,277 | |
| | 11,062 | | | Ineos US Finance LLC, Term Loan | | | 4.258% | | | | 2-Month LIBOR | | | | 2.000% | | | | 4/01/24 | | | | BB+ | | | | 10,912,534 | |
| | 13,945 | | | Univar, Inc., Term Loan B | | | 4.484% | | | | 1-Month LIBOR | | | | 2.250% | | | | 7/01/24 | | | | BB+ | | | | 13,985,480 | |
| | 38,668 | | | Total Chemicals | | | | | | | | | | | | | | | | | | | | | | | 38,511,291 | |
| | | | | |
| | | | Commercial Services & Supplies – 4.4% (2.6% of Total Investments) | | | | | | | | | | | | | |
| | | | | | | |
| | 18,079 | | | ADS Waste Holdings, Inc., Term Loan B | | | 4.599% | | | | 1-Week LIBOR | | | | 2.250% | | | | 11/10/23 | | | | BB+ | | | | 18,138,195 | |
| | 15,123 | | | Formula One Group, Term Loan B | | | 4.734% | | | | 1-Month LIBOR | | | | 2.500% | | | | 2/01/24 | | | | B+ | | | | 14,974,513 | |
| | 16,898 | | | Trans Union LLC, Term Loan B3 | | | 4.234% | | | | 1-Month LIBOR | | | | 2.000% | | | | 4/10/23 | | | | BB+ | | | | 16,965,560 | |
| | 50,100 | | | Total Commercial Services & Supplies | | | | | | | | | | | | 50,078,268 | |
| | | | | |
| | | | Communications Equipment – 1.2% (0.7% of Total Investments) | | | | | | | | | | | | | |
| | | | | | | |
| | 1,995 | | | Avaya, Inc., Term Loan B | | | 6.575% | | | | 1-Month LIBOR | | | | 4.250% | | | | 12/15/24 | | | | B | | | | 1,924,496 | |
| | 4,975 | | | Mitel US Holdings, Inc., Term Loan, First Lien | | | 6.734% | | | | 1-Month LIBOR | | | | 4.500% | | | | 11/30/25 | | | | B | | | | 4,857,714 | |
| | 6,856 | | | Plantronics, Term Loan B | | | 4.734% | | | | 1-Month LIBOR | | | | 2.500% | | | | 7/02/25 | | | | Ba1 | | | | 6,866,349 | |
| | 13,826 | | | Total Communications Equipment | | | | | | | | | | | | | | | | | | | | | | | 13,648,559 | |
| | | | | |
| | | | Containers & Packaging – 1.3% (0.8% of Total Investments) | | | | | | | | | | | | | |
| | | | | | | |
| | 5,397 | | | Berry Global, Inc., Term Loan Q | | | 4.629% | | | | 1-Month LIBOR | | | | 2.250% | | | | 10/01/22 | | | | BBB– | | | | 5,402,349 | |
| | 8,500 | | | Berry Global, Inc., Term Loan U | | | 4.902% | | | | 1-Month LIBOR | | | | 2.500% | | | | 7/01/26 | | | | BBB– | | | | 8,503,995 | |
| | 865 | | | Crown Americas, Inc., Term Loan B | | | 4.369% | | | | 1-Month LIBOR | | | | 2.000% | | | | 4/03/25 | | | | Baa2 | | | | 869,755 | |
| | 14,762 | | | Total Containers & Packaging | | | | | | | | | | | | | | | | | | | | | | | 14,776,099 | |
77
| | |
| |
| JQC | | Nuveen Credit Strategies Income Fund(continued) |
| | Portfolio of Investments July 31, 2019 |
| | | | | | | | | | | | | | | | | | | | | | | | | | | | |
Principal
Amount (000) | | | Description (1) | | Coupon (2) | | | Reference
Rate (2) | | | Spread (2) | | | Maturity (3) | | | Ratings (4) | | | Value | |
| | | | | |
| | | | Diversified Consumer Services – 0.8% (0.5% of Total Investments) | | | | | | | | | | | | | |
| | | | | | | |
| $ | 4,450 | | | Cengage Learning Acquisitions, Inc., Term Loan B | | | 6.484% | | | | 1-Month LIBOR | | | | 4.250% | | | | 6/07/23 | | | | B | | | $ | 4,299,425 | |
| | 4,974 | | | Houghton Mifflin, Term Loan B, First Lien, (DD1) | | | 5.234% | | | | 1-Month LIBOR | | | | 3.000% | | | | 5/28/21 | | | | B | | | | 4,779,258 | |
| | 9,424 | | | Total Diversified Consumer Services | | | | | | | | | | | | | | | | | | | | | | | 9,078,683 | |
| | | | | |
| | | | Diversified Financial Services – 0.6% (0.3% of Total Investments) | | | | | | | | | | | | | |
| | | | | | | |
| | 2,494 | | | Getty Images, Inc., Initial Dollar Term Loan | | | 6.750% | | | | 1-Month LIBOR | | | | 4.500% | | | | 2/19/26 | | | | B2 | | | | 2,493,697 | |
| | 1,124 | | | Lions Gate Entertainment Corp., Term Loan B | | | 4.484% | | | | 1-Month LIBOR | | | | 2.250% | | | | 3/24/25 | | | | Ba2 | | | | 1,124,404 | |
| | 7,271 | | | Walter Investment Management Corporation, Term Loan B, First Lien, (6) | | | 0.000% | | | | N/A | | | | N/A | | | | 6/30/22 | | | | Ca | | | | 2,781,113 | |
| | 10,889 | | | Total Diversified Financial Services | | | | | | | | | | | | | | | | | | | | | | | 6,399,214 | |
| | | | |
| | | | Diversified Telecommunication Services – 4.8% (2.9% of Total Investments) | | | | | | | | | | |
| | | | | | | |
| | 11,241 | | | CenturyLink, Inc., Initial Term Loan A | | | 4.984% | | | | 1-Month LIBOR | | | | 2.750% | | | | 11/01/22 | | | | BBB– | | | | 11,259,840 | |
| | 1,940 | | | CenturyLink, Inc., Term Loan B | | | 4.984% | | | | 1-Month LIBOR | | | | 2.750% | | | | 1/31/25 | | | | BBB– | | | | 1,930,800 | |
| | 1,995 | | | Frontier Communications Corporation, Term Loan B, (WI/DD) | | | TBD | | | | TBD | | | | TBD | | | | TBD | | | | B2 | | | | 1,975,171 | |
| | 11,144 | | | Level 3 Financing, Inc., Term Loan B, (5) | | | 4.484% | | | | 1-Month LIBOR | | | | 2.250% | | | | 2/22/24 | | | | BBB– | | | | 11,168,240 | |
| | 8,933 | | | Numericable Group S.A., Term Loan B13 | | | 6.325% | | | | 1-Month LIBOR | | | | 4.000% | | | | 8/14/26 | | | | B | | | | 8,904,631 | |
| | 20,000 | | | Ziggo B.V., Term Loan E, (5) | | | 4.825% | | | | 1-Month LIBOR | | | | 2.500% | | | | 4/15/25 | | | | B+ | | | | 19,905,500 | |
| | 55,253 | | | Total Diversified Telecommunication Services | | | | | | | | | | | | 55,144,182 | |
| | | | | |
| | | | Electric Utilities – 2.1% (1.3% of Total Investments) | | | | | | | | | | | | | |
| | | | | | | |
| | 11,764 | | | Vistra Operations Co., Term Loan B1 | | | 4.234% | | | | 1-Month LIBOR | | | | 2.000% | | | | 8/01/23 | | | | BBB– | | | | 11,795,354 | |
| | 12,834 | | | Vistra Operations Co., Term Loan B3, (DD1) | | | 4.270% | | | | 3-Month LIBOR | | | | 2.000% | | | | 12/31/25 | | | | BBB– | | | | 12,871,642 | |
| | 24,598 | | | Total Electric Utilities | | | | | | | | | | | | | | | | | | | | | | | 24,666,996 | |
| | | | | |
| | | | Energy Equipment & Services – 0.2% (0.1% of Total Investments) | | | | | | | | | | | | | |
| | | | | | | |
| | 1,740 | | | McDermott International, Term Loan, (DD1) | | | 7.234% | | | | 1-Month LIBOR | | | | 5.000% | | | | 5/12/25 | | | | Ba3 | | | | 1,667,183 | |
| | | | | |
| | | | Entertainment – 0.1% (0.0% of Total Investments) | | | | | | | | | | | | | |
| | | | | | | |
| | 500 | | | NASCAR Holdings, Inc., Term Loan B, (WI/DD) | | | TBD | | | | TBD | | | | TBD | | | | TBD | | | | BB | | | | 502,815 | |
| | | | | |
| | | | Equity Real Estate Investment Trust – 0.3% (0.2% of Total Investments) | | | | | | | | | | | | | |
| | | | | | | |
| | 3,053 | | | Communications Sales & Leasing, Inc., Shortfall Term Loan | | | 7.234% | | | | 1-Month LIBOR | | | | 5.000% | | | | 10/24/22 | | | | Caa1 | | | | 2,976,455 | |
| | | | | |
| | | | Food & Staples Retailing – 2.2% (1.3% of Total Investments) | | | | | | | | | | | | | |
| | | | | | | |
| | 5,047 | | | Albertson’s LLC, Term Loan B6 | | | 5.234% | | | | 1-Month LIBOR | | | | 3.000% | | | | 6/22/23 | | | | BB | | | | 5,062,418 | |
| | 2,496 | | | Albertson’s LLC, Term Loan B7 | | | 5.234% | | | | 1-Month LIBOR | | | | 3.000% | | | | 11/17/25 | | | | BB | | | | 2,502,789 | |
| | 17,771 | | | US Foods, Inc., Term Loan B | | | 4.234% | | | | 1-Month LIBOR | | | | 2.000% | | | | 6/27/23 | | | | BBB– | | | | 17,778,901 | |
| | 25,314 | | | Total Food & Staples Retailing | | | | | | | | | | | | | | | | | | | | | | | 25,344,108 | |
| | | | | |
| | | | Food Products – 1.9% (1.1% of Total Investments) | | | | | | | | | | | | | |
| | | | | | | |
| | 7,959 | | | Chobani, Inc., Term Loan B | | | 5.734% | | | | 1-Month LIBOR | | | | 3.500% | | | | 10/10/23 | | | | B1 | | | | 7,892,040 | |
| | 13,741 | | | JBS USA Lux S.A., Term Loan | | | 4.734% | | | | 1-Month LIBOR | | | | 2.500% | | | | 5/01/26 | | | | Ba2 | | | | 13,794,232 | |
| | 21,700 | | | Total Food Products | | | | | | | | | | | | | | | | | | | | | | | 21,686,272 | |
| | | | | |
| | | | Health Care Equipment & Supplies – 4.5% (2.7% of Total Investments) | | | | | | | | | | | | | |
| | | | | | | |
| | 32,696 | | | Acelity, Term Loan B | | | 5.580% | | | | 3-Month LIBOR | | | | 3.250% | | | | 2/02/24 | | | | B1 | | | | 32,830,885 | |
| | 12,193 | | | Onex Carestream Finance LP, Term Loan, First Lien | | | 7.984% | | | | 1-Month LIBOR | | | | 5.750% | | | | 2/28/21 | | | | B1 | | | | 11,751,307 | |
| | 7,954 | | | Onex Carestream Finance LP, Term Loan, Second Lien | | | 11.734% | | | | 1-Month LIBOR | | | | 9.500% | | | | 6/07/21 | | | | B– | | | | 7,575,893 | |
| | 52,843 | | | Total Health Care Equipment & Supplies | | | | | | | | | | | | 52,158,085 | |
| | | | | |
| | | | Health Care Providers & Services – 9.2% (5.6% of Total Investments) | | | | | | | | | | | | | |
| | | | | | | |
| | 5,165 | | | Acadia Healthcare, Inc., Term Loan B3 | | | 4.734% | | | | 1-Month LIBOR | | | | 2.500% | | | | 2/11/22 | | | | Ba2 | | | | 5,178,811 | |
| | 9,917 | | | Ardent Health, Term Loan, First Lien | | | 6.734% | | | | 1-Month LIBOR | | | | 4.500% | | | | 6/30/25 | | | | B1 | | | | 9,958,674 | |
| | 2,992 | | | ATI Holdings Acquisition, Inc., Term Loan | | | 5.770% | | | | 1-Month LIBOR | | | | 3.500% | | | | 5/10/23 | | | | B1 | | | | 2,954,884 | |
| | 12,405 | | | Brightspring Health, Term Loan B | | | 6.880% | | | | 1-Month LIBOR | | | | 4.500% | | | | 3/05/26 | | | | B1 | | | | 12,483,683 | |
| | 7,513 | | | Civitas Solutions, Term Loan B | | | 6.490% | | | | 1-Month LIBOR | | | | 4.250% | | | | 3/09/26 | | | | B1 | | | | 7,569,683 | |
78
| | | | | | | | | | | | | | | | | | | | | | | | | | | | |
Principal
Amount (000) | | | Description (1) | | Coupon (2) | | | Reference
Rate (2) | | | Spread (2) | | | Maturity (3) | | | Ratings (4) | | | Value | |
| | | | | |
| | | | Health Care Providers & Services(continued) | | | | | | | | | | | | | |
| | | | | | | |
| $ | 468 | | | Civitas Solutions, Term Loan C | | | 6.490% | | | | 1-Month LIBOR | | | | 4.250% | | | | 3/09/26 | | | | B1 | | | $ | 471,345 | |
| | 7,000 | | | Concentra, Inc., Term Loan B | | | 5.210% | | | | 3-Month LIBOR | | | | 2.750% | | | | 6/01/22 | | | | B+ | | | | 7,019,705 | |
| | 14,291 | | | ConvaTec, Inc., Term Loan B | | | 4.580% | | | | 3-Month LIBOR | | | | 2.250% | | | | 10/25/23 | | | | BB | | | | 14,283,696 | |
| | 4,106 | | | DaVita HealthCare Partners, Inc., Term Loan B | | | 5.130% | | | | 1-Month LIBOR | | | | 2.750% | | | | 6/24/21 | | | | BBB– | | | | 4,110,818 | |
| | 12,611 | | | Kindred at Home Hospice, Term Loan B | | | 6.000% | | | | 1-Month LIBOR | | | | 3.750% | | | | 7/02/25 | | | | B1 | | | | 12,697,286 | |
| | 4,478 | | | Lifepoint Health, Inc., Term Loan | | | 6.769% | | | | 1-Month LIBOR | | | | 4.500% | | | | 11/16/25 | | | | B+ | | | | 4,509,402 | |
| | 6,765 | | | Millennium Laboratories, Inc., Term Loan B, First Lien | | | 8.734% | | | | 1-Month LIBOR | | | | 6.500% | | | | 12/21/20 | | | | Caa3 | | | | 3,066,725 | |
| | 5,276 | | | Pharmaceutical Product Development, Inc., Term Loan B | | | 4.734% | | | | 1-Month LIBOR | | | | 2.500% | | | | 8/18/22 | | | | Ba3 | | | | 5,274,970 | |
| | 8,463 | | | Prospect Medical Holdings, Term Loan B1 | | | 7.875% | | | | 1-Month LIBOR | | | | 5.500% | | | | 2/22/24 | | | | B | | | | 8,458,170 | |
| | 159 | | | Quorum Health Corp., Term Loan B | | | 9.006% | | | | 3-Month LIBOR | | | | 6.750% | | | | 4/29/22 | | | | B1 | | | | 157,423 | |
| | 8,185 | | | Select Medical Corporation, Term Loan B | | | 4.850% | | | | 3-Month LIBOR | | | | 2.500% | | | | 3/06/25 | | | | Ba2 | | | | 8,179,996 | |
| | 109,794 | | | Total Health Care Providers & Services | | | | | | | | | | | | 106,375,271 | |
| | | | | |
| | | | Health Care Technology – 0.2% (0.1% of Total Investments) | | | | | | | | | | | | | |
| | | | | | | |
| | 2,571 | | | Emdeon, Inc., Term Loan, (DD1), (5) | | | 4.734% | | | | 1-Month LIBOR | | | | 2.500% | | | | 3/01/24 | | | | B+ | | | | 2,569,620 | |
| | | | | |
| | | | Hotels, Restaurants & Leisure – 15.3% (9.3% of Total Investments) | | | | | | | | | | | | | |
| | | | | | | |
| | 2,805 | | | Aramark Corporation, Term Loan | | | 4.080% | | | | 3-Month LIBOR | | | | 1.750% | | | | 3/11/25 | | | | BBB– | | | | 2,809,670 | |
| | 15,393 | | | Burger King Corporation, Term Loan B3 | | | 4.484% | | | | 1-Month LIBOR | | | | 2.250% | | | | 2/16/24 | | | | Ba3 | | | | 15,420,062 | |
| | 19,041 | | | Caesars Entertainment Operating Company, Inc., Term Loan B | | | 4.234% | | | | 1-Month LIBOR | | | | 2.000% | | | | 10/06/24 | | | | BB | | | | 19,023,537 | |
| | 18,223 | | | Caesars Resort Collection, Term Loan, First Lien | | | 4.984% | | | | 1-Month LIBOR | | | | 2.750% | | | | 12/23/24 | | | | BB | | | | 18,105,785 | |
| | 971 | | | CCM Merger, Inc., Term Loan B | | | 4.484% | | | | 1-Month LIBOR | | | | 2.250% | | | | 8/09/21 | | | | BB– | | | | 972,678 | |
| | 9,473 | | | Equinox Holdings, Inc., Term Loan B1, (WI/DD) | | | TBD | | | | TBD | | | | TBD | | | | TBD | | | | B+ | | | | 9,502,150 | |
| | 14,681 | | | Hilton Hotels, Term Loan B2 | | | 4.016% | | | | 1-Month LIBOR | | | | 1.750% | | | | 6/22/26 | | | | BBB– | | | | 14,743,955 | |
| | 21,885 | | | Life Time Fitness, Inc., Term Loan B | | | 5.272% | | | | 3-Month LIBOR | | | | 2.750% | | | | 6/10/22 | | | | BB– | | | | 21,902,798 | |
| | 11,940 | | | Marriott Ownership Resorts, Term Loan B | | | 4.484% | | | | 1-Month LIBOR | | | | 2.250% | | | | 8/29/25 | | | | Baa3 | | | | 11,994,685 | |
| | 4,644 | | | MGM Growth Properties, Term Loan B | | | 4.234% | | | | 1-Month LIBOR | | | | 2.000% | | | | 3/21/25 | | | | BB+ | | | | 4,652,220 | |
| | 12,867 | | | Scientific Games Corp., Initial Term Loan B5 | | | 4.984% | | | | 1-Month LIBOR | | | | 2.750% | | | | 8/14/24 | | | | Ba3 | | | | 12,821,325 | |
| | 8,038 | | | Stars Group Holdings, Term Loan B | | | 5.830% | | | | 3-Month LIBOR | | | | 3.500% | | | | 7/10/25 | | | | B+ | | | | 8,078,014 | |
| | 15,416 | | | Station Casino LLC, Term Loan B | | | 4.740% | | | | 1-Month LIBOR | | | | 2.500% | | | | 6/08/23 | | | | BB | | | | 15,471,759 | |
| | 9,000 | | | Whataburger Restaurants, Term Loan B, (WI/DD) | | | TBD | | | | TBD | | | | TBD | | | | TBD | | | | B+ | | | | 9,044,100 | |
| | 2,481 | | | Wyndham International, Inc., Term Loan B | | | 3.984% | | | | 1-Month LIBOR | | | | 1.750% | | | | 5/30/25 | | | | BBB– | | | | 2,490,753 | |
| | 9,680 | | | YUM Brands, Term Loan B | | | 4.050% | | | | 1-Month LIBOR | | | | 1.750% | | | | 4/03/25 | | | | BBB– | | | | 9,688,762 | |
| | 176,538 | | | Total Hotels, Restaurants & Leisure | | | | | | | | | | | | | | | | | | | | | | | 176,722,253 | |
| | | | | |
| | | | Household Durables – 1.2% (0.7% of Total Investments) | | | | | | | | | | | | | |
| | | | | | | |
| | 4,430 | | | Apex Tool Group LLC, Term Loan B | | | 5.984% | | | | 1-Month LIBOR | | | | 3.750% | | | | 2/01/22 | | | | B2 | | | | 4,259,032 | |
| | 14,348 | | | Serta Simmons Holdings LLC, Term Loan, First Lien | | | 5.865% | | | | 1-Month LIBOR | | | | 3.500% | | | | 11/08/23 | | | | CCC+ | | | | 9,882,409 | |
| | 18,778 | | | Total Household Durables | | | | | | | | | | | | | | | | | | | | | | | 14,141,441 | |
| | | | | |
| | | | Household Products – 2.5% (1.5% of Total Investments) | | | | | | | | | | | | | |
| | | | | | | |
| | 9,579 | | | Energizer Holdings, Term Loan B | | | 4.688% | | | | 1-Month LIBOR | | | | 2.250% | | | | 12/17/25 | | | | BB+ | | | | 9,582,393 | |
| | 19,167 | | | Reynolds Group Holdings, Inc., Term Loan, First Lien | | | 4.984% | | | | 1-Month LIBOR | | | | 2.750% | | | | 2/05/23 | | | | B+ | | | | 19,193,869 | |
| | 28,746 | | | Total Household Products | | | | | | | | | | | | | | | | | | | | | | | 28,776,262 | |
| | | | | |
| | | | Insurance – 0.8% (0.5% of Total Investments) | | | | | | | | | | | | | |
| | | | | | | |
| | 9,736 | | | Hub International Holdings, Inc., Term Loan B | | | 5.267% | | | | 3-Month LIBOR | | | | 3.000% | | | | 4/25/25 | | | | B | | | | 9,649,263 | |
| | | | | |
| | | | Interactive Media & Services – 0.7% (0.4% of Total Investments) | | | | | | | | | | | | | |
| | | | | | | |
| | 8,962 | | | Rackspace Hosting, Inc., Refinancing Term B Loan, First Lien | | | 5.576% | | | | 3-Month LIBOR | | | | 3.000% | | | | 11/03/23 | | | | BB– | | | | 8,340,177 | |
| | | | | |
| | | | Internet Software & Services – 3.0% (1.8% of Total Investments) | | | | | | | | | | | | | |
| | | | | | | |
| | 18,021 | | | Ancestry.com, Inc., Term Loan, First Lien | | | 5.490% | | | | 1-Month LIBOR | | | | 3.250% | | | | 10/19/23 | | | | B | | | | 18,035,767 | |
| | 14,697 | | | Dynatrace, Term Loan, First Lien | | | 5.234% | | | | 1-Month LIBOR | | | | 3.000% | | | | 8/22/25 | | | | B1 | | | | 14,733,579 | |
| | 306 | | | Dynatrace, Term Loan, Second Lien | | | 9.234% | | | | 1-Month LIBOR | | | | 7.000% | | | | 8/21/26 | | | | CCC+ | | | | 309,273 | |
| | 4,000 | | | SkillSoft Corporation, Term Loan, Second Lien | | | 10.520% | | | | 3-Month LIBOR | | | | 8.250% | | | | 4/28/22 | | | | CCC | | | | 1,470,000 | |
| | 37,024 | | | Total Internet Software & Services | | | | | | | | | | | | | | | | | | | | | | | 34,548,619 | |
79
| | |
| |
| JQC | | Nuveen Credit Strategies Income Fund(continued) |
| | Portfolio of Investments July 31, 2019 |
| | | | | | | | | | | | | | | | | | | | | | | | | | | | |
Principal
Amount (000) | | | Description (1) | | Coupon (2) | | | Reference
Rate (2) | | | Spread (2) | | | Maturity (3) | | | Ratings (4) | | | Value | |
| | | | | |
| | | | IT Services – 3.1% (2.0% of Total Investments) | | | | | | | | | | | | | |
| | | | | | | |
| $ | 18,575 | | | Sabre, Inc., Term Loan B | | | 4.234% | | | | 1-Month LIBOR | | | | 2.000% | | | | 2/22/24 | | | | BB | | | $ | 18,652,973 | |
| | 5,141 | | | Syniverse Holdings, Inc., Term Loan C | | | 7.325% | | | | 1-Month LIBOR | | | | 5.000% | | | | 3/09/23 | | | | B2 | | | | 4,718,699 | |
| | 12,745 | | | Tempo Acquisition LLC, Term Loan B, (5) | | | 5.234% | | | | 1-Month LIBOR | | | | 3.000% | | | | 5/01/24 | | | | B1 | | | | 12,779,961 | |
| | 36,461 | | | Total IT Services | | | | | | | | | | | | | | | | | | | | | | | 36,151,633 | |
| | | | | |
| | | | Machinery – 1.1% (0.7% of Total Investments) | | | | | | | | | | | | | |
| | | | | | | |
| | 12,538 | | | Gardner Denver, Inc., Term Loan B | | | 4.984% | | | | 1-Month LIBOR | | | | 2.750% | | | | 7/30/24 | | | | BB+ | | | | 12,585,641 | |
| | | | | |
| | | | Marine – 0.2% (0.1% of Total Investments) | | | | | | | | | | | | | |
| | | | | | | |
| | 2,669 | | | Harvey Gulf International Marine, Inc., Exit Term Loan | | | 8.743% | | | | 3-Month LIBOR | | | | 6.000% | | | | 7/02/23 | | | | B | | | | 2,545,463 | |
| | | | | |
| | | | Media – 12.0% (7.3% of Total Investments) | | | | | | | | | | | | | |
| | | | | | | |
| | 7,031 | | | Acquisitions Cogeco Cable II L.P., Term Loan, First Lien | | | 4.484% | | | | 1-Month LIBOR | | | | 2.250% | | | | 1/03/25 | | | | BB– | | | | 7,025,860 | |
| | 846 | | | Advantage Sales & Marketing, Inc., Term Loan B2, First Lien, (WI/DD) | | | TBD | | | | TBD | | | | TBD | | | | TBD | | | | B2 | | | | 785,575 | |
| | 905 | | | Advantage Sales & Marketing, Inc., Term Loan, First Lien | | | 5.580% | | | | 3-Month LIBOR | | | | 3.250% | | | | 7/23/21 | | | | B2 | | | | 841,756 | |
| | 1,995 | | | AMC Entertainment, Inc., Term Loan B | | | 5.230% | | | | 6-Month LIBOR | | | | 3.000% | | | | 4/22/26 | | | | Ba2 | | | | 2,000,247 | |
| | 451 | | | Catalina Marketing Corporation, First Out Loan | | | 9.814% | | | | 1-Month LIBOR | | | | 7.500% | | | | 2/15/23 | | | | B2 | | | | 382,825 | |
| | 570 | | | Catalina Marketing Corporation, Last Out PIK Term Loan, (cash 3.314, PIK 9.500%) | | | 3.314% | | | | 1-Month LIBOR | | | | 1.000% | | | | 8/15/23 | | | | Caa2 | | | | 270,786 | |
| | 10,877 | | | Charter Communications Operating Holdings LLC, Term Loan B | | | 4.330% | | | | 3-Month LIBOR | | | | 2.000% | | | | 4/30/25 | | | | BBB– | | | | 10,908,623 | |
| | 9,018 | | | Cineworld Group PLC, Term Loan B | | | 4.484% | | | | 1-Month LIBOR | | | | 2.250% | | | | 2/28/25 | | | | BB– | | | | 9,000,201 | |
| | 9,918 | | | Clear Channel Communications, Inc., Exit Term Loan | | | 6.579% | | | | 3-Month LIBOR | | | | 4.000% | | | | 5/01/26 | | | | BB– | | | | 10,004,366 | |
| | 9,197 | | | CSC Holdings LLC, Term Loan B, (DD1) | | | 4.825% | | | | 1-Month LIBOR | | | | 2.500% | | | | 1/25/26 | | | | BB | | | | 9,208,371 | |
| | 5,739 | | | Cumulus Media, Inc., Exit Term Loan | | | 6.740% | | | | 1-Month LIBOR | | | | 4.500% | | | | 5/13/22 | | | | B | | | | 5,787,715 | |
| | 5,000 | | | Gray Television, Inc., Term Loan B2, (WI/DD) | | | TBD | | | | TBD | | | | TBD | | | | TBD | | | | BB | | | | 5,011,350 | |
| | 14,325 | | | Meredith Corporation, Term Loan B1 | | | 4.984% | | | | 1-Month LIBOR | | | | 2.750% | | | | 1/31/25 | | | | BB | | | | 14,392,427 | |
| | 2,000 | | | Nexstar Broadcasting, Inc., Term Loan B, (WI/DD) | | | TBD | | | | TBD | | | | TBD | | | | TBD | | | | BB | | | | 2,002,920 | |
| | 430 | | | Nexstar Broadcasting, Inc., Term Loan B3 | | | 4.652% | | | | 1-Month LIBOR | | | | 2.250% | | | | 1/17/24 | | | | BB | | | | 429,177 | |
| | 2,160 | | | Nexstar Broadcasting, Inc., Term Loan B3 | | | 4.491% | | | | 1-Month LIBOR | | | | 2.250% | | | | 1/17/24 | | | | BB | | | | 2,154,427 | |
| | 4,937 | | | Sinclair Television Group, Term Loan B2 | | | 4.490% | | | | 1-Month LIBOR | | | | 2.250% | | | | 1/03/24 | | | | BB+ | | | | 4,939,794 | |
| | 4,259 | | | Springer Science & Business Media, Inc., Term Loan B13, First Lien | | | 5.734% | | | | 1-Month LIBOR | | | | 3.500% | | | | 8/15/22 | | | | B | | | | 4,272,202 | |
| | 25,238 | | | Tribune Media Company, Term Loan C | | | 5.234% | | | | 1-Month LIBOR | | | | 3.000% | | | | 1/27/24 | | | | BB+ | | | | 25,248,639 | |
| | 12,000 | | | Virgin Media Investment Holdings Limited, Term Loan K | | | 4.825% | | | | 1-Month LIBOR | | | | 2.500% | | | | 1/15/26 | | | | Ba3 | | | | 12,040,020 | |
| | 12,127 | | | WideOpenWest Finance LLC, Term Loan B | | | 5.519% | | | | 1-Month LIBOR | | | | 3.250% | | | | 8/18/23 | | | | B | | | | 11,935,307 | |
| | 139,023 | | | Total Media | | | | | | | | | | | | | | | | | | | | | | | 138,642,588 | |
| | | | | |
| | | | Multiline Retail – 0.8% (0.5% of Total Investments) | | | | | | | | | | | | | |
| | | | | | | |
| | 2,099 | | | Belk, Inc., Term Loan B, First Lien | | | 7.285% | | | | 3-Month LIBOR | | | | 4.750% | | | | 12/12/22 | | | | B2 | | | | 1,708,997 | |
| | 7,880 | | | EG America LLC, Term Loan, First Lien | | | 6.330% | | | | 3-Month LIBOR | | | | 4.000% | | | | 2/07/25 | | | | B | | | | 7,816,066 | |
| | 9,979 | | | Total Multiline Retail | | | | | | | | | | | | | | | | | | | | | | | 9,525,063 | |
| | | | | |
| | | | Oil, Gas & Consumable Fuels – 1.4% (0.8% of Total Investments) | | | | | | | | | | | | | |
| | | | | | | |
| | 2,000 | | | California Resources Corporation, Term Loan | | | 12.616% | | | | 1-Month LIBOR | | | | 10.375% | | | | 12/31/21 | | | | B | | | | 2,014,000 | |
| | 4,000 | | | California Resources Corporation, Term Loan B | | | 6.991% | | | | 1-Month LIBOR | | | | 4.750% | | | | 12/31/22 | | | | B | | | | 3,825,000 | |
| | 4,969 | | | Fieldwood Energy LLC, Exit Term Loan | | | 7.506% | | | | 3-Month LIBOR | | | | 5.250% | | | | 4/11/22 | | | | B+ | | | | 4,587,834 | |
| | 6,896 | | | Fieldwood Energy LLC, Exit Term Loan, second Lien | | | 9.506% | | | | 3-Month LIBOR | | | | 7.250% | | | | 4/11/23 | | | | B+ | | | | 5,718,377 | |
| | 17,865 | | | Total Oil, Gas & Consumable Fuels | | | | | | | | | | | | | | | | | | | | | | | 16,145,211 | |
| | | | | |
| | | | Personal Products – 1.9% (1.2% of Total Investments) | | | | | | | | | | | | | |
| | | | | | | |
| | 9,597 | | | Coty, Inc., Term Loan A | | | 4.360% | | | | 1-Month LIBOR | | | | 2.000% | | | | 4/05/23 | | | | BB– | | | | 9,189,545 | |
| | 4,950 | | | Coty, Inc., Term Loan B | | | 4.610% | | | | 1-Month LIBOR | | | | 2.250% | | | | 4/07/25 | | | | BB– | | | | 4,795,312 | |
| | 10,204 | | | Revlon Consumer Products Corporation, Term Loan B, First Lien | | | 6.022% | | | | 3-Month LIBOR | | | | 3.500% | | | | 11/16/20 | | | | B3 | | | | 8,359,211 | |
| | 24,751 | | | Total Personal Products | | | | | | | | | | | | | | | | | | | | | | | 22,344,068 | |
80
| | | | | | | | | | | | | | | | | | | | | | | | | | | | |
Principal
Amount (000) | | | Description (1) | | Coupon (2) | | | Reference
Rate (2) | | | Spread (2) | | | Maturity (3) | | | Ratings (4) | | | Value | |
| | | | | |
| | | | Pharmaceuticals – 2.4% (1.4% of Total Investments) | | | | | | | | | | | | | |
| | | | | | | |
| $ | 16,578 | | | Alphabet Holding Company, Inc., Initial Term Loan, First Lien | | | 5.734% | | | | 1-Month LIBOR | | | | 3.500% | | | | 9/26/24 | | | | B– | | | $ | 15,721,387 | |
| | 7,895 | | | Valeant Pharmaceuticals International, Inc., Term Loan B | | | 5.129% | | | | 1-Month LIBOR | | | | 2.750% | | | | 11/27/25 | | | | Ba2 | | | | 7,903,145 | |
| | 3,572 | | | Valeant Pharmaceuticals International, Inc., Term Loan, First Lien | | | 5.379% | | | | 1-Month LIBOR | | | | 3.000% | | | | 6/02/25 | | | | Ba2 | | | | 3,589,075 | |
| | 28,045 | | | Total Pharmaceuticals | | | | | | | | | | | | | | | | | | | | | | | 27,213,607 | |
| | | | | |
| | | | Professional Services – 2.4% (1.5% of Total Investments) | | | | | | | | | | | | | |
| | | | | | | |
| | 936 | | | Ceridian HCM Holding, Inc., Term Loan B | | | 5.234% | | | | 1-Month LIBOR | | | | 3.000% | | | | 4/30/25 | | | | B2 | | | | 943,362 | |
| | 19,148 | | | On Assignment, Inc., Term Loan B | | | 4.234% | | | | 1-Month LIBOR | | | | 2.000% | | | | 4/02/25 | | | | BB | | | | 19,196,290 | |
| | 8,883 | | | Skillsoft Corporation, Initial Term Loan, First Lien | | | 6.946% | | | | 6-Month LIBOR | | | | 4.750% | | | | 4/28/21 | | | | CCC+ | | | | 7,567,456 | |
| | 28,967 | | | Total Professional Services | | | | | | | | | | | | | | | | | | | | | | | 27,707,108 | |
| | | | |
| | | | Real Estate Management & Development – 1.4% (0.8% of Total Investments) | | | | | | | | | | |
| | | | | | | |
| | 2,000 | | | GGP, Initial Term Loan A1 | | | 4.484% | | | | 1-Month LIBOR | | | | 2.250% | | | | 8/27/21 | | | | BB+ | | | | 1,992,500 | |
| | 3,960 | | | GGP, Initial Term Loan A2 | | | 4.484% | | �� | | 1-Month LIBOR | | | | 2.250% | | | | 8/28/23 | | | | BB+ | | | | 3,856,224 | |
| | 10,193 | | | GGP, Term Loan B | | | 4.734% | | | | 1-Month LIBOR | | | | 2.500% | | | | 8/27/25 | | | | BB+ | | | | 10,013,807 | |
| | 16,153 | | | Total Real Estate Management & Development | | | | | | | | | | | | 15,862,531 | |
| | | | |
| | | | Road & Rail – 0.8% (0.5% of Total Investments) | | | | | | | | | | |
| | | | | | | |
| | 8,806 | | | Avolon LLC, Term Loan B3 | | | 4.022% | | | | 1-Month LIBOR | | | | 1.750% | | | | 1/30/25 | | | | Baa2 | | | | 8,838,012 | |
| | | | |
| | | | Semiconductors & Semiconductor Equipment – 2.1% (1.2% of Total Investments) | | | | | | | | | | |
| | | | | | | |
| | 5,857 | | | Cabot Microelectronics, Term Loan B | | | 4.500% | | | | 1-Month LIBOR | | | | 2.250% | | | | 11/14/25 | | | | BB+ | | | | 5,879,136 | |
| | 3,791 | | | Lumileds, Term Loan B | | | 5.799% | | | | 3-Month LIBOR | | | | 3.500% | | | | 6/30/24 | | | | B+ | | | | 2,558,594 | |
| | 8,911 | | | Microchip Technology., Inc, Term Loan B | | | 4.240% | | | | 1-Month LIBOR | | | | 2.000% | | | | 5/29/25 | | | | Baa3 | | | | 8,921,958 | |
| | 6,302 | | | ON Semiconductor Corporation, Term Loan B3 | | | 3.984% | | | | 1-Month LIBOR | | | | 1.750% | | | | 3/31/23 | | | | Baa3 | | | | 6,299,329 | |
| | 24,861 | | | Total Semiconductors & Semiconductor Equipment | | | | | | | | | | | | 23,659,017 | |
| | | | | |
| | | | Software – 13.2% (8.0% of Total Investments) | | | | | | | | | | | | | |
| | | | | | | |
| | 4,297 | | | Blackboard, Inc., Term Loan B4 | | | 7.300% | | | | 3-Month LIBOR | | | | 5.000% | | | | 6/30/21 | | | | B– | | | | 4,286,849 | |
| | 4 | | | BMC Software, Inc., Term Loan B | | | 6.580% | | | | 3-Month LIBOR | | | | 4.250% | | | | 10/02/25 | | | | B | | | | 3,768 | |
| | 18,059 | | | Ellucian, Term Loan B, First Lien | | | 5.580% | | | | 3-Month LIBOR | | | | 3.250% | | | | 9/30/22 | | | | B | | | | 18,083,611 | |
| | 7,982 | | | Epicor Software Corporation, Term Loan B | | | 5.490% | | | | 1-Month LIBOR | | | | 3.250% | | | | 6/01/22 | | | | B2 | | | | 7,976,587 | |
| | 13,222 | | | Greeneden U.S. Holdings II LLC, Term Loan B | | | 5.484% | | | | 1-Month LIBOR | | | | 3.250% | | | | 12/01/23 | | | | B2 | | | | 13,176,172 | |
| | 18,142 | | | Infor (US), Inc., Term Loan B, (5) | | | 5.080% | | | | 3-Month LIBOR | | | | 2.750% | | | | 2/01/22 | | | | Ba3 | | | | 18,171,010 | |
| | 5,351 | | | Informatica, Term Loan B | | | 5.484% | | | | 1-Month LIBOR | | | | 3.250% | | | | 8/05/22 | | | | B1 | | | | 5,382,898 | |
| | 2,919 | | | Kronos Incorporated, Term Loan B | | | 5.579% | | | | 3-Month LIBOR | | | | 3.000% | | | | 11/01/23 | | | | B | | | | 2,924,494 | |
| | 15,169 | | | Kronos Incorporated, Term Loan B, Second Lien | | | 10.829% | | | | 3-Month LIBOR | | | | 8.250% | | | | 11/01/24 | | | | CCC | | | | 15,709,472 | |
| | 1,850 | | | Micro Focus International PLC, New Term Loan | | | 4.734% | | | | 1-Month LIBOR | | | | 2.500% | | | | 6/21/24 | | | | BB– | | | | 1,839,024 | |
| | 12,492 | | | Micro Focus International PLC, Term Loan B | | | 4.734% | | | | 1-Month LIBOR | | | | 2.500% | | | | 6/21/24 | | | | BB– | | | | 12,419,384 | |
| | 9,612 | | | Micro Focus International PLC, Term Loan B2 | | | 4.484% | | | | 1-Month LIBOR | | | | 2.250% | | | | 11/19/21 | | | | BB– | | | | 9,611,942 | |
| | 1,213 | | | Misys, New Term Loan, Second Lien | | | 9.446% | | | | 1-Month LIBOR | | | | 7.250% | | | | 6/13/25 | | | | CCC+ | | | | 1,207,983 | |
| | 8,000 | | | Press Ganey Holdings, Inc., Term Loan, First Lien, (WI/DD) | | | TBD | | | | TBD | | | | TBD | | | | TBD | | | | B | | | | 7,994,000 | |
| | 3,920 | | | RP Crown Parent LLC, Term Loan B | | | 4.984% | | | | 1-Month LIBOR | | | | 2.750% | | | | 10/15/23 | | | | B1 | | | | 3,918,618 | |
| | 5,842 | | | SS&C Technologies, Inc./ Sunshine Acquisition II, Inc., Term Loan B3 | | | 4.484% | | | | 1-Month LIBOR | | | | 2.250% | | | | 4/16/25 | | | | BB+ | | | | 5,849,555 | |
| | 3,978 | | | SS&C Technologies, Inc./ Sunshine Acquisition II, Inc., Term Loan B4 | | | 4.484% | | | | 1-Month LIBOR | | | | 2.250% | | | | 4/16/25 | | | | BB | | | | 3,982,594 | |
| | 4,296 | | | TIBCO Software, Inc., Term Loan B | | | 6.390% | | | | 1-Month LIBOR | | | | 4.000% | | | | 6/30/26 | | | | B1 | | | | 4,309,754 | |
| | 15,000 | | | Ultimate Software, Term Loan, First Lien | | | 6.080% | | | | 3-Month LIBOR | | | | 3.750% | | | | 5/04/26 | | | | B | | | | 15,139,425 | |
| | 151,348 | | | Total Software | | | | | | | | | | | | | | | | | | | | | | | 151,987,140 | |
| | | | | |
| | | | Specialty Retail – 1.6% (1.0% of Total Investments) | | | | | | | | | | | | | |
| | | | | | | |
| | 699 | | | Academy, Ltd., Term Loan B | | | 6.397% | | | | 1-Month LIBOR | | | | 4.000% | | | | 7/01/22 | | | | CCC+ | | | | 494,250 | |
| | 1,991 | | | Petco Animal Supplies, Inc., Term Loan B1 | | | 5.506% | | | | 3-Month LIBOR | | | | 3.250% | | | | 1/26/23 | | | | B2 | | | | 1,550,672 | |
| | 16,843 | | | Petsmart Inc., Term Loan B, First Lien, (DD1) | | | 6.380% | | | | 1-Month LIBOR | | | | 4.000% | | | | 3/11/22 | | | | B | | | | 16,564,645 | |
| | 313 | | | Serta Simmons Holdings LLC, Term Loan, Second Lien | | | 10.314% | | | | 1-Month LIBOR | | | | 8.000% | | | | 11/08/24 | | | | CCC– | | | | 145,601 | |
| | 19,846 | | | Total Specialty Retail | | | | | | | | | | | | | | | | | | | | | | | 18,755,168 | |
81
| | |
| |
| JQC | | Nuveen Credit Strategies Income Fund(continued) |
| | Portfolio of Investments July 31, 2019 |
| | | | | | | | | | | | | | | | | | | | | | | | | | | | |
Principal
Amount (000) | | | Description (1) | | Coupon (2) | | | Reference
Rate (2) | | | Spread (2) | | | Maturity (3) | | | Ratings (4) | | | Value | |
| | | | |
| | | | Technology Hardware, Storage & Peripherals – 1.9% (1.2% of Total Investments) | | | | | | | | | | |
| | | | | | | |
| $ | 14,793 | | | Dell International LLC, Refinancing Term Loan B | | | 4.240% | | | | 1-Month LIBOR | | | | 2.000% | | | | 9/07/23 | | | | BBB– | | | $ | 14,849,653 | |
| | 7,112 | | | Western Digital, Term Loan B | | | 4.012% | | | | 1-Month LIBOR | | | | 1.750% | | | | 4/29/23 | | | | Baa2 | | | | 7,070,415 | |
| | 21,905 | | | Total Technology Hardware, Storage & Peripherals | | | | | | | | | | | | 21,920,068 | |
| | | | | |
| | | | Trading Companies & Distributors – 0.9% (0.6% of Total Investments) | | | | | | | | | | | | | |
| | | | | | | |
| | 10,835 | | | HD Supply Waterworks, Ltd., Term Loan B | | | 5.238% | | | | 3-Month LIBOR | | | | 2.750% | | | | 8/01/24 | | | | B+ | | | | 10,846,268 | |
| | | | |
| | | | Transportation Infrastructure – 0.1% (0.1% of Total Investments) | | | | | | | | | | |
| | | | | | | |
| | 524 | | | Standard Aero, Canadien Term Loan | | | 6.330% | | | | 3-Month LIBOR | | | | 4.000% | | | | 4/06/26 | | | | B | | | | 528,409 | |
| | 976 | | | Standard Aero, USD Term Loan B | | | 6.330% | | | | 3-Month LIBOR | | | | 4.000% | | | | 4/06/26 | | | | B | | | | 982,841 | |
| | 1,500 | | | Total Transportation Infrastructure | | | | | | | | | | | | 1,511,250 | |
| | | |
| | | | Wireless Telecommunication Services – 0.8% (0.5% of Total Investments) | | | | | | | |
| | | | | | | |
| | 3,990 | | | Sprint Corporation, Incremental Term Loan | | | 5.250% | | | | 1-Month LIBOR | | | | 3.000% | | | | 2/02/24 | | | | Ba2 | | | | 3,993,087 | |
| | 4,888 | | | Sprint Corporation, Term Loan, First Lien | | | 4.750% | | | | 1-Month LIBOR | | | | 2.500% | | | | 2/02/24 | | | | Ba2 | | | | 4,883,224 | |
| | 8,878 | | | Total Wireless Telecommunication Services | | | | | | | | | | | | 8,876,311 | |
| $ | 1,420,663 | | | Total Variable Rate Senior Loan Interests (cost $1,415,039,702) | | | | | | | | | | | | 1,394,114,033 | |
| | | | | | | |
Principal
Amount (000) | | | Description (1) | | | | | | | | Coupon | | | Maturity | | | Ratings (4) | | | Value | |
| | | | | |
| | | | CORPORATE BONDS – 31.8% (19.2% of Total Investments) | | | | | | | | | | | | | | | | | |
| | | | | |
| | | | Aerospace & Defense – 1.0% (0.6% of Total Investments) | | | | | | | | | | | | | |
| | | | | | | |
| $ | 3,000 | | | Bombardier Inc, 144A | | | | | | | | | | | 6.000% | | | | 10/15/22 | | | | B | | | $ | 3,000,000 | |
| | 4,000 | | | TransDigm Inc, (5) | | | | | | | | | | | 6.000% | | | | 7/15/22 | | | | B– | | | | 4,041,200 | |
| | 4,000 | | | TransDigm Inc, (5) | | | | | | | | | | | 6.500% | | | | 7/15/24 | | | | B– | | | | 4,110,000 | |
| | 11,000 | | | Total Aerospace & Defense | | | | | | | | | | | | | | | | | | | | | | | 11,151,200 | |
| | | | | |
| | | | Airlines – 0.4% (0.3% of Total Investments) | | | | | | | | | | | | | |
| | | | | | | |
| | 3,004 | | | American Airlines Group Inc, 144A, (5) | | | | | | | | | | | 4.625% | | | | 3/01/20 | | | | BB– | | | | 3,022,775 | |
| | 1,750 | | | American Airlines Group Inc, 144A | | | | | | | | | | | 5.000% | | | | 6/01/22 | | | | BB– | | | | 1,800,488 | |
| | 4,754 | | | Total Airlines | | | | | | | | | | | | | | | | | | | | | | | 4,823,263 | |
| | | | | |
| | | | Auto Components – 0.4% (0.2% of Total Investments) | | | | | | | | | | | | | |
| | | | | | | |
| | 4,000 | | | Panther BF Aggregator 2 LP / Panther Finance Co Inc, 144A, (5) | | | | | | | | | | | 6.250% | | | | 5/15/26 | | | | BB | | | | 4,138,800 | |
| | | | | |
| | | | Communications Equipment – 0.3% (0.2% of Total Investments) | | | | | | | | | | | | | |
| | | | | | | |
| | 19,375 | | | Avaya Inc, 144A, (6), (7) | | | | | | | | | | | 7.000% | | | | 4/01/19 | | | | N/R | | | | — | |
| | 9,250 | | | Avaya Inc, 144A, (6), (7) | | | | | | | | | | | 10.500% | | | | 3/01/21 | | | | N/R | | | | — | |
| | 4,000 | | | CommScope Inc, 144A | | | | | | | | | | | 5.500% | | | | 3/01/24 | | | | Ba1 | | | | 4,050,000 | |
| | 32,625 | | | Total Communications Equipment | | | | | | | | | | | | 4,050,000 | |
| | | | | |
| | | | Consumer Finance – 2.3% (1.4% of Total Investments) | | | | | | | | | | | | | |
| | | | | | | |
| | 5,000 | | | DAE Funding LLC, 144A, (5) | | | | | | | | | | | 5.250% | | | | 11/15/21 | | | | BBB– | | | | 5,225,000 | |
| | 5,000 | | | DAE Funding LLC, 144A, (5) | | | | | | | | | | | 4.500% | | | | 8/01/22 | | | | BBB– | | | | 5,089,000 | |
| | 10,000 | | | Refinitiv US Holdings Inc, 144A, (5) | | | | | | | | | | | 6.250% | | | | 5/15/26 | | | | BB+ | | | | 10,750,000 | |
| | 5,000 | | | Verscend Escrow Corp, 144A | | | | | | | | | | | 9.750% | | | | 8/15/26 | | | | CCC+ | | | | 5,330,150 | |
| | 25,000 | | | Total Consumer Finance | | | | | | | | | | | | | | | | | | | | | | | 26,394,150 | |
| | | | | |
| | | | Diversified Financial Services – 0.6% (0.3% of Total Investments) | | | | | | | | | | | | | |
| | | | | | | |
| | 3,000 | | | Avolon Holdings Funding Ltd, 144A, (5) | | | | | | | | | | | 5.250% | | | | 5/15/24 | | | | BBB– | | | | 3,220,260 | |
| | 3,000 | | | Park Aerospace Holdings Ltd, 144A, (5) | | | | | | | | | | | 5.500% | | | | 2/15/24 | | | | BBB– | | | | 3,240,900 | |
| | 6,000 | | | Total Diversified Financial Services | | | | | | | | | | | | 6,461,160 | |
| | | |
| | | | Diversified Telecommunication Services – 1.3% (0.8% of Total Investments) | | | | | | | |
| | | | | | | |
| | 3,000 | | | CenturyLink Inc, (5) | | | | | | | | | | | 6.450% | | | | 6/15/21 | | | | BB | | | | 3,146,400 | |
| | 8,000 | | | CenturyLink Inc, (5) | | | | | | | | | | | 5.800% | | | | 3/15/22 | | | | BB | | | | 8,320,000 | |
| | 2,000 | | | CommScope Inc, 144A, (5) | | | | | | | | | | | 5.000% | | | | 6/15/21 | | | | B1 | | | | 2,000,000 | |
| | 2,000 | | | Frontier Communications Corp, 144A | | | | | | | | | | | 8.000% | | | | 4/01/27 | | | | B2 | | | | 2,086,900 | |
| | 15,000 | | | Total Diversified Telecommunication Services | | | | | | | | | | | | 15,553,300 | |
82
| | | | | | | | | | | | | | | | | | | | | | | | | | | | |
Principal
Amount (000) | | | Description (1) | | | | | | | | Coupon | | | Maturity | | | Ratings (4) | | | Value | |
| | | | | |
| | | | Food Products – 1.2% (0.7% of Total Investments) | | | | | | | | | | | | | |
| | | | | | | |
| $ | 3,000 | | | B&G Foods Inc, (5) | | | | | | | | | | | 5.250% | | | | 4/01/25 | | | | BB– | | | $ | 2,985,000 | |
| | 5,320 | | | Chobani LLC, 144A | | | | | | | | | | | 7.500% | | | | 4/15/25 | | | | CCC+ | | | | 4,947,600 | |
| | 5,000 | | | JBS Investments GmbH, 144A | | | | | | | | | | | 6.250% | | | | 2/05/23 | | | | BB | | | | 5,087,550 | |
| | 1,000 | | | Pilgrim’s Pride Corp, 144A | | | | | | | | | | | 5.750% | | | | 3/15/25 | | | | BB | | | | 1,032,500 | |
| | 14,320 | | | Total Food Products | | | | | | | | | | | | | | | | | | | | | | | 14,052,650 | |
| | | |
| | | | Health Care Equipment & Supplies – 0.6% (0.4% of Total Investments) | | | | | | | |
| | | | | | | |
| | 7,069 | | | AMN Healthcare Inc, 144A, (5) | | | | | | | | | | | 5.125% | | | | 10/01/24 | | | | Ba2 | | | | 7,228,052 | |
| | | |
| | | | Health Care Providers & Services – 7.6% (4.6% of Total Investments) | | | | | | | |
| | | | | | | |
| | 9,000 | | | Centene Corp, | | | | | | | | | | | 4.750% | | | | 1/15/25 | | | | BB+ | | | | 9,180,180 | |
| | 4,000 | | | Centene Corp, 144A, (5) | | | | | | | | | | | 5.375% | | | | 6/01/26 | | | | BB+ | | | | 4,225,000 | |
| | 3,000 | | | Envision Healthcare Corp, 144A | | | | | | | | | | | 8.750% | | | | 10/15/26 | | | | B– | | | | 2,077,500 | |
| | 12,000 | | | Molina Healthcare Inc, (5) | | | | | | | | | | | 5.375% | | | | 11/15/22 | | | | BB– | | | | 12,555,000 | |
| | 5,000 | | | Molina Healthcare Inc, 144A, (5) | | | | | | | | | | | 4.875% | | | | 6/15/25 | | | | BB– | | | | 5,037,500 | |
| | 6,650 | | | Polaris Intermediate Corp, 144A, (cash 8.500%, PIK 8.500%) | | | | | | | | | | | 8.500% | | | | 12/01/22 | | | | B– | | | | 6,167,875 | |
| | 4,850 | | | RegionalCare Hospital Partners Holdings Inc / LifePoint Health Inc, 144A, (5) | | | | | | | | | | | 9.750% | | | | 12/01/26 | | | | CCC+ | | | | 5,147,063 | |
| | 1,200 | | | Select Medical Corp, (5) | | | | | | | | | | | 6.375% | | | | 6/01/21 | | | | B– | | | | 1,201,500 | |
| | 7,000 | | | Tenet Healthcare Corp, (DD1) | | | | | | | | | | | 8.125% | | | | 4/01/22 | | | | B– | | | | 7,472,500 | |
| | 10,500 | | | Tenet Healthcare Corp, (5) | | | | | | | | | | | 5.125% | | | | 5/01/25 | | | | Ba3 | | | | 10,462,830 | |
| | 6,805 | | | Vizient Inc, 144A, (5) | | | | | | | | | | | 6.250% | | | | 5/15/27 | | | | B | | | | 7,230,312 | |
| | 8,000 | | | WellCare Health Plans Inc, (5) | | | | | | | | | | | 5.250% | | | | 4/01/25 | | | | BB | | | | 8,301,680 | |
| | 8,500 | | | WellCare Health Plans Inc, 144A, (5) | | | | | | | | | | | 5.375% | | | | 8/15/26 | | | | BB | | | | 8,989,855 | |
| | 86,505 | | | Total Health Care Providers & Services | | | | | | | | | | | | 88,048,795 | |
| | | | | |
| | | | Health Care Technology – 1.5% (0.9% of Total Investments) | | | | | | | | | | | | | |
| | | | | | | |
| | 17,840 | | | Change Healthcare Holdings LLC, 144A, (5) | | | | | | | | | | | 5.750% | | | | 3/01/25 | | | | B– | | | | 17,879,248 | |
| | | | | |
| | | | Hotels, Restaurants & Leisure – 1.7% (1.0% of Total Investments) | | | | | | | | | | | | | |
| | | | | | | |
| | 6,500 | | | International Game Technology PLC, 144A, (5) | | | | | | | | | | | 6.250% | | | | 2/15/22 | | | | BB+ | | | | 6,841,250 | |
| | 8,000 | | | KFC Holding Co/Pizza Hut Holdings LLC/Taco Bell of America LLC, 144A, (5) | | | | | | | | | | | 4.750% | | | | 6/01/27 | | | | BB | | | | 8,190,000 | |
| | 3,250 | | | Scientific Games International Inc | | | | | | | | | | | 6.250% | | | | 9/01/20 | | | | CCC+ | | | | 3,254,062 | |
| | 1,680 | | | Scientific Games International Inc, (5) | | | | | | | | | | | 10.000% | | | | 12/01/22 | | | | B– | | | | 1,751,434 | |
| | 19,430 | | | Total Hotels, Restaurants & Leisure | | | | | | | | | | | | | | | | | | | | | | | 20,036,746 | |
| | | | | |
| | | | Internet & Direct Marketing Retail – 0.6% (0.4% of Total Investments) | | | | | | | | | | | | | |
| | | | | | | |
| | 7,000 | | | Netflix Inc, (5) | | | | | | | | | | | 4.875% | | | | 4/15/28 | | | | BB– | | | | 7,231,875 | |
| | | | | |
| | | | IT Services – 1.0% (0.5% of Total Investments) | | | | | | | | | | | | | | | | | |
| | | | | | | |
| | 4,000 | | | Go Daddy Operating Co LLC / GD Finance Co Inc, 144A, (5) | | | | | | | | | | | 5.250% | | | | 12/01/27 | | | | B+ | | | | 4,165,000 | |
| | 6,428 | | | WEX Inc, 144A, (5) | | | | | | | | | | | 4.750% | | | | 2/01/23 | | | | BB– | | | | 6,460,140 | |
| | 10,428 | | | Total IT Services | | | | | | | | | | | | | | | | | | | | | | | 10,625,140 | |
| | | | | |
| | | | Machinery – 0.5% (0.3% of Total Investments) | | | | | | | | | | | | | |
| | | | | | | |
| | 6,000 | | | Apex Tool Group LLC / BC Mountain Finance Inc, 144A | | | | | | | | | | | 9.000% | | | | 2/15/23 | | | | CCC+ | | | | 5,340,000 | |
| | | | | |
| | | | Media – 2.9% (1.8% of Total Investments) | | | | | | | | | | | | | |
| | | | | | | |
| | 3,000 | | | CCO Holdings LLC, (5) | | | | | | | | | | | 5.250% | | | | 9/30/22 | | | | BB+ | | | | 3,033,750 | |
| | 4,000 | | | CCO Holdings LLC, 144A, (5) | | | | | | | | | | | 5.125% | | | | 5/01/23 | | | | BB+ | | | | 4,095,600 | |
| | 2,000 | | | CCO Holdings LLC, 144A | | | | | | | | | | | 5.750% | | | | 2/15/26 | | | | BB+ | | | | 2,106,920 | |
| | 4,000 | | | Clear Channel Worldwide Holdings Inc, 144A | | | | | | | | | | | 9.250% | | | | 2/15/24 | | | | CCC+ | | | | 4,340,000 | |
| | 2,860 | | | CSC Holdings LLC, 144A, (5) | | | | | | | | | | | 5.375% | | | | 7/15/23 | | | | BB | | | | 2,933,216 | |
| | 3,000 | | | CSC Holdings LLC, 144A, (5) | | | | | | | | | | | 5.500% | | | | 4/15/27 | | | | BB | | | | 3,142,500 | |
| | 10,609 | | | iHeartCommunications Inc, (6), (7) | | | | | | | | | | | 9.000% | | | | 12/15/19 | | | | N/R | | | | — | |
| | 240 | | | iHeartCommunications Inc, (6), (7) | | | | | | | | | | | 9.000% | | | | 3/01/21 | | | | N/R | | | | — | |
| | 42,258 | | | iHeartCommunications Inc, (6), (7) | | | | | | | | | | | 12.000% | | | | 8/01/21 | | | | N/R | | | | — | |
| | 1,335 | | | iHeartCommunications Inc | | | | | | | | | | | 6.375% | | | | 5/01/26 | | | | BB– | | | | 1,417,826 | |
83
| | |
| |
| JQC | | Nuveen Credit Strategies Income Fund(continued) |
| | Portfolio of Investments July 31, 2019 |
| | | | | | | | | | | | | | | | | | | | | | | | | | | | |
Principal
Amount (000) | | | Description (1) | | | | | | | | Coupon | | | Maturity | | | Ratings (4) | | | Value | |
| | | | | |
| | | | Media(continued) | | | | | | | | | | | | | |
| | | | | | | |
| $ | 2,452 | | | iHeartCommunications Inc | | | | | | | | | | | 8.375% | | | | 5/01/27 | | | | B– | | | $ | 2,580,279 | |
| | 2,000 | | | Nielsen Co Luxembourg SARL, 144A, (5) | | | | | | | | | | | 5.500% | | | | 10/01/21 | | | | BB | | | | 2,005,000 | |
| | 8,000 | | | Univision Communications Inc, 144A | | | | | | | | | | | 5.125% | | | | 5/15/23 | | | | B | | | | 7,942,400 | |
| | 85,754 | | | Total Media | | | | | | | | | | | | | | | | | | | | | | | 33,597,491 | |
| | | | | |
| | | | Personal Products – 0.9% (0.5% of Total Investments) | | | | | | | | | | | | | |
| | | | | | | |
| | 11,000 | | | Revlon Consumer Products Corp, (5) | | | | | | | | | | | 5.750% | | | | 2/15/21 | | | | CCC | | | | 10,230,000 | |
| | | |
| | | | Real Estate Management & Development – 0.8% (0.5% of Total Investments) | | | | | | | |
| | | | | | | |
| | 10,000 | | | Realogy Group LLC / RealogyCo-Issuer Corp, 144A, (5) | | | | | | | | | | | 5.250% | | | | 12/01/21 | | | | B | | | | 9,625,000 | |
| | | | | |
| | | | Software – 1.5% (0.9% of Total Investments) | | | | | | | | | | | | | |
| | | | | | | |
| | 5,500 | | | Blackboard Inc, 144A | | | | | | | | | | | 9.750% | | | | 10/15/21 | | | | CCC– | | | | 5,355,625 | |
| | 5,000 | | | IQVIA Inc, 144A, (5) | | | | | | | | | | | 5.000% | | | | 5/15/27 | | | | BB | | | | 5,211,900 | |
| | 1,500 | | | SS&C Technologies Inc, 144A | | | | | | | | | | | 5.500% | | | | 9/30/27 | | | | B+ | | | | 1,560,000 | |
| | 4,000 | | | Symantec Corp, 144A, (5) | | | | | | | | | | | 5.000% | | | | 4/15/25 | | | | Baa3 | | | | 4,081,354 | |
| | 16,000 | | | Total Software | | | | | | | | | | | | | | | | | | | | | | | 16,208,879 | |
| | | |
| | | | Technology Hardware, Storage & Peripherals – 1.3% (0.8% of Total Investments) | | | | | | | |
| | | | | | | |
| | 9,000 | | | Dell International LLC / EMC Corp, 144A, (5) | | | | | | | | | | | 5.875% | | | | 6/15/21 | | | | BB+ | | | | 9,155,583 | |
| | 5,000 | | | Dell International LLC / EMC Corp, 144A, (5) | | | | | | | | | | | 7.125% | | | | 6/15/24 | | | | BB+ | | | | 5,287,541 | |
| | 14,000 | | | Total Technology Hardware, Storage��& Peripherals | | | | | | | | | | | | 14,443,124 | |
| | | | | |
| | | | Wireless Telecommunication Services – 3.4% (2.1% of Total Investments) | | | | | | | | | | | | | |
| | | | | | | |
| | 6,000 | | | Hughes Satellite Systems Corp, (5) | | | | | | | | | | | 5.250% | | | | 8/01/26 | | | | BBB– | | | | 6,357,000 | |
| | 16,100 | | | Intelsat Connect Finance SA, 144A | | | | | | | | | | | 9.500% | | | | 2/15/23 | | | | CCC– | | | | 14,444,920 | |
| | 6,000 | | | Intelsat Jackson Holdings SA, 144A, (5) | | | | | | | | | | | 8.500% | | | | 10/15/24 | | | | CCC+ | | | | 5,985,600 | |
| | 12,000 | | | T-Mobile USA Inc, (5) | | | | | | | | | | | 6.375% | | | | 3/01/25 | | | | BB+ | | | | 12,435,000 | |
| | 12,000 | | | T-Mobile USA Inc, (7) | | | | | | | | | | | 6.375% | | | | 3/01/25 | | | | N/R | | | | — | |
| | 52,100 | | | Total Wireless Telecommunication Services | | | | | | | | | | | | 39,222,520 | |
| $ | 455,825 | | | Total Corporate Bonds (cost $359,288,865) | | | | | | | | | | | | 366,341,393 | |
| | | | | | | |
Principal
Amount (000) | | | Description (1) | | | | | | | | Coupon | | | Maturity | | | Ratings (4) | | | Value | |
| | | | | |
| | | | CONVERTIBLE BONDS – 2.1% (1.3% of Total Investments) | | | | | | | | | | | | | | | | | |
| | | | | |
| | | | Biotechnology – 1.8% (1.1% of Total Investments) | | | | | | | | | | | | | |
| | | | | | | |
| $ | 7,000 | | | Acorda Therapeutics Inc | | | | | | | | | | | 1.750% | | | | 6/15/21 | | | | N/R | | | $ | 5,816,433 | |
| | 10,000 | | | BioMarin Pharmaceutical Inc | | | | | | | | | | | 0.599% | | | | 8/01/24 | | | | N/R | | | | 10,166,330 | |
| | 6,000 | | | Clovis Oncology Inc | | | | | | | | | | | 2.500% | | | | 9/15/21 | | | | N/R | | | | 5,145,446 | |
| | 23,000 | | | Total Biotechnology | | | | | | | | | | | | | | | | | | | | | | | 21,128,209 | |
| | | | | |
| | | | Pharmaceuticals – 0.3% (0.2% of Total Investments) | | | | | | | | | | | | | |
| | | | | | | |
| | 3,000 | | | Horizon Pharma Investment Ltd, (DD1) | | | | | | | | | | | 2.500% | | | | 3/15/22 | | | | B | | | | 3,367,607 | |
| $ | 26,000 | | | Total Convertible Bonds (cost $25,465,630) | | | | | | | | | | | | 24,495,816 | |
| | | | | | | |
| Shares | | | Description (1) | | | | | | | | | | | | | | | | | Value | |
| | | | | |
| | | | COMMON STOCKS – 1.1% (0.7% of Total Investments) | | | | | | | | | | | | | | | | | |
| | | |
| | | | Diversified Consumer Services – 0.1% (0.0% of Total Investments) | | | | | | | |
| | | | | | | |
| | 41,905 | | | Cengage Learning Holdings II Inc, (8), (9) | | | | | | | | | | | | | | | | | | | | | | $ | 522,555 | |
| | | | | |
| | | | Energy Equipment & Services – 0.2% (0.2% of Total Investments) | | | | | | | | | | | | | |
| | | | | | | |
| | 10,935 | | | Vantage Drilling International, (8), (9) | | | | | | | | | | | | | | | | | | | | | | | 2,580,660 | |
84
| | | | | | | | | | | | | | | | | | | | | | | | | | | | |
| | | | | | | |
| Shares | | | Description (1) | | | | | | | | | | | | | | | | | Value | |
| | | | | |
| | | | Health Care Providers & Services – 0.0% (0.0% of Total Investments) | | | | | | | | | | | | | |
| | | | | | | |
| | 227,437 | | | Millennium Health LLC, (8), (9) | | | | | | | | | | | | | | | | | | | | | | $ | 2,274 | |
| | 211,860 | | | Millennium Health LLC, (7), (9) | | | | | | | | | | | | | | | | | | | | | | | 232,971 | |
| | 198,883 | | | Millennium Health LLC, (7), (9) | | | | | | | | | | | | | | | | | | | | | | | 198,799 | |
| | | | Total Health Care Providers & Services | | | | | | | | | | | | 434,044 | |
| | | | | |
| | | | Internet & Direct Marketing Retail – 0.0% (0.0% of Total Investments) | | | | | | | | | | | | | |
| | | | | | | |
| | 9,796 | | | Catalina Marketing Corp, (8), (9) | | | | | | | | | | | | | | | | | | | | | | | 48,980 | |
| | | | | |
| | | | Marine – 0.0% (0.0% of Total Investments) | | | | | | | | | | | | | |
| | | | | | | |
| | 6,278 | | | HGIM Corp, (8), (9) | | | | | | | | | | | | | | | | | | | | | | | 87,892 | |
| | | | | |
| | | | Media – 0.6% (0.4% of Total Investments) | | | | | | | | | | | | | |
| | | | | | | |
| | 51,719 | | | Affinion Group Holdings Inc, (8) | | | | | | | | | | | | | | | | | | | | | | | 12,930 | |
| | 338,831 | | | Clear Channel Outdoor Holdings Inc, (9) | | | | | | | | | | | | | | | | | | | | | | | 1,026,658 | |
| | 84,265 | | | Cumulus Media Inc | | | | | | | | | | | | | | | | | | | | | | | 1,273,244 | |
| | 281,046 | | | iHeartMedia Inc, (9) | | | | | | | | | | | | | | | | | | | | | | | 4,204,448 | |
| | 17,987 | | | Tribune Co, (7) | | | | | | | | | | | | | | | | | | | | | | | 9,893 | |
| | | | Total Media | | | | | | | | | | | | | | | | | | | | | | | 6,527,173 | |
| | | | | |
| | | | Pharmaceuticals – 0.1% (0.1% of Total Investments) | | | | | | | | | | | | | |
| | | | | | | |
| | 110,097 | | | Advanz Pharma Corp, (9) | | | | | | | | | | | | | | | | | | | | | | | 1,466,492 | |
| | | | | |
| | | | Software – 0.1% (0.0% of Total Investments) | | | | | | | | | | | | | |
| | | | | | | |
| | 40,260 | | | Avaya Holdings Corp, (9) | | | | | | | | | | | | | | | | | | | | | | | 484,731 | |
| | | | Total Common Stocks (cost $28,748,443) | | | | | | | | | | | | | | | | 12,152,527 | |
| | | | | | | |
| Shares | | | Description (1) | | | | | | | | | | | | | | | | | Value | |
| | | | | |
| | | | COMMON STOCK RIGHTS – 0.2% (0.1% of Total Investments) | | | | | | | | | | | | | | | | | |
| | | | | |
| | | | Oil, Gas & Consumable Fuels – 0.2% (0.1% of Total Investments) | | | | | | | | | | | | | |
| | | | | | | |
| | 9,278 | | | Fieldwood Energy LLC, (8), (9) | | | | | | | | | | | | | | | | | | | | | | $ | 276,020 | |
| | 45,924 | | | Fieldwood Energy LLC, (8), (9) | | | | | | | | | | | | | | | | | | | | | | | 1,366,239 | |
| | | | Total Common Stock Rights (cost $1,310,866) | | | | | | | | | | | | 1,642,259 | |
| | | | | | | |
| Shares | | | Description (1) | | | | | | | | | | | | | | | | | Value | |
| | | | | |
| | | | WARRANTS – 0.0% (0.0% of Total Investments) | | | | | | | | | | | | | | | | | |
| | | | |
| | | | Marine – 0.0% (0.0% of Total Investments) | | | | | | | | | | |
| | | | | | | |
| | 28,051 | | | HGIM Corp, (8) | | | | | | | | | | | | | | | | | | | | | | $ | 392,714 | |
| | | | |
| | | | Software – 0.0% (0.0% of Total Investments) | | | | | | | | | | |
| | | | | | | |
| | 37,723 | | | Avaya Holdings Corp, (8) | | | | | | | | | | | | | | | | | | | | | | | 28,292 | |
| | | | Total Warrants (cost $6,043,241) | | | | | | | | | | | | | | | | 421,006 | |
| | | | Total Long-Term Investments (cost $1,835,896,747) | | | | | | | | | | | | 1,799,167,034 | |
| | | | | | | |
| Shares | | | Description | | | | | | | | Coupon | | | | | | | | | Value | |
| | | | | |
| | | | SHORT-TERM INVESTMENTS – 9.1% (5.5% of Total Investments) | | | | | | | | | | | | | | | | | |
| | | | | |
| | | | INVESTMENT COMPANIES – 9.1% (5.5% of Total Investments) | | | | | | | | | | | | | | | | | |
| | | | | | | |
| | 104,681,406 | | | BlackRock Liquidity FundsT-Fund Portfolio, (10) | | | | | | | | | | | 2.254% (11) | | | | | | | | | | | $ | 104,681,406 | |
| | | | Total Short-Term Investments (cost $104,681,406) | | | | | | | | | | | | 104,681,406 | |
| | | | Total Investments (cost $1,940,578,153) – 165.3% | | | | | | | | | | | | 1,903,848,440 | |
| | | | Borrowings – (41.7)% (12), (13) | | | | | | | | | | | | (480,000,000 | ) |
| | | | Reverse Repurchase Agreements – (18.5)% (14) | | | | | | | | | | | | (213,000,000 | ) |
| | | | Other Assets Less Liabilities – (5.1)% | | | | | | | | | | | | (59,071,034 | ) |
| | | | Net Assets Applicable to Common Shares – 100% | | | | | | | | | | | $ | 1,151,777,406 | |
85
| | |
| |
| JQC | | Nuveen Credit Strategies Income Fund(continued) |
| | Portfolio of Investments July 31, 2019 |
For Fund portfolio compliance purposes, the Fund’s industry classifications refer to any one or more of the industrysub-classifications used by one or more widely recognized market indexes or ratings group indexes, and/or as defined by Fund management. This definition may not apply for purposes of this report, which may combine industrysub-classifications into sectors for reporting ease.
| (1) | All percentages shown in the Portfolio of Investments are based on net assets applicable to common shares unless otherwise noted. |
| (2) | Senior loans generally pay interest at rates which are periodically adjusted by reference to a base short-term, floating lending rate (Reference Rate) plus an assigned fixed rate (Spread). These floating lending rates are generally (i) the lending rate referenced by the London Inter-Bank Offered Rate (“LIBOR”), or (ii) the prime rate offered by one or more major United States banks. Senior loans may be considered restricted in that the Fund ordinarily is contractually obligated to receive approval from the agent bank and/or borrower prior to the disposition of a senior loan. The rate shown is the coupon as of the end of the reporting period. |
| (3) | Senior loans generally are subject to mandatory and/or optional prepayment. Because of these mandatory prepayment conditions and because there may be significant economic incentives for a borrower to prepay, prepayments of senior loans may occur. As a result, the actual remaining maturity of senior loans held may be substantially less than the stated maturities shown. |
| (4) | For financial reporting purposes, the ratings disclosed are the highest of Standard & Poor’s Group (“Standard & Poor’s”), Moody’s Investors Service, Inc. (“Moody’s”) or Fitch, Inc. (“Fitch”) rating. This treatment of split-rated securities may differ from that used for other purposes, such as for Fund investment policies. Ratings below BBB by Standard & Poor’s, Baa by Moody’s or BBB by Fitch are considered to be below investment grade. Holdings designated N/R are not rated by any of these national rating agencies. Ratings are not covered by the report of independent registered public accounting firm. |
| (5) | Investment, or portion of investment, has been pledged to collateralize the net payment obligations for investments in reverse repurchase agreements. As of the end of the reporting period, investments with a value of $341,322,406 have been pledged as collateral for reverse repurchase agreements. |
| (6) | Defaulted security. A security whose issuer has failed to fully pay principal and/or interest when due, or is under the protection of bankruptcy. |
| (7) | Investment valued at fair value using methods determined in good faith by, or at the discretion of, the Board. For fair value measurement disclosure purposes, investment classified as Level 3. See Notes to Financial Statements, Note 2 – Investment Valuation and Fair Value Measurements for more information. |
| (8) | For fair value measurement disclosure purposes, investment classified as Level 2. See Notes to Financial Statements, Note 2 – Investment Valuation and Fair Value Measurements for more information. |
| (9) | Non-income producing; issuer has not declared a dividend within the past twelve months. |
| (10) | A copy of the most recent financial statements for these investment companies can be obtained directly from the Securities and Exchange Commission on its website at http://www.sec.gov. |
| (11) | The rate shown is the annualizedseven-day subsidized yield as of the end of the reporting period. |
| (12) | Borrowings as a percentage of Total Investments is 25.2%. |
| (13) | The Fund segregates 100% of its eligible investments (excluding any investments separately pledged as collateral for specific investments in derivatives, when applicable) in the Portfolio of Investments as collateral for borrowings. |
| (14) | Reverse Repurchase Agreements as a percentage of Total Investments is 11.2%. |
| 144A | Investment is exempt from registration under Rule 144A of the Securities Act of 1933, as amended. These investments may only be resold in transactions exempt from registration, which are normally those transactions with qualified institutional buyers. |
| DD1 | Portion of investment purchased on a delayed delivery basis. |
| LIBOR | London Inter-Bank Offered Rate |
| PIK | Payment-in-kind (“PIK”) security. Depending on the terms of the security, income may be received in the form of cash, securities, or a combination of both. The PIK rate shown, where applicable, represents the annualized rate of the last PIK payment made by the issuer as of the end of the reporting period. |
| TBD | Senior loan purchased on a when-issued or delayed-delivery basis. Certain details associated with this purchase are not known prior to the settlement date of the transaction. In addition, senior loans typically trade without accrued interest and therefore a coupon rate is not available prior to settlement. At settlement, if still unknown, the borrower or counterparty will provide the Fund with the final coupon rate and maturity date. |
| WI/DD | Purchased on a when-issued or delayed delivery basis. |
See accompanying notes to financial statements.
86
Statement of Assets and Liabilities
July 31, 2019
| | | | | | | | | | | | | | | | | | | | |
| | | NSL | | | JFR | | | JRO | | | JSD | | | JQC | |
Assets | | | | | | | | | | | | | | | | | | | | |
Long-term investments, at value (cost $420,449,578, $1,018,880,422, $712,293,425, $279,855,274 and $1,835,896,747, respectively) | | $ | 405,270,612 | | | $ | 984,729,223 | | | $ | 688,789,942 | | | $ | 271,555,069 | | | $ | 1,799,167,034 | |
Short-term investments, at value (cost approximates value) | | | 13,492,573 | | | | 43,812,049 | | | | 36,427,860 | | | | 15,566,819 | | | | 104,681,406 | |
Cash collateral at brokers for investments in swaps(1) | | | 387,000 | | | | — | | | | — | | | | 345,922 | | | | — | |
Unrealized appreciation on interest rate swaps | | | — | | | | 510,157 | | | | 384,635 | | | | — | | | | — | |
Receivable for: | | | | | | | | | | | | | | | | | | | | |
Interest | | | 1,806,464 | | | | 4,084,161 | | | | 2,528,967 | | | | 1,069,710 | | | | 10,357,618 | |
Investments sold | | | 5,631,655 | | | | 12,768,796 | | | | 7,380,673 | | | | 2,503,424 | | | | 8,925,980 | |
Reclaims | | | — | | | | — | | | | — | | | | — | | | | 17,480 | |
Other assets | | | 108,700 | | | | 154,018 | | | | 98,079 | | | | 26,833 | | | | 398,714 | |
Total assets | | | 426,697,004 | | | | 1,046,058,404 | | | | 735,610,156 | | | | 291,067,777 | | | | 1,923,548,232 | |
Liabilities | | | | | | | | | | | | | | | | | | | | |
Borrowings | | | 114,000,000 | | | | 264,500,000 | | | | 178,800,000 | | | | 72,000,000 | | | | 480,000,000 | |
Reverse repurchase agreements | | | — | | | | — | | | | — | | | | — | | | | 213,000,000 | |
Cash overdraft | | | — | | | | — | | | | — | | | | 718,318 | | | | — | |
Cash overdraft denominated in foreign currencies (cost $—, $—, $—, $55 and $174, respectively) | | | — | | | | — | | | | — | | | | 50 | | | | 175 | |
Credit default swaps premiums received | | | — | | | | — | | | | — | | | | 205,391 | | | | — | |
Unrealized depreciation on interest rate swaps | | | 167,345 | | | | 1,936 | | | | 65,671 | | | | — | | | | — | |
Payable for: | | | | | | | | | | | | | | | | | | | | |
Dividends | | | 1,419,463 | | | | 3,475,209 | | | | 2,520,080 | | | | 1,017,110 | | | | 13,908,830 | |
Investments purchased | | | 13,520,255 | | | | 34,682,815 | | | | 26,196,965 | | | | 11,541,145 | | | | 60,813,150 | |
Unfunded senior loans | | | 10,302 | | | | 21,975 | | | | 13,220 | | | | 10,302 | | | | — | |
Variation margin on swap contracts | | | — | | | | — | | | | — | | | | 7,060 | | | | — | |
Term Preferred Shares (“Term Preferred”), net of deferred offering costs (liquidation preference $43,000,000, $115,000,000, $84,000,000, $35,000,000 and $—, respectively) | | | 42,585,413 | | | | 114,075,264 | | | | 83,075,728 | | | | 34,757,373 | | | | — | |
Accrued expenses: | | | | | | | | | | | | | | | | | | | | |
Interest | | | 142 | | | | — | | | | 458,792 | | | | 1,663 | | | | 2,123,400 | |
Management fees | | | 281,836 | | | | 679,235 | | | | 479,615 | | | | 190,172 | | | | 1,258,417 | |
Trustees fees | | | 81,613 | | | | 152,742 | | | | 96,788 | | | | 18,393 | | | | 393,214 | |
Other | | | 143,171 | | | | 250,782 | | | | 203,114 | | | | 113,302 | | | | 273,640 | |
Total liabilities | | | 172,209,540 | | | | 417,839,958 | | | | 291,909,973 | | | | 120,580,279 | | | | 771,770,826 | |
Net assets applicable to common shares | | $ | 254,487,464 | | | $ | 628,218,446 | | | $ | 443,700,183 | | | $ | 170,487,498 | | | $ | 1,151,777,406 | |
Common shares outstanding | | | 38,611,472 | | | | 56,918,468 | | | | 40,541,218 | | | | 10,095,648 | | | | 135,609,290 | |
Net asset value (“NAV”) per common share outstanding | | $ | 6.59 | | | $ | 11.04 | | | $ | 10.94 | | | $ | 16.89 | | | $ | 8.49 | |
Net assets applicable to common shares consist of: | | | | | | | | | | | | | | | | | | | | |
Common shares, $0.01 par value per share | | $ | 386,115 | | | $ | 569,185 | | | $ | 405,412 | | | $ | 100,956 | | | $ | 1,356,093 | |
Paid-in-surplus | | | 287,463,422 | | | | 708,549,267 | | | | 503,132,637 | | | | 191,652,558 | | | | 1,344,053,329 | |
Total distributable earnings | | | (33,362,073 | ) | | | (80,900,006 | ) | | | (59,837,866 | ) | | | (21,266,016 | ) | | | (193,632,016 | ) |
Net assets applicable to common shares | | $ | 254,487,464 | | | $ | 628,218,446 | | | $ | 443,700,183 | | | $ | 170,487,498 | | | $ | 1,151,777,406 | |
Authorized shares: | | | | | | | | | | | | | | | | | | | | |
Common | | | Unlimited | | | | Unlimited | | | | Unlimited | | | | Unlimited | | | | Unlimited | |
Preferred | | | Unlimited | | | | Unlimited | | | | Unlimited | | | | Unlimited | | | | Unlimited | |
| (1) | Cash pledged to collateralize the net payment obligations for investments in derivatives. |
See accompanying notes to financial statements.
87
Statement of Operations
Year Ended July 31, 2019
| | | | | | | | | | | | | | | | | | | | |
| | | NSL | | | JFR | | | JRO | | | JSD | | | JQC | |
Investment Income | | | | | | | | | | | | | | | | | | | | |
Interest and dividends | | $ | 25,238,434 | | | $ | 60,022,817 | | | $ | 42,527,422 | | | $ | 17,561,942 | | | $ | 101,945,401 | |
Fees | | | 557,533 | | | | 1,326,345 | | | | 916,304 | | | | 392,161 | | | | 1,444,557 | |
Total investment income | | | 25,795,967 | | | | 61,349,162 | | | | 43,443,726 | | | | 17,954,103 | | | | 103,389,958 | |
Expenses | | | | | | | | | | | | | | | | | | | | |
Management fees | | | 3,351,458 | | | | 8,066,542 | | | | 5,701,582 | | | | 2,270,143 | | | | 15,134,810 | |
Interest expense and amortization of offering costs | | | 4,731,056 | | | | 13,138,046 | | | | 8,725,210 | | | | 3,468,320 | | | | 24,798,526 | |
Custodian fees | | | 128,369 | | | | 233,350 | | | | 197,098 | | | | 100,248 | | | | 371,034 | |
Trustees fees | | | 11,697 | | | | 28,614 | | | | 20,084 | | | | 7,905 | | | | 53,021 | |
Professional fees | | | 52,950 | | | | 94,503 | | | | 80,936 | | | | 49,375 | | | | 106,946 | |
Shareholder reporting expenses | | | 43,291 | | | | 91,174 | | | | 69,155 | | | | 26,134 | | | | 149,818 | |
Shareholder servicing agent fees | | | 14,857 | | | | 18,771 | | | | 26,499 | | | | 13,740 | | | | 6,577 | |
Stock exchange listing fees | | | 10,804 | | | | 6,416 | | | | 11,344 | | | | 6,824 | | | | 37,959 | |
Investor relations expenses | | | 2,478 | | | | 7,268 | | | | 4,849 | | | | 2,893 | | | | 72,703 | |
Other | | | 30,914 | | | | 57,530 | | | | 23,516 | | | | 43,074 | | | | 34,075 | |
Total expenses | | | 8,377,874 | | | | 21,742,214 | | | | 14,860,273 | | | | 5,988,656 | | | | 40,765,469 | |
Net investment income (loss) | | | 17,418,093 | | | | 39,606,948 | | | | 28,583,453 | | | | 11,965,447 | | | | 62,624,489 | |
Realized and Unrealized Gain (Loss) | | | | | | | | | | | | | | | | | | | | |
Net realized gain (loss) from: | | | | | | | | | | | | | | | | | | | | |
Investments and foreign currency | | | (12,961,836 | ) | | | (22,162,068 | ) | | | (19,639,235 | ) | | | (6,255,418 | ) | | | (68,293,099 | ) |
Swaps | | | (534,288 | ) | | | 165,763 | | | | (101,789 | ) | | | (396,791 | ) | | | — | |
Change in net unrealized appreciation (depreciation) of: | | | | | | | | | | | | | | | | | | | | |
Investments and foreign currency | | | (364,248 | ) | | | (8,136,582 | ) | | | (3,169,787 | ) | | | (3,347,408 | ) | | | 44,989,600 | |
Swaps | | | 1,031,635 | | | | 2,938,806 | | | | 2,650,051 | | | | 146,150 | | | | — | |
Net realized and unrealized gain (loss) | | | (12,828,737 | ) | | | (27,194,081 | ) | | | (20,260,760 | ) | | | (9,853,467 | ) | | | (23,303,499 | ) |
Net increase (decrease) in net assets applicable to common shares from operations | | $ | 4,589,356 | | | $ | 12,412,867 | | | $ | 8,322,693 | | | $ | 2,111,980 | | | $ | 39,320,990 | |
See accompanying notes to financial statements.
88
Statement of Changes in Net Assets
| | | | | | | | | | | | | | | | |
| | | NSL | | | JFR | |
| | | Year
Ended 7/31/19 | | | Year(1)
Ended 7/31/18 | | | Year
Ended 7/31/19 | | | Year(1) Ended 7/31/18 | |
Operations | | | | | | | | | | | | | | | | |
Net investment income (loss) | | $ | 17,418,093 | | | $ | 16,516,893 | | | $ | 39,606,948 | | | $ | 37,297,459 | |
Net realized gain (loss) from: | | | | | | | | | | | | | | | | |
Investments and foreign currency | | | (12,961,836 | ) | | | 988,609 | | | | (22,162,068 | ) | | | (3,918,156 | ) |
Swaps | | | (534,288 | ) | | | (170,366 | ) | | | 165,763 | | | | 710,097 | |
Change in net unrealized appreciation (depreciation) of: | | | | | | | | | | | | | | | | |
Investments and foreign currency | | | (364,248 | ) | | | (1,461,678 | ) | | | (8,136,582 | ) | | | 795,592 | |
Swaps | | | 1,031,635 | | | | (650,645 | ) | | | 2,938,806 | | | | (3,024,738 | ) |
Net increase (decrease) in net assets applicable to common shares from
operations | | | 4,589,356 | | | | 15,222,813 | | | | 12,412,867 | | | | 31,860,254 | |
Distributions to Common Shareholders(2) | | | | | | | | | | | | | | | | |
Dividends(3) | | | (16,797,816 | ) | | | (17,553,641 | ) | | | (41,351,267 | ) | | | (44,003,590 | ) |
Return of capital | | | — | | | | — | | | | — | | | | — | |
Decrease in net assets applicable to common shares from distributions to
common shareholders | | | (16,797,816 | ) | | | (17,553,641 | ) | | | (41,351,267 | ) | | | (44,003,590 | ) |
Capital Share Transactions | | | | | | | | | | | | | | | | |
Common shares: | | | | | | | | | | | | | | | | |
Proceeds from shelf offering, net of offering costs | | | — | | | | — | | | | — | | | | 5,297,434 | |
Net proceeds from shares issued to shareholders due to reinvestment of
distributions | | | — | | | | — | | | | — | | | | 139,663 | |
Cost of shares repurchased and retired | | | (56,494 | ) | | | — | | | | — | | | | — | |
Net increase (decrease) in net assets applicable to common shares from
capital share transactions | | | (56,494 | ) | | | — | | | | — | | | | 5,437,097 | |
Net increase (decrease) in net assets applicable to common shares | | | (12,264,954 | ) | | | (2,330,828 | ) | | | (28,938,400 | ) | | | (6,706,239 | ) |
Net assets applicable to common shares at the beginning of period | | | 266,752,418 | | | | 269,083,246 | | | | 657,156,846 | | | | 663,863,085 | |
Net assets applicable to common shares at the end of period | | $ | 254,487,464 | | | $ | 266,752,418 | | | $ | 628,218,446 | | | $ | 657,156,846 | |
| (1) | Prior period amounts have been conformed to current year presentation. See Notes to Financial Statements, Note 11 – New Accounting Pronouncements for further details. |
| (2) | The composition and per share amounts of the Funds’ distributions are presented in the Financial Highlights. The distribution information for the Funds as of their most recent tax year end is presented within the Notes to Financial Statements, Note 6 – Income Tax Information. |
| (3) | For the fiscal year ended July 31, 2018, the Funds’ distributions to shareholders were paid from net investment income. |
See accompanying notes to financial statements.
89
Statement of Changes in Net Assets(continued)
| | | | | | | | | | | | | | | | |
| | | JRO | | | JSD | |
| | | Year Ended 7/31/19 | | | Year(1)
Ended 7/31/18 | | | Year Ended 7/31/19 | | | Year(1)
Ended 7/31/18 | |
Operations | | | | | | | | | | | | | | | | |
Net investment income (loss) | | $ | 28,583,453 | | | $ | 26,747,901 | | | $ | 11,965,447 | | | $ | 12,002,204 | |
Net realized gain (loss) from: | | | | | | | | | | | | | | | | |
Investments and foreign currency | | | (19,639,235 | ) | | | (2,177,791 | ) | | | (6,255,418 | ) | | | (1,771,955 | ) |
Swaps | | | (101,789 | ) | | | 661,463 | | | | (396,791 | ) | | | (201,725 | ) |
Change in net unrealized appreciation (depreciation) of: | | | | | | | | | | | | | | | | |
Investments and foreign currency | | | (3,169,787 | ) | | | 828,220 | | | | (3,347,408 | ) | | | 1,590,671 | |
Swaps | | | 2,650,051 | | | | (2,851,257 | ) | | | 146,150 | | | | (104,691 | ) |
Net increase (decrease) in net assets applicable to common shares from
operations | | | 8,322,693 | | | | 23,208,536 | | | | 2,111,980 | | | | 11,514,504 | |
Distributions to Common Shareholders(2) | | | | | �� | | | | | | | | | | | |
Dividends(3) | | | (29,824,066 | ) | | | (32,185,250 | ) | | | (12,508,508 | ) | | | (13,098,094 | ) |
Return of capital | | | — | | | | — | | | | — | | | | — | |
Decrease in net assets applicable to common shares from distributions to
common shareholders | | | (29,824,066 | ) | | | (32,185,250 | ) | | | (12,508,508 | ) | | | (13,098,094 | ) |
Capital Share Transactions | | | | | | | | | | | | | | | | |
Common shares: | | | | | | | | | | | | | | | | |
Proceeds from shelf offering, net of offering costs | | | — | | | | 9,134,335 | | | | — | | | | — | |
Net proceeds from shares issued to shareholders due to reinvestment of
distributions | | | — | | | | 59,873 | | | | — | | | | — | |
Cost of shares repurchased and retired | | | (176,868 | ) | | | — | | | | — | | | | — | |
Net increase (decrease) in net assets applicable to common shares from capital share transactions | | | (176,868 | ) | | | 9,194,208 | | | | — | | | | — | |
Net increase (decrease) in net assets applicable to common shares | | | (21,678,241 | ) | | | 217,494 | | | | (10,396,528 | ) | | | (1,583,590 | ) |
Net assets applicable to common shares at the beginning of period | | | 465,378,424 | | | | 465,160,930 | | | | 180,884,026 | | | | 182,467,616 | |
Net assets applicable to common shares at the end of period | | $ | 443,700,183 | | | $ | 465,378,424 | | | $ | 170,487,498 | | | $ | 180,884,026 | |
| (1) | Prior period amounts have been conformed to current year presentation. See Notes to Financial Statements, Note 11 – New Accounting Pronouncements for further details. |
| (2) | The composition and per share amounts of the Funds’ distributions are presented in the Financial Highlights. The distribution information for the Funds as of their most recent tax year end is presented within the Notes to Financial Statements, Note 6 – Income Tax Information. |
| (3) | For the fiscal year ended July 31, 2018, the Funds’ distributions to shareholders were paid from net investment income. |
See accompanying notes to financial statements.
90
| | | | | | | | |
| | | JQC | |
| | | Year
Ended 7/31/19 | | | Year(1)
Ended 7/31/18 | |
Operations | | | | | | | | |
Net investment income (loss) | | $ | 62,624,489 | | | $ | 59,827,455 | |
Net realized gain (loss) from: | | | | | | | | |
Investments and foreign currency | | | (68,293,099 | ) | | | (9,945,000 | ) |
Swaps | | | — | | | | 1,412,527 | |
Change in net unrealized appreciation (depreciation) of: | | | | | | | | |
Investments and foreign currency | | | 44,989,600 | | | | (5,536,690 | ) |
Swaps | | | — | | | | (1,375,436 | ) |
Net increase (decrease) in net assets applicable to common shares from operations | | | 39,320,990 | | | | 44,382,856 | |
Distributions to Common Shareholders(2) | | | | | | | | |
Dividends(3) | | | (80,837,610 | ) | | | (72,567,457 | ) |
Return of capital | | | (42,792,971 | ) | | | — | |
Decrease in net assets applicable to common shares from distributions to common shareholders | | | (123,630,581 | ) | | | (72,567,457 | ) |
Capital Share Transactions | | | | | | | | |
Common shares: | | | | | | | | |
Proceeds from shelf offering, net of offering costs | | | — | | | | — | |
Net proceeds from shares issued to shareholders due to reinvestment of distributions | | | — | | | | — | |
Cost of shares repurchase and retired | | | (1,175,108 | ) | | | — | |
Net increase (decrease) in net assets applicable to common shares from capital share transactions | | | (1,175,108 | ) | | | — | |
Net increase (decrease) in net assets applicable to common shares | | | (85,484,699 | ) | | | (28,184,601 | ) |
Net assets applicable to common shares at the beginning of period | | | 1,237,262,105 | | | | 1,265,446,706 | |
Net assets applicable to common shares at the end of period | | $ | 1,151,777,406 | | | $ | 1,237,262,105 | |
| (1) | Prior period amounts have been conformed to current year presentation. See Notes to Financial Statements, Note 11 – New Accounting Pronouncements for further details. |
| (2) | The composition and per share amounts of the Funds’ distributions are presented in the Financial Highlights. The distribution information for the Funds as of their most recent tax year end is presented within the Notes to Financial Statements, Note 6 – Income Tax Information. |
| (3) | For the fiscal year ended July 31, 2018, the Funds’ distributions to shareholders were paid from net investment income. |
See accompanying notes to financial statements.
91
Statement of Cash Flows
Year Ended July 31, 2019
| | | | | | | | | | | | | | | | | | | | |
| | | NSL | | | JFR | | | JRO | | | JSD | | | JQC | |
Cash Flows from Operating Activities: | | | | | | | | | | | | | | | | | | | | |
Net Increase (Decrease) in Net Assets Applicable to Common Shares from Operations | | $ | 4,589,356 | | | $ | 12,412,867 | | | $ | 8,322,693 | | | $ | 2,111,980 | | | $ | 39,320,990 | |
Adjustments to reconcile the net increase (decrease) in net assets applicable to common shares from operations to net cash provided by (used in) operating activities: | | | | | | | | | | | | | | | | | | | | |
Purchases of investments | | | (126,645,982 | ) | | | (317,688,046 | ) | | | (233,986,421 | ) | | | (89,223,766 | ) | | | (935,983,915 | ) |
Proceeds from sales and maturities of investments | | | 130,734,916 | | | | 334,027,825 | | | | 245,763,177 | | | | 93,692,982 | | | | 1,033,280,420 | |
Proceeds from (Purchases of) short-term investments, net | | | (3,371,144 | ) | | | (20,270,959 | ) | | | (19,271,499 | ) | | | (7,448,314 | ) | | | (37,968,376 | ) |
Proceeds from (Payments for) cash denominated in foreign currencies, net | | | 70 | | | | 179 | | | | 119 | | | | 3 | | | | (1 | ) |
Proceeds from (Payments for) closed foreign currency spot contracts | | | (40 | ) | | | (102 | ) | | | (68 | ) | | | — | | | | 516 | |
Premiums received (paid) for credit default swaps | | | — | | | | — | | | | — | | | | 216,371 | | | | — | |
Payment-in-kind distributions | | | (143,821 | ) | | | (233,432 | ) | | | (170,852 | ) | | | (49,660 | ) | | | (29,959 | ) |
Taxes paid | | | (95,983 | ) | | | (95,254 | ) | | | (56,218 | ) | | | (19,589 | ) | | | — | |
Proceeds from litigation settlement | | | — | | | | — | | | | — | | | | — | | | | 203,751 | |
Amortization (Accretion) of premiums and discounts, net | | | (1,811,631 | ) | | | (2,651,360 | ) | | | (2,263,134 | ) | | | (1,374,659 | ) | | | (306,008 | ) |
Amortization of deferred offering costs | | | 183,646 | | | | 252,303 | | | | 162,703 | | | | 192,939 | | | | — | |
(Increase) Decrease in: | | | | | | | | | | | | | | | | | | | | |
Receivable for interest | | | (65,824 | ) | | | 315,017 | | | | 545,652 | | | | 206,850 | | | | (632,224 | ) |
Receivable for investments sold | | | (2,350,492 | ) | | | (4,645,005 | ) | | | (14,187 | ) | | | 952,744 | | | | 26,417,320 | |
Receivable for shares sold | | | — | | | | 31,001 | | | | — | | | | — | | | | — | |
Other assets | | | 20,212 | | | | (3,976 | ) | | | 17,686 | | | | 2,479 | | | | 13,675 | |
Increase (Decrease) in: | | | | | | | | | | | | | | | | | | | | |
Payable for investments purchased | | | 2,676,039 | | | | 10,050,409 | | | | 8,513,029 | | | | 3,137,675 | | | | (18,416,348 | ) |
Payable for unfunded senior loans | | | (51,203 | ) | | | (109,214 | ) | | | (65,706 | ) | | | (51,203 | ) | | | — | |
Payable for variation margin on swap contracts | | | — | | | | — | | | | — | | | | 6,531 | | | | — | |
Accrued interest | | | (442 | ) | | | — | | | | 27,865 | | | | 1,663 | | | | (59,234 | ) |
Accrued management fees | | | (8,501 | ) | | | (19,142 | ) | | | (14,658 | ) | | | (7,036 | ) | | | (65,013 | ) |
Accrued Trustees fees | | | (3,207 | ) | | | (3,676 | ) | | | (2,300 | ) | | | (23 | ) | | | (16,193 | ) |
Accrued other expenses | | | (18,762 | ) | | | 8,168 | | | | (1,329 | ) | | | 15,713 | | | | (186,951 | ) |
Net realized (gain) loss from investments and foreign currency | | | 12,961,836 | | | | 22,162,068 | | | | 19,639,235 | | | | 6,255,418 | | | | 68,293,099 | |
Change in net unrealized (appreciation) depreciation of: | | | | | | | | | | | | | | | | | | | | |
Investments and foreign currency | | | 364,248 | | | | 8,136,582 | | | | 3,169,787 | | | | 3,347,408 | | | | (44,989,600 | ) |
Swaps(1) | | | (1,031,635 | ) | | | (2,938,806 | ) | | | (2,650,051 | ) | | | (173,604 | ) | | | — | |
Net cash provided by (used in) operating activities | | | 15,931,656 | | | | 38,737,447 | | | | 27,665,523 | | | | 11,792,902 | | | | 128,875,949 | |
Cash Flows from Financing Activities: | | | | | | | | | | | | | | | | | | | | |
Proceeds from reverse repurchase agreements | | | — | | | | — | | | | — | | | | — | | | | 70,000,000 | |
(Payments for) reverse repurchase agreements | | | — | | | | — | | | | — | | | | — | | | | (2,000,000 | ) |
Proceeds from borrowings | | | — | | | | 10,200,000 | | | | — | | | | — | | | | 25,000,000 | |
Repayments of borrowings | | | — | | | | — | | | | — | | | | — | | | | (106,000,000 | ) |
(Payments for) Term Preferred Shares redeemed, at liquidation preference | | | — | | | | (10,200,000 | ) | | | — | | | | — | | | | — | |
Increase (Decrease) in cash overdraft | | | — | | | | — | | | | — | | | | 718,318 | | | | — | |
Increase (Decrease) in cash overdraft denominated in foreign currencies | | | (1,038 | ) | | | (2,642 | ) | | | (1,765 | ) | | | (3 | ) | | | 157 | |
Cash distributions paid to common shareholders | | | (16,647,124 | ) | | | (41,117,805 | ) | | | (29,643,640 | ) | | | (12,440,823 | ) | | | (114,702,292 | ) |
Cost of shares repurchased and retired | | | (56,494 | ) | | | — | | | | (176,868 | ) | | | — | | | | (1,175,108 | ) |
Net cash provided by (used in) financing activities | | | (16,704,656 | ) | | | (41,120,447 | ) | | | (29,822,273 | ) | | | (11,722,508 | ) | | | (128,877,243 | ) |
Net Increase (Decrease) in Cash and Cash Collateral at Brokers | | | (773,000 | ) | | | (2,383,000 | ) | | | (2,156,750 | ) | | | 70,394 | | | | (1,294 | ) |
Cash and cash collateral at brokers at the beginning of period | | | 1,160,000 | | | | 2,383,000 | | | | 2,156,750 | | | | 275,528 | | | | 1,294 | |
Cash and cash collateral at brokers at the end of period | | $ | 387,000 | | | $ | — | | | $ | — | | | $ | 345,922 | | | $ | — | |
| | | | | |
| Supplemental Disclosure of Cash Flow Information | | NSL | | | JFR | | | JRO | | | JSD | | | JQC | |
Cash paid for interest (excluding borrowing and amortization of offering costs) | | $ | 4,489,206 | | | $ | 12,885,743 | | | $ | 8,518,348 | | | $ | 3,229,096 | | | $ | 24,873,094 | |
| (1) | Excluding over-the-counter cleared swaps. |
See accompanying notes to financial statements.
92
THIS PAGE INTENTIONALLY LEFT BLANK
93
Financial Highlights
Selected data for a common share outstanding throughout each period:
| | | | | | | | | | | | | | | | | | | | | | | | | | | | | | | | | | | | | | | | | | | | |
| | | | |
| | | | | | Investment Operations | | | Less Distributions to
Common Shareholders | | | Common Share | |
| | | Beginning
Common
Share
NAV | | | Net
Invest
ment
Income
(Loss)(a) | | | Net
Realized/
Unrealized
Gain (Loss) | | | Total | | | From
Net
Investment
Income | | | From
Accumu
lated
Net
Realized
Gains | | | Total | | | Discount
from
Shares
Repurchased
and Retired | | | Premium
from
Shares
Sold
through
Shelf
Offering | | | Ending
NAV | | | Ending
Share
Price | |
|
NSL | |
Year Ended 7/31: | |
2019 | | $ | 6.91 | | | $ | 0.45 | | | $ | (0.33 | ) | | $ | 0.12 | | | $ | (0.44 | ) | | $ | — | | | $ | (0.44 | ) | | $ | — | * | | $ | — | | | $ | 6.59 | | | $ | 5.90 | |
2018 | | | 6.97 | | | | 0.43 | | | | (0.04 | ) | | | 0.39 | | | | (0.45 | ) | | | — | | | | (0.45 | ) | | | — | | | | — | | | | 6.91 | | | | 6.13 | |
2017 | | | 6.76 | | | | 0.46 | | | | 0.21 | | | | 0.67 | | | | (0.46 | ) | | | — | | | | (0.46 | ) | | | — | | | | — | | | | 6.97 | | | | 6.83 | |
2016 | | | 7.16 | | | | 0.45 | | | | (0.43 | ) | | | 0.02 | | | | (0.42 | ) | | | — | | | | (0.42 | ) | | | — | * | | | — | | | | 6.76 | | | | 6.25 | |
2015 | | | 7.51 | | | | 0.45 | | | | (0.38 | ) | | | 0.07 | | | | (0.42 | ) | | | — | | | | (0.42 | ) | | | — | | | | — | | | | 7.16 | | | | 6.34 | |
|
JFR | |
Year Ended 7/31: | |
2019 | | | 11.55 | | | | 0.70 | | | | (0.48 | ) | | | 0.22 | | | | (0.73 | ) | | | — | | | | (0.73 | ) | | | — | | | | — | | | | 11.04 | | | | 9.76 | |
2018 | | | 11.76 | | | | 0.66 | | | | (0.10 | ) | | | 0.56 | | | | (0.77 | ) | | | — | | | | (0.77 | ) | | | — | | | | — | * | | | 11.55 | | | | 10.30 | |
2017 | | | 11.36 | | | | 0.73 | | | | 0.46 | | | | 1.19 | | | | (0.79 | ) | | | — | | | | (0.79 | ) | | | — | | | | — | * | | | 11.76 | | | | 11.83 | |
2016 | | | 12.01 | | | | 0.73 | | | | (0.66 | ) | | | 0.07 | | | | (0.72 | ) | | | — | | | | (0.72 | ) | | | — | | | | — | | | | 11.36 | | | | 10.68 | |
2015 | | | 12.59 | | | | 0.75 | | | | (0.61 | ) | | | 0.14 | | | | (0.72 | ) | | | — | | | | (0.72 | ) | | | — | | | | — | | | | 12.01 | | | | 10.67 | |
94
| | | | | | | | | | | | | | | | | | | | | | |
| | | | | | | Common Share Supplemental Data/
Ratios Applicable to Common Shares | |
Common Share
Total Returns | | | | | | Ratios to Average Net Assets(c) | | | | |
Based
on
NAV(b) | | | Based
on
Share
Price(b) | | | Ending
Net
Assets
(000) | | | Expenses | | | Net
Investment
Income (Loss) | | | Portfolio
Turnover
Rate(d) | |
| | | | | |
| | | | | | | | | | | | | | | | | | | | | | | |
| | | | | | | | | | | | | | | | | | | | | | |
| | 1.81 | % | | | 3.60 | % | | $ | 254,487 | | | | 3.26 | % | | | 6.77 | % | | | 31 | % |
| | 5.91 | | | | (3.78 | ) | | | 266,752 | | | | 2.90 | | | | 6.24 | | | | 29 | |
| | 10.22 | | | | 17.00 | | | | 269,083 | | | | 2.64 | | | | 6.70 | | | | 55 | |
| | 0.61 | | | | 5.89 | | | | 261,071 | | | | 2.53 | | | | 6.84 | | | | 29 | |
| | 0.96 | | | | (3.25 | ) | | | 276,530 | | | | 2.37 | | | | 6.08 | | | | 34 | |
| | | | | |
| | | | | | | | | | | | | | | | | | | | | | | |
| | | | | | | | | | | | | | | | | | | | | | |
| | 2.03 | | | | 1.98 | | | | 628,218 | | | | 3.43 | | | | 6.25 | | | | 32 | |
| | 5.01 | | | | (6.64 | ) | | | 657,157 | | | | 2.99 | | | | 5.68 | | | | 29 | |
| | 10.76 | | | | 18.63 | | | | 663,863 | | | | 2.63 | | | | 6.28 | | | | 59 | |
| | 0.93 | | | | 7.50 | | | | 626,627 | | | | 2.46 | | | | 6.52 | | | | 26 | |
| | 1.15 | | | | (2.88 | ) | | | 662,801 | | | | 2.29 | | | | 6.08 | | | | 33 | |
| (a) | Per share Net Investment Income (Loss) is calculated using the average daily shares method. |
| (b) | Total Return Based on Common Share NAV is the combination of changes in common share NAV, reinvested dividend income at NAV and reinvested capital gains distributions at NAV, if any. The last dividend declared in the period, which is typically paid on the first business day of the following month, is assumed to be reinvested at the ending NAV. The actual reinvest price for the last dividend declared in the period may often be based on the Fund’s market price (and not its NAV), and therefore may be different from the price used in the calculation. Total returns are not annualized. |
Total Return Based on Common Share Price is the combination of changes in the market price per share and the effect of reinvested dividend income and reinvested capital gains distributions, if any, at the average price paid per share at the time of reinvestment. The last dividend declared in the period, which is typically paid on the first business day of the following month, is assumed to be reinvested at the ending market price. The actual reinvestment for the last dividend declared in the period may take place over several days, and in some instances may not be based on the market price, so the actual reinvestment price may be different from the price used in the calculation. Total returns are not annualized.
| | | | |
| (c) | | • | | Net Investment Income (Loss) ratios reflect income earned and expenses incurred on assets attributable to preferred shares (as described in Note 4 – Fund Shares, Preferred Shares) and/or borrowings (as described in Note 9 – Fund Leverage), where applicable. |
| | • | | Each ratio includes the effect of all interest expense paid and other costs related to preferred shares and/or borrowings, where applicable, as follows: |
| | | | |
Ratios of Interest Expense
to Average Net Assets
Applicable to Common Shares | |
NSL | |
Year Ended 7/31: | |
2019 | | | 1.84 | % |
2018 | | | 1.46 | |
2017 | | | 1.19 | |
2016 | | | 1.08 | |
2015 | | | 0.89 | |
| | | | |
Ratios of Interest Expense
to Average Net Assets
Applicable to Common Shares | |
JFR | |
Year Ended 7/31: | |
2019 | | | 2.07 | % |
2018 | | | 1.61 | |
2017 | | | 1.24 | |
2016 | | | 1.08 | |
2015 | | | 0.88 | |
| (d) | Portfolio Turnover Rate is calculated based on the lesser of long-term purchases or sales (as disclosed in Note 5 – Investment Transactions) divided by the average long-term market value during the period. |
| * | Rounds to less than $0.01 per share. |
See accompanying notes to financial statements.
95
Financial Highlights(continued)
Selected data for a common share outstanding throughout each period:
| | | | | | | | | | | | | | | | | | | | | | | | | | | | | | | | | | | | | | | | | | | | |
| | | | |
| | | | | | Investment Operations | | | Less Distributions to
Common Shareholders | | | Common Share | |
| | | Beginning
Common
Share
NAV | | | Net
Investment
Income
(Loss)(a) | | | Net
Realized/
Unrealized
Gain (Loss) | | | Total | | | From
Net
Investment
Income | | | From
Accumu
lated
Net
Realized
Gains | | | Total | | | Discount
from
Shares
Repurchased
and Retired | | | Premium
from
Shares
Sold
through
Shelf
Offering | | | Ending
NAV | | | Ending
Share
Price | |
|
JRO | |
Year Ended 7/31: | | | | | | | | | | | | | | | | | | | | | | | | | | | | | | | | | | | | | | | | | | | | |
2019 | | $ | 11.47 | | | $ | 0.70 | | | $ | (0.49 | ) | | $ | 0.21 | | | $ | (0.74 | ) | | $ | — | | | $ | (0.74 | ) | | $ | — | * | | $ | — | | | $ | 10.94 | | | $ | 9.70 | |
2018 | | | 11.70 | | | | 0.66 | | | | (0.09 | ) | | | 0.57 | | | | (0.80 | ) | | | — | | | | (0.80 | ) | | | — | | | | — | * | | | 11.47 | | | | 10.23 | |
2017 | | | 11.31 | | | | 0.76 | | | | 0.45 | | | | 1.21 | | | | (0.83 | ) | | | — | | | | (0.83 | ) | | | — | | | | 0.01 | | | | 11.70 | | | | 11.87 | |
2016 | | | 12.05 | | | | 0.77 | | | | (0.75 | ) | | | 0.02 | | | | (0.76 | ) | | | — | | | | (0.76 | ) | | | — | | | | — | | | | 11.31 | | | | 10.72 | |
2015 | | | 12.68 | | | | 0.79 | | | | (0.66 | ) | | | 0.13 | | | | (0.76 | ) | | | — | | | | (0.76 | ) | | | — | | | | — | | | | 12.05 | | | | 10.82 | |
|
JSD | |
Year Ended 7/31: | | | | | | | | | | | | | | | | | | | | | | | | | | | | | | | | | | | | | | | | | | | | |
2019 | | | 17.92 | | | | 1.19 | | | | (0.98 | ) | | | 0.21 | | | | (1.24 | ) | | | — | | | | (1.24 | ) | | | — | | | | — | | | | 16.89 | | | | 15.36 | |
2018 | | | 18.07 | | | | 1.19 | | | | (0.04 | ) | | | 1.15 | | | | (1.30 | ) | | | — | | | | (1.30 | ) | | | — | | | | — | | | | 17.92 | | | | 16.67 | |
2017 | | | 17.49 | | | | 1.29 | | | | 0.54 | | | | 1.83 | | | | (1.25 | ) | | | — | | | | (1.25 | ) | | | — | | | | — | * | | | 18.07 | | | | 17.75 | |
2016 | | | 18.63 | | | | 1.21 | | | | (1.16 | ) | | | 0.05 | | | | (1.16 | ) | | | (0.03 | ) | | | (1.19 | ) | | | — | | | | — | | | | 17.49 | | | | 16.16 | |
2015 | | | 19.48 | | | | 1.22 | | | | (0.87 | ) | | | 0.35 | | | | (1.16 | ) | | | (0.04 | ) | | | (1.20 | ) | | | — | | | | — | | | | 18.63 | | | | 16.41 | |
96
| | | | | | | | | | | | | | | | | | | | | | |
| | | | | | | Common Share Supplemental Data/
Ratios Applicable to Common Shares | |
Common Share
Total Returns | | | | | | Ratios to Average Net Assets(c) | | | | |
| | | | | |
Based
on
NAV(b) | | | Based
on
Share
Price(b) | | | Ending
Net
Assets
(000) | | | Expenses | | | Net
Investment
Income (Loss) | | | Portfolio
Turnover
Rate(d) | |
| | | | | |
| | | | | | | | | | | | | | | | | | | | | | | |
| | | | | | | | | | | | | | | | | | | | | | |
| | 1.94 | % | | | 2.19 | % | | $ | 443,700 | | | | 3.31 | % | | | 6.37 | % | | | 34 | % |
| | 5.06 | | | | (7.38 | ) | | | 465,378 | | | | 2.99 | | | | 5.77 | | | | 30 | |
| | 11.06 | | | | 18.92 | | | | 465,161 | | | | 2.68 | | | | 6.57 | | | | 57 | |
| | 0.53 | | | | 6.91 | | | | 435,189 | | | | 2.49 | | | | 6.91 | | | | 27 | |
| | 1.03 | | | | (6.74 | ) | | | 463,729 | | | | 2.31 | | | | 6.41 | | | | 34 | |
| | | | | |
| | | | | | | | | | | | | | | | | | | | | | | |
| | | | | | | | | | | | | | | | | | | | | | |
| | 1.30 | | | | (0.30 | ) | | | 170,487 | | | | 3.45 | | | | 6.89 | | | | 33 | |
| | 6.66 | | | | 1.33 | | | | 180,884 | | | | 2.96 | | | | 6.69 | | | | 29 | |
| | 10.68 | | | | 17.91 | | | | 182,468 | | | | 2.52 | | | | 7.18 | | | | 58 | |
| | 0.62 | | | | 6.52 | | | | 176,531 | | | | 2.27 | | | | 7.05 | | | | 34 | |
| | 1.87 | | | | (3.27 | ) | | | 188,031 | | | | 1.78 | | | | 6.43 | | | | 31 | |
| (a) | Per share Net Investment Income (Loss) is calculated using the average daily shares method. |
| (b) | Total Return Based on Common Share NAV is the combination of changes in common share NAV, reinvested dividend income at NAV and reinvested capital gains distributions at NAV, if any. The last dividend declared in the period, which is typically paid on the first business day of the following month, is assumed to be reinvested at the ending NAV. The actual reinvest price for the last dividend declared in the period may often be based on the Fund’s market price (and not its NAV), and therefore may be different from the price used in the calculation. Total returns are not annualized. |
| | Total Return Based on Common Share Price is the combination of changes in the market price per share and the effect of reinvested dividend income and reinvested capital gains distributions, if any, at the average price paid per share at the time of reinvestment. The last dividend declared in the period, which is typically paid on the first business day of the following month, is assumed to be reinvested at the ending market price. The actual reinvestment for the last dividend declared in the period may take place over several days, and in some instances may not be based on the market price, so the actual reinvestment price may be different from the price used in the calculation. Total returns are not annualized. |
| | | | |
| (c) | | • | | Net Investment Income (Loss) ratios reflect income earned and expenses incurred on assets attributable to preferred shares (as described in Note 4 – Fund Shares, Preferred Shares) and/or borrowings (as described in Note 9 – Fund Leverage), where applicable. |
| | • | | Each ratio includes the effect of all interest expense paid and other costs related to preferred shares and/or borrowings, where applicable, as follows: |
| | | | |
Ratios of Interest Expense
to Average Net Assets
Applicable to Common Shares | |
JRO | |
Year Ended 7/31: | |
2019 | | | 1.94 | % |
2018 | | | 1.59 | |
2017 | | | 1.27 | |
2016 | | | 1.08 | |
2015 | | | 0.89 | |
| | | | |
Ratios of Interest Expense
to Average Net Assets
Applicable to Common Shares | |
JSD | |
Year Ended 7/31: | |
2019 | | | 2.00 | % |
2018 | | | 1.44 | |
2017 | | | 1.07 | |
2016 | | | 0.82 | |
2015 | | | 0.45 | |
| (d) | Portfolio Turnover Rate is calculated based on the lesser of long-term purchases or sales (as disclosed in Note 5 – Investment Transactions) divided by the average long-term market value during the period. |
| * | Rounds to less than $0.01 per share. |
See accompanying notes to financial statements.
97
Financial Highlights(continued)
Selected data for a common share outstanding throughout each period:
| | | | | | | | | | | | | | | | | | | | | | | | | | | | | | | | | | | | | | | | | | | | |
| | | | |
| | | | | | Investment Operations | | | Less Distributions to
Common Shareholders | | | Common Share | |
| | | Beginning
Common
Share
NAV | | | Net
Investment
Income
(Loss)(a) | | | Net
Realized/
Unrealized
Gain (Loss) | | | Total | | | From
Net
Investment
Income | | | From
Accumulated
Net
Realized
Gains | | | Return
of
capital | | | Total | | | Discount
from
Shares
Repurchased
and Retired | | | Ending
NAV | | | Ending
Share
Price | |
|
JQC | |
Year Ended 7/31: | |
2019 | | $ | 9.11 | | | $ | 0.46 | | | $ | (0.17 | ) | | $ | 0.29 | | | $ | (0.60 | ) | | $ | — | | | $ | (0.31 | ) | | $ | (0.91 | ) | | $ | — | * | | $ | 8.49 | | | $ | 7.68 | |
2018 | | | 9.32 | | | | 0.44 | | | | (0.12 | ) | | | 0.32 | | | | (0.53 | ) | | | — | | | | — | | | | (0.53 | ) | | | — | | | | 9.11 | | | | 7.89 | |
2017 | | | 9.25 | | | | 0.52 | | | | 0.18 | | | | 0.70 | | | | (0.63 | ) | | | — | | | | — | | | | (0.63 | ) | | | — | | | | 9.32 | | | | 8.69 | |
2016 | | | 9.88 | | | | 0.58 | | | | (0.60 | ) | | | (0.02 | ) | | | (0.61 | ) | | | — | | | | — | | | | (0.61 | ) | | | — | * | | | 9.25 | | | | 8.43 | |
2015 | | | 10.25 | | | | 0.62 | | | | (0.43 | ) | | | 0.19 | | | | (0.56 | ) | | | — | | | | — | | | | (0.56 | ) | | | — | * | | | 9.88 | | | | 8.59 | |
| (a) | Per share Net Investment Income (Loss) is calculated using the average daily shares method. |
| (b) | Total Return Based on Common Share NAV is the combination of changes in common share NAV, reinvested dividend income at NAV and reinvested capital gains distributions at NAV, if any. The last dividend declared in the period, which is typically paid on the first business day of the following month, is assumed to be reinvested at the ending NAV. The actual reinvest price for the last dividend declared in the period may often be based on the Fund’s market price (and not its NAV), and therefore may be different from the price used in the calculation. Total returns are not annualized. |
Total Return Based on Common Share Price is the combination of changes in the market price per share and the effect of reinvested dividend income and reinvested capital gains distributions, if any, at the average price paid per share at the time of reinvestment. The last dividend declared in the period, which is typically paid on the first business day of the following month, is assumed to be reinvested at the ending market price. The actual reinvestment for the last dividend declared in the period may take place over several days, and in some instances may not be based on the market price, so the actual reinvestment price may be different from the price used in the calculation. Total returns are not annualized.
| | | | |
| (c) | | • | | Net Investment Income (Loss) ratios reflect income earned and expenses incurred on assets attributable to reverse repurchase agreements and borrowings (as described in Note 9 – Fund Leverage), where applicable. |
| | • | | Each ratio includes the effect of all interest expense and other costs related to reverse repurchase agreements and borrowings, where applicable, as follows: |
| | | | |
| JQC | | Ratios of Interest Expense
to Average Net Assets
Applicable to Common Shares | |
Year Ended 7/31: | |
2019 | | | 2.08 | % |
2018 | | | 1.67 | |
2017 | | | 1.23 | |
2016 | | | 1.01 | |
2015 | | | 0.66 | |
98
| | | | | | | | | | | | | | | | | | | | | | |
| | | | | | | Common Share Supplemental Data/
Ratios Applicable to Common Shares | |
Common Share
Total Returns | | | | | | Ratios to Average Net Assets(c) | | | | |
Based
on
NAV(b) | | |
Based
on
Share
Price(b) | | | Ending
Net
Assets
(000) | | | Expenses | | | Net
Investment
Income (Loss) | | | Portfolio
Turnover
Rate(d) | |
| | | | | |
| | | | | | | | | | | | | | | | | | | | | | | |
| | | | | | | | | | | | | | | | | | | | | | |
| | 3.43 | % | | | 9.33 | % | | $ | 1,151,777 | | | | 3.42 | % | | | 5.25 | % | | | 59 | % |
| | 3.64 | | | | (3.09 | ) | | | 1,237,262 | | | | 3.01 | | | | 4.84 | | | | 45 | |
| | 7.70 | | | | 10.75 | | | | 1,265,447 | | | | 2.57 | | | | 5.59 | | | | 46 | |
| | 0.11 | | | | 5.98 | | | | 1,255,254 | | | | 2.41 | | | | 6.32 | | | | 46 | |
| | 1.82 | | | | 1.02 | | | | 1,344,763 | | | | 1.95 | | | | 6.16 | | | | 61 | |
| (d) | Portfolio Turnover Rate is calculated based on the lesser of long-term purchases or sales (as disclosed in Note 5 – Investment Transactions) divided by the average long-term market value during the period. |
| * | Rounds to less than $0.01 per share. |
See accompanying notes to financial statements.
99
Financial Highlights(continued)
| | | | | | | | | | | | | | | | | | | | | | | | | | | | |
| | | Borrowings
at the End of Period | | | VRTP Shares
at the End of Period | | | Term Preferred
at the End of Period | | | Borrowings,
VRTP Shares and/or
Term Preferred
at the End of Period | |
| | | Aggregate
Amount
Outstanding
(000) | | | Asset
Coverage
Per $1,000
Share(a) | | | Aggregate
Amount
Outstanding
(000) | | | Asset
Coverage
Per $100,000
Share | | | Aggregate
Amount
Outstanding
(000) | | | Asset
Coverage
Per $1,000
Share | | | Asset
Coverage
Per $1
Liquidation
Preference | |
NSL | | | | | | | | | | | | | | | | | | | | | |
Year Ended 7/31: | | | | | | | | | | | | | | | | | | | | | |
2019 | | $ | 114,000 | | | $ | 3,610 | | | $ | — | | | $ | — | | | $ | 43,000 | | | $ | 2,621 | | | $ | 2.62 | |
2018 | | | 114,000 | | | | 3,717 | | | | — | | | | — | | | | 43,000 | | | | 2,699 | | | | 2.70 | |
2017 | | | 114,000 | | | | 3,738 | | | | — | | | | — | | | | 43,000 | | | | 2,714 | | | | 2.71 | |
2016 | | | 101,000 | | | | 4,030 | | | | 45,000 | | | | 278,816 | | | | — | | | | — | | | | 2.79 | |
2015 | | | 112,500 | | | | 3,974 | | | | 58,000 | | | | 262,188 | | | | — | | | | — | | | | 2.62 | |
| | | | | |
JFR | | | | | | | | | | | | | | | | | | | | | |
Year Ended 7/31: | | | | | | | | | | | | | | | | | | | | | |
2019 | | | 264,500 | | | | 3,810 | | | | — | | | | — | | | | 115,000 | | | | 2,655 | | | | 2.66 | |
2018 | | | 254,300 | | | | 4,077 | | | | — | | | | — | | | | 125,200 | | | | 2,732 | | | | 2.73 | |
2017 | | | 254,300 | | | | 4,103 | | | | — | | | | — | | | | 125,200 | | | | 2,749 | | | | 2.75 | |
2016 | | | 240,800 | | | | 4,051 | | | | 108,000 | | | | 279,652 | | | | — | | | | — | | | | 2.80 | |
2015 | | | 270,300 | | | | 3,966 | | | | 139,000 | | | | 261,935 | | | | — | | | | — | | | | 2.62 | |
| | | | | |
JRO | | | | | | | | | | | | | | | | | | | | | |
Year Ended 7/31: | | | | | | | | | | | | | | | | | | | | | |
2019 | | | 178,800 | | | | 3,951 | | | | — | | | | — | | | | 84,000 | | | | 2,688 | | | | 2.69 | |
2018 | | | 178,800 | | | | 4,073 | | | | — | | | | — | | | | 84,000 | | | | 2,771 | | | | 2.77 | |
2017 | | | 178,800 | | | | 4,071 | | | | — | | | | — | | | | 84,000 | | | | 2,770 | | | | 2.77 | |
2016 | | | 166,800 | | | | 4,059 | | | | 75,000 | | | | 279,979 | | | | — | | | | — | | | | 2.80 | |
2015 | | | 188,800 | | | | 3,975 | | | | 98,000 | | | | 261,691 | | | | — | | | | — | | | | 2.62 | |
| | | | | |
JSD | | | | | | | | | | | | | | | | | | | | | |
Year Ended 7/31: | | | | | | | | | | | | | | | | | | | | | |
2019 | | | 72,000 | | | | 3,854 | | | | — | | | | — | | | | 35,000 | | | | 2,593 | | | | 2.59 | |
2018 | | | 72,000 | | | | 3,998 | | | | — | | | | — | | | | 35,000 | | | | 2,691 | | | | 2.69 | |
2017 | | | 72,000 | | | | 4,020 | | | | — | | | | — | | | | 35,000 | | | | 2,705 | | | | 2.71 | |
2016 | | | 64,000 | | | | 4,305 | | | | — | | | | — | | | | 35,000 | | | | 2,783 | | | | 2.78 | |
2015 | | | 85,200 | | | | 3,207 | | | | — | | | | — | | | | — | | | | — | | | | — | |
| | | | | |
JQC | | | | | | | | | | | | | | | | | | | | | |
Year Ended 7/31: | | | | | | | | | | | | | | | | | | | | | |
2019 | | | 480,000 | | | | 3,400 | | | | — | | | | — | | | | — | | | | — | | | | — | |
2018 | | | 561,000 | | | | 3,205 | | | | — | | | | — | | | | — | | | | — | | | | — | |
2017 | | | 561,000 | | | | 3,256 | | | | — | | | | — | | | | — | | | | — | | | | — | |
2016 | | | 561,000 | | | | 3,238 | | | | — | | | | — | | | | — | | | | — | | | | — | |
2015 | | | 640,000 | | | | 3,101 | | | | — | | | | — | | | | — | | | | — | | | | — | |
100
| (a) | Beginning with the fiscal year ended July 31, 2017, the Funds are calculating Asset Coverage Per $1,000 of Borrowings as defined under the 1940 Act and not as defined for financial reporting purposes. For purposes of calculating Asset Coverage as defined under the 1940 Act, the outstanding preferred shares are excluded because they are treated as equity for regulatory purposes. The Asset Coverage amounts presented in the table above are calculated in accordance with the 1940 Act, and therefore the Asset Coverage per $1,000 of Borrowings reflects the amount of Fund total assets (less all liabilities not represented by borrowings and preferred shares) per $1,000 of borrowings alone. |
For financial reporting purposes, preferred shares are considered to be debt. For the fiscal years ended July 31, 2015 and July 31, 2016, the Asset Coverage amounts per $1,000 of Borrowings reflected the amount of Fund total assets (less all liabilities not represented by borrowings and preferred shares) per $1,000 of the combined amount of borrowings and outstanding preferred shares and the Asset Coverage amounts per financial reporting purposes as follows:
| | | | | | | | |
| | | Borrowings at the End of Period | |
| | | Aggregate Amount Outstanding (000) | | | Asset Coverage Per $1,000 Share | |
NSL | | | | | | | | |
Year Ended 7/31: | | | | | |
2016 | | $ | 101,000 | | | $ | 2,788 | |
2015 | | | 112,500 | | | | 2,622 | |
| | | | | | | | |
| | | Borrowings at the End of Period | |
| | | Aggregate Amount Outstanding (000) | | | Asset Coverage Per $1,000 Share | |
JFR | | | | | | | | |
Year Ended 7/31: | | | | | |
2016 | | $ | 240,800 | | | $ | 2,797 | |
2015 | | | 270,300 | | | | 2,619 | |
| | | | | | | | |
| | | Borrowings at the End of Period | |
| | | Aggregate Amount Outstanding (000) | | | Asset Coverage Per $1,000 Share | |
JRO | | | | | | | | |
Year Ended 7/31: | | | | | |
2016 | | $ | 166,800 | | | $ | 2,800 | |
2015 | | | 188,800 | | | | 2,617 | |
| | | | | | | | |
| | | Borrowings at the End of Period | |
| | | Aggregate Amount Outstanding (000) | | | Asset Coverage Per $1,000 Share | |
JSD | | | | | | | | |
Year Ended 7/31: | | | | | |
2016 | | $ | 64,000 | | | $ | 2,783 | |
See accompanying notes to financial statements.
101
Notes to Financial Statements
1. General Information and Significant Accounting Policies
General Information
Fund Information
The funds covered in this report and their corresponding New York Stock Exchange (“NYSE”) symbols are as follows (each a “Fund” and collectively, the “Funds”):
| | • | | Nuveen Senior Income Fund (NSL) |
| | • | | Nuveen Floating Rate Income Fund (JFR) |
| | • | | Nuveen Floating Rate Income Opportunity Fund (JRO) |
| | • | | Nuveen Short Duration Credit Opportunities Fund (JSD) |
| | • | | Nuveen Credit Strategies Income Fund (JQC) |
The Funds are registered under the Investment Company Act of 1940 (the “1940 Act”), as amended, as diversified closed-end management investment companies. NSL, JFR, JRO, JSD and JQC were organized as Massachusetts business trusts on August 13, 1999, January 15, 2004, April 27, 2004, January 3, 2011 and May 17, 2003, respectively.
The end of the reporting period for the Funds is July 31, 2019, and the period covered by these Notes to Financial Statements is the fiscal year ended July 31, 2019 (the “current fiscal period”).
Investment Adviser
The Funds’ investment adviser is Nuveen Fund Advisors, LLC (the “Adviser”), a subsidiary of Nuveen, LLC (“Nuveen”). Nuveen is the investment management arm of Teachers Insurance and Annuity Association of America (TIAA). The Adviser has overall responsibility for management of the Funds, oversees the management of the Funds’ portfolios, manages the Funds’ business affairs and provides certain clerical, bookkeeping and other administrative services, and, if necessary, asset allocation decisions. The Adviser has entered into sub-advisory agreements with Symphony Asset Management, LLC (“Symphony”), an affiliate of Nuveen, under which Symphony manages the investment portfolios of the Funds. The Adviser is responsible for overseeing the Funds’ investments in interest rate and credit default swap contracts.
Investment Objectives and Principal Investment Strategies
NSL’s investment objective is to achieve a high level of current income, consistent with capital preservation. The Fund invests at least 80% of its managed assets (as defined in Note 7 – Management Fees) in adjustable rate senior loans. Senior loans that satisfy the 80% requirement may be secured or unsecured so long as any unsecured senior loans are investment grade quality. The Fund invests at least 65% of its managed assets in adjustable rate senior loans that are secured by specific collateral. The Fund may invest a substantial portion of its managed assets in senior loans and other debt instruments that are, at the time of investment, rated below investment grade or are unrated but judged to be of comparable quality by Symphony.
JFR’s investment objective is to achieve a high level of current income. The Fund invests at least 80% of its managed assets in adjustable rate loans, primarily secured senior loans. As part of the 80% requirement, the Fund also may invest in unsecured senior loans and secured and unsecured subordinated loans. The Fund invests at least 65% of its managed assets in adjustable rate senior loans that are secured by specific collateral. The Fund may invest a substantial portion of its managed assets in senior loans and other debt instruments that are, at the time of investment, rated below investment grade or are unrated but judged to be of comparable quality by Symphony.
JRO’s investment objective is to achieve a high level of current income. The Fund invests at least 80% of its managed assets in adjustable rate loans, primarily secured senior loans. As part of the 80% requirement, the Fund also may invest in unsecured senior loans and secured and unsecured subordinated loans. The Fund invests at least 65% of its managed assets in adjustable rate senior loans that are secured by specific collateral.
JSD’s investment objective is to provide current income and the potential for capital appreciation. Under normal market circumstances the Fund will invest at least 70% of its managed assets in adjustable rate corporate debt instruments, including senior secured loans, second lien loans and other adjustable rate corporate debt instruments. The Fund may make limited tactical investments in high yield debt and other debt instruments of up to 30% of its managed assets. No more than 30% of the Fund’s managed assets may be invested in debt instruments that are, at the time of investment, rated CCC+ or Caa or below by any Nationally Recognized Statistical Rating Organization or that are unrated but judged by Symphony, to be of comparable quality. The Fund may enter into tactical short positions consisting primarily of high yield debt, either directly or through the use of derivatives, including credit default swaps, creating investment exposure or hedging existing long (positive) investment exposure in a notional amount up to 20% of its managed
102
assets. The Fund may invest up to 20% of its managed assets in debt instruments of non-U.S. issuers that are U.S. dollar or non-U.S. dollar denominated. The Fund’s investments in debt instruments of non-U.S. issuers may include debt instruments of issuers located, or conducting their business, in emerging markets countries.
JQC’s investment objectives are high current income and total return. The Fund meets its investment objectives by investing approximately 70% of its managed assets in senior secured and second lien loans, and up to 30% of its managed assets across the capital structure of companies (including equity securities) with a primary emphasis on high yield bonds, convertible securities and other forms of income-producing securities.
The Funds can invest up to 5% in iBOXX Loan Total Return Swaps.
Significant Accounting Policies
Each Fund is an investment company and follows accounting and reporting guidance under Financial Accounting Standards Board (“FASB”) Accounting Standards Codification (ASC) Topic 946 “Financial Services – Investment Companies.” The following is a summary of significant accounting policies followed by the Funds in the preparation of their financial statements in accordance with U.S. generally accepted accounting principles (“U.S. GAAP”).
Investment Transactions
Investment transactions are recorded on a trade date basis. Trade date for senior and subordinated loans purchased in the “primary market” is considered the date on which the loan allocations are determined. Trade date for senior and subordinated loans purchased in the “secondary market” is the date on which the transaction is entered into. Realized gains and losses from investment transactions are determined on the specific identification method, which is the same basis used for federal income tax purposes. Investments purchased on a when-issued/delayed delivery basis may have extended settlement periods. Any investments so purchased are subject to market fluctuation during this period. The Funds have earmarked securities in their portfolios with a current value at least equal to the amount of the when-issued/delayed delivery purchase commitments.
As of the end of the reporting period, the Funds’ outstanding when-issued/delayed delivery purchase commitments were as follows:
| | | | | | | | | | | | | | | | | | | | |
| | | NSL | | | JFR | | | JRO | | | JSD | | | JQC | |
Outstanding when-issued/delayed delivery purchase commitments | | $ | 13,515,777 | | | $ | 34,660,103 | | | $ | 26,181,134 | | | $ | 11,539,981 | | | $ | 60,809,080 | |
Investment Income
Dividend income is recorded on the ex-dividend date or, for foreign securities, when information is available. Non-cash dividends received in the form of stock, if any, are recognized on the ex-dividend date and recorded at fair value. Interest income, which reflects the amortization of premiums and accretion of discounts for financial reporting purposes, is recorded on an accrual basis. Interest income also reflects payment-in-kind (“PIK”) interest and fee income, if any. PIK interest represents income received in the form of securities in lieu of cash. Fee income consists primarily of amendment fees. Amendment fees are earned as compensation for evaluating and accepting changes to an original senior loan agreement and are recognized when received. Fee income and amendment fees, if any, are recognized as “Fees” on the Statement of Operations.
Professional Fees
Professional fees presented on the Statement of Operations consist of legal fees incurred in the normal course of operations, audit fees, tax consulting fees and, in some cases, workout expenditures. Workout expenditures are incurred in an attempt to protect or enhance an investment or to pursue other claims or legal actions on behalf of Fund shareholders. If a refund is received for workout expenditures paid in a prior reporting period, such amounts will be recognized as “Legal fee refund” on the Statement of Operations.
Dividends and Distributions to Common Shareholders
Dividends to common shareholders, if any, are declared monthly. For NSL, JFR, JRO and JSD net realized capital gains from investment transactions, if any, are declared and distributed to shareholders at least annually. Furthermore, capital gains are distributed only to the extent they exceed available capital loss carryforwards.
For the period August 1, 2018 through December 31, 2018, JQC’s regular monthly distributions were sourced entirely from net investment income. Effective in conjunction with the declaration of the January 2019 distribution, the Fund has implemented a capital return plan where a supplemental amount is expected to be included in the Fund’s regular monthly distribution. Under this program, the Fund’s regular monthly distribution is expected to include net investment income, return of capital and potentially capital gains for tax purposes. In the event that total distributions during a calendar year exceed the Fund’s total return on net asset value (“NAV”), the difference will reduce NAV per share. If the Fund’s total return on NAV exceeds total distributions during a calendar year, the excess will be reflected as an increase in NAV per share. The final determination of the source and character of all distributions for the fiscal year are made after the end of the fiscal year and is reflected in the financial statements contained in the annual report as of July 31 each year.
103
Notes to Financial Statements(continued)
Distributions to common shareholders are recorded on the ex-dividend date. The amount and timing of distributions are determined in accordance with federal income tax regulations, which may differ from U.S. GAAP.
Compensation
The Funds pay no compensation directly to those of its trustees who are affiliated with the Adviser or to its officers, all of whom receive remuneration for their services to the Funds from the Adviser or its affiliates. The Funds’ Board of Trustees (the “Board”) has adopted a deferred compensation plan for independent trustees that enables trustees to elect to defer receipt of all or a portion of the annual compensation they are entitled to receive from certain Nuveen-advised funds. Under the plan, deferred amounts are treated as though equal dollar amounts had been invested in shares of select Nuveen-advised funds.
Indemnifications
Under the Funds’ organizational documents, their officers and trustees are indemnified against certain liabilities arising out of the performance of their duties to the Funds. In addition, in the normal course of business, the Funds enter into contracts that provide general indemnifications to other parties. The Funds’ maximum exposure under these arrangements is unknown as this would involve future claims that may be made against the Funds that have not yet occurred. However, the Funds have not had prior claims or losses pursuant to these contracts and expect the risk of loss to be remote.
Netting Agreements
In the ordinary course of business, the Funds may enter into transactions subject to enforceable master repurchase agreements, International Swaps and Derivative Association, Inc. (ISDA) master agreements or other similar arrangements (“netting agreements”). Generally, the right to offset in netting agreements allows each Fund to offset certain securities and derivatives with a specific counterparty, when applicable, as well as any collateral received or delivered to that counterparty based on the terms of the agreements. Generally, each Fund manages its cash collateral and securities collateral on a counterparty basis.
The Funds’ investments subject to netting agreements as of the end of the reporting period, if any, are further described in Note 3 – Portfolio Securities and Investments in Derivatives.
Use of Estimates
The preparation of financial statements in conformity with U.S. GAAP requires management to make estimates and assumptions that affect the reported amounts of assets and liabilities at the date of the financial statements and the reported amounts of increases and decreases in net assets applicable to common shares from operations during the current fiscal period. Actual results may differ from those estimates.
2. Investment Valuation and Fair Value Measurements
The fair valuation input levels as described below are for fair value measurement purposes.
Fair value is defined as the price that would be received upon selling an investment or transferring a liability in an orderly transaction to an independent buyer in the principal or most advantageous market for the investment. A three-tier hierarchy is used to maximize the use of observable market data and minimize the use of unobservable inputs and to establish classification of fair value measurements for disclosure purposes. Observable inputs reflect the assumptions market participants would use in pricing the asset or liability. Observable inputs are based on market data obtained from sources independent of the reporting entity. Unobservable inputs reflect the reporting entity’s own assumptions about the assumptions market participants would use in pricing the asset or liability. Unobservable inputs are based on the best information available in the circumstances. The following is a summary of the three-tiered hierarchy of valuation input levels.
| | |
| Level 1 – | | Inputs are unadjusted and prices are determined using quoted prices in active markets for identical securities. |
| Level 2 – | | Prices are determined using other significant observable inputs (including quoted prices for similar securities, interest rates, credit spreads, etc.). |
| Level 3 – | | Prices are determined using significant unobservable inputs (including management’s assumptions in determining the fair value of investments). |
Common stocks and other equity-type securities are valued at the last sales price on the securities exchange on which such securities are primarily traded and are generally classified as Level 1. Securities primarily traded on the Nasdaq National Market (“Nasdaq”) are valued at the Nasdaq Official Closing Price and are generally classified as Level 1. However, securities traded on a securities exchange or Nasdaq for which there were no transactions on a given day or securities not listed on a securities exchange or Nasdaq are valued at the quoted bid price and are generally classified as Level 2.
Prices of fixed-income securities are provided by an independent pricing service (“pricing service”) approved by the Board. The pricing service establishes a security’s fair value using methods that may include consideration of the following: yields or prices of investments of comparable quality, type of issue, coupon, maturity and rating, market quotes or indications of value from security dealers, evaluations of anticipated cash flows or collateral, general market conditions and other information and analysis, including the obligor’s credit characteristics considered relevant. These securities are generally classified as Level 2. In pricing certain securities, particularly less liquid and lower quality securities, the pricing service may consider information about a security, its issuer or market activity provided by the Adviser. These securities are generally classified as Level 2 or Level 3 depending on the observability of the significant inputs.
104
Like most fixed-income securities, the senior and subordinated loans in which the Funds invest are not listed on an organized exchange. The secondary market of such investments may be less liquid relative to markets for other fixed-income securities. Consequently, the value of senior and subordinated loans, determined as described above, may differ significantly from the value that would have been determined had there been an active market for that senior loan. These securities are generally classified as Level 2.
Prices of swap contracts are also provided by a pricing service approved by the Board using the same methods as described above and are generally classified as Level 2.
Investments in investment companies are valued at their respective NAV’s on the valuation date and are generally classified as Level 1.
Investments initially valued in currencies other than the U.S. dollar are converted to the U.S. dollar using exchange rates obtained from pricing services. As a result, the NAV of the Funds’ shares may be affected by changes in the value of currencies in relation to the U.S. dollar. The value of securities traded in markets outside the United States or denominated in currencies other than the U.S. dollar may be affected significantly on a day that the NYSE is closed and an investor is not able to purchase, redeem or exchange shares. If significant market events occur between the time of determination of the closing price of a foreign security on an exchange and the time that the Funds’ NAV is determined, or if under the Funds’ procedures, the closing price of a foreign security is not deemed to be reliable, the security would be valued at fair value as determined in accordance with procedures established in good faith by the Board. These securities are generally classified as Level 2 or Level 3 depending on the observability of the significant inputs.
Certain securities may not be able to be priced by the pre-established pricing methods as described above. Such securities may be valued by the Board and/or its appointee at fair value. These securities generally include, but are not limited to, restricted securities (securities which may not be publicly sold without registration under the Securities Act of 1933, as amended) for which a pricing service is unable to provide a market price; securities whose trading has been formally suspended; debt securities that have gone into default and for which there is no current market quotation; a security whose market price is not available from a pre-established pricing source; a security with respect to which an event has occurred that is likely to materially affect the value of the security after the market has closed but before the calculation of a Fund’s NAV (as may be the case in non-U.S. markets on which the security is primarily traded) or make it difficult or impossible to obtain a reliable market quotation; and a security whose price, as provided by the pricing service, is not deemed to reflect the security’s fair value. As a general principle, the fair value of a security would appear to be the amount that the owner might reasonably expect to receive for it in a current sale. A variety of factors may be considered in determining the fair value of such securities, which may include consideration of the following: yields or prices of investments of comparable quality, type of issue, coupon, maturity and rating, market quotes or indications of value from security dealers, evaluations of anticipated cash flows or collateral, general market conditions and other information and analysis, including the obligor’s credit characteristics considered relevant. These securities are generally classified as Level 2 or Level 3 depending on the observability of the significant inputs. Regardless of the method employed to value a particular security, all valuations are subject to review by the Board and/or its appointee.
The inputs or methodologies used for valuing securities are not an indication of the risks associated with investing in those securities. The following is a summary of each Fund’s fair value measurements as of the end of the reporting period:
| | | | | | | | | | | | | | | | |
| NSL | | Level 1 | | | Level 2 | | | Level 3 | | | Total | |
Long-Term Investments*: | | | | | | | | | | | | | | | | |
Variable Rate Senior Loan Interests | | $ | — | | | $ | 374,654,719 | | | $ | — | | | $ | 374,654,719 | |
Corporate Bonds** | | | — | | | | 22,550,566 | | | | — | *** | | | 22,550,566 | |
Common Stocks** | | | 6,249,310 | | | | 1,262,426 | | | | 81,015 | | | | 7,592,751 | |
Common Stocks Rights** | | | — | | | | 252,191 | | | | — | | | | 252,191 | |
Convertible Bonds | | | — | | | | 60,778 | | | | — | | | | 60,778 | |
Warrants** | | | — | | | | 159,607 | | | | — | | | | 159,607 | |
| | | | |
Short-Term Investments: | | | | | | | | | | | | | | | | |
Investment Companies | | | 13,492,573 | | | | — | | | | — | | | | 13,492,573 | |
| | | | |
Investments in Derivatives: | | | | | | | | | | | | | | | | |
Interest Rate Swaps**** | | | — | | | | (167,345 | ) | | | — | | | | (167,345 | ) |
Total | | $ | 19,741,883 | | | $ | 398,772,942 | | | $ | 81,015 | | | $ | 418,595,840 | |
105
Notes to Financial Statements(continued)
| | | | | | | | | | | | | | | | |
| JFR | | Level 1 | | | Level 2 | | | Level 3 | | | Total | |
Long-Term Investments*: | | | | | | | | | | | | | | | | |
Variable Rate Senior Loan Interests | | $ | — | | | $ | 888,812,260 | | | $ | — | | | $ | 888,812,260 | |
Corporate Bonds** | | | — | | | | 60,748,433 | | | | — | *** | | | 60,748,433 | |
Common Stocks** | | | 13,795,350 | | | | 3,203,352 | | | | 165,867 | | | | 17,164,569 | |
Investment Companies | | | 10,869,536 | | | | — | | | | — | | | | 10,869,536 | |
Asset-Backed Securities | | | — | | | | 6,086,530 | | | | — | | | | 6,086,530 | |
Common Stock Rights** | | | — | | | | 466,778 | | | | — | | | | 466,778 | |
Convertible Bonds | | | — | | | | 106,361 | | | | — | | | | 106,361 | |
Warrants** | | | — | | | | 474,756 | | | | — | | | | 474,756 | |
| | | | |
Short-Term Investments: | | | | | | | | | | | | | | | | |
Investment Companies | | | 43,812,049 | | | | — | | | | — | | | | 43,812,049 | |
| | | | |
Investments in Derivatives: | | | | | | | | | | | | | | | | |
Interest Rate Swaps**** | | | — | | | | 508,221 | | | | — | | | | 508,221 | |
Total | | $ | 68,476,935 | | | $ | 960,406,691 | | | $ | 165,867 | | | $ | 1,029,049,493 | |
| | | | |
| JRO | | | | | | | | | | | | |
Long-Term Investments*: | | | | | | | | | | | | | | | | |
Variable Rate Senior Loan Interests | | $ | — | | | $ | 630,034,071 | | | $ | — | | | $ | 630,034,071 | |
Corporate Bonds** | | | — | | | | 41,607,553 | | | | — | *** | | | 41,607,553 | |
Common Stocks** | | | 10,837,414 | | | | 2,762,470 | | | | 122,888 | | | | 13,722,772 | |
Asset-Backed Securities | | | — | | | | 2,560,939 | | | | — | | | | 2,560,939 | |
Common Stock Rights** | | | — | | | | 481,563 | | | | — | | | | 481,563 | |
Convertible Bonds | | | — | | | | 75,972 | | | | — | | | | 75,972 | |
Warrants** | | | — | | | | 307,072 | | | | — | | | | 307,072 | |
| | | | |
Short-Term Investments: | | | | | | | | | | | | | | | | |
Investment Companies | | | 36,427,860 | | | | — | | | | — | | | | 36,427,860 | |
| | | | |
Investments in Derivatives: | | | | | | | | | | | | | | | | |
Interest Rate Swaps**** | | | — | | | | 318,964 | | | | — | | | | 318,964 | |
Total | | $ | 47,265,274 | | | $ | 678,148,604 | | | $ | 122,888 | | | $ | 725,536,766 | |
| | | | |
| JSD | | | | | | | | | | | | |
Long-Term Investments*: | | | | | | | | | | | | | | | | |
Variable Rate Senior Loan Interests | | $ | — | | | $ | 250,270,698 | | | $ | — | | | $ | 250,270,698 | |
Corporate Bonds** | | | — | | | | 15,932,932 | | | | — | *** | | | 15,932,932 | |
Common Stocks** | | | 4,377,485 | | | | 479,270 | | | | 25,043 | | | | 4,881,798 | |
Common Stock Rights** | | | — | | | | 259,896 | | | | — | | | | 259,896 | |
Convertible Bonds | | | — | | | | 60,778 | | | | — | | | | 60,778 | |
Warrants** | | | — | | | | 148,967 | | | | — | | | | 148,967 | |
| | | | |
Short-Term Investments: | | | | | | | | | | | | | | | | |
Investment Companies | | | 15,566,819 | | | | — | | | | — | | | | 15,566,819 | |
| | | | |
Investments in Derivatives: | | | | | | | | | | | | | | | | |
Credit Default Swaps**** | | | — | | | | (69,441 | ) | | | — | | | | (69,441 | ) |
Total | | $ | 19,944,304 | | | $ | 267,083,100 | | | $ | 25,043 | | | $ | 287,052,447 | |
| | | | |
| JQC | | | | | | | | | | | | |
Long-Term Investments*: | | | | | | | | | | | | | | | | |
Variable Rate Senior Loan Interests | | $ | — | | | $ | 1,394,114,033 | | | $ | — | | | $ | 1,394,114,033 | |
Corporate Bonds** | | | — | | | | 366,341,393 | | | | — | *** | | | 366,341,393 | |
Convertible Bonds | | | — | | | | 24,495,816 | | | | — | | | | 24,495,816 | |
Common Stocks** | | | 8,455,573 | | | | 3,255,291 | | | | 441,663 | | | | 12,152,527 | |
Common Stock Rights** | | | — | | | | 1,642,259 | | | | — | | | | 1,642,259 | |
Warrants** | | | — | | | | 421,006 | | | | — | | | | 421,006 | |
| | | | |
Short-Term Investments: | | | | | | | | | | | | | | | | |
Investment Companies | | | 104,681,406 | | | | — | | | | — | | | | 104,681,406 | |
Total | | $ | 113,136,979 | | | $ | 1,790,269,798 | | | $ | 441,663 | | | $ | 1,903,848,440 | |
| * | Refer to the Fund’s Portfolio of Investments for industry classifications, where applicable. |
| ** | Refer to the Fund’s Portfolio of Investments for securities classified as Level 2 and/or Level 3. |
| *** | Value equals zero as of the end of the reporting period. |
| **** | Represents net unrealized appreciation (depreciation) as reported in the Fund’s Portfolio of Investments. |
106
3. Portfolio Securities and Investments in Derivatives
Portfolio Securities
Foreign Currency Transactions
To the extent that the Funds may invest in securities and/or contracts that are denominated in a currency other than U.S. dollars, the Funds will be subject to currency risk, which is the risk that an increase in the U.S. dollar relative to the foreign currency will reduce returns or portfolio value. Generally, when the U.S. dollar rises in value against a foreign currency, the Funds’ investments denominated in that currency will lose value because its currency is worth fewer U.S. dollars; the opposite effect occurs if the U.S. dollar falls in relative value. Investments and other assets and liabilities denominated in foreign currencies are converted into U.S. dollars on a spot (i.e. cash) basis at the spot rate prevailing in the foreign currency exchange market at the time of valuation. Purchases and sales of investments and income denominated in foreign currencies are translated into U.S. dollars on the respective dates of such transactions.
The books and records of the Funds are maintained in U.S. dollars. Foreign currencies, assets and liabilities are translated into U.S. dollars at 4:00 p.m. Eastern Time. Investment transactions, income and expenses are translated on the respective dates of such transactions. Net realized foreign currency gains and losses resulting from changes in exchange rates include foreign currency gains and losses between trade date and settlement date of the transactions, foreign currency transactions and the difference between the amounts of interest and dividends recorded on the books of the Funds and the amounts actually received.
The realized gains and losses resulting from changes in foreign currency exchange rates and changes in foreign exchange rates associated with (i) foreign currency, (ii) investments, (iii) investments in derivatives and (iv) other assets and liabilities are recognized as a component of “Net realized gain (loss) from investments and foreign currency” on the Statement of Operations, when applicable.
The unrealized gains and losses resulting from changes in foreign currency exchange rates and changes in foreign exchange rates associated with (i) investments and (ii) other assets and liabilities are recognized as a component of “Change in net unrealized appreciation (depreciation) of investments and foreign currency” on the Statement of Operations, when applicable. The unrealized gains and losses resulting from changes in foreign exchange rates associated with investments in derivatives are recognized as a component of the respective derivative’s related “Change in net unrealized appreciation (depreciation)” on the Statement of Operations, when applicable.
Zero Coupon Securities
A zero coupon security does not pay a regular interest coupon to its holders during the life of the security. Income to the holder of the security comes from accretion of the difference between the original purchase price of the security at issuance and the par value of the security at maturity and is effectively paid at maturity. The market prices of zero coupon securities generally are more volatile than the market prices of securities that pay interest periodically.
Investments in Derivatives
Each Fund is authorized to invest in certain derivative instruments, such as futures, options and swap contracts. Each Fund limits its investments in futures, options on futures and swap contracts to the extent necessary for the Adviser to claim the exclusion from registration by the Commodity Futures Trading Commission as a commodity pool operator with respect to the Fund. The Funds record derivative instruments at fair value, with changes in fair value recognized on the Statement of Operations, when applicable. Even though the Funds’ investments in derivatives may represent economic hedges, they are not considered to be hedge transactions for financial reporting purposes.
Interest Rate Swap Contracts
Interest rate swap contracts involve a Fund’s agreement with the counterparty to pay or receive a fixed rate payment in exchange for the counterparty receiving or paying a variable rate payment. Forward interest rate swap contracts involve a Fund’s agreement with a counterparty to pay, in the future, a fixed or variable rate payment in exchange for the counterparty paying the Fund a variable or fixed rate payment, the accruals for which would begin at a specified date in the future (the “effective date”).
The amount of the payment obligation for an interest rate swap is based on the notional amount and the termination date of the contract. Interest rate swap contracts do not involve the delivery of securities or other underlying assets or principal. Accordingly, the risk of loss with respect to the swap counterparty on such transactions is limited to the net amount of interest payments that the Fund is to receive.
Interest rate swap contracts are valued daily. Upon entering into an interest rate swap contract (and beginning on the effective date for a forward interest rate swap contract), the Fund accrues the fixed rate payment expected to be paid or received and the variable rate payment expected to be received or paid on the interest rate swap contracts on a daily basis, and recognizes the daily change in the fair value of the Fund’s contractual rights and obligations under the contracts. For an over-the-counter (“OTC”) swap that is not cleared through a clearing house (“OTC Uncleared”), the amount recorded on these transactions is recognized on the Statement of Assets and Liabilities as a component of “Unrealized appreciation or depreciation on interest rate swaps.”
107
Notes to Financial Statements(continued)
Upon the execution of an OTC swap cleared through a clearing house (“OTC Cleared”), the Fund is obligated to deposit cash or eligible securities, also known as “initial margin,” into an account at its clearing broker equal to a specified percentage of the contract amount. Cash deposited by the Fund to cover initial margin requirements on open swap contracts, if any, is recognized as a component of “Cash collateral at brokers for investment in swaps” on the Statement of Assets and Liabilities. Investments in OTC Cleared swaps obligate the Fund and the clearing broker to settle monies on a daily basis representing changes in the prior day’s “mark-to-market” of the swap contract. If the Fund has unrealized appreciation, the clearing broker will credit the Fund’s account with an amount equal to the appreciation. Conversely, if the Fund has unrealized depreciation, the clearing broker will debit the Fund’s account with an amount equal to the depreciation. These daily cash settlements are also known as “variation margin.” Variation margin for OTC Cleared swaps is recognized as a receivable and/or payable for “Variation margin on swap contracts” on the Statement of Assets and Liabilities. Upon the execution of an OTC Uncleared swap, neither the Fund nor the counterparty is required to deposit initial margin as the trades are recorded bilaterally between both parties to the swap contract, and the terms of the variation margin are subject to a predetermined threshold negotiated by the Fund and the counterparty. Variation margin for OTC Uncleared swaps is recognized as a component of “Unrealized appreciation or depreciation on interest rate swaps” as described in the preceding paragraph.
The net amount of periodic payments settled in cash are recognized as a component of “Net realized gain (loss) from swaps” on the Statement of Operations, in addition to the net realized gain or loss recorded upon the termination of the swap contract. For tax purposes, payments expected to be received or paid on the swap contracts are treated as ordinary income or expense, respectively. Changes in the value of the swap contracts during the fiscal period are recognized as a component of “Change in net unrealized appreciation (depreciation) of swaps” on the Statement of Operations. In certain instances, payments are made or received upon entering into the swap contract to compensate for differences between the stated terms of the swap agreements and prevailing market conditions (credit spreads, currency exchange rates, interest rates, and other relevant factors). Payments received or made at the beginning of the measurement period, if any, are recognized as “Interest rate swaps premiums received and/or paid” on the Statement of Assets and Liabilities.
During the current fiscal period, NSL, JFR, JRO and JSD used cancellable interest rate swaps in which each Fund received payments based upon pre-determined fixed rates and paid one-month LIBOR plus a fixed spread. After a non-callable period, the swap counterparty owns the right on future monthly dates to terminate the swap at par. The purpose of the cancellable interest rate swap is to convert a fixed rate Term Preferred Share issuance to floating rate, and the cancellation dates of the swap correspond to dates on which the Funds can call the Term Preferred Share issue.
The average notional amount of interest rate swap contracts outstanding during the current fiscal period was as follows:
| | | | | | | | | | | | | | | | |
| | | NSL | | | JFR | | | JRO | | | JSD | |
Average notional amount of interest rate swap contracts outstanding* | | $ | 43,000,000 | | | $ | 115,000,000 | | | $ | 84,000,000 | | | $ | 31,500,000 | |
| * | The average notional amount is calculated based on the outstanding notional at the beginning of the current fiscal period and at the end of each fiscal quarter within the current fiscal period. |
Credit Default Swap Contracts
A Fund may enter into a credit default swap contract to seek to maintain a total return on a particular investment or portion of its portfolio, or to take an active long or short position with respect to the likelihood of a particular issuer’s default. Credit default swap contracts involve one party making a stream of payments to another party in exchange for the right to receive a specified return if/when there is a credit event by a third party. Generally, a credit event means bankruptcy, failure to pay, or restructuring. The specific credit events applicable for each credit default swap are stated in the terms of the particular swap agreement. When a Fund has bought (sold) protection in a credit default swap upon occurrence of a specific credit event with respect to the underlying referenced entity, the Fund will either (i) deliver (receive) that security, or an equivalent amount of cash, from the counterparty in exchange for receipt (payment) of the notional amount to the counterparty, or (ii) receive (pay) a net settlement amount of the credit default swap contract less the recovery value of the referenced obligation or underlying securities comprising the referenced index. The difference between the value of the security received (delivered) and the notional amount delivered (received) is recorded as a realized gain or loss. Payments paid (received) at the beginning of the measurement period are recognized as a component of “Credit default swaps premiums paid and/or received” on the Statement of Assets and Liabilities, when applicable.
Credit default swap contracts are valued daily. Changes in the value of a credit default swap during the fiscal period are recognized as a component of “Change in net unrealized appreciation (depreciation) of swaps” and realized gains and losses are recognized as a component of “Net realized gain (loss) from swaps” on the Statement of Operations.
For OTC swaps not cleared through a clearing house (“OTC Uncleared”), the daily change in the market value of the swap contract, along with any daily interest fees accrued, are recognized as components of “Unrealized appreciation or depreciation on credit default swaps” on the Statement of Assets and Liabilities.
Upon the execution of an OTC swap cleared through a clearing house (“OTC Cleared”), a Fund is obligated to deposit cash or eligible securities, also known as “initial margin,” into an account at its clearing broker equal to a specified percentage of the contract amount. Cash held by the broker to cover initial margin requirements on open swap contracts, if any, is recognized as “Cash collateral at brokers for investments in swaps” on the Statement of
108
Assets and Liabilities. Investments in OTC Cleared swaps obligate a Fund and the clearing broker to settle monies on a daily basis representing changes in the prior day’s “mark-to-market” of the swap. If a Fund has unrealized appreciation the clearing broker would credit the Fund’s account with an amount equal to the appreciation. Conversely, if a Fund has unrealized depreciation the clearing broker will debit the Fund’s account with an amount equal to the depreciation. These daily cash settlements are also known as “variation margin.” Variation margin for OTC Cleared swaps is recognized as a receivable and/or payable for “Variation margin on swap contracts” on the Statement of Assets and Liabilities. Upon the execution of an OTC Uncleared swap, neither the Fund nor the counterparty is required to deposit initial margin as the trades are recorded bilaterally between both parties to the swap contract, and the terms of the variation margin are subject to a predetermined threshold negotiated by the Fund and the counterparty. Variation margin for OTC Uncleared swaps is recognized as a component of “Unrealized appreciation or depreciation on credit default swaps” as described in the preceding paragraph. The maximum potential amount of future payments the Fund could incur as a buyer or seller of protection in a credit default swap contract is limited to the notional amount of the contract. The maximum potential amount would be offset by the recovery value, if any, of the respective referenced entity.
During the current fiscal period, JSD invested in credit default swap contracts to provide a benefit if particular bonds’ credit quality worsened.
The average notional amount of credit default swap contracts outstanding during the current fiscal period was as follows:
| | | | |
| | | JSD | |
Average notional amount of credit default swap contracts outstanding* | | $ | 2,600,000 | |
| * | The average notional amount is calculated based on the outstanding notional at the beginning of the current fiscal period and at the end of each fiscal quarter within the current fiscal period. |
The following table presents the fair value of all swap contracts held by the Funds as of the end of the reporting period, the location of these instruments on the Statement of Assets and Liabilities and the primary underlying risk exposure.
| | | | | | | | | | | | | | | | | | |
| | | | | Location on the Statement of Assets and Liabilities | |
Underlying
Risk Exposure | | Derivative
Instrument | | Asset Derivatives | | | | | | (Liability) Derivatives | |
| | Location | | Value | | | | | | Location | | Value | |
| NSL | | | | | | | | | | | | | | | | | | |
| Interest rate | | Swaps (OTC Uncleared) | | — | | $ | — | | | | | | | Unrealized depreciation on interest rate swaps | | $ | (167,345 | ) |
| JFR | | | | | | | | | | | | | | | | | | |
| Interest rate | | Swaps (OTC Uncleared) | | Unrealized appreciation on interest rate swaps | | $ | 510,157 | | | | | | | Unrealized depreciation on interest rate swaps | | $ | (1,936 | ) |
| JRO | | | | | | | | | | | | | | | | | | |
| Interest rate | | Swaps (OTC Uncleared) | | Unrealized appreciation on interest rate swaps | | $ | 384,635 | | | | | | | Unrealized depreciation on interest rate swaps | | $ | (65,671 | ) |
| JSD | | | | | | | | | | | | | | | | | | |
| Credit | | Swaps (OTC Cleared) | | — | | $ | — | | | | | | | Payable for variation margin on swap contracts**^ | | $ | (69,441 | ) |
| ** | Value represents the unrealized appreciation (depreciation) of swaps as reported in the Fund’s Portfolio of Investments and not the asset and/or liability amount as described above. |
| ^ | Some swap contracts require a counterparty to pay or receive a premium, which is disclosed on the Statement of Assets and Liabilities and is not reflected in the cumulative unrealized appreciation (depreciation) presented above. |
The following table presents the swap contracts subject to netting agreements and the collateral delivered related to those swap contracts as of end of the reporting period.
| | | | | | | | | | | | | | | | | | | | | | |
| Fund | | Counterparty | | Gross
Unrealized
Appreciation on
Interest Rate
Swaps*** | | | Gross
Unrealized
(Depreciation) on
Interest Rate
Swaps*** | | | Net
Unrealized
Appreciation
(Depreciation) on
Interest Rate
Swaps | | | Collateral
Pledged
to (from)
Counterparty | | | Net
Exposure | |
| NSL | | Morgan Stanley Capital Services LLC | | $ | — | | | $ | (167,345 | ) | | $ | (167,345 | ) | | $ | 167,345 | | | $ | — | |
| JFR | | Morgan Stanley Capital Services LLC | | | 510,157 | | | | (1,936 | ) | | | 508,221 | | | | (508,221 | ) | | | — | |
| JRO | | Morgan Stanley Capital Services LLC | | | 384,635 | | | | (65,671 | ) | | | 318,964 | | | | (271,532 | ) | | | 47,432 | |
| *** | Represents gross unrealized appreciation (depreciation) for the counterparty as reported in the Fund’s Portfolio of Investments. |
109
Notes to Financial Statements(continued)
The following table presents the amount of net realized gain (loss) and change in net unrealized appreciation (depreciation) recognized on swap contracts on the Statement of Operations during the current fiscal period, and the primary underlying risk exposure.
| | | | | | | | | | | | |
| Fund | | Underlying
Risk Exposure | | Derivative
Instrument | | Net Realized
Gain��(Loss) from
Swaps | | | Change in Net
Unrealized
Appreciation
(Depreciation) of
Swaps | |
| NSL | | Interest rate | | Swaps | | $ | (534,288 | ) | | $ | 1,031,635 | |
| JFR | | Interest rate | | Swaps | | $ | 165,763 | | | $ | 2,938,806 | |
| JRO | | Interest rate | | Swaps | | $ | (101,789 | ) | | $ | 2,650,051 | |
| JSD | | | | | | | | | | | | |
| | Credit | | Swaps | | $ | (259,682 | ) | | $ | (27,454 | ) |
| | | Interest rate | | Swaps | | | (137,109 | ) | | | 173,604 | |
| Total | | | | | | $ | (396,791 | ) | | $ | 146,150 | |
Market and Counterparty Credit Risk
In the normal course of business each Fund may invest in financial instruments and enter into financial transactions where risk of potential loss exists due to changes in the market (market risk) or failure of the other party to the transaction to perform (counterparty credit risk). The potential loss could exceed the value of the financial assets recorded on the financial statements. Financial assets, which potentially expose each Fund to counterparty credit risk, consist principally of cash due from counterparties on forward, option and swap transactions, when applicable. The extent of each Fund’s exposure to counterparty credit risk in respect to these financial assets approximates their carrying value as recorded on the Statement of Assets and Liabilities.
Each Fund helps manage counterparty credit risk by entering into agreements only with counterparties the Adviser believes have the financial resources to honor their obligations and by having the Adviser monitor the financial stability of the counterparties. Additionally, counterparties may be required to pledge collateral daily (based on the daily valuation of the financial asset) on behalf of each Fund with a value approximately equal to the amount of any unrealized gain above a pre-determined threshold. Reciprocally, when each Fund has an unrealized loss, the Funds have instructed the custodian to pledge assets of the Funds as collateral with a value approximately equal to the amount of the unrealized loss above a pre-determined threshold. Collateral pledges are monitored and subsequently adjusted if and when the valuations fluctuate, either up or down, by at least the pre-determined threshold amount.
4. Fund Shares
Common Shares
Common Shares Equity Shelf Programs and Offering Costs
The following Funds have each filed registration statements with the Securities and Exchange Commission (“SEC”) authorizing each Fund to issue additional common shares through one or more equity shelf program (“Shelf Offering”), which became effective with the SEC during prior fiscal periods.
Under these Shelf Offerings, the Funds, subject to market conditions, may raise additional equity capital by issuing additional common shares from time to time in varying amounts and by different offering methods at a net price at or above each Fund’s NAV per common share. In the event a Fund’s Shelf Offering registration statement is no longer current, the Fund may not issue additional common shares until a post-effective amendment to the registration statement has been filed with the SEC.
Additional authorized common shares, common shares sold and offering proceeds, net of offering costs under each Fund’s Shelf Offering during the Fund’s current and prior fiscal period were as follows:
| | | | | | | | | | | | | | | | |
| | | NSL | | | JFR | |
| | | Year Ended
7/31/19 | | | Year Ended
7/31/18* | | | Year Ended
7/31/19** | | | Year Ended
7/31/18 | |
Additional authorized common shares | | | — | | | | 8,800,000 | | | | 12,900,000 | | | | 12,900,000 | |
Common shares sold | | | — | | | | — | | | | — | | | | 452,068 | |
Offering proceeds, net of offering costs | | $ | — | | | $ | — | | | | — | | | $ | 5,297,434 | |
110
| | | | | | | | | | | | | | | | |
| | | JRO | | | JSD | |
| | | Year Ended
7/31/19** | | | Year Ended
7/31/18 | | | Year Ended 7/31/19 | | | Year Ended
7/31/18* | |
Additional authorized common shares | | | 8,500,000 | | | | 8,500,000 | | | | — | | | | 1,000,000 | |
Common shares sold | | | — | | | | 783,600 | | | | — | | | | — | |
Offering proceeds, net of offering costs | | $ | — | | | $ | 9,134,335 | | | $ | — | | | $ | — | |
| * | Represents additional authorized common shares for the period August 1, 2017 through December 8, 2017. |
| ** | Represent additional authorized common shares for the period August 1, 2018 through November 30, 2018. |
Costs incurred by the Funds in connection with their initial shelf registrations were recorded as a prepaid expense and recognized as “Deferred offering costs” on the Statement of Assets and Liabilities. These costs are amortized pro rata as shares are sold and are recognized as a component of “Proceeds from shelf offering, net of offering costs” on the Statement of Changes in Net Assets. Any deferred offering costs remaining one year after effectiveness of the initial shelf registration will be expensed. Costs incurred by the Funds to keep the shelf registration current are expensed as incurred and recognized as a component of “Other expenses” on the Statement of Operations.
Common Share Transactions
Transactions in common shares during the Funds’ current and prior fiscal period, where applicable, were as follows:
| | | | | | | | | | | | | | | | |
| | | NSL | | | JFR | |
| | | Year Ended 7/31/19 | | | Year Ended
7/31/18 | | | Year Ended
7/31/19 | | | Year Ended
7/31/18 | |
Common shares: | | | | | | | | | | | | | | | | |
Sold through shelf offering | | | — | | | | — | | | | — | | | | 452,068 | |
Issued to shareholders due to reinvestment of distributions | | | — | | | | — | | | | — | | | | 11,975 | |
Repurchased and retired | | | (10,400 | ) | | | — | | | | — | | | | — | |
Weighted average common share: | | | | | | | | | | | | | | | | |
Premium to NAV per shelf offering share sold | | | — | | | | — | | | | — | | | | 1.38 | % |
Price per share repurchased and retired | | $ | 5.41 | | | | — | | | | — | | | | — | |
Discount per share repurchased and retired | | | 15.29 | % | | | — | | | | — | | | | — | |
| | |
| | | JRO | | | JQC | |
| | | Year Ended
7/31/19 | | | Year Ended
7/31/18 | | | Year Ended
7/31/19 | | | Year Ended
7/31/18 | |
Common shares: | | | | | | | | | | | | | | | | |
Sold through shelf offering | | | — | | | | 783,600 | | | | — | | | | — | |
Issued to shareholders due to reinvestment of distributions | | | — | | | | 5,155 | | | | — | | | | — | |
Repurchased and retired | | | (20,000 | ) | | | — | | | | (157,700 | ) | | | — | |
Weighted average common share: | | | | | | | | | | | | | | | | |
Premium to NAV per shelf offering share sold | | | — | | | | 1.71 | % | | | — | | | | — | |
Price per share repurchased and retired | | $ | 8.82 | | | | — | | | $ | 7.43 | | | | — | |
Discount per share repurchased and retired | | | 16.68 | % | | | — | | | | 16.16 | % | | | — | |
Preferred Shares
Term Preferred Shares
The following Funds have issued and have outstanding Term Preferred Shares (“Term Preferred”), with a $1,000 liquidation preference per share.
As of the end of the reporting, NSL, JFR, JRO and JSD had $42,585,413, $114,075,264, $83,075,728 and $34,757,373 Term Preferred at liquidation preference, net of deferred offering costs, respectively. Further details of the Funds’ Term Preferred Shares outstanding as of the end of the reporting period, were as follows:
| | | | | | | | | | | | |
| Fund | | Series | | | Shares
Outstanding | | | Liquidation
Preference | |
NSL | | | 2021 | | | | 43,000 | | | $ | 43,000,000 | |
JFR | | | 2022 | | | | 25,000 | | | | 25,000,000 | |
| | | 2024 | | | | 35,000 | | | | 35,000,000 | |
| | | | 2027 | | | | 55,000 | | | | 55,000,000 | |
111
Notes to Financial Statements(continued)
| | | | | | | | | | | | |
| Fund | | Series | | | Shares
Outstanding | | | Liquidation
Preference | |
JRO | | | 2022 | | | | 10,000 | | | $ | 10,000,000 | |
| | | 2022-1 | | | | 21,000 | | | | 21,000,000 | |
| | | 2023 | | | | 8,000 | | | | 8,000,000 | |
| | | | 2027 | | | | 45,000 | | | | 45,000,000 | |
JSD | | | 2020 | | | | 35,000 | | | $ | 35,000,000 | |
Each Fund is obligated to redeem its Term Preferred by the date as specified in its offering document (“Term Redemption Date”), unless earlier redeemed or repurchased by the Fund. The Term Preferred are subject to redemption at the option of each Fund, subject to payment of a premium for approximately one year following the date of issuance (“Optional Redemption Premium Expiration Date”), and at liquidation preference per share plus accumulated but unpaid dividends. Term Preferred are subject to mandatory redemption in certain circumstances. Each Fund may be obligated to redeem a certain amount of the Term Preferred if the Fund fails to maintain certain asset coverage and leverage ratio requirements and such failures are not cured by the applicable cure date. The redemption price per share is equal to the sum of the liquidation preference per share (plus any premium) plus any accumulated but unpaid dividends. The Term Redemption Date and Optional Redemption Premium Expiration Date for each Fund’s series of Term Preferred are as follows:
| | | | | | | | | | | | |
| Fund | | Series | | | Term
Redemption Date | | | Optional
Redemption Premium
Expiration Date | |
NSL | | | 2021 | | | | November 1, 2021 | | | | October 31, 2017 | |
JFR | | | 2022 | | | | January 1, 2022 | | | | December 31, 2017 | |
| | | 2024 | | | | June 1, 2024 | | | | N/A | |
| | | | 2027 | | | | January 1, 2027 | | | | December 31, 2017 | |
JRO | | | 2022 | | | | January 1, 2022 | | | | December 31, 2017 | |
| | | 2022-1 | | | | April 1, 2022 | | | | June 30, 2019 | |
| | | 2023 | | | | December 1, 2023 | | | | November 30, 2017 | |
| | | | 2027 | | | | January 1, 2027 | | | | December 31, 2017 | |
JSD | | | 2020 | | | | November 1, 2020 | | | | October 31, 2016 | |
The average liquidation preference of Term Preferred outstanding and the annualized dividend rate for each Fund during the current fiscal period were as follows:
| | | | | | | | | | | | | | | | |
| | | NSL | | | JFR | | | JRO | | | JSD | |
Average liquidation preference of Term Preferred outstanding | | $ | 43,000,000 | | | $ | 118,129,863 | | | $ | 84,000,000 | | | $ | 35,000,000 | |
Annualized dividend rate | | | 2.00 | % | | | 3.80 | % | | | 3.33 | % | | | 2.62 | % |
Term Preferred generally do not trade, and market quotations are generally not available. Term Preferred are short-term instruments that pay a dividend rate, subject to adjustment as set forth in accordance with the offering documents. The fair value of Term Preferred is expected to be approximately its liquidation preference so long as the fixed “spread” on the Term Preferred remains roughly in line with the “spread” being demanded by investors on instruments having similar terms in the current market environment. In present market conditions, the Fund’s Adviser has determined that the fair value of Term Preferred is approximately its liquidation preference, but its fair value could vary if market conditions change materially. For financial reporting purposes, the liquidation preference of Term Preferred is a liability and is recognized as “Term Preferred Shares (“Term Preferred”), net of deferred offering costs” on the Statement of Assets and Liabilities.
Dividends on Term Preferred (which are treated as interest payments for financial reporting purposes) are at the rates set forth in its offering document. The initial dividend rate will expire approximately two years after the first issuance of shares and will be adjusted upwards semi-annually thereafter. Unpaid dividends on Term Preferred are recognized as a component of “Interest payable” on the Statement of Assets and Liabilities, when applicable. Dividends accrued on Term Preferred are recognized as a component of “Interest expense and amortization of offering costs” on the Statement of Operations.
Costs incurred in connection with each Fund’s offering of Term Preferred were recorded as a deferred charge, which are amortized over the life of the shares and are recognized as components of “Term Preferred Shares, net of deferred offering costs” on the Statement of Assets and Liabilities and “Interest expense and amortization of offering costs” on the Statement of Operations.
In conjunction with JFR’s redemption of Series 2019 Term Preferred, the remaining deferred offering costs of $52,114, were fully expensed during the current fiscal period, as the redemptions were deemed an extinguishment of debt.
112
Preferred Share Transactions
Transactions in preferred shares during the Funds’ current and prior fiscal period, where applicable, are noted in the following table.
Transactions in Term Preferred for the Funds, where applicable, were as follows:
| | | | | | | | | | | | |
| | | Year Ended
July 31, 2019 | |
| JFR | | Series | | | Shares | | | Amount | |
Term Preferred redeemed | | | 2019 | | | | (10,200 | ) | | $ | (10,200,000 | ) |
5. Investment Transactions
Long-term purchases and sales (including maturities but excluding derivative transactions, where applicable) during the current fiscal period, were as follows:
| | | | | | | | | | | | | | | | | | | | |
| | | NSL | | | JFR | | | JRO | | | JSD | | | JQC | |
Purchases | | $ | 126,645,982 | | | $ | 317,688,046 | | | $ | 233,986,421 | | | $ | 89,223,766 | | | $ | 935,983,915 | |
Sales and maturities | | $ | 130,734,916 | | | $ | 334,027,825 | | | $ | 245,763,177 | | | $ | 93,692,982 | | | $ | 1,033,280,420 | |
6. Income Tax Information
Each Fund is a separate taxpayer for federal income tax purposes. Each Fund intends to distribute substantially all of its net investment income and net capital gain to shareholders and to otherwise comply with the requirements of Subchapter M of the Internal Revenue Code applicable to regulated investment companies. Therefore, no federal income tax provision is required.
For all open tax years and all major taxing jurisdictions, management of the Funds has concluded that there are no significant uncertain tax positions that would require recognition in the financial statements. Open tax years are those that are open for examination by taxing authorities (i.e., generally the last four tax year ends and the interim tax period since then). Furthermore, management of the Funds is also not aware of any tax positions for which it is reasonably possible that the total amounts of unrecognized tax benefits will significantly change in the next twelve months.
The following information is presented on an income tax basis. Differences between amounts for financial statement and federal income tax purposes are primarily due to the treatment of timing differences in recognizing certain gains and losses on investment transactions and recognition of premium amortization (except for NSL). To the extent that differences arise that are permanent in nature, such amounts are reclassified within the capital accounts as detailed below. Temporary differences do not require reclassification. Temporary and permanent differences do not impact the NAVs of the Funds.
The tables below present the cost and unrealized appreciation (depreciation) of each Fund’s investment portfolio, as determined on a federal income tax basis, as of July 31, 2019.
For purposes of this disclosure, derivative tax cost is generally the sum of any upfront fees or premiums exchanged and any amounts unrealized for income statement reporting but realized in income and/or capital gains for tax reporting. If a particular derivative category does not disclose any tax unrealized appreciation or depreciation, the change in value of those derivatives have generally been fully realized for tax purposes.
| | | | | | | | | | | | | | | | | | | | |
| | | NSL | | | JFR | | | JRO | | | JSD | | | JQC | |
Tax cost of investments | | $ | 433,976,095 | | | $ | 1,067,798,283 | | | $ | 751,383,665 | | | $ | 296,036,413 | | | $ | 1,949,011,330 | |
Gross unrealized: | | | | | | | | | | | | | | | | | | | | |
Appreciation | | | 3,172,754 | | | | 7,463,731 | | | | 5,359,542 | | | | 2,204,756 | | | | 16,768,112 | |
Depreciation | | | (18,385,664 | ) | | | (46,720,742 | ) | | | (31,525,405 | ) | | | (11,119,281 | ) | | | (61,931,002 | ) |
Net unrealized appreciation (depreciation) of investments | | $ | (15,212,910 | ) | | $ | (39,257,011 | ) | | $ | (26,165,863 | ) | | $ | (8,914,525 | ) | | $ | (45,162,890 | ) |
| | | | | |
| | | | | | NSL | | | JFR | | | JRO | | | JSD | |
Tax cost of swaps | | | | | | $ | — | | | $ | — | | | $ | — | | | $ | (274,831 | ) |
Net unrealized appreciation (depreciation) of swaps | | | | | | | (167,345 | ) | | | 508,221 | | | | 318,964 | | | | — | |
113
Notes to Financial Statements(continued)
Permanent differences, primarily due to bond premium amortization adjustments, treatment of notional principal contracts, nondeductible offering costs, foreign currency transactions, investments in partnerships, distressed PIK bond adjustments and federal taxes paid, resulted in reclassifications among the Funds’ components of common share net assets as of July 31, 2019, the Funds’ tax year end.
The tax components of undistributed net ordinary income and net long-term capital gains as of July 31, 2019, the Funds’ tax year end, were as follows:
| | | | | | | | | | | | | | | | | | | | |
| | | NSL | | | JFR | | | JRO | | | JSD | | | JQC | |
Undistributed net ordinary income1 | | $ | 4,332,922 | | | $ | 7,722,320 | | | $ | 5,019,104 | | | $ | 1,868,300 | | | $ | — | |
Undistributed net long-term capital gains | | | — | | | | — | | | | — | | | | — | | | | — | |
|
1 Undistributed net ordinary income (on a tax basis) has not been reduced for the dividend declared on July 1, 2019, paid on August 1, 2019. Net ordinary income consists of net taxable income derived from dividends, interest and net short-term capital gains, if any. | |
The tax character of distributions paid during the Funds’ tax years ended July 31, 2019 and July 31, 2018 was designated for purposes of the dividends paid deduction as follows:
| | | | | | | | | | | | | | | | | | | | |
| 2019 | | NSL | | | JFR | | | JRO | | | JSD | | | JQC | |
Distributions from net ordinary income2 | | $ | 17,503,719 | | | $ | 45,612,741 | | | $ | 32,437,791 | | | $ | 13,396,971 | | | $ | 71,825,427 | |
Distributions from net long-term capital gains | | | — | | | | — | | | | — | | | | — | | | | — | |
Return of capital | | | — | | | | — | | | | — | | | | — | | | | 42,792,971 | |
| | | | | |
| 2018 | | NSL | | | JFR | | | JRO | | | JSD | | | JQC | |
Distributions from net ordinary income2 | | $ | 18,645,372 | | | $ | 48,769,652 | | | $ | 35,379,514 | | | $ | 13,766,120 | | | $ | 74,671,845 | |
Distributions from net long-term capital gains | | | — | | | | — | | | | — | | | | — | | | | — | |
Return of capital | | | — | | | | — | | | | — | | | | — | | | | — | |
| 2 | Net ordinary income consists of net taxable income derived from dividends, interest, and net short-term capital gains, if any. |
As of July 31, 2019, the Funds’ tax year end, the Funds had unused capital losses carrying forward available for federal income tax purposes to be applied against future capital gains, if any. The capital losses are not subject to expiration.
| | | | | | | | | | | | | | | | | | | | |
| | | NSL | | | JFR | | | JRO | | | JSD | | | JQC | |
Not subject to expiration: | | | | | | | | | | | | | | | | | | | | |
Short-term | | $ | 362,113 | | | $ | 1,044,180 | | | $ | 909,941 | | | $ | 759,857 | | | $ | 15,496,811 | |
Long-term | | | 20,553,514 | | | | 45,317,913 | | | | 35,573,406 | | | | 12,420,287 | | | | 118,937,369 | |
Total | | $ | 20,915,627 | | | $ | 46,362,093 | | | $ | 36,483,347 | | | $ | 13,180,144 | | | $ | 134,434,180 | |
7. Management Fees
Each Fund’s management fee compensates the Adviser for overall investment advisory and administrative services and general office facilities. Symphony is compensated for its services to the Funds from the management fees paid to the Adviser.
Each Fund’s management fee consists of two components – a fund-level fee, based only on the amount of assets within each individual Fund, and a complex-level fee, based on the aggregate amount of all eligible fund assets managed by the Adviser. This pricing structure enables Fund shareholders to benefit from growth in the assets within their respective Fund as well as from growth in the amount of complex-wide assets managed by the Adviser.
The annual fund-level fee, payable monthly, for each Fund is calculated according to the following schedule:
| | | | | | | | |
| Average Daily Managed Assets* | | NSL JFR JRO JSD
Fund-Level Fee Rate | | | JQC
Fund-Level Fee Rate | |
For the first $500 million | | | 0.6500 | % | | | 0.6800 | % |
For the next $500 million | | | 0.6250 | | | | 0.6550 | |
For the next $500 million | | | 0.6000 | | | | 0.6300 | |
For the next $500 million | | | 0.5750 | | | | 0.6050 | |
For managed assets over $2 billion | | | 0.5500 | | | | 0.5800 | |
114
The annual complex-level fee, payable monthly, for each Fund is calculated by multiplying the current complex-wide fee rate, determined according to the following schedule by the Funds’ daily managed assets:
| | | | |
| Complex-Level Eligible Asset Breakpoint Level* | | Effective Complex-Level Fee Rate at Breakpoint Level | |
$55 billion | | | 0.2000 | % |
$56 billion | | | 0.1996 | |
$57 billion | | | 0.1989 | |
$60 billion | | | 0.1961 | |
$63 billion | | | 0.1931 | |
$66 billion | | | 0.1900 | |
$71 billion | | | 0.1851 | |
$76 billion | | | 0.1806 | |
$80 billion | | | 0.1773 | |
$91 billion | | | 0.1691 | |
$125 billion | | | 0.1599 | |
$200 billion | | | 0.1505 | |
$250 billion | | | 0.1469 | |
$300 billion | | | 0.1445 | |
| * | For the complex-level fees, managed assets include closed-end fund assets managed by the Adviser that are attributable to certain types of leverage. For these purposes, leverage includes the funds’ use of preferred stock and borrowings and certain investments in the residual interest certificates (also called inverse floating rate securities) in tender option bond (TOB) trusts, including the portion of assets held by a TOB trust that has been effectively financed by the trust’s issuance of floating rate securities, subject to an agreement by the Adviser as to certain funds to limit the amount of such assets for determining managed assets in certain circumstances. The complex-level fee is calculated based upon the aggregate daily managed assets of all Nuveen open-end and closed-end funds that constitute ‘’eligible assets.” Eligible assets do not include assets attributable to investments in other Nuveen funds or assets in excess of a determined amount (originally $2 billion) added to the Nuveen fund complex in connection with the Adviser’s assumption of the management of the former First American Funds effective January 1, 2011. As of July 31, 2019, the complex-level fee for each Fund was 0.1573%. |
8. Senior Loan Commitments
Unfunded Commitments
Pursuant to the terms of certain of the variable rate senior loan agreements, the Funds may have unfunded senior loan commitments. Each Fund will maintain with its custodian, cash, liquid securities and/or liquid senior loans having an aggregate value at least equal to the amount of unfunded senior loan commitments. As of the end of the reporting period, the following Funds’ outstanding unfunded senior loan commitments were as follows:
| | | | | | | | | | | | | | | | |
| | | NSL | | | JFR | | | JRO | | | JSD | |
Outstanding unfunded senior loan commitments | | $ | 10,302 | | | $ | 21,975 | | | $ | 13,220 | | | $ | 10,302 | |
Participation Commitments
With respect to the senior loans held in each Fund’s portfolio, the Funds may: 1) invest in assignments; 2) act as a participant in primary lending syndicates; or 3) invest in participations. If a Fund purchases a participation of a senior loan interest, the Fund would typically enter into a contractual agreement with the lender or other third party selling the participation, rather than directly with the borrower. As such, the Fund not only assumes the credit risk of the borrower, but also that of the selling participant or other persons interpositioned between the Fund and the borrower. As of the end of the reporting period, the Funds had no such outstanding participation commitments.
9. Fund Leverage
Borrowings
Each Fund has entered into a borrowing arrangement (“Borrowings”) as a means of leverage.
Borrowings Information for NSL, JFR and JRO
The following Funds have entered into a revolving credit and security agreement with certain banks and their affiliates. As of the end of the reporting period, each Fund’s maximum commitment amount under its Borrowings is as follows:
| | | | | | | | | | | | |
| | | NSL | | | JFR | | | JRO | |
Maximum commitment amount | | $ | 115,000,000 | | | $ | 290,000,000 | | | $ | 195,000,000 | |
115
Notes to Financial Statements(continued)
As of the end of the reporting period, each Fund’s outstanding balance on its Borrowings was as follows:
| | | | | | | | | | | | |
| | | NSL | | | JFR | | | JRO | |
Outstanding balance on Borrowings | | $ | 114,000,000 | | | $ | 264,500,000 | | | $ | 178,800,000 | |
For NSL, interest is charged at a rate equal to the higher of (a) 1-Month LIBOR (London Inter-Bank Offered Rate) plus 0.75% (0.80% prior to January 28, 2019) or (b) the Federal Funds rate plus 0.75% (0.80% prior to January 28, 2019). For JFR and JRO, interest is charged at a rate equal to1-Month LIBOR (London Inter-Bank Offered Rate) plus 0.80%. NSL accrues 0.15% per annum on the undrawn balance if it is less than 50% of the maximum commitment amount; however, if the undrawn portion of the Borrowings is greater than 50% of the maximum commitment amount the Fund will accrue 0.25% per annum on the undrawn portion. JFR accrues 0.25% per annum on the undrawn balance if the undrawn portion of the Borrowings on a particular day is more than 20% of the maximum commitment amount. JRO accrues 0.30% per annum on the undrawn balance if the undrawn portion of the Borrowings on a particular day is more than 10% of the maximum commitment amount. NSL and JRO also accrued an upfront fee of 0.05% and 0.025% per annum on the maximum commitment amount, respectively.
On December 21, 2018, JFR and JRO renewed their Borrowings through December 20, 2019. On January 28, 2019, NSL renewed its Borrowings through January 27, 2020. Interest charged on NSL’s Borrowings was changed to the higher of (a) 1-Month LIBOR plus 0.75% or (b) the Federal Funds rate plus 0.75%. All other items of the Borrowings remain unchanged.
During the current fiscal period, the average daily balance outstanding and average annual interest rate on each Fund’s Borrowings were as follows:
| | | | | | | | | | | | |
| | | NSL | | | JFR | | | JRO | |
Average daily balance outstanding | | $ | 114,000,000 | | | $ | 261,509,863 | | | $ | 178,800,000 | |
Average annual interest rate | | | 3.14 | % | | | 3.16 | % | | | 3.17 | % |
Borrowings Information for JSD
The Fund has outstanding a 364-day revolving line of credit. As of the end of the reporting period, the Fund’s maximum commitment amount under its Borrowings is as follows:
| | | | |
| | | JSD | |
Maximum commitment amount | | $ | 75,000,000 | |
As of the end of the reporting period, the Fund’s outstanding balance on its Borrowings was as follows:
| | | | |
| | | JSD | |
Outstanding balance on Borrowings | | $ | 72,000,000 | |
Interest is charged on these Borrowings at a rate per annum equal to 1-Month LIBOR plus 0.80%. The Fund also accrued 0.15% per annum on the undrawn portion if it was less than 50% of the maximum commitment; however, if the undrawn portion of the Borrowings was greater than 50% of the maximum commitment amount the Fund accrued a 0.25% per annum on the undrawn portion of the Borrowings.
On October 31, 2018, JSD renewed its Borrowings through October 30, 2019. The Fund also accrued an upfront fee of 0.05% per annum on the maximum commitment amount. All other items of the Borrowings remain unchanged.
During the current fiscal period, the average daily balance outstanding and average annual interest rate on the Fund’s Borrowings were as follows:
| | | | |
| | | JSD | |
Average daily balance outstanding | | $ | 72,000,000 | |
Average annual interest rate | | | 3.16 | % |
Borrowings Information for JQC
The Fund has entered into a borrowing agreement with a bank and its affiliate. As of the end of the reporting period, the Fund’s maximum commitment amount under its Borrowings is as follows:
| | | | |
| | | JQC | |
Maximum commitment amount | | $ | 505,000,000 | |
As of the end of the reporting period, the Fund’s outstanding balance on its Borrowings was as follows:
| | | | |
| | | JQC | |
Outstanding balance on Borrowings | | $ | 480,000,000 | |
116
For the period August 1, 2018 to September 11, 2018, the interest was charged on these Borrowings at a rate per annum equal to 3-Month LIBOR plus 1.15%. The Fund also accrued 1.15% per annum on any positive difference between 90% of the maximum commitment amount and the daily drawn amount.
On September 11, 2018, JQC amended its borrowings. Interest is charged on the Borrowings at a rate per annum equal to the 3-Month LIBOR plus 1.10%. The Fund also accrues 1.10% per annum on any positive difference between 90% of the maximum commitment amount and the daily drawn amount. All other items remain unchanged.
During the current fiscal period, the average daily balance outstanding and average annual interest rate on the Fund’s Borrowings were as follows:
| | | | |
| | | JQC | |
Average daily balance outstanding | | $ | 495,602,740 | |
Average annual interest rate | | | 3.63 | % |
Other Borrowings Information for the Funds
In order to maintain their Borrowings, the Funds must meet certain collateral, asset coverage and other requirements. Each Fund’s Borrowings outstanding is fully secured by eligible securities held in its portfolio of investments.
Each Funds’ Borrowings outstanding is recognized as “Borrowings” on the Statement of Assets and Liabilities. Interest expense incurred on the borrowed amount, undrawn balance and initial fees are recognized as a component of “Interest expense and amortization of offering costs” on the Statement of Operations.
Reverse Repurchase Agreements
During the current fiscal period, JQC used reverse repurchase agreements as a means of leverage.
In a reverse repurchase agreement, the Fund sells to the counterparty a security that it holds with a contemporaneous agreement to repurchase the same security at an agreed-upon price and date, with the Fund retaining the risk of loss that is associated with that security. The Fund will pledge assets determined to be liquid by the Adviser to cover its obligations under reverse repurchase agreements. Securities sold under reverse repurchase agreements are recorded as a liability and recognized as “Reverse repurchase agreements” on the Statement of Assets and Liabilities.
Payments made on reverse repurchase agreements are recognized as a component of “Interest expense and amortization of offering costs” on the Statement of Operations.
As of the end of the reporting period, the Fund’s outstanding balances on its reverse repurchase agreements were as follows:
| | | | | | | | | | | | | | | | | | | | |
| Counterparty | | Rate | | | Principal
Amount | | | Maturity* | | | Value | | | Value and
Accrued Interest | |
Societe Generale | | | 3-Month LIBOR plus 0.75 | % | | $ | (213,000,000 | ) | | | 4/15/20 | | | $ | (213,000,000 | ) | | $ | (213,622,450 | ) |
| * | The Fund may repurchase the reverse repurchase agreement prior to the maturity date and/or counterparty may accelerate maturity upon pre-specified advance notice. |
During the current fiscal period, the average daily balance outstanding and average interest rate on the Fund’s reverse repurchase agreements were as follows:
| | | | |
| | | JQC | |
Average daily balance outstanding | | | $194,890,411 | |
Average interest rate | | | 3.32 | % |
The following table presents the reverse repurchase agreements subject to netting agreements and the collateral delivered related to those reverse repurchase agreements.
| | | | | | | | | | | | |
| Counterparty | | Reverse Repurchase
Agreements* | | | Collateral Pledged
to Counterparty** | | | Net
Exposure | |
Societe Generale | | $ | (213,622,450 | ) | | $ | 213,622,450 | | | $ | — | |
| * | Represents gross value and accrued interest for the counterparty as reported in the preceding table. |
| ** | As of the end of the reporting period, the value of the collateral pledged to the counterparty exceeded the value of the reverse repurchase agreements. |
117
Notes to Financial Statements(continued)
10. Inter-Fund Lending
The SEC has granted an exemptive order permitting registeredopen-end andclosed-end Nuveen funds to participate in an inter-fund lending facility whereby the Nuveen funds may directly lend to and borrow money from each other for temporary purposes (e.g., to satisfy redemption requests or when a sale of securities “fails,” resulting in an unanticipated cash shortfall) (the “Inter-Fund Program”). Theclosed-end Nuveen funds, including the Funds covered by this shareholder report, will participate only as lenders, and not as borrowers, in the Inter-Fund Program because suchclosed-end funds rarely, if ever, need to borrow cash to meet redemptions. The Inter-Fund Program is subject to a number of conditions, including, among other things, the requirements that (1) no fund may borrow or lend money through the Inter-Fund Program unless it receives a more favorable interest rate than is typically available from a bank or other financial institution for a comparable transaction; (2) no fund may borrow on an unsecured basis through the Inter-Fund Program unless the fund’s outstanding borrowings from all sources immediately after the inter-fund borrowing total 10% or less of its total assets; provided that if the borrowing fund has a secured borrowing outstanding from any other lender, including but not limited to another fund, the inter-fund loan must be secured on at least an equal priority basis with at least an equivalent percentage of collateral to loan value; (3) if a fund’s total outstanding borrowings immediately after an inter-fund borrowing would be greater than 10% of its total assets, the fund may borrow through the inter-fund loan on a secured basis only; (4) no fund may lend money if the loan would cause its aggregate outstanding loans through the Inter-Fund Program to exceed 15% of its net assets at the time of the loan; (5) a fund’s inter-fund loans to any one fund shall not exceed 5% of the lending fund’s net assets; (6) the duration of inter-fund loans will be limited to the time required to receive payment for securities sold, but in no event more than seven days; and (7) each inter-fund loan may be called on one business day’s notice by a lending fund and may be repaid on any day by a borrowing fund. In addition, a Nuveen fund may participate in the Inter-Fund Program only if and to the extent that such participation is consistent with the fund’s investment objective and investment policies. The Board is responsible for overseeing the Inter-Fund Program.
The limitations detailed above and the other conditions of the SEC exemptive order permitting the Inter-Fund Program are designed to minimize the risks associated with Inter-Fund Program for both the lending fund and the borrowing fund. However, no borrowing or lending activity is without risk. When a fund borrows money from another fund, there is a risk that the loan could be called on one day’s notice or not renewed, in which case the fund may have to borrow from a bank at a higher rate or take other actions to payoff such loan if an inter-fund loan is not available from another fund. Any delay in repayment to a lending fund could result in a lost investment opportunity or additional borrowing costs.
During the current reporting period, none of the Funds covered by this shareholder report have entered into any inter-fund loan activity.
11. New Accounting Pronouncements
Disclosure Update and Simplification
During August 2018, the SEC issued Final Rule ReleaseNo. 33-10532, Disclosure Update and Simplification (“Final Rule ReleaseNo. 33-10532”). Final Rule ReleaseNo. 33-10532 amends certain financial statement disclosure requirements to conform to U.S. GAAP. The amendments to Rule6-04.17 of RegulationS-X (balance sheet) remove the requirement to separately state the book basis components of net assets: undistributed (over-distribution of) net investment income (“UNII”), accumulated undistributed net realized gains (losses), and net unrealized appreciation (depreciation) at the balance sheet date. Instead, consistent with U.S. GAAP, funds will be required to disclose total distributable earnings. The amendments to Rule6-09 of RegulationS-X (statement of changes in net assets) remove the requirement to separately state the sources of distributions paid. Instead, consistent with U.S. GAAP, funds will be required to disclose the total amount of distributions paid, except that any tax return of capital must be separately disclosed. The amendments also remove the requirement to parenthetically state the book basis amount of UNII on the statement of changes in net assets.
The requirements of Final Rule ReleaseNo. 33-10532 are effective November 5, 2018, and the Funds’ Statement of Assets and Liabilities and Statement of Changes in Net Assets for the current reporting period have been modified accordingly. In addition, certain amounts within each Fund’s Statement of Changes in Net Assets for the prior fiscal period have been modified to conform to Final Rule ReleaseNo. 33-10532.
For the prior fiscal period, the total amount of distributions paid to shareholders from net investment income and from accumulated net realized gains, if any, are recognized as “Dividends” on the Statement of Changes in Net Assets.
As of July 31, 2018, the Funds’ Statement of Changes in Net Assets reflected the following UNII balances.
| | | | | | | | | | | | | | | | | | | | |
| | | NSL | | | JFR | | | JRO | | | JSD | | | JQC | |
UNII at the end of period | | $ | 492,596 | | | $ | (6,939,292 | ) | | $ | (4,665,678 | ) | | $ | (1,022,611 | ) | | $ | (21,887,770 | ) |
FASB Accounting Standards Update (“ASU”)2017-08 (“ASU2017-08”) Premium Amortization on Purchased Callable Debt Securities
The FASB has issued ASU2017-08, which shortens the premium amortization period for purchasednon-contingently callable debt securities. ASU2017-08 specifies that the premium amortization period ends at the earliest call date, for purchasednon-contingently callable debt securities. ASU2017-08 is effective for fiscal years, and interim periods within those fiscal years, beginning after December 15, 2018. Management is currently evaluating the implications of ASU2017-08, if any.
118
Fair Value Measurement: Disclosure Framework
During August 2018, the FASB issued ASU 2018-13 (“ASU 2018-13”),Fair Value Measurement: Disclosure Framework – Changes to the Disclosure Requirements for Fair Value Measurements. ASU 2018-13 modifies the disclosures required by Topic 820, Fair Value Measurements. The amendments in ASU 2018-13 are effective for all entities for fiscal years, and interim periods within those fiscal years, beginning after December 15, 2019. During the current reporting period, management early implemented this guidance. This implementation did not have a material impact on the Funds’ financial statements.
12. Subsequent Events
Complex-Level Management Fee
Effective August 1, 2019 (subsequent to the close of the reporting period), “eligible assets” of the complex-level management fee will include certain assets of certain Nuveen funds that were reorganized into funds advised by an affiliate of the Adviser during the 2019 calendar year.
Borrowings
During September 2019, JQC decreased the outstanding balance on its Borrowings to $460,000,000.
119
Additional Fund Information(Unaudited)
| | | | | | | | | | |
| Board of Trustees | | | | | | | | | | |
| Margo Cook* | | Jack B. Evans | | William C. Hunter | | Albin F. Moschner | | John K. Nelson | | |
| Judith M. Stockdale | | Carole E. Stone | | Terence J. Toth | | Margaret L Wolff | | Robert L. Young | | |
| * | Interested Board Member. |
| | | | | | | | |
| | | | | |
Fund Manager Nuveen Fund Advisors, LLC 333 West Wacker Drive Chicago, IL 60606 | | Custodian State Street Bank
& Trust Company One Lincoln Street Boston, MA 02111 | | Legal Counsel Chapman and Cutler LLP Chicago, IL 60603 | | Independent Registered
Public Accounting Firm KPMG LLP 200 East Randolph Street Chicago, IL 60601 | | Transfer Agent and
Shareholder Services Computershare Trust Company, N.A. 250 Royall Street Canton, MA 02021 (800) 257-8787 |
Distribution Information
The Funds hereby designate their percentages of dividends paid from net ordinary income as dividends qualifying as Interest-Related Dividends and/or short-term capital gain dividends as defined in the Internal Revenue Code Section 871(k) for the taxable year ended July 31, 2019:
| | | | | | | | | | | | | | | | | | | | |
| | | NSL | | | JFR | | | JRO | | | JSD | | | JQC | |
% of Interest-Related Dividends for the period August 1, 2018 through December 31, 2018 | | | 83.9% | | | | 81.0% | | | | 82.4% | | | | 83.3% | | | | 86.4% | |
% of Interest-Related Dividends for the period January 1, 2019 through July 31, 2019 | | | 82.9% | | | | 82.6% | | | | 83.1% | | | | 85.8% | | | | 86.4% | |
Portfolio of Investments Information
Each Fund is required to file its complete schedule of portfolio holdings with the Securities and Exchange Commission (SEC) for the first and third quarters of each fiscal year as an exhibit to its report on Form N-PORT. You may obtain this information on the SEC’s website at http://www.sec.gov.
Nuveen Funds’ Proxy Voting Information
You may obtain (i) information regarding how each fund voted proxies relating to portfolio securities held during the most recent twelve-month period ended June 30, without charge, upon request, by calling Nuveen toll-free at (800) 257-8787 or on Nuveen’s website at www.nuveen.com and (ii) a description of the policies and procedures that each fund used to determine how to vote proxies relating to portfolio securities without charge, upon request, by calling Nuveen toll free at (800) 257-8787. You may also obtain this information directly from the SEC. Visit the SEC on-line at http://www.sec.gov.
CEO Certification Disclosure
Each Fund’s Chief Executive Officer (CEO) has submitted to the New York Stock Exchange (NYSE) the annual CEO certification as required by Section 303A.12(a) of the NYSE Listed Company Manual. Each Fund has filed with the SEC the certification of its CEO and Chief Financial Officer required by Section 302 of theSarbanes-Oxley Act.
Common Share Repurchases
Each Fund intends to repurchase, through its open market share repurchase program, shares of its own common stock at such times and in such amounts as is deemed advisable. During the period covered by this report, each Fund repurchased shares of its common stock, as shown in the accompanying table. Any future repurchases will be reported to shareholders in the next annual or semi-annual report.
| | | | | | | | | | | | | | | | | | | | |
| | | NSL | | | JFR | | | JRO | | | JSD | | | JQC | |
Common shares repurchased | | | 10,400 | | | | — | | | | 20,000 | | | | — | | | | 157,700 | |
FINRA BrokerCheck
The Financial Industry Regulatory Authority (FINRA) provides information regarding the disciplinary history of FINRA member firms and associated investment professionals. This information as well as an investor brochure describing FINRA BrokerCheck is available to the public by calling the FINRA BrokerCheck Hotline number at (800) 289-9999 or by visiting www.FINRA.org.
120
Glossary of Terms Used in this Report
(Unaudited)
| ∎ | | Average Annual Total Return: This is a commonly used method to express an investment’s performance over a particular, usually multi-year time period. It expresses the return that would have been necessary each year to equal the investment’s actual cumulative performance (including change in NAV or offer price and reinvested dividends and capital gains distributions, if any) over the time period being considered. |
| ∎ | | Collateralized Loan Obligation (CLO): A security backed by a pool of debt, often low rated corporate loans. Collateralized loan obligations (CLOs) are similar to collateralized mortgage obligations, except for the different type of underlying loan. |
| ∎ | | Convexity: A tool used in risk management to measure the sensitivity of bond duration to interest rate changes. Higher convexity generally means higher sensitivity to interest rate changes. |
| ∎ | | Credit Suisse Leveraged Loan Index: A representative, unmanaged index of tradeable, senior, U.S. dollar-denominated leveraged loans. Index returns assume reinvestment of distributions, but do not include the effects of any applicable sales charges or management fees. |
| ∎ | | Effective Leverage: Effective leverage is a fund’s effective economic leverage, and includes both regulatory leverage (see below) and the leverage effects of certain derivative investments in the fund’s portfolio. |
| ∎ | | Gross Domestic Product (GDP):The total market value of all final goods and services produced in a country/region in a given year, equal to total consumer, investment and government spending, plus the value of exports, minus the value of imports. |
| ∎ | | ICE BofAML U.S. High Yield Index: An index that tracks the performance of U.S. dollar denominated below investment grade corporate debt publicly issued in the U.S. domestic market. Index returns assume reinvestment of distributions, but do not include the effects of any applicable sales charges or management fees. |
| ∎ | | Leverage: Leverage is created whenever a fund has investment exposure (both reward and/or risk) equivalent to more than 100% of the investment capital. |
| ∎ | | Net Asset Value (NAV) Per Share: A fund’s Net Assets is equal to its total assets (securities, cash, accrued earnings and receivables) less its total liabilities. NAV per share is equal to the fund’s Net Assets divided by its number of shares outstanding. |
| ∎ | | Regulatory Leverage: Regulatory leverage consists of preferred shares issued by or borrowings of a fund. Both of these are part of a fund’s capital structure. Regulatory leverage is subject to asset coverage limits set forth in the Investment Company Act of 1940. |
121
Reinvest Automatically, Easily and Conveniently
Nuveen makes reinvesting easy. A phone call is all it takes to set up your reinvestment account.
Your Nuveen Closed-End Funds Automatic Reinvestment Plan
Nuveen Closed-End Fund allows you to conveniently reinvest distributions in additional Fund shares.
By choosing to reinvest, you’ll be able to invest money regularly and automatically, and watch your investment grow through the power of compounding. Just like distributions in cash, there may be times when income or capital gains taxes may be payable on distributions that are reinvested.
It is important to note that an automatic reinvestment plan does not ensure a profit, nor does it protect you against loss in a declining market.
Easy and convenient
To make recordkeeping easy and convenient, each quarter you’ll receive a statement showing your total distributions, the date of investment, the shares acquired and the price per share, and the total number of shares you own.
How shares are purchased
The shares you acquire by reinvesting will either be purchased on the open market or newly issued by the Fund. If the shares are trading at or above net asset value at the time of valuation, the Fund will issue new shares at the greater of the net asset value or 95% of the then-current market price. If the shares are trading at less than net asset value, shares for your account will be purchased on the open market. If the Plan Agent begins purchasing Fund shares on the open market while shares are trading below net asset value, but the Fund’s shares subsequently trade at or above their net asset value before the Plan Agent is able to complete its purchases, the Plan Agent may cease open-market purchases and may invest the uninvested portion of the distribution in newly-issued Fund shares at a price equal to the greater of the shares’ net asset value or 95% of the shares’ market value on the last business day immediately prior to the purchase date. Distributions received to purchase shares in the open market will normally be invested shortly after the distribution payment date. No interest will be paid on distributions awaiting reinvestment. Because the market price of the shares may increase before purchases are completed, the average purchase price per share may exceed the market price at the time of valuation, resulting in the acquisition of fewer shares than if the distribution had been paid in shares issued by the Fund. A pro rata portion of any applicable brokerage commissions on open market purchases will be paid by Plan participants. These commissions usually will be lower than those charged on individual transactions.
Flexible
You may change your distribution option or withdraw from the Plan at any time, should your needs or situation change.
You can reinvest whether your shares are registered in your name, or in the name of a brokerage firm, bank, or other nominee. Ask your investment advisor if his or her firm will participate on your behalf. Participants whose shares are registered in the name of one firm may not be able to transfer the shares to another firm and continue to participate in the Plan.
The Fund reserves the right to amend or terminate the Plan at any time. Although the Fund reserves the right to amend the Plan to include a service charge payable by the participants, there is no direct service charge to participants in the Plan at this time.
Call today to start reinvesting distributions
For more information on the Nuveen Automatic Reinvestment Plan or to enroll in or withdraw from the Plan, speak with your financial advisor or call us at (800) 257-8787.
122
Annual Investment Management Agreement Approval Process
(Unaudited)
At a meeting held onMay 21-23, 2019 (the“May Meeting”), the Board of Trustees (each, a“Board” and each Trustee, a“Board Member”) of each Fund, including the Board Members who are not “interested persons” (as defined under the Investment Company Act of 1940 (the“1940 Act”)) (the“Independent Board Members”), approved, for its respective Fund, the renewal of the management agreement (each, an“Investment Management Agreement”) with Nuveen Fund Advisors, LLC (the“Adviser”) pursuant to which the Adviser serves as investment adviser to such Fund and thesub-advisory agreement (each, a“Sub-Advisory Agreement”) with Symphony Asset Management LLC (the“Sub-Adviser”) pursuant to which theSub-Adviser serves as thesub-adviser to such Fund. Following an initialtwo-year period, the Board, including the Independent Board Members, is required under the 1940 Act to review and approve each Investment Management Agreement andSub-Advisory Agreement on behalf of the applicable Fund on an annual basis. The Investment Management Agreements andSub-Advisory Agreements are collectively referred to as the“Advisory Agreements”and the Adviser and theSub-Adviser are collectively, the“Fund Advisers” and each, a“Fund Adviser.”
In response to a request on behalf of the Independent Board Members by independent legal counsel, the Board received and reviewed prior to the May Meeting extensive materials specifically prepared for the annual review of Advisory Agreements by the Adviser as well as by Broadridge Financial Solutions, Inc. (“Broadridge”), an independent provider of investment company data. The materials provided in connection with the annual review covered a breadth of subject matter including, but not limited to, a description of the nature, extent and quality of services provided by the Fund Advisers; a review of theSub-Adviser and investment team; an analysis of fund performance in absolute terms and as compared to the performance of certain peer funds and benchmarks with a focus on any performance outliers; an analysis of the fees and expense ratios of the Nuveen funds in absolute terms and as compared to those of certain peer funds with a focus on any expense outliers; a description of portfolio manager compensation; a review of the secondary market trading of shares of the Nuveenclosed-end funds (including, among other things, an analysis of performance, distribution and valuation and capital raising trends in the broaderclosed-end fund market and in particular with respect to Nuveenclosed-end funds; a review of the leverage management actions taken on behalf of the Nuveenclosed-end funds and their resulting impact on performance; and a description of the distribution management process and any capital management activities); a review of the performance of various service providers; a description of various initiatives Nuveen had undertaken or continued during the year for the benefit of particular fund(s) and/or the complex; a description of the profitability or financial data of Nuveen and theSub-Adviser; and a description of indirect benefits received by the Fund Advisers as a result of their relationships with the Nuveen funds. The Board Members held anin-person meeting onApril 17-18, 2019 (the“April Meeting”), in part, to review and discuss the performance of the Nuveen funds and the Adviser’s evaluation of the varioussub-advisers to the Nuveen funds. The Independent Board Members asked questions and requested additional information that was provided for the May Meeting.
The information prepared specifically for the annual review of the Advisory Agreements supplemented the information provided to the Board and its committees throughout the year. The Board and its committees met regularly during the year and the information provided and topics discussed were relevant to the review of the Advisory Agreements. Some of these reports and other data included, among other things, materials that outlined the investment performance of the Nuveen funds; strategic plans of the Adviser which may impact the services it provides to the Nuveen funds; the review of the Nuveen funds and applicable investment teams; the management of leverage financing forclosed-end funds; the secondary market trading of theclosed-end funds and any actions to address discounts; compliance, regulatory and risk management matters; the trading practices of the varioussub-advisers; valuation of securities; fund expenses; and overall market and regulatory developments. The Board further continued its practice of seeking to meet periodically with the varioussub-advisers to the Nuveen funds and their investment teams, when feasible. The Independent Board Members considered the review of the Advisory Agreements to be an ongoing process and employed the accumulated information, knowledge, and experience the Board Members had gained during their tenure on the boards governing the Nuveen funds and working with the Fund Advisers in their review of the Advisory Agreements. The contractual arrangements are a result of multiple years of review, negotiation and information provided in connection with the boards’ annual review of the Nuveen funds’ advisory arrangements and oversight of the Nuveen funds.
123
Annual Investment Management Agreement Approval Process(continued)
(Unaudited)
The Independent Board Members were advised by independent legal counsel during the annual review process as well as throughout the year, including meeting in executive sessions with such counsel at which no representatives from the Adviser or theSub-Adviser were present. In connection with their annual review, the Independent Board Members also received a memorandum from independent legal counsel outlining their fiduciary duties and legal standards in reviewing the Advisory Agreements.
In deciding to renew the Advisory Agreements, the Independent Board Members did not identify a particular factor or information as determinative or controlling, but rather the decision reflected the comprehensive consideration of all the information provided, and each Board Member may have attributed different levels of importance to the various factors and information considered in connection with the approval process. The following summarizes the principal factors and information, but not all the factors, the Board considered in deciding to renew the Advisory Agreements and its conclusions.
| A. | | Nature, Extent and Quality of Services |
In evaluating the renewal of the Advisory Agreements, the Independent Board Members received and considered information regarding the nature, extent and quality of the applicable Fund Adviser’s services provided to the respective Fund with particular focus on the services and enhancements to such services provided during the last year. The Board recognized that the Adviser provides a comprehensive set of services necessary to operate the Nuveen funds in a highly regulated industry and noted that the scope of such services has expanded over the years as a result of regulatory, market and other developments, such as the development of the liquidity management program and expanded compliance programs. Some of the functions the Adviser is responsible for include, but are not limited to: product management (such as analyzing a fund’s position in the marketplace, setting dividends, preparing shareholder and intermediary communications and other due diligence support); investment oversight (such as analyzing fund performance,sub-advisers and investment teams and analyzing trade executions of portfolio transactions, soft dollar practices and securities lending activities); securities valuation services (such as executing the daily valuation process for portfolio securities and developing and recommending changes to valuation policies and procedures); risk management (such as overseeing operational and investment risks, including stress testing); fund administration (such as preparing fund tax returns and other tax compliance services, overseeing the Nuveen funds’ independent public accountants and other service providers; managing fund budgets and expenses; and helping to fulfill the funds’ regulatory filing requirements); oversight of shareholder services and transfer agency functions (such as oversight and liaison of transfer agent service providers which include registered shareholder customer service and transaction processing); Board relations services (such as organizing and administering Board and committee meetings, preparing various reports to the Board and committees and providing other support services); compliance and regulatory oversight services (such as developing and maintaining a compliance program to ensure compliance with applicable laws and regulations, monitoring compliance with applicable fund policies and procedures and adherence to investment restrictions, and evaluating the compliance programs of the Nuveen fundsub-advisers and certain other service providers); legal support and oversight of outside law firms (such as with respect to filing and updating registration statements; maintaining various regulatory registrations; and providing legal interpretations regarding fund activities, applicable regulations and implementation of policies and procedures); and leverage, capital and distribution management services. In reviewing the scope and quality of services, the Board recognized the continued efforts and resources the Adviser and its affiliates have employed to continue to enhance their services for the benefit of the complex as well as particular Nuveen funds over recent years. Such service enhancements have included, but are not limited to:
| | • | | Fund Improvements and Product Management Initiatives – continuing to proactively manage the Nuveen fund complex as a whole and at the individual fund level with an aim to enhance the shareholder outcomes through, among other things, repositioning funds, merging funds, reviewing and updating investment policies and benchmarks, modifying the composition of certain portfolio management teams and analyzing various data to help devise such improvements; |
| | • | | Capital Initiatives –continuing to invest capital to support new funds with initial capital as well as to facilitate modifications to the strategies or structure of existing funds; |
| | • | | Compliance Program Initiatives– continuing efforts to enhance the compliance program through, among other things, internally integrating various portfolio management teams and aligning compliance support accordingly, completing a |
124
| | comprehensive review of existing policies and procedures and revising such policies and procedures as appropriate, enhancingcompliance-related technologies and workflows, and optimizing compliance shared services across the organization and affiliates; |
| | • | | Risk Management and Valuation Services – continuing efforts to strengthen the risk management functions, including through, among other things, enhancing the interaction and reporting between the investment risk management team and various affiliates, increasing the efficiency of risk monitoring performed on the Nuveen funds through improved reporting, continuing to implement risk programs designed to provide a more disciplined and consistent approach to identifying and mitigating operational risks, continuing progress on implementing a liquidity program that complies with the new liquidity regulatory requirements and continuing to oversee the daily valuation process; |
| | • | | Additional Compliance Services – continuing investment of time and resources necessary to develop the compliance policies and procedures and other related tools necessary to meet the various new regulatory requirements affecting the Nuveen funds that have been adopted over recent years; |
| | • | | Government Relations– continuing efforts of various Nuveen teams and affiliates to advocate and communicate their positions with lawmakers and other regulatory bodies on issues that will impact the Nuveen funds; |
| | • | | Business Continuity, Disaster Recovery and Information Services– establishing an information security program to help identify and manage information security risks, periodically testing disaster recovery plans, maintaining and updating business continuity plans and providing reports to the Board, at least annually, addressing, among other things, management’s security risk assessment, cyber risk profile, incident tracking and other relevant information technologyrisk-related reports; |
| | • | | Expanded Dividend Management Services – continuing to expand the services necessary to manage the dividends among the varying types of Nuveen funds that have developed as the Nuveen complex has grown in size and scope; and |
| | • | | with respect specifically toclosed-end funds, such initiatives also included: |
| | • | Leverage Management Services – continuing to actively manage leverage including developing new leverage instruments, refinancing existing leverage and negotiating reductions in associated leverage expenses; |
| | • | Capital Management Services – ongoing capital management efforts through a share repurchase program as well as a shelf offering program that raises additional equity capital in seeking to enhance shareholder value; |
| | • | Data and Market Analytics – continuing focus on analyzing data and market analytics to better understand the ownership cycles and secondary market experience ofclosed-end funds; and |
| | • | Closed-end Fund Investor Relations Program – maintaining theclosed-end fund investor relations program which, among other things, raises awareness, provides educational materials and cultivates advocacy forclosed-end funds and the Nuveenclosed-end fund product line. |
In addition to the services provided by the Adviser, the Board also considered the risks borne by the Adviser and its affiliates in managing the Nuveen funds, including entrepreneurial, operational, reputational, regulatory and litigation risks.
The Board further considered the division of responsibilities between the Adviser and theSub-Adviser and recognized that theSub-Adviser and its investment personnel generally are responsible for the management of each Fund’s portfolio. The Board noted that the Adviser oversees theSub-Adviser and considered an analysis of theSub-Adviser provided by the Adviser which included, among other things, theSub-Adviser’s assets under management and changes thereto, a summary of the investment team and changes thereto, the investment approach of the team and the performance of the Nuveen fundssub-advised by theSub-Adviser over various periods. The Board further considered at the May Meeting or prior meetings evaluations of theSub-Adviser’s compliance program and trade execution. The Board noted that the Adviser recommended the renewal of theSub-Advisory Agreements.
125
Annual Investment Management Agreement Approval Process(continued)
(Unaudited)
Based on its review, the Board determined, in the exercise of its reasonable business judgment, that it was satisfied with the nature, extent and quality of services provided to the respective Funds under each applicable Advisory Agreement.
| B. | | The Investment Performance of the Funds and Fund Advisers |
In evaluating the quality of the services provided by the Fund Advisers, the Board also received and considered the investment performance of the Nuveen funds they advise. In this regard, the Board reviewed Fund performance over the quarter,one-,three- and five-year periods ending December 31, 2018 as well as performance data for the first quarter of 2019 ending March 29, 2019. Unless otherwise indicated, the performance data referenced below reflects the periods ended December 31, 2018. The Board considered the Adviser’s analysis of each fund’s performance, with particular focus on funds that were considered performance outliers and the factors contributing to their performance. The Board also noted that it received performance data of the Nuveen funds during its quarterly meetings throughout the year and took into account the discussions that occurred at these Board meetings regarding fund performance. In this regard, in its evaluation of Nuveen fund performance at meetings throughout the year, the Board considered performance information for the funds for different time periods, both absolute and relative to appropriate benchmarks and peers, with particular attention to information indicating underperformance of the respective funds and discussed with the Adviser the reasons for such underperformance.
The Board reviewed both absolute and relative fund performance during the annual review. With respect to the latter, the Board considered fund performance in comparison to the performance of peer funds (the“Performance Peer Group”) and recognized and/or customized benchmarks (i.e., generally benchmarks derived from multiple recognized benchmarks). In considering performance data, the Board is aware of certain inherent limitations with such data, including that differences between the objective(s), strategies and other characteristics of the Nuveen funds compared to the respective Performance Peer Group and/or benchmark(s) (such as differences in the use of leverage) will necessarily contribute to differences in performance results and limit the value of the comparative information. To assist the Board in its review of the comparability of the relative performance, the Adviser has ranked the relevancy of the peer group to the funds as low, medium or high. Depending on the facts and circumstances, however, the Board may be satisfied with a fund’s performance notwithstanding that its performance may be below its benchmark or peer group for certain periods. In addition, the performance data may vary significantly depending on the end date selected, and shareholders may evaluate fund performance based on their own holding period which may differ from the performance periods reviewed by the Board leading to different results. Further, the Board considered a fund’s performance in light of the overall financial market conditions during the respective periods. As noted above, the Board reviewed, among other things, Nuveen fund performance over various periods ended December 31, 2018, and the Board was aware of the market decline in the fourth quarter of 2018 and considered performance from the first quarter of 2019 as well. The Board also noted that a shorter period of underperformance may significantly impact longer term performance.
In addition to the foregoing, the Board recognized the importance of secondary market trading to shareholders and considered the evaluation of premiums and discounts at which the shares of the Nuveenclosed-end funds trade to be a continuing priority for the Board. The Board and/or itsClosed-end Fund committee consider premium and discount data at each quarterly meeting throughout the year as well as during the annual review.
In their review of performance, the Independent Board Members focused, in particular, on the Adviser’s analysis of Nuveen funds determined to be underperforming performance outliers. The Board recognized that some periods of underperformance may only be temporary while other periods of underperformance may indicate a broader issue that may require a corrective action. Accordingly, with respect to any Nuveen funds for which the Board had identified performance issues, the Board monitors such funds closely until performance improves, discusses with the Adviser the reasons for such results, considers whether any steps are necessary or appropriate to address such issues, and reviews the results of any efforts undertaken.
The Board’s determinations with respect to each Fund are summarized below.
For Nuveen Senior Income Fund, the Board noted that the Fund ranked in the third quartile of its Performance Peer Group in theone-,three- andfive-year periods. In addition, the Fund outperformed its benchmark in thethree-year period, but the
126
Fund’s performance was below the performance of its benchmark in theone- andfive-year periods. The Board also noted that the Fund’s performance improved in the first quarter of 2019 with the Fund ranking in the second quartile for theone-year period and third quartile for thethree- andfive-year periods. The Board was satisfied with the Fund’s overall performance.
For Nuveen Floating Rate Income Fund,the Board noted that although the Fund ranked in the fourth quartile of its Performance Peer Group in theone-year period, the Fund ranked in the third quartile in thethree- andfive-year periods. In addition, the Fund outperformed its benchmark in thethree-year period, but the Fund’s performance was below the performance of its benchmark in theone- andfive-year periods. The Board, however, noted the Fund’s relative peer performance improved in the first quarter of 2019 with the Fund ranking in the third quartile of the Performance Peer Group for theone-,three-, andfive-year periods ended March 29, 2019. The Board was satisfied with the Fund’s overall performance.
For Nuveen Floating Rate Income Opportunity Fund, the Board noted that although the Fund ranked in the fourth quartile of its Performance Peer Group in theone-year period, the Fund ranked in the third quartile in thethree- andfive-year periods. In addition, the Fund outperformed its benchmark in thethree-year period, but the Fund’s performance was below the performance of its benchmark in theone- andfive-year periods. The Board, however, noted the Fund’s relative peer performance improved in the first quarter of 2019 with the Fund ranking in the second quartile of the Performance Peer Group for theone- andthree-year periods and third quartile for thefive-year period ended March 29, 2019. The Board was satisfied with the Fund’s overall performance.
For Nuveen Short Duration Credit Opportunities Fund, the Board noted that the Fund ranked in the third quartile of its Performance Peer Group for theone-year period and the second quartile in thethree- andfive-year periods. In addition, the Fund outperformed its benchmark in thethree-year period, but the Fund’s performance was below the benchmark for theone- andfive-year periods. The Board noted that the Fund’s performance improved in the first quarter of 2019 with the Fund ranking in the second quartile of the Performance Peer Group for theone- andfive-year periods and third quartile for thethree-year period ended March 29, 2019. The Board was satisfied with the Fund’s overall performance.
For Nuveen Credit Strategies Income Fund, the Board noted that although the Fund ranked in the fourth quartile of its Performance Peer Group in thefive-year period, the Fund ranked in the third quartile in theone- andthree-year periods. The Fund’s performance was also below the performance of its benchmark for theone-,three- andfive-year periods ended December 31, 2018. The Board, however, noted the Fund’s improved performance in the first quarter of 2019 with the Fund ranking in the first quartile of its Performance Peer Group in theone-year period, third quartile in thethree-year period and fourth quartile in thefive-year period ended March 29, 2019. Further, although the Fund’s performance was below the performance of its benchmark in thethree- andfive-year periods, the Fund outperformed the benchmark in theone-year period ended March 29, 2019. The Board considered the Adviser’s explanation of the factors that detracted from the Fund’s performance and was satisfied with the Adviser’s explanation. The Board also noted the steps taken in seeking to improve performance. The Board noted that it would continue to monitor the performance of this Fund.
| C. | | Fees, Expenses and Profitability |
In its annual review, the Board considered the fees paid to the Fund Advisers and the total operating expense ratio of each Nuveen fund. More specifically, the Independent Board Members reviewed, among other things, each fund’s gross and net management fee rates and net total expense ratio in relation to those of a comparable universe of funds (the“Peer Universe”) established by Broadridge. The Independent Board Members reviewed the methodology Broadridge employed to establish its Peer Universe and recognized that differences between the applicable fund and its respective Peer Universe as well as changes to the composition of the Peer Universe from year to year may limit some of the value of the comparative data. The Independent Board Members also considered a fund’s operating expense ratio as it more directly reflected the shareholder’s costs in investing in the respective fund.
In their review, the Independent Board Members considered, in particular, each fund with a net expense ratio (excludinginvestment-related costs of leverage) of six basis points or higher compared to that of its peer average (each, an“Expense
127
Annual Investment Management Agreement Approval Process(continued)
(Unaudited)
Outlier Fund”) and an analysis as to the factors contributing to each such fund’s higher relative net expense ratio. In addition, although the Board reviewed a fund’s total net expenses both including and excludinginvestment-related expenses (i.e., leverage costs) and taxes for certain of theclosed-end funds, the Board recognized that leverage expenses will vary across the Nuveen funds and in comparison to peers because of differences in the forms and terms of leverage employed by the respective fund. Accordingly, in reviewing the comparative data between a fund and its peers, the Board generally considered the fund’s net expense ratio and fees (excluding leverage costs and leveraged assets) to be higher if they were over 10 basis points higher, slightly higher if they were 6 to 10 basis points higher, in line if they were within approximately 5 basis points higher than the peer average and below if they were below the peer average of the Peer Universe. The Independent Board Members also considered, in relevant part, a fund’s net management fee and net total expense ratio in light of its performance history.
In their review of the fee arrangements for the Nuveen funds, the Independent Board Members considered the management fee schedules, including thecomplex-wide andfund-level breakpoint schedules, as applicable. The Board noted that across the Nuveen fund complex, thecomplex-wide fee breakpoints reduced fees by $51.5 million andfund-level breakpoints reduced fees by $55.1 million in 2018.
With respect to theSub-Adviser, the Board considered thesub-advisory fee paid to theSub-Adviser, including any breakpoint schedule, and as described below, comparative data of the fees theSub-Adviser charges to other clients, if any.
The Independent Board Members noted that the Funds each had a net management fee and a net expense ratio that were below the respective peer averages.Based on its review of the information provided, the Board determined that each Fund’s management fees (as applicable) to a Fund Adviser were reasonable in light of the nature, extent and quality of services provided to the Fund.
| | 2. | | Comparisons with the Fees of Other Clients |
In determining the appropriateness of fees, the Board also reviewed information regarding the fee rates the respective Fund Advisers charged to certain other types of clients and the type of services provided to these other clients. For the Adviser and/or theSub-Adviser, such other clients may include retail and institutional managed accounts; hedge funds; andsub-advised funds outside the Nuveen family. The Board further noted that the Adviser also advised certainexchange-traded funds (“ETFs”) sponsored by Nuveen.
The Board recognized that each Fund had an affiliatedsub-adviser and, with respect to affiliatedsub-advisers, reviewed, among other things, the range of fees assessed for managed accounts and hedge funds (along with their performance fee). The Board also reviewed the fee range and average fee rate of certain selected investment strategies offered in retail and institutional managed accounts by theSub-Adviser and the hedge funds advised by theSub-Adviser (along with their performance fee) and of thenon-Nuveen investment companiessub-advised by affiliatedsub-advisers.
In addition to the comparative fee data, the Board also reviewed, among other things, a description of the different levels of services provided to certain other clients compared to the services provided to the Nuveen funds as well as the differences in portfolio investment policies, investor profiles, account sizes and regulatory requirements, all of which contribute to the variations in the fee schedules. The Board noted, among other things, the wide range of services in addition to investment management services provided to the Nuveen funds when the Adviser is principally responsible for all aspects of operating the funds, including the increased regulatory requirements that must be met in managing the funds, the larger account sizes of managed accounts and hedge funds and the increased entrepreneurial, legal and regulatory risks that the Adviser incurs in sponsoring and managing the funds. Further, with respect to ETFs, the Board considered that Nuveen ETFs are passively managed compared to the active management of other Nuveen funds which contributed to the differences in fee levels between the Nuveen ETFs and other Nuveen funds. In general, higher fee levels reflect higher levels of service provided by the Adviser, increased investment management complexity, greater product management requirements, and higher levels of business risk or some combination of these factors. The Board further considered that theSub-Adviser’s fee is essentially for portfolio management services and therefore more comparable to the fees it receives for retail wrap accounts and other externalsub-advisory mandates. The Board concluded the varying levels of fees were justified given, among other things, the
128
inherent differences in the products and the level of services provided to the Nuveen funds versus other clients, the differing regulatory requirements and legal liabilities and the entrepreneurial, legal and regulatory risks incurred in sponsoring and advising a registered investment company.
| | 3. | | Profitability of Fund Advisers |
In conjunction with their review of fees, the Independent Board Members considered information regarding Nuveen’s level of profitability for its advisory services to the Nuveen funds for the calendar years 2018 and 2017. The Board reviewed, among other things, Nuveen’s net margins(pre-tax) (both including and excluding distribution expenses); gross and net revenue margins(pre- andpost-tax); revenues, expenses, and net income(pre-tax andafter-tax and before distribution) of Nuveen for fund advisory services; and comparative profitability data comparing the adjusted margins of Nuveen compared to the adjusted margins of certain peers with publicly available data and with the most comparable assets under management (based on asset size and asset composition) for each of the last two calendar years. The Board also reviewed the revenues and expenses the Adviser derived from its ETF product line that was launched in 2016. The Independent Board Members noted that Nuveen’s net margins were higher in 2018 than the previous year and considered the key drivers behind the revenue and expense changes that impacted Nuveen’s net margins between the years. The Board considered the costs of investments in the Nuveen business, including the investment of seed capital in certain Nuveen funds and additional investments in infrastructure and technology. The Independent Board Members also noted that Nuveen’s adjusted margins from its relationships with the Nuveen funds were on the low range compared to the adjusted margins of the peers; however, the Independent Board Members recognized the inherent limitations of the comparative data of other publicly traded peers given that the calculation of profitability is rather subjective and numerous factors (such as types of funds, business mix, cost of capital, methodology to allocate expenses and other factors) can have a significant impact on the results.
The Independent Board Members also reviewed a description of the expense allocation methodology employed to develop the financial information and a summary of the history of changes to the methodology over theten-year period from 2008 to 2018, and recognized that other reasonable allocation methodologies could be employed and lead to significantly different results. The Board noted that two Independent Board Members, along with independent counsel, serve as the Board’s liaisons to review profitability and discuss any proposed changes to the methodology prior to the full Board’s review.
Aside from Nuveen’s profitability, the Board recognized that the Adviser is a subsidiary of Nuveen, LLC, the investment management arm of Teachers Insurance and Annuity Association of America (“TIAA”). As such, the Board also reviewed a balance sheet for TIAA reflecting its assets, liabilities and capital and contingency reserves for the 2018 and 2017 calendar years to consider the financial strength of TIAA having recognized the importance of having an adviser with significant resources.
In addition to Nuveen, the Independent Board Members also considered the profitability of theSub-Adviser from its relationships with the Nuveen funds. In this regard, the Independent Board Members reviewed theSub-Adviser’s revenues, expenses and revenue margins(pre- andpost-tax) for its advisory activities for the calendar year ended December 31, 2018.
In evaluating the reasonableness of the compensation, the Independent Board Members also considered any other ancillary benefits derived by the respective Fund Adviser from its relationship with the Nuveen funds as discussed in further detail below.
Based on a consideration of all the information provided, the Board noted that Nuveen’s and theSub-Adviser’s level of profitability was acceptable and not unreasonable in light of the services provided.
| D. | | Economies of Scale and Whether Fee Levels Reflect These Economies of Scale |
With respect to economies of scale, the Independent Board Members noted that although economies of scale are difficult to measure, the Adviser shares the benefits of economies of scale in various ways including breakpoints in the management fee schedule (subject to limited exceptions), fee waivers and/or expense limitations, the pricing of Nuveen funds at scale at inception and investments in its business which can enhance the services provided to the funds for the fees paid. With respect to breakpoint schedules, because the Board had previously recognized that economies of scale may occur not only when the assets of a particular Nuveen fund grow but also when the assets in the complex grow, the Nuveen funds generally
129
Annual Investment Management Agreement Approval Process(continued)
(Unaudited)
pay the Adviser a management fee comprised of afund-level component and acomplex-level component each with its own breakpoint schedule, subject to certain exceptions. In general terms, the breakpoint schedule at the fund level reduces fees as assets in the particular fund pass certain thresholds and the breakpoint schedule at the complex level reduces fees on the Nuveen funds as the eligible assets in the complex pass certain thresholds. The Independent Board Members reviewed, among other things, thefund-level andcomplex-level fee schedules. With respect to the Nuveenclosed-end funds, the Independent Board Members noted that, although such funds may fromtime-to-time make additional share offerings, the growth of their assets would occur primarily through the appreciation of such funds’ investment portfolios.
In addition, the Independent Board Members recognized the Adviser’s continued reinvestment in its business through, among other things, investments in its business infrastructure and information technology, portfolio accounting system as well as other systems and platforms that will, among other things, support growth, simplify and enhance information sharing, and enhance the investment process to the benefit of all of the Nuveen funds.
Based on its review, the Board concluded that the current fee arrangements together with the Adviser’s reinvestment in its business appropriately shared any economies of scale with shareholders.
The Independent Board Members received and considered information regarding other benefits the respective Fund Adviser or its affiliates may receive as a result of their relationship with the Nuveen funds. The Board considered that an affiliate of the Adviser serves asco-manager in the initial public offerings of newclosed-end funds for which it may receive revenue and serves as an underwriter on shelf offerings of existingclosed-end funds for which it receives compensation. In addition, the Independent Board Members also noted that theSub-Adviser engages in soft dollar transactions pursuant to which it may receive the benefit of research products and other services provided bybroker-dealers executing portfolio transactions on behalf of the applicable Nuveen funds.
The Board, however, noted that the benefits for theSub-Adviser when transacting infixed-income securities may be more limited as such securities generally trade on a principal basis and therefore do not generate brokerage commissions. Further, the Board noted that although theSub-Adviser may benefit from the receipt of research and other services that it may otherwise have to pay for out of its own resources, the research may also benefit the Nuveen funds to the extent it enhances the ability of theSub-Adviser to manage such funds or is acquired through the commissions paid on portfolio transactions of other clients.
Based on their review, the Board concluded that any indirect benefits received by a Fund Adviser as a result of its relationship with the Funds were reasonable and within acceptable parameters.
The Board Members did not identify any single factor discussed previously asall-important or controlling. The Board Members, including the Independent Board Members, concluded that the terms of each Advisory Agreement were fair and reasonable, that the respective Fund Adviser’s fees were reasonable in light of the services provided to each Fund and that the Advisory Agreements be renewed.
130
Board Members & Officers
(Unaudited)
The management of the Funds, including general supervision of the duties performed for the Funds by the Adviser, is the responsibility of the Board of Trustees of the Funds. The number of trustees of the Funds is set at ten. None of the trustees who are not “interested” persons of the Funds (referred to herein as “independent board members”) has ever been a director or employee of, or consultant to, Nuveen or its affiliates. The names and business addresses of the trustees and officers of the Funds, their principal occupations and other affiliations during the past five years, the number of portfolios each oversees and other directorships they hold are set forth below.
| | | | | | | | |
| | | | |
| | | | | | | | | |
Name, Year of Birth & Address | | Position(s) Held with the Funds | | Year First Elected or Appointed and Term(1) | | Principal Occupation(s) Including other Directorships During Past 5 Years | | Number of Portfolios in Fund Complex Overseen by Board Member |
| | | | |
| | | | | | | | | |
| | |
| Independent Board Members: | | | | |
| | | | |
∎ TERENCE J. TOTH | | | | | | Formerly, aCo-Founding Partner, Promus Capital (2008-2017); Director, Fulcrum IT Service LLC (since 2010) and Quality Control Corporation (since 2012); member: Catalyst Schools of Chicago Board (since 2008) and Mather Foundation Board (since 2012), and chair of its Investment Committee; formerly, Director, Legal & General Investment Management America, Inc. (2008-2013); formerly, CEO and President, Northern Trust Global Investments (2004-2007): Executive Vice President, Quantitative Management & Securities Lending (2000-2004); prior thereto, various positions with Northern Trust Company (since 1994); formerly, Member, Northern Trust Mutual Funds Board (2005-2007), Northern Trust Global Investments Board (2004-2007), Northern Trust Japan Board (2004-2007), Northern Trust Securities Inc. Board(2003-2007) and Northern Trust Hong Kong Board (1997-2004). | | |
1959 333 W. Wacker Drive Chicago, IL 60606 | | Chairman and Board Member | | 2008 Class II | | 163 |
| | | | | | |
| | | | |
∎ JACK B. EVANS | | | | | | Chairman (since 2019), formerly, President (1996-2019), The Hall-Perrine Foundation, a private philanthropic corporation; Director and Chairman, United Fire Group, a publicly held company; Director, Public Member, American Board of Orthopaedic Surgery (since 2015); Life Trustee of Coe College and the Iowa College Foundation; formerly, PresidentPro-Tem of the Board of Regents for the State of Iowa University System; formerly, Director, Alliant Energy and The Gazette Company; formerly, Director, Federal Reserve Bank of Chicago; formerly, President and Chief Operating Officer, SCI Financial Group, Inc., a regional financial services firm. | | |
1948 333 W. Wacker Drive Chicago, IL 60606 | | Board Member | | 1999 Class III | | 163 |
| | | | | | |
| | | | |
∎ WILLIAM C. HUNTER | | | | | | Dean Emeritus, formerly, Dean, Tippie College of Business, University of Iowa(2006-2012); Director of Wellmark, Inc. (since 2009); past Director(2005-2015), and past President (2010-2014) Beta Gamma Sigma, Inc., The International Business Honor Society; formerly, Director (2004-2018) of Xerox Corporation; Dean and Distinguished Professor of Finance, School of Business at the University of Connecticut (2003-2006); previously, Senior Vice President and Director of Research at the Federal Reserve Bank of Chicago (1995-2003); formerly, Director (1997-2007), Credit Research Center at Georgetown University. | | |
1948 333 W. Wacker Drive Chicago, IL 60606 | | Board Member | | 2003 Class I | | 163 |
| | | | |
| | | | |
∎ ALBIN F. MOSCHNER | | | | | | Founder and Chief Executive Officer, Northcroft Partners, LLC, a management consulting firm (since 2012); Chairman (since 2019), and Director (since 2012), USA Technologies, Inc., a provider of solutions and services to facilitate electronic payment transactions (since 2012); formerly, Director, Wintrust Financial Corporation (1996-2016); previously, held positions at Leap Wireless International, Inc., including Consultant (2011-2012), Chief Operating Officer (2008-2011), and Chief Marketing Officer (2004-2008); formerly, President, Verizon Card Services division of Verizon Communications, Inc. (2000-2003); formerly, President, One Point Services at One Point Communications(1999-2000); formerly, Vice Chairman of the Board, Diba, Incorporated(1996-1997); formerly, various executive positions (1991-1996) and Chief Executive Officer (1995-1996) of Zenith Electronics Corporation. | | |
1952 333 W. Wacker Drive Chicago, IL 60606 | | Board Member | | 2016 Class III | | 163 |
| | | | | | |
131
Board Members & Officers(continued)
(Unaudited)
| | | | | | | | |
| | | | |
| | | | | | | | | |
Name, Year of Birth & Address | | Position(s) Held with the Funds | | Year First Elected or Appointed and Term(1) | | Principal Occupation(s) Including other Directorships During Past 5 Years | | Number of Portfolios in Fund Complex Overseen by Board Member |
| | | | |
| | | | | | | | | |
| | |
| Independent Board Members (continued): | | | | |
| | | | |
∎ JOHN K. NELSON | | | | | | Member of Board of Directors of Core12 LLC (since 2008), a private firm which develops branding, marketing and communications strategies for clients; serves on The President’s Council, Fordham University (since 2010); and previously was a Director of The Curran Center for Catholic American Studies (2009-2018) formerly, senior external advisor to the financial services practice of Deloitte Consulting LLP (2012-2014): formerly, Chairman of the Board of Trustees of Marian University (2010 as trustee, 2011-2014 as Chairman); formerly, Chief Executive Officer of ABN AMRO N.V. North America, and Global Head of its Financial Markets Division (2007-2008); prior senior positions held at ABN AMRO include Corporate Executive Vice President and Head of GlobalMarkets-the Americas (2006-2007), CEO of Wholesale Banking North America and Global Head of Foreign Exchange and Futures Markets (2001-2006), and Regional Commercial Treasurer and Senior Vice President Trading-North America (1996-2001); formerly, Trustee at St. Edmund Preparatory School in New York City. | | |
1962 333 W. Wacker Drive Chicago, IL 60606 | | Board Member | | 2013 Class II | | 163 |
| | | | | | |
| | | | |
∎ JUDITH M. STOCKDALE | | | | | | Board Member, Land Trust Alliance (since 2013) and U.S. Endowment for Forestry and Communities (since 2013); formerly, Executive Director(1994-2012), Gaylord and Dorothy Donnelley Foundation; prior thereto, Executive Director, Great Lakes Protection Fund (1990-1994). | | |
1947 333 W. Wacker Drive Chicago, IL 60606 | | Board Member | | 1997 Class I | | 163 |
| | | | |
∎ CAROLE E. STONE | | | | | | Former Director, Chicago Board Options Exchange, Inc. (2006-2017); and C2 Options Exchange, Incorporated (2009-2017); Director, Cboe, L.C. Global Markets, Inc., formerly, CBOE Holdings, Inc. (since 2010); formerly, Commissioner, New York State Commission on Public Authority Reform (2005-2010). | | |
1947 333 W. Wacker Drive Chicago, IL 60606 | | Board Member | | 2007 Class I | | 163 |
| | | | |
∎ MARGARET L. WOLFF | | | | | | Formerly, member of the Board of Directors (2013-2017) of Travelers Insurance Company of Canada and The Dominion of Canada General Insurance Company (each, a part of Travelers Canada, the Canadian operation of The Travelers Companies, Inc.); formerly, Of Counsel, Skadden, Arps, Slate, Meagher & Flom LLP (Mergers & Acquisitions Group) (2005-2014); Member of the Board of Trustees of New York-Presbyterian Hospital (since 2005); Member (since 2004) and Chair (since 2015) of the Board of Trustees of The John A. Hartford Foundation (a philanthropy dedicated to improving the care of older adults); formerly, Member (2005-2015) and Vice Chair (2011-2015) of the Board of Trustees of Mt. Holyoke College. | | |
1955 333 W. Wacker Drive Chicago, IL 60606 | | Board Member | | 2016 Class I | | 163 |
| | | | | | |
| | | | |
∎ ROBERT L. YOUNG(2) | | | | | | Formerly, Chief Operating Officer and Director, J.P.Morgan Investment Management Inc. (2010-2016); formerly, President and Principal Executive Officer (2013-2016), and Senior Vice President and Chief Operating Officer (2005-2010), of J.P.Morgan Funds; formerly, Director and various officer positions for J.P.Morgan Investment Management Inc. (formerly, JPMorgan Funds Management, Inc. and formerly, One Group Administrative Services) and JPMorgan Distribution Services, Inc. (formerly, One Group Dealer Services, Inc.) (1999-2017). | | |
1963 333 W. Wacker Drive Chicago, IL 60606 | | Board Member | | 2017 Class II | | 161 |
| | | | | | |
132
| | | | | | | | |
| | | | |
| | | | | | | | | |
Name, Year of Birth & Address | | Position(s)��Held with the Funds | | Year First Elected or Appointed and Term(1) | | Principal Occupation(s) Including other Directorships During Past 5 Years | | Number of Portfolios in Fund Complex Overseen by Board Member |
| | | | |
| | | | | | | | | |
| | |
| Interested Board Member: | | | | |
| | | | |
∎ MARGO L. COOK(3) | | | | | | President (since 2017), formerly,Co-Chief Executive Officer andCo-President (2016-2017), formerly, Senior Executive Vice President of Nuveen Investments, Inc.; President, Global Products and Solutions (since 2017), and,Co-Chief Executive Officer (since 2015), formerly, Executive Vice President (2013-2015), of Nuveen Securities, LLC; Executive Vice President (since 2017) of Nuveen, LLC; President (since August 2017), formerlyCo-President (2016- 2017), formerly, Senior Executive Vice President of Nuveen Fund Advisors, LLC (Executive Vice President2011-2015); President (since 2017), Nuveen Alternative Investments, LLC; Chartered Financial Analyst. | | |
1964 333 W. Wacker Drive Chicago, IL 60606 | | Board Member | | 2016 Class III | | 163 |
| | | | | | |
| | | | |
| | | | | | | | | |
Name, Year of Birth & Address | | Position(s) Held with the Funds | | Year First Elected or Appointed(4) | | Principal Occupation(s) During Past 5 Years | | |
| | | | |
| | | | | | | | | |
| | |
| Officers of the Funds: | | | | |
| | | | |
∎ CEDRIC H. ANTOSIEWICZ | | | | | | Senior Managing Director (since 2017), formerly, Managing Director (2004-2017) of Nuveen Securities, LLC; Senior Managing Director (since 2017), formerly, Managing Director (2014-2017) of Nuveen Fund Advisors, LLC. | | |
1962 333 W. Wacker Drive Chicago, IL 60606 | | Chief Administrative Officer | | 2007 | | |
| | | | |
∎ NATHANIEL T. JONES | | | | | | Managing Director (since 2017), formerly, Senior Vice President(2016-2017), formerly, Vice President (2011-2016) of Nuveen; Managing Director of Nuveen Fund Advisors, LLC; Chartered Financial Analyst. | | |
1979 333 W. Wacker Drive Chicago, IL 60606 | | Vice President and Treasurer | | 2016 | | |
| | | | |
∎ WALTER M. KELLY | | | | | | Managing Director (since 2017), formerly, Senior Vice President(2008-2017) of Nuveen. | | |
1970 333 W. Wacker Drive Chicago, IL 60606 | | Chief Compliance Officer and Vice President | | 2003 | | |
| | | | |
∎ DAVID J. LAMB | | | | | | Managing Director (since 2017), formerly, Senior Vice President of Nuveen (since 2006), Vice President prior to 2006. | | |
1963 333 W. Wacker Drive Chicago, IL 60606 | | Vice President | | 2015 | | |
| | | | |
∎ TINA M. LAZAR | | | | | | Managing Director (since 2017), formerly, Senior Vice President(2014-2017) of Nuveen Securities, LLC. | | |
1961 333 W. Wacker Drive Chicago, IL 60606 | | Vice President | | 2002 | | |
| | | | |
∎ BRIAN J. LOCKHART | | | | | | Managing Director (since 2017), formerly, Vice President(2010-2017) of Nuveen; Head of Investment Oversight (since 2017), formerly, Team Leader of Manager Oversight(2015-2017); Chartered Financial Analyst and Certified Financial Risk Manager. | | |
1974 333 W. Wacker Drive Chicago, IL 60606 | | Vice President | | 2019 | | |
| | | | |
∎ JACQUES M.
LONGERSTAEY | | | | | | Senior Managing Director, Chief Risk Officer, Nuveen, LLC (since May 2019); Senior Managing Director (since May 2019) of Nuveen Fund Advisors, LLC; formerly, Chief Investment and Model Risk Officer, Wealth & Investment Management Division, Wells Fargo Bank (NA) (from2013-2019). | | |
1963 8500 Andrew Carnegie Blvd. Charlotte, NC 28262 | | Vice President | | 2019 | | |
| | | | | | | |
133
Board Members & Officers(continued)
(Unaudited)
| | | | | | | | |
| | | | |
| | | | | | | | | |
Name, Year of Birth & Address | | Position(s) Held with the Funds | | Year First Elected or Appointed(4) | | Principal Occupation(s) During Past 5 Years | | |
| | | | |
| | | | | | | | | |
| | |
| Officers of the Fund (continued): | | | | |
| | | | |
∎ KEVIN J. MCCARTHY | | | | | | Senior Managing Director (since 2017) and Secretary and General Counsel (since 2016) of Nuveen Investments, Inc., formerly, Executive Vice President (2016-2017) and Managing Director and Assistant Secretary (2008-2016); Senior Managing Director (since 2017) and Assistant Secretary (since 2008) of Nuveen Securities, LLC, formerly Executive Vice President (2016-2017) and Managing Director (2008-2016); Senior Managing Director (since 2017), Secretary (since 2016) andCo-General Counsel (since 2011) of Nuveen Fund Advisors, LLC, formerly, Executive Vice President (2016-2017), Managing Director (2008-2016) and Assistant Secretary (2007-2016); Senior Managing Director (since 2017), Secretary (since 2016) and Associate General Counsel (since 2011) of Nuveen Asset Management, LLC, formerly Executive Vice President (2016-2017) and Managing Director and Assistant Secretary(2011-2016); Senior Managing Director (since 2017) and Secretary (since 2016) of Nuveen Investments Advisers, LLC, formerly Executive Vice President (2016-2017); Vice President (since 2007) and Secretary (since 2016), formerly, Assistant Secretary, of NWQ Investment Management Company, LLC, Symphony Asset Management LLC, Santa Barbara Asset Management, LLC and Winslow Capital Management, LLC (since 2010). Senior Managing Director (since 2017) and Secretary (since 2016) of Nuveen Alternative Investments, LLC. | | |
1966 333 W. Wacker Drive Chicago, IL 60606 | | Vice President and Assistant Secretary | | 2007 | | |
| | | | | | |
| | | | |
∎ WILLIAM T. MEYERS | | | | | | Senior Managing Director (since 2017), formerly, Managing Director(2016-2017), Senior Vice President (2010-2016) of Nuveen Securities, LLC; and Nuveen Fund Advisors, LLC; Senior Managing Director (since 2017), formerly, Managing Director (2016-2017), Senior Vice President (2010-2016) of Nuveen, has held various positions with Nuveen since 1991. | | |
1966 333 W. Wacker Drive Chicago, IL 60606 | | Vice President | | 2018 | | |
| | | | | | |
| | | | |
∎ MICHAEL A. PERRY | | | | | | Executive Vice President (since 2017), previously Managing Director from 2016), of Nuveen Fund Advisors, LLC and Nuveen Alternative Investments, LLC; Executive Vice President (since 2017), formerly, Managing Director(2015-2017), of Nuveen Securities, LLC; formerly, Managing Director(2010-2015) of UBS Securities, LLC. | | |
1967 333 W. Wacker Drive Chicago, IL 60606 | | Vice President | | 2017 | | |
| | | | | | |
| | | | |
∎ CHRISTOPHER M. ROHRBACHER | | | | | | Managing Director (since 2017) and Assistant Secretary of Nuveen Securities, LLC; Managing Director (since 2017), formerly, Senior Vice President(2016-2017) and Assistant Secretary (since 2016) of Nuveen Fund Advisors, LLC. | | |
1971 333 W. Wacker Drive Chicago, IL 60606 | | Vice President and Assistant Secretary | | 2008 | | |
| | | | |
∎ WILLIAM A. SIFFERMANN | | | | | | Managing Director (since 2017), formerly Senior Vice President (2016-2017) and Vice President (2011-2016) of Nuveen. | | |
1975 333 W. Wacker Drive Chicago, IL 60606 | | Vice President | | 2017 | | |
| | | | |
∎ JOEL T. SLAGER | | | | | | Fund Tax Director for Nuveen Funds (since 2013); previously, Vice President of Morgan Stanley Investment Management, Inc., Assistant Treasurer of the Morgan Stanley Funds (from 2010 to 2013). | | |
1978 333 W. Wacker Drive Chicago, IL 60606 | | Vice President and Assistant Secretary | | 2013 | | |
| | | | |
∎ E. SCOTT WICKERHAM | | | | | | Senior Managing Director, Head of Fund Administration at Nuveen, LLC (since 2019), formerly, Managing Director; Senior Managing Director (since 2019), Nuveen Fund Advisers, LLC; Principal Financial Officer, Principal Accounting Officer and Treasurer (since 2017) to the TIAA-CREF Funds, the TIAA-CREF Life Funds, the TIAA Separate AccountVA-1 and the Treasurer (since 2017) to the CREF Accounts; Senior Director, TIAA-CREF Fund Administration (2014-2015); has held various positions with TIAA since 2006. | | |
1973 TIAA 730 Third Avenue New York, NY 10017 | | Vice President and Controller | | 2019 | | |
| | | | | | |
134
| | | | | | | | |
| | | | |
| | | | | | | | | |
Name, Year of Birth & Address | | Position(s) Held with the Funds | | Year First Elected or Appointed(4) | | Principal Occupation(s) During Past 5 Years | | |
| | | | |
| | | | | | | | | |
| | |
| Officers of the Fund (continued): | | | | |
| | | | |
∎ MARK L. WINGET | | | | | | Vice President and Assistant Secretary of Nuveen Securities, LLC (since 2008); Vice President (since 2010) and Associate General Counsel (since 2008) of Nuveen. | | |
1968 333 W. Wacker Drive Chicago, IL 60606 | | Vice President and Assistant Secretary | | 2008 | | |
| | | | |
∎ GIFFORD R. ZIMMERMAN | | | | | | Managing Director (since 2002), and Assistant Secretary of Nuveen Securities, LLC; Managing Director (since 2004) and Assistant Secretary (since 1994) of Nuveen Investments, Inc.; Managing Director (since 2002), Assistant Secretary (since 1997) andCo-General Counsel (since |2011) of Nuveen Fund Advisors, LLC; Managing Director, Assistant Secretary and Associate General Counsel of Nuveen Asset Management, LLC (since 2011); Vice President (since 2017), formerly, Managing Director (2003-2017) and Assistant Secretary (since 2003) of Symphony Asset Management LLC; Managing Director and Assistant Secretary (since 2002) of Nuveen Investments Advisers, LLC; Vice President and Assistant Secretary of NWQ Investment Management Company, LLC (since 2002), Santa Barbara Asset Management, LLC (since 2006), and of Winslow Capital Management, LLC, (since 2010); Chartered Financial Analyst. | | |
1956 333 W. Wacker Drive Chicago, IL 60606 | | Vice President Secretary | | 1988 | | |
| | | | | | |
| (1) | The Board of Trustees is divided into three classes, Class I, Class II, and Class III, with each being elected to serve until the third succeeding annual shareholders’ meeting subsequent to its election or thereafter in each case when its respective successors are duly elected or appointed, except two board members are elected by the holders of Preferred Shares, when applicable, to serve until the next annual shareholders’ meeting subsequent to its election or thereafter in each case when its respective successors are duly elected or appointed. The year first elected or appointed represents the year in which the board member was first elected or appointed to any fund in the Nuveen complex. |
| (2) | Mr. Young was appointed as a Board Member of each of the Nuveen Funds except Nuveen Diversified Dividend and Income Fund and Nuveen Real Estate Income Fund. |
| (3) | “Interested person” as defined in the 1940 Act, by reason of her position with Nuveen, LLC. and certain of its subsidiaries, which are affiliates of the Nuveen Funds. |
| (4) | Officers serve one year terms through August of each year. The year first elected or appointed represents the year in which the Officer was first elected or appointed to any fund in the Nuveen complex. |
135
Nuveen:
Serving Investors for Generations
Since 1898, financial advisors and their clients have relied on Nuveen to provide dependable investment solutions through continued adherence to proven, long-term investing principles. Today, we offer a range of high quality solutions designed to be integral components of a well-diversified core portfolio.
Focused on meeting investor needs.
Nuveen is the investment manager of TIAA. We have grown into one of the world’s premier global asset managers, with specialist knowledge across all major asset classes and particular strength in solutions that provide income for investors and that draw on our expertise in alternatives and responsible investing. Nuveen is driven not only by the independent investment processes across the firm, but also the insights, risk management, analytics and other tools and resources that a truly world-class platform provides. As a global asset manager, our mission is to work in partnership with our clients to create solutions which help them secure their financial future.
Find out how we can help you.
To learn more about how the products and services of Nuveen may be able to help you meet your financial goals, talk to your financial advisor, or call us at(800) 257-8787. Please read the information provided carefully before you invest. Investors should consider the investment objective and policies, risk considerations, charges and expenses of any investment carefully. Where applicable, be sure to obtain a prospectus, which contains this and other relevant information. To obtain a prospectus, please contact your securities representative or Nuveen, 333 W. Wacker Dr., Chicago, IL 60606. Please read the prospectus carefully before you invest or send money.
Learn more about Nuveen Funds at:www.nuveen.com/closed-end-funds
| | | | |
| Nuveen Securities, LLC, member FINRA and SIPC | 333 West Wacker Drive Chicago, IL 60606 | www.nuveen.com | | | | EAN-A-0719D
944355-INV-Y-09/20 |
ITEM 2. CODE OF ETHICS.
As of the end of the period covered by this report, the registrant has adopted a code of ethics that applies to the registrant’s principal executive officer, principal financial officer, principal accounting officer or controller, or persons performing similar functions. There were no amendments to or waivers from the Code during the period covered by this report. The registrant has posted the code of ethics on its website at www.nuveen.com/CEF/Shareholder/FundGovernance.aspx. (To view the code, click on Code of Conduct.)
ITEM 3. AUDIT COMMITTEE FINANCIAL EXPERT.
As of the end of the period covered by this report, the registrant’s Board of Directors or Trustees (“Board”) determined that the registrant has at least one “audit committee financial expert” (as defined in Item 3 of Form N-CSR) serving on its Audit Committee. The registrant’s audit committee financial experts are Carole E. Stone, Jack B. Evans and William C. Hunter, who are “independent” for purposes of Item 3 of Form N-CSR.
Ms. Stone served for five years as Director of the New York State Division of the Budget. As part of her role as Director, Ms. Stone was actively involved in overseeing the development of the State’s operating, local assistance and capital budgets, its financial plan and related documents; overseeing the development of the State’s bond-related disclosure documents and certifying that they fairly presented the State’s financial position; reviewing audits of various State and local agencies and programs; and coordinating the State’s system of internal audit and control. Prior to serving as Director, Ms. Stone worked as a budget analyst/examiner with increasing levels of responsibility over a 30 year period, including approximately five years as Deputy Budget Director. Ms. Stone has also served as Chair of the New York State Racing Association Oversight Board, as Chair of the Public Authorities Control Board, as a Commissioner on the New York State Commission on Public Authority Reform and as a member of the Boards of Directors of several New York State public authorities. These positions have involved overseeing operations and finances of certain entities and assessing the adequacy of project/entity financing and financial reporting. Currently, Ms. Stone is on the Board of Directors of CBOE Holdings, Inc., of the Chicago Board Options Exchange, and of C2 Options Exchange. Ms. Stone’s position on the boards of these entities and as a member of both CBOE Holdings’ Audit Committee and its Finance Committee has involved, among other things, the oversight of audits, audit plans and preparation of financial statements.
Mr. Evans was formerly President and Chief Operating Officer of SCI Financial Group, Inc., a full service registered broker-dealer and registered investment adviser (“SCI”). As part of his role as President and Chief Operating Officer, Mr. Evans actively supervised the Chief Financial Officer (the “CFO”) and actively supervised the CFO’s preparation of financial statements and other filings with various regulatory authorities. In such capacity, Mr. Evans was actively involved in the preparation of SCI’s financial statements and the resolution of issues raised in connection therewith. Mr. Evans has also served on the audit committee of various reporting companies. At such companies, Mr. Evans was involved in the oversight of audits, audit plans, and the preparation of financial statements. Mr. Evans also formerly chaired the audit committee of the Federal Reserve Bank of Chicago.
Mr. Hunter was formerly a Senior Vice President at the Federal Reserve Bank of Chicago. As part of his role as Senior Vice President, Mr. Hunter was the senior officer responsible for all operations of each of the Economic Research, Statistics, and Community and Consumer Affairs units at the Federal Reserve Bank of Chicago. In such capacity, Mr. Hunter oversaw the subunits of the Statistics and Community and Consumer Affairs divisions responsible for the analysis and evaluation of bank and bank holding company financial statements and financial filings. Prior to serving as Senior Vice President at the Federal Reserve Bank of Chicago, Mr. Hunter was the Vice President of the Financial Markets unit at the Federal Reserve Bank of Atlanta where he supervised financial staff and bank holding company analysts who analyzed and evaluated bank and bank holding company financial statements. Mr. Hunter also currently serves on the Boards of Directors of Xerox Corporation and Wellmark, Inc. as well as on the Audit Committees of such Boards. As an Audit Committee member, Mr. Hunter’s responsibilities include, among other things, reviewing financial statements, internal audits and internal controls over financial reporting. Mr. Hunter also formerly was a Professor of Finance at the University of Connecticut School of Business and has authored numerous scholarly articles on the topics of finance, accounting and economics.
ITEM 4. PRINCIPAL ACCOUNTANT FEES AND SERVICES.
Nuveen Floating Rate Income Fund
The following tables show the amount of fees that KPMG LLP, the Fund’s auditor, billed to the Fund during the Fund’s last two full fiscal years. For engagements with KPMG LLP the Audit Committee approved in advance all audit services and non-audit services that KPMG LLP provided to the Fund, except for those non-audit services that were subject to the pre-approval exception under Rule 2-01 of Regulation S-X (the “pre-approval exception”). The pre-approval exception for services provided directly to the Fund waives the pre-approval requirement for services other than audit, review or attest services if: (A) the aggregate amount of all such services provided constitutes no more than 5% of the total amount of revenues paid by the Fund to its accountant during the fiscal year in which the services are provided; (B) the Fund did not recognize the services as non-audit services at the time of the engagement; and (C) the services are promptly brought to the Audit Committee’s attention, and the Committee (or its delegate) approves the services before the audit is completed.
The Audit Committee has delegated certain pre-approval responsibilities to its Chairman (or, in his absence, any other member of the Audit Committee).
SERVICES THAT THE FUND’S AUDITOR BILLED TO THE FUND
| | | | | | | | | | | | | | | | |
Fiscal Year Ended | | Audit Fees Billed
to Fund1 | | | Audit-Related Fees
Billed to Fund2 | | | Tax Fees
Billed to Fund 3 | | | All Other Fees
Billed to Fund 4 | |
July 31, 2019 | | $ | 34,470 | | | $ | 5,000 | | | $ | 0 | | | $ | 0 | |
| | | | | | | | | | | | | | | | |
| | | | | | | | | | | | | | | | |
Percentage approved pursuant to pre-approval
exception | | | 0 | % | | | 0 | % | | | 0 | % | | | 0 | % |
| | | | | | | | | | | | | | | | |
| | | | | | | | | | | | | | | | |
July 31, 2018 | | $ | 34,470 | | | $ | 2,000 | | | $ | 0 | | | $ | 0 | |
| | | | | | | | | | | | | | | | |
| | | | | | | | | | | | | | | | |
Percentage approved pursuant to pre-approval
exception | | | 0 | % | | | 0 | % | | | 0 | % | | | 0 | % |
| | | | | | | | | | | | | | | | |
1 “Audit Fees” are the aggregate fees billed for professional services for the audit of the Fund’s annual financial statements and services provided in connection with statutory and regulatory filings or engagements.
2 “Audit Related Fees” are the aggregate fees billed for assurance and related services reasonably related to the performance of the audit or review of financial statements that are not reported under “Audit Fees”. These fees include offerings related to the Fund’s common shares and leverage.
3 “Tax Fees” are the aggregate fees billed for professional services for tax advice, tax compliance, and tax planning. These fees include: all global withholding tax services; excise and state tax reviews; capital gain, tax equalization and taxable basis calculation performed by the principal accountant.
4 “All Other Fees” are the aggregate fees billed for products and services other than “Audit Fees”, “Audit-Related Fees” and “Tax Fees”. These fees represent all “Agreed-Upon Procedures” engagements pertaining to the Fund’s use of leverage.
SERVICES THAT THE FUND’S AUDITOR BILLED TO THE
ADVISER AND AFFILIATED FUND SERVICE PROVIDERS
The following tables show the amount of fees billed by KPMG LLP to Nuveen Fund Advisors, LLC (formerly Nuveen Fund Advisors, Inc.) (the “Adviser”), and any entity controlling, controlled by or under common control with the Adviser that provides ongoing services to the Fund (“Affiliated Fund Service Provider”), for engagements directly related to the Fund’s operations and financial reporting, during the Fund’s last two full fiscal years.
The tables also show the percentage of fees subject to the pre-approval exception. The pre-approval exception for services provided to the Adviser and any Affiliated Fund Service Provider (other than audit, review or attest services) waives the pre-approval requirement if: (A) the aggregate amount of all such services provided constitutes no more than 5% of the total amount of revenues paid to KPMG LLP by the Fund, the Adviser and Affiliated Fund Service Providers during the fiscal year in which the services are provided that would have to be pre-approved by the Audit Committee; (B) the Fund did not recognize the services as non-audit services at the time of the engagement; and (C) the services are promptly brought to the Audit Committee’s attention, and the Committee (or its delegate) approves the services before the Fund’s audit is completed.
| | | | | | | | | | | | |
Fiscal Year Ended | | Audit-Related Fees
Billed to Adviser and
Affiliated Fund Service
Providers | | | Tax Fees Billed to
Adviser and
Affiliated Fund
Service Providers | | | All Other Fees
Billed to Adviser
and Affiliated Fund
Service Providers | |
July 31, 2019 | | $ | 0 | | | $ | 0 | | | $ | 0 | |
| | | | | | | | | | | | |
| | | | | | | | | | | | |
Percentage approved pursuant to pre-approval exception | | | 0 | % | | | 0 | % | | | 0 | % |
| | | | | | | | | | | | |
| | | | | | | | | | | | |
July 31, 2018 | | $ | 0 | | | $ | 0 | | | $ | 0 | |
| | | | | | | | | | | | |
| | | | | | | | | | | | |
Percentage approved pursuant to pre-approval exception | | | 0 | % | | | 0 | % | | | 0 | % |
| | | | | | | | | | | | |
NON-AUDIT SERVICES
The following table shows the amount of fees that KPMG LLP billed during the Fund’s last two full fiscal years for non-audit services. The Audit Committee is required to pre-approve non-audit services that KPMG LLP provides to the Adviser and any Affiliated Fund Services Provider, if the engagement related directly to the Fund’s operations and financial reporting (except for those subject to the pre-approval exception described above). The Audit Committee requested and received information from KPMG LLP about any non-audit services that KPMG LLP rendered during the Fund’s last fiscal year to the Adviser and any Affiliated Fund Service Provider. The Committee considered this information in evaluating KPMG LLP ’s independence.
| | | | | | | | | | | | | | | | |
Fiscal Year Ended | | Total Non-Audit Fees
Billed to Fund | | | Total Non-Audit Fees
billed to Adviser and
Affiliated Fund Service
Providers (engagements
related directly to the
operations and financial
reporting of the Fund) | | | Total Non-Audit Fees
billed to Adviser and
Affiliated Fund Service
Providers (all other
engagements) | | | Total | |
July 31, 2019 | | $ | 0 | | | $ | 0 | | | $ | 0 | | | $ | 0 | |
July 31, 2018 | | $ | 0 | | | $ | 0 | | | $ | 0 | | | $ | 0 | |
“Non-Audit Fees billed to Fund” for both fiscal year ends represent “Tax Fees” and “All Other Fees” billed to Fund in their respective amounts from the previous table.
Less than 50 percent of the hours expended on the principal accountant’s engagement to audit the registrant’s financial statements for the most recent fiscal year were attributed to work performed by persons other than the principal accountant’s full-time, permanent employees.
Audit Committee Pre-Approval Policies and Procedures. Generally, the Audit Committee must approve (i) all non-audit services to be performed for the Fund by the Fund’s independent accountants and (ii) all audit and non-audit services to be performed by the Fund’s independent accountants for the Affiliated Fund Service Providers with respect to operations and financial reporting of the Fund. Regarding tax and research projects conducted by the independent accountants for the Fund and Affiliated Fund Service Providers (with respect to operations and financial reports of the Fund) such engagements will be (i) pre-approved by the Audit Committee if they are expected to be for amounts greater than $10,000; (ii) reported to the Audit Committee chairman for his verbal approval prior to engagement if they are expected to be for amounts under $10,000 but greater than $5,000; and (iii) reported to the Audit Committee at the next Audit Committee meeting if they are expected to be for an amount under $5,000.
ITEM 5. AUDIT COMMITTEE OF LISTED REGISTRANTS.
The registrant’s Board has a separately designated Audit Committee established in accordance with Section 3(a)(58)(A) of the Securities Exchange Act of 1934, as amended (15 U.S.C. 78c(a)(58)(A)). As of the end of the period covered by this report, the members of the audit committee are Jack B. Evans, Chair, William C. Hunter, John K. Nelson, Carole E. Stone and Terence J. Toth.
ITEM 6. SCHEDULE OF INVESTMENTS.
(a) See Portfolio of Investments in Item 1.
(b) Not applicable.
ITEM 7. DISCLOSURE OF PROXY VOTING POLICIES AND PROCEDURES FOR CLOSED-END MANAGEMENT INVESTMENT COMPANIES.
Nuveen Fund Advisors, LLC is the registrant’s investment adviser (also referred to as the “Adviser”). The Adviser is responsible for the on-going monitoring of the Fund’s investment portfolio, managing the Fund’s business affairs and providing certain clerical, bookkeeping and administrative services. The Adviser has engaged Symphony Asset Management, LLC (“Symphony” or “Sub-Adviser”) as Sub-Adviser to provide discretionary investment advisory services. As part of these services, the Adviser has delegated to the Sub-Adviser the full responsibility for proxy voting on securities held in the registrant’s portfolio and related duties in accordance with the Sub-Adviser’s policies and procedures. The Adviser periodically monitors the Sub-Adviser’s voting to ensure that it is carrying out its duties. The Sub-Adviser’s proxy voting policies and procedures are summarized as follows:
SYMPHONY
Symphony has adopted and implemented proxy voting guidelines to ensure that proxies are voted in the best interest of its Clients. These are merely guidelines and specific situations may call for a vote which does not follow the guidelines. In determining how to vote proxies, Symphony will follow the Proxy Voting Guidelines of the independent third party which Symphony has retained to provide proxy voting services (“Symphony’s Proxy Guidelines”).
Symphony has created a Proxy Voting Committee to periodically review Symphony’s Proxy Guidelines, address conflicts of interest, specific situations and any portfolio manager’s decision to deviate from Symphony’s Proxy Guideline, (including the third party’s guidelines). Under certain circumstances, Symphony may vote one way for some Clients and another way for other Clients. For example, votes for a Client who provides specific voting instructions may differ from votes for Clients who do not provide proxy voting instructions. However, when Symphony has discretion, proxies will generally be voted the same way for all Clients. In addition, conflicts of interest in voting proxies may arise between Clients, between Symphony and its employees, or a lending or other material relationship. As a general rule, conflicts will be resolved by Symphony voting in accordance with Symphony’s Proxy Guidelines when:
| | • | | Symphony manages the account of a corporation or a pension fund sponsored by a corporation in which Clients of Symphony also own stock. Symphony will vote the proxy for its other Clients in accordance with Symphony’s Proxy Guidelines and will follow any directions from the corporation or the pension plan, if different than Symphony���s Proxy Guidelines; |
| | • | | An employee or a member of his/her immediate family is on the Board of Directors or a member of senior management of the company that is the issuer of securities held in Client’s account; |
| | • | | Symphony has a borrowing or other material relationship with a corporation whose securities are the subject of the proxy. |
Proxies will always be voted in the best interest of Symphony’s Clients. Those situations that do not fit within the general rules for the resolution of conflicts of interest will be reviewed by the Proxy Voting Committee. The Proxy Voting Committee, after consulting with senior management, if appropriate, will determine how the proxy should be voted. For example, when a portfolio manager decides not to follow Symphony’s Proxy Guidelines, the Proxy Voting Committee will review a portfolio manager’s recommendation and determine how to vote the proxy. Decisions by the Proxy Voting Committee will be documented and kept with records related to the voting of proxies. A summary of specific votes will be retained in accordance with Symphony’s Books and Records Requirements which are set forth Symphony’s Compliance Manual and Code of Ethics.
ITEM 8. PORTFOLIO MANAGERS OF CLOSED-END MANAGEMENT INVESTMENT COMPANIES.
Nuveen Fund Advisors, LLC is the registrant’s investment adviser (also referred to as the “Adviser”). The Adviser is responsible for the selection and on-going monitoring of the Fund’s investment portfolio, managing the Fund’s business affairs and providing certain clerical, bookkeeping and administrative services. The Adviser has engaged Symphony Asset Management LLC (“Symphony”, also referred to as “Sub-Adviser”) as Sub-Adviser to provide discretionary investment advisory services. The following section provides information on the portfolio managers of the Sub-Adviser.
SYMPHONY ASSET MANAGEMENT LLC
| Item 8(a)(1). | PORTFOLIO MANAGER BIOGRAPHIES |
As of the date of filing this report, the following individuals at the Sub-Adviser (the “Portfolio Manager”) have primary responsibility for the day-to-day implementation of the Fund’s investment strategy:
Scott Caraher, Senior Portfolio Manager, Co-Head of Investments, Head of Loans, is a member of the Risk Committee and responsible for Symphony’s retail and institutional bank loan-focused portfolios, including credit trading related to bank loans. Prior to joining Symphony in 2002, Mr. Caraher was an Investment Banking Analyst in the industrial group at Deutsche Banc Alex Brown in New York.
Jenny Rhee, Senior Portfolio Manager, Co-Head of Investments, Head of High Yield, joined Symphony in 2001. She is a member of the Risk Committee and responsible for Symphony’s high yield strategies, including the long-short credit strategy, the long-short credit opportunities strategy and credit trading related to high yield. Prior to joining the firm, she was a member of the equity research team at Epoch Partners, and she began her career as an Investment Banking Analyst at Credit Suisse First Boston.
| Item 8(a)(2). | OTHER ACCOUNTS MANAGED BY PORTFOLIO MANAGERS |
In addition to the Fund, as of July 31, 2019, the portfolio managers are also primarily responsible for the day-to-day portfolio management of the following accounts:
| | | | | | | | |
| | | Scott Caraher | | | Jenny Rhee | |
(a) Registered Investment Companies | | | | | | | | |
Number of accounts | | | 11 | | | | 9 | |
Assets | | $ | 6.23 billion | | | $ | 5.54 billion | |
(b) Other pooled accounts | | | | | | | | |
Non-performance fee accounts | | | | | | | | |
Number of accounts | | | 5 | | | | 1 | |
Assets | | $ | 1.21 billion | | | $ | 66 million | |
Performance fee accounts | | | | | | | | |
Number of accounts | | | 0 | | | | 1 | |
Assets | | $ | 0 | | | $ | 1.03 billion | |
| | | | | | | | |
| | | Scott Caraher | | | Jenny Rhee | |
(c) Other | | | | | | | | |
Non-performance fee accounts | | | | | | | | |
Number of accounts | | | 5 | | | | 8 | |
Assets | | $ | 1.25 billion | | | $ | 8.5 million | |
Performance fee accounts | | | | | | | | |
Number of accounts | | | 0 | | | | 0 | |
Assets | | $ | 0 | | | $ | 0 | |
* Assets are as of July 31, 2019.
POTENTIAL MATERIAL CONFLICTS OF INTEREST
As described above, the portfolio managers may manage other accounts with investment strategies similar to the Fund, including other investment companies and separately managed accounts. Fees earned by the Sub-adviser may vary among these accounts and the portfolio managers may personally invest in some but not all of these accounts. These factors could create conflicts of interest because a portfolio manager may have incentives to favor certain accounts over others, resulting in other accounts outperforming the Fund. A conflict may also exist if a portfolio manager identified a limited investment opportunity that may be appropriate for more than one account, but the Fund is not able to take full advantage of that opportunity due to the need to allocate that opportunity among multiple accounts. In addition, the portfolio managers may execute transactions for another account that may adversely impact the value of securities held by the Fund. However, the Sub-adviser believes that these risks are mitigated by the fact that accounts with like investment strategies managed by a particular portfolio manager are generally managed in a similar fashion, subject to exceptions to account for particular investment restrictions or policies applicable only to certain accounts, differences in cash flows and account sizes, and other factors. In addition, the Sub-adviser has adopted trade allocation procedures so that accounts with like investment strategies are treated fairly and equitably over time.
| Item 8(a)(3). | FUND MANAGER COMPENSATION |
As of the most recently completed fiscal year end, the primary portfolio managers’ compensation is as follows:
Symphony’s senior management, specifically the four Co-Heads of Investment and Head of Business, determines base salaries in part on Symphony’s aggregate management and performance fees. Compensation is reviewed periodically to ensure competitiveness with comparable positions at similar asset management firms.
Similar to base salaries, the bonus pool is based in part on Symphony’s aggregate management and performance fees. The bonus pool is tied to the firm’s business results and allocated based on investment and individual performance
Bonus compensation is determined by senior management on a discretionary basis and not on fixed formulas. Investment professionals’ bonus payments depend on the role and responsibilities of the specific professional and are based on individual work performance, idea contribution to the investment team, strategy performance, and overall firm performance.
Additionally, all key members of the investment team, including the Co-Heads of Investments participate in an equity plan. The equity program entitles participants to annual sharing in
Symphony’s income, both in the form of distributions and sharing in enterprise value through periodic, scheduled liquidity opportunities. The program vests over six-years and provides participants with a substantial, uncapped economic opportunity, while at the same time creating long-term alignment and facilitating orderly succession planning.
Equity program grants are also determined by Symphony senior management in consultation with senior management of Symphony’s parent, Nuveen.
| Item 8(a)(4). | OWNERSHIP OF JFR SECURITIES AS OF JULY 31, 2019 |
| | | | | | | | | | | | | | | | | | | | | | | | | | |
Name of Portfolio Manager | | None | | | $1 -
$10,000 | | | $10,001-
$50,000 | | | $50,001-
$100,000 | | $100,001-
$500,000 | | | $500,001-
$1,000,000 | | | Over $1,000,000 | |
Scott Caraher | | | | | | | | | | | | | | X | | | | | | | | | | | | |
Jenny Rhee | | | X | | | | | | | | | | | | |
|
|
| | | | | | | | |
ITEM 9. PURCHASES OF EQUITY SECURITIES BY CLOSED-END MANAGEMENT INVESTMENT COMPANY AND AFFILIATED PURCHASERS.
Not applicable.
ITEM 10. SUBMISSION OF MATTERS TO A VOTE OF SECURITY HOLDERS.
There have been no material changes to the procedures by which shareholders may recommend nominees to the registrant’s Board implemented after the registrant last provided disclosure in response to this Item.
ITEM 11. CONTROLS AND PROCEDURES.
| | (a) | The registrant’s principal executive and principal financial officers, or persons performing similar functions, have concluded that the registrant’s disclosure controls and procedures (as defined in Rule 30a-3(c) under the Investment Company Act of 1940, as amended (the “1940 Act”) (17 CFR 270.30a-3(c))) are effective, as of a date within 90 days of the filing date of this report that includes the disclosure required by this paragraph, based on their evaluation of the controls and procedures required by Rule 30a-3(b) under the 1940 Act (17 CFR 270.30a-3(b)) and Rules 13a-15(b) or 15d-15 (b) under the Securities Exchange Act of 1934, as amended (the “Exchange Act”) (17 CFR 240.13a-15(b) or 240.15d-15 (b)). |
| | (b) | There were no changes in the registrant’s internal control over financial reporting (as defined in Rule 30a-3(d) under the 1940 Act (17 CFR 270.30a-3(d)) that occurred during the period covered by this report that has materially affected, or is reasonably likely to materially affect, the registrant’s internal control over financial reporting. |
ITEM 12. DISCLOSURE OF SECURITIES LENDING ACTIVITIES FOR CLOSED-END MANAGEMENT INVESTMENT COMPANIES.
Not applicable
ITEM 13. EXHIBITS.
File the exhibits listed below as part of this Form.
(a)(1) Any code of ethics, or amendment thereto, that is the subject of the disclosure required by Item 2, to the extent that the registrant intends to satisfy the Item 2 requirements through filing of an exhibit: Not applicable because the code is posted on registrant’s website at www.nuveen.com/CEF/Shareholder/FundGovernance.aspx and there were no amendments during the period covered by this report. (To view the code, click on Code of Conduct.)
(a)(2) A separate certification for each principal executive officer and principal financial officer of the registrant as required by Rule 30a-2(a) under the 1940 Act (17 CFR 270.30a-2(a)) in the exact form set forth below: Ex-99.CERT Attached hereto.
(a)(3) Any written solicitation to purchase securities under Rule 23c-1 under the 1940 Act (17 CFR 270.23c-1) sent or given during the period covered by the report by or on behalf of the registrant to 10 or more persons. Not applicable.
(a)(4) Change in the registrant’s independent public accountant. Not applicable.
(b) If the report is filed under Section 13(a) or 15(d) of the Exchange Act, provide the certifications required by Rule 30a-2(b) under the 1940 Act (17 CFR 270.30a-2(b)); Rule 13a-14(b) or Rule 15d-14(b) under the Exchange Act (17 CFR 240.13a-14(b) or 240.15d-14(b)), and Section 1350 of Chapter 63 of Title 18 of the United States Code (18 U.S.C. 1350) as an exhibit. A certification furnished pursuant to this paragraph will not be deemed “filed” for purposes of Section 18 of the Exchange Act (15 U.S.C. 78r), or otherwise subject to the liability of that section. Such certification will not be deemed to be incorporated by reference into any filing under the Securities Act of 1933 or the Exchange Act, except to the extent that the registrant specifically incorporates it by reference. Ex-99.906 CERT attached hereto.
SIGNATURES
Pursuant to the requirements of the Securities Exchange Act of 1934 and the Investment Company Act of 1940, the registrant has duly caused this report to be signed on its behalf by the undersigned, thereunto duly authorized.
(Registrant) Nuveen Floating Rate Income Fund
| | | | |
| By (Signature and Title) | | /s/ Gifford R. Zimmerman | | |
| | Gifford R. Zimmerman | | |
| | Vice President and Secretary | | |
| |
| Date: October 7, 2019 | | |
Pursuant to the requirements of the Securities Exchange Act of 1934 and the Investment Company Act of 1940, this report has been signed below by the following persons on behalf of the registrant and in the capacities and on the dates indicated.
| | | | |
| By (Signature and Title) | | /s/ Cedric H. Antosiewicz | | |
| | Cedric H. Antosiewicz | | |
| | Chief Administrative Officer | | |
| | (principal executive officer) | | |
| |
| Date: October 7, 2019 | | |
| | |
| By (Signature and Title) | | /s/ E. Scott Wickerham | | |
| | E. Scott Wickerham | | |
| | Vice President and Controller | | |
| | (principal financial officer) | | |
| |
| Date: October 7, 2019 | | |