UNITED STATES
SECURITIES AND EXCHANGE COMMISSION
Washington, D.C. 20549
FORM N-CSR
CERTIFIED SHAREHOLDER REPORT OF REGISTERED
MANAGEMENT INVESTMENT COMPANIES
| | |
| Investment Company Act file number | | 811-21494 |
Nuveen Floating Rate Income Fund
(Exact name of registrant as specified in charter)
Nuveen Investments
333 West Wacker Drive
Chicago, IL 60606
(Address of principal executive offices) (Zip code)
Gifford R. Zimmerman
Nuveen Investments
333 West Wacker Drive
Chicago, IL 60606
(Name and address of agent for service)
| | |
| Registrant’s telephone number, including area code: | | (312) 917-7700 |
| | |
| Date of fiscal year end: | | July 31 |
| | |
| Date of reporting period: | | July 31, 2020 |
Form N-CSR is to be used by management investment companies to file reports with the Commission not later than 10 days after the transmission to stockholders of any report that is required to be transmitted to stockholders under Rule 30e-1 under the Investment Company Act of 1940 (17 CFR 270.30e-1). The Commission may use the information provided on Form N-CSR in its regulatory, disclosure review, inspection, and policymaking roles.
A registrant is required to disclose the information specified by Form N-CSR, and the Commission will make this information public. A registrant is not required to respond to the collection of information contained in Form N-CSR unless the Form displays a currently valid Office of Management and Budget (“OMB”) control number. Please direct comments concerning the accuracy of the information collection burden estimate and any suggestions for reducing the burden to Secretary, Securities and Exchange Commission, 450 Fifth Street, NW, Washington, DC 20549-0609. The OMB has reviewed this collection of information under the clearance requirements of 44 U.S.C. ss. 3507.
| ITEM 1. | REPORTS TO STOCKHOLDERS. |

Closed-End Funds
31 July 2020
Nuveen
Closed-End Funds
| | |
| NSL | | Nuveen Senior Income Fund |
| JFR | | Nuveen Floating Rate Income Fund |
| JRO | | Nuveen Floating Rate Income Opportunity Fund |
| JSD | | Nuveen Short Duration Credit Opportunities Fund |
| JQC | | Nuveen Credit Strategies Income Fund |
Beginning on January 1, 2021, as permitted by regulations adopted by the Securities and Exchange Commission, paper copies of the Fund’s annual and semi-annual shareholder reports will no longer be sent by mail, unless you specifically request paper copies of the reports. Instead, the reports will be made available on the Fund’s website (www.nuveen.com), and you will be notified by mail each time a report is posted and provided with a website link to access the report.
If you already elected to receive shareholder reports electronically, you will not be affected by this change and you need not take any action. You may elect to receive shareholder reports and other communications from the Fund electronically anytime by contacting your financial intermediary (such as a broker-dealer or bank) or, if you are a direct investor, by enrolling at www.nuveen.com/client-access.
Beginning on January 1, 2019, you may elect to receive all future reports in paper free of charge. If you invest through a financial intermediary, you can contact your financial intermediary to request that you continue to receive paper copies of your shareholder reports. If you invest directly with the Fund, you can call 800-257-8787 (select option #2) to let the Fund know you wish to continue receiving paper copies of your shareholder reports or you can set your delivery preference by logging into your Investor Center account at www.computershare.com/investor and click on “Communication Preferences”. Your election to receive reports in paper will apply to all funds held in your account if you invest through your financial intermediary or all funds held with the fund complex if you invest directly with the Fund.
Annual Report
Life is Complex
Nuveen makes things e-simple.
It only takes a minute to sign up for e-Reports. Once enrolled, you’ll receive an e-mail as soon as your Nuveen Fund information is ready—no more waiting for delivery by regular mail. Just click on the link within the e-mail to see the report and save it on your computer if you wish.
Free e-Reports right to your email!
www.investordelivery.com
If you receive your Nuveen Fund dividends and statements from your financial professional or brokerage account.
or
www.nuveen.com/client-access
If you receive your Nuveen Fund dividends and statements directly from Nuveen.
NOT FDIC INSURED MAY LOSE VALUE NO BANK GUARANTEE
Table of Contents
3
Chair’s Letter to Shareholders

Dear Shareholders,
The COVID-19 crisis is taking an unprecedented toll on our health, societies, economies and financial markets. Our thoughts are with you during this time of significant disruption caused by the disease and its economic fallout. With many regions of the world suppressing the initial spread of the virus, governments and public health officials face the extraordinary challenge of balancing the resumption of economic activity with public safety. New clusters of infection emerged in the U.S. and other countries following their reopening this summer while a new school year and Northern Hemisphere flu season have added new concerns. Nevertheless, an economic recovery has gained traction, as jobs, consumer spending, manufacturing and other indicators have begun to rebound from their weakest levels. Additionally, progress toward a vaccine has been promising, while the timeline is unknown. Markets have recently taken an optimistic view, bouts of elevated volatility are likely to continue, with economic data, coronavirus infection rates and the upcoming U.S. presidential election under scrutiny.
While we do not want to understate the dampening effect on the global economy, it is important to differentiate short-term interruptions from the longer-lasting implications to the economy. Prior to the COVID-19 crisis, some areas of the global economy were showing signs of improvement after trade tensions had weighed on economic activity for much of 2019. More recently, countries that have reopened have seen marked improvement in some near-term economic indicators. Central banks and governments around the world have announced economic stimulus measures and pledged to continue doing what it takes to support their economies. In the U.S., the Federal Reserve has cut its benchmark interest rate to near zero and introduced similar programs that helped revive the U.S. economy after the 2008 financial crisis. The U.S. Government has approved three relief packages, including a $2 trillion-dollar package directly supporting businesses and individuals. The Coronavirus Aid, Relief and Economic Security Act, called the CARES Act, has provided direct payments and expanded unemployment benefits to individuals, loans and grants to small businesses, loans and other money to large corporations and funding for hospitals, public health, education and state and local governments. In the European Union, the European Central Bank recently increased the size of its Pandemic Emergency Purchase Program, known as PEPP, to $1.6 trillion from $878 billion and extended its duration to June 2021.
In the meantime, patience and a long-term perspective are key for investors. When market fluctuations are the leading headlines day after day, it’s tempting to “do something.” However, your long-term goals can’t be met with short-term thinking. We encourage you to talk to your financial professional, who can review your time horizon, risk tolerance and investment goals. On behalf of the other members of the Nuveen Fund Board, we look forward to continuing to earn your trust in the months and years ahead.
Sincerely,

Terence J. Toth
Chair of the Board
September 22, 2020
4
Portfolio Managers’ Comments
Nuveen Senior Income Fund (NSL)
Nuveen Floating Rate Income Fund (JFR)
Nuveen Floating Rate Income Opportunity Fund (JRO)
Nuveen Short Duration Credit Opportunities Fund (JSD)
Nuveen Credit Strategies Income Fund (JQC)
The Funds’ investment portfolios are managed by Symphony Asset Management, LLC (Symphony), an affiliate of Nuveen Fund Advisors, LLC, the Funds’ investment adviser. During the reporting period, Scott Caraher and Jenny Rhee managed NSL, JFR, JRO and JSD, while Scott Caraher, Jenny Rhee and Bernard Wong, CFA, managed JQC.
Effective August 17, 2020 (subsequent to the close of the reporting period), Kevin Lorenz, CFA, joins Scott Caraher as portfolio manager of NSL, JFR, JRO, JSD and JQC.
Effective September 3, 2019, Bernard Wong, CFA, was added as a portfolio manager to JQC and Sutanto Widjaja is no longer a portfolio manager on JQC. Effective August 17, 2020 (subsequent to the close of the reporting period), Bernard Wong, CFA, no longer serves as portfolio manager to JQC.
Subsequent to the close of the reporting period, management announced that effective October 1, 2020, Jenny Rhee will no longer serve as portfolio manager of NSL, JFR, JRO, JSD and JQC.
Here the team discusses economic and market conditions, their management strategies and the performance of the Funds for the twelve-month reporting period ended July 31, 2020.
What factors affected the U.S. economy and the markets during the twelve-month annual reporting period ended July 31, 2020?
The longest economic expansion in U.S. history came to an abrupt halt in early 2020 amid the COVID-19 coronavirus pandemic. To slow the spread of the virus, large portions of the economy were shut down, with companies closing either temporarily or permanently and most of the U.S. population under stay-at-home orders during March and April 2020. A phased reopening began toward the end of May, but the disruption to the economy has been swift and severe. In June 2020, the National Bureau of Economic Research announced that the economic expansion that began in June 2009 officially ended in February 2020, marking the start of a recession (a several months’ long contraction across the broad economy). As expected, the U.S. economy suffered a sharp contraction in the second quarter of 2020, with gross
This material is not intended to be a recommendation or investment advice, does not constitute a solicitation to buy, sell or hold a security or an investment strategy and is not provided in a fiduciary capacity. The information provided does not take into account the specific objectives or circumstances of any particular investor, or suggest any specific course of action. Investment decisions should be made based on an investor’s objectives and circumstances and in consultation with his or her advisors.
Certain statements in this report are forward-looking statements. Discussions of specific investments are for illustration only and are not intended as recommendations of individual investments. The forward-looking statements and other views expressed herein are those of the portfolio managers as of the date of this report. Actual future results or occurrences may differ significantly from those anticipated in any forward-looking statements and the views expressed herein are subject to change at any time, due to numerous market and other factors. The Funds disclaim any obligation to update publicly or revise any forward-looking statements or views expressed herein.
For financial reporting purposes, the ratings disclosed are the highest rating given by one of the following national rating agencies: Standard & Poor’s (S&P), Moody’s Investors Service, Inc. (Moody’s) or Fitch, Inc. (Fitch). This treatment of split-rated securities may differ from that used for other purposes, such as for Fund investment policies. Credit ratings are subject to change. AAA, AA, A and BBB are investment grade ratings, while BB, B, CCC, CC, C and D are below investment grade ratings. Holdings designated N/R are not rated by these national rating agencies.
Refer to the Glossary of Terms Used in this Report for further definition of the terms used within this section.
5
Portfolio Managers’ Comments (continued)
domestic product (GDP) down 32.9% on an annualized basis according to the Bureau of Economic Analysis “advance” estimate. GDP measures the value of goods and services produced by the nation’s economy less the value of the goods and services used up in production, adjusted for price changes. In the second quarter, steep declines in consumer spending, business investment and exports weighed on economic activity, offsetting increased government spending. By comparison, the annualized GDP growth rate shrank 5% in the first quarter of 2020, after expanding 2.4% in the fourth quarter of 2019 and 2.2% in 2019 overall.
Consumer spending, the largest driver of the economy, was well supported earlier in this reporting period by low unemployment, wage gains and tax cuts. However, the COVID-19 crisis containment measures drove a significant drop in consumer spending and a sharp rise in unemployment starting in March 2020. The Bureau of Labor Statistics said the unemployment rate rose to 10.2% in July 2020 from 3.7% in July 2019. The economy added 1.8 million jobs in July, but non-farm employment remained 12.9 million below the February 2020 level. The average hourly earnings rate appeared to soar, growing at an annualized rate of 4.8% in July 2020, despite the spike in unemployment. Earnings data were skewed by the concentration of job losses in lower-wage work, which effectively eliminated most of the low-wage data, resulting in an average of mostly higher numbers. The overall trend of inflation weakened considerably, which was attributed to large decreases in gasoline, apparel, air travel and lodging prices offsetting an increase in food prices. The Bureau of Labor Statistics said the Consumer Price Index (CPI) increased 1.0% over the twelve-month reporting period ended July 31, 2020 before seasonal adjustment.
Low mortgage rates and low inventory drove home prices moderately higher in this reporting period, although the period measured only partially reflects the shutdown. The S&P CoreLogic Case-Shiller U.S. National Home Price Index, which covers all nine U.S. census divisions, was up 4.3% year-over-year in June 2020 (most recent data available at the time this report was prepared). The 10-City and 20-City Composites reported year-over-year increases of 2.8% and 3.5%, respectively.
With economic momentum slowing in 2019 from 2018’s stronger pace, the U.S. Federal Reserve (Fed) cut its benchmark interest rate by 0.25% at each of the July 2019, September 2019 and October 2019 policy committee meetings. Markets registered disappointment with the Fed’s explanation that the rate cuts were a “mid-cycle adjustment,” rather than a prolonged easing period, and its signal that there would be no additional rate cuts in 2019. Also in the latter half of 2019, the Fed announced it would stop shrinking its bond portfolio sooner than scheduled, as well as began buying short-term Treasury bills to help money markets operate smoothly and maintain short-term borrowing rates at low levels. Fed Chairman Powell emphasized that the Treasury bill purchases were not a form of quantitative easing. The Fed continued its Treasury bill buying in January 2020, as well as left its benchmark interest rate unchanged, while noting the emerging COVID-19 risks.
As the outbreak spread to the U.S. and significant restrictions on social and economic activity were imposed starting in March 2020, the Fed enacted an array of emergency measures to stabilize the financial system and support the markets, including cutting its main interest rate to near zero, offering lending programs to aid small and large companies and allowing unlimited bond purchases, known as quantitative easing. There were no policy changes at the Fed’s April, June and July 2020 meetings, where Chairman Powell reiterated a commitment to keep rates near zero until the economy recovers and continued to issue a cautious outlook for the U.S. economy. Also at the July meeting, the Fed extended some of its pandemic funding facilities by another three months to December 2020.
Meanwhile, the U.S. government approved three aid packages, totaling more than $100 billion in funding to health agencies and employers offering paid leave and $2 trillion allocated across direct payments to Americans, an expansion of unemployment insurance, loans to large and small businesses, funding to hospitals and health agencies and support to state and local governments.
While trade and tariff policy drove market sentiment for most of the twelve-month reporting period, the outbreak of the novel coronavirus and its associated disease COVID-19 rapidly dwarfed all other market concerns starting in late February 2020. Equity and commodity markets sold-off and safe-haven assets rallied in March 2020 as China, other countries and
6
then the United States initiated quarantines, restricted travel and shuttered factories and businesses. The potential economic shock was particularly difficult to assess, which amplified market volatility. An ill-timed oil price war between the Organization of the Petroleum Exporting Countries (OPEC) and non-OPEC member Russia, which caused oil prices to plunge in March 2020, exacerbated the market sell-off.
Outside the U.S., many countries implemented lockdowns and restrictions on business activity to reduce infection rates, with a deep impact to their economies. Pandemic responses included central bank monetary easing and quantitative easing, fiscal relief programs, the loosening of fiscal rules and, in the case of emerging markets, emergency financing and debt relief from bilateral creditors and international organizations such as the International Monetary Fund and World Bank. The U.K. formally exited the European Union (EU) at the end of January 2020, triggering the one-year transition period, but Brexit talks were temporarily paused during the virus lockdown. When negotiations resumed, the U.K. continued to indicate it would not seek an extension. Italy’s prime minister unexpectedly resigned in August 2019, and the newly formed coalition government appeared to take a less antagonistic stance towards the EU. To help relieve the coronavirus impact on Italy and other more indebted Southern European countries, the European Commission proposed a €750 billion aid program to be funded by all member states, which was unanimously approved in July 2020. In Asia, northern countries were among the first to successfully reduce infection rates and relax coronavirus restrictions, but pockets of the disease re-emerged. The widespread anti-government protests roiling Hong Kong throughout 2019 had dissipated amid the lockdown, but tensions flared in late May 2020 when China unexpectedly announced a national security law perceived as a threat to Hong Kong’s sovereignty. India took stringent lockdown steps in March 2020 but still saw a rapid increase in cases. Latin American countries entered the health crisis in already weakened positions, with high government debt and widespread civil unrest. Venezuela’s economic and political crisis continued to deepen. Argentina surprised the market with the return of a less market-friendly administration but continued to pursue a restructuring of its debt. Brazil’s Bolsonaro administration achieved a legislative win on pension reform but had not fully delivered on reviving economic growth. As the pandemic spread to Latin America, the inconsistent government responses, reduced testing capabilities, weaker health care systems, food shortages and public protests contributed to accelerating infection and death rates.
Prior to the COVID-19 crisis, global markets had become more bullish on the outlook for 2020 as trade policy and Brexit appeared to make progress at the end of 2019. The U.S. and China agreed on a partial trade deal, which included rolling back some tariffs, increasing China’s purchases of U.S. agriculture products and the consideration of intellectual property, technology and financial services rights. The “phase one” deal was signed on January 15, 2020. While much of the focus remained on the U.S.-China relationship, trade spats between the U.S. and Mexico, the EU, Brazil and Argentina also arose throughout the reporting period. In January 2020, the U.S. Congress fully approved the U.S., Mexico and Canada Agreement (USMCA), which replaces the North American Free Trade Agreement. With more clarity on trade deals, the trade-related deterioration in global manufacturing and export data was expected to improve. However, the COVID-19 crisis has since upended those assumptions. Furthermore, tensions between the U.S. and China escalated amid the pandemic, with both sides stoking resentment about the management of the health crisis, Hong Kong’s sovereignty, trade policy and technology issues.
For the twelve-month reporting period, the U.S. senior loan market, as measured by the Credit Suisse Leveraged Loan Index (“the Index”), returned -1.20%. The high yield market represented by the ICE BofA U.S. High Yield Index returned 3.10%. During the first half of the reporting period, U.S. risk assets, including senior loans and high yield bonds, rose on positive and improved investor sentiment as a result of steady U.S. economic growth, accommodative U.S. monetary policy and supportive financial conditions for corporate issuers. This sentiment changed quickly with the abrupt and historic sell-off in U.S. risk assets during February and March 2020, driven by the COVID-19 crisis. This was followed by a strong recovery that was underpinned by unprecedented monetary and fiscal easing measures, combined with signs of an economic recovery.
7
Portfolio Managers’ Comments (continued)
What strategies were used to manage the Funds during the twelve-month reporting period ended July 31, 2020?
The Funds invested predominantly in first-lien, senior secured corporate loans. Symphony prefers to focus on issuers that have strong asset coverage, loans of larger issuance size and defensible businesses (business models that are less sensitive to economic cycles). These loans are generally referred to as broadly syndicated loans.
NSL seeks to achieve a high level of current income, consistent with capital preservation by investing primarily in adjustable rate U.S dollar-denominated secured senior loans. The Fund invests at least 80% of its managed assets in adjustable rate senior secured loans. Up to 20% may include U.S. dollar denominated senior loans of non-U.S. borrowers, senior loans that are not secured, other debt securities and equity securities and warrants. The Fund uses leverage. Leverage is discussed in more detail later in the Fund Leverage section of this report.
JFR seeks to achieve a high level of current income by investing in adjustable rate secured and unsecured senior loans and other debt instruments. The Fund invests at least 80% of its managed assets in adjustable rate loans, primarily senior loans, though the loans may include unsecured senior loans and secured and unsecured subordinated loans. At least 65% the Fund’s managed assets must include adjustable rate senior loans that are secured by specific collateral. The Fund uses leverage. Leverage is discussed in more detail later in the Fund Leverage section of this report.
JRO seeks to achieve a high level of current income. The Fund invests at least 80% of its managed assets in adjustable rate loans, primarily senior loans, though the loans may include unsecured senior loans and secured and unsecured subordinated loans. At least 65% of the Fund’s managed assets must include adjustable rate senior loans that are secured by specific collateral. The Fund uses leverage. Leverage is discussed in more detail later in the Fund Leverage section of this report.
JSD seeks to provide current income and the potential for capital appreciation. The Fund invests at least 70% of its managed assets in adjustable rate corporate debt instruments, including senior secured loans, second lien loans and other adjustable rate corporate debt instruments, at least 80% of “assets,” at time of purchase, in loans or securities in the issuing company’s capital structure that are senior to its common equity, including but not limited to debt securities and preferred securities. The Fund’s assets may include up to 30% of other types of debt instruments or short positions consisting primarily of high yield debt. The Fund maintains a portfolio with an average duration that does not exceed two years. The Fund uses leverage. Leverage is discussed in more detail later in the Fund Leverage section of this report.
JQC’s primary investment objective is high current income and its secondary objective is total return. The Fund invests at least 70% of its managed assets in adjustable rate senior secured and second lien loans, at least 80% of “assets,” at time of purchase, in loans or securities in the issuing company’s capital structure that are senior to its common equity, including but not limited to debt securities and preferred securities. The Fund assets may include up to 30% in other types of securities across a company’s capital structure, primarily income-oriented securities such as high yield debt, convertible securities and other forms of corporate debt. The Fund uses leverage. Leverage is discussed in more detail later in the Fund Leverage section of this report.
During the reporting period, the Funds continued to be actively managed while maintaining an overall bias towards high quality, more liquid loans relative to the Index. Heading into 2020, the Funds marginally increased exposure to lower credit quality issues on the expectations that fundamentally the economy would remain robust and there was potential for accelerated economic growth as U.S. China trade tension largely subsided. As capital markets began to sell-off in February and March 2020, the Funds took steps to reduce credit risk and leverage by increasing cash level. As the market began to recover in later March and early April 2020, the Funds added high quality loans. Later in May 2020, the Funds selectively added credit risk by increasing B-rated issues to capture the risk rally. On a relative basis, JQC added less B-rated issues than the other Funds.
8
How did the Funds perform during this twelve-month reporting period ended July 31, 2020?
The tables in the Performance Overview and Holding Summaries section of this report provide total return performance for each Fund for the one-year, five-year, ten-year and/or since inception periods ended July 31, 2020.
The Funds’ total returns at net asset value (NAV) are compared with the performance of a corresponding market index. The Funds’ total returns at NAV for the reporting period are as follows: NSL -9.89%, JFR -8.82%, JRO -8.91%, JSD -11.19% and JQC -5.91%. During the reporting period the Credit Suisse Leveraged Loan Index returned -1.20%. The Funds’ performance versus the Index reflected underperformance during the second half of the reporting period, most notably during the massive sell-off in March 2020.
During the first half of the reporting period, U.S. risk assets, including senior loans and high yield bonds, rose on positive and improved investor sentiment as a result of steady U.S. economic growth, accommodative U.S. monetary policy and supportive financial conditions for corporate issuers. These market advances occurred despite periodic spikes in volatility due to the ebb and flow of investor concern toward major macro issues, including but not limited to U.S. and China economic resilience, U.S.-China trade negotiations, U.S.-Iranian tensions and Brexit. Macro anxiety aside, the fundamental environment during the reporting period was conducive to corporate operating conditions, as well as loan and high yield bond returns with the latter only somewhat impacted by retail supply and demand dynamics. For the first half of the reporting period, the Funds outperformed the index, with the exception of JSD.
The second half of the reporting period reflected an abrupt and historic sell-off in the U.S. for risk assets followed by a strong recovery. Risk assets including senior loans sold off by degrees not seen since the 2008 financial crisis, as the COVID-19 crisis evolved during February and March 2020. During the reporting period, several catalyst driven holdings declined sharply following extreme capital markets volatility. Additionally, the Funds sold some liquid loans at discounted levels in order to increase cash levels and reduce leverage.
What other factors impacted Fund Performance?
Several factors contributed to the Funds’ underperformance versus the Credit Suisse Leveraged Loan Index including disappointing results within the energy sector. The Funds’ exposure to Fieldwood Energy LLC and California Resources Corporation detracted from performance. Fieldwood Energy is an independent oil and gas services company in the Gulf of Mexico. Heading into 2020, the company was well positioned to bring several deep-water oil fields online to increase production, which would have driven revenue and earnings before interest, taxes, depreciation, and amortization (EBITDA) growth, boosted margins and substantially reduced leverage. The business plan was disrupted by the unprecedented and unforeseen drop in oil prices as a result of oversupply of crude oil from production increases from both Russia and Saudi Arabia, combined with dramatically lower refined product demand stemming from the COVID-19 crisis. As a result, loan prices dropped severely in March 2020. In addition, loans of California Resources, the single largest independent oil producer in California, came under severe pressure following extreme volatility in oil prices in March 2020. The loans of Fieldwood Energy and California Resources were the largest detractors for the Funds for the reporting period. While oil prices recovered strongly in the second quarter of 2020, these loans did not recover as they continued to work with lenders on potential restructuring. The Funds are working through the restructurings of these holdings. Both companies have highly attractive oil portfolios, and there is meaningful upside in these loans should oil price recover to its long-term historical average. The Funds continue to own Fieldwood Energy and California Resources.
In addition, disappointing issue selection and overweight in the communication services sector detracted from performance versus the Credit Suisse Leveraged Loan Index, most notably the bonds of Intelsat S.A. In early February 2020, the Federal Communications Commission (FCC) announced that it was moving forward with the C-band process, assigning nearly $5 billion of incentive payment/reimbursement to Intelsat. It was widely expected that Intelsat could raise funding in the capital markets following the FCC’s decision to pay down existing bond debt. However, liquidity in the capital markets essentially evaporated in March 2020 as volatility spiked, particularly for CCC rated issuers like Intelsat. The
9
Portfolio Managers’ Comments (continued)
company was not able to raise liquidity in the capital markets and filed for restructuring in May 2020. As part of filing, Intelsat secured $1 billion in debtor-in-possession (DIP) financing, which will allow the company to proceed with the FCC process. It’s worth noting that the loans of Intelsat contributed positively during the reporting period as the restructuring was favorable to senior loan holders. The Funds continue to hold positions in Intelsat.
Lastly, overall exposure to equities received from reorganizations detracted from performance versus the Credit Suisse Leveraged Loan Index during the reporting period, most notably the reorganization equity of iHeart Communications Inc. In December 2019, Liberty Media announced that they wanted to increase their stake in iHeart to 50%, boosting its share price. The acquisition required Department of Justice’s approval and as the COVID-19 crisis hit markets the approval was delayed and the stock was dragged down with overall equity markets. The Funds reduced exposure to iHeart equity during the reporting period.
Partially offsetting the negative returns was an active overweight within the utilities sector as a result of large exposure in Pacific Gas and Electric Co (PG&E). The loan and bond prices of PG&E began to rise as the company progresses towards an exit from bankruptcy. Upon emerging from bankruptcy, prices of its bonds and loans rose further as the company issued new debt that was oversubscribed, indicating strong capital markets access and improving credit profile. The Funds continue to hold positions in PG&E.
In addition, strong issuer selection within the consumer discretionary sector contributed to performance versus the Credit Suisse Leveraged Loan Index. The Funds were significantly underweight relative to the Index brick-and-mortar retailers. For example, the Funds had no exposure to J.C. Penny Corporation, which was hit hard by the COVID-19 crisis. Additionally, PetSmart loans recovered strongly in late March 2020 and the second quarter of 2020, driven by better than expected earnings results and improved liquidity profile following bond issuances. The Funds continue to hold positions in PetSmart.
While exposure to equities received from reorganizations was overall negative to the Funds’ performance versus the Credit Suisse Leveraged Loan Index, the reorganization equity of Avaya, Inc. was a top contributor for the reporting period for JFR, JRO, NSL and JSD. Shares of the company rallied following stronger-than-expected earnings outlook. The Funds took advantage of the rise in share price to reduce the position.
During the reporting period, JSD underperformed the other Funds notably due to higher exposure for equities received from reorganizations, including iHeart, as well as higher exposure to Intelsat, Fieldwood Energy and California Resources.
JSD continued to invest in credit default swaps, which were used to provide a benefit if particular bonds’ credit quality worsened. During the reporting period these credit default swaps had a positive impact on overall Fund performance.
The Funds are managed in a similar manner; however, JQC has a differentiated mandate relative to the other Funds. JQC’s credit quality profile is higher relative to the other Funds. While credit quality positioning was not a key driver for performance during the reporting period, JQC’s larger overweight to BBB- rated issues contributed positively to performance relative to the other Funds. Another reason for JQC’s outperformance relative to the other Funds was less exposure to aforementioned detractors, including (on a relative basis) underweighted Fieldwood Energy and California Resources, less exposure to equities received from reorganizations, especially iHeart and notably less exposure to Intelsat bonds. Finally, JQC has a higher allocation to high yield bonds. During the reporting period, good issue selection within high yield bonds resulted to outperformance relative to the other Funds.
10
Fund Leverage
IMPACT OF THE FUNDS’ LEVERAGE STRATEGIES ON PERFORMANCE
One important factor impacting the returns of the Funds’ common shares relative to their cmparitive benchmarks was the Funds’ use of leverage through bank borrowings, Term Preferred Shares (Term Preferred) for NSL, JFR and JRO, Taxable Fund Preferred Shares (TFP) for JSD and reverse repurchase agreements for JQC. The Funds use leverage because our research has shown that, over time, leveraging provides opportunities for additional income. The opportunity arises when short-term rates that a Fund pays on its leveraging instruments are lower than the interest the Fund earns on its portfolio securities that it has bought with the proceeds of that leverage. This has been particularly true in the recent market environment where short-term rates have been low by historical standards.
However, use of leverage can expose Fund common shares to additional price volatility. When a Fund uses leverage, the Fund’s common shares will experience a greater increase in their net asset value if the securities acquired through the use of leverage increase in value, but will also experience a correspondingly larger decline in their net asset value if the securities acquired through leverage decline in value. All this will make the shares’ total return performance more variable over time.
In addition, common share income in levered funds will typically decrease in comparison to unlevered funds when shortterm interest rates increase and increase when short-term interest rates decrease. In recent quarters, fund leverage expenses have generally tracked the overall movement of short-term interest rates. While fund leverage expenses are somewhat higher than their recent lows, leverage nevertheless continues to provide the opportunity for incremental common share income, particularly over longer-term periods.
The Funds’ use of leverage had a negative impact on total return performance during this reporting period. The negative impact of leverage during the brief but severe COVID-19 induced market downturn in March was greater than the positive impact of leverage during the remainder of the reporting period. More specifically, this net negative contribution of leverage was amplified during the market downturn in part because the Fund used proceeds from portfolio sales to reduce its elevated leverage ratio, which rose as prices of portfolio securities, including those sold for de-levering purposes, declined. Conversely, as financial markets recovered and asset prices steadied, the Fund gradually increased leverage levels, using proceeds to purchase new portfolio securities at generally higher prices. Management believes, however, that the potential benefits from leverage continue to outweigh the associated increase in risk and total return variability previously described.
During the current fiscal period, NSL, JFR and JRO used cancellable interest rate swaps in which each Fund received payments based upon pre-determined fixed rates and paid one-month LIBOR plus a fixed spread. After a non-callable period, the swap counterparty owns the right on future monthly dates to terminate the swap at par. The purpose of the cancellable interest rate swap is to convert a fixed rate Term Preferred Share issuance to floating rate, and the cancellation dates of the swap correspond to dates on which the Funds can call the Term Preferred Share issue. Collectively, these interest rate swap contracts had a negligible impact on the Funds’ total return performance during the period.
As of July 31, 2020, the Funds’ percentages of leverage are as shown in the accompanying table.
| | | | | | | | | | | | | | | | | | | | |
| | | NSL | | | JFR | | | JRO | | | JSD | | | JQC | |
Effective Leverage* | | | 35.81 | % | | | 35.79 | % | | | 35.74 | % | | | 35.77 | % | | | 35.75 | % |
Regulatory Leverage* | | | 35.81 | % | | | 35.79 | % | | | 35.74 | % | | | 35.77 | % | | | 30.12 | % |
| * | Effective leverage is a Fund’s effective economic leverage, and includes both regulatory leverage and the leverage effects of reverse repurchase agreements, certain derivatives and other investments in a Fund’s portfolio that increase the Fund’s investment exposure. Regulatory leverage consists of preferred shares issued or borrowings of a Fund. Both of these are part of a Fund’s capital structure. A Fund, however, may from time to time borrow on a typically transient basis in connection with its day-to-day operations, primarily in connection with the need to settle portfolio trades. Such incidental borrowings are excluded from the calculation of a Fund’s effective leverage ratio. Regulatory leverage is subject to asset coverage limits set forth in the Investment Company Act of 1940. |
11
Fund Leverage (continued)
THE FUNDS’ LEVERAGE
Bank Borrowings
As noted above, the Funds employ leverage through the use of bank borrowings. The Funds’ bank borrowing activities are as shown in the accompanying table. Paydowns reflect on-going leverage management activity that seeks to maintain each Fund’s leverage ratio within a specified internal operating range.
| | | | | | | | | | | | | | | | | | | | | | | | | | | | | | | | | | | | |
| | | Current Reporting Period | | | | | | Subsequent to the Close of
the Reporting Period | |
| Fund | | Outstanding
Balance as of
August 1, 2019 | | | Draws | | | Paydowns | | | Outstanding
Balance as of
July 31, 2020 | | | Average Balance
Outstanding | | | | | | Draws | | | Paydowns | | | Outstanding
Balance as of
September 28, 2020 | |
NSL | | $ | 114,000,000 | | | $ | 13,400,000 | | | $ | (41,200,000 | ) | | $ | 86,200,000 | | | $ | 100,082,514 | | | | | | | $ | 21,000,000 | | | $ | — | | | $ | 107,200,000 | |
JFR | | $ | 264,500,000 | | | $ | 57,600,000 | | | $ | (114,000,000 | ) | | $ | 208,100,000 | | | $ | 243,599,180 | | | | | | | $ | 8,000,000 | | | $ | — | | | $ | 216,100,000 | |
JRO | | $ | 178,800,000 | | | $ | 63,700,000 | | | $ | (77,600,000 | ) | | $ | 164,900,000 | | | $ | 171,530,601 | | | | | | | $ | 6,000,000 | | | $ | — | | | $ | 170,900,000 | |
JSD | | $ | 72,000,000 | | | $ | 8,500,000 | | | $ | (72,000,000 | ) | | $ | 8,500,000 | | | $ | 23,569,841 | | | | | | | $ | 1,500,000 | | | $ | — | | | $ | 10,000,000 | |
JQC | | $ | 480,000,000 | | | $ | 35,000,000 | | | $ | (113,000,000 | ) | | $ | 402,000,000 | | | $ | 427,565,574 | | | | | | | $ | 3,000,000 | | | $ | — | | | $ | 405,000,000 | |
Refer to Notes to Financial Statements, Note 8 – Fund Leverage and Note 10 – Subsequent Events for further details.
Reverse Repurchase Agreements
As noted previously, in addition to bank borrowings, JQC also used reverse repurchase agreements, in which the Fund sells to a counterparty a security that it holds with a contemporaneous agreement to repurchase the same security at an agreed-upon price and date. The Fund’s transactions in reverse repurchase agreements are as shown in the accompanying table. Sales reflect on-going leverage management activity that seeks to maintain the Fund’s leverage ratio within a specified internal operating range.
| | | | | | | | | | | | | | | | | | | | | | | | | | | | | | | | | | |
| Current Reporting Period | | | | | | Subsequent to the Close of
the Reporting Period | |
Outstanding
Balance as of
August 1, 2019 | | | Sales | | | Purchases | | | Outstanding
Balance as of
July 31, 2020 | | | Average Balance
Outstanding | | | | | | Sales | | | Purchases | | | Outstanding
Balance as of
September 28, 2020 | |
| | $213,000,000 | | | | $(108,000,000) | | | | $12,000,000 | | | | $117,000,000 | | | | $175,426,230 | | | | | | | | $ — | | | | $ — | | | | $117,000,000 | |
Refer to Notes to Financial Statements, Note 8 – Fund Leverage for further details.
Term Preferred Shares
As noted previously, in addition to bank borrowings, the following Funds also issued Term Preferred. The Funds' transactions in Term Preferred are as shown in the accompanying table. Redemptions reflect on-going leverage management activity that seeks to maintain each Fund’s leverage ratio within a specified internal operating range.
| | | | | | | | | | | | | | | | | | | | | | | | | | | | | | | | | | | | |
| | | Current Reporting Period | | | | | | | | | Subsequent to the Close of
the Reporting Period | |
| Fund | | Outstanding
Balance as of
August 1, 2019 | | | Issuance | | | Redemptions | | | Outstanding
Balance as of
July 31, 2020 | | | Average Balance
Outstanding | | | | | | Issuance | | | Redemptions | | | Outstanding
Balance as of
September 28, 2020 | |
NSL | | $ | 43,000,000 | | | $ | — | | | $ | (10,000,000 | ) | | $ | 33,000,000 | | | $ | 39,994,536 | | | | | | | $ | — | | | $ | (18,000,000 | ) | | $ | 15,000,000 | |
JFR | | $ | 115,000,000 | | | $ | — | | | $ | (25,000,000 | ) | | $ | 90,000,000 | | | $ | 97,923,497 | | | | | | | $ | — | | | $ | — | | | $ | 90,000,000 | |
JRO | | $ | 84,000,000 | | | $ | — | | | $ | (39,000,000 | ) | | $ | 45,000,000 | | | $ | 65,393,443 | | | | | | | $ | — | | | $ | — | | | $ | 45,000,000 | |
JSD* | | $ | 35,000,000 | | | $ | — | | | $ | (35,000,000 | ) | | $ | — | | | $ | 35,000,000 | | | | | | | $ | — | | | $ | — | | | $ | — | |
| * | For the period August 1, 2019 through October 29, 2019. |
12
Refer to Notes to Financial Statements, Note 5 – Fund Shares and Note 10 – Subsequent Events for further details on Term Preferred.
Taxable Fund Preferred Shares
As noted previously, in addition to bank borrowings, JSD also issued TFP. The Fund’s transactions in TFP are as shown in the accompanying table. Redemptions reflect on-going leverage management activity that seeks to maintain the Fund’s leverage ratio within a specified internal operating range.
| | | | | | | | | | | | | | | | | | | | | | | | | | | | | | | | | | |
| Current Reporting Period | | | | | | Subsequent to the Close of
the Reporting Period | |
Outstanding
Balance as of
August 1, 2019 | | | Issuance | | | Redemptions | | | Outstanding
Balance as of
July 31, 2020 | | | Average Balance
Outstanding* | | | | | | Issuance | | | Redemptions | | | Outstanding
Balance as of
September 28, 2020 | |
| | $ — | | | | $100,000,000 | | | | $(30,000,000) | | | | $70,000,000 | | | | $87,212,766 | | | | | | | | $ — | | | | $ — | | | | $70,000,000 | |
| * | For the period October 24, 2019 (first issuance of shares) through July 31, 2020. |
Refer to Notes to Financial Statements, Note 5 – Fund Shares for further details on TFP.
13
Common Share Information
NSL, JFR, JRO and JSD COMMON SHARE DISTRIBUTION INFORMATION
The following information regarding NSL’s, JFR’s, JRO’s and JSD’s distributions is current as of July 31, 2020. Each Fund’s distribution levels may vary over time based on each Fund’s investment activity and portfolio investment value changes.
During the current reporting period, each Fund’s distributions to common shareholders were as shown in the accompanying table.
| | | | | | | | | | | | | | | | |
| | | Per Common Share Amounts | |
| Monthly Distribution (Ex-Dividend Date) | | NSL | | | JFR | | | JRO | | | JSD | |
August 2019 | | $ | 0.0375 | | | $ | 0.0615 | | | $ | 0.0625 | | | $ | 0.1035 | |
September | | | 0.0365 | | | | 0.0615 | | | | 0.0605 | | | | 0.0965 | |
October | | | 0.0365 | | | | 0.0615 | | | | 0.0605 | | | | 0.0965 | |
November | | | 0.0365 | | | | 0.0615 | | | | 0.0605 | | | | 0.0965 | |
December | | | 0.0365 | | | | 0.0615 | | | | 0.0605 | | | | 0.0915 | |
January | | | 0.0365 | | | | 0.0615 | | | | 0.0605 | | | | 0.0915 | |
February | | | 0.0365 | | | | 0.0615 | | | | 0.0605 | | | | 0.0915 | |
March | | | 0.0365 | | | | 0.0615 | | | | 0.0605 | | | | 0.0915 | |
April | | | 0.0350 | | | | 0.0570 | | | | 0.0560 | | | | 0.0875 | |
May | | | 0.0350 | | | | 0.0570 | | | | 0.0560 | | | | 0.0875 | |
June | | | 0.0305 | | | | 0.0460 | | | | 0.0450 | | | | 0.0705 | |
July 2020 | | | 0.0305 | | | | 0.0460 | | | | 0.0450 | | | | 0.0705 | |
Total Distributions from Net Investment Income | | $ | 0.4240 | | | $ | 0.6980 | | | $ | 0.6880 | | | $ | 1.0750 | |
| | | | | | | | | | | | | | | | | |
Current Distribution Rate* | | | 7.66 | % | | | 6.87 | % | | | 6.78 | % | | | 7.27 | % |
| * | Current distribution rate is based on the Fund’s current annualized monthly distribution divided by the Fund’s current market price. The Fund’s monthly distributions to its shareholders may be comprised of ordinary income, net realized capital gains and, if at the end of the fiscal year the Fund’s cumulative net ordinary income and net realized gains are less than the amount of the Fund’s distributions, a return of capital for tax purposes. |
NSL, JFR, JRO and JSD seek to pay regular monthly dividends out of their net investment income at a rate that reflects their past and projected net income performance. To permit each Fund to maintain a more stable monthly dividend, the Fund may pay dividends at a rate that may be more or less than the amount of net income actually earned by the Fund during the period. Distributions to common shareholders are determined on a tax basis, which may differ from amounts recorded in the accounting records. In instances where the monthly dividend exceeds the earned net investment income, the Fund would report a negative undistributed net ordinary income. Refer to Note 6 – Income Tax Information for additional information regarding the amounts of undistributed net ordinary income and undistributed net long-term capital gains and the character of the actual distributions paid by the Fund during the period.
All monthly dividends paid by NSL, JFR, JRO and JSD during the current reporting period were paid from net investment income. If a portion of the Fund’s monthly distributions is sourced or comprised of elements other than net investment income, including capital gains and/or a return of capital, shareholders will be notified of those sources. For financial reporting purposes, the per share amounts of each Fund’s distributions for the reporting period are presented in this report’s Financial Highlights. For income tax purposes, distribution information for each Fund as of its most recent tax year end is presented in Note 6 – Income Tax Information within the Notes to Financial Statements of this report.
14
JQC DISTRIBUTION INFORMATION
The following information regarding JQC’s distributions is current as of July 31, 2020.
JQC has a capital return plan where a supplemental amount is expected to be included in the Fund’s regular monthly distribution. Under this program, the Fund’s regular monthly distribution is expected to include net investment income, return of capital and potentially capital gains for tax purposes.
The figures in the table below provide the sources (for tax purposes) of the Fund’s distributions as of July 31, 2020. These source include amounts attributable to realized gains and/or returns of capital. The Fund attributes these non-income sources equally to each regular distribution throughout the fiscal year. The information shown below is for the distributions paid on common shares for all months in the current fiscal year. These should not be used for tax reporting purposes, and the distribution sources may differ for financial reporting than for tax reporting. The final determination of the tax characteristics of all distributions paid in 2020 will be made in early 2021 and reported to you on Form 1099-DIV. More details about the tax characteristics of the Fund’s distributions are available on www.nuveen.com/CEFdistributions.
Data as of July 31, 2020
| | | | | | | | | | | | | | | | | | | | | | | | | | | | |
Current Month
Percentage of Distributions | | | | | Calendar YTD
Per Share Amounts | |
Net
Investment
Income | | | Realized
Gains | | | Return of
Capital | | | | | Total
Distributions | | | Net
Investment
Income | | | Realized
Gains | | | Return of
Capital | |
| | 34.56% | | | | 0.00% | | | | 65.44% | | | | | | $1.1323 | | | | $0.3913 | | | | $0.0000 | | | | $0.7410 | |
The following table provides information regarding Fund distributions and total return performance over various time periods. This information is intended to help you better understand whether Fund returns for the specified time periods were sufficient to meet Fund distributions.
Data as of July 31, 2020
| | | | | | | | | | | | | | | | | | | | | | | | | | | | |
| | | | | | | | Annualized | | | | | Cumulative | |
Inception
Date | | Latest
Monthly
Per Share
Distribution | | | | | Current
Distribution on
NAV | | | 1-Year
Return on
NAV | | | 5-Year
Return on
NAV | | | | | Calendar YTD
Distributions on
NAV | | | Calendar
YTD Return
on NAV | |
| 6/25/2003 | | | $0.0810 | | | | | | 14.13% | | | | (5.91)% | | | | 1.69% | | | | | | 8.94% | | | | (8.26)% | |
NUVEEN CLOSED-END FUND DISTRIBUTION AMOUNTS
The Nuveen Closed-End Funds’ monthly and quarterly periodic distributions to shareholders are posted on www.nuveen.com and can be found on Nuveen’s enhanced closed-end fund resource page, which is at https://www.nuveen.com/resource-center-closed-end-funds, along with other Nuveen closed-end fund product updates. To ensure timely access to the latest information, shareholders may use a subscribe function, which can be activated at this web page (https://www.nuveen.com/subscriptions).
COMMON SHARE REPURCHASES
During August 2020 (subsequent to the close of the reporting period), the Funds’ Board of Trustees reauthorized an open-market share repurchase program, allowing each Fund to repurchase an aggregate of up to approximately 10% of its outstanding common shares.
15
Common Share Information (continued)
As of July 31, 2020, and since the inception of the Funds’ repurchase programs, the Funds have cumulatively repurchased and retired their outstanding common shares as shown in the accompanying table.
| | | | | | | | | | | | | | | | | | | | |
| | | NSL | | | JFR | | | JRO | | | JSD | | | JQC | |
Common shares cumulatively repurchased and retired | | | 15,400 | | | | 147,593 | | | | 39,400 | | | | 10,000 | | | | 5,473,400 | |
Common shares authorized for repurchase | | | 3,860,000 | | | | 5,690,000 | | | | 4,050,000 | | | | 1,005,000 | | | | 13,560,000 | |
During the current reporting period, the following Fund repurchased and retired its common shares at a weighted average price per share and a weighted average discount per share as shown in the following table.
| | | | |
| | | JSD | |
Common shares repurchased and retired | | | 10,000 | |
Weighted average price per common share repurchased and retired | | | $11.56 | |
Weighted average discount per common share repurchased and retired | | | 17.15 | % |
OTHER COMMON SHARE INFORMATION
As of July 31, 2020, and during the current reporting period, the Funds’ common share prices were trading at a premium/(discount) to their common share NAVs as shown in the accompanying table.
| | | | | | | | | | | | | | | | | | | | |
| | | NSL | | | JFR | | | JRO | | | JSD | | | JQC | |
Common share NAV | | | $5.53 | | | | $9.40 | | | | $9.31 | | | | $13.98 | | | | $6.88 | |
Common share price | | | $4.78 | | | | $8.03 | | | | $7.97 | | | | $11.64 | | | | $5.88 | |
Premium/(Discount) to NAV | | | (13.56 | )% | | | (14.57 | )% | | | (14.39 | )% | | | (16.74 | )% | | | (14.53 | )% |
12-month average premium/(discount) to NAV | | | (11.98 | )% | | | (11.89 | )% | | | (11.93 | )% | | | (11.45 | )% | | | (10.67 | )% |
16
THIS PAGE INTENTIONALLY LEFT BLANK
17
| | |
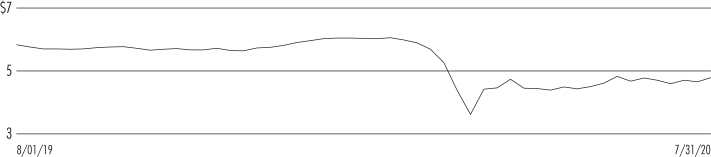
| NSL | | Nuveen Senior Income Fund Performance Overview and Holding Summaries as of July 31, 2020 |
Refer to Glossary of Terms Used in this Report for further definition of the terms used within this section.
Average Annual Total Returns as of July 31, 2020
| | | | | | | | | | | | |
| | | Average Annual | |
| | | 1-Year | | | 5-Year | | | 10-Year | |
| NSL at Common Share NAV | | | (9.89)% | | | | 1.50% | | | | 4.75% | |
| NSL at Common Share Price | | | (12.19)% | | | | 1.64% | | | | 3.43% | |
| Credit Suisse Leveraged Loan Index | | | (1.20)% | | | | 3.31% | | | | 4.38% | |
Past performance is not predictive of future results. Current performance may be higher or lower than the data shown. Returns do not reflect the deduction of taxes that shareholders may have to pay on Fund distributions or upon the sale of Fund shares. Returns at NAV are net of Fund expenses, and assume reinvestment of distributions. Comparative index return information is provided for the Fund’s shares at NAV only. Indexes are not available for direct investment.
Common Share Price Performance — Weekly Closing Price
18
This data relates to the securities held in the Fund’s portfolio of investments as of the end of the reporting period. It should not be construed as a measure of performance for the Fund itself. Holdings are subject to change.
For financial reporting purposes, the ratings disclosed are the highest rating given by one of the following national rating agencies: Standard & Poor’s Group, Moody’s Investors Service, Inc. or Fitch, Inc. This treatment of split-rated securities may differ from that used for other purposes, such as for Fund investment policies. Credit ratings are subject to change. AAA, AA, A and BBB are investment grade ratings; BB, B, CCC, CC, C and D are below-investment grade ratings. Holdings designated N/R are not rated by these national rating agencies.
Fund Allocation
(% of net assets)
| | | | |
| Variable Rate Senior Loan Interests | | | 134.4% | |
| Corporate Bonds | | | 16.0% | |
| Common Stocks | | | 2.0% | |
| Warrants | | | 0.0% | |
| Convertible Preferred Securities | | | 0.0% | |
| Common Stock Rights | | | 0.0% | |
| Short-Term Investment Companies | | | 7.2% | |
| Other Assets Less Liabilities | | | (3.9)% | |
| Net Assets Plus Borrowings and Term Preferred Shares, net of deferred offering costs | | | 155.7% | |
| Borrowings | | | (40.3)% | |
| Term Preferred Shares, net of deferred offering costs | | | (15.4)% | |
| Net Assets | | | 100% | |
Top Five Issuers
(% of total long-term investments)
| | | | |
| Pacific Gas & Electric Co | | | 3.0% | |
| Intelsat SA | | | 2.4% | |
| Burger King Corporation | | | 2.0% | |
| Seattle SpinCo Inc | | | 1.5% | |
| Dell International LLC | | | 1.5% | |
Portfolio Composition
(% of total investments)
| | | | |
| Media | | | 12.7% | |
| Hotels, Restaurants & Leisure | | | 9.3% | |
| Software | | | 7.7% | |
| Health Care Providers & Services | | | 5.9% | |
| Electric Utilities | | | 4.3% | |
| Diversified Telecommunication Services | | | 3.9% | |
| Communications Equipment | | | 3.3% | |
| Pharmaceuticals | | | 3.1% | |
| Oil, Gas & Consumable Fuels | | | 2.8% | |
| IT Services | | | 2.8% | |
| Commercial Services & Supplies | | | 2.6% | |
| Technology Hardware, Storage & Peripherals | | | 2.2% | |
| Health Care Technology | | | 1.9% | |
| Food & Staples Retailing | | | 1.8% | |
| Aerospace & Defense | | | 1.7% | |
| Auto Components | | | 1.7% | |
| Professional Services | | | 1.6% | |
| Insurance | | | 1.5% | |
| Airlines | | | 1.4% | |
| Specialty Retail | | | 1.4% | |
| Road & Rail | | | 1.3% | |
| Internet Software & Services | | | 1.2% | |
| Other1 | | | 19.4% | |
| Short-Term Investment Companies | | | 4.5% | |
Total | | | 100% | |
Portfolio Credit Quality
(% of total long-term fixed income investments)
| | | | |
| BBB | | | 12.3% | |
| BB or Lower | | | 83.9% | |
| N/R (not rated) | | | 3.8% | |
Total | | | 100% | |
| 1 | See Portfolio of Investments for details on “other” Portfolio Composition. |
19
| | |
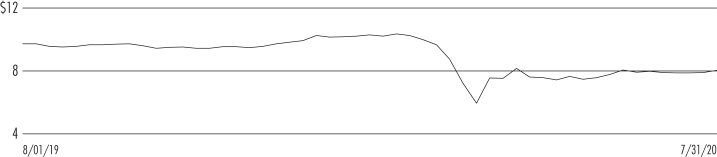
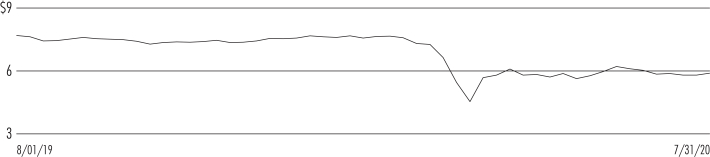
| JFR | | Nuveen Floating Rate Income Fund Performance Overview and Holding Summaries as of July 31, 2020 |
Refer to Glossary of Terms Used in this Report for further definition of the terms used within this section.
Average Annual Total Returns as of July 31, 2020
| | | | | | | | | | | | |
| | | Average Annual | |
| | | 1-Year | | | 5-Year | | | 10-Year | |
| JFR at Common Share NAV | | | (8.82)% | | | | 1.78% | | | | 4.82% | |
| JFR at Common Share Price | | | (10.98)% | | | | 1.57% | | | | 3.86% | |
| Credit Suisse Leveraged Loan Index | | | (1.20)% | | | | 3.31% | | | | 4.38% | |
Past performance is not predictive of future results. Current performance may be higher or lower than the data shown. Returns do not reflect the deduction of taxes that shareholders may have to pay on Fund distributions or upon the sale of Fund shares. Returns at NAV are net of Fund expenses, and assume reinvestment of distributions. Comparative index return information is provided for the Fund’s shares at NAV only. Indexes are not available for direct investment.
Common Share Price Performance — Weekly Closing Price
20
This data relates to the securities held in the Fund’s portfolio of investments as of the end of the reporting period. It should not be construed as a measure of performance for the Fund itself. Holdings are subject to change.
For financial reporting purposes, the ratings disclosed are the highest rating given by one of the following national rating agencies: Standard & Poor’s Group, Moody’s Investors Service, Inc. or Fitch, Inc. This treatment of split-rated securities may differ from that used for other purposes, such as for Fund investment policies. Credit ratings are subject to change. AAA, AA, A and BBB are investment grade ratings; BB, B, CCC, CC, C and D are below-investment grade ratings. Holdings designated N/R are not rated by these national rating agencies.
Fund Allocation
(% of net assets)
| | | | |
| Variable Rate Senior Loan Interests | | | 132.4% | |
| Corporate Bonds | | | 16.1% | |
| Common Stocks | | | 2.0% | |
| Long-Term Investment Companies | | | 1.8% | |
| Asset-Backed Securities | | | 0.6% | |
| Warrants | | | 0.0% | |
| Convertible Preferred Securities | | | 0.0% | |
| Common Stock Rights | | | 0.0% | |
| Short-Term Investment Companies | | | 8.4% | |
| Other Assets Less Liabilities | | | (5.7)% | |
| Net Assets Plus Borrowings and Term Preferred Shares, net of deferred offering costs | | | 155.6% | |
| Borrowings | | | (38.9)% | |
| Term Preferred Shares, net of deferred offering costs | | | (16.7)% | |
Net Assets | | | 100% | |
Top Five Issuers
(% of total long-term investments)
| | | | |
| Pacific Gas and Electric Co | | | 3.8% | |
| Burger King Corporation | | | 2.6% | |
| Intelsat SA | | | 2.1% | |
| Dell International LLC | | | 1.5% | |
| iHeartCommunications Inc | | | 1.5% | |
Portfolio Composition
(% of total investments)
| | | | |
| Media | | | 12.7% | |
| Hotels, Restaurants & Leisure | | | 10.1% | |
| Software | | | 6.8% | |
| Health Care Providers & Services | | | 6.2% | |
| Electric Utilities | | | 4.2% | |
| Pharmaceuticals | | | 3.5% | |
| Diversified Telecommunication Services | | | 3.5% | |
| Communications Equipment | | | 3.3% | |
| Oil, Gas & Consumable Fuels | | | 2.8% | |
| IT Services | | | 2.4% | |
| Commercial Services & Supplies | | | 2.4% | |
| Technology Hardware, Storage & Peripherals | | | 2.0% | |
| Food & Staples Retailing | | | 1.7% | |
| Health Care Technology | | | 1.6% | |
| Aerospace & Defense | | | 1.6% | |
| Household Products | | | 1.6% | |
| Auto Components | | | 1.6% | |
| Insurance | | | 1.5% | |
| Professional Services | | | 1.4% | |
| Internet Software & Services | | | 1.2% | |
| Specialty Retail | | | 1.2% | |
| Airlines | | | 1.2% | |
| Other1 | | | 18.8% | |
| Long-Term Investment Companies | | | 1.1% | |
| Asset-Backed Securities | | | 0.4% | |
| Short-Term Investment Companies | | | 5.2% | |
Total | | | 100% | |
Portfolio Credit Quality
(% of total long-term fixed income investments)
| | | | |
| BBB | | | 12.7% | |
| BB or Lower | | | 84.0% | |
| N/R (not rated) | | | 3.3% | |
Total | | | 100% | |
| 1 | See Portfolio of Investments for details on “other” Portfolio Composition. |
21
| | |
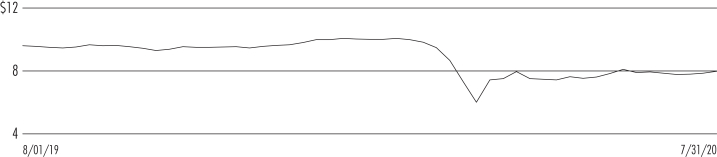
| JRO | | Nuveen Floating Rate Income Opportunity Fund Performance Overview and Holding Summaries as of July 31, 2020 |
Refer to Glossary of Terms Used in this Report for further definition of the terms used within this section.
Average Annual Total Returns as of July 31, 2020
| | | | | | | | | | | | |
| | | Average Annual | |
| | | 1-Year | | | 5-Year | | | 10-Year | |
| JRO at Common Share NAV | | | (8.91)% | | | | 1.72% | | | | 5.21% | |
| JRO at Common Share Price | | | (11.13)% | | | | 1.35% | | | | 3.69% | |
| Credit Suisse Leveraged Loan Index | | | (1.20)% | | | | 3.31% | | | | 4.38% | |
Past performance is not predictive of future results. Current performance may be higher or lower than the data shown. Returns do not reflect the deduction of taxes that shareholders may have to pay on Fund distributions or upon the sale of Fund shares. Returns at NAV are net of Fund expenses, and assume reinvestment of distributions. Comparative index return information is provided for the Fund’s shares at NAV only. Indexes are not available for direct investment.
Common Share Price Performance — Weekly Closing Price
22
This data relates to the securities held in the Fund’s portfolio of investments as of the end of the reporting period. It should not be construed as a measure of performance for the Fund itself. Holdings are subject to change.
For financial reporting purposes, the ratings disclosed are the highest rating given by one of the following national rating agencies: Standard & Poor’s Group, Moody’s Investors Service, Inc. or Fitch, Inc. This treatment of split-rated securities may differ from that used for other purposes, such as for Fund investment policies. Credit ratings are subject to change. AAA, AA, A and BBB are investment grade ratings; BB, B, CCC, CC, C and D are below-investment grade ratings. Holdings designated N/R are not rated by these national rating agencies.
Fund Allocation
(% of net assets)
| | | | |
| Variable Rate Senior Loan Interests | | | 132.6% | |
| Corporate Bonds | | | 15.8% | |
| Common Stocks | | | 2.2% | |
| Asset-Backed Securities | | | 0.6% | |
| Warrants | | | 0.0% | |
| Convertible Preferred Securities | | | 0.0% | |
| Common Stock Rights | | | 0.0% | |
| Short-Term Investment Companies | | | 8.8% | |
| Other Assets Less Liabilities | | | (4.5)% | |
| Net Assets Plus Borrowings and Term Preferred Shares, net of deferred offering costs | | | 155.5% | |
| Borrowings | | | (43.7)% | |
| Term Preferred Shares, net of deferred offering costs | | | (11.8)% | |
Net Assets | | | 100% | |
Top Five Issuers
(% of total long-term investments)
| | | | |
| Pacific Gas and Electric Co | | | 3.7% | |
| Burger King Corporation | | | 2.6% | |
| Intelsat SA | | | 2.3% | |
| iHeartCommunications Inc | | | 1.6% | |
| Dell International LLC | | | 1.6% | |
Portfolio Composition
(% of total investments)
| | | | |
| Media | | | 13.8% | |
| Hotels, Restaurants & Leisure | | | 9.8% | |
| Software | | | 7.0% | |
| Health Care Providers & Services | | | 6.1% | |
| Electric Utilities | | | 4.0% | |
| Diversified Telecommunication Services | | | 3.6% | |
| Communications Equipment | | | 3.4% | |
| Commercial Services & Supplies | | | 2.8% | |
| Pharmaceuticals | | | 2.8% | |
| IT Services | | | 2.7% | |
| Oil, Gas & Consumable Fuels | | | 2.6% | |
| Technology Hardware, Storage & Peripherals | | | 2.0% | |
| Health Care Technology | | | 1.8% | |
| Food & Staples Retailing | | | 1.8% | |
| Aerospace & Defense | | | 1.7% | |
| Auto Components | | | 1.6% | |
| Insurance | | | 1.3% | |
| Professional Services | | | 1.3% | |
| Household Products | | | 1.3% | |
| Specialty Retail | | | 1.2% | |
| Interactive Media & Services | | | 1.2% | |
| Road & Rail | | | 1.2% | |
| Other1 | | | 19.1% | |
| Asset-Backed Securities | | | 0.4% | |
| Short-Term Investment Companies | | | 5.5% | |
Total | | | 100% | |
Portfolio Credit Quality
(% of total long-term fixed income investments)
| | | | |
| BBB | | | 12.2% | |
| BB or Lower | | | 84.4% | |
| N/R (not rated) | | | 3.4% | |
Total | | | 100% | |
| 1 | See Portfolio of Investments for details on “other” Portfolio Composition. |
23
| | |
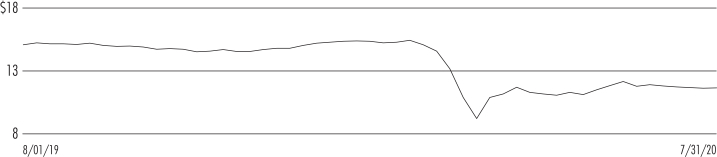
| JSD | | Nuveen Short Duration Credit Opportunities Fund Performance Overview and Holding Summaries as of July 31, 2020 |
Refer to the Glossary of Terms Used in this Report for further definition of the terms used within this section.
Average Annual Total Returns as of July 31, 2020
| | | | | | | | | | | | |
| | | Average Annual | |
| | | 1-Year | | | 5-Year | | | Since
Inception | |
| JSD at Common Share NAV | | | (11.19)% | | | | 1.33% | | | | 3.93% | |
| JSD at Common Share Price | | | (17.88)% | | | | 0.82% | | | | 1.87% | |
| Credit Suisse Leveraged Loan Index | | | (1.20)% | | | | 3.31% | | | | 3.86% | |
Since inception returns are from May 25, 2011. Past performance is not predictive of future results. Current performance may be higher or lower than the data shown. Returns do not reflect the deduction of taxes that shareholders may have to pay on Fund distributions or upon the sale of Fund shares. Returns at NAV are net of Fund expenses, and assume reinvestment of distributions. Comparative index return information is provided for the Fund’s shares at NAV only. Indexes are not available for direct investment.
Common Share Price Performance — Weekly Closing Price
24
This data relates to the securities held in the Fund’s portfolio of investments as of the end of the reporting period. It should not be construed as a measure of performance for the Fund itself. Holdings are subject to change.
For financial reporting purposes, the ratings disclosed are the highest rating given by one of the following national rating agencies: Standard & Poor’s Group, Moody’s Investors Service, Inc. or Fitch, Inc. This treatment of split-rated securities may differ from that used for other purposes, such as for Fund investment policies. Credit ratings are subject to change. AAA, AA, A and BBB are investment grade ratings; BB, B, CCC, CC, C and D are below-investment grade ratings. Holdings designated N/R are not rated by these national rating agencies.
Fund Allocation
(% of net assets)
| | | | |
| Variable Rate Senior Loan Interests | | | 134.2% | |
| Corporate Bonds | | | 16.4% | |
| Common Stocks | | | 1.8% | |
| Warrants | | | 0.1% | |
| Convertible Preferred Securities | | | 0.1% | |
| Common Stock Rights | | | 0.0% | |
| Short-Term Investment Companies | | | 6.4% | |
| Other Assets Less Liabilities | | | (3.6)% | |
| Net Assets Plus Borrowings and Taxable Fund Preferred Shares, net of deferred offering costs | | | 155.4% | |
| Borrowings | | | (6.0)% | |
| Taxable Fund Preferred, net of deferred offering costs | | | (49.4)% | |
Net Assets | | | 100% | |
Top Five Issuers
(% of total long-term investments)
| | | | |
| Pacific Gas & Electric Co | | | 3.2% | |
| Intelsat SA | | | 2.5% | |
| Jaguar Holding Co II | | | 1.9% | |
| Caesars Holdings Inc | | | 1.8% | |
| Frontier Communications Corp | | | 1.6% | |
Portfolio Composition
(% of total investments)
| | | | |
| Media | | | 11.9% | |
| Hotels, Restaurants & Leisure | | | 8.7% | |
| Health Care Providers & Services | | | 8.0% | |
| Software | | | 7.8% | |
| Electric Utilities | | | 4.4% | |
| Diversified Telecommunication Services | | | 4.3% | |
| Oil, Gas & Consumable Fuels | | | 3.4% | |
| Pharmaceuticals | | | 3.3% | |
| IT Services | | | 3.3% | |
| Communications Equipment | | | 3.2% | |
| Commercial Services & Supplies | | | 2.8% | |
| Aerospace & Defense | | | 2.4% | |
| Health Care Technology | | | 1.9% | |
| Technology Hardware, Storage & Peripherals | | | 1.6% | |
| Auto Components | | | 1.5% | |
| Interactive Media & Services | | | 1.5% | |
| Airlines | | | 1.5% | |
| Road & Rail | | | 1.4% | |
| Specialty Retail | | | 1.4% | |
| Internet Software & Services | | | 1.4% | |
| Professional Services | | | 1.4% | |
| Other1 | | | 18.9% | |
| Short-Term Investment Companies | | | 4.0% | |
Total | | | 100% | |
Portfolio Credit Quality
(% of total long-term fixed income investments)
| | | | |
| BBB | | | 10.1% | |
| BB or Lower | | | 85.8% | |
| N/R (not rated) | | | 4.1% | |
Total | | | 100% | |
| 1 | See Portfolio of Investments for details on “other” Portfolio Composition. |
25
| | |
| JQC | | Nuveen Credit Strategies Income Fund Performance Overview and Holding Summaries as of July 31, 2020 |
Refer to Glossary of Terms Used in this Report for further definition of the terms used within this section.
Average Annual Total Returns as of July 31, 2020
| | | | | | | | | | | | |
| | | Average Annual | |
| | | 1-Year | | | 5-Year | | | 10-Year | |
| JQC at Common Share NAV | | | (5.91)% | | | | 1.69% | | | | 5.07% | |
| JQC at Common Share Price | | | (9.54)% | | | | 2.38% | | | | 5.62% | |
| Credit Suisse Leveraged Loan Index | | | (1.20)% | | | | 3.31% | | | | 4.38% | |
Past performance is not predictive of future results. Current performance may be higher or lower than the data shown. Returns do not reflect the deduction of taxes that shareholders may have to pay on Fund distributions or upon the sale of Fund shares. Returns at NAV are net of Fund expenses, and assume reinvestment of distributions. Comparative index return information is provided for the Fund’s shares at NAV only. Indexes are not available for direct investment.
Common Share Price Performance — Weekly Closing Price
26
This data relates to the securities held in the Fund’s portfolio of investments as of the end of the reporting period. It should not be construed as a measure of performance for the Fund itself. Holdings are subject to change.
For financial reporting purposes, the ratings disclosed are the highest rating given by one of the following national rating agencies: Standard & Poor’s Group, Moody’s Investors Service, Inc. or Fitch, Inc. This treatment of split-rated securities may differ from that used for other purposes, such as for Fund investment policies. Credit ratings are subject to change. AAA, AA, A and BBB are investment grade ratings; BB, B, CCC, CC, C and D are below-investment grade ratings. Holdings designated N/R are not rated by these national rating agencies.
Fund Allocation
(% of net assets)
| | | | |
| Variable Rate Senior Loan Interests | | | 124.1% | |
| Corporate Bonds | | | 28.8% | |
| Common Stocks | | | 0.6% | |
| Convertible Bonds | | | 0.5% | |
| Warrants | | | 0.0% | |
| Common Stock Rights | | | 0.0% | |
| Short-Term Investment Companies | | | 3.9% | |
| Other Assets Less Liabilities | | | (2.3)% | |
| Net Assets Plus Borrowings and Reverse Repurchase Agreements | | | 155.6% | |
| Borrowings | | | (43.1)% | |
| Reverse Repurchase Agreements | | | (12.5)% | |
Net Assets | | | 100% | |
Top Five Issuers
(% of total long-term investments)
| | | | |
| Ultimate Software Group Inc | | | 1.7% | |
| CenturyLink Inc | | | 1.6% | |
| Argos Holdings Inc | | | 1.5% | |
| United Airlines Holdings Inc | | | 1.5% | |
| PAREXEL International Corp | | | 1.5% | |
Portfolio Composition
(% of total investments)
| | | | |
| Hotels, Restaurants & Leisure | | | 11.3% | |
| Media | | | 9.6% | |
| Health Care Providers & Services | | | 9.3% | |
| Software | | | 5.8% | |
| Airlines | | | 3.7% | |
| Food & Staples Retailing | | | 2.7% | |
| Insurance | | | 2.7% | |
| Diversified Telecommunication Services | | | 2.7% | |
| IT Services | | | 2.7% | |
| Trading Companies & Distributors | | | 2.7% | |
| Commercial Services & Supplies | | | 2.6% | |
| Specialty Retail | | | 1.9% | |
| Semiconductors & Semiconductor Equipment | | | 1.8% | |
| Pharmaceuticals | | | 1.8% | |
| Diversified Financial Services | | | 1.8% | |
| Wireless Telecommunication Services | | | 1.8% | |
| Personal Products | | | 1.8% | |
| Machinery | | | 1.6% | |
| Oil, Gas & Consumable Fuels | | | 1.6% | |
| Internet Software & Services | | | 1.5% | |
| Multiline Retail | | | 1.5% | |
| Automobiles | | | 1.5% | |
| Communications Equipment | | | 1.5% | |
| Life Sciences Tools & Services | | | 1.4% | |
| Electric Utilities | | | 1.3% | |
| Other1 | | | 18.9% | |
| Short-Term Investment Companies | | | 2.5% | |
Total | | | 100% | |
Portfolio Credit Quality
(% of total long-term fixed income investments)
| | | | |
| BBB | | | 17.3% | |
| BB or Lower | | | 81.5% | |
| N/R (not rated) | | | 1.2% | |
Total | | | 100% | |
| 1 | See Portfolio of Investments for details on “other” Portfolio Composition. |
27
Shareholder Meeting Report
The annual meeting of shareholders, originally scheduled to be held on April 8, 2020 in person, was postponed to April 22, 2020 for NSL, JFR, JRO, JSD and JQC. The meeting was held virtually due to public health concerns regarding the ongoing COVID-19 pandemic; at this meeting the shareholders were asked to elect Board members.
| | | | | | | | | | | | | | | | | | | | | | | | | | | | | | | | | | | | |
| | | NSL | | | JFR | | | JRO | | | JSD | | | JQC | |
| | | Common and
Preferred
shares voting
together
as a class | | | Preferred
Shares | | | Common and
Preferred
shares voting
together
as a class | | | Preferred
Shares | | | Common and
Preferred
shares voting
together
as a class | | | Preferred
Shares | | | Common and
Preferred
shares voting
together
as a class | | | Preferred
Shares | | | Common
Shares | |
Approval of the Board Members was reached as follows: | | | | | | | | | | | | | | | | | | | | | | | | | | | | | | | | | | | | |
John K. Nelson | | | | | | | | | | | | | | | | | | | | | | | | | | | | | | | | | | | | |
For | | | 28,358,596 | | | | — | | | | 45,772,480 | | | | — | | | | 33,393,714 | | | | — | | | | 7,926,882 | | | | — | | | | 104,133,212 | |
Withhold | | | 5,161,938 | | | | — | | | | 1,465,020 | | | | — | | | | 2,077,073 | | | | — | | | | 1,333,606 | | | | — | | | | 9,706,193 | |
Total | | | 33,520,534 | | | | — | | | | 47,237,500 | | | | — | | | | 35,470,787 | | | | — | | | | 9,260,488 | | | | — | | | | 113,839,405 | |
Terence J. Toth | | | | | | | | | | | | | | | | | | | | | | | | | | | | | | | | | | | | |
For | | | 29,459,169 | | | | — | | | | 43,583,999 | | | | — | | | | 31,483,020 | | | | — | | | | 7,954,725 | | | | — | | | | 106,279,400 | |
Withhold | | | 4,061,365 | | | | — | | | | 3,653,501 | | | | — | | | | 3,987,767 | | | | — | | | | 1,305,763 | | | | — | | | | 7,560,005 | |
Total | | | 33,520,534 | | | | — | | | | 47,237,500 | | | | — | | | | 35,470,787 | | | | — | | | | 9,260,488 | | | | — | | | | 113,839,405 | |
Robert L. Young | | | | | | | | | | | | | | | | | | | | | | | | | | | | | | | | | | | | |
For | | | 29,595,876 | | | | — | | | | 45,841,986 | | | | — | | | | 33,346,044 | | | | — | | | | 7,924,599 | | | | — | | | | 106,376,044 | |
Withhold | | | 3,924,658 | | | | — | | | | 1,395,514 | | | | — | | | | 2,124,743 | | | | — | | | | 1,335,889 | | | | — | | | | 7,463,361 | |
Total | | | 33,520,534 | | | | — | | | | 47,237,500 | | | | — | | | | 35,470,787 | | | | — | | | | 9,260,488 | | | | — | | | | 113,839,405 | |
William C. Hunter | | | | | | | | | | | | | | | | | | | | | | | | | | | | | | | | | | | | |
For | | | — | | | | 20,703 | | | | — | | | | 55,000 | | | | — | | | | 56,700 | | | | — | | | | 100,000 | | | | — | |
Withhold | | | — | | | | 1,086 | | | | — | | | | — | | | | — | | | | 1,330 | | | | — | | | | — | | | | — | |
Total | | | — | | | | 21,789 | | | | — | | | | 55,000 | | | | — | | | | 58,030 | | | | — | | | | 100,000 | | | | — | |
Albin F. Moschner | | | | | | | | | | | | | | | | | | | | | | | | | | | | | | | | | | | | |
For | | | — | | | | 21,033 | | | | — | | | | 55,000 | | | | — | | | | 56,836 | | | | — | | | | 100,000 | | | | — | |
Withhold | | | — | | | | 756 | | | | — | | | | — | | | | — | | | | 1,194 | | | | — | | | | — | | | | — | |
Total | | | — | | | | 21,789 | | | | — | | | | 55,000 | | | | — | | | | 58,030 | | | | — | | | | 100,000 | | | | — | |
28
Report of Independent Registered Public Accounting Firm
To the Shareholders and Board of Trustees
Nuveen Senior Income Fund
Nuveen Floating Rate Income Fund
Nuveen Floating Rate Income Opportunity Fund
Nuveen Short Duration Credit Opportunities Fund
Nuveen Credit Strategies Income Fund:
Opinion on the Financial Statements
We have audited the accompanying statements of assets and liabilities of Nuveen Senior Income Fund, Nuveen Floating Rate Income Fund, Nuveen Floating Rate Income Opportunity Fund, Nuveen Short Duration Credit Opportunities Fund and Nuveen Credit Strategies Income Fund (the Funds), including the portfolios of investments, as of July 31, 2020, the related statements of operations and cash flows for the year then ended, the statements of changes in net assets for each of the years in the two-year period then ended, and the related notes (collectively, the financial statements) and the financial highlights for each of the years in the five-year period then ended. In our opinion, the financial statements and financial highlights present fairly, in all material respects, the financial position of the Funds as of July 31, 2020, the results of their operations and cash flows for the year then ended, the changes in their net assets for each of the years in the two-year period then ended, and the financial highlights for each of the years in the five-year period then ended, in conformity with U.S. generally accepted accounting principles.
Basis for Opinion
These financial statements and financial highlights are the responsibility of the Funds’ management. Our responsibility is to express an opinion on these financial statements and financial highlights based on our audits. We are a public accounting firm registered with the Public Company Accounting Oversight Board (United States) (PCAOB) and are required to be independent with respect to the Funds in accordance with the U.S. federal securities laws and the applicable rules and regulations of the Securities and Exchange Commission and the PCAOB.
We conducted our audits in accordance with the standards of the PCAOB. Those standards require that we plan and perform the audit to obtain reasonable assurance about whether the financial statements and financial highlights are free of material misstatement, whether due to error or fraud. Our audits included performing procedures to assess the risks of material misstatement of the financial statements and financial highlights, whether due to error or fraud, and performing procedures that respond to those risks. Such procedures included examining, on a test basis, evidence regarding the amounts and disclosures in the financial statements and financial highlights. Such procedures also included confirmation of securities owned as of July 31, 2020, by correspondence with custodians and brokers or other appropriate auditing procedures. Our audits also included evaluating the accounting principles used and significant estimates made by management, as well as evaluating the overall presentation of the financial statements and financial highlights. We believe that our audits provide a reasonable basis for our opinion.

We have served as the auditor of one or more Nuveen investment companies since 2014.
Chicago, Illinois
September 28, 2020
29
| | |
| NSL | | Nuveen Senior Income Fund Portfolio of Investments July 31, 2020 |
| | | | | | | | | | | | | | | | | | | | | | | | | | | | |
Principal
Amount (000) | | | Description (1) | | Coupon (2) | | | Reference
Rate (2) | | | Spread (2) | | | Maturity (3) | | | Ratings (4) | | | Value | |
| |
| | | | LONG-TERM INVESTMENTS – 152.4% (95.5% of Total Investments) | |
| |
| | | | VARIABLE RATE SENIOR LOAN INTERESTS – 134.4% (84.2% of Total Investments) (2) | |
| |
| | | | Aerospace & Defense – 2.8% (1.7% of Total Investments) | |
| | | | | | | |
| $ | 523 | | | MacDonald, Dettwiler and Associates, Ltd., Term Loan B | | | 2.911% | | | | 1-Month LIBOR | | | | 2.750% | | | | 10/05/24 | | | | B | | | $ | 504,104 | |
| | 2,037 | | | Sequa Corporation, Term Loan B | | | 6.000% | | | | 3-Month LIBOR | | | | 5.000% | | | | 11/28/21 | | | | B– | | | | 1,933,739 | |
| | 1,037 | | | Sequa Corporation, Term Loan, Second Lien | | | 11.250% | | | | Prime | | | | 8.000% | | | | 4/28/22 | | | | CCC– | | | | 797,006 | |
| | 576 | | | Standard Aero, Term Loan B1 | | | 3.808% | | | | 3-Month LIBOR | | | | 3.500% | | | | 4/08/26 | | | | B– | | | | 465,425 | |
| | 310 | | | Standard Aero, Term Loan B2 | | | 3.808% | | | | 3-Month LIBOR | | | | 3.500% | | | | 4/08/26 | | | | B– | | | | 250,228 | |
| | 974 | | | Transdigm, Inc., Term Loan E | | | 2.411% | | | | 1-Month LIBOR | | | | 2.250% | | | | 5/30/25 | | | | Ba3 | | | | 912,971 | |
| | 804 | | | Transdigm, Inc., Term Loan F | | | 2.411% | | | | 1-Month LIBOR | | | | 2.250% | | | | 12/09/25 | | | | Ba3 | | | | 754,495 | |
| | 314 | | | Transdigm, Inc., Term Loan G | | | 2.411% | | | | 1-Month LIBOR | | | | 2.250% | | | | 8/22/24 | | | | Ba3 | | | | 294,552 | |
| | 6,575 | | | Total Aerospace & Defense | | | | | | | | | | | | | | | | | | | | | | | 5,912,520 | |
| |
| | | | Air Freight & Logistics – 0.9% (0.5% of Total Investments) | |
| | | | | | | |
| | 746 | | | PAE Holding Corporation, Term Loan B | | | 6.500% | | | | 2-Month LIBOR | | | | 5.500% | | | | 10/20/22 | | | | B+ | | | | 742,648 | |
| | 1,083 | | | XPO Logistics, Inc., Term Loan B | | | 2.161% | | | | 1-Month LIBOR | | | | 2.000% | | | | 2/24/25 | | | | BBB– | | | | 1,072,493 | |
| | 1,829 | | | Total Air Freight & Logistics | | | | | | | | | | | | | | | | | | | | | | | 1,815,141 | |
| |
| | | | Airlines – 2.1% (1.3% of Total Investments) | |
| | | | | | | |
| | 870 | | | American Airlines, Inc., Term Loan B | | | 2.184% | | | | 1-Month LIBOR | | | | 2.000% | | | | 4/28/23 | | | | Ba3 | | | | 666,422 | |
| | 767 | | | American Airlines, Inc., Term Loan B | | | 1.916% | | | | 1-Month LIBOR | | | | 1.750% | | | | 1/29/27 | | | | Ba3 | | | | 540,734 | |
| | 3,215 | | | American Airlines, Inc., Term Loan B | | | 2.175% | | | | 1-Month LIBOR | | | | 2.000% | | | | 12/14/23 | | | | Ba3 | | | | 2,449,021 | |
| | 286 | | | Delta Air Lines, Inc., Term Loan B | | | 5.750% | | | | 3-Month LIBOR | | | | 4.750% | | | | 4/29/23 | | | | Baa2 | | | | 282,336 | |
| | 734 | | | WestJet Airlines, Term Loan, (DD1) | | | 4.000% | | | | 6-Month LIBOR | | | | 3.000% | | | | 12/11/26 | | | | BB+ | | | | 546,895 | |
| | 5,872 | | | Total Airlines | | | | | | | | | | | | | | | | | | | | | | | 4,485,408 | |
| |
| | | | Auto Components – 1.9% (1.2% of Total Investments) | |
| | | | | | | |
| | 149 | | | Adient Global Holdings, Initial Term Loan, (WI/DD) | | | TBD | | | | TBD | | | | TBD | | | | TBD | | | | Ba3 | | | | 147,970 | |
| | 834 | | | DexKo Global, Inc., Term Loan B | | | 4.500% | | | | 1-Month LIBOR | | | | 3.500% | | | | 7/24/24 | | | | B1 | | | | 798,881 | |
| | 1,489 | | | Johnson Controls Inc., Term Loan B | | | 3.667% | | | | 1-Month LIBOR | | | | 3.500% | | | | 4/30/26 | | | | B1 | | | | 1,457,732 | |
| | 898 | | | Superior Industries International, Inc., Term Loan B | | | 4.161% | | | | 1-Month LIBOR | | | | 4.000% | | | | 5/23/24 | | | | B1 | | | | 826,296 | |
| | 920 | | | Trico Group, LLC, Initial Term Loan, First Lien | | | 8.000% | | | | 3-Month LIBOR | | | | 7.000% | | | | 2/02/24 | | | | B | | | | 878,530 | |
| | 4,290 | | | Total Auto Components | | | | | | | | | | | | | | | | | | | | | | | 4,109,409 | |
| |
| | | | Automobiles – 0.6% (0.4% of Total Investments) | |
| | | | | | | |
| | 375 | | | Caliber Collision, Term Loan B | | | 4.072% | | | | 3-Month LIBOR | | | | 3.000% | | | | 2/05/26 | | | | B1 | | | | 359,396 | |
| | 149 | | | Caliber Collision, Term Loan B | | | 4.072% | | | | 6-Month LIBOR | | | | 3.000% | | | | 2/05/26 | | | | B1 | | | | 142,977 | |
| | 731 | | | Navistar, Inc., Term Loan B | | | 3.690% | | | | 1-Month LIBOR | | | | 3.500% | | | | 11/06/24 | | | | Ba2 | | | | 710,833 | |
| | 1,255 | | | Total Automobiles | | | | | | | | | | | | | | | | | | | | | | | 1,213,206 | |
| |
| | | | Beverages – 0.7% (0.4% of Total Investments) | |
| | | | | | | |
| | 1,467 | | | Jacobs Douwe Egberts, Term Loan B | | | 2.188% | | | | 1-Month LIBOR | | | | 2.000% | | | | 11/01/25 | | | | BB+ | | | | 1,447,001 | |
| |
| | | | Biotechnology – 0.9% (0.6% of Total Investments) | |
| | | | | | | |
| | 2,025 | | | Grifols, Inc., Term Loan B, First Lien | | | 2.111% | | | | 1-Week LIBOR | | | | 2.000% | | | | 11/15/27 | | | | Ba2 | | | | 1,985,908 | |
| | | | | | |
| | | | Building Products – 1.2% (0.7% of Total Investments) | | | | | | | | | | | | | | | | |
| | | | | | | |
| | 479 | | | Ply Gem Industries, Inc., Term Loan B | | | 3.928% | | | | 1-Month LIBOR | | | | 3.750% | | | | 4/12/25 | | | | B+ | | | | 472,160 | |
| | 2,114 | | | Quikrete Holdings, Inc., Term Loan B | | | 2.661% | | | | 1-Month LIBOR | | | | 2.500% | | | | 2/01/27 | | | | BB– | | | | 2,047,414 | |
| | 2,593 | | | Total Building Products | | | | | | | | | | | | | | | | | | | | | | | 2,519,574 | |
| |
| | | | Capital Markets – 0.4% (0.3% of Total Investments) | |
| | | | | | | |
| | 714 | | | RPI Finance Trust, Term Loan B1 | | | 1.911% | | | | 1-Month LIBOR | | | | 1.750% | | | | 2/11/27 | | | | BBB– | | | | 707,948 | |
| | 214 | | | RPI Finance Trust, Term Loan B1 | | | 1.911% | | | | 1-Month LIBOR | | | | 1.750% | | | | 2/11/27 | | | | BBB– | | | | 211,458 | |
| | 928 | | | Total Capital Markets | | | | | | | | | | | | | | | | | | | | | | | 919,406 | |
| |
| | | | Chemicals – 1.0% (0.7% of Total Investments) | |
| | | | | | | |
| | 666 | | | Ineos US Finance LLC, Term Loan | | | 2.214% | | | | 2-Month LIBOR | | | | 2.000% | | | | 3/31/24 | | | | BBB– | | | | 643,196 | |
30
| | | | | | | | | | | | | | | | | | | | | | | | | | | | |
Principal
Amount (000) | | | Description (1) | | Coupon (2) | | | Reference
Rate (2) | | | Spread (2) | | | Maturity (3) | | | Ratings (4) | | | Value | |
| |
| | | | Chemicals (continued) | |
| | | | | | | |
| $ | 500 | | | Lummus Technology, Term Loan | | | 4.308% | | | | 3-Month LIBOR | | | | 4.000% | | | | 6/30/27 | | | | B+ | | | $ | 495,625 | |
| | 480 | | | PQ Corporation, Incremental Term Loan B, (WI/DD) | | | TBD | | | | TBD | | | | TBD | | | | TBD | | | | BB– | | | | 478,550 | |
| | 576 | | | Univar, Inc., Term Loan B | | | 2.411% | | | | 1-Month LIBOR | | | | 2.250% | | | | 7/01/24 | | | | BB+ | | | | 566,454 | |
| | 2,222 | | | Total Chemicals | | | | | | | | | | | | | | | | | | | | | | | 2,183,825 | |
| |
| | | | Commercial Services & Supplies – 4.2% (2.6% of Total Investments) | |
| | | | | | | |
| | 647 | | | ADS Waste Holdings, Inc., Term Loan B | | | 3.000% | | | | 1-Week LIBOR | | | | 2.250% | | | | 11/10/23 | | | | BB+ | | | | 644,630 | |
| | 529 | | | Brand Energy & Infrastructure Services, Inc., Term Loan B, First Lien, (DD1) | | | 5.250% | | | | 3-Month LIBOR | | | | 4.250% | | | | 6/21/24 | | | | B– | | | | 484,312 | |
| | 108 | | | Education Management LLC, Term Loan A, (6) | | | 0.000% | | | | N/A | | | | N/A | | | | 7/02/20 | | | | N/R | | | | 1,086 | |
| | 4,003 | | | Formula One Group, Term Loan B | | | 3.500% | | | | 1-Month LIBOR | | | | 2.500% | | | | 2/01/24 | | | | B+ | | | | 3,888,056 | |
| | 433 | | | Garda World Security Corp, Term Loan B, First Lien | | | 4.930% | | | | 1-Month LIBOR | | | | 4.750% | | | | | | | | B | | | | 429,875 | |
| | 1,094 | | | GFL Environmental, Term Loan | | | 4.000% | | | | 3-Month LIBOR | | | | 3.000% | | | | 5/31/25 | | | | BB– | | | | 1,090,801 | |
| | 329 | | | Harland Clarke Holdings Corporation, Term Loan B7 | | | 5.750% | | | | 3-Month LIBOR | | | | 4.750% | | | | 11/03/23 | | | | CCC+ | | | | 233,118 | |
| | 938 | | | iQor US, Inc., Term Loan, First Lien, (6) | | | 0.000% | | | | N/A | | | | N/A | | | | 4/01/21 | | | | CC | | | | 661,422 | |
| | 250 | | | iQor US, Inc., Term Loan, Second Lien, (6) | | | 0.000% | | | | N/A | | | | N/A | | | | 4/01/22 | | | | C | | | | 61,605 | |
| | 278 | | | KAR Auction Services, Inc., Term Loan B6 | | | 2.438% | | | | 1-Month LIBOR | | | | 2.250% | | | | 9/19/26 | | | | Ba3 | | | | 269,026 | |
| | 133 | | | Pitney Bowes Inc., Term Loan B | | | 5.661% | | | | 1-Month LIBOR | | | | 5.500% | | | | 1/07/25 | | | | BBB– | | | | 125,359 | |
| | 2 | | | Robertshaw US Holding Corp., Initial Term Loan, First Lien | | | 4.250% | | | | 1-Month LIBOR | | | | 3.250% | | | | 2/28/25 | | | | B3 | | | | 1,484 | |
| | 685 | | | Robertshaw US Holding Corp., Initial Term Loan, First Lien | | | 4.250% | | | | 6-Month LIBOR | | | | 3.250% | | | | 2/28/25 | | | | B3 | | | | 578,780 | |
| | 139 | | | Sabert Corporation, Initial Term Loan | | | 5.500% | | | | 1-Month LIBOR | | | | 4.500% | | | | 12/10/26 | | | | B | | | | 138,546 | |
| | 417 | | | West Corporation, Incremental Term Loan B1 | | | 4.500% | | | | 3-Month LIBOR | | | | 3.500% | | | | 10/10/24 | | | | BB+ | | | | 364,586 | |
| | 9,985 | | | Total Commercial Services & Supplies | | | | | | | | | | | | | | | | | | | | | | | 8,972,686 | |
| |
| | | | Communications Equipment – 3.5% (2.2% of Total Investments) | |
| | | | | | | |
| | 2,610 | | | Avaya, Inc., Term Loan B | | | 4.425% | | | | 1-Month LIBOR | | | | 4.250% | | | | 12/15/24 | | | | BB– | | | | 2,475,786 | |
| | 1,664 | | | CommScope, Inc., Term Loan B | | | 3.411% | | | | 1-Month LIBOR | | | | 3.250% | | | | 4/04/26 | | | | Ba3 | | | | 1,634,562 | |
| | 886 | | | Mitel US Holdings, Inc., Term Loan, First Lien | | | 4.666% | | | | 1-Month LIBOR | | | | 4.500% | | | | 11/30/25 | | | | B– | | | | 732,067 | |
| | 924 | | | Plantronics, Term Loan B, (DD1) | | | 2.661% | | | | 1-Month LIBOR | | | | 2.500% | | | | 7/02/25 | | | | Ba2 | | | | 856,816 | |
| | 139 | | | Plantronics, Term Loan B, (DD1) | | | 2.861% | | | | 6-Month LIBOR | | | | 2.500% | | | | 7/02/25 | | | | Ba2 | | | | 128,933 | |
| | 748 | | | Riverbed Technology, Inc., Term Loan B, First Lien | | | 3.511% | | | | 3-Month LIBOR | | | | 3.250% | | | | 4/24/22 | | | | B2 | | | | 683,199 | |
| | 890 | | | Univision Communications, Inc., Term Loan C5 | | | 3.750% | | | | 1-Month LIBOR | | | | 2.750% | | | | 3/15/24 | | | | B | | | | 855,886 | |
| | 7,861 | | | Total Communications Equipment | | | | | | | | | | | | | | | | | | | | | | | 7,367,249 | |
| |
| | | | Construction & Engineering – 0.5% (0.3% of Total Investments) | |
| | | | | | | |
| | 1,307 | | | Traverse Midstream Partners, Term Loan B | | | 5.000% | | | | 1-Month LIBOR | | | | 4.000% | | | | 9/27/24 | | | | B | | | | 1,148,569 | |
| | | | | | |
| | | | Consumer Finance – 0.7% (0.4% of Total Investments) | | | | | | | | | | | | | | | | |
| | | | | | | |
| | 1,460 | | | Verscend Technologies, Tern Loan B | | | 4.661% | | | | 1-Month LIBOR | | | | 4.500% | | | | 8/27/25 | | | | B+ | | | | 1,457,718 | |
| |
| | | | Containers & Packaging – 0.8% (0.5% of Total Investments) | |
| | | | | | | |
| | 990 | | | Berry Global, Inc., Term Loan Y | | | 2.188% | | | | 1-Month LIBOR | | | | 2.000% | | | | 7/01/26 | | | | BBB– | | | | 962,621 | |
| | 339 | | | Berry Global, Inc., Term Loan W | | | 2.188% | | | | 1-Month LIBOR | | | | 2.000% | | | | 10/01/22 | | | | BBB– | | | | 333,448 | |
| | 375 | | | Reynolds Group Holdings, Inc., Term Loan, First Lien | | | 1.911% | | | | 1-Month LIBOR | | | | 1.750% | | | | 2/04/27 | | | | BB+ | | | | 368,984 | |
| | 1,704 | | | Total Containers & Packaging | | | | | | | | | | | | | | | | | | | | | | | 1,665,053 | |
| |
| | | | Distributors – 0.5% (0.3% of Total Investments) | |
| | | | | | | |
| | 210 | | | Insurance Auto Actions Inc., Term Loan | | | 2.438% | | | | 1-Month LIBOR | | | | 2.250% | | | | 6/28/26 | | | | BB+ | | | | 206,335 | |
| | 764 | | | SRS Distribution, Inc., Term Loan B | | | 4.072% | | | | 3-Month LIBOR | | | | 3.000% | | | | 5/24/25 | | | | B | | | | 741,186 | |
| | 974 | | | Total Distributors | | | | | | | | | | | | | | | | | | | | | | | 947,521 | |
| |
| | | | Diversified Consumer Services – 1.7% (1.0% of Total Investments) | |
| | | | | | | |
| | 2,049 | | | Cengage Learning Acquisitions, Inc., Term Loan B | | | 5.250% | | | | 6-Month LIBOR | | | | 4.250% | | | | 6/07/23 | | | | B | | | | 1,681,661 | |
| | 74 | | | Education Management LLC, Elevated Term Loan A1, (6) | | | 0.000% | | | | N/A | | | | N/A | | | | 7/02/20 | | | | N/R | | | | 925 | |
| | 2 | | | Education Management LLC, Elevated Term Loan A2, (6) | | | 5.808% | | | | 3-Month LIBOR | | | | 5.500% | | | | 7/02/20 | | | | N/R | | | | — | |
| | 1,869 | | | Refinitiv, Term Loan B | | | 3.411% | | | | 1-Month LIBOR | | | | 3.250% | | | | 10/01/25 | | | | BB+ | | | | 1,857,600 | |
| | 3,994 | | | Total Diversified Consumer Services | | | | | | | | | | | | | | | | | | | | | | | 3,540,186 | |
31
| | |
| |
| NSL | | Nuveen Senior Income Fund (continued) |
| | Portfolio of Investments July 31, 2020 |
| | | | | | | | | | | | | | | | | | | | | | | | | | | | |
Principal
Amount (000) | | | Description (1) | | Coupon (2) | | | Reference
Rate (2) | | | Spread (2) | | | Maturity (3) | | | Ratings (4) | | | Value | |
| |
| | | | Diversified Financial Services – 1.4% (0.9% of Total Investments) | |
| | | | | | | |
| $ | 644 | | | Blackstone CQP, Term Loan | | | 3.806% | | | | 3-Month LIBOR | | | | 3.500% | | | | 9/30/24 | | | | B+ | | | $ | 628,217 | |
| | 1,252 | | | Ditech Holding Corporation., Term Loan B, First Lien, (6) | | | 0.000% | | | | N/A | | | | N/A | | | | 6/30/22 | | | | D | | | | 294,238 | |
| | 1,309 | | | Inmarsat Finance, Term Loan, First Lien | | | 5.500% | | | | 1-Month LIBOR | | | | 4.500% | | | | 12/12/26 | | | | B+ | | | | 1,279,218 | |
| | 336 | | | Lions Gate Entertainment Corp., Term Loan B | | | 2.411% | | | | 1-Month LIBOR | | | | 2.250% | | | | 3/24/25 | | | | Ba2 | | | | 323,966 | |
| | 556 | | | Sotheby’s, Term Loan B | | | 6.500% | | | | 1-Month LIBOR | | | | 5.500% | | | | 1/15/27 | | | | B+ | | | | 532,027 | |
| | 4,097 | | | Total Diversified Financial Services | | | | | | | | | | | | | | | | | | | | | | | 3,057,666 | |
| |
| | | | Diversified Telecommunication Services – 5.9% (3.7% of Total Investments) | |
| | | | | | | |
| | 284 | | | Altice France S.A., Term Loan B12 | | | 3.862% | | | | 1-Month LIBOR | | | | 3.687% | | | | 1/31/26 | | | | B | | | | 278,779 | |
| | 4,041 | | | CenturyLink, Inc, Term Loan B | | | 2.411% | | | | 1-Month LIBOR | | | | 2.250% | | | | 3/15/27 | | | | BB+ | | | | 3,901,748 | |
| | 310 | | | Consolidated Communications Holdings, Initial Term Loan, (WI/DD) | | | TBD | | | | TBD | | | | TBD | | | | TBD | | | | B+ | | | | 301,538 | |
| | 4,433 | | | Frontier Communications Corporation, Term Loan B, (DD1), (6) | | | 3.911% | | | | 1-Month LIBOR | | | | 3.750% | | | | 6/15/24 | | | | N/R | | | | 4,378,071 | |
| | 15 | | | Frontier Communications Corporation, Term Loan B, (DD1), (6) | | | 6.000% | | | | Prime | | | | 2.750% | | | | 6/15/24 | | | | N/R | | | | 14,631 | |
| | 236 | | | Intelsat Jackson Holdings, S.A., Term Loan B4, (6) | | | 8.750% | | | | Prime | | | | 5.500% | | | | 1/02/24 | | | | B | | | | 238,774 | |
| | 378 | | | Intelsat Jackson Holdings, S.A., Term Loan B5, (6) | | | 8.625% | | | | N/A | | | | N/A | | | | 1/02/24 | | | | B | | | | 382,593 | |
| | 2,956 | | | Numericable Group S.A., Term Loan B13 | | | 4.175% | | | | 1-Month LIBOR | | | | 4.000% | | | | 8/14/26 | | | | B | | | | 2,901,560 | |
| | 220 | | | Zayo Group LLC, Initial Dollar Term Loan | | | 3.161% | | | | 1-Month LIBOR | | | | 3.000% | | | | 3/09/27 | | | | B1 | | | | 213,741 | |
| | 12,873 | | | Total Diversified Telecommunication Services | | | | | | | | | | | | | | | | | | | | | | | 12,611,435 | |
| |
| | | | Electric Utilities – 0.5% (0.3% of Total Investments) | |
| | | | | | | |
| | 517 | | | ExGen Renewables, Term Loan | | | 4.000% | | | | 3-Month LIBOR | | | | 3.000% | | | | 11/28/24 | | | | BB– | | | | 512,551 | |
| | 609 | | | Vistra Operations Co., Term Loan B3 | | | 1.931% | | | | 1-Month LIBOR | | | | 1.750% | | | | 12/31/25 | | | | Baa3 | | | | 600,678 | |
| | 1,126 | | | Total Electric Utilities | | | | | | | | | | | | | | | | | | | | | | | 1,113,229 | |
| |
| | | | Electrical Equipment – 1.2% (0.8% of Total Investments) | |
| | | | | | | |
| | 1,941 | | | Avolon LLC, Term Loan B4 | | | 2.250% | | | | 1-Month LIBOR | | | | 1.500% | | | | 2/10/27 | | | | Baa2 | | | | 1,821,234 | |
| | 748 | | | Vertiv Co.,Term Loan B | | | 3.162% | | | | 1-Month LIBOR | | | | 3.000% | | | | 3/02/27 | | | | B+ | | | | 733,162 | |
| | 2,689 | | | Total Electrical Equipment | | | | | | | | | | | | | | | | | | | | | | | 2,554,396 | |
| |
| | | | Electronic Equipment, Instruments & Components – 0.4% (0.3% of Total Investments) | |
| | | | | | | |
| | 866 | | | TTM Technologies, Inc., Term Loan B | | | 2.671% | | | | 1-Month LIBOR | | | | 2.500% | | | | 9/28/24 | | | | BB+ | | | | 853,968 | |
| |
| | | | Energy Equipment & Services – 0.1% (0.1% of Total Investments) | |
| | | | | | | |
| | 371 | | | Petroleum GEO-Services ASA/PGS Finance, Inc., Term Loan B | | | 7.750% | | | | 3-Month LIBOR | | | | 7.000% | | | | 6/13/24 | | | | Caa1 | | | | 233,273 | |
| | | | | | | |
| | | | Entertainment – 0.5% (0.3% of Total Investments) | | | | | | | | | | | | | | | | | | |
| | | | | | | |
| | 670 | | | AMC Entertainment, Inc., Term Loan B | | | 4.080% | | | | 6-Month LIBOR | | | | 3.000% | | | | 4/22/26 | | | | CCC+ | | | | 444,134 | |
| | 702 | | | Springer SBM Two GmbH, Term Loan B16 | | | 4.500% | | | | 1-Month LIBOR | | | | 3.500% | | | | 8/14/24 | | | | B2 | | | | 693,435 | |
| | 1,372 | | | Total Entertainment | | | | | | | | | | | | | | | | | | | | | | | 1,137,569 | |
| |
| | | | Equity Real Estate Investment Trust – 1.1% (0.7% of Total Investments) | |
| | | | | | | |
| | 1,426 | | | Realogy Group LLC, Term Loan A, (DD1) | | | 2.437% | | | | 1-Month LIBOR | | | | 2.250% | | | | 2/08/23 | | | | BB– | | | | 1,340,684 | |
| | 971 | | | Realogy Group LLC, Term Loan B | | | 3.000% | | | | 1-Month LIBOR | | | | 2.250% | | | | 2/08/25 | | | | BB– | | | | 922,663 | |
| | 2,397 | | | Total Equity Real Estate Investment Trust | | | | | | | | | | | | | | | | | | | | | | | 2,263,347 | |
| |
| | | | Food & Staples Retailing – 2.8% (1.8% of Total Investments) | |
| | | | | | | |
| | 555 | | | Aramark Corporation, Term Loan | | | 1.911% | | | | 1-Month LIBOR | | | | 1.750% | | | | 3/11/25 | | | | BBB- | | | | 530,354 | |
| | 732 | | | BellRing Brands, Term Loan, First Lien | | | 6.000% | | | | 1-Month LIBOR | | | | 5.000% | | | | 10/21/24 | | | | B+ | | | | 736,164 | |
| | 556 | | | BJ’s Wholesale Club, Inc., Term Loan, First Lien | | | 2.178% | | | | 1-Month LIBOR | | | | 2.000% | | | | 2/03/24 | | | | BB | | | | 550,352 | |
| | 515 | | | Hearthside Group Holdings LLC, Term Loan B | | | 3.849% | | | | 1-Month LIBOR | | | | 3.688% | | | | 5/31/25 | | | | B2 | | | | 498,887 | |
| | 30 | | | Hearthside Group Holdings, LLC, Incremental Term Loan B3 | | | 6.000% | | | | 1-Month LIBOR | | | | 5.000% | | | | 5/31/25 | | | | B2 | | | | 29,711 | |
| | 3,902 | | | US Foods, Inc., New Term Loan | | | 1.911% | | | | 1-Month LIBOR | | | | 1.750% | | | | 6/27/23 | | | | BB | | | | 3,711,970 | |
| | 6,290 | | | Total Food & Staples Retailing | | | | | | | | | | | | | | | | | | | | | | | 6,057,438 | |
| |
| | | | Food Products – 0.3% (0.2% of Total Investments) | |
| | | | | | | |
| | 557 | | | American Seafoods Group LLC, Term Loan B | | | 3.750% | | | | 3-Month LIBOR | | | | 2.750% | | | | 8/21/23 | | | | BB– | | | | 548,789 | |
32
| | | | | | | | | | | | | | | | | | | | | | | | | | | | |
Principal
Amount (000) | | | Description (1) | | Coupon (2) | | | Reference
Rate (2) | | | Spread (2) | | | Maturity (3) | | | Ratings (4) | | | Value | |
| |
| | | | Food Products (continued) | |
| | | | | | | |
| $ | 175 | | | Froneri Lux FinCo SARL, Term Loan, First Lien | | | 2.411% | | | | 1-Month LIBOR | | | | 2.250% | | | | 1/31/27 | | | | B1 | | | $ | 168,344 | |
| | 732 | | | Total Food Products | | | | | | | | | | | | | | | | | | | | | | | 717,133 | |
| |
| | | | Health Care Equipment & Supplies – 1.0% (0.7% of Total Investments) | |
| | | | | | | |
| | 545 | | | Greatbatch Ltd., New Term Loan B | | | 3.500% | | | | 1-Month LIBOR | | | | 2.500% | | | | 10/27/22 | | | | B+ | | | | 540,328 | |
| | 446 | | | LifeScan, Term Loan B | | | 7.175% | | | | 3-Month LIBOR | | | | 6.000% | | | | 10/01/24 | | | | B | | | | 409,913 | |
| | 789 | | | MedPlast, Term Loan, First Lien | | | 3.911% | | | | 1-Month LIBOR | | | | 3.750% | | | | 7/02/25 | | | | B3 | | | | 688,915 | |
| | 714 | | | Vyaire Medical, Inc., Term Loan B | | | 5.750% | | | | 3-Month LIBOR | | | | 4.750% | | | | 4/30/25 | | | | B3 | | | | 596,804 | |
| | 2,494 | | | Total Health Care Equipment & Supplies | | | | | | | | | | | | | | | | | | | | | | | 2,235,960 | |
| |
| | | | Health Care Providers & Services – 9.0% (5.6% of Total Investments) | |
| | | | | | | |
| | 2,030 | | | Air Medical Group Holdings, Inc., Term Loan B | | | 4.250% | | | | 6-Month LIBOR | | | | 3.250% | | | | 4/28/22 | | | | B1 | | | | 2,009,732 | |
| | 356 | | | Air Methods, Term Loan, First Lien | | | 4.500% | | | | 3-Month LIBOR | | | | 3.500% | | | | 4/21/24 | | | | B | | | | 287,034 | |
| | 1 | | | Albany Molecular Research, Inc., Initial Term Loan, First Lien | | | 4.250% | | | | 2-Month LIBOR | | | | 3.250% | | | | 8/31/24 | | | | B2 | | | | 961 | |
| | 378 | | | Albany Molecular Research, Inc., Initial Term Loan, First Lien | | | 4.250% | | | | 3-Month LIBOR | | | | 3.250% | | | | 8/31/24 | | | | B2 | | | | 372,758 | |
| | 861 | | | Ardent Health, Term Loan, First Lien | | | 5.500% | | | | 1-Month LIBOR | | | | 4.500% | | | | 6/28/25 | | | | B1 | | | | 856,222 | |
| | 1,081 | | | Brightspring Health, Term Loan B | | | 3.425% | | | | 1-Month LIBOR | | | | 3.250% | | | | 3/05/26 | | | | B1 | | | | 1,061,064 | |
| | 741 | | | Catalent Pharma Solutions, Inc., Dollar Term Loan B2 | | | 3.250% | | | | 1-Month LIBOR | | | | 2.250% | | | | 5/17/26 | | | | BB+ | | | | 738,466 | |
| | 585 | | | Civitas Solutions, Term Loan B | | | 4.420% | | | | 1-Month LIBOR | | | | 4.250% | | | | 3/08/26 | | | | B | | | | 574,077 | |
| | 27 | | | Civitas Solutions, Term Loan C | | | 4.420% | | | | 1-Month LIBOR | | | | 4.250% | | | | 3/08/26 | | | | B | | | | 26,138 | |
| | 340 | | | DaVita, Inc., Term Loan B | | | 1.911% | | | | 1-Month LIBOR | | | | 1.750% | | | | 8/12/26 | | | | BBB– | | | | 334,218 | |
| | 1,713 | | | Envision Healthcare Corporation, Initial Term Loan | | | 3.911% | | | | 1-Month LIBOR | | | | 3.750% | | | | 10/10/25 | | | | Caa1 | | | | 1,140,279 | |
| | 96 | | | HCA, Inc., Term Loan B13 | | | 1.911% | | | | 1-Month LIBOR | | | | 1.750% | | | | 3/18/26 | | | | BBB– | | | | 94,897 | |
| | 465 | | | Heartland Dental Care, Inc., Term Loan, First Lien | | | 3.661% | | | | 1-Month LIBOR | | | | 3.500% | | | | 4/30/25 | | | | B3 | | | | 413,828 | |
| | 488 | | | InnovaCare, Initial Term Loan | | | 6.750% | | | | 3-Month LIBOR | | | | 5.750% | | | | 11/06/26 | | | | B+ | | | | 476,531 | |
| | 425 | | | Jordan Health, Initial Term Loan, First Lien | | | 5.386% | | | | 3-Month LIBOR | | | | 5.000% | | | | 5/15/25 | | | | Caa1 | | | | 351,138 | |
| | 1,736 | | | Kindred at Home Hospice, Term Loan B, First Lien | | | 3.438% | | | | 1-Month LIBOR | | | | 3.250% | | | | 7/02/25 | | | | B1 | | | | 1,715,167 | |
| | 2,372 | | | Lifepoint Health, Inc., New Term Loan B | | | 3.911% | | | | 1-Month LIBOR | | | | 3.750% | | | | 11/16/25 | | | | B1 | | | | 2,325,220 | |
| | 2,316 | | | Pharmaceutical Product Development, Inc., Term Loan B | | | 3.500% | | | | 1-Month LIBOR | | | | 2.500% | | | | 8/18/22 | | | | Ba2 | | | | 2,310,395 | |
| | 103 | | | Quorum Health Corp, Term Loan, (6) | | | 9.250% | | | | 3-Month LIBOR | | | | 8.250% | | | | 4/29/22 | | | | N/R | | | | 96,062 | |
| | 1,986 | | | Select Medical Corporation, Term Loan B | | | 2.680% | | | | 1-Month LIBOR | | | | 2.500% | | | | 3/06/25 | | | | Ba2 | | | | 1,937,357 | |
| | 1,117 | | | Surgery Center Holdings Inc., Initial Term Loan, (DD1) | | | 4.250% | | | | 1-Month LIBOR | | | | 3.250% | | | | 9/03/24 | | | | B2 | | | | 1,059,730 | |
| | 1,269 | | | Team Health, Inc., Initial Term Loan | | | 3.750% | | | | 1-Month LIBOR | | | | 2.750% | | | | 2/06/24 | | | | B+ | | | | 1,012,963 | |
| | 20,486 | | | Total Health Care Providers & Services | | | | | | | | | | | | | | | | | | | | | | | 19,194,237 | |
| |
| | | | Health Care Technology – 2.9% (1.9% of Total Investments) | |
| | | | | | | |
| | 2,846 | | | Emdeon, Inc., Term Loan | | | 3.500% | | | | 3-Month LIBOR | | | | 2.500% | | | | 3/01/24 | | | | B+ | | | | 2,792,122 | |
| | 117 | | | Emdeon, Inc., Term Loan | | | 3.500% | | | | 1-Month LIBOR | | | | 2.500% | | | | 3/01/24 | | | | B+ | | | | 114,486 | |
| | 1,545 | | | Onex Carestream Finance LP, New Extended Term Loan, First Lien | | | 7.822% | | | | 3-Month LIBOR | | | | 6.750% | | | | 5/05/23 | | | | B1 | | | | 1,473,558 | |
| | 951 | | | Onex Carestream Finance LP, New Extended Term Loan, Second Lien | | | 5.572% | | | | 3-Month LIBOR | | | | 4.500% | | | | 8/05/23 | | | | Caa1 | | | | 765,738 | |
| | 1,144 | | | Zelis, Term Loan B | | | 4.911% | | | | 1-Month LIBOR | | | | 4.750% | | | | 9/30/26 | | | | B | | | | 1,143,638 | |
| | 6,603 | | | Total Health Care Technology | | | | | | | | | | | | | | | | | | | | | | | 6,289,542 | |
| |
| | | | Hotels, Restaurants & Leisure – 14.5% (9.1% of Total Investments) | |
| | | | | | | |
| | 300 | | | 24 Hour Fitness Worldwide, Inc., DIP Term Loan, (5), (6) | | | 11.000% | | | | 3-Month LIBOR | | | | 10.000% | | | | 6/15/21 | | | | B2 | | | | 289,210 | |
| | 1,008 | | | 24 Hour Fitness Worldwide, Inc., Term Loan B, (6) | | | 0.000% | | | | N/A | | | | N/A | | | | 5/31/25 | | | | D | | | | 238,384 | |
| | 2,263 | | | Alterra Mountain Company, Term Loan B, First Lien | | | 2.911% | | | | 1-Month LIBOR | | | | 2.750% | | | | 7/31/24 | | | | B1 | | | | 2,182,373 | |
| | 339 | | | Boyd Gaming Corporation, Refinancing Term Loan B | | | 2.361% | | | | 1-Week LIBOR | | | | 2.250% | | | | 9/15/23 | | | | BB– | | | | 328,497 | |
| | 6,872 | | | Burger King Corporation, Term Loan B4 | | | 1.911% | | | | 1-Month LIBOR | | | | 1.750% | | | | 11/19/26 | | | | BB+ | | | | 6,609,334 | |
| | 500 | | | Caesars Resort Collection, Term Loan | | | 4.687% | | | | 1-Month LIBOR | | | | 4.500% | | | | 7/20/25 | | | | B+ | | | | 483,047 | |
| | 250 | | | Caesars Resort Collection, Term Loan | | | 4.772% | | | | 3-Month LIBOR | | | | 4.500% | | | | 7/20/25 | | | | B+ | | | | 241,524 | |
| | 3,206 | | | Caesars Resort Collection, Term Loan, First Lien | | | 2.911% | | | | 1-Month LIBOR | | | | 2.750% | | | | 12/22/24 | | | | B+ | | | | 2,959,123 | |
| | 965 | | | CCM Merger, Inc., Term Loan B | | | 3.000% | | | | 1-Month LIBOR | | | | 2.250% | | | | 8/09/21 | | | | BB | | | | 950,293 | |
| | | | | | | |
| | 2,135 | | | CityCenter Holdings LLC, Term Loan B | | | 3.000% | | | | 1-Month LIBOR | | | | 2.250% | | | | 4/18/24 | | | | B+ | | | | 1,983,119 | |
33
| | |
| |
| NSL | | Nuveen Senior Income Fund (continued) |
| | Portfolio of Investments July 31, 2020 |
| | | | | | | | | | | | | | | | | | | | | | | | | | | | |
Principal
Amount (000) | | | Description (1) | | Coupon (2) | | | Reference
Rate (2) | | | Spread (2) | | | Maturity (3) | | | Ratings (4) | | | Value | |
| |
| | | | Hotels, Restaurants & Leisure (continued) | |
| $ | 1,610 | | | ClubCorp Operations, Inc., Term Loan B | | | 3.058% | | | | 3-Month LIBOR | | | | 2.750% | | | | 9/18/24 | | | | B– | | | $ | 1,395,492 | |
| | 1,312 | | | Equinox Holdings, Inc., Term Loan B1 | | | 4.072% | | | | 6-Month LIBOR | | | | 3.000% | | | | 3/08/24 | | | | Caa1 | | | | 994,987 | |
| | 483 | | | Four Seasons Holdings, Inc., Term Loan B | | | 2.161% | | | | 1-Month LIBOR | | | | 2.000% | | | | 11/30/23 | | | | BB+ | | | | 467,294 | |
| | 598 | | | Golden Nugget LLC, Initial Term Loan B | | | 3.250% | | | | 1-Month LIBOR | | | | 2.500% | | | | 10/04/23 | | | | B | | | | 504,797 | |
| | 1,530 | | | Hilton Hotels, Term Loan B2 | | | 1.922% | | | | 1-Month LIBOR | | | | 1.750% | | | | 6/21/26 | | | | BBB– | | | | 1,475,927 | |
| | 1,563 | | | Life Time Fitness, Inc., Term Loan B | | | 3.750% | | | | 3-Month LIBOR | | | | 2.750% | | | | 6/15/22 | | | | B | | | | 1,417,525 | |
| | 4 | | | Life Time Fitness, Inc., Term Loan B | | | 3.750% | | | | 6-Month LIBOR | | | | 2.750% | | | | 6/15/22 | | | | B | | | | 3,653 | |
| | 439 | | | PCI Gaming, Term Loan, First Lien | | | 2.661% | | | | 1-Month LIBOR | | | | 2.500% | | | | 5/31/26 | | | | BBB– | | | | 422,838 | |
| | 607 | | | Scientific Games Corp., Initial Term Loan B5 | | | 2.911% | | | | 1-Month LIBOR | | | | 2.750% | | | | 8/14/24 | | | | B+ | | | | 554,513 | |
| | 8 | | | Scientific Games Corp., Initial Term Loan B5 | | | 3.058% | | | | 3-Month LIBOR | | | | 2.750% | | | | 8/14/24 | | | | B+ | | | | 7,234 | |
| | 2,480 | | | Scientific Games Corp., Initial Term Loan B5 | | | 3.612% | | | | 6-Month LIBOR | | | | 2.750% | | | | 8/14/24 | | | | B+ | | | | 2,266,710 | |
| | 868 | | | Seaworld Parks and Entertainment, Inc., Term Loan B5 | | | 3.750% | | | | 1-Month LIBOR | | | | 3.000% | | | | 3/31/24 | | | | B2 | | | | 810,388 | |
| | 2,153 | | | Stars Group Holdings, Term Loan B | | | 3.808% | | | | 3-Month LIBOR | | | | 3.500% | | | | 7/10/25 | | | | BBB– | | | | 2,156,377 | |
| | 1,465 | | | Station Casinos LLC, Term Loan B | | | 2.500% | | | | 1-Month LIBOR | | | | 2.250% | | | | 2/08/27 | | | | BB– | | | | 1,357,642 | |
| | 983 | | | Wyndham International, Inc., Term Loan B | | | 1.911% | | | | 1-Month LIBOR | | | | 1.750% | | | | 5/30/25 | | | | BB+ | | | | 939,108 | |
| | 33,941 | | | Total Hotels, Restaurants & Leisure | | | | | | | | | | | | | | | | | | | | | | | 31,039,389 | |
| |
| | | | Household Durables – 0.4% (0.3% of Total Investments) | |
| | | | | | | |
| | 696 | | | Apex Tool Group LLC, Third Amendment Term Loan | | | 6.500% | | | | 1-Month LIBOR | | | | 5.250% | | | | 8/21/24 | | | | B3 | | | | 642,617 | |
| | 38 | | | Serta Simmons Holdings LLC, First Out Term Loan | | | 8.500% | | | | 2-Month LIBOR | | | | 7.500% | | | | 6/01/27 | | | | B+ | | | | 37,606 | |
| | 308 | | | Serta Simmons Holdings LLC, Second Out Term Loan | | | 8.500% | | | | 2-Month LIBOR | | | | 7.500% | | | | 6/01/27 | | | | B | | | | 236,878 | |
| | 1,042 | | | Total Household Durables | | | | | | | | | | | | | | | | | | | | | | | 917,101 | |
| |
| | | | Household Products – 1.8% (1.1% of Total Investments) | |
| | | | | | | |
| | 3,469 | | | KIK Custom Products Inc., Term Loan B2, (DD1) | | | 5.000% | | | | 1-Month LIBOR | | | | 4.000% | | | | 5/15/23 | | | | B– | | | | 3,431,067 | |
| | 477 | | | Reynolds Group Holdings, Inc., Term Loan, First Lien | | | 2.911% | | | | 1-Month LIBOR | | | | 2.750% | | | | 2/05/23 | | | | B+ | | | | 468,646 | |
| | 3,946 | | | Total Household Products | | | | | | | | | | | | | | | | | | | | | | | 3,899,713 | |
| |
| | | | Industrial Conglomerates – 0.3% (0.2% of Total Investments) | |
| | | | | | | |
| | 2 | | | Education Adisory Board, Term Loan, First Lien | | | 4.750% | | | | 1-Month LIBOR | | | | 3.750% | | | | 9/29/24 | | | | B2 | | | | 1,798 | |
| | 731 | | | Education Adisory Board, Term Loan, First Lien | | | 4.750% | | | | 3-Month LIBOR | | | | 3.750% | | | | 9/29/24 | | | | B2 | | | | 701,104 | |
| | 733 | | | Total Industrial Conglomerates | | | | | | | | | | | | | | | | | | | | | | | 702,902 | |
| |
| | | | Insurance – 2.4% (1.5% of Total Investments) | |
| | | | | | | |
| | 1,133 | | | Acrisure LLC, Term Loan B | | | 3.661% | | | | 1-Month LIBOR | | | | 3.500% | | | | 2/15/27 | | | | B | | | | 1,094,928 | |
| | 1,795 | | | Alliant Holdings I LLC, Term Loan B | | | 2.911% | | | | 1-Month LIBOR | | | | 2.750% | | | | 5/10/25 | | | | B | | | | 1,740,161 | |
| | 467 | | | Asurion LLC, Term Loan B6 | | | 3.161% | | | | 1-Month LIBOR | | | | 3.000% | | | | 11/03/23 | | | | Ba3 | | | | 460,858 | |
| | 1,625 | | | Hub International Holdings, Inc., Term Loan B | | | 3.219% | | | | 3-Month LIBOR | | | | 3.000% | | | | 4/25/25 | | | | B | | | | 1,583,063 | |
| | 275 | | | Ryan Specialty Group LLC, Term Loan B, (WI/DD) | | | TBD | | | | TBD | | | | TBD | | | | TBD | | | | B1 | | | | 273,625 | |
| | 5,295 | | | Total Insurance | | | | | | | | | | | | | | | | | | | | | | | 5,152,635 | |
| |
| | | | Interactive Media & Services – 1.9% (1.2% of Total Investments) | |
| | | | | | | |
| | 3,208 | | | Rackspace Hosting, Inc., Refinancing Term Loan B, First Lien, (DD1) | | | 4.000% | | | | 3-Month LIBOR | | | | 3.000% | | | | 11/03/23 | | | | B+ | | | | 3,150,083 | |
| | 975 | | | WeddingWire, Inc., Term Loan | | | 4.808% | | | | 3-Month LIBOR | | | | 4.500% | | | | 12/21/25 | | | | B+ | | | | 897,093 | |
| | 4,183 | | | Total Interactive Media & Services | | | | | | | | | | | | | | | | | | | | | | | 4,047,176 | |
| |
| | | | Internet & Direct Marketing Retail – 0.7% (0.4% of Total Investments) | |
| | | | | | | |
| | 1,447 | | | Uber Technologies, Inc., Term Loan | | | 5.000% | | | | 1-Month LIBOR | | | | 4.000% | | | | 4/04/25 | | | | B1 | | | | 1,430,312 | |
| |
| | | | Internet Software & Services – 2.0% (1.2% of Total Investments) | |
| | | | | | | |
| | 962 | | | Ancestry.com, Inc., Term Loan, First Lien | | | 4.750% | | | | 1-Month LIBOR | | | | 3.750% | | | | 10/19/23 | | | | B | | | | 948,283 | |
| | 554 | | | Blue Yonder, Term Loan B, (WI/DD) | | | TBD | | | | TBD | | | | TBD | | | | TBD | | | | B1 | | | | 554,098 | |
| | 552 | | | Dynatrace LLC, Term Loan, First Lien | | | 2.411% | | | | 1-Month LIBOR | | | | 2.250% | | | | 8/23/25 | | | | B1 | | | | 544,872 | |
| | 2,087 | | | Epicor Software Corporation, Term Loan, First Lien, (DD1) | | | 5.250% | | | | 3-Month LIBOR | | | | 4.250% | | | | 7/30/27 | | | | B2 | | | | 2,087,706 | |
| | | | | | | |
| | 1,109 | | | SkillSoft Corporation, Term Loan, Second Lien, (6) | | | 0.000% | | | | N/A | | | | N/A | | | | 4/28/22 | | | | CCC | | | | 46,573 | |
| | 5,264 | | | Total Internet Software & Services | | | | | | | | | | | | | | | | | | | | | | | 4,181,532 | |
34
| | | | | | | | | | | | | | | | | | | | | | | | | | | | |
Principal
Amount (000) | | | Description (1) | | Coupon (2) | | | Reference
Rate (2) | | | Spread (2) | | | Maturity (3) | | | Ratings (4) | | | Value | |
| |
| | | | IT Services – 4.3% (2.7% of Total Investments) | |
| | | | | | | |
| $ | 832 | | | Datto, Inc., Term Loan | | | 4.411% | | | | 1-Month LIBOR | | | | 4.250% | | | | 4/02/26 | | | | B | | | $ | 829,155 | |
| | 1 | | | DTI Holdings, Inc., Replacement Term Loan B1 | | | 5.750% | | | | 2-Month LIBOR | | | | 4.750% | | | | 9/30/23 | | | | CCC+ | | | | 1,036 | |
| | 498 | | | DTI Holdings, Inc., Replacement Term Loan B1 | | | 5.750% | | | | 3-Month LIBOR | | | | 4.750% | | | | 9/30/23 | | | | CCC+ | | | | 397,290 | |
| | 97 | | | iQor US, Inc., Term Loan, (6) | | | 11.000% | | | | 1-Month LIBOR | | | | 10.000% | | | | 5/27/21 | | | | N/R | | | | 91,449 | |
| | 648 | | | KBR, Inc., New Term Loan B | | | 2.911% | | | | 1-Month LIBOR | | | | 2.750% | | | | 2/07/27 | | | | Ba1 | | | | 640,134 | |
| | 1,081 | | | Sabre, Inc., Term Loan B | | | 2.161% | | | | 1-Month LIBOR | | | | 2.000% | | | | 2/22/24 | | | | Ba3 | | | | 992,643 | |
| | 422 | | | Science Applications International Corporation, Term Loan B | | | 2.036% | | | | 1-Month LIBOR | | | | 1.875% | | | | 10/31/25 | | | | BB+ | | | | 416,704 | |
| | 2,000 | | | Syniverse Holdings, Inc., Initial Term Loan, Second Lien | | | 10.000% | | | | 3-Month LIBOR | | | | 9.000% | | | | 3/11/24 | | | | CCC– | | | | 1,046,790 | |
| | 1,868 | | | Syniverse Holdings, Inc., Term Loan C | | | 6.000% | | | | 3-Month LIBOR | | | | 5.000% | | | | 3/09/23 | | | | CCC+ | | | | 1,490,038 | |
| | 1,213 | | | Tempo Acquisition LLC, Term Loan B | | | 2.911% | | | | 1-Month LIBOR | | | | 2.750% | | | | 5/01/24 | | | | B1 | | | | 1,186,128 | |
| | 1,603 | | | West Corporation, Term Loan B , (DD1) | | | 5.000% | | | | 3-Month LIBOR | | | | 4.000% | | | | 10/10/24 | | | | BB– | | | | 1,417,190 | |
| | 720 | | | WEX, Inc., Term Loan B3 | | | 2.411% | | | | 1-Month LIBOR | | | | 2.250% | | | | 5/17/26 | | | | Ba2 | | | | 698,459 | |
| | 10,983 | | | Total IT Services | | | | | | | | | | | | | | | | | | | | | | | 9,207,016 | |
| |
| | | | Leosire Products – 0.2% (0.1% of Total Investments) | |
| | | | | | | |
| | 425 | | | Carnival Corp, Term Loan B, (DD1) | | | 8.500% | | | | 1-Month LIBOR | | | | 7.500% | | | | 6/30/25 | | | | Baa3 | | | | 418,183 | |
| |
| | | | Life Sciences Tools & Services – 1.0% (0.6% of Total Investments) | |
| | | | | | | |
| | 194 | | | Inventiv Health, Inc., Term Loan B | | | 1.911% | | | | 1-Month LIBOR | | | | 1.750% | | | | 8/01/24 | | | | BB | | | | 189,826 | |
| | 1,934 | | | Parexel International Corp., Term Loan B | | | 2.911% | | | | 1-Month LIBOR | | | | 2.750% | | | | 9/27/24 | | | | B2 | | | | 1,864,230 | |
| | 2,128 | | | Total Life Sciences Tools & Services | | | | | | | | | | | | | | | | | | | | | | | 2,054,056 | |
| |
| | | | Machinery – 1.5% (0.9% of Total Investments) | |
| | | | | | | |
| | 972 | | | Gardner Denver, Inc., Extended Term Loan B | | | 1.911% | | | | 1-Month LIBOR | | | | 1.750% | | | | 2/28/27 | | | | Ba2 | | | | 937,710 | |
| | 109 | | | Gardner Denver, Inc., New Term Loan B | | | 2.916% | | | | 1-Month LIBOR | | | | 2.750% | | | | 1/31/27 | | | | BB+ | | | | 107,780 | |
| | 821 | | | Gates Global LLC, Term Loan B | | | 3.750% | | | | 1-Month LIBOR | | | | 2.750% | | | | 4/01/24 | | | | B1 | | | | 804,191 | |
| | 1,000 | | | Thyssenkrupp Elevator, Term Loan B, (WI/DD) | | | TBD | | | | TBD | | | | TBD | | | | TBD | | | | B1 | | | | 987,815 | |
| | 271 | | | TNT Crane and Rigging Inc., Initial Term Loan, First Lien, (6) | | | 0.000% | | | | N/A | | | | N/A | | | | 11/27/20 | | | | Caa3 | | | | 193,704 | |
| | 500 | | | TNT Crane and Rigging, Inc., Term Loan, Second Lien, (6) | | | 0.000% | | | | N/A | | | | N/A | | | | 11/27/21 | | | | C | | | | 88,162 | |
| | 3,673 | | | Total Machinery | | | | | | | | | | | | | | | | | | | | | | | 3,119,362 | |
| |
| | | | Marine – 0.2% (0.2% of Total Investments) | |
| | | | | | | |
| | 1,024 | | | Harvey Gulf International Marine, Inc., Exit Term Loan | | | 7.713% | | | | 3-Month LIBOR | | | | 6.000% | | | | 7/02/23 | | | | B– | | | | 495,572 | |
| |
| | | | Media – 16.7% (10.5% of Total Investments) | |
| | | | | | | |
| | 360 | | | Advantage Sales & Marketing, Inc., Term Loan B2, First Lien | | | 4.250% | | | | 3-Month LIBOR | | | | 3.250% | | | | 7/25/21 | | | | B2 | | | | 342,680 | |
| | 961 | | | Advantage Sales & Marketing, Inc., Term Loan, First Lien | | | 4.250% | | | | 3-Month LIBOR | | | | 3.250% | | | | 7/25/21 | | | | B2 | | | | 914,978 | |
| | 269 | | | Affinion Group Holdings, Inc., Consenting Term Loan, (cash 3.250%, PIK 1.750%) | | | 5.000% | | | | 3-Month LIBOR | | | | 4.000% | | | | 4/10/24 | | | | N/R | | | | 190,292 | |
| | | | | | | |
| | 203 | | | Catalina Marketing Corporation, First Out Term Loan | | | 8.500% | | | | 1-Month LIBOR | | | | 7.500% | | | | 2/15/23 | | | | B2 | | | | 124,961 | |
| | 304 | | | Catalina Marketing Corporation, Last Out Term Loan, (cash 2.000%, PIK 9.500%) | | | 11.500% | | | | 1-Month LIBOR | | | | 1.000% | | | | 8/15/23 | | | | Caa2 | | | | 67,698 | |
| | | | | | | |
| | 144 | | | CBS Radio, Inc., Term Loan B2 | | | 2.673% | | | | 1-Month LIBOR | | | | 2.500% | | | | 11/17/24 | | | | BB– | | | | 137,483 | |
| | 2,850 | | | Cequel Communications LLC, Term Loan B | | | 2.425% | | | | 1-Month LIBOR | | | | 2.250% | | | | 1/15/26 | | | | BB | | | | 2,761,473 | |
| | 2,711 | | | Charter Communications Operating Holdings LLC, Term Loan B2 | | | 1.920% | | | | 1-Month LIBOR | | | | 1.750% | | | | 2/01/27 | | | | BBB– | | | | 2,650,905 | |
| | 1,510 | | | Cineworld Group PLC, Term Loan B | | | 3.322% | | | | 6-Month LIBOR | | | | 2.250% | | | | 2/28/25 | | | | B | | | | 969,979 | |
| | 7 | | | Clear Channel Outdoor Holdings, Inc., Term Loan B | | | 3.714% | | | | 2-Month LIBOR | | | | 3.500% | | | | 8/21/26 | | | | B1 | | | | 6,593 | |
| | 2,921 | | | Clear Channel Outdoor Holdings, Inc., Term Loan B | | | 3.761% | | | | 3-Month LIBOR | | | | 3.500% | | | | 8/21/26 | | | | B1 | | | | 2,610,665 | |
| | 964 | | | CSC Holdings LLC, Refinancing Term Loan | | | 2.425% | | | | 1-Month LIBOR | | | | 2.250% | | | | 7/17/25 | | | | BB | | | | 934,937 | |
| | 2,047 | | | CSC Holdings, LLC, Term Loan B5 | | | 2.675% | | | | 1-Month LIBOR | | | | 2.500% | | | | 4/15/27 | | | | Ba3 | | | | 1,988,730 | |
| | | | | | | |
| | 326 | | | Cumulus Media, Inc., Term Loan B | | | 4.822% | | | | 3-Month LIBOR | | | | 3.750% | | | | 3/31/26 | | | | B | | | | 312,175 | |
| | 494 | | | EW Scripps, Term Loan B2 | | | 2.661% | | | | 1-Month LIBOR | | | | 2.500% | | | | 5/01/26 | | | | BB+ | | | | 477,721 | |
| | 415 | | | Gray Television, Inc., Term Loan B2 | | | 2.421% | | | | 1-Month LIBOR | | | | 2.250% | | | | 2/07/24 | | | | BB+ | | | | 404,834 | |
| | 366 | | | Houghton Mifflin Harcourt, Term Loan | | | 7.250% | | | | 1-Month LIBOR | | | | 6.250% | | | | 11/22/24 | | | | B | | | | 330,891 | |
35
| | |
| |
| NSL | | Nuveen Senior Income Fund (continued) |
| | Portfolio of Investments July 31, 2020 |
| | | | | | | | | | | | | | | | | | | | | | | | | | | | |
Principal
Amount (000) | | | Description (1) | | Coupon (2) | | | Reference
Rate (2) | | | Spread (2) | | | Maturity (3) | | | Ratings (4) | | | Value | |
| |
| | | | Media (continued) | |
| | | | | | | |
| $ | 2,521 | | | iHeartCommunications Inc., Term Loan B | | | 3.161% | | | | 1-Month LIBOR | | | | 3.000% | | | | 5/01/26 | | | | B+ | | | $ | 2,367,082 | |
| | 905 | | | IMG Worldwide, Inc., Term Loan B | | | 2.920% | | | | 1-Month LIBOR | | | | 2.750% | | | | 5/16/25 | | | | B3 | | | | 722,355 | |
| | 1,120 | | | Intelsat Jackson Holdings, S.A., DIP Term Loan, (5), (6) | | | 6.500% | | | | 3-Month LIBOR | | | | 5.500% | | | | 7/13/21 | | | | B2 | | | | 1,143,480 | |
| | 3,422 | | | Intelsat Jackson Holdings, S.A., Term Loan B, (DD1), (6) | | | 8.000% | | | | Prime | | | | 4.750% | | | | 11/27/23 | | | | B | | | | 3,455,604 | |
| | 643 | | | LCPR Loan Financing LLC, Term Loan B | | | 5.175% | | | | 1-Month LIBOR | | | | 5.000% | | | | 10/15/26 | | | | BB– | | | | 647,891 | |
| | 2,449 | | | McGraw-Hill Education Holdings LLC, Term Loan B | | | 5.000% | | | | 3-Month LIBOR | | | | 4.000% | | | | 5/04/22 | | | | BB+ | | | | 2,143,962 | |
| | 290 | | | Meredith Corporation, Incremental Term Loan B | | | 5.250% | | | | 1-Month LIBOR | | | | 4.250% | | | | 1/31/25 | | | | BB– | | | | 284,080 | |
| | 1,405 | | | Meredith Corporation, Term Loan B2 | | | 2.667% | | | | 1-Month LIBOR | | | | 2.500% | | | | 1/31/25 | | | | BB– | | | | 1,330,823 | |
| | 983 | | | Metro-Goldwyn-Mayer, Inc., Term Loan, First Lien | | | 2.670% | | | | 1-Month LIBOR | | | | 2.500% | | | | 7/03/25 | | | | BB | | | | 944,428 | |
| | 750 | | | Metro-Goldwyn-Mayer, Inc., Term Loan, Second Lien | | | 5.500% | | | | 2-Month LIBOR | | | | 4.500% | | | | 7/06/26 | | | | B– | | | | 726,563 | |
| | 576 | | | Nexstar Broadcasting, Inc., Term Loan B | | | 2.921% | | | | 1-Month LIBOR | | | | 2.750% | | | | 9/19/26 | | | | BB | | | | 562,554 | |
| | 350 | | | Nexstar Broadcasting, Inc., Term Loan B3 | | | 2.421% | | | | 1-Month LIBOR | | | | 2.250% | | | | 1/17/24 | | | | BB | | | | 340,964 | |
| | 1,364 | | | Nexstar Broadcasting, Inc., Term Loan B3 | | | 2.416% | | | | 1-Month LIBOR | | | | 2.250% | | | | 1/17/24 | | | | BB | | | | 1,328,746 | |
| | 833 | | | Sinclair Television Group, Term Loan B2 | | | 2.420% | | | | 1-Month LIBOR | | | | 2.250% | | | | 1/03/24 | | | | BB+ | | | | 813,465 | |
| | 917 | | | WideOpenWest Finance LLC, Term Loan B | | | 4.250% | | | | 1-Month LIBOR | | | | 3.250% | | | | 8/19/23 | | | | B | | | | 906,302 | |
| | 2,768 | | | Ziggo B.V., Term Loan | | | 2.675% | | | | 1-Month LIBOR | | | | 2.500% | | | | 4/30/28 | | | | BB | | | | 2,666,157 | |
| | 38,148 | | | Total Media | | | | | | | | | | | | | | | | | | | | | | | 35,611,451 | |
| |
| | | | Multiline Retail – 0.7% (0.4% of Total Investments) | |
| | | | | | | |
| | 1,508 | | | Belk, Inc., Term Loan, First Lien | | | 7.750% | | | | 6-Month LIBOR | | | | 6.750% | | | | 7/31/25 | | | | Caa1 | | | | 657,957 | |
| | 856 | | | EG America LLC, Term Loan, First Lien | | | 5.072% | | | | 6-Month LIBOR | | | | 4.000% | | | | 2/07/25 | | | | B2 | | | | 815,305 | |
| | 2,364 | | | Total Multiline Retail | | | | | | | | | | | | | | | | | | | | | | | 1,473,262 | |
| |
| | | | Multi-Utilities – 0.2% (0.1% of Total Investments) | |
| | | | | | | |
| | 500 | | | Pacific Gas & Electric, Term Loan, First Lien | | | 5.500% | | | | Prime | | | | 4.500% | | | | 4/27/22 | | | | B1 | | | | 495,625 | |
| |
| | | | Oil, Gas & Consumable Fuels – 3.1% (1.9% of Total Investments) | |
| | | | | | | |
| | 723 | | | BCP Renaissance Parent, Term Loan B | | | 4.500% | | | | 3-Month LIBOR | | | | 3.500% | | | | 11/01/24 | | | | B+ | | | | 654,926 | |
| | 922 | | | Buckeye Partners, Term Loan, First Lien | | | 2.921% | | | | 1-Month LIBOR | | | | 2.750% | | | | 11/01/26 | | | | BBB– | | | | 903,862 | |
| | 1,932 | | | California Resources Corporation, DIP Term Loan | | | 10.000% | | | | 1-Month LIBOR | | | | 9.000% | | | | 2/21/28 | | | | N/R | | | | 1,912,382 | |
| | 328 | | | California Resources Corporation, Term Loan, (6) | | | 0.000% | | | | N/A | | | | N/A | | | | 12/31/21 | | | | D | | | | 14,197 | |
| | 3,260 | | | California Resources Corporation, Term Loan B, (6) | | | 0.000% | | | | N/A | | | | N/A | | | | 12/31/22 | | | | D | | | | 1,257,431 | |
| | 4,121 | | | Fieldwood Energy LLC, Exit Term Loan, (DD1), (6) | | | 7.027% | | | | 3-Month LIBOR | | | | 5.250% | | | | 4/11/22 | | | | CCC | | | | 1,023,447 | |
| | 2,186 | | | Fieldwood Energy LLC, Exit Term Loan, Second Lien, (6) | | | 0.000% | | | | N/A | | | | N/A | | | | 4/11/23 | | | | C | | | | 37,581 | |
| | 942 | | | Gulf Finance, LLC, Term Loan B | | | 6.250% | | | | 1-Month LIBOR | | | | 5.250% | | | | 8/25/23 | | | | CCC+ | | | | 615,638 | |
| | 419 | | | Peabody Energy Corporation, Term Loan B | | | 2.911% | | | | 1-Month LIBOR | | | | 2.750% | | | | 3/31/25 | | | | B1 | | | | 224,464 | |
| | 14,833 | | | Total Oil, Gas & Consumable Fuels | | | | | | | | | | | | | | | | | | | | | | | 6,643,928 | |
| |
| | | | Personal Products – 0.8% (0.5% of Total Investments) | |
| | | | | | | |
| | 1,091 | | | Coty, Inc., Term Loan A | | | 1.916% | | | | 1-Month LIBOR | | | | 1.750% | | | | 4/05/23 | | | | B | | | | 992,682 | |
| | 131 | | | Coty, Inc., Term Loan B | | | 2.416% | | | | 1-Month LIBOR | | | | 2.250% | | | | 4/05/25 | | | | B | | | | 113,931 | |
| | 2,514 | | | Revlon Consumer Products Corporation, Term Loan B, First Lien | | | 4.250% | | | | 3-Month LIBOR | | | | 3.500% | | | | 9/07/23 | | | | C | | | | 687,122 | |
| | 3,736 | | | Total Personal Products | | | | | | | | | | | | | | | | | | | | | | | 1,793,735 | |
| |
| | | | Pharmaceuticals – 4.5% (2.8% of Total Investments) | |
| | | | | | | |
| | 576 | | | Alphabet Holding Company, Inc., Initial Term Loan, First Lien | | | 3.661% | | | | 1-Month LIBOR | | | | 3.500% | | | | 9/28/24 | | | | B– | | | | 554,763 | |
| | 2,295 | | | Concordia Healthcare Corp, Exit Term Loan | | | 6.568% | | | | 6-Month LIBOR | | | | 5.500% | | | | 9/06/24 | | | | B– | | | | 2,147,919 | |
| | 490 | | | Elanco Animal Health, Term Loan B, (WI/DD) | | | TBD | | | | TBD | | | | TBD | | | | TBD | | | | Baa3 | | | | 478,975 | |
| | 761 | | | Endo Health Solutions, Inc., Term Loan B | | | 5.000% | | | | 3-Month LIBOR | | | | 4.250% | | | | 4/29/24 | | | | B+ | | | | 731,197 | |
| | 1,076 | | | Mallinckrodt International Finance S.A., Term Loan B, First Lien | | | 3.500% | | | | 6-Month LIBOR | | | | 2.750% | | | | 9/24/24 | | | | B– | | | | 904,686 | |
| | 579 | | | Mallinckrodt International Finance S.A., Term Loan, First Lien | | | 3.750% | | | | 3-Month LIBOR | | | | 3.000% | | | | 2/24/25 | | | | B– | | | | 488,248 | |
| | | | | | | |
| | 1,561 | | | Valeant Pharmaceuticals International, Inc., Term Loan B | | | 2.926% | | | | 1-Month LIBOR | | | | 2.750% | | | | 11/27/25 | | | | BB | | | | 1,532,327 | |
36
| | | | | | | | | | | | | | | | | | | | | | | | | | | | |
Principal
Amount (000) | | | Description (1) | | Coupon (2) | | | Reference
Rate (2) | | | Spread (2) | | | Maturity (3) | | | Ratings (4) | | | Value | |
| |
| | | | Pharmaceuticals (continued) | |
| | | | | | | |
| $ | 2,721 | | | Valeant Pharmaceuticals International, Inc., Term Loan, First Lien, (DD1) | | | 3.176% | | | | 1-Month LIBOR | | | | 3.000% | | | | 6/02/25 | | | | BB | | | $ | 2,683,052 | |
| | 10,059 | | | Total Pharmaceuticals | | | | | | | | | | | | | | | | | | | | | | | 9,521,167 | |
| |
| | | | Professional Services – 2.5% (1.6% of Total Investments) | |
| | | | | | | |
| | 1,172 | | | Ceridian HCM Holding, Inc., Term Loan B | | | 2.611% | | | | 1-Week LIBOR | | | | 2.500% | | | | 4/30/25 | | | | B+ | | | | 1,140,916 | |
| | 497 | | | Creative Artists Agency, LLC, Term Loan B | | | 3.911% | | | | 1-Month LIBOR | | | | 3.750% | | | | 11/26/26 | | | | B | | | | 474,242 | |
| | 748 | | | Dun & Bradstreet Corp.,Term Loan, First Lien | | | 3.922% | | | | 1-Month LIBOR | | | | 3.750% | | | | 2/08/26 | | | | BB | | | | 745,866 | |
| | 1,001 | | | Nielsen Finance LLC, Term Loan B4 | | | 2.183% | | | | 1-Month LIBOR | | | | 2.000% | | | | 10/04/23 | | | | BBB– | | | | 976,392 | |
| | 448 | | | On Assignment, Inc., Term Loan B3 | | | 1.911% | | | | 1-Month LIBOR | | | | 1.750% | | | | 4/02/25 | | | | BBB– | | | | 442,107 | |
| | 2,329 | | | Skillsoft Corporation, Initial Term Loan, First Lien, (6) | | | 0.000% | | | | N/A | | | | N/A | | | | 4/28/21 | | | | CCC+ | | | | 1,516,025 | |
| | 6,195 | | | Total Professional Services | | | | | | | | | | | | | | | | | | | | | | | 5,295,548 | |
| |
| | | | Real Estate Management & Development – 0.6% (0.4% of Total Investments) | |
| | | | | | | |
| | 1,345 | | | GGP, Initial Term Loan A2 | | | 3.161% | | | | 1-Month LIBOR | | | | 2.500% | | | | 8/24/23 | | | | BB+ | | | | 1,200,100 | |
| | | | | | | |
| | | | Road & Rail – 2.1% (1.3% of Total Investments) | | | | | | | | | | | | | | | | | | |
| | | | | | | |
| | 1,002 | | | Avolon LLC, Term Loan B3 | | | 2.500% | | | | 1-Month LIBOR | | | | 1.750% | | | | 1/15/25 | | | | Baa2 | | | | 959,419 | |
| | 733 | | | Ceva Group PLC, Term Loan B | | | 5.308% | | | | 3-Month LIBOR | | | | 5.000% | | | | 8/03/25 | | | | B+ | | | | 628,658 | |
| | 1,247 | | | Genesee & Wyoming Inc., Term Loan, First Lien | | | 2.308% | | | | 3-Month LIBOR | | | | 2.000% | | | | 12/30/26 | | | | BB+ | | | | 1,226,420 | |
| | 650 | | | Hertz Corporation, Term Loan, (WI/DD), (6) | | | TBD | | | | TBD | | | | TBD | | | | TBD | | | | N/R | | | | 620,750 | |
| | 955 | | | Quality Distribution, Incremental Term Loan, First Lien | | | 6.500% | | | | 3-Month LIBOR | | | | 5.500% | | | | 8/18/22 | | | | B– | | | | 907,250 | |
| | 38 | | | Savage Enterprises LLC, Term Loan B | | | 3.180% | | | | 1-Month LIBOR | | | | 3.000% | | | | 8/01/25 | | | | BB | | | | 37,821 | |
| | 4,625 | | | Total Road & Rail | | | | | | | | | | | | | | | | | | | | | | | 4,380,318 | |
| |
| | | | Semiconductors & Semiconductor Equipment – 1.1% (0.7% of Total Investments) | |
| | | | | | | |
| | 441 | | | Cabot Microelectronics, Term Loan B1 | | | 2.188% | | | | 1-Month LIBOR | | | | 2.000% | | | | 11/15/25 | | | | BB+ | | | | 438,653 | |
| | 1,074 | | | Lumileds, Term Loan B | | | 4.572% | | | | 6-Month LIBOR | | | | 3.500% | | | | 6/30/24 | | | | CCC+ | | | | 427,664 | |
| | 463 | | | Microchip Technology, Inc., Term Loan B | | | 2.170% | | | | 1-Month LIBOR | | | | 2.000% | | | | 5/29/25 | | | | Baa3 | | | | 461,981 | |
| | 1,062 | | | ON Semiconductor Corporation, New Replacement Term Loan B4 | | | 2.166% | | | | 1-Month LIBOR | | | | 2.000% | | | | 9/19/26 | | | | BB | | | | 1,046,891 | |
| | 3,040 | | | Total Semiconductors & Semiconductor Equipment | | | | | | | | | | | | | | | | | | | | | | | 2,375,189 | |
| |
| | | | Software – 12.0% (7.5% of Total Investments) | |
| | | | | | | |
| | 595 | | | Autodata Solutions, Term Loan, First Lien | | | 3.661% | | | | 1-Month LIBOR | | | | 3.500% | | | | 5/30/26 | | | | BB– | | | | 574,905 | |
| | 1,042 | | | Blackboard, Inc., Term Loan B5, First Lien | | | 7.000% | | | | 3-Month LIBOR | | | | 6.000% | | | | 6/30/24 | | | | B | | | | 989,367 | |
| | 1,028 | | | BMC Software, Inc., Term Loan B | | | 4.411% | | | | 1-Month LIBOR | | | | 4.250% | | | | 10/02/25 | | | | B2 | | | | 994,845 | |
| | 1,513 | | | DiscoverOrg LLC, Term Loan B | | | 3.911% | | | | 1-Month LIBOR | | | | 3.750% | | | | 2/01/26 | | | | B+ | | | | 1,497,142 | |
| | 1,453 | | | Ellucian, Term Loan B, First Lien | | | 4.250% | | | | 3-Month LIBOR | | | | 3.250% | | | | 9/30/22 | | | | B | | | | 1,446,208 | |
| | 2,195 | | | Greeneden U.S. Holdings II LLC, Term Loan B, (DD1) | | | 3.411% | | | | 1-Month LIBOR | | | | 3.250% | | | | 12/01/23 | | | | B2 | | | | 2,166,208 | |
| | 178 | | | Greenway Health, Term Loan, First Lien | | | 4.820% | | | | 6-Month LIBOR | | | | 3.750% | | | | 2/16/24 | | | | B– | | | | 143,523 | |
| | 1,078 | | | Informatica LLC, Term Loan, First Lien | | | 3.411% | | | | 1-Month LIBOR | | | | 3.250% | | | | 2/14/27 | | | | B1 | | | | 1,055,436 | |
| | 677 | | | McAfee Holdings International, Inc., Term Loan, Second Lien | | | 9.500% | | | | 1-Month LIBOR | | | | 8.500% | | | | 9/28/25 | | | | B– | | | | 690,203 | |
| | 1,588 | | | McAfee LLC, Term Loan B | | | 3.916% | | | | 1-Month LIBOR | | | | 3.750% | | | | 9/29/24 | | | | B | | | | 1,575,520 | |
| | 788 | | | Micro Focus International PLC, New Term Loan | | | 2.661% | | | | 1-Month LIBOR | | | | 2.500% | | | | 6/21/24 | | | | BB– | | | | 745,938 | |
| | 5,319 | | | Micro Focus International PLC, Term Loan B | | | 2.661% | | | | 1-Month LIBOR | | | | 2.500% | | | | 6/21/24 | | | | BB | | | | 5,037,501 | |
| | 817 | | | Micro Focus International PLC, Term Loan B4 | | | 5.250% | | | | 3-Month LIBOR | | | | 4.250% | | | | 6/05/25 | | | | BB | | | | 809,979 | |
| | 1,606 | | | Misys, New Term Loan, First Lien | | | 4.500% | | | | 6-Month LIBOR | | | | 3.500% | | | | 6/13/24 | | | | BB– | | | | 1,490,988 | |
| | 249 | | | Mitchell International, Inc., Initial Term Loan, First Lien | | | 3.411% | | | | 1-Month LIBOR | | | | 3.250% | | | | 11/29/24 | | | | B2 | | | | 238,121 | |
| | 300 | | | Mitchell International, Inc., Initial Term Loan, Second Lien | | | 7.411% | | | | 1-Month LIBOR | | | | 7.250% | | | | 11/30/25 | | | | CCC | | | | 272,175 | |
| | 695 | | | Perforce Software Inc., Term Loan, First Lien | | | 3.911% | | | | 1-Month LIBOR | | | | 3.750% | | | | 7/01/26 | | | | B– | | | | 675,566 | |
| | 135 | | | SkillSoft Corporation, DIP Term Loan, (6) | | | 8.500% | | | | 1-Month LIBOR | | | | 7.500% | | | | 6/15/21 | | | | N/R | | | | 134,048 | |
| | 1,278 | | | SS&C Technologies, Inc./ Sunshine Acquisition II, Inc., New Term Loan B3 | | | 1.911% | | | | 1-Month LIBOR | | | | 1.750% | | | | 4/16/25 | | | | BB+ | | | | 1,242,725 | |
| | 898 | | | SS&C Technologies, Inc./ Sunshine Acquisition II, Inc., New Term Loan B4 | | | 1.911% | | | | 1-Month LIBOR | | | | 1.750% | | | | 4/16/25 | | | | BB+ | | | | 873,101 | |
| | 388 | | | Thomson Reuters IP & S, Term Loan B | | | 3.161% | | | | 1-Month LIBOR | | | | 3.000% | | | | 10/31/26 | | | | B | | | | 381,017 | |
| | | | | | | |
| | 1,096 | | | TIBCO Software, Inc., Term Loan, First Lien | | | 3.920% | | | | 1-Month LIBOR | | | | 3.750% | | | | 7/03/26 | | | | B+ | | | | 1,060,960 | |
37
| | |
| |
| NSL | | Nuveen Senior Income Fund (continued) |
| | Portfolio of Investments July 31, 2020 |
| | | | | | | | | | | | | | | | | | | | | | | | | | | | |
Principal
Amount (000) | | | Description (1) | | Coupon (2) | | | Reference
Rate (2) | | | Spread (2) | | | Maturity (3) | | | Ratings (4) | | | Value | |
| |
| | | | Software (continued) | |
| | | | | | | |
| $ | 770 | | | Ultimate Software, Incremental Term Loan | | | 4.750% | | | | 3-Month LIBOR | | | | 4.000% | | | | 5/03/26 | | | | B1 | | | $ | 772,100 | |
| | 496 | | | Ultimate Software, Term Loan, First Lien | | | 3.911% | | | | 1-Month LIBOR | | | | 3.750% | | | | 5/03/26 | | | | B1 | | | | 492,374 | |
| | 300 | | | Xperi Holding Corp, Term Loan B | | | 4.161% | | | | 1-Month LIBOR | | | | 4.000% | | | | 6/01/25 | | | | BB– | | | | 294,876 | |
| | 26,482 | | | Total Software | | | | | | | | | | | | | | | | | | | | | | | 25,654,826 | |
| |
| | | | Specialty Retail – 2.2% (1.4% of Total Investments) | |
| | | | | | | |
| | 504 | | | Academy, Ltd., Term Loan B, (DD1) | | | 5.000% | | | | 1-Month LIBOR | | | | 4.000% | | | | 7/01/22 | | | | CCC+ | | | | 451,806 | |
| | 568 | | | Petco Animal Supplies, Inc., Term Loan B1 | | | 4.250% | | | | 3-Month LIBOR | | | | 3.250% | | | | 1/26/23 | | | | B3 | | | | 478,004 | |
| | 1,200 | | | Petsmart Inc., Term Loan B | | | 4.000% | | | | 3-Month LIBOR | | | | 3.000% | | | | 3/11/22 | | | | B | | | | 1,187,306 | |
| | 2,473 | | | Petsmart Inc., Term Loan B, First Lien, (DD1) | | | 5.000% | | | | 3-Month LIBOR | | | | 4.000% | | | | 3/11/22 | | | | B | | | | 2,466,117 | |
| | 4,745 | | | Total Specialty Retail | | | | | | | | | | | | | | | | | | | | | | | 4,583,233 | |
| |
| | | | Technology Hardware, Storage & Peripherals – 3.5% (2.2% of Total Investments) | |
| | | | | | | |
| | 5,036 | | | Dell International LLC, Refinancing Term Loan B1 | | | 2.750% | | | | 1-Month LIBOR | | | | 2.000% | | | | 9/19/25 | | | | Baa3 | | | | 4,975,621 | |
| | 496 | | | NCR Corporation, Term Loan B | | | 2.670% | | | | 1-Month LIBOR | | | | 2.500% | | | | 8/28/26 | | | | BB+ | | | | 482,603 | |
| | 400 | | | Tech Data Corporation, Asset Based Term Loan | | | 3.667% | | | | 1-Month LIBOR | | | | 3.500% | | | | 7/01/25 | | | | BBB- | | | | 400,416 | |
| | 1,716 | | | Western Digital, Term Loan B | | | 1.911% | | | | 1-Month LIBOR | | | | 1.750% | | | | 4/29/23 | | | | BBB- | | | | 1,690,681 | |
| | 7,648 | | | Total Technology Hardware, Storage & Peripherals | | | | | | | | | | | | | | | | | | | | | | | 7,549,321 | |
| |
| | | | Trading Companies & Distributors – 0.2% (0.1% of Total Investments) | |
| | | | | | | |
| | 345 | | | Hayward Industries, Inc., Initial Term Loan, First Lien | | | 3.661% | | | | 1-Month LIBOR | | | | 3.500% | | | | 8/04/24 | | | | B | | | | 337,157 | |
| |
| | | | Transportation Infrastructure – 0.5% (0.3% of Total Investments) | |
| | | | | | | |
| | 492 | | | Atlantic Aviation FBO Inc., Term Loan | | | 3.911% | | | | 1-Month LIBOR | | | | 3.750% | | | | 12/06/25 | | | | BB– | | | | 468,695 | |
| | 740 | | | Hanjin International Corp, Initial Term Loan | | | 2.661% | | | | 1-Month LIBOR | | | | 2.500% | | | | 10/18/20 | | | | B1 | | | | 680,800 | |
| | 1,232 | | | Total Transportation Infrastructure | | | | | | | | | | | | | | | | | | | | | | | 1,149,495 | |
| |
| | | | Wireless Telecommunication Services – 1.0% (0.6% of Total Investments) | |
| | | | | | | |
| | 648 | | | Asurion LLC, Term Loan B4 | | | 3.161% | | | | 1-Month LIBOR | | | | 3.000% | | | | 8/04/22 | | | | Ba3 | | | | 641,040 | |
| | 1,000 | | | T-Mobile USA, Term Loan, First Lien | | | 3.161% | | | | 1-Month LIBOR | | | | 3.000% | | | | 4/01/27 | | | | BBB– | | | | 1,004,810 | |
| | 735 | | | Windstream Corporation, Term Loan, (DD1), (6) | | | 6.250% | | | | Prime | | | | 3.000% | | | | 4/24/21 | | | | D | | | | 438,060 | |
| | 2,383 | | | Total Wireless Telecommunication Services | | | | | | | | | | | | | | | | | | | | 2,083,910 | |
| $ | 320,501 | | | Total Variable Rate Senior Loan Interests (cost $312,261,482) | | | | | | | | | | | | | | | | 286,822,787 | |
| | | | | | | |
Principal
Amount (000) | | | Description (1) | | | | | | | | Coupon | | | Maturity | | | Ratings (4) | | | Value | |
| |
| | | | CORPORATE BONDS – 16.0% (10.0% of Total Investments) | |
| |
| | | | Airlines – 0.1% (0.1% of Total Investments) | |
| | | | | | | |
| $ | 470 | | | American Airlines Group Inc, 144A | | | | | | | | | | | 5.000% | | | | 6/01/22 | | | | Caa1 | | | $ | 262,500 | |
| | | | | |
| | | | Auto Components – 0.8% (0.5% of Total Investments) | | | | | | | | | | | | | |
| | | | | | | |
| | 765 | | | Adient Global Holdings Ltd, 144A | | | | | | | | | | | 4.875% | | | | 8/15/26 | | | | B | | | | 713,363 | |
| | 810 | | | Adient US LLC, 144A | | | | | | | | | | | 9.000% | | | | 4/15/25 | | | | Ba3 | | | | 902,137 | |
| | 1,575 | | | Total Auto Components | | | | | | | | | | | | | | | | | | | | | | | 1,615,500 | |
| |
| | | | Chemicals – 0.2% (0.1% of Total Investments) | |
| | | | | | | |
| | 345 | | | Olin Corp, 144A | | | | | | | | | | | 9.500% | | | | 6/01/25 | | | | BB– | | | | 393,300 | |
| |
| | | | Communications Equipment – 1.8% (1.1% of Total Investments) | |
| | | | | | | |
| | 2,745 | | | Intelsat Jackson Holdings SA, (6) | | | | | | | | | | | 5.500% | | | | 8/01/23 | | | | N/R | | | | 1,719,056 | |
| | 3,030 | | | Intelsat Jackson Holdings SA, 144A, (6) | | | | | | | | | | | 9.750% | | | | 7/15/25 | | | | N/R | | | | 2,014,950 | |
| | 5,775 | | | Total Communications Equipment | | | | | | | | | | | | | | | | | | | | | | | 3,734,006 | |
| |
| | | | Diversified Consumer Services – 0.1% (0.1% of Total Investments) | |
| | | | | | | |
| | 300 | | | Kronos Acquisition Holdings Inc, 144A | | | | | | | | | | | 9.000% | | | | 8/15/23 | | | | CCC | | | | 305,250 | |
| |
| | | | Diversified Financial Services – 0.3% (0.2% of Total Investments) | |
| | | | | | | |
| | 680 | | | PetSmart Inc, 144A | | | | | | | | | | | 7.125% | | | | 3/15/23 | | | | CCC+ | | | | 686,800 | |
38
| | | | | | | | | | | | | | | | | | | | | | | | | | | | |
Principal
Amount (000) | | | Description (1) | | | | | | | | Coupon | | | Maturity | | | Ratings (4) | | | Value | |
| |
| | | | Diversified Telecommunication Services – 0.3% (0.2% of Total Investments) | |
| | | | | | | |
| $ | 535 | | | Consolidated Communications Inc | | | | | | | | | | | 6.500% | | | | 10/01/22 | | | | CCC+ | | | $ | 524,969 | |
| |
| | | | Electric Utilities – 5.7% (3.6% of Total Investments) | |
| | | | | | | |
| | 1,735 | | | Bruce Mansfield Unit 1 2007 Pass-Through Trust, (6) | | | | | | | | | | | 6.850% | | | | 6/01/34 | | | | N/R | | | | 2,169 | |
| | 258 | | | Pacific Gas and Electric Co | | | | | | | | | | | 3.450% | | | | 7/01/25 | | | | BBB– | | | | 274,731 | |
| | 2,805 | | | Pacific Gas and Electric Co | | | | | | | | | | | 3.150% | | | | 1/01/26 | | | | BBB– | | | | 2,944,718 | |
| | 257 | | | Pacific Gas and Electric Co | | | | | | | | | | | 3.750% | | | | 7/01/28 | | | | BBB– | | | | 281,208 | |
| | 1,060 | | | Pacific Gas and Electric Co | | | | | | | | | | | 4.550% | | | | 7/01/30 | | | | BBB– | | | | 1,217,315 | |
| | 2,805 | | | Pacific Gas and Electric Co | | | | | | | | | | | 4.500% | | | | 7/01/40 | | | | BBB– | | | | 3,226,854 | |
| | 1,060 | | | Pacific Gas and Electric Co | | | | | | | | | | | 4.950% | | | | 7/01/50 | | | | BBB– | | | | 1,283,959 | |
| | 418 | | | Pacific Gas and Electric Co | | | | | | | | | | | 3.850% | | | | 11/15/23 | | | | BBB– | | | | 442,158 | |
| | 235 | | | Pacific Gas and Electric Co | | | | | | | | | | | 3.300% | | | | 12/01/27 | | | | BBB– | | | | 248,305 | |
| | 1,615 | | | Pacific Gas and Electric Co | | | | | | | | | | | 4.750% | | | | 2/15/44 | | | | BBB– | | | | 1,867,601 | |
| | 450 | | | Pacific Gas and Electric Co | | | | | | | | | | | 4.250% | | | | 3/15/46 | | | | BBB– | | | | 491,011 | |
| | 12,698 | | | Total Electric Utilities | | | | | | | | | | | | | | | | | | | | | | | 12,280,029 | |
| |
| | | | Energy Equipment & Services – 0.2% (0.1% of Total Investments) | |
| | | | | | | |
| | 420 | | | Bausch Health Cos Inc, 144A | | | | | | | | | | | 6.125% | | | | 4/15/25 | | | | B | | | | 433,650 | |
| |
| | | | Entertainment – 0.6% (0.3% of Total Investments) | |
| | | | | | | |
| | 810 | | | AMC Entertainment Holdings Inc, 144A | | | | | | | | | | | 10.500% | | | | 4/15/25 | | | | CCC+ | | | | 642,938 | |
| | 1,118 | | | AMC Entertainment Holdings Inc, 144A, (cash 10.000%, PIK 12.000%) | | | | 12.000% | | | | 6/15/26 | | | | N/R | | | | 531,050 | |
| | 1,928 | | | Total Entertainment | | | | | | | | | | | | | | | | | | | | | | | 1,173,988 | |
| |
| | | | Equity Real Estate Investment Trust – 0.8% (0.5% of Total Investments) | |
| | | | | |
| | 1,620 | | | Uniti Group LP / Uniti Fiber Holdings Inc / CSL Capital LLC, 144A | | | | 7.875% | | | | 2/15/25 | | | | B | | | | 1,705,050 | |
| |
| | | | Health Care Equipment & Supplies – 0.0% (0.0% of Total Investments) | |
| | | | | |
| | 500 | | | Mallinckrodt International Finance SA / Mallinckrodt CB LLC, 144A | | | | 5.625% | | | | 10/15/23 | | | | CC | | | | 80,000 | |
| |
| | | | Health Care Providers & Services – 0.4% (0.3% of Total Investments) | |
| | | | | | | |
| | 480 | | | AHP Health Partners Inc, 144A | | | | | | | | | | | 9.750% | | | | 7/15/26 | | | | CCC+ | | | | 510,000 | |
| | 65 | | | HCA Inc | | | | | | | | | | | 5.375% | | | | 2/01/25 | | | | Ba2 | | | | 73,288 | |
| | 60 | | | Tenet Healthcare Corp | | | | | | | | | | | 8.125% | | | | 4/01/22 | | | | B– | | | | 64,650 | |
| | 165 | | | Tenet Healthcare Corp | | | | | | | | | | | 4.625% | | | | 7/15/24 | | | | BB– | | | | 168,712 | |
| | 90 | | | Tenet Healthcare Corp, 144A | | | | | | | | | | | 6.250% | | | | 2/01/27 | | | | B1 | | | | 95,599 | |
| | 860 | | | Total Health Care Providers & Services | | | | | | | | | | | | | | | | 912,249 | |
| |
| | | | Hotels, Restaurants & Leisure – 0.2% (0.2% of Total Investments) | |
| | | | | | | |
| | 250 | | | 1011778 BC ULC / New Red Finance Inc, 144A | | | | | | | | | | | 5.000% | | | | 10/15/25 | | | | B+ | | | | 256,652 | |
| | 235 | | | Carnival Corp, 144A | | | | | | | | | | | 11.500% | | | | 4/01/23 | | | | Baa3 | | | | 255,720 | |
| | 485 | | | Total Hotels, Restaurants & Leisure | | | | | | | | | | | | | | | | | | | | | | | 512,372 | |
| |
| | | | IT Services – 0.2% (0.1% of Total Investments) | |
| | | | | |
| | 430 | | | Genesys Telecommunications Laboratories Inc/Greeneden Lux 3 Sarl/Greeneden US Ho, 144A | | | | 10.000% | | | | 11/30/24 | | | | CCC+ | | | | 459,025 | |
| | |
| | | | Media – 2.2% (1.4% of Total Investments) | | | | |
| | | | | |
| | 95 | | | CCO Holdings LLC / CCO Holdings Capital Corp, 144A | | | | 5.375% | | | | 5/01/25 | | | | BB+ | | | | 97,969 | |
| | 1,700 | | | Houghton Mifflin Harcourt Publishers Inc, 144A | | | | | | | | | | | 9.000% | | | | 2/15/25 | | | | BB– | | | | 1,640,500 | |
| | 969 | | | iHeartCommunications Inc | | | | | | | | | | | 8.375% | | | | 5/01/27 | | | | CCC+ | | | | 961,403 | |
| | 1,380 | | | iHeartCommunications Inc, 144A | | | | | | | | | | | 5.250% | | | | 8/15/27 | | | | B+ | | | | 1,393,800 | |
| | 245 | | | Intelsat Luxembourg SA, (6) | | | | | | | | | | | 8.125% | | | | 6/01/23 | | | | N/R | | | | 12,250 | |
| | 635 | | | Univision Communications Inc, 144A | | | | | | | | | | | 9.500% | | | | 5/01/25 | | | | B | | | | 693,737 | |
| | 5,024 | | | Total Media | | | | | | | | | | | | | | | | | | | | | | | 4,799,659 | |
| |
| | | | Oil, Gas & Consumable Fuels – 1.5% (0.9% of Total Investments) | |
| | | | | | | |
| | 1,715 | | | Citgo Holding Inc, 144A | | | | | | | | | | | 9.250% | | | | 8/01/24 | | | | B+ | | | | 1,715,000 | |
| | 230 | | | CITGO Petroleum Corp, 144A | | | | | | | | | | | 6.250% | | | | 8/15/22 | | | | BB | | | | 231,081 | |
| | 595 | | | CITGO Petroleum Corp, 144A | | | | | | | | | | | 7.000% | | | | 6/15/25 | | | | BB | | | | 611,362 | |
| | 300 | | | MEG Energy Corp, 144A | | | | | | | | | | | 7.000% | | | | 3/31/24 | | | | B+ | | | | 285,750 | |
| | 650 | | | Oasis Petroleum Inc, 144A | | | | | | | | | | | 6.250% | | | | 5/01/26 | | | | Caa1 | | | | 115,375 | |
39
| | |
| |
| NSL | | Nuveen Senior Income Fund (continued) |
| | Portfolio of Investments July 31, 2020 |
| | | | | | | | | | | | | | | | | | | | | | | | | | | | |
Principal
Amount (000) | | | Description (1) | | | | | | | | Coupon | | | Maturity | | | Ratings (4) | | | Value | |
| |
| | | | Oil, Gas & Consumable Fuels (continued) | |
| | | | | | | |
| $ | 800 | | | Whiting Petroleum Corp, (6) | | | | | | | | | | | 6.625% | | | | 1/15/26 | | | | N/R | | | $ | 138,000 | |
| | 4,290 | | | Total Oil, Gas & Consumable Fuels | | | | | | | | | | | | | | | | 3,096,568 | |
| | | | | |
| | | | Pharmaceuticals – 0.5% (0.3% of Total Investments) | | | | | | | | | | | | | |
| | | | | | | |
| | 437 | | | Advanz Pharma Corp Ltd | | | | | | | | | | | 8.000% | | | | 9/06/24 | | | | B– | | | | 419,520 | |
| | 269 | | | Endo Dac / Endo Finance LLC / Endo Finco Inc, 144A | | | | 9.500% | | | | 7/31/27 | | | | CCC+ | | | | 289,848 | |
| | 340 | | | Endo Dac / Endo Finance LLC / Endo Finco Inc, 144A | | | | 6.000% | | | | 6/30/28 | | | | CCC+ | | | | 259,250 | |
| | 134 | | | Par Pharmaceutical Inc, 144A | | | | | | | | | | | 7.500% | | | | 4/01/27 | | | | B+ | | | | 142,526 | |
| | 1,180 | | | Total Pharmaceuticals | | | | | | | | | | | | | | | | | | | | | | | 1,111,144 | |
| |
| | | | Wireless Telecommunication Services – 0.1% (0.0% of Total Investments) | |
| | | | | | | |
| | 575 | | | Intelsat Connect Finance SA, 144A, (6) | | | | | | | | | | | 9.500% | | | | 2/15/23 | | | | N/R | | | | 166,750 | |
| $ | 39,690 | | | Total Corporate Bonds (cost $37,982,943) | | | | | | | | | | | | | | | | 34,252,809 | |
| | | | | | | |
| Shares | | | Description (1) | | | | | | | | | | | | | | | | | Value | |
| |
| | | | COMMON STOCKS – 2.0% (1.3% of Total Investments) | |
| |
| | | | Diversified Consumer Services – 0.0% (0.0% of Total Investments) | |
| | | | | | | |
| | 12,578 | | | Cengage Learning Holdings II Inc, (7), (9) | | | | | | | | | | | | | | | | | | | | | | $ | 29,344 | |
| |
| | | | Electric Utilities – 0.4% (0.3% of Total Investments) | |
| | | | | | | |
| | 37,457 | | | Energy Harbor Corp, (7), (9), (10) | | | | | | | | | | | | | | | | | | | | | | | 840,910 | |
| |
| | | | Energy Equipment & Services – 0.1% (0.0% of Total Investments) | |
| | | | | | | |
| | 40,007 | | | Transocean Ltd | | | | | | | | | | | | | | | | | | | | | | | 81,614 | |
| | 5,623 | | | Vantage Drilling International, (7), (9) | | | | | | | | | | | | | | | | | | | | | | | 33,272 | |
| | | | Total Energy Equipment & Services | | | | | | | | | | | | | | | | 114,886 | |
| |
| | | | Health Care Providers & Services – 0.0% (0.0% of Total Investments) | |
| | | | | | | |
| | 35,750 | | | Millennium Health LLC, (8), (9) | | | | | | | | | | | | | | | | | | | | | | | 39,682 | |
| | 33,563 | | | Millennium Health LLC, (8), (9) | | | | | | | | | | | | | | | | | | | | | | | 33,899 | |
| | | | Total Health Care Providers & Services | | | | | | | | | | | | | | | | 73,581 | |
| |
| | | | Internet & Direct Marketing Retail – 0.0% (0.0% of Total Investments) | |
| | | | | | | |
| | 5,388 | | | Catalina Marketing Corp, (7), (9) | | | | | | | | | | | | | | | | | | | | | | | 2,694 | |
| |
| | | | Marine – 0.0% (0.0% of Total Investments) | |
| | | | | | | |
| | 430 | | | ACBL HLDG CORP, (7), (9) | | | | | | | | | | | | | | | | | | | | | | | 18,275 | |
| | |
| | | | Media – 1.2% (0.8% of Total Investments) | | | | |
| | | | | | | |
| | 363,854 | | | Clear Channel Outdoor Holdings Inc, (9) | | | | | | | | | | | | | | | | | | | | | | | 333,472 | |
| | 40,449 | | | Cumulus Media Inc | | | | | | | | | | | | | | | | | | | | | | | 158,965 | |
| | 775,233 | | | Hibu plc, (7), (9) | | | | | | | | | | | | | | | | | | | | | | | 54,266 | |
| | 182,131 | | | iHeartMedia Inc, (9) | | | | | | | | | | | | | | | | | | | | | | | 1,522,615 | |
| | 6,268 | | | Metro-Goldwyn-Mayer Inc, (7), (9) | | | | | | | | | | | | | | | | | | | | | | | 479,502 | |
| | 14,825 | | | Tribune Co, (8) | | | | | | | | | | | | | | | | | | | | | | | 15 | |
| | | | Total Media | | | | | | | | | | | | | | | | | | | | | | | 2,548,835 | |
| |
| | | | Pharmaceuticals – 0.0% (0.0% of Total Investments) | |
| | | | | | | |
| | 7,999 | | | Advanz Pharma Corp Ltd, (9) | | | | | | | | | | | | | | | | | | | | | | | 26,397 | |
| |
| | | | Software – 0.3% (0.2% of Total Investments) | |
| | | | | | | |
| | 50,122 | | | Avaya Holdings Corp, (9) | | | | | | | | | | | | | | | | | | | | | | | 634,544 | |
| | | | Total Common Stocks (cost $13,263,641) | | | | | | | | | | | | | | | | 4,289,466 | |
40
| | | | | | | | | | | | | | | | | | | | | | | | | | | | |
| Shares | | | Description (1) | | | | | | | | | | | | | | | | | Value | |
| |
| | | | WARRANTS – 0.0% (0.0% of Total Investments) | |
| |
| | | | Communications Equipment – 0.0% (0.0% of Total Investments) | |
| | | | | | | |
| | 11,806 | | | Avaya Holdings Corp, (7) | | | | | | | | | | | | | | | | | | | | | | $ | 7,084 | |
| |
| | | | Marine – 0.0% (0.0% of Total Investments) | |
| | | | | | | |
| | 452 | | | ACBL HLDG CORP, (7) | | | | | | | | | | | | | | | | | | | | | | | 16,272 | |
| | 1,682 | | | ACBL HLDG CORP, (7) | | | | | | | | | | | | | | | | | | | | | | | 42,050 | |
| | 1,279 | | | ACBL HLDG CORP, (7) | | | | | | | | | | | | | | | | | | | | | | | 39,649 | |
| | | | Total Marine | | | | | | | | | | | | | | | | | | | | | | | 97,971 | |
| | | | Total Warrants (cost $1,199,219) | | | | | | | | | | | | | | | | | | | | | | | 105,055 | |
| | | | | | | |
| Shares | | | Description (1) | | | | | | | | Coupon | | | | | | Ratings (4) | | | Value | |
| |
| | | | CONVERTIBLE PREFERRED SECURITIES – 0.0% (0.0% of Total Investments) | |
| |
| | | | Marine – 0.0% (0.0% of Total Investments) | |
| | | | | | | |
| | 1,600 | | | ACBL HLDG CORP, (7) | | | | | | | | | | | 0.000% | | | | | | | | N/R | | | $ | 40,000 | |
| | 1,821 | | | ACBL HLDG CORP, (7) | | | | | | | | | | | 0.000% | | | | | | | | N/R | | | | 56,451 | |
| | | | Total Marine | | | | | | | | | | | | | | | | | | | | | | | 96,451 | |
| | | | Total Convertible Preferred Securities (cost $97,140) | | | | | | | | | | | | | | | | 96,451 | |
| | | | | | | |
| Shares | | | Description (1) | | | | | | | | | | | | | | | | | Value | |
| |
| | | | COMMON STOCK RIGHTS – 0.0% (0.0% of Total Investments) | |
| |
| | | | Oil, Gas & Consumable Fuels – 0.0% (0.0% of Total Investments) | |
| | | | | |
| | 7,052 | | | Fieldwood Energy Inc, (7), (9) | | | | | | | | | | | | | | | $ | 353 | |
| | 1,425 | | | Fieldwood Energy Inc, (7), (9) | | | | | | | | | | | | | | | | | | | | | | | 71 | |
| | | | Total Common Stock Rights (cost $201,310) | | | | | | | | | | | | | | | | | | | | | | | 424 | |
| | | | Total Long-Term Investments (cost $365,005,735) | | | | | | | | | | | | | | | | 325,566,992 | |
| | | | | | | |
| Shares | | | Description (1) | | | | | | | | Coupon | | | | | | | | | Value | |
| |
| | | | SHORT-TERM INVESTMENTS – 7.2% (4.5% of Total Investments) | |
| |
| | | | INVESTMENT COMPANIES – 7.2% (4.5% of Total Investments) | |
| | | | | | | |
| | 15,432,067 | | | BlackRock Liquidity Funds T-Fund Portfolio, (11) | | | | | | | | | | | 0.650% (12) | | | | | | | | | | | $ | 15,432,067 | |
| | | | Total Short-Term Investments (cost $15,432,067) | | | | 15,432,067 | |
| | | | Total Investments (cost $380,437,802) – 159.6% | | | | 340,999,059 | |
| | | | Borrowings – (40.3)% (13), (14) | | | | (86,200,000 | ) |
| | | | Term Preferred Shares, net of deferred offering costs – (15.4)% (15) | | | | (32,823,464 | ) |
| | | | Other Assets Less Liabilities – (3.9)% | | | | (8,285,672 | ) |
| | | | Net Assets Applicable to Common Shares – 100% | | | $ | 213,689,923 | |
41
| | |
| |
| NSL | | Nuveen Senior Income Fund (continued) |
| | Portfolio of Investments July 31, 2020 |
For Fund portfolio compliance purposes, the Fund’s industry classifications refer to any one or more of the industry sub-classifications used by one or more widely recognized market indexes or ratings group indexes, and/or as defined by Fund management. This definition may not apply for purposes of this report, which may combine industry sub-classifications into sectors for reporting ease.
| (1) | All percentages shown in the Portfolio of Investments are based on net assets applicable to common shares unless otherwise noted. |
| (2) | Senior loans generally pay interest at rates which are periodically adjusted by reference to a base short-term, floating lending rate (Reference Rate) plus an assigned fixed rate (Spread). These floating lending rates are generally (i) the lending rate referenced by the London Inter-Bank Offered Rate (“LIBOR”), or (ii) the prime rate offered by one or more major United States banks. Senior loans may be considered restricted in that the Fund ordinarily is contractually obligated to receive approval from the agent bank and/or borrower prior to the disposition of a senior loan. The rate shown is the coupon as of the end of the reporting period. |
| (3) | Senior loans generally are subject to mandatory and/or optional prepayment. Because of these mandatory prepayment conditions and because there may be significant economic incentives for a borrower to prepay, prepayments of senior loans may occur. As a result, the actual remaining maturity of senior loans held may be substantially less than the stated maturities shown. |
| (4) | For financial reporting purposes, the ratings disclosed are the highest of Standard & Poor’s Group (“Standard & Poor’s”), Moody’s Investors Service, Inc. (“Moody’s”) or Fitch, Inc. (“Fitch”) rating. This treatment of split-rated securities may differ from that used for other purposes, such as for Fund investment policies. Ratings below BBB by Standard & Poor’s, Baa by Moody’s or BBB by Fitch are considered to be below investment grade. Holdings designated N/R are not rated by any of these national rating agencies. Ratings are not covered by the report of independent registered public accounting firm. |
| (5) | Investment, or portion of investment, represents an outstanding unfunded senior loan commitment. See Notes to Financial Statements, Note 4 – Portfolio Securities and Investments in Derivatives for more information. |
| (6) | Defaulted security. A security whose issuer has failed to fully pay principal and/or interest when due, or is under the protection of bankruptcy. |
| (7) | For fair value measurement disclosure purposes, investment classified as Level 2. See Notes to Financial Statements, Note 3 – Investment Valuation and Fair Value Measurements for more information. |
| (8) | Investment valued at fair value using methods determined in good faith by, or at the discretion of, the Board. For fair value measurement disclosure purposes, investment classified as Level 3. See Notes to Financial Statements, Note 3 – Investment Valuation and Fair Value Measurements for more information. |
| (9) | Non-income producing; issuer has not declared a dividend within the past twelve months. |
| (10) | Common Stock received as part of the bankruptcy settlements for Bruce Mansfield Unit 1 2007 Pass-Through Trust. |
| (11) | A copy of the most recent financial statements for these investment companies can be obtained directly from the Securities and Exchange Commission on its website at http://www.sec.gov. |
| (12) | The rate shown is the annualized seven-day subsidized yield as of the end of the reporting period. |
| (13) | Borrowings as a percentage of Total Investments is 25.3%. |
| (14) | The Fund segregates 100% of its eligible investments (excluding any investments separately pledged as collateral for specific investments in derivatives, when applicable) in the Portfolio of Investments as collateral for borrowings. |
| (15) | Term Preferred Shares, net of deferred offering costs as a percentage of Total Investments is 9.6%. |
| 144A | Investment is exempt from registration under Rule 144A of the Securities Act of 1933, as amended. These investments may only be resold in transactions exempt from registration, which are normally those transactions with qualified institutional buyers. |
| DD1 | Portion of investment purchased on a delayed delivery basis. |
| LIBOR | London Inter-Bank Offered Rate |
| PIK | Payment-in-kind (“PIK”) security. Depending on the terms of the security, income may be received in the form of cash, securities, or a combination of both. The PIK rate shown, where applicable, represents the annualized rate of the last PIK payment made by the issuer as of the end of the reporting period. |
| TBD | Senior loan purchased on a when-issued or delayed-delivery basis. Certain details associated with this purchase are not known prior to the settlement date of the transaction. In addition, senior loans typically trade without accrued interest and therefore a coupon rate is not available prior to settlement. At settlement, if still unknown, the borrower or counterparty will provide the Fund with the final coupon rate and maturity date. |
| WI/DD | Purchased on a when-issued or delayed delivery basis. |
See accompanying notes to financial statements.
42
| | |
| JFR | | Nuveen Floating Rate Income Fund Portfolio of Investments July 31, 2020 |
| | | | | | | | | | | | | | | | | | | | | | | | | | | | |
Principal
Amount (000) | | | Description (1) | | Coupon (2) | | | Reference
Rate (2) | | | Spread (2) | | | Maturity (3) | | | Ratings (4) | | | Value | |
| |
| | | | LONG-TERM INVESTMENTS – 152.9% (94.8% of Total Investments) | |
| |
| | | | VARIABLE RATE SENIOR LOAN INTERESTS – 132.4% (82.0% of Total Investments) (2) | |
| |
| | | | Aerospace & Defense – 2.6% (1.6% of Total Investments) | |
| | | | | | | |
| $ | 1,308 | | | MacDonald, Dettwiler and Associates, Ltd., Term Loan B | | | 2.911% | | | | 1-Month LIBOR | | | | 2.750% | | | | 10/05/24 | | | | B | | | $ | 1,260,261 | |
| | 5,503 | | | Sequa Corporation, Term Loan B | | | 6.000% | | | | 3-Month LIBOR | | | | 5.000% | | | | 11/28/21 | | | | B– | | | | 5,223,032 | |
| | 2,071 | | | Sequa Corporation, Term Loan, Second Lien | | | 11.250% | | | | Prime | | | | 8.000% | | | | 4/28/22 | | | | CCC– | | | | 1,592,105 | |
| | 1,427 | | | Standard Aero, Term Loan B1 | | | 3.808% | | | | 3-Month LIBOR | | | | 3.500% | | | | 4/08/26 | | | | B– | | | | 1,152,453 | |
| | 767 | | | Standard Aero, Term Loan B2 | | | 3.808% | | | | 3-Month LIBOR | | | | 3.500% | | | | 4/08/26 | | | | B– | | | | 619,598 | |
| | 1,466 | | | Transdigm, Inc., Term Loan E | | | 2.411% | | | | 1-Month LIBOR | | | | 2.250% | | | | 5/30/25 | | | | Ba3 | | | | 1,374,121 | |
| | 1,757 | | | Transdigm, Inc., Term Loan F | | | 2.411% | | | | 1-Month LIBOR | | | | 2.250% | | | | 12/09/25 | | | | Ba3 | | | | 1,649,111 | |
| | 1,284 | | | Transdigm, Inc., Term Loan G | | | 2.411% | | | | 1-Month LIBOR | | | | 2.250% | | | | 8/22/24 | | | | Ba3 | | | | 1,205,374 | |
| | 15,583 | | | Total Aerospace & Defense | | | | | | | | | | | | | | | | | | | | | | | 14,076,055 | |
| |
| | | | Air Freight & Logistics – 0.7% (0.4% of Total Investments) | |
| | | | | | | |
| | 1,493 | | | PAE Holding Corporation, Term Loan B | | | 6.500% | | | | 2-Month LIBOR | | | | 5.500% | | | | 10/20/22 | | | | B+ | | | | 1,485,295 | |
| | 2,166 | | | XPO Logistics, Inc., Term Loan B | | | 2.161% | | | | 1-Month LIBOR | | | | 2.000% | | | | 2/24/25 | | | | BBB– | | | | 2,144,987 | |
| | 3,659 | | | Total Air Freight & Logistics | | | | | | | | | | | | | | | | | | | | | | | 3,630,282 | |
| |
| | | | Airlines – 1.8% (1.1% of Total Investments) | |
| | | | | | | |
| | 1,867 | | | American Airlines, Inc., Term Loan B | | | 2.184% | | | | 1-Month LIBOR | | | | 2.000% | | | | 4/28/23 | | | | Ba3 | | | | 1,430,369 | |
| | 1,574 | | | American Airlines, Inc., Term Loan B | | | 1.916% | | | | 1-Month LIBOR | | | | 1.750% | | | | 1/29/27 | | | | Ba3 | | | | 1,109,297 | |
| | 7,379 | | | American Airlines, Inc., Term Loan B | | | 2.175% | | | | 1-Month LIBOR | | | | 2.000% | | | | 12/14/23 | | | | Ba3 | | | | 5,621,062 | |
| | 571 | | | Delta Air Lines, Inc., Term Loan B | | | 5.750% | | | | 3-Month LIBOR | | | | 4.750% | | | | 4/29/23 | | | | Baa2 | | | | 563,686 | |
| | 1,181 | | | WestJet Airlines, Term Loan, (DD1) | | | 4.000% | | | | 6-Month LIBOR | | | | 3.000% | | | | 12/11/26 | | | | BB+ | | | | 880,632 | |
| | 12,572 | | | Total Airlines | | | | | | | | | | | | | | | | | | | | | | | 9,605,046 | |
| |
| | | | Auto Components – 1.7% (1.1% of Total Investments) | |
| | | | | | | |
| | 997 | | | Adient Global Holdings, Initial Term Loan, (WI/DD) | | | TBD | | | | TBD | | | | TBD | | | | TBD | | | | Ba3 | | | | 986,469 | |
| | 1,390 | | | DexKo Global, Inc., Term Loan B | | | 4.500% | | | | 1-Month LIBOR | | | | 3.500% | | | | 7/24/24 | | | | B1 | | | | 1,331,467 | |
| | 3,474 | | | Johnson Controls Inc., Term Loan B | | | 3.667% | | | | 1-Month LIBOR | | | | 3.500% | | | | 4/30/26 | | | | B1 | | | | 3,401,374 | |
| | 1,796 | | | Superior Industries International, Inc., Term Loan B | | | 4.161% | | | | 1-Month LIBOR | | | | 4.000% | | | | 5/23/24 | | | | B1 | | | | 1,652,593 | |
| | 1,840 | | | Trico Group, LLC, Initial Term Loan, First Lien | | | 8.000% | | | | 3-Month LIBOR | | | | 7.000% | | | | 2/02/24 | | | | B | | | | 1,757,060 | |
| | 9,497 | | | Total Auto Components | | | | | | | | | | | | | | | | | | | | | | | 9,128,963 | |
| |
| | | | Automobiles – 0.5% (0.3% of Total Investments) | |
| | | | | | | |
| | 298 | | | Caliber Collision, Term Loan B | | | 4.072% | | | | 6-Month LIBOR | | | | 3.000% | | | | 2/05/26 | | | | B1 | | | | 285,954 | |
| | 749 | | | Caliber Collision, Term Loan B | | | 4.072% | | | | 3-Month LIBOR | | | | 3.000% | | | | 2/05/26 | | | | B1 | | | | 718,792 | |
| | 1,462 | | | Navistar, Inc., Term Loan B | | | 3.690% | | | | 1-Month LIBOR | | | | 3.500% | | | | 11/06/24 | | | | Ba2 | | | | 1,421,667 | |
| | 2,509 | | | Total Automobiles | | | | | | | | | | | | | | | | | | | | | | | 2,426,413 | |
| |
| | | | Beverages – 0.5% (0.3% of Total Investments) | |
| | | | | | | |
| | 2,676 | | | Jacobs Douwe Egberts, Term Loan B | | | 2.188% | | | | 1-Month LIBOR | | | | 2.000% | | | | 11/01/25 | | | | BB+ | | | | 2,640,418 | |
| |
| | | | Biotechnology – 0.7% (0.4% of Total Investments) | |
| | | | | | | |
| | 3,774 | | | Grifols, Inc., Term Loan B, First Lien | | | 2.111% | | | | 1-Week LIBOR | | | | 2.000% | | | | 11/15/27 | | | | Ba2 | | | | 3,701,823 | |
| | | |
| | | | Building Products – 1.3% (0.8% of Total Investments) | | | | | | | |
| | | | | | | |
| | 639 | | | Ply Gem Industries, Inc., Term Loan B | | | 3.928% | | | | 1-Month LIBOR | | | | 3.750% | | | | 4/12/25 | | | | B+ | | | | 629,547 | |
| | 6,438 | | | Quikrete Holdings, Inc., Term Loan B | | | 2.661% | | | | 1-Month LIBOR | | | | 2.500% | | | | 2/01/27 | | | | BB– | | | | 6,236,646 | |
| | 7,077 | | | Total Building Products | | | | | | | | | | | | | | | | | | | | | | | 6,866,193 | |
| |
| | | | Capital Markets – 0.7% (0.4% of Total Investments) | |
| | | | | | | |
| | 2,739 | | | RPI Finance Trust, Term Loan B1 | | | 1.911% | | | | 1-Month LIBOR | | | | 1.750% | | | | 2/11/27 | | | | BBB– | | | | 2,716,306 | |
| | 824 | | | RPI Finance Trust, Term Loan B1 | | | 1.911% | | | | 1-Month LIBOR | | | | 1.750% | | | | 2/11/27 | | | | BBB– | | | | 814,022 | |
| | 3,563 | | | Total Capital Markets | | | | | | | | | | | | | | | | | | | | | | | 3,530,328 | |
43
| | |
| |
| JFR | | Nuveen Floating Rate Income Fund (continued) |
| | Portfolio of Investments July 31, 2020 |
| | | | | | | | | | | | | | | | | | | | | | | | | | | | |
Principal
Amount (000) | | | Description (1) | | Coupon (2) | | | Reference
Rate (2) | | | Spread (2) | | | Maturity (3) | | | Ratings (4) | | | Value | |
| |
| | | | Chemicals – 0.9% (0.5% of Total Investments) | |
| | | | | | | |
| $ | 1,187 | | | Ineos US Finance LLC, Term Loan | | | 2.214% | | | | 2-Month LIBOR | | | | 2.000% | | | | 3/31/24 | | | | BBB– | | | $ | 1,146,398 | |
| | 1,000 | | | Lummus Technology, Term Loan | | | 4.308% | | | | 3-Month LIBOR | | | | 4.000% | | | | 6/30/27 | | | | B+ | | | | 991,250 | |
| | 1,200 | | | PQ Corporation, Incremental Term Loan B, (WI/DD) | | | TBD | | | | TBD | | | | TBD | | | | TBD | | | | BB– | | | | 1,196,376 | |
| | 1,410 | | | Univar, Inc., Term Loan B | | | 2.411% | | | | 1-Month LIBOR | | | | 2.250% | | | | 7/01/24 | | | | BB+ | | | | 1,387,235 | |
| | 4,797 | | | Total Chemicals | | | | | | | | | | | | | | | | | | | | | | | 4,721,259 | |
| |
| | | | Commercial Services & Supplies – 3.9% (2.4% of Total Investments) | |
| | | | | | | |
| | 1,904 | | | ADS Waste Holdings, Inc., Term Loan B | | | 3.000% | | | | 1-Week LIBOR | | | | 2.250% | | | | 11/10/23 | | | | BB+ | | | | 1,897,558 | |
| | 1,096 | | | Brand Energy & Infrastructure Services, Inc., Term Loan B, First Lien, (DD1) | | | 5.250% | | | | 3-Month LIBOR | | | | 4.250% | | | | 6/21/24 | | | | B– | | | | 1,004,018 | |
| | 687 | | | Education Management LLC, Term Loan A, (5) | | | 0.000% | | | | N/A | | | | N/A | | | | 7/02/20 | | | | N/R | | | | 6,865 | |
| | 9,483 | | | Formula One Group, Term Loan B | | | 3.500% | | | | 1-Month LIBOR | | | | 2.500% | | | | 2/01/24 | | | | B+ | | | | 9,210,678 | |
| | 1,058 | | | Garda World Security Corp, Term Loan B, First Lien | | | 4.930% | | | | 1-Month LIBOR | | | | 4.750% | | | | | | | | B1 | | | | 1,050,806 | |
| | 2,418 | | | GFL Environmental, Term Loan | | | 4.000% | | | | 3-Month LIBOR | | | | 3.000% | | | | 5/31/25 | | | | BB– | | | | 2,410,899 | |
| | 805 | | | Harland Clarke Holdings Corporation, Term Loan B7 | | | 5.750% | | | | 3-Month LIBOR | | | | 4.750% | | | | 11/03/23 | | | | CCC+ | | | | 570,743 | |
| | 1,876 | | | iQor US, Inc., Term Loan, First Lien, (5) | | | 0.000% | | | | N/A | | | | N/A | | | | 4/01/21 | | | | CC | | | | 1,322,844 | |
| | 500 | | | iQor US, Inc., Term Loan, Second Lien, (5) | | | 0.000% | | | | N/A | | | | N/A | | | | 4/01/22 | | | | C | | | | 123,210 | |
| | 417 | | | KAR Auction Services, Inc., Term Loan B6 | | | 2.438% | | | | 1-Month LIBOR | | | | 2.250% | | | | 9/19/26 | | | | Ba3 | | | | 403,540 | |
| | 273 | | | Pitney Bowes Inc., Term Loan B | | | 5.661% | | | | 1-Month LIBOR | | | | 5.500% | | | | 1/07/25 | | | | BBB– | | | | 256,337 | |
| | 4 | | | Robertshaw US Holding Corp., Initial Term Loan, First Lien | | | 4.250% | | | | 1-Month LIBOR | | | | 3.250% | | | | 2/28/25 | | | | B3 | | | | 3,620 | |
| | 1,671 | | | Robertshaw US Holding Corp., Initial Term Loan, First Lien | | | 4.250% | | | | 6-Month LIBOR | | | | 3.250% | | | | 2/28/25 | | | | B3 | | | | 1,411,985 | |
| | 289 | | | Sabert Corporation, Initial Term Loan | | | 5.500% | | | | 1-Month LIBOR | | | | 4.500% | | | | 12/10/26 | | | | B | | | | 286,987 | |
| | 944 | | | West Corporation, Incremental Term Loan B1 | | | 4.500% | | | | 3-Month LIBOR | | | | 3.500% | | | | 10/10/24 | | | | BB+ | | | | 825,100 | |
| | 23,425 | | | Total Commercial Services & Supplies | | | | | | | | 20,785,190 | |
| |
| | | | Communications Equipment – 3.8% (2.4% of Total Investments) | |
| | | | | | | |
| | 6,764 | | | Avaya, Inc., Term Loan B | | | 4.425% | | | | 1-Month LIBOR | | | | 4.250% | | | | 12/15/24 | | | | BB– | | | | 6,415,366 | |
| | 5,278 | | | CommScope, Inc., Term Loan B | | | 3.411% | | | | 1-Month LIBOR | | | | 3.250% | | | | 4/04/26 | | | | Ba3 | | | | 5,184,974 | |
| | 830 | | | Mitel US Holdings, Inc., Term Loan, First Lien | | | 4.666% | | | | 1-Month LIBOR | | | | 4.500% | | | | 11/30/25 | | | | B– | | | | 685,235 | |
| | 1,937 | | | Plantronics, Term Loan B, (DD1) | | | 2.661% | | | | 1-Month LIBOR | | | | 2.500% | | | | 7/02/25 | | | | Ba2 | | | | 1,781,760 | |
| | 273 | | | Plantronics, Term Loan B, (DD1) | | | 2.861% | | | | 6-Month LIBOR | | | | 2.500% | | | | 7/02/25 | | | | Ba2 | | | | 268,119 | |
| | 1,855 | | | Riverbed Technology, Inc., Term Loan B, First Lien, (DD1) | | | 3.511% | | | | 3-Month LIBOR | | | | 3.250% | | | | 4/24/22 | | | | B2 | | | | 1,694,332 | |
| | 4,741 | | | Univision Communications, Inc., Term Loan C5 | | | 3.750% | | | | 1-Month LIBOR | | | | 2.750% | | | | 3/15/24 | | | | B | | | | 4,561,640 | |
| | 21,678 | | | Total Communications Equipment | | | | | | | | 20,591,426 | |
| |
| | | | Construction & Engineering – 0.3% (0.2% of Total Investments) | |
| | | | | | | |
| | 1,729 | | | Traverse Midstream Partners, Term Loan B | | | 5.000% | | | | 1-Month LIBOR | | | | 4.000% | | | | 9/27/24 | | | | B | | | | 1,520,298 | |
| |
| | | | Consumer Finance – 0.5% (0.3% of Total Investments) | |
| | | | | | | |
| | 2,920 | | | Verscend Technologies, Tern Loan B | | | 4.661% | | | | 1-Month LIBOR | | | | 4.500% | | | | 8/27/25 | | | | B+ | | | | 2,915,438 | |
| |
| | | | Containers & Packaging – 1.1% (0.7% of Total Investments) | |
| | | | | | | |
| | 667 | | | Berry Global, Inc., Term Loan W | | | 2.188% | | | | 1-Month LIBOR | | | | 2.000% | | | | 10/01/22 | | | | BBB– | | | | 657,052 | |
| | 2,970 | | | Berry Global, Inc., Term Loan Y | | | 2.188% | | | | 1-Month LIBOR | | | | 2.000% | | | | 7/01/26 | | | | BBB– | | | | 2,887,865 | |
| | 589 | | | Kloeckner Pentaplast of America Inc., Dollar Term Loan | | | 5.250% | | | | 6-Month LIBOR | | | | 4.250% | | | | 6/30/22 | | | | B– | | | | 561,961 | |
| | 1,927 | | | Reynolds Group Holdings, Inc., Term Loan, First Lien | | | 1.911% | | | | 1-Month LIBOR | | | | 1.750% | | | | 2/04/27 | | | | BB+ | | | | 1,894,706 | |
| | 6,153 | | | Total Containers & Packaging | | | | | | | | | | | | | | | | | | | | | | | 6,001,584 | |
| |
| | | | Distributors – 0.3% (0.2% of Total Investments) | |
| | | | | | | |
| | 314 | | | Insurance Auto Actions Inc., Term Loan | | | 2.438% | | | | 1-Month LIBOR | | | | 2.250% | | | | 6/28/26 | | | | BB+ | | | | 309,503 | |
| | 1,529 | | | SRS Distribution, Inc., Term Loan B | | | 4.072% | | | | 3-Month LIBOR | | | | 3.000% | | | | 5/24/25 | | | | B | | | | 1,482,372 | |
| | 1,843 | | | Total Distributors | | | | | | | | | | | | | | | | | | | | | | | 1,791,875 | |
| |
| | | | Diversified Consumer Services – 1.6% (1.0% of Total Investments) | |
| | | | | | | |
| | 5,122 | | | Cengage Learning Acquisitions, Inc., Term Loan B | | | 5.250% | | | | 6-Month LIBOR | | | | 4.250% | | | | 6/07/23 | | | | B | | | | 4,203,550 | |
| | | | | | | |
| | 468 | | | Education Management LLC, Elevated Term Loan A1, (5) | | | 0.000% | | | | N/A | | | | N/A | | | | 7/02/20 | | | | N/R | | | | 5,844 | |
44
| | | | | | | | | | | | | | | | | | | | | | | | | | | | |
Principal
Amount (000) | | | Description (1) | | Coupon (2) | | | Reference
Rate (2) | | | Spread (2) | | | Maturity (3) | | | Ratings (4) | | | Value | |
| |
| | | | Diversified Consumer Services (continued) | |
| | | | | | | |
| $ | 12 | | | Education Management LLC, Elevated Term Loan A2, (5) | | | 5.808% | | | | 3-Month LIBOR | | | | 5.500% | | | | 7/02/20 | | | | N/R | | | $ | — | |
| | 4,472 | | | Refinitiv, Term Loan B | | | 3.411% | | | | 1-Month LIBOR | | | | 3.250% | | | | 10/01/25 | | | | BB+ | | | | 4,443,758 | |
| | 10,074 | | | Total Diversified Consumer Services | | | | | | | | 8,653,152 | |
| |
| | | | Diversified Financial Services – 1.4% (0.9% of Total Investments) | |
| | | | | | | |
| | 1,955 | | | Blackstone CQP, Term Loan | | | 3.806% | | | | 3-Month LIBOR | | | | 3.500% | | | | 9/30/24 | | | | B+ | | | | 1,908,813 | |
| | 2,793 | | | Ditech Holding Corporation., Term Loan B, First Lien, (5) | | | 0.000% | | | | N/A | | | | N/A | | | | 6/30/22 | | | | D | | | | 656,264 | |
| | 3,117 | | | Inmarsat Finance, Term Loan, First Lien | | | 5.500% | | | | 1-Month LIBOR | | | | 4.500% | | | | 12/12/26 | | | | B+ | | | | 3,045,757 | |
| | 672 | | | Lions Gate Entertainment Corp., Term Loan B | | | 2.411% | | | | 1-Month LIBOR | | | | 2.250% | | | | 3/24/25 | | | | Ba2 | | | | 647,931 | |
| | 1,389 | | | Sotheby’s, Term Loan B | | | 6.500% | | | | 1-Month LIBOR | | | | 5.500% | | | | 1/15/27 | | | | B+ | | | | 1,330,066 | |
| | 9,926 | | | Total Diversified Financial Services | | | | | | | | 7,588,831 | |
| |
| | | | Diversified Telecommunication Services – 5.1% (3.2% of Total Investments) | |
| | | | | | | |
| | 1,008 | | | Altice France S.A., Term Loan B12 | | | 3.862% | | | | 1-Month LIBOR | | | | 3.688% | | | | 1/31/26 | | | | B | | | | 988,427 | |
| | 8,369 | | | CenturyLink, Inc, Term Loan B | | | 2.411% | | | | 1-Month LIBOR | | | | 2.250% | | | | 3/15/27 | | | | BB+ | | | | 8,081,726 | |
| | 780 | | | Consolidated Communications Holdings, Initial Term Loan, (WI/DD) | | | TBD | | | | TBD | | | | TBD | | | | TBD | | | | B+ | | | | 758,710 | |
| | 10,073 | | | Frontier Communications Corporation, Term Loan B, (DD1), (5) | | | 3.911% | | | | 1-Month LIBOR | | | | 3.750% | | | | 6/15/24 | | | | N/R | | | | 9,946,952 | |
| | 465 | | | Intelsat Jackson Holdings, S.A., Term Loan B4, (5) | | | 8.750% | | | | Prime | | | | 5.500% | | | | 1/02/24 | | | | B | | | | 469,613 | |
| | 744 | | | Intelsat Jackson Holdings, S.A., Term Loan B5, (5) | | | 8.625% | | | | N/A | | | | N/A | | | | 1/02/24 | | | | B | | | | 752,471 | |
| | 5,957 | | | Numericable Group S.A., Term Loan B13 | | | 4.175% | | | | 1-Month LIBOR | | | | 4.000% | | | | 8/14/26 | | | | B | | | | 5,847,065 | |
| | 479 | | | Zayo Group LLC, Initial Dollar Term Loan | | | 3.161% | | | | 1-Month LIBOR | | | | 3.000% | | | | 3/09/27 | | | | B1 | | | | 466,344 | |
| | 27,875 | | | Total Diversified Telecommunication Services | | | | | | | | 27,311,308 | |
| |
| | | | Electric Utilities – 0.6% (0.4% of Total Investments) | |
| | | | | | | |
| | 1,149 | | | ExGen Renewables, Term Loan | | | 4.000% | | | | 3-Month LIBOR | | | | 3.000% | | | | 11/28/24 | | | | BB– | | | | 1,139,003 | |
| | 1,000 | | | Pacific Gas & Electric, Term Loan, First Lien | | | 5.500% | | | | 3-Month LIBOR | | | | 4.500% | | | | 6/23/25 | | | | BB | | | | 991,250 | |
| | 1,280 | | | Vistra Operations Co., Term Loan B3 | | | 1.931% | | | | 1-Month LIBOR | | | | 1.750% | | | | 12/31/25 | | | | Baa3 | | | | 1,262,720 | |
| | 3,429 | | | Total Electric Utilities | | | | | | | | | | | | | | | | | | | | | | | 3,392,973 | |
| |
| | | | Electrical Equipment – 1.0% (0.6% of Total Investments) | |
| | | | | | | |
| | 4,394 | | | Avolon LLC, Term Loan B4 | | | 2.250% | | | | 1-Month LIBOR | | | | 1.500% | | | | 2/10/27 | | | | Baa2 | | | | 4,122,344 | |
| | 1,497 | | | Vertiv Co.,Term Loan B | | | 3.162% | | | | 1-Month LIBOR | | | | 3.000% | | | | 3/02/27 | | | | B+ | | | | 1,466,325 | |
| | 5,891 | | | Total Electrical Equipment | | | | | | | | 5,588,669 | |
| |
| | | | Electronic Equipment, Instruments & Components – 0.4% (0.2% of Total Investments) | |
| | | | | | | |
| | 1,863 | | | TTM Technologies, Inc., Term Loan B | | | 2.671% | | | | 1-Month LIBOR | | | | 2.500% | | | | 9/28/24 | | | | BB+ | | | | 1,837,375 | |
| |
| | | | Energy Equipment & Services – 0.1% (0.1% of Total Investments) | |
| | | | | | | |
| | 927 | | | Petroleum GEO-Services ASA/PGS Finance, Inc., Term Loan B | | | 7.750% | | | | 3-Month LIBOR | | | | 7.000% | | | | 6/13/24 | | | | Caa1 | | | | 583,183 | |
| |
| | | | Entertainment – 0.5% (0.3% of Total Investments) | |
| | | | | | | |
| | 2,082 | | | AMC Entertainment, Inc., Term Loan B | | | 4.080% | | | | 6-Month LIBOR | | | | 3.000% | | | | 4/22/26 | | | | CCC+ | | | | 1,380,168 | |
| | 1,256 | | | Springer SBM Two GmbH, Term Loan B16 | | | 4.500% | | | | 1-Month LIBOR | | | | 3.500% | | | | 8/14/24 | | | | B2 | | | | 1,241,364 | |
| | 3,338 | | | Total Entertainment | | | | | | | | 2,621,532 | |
| |
| | | | Equity Real Estate Investment Trust – 0.9% (0.6% of Total Investments) | |
| | | | | | | |
| | 3,219 | | | Realogy Group LLC, Term Loan A, (DD1) | | | 2.437% | | | | 1-Month LIBOR | | | | 2.250% | | | | 2/08/23 | | | | BB– | | | | 3,027,609 | |
| | 1,815 | | | Realogy Group LLC, Term Loan B | | | 3.000% | | | | 1-Month LIBOR | | | | 2.250% | | | | 2/08/25 | | | | BB– | | | | 1,724,917 | |
| | 5,034 | | | Total Equity Real Estate Investment Trust | | | | | | | | 4,752,526 | |
| |
| | | | Food & Staples Retailing – 2.7% (1.7% of Total Investments) | |
| | | | | | | |
| | 931 | | | Aramark Corporation, Term Loan | | | 1.911% | | | | 1-Month LIBOR | | | | 1.750% | | | | 3/11/25 | | | | BBB– | | | | 890,300 | |
| | 1,706 | | | BellRing Brands, Term Loan, First Lien | | | 6.000% | | | | 1-Month LIBOR | | | | 5.000% | | | | 10/21/24 | | | | B+ | | | | 1,717,716 | |
| | 764 | | | BJ’s Wholesale Club, Inc., Term Loan, First Lien | | | 2.178% | | | | 1-Month LIBOR | | | | 2.000% | | | | 2/03/24 | | | | BB | | | | 755,731 | |
| | 1,030 | | | Hearthside Group Holdings LLC, Term Loan B | | | 3.849% | | | | 1-Month LIBOR | | | | 3.688% | | | | 5/31/25 | | | | B2 | | | | 997,775 | |
| | 60 | | | Hearthside Group Holdings, LLC, Incremental Term Loan B3 | | | 6.000% | | | | 1-Month LIBOR | | | | 5.000% | | | | 5/31/25 | | | | B2 | | | | 59,421 | |
45
| | |
| |
| JFR | | Nuveen Floating Rate Income Fund (continued) |
| | Portfolio of Investments July 31, 2020 |
| | | | | | | | | | | | | | | | | | | | | | | | | | | | |
Principal
Amount (000) | | | Description (1) | | Coupon (2) | | | Reference
Rate (2) | | | Spread (2) | | | Maturity (3) | | | Ratings (4) | | | Value | |
| |
| | | | Food & Staples Retailing (continued) | |
| | | | | | | |
| $ | 10,734 | | | US Foods, Inc., New Term Loan | | | 1.911% | | | | 1-Month LIBOR | | | | 1.750% | | | | 6/27/23 | | | | BB | | | $ | 10,210,309 | |
| | 15,225 | | | Total Food & Staples Retailing | | | | | | | | | | | | | | | | | | | | | | | 14,631,252 | |
| |
| | | | Food Products – 0.4% (0.3% of Total Investments) | |
| | | | | | | |
| | 1,226 | | | American Seafoods Group LLC, Term Loan B | | | 3.750% | | | | 3-Month LIBOR | | | | 2.750% | | | | 8/21/23 | | | | BB– | | | | 1,207,337 | |
| | 1,165 | | | Froneri Lux FinCo SARL, Term Loan, First Lien | | | 2.411% | | | | 1-Month LIBOR | | | | 2.250% | | | | 1/31/27 | | | | B1 | | | | 1,120,689 | |
| | 2,391 | | | Total Food Products | | | | | | | | | | | | | | | | | | | | | | | 2,328,026 | |
| |
| | | | Health Care Equipment & Supplies – 1.0% (0.6% of Total Investments) | |
| | | | | | | |
| | 1,089 | | | Greatbatch Ltd., New Term Loan B | | | 3.500% | | | | 1-Month LIBOR | | | | 2.500% | | | | 10/27/22 | | | | B+ | | | | 1,080,656 | |
| | 1,452 | | | LifeScan, Term Loan B | | | 7.175% | | | | 3-Month LIBOR | | | | 6.000% | | | | 10/01/24 | | | | B | | | | 1,333,673 | |
| | 2,014 | | | MedPlast, Term Loan, First Lien | | | 3.911% | | | | 1-Month LIBOR | | | | 3.750% | | | | 7/02/25 | | | | B3 | | | | 1,759,167 | |
| | 1,429 | | | Vyaire Medical, Inc., Term Loan B | | | 5.750% | | | | 3-Month LIBOR | | | | 4.750% | | | | 4/30/25 | | | | B3 | | | | 1,193,608 | |
| | 5,984 | | | Total Health Care Equipment & Supplies | | | | | | | | 5,367,104 | |
| |
| | | | Health Care Providers & Services – 8.9% (5.6% of Total Investments) | |
| | | | | | | |
| | 1,818 | | | Acadia Healthcare, Inc., Term Loan B3 | | | 2.661% | | | | 1-Month LIBOR | | | | 2.500% | | | | 2/11/22 | | | | Ba3 | | | | 1,794,738 | |
| | 4,275 | | | Air Medical Group Holdings, Inc., Term Loan B | | | 4.250% | | | | 6-Month LIBOR | | | | 3.250% | | | | 4/28/22 | | | | B1 | | | | 4,232,041 | |
| | 802 | | | Air Methods, Term Loan, First Lien | | | 4.500% | | | | 3-Month LIBOR | | | | 3.500% | | | | 4/21/24 | | | | B | | | | 646,595 | |
| | 2 | | | Albany Molecular Research, Inc., Initial Term Loan, First Lien | | | 4.250% | | | | 2-Month LIBOR | | | | 3.250% | | | | 8/31/24 | | | | B2 | | | | 2,402 | |
| | 946 | | | Albany Molecular Research, Inc., Initial Term Loan, First Lien | | | 4.250% | | | | 3-Month LIBOR | | | | 3.250% | | | | 8/31/24 | | | | B2 | | | | 931,896 | |
| | 1,791 | | | Ardent Health, Term Loan, First Lien | | | 5.500% | | | | 1-Month LIBOR | | | | 4.500% | | | | 6/28/25 | | | | B1 | | | | 1,782,095 | |
| | 2,311 | | | Brightspring Health, Term Loan B | | | 3.425% | | | | 1-Month LIBOR | | | | 3.250% | | | | 3/05/26 | | | | B1 | | | | 2,267,848 | |
| | 1,234 | | | Catalent Pharma Solutions, Inc., Dollar Term Loan B2 | | | 3.250% | | | | 1-Month LIBOR | | | | 2.250% | | | | 5/17/26 | | | | BB+ | | | | 1,230,777 | |
| | 1,170 | | | Civitas Solutions, Term Loan B | | | 4.420% | | | | 1-Month LIBOR | | | | 4.250% | | | | 3/08/26 | | | | B | | | | 1,148,154 | |
| | 53 | | | Civitas Solutions, Term Loan C | | | 4.420% | | | | 1-Month LIBOR | | | | 4.250% | | | | 3/08/26 | | | | B | | | | 52,277 | |
| | 680 | | | DaVita, Inc., Term Loan B | | | 1.911% | | | | 1-Month LIBOR | | | | 1.750% | | | | 8/12/26 | | | | BBB– | | | | 668,436 | |
| | 4,166 | | | Envision Healthcare Corporation, Initial Term Loan | | | 3.911% | | | | 1-Month LIBOR | | | | 3.750% | | | | 10/10/25 | | | | Caa1 | | | | 2,772,573 | |
| | 631 | | | HCA, Inc., Term Loan B12 | | | 1.911% | | | | 1-Month LIBOR | | | | 1.750% | | | | 3/13/25 | | | | BBB– | | | | 623,748 | |
| | 1,088 | | | HCA, Inc., Term Loan B13 | | | 1.911% | | | | 1-Month LIBOR | | | | 1.750% | | | | 3/18/26 | | | | BBB– | | | | 1,075,094 | |
| | 991 | | | Heartland Dental Care, Inc., Term Loan, First Lien | | | 3.661% | | | | 1-Month LIBOR | | | | 3.500% | | | | 4/30/25 | | | | B3 | | | | 882,679 | |
| | 975 | | | InnovaCare, Initial Term Loan | | | 6.750% | | | | 3-Month LIBOR | | | | 5.750% | | | | 11/06/26 | | | | B+ | | | | 953,063 | |
| | 1,084 | | | Jordan Health, Initial Term Loan, First Lien | | | 5.386% | | | | 3-Month LIBOR | | | | 5.000% | | | | 5/15/25 | | | | Caa1 | | | | 894,849 | |
| | 3,536 | | | Kindred at Home Hospice, Term Loan B, First Lien | | | 3.438% | | | | 1-Month LIBOR | | | | 3.250% | | | | 7/02/25 | | | | B1 | | | | 3,494,402 | |
| | 5,934 | | | Lifepoint Health, Inc., New Term Loan B | | | 3.911% | | | | 1-Month LIBOR | | | | 3.750% | | | | 11/16/25 | | | | B1 | | | | 5,817,264 | |
| | 88 | | | MyEyeDr, Delayed Draw Term Loan, (6) | | | 4.613% | | | | 3-Month LIBOR | | | | 4.250% | | | | 8/31/26 | | | | B– | | | | 80,258 | |
| | 351 | | | MyEyeDr, Term Loan | | | 4.613% | | | | 3-Month LIBOR | | | | 4.250% | | | | 8/31/26 | | | | B– | | | | 320,294 | |
| | 7,991 | | | Pharmaceutical Product Development, Inc., Term Loan B | | | 3.500% | | | | 1-Month LIBOR | | | | 2.500% | | | | 8/18/22 | | | | Ba2 | | | | 7,970,737 | |
| | 235 | | | Quorum Health Corp, Term Loan, (5) | | | 9.250% | | | | 3-Month LIBOR | | | | 8.250% | | | | 4/29/22 | | | | N/R | | | | 218,254 | |
| | 3,261 | | | Select Medical Corporation, Term Loan B | | | 2.680% | | | | 1-Month LIBOR | | | | 2.500% | | | | 3/06/25 | | | | Ba2 | | | | 3,180,452 | |
| | 2,782 | | | Surgery Center Holdings Inc., Initial Term Loan, (DD1) | | | 4.250% | | | | 1-Month LIBOR | | | | 3.250% | | | | 9/03/24 | | | | B2 | | | | 2,638,794 | |
| | 2,653 | | | Team Health, Inc., Initial Term Loan | | | 3.750% | | | | 1-Month LIBOR | | | | 2.750% | | | | 2/06/24 | | | | B+ | | | | 2,117,238 | |
| | 50,848 | | | Total Health Care Providers & Services | | | | | | | | 47,796,958 | |
| |
| | | | Health Care Technology – 2.7% (1.6% of Total Investments) | |
| | | | | | | |
| | 285 | | | Emdeon, Inc., Term Loan | | | 3.500% | | | | 1-Month LIBOR | | | | 2.500% | | | | 3/01/24 | | | | B+ | | | | 279,513 | |
| | 6,948 | | | Emdeon, Inc., Term Loan | | | 3.500% | | | | 3-Month LIBOR | | | | 2.500% | | | | 3/01/24 | | | | B+ | | | | 6,816,846 | |
| | 2,900 | | | Onex Carestream Finance LP, New Extended Term Loan, First Lien | | | 7.822% | | | | 6-Month LIBOR | | | | 6.750% | | | | 5/05/23 | | | | B1 | | | | 2,765,944 | |
| | 2,385 | | | Onex Carestream Finance LP, New Extended Term Loan, Second Lien | | | 5.572% | | | | 3-Month LIBOR | | | | 4.500% | | | | 8/05/23 | | | | Caa1 | | | | 1,919,602 | |
| | 2,438 | | | Zelis, Term Loan B | | | 4.911% | | | | 1-Month LIBOR | | | | 4.750% | | | | 9/30/26 | | | | B | | | | 2,436,446 | |
| | 14,956 | | | Total Health Care Technology | | | | | | | | | | | | | | | | | | | | | | | 14,218,351 | |
| |
| | | | Hotels, Restaurants & Leisure – 15.9% (9.9% of Total Investments) | |
| | | | | | | |
| | 751 | | | 24 Hour Fitness Worldwide, Inc., DIP Term Loan, (5), (6) | | | 11.000% | | | | 3-Month LIBOR | | | | 10.000% | | | | 6/15/21 | | | | B2 | | | | 723,026 | |
| | 2,520 | | | 24 Hour Fitness Worldwide, Inc., Term Loan B, (5) | | | 0.000% | | | | N/A | | | | N/A | | | | 5/31/25 | | | | D | | | | 595,959 | |
46
| | | | | | | | | | | | | | | | | | | | | | | | | | | | |
Principal
Amount (000) | | | Description (1) | | Coupon (2) | | | Reference
Rate (2) | | | Spread (2) | | | Maturity (3) | | | Ratings (4) | | | Value | |
| |
| | | | Hotels, Restaurants & Leisure (continued) | |
| | | | | | | |
| $ | 3,772 | | | Alterra Mountain Company, Term Loan B, First Lien | | | 2.911% | | | | 1-Month LIBOR | | | | 2.750% | | | | 7/31/24 | | | | B1 | | | $ | 3,637,288 | |
| | 1,297 | | | Alterra Mountain Company, Term Loan, First Lien | | | 5.500% | | | | 1-Month LIBOR | | | | 4.500% | | | | 8/01/26 | | | | B1 | | | | 1,293,508 | |
| | 1,406 | | | Boyd Gaming Corporation, Refinancing Term Loan B | | | 2.361% | | | | 1-Week LIBOR | | | | 2.250% | | | | 9/15/23 | | | | BB– | | | | 1,364,020 | |
| | 22,026 | | | Burger King Corporation, Term Loan B4 | | | 1.911% | | | | 1-Month LIBOR | | | | 1.750% | | | | 11/19/26 | | | | BB+ | | | | 21,184,811 | |
| | 1,000 | | | Caesars Resort Collection, Term Loan | | | 4.687% | | | | 1-Month LIBOR | | | | 4.500% | | | | 7/20/25 | | | | B+ | | | | 966,095 | |
| | 500 | | | Caesars Resort Collection, Term Loan | | | 4.772% | | | | 3-Month LIBOR | | | | 4.500% | | | | 7/20/25 | | | | B+ | | | | 483,048 | |
| | 10,449 | | | Caesars Resort Collection, Term Loan, First Lien | | | 2.911% | | | | 1-Month LIBOR | | | | 2.750% | | | | 12/22/24 | | | | B+ | | | | 9,644,220 | |
| | 832 | | | CCM Merger, Inc., Term Loan B | | | 3.000% | | | | 1-Month LIBOR | | | | 2.250% | | | | 8/09/21 | | | | BB | | | | 819,919 | |
| | 4,513 | | | CityCenter Holdings LLC, Term Loan B | | | 3.000% | | | | 1-Month LIBOR | | | | 2.250% | | | | 4/18/24 | | | | B+ | | | | 4,191,287 | |
| | 3,820 | | | ClubCorp Operations, Inc., Term Loan B | | | 3.058% | | | | 3-Month LIBOR | | | | 2.750% | | | | 9/18/24 | | | | B– | | | | 3,310,984 | |
| | 3,965 | | | Equinox Holdings, Inc., Term Loan B1 | | | 4.072% | | | | 6-Month LIBOR | | | | 3.000% | | | | 3/08/24 | | | | Caa1 | | | | 3,008,671 | |
| | 965 | | | Four Seasons Holdings, Inc., Term Loan B | | | 2.161% | | | | 1-Month LIBOR | | | | 2.000% | | | | 11/30/23 | | | | BB+ | | | | 934,588 | |
| | 1,491 | | | Golden Nugget LLC, Initial Term Loan B | | | 3.250% | | | | 1-Month LIBOR | | | | 2.500% | | | | 10/04/23 | | | | B | | | | 1,258,626 | |
| | 7,787 | | | Hilton Hotels, Term Loan B2 | | | 1.922% | | | | 1-Month LIBOR | | | | 1.750% | | | | 6/21/26 | | | | BBB– | | | | 7,510,161 | |
| | 8 | | | Life Time Fitness, Inc., Term Loan B | | | 3.750% | | | | 6-Month LIBOR | | | | 2.750% | | | | 6/15/22 | | | | B | | | | 6,883 | |
| | 2,945 | | | Life Time Fitness, Inc., Term Loan B | | | 3.750% | | | | 3-Month LIBOR | | | | 2.750% | | | | 6/15/22 | | | | B | | | | 2,670,610 | |
| | 878 | | | PCI Gaming, Term Loan, First Lien | | | 2.661% | | | | 1-Month LIBOR | | | | 2.500% | | | | 5/31/26 | | | | BBB– | | | | 845,677 | |
| | 22 | | | Scientific Games Corp., Initial Term Loan B5 | | | 3.612% | | | | 3-Month LIBOR | | | | 2.750% | | | | 8/14/24 | | | | B+ | | | | 19,653 | |
| | 1,649 | | | Scientific Games Corp., Initial Term Loan B5 | | | 3.612% | | | | 1-Month LIBOR | | | | 2.750% | | | | 8/14/24 | | | | B+ | | | | 1,506,487 | |
| | 6,739 | | | Scientific Games Corp., Initial Term Loan B5 | | | 3.612% | | | | 6-Month LIBOR | | | | 2.750% | | | | 8/14/24 | | | | B+ | | | | 6,158,146 | |
| | 3,126 | | | Seaworld Parks and Entertainment, Inc., Term Loan B5 | | | 3.750% | | | | 1-Month LIBOR | | | | 3.000% | | | | 3/31/24 | | | | B2 | | | | 2,917,926 | |
| | 5,464 | | | Stars Group Holdings, Term Loan B | | | 3.808% | | | | 3-Month LIBOR | | | | 3.500% | | | | 7/10/25 | | | | BBB– | | | | 5,471,882 | |
| | 2,930 | | | Station Casinos LLC, Term Loan B | | | 2.500% | | | | 1-Month LIBOR | | | | 2.250% | | | | 2/08/27 | | | | BB– | | | | 2,715,284 | |
| | 1,965 | | | Wyndham International, Inc., Term Loan B | | | 1.911% | | | | 1-Month LIBOR | | | | 1.750% | | | | 5/30/25 | | | | BB+ | | | | 1,878,216 | |
| | 92,820 | | | Total Hotels, Restaurants & Leisure | | | | | | | | 85,116,975 | |
| |
| | | | Household Durables – 0.5% (0.3% of Total Investments) | |
| | | | | | | |
| | 1,697 | | | Apex Tool Group LLC, Third Amendment Term Loan | | | 6.500% | | | | 1-Month LIBOR | | | | 5.250% | | | | 8/21/24 | | | | B3 | | | | 1,565,813 | |
| | 100 | | | Serta Simmons Holdings LLC, First Out Term Loan | | | 8.500% | | | | 2-Month LIBOR | | | | 7.500% | | | | 6/01/27 | | | | B+ | | | | 99,476 | |
| | 928 | | | Serta Simmons Holdings LLC, Second Out Term Loan | | | 8.500% | | | | 2-Month LIBOR | | | | 7.500% | | | | 6/01/27 | | | | B | | | | 714,247 | |
| | 2,725 | | | Total Household Durables | | | | | | | | | | | | | | | | | | | | | | | 2,379,536 | |
| |
| | | | Household Products – 2.5% (1.6% of Total Investments) | |
| | | | | | | |
| | 313 | | | Energizer Holdings, Term Loan B | | | 2.438% | | | | 1-Month LIBOR | | | | 2.250% | | | | 12/17/25 | | | | BB+ | | | | 311,933 | |
| | 8,796 | | | KIK Custom Products Inc., Term Loan B2, (DD1) | | | 5.000% | | | | 1-Month LIBOR | | | | 4.000% | | | | 5/15/23 | | | | B– | | | | 8,699,486 | |
| | 4,547 | | | Reynolds Group Holdings, Inc., Term Loan, First Lien, (DD1) | | | 2.911% | | | | 1-Month LIBOR | | | | 2.750% | | | | 2/05/23 | | | | B+ | | | | 4,469,035 | |
| | 13,656 | | | Total Household Products | | | | | | | | | | | | | | | | | | | | | | | 13,480,454 | |
| |
| | | | Industrial Conglomerates – 0.3% (0.2% of Total Investments) | |
| | | | | | | |
| | 4 | | | Education Adisory Board, Term Loan, First Lien | | | 4.750% | | | | 1-Month LIBOR | | | | 3.750% | | | | 9/29/24 | | | | B2 | | | | 3,595 | |
| | 1,462 | | | Education Adisory Board, Term Loan, First Lien | | | 4.750% | | | | 3-Month LIBOR | | | | 3.750% | | | | 9/29/24 | | | | B2 | | | | 1,402,209 | |
| | 1,466 | | | Total Industrial Conglomerate | | | | | | | | | | | | | | | | | | | | | | | 1,405,804 | |
| |
| | | | Insurance – 2.4% (1.5% of Total Investments) | |
| | | | | | | |
| | 2,586 | | | Acrisure LLC, Term Loan B | | | 3.661% | | | | 1-Month LIBOR | | | | 3.500% | | | | 2/15/27 | | | | B | | | | 2,498,203 | |
| | 4,096 | | | Alliant Holdings I LLC, Term Loan B | | | 2.911% | | | | 1-Month LIBOR | | | | 2.750% | | | | 5/10/25 | | | | B | | | | 3,971,455 | |
| | 2,542 | | | Asurion LLC, Term Loan B6 | | | 3.161% | | | | 1-Month LIBOR | | | | 3.000% | | | | 11/03/23 | | | | Ba3 | | | | 2,510,160 | |
| | 3,301 | | | Hub International Holdings, Inc., Term Loan B | | | 3.263% | | | | 3-Month LIBOR | | | | 3.000% | | | | 4/25/25 | | | | B | | | | 3,214,975 | |
| | 700 | | | Ryan Specialty Group LLC, Term Loan B, (WI/DD) | | | TBD | | | | TBD | | | | TBD | | | | TBD | | | | B1 | | | | 696,500 | |
| | 13,225 | | | Total Insurance | | | | | | | | | | | | | | | | | | | | | | | 12,891,293 | |
| |
| | | | Interactive Media & Services – 1.9% (1.1% of Total Investments) | |
| | | | | | | |
| | 8,209 | | | Rackspace Hosting, Inc., Refinancing Term Loan B, First Lien, (DD1) | | | 4.000% | | | | 3-Month LIBOR | | | | 3.000% | | | | 11/03/23 | | | | B+ | | | | 8,061,306 | |
| | 1,970 | | | WeddingWire, Inc., Term Loan | | | 4.808% | | | | 3-Month LIBOR | | | | 4.500% | | | | 12/21/25 | | | | B+ | | | | 1,812,400 | |
| | 10,179 | | | Total Interactive Media & Services | | | | | | | | 9,873,706 | |
47
| | |
| |
| JFR | | Nuveen Floating Rate Income Fund (continued) |
| | Portfolio of Investments July 31, 2020 |
| | | | | | | | | | | | | | | | | | | | | | | | | | | | |
Principal
Amount (000) | | | Description (1) | | Coupon (2) | | | Reference
Rate (2) | | | Spread (2) | | | Maturity (3) | | | Ratings (4) | | | Value | |
| |
| | | | Internet & Direct Marketing Retail – 0.6% (0.4% of Total Investments) | |
| | | | | | | |
| $ | 2,894 | | | Uber Technologies, Inc., Term Loan | | | 5.000% | | | | 1-Month LIBOR | | | | 4.000% | | | | 4/04/25 | | | | B1 | | | $ | 2,860,623 | |
| | 565 | | | Uber Technologies, Inc., Term Loan | | | 3.661% | | | | 1-Month LIBOR | | | | 3.500% | | | | 7/13/23 | | | | B1 | | | | 554,370 | |
| | 3,459 | | | Total Internet & Direct Marketing Retail | | | | | | | | 3,414,993 | |
| |
| | | | Internet Software & Services – 2.0% (1.2% of Total Investments) | |
| | | | | | | |
| | 1,926 | | | Ancestry.com, Inc., Term Loan, First Lien | | | 4.750% | | | | 1-Month LIBOR | | | | 3.750% | | | | 10/19/23 | | | | B | | | | 1,896,566 | |
| | 1,109 | | | Blue Yonder, Term Loan B, (WI/DD) | | | TBD | | | | TBD | | | | TBD | | | | TBD | | | | B1 | | | | 1,108,197 | |
| | 1,168 | | | Dynatrace LLC, Term Loan, First Lien | | | 2.411% | | | | 1-Month LIBOR | | | | 2.250% | | | | 8/23/25 | | | | B1 | | | | 1,153,657 | |
| | 6,444 | | | Epicor Software Corporation, Term Loan, First Lien, (DD1) | | | 5.250% | | | | 3-Month LIBOR | | | | 4.250% | | | | 7/30/27 | | | | B2 | | | | 6,447,003 | |
| | 2,448 | | | SkillSoft Corporation, Term Loan, Second Lien, (5) | | | 0.000% | | | | N/A | | | | N/A | | | | 4/28/22 | | | | CCC | | | | 102,814 | |
| | 13,095 | | | Total Internet Software & Services | | | | | | | | 10,708,237 | |
| |
| | | | IT Services – 3.7% (2.3% of Total Investments) | |
| | | | | | | |
| | 2,081 | | | Datto, Inc., Term Loan | | | 4.411% | | | | 1-Month LIBOR | | | | 4.250% | | | | 4/02/26 | | | | B | | | | 2,075,249 | |
| | 995 | | | DTI Holdings, Inc., Replacement Term Loan B1 | | | 5.750% | | | | 3-Month LIBOR | | | | 4.750% | | | | 9/30/23 | | | | CCC+ | | | | 794,582 | |
| | 2 | | | DTI Holdings, Inc., Replacement Term Loan B1 | | | 5.750% | | | | 2-Month LIBOR | | | | 4.750% | | | | 9/30/23 | | | | CCC+ | | | | 2,071 | |
| | 195 | | | iQor US, Inc., Term Loan, (5) | | | 11.000% | | | | 1-Month LIBOR | | | | 10.000% | | | | 5/27/21 | | | | N/R | | | | 182,898 | |
| | 1,297 | | | KBR, Inc., New Term Loan B | | | 2.911% | | | | 1-Month LIBOR | | | | 2.750% | | | | 2/07/27 | | | | Ba1 | | | | 1,280,268 | |
| | 3,568 | | | Sabre, Inc., Term Loan B | | | 2.161% | | | | 1-Month LIBOR | | | | 2.000% | | | | 2/22/24 | | | | Ba3 | | | | 3,277,175 | |
| | 845 | | | Science Applications International Corporation, Term Loan B | | | 2.036% | | | | 1-Month LIBOR | | | | 1.875% | | | | 10/31/25 | | | | BB+ | | | | 833,408 | |
| | 3,500 | | | Syniverse Holdings, Inc., Initial Term Loan, Second Lien | | | 10.000% | | | | 3-Month LIBOR | | | | 9.000% | | | | 3/11/24 | | | | CCC– | | | | 1,831,883 | |
| | 3,251 | | | Syniverse Holdings, Inc., Term Loan C | | | 6.000% | | | | 3-Month LIBOR | | | | 5.000% | | | | 3/09/23 | | | | CCC+ | | | | 2,592,641 | |
| | 2,425 | | | Tempo Acquisition LLC, Term Loan B | | | 2.911% | | | | 1-Month LIBOR | | | | 2.750% | | | | 5/01/24 | | | | B1 | | | | 2,372,256 | |
| | 3,641 | | | West Corporation, Term Loan B, (DD1) | | | 5.000% | | | | 3-Month LIBOR | | | | 4.000% | | | | 10/10/24 | | | | BB– | | | | 3,219,746 | |
| | 1,440 | | | WEX, Inc., Term Loan B3 | | | 2.411% | | | | 1-Month LIBOR | | | | 2.250% | | | | 5/17/26 | | | | Ba2 | | | | 1,396,918 | |
| | 23,240 | | | Total IT Services | | | | | | | | | | | | | | | | | | | | | | | 19,859,095 | |
| |
| | | | Leisure Products – 0.2% (0.1% of Total Investments) | |
| | | | | | | |
| | 1,055 | | | Carnival Corp, Term Loan B, (DD1) | | | 8.500% | | | | 1-Month LIBOR | | | | 7.500% | | | | 6/30/25 | | | | Baa3 | | | | 1,038,078 | |
| |
| | | | Life Sciences Tools & Services – 1.2% (0.7% of Total Investments) | |
| | | | | | | |
| | 388 | | | Inventiv Health, Inc., Term Loan B | | | 1.911% | | | | 1-Month LIBOR | | | | 1.750% | | | | 8/01/24 | | | | BB | | | | 379,653 | |
| | 6,043 | | | Parexel International Corp., Term Loan B | | | 2.911% | | | | 1-Month LIBOR | | | | 2.750% | | | | 9/27/24 | | | | B2 | | | | 5,825,355 | |
| | 6,431 | | | Total Life Sciences Tools & Services | | | | | | | | 6,205,008 | |
| |
| | | | Machinery – 1.2% (0.7% of Total Investments) | |
| | | | | | | |
| | 2,343 | | | Gardner Denver, Inc., Extended Term Loan B | | | 1.911% | | | | 1-Month LIBOR | | | | 1.750% | | | | 2/28/27 | | | | Ba2 | | | | 2,259,816 | |
| | 263 | | | Gardner Denver, Inc., New Term Loan B | | | 2.916% | | | | 1-Month LIBOR | | | | 2.750% | | | | 1/31/27 | | | | BB+ | | | | 259,743 | |
| | 1,436 | | | Gates Global LLC, Term Loan B | | | 3.750% | | | | 1-Month LIBOR | | | | 2.750% | | | | 4/01/24 | | | | B1 | | | | 1,407,334 | |
| | 1,750 | | | Thyssenkrupp Elevator, Term Loan B, (WI/DD) | | | TBD | | | | TBD | | | | TBD | | | | TBD | | | | B1 | | | | 1,728,676 | |
| | 577 | | | TNT Crane and Rigging Inc., Initial Term Loan, First Lien, (5) | | | 0.000% | | | | N/A | | | | N/A | | | | 11/27/20 | | | | Caa3 | | | | 411,963 | |
| | 850 | | | TNT Crane and Rigging, Inc., Term Loan, Second Lien, (5) | | | 0.000% | | | | N/A | | | | N/A | | | | 11/27/21 | | | | C | | | | 149,876 | |
| | 7,219 | | | Total Machinery | | | | | | | | | | | | | | | | | | | | | | | 6,217,408 | |
| |
| | | | Marine – 0.3% (0.2% of Total Investments) | |
| | | | | | | |
| | 3,119 | | | Harvey Gulf International Marine, Inc., Exit Term Loan | | | 7.713% | | | | 3-Month LIBOR | | | | 6.000% | | | | 7/02/23 | | | | B– | | | | 1,509,026 | |
| |
| | | | Media – 17.2% (10.6% of Total Investments) | |
| | | | | | | |
| | 600 | | | Advantage Sales & Marketing, Inc., Term Loan B2, First Lien | | | 4.250% | | | | 3-Month LIBOR | | | | 3.250% | | | | 7/25/21 | | | | B2 | | | | 570,984 | |
| | 1,955 | | | Advantage Sales & Marketing, Inc., Term Loan, First Lien | | | 4.250% | | | | 3-Month LIBOR | | | | 3.250% | | | | 7/25/21 | | | | B2 | | | | 1,861,715 | |
| | 538 | | | Affinion Group Holdings, Inc., Consenting Term Loan, (cash 3.250%, PIK 1.750%) | | | 5.000% | | | | 3-Month LIBOR | | | | 4.000% | | | | 4/10/24 | | | | N/R | | | | 380,583 | |
| | 696 | | | Catalina Marketing Corporation, First Out Term Loan | | | 8.500% | | | | 1-Month LIBOR | | | | 7.500% | | | | 2/15/23 | | | | B2 | | | | 428,313 | |
48
| | | | | | | | | | | | | | | | | | | | | | | | | | | | |
Principal
Amount (000) | | | Description (1) | | Coupon (2) | | | Reference
Rate (2) | | | Spread (2) | | | Maturity (3) | | | Ratings (4) | | | Value | |
| |
| | | | Media (continued) | |
| | | | | | | |
| $ | 1,043 | | | Catalina Marketing Corporation, Last Out Term Loan, (cash 2.000, PIK 9.500%) | | | 11.500% | | | | 1-Month LIBOR | | | | 1.000% | | | | 8/15/23 | | | | Caa2 | | | $ | 232,040 | |
| | 351 | | | CBS Radio, Inc., Term Loan B2 | | | 2.673% | | | | 1-Month LIBOR | | | | 2.500% | | | | 11/17/24 | | | | BB– | | | | 333,888 | |
| | 6,066 | | | Cequel Communications LLC, Term Loan B | | | 2.425% | | | | 1-Month LIBOR | | | | 2.250% | | | | 1/15/26 | | | | BB | | | | 5,877,642 | |
| | 4,894 | | | Charter Communications Operating Holdings LLC, Term Loan B2 | | | 1.920% | | | | 1-Month LIBOR | | | | 1.750% | | | | 2/01/27 | | | | BBB– | | | | 4,785,731 | |
| | 3,150 | | | Cineworld Group PLC, Term Loan B | | | 3.322% | | | | 6-Month LIBOR | | | | 2.250% | | | | 2/28/25 | | | | B | | | | 2,022,939 | |
| | 27 | | | Clear Channel Outdoor Holdings, Inc., Term Loan B | | | 3.714% | | | | 2-Month LIBOR | | | | 3.500% | | | | 8/21/26 | | | | B1 | | | | 23,908 | |
| | 10,591 | | | Clear Channel Outdoor Holdings, Inc., Term Loan B | | | 3.761% | | | | 3-Month LIBOR | | | | 3.500% | | | | 8/21/26 | | | | B1 | | | | 9,467,387 | |
| | 2,860 | | | CSC Holdings LLC, Refinancing Term Loan | | | 2.425% | | | | 1-Month LIBOR | | | | 2.250% | | | | 7/17/25 | | | | BB | | | | 2,773,553 | |
| | 4,878 | | | CSC Holdings, LLC, Term Loan B5 | | | 2.675% | | | | 1-Month LIBOR | | | | 2.500% | | | | 4/15/27 | | | | Ba3 | | | | 4,738,067 | |
| | 764 | | | Cumulus Media, Inc., Term Loan B | | | 4.822% | | | | 3-Month LIBOR | | | | 3.750% | | | | 3/31/26 | | | | B | | | | 732,586 | |
| | 988 | | | EW Scripps, Term Loan B2 | | | 2.661% | | | | 1-Month LIBOR | | | | 2.500% | | | | 5/01/26 | | | | BB+ | | | | 955,443 | |
| | 830 | | | Gray Television, Inc., Term Loan B2 | | | 2.421% | | | | 1-Month LIBOR | | | | 2.250% | | | | 2/07/24 | | | | BB+ | | | | 809,667 | |
| | 850 | | | Gray Television, Inc., Term Loan C | | | 2.671% | | | | 1-Month LIBOR | | | | 2.500% | | | | 1/02/26 | | | | BB+ | | | | 830,526 | |
| | 731 | | | Houghton Mifflin Harcourt, Term Loan | | | 7.250% | | | | 1-Month LIBOR | | | | 6.250% | | | | 11/22/24 | | | | B | | | | 661,781 | |
| | 6,866 | | | iHeartCommunications Inc., Term Loan B | | | 3.161% | | | | 1-Month LIBOR | | | | 3.000% | | | | 5/01/26 | | | | B+ | | | | 6,446,757 | |
| | 2,714 | | | IMG Worldwide, Inc., Term Loan B | | | 2.920% | | | | 1-Month LIBOR | | | | 2.750% | | | | 5/16/25 | | | | B3 | | | | 2,167,063 | |
| | 2,507 | | | Intelsat Jackson Holdings, S.A., DIP Term Loan, (5), (6) | | | 6.500% | | | | 3-Month LIBOR | | | | 5.500% | | | | 7/13/21 | | | | B2 | | | | 2,559,243 | |
| | 8,553 | | | Intelsat Jackson Holdings, S.A., Term Loan B, (DD1), (5) | | | 8.000% | | | | Prime | | | | 4.750% | | | | 11/27/23 | | | | B | | | | 8,636,644 | |
| | 1,608 | | | LCPR Loan Financing LLC, Term Loan B | | | 5.175% | | | | 1-Month LIBOR | | | | 5.000% | | | | 10/15/26 | | | | BB– | | | | 1,619,728 | |
| | 4,972 | | | McGraw-Hill Education Holdings LLC, Term Loan B | | | 5.000% | | | | 3-Month LIBOR | | | | 4.000% | | | | 5/04/22 | | | | BB+ | | | | 4,353,186 | |
| | 690 | | | Meredith Corporation, Incremental Term Loan B | | | 5.250% | | | | 1-Month LIBOR | | | | 4.250% | | | | 1/31/25 | | | | BB– | | | | 675,914 | |
| | 3,315 | | | Meredith Corporation, Term Loan B2 | | | 2.667% | | | | 1-Month LIBOR | | | | 2.500% | | | | 1/31/25 | | | | BB– | | | | 3,140,916 | |
| | 1,965 | | | Metro-Goldwyn-Mayer, Inc., Term Loan, First Lien | | | 2.670% | | | | 1-Month LIBOR | | | | 2.500% | | | | 7/03/25 | | | | BB | | | | 1,888,856 | |
| | 1,250 | | | Metro-Goldwyn-Mayer, Inc., Term Loan, Second Lien | | | 5.500% | | | | 2-Month LIBOR | | | | 4.500% | | | | 7/06/26 | | | | B– | | | | 1,210,937 | |
| | 1,441 | | | Nexstar Broadcasting, Inc., Term Loan B | | | 2.921% | | | | 1-Month LIBOR | | | | 2.750% | | | | 9/19/26 | | | | BB | | | | 1,406,384 | |
| | 872 | | | Nexstar Broadcasting, Inc., Term Loan B3 | | | 2.421% | | | | 1-Month LIBOR | | | | 2.250% | | | | 1/17/24 | | | | BB | | | | 849,194 | |
| | 3,398 | | | Nexstar Broadcasting, Inc., Term Loan B3 | | | 2.416% | | | | 1-Month LIBOR | | | | 2.250% | | | | 1/17/24 | | | | BB | | | | 3,309,334 | |
| | 419 | | | Red Ventures, Term Loan B | | | 2.661% | | | | 1-Month LIBOR | | | | 2.500% | | | | 11/08/24 | | | | B+ | | | | 404,393 | |
| | 1,241 | | | Sinclair Television Group, Term Loan B2 | | | 2.680% | | | | 1-Month LIBOR | | | | 2.500% | | | | 9/30/26 | | | | BB+ | | | | 1,208,065 | |
| | 4,960 | | | Sinclair Television Group, Term Loan B2 | | | 2.420% | | | | 1-Month LIBOR | | | | 2.250% | | | | 1/03/24 | | | | BB+ | | | | 4,841,944 | |
| | 3,252 | | | WideOpenWest Finance LLC, Term Loan B | | | 4.250% | | | | 1-Month LIBOR | | | | 3.250% | | | | 8/19/23 | | | | B | | | | 3,213,348 | |
| | 6,689 | | | Ziggo B.V., Term Loan | | | 2.675% | | | | 1-Month LIBOR | | | | 2.500% | | | | 4/30/28 | | | | BB | | | | 6,444,537 | |
| | 98,524 | | | Total Media | | | | | | | | | | | | | | | | | | | | | | | 91,863,196 | |
| |
| | | | Multiline Retail – 1.1% (0.7% of Total Investments) | |
| | | | | | | |
| | 3,114 | | | 99 Cents Only Stores, Term Loan B2, Second Lien, (cash 6.296%, PIK 1.500%) | | | 7.796% | | | | 3-Month LIBOR | | | | 5.000% | | | | 1/13/22 | | | | CCC+ | | | | 2,825,767 | |
| | 2,794 | | | Belk, Inc., Term Loan, First Lien | | | 7.750% | | | | 6-Month LIBOR | | | | 6.750% | | | | 7/31/25 | | | | Caa1 | | | | 1,219,116 | |
| | 1,955 | | | EG America LLC, Term Loan, First Lien | | | 5.072% | | | | 6-Month LIBOR | | | | 4.000% | | | | 2/07/25 | | | | B2 | | | | 1,863,555 | |
| | 7,863 | | | Total Multiline Retail | | | | | | | | | | | | | | | | | | | | | | | 5,908,438 | |
| |
| | | | Oil, Gas & Consumable Fuels – 3.0% (1.9% of Total Investments) | |
| | | | | | | |
| | 964 | | | BCP Renaissance Parent, Term Loan B | | | 4.500% | | | | 3-Month LIBOR | | | | 3.500% | | | | 11/01/24 | | | | B+ | | | | 873,235 | |
| | 3,092 | | | Buckeye Partners, Term Loan, First Lien | | | 2.921% | | | | 1-Month LIBOR | | | | 2.750% | | | | 11/01/26 | | | | BBB– | | | | 3,030,405 | |
| | 4,616 | | | California Resources Corporation, DIP Term Loan | | | 10.000% | | | | 1-Month LIBOR | | | | 9.000% | | | | 2/21/28 | | | | N/R | | | | 4,569,771 | |
| | 7,790 | | | California Resources Corporation, Term Loan B, (5) | | | 0.000% | | | | N/A | | | | N/A | | | | 12/31/22 | | | | D | | | | 3,004,720 | |
| | 765 | | | California Resources Corporation, Term Loan, (5) | | | 0.000% | | | | N/A | | | | N/A | | | | 12/31/21 | | | | D | | | | 33,126 | |
| | 10,068 | | | Fieldwood Energy LLC, Exit Term Loan, (DD1), (5) | | | 7.027% | | | | 3-Month LIBOR | | | | 5.250% | | | | 4/11/22 | | | | CCC | | | | 2,500,216 | |
| | 4,881 | | | Fieldwood Energy LLC, Exit Term Loan, Second Lien, (5) | | | 0.000% | | | | N/A | | | | N/A | | | | 4/11/23 | | | | C | | | | 83,910 | |
| | 2,504 | | | Gulf Finance, LLC, Term Loan B | | | 6.250% | | | | 1-Month LIBOR | | | | 5.250% | | | | 8/25/23 | | | | CCC+ | | | | 1,636,620 | |
| | 738 | | | Peabody Energy Corporation, Term Loan B | | | 2.911% | | | | 1-Month LIBOR | | | | 2.750% | | | | 3/31/25 | | | | B1 | | | | 394,753 | |
| | 35,418 | | | Total Oil, Gas & Consumable Fuels | | | | | | | | 16,126,756 | |
| |
| | | | Personal Products – 1.1% (0.6% of Total Investments) | |
| | | | | | | |
| | 4,378 | | | Coty, Inc., Term Loan A | | | 1.916% | | | | 1-Month LIBOR | | | | 1.750% | | | | 4/05/23 | | | | B | | | | 3,984,279 | |
| | 263 | | | Coty, Inc., Term Loan B | | | 2.416% | | | | 1-Month LIBOR | | | | 2.250% | | | | 4/05/25 | | | | B | | | | 227,862 | |
49
| | |
| |
| JFR | | Nuveen Floating Rate Income Fund (continued) |
| | Portfolio of Investments July 31, 2020 |
| | | | | | | | | | | | | | | | | | | | | | | | | | | | |
Principal
Amount (000) | | | Description (1) | | Coupon (2) | | | Reference
Rate (2) | | | Spread (2) | | | Maturity (3) | | | Ratings (4) | | | Value | |
| |
| | | | Personal Products (continued) | |
| | | | | | | |
| $ | 5,028 | | | Revlon Consumer Products Corporation, Term Loan B, First Lien | | | 3.863% | | | | 3-Month LIBOR | | | | 3.500% | | | | 9/07/23 | | | | C | | | $ | 1,374,244 | |
| | 9,669 | | | Total Personal Products | | | | | | | | 5,586,385 | |
| |
| | | | Pharmaceuticals – 5.1% (3.2% of Total Investments) | |
| | | | | | | |
| | 1,290 | | | Alphabet Holding Company, Inc., Initial Term Loan, First Lien | | | 3.661% | | | | 1-Month LIBOR | | | | 3.500% | | | | 9/28/24 | | | | B– | | | | 1,241,164 | |
| | 1,985 | | | Amneal Pharmaceuticals LLC, Initial Term Loan | | | 3.688% | | | | 1-Month LIBOR | | | | 3.500% | | | | 5/04/25 | | | | B | | | | 1,874,402 | |
| | 5,366 | | | Concordia Healthcare Corp, Exit Term Loan | | | 6.568% | | | | 6-Month LIBOR | | | | 5.500% | | | | 9/06/24 | | | | B– | | | | 5,022,946 | |
| | 1,220 | | | Elanco Animal Health, Term Loan B, (WI/DD) | | | TBD | | | | TBD | | | | TBD | | | | TBD | | | | Baa3 | | | | 1,192,550 | |
| | 3,741 | | | Endo Health Solutions, Inc., Term Loan B | | | 5.000% | | | | 3-Month LIBOR | | | | 4.250% | | | | 4/29/24 | | | | B+ | | | | 3,593,857 | |
| | 2,700 | | | Mallinckrodt International Finance S.A., Term Loan B, First Lien | | | 3.500% | | | | 6-Month LIBOR | | | | 2.750% | | | | 9/24/24 | | | | B– | | | | 2,270,334 | |
| | 1,428 | | | Mallinckrodt International Finance S.A., Term Loan, First Lien | | | 3.750% | | | | 3-Month LIBOR | | | | 3.000% | | | | 2/24/25 | | | | B– | | | | 1,204,483 | |
| | 3,933 | | | Valeant Pharmaceuticals International, Inc., Term Loan B | | | 2.926% | | | | 1-Month LIBOR | | | | 2.750% | | | | 11/27/25 | | | | BB | | | | 3,861,177 | |
| | 6,936 | | | Valeant Pharmaceuticals International, Inc., Term Loan, First Lien, (DD1) | | | 3.176% | | | | 1-Month LIBOR | | | | 3.000% | | | | 6/02/25 | | | | BB | | | | 6,838,648 | |
| | 28,599 | | | Total Pharmaceuticals | | | | | | | | | | | | | | | | | | | | | | | 27,099,561 | |
| |
| | | | Professional Services – 2.3% (1.4% of Total Investments) | |
| | | | | | | |
| | 2,217 | | | Ceridian HCM Holding, Inc., Term Loan B | | | 2.611% | | | | 1-Week LIBOR | | | | 2.500% | | | | 4/30/25 | | | | B+ | | | | 2,158,741 | |
| | 1,120 | | | Creative Artists Agency, LLC, Term Loan B | | | 3.911% | | | | 1-Month LIBOR | | | | 3.750% | | | | 11/26/26 | | | | B | | | | 1,067,044 | |
| | 1,596 | | | Dun & Bradstreet Corp.,Term Loan, First Lien | | | 3.922% | | | | 1-Month LIBOR | | | | 3.750% | | | | 2/08/26 | | | | BB | | | | 1,591,180 | |
| | 3,433 | | | Nielsen Finance LLC, Term Loan B4 | | | 2.183% | | | | 1-Month LIBOR | | | | 2.000% | | | | 10/04/23 | | | | BBB– | | | | 3,348,569 | |
| | 746 | | | On Assignment, Inc., Term Loan B3 | | | 1.911% | | | | 1-Month LIBOR | | | | 1.750% | | | | 4/02/25 | | | | BBB– | | | | 736,846 | |
| | 4,968 | | | Skillsoft Corporation, Initial Term Loan, First Lien (5) | | | 0.000% | | | | N/A | | | | N/A | | | | 4/28/21 | | | | CCC+ | | | | 3,234,129 | |
| | 14,080 | | | Total Professional Services | | | | | | | | 12,136,509 | |
| |
| | | | Real Estate Management & Development – 0.7% (0.5% of Total Investments) | |
| | | | | | | |
| | 4,482 | | | GGP, Initial Term Loan A2 | | | 3.161% | | | | 1-Month LIBOR | | | | 2.500% | | | | 8/24/23 | | | | BB+ | | | | 4,000,332 | |
| |
| | | | Road & Rail – 1.7% (1.1% of Total Investments) | |
| | | | | | | |
| | 2,278 | | | Avolon LLC, Term Loan B3 | | | 2.500% | | | | 1-Month LIBOR | | | | 1.750% | | | | 1/15/25 | | | | Baa2 | | | | 2,182,137 | |
| | 1,466 | | | Ceva Group PLC, Term Loan B | | | 5.308% | | | | 3-Month LIBOR | | | | 5.000% | | | | 8/03/25 | | | | B+ | | | | 1,257,317 | |
| | 2,494 | | | Genesee & Wyoming Inc., Term Loan, First Lien | | | 2.308% | | | | 3-Month LIBOR | | | | 2.000% | | | | 12/30/26 | | | | BB+ | | | | 2,452,840 | |
| | 1,500 | | | Hertz Corporation, Term Loan, (WI/DD), (5) | | | TBD | | | | TBD | | | | TBD | | | | TBD | | | | N/R | | | | 1,432,500 | |
| | 1,910 | | | Quality Distribution, Incremental Term Loan, First Lien | | | 6.500% | | | | 3-Month LIBOR | | | | 5.500% | | | | 8/18/22 | | | | B– | | | | 1,814,500 | |
| | 77 | | | Savage Enterprises LLC, Term Loan B | | | 3.180% | | | | 1-Month LIBOR | | | | 3.000% | | | | 8/01/25 | | | | BB | | | | 75,642 | |
| | 9,725 | | | Total Road & Rail | | | | | | | | | | | | | | | | | | | | | | | 9,214,936 | |
| |
| | | | Semiconductors & Semiconductor Equipment – 1.1% (0.7% of Total Investments) | |
| | | | | | | |
| | 882 | | | Cabot Microelectronics, Term Loan B1 | | | 2.188% | | | | 1-Month LIBOR | | | | 2.000% | | | | 11/15/25 | | | | BB+ | | | | 877,305 | |
| | 3,459 | | | Lumileds, Term Loan B | | | 4.572% | | | | 6-Month LIBOR | | | | 3.500% | | | | 6/30/24 | | | | CCC+ | | | | 1,377,707 | |
| | 1,707 | | | Microchip Technology, Inc., Term Loan B | | | 2.170% | | | | 1-Month LIBOR | | | | 2.000% | | | | 5/29/25 | | | | Baa3 | | | | 1,700,263 | |
| | 2,006 | | | ON Semiconductor Corporation, New Replacement Term Loan B4 | | | 2.166% | | | | 1-Month LIBOR | | | | 2.000% | | | | 9/19/26 | | | | BB | | | | 1,977,460 | |
| | 8,054 | | | Total Semiconductors & Semiconductor Equipment | | | | | | | | 5,932,735 | |
| |
| | | | Software – 10.6% (6.6% of Total Investments) | |
| | | | | | | |
| | 1,439 | | | Autodata Solutions, Term Loan, First Lien | | | 3.661% | | | | 1-Month LIBOR | | | | 3.500% | | | | 5/30/26 | | | | BB– | | | | 1,389,353 | |
| | 2,084 | | | Blackboard, Inc., Term Loan B5, First Lien | | | 7.000% | | | | 3-Month LIBOR | | | | 6.000% | | | | 6/30/24 | | | | B | | | | 1,978,735 | |
| | 2,499 | | | BMC Software, Inc., Term Loan B | | | 4.411% | | | | 1-Month LIBOR | | | | 4.250% | | | | 10/02/25 | | | | B2 | | | | 2,419,035 | |
| | 3,674 | | | DiscoverOrg LLC, Term Loan B | | | 3.911% | | | | 1-Month LIBOR | | | | 3.750% | | | | 2/01/26 | | | | B+ | | | | 3,635,583 | |
| | 3,324 | | | Ellucian, Term Loan B, First Lien | | | 4.250% | | | | 3-Month LIBOR | | | | 3.250% | | | | 9/30/22 | | | | B | | | | 3,308,133 | |
| | 4,124 | | | Greeneden U.S. Holdings II LLC, Term Loan B, (DD1) | | | 3.411% | | | | 1-Month LIBOR | | | | 3.250% | | | | 12/01/23 | | | | B2 | | | | 4,070,946 | |
| | 533 | | | Greenway Health, Term Loan, First Lien | | | 4.820% | | | | 6-Month LIBOR | | | | 3.750% | | | | 2/16/24 | | | | B– | | | | 430,570 | |
| | 3,468 | | | Informatica LLC, Term Loan, First Lien | | | 3.411% | | | | 1-Month LIBOR | | | | 3.250% | | | | 2/14/27 | | | | B1 | | | | 3,395,485 | |
50
| | | | | | | | | | | | | | | | | | | | | | | | | | | | |
Principal
Amount (000) | | | Description (1) | | Coupon (2) | | | Reference
Rate (2) | | | Spread (2) | | | Maturity (3) | | | Ratings (4) | | | Value | |
| |
| | | | Software (continued) | |
| | | | | | | |
| $ | 1,465 | | | McAfee Holdings International, Inc., Term Loan, Second Lien | | | 9.500% | | | | 1-Month LIBOR | | | | 8.500% | | | | 9/28/25 | | | | B– | | | $ | 1,492,469 | |
| | 3,522 | | | McAfee LLC, Term Loan B | | | 3.916% | | | | 1-Month LIBOR | | | | 3.750% | | | | 9/29/24 | | | | B | | | | 3,494,104 | |
| | 1,569 | | | Micro Focus International PLC, New Term Loan | | | 2.661% | | | | 1-Month LIBOR | | | | 2.500% | | | | 6/21/24 | | | | BB– | | | | 1,486,045 | |
| | 10,596 | | | Micro Focus International PLC, Term Loan B | | | 2.661% | | | | 1-Month LIBOR | | | | 2.500% | | | | 6/21/24 | | | | BB | | | | 10,035,630 | |
| | 2,193 | | | Micro Focus International PLC, Term Loan B4 | | | 5.250% | | | | 3-Month LIBOR | | | | 4.250% | | | | 6/05/25 | | | | BB | | | | 2,174,885 | |
| | 4,117 | | | Misys, New Term Loan, First Lien | | | 4.500% | | | | 6-Month LIBOR | | | | 3.500% | | | | 6/13/24 | | | | BB– | | | | 3,822,145 | |
| | 499 | | | Mitchell International, Inc., Initial Term Loan, First Lien | | | 3.411% | | | | 1-Month LIBOR | | | | 3.250% | | | | 11/29/24 | | | | B2 | | | | 476,243 | |
| | 667 | | | Mitchell International, Inc., Initial Term Loan, Second Lien | | | 7.411% | | | | 1-Month LIBOR | | | | 7.250% | | | | 11/30/25 | | | | CCC | | | | 604,833 | |
| | 1,687 | | | Perforce Software Inc., Term Loan, First Lien | | | 3.911% | | | | 1-Month LIBOR | | | | 3.750% | | | | 7/01/26 | | | | B– | | | | 1,640,660 | |
| | 288 | | | SkillSoft Corporation, DIP Term Loan, (5) | | | 8.500% | | | | 1-Month LIBOR | | | | 7.500% | | | | 6/15/21 | | | | N/R | | | | 285,963 | |
| | 2,588 | | | SS&C Technologies, Inc./ Sunshine Acquisition II, Inc., New Term Loan B3 | | | 1.911% | | | | 1-Month LIBOR | | | | 1.750% | | | | 4/16/25 | | | | BB+ | | | | 2,516,192 | |
| | 1,818 | | | SS&C Technologies, Inc./ Sunshine Acquisition II, Inc., New Term Loan B4 | | | 1.911% | | | | 1-Month LIBOR | | | | 1.750% | | | | 4/16/25 | | | | BB+ | | | | 1,767,800 | |
| | 935 | | | Thomson Reuters IP & S, Term Loan B | | | 3.161% | | | | 1-Month LIBOR | | | | 3.000% | | | | 10/31/26 | | | | B | | | | 918,348 | |
| | 2,741 | | | TIBCO Software, Inc., Term Loan, First Lien | | | 3.920% | | | | 1-Month LIBOR | | | | 3.750% | | | | 7/03/26 | | | | B+ | | | | 2,654,305 | |
| | 1,308 | | | Ultimate Software, Incremental Term Loan | | | 4.750% | | | | 3-Month LIBOR | | | | 4.000% | | | | 5/03/26 | | | | B1 | | | | 1,311,342 | |
| | 993 | | | Ultimate Software, Term Loan, First Lien | | | 3.911% | | | | 1-Month LIBOR | | | | 3.750% | | | | 5/03/26 | | | | B1 | | | | 984,749 | |
| | 600 | | | Xperi Holding Corp, Term Loan B | | | 4.161% | | | | 1-Month LIBOR | | | | 4.000% | | | | 6/01/25 | | | | BB– | | | | 589,752 | |
| | 58,731 | | | Total Software | | | | | | | | | | | | | | | | | | | | | | | 56,883,305 | |
| |
| | | | Specialty Retail – 2.0% (1.2% of Total Investments) | |
| | | | | | | |
| | 1,052 | | | Academy, Ltd., Term Loan B, (DD1) | | | 5.000% | | | | 1-Month LIBOR | | | | 4.000% | | | | 7/01/22 | | | | CCC+ | | | | 942,631 | |
| | 1,355 | | | Petco Animal Supplies, Inc., Term Loan B1 | | | 4.250% | | | | 3-Month LIBOR | | | | 3.250% | | | | 1/26/23 | | | | B3 | | | | 1,140,030 | |
| | 2,943 | | | Petsmart Inc., Term Loan B | | | 4.000% | | | | 3-Month LIBOR | | | | 3.000% | | | | 3/11/22 | | | | B | | | | 2,912,031 | |
| | 5,662 | | | Petsmart Inc., Term Loan B, First Lien, (DD1) | | | 5.000% | | | | 3-Month LIBOR | | | | 4.000% | | | | 3/11/22 | | | | B | | | | 5,648,015 | |
| | 11,012 | | | Total Specialty Retail | | | | | | | | | | | | | | | | | | | | | | | 10,642,707 | |
| |
| | | | Technology Hardware, Storage & Peripherals – 3.2% (2.0% of Total Investments) | |
| | | | | | | |
| | 12,722 | | | Dell International LLC, Refinancing Term Loan B1 | | | 2.750% | | | | 1-Month LIBOR | | | | 2.000% | | | | 9/19/25 | | | | Baa3 | | | | 12,569,232 | |
| | 794 | | | NCR Corporation, Term Loan B | | | 2.670% | | | | 1-Month LIBOR | | | | 2.500% | | | | 8/28/26 | | | | BB+ | | | | 772,165 | |
| | 1,000 | | | Tech Data Corporation, Asset Based Term Loan | | | 3.667% | | | | 1-Month LIBOR | | | | 3.500% | | | | 7/01/25 | | | | BBB– | | | | 1,001,040 | |
| | 2,917 | | | Western Digital, Term Loan B | | | 1.911% | | | | 1-Month LIBOR | | | | 1.750% | | | | 4/29/23 | | | | BBB– | | | | 2,874,839 | |
| | 17,433 | | | Total Technology Hardware, Storage & Peripherals | | | | | | | | 17,217,276 | |
| |
| | | | Textiles, Apparel & Luxury Goods – 0.1% (0.0% of Total Investments) | |
| | | | | | | |
| | 294 | | | Samsonite Corporation, Incremental Term Loan B2 | | | 5.500% | | | | 1-Month LIBOR | | | | 4.500% | | | | 4/25/25 | | | | BB | | | | 287,936 | |
| |
| | | | Trading Companies & Distributors – 0.2% (0.1% of Total Investments) | |
| | | | | | | |
| | 838 | | | Hayward Industries, Inc., Initial Term Loan, First Lien | | | 3.661% | | | | 1-Month LIBOR | | | | 3.500% | | | | 8/04/24 | | | | B | | | | 818,809 | |
| | 170 | | | HD Supply Waterworks, Ltd., Term Loan B | | | 3.750% | | | | 6-Month LIBOR | | | | 2.750% | | | | 8/01/24 | | | | B | | | | 165,400 | |
| | 109 | | | HD Supply Waterworks, Ltd., Term Loan B | | | 3.750% | | | | 6-Month LIBOR | | | | 2.750% | | | | 8/01/24 | | | | B | | | | 107,286 | |
| | 1,117 | | | Total Trading Companies & Distributors | | | | | | | | | | | | 1,091,495 | |
| |
| | | | Transportation Infrastructure – 0.5% (0.3% of Total Investments) | |
| | | | | | | |
| | 985 | | | Atlantic Aviation FBO Inc., Term Loan | | | 3.911% | | | | 1-Month LIBOR | | | | 3.750% | | | | 12/06/25 | | | | BB– | | | | 937,390 | |
| | 1,850 | | | Hanjin International Corp, Initial Term Loan | | | 2.661% | | | | 1-Month LIBOR | | | | 2.500% | | | | 10/18/20 | | | | B1 | | | | 1,702,000 | |
| | 2,835 | | | Total Transportation Infrastructure | | | | | | | | 2,639,390 | |
| |
| | | | Wireless Telecommunication Services – 1.2% (0.8% of Total Investments) | |
| | | | | | | |
| | 3,567 | | | Asurion LLC, Term Loan B4 | | | 3.161% | | | | 1-Month LIBOR | | | | 3.000% | | | | 8/04/22 | | | | Ba3 | | | | 3,525,719 | |
| | 2,000 | | | T-Mobile USA, Term Loan, First Lien | | | 3.161% | | | | 1-Month LIBOR | | | | 3.000% | | | | 4/01/27 | | | | BBB– | | | | 2,009,620 | |
| | 1,795 | | | Windstream Corporation, Term Loan, (DD1), (5) | | | 6.250% | | | | Prime | | | | 3.000% | | | | 4/24/21 | | | | D | | | | 1,069,820 | |
| | 7,362 | | | Total Wireless Telecommunication Services | | | | | | | | 6,605,159 | |
| $ | 788,103 | | | Total Variable Rate Senior Loan Interests (cost $766,776,894) | | | | | | | | 707,939,560 | |
51
| | |
| |
| JFR | | Nuveen Floating Rate Income Fund (continued) |
| | Portfolio of Investments July 31, 2020 |
| | | | | | | | | | | | | | | | | | | | | | | | | | | | |
Principal
Amount (000) | | | Description (1) | | | | | | | | Coupon | | | Maturity | | | Ratings (4) | | | Value | |
| |
| | | | CORPORATE BONDS – 16.1% (10.0% of Total Investments) | |
| |
| | | | Airlines – 0.1% (0.1% of Total Investments) | |
| | | | | |
| $ | 1,150 | | | American Airlines Group Inc, 144A | | | | 5.000% | | | | 6/01/22 | | | | Caa1 | | | $ | 642,287 | |
| |
| | | | Auto Components – 0.8% (0.5% of Total Investments) | |
| | | | | |
| | 1,895 | | | Adient Global Holdings Ltd, 144A | | | | 4.875% | | | | 8/15/26 | | | | B | | | | 1,767,087 | |
| | 2,025 | | | Adient US LLC, 144A | | | | | | | | | | | 9.000% | | | | 4/15/25 | | | | Ba3 | | | | 2,255,344 | |
| | 3,920 | | | Total Auto Components | | | | | | | | | | | | | | | | | | | | | | | 4,022,431 | |
| |
| | | | Chemicals – 0.2% (0.1% of Total Investments) | |
| | | | | | | |
| | 840 | | | Olin Corp, 144A | | | | | | | | | | | 9.500% | | | | 6/01/25 | | | | BB– | | | | 957,600 | |
| |
| | | | Communications Equipment – 1.4% (0.9% of Total Investments) | |
| | | | | | | |
| | 6,092 | | | Intelsat Jackson Holdings SA, (5) | | | | | | | | | | | 5.500% | | | | 8/01/23 | | | | N/R | | | | 3,815,115 | |
| | 5,675 | | | Intelsat Jackson Holdings SA, 144A, (5) | | | | | | | | 9.750% | | | | 7/15/25 | | | | N/R | | | | 3,773,875 | |
| | 11,767 | | | Total Communications Equipment | | | | | | | | 7,588,990 | |
| |
| | | | Diversified Consumer Services – 0.1% (0.1% of Total Investments) | |
| | | | | | |
| | 650 | | | Kronos Acquisition Holdings Inc, 144A | | | | | | | | 9.000% | | | | 8/15/23 | | | | CCC | | | | 661,375 | |
| |
| | | | Diversified Financial Services – 0.3% (0.2% of Total Investments) | |
| | | | | | | |
| | 1,690 | | | PetSmart Inc, 144A | | | | | | | | | | | 7.125% | | | | 3/15/23 | | | | CCC+ | | | | 1,706,900 | |
| |
| | | | Diversified Telecommunication Services – 0.5% (0.3% of Total Investments) | |
| | | | | |
| | 1,185 | | | Consolidated Communications Inc | | | | 6.500% | | | | 10/01/22 | | | | CCC+ | | | | 1,162,781 | |
| | 1,340 | | | CSC Holdings LLC, 144A | | | | | | | | | | | 10.875% | | | | 10/15/25 | | | | B | | | | 1,436,614 | |
| | 2,525 | | | Total Diversified Telecommunication Services | | | | | | | | 2,599,395 | |
| |
| | | | Electric Utilities – 5.7% (3.5% of Total Investments) | |
| | | | | |
| | 4,250 | | | Bruce Mansfield Unit 1 2007 Pass-Through Trust, (5) | | | | 6.850% | | | | 6/01/34 | | | | N/R | | | | 5,313 | |
| | 1,025 | | | Pacific Gas and Electric Co | | | | | | | | | | | 3.850% | | | | 11/15/23 | | | | BBB– | | | | 1,084,239 | |
| | 638 | | | Pacific Gas and Electric Co | | | | | | | | | | | 3.450% | | | | 7/01/25 | | | | BBB– | | | | 680,158 | |
| | 6,938 | | | Pacific Gas and Electric Co | | | | 3.150% | | | | 1/01/26 | | | | BBB– | | | | 7,283,131 | |
| | 590 | | | Pacific Gas and Electric Co | | | | | | | | | | | 3.300% | | | | 12/01/27 | | | | BBB– | | | | 623,405 | |
| | 638 | | | Pacific Gas and Electric Co | | | | | | | | | | | 3.750% | | | | 7/01/28 | | | | BBB– | | | | 696,194 | |
| | 2,572 | | | Pacific Gas and Electric Co | | | | | | | | | | | 4.550% | | | | 7/01/30 | | | | BBB– | | | | 2,954,287 | |
| | 6,938 | | | Pacific Gas and Electric Co | | | | | | | | 4.500% | | | | 7/01/40 | | | | BBB– | | | | 7,980,955 | |
| | 3,955 | | | Pacific Gas and Electric Co | | | | | | | | | | | 4.750% | | | | 2/15/44 | | | | BBB– | | | | 4,573,598 | |
| | 1,100 | | | Pacific Gas and Electric Co | | | | | | | | | | | 4.250% | | | | 3/15/46 | | | | BBB– | | | | 1,200,248 | |
| | 2,572 | | | Pacific Gas and Electric Co | | | | | | | | | | | 4.950% | | | | 7/01/50 | | | | BBB– | | | | 3,116,024 | |
| | 31,216 | | | Total Electric Utilities | | | | | | | | | | | | | | | | | | | | | | | 30,197,552 | |
| |
| | | | Energy Equipment & Services – 0.2% (0.1% of Total Investments) | |
| | | | | | | |
| | 1,055 | | | Bausch Health Cos Inc, 144A | | | | | | | | | | | 6.125% | | | | 4/15/25 | | | | B | | | | 1,089,288 | |
| |
| | | | Entertainment – 0.5% (0.3% of Total Investments) | |
| | | | | |
| | 2,025 | | | AMC Entertainment Holdings Inc, 144A | | | | 10.500% | | | | 4/15/25 | | | | CCC+ | | | | 1,607,344 | |
| | 2,542 | | | AMC Entertainment Holdings Inc, 144A, (cash 10.000%, PIK 12.000%) | | | | 12.000% | | | | 6/15/26 | | | | N/R | | | | 1,207,212 | |
| | 4,567 | | | Total Entertainment | | | | | | | | | | | | | | | | | | | | | | | 2,814,556 | |
| |
| | | | Equity Real Estate Investment Trust – 0.8% (0.5% of Total Investments) | |
| | | | | |
| | 3,880 | | | Uniti Group LP / Uniti Fiber Holdings Inc / CSL Capital LLC, 144A | | | | 7.875% | | | | 2/15/25 | | | | B | | | | 4,083,700 | |
| |
| | | | Health Care Equipment & Supplies – 0.0% (0.0% of Total Investments) | |
| | | | | |
| | 1,250 | | | Mallinckrodt International Finance SA / Mallinckrodt CB LLC, 144A | | | | 5.625% | | | | 10/15/23 | | | | CC | | | | 200,000 | |
| |
| | | | Health Care Providers & Services – 1.0% (0.6% of Total Investments) | |
| | | | | | | |
| | 1,190 | | | AHP Health Partners Inc, 144A | | | | | | | | | | | 9.750% | | | | 7/15/26 | | | | CCC+ | | | | 1,264,375 | |
| | 1,000 | | | CHS/Community Health Systems Inc, 144A | | | | 9.875% | | | | 6/30/23 | | | | CCC– | | | | 790,000 | |
| | 165 | | | HCA Inc | | | | | | | | | | | 5.375% | | | | 2/01/25 | | | | Ba2 | | | | 186,038 | |
| | 910 | | | Tenet Healthcare Corp | | | | | | | | | | | 8.125% | | | | 4/01/22 | | | | B– | | | | 980,525 | |
| | 415 | | | Tenet Healthcare Corp | | | | | | | | | | | 4.625% | | | | 7/15/24 | | | | BB– | | | | 424,337 | |
52
| | | | | | | | | | | | | | | | | | | | | | | | | | | | |
Principal
Amount (000) | | | Description (1) | | | | | | | | Coupon | | | Maturity | | | Ratings (4) | | | Value | |
| |
| | | | Health Care Providers & Services (continued) | |
| | | | | | | |
| $ | 1,365 | | | Tenet Healthcare Corp, 144A | | | | | | | | | | | 6.250% | | | | 2/01/27 | | | | B1 | | | $ | 1,449,917 | |
| | 5,045 | | | Total Health Care Providers & Services | | | | | | | | | | | | 5,095,192 | |
| |
| | | | Hotels, Restaurants & Leisure – 0.2% (0.2% of Total Investments) | |
| | | | | |
| | 625 | | | 1011778 BC ULC / New Red Finance Inc, 144A | | | | 5.000% | | | | 10/15/25 | | | | B+ | | | | 641,631 | |
| | 575 | | | Carnival Corp, 144A | | | | | | | | | | | 11.500% | | | | 4/01/23 | | | | Baa3 | | | | 625,698 | |
| | 1,200 | | | Total Hotels, Restaurants & Leisure | | | | | | | | | | | | | | | | 1,267,329 | |
| |
| | | | IT Services – 0.2% (0.1% of Total Investments) | |
| | | | | |
| | 1,055 | | | Genesys Telecommunications Laboratories Inc/Greeneden Lux 3 Sarl/Greeneden US Ho, 144A | | | | 10.000% | | | | 11/30/24 | | | | CCC+ | | | | 1,126,212 | |
| |
| | | | Media – 2.1% (1.3% of Total Investments) | |
| | | | | |
| | 240 | | | CCO Holdings LLC / CCO Holdings Capital Corp, 144A | | | | 5.375% | | | | 5/01/25 | | | | BB+ | | | | 247,500 | |
| | 4,000 | | | Houghton Mifflin Harcourt Publishers Inc, 144A | | | | 9.000% | | | | 2/15/25 | | | | BB– | | | | 3,860,000 | |
| | 2,515 | | | iHeartCommunications Inc | | | | | | | | | | | 8.375% | | | | 5/01/27 | | | | CCC+ | | | | 2,497,550 | |
| | 3,080 | | | iHeartCommunications Inc, 144A | | | | 5.250% | | | | 8/15/27 | | | | B+ | | | | 3,110,800 | |
| | 605 | | | Intelsat Luxembourg SA, (5) | | | | | | | | | | | 8.125% | | | | 6/01/23 | | | | N/R | | | | 30,250 | |
| | 1,590 | | | Univision Communications Inc, 144A | | | | | | | | 9.500% | | | | 5/01/25 | | | | B | | | | 1,737,075 | |
| | 12,030 | | | Total Media | | | | | | | | | | | | | | | | | | | | | | | 11,483,175 | |
| |
| | | | Oil, Gas & Consumable Fuels – 1.4% (0.9% of Total Investments) | |
| | | | | | | |
| | 4,200 | | | Citgo Holding Inc, 144A | | | | | | | | | | | 9.250% | | | | 8/01/24 | | | | B+ | | | | 4,200,000 | |
| | 570 | | | CITGO Petroleum Corp, 144A | | | | | | | | | | | 6.250% | | | | 8/15/22 | | | | BB | | | | 572,679 | |
| | 1,480 | | | CITGO Petroleum Corp, 144A | | | | | | | | | | | 7.000% | | | | 6/15/25 | | | | BB | | | | 1,520,700 | |
| | 750 | | | MEG Energy Corp, 144A | | | | | | | | | | | 7.000% | | | | 3/31/24 | | | | B+ | | | | 714,375 | |
| | 1,600 | | | Oasis Petroleum Inc, 144A | | | | | | | | | | | 6.250% | | | | 5/01/26 | | | | Caa1 | | | | 284,000 | |
| | 2,000 | | | Whiting Petroleum Corp, (5) | | | | | | | | | | | 6.625% | | | | 1/15/26 | | | | N/R | | | | 345,000 | |
| | 10,600 | | | Total Oil, Gas & Consumable Fuels | | | | | | | | 7,636,754 | |
| |
| | | | Pharmaceuticals – 0.5% (0.3% of Total Investments) | |
| | | | | | | |
| | 1,165 | | | Advanz Pharma Corp Ltd | | | | | | | | | | | 8.000% | | | | 9/06/24 | | | | B– | | | | 1,118,400 | |
| | 659 | | | Endo Dac / Endo Finance LLC / Endo Finco Inc, 144A | | | | 9.500% | | | | 7/31/27 | | | | CCC+ | | | | 710,072 | |
| | 831 | | | Endo Dac / Endo Finance LLC / Endo Finco Inc, 144A | | | | 6.000% | | | | 6/30/28 | | | | CCC+ | | | | 633,638 | |
| | 329 | | | Par Pharmaceutical Inc, 144A | | | | | | | | | | | 7.500% | | | | 4/01/27 | | | | B+ | | | | 349,934 | |
| | 2,984 | | | Total Pharmaceuticals | | | | | | | | | | | | | | | | | | | | | | | 2,812,044 | |
| |
| | | | Wireless Telecommunication Services – 0.1% (0.0% of Total Investments) | |
| | | | | |
| | 995 | | | Intelsat Connect Finance SA, 144A, (5) | | | | 9.500% | | | | 2/15/23 | | | | N/R | | | | 288,550 | |
| $ | 98,419 | | | Total Corporate Bonds (cost $94,545,460) | | | | | | | | | | | | 86,273,330 | |
| | | | | | | |
| Shares | | | Description (1) | | | | | | | | | | | | | | | | | Value | |
| |
| | | | COMMON STOCKS – 2.0% (1.3% of Total Investments) | |
| |
| | | | Diversified Consumer Services – 0.0% (0.0% of Total Investments) | |
| | | | | |
| | 18,448 | | | Cengage Learning Holdings II Inc, (7), (8) | | | | | | | | | | | | | | | $ | 43,039 | |
| |
| | | | Electric Utilities – 0.4% (0.3% of Total Investments) | |
| | | | | | | |
| | 91,757 | | | Energy Harbor Corp, (7), (8), (10) | | | | | | | | | | | | | | | | | | | | | | | 2,059,945 | |
| |
| | | | Energy Equipment & Services – 0.0% (0.0% of Total Investments) | |
| | | | | | | |
| | 83,230 | | | Transocean Ltd | | | | | | | | | | | | | | | | | | | | | | | 169,789 | |
| | 7,777 | | | Vantage Drilling International, (7) | | | | | | | | 46,017 | |
| | | | Total Energy Equipment & Services | | | | | | | | 215,806 | |
| |
| | | | Health Care Providers & Services – 0.0% (0.0% of Total Investments) | |
| | | | | | | |
| | 68,990 | | | Millennium Health LLC, (8), (9) | | | | | | | | | | | | | | | | | | | | | | | 76,579 | |
| | 64,762 | | | Millennium Health LLC, (8), (9) | | | | | | | | | | | | | | | | | | | | | | | 65,410 | |
| | | | Total Health Care Providers & Services | | | | | | | | | | | | 141,989 | |
53
| | |
| |
| JFR | | Nuveen Floating Rate Income Fund (continued) |
| | Portfolio of Investments July 31, 2020 |
| | | | | | | | | | | | | | | | | | | | | | | | | | | | |
| Shares | | | Description (1) | | | | | | | | | | | | | | | | | Value | |
| |
| | | | Internet & Direct Marketing Retail – 0.0% (0.0% of Total Investments) | |
| | | | | | | |
| | 17,539 | | | Catalina Marketing Corp, (7), (8) | | | | | | | | | | | | | | | | | | | | | | $ | 8,769 | |
| |
| | | | Marine – 0.0% (0.0% of Total Investments) | |
| | | | | | | |
| | 860 | | | ACBL HLDG CORP, (7), (8) | | | | | | | | | | | | | | | | | | | | | | | 36,550 | |
| |
| | | | Media – 1.3% (0.8% of Total Investments) | |
| | | | | |
| | 813,624 | | | Clear Channel Outdoor Holdings Inc, (8) | | | | | | | | | | | | | | | | 745,686 | |
| | 94,923 | | | Cumulus Media Inc, (8) | | | | | | | | | | | | | | | | | | | | | | | 373,047 | |
| | 1,973,746 | | | Hibu plc, (7), (8) | | | | | | | | | | | | | | | | | | | | | | | 138,162 | |
| | 394,504 | | | iHeartMedia Inc, (8) | | | | | | | | | | | | | | | | | | | | | | | 3,298,054 | |
| | 26,045 | | | Metro-Goldwyn-Mayer Inc, (7) | | | | | | | | | | | | | | | | | | | | | | | 1,992,443 | |
| | 45,942 | | | Tribune Co, (9) | | | | | | | | | | | | | | | | | | | | | | | 46 | |
| | | | Total Media | | | | | | | | | | | | | | | | | | | | | | | 6,547,438 | |
| | | | |
| | | | Pharmaceuticals – 0.0% (0.0% of Total Investments) | | | | | | | | | | |
| | | | | | | |
| | 22,895 | | | Advanz Pharma Corp Ltd, (8) | | | | | | | | | | | | | | | | | | | | | | | 75,553 | |
| |
| | | | Software – 0.3% (0.2% of Total Investments) | |
| | | | | | | |
| | 107,413 | | | Avaya Holdings Corp, (8) | | | | | | | | | | | | | | | | | | | | | | | 1,359,849 | |
| | | | Total Common Stocks (cost $30,639,222) | | | | | | | | | | | | 10,488,938 | |
| | | | | | | |
| Shares | | | Description (1), (12) | | | | | | | | | | | | | | | | | Value | |
| |
| | | | INVESTMENT COMPANIES – 1.8% (1.1% of Total Investments) | |
| | | | | |
| | 353,668 | | | Eaton Vance Floating-Rate Income Trust | | | | | | | | | | | | | | | $ | 4,095,476 | |
| | 968,586 | | | Eaton Vance Senior Income Trust | | | | | | | | 5,520,940 | |
| | | | Total Investment Companies (cost $11,981,509) | | | | | | | | | | | | 9,616,416 | |
| | | | | | | |
Principal
Amount (000) | | | Description (1) | | | | | | | | Coupon | | | Maturity | | | Ratings (4) | | | Value | |
| |
| | | | ASSET-BACKED SECURITIES – 0.6% ( 0.4% of Total Investments) | |
| | | | | | | |
| $ | 1,200 | | | Dryden 50 Senior Loan Fund, Series 2017-50A, 144A, (3-Month LIBOR reference rate +6.260% spread), (11) | | | | | | | | | | | 6.535% | | | | 7/15/30 | | | | Ba3 | | | $ | 1,068,648 | |
| | 600 | | | Flatiron CLO 19 Ltd, Series 2019-1A, 144A, (3-Month LIBOR reference rate +7.200% spread), (11) | | | | | | | | | | | 7.480% | | | | 11/16/32 | | | | BB– | | | | 563,421 | |
| | 1,250 | | | Gilbert Park CLO Ltd, Series 2017-1A, 144A, (3-Month LIBOR reference rate +6.400% spread), (11) | | | | | | | | | | | 6.675% | | | | 10/15/30 | | | | Ba3 | | | | 1,128,559 | |
| | 600 | | | Neuberger Berman Loan Advisers CLO 28 Ltd, Series 2018-28A, 144A, (3-Month LIBOR reference rate +5.600% spread), (11) | | | | | | | | 5.872% | | | | 4/20/30 | | | | BB– | | | | 510,660 | |
| $ | 3,650 | | | Total Asset-Backed Securities (cost $3,612,403) | | | | | | | | | | | | | | | | 3,271,288 | |
| | | | | | | |
| Shares | | | Description (1) | | | | | | | | | | | | | | | | | Value | |
| |
| | | | WARRANTS – 0.0% (0.0% of Total Investments) | |
| |
| | | | Communications Equipment – 0.0% (0.0% of Total Investments) | |
| | | | | | | |
| | 21,002 | | | Avaya Holdings Corp, (7) | | | | | | | | | | | | | | | | | | | | | | $ | 12,601 | |
| |
| | | | Marine – 0.0% (0.0% of Total Investments) | |
| | | | | | | |
| | 904 | | | ACBL HLDG CORP, (7) | | | | | | | | | | | | | | | | | | | | | | | 32,544 | |
| | 3,363 | | | ACBL HLDG CORP, (7) | | | | | | | | | | | | | | | | | | | | | | | 84,075 | |
| | 2,558 | | | ACBL HLDG CORP, (7) | | | | | | | | | | | | | | | | | | | | | | | 79,298 | |
| | 6,825 | | | Total Marine | | | | | | | | | | | | | | | | | | | | | | | 195,917 | |
| | | | Total Warrants (cost $2,106,079) | | | | | | | | | | | | | | | | | | | | | | | 208,518 | |
54
| | | | | | | | | | | | | | | | | | | | | | | | | | | | |
| Shares | | | Description (1) | | | | | | | | Coupon | | | | | | Ratings (4) | | | Value | |
| |
| | | | CONVERTIBLE PREFERRED SECURITIES – 0.0% (0.0% of Total Investments) | |
| |
| | | | Marine – 0.0% (0.0% of Total Investments) | |
| | | | | | | |
| $ | 3,200 | | | ACBL HLDG CORP, (7) | | | | | | | | | | | 0.000% | | | | | | | | N/R | | | $ | 80,000 | |
| | 3,642 | | | ACBL HLDG CORP, (7) | | | | | | | | | | | 0.000% | | | | | | | | N/R | | | | 112,902 | |
| | | | Total Marine | | | | | | | | | | | | | | | | | | | | | | | 192,902 | |
| | | | Total Convertible Preferred Securities (cost $194,281) | | | | | | | | | | | | 192,902 | |
| | | | | | | |
| Shares | | | Description (1) | | | | | | | | | | | | | | | | | Value | |
| |
| | | | COMMON STOCK RIGHTS – 0.0% (0.0% of Total Investments) | |
| |
| | | | Oil, Gas & Consumable Fuels – 0.0% (0.0% of Total Investments) | |
| | | | | | | |
| | 13,053 | | | Fieldwood Energy Inc, (7), (8) | | | | | | | | | | | | | | | | | | | | | | $ | 652 | |
| | 2,637 | | | Fieldwood Energy Inc, (7), (8) | | | | | | | | | | | | | | | | | | | | | | | 132 | |
| | | | Total Common Stock Rights (cost $372,582) | | | | | | | | 784 | |
| | | | Total Long-Term Investments (cost $910,228,430) | | | | | | | | 817,991,736 | |
| | | | | | | |
| Shares | | | Description (1) | | | | | | | | Coupon | | | | | | | | | Value | |
| |
| | | | SHORT-TERM INVESTMENTS – 8.4% (5.2% of Total Investments) | |
| |
| | | | INVESTMENT COMPANIES – 8.4% (5.2% of Total Investments) | |
| | | | | |
| | 44,809,031 | | | BlackRock Liquidity Funds T-Fund Portfolio, (12) | | | | 0.065% (13) | | | | | | | | | | | $ | 44,809,031 | |
| | | | Total Short-Term Investments (cost $44,809,031) | | | | | | | | | | | | 44,809,031 | |
| | | | Total Investments (cost $955,037,461) – 161.3% | | | | | | | | | | | | 862,800,767 | |
| | | | Borrowings – (38.9)% (14), (15) | | | | | | | | | | | | (208,100,000 | ) |
| | | | Term Preferred Shares, net of deferred offering costs – (16.7)% (16) | | | | | | | | | | | | (89,337,109 | ) |
| | | | Other Assets Less Liabilities – (5.7)% (17) | | | | | | | | | | | | (30,502,994 | ) |
| | | | Net Assets Applicable to Common Shares – 100% | | | | | | | | | | | $ | 534,860,664 | |
Investment in Derivatives
Interest Rate Swaps – OTC Uncleared
| | | | | | | | | | | | | | | | | | | | | | | | | | | | | | | | |
| Counterparty | | Notional
Amount | | | Fund
Pay/Receive
Floating Rate | | | Floating Rate Index | | | Fixed Rate
(Annualized) | | | Fixed Rate
Payment
Frequency | | | Maturity
Date | | | Value | | | Unrealized
Appreciation
(Depreciation) | |
Morgan Stanley Capital Services LLC | | $ | 55,000,000 | | | | Pay | | | | 1-Month LIBOR | | | | 4.000 | % | | | Monthly | | | | 1/01/27 | (18) | | $ | 712,604 | | | $ | 712,604 | |
Total unrealized appreciation on interest rate swaps | | | | | | | | | | | | | | | | | | | | | | | $ | 712,604 | |
55
| | |
| |
| JFR | | Nuveen Floating Rate Income Fund (continued) |
| | Portfolio of Investments July 31, 2020 |
For Fund portfolio compliance purposes, the Fund’s industry classifications refer to any one or more of the industry sub-classifications used by one or more widely recognized market indexes or ratings group indexes, and/or as defined by Fund management. This definition may not apply for purposes of this report, which may combine industry sub-classifications into sectors for reporting ease.
| (1) | All percentages shown in the Portfolio of Investments are based on net assets applicable to common shares unless otherwise noted. |
| (2) | Senior loans generally pay interest at rates which are periodically adjusted by reference to a base short-term, floating lending rate (Reference Rate) plus an assigned fixed rate (Spread). These floating lending rates are generally (i) the lending rate referenced by the London Inter-Bank Offered Rate (“LIBOR”), or (ii) the prime rate offered by one or more major United States banks. Senior loans may be considered restricted in that the Fund ordinarily is contractually obligated to receive approval from the agent bank and/or borrower prior to the disposition of a senior loan. The rate shown is the coupon as of the end of the reporting period. |
| (3) | Senior loans generally are subject to mandatory and/or optional prepayment. Because of these mandatory prepayment conditions and because there may be significant economic incentives for a borrower to prepay, prepayments of senior loans may occur. As a result, the actual remaining maturity of senior loans held may be substantially less than the stated maturities shown. |
| (4) | For financial reporting purposes, the ratings disclosed are the highest of Standard & Poor’s Group (“Standard & Poor’s”), Moody’s Investors Service, Inc. (“Moody’s”) or Fitch, Inc. (“Fitch”) rating. This treatment of split-rated securities may differ from that used for other purposes, such as for Fund investment policies. Ratings below BBB by Standard & Poor’s, Baa by Moody’s or BBB by Fitch are considered to be below investment grade. Holdings designated N/R are not rated by any of these national rating agencies. Ratings are not covered by the report of independent registered public accounting firm. |
| (5) | Defaulted security. A security whose issuer has failed to fully pay principal and/or interest when due, or is under the protection of bankruptcy. |
| (6) | Investment, or portion of investment, represents an outstanding unfunded senior loan commitment. See Notes to Financial Statements, Note 4 – Portfolio Securities and Investments in Derivatives for more information. |
| (7) | For fair value measurement disclosure purposes, investment classified as Level 2. See Notes to Financial Statements, Note 3 – Investment Valuation and Fair Value Measurements for more information. |
| (8) | Non-income producing; issuer has not declared a dividend within the past twelve months. |
| (9) | Investment valued at fair value using methods determined in good faith by, or at the discretion of, the Board. For fair value measurement disclosure purposes, investment classified as Level 3. See Notes to Financial Statements, Note 3 – Investment Valuation and Fair Value Measurements for more information. |
| (10) | Common Stock received as part of the bankruptcy settlements for Bruce Mansfield Unit 1 2007 Pass-Through Trust. |
| (11) | Variable rate security. The rate shown is the coupon as of the end of the reporting period. |
| (12) | A copy of the most recent financial statements for these investment companies can be obtained directly from the Securities and Exchange Commission on its website at http://www.sec.gov. |
| (13) | The rate shown is the annualized seven-day subsidized yield as of the end of the reporting period. |
| (14) | Borrowings as a percentage of Total Investments is 24.1%. |
| (15) | The Fund segregates 100% of its eligible investments (excluding any investments separately pledged as collateral for specific investments in derivatives, when applicable) in the Portfolio of Investments as collateral for borrowings. |
| (16) | Term Preferred Shares, net of deferred offering costs as a percentage of Total Investments is 10.4%. |
| (17) | Other assets less liabilities includes the unrealized appreciation (depreciation) of certain over-the-counter (“OTC”) derivatives as presented on the Statement of Assets and Liabilities, when applicable. The unrealized appreciation (depreciation) of OTC cleared and exchange-traded derivatives is recognized as part of the cash collateral at brokers and/or the receivable or payable for variation margin as presented on the Statement of Assets and Liabilities, when applicable. |
| (18) | This interest rate swap has an optional early termination date beginning on January 1, 2021 and monthly thereafter through the termination date as specified in the swap contract. |
| 144A | Investment is exempt from registration under Rule 144A of the Securities Act of 1933, as amended. These investments may only be resold in transactions exempt from registration, which are normally those transactions with qualified institutional buyers. |
| DD1 | Portion of investment purchased on a delayed delivery basis. |
| LIBOR | London Inter-Bank Offered Rate |
| PIK | Payment-in-kind (“PIK”) security. Depending on the terms of the security, income may be received in the form of cash, securities, or a combination of both. The PIK rate shown, where applicable, represents the annualized rate of the last PIK payment made by the issuer as of the end of the reporting period. |
| TBD | Senior loan purchased on a when-issued or delayed-delivery basis. Certain details associated with this purchase are not known prior to the settlement date of the transaction. In addition, senior loans typically trade without accrued interest and therefore a coupon rate is not available prior to settlement. At settlement, if still unknown, the borrower or counterparty will provide the Fund with the final coupon rate and maturity date. |
| WI/DD | Purchased on a when-issued or delayed delivery basis. |
See accompanying notes to financial statements.
56
| | |
| JRO | | Nuveen Floating Rate Income
Opportunity Fund Portfolio of Investments July 31, 2020 |
| | | | | | | | | | | | | | | | | | | | | | | | | | | | |
Principal
Amount (000) | | | Description (1) | | Coupon (2) | | | Reference
Rate (2) | | | Spread (2) | | | Maturity (3) | | | Ratings (4) | | | Value | |
| |
| | | | LONG-TERM INVESTMENTS – 151.2% (94.5% of Total Investments) | |
| |
| | | | VARIABLE RATE SENIOR LOAN INTERESTS – 132.6% (82.8% of Total Investments) (2) | |
| |
| | | | Aerospace & Defense – 2.7% (1.7% of Total Investments) | |
| | | | | | | |
| $ | 916 | | | MacDonald, Dettwiler and Associates, Ltd., Term Loan B | | | 2.911% | | | | 1-Month LIBOR | | | | 2.750% | | | | 10/05/24 | | | | B | | | $ | 882,183 | |
| | 4,117 | | | Sequa Corporation, Term Loan B | | | 6.000% | | | | 3-Month LIBOR | | | | 5.000% | | | | 11/28/21 | | | | B– | | | | 3,907,751 | |
| | 1,437 | | | Sequa Corporation, Term Loan, Second Lien | | | 11.250% | | | | Prime | | | | 8.000% | | | | 4/28/22 | | | | CCC– | | | | 1,104,902 | |
| | 988 | | | Standard Aero, Term Loan B1 | | | 3.808% | | | | 3-Month LIBOR | | | | 3.500% | | | | 4/08/26 | | | | B– | | | | 797,541 | |
| | 531 | | | Standard Aero, Term Loan B2 | | | 3.808% | | | | 3-Month LIBOR | | | | 3.500% | | | | 4/08/26 | | | | B– | | | | 428,785 | |
| | 1,680 | | | Transdigm, Inc., Term Loan E | | | 2.411% | | | | 1-Month LIBOR | | | | 2.250% | | | | 5/30/25 | | | | Ba3 | | | | 1,575,141 | |
| | 1,272 | | | Transdigm, Inc., Term Loan F | | | 2.411% | | | | 1-Month LIBOR | | | | 2.250% | | | | 12/09/25 | | | | Ba3 | | | | 1,194,797 | |
| | 391 | | | Transdigm, Inc., Term Loan G | | | 2.411% | | | | 1-Month LIBOR | | | | 2.250% | | | | 8/22/24 | | | | Ba3 | | | | 367,033 | |
| | 11,332 | | | Total Aerospace & Defense | | | | | | | | | | | | | | | | | | | | | | | 10,258,133 | |
| |
| | | | Air Freight & Logistics – 0.6% (0.4% of Total Investments) | |
| | | | | | | |
| | 995 | | | PAE Holding Corporation, Term Loan B | | | 6.500% | | | | 2-Month LIBOR | | | | 5.500% | | | | 10/20/22 | | | | B+ | | | | 990,197 | |
| | 1,444 | | | XPO Logistics, Inc., Term Loan B | | | 2.161% | | | | 1-Month LIBOR | | | | 2.000% | | | | 2/24/25 | | | | BBB– | | | | 1,429,991 | |
| | 2,439 | | | Total Air Freight & Logistics | | | | | | | | | | | | | | | | | | | | | | | 2,420,188 | |
| |
| | | | Airlines – 1.6% (1.0% of Total Investments) | |
| | | | | | | |
| | 1,309 | | | American Airlines, Inc., Term Loan B | | | 2.184% | | | | 1-Month LIBOR | | | | 2.000% | | | | 4/28/23 | | | | Ba3 | | | | 1,002,342 | |
| | 949 | | | American Airlines, Inc., Term Loan B | | | 1.916% | | | | 1-Month LIBOR | | | | 1.750% | | | | 1/29/27 | | | | Ba3 | | | | 669,001 | |
| | 4,192 | | | American Airlines, Inc., Term Loan B | | | 2.175% | | | | 1-Month LIBOR | | | | 2.000% | | | | 12/14/23 | | | | Ba3 | | | | 3,193,298 | |
| | 428 | | | Delta Air Lines, Inc., Term Loan B | | | 5.750% | | | | 3-Month LIBOR | | | | 4.750% | | | | 4/29/23 | | | | Baa2 | | | | 422,517 | |
| | 1,148 | | | WestJet Airlines, Term Loan, (DD1) | | | 4.000% | | | | 6-Month LIBOR | | | | 3.000% | | | | 12/11/26 | | | | BB+ | | | | 856,282 | |
| | 8,026 | | | Total Airlines | | | | | | | | | | | | | | | | | | | | | | | 6,143,440 | |
| |
| | | | Auto Components – 1.8% (1.1% of Total Investments) | |
| | | | | | | |
| | 748 | | | Adient Global Holdings, Initial Term Loan, (WI/DD) | | | TBD | | | | TBD | | | | TBD | | | | TBD | | | | Ba3 | | | | 739,852 | |
| | 1,112 | | | DexKo Global, Inc., Term Loan B | | | 4.500% | | | | 1-Month LIBOR | | | | 3.500% | | | | 7/24/24 | | | | B1 | | | | 1,065,174 | |
| | 2,382 | | | Johnson Controls Inc., Term Loan B | | | 3.667% | | | | 1-Month LIBOR | | | | 3.500% | | | | 4/30/26 | | | | B1 | | | | 2,332,371 | |
| | 1,347 | | | Superior Industries International, Inc., Term Loan B | | | 4.161% | | | | 1-Month LIBOR | | | | 4.000% | | | | 5/23/24 | | | | B1 | | | | 1,239,444 | |
| | 1,380 | | | Trico Group, LLC, Initial Term Loan, First Lien | | | 8.000% | | | | 3-Month LIBOR | | | | 7.000% | | | | 2/02/24 | | | | B | | | | 1,317,795 | |
| | 6,969 | | | Total Auto Components | | | | | | | | | | | | | | | | | | | | | | | 6,694,636 | |
| |
| | | | Automobiles – 0.5% (0.3% of Total Investments) | |
| | | | | | | |
| | 562 | | | Caliber Collision, Term Loan B | | | 4.072% | | | | 3-Month LIBOR | | | | 3.000% | | | | 2/05/26 | | | | B1 | | | | 539,093 | |
| | 223 | | | Caliber Collision, Term Loan B | | | 4.072% | | | | 6-Month LIBOR | | | | 3.000% | | | | 2/05/26 | | | | B1 | | | | 214,466 | |
| | 975 | | | Navistar, Inc., Term Loan B | | | 3.690% | | | | 1-Month LIBOR | | | | 3.500% | | | | 11/06/24 | | | | Ba2 | | | | 947,778 | |
| | 1,760 | | | Total Automobiles | | | | | | | | | | | | | | | | | | | | | | | 1,701,337 | |
| |
| | | | Beverages – 0.6% (0.4% of Total Investments) | |
| | | | | | | |
| | 2,216 | | | Jacobs Douwe Egberts, Term Loan B | | | 2.188% | | | | 1-Month LIBOR | | | | 2.000% | | | | 11/01/25 | | | | BB+ | | | | 2,186,316 | |
| |
| | | | Biotechnology – 0.7% (0.4% of Total Investments) | |
| | | | | | | |
| | 2,690 | | | Grifols, Inc., Term Loan B, First Lien | | | 2.111% | | | | 1-Week LIBOR | | | | 2.000% | | | | 11/15/27 | | | | Ba2 | | | | 2,638,118 | |
| |
| | | | Building Products – 1.6% (1.0% of Total Investments) | |
| | | | | | | |
| | 639 | | | Ply Gem Industries, Inc., Term Loan B | | | 3.928% | | | | 1-Month LIBOR | | | | 3.750% | | | | 4/12/25 | | | | B+ | | | | 629,546 | |
| | 5,608 | | | Quikrete Holdings, Inc., Term Loan B | | | 2.661% | | | | 1-Month LIBOR | | | | 2.500% | | | | 2/01/27 | | | | BB– | | | | 5,431,818 | |
| | 6,247 | | | Total Building Products | | | | | | | | | | | | | | | | | | | | | | | 6,061,364 | |
| |
| | | | Capital Markets – 1.3% (0.8% of Total Investments) | |
| | | | | | | |
| | 895 | | | Advisor Group Holdings, Inc., Initial Term Loan B | | | 5.161% | | | | 1-Month LIBOR | | | | 5.000% | | | | 8/01/26 | | | | B2 | | | | 849,955 | |
| | 1,970 | | | Distributed Power, Term Loan B | | | 4.209% | | | | 6-Month LIBOR | | | | 3.000% | | | | 11/06/25 | | | | B | | | | 1,782,850 | |
| | 1,846 | | | RPI Finance Trust, Term Loan B1 | | | 1.911% | | | | 1-Month LIBOR | | | | 1.750% | | | | 2/11/27 | | | | BBB– | | | | 1,830,398 | |
57
| | |
| |
| JRO | | Nuveen Floating Rate Income Opportunity Fund (continued) |
| | Portfolio of Investments July 31, 2020 |
| | | | | | | | | | | | | | | | | | | | | | | | | | | | |
Principal
Amount (000) | | | Description (1) | | Coupon (2) | | | Reference
Rate (2) | | | Spread (2) | | | Maturity (3) | | | Ratings (4) | | | Value | |
| |
| | | | Capital Markets (continued) | |
| | | | | | | |
| $ | 558 | | | RPI Finance Trust, Term Loan B1 | | | 1.911% | | | | 1-Month LIBOR | | | | 1.750% | | | | 2/11/27 | | | | BBB– | | | $ | 550,568 | |
| | 5,269 | | | Total Capital Markets | | | | | | | | | | | | | | | | | | | | | | | 5,013,771 | |
| |
| | | | Chemicals – 0.6% (0.4% of Total Investments) | |
| | | | | | | |
| | 875 | | | Ineos US Finance LLC, Term Loan | | | 2.214% | | | | 2-Month LIBOR | | | | 2.000% | | | | 3/31/24 | | | | BBB– | | | | 844,476 | |
| | 750 | | | Lummus Technology, Term Loan | | | 4.308% | | | | 3-Month LIBOR | | | | 4.000% | | | | 6/30/27 | | | | B+ | | | | 743,438 | |
| | 850 | | | PQ Corporation, Incremental Term Loan B, (WI/DD) | | | TBD | | | | TBD | | | | TBD | | | | TBD | | | | BB– | | | | 847,433 | |
| | 2,475 | | | Total Chemicals | | | | | | | | | | | | | | | | | | | | | | | 2,435,347 | |
| |
| | | | Commercial Services & Supplies – 4.5% (2.8% of Total Investments) | |
| | | | | | | |
| | 1,382 | | | ADS Waste Holdings, Inc., Term Loan B | | | 3.000% | | | | 1-Week LIBOR | | | | 2.250% | | | | 11/10/23 | | | | BB+ | | | | 1,376,838 | |
| | 699 | | | Brand Energy & Infrastructure Services, Inc., Term Loan B, First Lien, (DD1) | | | 5.250% | | | | 3-Month LIBOR | | | | 4.250% | | | | 6/21/24 | | | | B– | | | | 640,579 | |
| | 217 | | | Education Management LLC, Term Loan A, (5) | | | 0.000% | | | | N/A | | | | N/A | | | | 7/02/20 | | | | N/R | | | | 2,172 | |
| | 6,696 | | | Formula One Group, Term Loan B | | | 3.500% | | | | 1-Month LIBOR | | | | 2.500% | | | | 2/01/24 | | | | B+ | | | | 6,503,232 | |
| | 1,000 | | | Fort Dearborn Holding Company, Inc., Term Loan, Second Lien | | | 9.516% | | | | 3-Month LIBOR | | | | 8.500% | | | | 10/21/24 | | | | CCC | | | | 917,500 | |
| | 721 | | | Garda World Security Corp, Term Loan B, First Lien | | | 4.930% | | | | 1-Month LIBOR | | | | 4.750% | | | | | | | | B1 | | | | 716,459 | |
| | 3,188 | | | GFL Environmental, Term Loan | | | 4.000% | | | | 3-Month LIBOR | | | | 3.000% | | | | 5/31/25 | | | | BB– | | | | 3,178,062 | |
| | 558 | | | Harland Clarke Holdings Corporation, Term Loan B7 | | | 5.750% | | | | 3-Month LIBOR | | | | 4.750% | | | | 11/03/23 | | | | CCC+ | | | | 395,905 | |
| | 1,313 | | | iQor US, Inc., Term Loan, First Lien, (5) | | | 0.000% | | | | N/A | | | | N/A | | | | 4/01/21 | | | | CC | | | | 925,991 | |
| | 333 | | | iQor US, Inc., Term Loan, Second Lien, (5) | | | 0.000% | | | | N/A | | | | N/A | | | | 4/01/22 | | | | C | | | | 82,140 | |
| | 348 | | | KAR Auction Services, Inc., Term Loan B6 | | | 2.438% | | | | 1-Month LIBOR | | | | 2.250% | | | | 9/19/26 | | | | Ba3 | | | | 336,283 | |
| | 199 | | | Pitney Bowes Inc., Term Loan B | | | 5.661% | | | | 1-Month LIBOR | | | | 5.500% | | | | 1/07/25 | | | | BBB– | | | | 186,582 | |
| | 3 | | | Robertshaw US Holding Corp., Initial Term Loan, First Lien | | | 4.250% | | | | 1-Month LIBOR | | | | 3.250% | | | | 2/28/25 | | | | B3 | | | | 2,542 | |
| | 1,173 | | | Robertshaw US Holding Corp., Initial Term Loan, First Lien | | | 4.250% | | | | 6-Month LIBOR | | | | 3.250% | | | | 2/28/25 | | | | B3 | | | | 991,382 | |
| | 209 | | | Sabert Corporation, Initial Term Loan | | | 5.500% | | | | 1-Month LIBOR | | | | 4.500% | | | | 12/10/26 | | | | B | | | | 207,818 | |
| | 680 | | | West Corporation, Incremental Term Loan B1 | | | 4.500% | | | | 3-Month LIBOR | | | | 3.500% | | | | 10/10/24 | | | | BB+ | | | | 594,843 | |
| | 18,719 | | | Total Commercial Services & Supplies | | | | | | | | | | | | | | | | | | | | | | | 17,058,328 | |
| |
| | | | Communications Equipment – 3.9% (2.4% of Total Investments) | |
| | | | | | | |
| | 5,483 | | | Avaya, Inc., Term Loan B | | | 4.425% | | | | 1-Month LIBOR | | | | 4.250% | | | | 12/15/24 | | | | BB– | | | | 5,200,593 | |
| | 4,412 | | | CommScope, Inc., Term Loan B | | | 3.411% | | | | 1-Month LIBOR | | | | 3.250% | | | | 4/04/26 | | | | Ba3 | | | | 4,333,843 | |
| | 881 | | | Mitel US Holdings, Inc., Term Loan, First Lien | | | 4.666% | | | | 1-Month LIBOR | | | | 4.500% | | | | 11/30/25 | | | | B– | | | | 727,959 | |
| | 1,607 | | | Plantronics, Term Loan B, (DD1) | | | 2.861% | | | | 6-Month LIBOR | | | | 2.500% | | | | 7/02/25 | | | | Ba2 | | | | 1,491,117 | |
| | 1,297 | | | Riverbed Technology, Inc., Term Loan B, First Lien, (DD1) | | | 3.511% | | | | 3-Month LIBOR | | | | 3.250% | | | | 4/24/22 | | | | B2 | | | | 1,184,211 | |
| | 1,897 | | | Univision Communications, Inc., Term Loan C5 | | | 3.750% | | | | 1-Month LIBOR | | | | 2.750% | | | | 3/15/24 | | | | B | | | | 1,825,140 | |
| | 15,577 | | | Total Communications Equipment | | | | | | | | | | | | | | | | | | | | | | | 14,762,863 | |
| |
| | | | Construction & Engineering – 0.4% (0.3% of Total Investments) | |
| | | | | | | |
| | 1,729 | | | Traverse Midstream Partners, Term Loan B | | | 5.000% | | | | 1-Month LIBOR | | | | 4.000% | | | | 9/27/24 | | | | B | | | | 1,520,298 | |
| |
| | | | Consumer Finance – 0.6% (0.4% of Total Investments) | |
| | | | | | | |
| | 2,190 | | | Verscend Technologies, Tern Loan B | | | 4.661% | | | | 1-Month LIBOR | | | | 4.500% | | | | 8/27/25 | | | | B+ | | | | 2,186,578 | |
| |
| | | | Containers & Packaging – 0.9% (0.5% of Total Investments) | |
| | | | | | | |
| | 498 | | | Berry Global, Inc., Term Loan W | | | 2.188% | | | | 1-Month LIBOR | | | | 2.000% | | | | 10/01/22 | | | | BBB– | | | | 490,328 | |
| | 1,980 | | | Berry Global, Inc., Term Loan Y | | | 2.188% | | | | 1-Month LIBOR | | | | 2.000% | | | | 7/01/26 | | | | BBB– | | | | 1,925,243 | |
| | 409 | | | Kloeckner Pentaplast of America Inc., Dollar Term Loan | | | 5.250% | | | | 6-Month LIBOR | | | | 4.250% | | | | 6/30/22 | | | | B– | | | | 390,516 | |
| | 500 | | | Reynolds Group Holdings, Inc., Term Loan, First Lien | | | 1.911% | | | | 1-Month LIBOR | | | | 1.750% | | | | 2/04/27 | | | | BB+ | | | | 491,978 | |
| | 3,387 | | | Total Containers & Packaging | | | | | | | | | | | | | | | | | | | | | | | 3,298,065 | |
| |
| | | | Distributors – 0.3% (0.2% of Total Investments) | |
| | | | | | | |
| | 262 | | | Insurance Auto Actions Inc., Term Loan | | | 2.438% | | | | 1-Month LIBOR | | | | 2.250% | | | | 6/28/26 | | | | BB+ | | | | 257,920 | |
| | 955 | | | SRS Distribution, Inc., Term Loan B | | | 4.072% | | | | 3-Month LIBOR | | | | 3.000% | | | | 5/24/25 | | | | B | | | | 926,482 | |
| | 1,217 | | | Total Distributors | | | | | | | | | | | | | | | | | | | | | | | 1,184,402 | |
58
| | | | | | | | | | | | | | | | | | | | | | | | | | | | |
Principal
Amount (000) | | | Description (1) | | Coupon (2) | | | Reference
Rate (2) | | | Spread (2) | | | Maturity (3) | | | Ratings (4) | | | Value | |
| |
| | | | Diversified Consumer Services – 1.6% (1.0% of Total Investments) | |
| | | | | | | |
| $ | 3,607 | | | Cengage Learning Acquisitions, Inc., Term Loan B | | | 5.250% | | | | 6-Month LIBOR | | | | 4.250% | | | | 6/07/23 | | | | B | | | $ | 2,960,062 | |
| | 148 | | | Education Management LLC, Elevated Term Loan A1, (5) | | | 0.000% | | | | N/A | | | | N/A | | | | 7/02/20 | | | | N/R | | | | 1,849 | |
| | 4 | | | Education Management LLC, Elevated Term Loan A2, (5) | | | 5.808% | | | | 3-Month LIBOR | | | | 5.500% | | | | 7/02/20 | | | | N/R | | | | — | |
| | 3,193 | | | Refinitiv, Term Loan B | | | 3.411% | | | | 1-Month LIBOR | | | | 3.250% | | | | 10/01/25 | | | | BB+ | | | | 3,172,982 | |
| | 6,952 | | | Total Diversified Consumer Services | | | | | | | | | | | | | | | | | | | | | | | 6,134,893 | |
| |
| | | | Diversified Financial Services – 1.4% (0.9% of Total Investments) | |
| | | | | | | |
| | 1,485 | | | Blackstone CQP, Term Loan | | | 3.806% | | | | 3-Month LIBOR | | | | 3.500% | | | | 9/30/24 | | | | B+ | | | | 1,449,731 | |
| | 1,969 | | | Ditech Holding Corporation., Term Loan B, First Lien, (5) | | | 0.000% | | | | N/A | | | | N/A | | | | 6/30/22 | | | | D | | | | 462,744 | |
| | 2,182 | | | Inmarsat Finance, Term Loan, First Lien | | | 5.500% | | | | 1-Month LIBOR | | | | 4.500% | | | | 12/12/26 | | | | B+ | | | | 2,132,030 | |
| | 504 | | | Lions Gate Entertainment Corp., Term Loan B | | | 2.411% | | | | 1-Month LIBOR | | | | 2.250% | | | | 3/24/25 | | | | Ba2 | | | | 485,948 | |
| | 926 | | | Sotheby’s, Term Loan B | | | 6.500% | | | | 1-Month LIBOR | | | | 5.500% | | | | 1/15/27 | | | | B+ | | | | 886,711 | |
| | 7,066 | | | Total Diversified Financial Services | | | | | | | | | | | | | | | | | | | | | | | 5,417,164 | |
| |
| | | | Diversified Telecommunication Services – 5.2% (3.3% of Total Investments) | |
| | | | | | | |
| | 695 | | | Altice France S.A., Term Loan B12 | | | 3.862% | | | | 1-Month LIBOR | | | | 3.688% | | | | 1/31/26 | | | | B | | | | 681,364 | |
| | 6,242 | | | CenturyLink, Inc, Term Loan B | | | 2.411% | | | | 1-Month LIBOR | | | | 2.250% | | | | 3/15/27 | | | | BB+ | | | | 6,027,358 | |
| | 550 | | | Consolidated Communications Holdings, Initial Term Loan, (WI/DD) | | | TBD | | | | TBD | | | | TBD | | | | TBD | | | | B+ | | | | 534,988 | |
| | 7,303 | | | Frontier Communications Corporation, Term Loan B, (DD1), (5) | | | 3.911% | | | | 1-Month LIBOR | | | | 3.750% | | | | 6/15/24 | | | | N/R | | | | 7,212,043 | |
| | 383 | | | Intelsat Jackson Holdings, S.A., Term Loan B4, (5) | | | 8.750% | | | | Prime | | | | 5.500% | | | | 1/02/24 | | | | B | | | | 387,366 | |
| | 614 | | | Intelsat Jackson Holdings, S.A., Term Loan B5, (5) | | | 8.625% | | | | N/A | | | | N/A | | | | 1/02/24 | | | | B | | | | 620,685 | |
| | 3,834 | | | Numericable Group S.A., Term Loan B13 | | | 4.175% | | | | 1-Month LIBOR | | | | 4.000% | | | | 8/14/26 | | | | B | | | | 3,763,361 | |
| | 419 | | | Zayo Group LLC, Initial Dollar Term Loan | | | 3.161% | | | | 1-Month LIBOR | | | | 3.000% | | | | 3/09/27 | | | | B1 | | | | 408,051 | |
| | 20,040 | | | Total Diversified Telecommunication Services | | | | | | | | | | | | | | | | | | | | | | | 19,635,216 | |
| |
| | | | Electric Utilities – 0.7% (0.4% of Total Investments) | |
| | | | | | | |
| | 861 | | | ExGen Renewables, Term Loan | | | 4.000% | | | | 3-Month LIBOR | | | | 3.000% | | | | 11/28/24 | | | | BB– | | | | 854,252 | |
| | 750 | | | Pacific Gas & Electric, Term Loan, First Lien | | | 5.500% | | | | 3-Month LIBOR | | | | 4.500% | | | | 6/23/25 | | | | BB | | | | 743,438 | |
| | 904 | | | Vistra Operations Co., Term Loan B3 | | | 1.911% | | | | 1-Month LIBOR | | | | 1.750% | | | | 12/31/25 | | | | Baa3 | | | | 891,659 | |
| | 2,515 | | | Total Electric Utilities | | | | | | | | | | | | | | | | | | | | | | | 2,489,349 | |
| |
| | | | Electrical Equipment – 1.1% (0.7% of Total Investments) | |
| | | | | | | |
| | 3,300 | | | Avolon LLC, Term Loan B4 | | | 2.250% | | | | 1-Month LIBOR | | | | 1.500% | | | | 2/10/27 | | | | Baa2 | | | | 3,096,196 | |
| | 998 | | | Vertiv Co.,Term Loan B | | | 3.162% | | | | 1-Month LIBOR | | | | 3.000% | | | | 3/02/27 | | | | B+ | | | | 977,550 | |
| | 4,298 | | | Total Electrical Equipment | | | | | | | | | | | | | | | | | | | | | | | 4,073,746 | |
| |
| | | | Electronic Equipment, Instruments & Components – 0.3% (0.2% of Total Investments) | |
| | | | | | | |
| | 1,322 | | | TTM Technologies, Inc., Term Loan B | | | 2.671% | | | | 1-Month LIBOR | | | | 2.500% | | | | 9/28/24 | | | | BB+ | | | | 1,303,864 | |
| |
| | | | Energy Equipment & Services – 0.1% (0.1% of Total Investments) | |
| | | | | | | |
| | 649 | | | Petroleum GEO-Services ASA/PGS Finance, Inc., Term Loan B | | | 7.750% | | | | 3-Month LIBOR | | | | 7.000% | | | | 6/13/24 | | | | Caa1 | | | | 408,228 | |
| |
| | | | Entertainment – 0.5% (0.3% of Total Investments) | |
| | | | | | | |
| | 1,502 | | | AMC Entertainment, Inc., Term Loan B | | | 4.080% | | | | 6-Month LIBOR | | | | 3.000% | | | | 4/22/26 | | | | CCC+ | | | | 995,519 | |
| | 804 | | | Springer SBM Two GmbH, Term Loan B16 | | | 4.500% | | | | 1-Month LIBOR | | | | 3.500% | | | | 8/14/24 | | | | B2 | | | | 795,242 | |
| | 2,306 | | | Total Entertainment | | | | | | | | | | | | | | | | | | | | | | | 1,790,761 | |
| |
| | | | Equity Real Estate Investment Trust – 0.9% (0.5% of Total Investments) | |
| | | | | | | |
| | 2,210 | | | Realogy Group LLC, Term Loan A, (DD1) | | | 2.437% | | | | 1-Month LIBOR | | | | 2.250% | | | | 2/08/23 | | | | BB– | | | | 2,078,240 | |
| | 1,235 | | | Realogy Group LLC, Term Loan B | | | 3.000% | | | | 1-Month LIBOR | | | | 2.250% | | | | 2/08/25 | | | | BB– | | | | 1,173,371 | |
| | 3,445 | | | Total Equity Real Estate Investment Trust | | | | | | | | | | | | | | | | | | | | | | | 3,251,611 | |
| |
| | | | Food & Staples Retailing – 2.8% (1.8% of Total Investments) | |
| | | | | | | |
| | 743 | | | Aramark Corporation, Term Loan | | | 1.911% | | | | 1-Month LIBOR | | | | 1.750% | | | | 3/11/25 | | | | BBB– | | | | 710,327 | |
| | 1,219 | | | BellRing Brands, Term Loan, First Lien | | | 6.000% | | | | 1-Month LIBOR | | | | 5.000% | | | | 10/21/24 | | | | B+ | | | | 1,226,940 | |
| | 776 | | | BJ’s Wholesale Club, Inc., Term Loan, First Lien | | | 2.178% | | | | 1-Month LIBOR | | | | 2.000% | | | | 2/03/24 | | �� | | BB | | | | 767,984 | |
59
| | |
| |
| JRO | | Nuveen Floating Rate Income Opportunity Fund (continued) |
| | Portfolio of Investments July 31, 2020 |
| | | | | | | | | | | | | | | | | | | | | | | | | | | | |
Principal
Amount (000) | | | Description (1) | | Coupon (2) | | | Reference
Rate (2) | | | Spread (2) | | | Maturity (3) | | | Ratings (4) | | | Value | |
| |
| | | | Food & Staples Retailing (continued) | |
| | | | | | | |
| $ | 773 | | | Hearthside Group Holdings LLC, Term Loan B | | | 3.849% | | | | 1-Month LIBOR | | | | 3.688% | | | | 5/31/25 | | | | B2 | | | $ | 748,331 | |
| | 45 | | | Hearthside Group Holdings, LLC, Incremental Term Loan B3 | | | 6.000% | | | | 1-Month LIBOR | | | | 5.000% | | | | 5/31/25 | | | | B2 | | | | 44,566 | |
| | 7,465 | | | US Foods, Inc., New Term Loan | | | 1.911% | | | | 1-Month LIBOR | | | | 1.750% | | | | 6/27/23 | | | | BB | | | | 7,101,136 | |
| | 11,021 | | | Total Food & Staples Retailing | | | | | | | | | | | | | | | | | | | | | | | 10,599,284 | |
| |
| | | | Food Products – 0.4% (0.3% of Total Investments) | |
| | | | | | | |
| | 891 | | | American Seafoods Group LLC, Term Loan B | | | 3.750% | | | | 3-Month LIBOR | | | | 2.750% | | | | 8/21/23 | | | | BB– | | | | 878,063 | |
| | 780 | | | Froneri Lux FinCo SARL, Term Loan, First Lien | | | 2.411% | | | | 1-Month LIBOR | | | | 2.250% | | | | 1/31/27 | | | | B1 | | | | 750,332 | |
| | 1,671 | | | Total Food Products | | | | | | | | | | | | | | | | | | | | | | | 1,628,395 | |
| |
| | | | Health Care Equipment & Supplies – 1.0% (0.6% of Total Investments) | |
| | | | | | | |
| | 817 | | | Greatbatch Ltd., New Term Loan B | | | 3.500% | | | | 1-Month LIBOR | | | | 2.500% | | | | 10/27/22 | | | | B+ | | | | 810,492 | |
| | 1,030 | | | LifeScan, Term Loan B | | | 7.175% | | | | 3-Month LIBOR | | | | 6.000% | | | | 10/01/24 | | | | B | | | | 946,187 | |
| | 1,399 | | | MedPlast, Term Loan, First Lien | | | 3.911% | | | | 1-Month LIBOR | | | | 3.750% | | | | 7/02/25 | | | | B3 | | | | 1,221,864 | |
| | 1,071 | | | Vyaire Medical, Inc., Term Loan B | | | 5.750% | | | | 3-Month LIBOR | | | | 4.750% | | | | 4/30/25 | | | | B3 | | | | 895,206 | |
| | 4,317 | | | Total Health Care Equipment & Supplies | | | | | | | | | | | | | | | | 3,873,749 | |
| |
| | | | Health Care Providers & Services – 9.0% (5.6% of Total Investments) | |
| | | | | | | |
| | 3,069 | | | Air Medical Group Holdings, Inc., Term Loan B | | | 4.250% | | | | 6-Month LIBOR | | | | 3.250% | | | | 4/28/22 | | | | B1 | | | | 3,038,070 | |
| | 595 | | | Air Methods, Term Loan, First Lien | | | 4.500% | | | | 3-Month LIBOR | | | | 3.500% | | | | 4/21/24 | | | | B | | | | 479,415 | |
| | 2 | | | Albany Molecular Research, Inc., Initial Term Loan, First Lien | | | 4.250% | | | | 2-Month LIBOR | | | | 3.250% | | | | 8/31/24 | | | | B2 | | | | 1,694 | |
| | 666 | | | Albany Molecular Research, Inc., Initial Term Loan, First Lien | | | 4.250% | | | | 3-Month LIBOR | | | | 3.250% | | | | 8/31/24 | | | | B2 | | | | 657,232 | |
| | 1,444 | | | Ardent Health, Term Loan, First Lien | | | 5.500% | | | | 1-Month LIBOR | | | | 4.500% | | | | 6/28/25 | | | | B1 | | | | 1,437,188 | |
| | 1,786 | | | Brightspring Health, Term Loan B | | | 3.425% | | | | 1-Month LIBOR | | | | 3.250% | | | | 3/05/26 | | | | B1 | | | | 1,752,250 | |
| | 988 | | | Catalent Pharma Solutions, Inc., Dollar Term Loan B2 | | | 3.250% | | | | 1-Month LIBOR | | | | 2.250% | | | | 5/17/26 | | | | BB+ | | | | 984,621 | |
| | 877 | | | Civitas Solutions, Term Loan B | | | 4.420% | | | | 1-Month LIBOR | | | | 4.250% | | | | 3/08/26 | | | | B | | | | 861,115 | |
| | 40 | | | Civitas Solutions, Term Loan C | | | 4.420% | | | | 1-Month LIBOR | | | | 4.250% | | | | 3/08/26 | | | | B | | | | 39,208 | |
| | 510 | | | DaVita, Inc., Term Loan B | | | 1.911% | | | | 1-Month LIBOR | | | | 1.750% | | | | 8/12/26 | | | | BBB– | | | | 501,327 | |
| | 3,856 | | | Envision Healthcare Corporation, Initial Term Loan | | | 3.911% | | | | 1-Month LIBOR | | | | 3.750% | | | | 10/10/25 | | | | Caa1 | | | | 2,566,291 | |
| | 379 | | | HCA, Inc., Term Loan B12 | | | 1.911% | | | | 1-Month LIBOR | | | | 1.750% | | | | 3/13/25 | | | | BBB– | | | | 374,249 | |
| | 603 | | | HCA, Inc., Term Loan B13 | | | 1.911% | | | | 1-Month LIBOR | | | | 1.750% | | | | 3/18/26 | | | | BBB– | | | | 596,159 | |
| | 596 | | | Heartland Dental Care, Inc., Term Loan, First Lien | | | 3.661% | | | | 1-Month LIBOR | | | | 3.500% | | | | 4/30/25 | | | | B3 | | | | 531,041 | |
| | 731 | | | InnovaCare, Initial Term Loan | | | 6.750% | | | | 3-Month LIBOR | | | | 5.750% | | | | 11/06/26 | | | | B+ | | | | 714,797 | |
| | 709 | | | Jordan Health, Initial Term Loan, First Lien | | | 5.386% | | | | 3-Month LIBOR | | | | 5.000% | | | | 5/15/25 | | | | Caa1 | | | | 585,231 | |
| | 2,929 | | | Kindred at Home Hospice, Term Loan B, First Lien | | | 3.438% | | | | 1-Month LIBOR | | | | 3.250% | | | | 7/02/25 | | | | B1 | | | | 2,894,627 | |
| | 4,075 | | | Lifepoint Health, Inc., New Term Loan B | | | 3.911% | | | | 1-Month LIBOR | | | | 3.750% | | | | 11/16/25 | | | | B1 | | | | 3,995,153 | |
| | 43 | | | MyEyeDr, Delayed Draw Term Loan | | | 4.613% | | | | 3-Month LIBOR | | | | 4.250% | | | | 8/31/26 | | | | B– | | | | 39,593 | |
| | 266 | | | MyEyeDr, Term Loan, (6) | | | 4.613% | | | | 3-Month LIBOR | | | | 4.250% | | | | 8/31/26 | | | | B– | | | | 242,614 | |
| | 5,404 | | | Pharmaceutical Product Development, Inc., Term Loan B | | | 3.500% | | | | 1-Month LIBOR | | | | 2.500% | | | | 8/18/22 | | | | Ba2 | | | | 5,390,831 | |
| | 179 | | | Quorum Health Corp, Term Loan, (5) | | | 9.250% | | | | 3-Month LIBOR | | | | 8.250% | | | | 4/29/22 | | | | N/R | | | | 165,986 | |
| | 2,716 | | | Select Medical Corporation, Term Loan B | | | 2.680% | | | | 1-Month LIBOR | | | | 2.500% | | | | 3/06/25 | | | | Ba2 | | | | 2,649,675 | |
| | 1,958 | | | Surgery Center Holdings Inc., Initial Term Loan, (DD1) | | | 4.250% | | | | 1-Month LIBOR | | | | 3.250% | | | | 9/03/24 | | | | B2 | | | | 1,856,544 | |
| | 2,140 | | | Team Health, Inc., Initial Term Loan | | | 3.750% | | | | 1-Month LIBOR | | | | 2.750% | | | | 2/06/24 | | | | B+ | | | | 1,707,582 | |
| | 36,561 | | | Total Health Care Providers & Services | | | | | | | | | | | | | | | | | | | | 34,062,493 | |
| |
| | | | Health Care Technology – 2.9% (1.8% of Total Investments) | |
| | | | | | | |
| | 204 | | | Emdeon, Inc., Term Loan | | | 3.500% | | | | 1-Month LIBOR | | | | 2.500% | | | | 3/01/24 | | | | B+ | | | | 199,984 | |
| | 4,971 | | | Emdeon, Inc., Term Loan | | | 3.500% | | | | 3-Month LIBOR | | | | 2.500% | | | | 3/01/24 | | | | B+ | | | | 4,877,280 | |
| | 2,223 | | | Onex Carestream Finance LP, New Extended Term Loan, First Lien | | | 7.822% | | | | 6-Month LIBOR | | | | 6.750% | | | | 5/05/23 | | | | B1 | | | | 2,119,751 | |
| | 2,295 | | | Onex Carestream Finance LP, New Extended Term Loan, Second Lien | | | 5.572% | | | | 3-Month LIBOR | | | | 4.500% | | | | 8/05/23 | | | | Caa1 | | | | 1,847,235 | |
| | 1,791 | | | Zelis, Term Loan B | | | 4.911% | | | | 1-Month LIBOR | | | | 4.750% | | | | 9/30/26 | | | | B | | | | 1,790,042 | |
| | 11,484 | | | Total Health Care Technology | | | | | | | | | | | | | | | | | | | | | | | 10,834,292 | |
60
| | | | | | | | | | | | | | | | | | | | | | | | | | | | |
Principal
Amount (000) | | | Description (1) | | Coupon (2) | | | Reference
Rate (2) | | | Spread (2) | | | Maturity (3) | | | Ratings (4) | | | Value | |
| |
| | | | Hotels, Restaurants & Leisure – 15.6% (9.7% of Total Investments) | |
| | | | | | | |
| $ | 450 | | | 24 Hour Fitness Worldwide, Inc., DIP Term Loan, (5), (6) | | | 11.000% | | | | N/A | | | | 11.000% | | | | 6/15/21 | | | | B2 | | | $ | 433,816 | |
| | 1,512 | | | 24 Hour Fitness Worldwide, Inc., Term Loan B, (5) | | | 0.000% | | | | N/A | | | | N/A | | | | 5/31/25 | | | | D | | | | 357,575 | |
| | 3,017 | | | Alterra Mountain Company, Term Loan B, First Lien | | | 2.911% | | | | 1-Month LIBOR | | | | 2.750% | | | | 7/31/24 | | | | B1 | | | | 2,909,831 | |
| | 898 | | | Alterra Mountain Company, Term Loan, First Lien | | | 5.500% | | | | 1-Month LIBOR | | | | 4.500% | | | | 8/01/26 | | | | B1 | | | | 895,506 | |
| | 593 | | | Boyd Gaming Corporation, Refinancing Term Loan B | | | 2.361% | | | | 1-Week LIBOR | | | | 2.250% | | | | 9/15/23 | | | | BB– | | | | 574,869 | |
| | 15,589 | | | Burger King Corporation, Term Loan B4 | | | 1.911% | | | | 1-Month LIBOR | | | | 1.750% | | | | 11/19/26 | | | | BB+ | | | | 14,993,678 | |
| | 750 | | | Caesars Resort Collection, Term Loan | | | 4.772% | | | | 1-Month LIBOR | | | | 4.500% | | | | 7/20/25 | | | | B+ | | | | 724,571 | |
| | 375 | | | Caesars Resort Collection, Term Loan | | | 4.772% | | | | 3-Month LIBOR | | | | 4.500% | | | | 7/20/25 | | | | B+ | | | | 362,286 | |
| | 7,712 | | | Caesars Resort Collection, Term Loan, First Lien | | | 2.911% | | | | 1-Month LIBOR | | | | 2.750% | | | | 12/22/24 | | | | B+ | | | | 7,118,429 | |
| | 746 | | | CCM Merger, Inc., Term Loan B | | | 3.000% | | | | 1-Month LIBOR | | | | 2.250% | | | | 8/09/21 | | | | BB | | | | 734,919 | |
| | 3,208 | | | CityCenter Holdings LLC, Term Loan B | | | 3.000% | | | | 1-Month LIBOR | | | | 2.250% | | | | 4/18/24 | | | | B+ | | | | 2,978,997 | |
| | 2,783 | | | ClubCorp Operations, Inc., Term Loan B | | | 3.058% | | | | 3-Month LIBOR | | | | 2.750% | | | | 9/18/24 | | | | B– | | | | 2,412,565 | |
| | 2,866 | | | Equinox Holdings, Inc., Term Loan B1 | | | 4.072% | | | | 6-Month LIBOR | | | | 3.000% | | | | 3/08/24 | | | | Caa1 | | | | 2,173,629 | |
| | 965 | | | Four Seasons Holdings, Inc., Term Loan B | | | 2.161% | | | | 1-Month LIBOR | | | | 2.000% | | | | 11/30/23 | | | | BB+ | | | | 934,588 | |
| | 1,020 | | | Golden Nugget LLC, Initial Term Loan B | | | 3.250% | | | | 1-Month LIBOR | | | | 2.500% | | | | 10/04/23 | | | | B | | | | 861,519 | |
| | 4,246 | | | Hilton Hotels, Term Loan B2 | | | 1.922% | | | | 1-Month LIBOR | | | | 1.750% | | | | 6/21/26 | | | | BBB– | | | | 4,095,048 | |
| | 2,399 | | | Life Time Fitness, Inc., Term Loan B | | | 3.750% | | | | 3-Month LIBOR | | | | 2.750% | | | | 6/15/22 | | | | B | | | | 2,175,549 | |
| | 6 | | | Life Time Fitness, Inc., Term Loan B | | | 3.750% | | | | 6-Month LIBOR | | | | 2.750% | | | | 6/15/22 | | | | B | | | | 5,607 | |
| | 659 | | | PCI Gaming, Term Loan, First Lien | | | 2.661% | | | | 1-Month LIBOR | | | | 2.500% | | | | 5/31/26 | | | | BBB– | | | | 634,258 | |
| | 1,105 | | | Scientific Games Corp., Initial Term Loan B5 | | | 2.911% | | | | 1-Month LIBOR | | | | 2.750% | | | | 8/14/24 | | | | B+ | | | | 1,009,326 | |
| | 14 | | | Scientific Games Corp., Initial Term Loan B5 | | | 3.058% | | | | 3-Month LIBOR | | | | 2.750% | | | | 8/14/24 | | | | B+ | | | | 13,167 | |
| | 4,515 | | | Scientific Games Corp., Initial Term Loan B5 | | | 3.612% | | | | 6-Month LIBOR | | | | 2.750% | | | | 8/14/24 | | | | B+ | | | | 4,125,872 | |
| | 519 | | | Seaworld Parks and Entertainment, Inc., Term Loan B5 | | | 3.750% | | | | 1-Month LIBOR | | | | 3.000% | | | | 3/31/24 | | | | B2 | | | | 484,192 | |
| | 4,385 | | | Stars Group Holdings, Term Loan B | | | 3.808% | | | | 3-Month LIBOR | | | | 3.500% | | | | 7/10/25 | | | | BBB– | | | | 4,391,646 | |
| | 2,198 | | | Station Casinos LLC, Term Loan B | | | 2.500% | | | | 1-Month LIBOR | | | | 2.250% | | | | 2/08/27 | | | | BB– | | | | 2,036,463 | |
| | 1,474 | | | Wyndham International, Inc., Term Loan B | | | 1.911% | | | | 1-Month LIBOR | | | | 1.750% | | | | 5/30/25 | | | | BB+ | | | | 1,408,662 | |
| | 64,004 | | | Total Hotels, Restaurants & Leisure | | | | | | | | | | | | | | | | | | | | | | | 58,846,568 | |
| |
| | | | Household Durables – 0.4% (0.3% of Total Investments) | |
| | | | | | | |
| | 1,187 | | | Apex Tool Group LLC, Third Amendment Term Loan | | | 6.500% | | | | 1-Month LIBOR | | | | 5.250% | | | | 8/21/24 | | | | B3 | | | | 1,095,164 | |
| | 58 | | | Serta Simmons Holdings LLC, First Out Term Loan | | | 8.500% | | | | 2-Month LIBOR | | | | 7.500% | | | | 6/01/27 | | | | B+ | | | | 57,741 | |
| | 661 | | | Serta Simmons Holdings LLC, Second Out Term Loan | | | 8.500% | | | | 2-Month LIBOR | | | | 7.500% | | | | 6/01/27 | | | | B | | | | 508,561 | |
| | 1,906 | | | Total Household Durables | | | | | | | | | | | | | | | | | | | | | | | 1,661,466 | |
| |
| | | | Household Products – 2.0% (1.3% of Total Investments) | |
| | | | | | | |
| | 6,182 | | | KIK Custom Products Inc., Term Loan B2, (DD1) | | | 5.000% | | | | 1-Month LIBOR | | | | 4.000% | | | | 5/15/23 | | | | B– | | | | 6,114,728 | |
| | 1,509 | | | Reynolds Group Holdings, Inc., Term Loan, First Lien, (DD1) | | | 2.911% | | | | 1-Month LIBOR | | | | 2.750% | | | | 2/05/23 | | | | B+ | | | | 1,482,759 | |
| | 7,691 | | | Total Household Products | | | | | | | | | | | | | | | | | | | | | | | 7,597,487 | |
| |
| | | | Industrial Conglomerates – 0.2% (0.2% of Total Investments) | |
| | | | | | | |
| | 3 | | | Education Adisory Board, Term Loan, First Lien | | | 6.000% | | | | 1-Month LIBOR | | | | 2.750% | | | | 9/29/24 | | | | B2 | | | | 2,397 | |
| | 974 | | | Education Adisory Board, Term Loan, First Lien | | | 6.000% | | | | 3-Month LIBOR | | | | 2.750% | | | | 9/29/24 | | | | B2 | | | | 934,806 | |
| | 977 | | | Total Industrial Conglomerates | | | | | | | | | | | | | | | | | | | | | | | 937,203 | |
| |
| | | | Insurance – 2.1% (1.3% of Total Investments) | |
| | | | | | | |
| | 1,845 | | | Acrisure LLC, Term Loan B | | | 3.661% | | | | 1-Month LIBOR | | | | 3.500% | | | | 2/15/27 | | | | B | | | | 1,782,111 | |
| | 2,555 | | | Alliant Holdings I LLC, Term Loan B | | | 2.911% | | | | 1-Month LIBOR | | | | 2.750% | | | | 5/10/25 | | | | B | | | | 2,476,861 | |
| | 1,152 | | | Asurion LLC, Term Loan B6 | | | 3.161% | | | | 1-Month LIBOR | | | | 3.000% | | | | 11/03/23 | | | | Ba3 | | | | 1,137,410 | |
| | 2,180 | | | Hub International Holdings, Inc., Term Loan B | | | 3.263% | | | | 3-Month LIBOR | | | | 3.000% | | | | 4/25/25 | | | | B | | | | 2,123,449 | |
| | 500 | | | Ryan Specialty Group LLC, Term Loan B, (WI/DD) | | | TBD | | | | TBD | | | | TBD | | | | TBD | | | | B1 | | | | 497,500 | |
| | 8,232 | | | Total Insurance | | | | | | | | | | | | | | | | | | | | | | | 8,017,331 | |
| |
| | | | Interactive Media & Services – 1.9% (1.2% of Total Investments) | |
| | | | | | | |
| | 5,824 | | | Rackspace Hosting, Inc., Refinancing Term Loan B, First Lien, (DD1) | | | 4.000% | | | | 3-Month LIBOR | | | | 3.000% | | | | 11/03/23 | | | | B+ | | | | 5,719,452 | |
61
| | |
| |
| JRO | | Nuveen Floating Rate Income Opportunity Fund (continued) |
| | Portfolio of Investments July 31, 2020 |
| | | | | | | | | | | | | | | | | | | | | | | | | | | | |
Principal
Amount (000) | | | Description (1) | | Coupon (2) | | | Reference
Rate (2) | | | Spread (2) | | | Maturity (3) | | | Ratings (4) | | | Value | |
| |
| | | | Interactive Media & Services (continued) | |
| | | | | | | |
| $ | 1,478 | | | WeddingWire, Inc., Term Loan | | | 4.808% | | | | 3-Month LIBOR | | | | 4.500% | | | | 12/21/25 | | | | B+ | | | $ | 1,359,300 | |
| | 7,302 | | | Total Interactive Media & Services | | | | | | | | | | | | | | | | | | | | | | | 7,078,752 | |
| |
| | | | Internet & Direct Marketing Retail – 0.7% (0.4% of Total Investments) | |
| | | | | | | |
| | 2,026 | | | Uber Technologies, Inc., Term Loan | | | 5.000% | | | | 1-Month LIBOR | | | | 4.000% | | | | 4/04/25 | | | | B1 | | | | 2,002,293 | |
| | 565 | | | Uber Technologies, Inc., Term Loan | | | 3.661% | | | | 1-Month LIBOR | | | | 3.500% | | | | 7/13/23 | | | | B1 | | | | 554,370 | |
| | 2,591 | | | Total Internet & Direct Marketing Retail | | | | | | | | | | | | | | | | 2,556,663 | |
| |
| | | | Internet Software & Services – 1.8% (1.1% of Total Investments) | |
| | | | | | | |
| | 1,444 | | | Ancestry.com, Inc., Term Loan, First Lien | | | 4.750% | | | | 1-Month LIBOR | | | | 3.750% | | | | 10/19/23 | | | | B | | | | 1,422,424 | |
| | 832 | | | Blue Yonder, Term Loan B, (WI/DD) | | | TBD | | | | TBD | | | | TBD | | | | TBD | | | | B1 | | | | 831,148 | |
| | 915 | | | Dynatrace LLC, Term Loan, First Lien | | | 2.411% | | | | 1-Month LIBOR | | | | 2.250% | | | | 8/23/25 | | | | B1 | | | | 904,109 | |
| | 3,544 | | | Epicor Software Corporation, Term Loan, First Lien, (DD1) | | | 5.250% | | | | 3-Month LIBOR | | | | 4.250% | | | | 7/30/27 | | | | B2 | | | | 3,545,476 | |
| | 1,913 | | | SkillSoft Corporation, Term Loan, Second Lien, (5) | | | 0.000% | | | | N/A | | | | N/A | | | | 4/28/22 | | | | CCC | | | | 80,339 | |
| | 8,648 | | | Total Internet Software & Services | | | | | | | | | | | | | | | | 6,783,496 | |
| |
| | | | IT Services – 4.2% (2.6% of Total Investments) | |
| | | | | | | |
| | 1,468 | | | Datto, Inc., Term Loan | | | 4.411% | | | | 1-Month LIBOR | | | | 4.250% | | | | 4/02/26 | | | | B | | | | 1,463,887 | |
| | 2 | | | DTI Holdings, Inc., Replacement Term Loan B1 | | | 5.750% | | | | 2-Month LIBOR | | | | 4.750% | | | | 9/30/23 | | | | CCC+ | | | | 1,381 | |
| | 663 | | | DTI Holdings, Inc., Replacement Term Loan B1 | | | 5.750% | | | | 3-Month LIBOR | | | | 4.750% | | | | 9/30/23 | | | | CCC+ | | | | 529,721 | |
| | 136 | | | iQor US, Inc., Term Loan, (5) | | | 11.000% | | | | 1-Month LIBOR | | | | 10.000% | | | | 5/27/21 | | | | N/R | | | | 128,028 | |
| | 973 | | | KBR, Inc., New Term Loan B | | | 2.911% | | | | 1-Month LIBOR | | | | 2.750% | | | | 2/07/27 | | | | Ba1 | | | | 960,201 | |
| | 500 | | | Optiv Security, Inc., Term Loan, Second Lien | | | 8.250% | | | | 1-Month LIBOR | | | | 7.250% | | | | 2/01/25 | | | | Caa3 | | | | 385,000 | |
| | 3,569 | | | Sabre, Inc., Term Loan B | | | 2.161% | | | | 1-Month LIBOR | | | | 2.000% | | | | 2/22/24 | | | | Ba3 | | | | 3,277,175 | |
| | 704 | | | Science Applications International Corporation, Term Loan B | | | 2.036% | | | | 1-Month LIBOR | | | | 1.875% | | | | 10/31/25 | | | | BB+ | | | | 694,507 | |
| | 3,500 | | | Syniverse Holdings, Inc., Initial Term Loan, Second Lien | | | 10.000% | | | | 3-Month LIBOR | | | | 9.000% | | | | 3/11/24 | | | | CCC– | | | | 1,831,883 | |
| | 2,009 | | | Syniverse Holdings, Inc., Term Loan C | | | 6.000% | | | | 3-Month LIBOR | | | | 5.000% | | | | 3/09/23 | | | | CCC+ | | | | 1,602,518 | |
| | 1,697 | | | Tempo Acquisition LLC, Term Loan B | | | 2.911% | | | | 1-Month LIBOR | | | | 2.750% | | | | 5/01/24 | | | | B1 | | | | 1,660,579 | |
| | 2,649 | | | West Corporation, Term Loan B, (DD1) | | | 5.000% | | | | 3-Month LIBOR | | | | 4.000% | | | | 10/10/24 | | | | BB– | | | | 2,342,449 | |
| | 960 | | | WEX, Inc., Term Loan B3 | | | 2.411% | | | | 1-Month LIBOR | | | | 2.250% | | | | 5/17/26 | | | | Ba2 | | | | 931,279 | |
| | 18,830 | | | Total IT Services | | | | | | | | | | | | | | | | | | | | | | | 15,808,608 | |
| |
| | | | Leisure Products – 0.2% (0.0% of Total Investments) | |
| | | | | | | |
| | 740 | | | Carnival Corp, Term Loan B, (DD1) | | | 8.500% | | | | 1-Month LIBOR | | | | 7.500% | | | | 6/30/25 | | | | Baa3 | | | | 728,130 | |
| |
| | | | Life Sciences Tools & Services – 1.1% (0.7% of Total Investments) | |
| | | | | | | |
| | 291 | | | Inventiv Health, Inc., Term Loan B | | | 1.911% | | | | 1-Month LIBOR | | | | 1.750% | | | | 8/01/24 | | | | BB | | | | 284,740 | |
| | 4,101 | | | Parexel International Corp., Term Loan B | | | 2.911% | | | | 1-Month LIBOR | | | | 2.750% | | | | 9/27/24 | | | | B2 | | | | 3,953,427 | |
| | 4,392 | | | Total Life Sciences Tools & Services | | | | | | | | | | | | | | | | | | | | | | | 4,238,167 | |
| |
| | | | Machinery – 1.2% (0.7% of Total Investments) | |
| | | | | | | |
| | 1,733 | | | Gardner Denver, Inc., Extended Term Loan B | | | 1.911% | | | | 1-Month LIBOR | | | | 1.750% | | | | 2/28/27 | | | | Ba2 | | | | 1,671,697 | |
| | 195 | | | Gardner Denver, Inc., New Term Loan B | | | 2.916% | | | | 1-Month LIBOR | | | | 2.750% | | | | 1/31/27 | | | | BB+ | | | | 192,145 | |
| | 1,026 | | | Gates Global LLC, Term Loan B | | | 3.750% | | | | 1-Month LIBOR | | | | 2.750% | | | | 4/01/24 | | | | B1 | | | | 1,005,239 | |
| | 1,250 | | | Thyssenkrupp Elevator, Term Loan B, (WI/DD) | | | TBD | | | | TBD | | | | TBD | | | | TBD | | | | B1 | | | | 1,234,769 | |
| | 430 | | | TNT Crane and Rigging Inc., Initial Term Loan, First Lien, (5) | | | 0.000% | | | | N/A | | | | N/A | | | | 11/27/20 | | | | Caa3 | | | | 306,890 | |
| | 650 | | | TNT Crane and Rigging, Inc., Term Loan, Second Lien, (5) | | | 0.000% | | | | N/A | | | | N/A | | | | 11/27/21 | | | | C | | | | 114,611 | |
| | 5,284 | | | Total Machinery | | | | | | | | | | | | | | | | | | | | | | | 4,525,351 | |
| |
| | | | Marine – 0.3% (0.2% of Total Investments) | |
| | | | | | | |
| | 2,007 | | | Harvey Gulf International Marine, Inc., Exit Term Loan | | | 7.713% | | | | 3-Month LIBOR | | | | 6.000% | | | | 7/02/23 | | | | B– | | | | 970,997 | |
| |
| | | | Media – 18.3% (11.4% of Total Investments) | |
| | | | | | | |
| | 337 | | | Advantage Sales & Marketing, Inc., Term Loan B2, First Lien | | | 4.250% | | | | 3-Month LIBOR | | | | 3.250% | | | | 7/25/21 | | | | B2 | | | | 320,301 | |
62
| | | | | | | | | | | | | | | | | | | | | | | | | | | | |
Principal
Amount (000) | | | Description (1) | | Coupon (2) | | | Reference
Rate (2) | | | Spread (2) | | | Maturity (3) | | | Ratings (4) | | | Value | |
| |
| | | | Media (continued) | |
| | | | | | | |
| $ | 1,257 | | | Advantage Sales & Marketing, Inc., Term Loan, First Lien | | | 4.250% | | | | 3-Month LIBOR | | | | 3.250% | | | | 7/25/21 | | | | B2 | | | $ | 1,197,170 | |
| | 404 | | | Affinion Group Holdings, Inc., Consenting Term Loan, (cash 3.250%, PIK 1.750%) | | | 5.000% | | | | 3-Month LIBOR | | | | 4.000% | | | | 4/10/24 | | | | N/R | | | | 285,437 | |
| | 474 | | | Catalina Marketing Corporation, First Out Term Loan | | | 8.500% | | | | 1-Month LIBOR | | | | 7.500% | | | | 2/15/23 | | | | B2 | | | | 291,576 | |
| | 710 | | | Catalina Marketing Corporation, Last Out Term Loan, (cash 2.000, PIK 9.500%) | | | 11.500% | | | | 1-Month LIBOR | | | | 1.000% | | | | 8/15/23 | | | | Caa2 | | | | 157,962 | |
| | 227 | | | CBS Radio, Inc., Term Loan B2 | | | 2.673% | | | | 1-Month LIBOR | | | | 2.500% | | | | 11/17/24 | | | | BB– | | | | 216,045 | |
| | 4,469 | | | Cequel Communications LLC, Term Loan B | | | 2.425% | | | | 1-Month LIBOR | | | | 2.250% | | | | 1/15/26 | | | | BB | | | | 4,330,273 | |
| | 3,758 | | | Charter Communications Operating Holdings LLC, Term Loan B2 | | | 1.920% | | | | 1-Month LIBOR | | | | 1.750% | | | | 2/01/27 | | | | BBB– | | | | 3,675,141 | |
| | 2,119 | | | Cineworld Group PLC, Term Loan B | | | 3.322% | | | | 6-Month LIBOR | | | | 2.250% | | | | 2/28/25 | | | | B | | | | 1,360,957 | |
| | 19 | | | Clear Channel Outdoor Holdings, Inc., Term Loan B | | | 3.714% | | | | 2-Month LIBOR | | | | 3.500% | | | | 8/21/26 | | | | B1 | | | | 16,642 | |
| | 7,372 | | | Clear Channel Outdoor Holdings, Inc., Term Loan B | | | 3.761% | | | | 3-Month LIBOR | | | | 3.500% | | | | 8/21/26 | | | | B1 | | | | 6,590,102 | |
| | 125 | | | Cox Media/Terrier Media, Term Loan, First Lien | | | 4.411% | | | | 1-Month LIBOR | | | | 4.250% | | | | 12/17/26 | | | | B+ | | | | 122,055 | |
| | 2,544 | | | CSC Holdings LLC, Refinancing Term Loan | | | 2.425% | | | | 1-Month LIBOR | | | | 2.250% | | | | 7/17/25 | | | | BB | | | | 2,466,999 | |
| | 3,365 | | | CSC Holdings, LLC, Term Loan B5 | | | 2.675% | | | | 1-Month LIBOR | | | | 2.500% | | | | 4/15/27 | | | | Ba3 | | | | 3,268,198 | |
| | 543 | | | Cumulus Media, Inc., Term Loan B | | | 4.822% | | | | 3-Month LIBOR | | | | 3.750% | | | | 3/31/26 | | | | B | | | | 520,700 | |
| | 741 | | | EW Scripps, Term Loan B2 | | | 2.661% | | | | 1-Month LIBOR | | | | 2.500% | | | | 5/01/26 | | | | BB+ | | | | 716,582 | |
| | 553 | | | Gray Television, Inc., Term Loan B2 | | | 2.421% | | | | 1-Month LIBOR | | | | 2.250% | | | | 2/07/24 | | | | BB+ | | | | 539,778 | |
| | 637 | | | Gray Television, Inc., Term Loan C | | | 2.671% | | | | 1-Month LIBOR | | | | 2.500% | | | | 1/02/26 | | | | BB+ | | | | 622,894 | |
| | 609 | | | Houghton Mifflin Harcourt, Term Loan | | | 7.250% | | | | 1-Month LIBOR | | | | 6.250% | | | | 11/22/24 | | | | B | | | | 551,484 | |
| | 5,275 | | | iHeartCommunications Inc., Term Loan B | | | 3.161% | | | | 1-Month LIBOR | | | | 3.000% | | | | 5/01/26 | | | | B+ | | | | 4,953,014 | |
| | 1,809 | | | IMG Worldwide, Inc., Term Loan B | | | 2.920% | | | | 1-Month LIBOR | | | | 2.750% | | | | 5/16/25 | | | | B3 | | | | 1,444,709 | |
| | 1,928 | | | Intelsat Jackson Holdings, S.A., DIP Term Loan, (5), (6) | | | 6.500% | | | | 3-Month LIBOR | | | | 5.500% | | | | 7/13/21 | | | | B | | | | 1,968,690 | |
| | 6,367 | | | Intelsat Jackson Holdings, S.A., Term Loan B, (DD1), (5) | | | 8.000% | | | | Prime | | | | 4.750% | | | | 11/27/23 | | | | B | | | | 6,429,081 | |
| | 1,126 | | | LCPR Loan Financing LLC, Term Loan B | | | 5.175% | | | | 1-Month LIBOR | | | | 5.000% | | | | 10/15/26 | | | | BB– | | | | 1,133,810 | |
| | 5,783 | | | McGraw-Hill Education Holdings LLC, Term Loan B | | | 5.000% | | | | 3-Month LIBOR | | | | 4.000% | | | | 5/04/22 | | | | BB+ | | | | 5,063,067 | |
| | 460 | | | Meredith Corporation, Incremental Term Loan B | | | 5.250% | | | | 1-Month LIBOR | | | | 4.250% | | | | 1/31/25 | | | | BB– | | | | 450,609 | |
| | 2,200 | | | Meredith Corporation, Term Loan B2 | | | 2.667% | | | | 1-Month LIBOR | | | | 2.500% | | | | 1/31/25 | | | | BB– | | | | 2,084,868 | |
| | 1,820 | | | Metro-Goldwyn-Mayer, Inc., Term Loan, First Lien | | | 2.670% | | | | 1-Month LIBOR | | | | 2.500% | | | | 7/03/25 | | | | BB | | | | 1,749,690 | |
| | 1,000 | | | Metro-Goldwyn-Mayer, Inc., Term Loan, Second Lien | | | 5.500% | | | | 2-Month LIBOR | | | | 4.500% | | | | 7/06/26 | | | | B– | | | | 968,750 | |
| | 1,057 | | | Nexstar Broadcasting, Inc., Term Loan B | | | 2.921% | | | | 1-Month LIBOR | | | | 2.750% | | | | 9/19/26 | | | | BB | | | | 1,031,348 | |
| | 637 | | | Nexstar Broadcasting, Inc., Term Loan B3 | | | 2.421% | | | | 1-Month LIBOR | | | | 2.250% | | | | 1/17/24 | | | | BB | | | | 619,978 | |
| | 2,481 | | | Nexstar Broadcasting, Inc., Term Loan B3 | | | 2.416% | | | | 1-Month LIBOR | | | | 2.250% | | | | 1/17/24 | | | | BB | | | | 2,416,074 | |
| | 314 | | | Red Ventures, Term Loan B | | | 2.661% | | | | 1-Month LIBOR | | | | 2.500% | | | | 11/08/24 | | | | B+ | | | | 303,295 | |
| | 893 | | | Sinclair Television Group, Term Loan B2 | | | 2.680% | | | | 1-Month LIBOR | | | | 2.500% | | | | 9/30/26 | | | | BB+ | | | | 869,807 | |
| | 3,414 | | | Sinclair Television Group, Term Loan B2 | | | 2.420% | | | | 1-Month LIBOR | | | | 2.250% | | | | 1/03/24 | | | | BB+ | | | | 3,333,329 | |
| | 2,242 | | | WideOpenWest Finance LLC, Term Loan B | | | 4.250% | | | | 1-Month LIBOR | | | | 3.250% | | | | 8/19/23 | | | | B | | | | 2,215,095 | |
| | 4,967 | | | Ziggo B.V., Term Loan | | | 2.675% | | | | 1-Month LIBOR | | | | 2.500% | | | | 4/30/28 | | | | BB | | | | 4,784,631 | |
| | 74,036 | | | Total Media | | | | | | | | | | | | | | | | | | | | | | | 69,070,141 | |
| |
| | | | Multiline Retail – 1.1% (0.7% of Total Investments) | |
| | | | | | | |
| | 889 | | | 99 Cents Only Stores, Term Loan B2, Second Lien, (cash 6.296%, PIK 1.500%) | | | 7.796% | | | | 6-Month LIBOR | | | | 5.000% | | | | 1/13/22 | | | | CCC+ | | | | 807,137 | |
| | 1,171 | | | 99 Cents Only Stores, Term Loan B2, Second Lien, (cash 6.296%, PIK 1.500%) | | | 7.796% | | | | 3-Month LIBOR | | | | 5.000% | | | | 1/13/22 | | | | CCC+ | | | | 1,061,697 | |
| | 1,904 | | | Belk, Inc., Term Loan, First Lien | | | 7.750% | | | | 6-Month LIBOR | | | | 6.750% | | | | 7/31/25 | | | | Caa1 | | | | 830,701 | |
| | 1,466 | | | EG America LLC, Term Loan, First Lien | | | 5.072% | | | | 6-Month LIBOR | | | | 4.000% | | | | 2/07/25 | | | | B2 | | | | 1,397,666 | |
| | 5,430 | | | Total Multiline Retail | | | | | | | | | | | | | | | | | | | | | | | 4,097,201 | |
| |
| | | | Oil, Gas & Consumable Fuels – 2.8% (1.7% of Total Investments) | |
| | | | | | | |
| | 964 | | | BCP Renaissance Parent, Term Loan B | | | 4.500% | | | | 3-Month LIBOR | | | | 3.500% | | | | 11/01/24 | | | | B+ | | | | 873,235 | |
| | 1,143 | | | Buckeye Partners, Term Loan, First Lien | | | 2.921% | | | | 1-Month LIBOR | | | | 2.750% | | | | 11/01/26 | | | | BBB– | | | | 1,119,617 | |
| | 3,161 | | | California Resources Corporation, DIP Term Loan | | | 10.000% | | | | 1-Month LIBOR | | | | 9.000% | | | | 2/21/28 | | | | N/R | | | | 3,129,619 | |
| | 5,335 | | | California Resources Corporation, Term Loan B, (5) | | | 0.000% | | | | N/A | | | | N/A | | | | 12/31/22 | | | | D | | | | 2,057,790 | |
| | 546 | | | California Resources Corporation, Term Loan, (5) | | | 0.000% | | | | N/A | | | | N/A | | | | 12/31/21 | | | | D | | | | 23,662 | |
| | 7,177 | | | Fieldwood Energy LLC, Exit Term Loan, (DD1), (5) | | | 7.027% | | | | 3-Month LIBOR | | | | 5.250% | | | | 4/11/22 | | | | CCC | | | | 1,782,366 | |
| | 3,211 | | | Fieldwood Energy LLC, Exit Term Loan, Second Lien, (5) | | | 0.000% | | | | N/A | | | | N/A | | | | 4/11/23 | | | | C | | | | 55,195 | |
63
| | |
| |
| JRO | | Nuveen Floating Rate Income Opportunity Fund (continued) |
| | Portfolio of Investments July 31, 2020 |
| | | | | | | | | | | | | | | | | | | | | | | | | | | | |
Principal
Amount (000) | | | Description (1) | | Coupon (2) | | | Reference
Rate (2) | | | Spread (2) | | | Maturity (3) | | | Ratings (4) | | | Value | |
| |
| | | | Oil, Gas & Consumable Fuels (continued) | |
| | | | | | | |
| $ | 1,735 | | | Gulf Finance, LLC, Term Loan B | | | 6.250% | | | | 1-Month LIBOR | | | | 5.250% | | | | 8/25/23 | | | | CCC+ | | | $ | 1,134,199 | |
| | 614 | | | Peabody Energy Corporation, Term Loan B | | | 2.911% | | | | 1-Month LIBOR | | | | 2.750% | | | | 3/31/25 | | | | B1 | | | | 328,314 | |
| | 23,886 | | | Total Oil, Gas & Consumable Fuels | | | | | | | | | | | | | | | | | | | | | | | 10,503,997 | |
| |
| | | | Personal Products – 0.7% (0.5% of Total Investments) | |
| | | | | | | |
| | 1,788 | | | Coty, Inc., Term Loan A | | | 1.916% | | | | 1-Month LIBOR | | | | 1.750% | | | | 4/05/23 | | | | B | | | | 1,626,979 | |
| | 56 | | | Coty, Inc., Term Loan B | | | 2.416% | | | | 1-Month LIBOR | | | | 2.250% | | | | 4/05/25 | | | | B | | | | 48,209 | |
| | 3,633 | | | Revlon Consumer Products Corporation, Term Loan B, First Lien | | | 3.863% | | | | 3-Month LIBOR | | | | 3.500% | | | | 9/07/23 | | | | C | | | | 993,173 | |
| | 5,477 | | | Total Personal Products | | | | | | | | | | | | | | | | | | | | | | | 2,668,361 | |
| |
| | | | Pharmaceuticals – 3.9% (2.5% of Total Investments) | |
| | | | | | | |
| | 948 | | | Alphabet Holding Company, Inc., Initial Term Loan, First Lien | | | 3.661% | | | | 1-Month LIBOR | | | | 3.500% | | | | 9/28/24 | | | | B– | | | | 912,067 | |
| | 3,525 | | | Concordia Healthcare Corp, Exit Term Loan | | | 6.568% | | | | 6-Month LIBOR | | | | 5.500% | | | | 9/06/24 | | | | B– | | | | 3,299,260 | |
| | 850 | | | Elanco Animal Health, Term Loan B, (WI/DD) | | | TBD | | | | TBD | | | | TBD | | | | TBD | | | | Baa3 | | | | 830,875 | |
| | 876 | | | Endo Health Solutions, Inc., Term Loan B | | | 5.000% | | | | 3-Month LIBOR | | | | 4.250% | | | | 4/29/24 | | | | B+ | | | | 841,115 | |
| | 1,375 | | | Mallinckrodt International Finance S.A., Term Loan B, First Lien | | | 3.500% | | | | 6-Month LIBOR | | | | 2.750% | | | | 9/24/24 | | | | B– | | | | 1,156,485 | |
| | 472 | | | Mallinckrodt International Finance S.A., Term Loan, First Lien | | | 3.750% | | | | 3-Month LIBOR | | | | 3.000% | | | | 2/24/25 | | | | B– | | | | 398,145 | |
| | 2,647 | | | Valeant Pharmaceuticals International, Inc., Term Loan B | | | 2.926% | | | | 1-Month LIBOR | | | | 2.750% | | | | 11/27/25 | | | | BB | | | | 2,598,141 | |
| | 4,942 | | | Valeant Pharmaceuticals International, Inc., Term Loan, First Lien, (DD1) | | | 3.176% | | | | 1-Month LIBOR | | | | 3.000% | | | | 6/02/25 | | | | BB | | | | 4,873,056 | |
| | 15,635 | | | Total Pharmaceuticals | | | | | | | | | | | | | | | | | | | | | | | 14,909,144 | |
| |
| | | | Professional Services – 2.1% (1.3% of Total Investments) | |
| | | | | | | |
| | 597 | | | On Assignment, Inc., Term Loan B3 | | | 1.911% | | | | 1-Month LIBOR | | | | 1.750% | | | | 4/02/25 | | | | BBB– | | | | 589,476 | |
| | 1,048 | | | Ceridian HCM Holding, Inc., Term Loan B | | | 2.611% | | | | 1-Week LIBOR | | | | 2.500% | | | | 4/30/25 | | | | B+ | | | | 1,020,316 | |
| | 796 | | | Creative Artists Agency, LLC, Term Loan B | | | 3.911% | | | | 1-Month LIBOR | | | | 3.750% | | | | 11/26/26 | | | | B | | | | 758,787 | |
| | 1,147 | | | Dun & Bradstreet Corp.,Term Loan, First Lien | | | 3.922% | | | | 1-Month LIBOR | | | | 3.750% | | | | 2/08/26 | | | | BB | | | | 1,143,661 | |
| | 2,371 | | | Nielsen Finance LLC, Term Loan B4 | | | 2.183% | | | | 1-Month LIBOR | | | | 2.000% | | | | 10/04/23 | | | | BBB– | | | | 2,312,437 | |
| | 3,298 | | | Skillsoft Corporation, Initial Term Loan, First Lien, (5) | | | 0.000% | | | | N/A | | | | N/A | | | | 4/28/21 | | | | CCC+ | | | | 2,146,914 | |
| | 9,257 | | | Total Professional Services | | | | | | | | | | | | | | | | | | | | | | | 7,971,591 | |
| |
| | | | Real Estate Management & Development – 0.6% (0.4% of Total Investments) | |
| | | | | | | |
| | 2,689 | | | GGP, Initial Term Loan A2 | | | 3.161% | | | | 1-Month LIBOR | | | | 2.500% | | | | 8/24/23 | | | | BB+ | | | | 2,400,199 | |
| |
| | | | Road & Rail – 1.9% (1.2% of Total Investments) | |
| | | | | | | |
| | 1,708 | | | Avolon LLC, Term Loan B3 | | | 2.500% | | | | 1-Month LIBOR | | | | 1.750% | | | | 1/15/25 | | | | Baa2 | | | | 1,635,401 | |
| | 916 | | | Ceva Group PLC, Term Loan B | | | 5.308% | | | | 3-Month LIBOR | | | | 5.000% | | | | 8/03/25 | | | | B+ | | | | 785,823 | |
| | 1,995 | | | Genesee & Wyoming Inc., Term Loan, First Lien | | | 2.308% | | | | 3-Month LIBOR | | | | 2.000% | | | | 12/30/26 | | | | BB+ | | | | 1,962,272 | |
| | 1,280 | | | Hertz Corporation, Term Loan, (WI/DD), (5) | | | TBD | | | | TBD | | | | TBD | | | | TBD | | | | N/R | | | | 1,222,400 | |
| | 1,432 | | | Quality Distribution, Incremental Term Loan, First Lien | | | 6.500% | | | | 3-Month LIBOR | | | | 5.500% | | | | 8/18/22 | | | | B– | | | | 1,360,875 | |
| | 48 | | | Savage Enterprises LLC, Term Loan B | | | 3.180% | | | | 1-Month LIBOR | | | | 3.000% | | | | 8/01/25 | | | | BB | | | | 47,276 | |
| | 7,379 | | | Total Road & Rail | | | | | | | | | | | | | | | | | | | | | | | 7,014,047 | |
| |
| | | | Semiconductors & Semiconductor Equipment – 1.1% (0.7% of Total Investments) | |
| | | | | | | |
| | 661 | | | Cabot Microelectronics, Term Loan B1 | | | 2.188% | | | | 1-Month LIBOR | | | | 2.000% | | | | 11/15/25 | | | | BB+ | | | | 657,979 | |
| | 2,416 | | | Lumileds, Term Loan B | | | 4.572% | | | | 6-Month LIBOR | | | | 3.500% | | | | 6/30/24 | | | | CCC+ | | | | 962,016 | |
| | 1,138 | | | Microchip Technology, Inc., Term Loan B | | | 2.170% | | | | 1-Month LIBOR | | | | 2.000% | | | | 5/29/25 | | | | Baa3 | | | | 1,133,509 | |
| | 1,416 | | | ON Semiconductor Corporation, New Replacement Term Loan B4 | | | 2.166% | | | | 1-Month LIBOR | | | | 2.000% | | | | 9/19/26 | | | | BB | | | | 1,395,854 | |
| | 5,631 | | | Total Semiconductors & Semiconductor Equipment | | | | | | | | | | | | 4,149,358 | |
| |
| | | | Software – 10.9% (6.8% of Total Investments) | |
| | | | | | | |
| | 992 | | | Autodata Solutions, Term Loan, First Lien | | | 3.661% | | | | 1-Month LIBOR | | | | 3.500% | | | | 5/30/26 | | | | BB– | | | | 958,174 | |
| | 1,489 | | | Blackboard, Inc., Term Loan B5, First Lien | | | 7.000% | | | | 3-Month LIBOR | | | | 6.000% | | | | 6/30/24 | | | | B | | | | 1,413,382 | |
| | 2,024 | | | BMC Software, Inc., Term Loan B | | | 4.411% | | | | 1-Month LIBOR | | | | 4.250% | | | | 10/02/25 | | | | B2 | | | | 1,959,099 | |
| | 2,574 | | | DiscoverOrg LLC, Term Loan B | | | 3.911% | | | | 1-Month LIBOR | | | | 3.750% | | | | 2/01/26 | | | | B+ | | | | 2,546,901 | |
64
| | | | | | | | | | | | | | | | | | | | | | | | | | | | |
Principal
Amount (000) | | | Description (1) | | Coupon (2) | | | Reference
Rate (2) | | | Spread (2) | | | Maturity (3) | | | Ratings (4) | | | Value | |
| |
| | | | Software (continued) | |
| | | | | | | |
| $ | 1,968 | | | Ellucian, Term Loan B, First Lien | | | 4.250% | | | | 3-Month LIBOR | | | | 3.250% | | | | 9/30/22 | | | | B | | | $ | 1,959,027 | |
| | 2,765 | | | Greeneden U.S. Holdings II LLC, Term Loan B, (DD1) | | | 3.411% | | | | 1-Month LIBOR | | | | 3.250% | | | | 12/01/23 | | | | B2 | | | | 2,728,838 | |
| | 326 | | | Greenway Health, Term Loan, First Lien | | | 4.820% | | | | 6-Month LIBOR | | | | 3.750% | | | | 2/16/24 | | | | B– | | | | 263,126 | |
| | 2,306 | | | Informatica LLC, Term Loan, First Lien | | | 3.411% | | | | 1-Month LIBOR | | | | 3.250% | | | | 2/14/27 | | | | B1 | | | | 2,258,222 | |
| | 1,071 | | | McAfee Holdings International, Inc., Term Loan, Second Lien | | | 9.500% | | | | 1-Month LIBOR | | | | 8.500% | | | | 9/28/25 | | | | B– | | | | 1,091,336 | |
| | 2,612 | | | McAfee LLC, Term Loan B | | | 3.916% | | | | 1-Month LIBOR | | | | 3.750% | | | | 9/29/24 | | | | B | | | | 2,591,590 | |
| | 1,137 | | | Micro Focus International PLC, New Term Loan | | | 2.661% | | | | 1-Month LIBOR | | | | 2.500% | | | | 6/21/24 | | | | BB– | | | | 1,077,113 | |
| | 7,680 | | | Micro Focus International PLC, Term Loan B | | | 2.661% | | | | 1-Month LIBOR | | | | 2.500% | | | | 6/21/24 | | | | BB | | | | 7,274,012 | |
| | 1,309 | | | Micro Focus International PLC, Term Loan B4 | | | 5.250% | | | | 3-Month LIBOR | | | | 4.250% | | | | 6/05/25 | | | | BB | | | | 1,298,005 | |
| | 2,838 | | | Misys, New Term Loan, First Lien | | | 4.500% | | | | 6-Month LIBOR | | | | 3.500% | | | | 6/13/24 | | | | BB- | | | | 2,634,674 | |
| | 374 | | | Mitchell International, Inc., Initial Term Loan, First Lien | | | 3.411% | | | | 1-Month LIBOR | | | | 3.250% | | | | 11/29/24 | | | | B2 | | | | 357,182 | |
| | 667 | | | Mitchell International, Inc., Initial Term Loan, Second Lien | | | 7.411% | | | | 1-Month LIBOR | | | | 7.250% | | | | 11/30/25 | | | | CCC | | | | 604,833 | |
| | 1,191 | | | Perforce Software Inc., Term Loan, First Lien | | | 3.911% | | | | 1-Month LIBOR | | | | 3.750% | | | | 7/01/26 | | | | B– | | | | 1,158,113 | |
| | 191 | | | SkillSoft Corporation, DIP Term Loan, (5) | | | 8.500% | | | | 1-Month LIBOR | | | | 7.500% | | | | 6/15/21 | | | | N/R | | | | 189,831 | |
| | 1,830 | | | SS&C Technologies, Inc./ Sunshine Acquisition II, Inc., New Term Loan B3 | | | 1.911% | | | | 1-Month LIBOR | | | | 1.750% | | | | 4/16/25 | | | | BB+ | | | | 1,779,469 | |
| | 1,286 | | | SS&C Technologies, Inc./ Sunshine Acquisition II, Inc., New Term Loan B4 | | | 1.911% | | | | 1-Month LIBOR | | | | 1.750% | | | | 4/16/25 | | | | BB+ | | | | 1,250,201 | |
| | 657 | | | Thomson Reuters IP & S, Term Loan B | | | 3.161% | | | | 1-Month LIBOR | | | | 3.000% | | | | 10/31/26 | | | | B | | | | 644,797 | |
| | 1,929 | | | TIBCO Software, Inc., Term Loan, First Lien | | | 3.920% | | | | 1-Month LIBOR | | | | 3.750% | | | | 7/03/26 | | | | B+ | | | | 1,867,500 | |
| | 1,000 | | | TIBCO Software, Inc., Term Loan, Second Lien | | | 7.420% | | | | 1-Month LIBOR | | | | 7.250% | | | | 3/04/28 | | | | B– | | | | 965,000 | |
| | 1,037 | | | Ultimate Software, Incremental Term Loan | | | 4.750% | | | | 3-Month LIBOR | | | | 4.000% | | | | 5/03/26 | | | | B1 | | | | 1,039,628 | |
| | 744 | | | Ultimate Software, Term Loan, First Lien | | | 3.911% | | | | 1-Month LIBOR | | | | 3.750% | | | | 5/03/26 | | | | B1 | | | | 738,562 | |
| | 400 | | | Xperi Holding Corp, Term Loan B | | | 4.161% | | | | 1-Month LIBOR | | | | 4.000% | | | | 6/01/25 | | | | BB– | | | | 393,168 | |
| | 42,397 | | | Total Software | | | | | | | | | | | | | | | | | | | | | | | 41,041,783 | |
| |
| | | | Specialty Retail – 2.0% (1.2% of Total Investments) | |
| | | | | | | |
| | 804 | | | Academy, Ltd., Term Loan B, (DD1) | | | 5.000% | | | | 1-Month LIBOR | | | | 4.000% | | | | 7/01/22 | | | | CCC+ | | | | 720,907 | |
| | 817 | | | Petco Animal Supplies, Inc., Term Loan B1 | | | 4.250% | | | | 3-Month LIBOR | | | | 3.250% | | | | 1/26/23 | | | | B3 | | | | 687,596 | |
| | 2,065 | | | Petsmart Inc., Term Loan B | | | 4.000% | | | | 3-Month LIBOR | | | | 3.000% | | | | 3/11/22 | | | | B | | | | 2,042,431 | |
| | 3,951 | | | Petsmart Inc., Term Loan B, First Lien, (DD1) | | | 5.000% | | | | 3-Month LIBOR | | | | 4.000% | | | | 3/11/22 | | | | B | | | | 3,940,597 | |
| | 7,637 | | | Total Specialty Retail | | | | | | | | | | | | | | | | | | | | | | | 7,391,531 | |
| |
| | | | Technology Hardware, Storage & Peripherals – 3.2% (2.0% of Total Investments) | |
| | | | | | | |
| | 8,988 | | | Dell International LLC, Refinancing Term Loan B1 | | | 2.750% | | | | 1-Month LIBOR | | | | 2.000% | | | | 9/19/25 | | | | Baa3 | | | | 8,879,714 | |
| | 595 | | | NCR Corporation, Term Loan B | | | 2.670% | | | | 1-Month LIBOR | | | | 2.500% | | | | 8/28/26 | | | | BB+ | | | | 579,124 | |
| | 710 | | | Tech Data Corporation, Asset Based Term Loan | | | 3.667% | | | | 1-Month LIBOR | | | | 3.500% | | | | 7/01/25 | | | | BBB– | | | | 710,738 | |
| | 1,765 | | | Western Digital, Term Loan B | | | 1.911% | | | | 1-Month LIBOR | | | | 1.750% | | | | 4/29/23 | | | | BBB– | | | | 1,739,622 | |
| | 12,058 | | | Total Technology Hardware, Storage & Peripherals | | | | | | | | | | | | 11,909,198 | |
| |
| | | | Textiles, Apparel & Luxury Goods – 0.1% (0.0% of Total Investments) | |
| | | | | | | |
| | 206 | | | Samsonite Corporation, Incremental Term Loan B2 | | | 5.500% | | | | 1-Month LIBOR | | | | 4.500% | | | | 4/25/25 | | | | BB | | | | 201,751 | |
| |
| | | | Trading Companies & Distributors – 0.2% (0.1% of Total Investments) | |
| | | | | | | |
| | 592 | | | Hayward Industries, Inc., Initial Term Loan, First Lien | | | 3.661% | | | | 1-Month LIBOR | | | | 3.500% | | | | 8/04/24 | | | | B | | | | 577,983 | |
| |
| | | | Transportation Infrastructure – 0.5% (0.3% of Total Investments) | |
| | | | | | | |
| | 739 | | | Atlantic Aviation FBO Inc., Term Loan | | | 3.911% | | | | 1-Month LIBOR | | | | 3.750% | | | | 12/06/25 | | | | BB– | | | | 703,043 | |
| | 1,305 | | | Hanjin International Corp, Initial Term Loan | | | 2.661% | | | | 1-Month LIBOR | | | | 2.500% | | | | 10/18/20 | | | | B1 | | | | 1,200,600 | |
| | 2,044 | | | Total Transportation Infrastructure | | | | | | | | | | | | 1,903,643 | |
| |
| | | | Wireless Telecommunication Services – 1.0% (0.6% of Total Investments) | |
| | | | | | | |
| | 1,621 | | | Asurion LLC, Term Loan B4 | | | 3.161% | | | | 1-Month LIBOR | | | | 3.000% | | | | 8/04/22 | | | | Ba3 | | | | 1,602,600 | |
| | 1,500 | | | T-Mobile USA, Term Loan, First Lien | | | 3.161% | | | | 1-Month LIBOR | | | | 3.000% | | | | 4/01/27 | | | | BBB– | | | | 1,507,215 | |
| | 870 | | | Windstream Corporation, Term Loan, (DD1), (5) | | | 6.250% | | | | Prime | | | | 3.000% | | | | 4/24/21 | | | | D | | | | 518,520 | |
| | 3,991 | | | Total Wireless Telecommunication Services | | | | 3,628,335 | |
| $ | 556,838 | | | Total Variable Rate Senior Loan Interests (cost $542,085,014) | | | | 500,254,711 | |
65
| | |
| |
| JRO | | Nuveen Floating Rate Income Opportunity Fund (continued) |
| | Portfolio of Investments July 31, 2020 |
| | | | | | | | | | | | | | | | | | | | | | | | | | | | |
Principal
Amount (000) | | | Description (1) | | | | | | | | Coupon | | | Maturity | | | Ratings (4) | | | Value | |
| |
| | | | CORPORATE BONDS – 15.8% (9.9% of Total Investments) | |
| |
| | | | Airlines – 0.1% (0.1% of Total Investments) | |
| | | | | | | |
| $ | 805 | | | American Airlines Group Inc, 144A | | | | | | | | | | | 5.000% | | | | 6/01/22 | | | | Caa1 | | | $ | 449,601 | |
| |
| | | | Auto Components – 0.7% (0.5% of Total Investments) | |
| | | | | | | |
| | 1,330 | | | Adient Global Holdings Ltd, 144A | | | | | | | | | | | 4.875% | | | | 8/15/26 | | | | B | | | | 1,240,225 | |
| | 1,425 | | | Adient US LLC, 144A | | | | | | | | | | | 9.000% | | | | 4/15/25 | | | | Ba3 | | | | 1,587,094 | |
| | 2,755 | | | Total Auto Components | | | | | | | | | | | | | | | | | | | | | | | 2,827,319 | |
| |
| | | | Chemicals – 0.2% (0.1% of Total Investments) | |
| | | | | | | |
| | 585 | | | Olin Corp, 144A | | | | | | | | | | | 9.500% | | | | 6/01/25 | | | | BB– | | | | 666,900 | |
| |
| | | | Communications Equipment – 1.5% (1.0% of Total Investments) | |
| | | | | | | |
| | 4,482 | | | Intelsat Jackson Holdings SA, (5) | | | | | | | | | | | 5.500% | | | | 8/01/23 | | | | N/R | | | | 2,806,852 | |
| | 4,360 | | | Intelsat Jackson Holdings SA, 144A, (5) | | | | | | | | | | | 9.750% | | | | 7/15/25 | | | | N/R | | | | 2,899,400 | |
| | 8,842 | | | Total Communications Equipment | | | | | | | | | | | | | | | | | | | | | | | 5,706,252 | |
| |
| | | | Diversified Consumer Services – 0.1% (0.1% of Total Investments) | |
| | | | | | | |
| | 400 | | | Kronos Acquisition Holdings Inc, 144A | | | | | | | | | | | 9.000% | | | | 8/15/23 | | | | CCC | | | | 407,000 | |
| |
| | | | Diversified Financial Services – 0.3% (0.2% of Total Investments) | |
| | | | | | | |
| | 1,190 | | | PetSmart Inc, 144A | | | | | | | | | | | 7.125% | | | | 3/15/23 | | | | CCC+ | | | | 1,201,900 | |
| |
| | | | Diversified Telecommunication Services – 0.4% (0.3% of Total Investments) | |
| | | | | | | |
| | 865 | | | Consolidated Communications Inc | | | | | | | | | | | 6.500% | | | | 10/01/22 | | | | CCC+ | | | | 848,781 | |
| | 660 | | | CSC Holdings LLC, 144A | | | | | | | | | | | 10.875% | | | | 10/15/25 | | | | B | | | | 707,586 | |
| | 1,525 | | | Total Diversified Telecommunication Services | | | | 1,556,367 | |
| |
| | | | Electric Utilities – 5.3% (3.3% of Total Investments) | |
| | | | | |
| | 2,980 | | | Bruce Mansfield Unit 1 2007 Pass-Through Trust, (5) | | | | 6.850% | | | | 6/01/34 | | | | N/R | | | | 3,725 | |
| | 715 | | | Pacific Gas and Electric Co | | | | | | | | | | | 3.850% | | | | 11/15/23 | | | | BBB– | | | | 756,323 | |
| | 448 | | | Pacific Gas and Electric Co | | | | | | | | | | | 3.450% | | | | 7/01/25 | | | | BBB– | | | | 477,445 | |
| | 4,668 | | | Pacific Gas and Electric Co | | | | | | | | | | | 3.150% | | | | 1/01/26 | | | | BBB– | | | | 4,900,364 | |
| | 410 | | | Pacific Gas and Electric Co | | | | | | | | | | | 3.300% | | | | 12/01/27 | | | | BBB– | | | | 433,213 | |
| | 448 | | | Pacific Gas and Electric Co | | | | | | | | | | | 3.750% | | | | 7/01/28 | | | | BBB– | | | | 488,701 | |
| | 1,537 | | | Pacific Gas and Electric Co | | | | | | | | | | | 4.550% | | | | 7/01/30 | | | | BBB– | | | | 1,765,682 | |
| | 4,668 | | | Pacific Gas and Electric Co | | | | | | | | | | | 4.500% | | | | 7/01/40 | | | | BBB– | | | | 5,369,886 | |
| | 2,765 | | | Pacific Gas and Electric Co | | | | | | | | | | | 4.750% | | | | 2/15/44 | | | | BBB– | | | | 3,197,471 | |
| | 770 | | | Pacific Gas and Electric Co | | | | | | | | | | | 4.250% | | | | 3/15/46 | | | | BBB– | | | | 840,174 | |
| | 1,537 | | | Pacific Gas and Electric Co | | | | | | | | | | | 4.950% | | | | 7/01/50 | | | | BBB– | | | | 1,862,347 | |
| | 20,946 | | | Total Electric Utilities | | | | | | | | | | | | | | | | | | | | | | | 20,095,331 | |
| |
| | | | Energy Equipment & Services – 0.2% (0.1% of Total Investments) | |
| | | | | | | |
| | 745 | | | Bausch Health Cos Inc, 144A | | | | | | | | | | | 6.125% | | | | 4/15/25 | | | | B | | | | 769,213 | |
| |
| | | | Entertainment – 0.5% (0.3% of Total Investments) | |
| | | | | | | |
| | 1,415 | | | AMC Entertainment Holdings Inc, 144A | | | | | | | | | | | 10.500% | | | | 4/15/25 | | | | CCC+ | | | | 1,123,156 | |
| | 1,807 | | | AMC Entertainment Holdings Inc, 144A, (cash 10.000%, PIK 12.000%) | | | | 12.000% | | | | 6/15/26 | | | | N/R | | | | 858,325 | |
| | 3,222 | | | Total Entertainment | | | | | | | | | | | | | | | | | | | | | | | 1,981,481 | |
| |
| | | | Equity Real Estate Investment Trust – 0.8% (0.5% of Total Investments) | |
| | | | | |
| | 2,700 | | | Uniti Group LP / Uniti Fiber Holdings Inc / CSL Capital LLC, 144A | | | | 7.875% | | | | 2/15/25 | | | | B | | | | 2,841,750 | |
| |
| | | | Health Care Equipment & Supplies – 0.0% (0.0% of Total Investments) | |
| | | | | |
| | 900 | | | Mallinckrodt International Finance SA / Mallinckrodt CB LLC, 144A | | | | 5.625% | | | | 10/15/23 | | | | CC | | | | 144,000 | |
| |
| | | | Health Care Providers & Services – 0.9% (0.5% of Total Investments) | |
| | | | | | | |
| | 830 | | | AHP Health Partners Inc, 144A | | | | | | | | | | | 9.750% | | | | 7/15/26 | | | | CCC+ | | | | 881,875 | |
| | 120 | | | HCA Inc | | | | | | | | | | | 5.375% | | | | 2/01/25 | | | | Ba2 | | | | 135,300 | |
| | 705 | | | Tenet Healthcare Corp | | | | | | | | | | | 8.125% | | | | 4/01/22 | | | | B– | | | | 759,637 | |
| | 295 | | | Tenet Healthcare Corp | | | | | | | | | | | 4.625% | | | | 7/15/24 | | | | BB– | | | | 301,638 | |
| | 1,060 | | | Tenet Healthcare Corp, 144A | | | | | | | | | | | 6.250% | | | | 2/01/27 | | | | B1 | | | | 1,125,943 | |
| | 3,010 | | | Total Health Care Providers & Services | | | | 3,204,393 | |
66
| | | | | | | | | | | | | | | | | | | | | | | | | | | | |
Principal
Amount (000) | | | Description (1) | | | | | | | | Coupon | | | Maturity | | | Ratings (4) | | | Value | |
| |
| | | | Hotels, Restaurants & Leisure – 0.3% (0.1% of Total Investments) | |
| | | | | | | |
| $ | 440 | | | 1011778 BC ULC / New Red Finance Inc, 144A | | | | | | | | | | | 5.000% | | | | 10/15/25 | | | | B+ | | | $ | 451,708 | |
| | 400 | | | Carnival Corp, 144A | | | | | | | | | | | 11.500% | | | | 4/01/23 | | | | Baa3 | | | | 435,268 | |
| | 840 | | | Total Hotels, Restaurants & Leisure | | | | 886,976 | |
| |
| | | | IT Services – 0.2% (0.1% of Total Investments) | |
| | | | | |
| | 735 | | | Genesys Telecommunications Laboratories Inc/Greeneden Lux 3 Sarl/Greeneden US Ho, 144A | | | | 10.000% | | | | 11/30/24 | | | | CCC+ | | | | 784,612 | |
| |
| | | | Media – 2.3% (1.5% of Total Investments) | |
| | | | | |
| | 165 | | | CCO Holdings LLC / CCO Holdings Capital Corp, 144A | | | | 5.375% | | | | 5/01/25 | | | | BB+ | | | | 170,156 | |
| | 3,000 | | | Houghton Mifflin Harcourt Publishers Inc, 144A | | | | | | | | | | | 9.000% | | | | 2/15/25 | | | | BB– | | | | 2,895,000 | |
| | 1,911 | | | iHeartCommunications Inc | | | | | | | | | | | 8.375% | | | | 5/01/27 | | | | CCC+ | | | | 1,897,164 | |
| | 2,465 | | | iHeartCommunications Inc, 144A | | | | | | | | | | | 5.250% | | | | 8/15/27 | | | | B+ | | | | 2,489,650 | |
| | 420 | | | Intelsat Luxembourg SA, (5) | | | | | | | | | | | 8.125% | | | | 6/01/23 | | | | N/R | | | | 21,000 | |
| | 1,110 | | | Univision Communications Inc, 144A | | | | | | | | | | | 9.500% | | | | 5/01/25 | | | | B | | | | 1,212,675 | |
| | 9,071 | | | Total Media | | | | | | | | | | | | | | | | | | | | | | | 8,685,645 | |
| |
| | | | Oil, Gas & Consumable Fuels – 1.4% (0.9% of Total Investments) | |
| | | | | | | |
| | 2,935 | | | Citgo Holding Inc, 144A | | | | | | | | | | | 9.250% | | | | 8/01/24 | | | | B+ | | | | 2,935,000 | |
| | 400 | | | CITGO Petroleum Corp, 144A | | | | | | | | | | | 6.250% | | | | 8/15/22 | | | | BB | | | | 401,880 | |
| | 1,040 | | | CITGO Petroleum Corp, 144A | | | | | | | | | | | 7.000% | | | | 6/15/25 | | | | BB | | | | 1,068,600 | |
| | 540 | | | MEG Energy Corp, 144A | | | | | | | | | | | 7.000% | | | | 3/31/24 | | | | B+ | | | | 514,350 | |
| | 1,100 | | | Oasis Petroleum Inc, 144A | | | | | | | | | | | 6.250% | | | | 5/01/26 | | | | Caa1 | | | | 195,250 | |
| | 1,400 | | | Whiting Petroleum Corp, (5) | | | | | | | | | | | 6.625% | | | | 1/15/26 | | | | N/R | | | | 241,500 | |
| | 7,415 | | | Total Oil, Gas & Consumable Fuels | | | | 5,356,580 | |
| |
| | | | Pharmaceuticals – 0.5% (0.3% of Total Investments) | |
| | | | | | | |
| | 733 | | | Advanz Pharma Corp Ltd | | | | | | | | | | | 8.000% | | | | 9/06/24 | | | | B– | | | | 703,680 | |
| | 461 | | | Endo Dac / Endo Finance LLC / Endo Finco Inc, 144A | | | | 9.500% | | | | 7/31/27 | | | | CCC+ | | | | 496,727 | |
| | 582 | | | Endo Dac / Endo Finance LLC / Endo Finco Inc, 144A | | | | 6.000% | | | | 6/30/28 | | | | CCC+ | | | | 443,775 | |
| | 230 | | | Par Pharmaceutical Inc, 144A | | | | | | | | | | | 7.500% | | | | 4/01/27 | | | | B+ | | | | 244,635 | |
| | 2,006 | | | Total Pharmaceuticals | | | | | | | | | | | | | | | | | | | | | | | 1,888,817 | |
| |
| | | | Wireless Telecommunication Services – 0.1% (0.0% of Total Investments) | |
| | | | | | | |
| | 795 | | | Intelsat Connect Finance SA, 144A, (5) | | | | | | | | | | | 9.500% | | | | 2/15/23 | | | | N/R | | | | 230,550 | |
| $ | 68,487 | | | Total Corporate Bonds (cost $65,646,818) | | | | 59,684,687 | |
| | | | | | | |
| Shares | | | Description (1) | | | | | | | | | | | | | | | | | Value | |
| |
| | | | COMMON STOCKS – 2.2% (1.4% of Total Investments) | |
| |
| | | | Diversified Consumer Services – 0.0% (0.0% of Total Investments) | |
| | | | | | | |
| | 16,910 | | | Cengage Learning Holdings II Inc, (7), (8) | | | | | | | | | | | | | | | | | | | | | | $ | 39,451 | |
| |
| | | | Electric Utilities – 0.4% (0.3% of Total Investments) | |
| | | | | | | |
| | 64,338 | | | Energy Harbor Corp, (7), (8), (10) | | | | | | | | | | | | | | | | | | | | | | | 1,444,388 | |
| |
| | | | Energy Equipment & Services – 0.0% (0.0% of Total Investments) | |
| | | | | | | |
| | 63,862 | | | Transocean Ltd | | | | | | | | | | | | | | | | | | | | | | | 130,278 | |
| | 7,266 | | | Vantage Drilling International, (7), (8) | | | | | | | | | | | | | | | | | | | | | | | 42,993 | |
| | | | Total Energy Equipment & Services | | | | | | | | | | | | | | | | | | | | | | | 173,271 | |
| |
| | | | Health Care Providers & Services – 0.0% (0.0% of Total Investments) | |
| | | | | | | |
| | 50,560 | | | Millennium Health LLC, (8), (9) | | | | | | | | | | | | | | | | | | | | | | | 56,121 | |
| | 47,462 | | | Millennium Health LLC, (8), (9) | | | | | | | | | | | | | | | | | | | | | | | 47,937 | |
| | | | Total Health Care Providers & Services | | | | | | | | | | | | | | | | | | | | | | | 104,058 | |
| |
| | | | Internet & Direct Marketing Retail – 0.0% (0.0% of Total Investments) | |
| | | | | | | |
| | 12,030 | | | Catalina Marketing Corp, (7), (8) | | | | | | | | | | | | | | | | | | | | | | | 6,015 | |
67
| | |
| |
| JRO | | Nuveen Floating Rate Income Opportunity Fund (continued) |
| | Portfolio of Investments July 31, 2020 |
| | | | | | | | | | | | | | | | | | | | | | | | | | | | |
| Shares | | | Description (1) | | | | | | | | | | | | | | | | | Value | |
| |
| | | | Marine – 0.0% (0.0% of Total Investments) | |
| | | | | | | |
| | 573 | | | ACBL HLDG CORP, (7), (8) | | | | | | | | | | | | | | | | | | | | | | $ | 24,353 | |
| |
| | | | Media – 1.5% (0.9% of Total Investments) | |
| | | | | | | |
| | 640,661 | | | Clear Channel Outdoor Holdings Inc, (8) | | | | | | | | | | | | | | | | | | | | | | | 587,166 | |
| | 67,466 | | | Cumulus Media Inc, (8) | | | | | | | | | | | | | | | | | | | | | | | 265,142 | |
| | 1,318,561 | | | Hibu plc, (7), (8) | | | | | | | | | | | | | | | | | | | | | | | 92,299 | |
| | 316,926 | | | iHeartMedia Inc, (8) | | | | | | | | | | | | | | | | | | | | | | | 2,649,501 | |
| | 23,363 | | | Metro-Goldwyn-Mayer Inc, (7), (8) | | | | | | | | | | | | | | | | | | | | | | | 1,787,270 | |
| | 36,087 | | | Tribune Co, (9) | | | | | | | | | | | | | | | | | | | | | | | 36 | |
| | | | Total Media | | | | | | | | | | | | | | | | | | | | | | | 5,381,414 | |
| |
| | | | Pharmaceuticals – 0.0% (0.0% of Total Investments) | |
| | | | | | | |
| | 15,310 | | | Advanz Pharma Corp Ltd, (8) | | | | | | | | | | | | | | | | | | | | | | | 50,523 | |
| |
| | | | Software – 0.3% (0.2% of Total Investments) | |
| | | | | | | |
| | 87,097 | | | Avaya Holdings Corp, (8) | | | | | | | | | | | | | | | | | | | | | | | 1,102,648 | |
| | | | Total Common Stocks (cost $23,653,997) | | | | 8,326,121 | |
| | | | | | | |
Principal
Amount (000) | | | Description (1) | | | | | | | | Coupon | | | Maturity | | | Ratings (4) | | | Value | |
| |
| | | | ASSET-BACKED SECURITIES – 0.6% (0.4% of Total Investments) | |
| | | | | | |
| $ | 800 | | | Dryden 50 Senior Loan Fund, Series 2017-50A, 144A, (3-Month LIBOR reference rate +6.260% spread), (11) | | | | | | | | 6.535% | | | | 7/15/30 | | | | Ba3 | | | $ | 712,432 | |
| | 400 | | | Flatiron CLO 19 Ltd, Series 2019-1A, 144A, (3-Month LIBOR reference rate +7.200% spread), (11) | | | | | | | | 7.480% | | | | 11/16/32 | | | | BB– | | | | 375,614 | |
| | 750 | | | Gilbert Park CLO Ltd, Series 2017-1A, 144A, (3-Month LIBOR reference rate +6.400% spread), (11) | | | | | | | | 6.675% | | | | 10/15/30 | | | | Ba3 | | | | 677,135 | |
| | 400 | | | Neuberger Berman Loan Advisers CLO 28 Ltd, Series 2018-28A, 144A, (3-Month LIBOR reference rate +5.600% spread), (11) | | | | 5.872% | | | | 4/20/30 | | | | BB– | | | | 340,440 | |
| $ | 2,350 | | | Total Asset-Backed Securities (cost $2,324,936) | | | | 2,105,621 | |
| | | | | | | |
| Shares | | | Description (1) | | | | | | | | | | | | | | | | | Value | |
| |
| | | | WARRANTS – 0.0% (0.0% of Total Investments) | |
| |
| | | | Communications Equipment – 0.0% (0.0% of Total Investments) | |
| | | | | | | |
| | 15,619 | | | Avaya Holdings Corp, (7) | | | | | | | | | | | | | | | | | | | | | | $ | 9,372 | |
| |
| | | | Marine – 0.0% (0.0% of Total Investments) | |
| | | | | | | |
| | 603 | | | ACBL HLDG CORP, (7) | | | | | | | | | | | | | | | | | | | | | | | 21,708 | |
| | 2,243 | | | ACBL HLDG CORP, (7) | | | | | | | | | | | | | | | | | | | | | | | 56,075 | |
| | 1,706 | | | ACBL HLDG CORP, (7) | | | | | | | | | | | | | | | | | | | | | | | 52,886 | |
| | 4,552 | | | Total Marine | | | | | | | | | | | | | | | | | | | | | | | 130,669 | |
| | | | Total Warrants (cost $1,588,065) | | | | 140,041 | |
| | | | | | | |
| Shares | | | Description (1) | | | | | | | | Coupon | | | | | | Ratings (4) | | | Value | |
| |
| | | | CONVERTIBLE PREFERRED SECURITIES – 0.0% (0.0% of Total Investments) | |
| |
| | | | Marine – 0.0% (0.0% of Total Investments) | |
| | | | | | | |
| | 2,133 | | | ACBL HLDG CORP, (7) | | | | | | | | | | | 0.000% | | | | | | | | N/R | | | $ | 53,325 | |
| | 2,428 | | | ACBL HLDG CORP, (7) | | | | | | | | | | | 0.000% | | | | | | | | N/R | | | | 75,268 | |
| | | | Total Marine | | | | | | | | | | | | | | | | | | | | | | | 128,593 | |
| | | | Total Convertible Preferred Securities (cost $129,512) | | | | | | | | | | | | | | | | 128,593 | |
| | | | | | | |
| Shares | | | Description (1) | | | | | | | | | | | | | | | | | Value | |
| |
| | | | COMMON STOCK RIGHTS – 0.0% (0.0% of Total Investments) | |
| |
| | | | Oil, Gas & Consumable Fuels – 0.0% (0.0% of Total Investments) | |
| | | | | | | |
| | 13,466 | | | Fieldwood Energy Inc, (7), (8) | | | | | | | | | | | | | | | | | | | | | | $ | 673 | |
68
| | | | | | | | | | | | | | | | | | | | | | | | | | | | |
| Shares | | | Description (1) | | | | | | | | | | | | | | | | | Value | |
| |
| | | | Oil, Gas & Consumable Fuels (continued) | |
| | | | | | | |
| $ | 2,721 | | | Fieldwood Energy Inc, (7), (8) | | | | | | | | | | | | | | | | | | | | | | $ | 136 | |
| | | | Total Common Stock Rights (cost $384,387) | | | | | | | | | | | | | | | | 809 | |
| | | | Total Long-Term Investments (cost $635,812,729) | | | | | | | | | | | | | | | | 570,640,583 | |
| | | | | | | |
| Shares | | | Description (1) | | | | | | | | Coupon | | | | | | | | | Value | |
| |
| | | | SHORT-TERM INVESTMENTS – 8.8% (5.5% of Total Investments) | |
| |
| | | | INVESTMENT COMPANIES – 8.8% (5.5% of Total Investments) | |
| | | | | | | |
| | 33,358,072 | | | BlackRock Liquidity Funds T-Fund Portfolio, (12) | | | | | | | | | | | 0.065% (13) | | | | | | | | | | | $ | 33,358,072 | |
| | | | Total Short-Term Investments (cost $33,358,072) | | | | | | | | 33,358,072 | |
| | | | Total Investments (cost $669,170,801) – 160.0% | | | | | | | | 603,998,655 | |
| | | | Borrowings – (43.7)% (14), (15) | | | | | | | | (164,900,000 | ) |
| | | | Term Preferred Shares, net of deferred offering costs – (11.8)% (16) | | | | | | | | (44,596,238 | ) |
| | | | Other Assets Less Liabilities – (4.5)% (17) | | | | | | | | (17,096,635 | ) |
| | | | Net Assets Applicable to Common Shares – 100% | | | | | | | $ | 377,405,782 | |
Investment in Derivatives
Interest Rate Swaps – OTC Uncleared
| | | | | | | | | | | | | | | | | | | | | | | | | | | | | | | | |
| Counterparty | | Notional
Amount | | | Fund
Pay/Receive
Floating Rate | | | Floating Rate Index | | | Fixed Rate
(Annualized) | | | Fixed Rate
Payment
Frequency | | | Maturity
Date | | | Value | | | Unrealized
Appreciation
(Depreciation) | |
Morgan Stanley Capital Services LLC | | $ | 45,000,000 | | | | Pay | | | | 1-Month LIBOR | | | | 4.000 | % | | | Monthly | | | | 1/01/27 | (18) | | $ | 583,039 | | | $ | 583,039 | |
Total unrealized appreciation on interest rate swaps | | | | | | | | | | | | | | | | | | | $ | 583,039 | |
69
| | |
| |
| JRO | | Nuveen Floating Rate Income Opportunity Fund (continued) |
| | Portfolio of Investments July 31, 2020 |
For Fund portfolio compliance purposes, the Fund’s industry classifications refer to any one or more of the industry sub-classifications used by one or more widely recognized market indexes or ratings group indexes, and/or as defined by Fund management. This definition may not apply for purposes of this report, which may combine industry sub-classifications into sectors for reporting ease.
| (1) | All percentages shown in the Portfolio of Investments are based on net assets applicable to common shares unless otherwise noted. |
| (2) | Senior loans generally pay interest at rates which are periodically adjusted by reference to a base short-term, floating lending rate (Reference Rate) plus an assigned fixed rate (Spread). These floating lending rates are generally (i) the lending rate referenced by the London Inter-Bank Offered Rate (“LIBOR”), or (ii) the prime rate offered by one or more major United States banks. Senior loans may be considered restricted in that the Fund ordinarily is contractually obligated to receive approval from the agent bank and/or borrower prior to the disposition of a senior loan. The rate shown is the coupon as of the end of the reporting period. |
| (3) | Senior loans generally are subject to mandatory and/or optional prepayment. Because of these mandatory prepayment conditions and because there may be significant economic incentives for a borrower to prepay, prepayments of senior loans may occur. As a result, the actual remaining maturity of senior loans held may be substantially less than the stated maturities shown. |
| (4) | For financial reporting purposes, the ratings disclosed are the highest of Standard & Poor’s Group (“Standard & Poor’s”), Moody’s Investors Service, Inc. (“Moody’s”) or Fitch, Inc. (“Fitch”) rating. This treatment of split-rated securities may differ from that used for other purposes, such as for Fund investment policies. Ratings below BBB by Standard & Poor’s, Baa by Moody’s or BBB by Fitch are considered to be below investment grade. Holdings designated N/R are not rated by any of these national rating agencies. Ratings are not covered by the report of independent registered public accounting firm. |
| (5) | Defaulted security. A security whose issuer has failed to fully pay principal and/or interest when due, or is under the protection of bankruptcy. |
| (6) | Investment, or portion of investment, represents an outstanding unfunded senior loan commitment. See Notes to Financial Statements, Note 4 – Portfolio Securities and Investments in Derivatives for more information. |
| (7) | For fair value measurement disclosure purposes, investment classified as Level 2. See Notes to Financial Statements, Note 3 – Investment Valuation and Fair Value Measurements for more information. |
| (8) | Non-income producing; issuer has not declared a dividend within the past twelve months. |
| (9) | Investment valued at fair value using methods determined in good faith by, or at the discretion of, the Board. For fair value measurement disclosure purposes, investment classified as Level 3. See Notes to Financial Statements, Note 3 – Investment Valuation and Fair Value Measurements for more information. |
| (10) | Common Stock received as part of the bankruptcy settlements for Bruce Mansfield Unit 1 2007 Pass-Through Trust. |
| (11) | Variable rate security. The rate shown is the coupon as of the end of the reporting period. |
| (12) | A copy of the most recent financial statements for these investment companies can be obtained directly from the Securities and Exchange Commission on its website at http://www.sec.gov. |
| (13) | The rate shown is the annualized seven-day subsidized yield as of the end of the reporting period. |
| (14) | Borrowings as a percentage of Total Investments is 27.3%. |
| (15) | The Fund segregates 100% of its eligible investments (excluding any investments separately pledged as collateral for specific investments in derivatives, when applicable) in the Portfolio of Investments as collateral for borrowings. |
| (16) | Term Preferred Shares, net of deferred offering costs as a percentage of Total Investments is 7.4%. |
| (17) | Other assets less liabilities includes the unrealized appreciation (depreciation) of certain over-the-counter (“OTC”) derivatives as presented on the Statement of Assets and Liabilities, when applicable. The unrealized appreciation (depreciation) of OTC cleared and exchange-traded derivatives is recognized as part of the cash collateral at brokers and/or the receivable or payable for variation margin as presented on the Statement of Assets and Liabilities, when applicable. |
| (18) | This interest rate swap has an optional early termination date beginning on January 1, 2021 and monthly thereafter through the termination date as specified in the swap contract. |
| 144A | Investment is exempt from registration under Rule 144A of the Securities Act of 1933, as amended. These investments may only be resold in transactions exempt from registration, which are normally those transactions with qualified institutional buyers. |
| DD1 | Portion of investment purchased on a delayed delivery basis. |
| LIBOR | London Inter-Bank Offered Rate |
| PIK | Payment-in-kind (“PIK”) security. Depending on the terms of the security, income may be received in the form of cash, securities, or a combination of both. The PIK rate shown, where applicable, represents the annualized rate of the last PIK payment made by the issuer as of the end of the reporting period. |
| TBD | Senior loan purchased on a when-issued or delayed-delivery basis. Certain details associated with this purchase are not known prior to the settlement date of the transaction. In addition, senior loans typically trade without accrued interest and therefore a coupon rate is not available prior to settlement. At settlement, if still unknown, the borrower or counterparty will provide the Fund with the final coupon rate and maturity date. |
| WI/DD | Purchased on a when-issued or delayed delivery basis. |
See accompanying notes to financial statements.
70
| | |
| JSD | | Nuveen Short Duration Credit
Opportunities Fund Portfolio of Investments July 31, 2020 |
| | | | | | | | | | | | | | | | | | | | | | | | | | | | |
Principal
Amount (000) | | | Description (1) | | Coupon (2) | | | Reference
Rate (2) | | | Spread (2) | | | Maturity (3) | | | Ratings (4) | | | Value | |
| |
| | | | LONG-TERM INVESTMENTS – 152.6% (96.0% of Total Investments) | |
| |
| | | | VARIABLE RATE SENIOR LOAN INTERESTS – 134.2% (84.5% of Total Investments) (2) | |
| |
| | | | Aerospace & Defense – 3.8% (2.4% of Total Investments) | |
| | | | | | | |
| $ | 386 | | | Standard Aero, Term Loan B1 | | | 3.808% | | | | 3-Month LIBOR | | | | 3.500% | | | | 4/08/26 | | | | B– | | | $ | 311,630 | |
| | 360 | | | MacDonald, Dettwiler and Associates, Ltd., Term Loan B | | | 2.911% | | | | 1-Month LIBOR | | | | 2.750% | | | | 10/05/24 | | | | B | | | | 346,572 | |
| | 2,349 | | | Sequa Corporation, Term Loan B | | | 6.000% | | | | 3-Month LIBOR | | | | 5.000% | | | | 11/28/21 | | | | B– | | | | 2,229,822 | |
| | 769 | | | Sequa Corporation, Term Loan, Second Lien | | | 11.250% | | | | Prime | | | | 8.000% | | | | 4/28/22 | | | | CCC– | | | | 590,924 | |
| | 207 | | | Standard Aero, Term Loan B2 | | | 3.808% | | | | 3-Month LIBOR | | | | 3.500% | | | | 4/08/26 | | | | B– | | | | 167,543 | |
| | 1,845 | | | Transdigm, Inc., Term Loan F | | | 2.411% | | | | 1-Month LIBOR | | | | 2.250% | | | | 12/09/25 | | | | Ba3 | | | | 1,731,680 | |
| | 5,916 | | | Total Aerospace & Defense | | | | | | | | | | | | | | | | | | | | | | | 5,378,171 | |
| |
| | | | Air Freight & Logistics – 1.0% (0.7% of Total Investments) | |
| | | | | | | |
| | 746 | | | PAE Holding Corporation, Term Loan B | | | 6.500% | | | | 2-Month LIBOR | | | | 5.500% | | | | 10/20/22 | | | | B+ | | | | 742,648 | |
| | 722 | | | XPO Logistics, Inc., Term Loan B | | | 2.161% | | | | 1-Month LIBOR | | | | 2.000% | | | | 2/24/25 | | | | BBB– | | | | 714,995 | |
| | 1,468 | | | Total Air Freight & Logistics | | | | | | | | | | | | | | | | | | | | | | | 1,457,643 | |
| |
| | | | Airlines – 2.2% (1.4% of Total Investments) | |
| | | | | | | |
| | 1,460 | | | American Airlines, Inc., Term Loan B | | | 2.184% | | | | 1-Month LIBOR | | | | 2.000% | | | | 4/28/23 | | | | Ba3 | | | | 1,118,125 | |
| | 778 | | | American Airlines, Inc., Term Loan B | | | 1.916% | | | | 1-Month LIBOR | | | | 1.750% | | | | 1/29/27 | | | | Ba3 | | | | 548,571 | |
| | 1,249 | | | American Airlines, Inc., Term Loan B | | | 2.175% | | | | 1-Month LIBOR | | | | 2.000% | | | | 12/14/23 | | | | Ba3 | | | | 951,069 | |
| | 650 | | | WestJet Airlines, Term Loan, (DD1) | | | 4.000% | | | | 6-Month LIBOR | | | | 3.000% | | | | 12/11/26 | | | | BB+ | | | | 484,930 | |
| | 4,137 | | | Total Airlines | | | | | | | | | | | | | | | | | | | | | | | 3,102,695 | |
| |
| | | | Auto Components – 1.6% (1.0% of Total Investments) | |
| | | | | | | |
| | 100 | | | Adient Global Holdings, Initial Term Loan, (WI/DD) | | | TBD | | | | TBD | | | | TBD | | | | TBD | | | | Ba3 | | | | 98,647 | |
| | 834 | | | DexKo Global, Inc., Term Loan B | | | 4.500% | | | | 1-Month LIBOR | | | | 3.500% | | | | 7/24/24 | | | | B1 | | | | 798,881 | |
| | 992 | | | Johnson Controls Inc., Term Loan B | | | 3.667% | | | | 1-Month LIBOR | | | | 3.500% | | | | 4/30/26 | | | | B1 | | | | 971,821 | |
| | 449 | | | Superior Industries International, Inc., Term Loan B | | | 4.161% | | | | 1-Month LIBOR | | | | 4.000% | | | | 5/23/24 | | | | B1 | | | | 413,148 | |
| | 2,375 | | | Total Auto Components | | | | | | | | | | | | | | | | | | | | | | | 2,282,497 | |
| |
| | | | Beverages – 0.4% (0.2% of Total Investments) | |
| | | | | | | |
| | 533 | | | Jacobs Douwe Egberts, Term Loan B | | | 2.188% | | | | 1-Month LIBOR | | | | 2.000% | | | | 11/01/25 | | | | BB+ | | | | 525,683 | |
| |
| | | | Biotechnology – 0.6% (0.4% of Total Investments) | |
| | | | | | | |
| | 912 | | | Grifols, Inc., Term Loan B, First Lien | | | 2.111% | | | | 1-Week LIBOR | | | | 2.000% | | | | 11/15/27 | | | | Ba2 | | | | 894,553 | |
| |
| | | | Building Products – 1.0% (0.6% of Total Investments) | |
| | | | | | | |
| | 320 | | | Ply Gem Industries, Inc., Term Loan B | | | 3.928% | | | | 1-Month LIBOR | | | | 3.750% | | | | 4/12/25 | | | | B+ | | | | 314,773 | |
| | 1,138 | | | Quikrete Holdings, Inc., Term Loan B | | | 2.661% | | | | 1-Month LIBOR | | | | 2.500% | | | | 2/01/27 | | | | BB– | | | | 1,102,786 | |
| | 1,458 | | | Total Building Products | | | | | | | | | | | | | | | | | | | | | | | 1,417,559 | |
| |
| | | | Capital Markets – 0.5% (0.3% of Total Investments) | |
| | | | | | | |
| | 593 | | | RPI Finance Trust, Term Loan B1 | | | 1.911% | | | | 1-Month LIBOR | | | | 1.750% | | | | 2/11/27 | | | | BBB– | | | | 588,238 | |
| | 179 | | | RPI Finance Trust, Term Loan B1 | | | 1.911% | | | | 1-Month LIBOR | | | | 1.750% | | | | 2/11/27 | | | | BBB– | | | | 176,559 | |
| | 772 | | | Total Capital Markets | | | | | | | | | | | | | | | | | | | | | | | 764,797 | |
| |
| | | | Chemicals – 1.0% (0.6% of Total Investments) | |
| | | | | | | |
| | 417 | | | Ineos US Finance LLC, Term Loan | | | 2.214% | | | | 2-Month LIBOR | | | | 2.000% | | | | 3/31/24 | | | | BBB– | | | | 402,562 | |
| | 250 | | | Lummus Technology, Term Loan | | | 4.308% | | | | 3-Month LIBOR | | | | 4.000% | | | | 6/30/27 | | | | B+ | | | | 247,812 | |
| | 320 | | | PQ Corporation, Incremental Term Loan B, (WI/DD) | | | TBD | | | | TBD | | | | TBD | | | | TBD | | | | BB– | | | | 319,034 | |
| | 387 | | | Univar, Inc., Term Loan B | | | 2.411% | | | | 1-Month LIBOR | | | | 2.250% | | | | 7/01/24 | | | | BB+ | | | | 380,386 | |
| | 1,374 | | | Total Chemicals | | | | 1,349,794 | |
71
| | |
| |
| JSD | | Nuveen Short Duration Credit Opportunities Fund (continued) |
| | Portfolio of Investments July 31, 2020 |
| | | | | | | | | | | | | | | | | | | | | | | | | | | | |
Principal
Amount (000) | | | Description (1) | | Coupon (2) | | | Reference
Rate (2) | | | Spread (2) | | | Maturity (3) | | | Ratings (4) | | | Value | |
| |
| | | | Commercial Services & Supplies – 4.4% (2.8% of Total Investments) | |
| | | | | | | |
| $ | 329 | | | ADS Waste Holdings, Inc., Term Loan B | | | 3.000% | | | | 1-Week LIBOR | | | | 2.250% | | | | 11/10/23 | | | | BB+ | | | $ | 327,567 | |
| | 360 | | | Brand Energy & Infrastructure Services, Inc., Term Loan B, First Lien, (DD1) | | | 5.250% | | | | 3-Month LIBOR | | | | 4.250% | | | | 6/21/24 | | | | B– | | | | 329,710 | |
| | 2,878 | | | Formula One Group, Term Loan B | | | 3.500% | | | | 1-Month LIBOR | | | | 2.500% | | | | 2/01/24 | | | | B+ | | | | 2,795,129 | |
| | 289 | | | Garda World Security Corp, Term Loan B, First Lien | | | 4.930% | | | | 1-Month LIBOR | | | | 4.750% | | | | | | | | B | | | | 286,584 | |
| | 674 | | | GFL Environmental, Term Loan | | | 4.000% | | | | 3-Month LIBOR | | | | 3.000% | | | | 5/31/25 | | | | BB– | | | | 671,599 | |
| | 750 | | | iQor US, Inc., Term Loan, First Lien, (5) | | | 0.000% | | | | N/A | | | | N/A | | | | 4/01/21 | | | | CC | | | | 529,138 | |
| | 167 | | | iQor US, Inc., Term Loan, Second Lien, (5) | | | 0.000% | | | | N/A | | | | N/A | | | | 4/01/22 | | | | C | | | | 41,070 | |
| | 278 | | | KAR Auction Services, Inc., Term Loan B6 | | | 2.438% | | | | 1-Month LIBOR | | | | 2.250% | | | | 9/19/26 | | | | Ba3 | | | | 269,026 | |
| | 69 | | | Pitney Bowes Inc., Term Loan B | | | 5.661% | | | | 1-Month LIBOR | | | | 5.500% | | | | 1/07/25 | | | | BBB– | | | | 64,761 | |
| | 425 | | | Robertshaw US Holding Corp., Initial Term Loan, First Lien | | | 4.250% | | | | 1-Month LIBOR | | | | 3.250% | | | | 2/28/25 | | | | B3 | | | | 359,304 | |
| | 1 | | | Robertshaw US Holding Corp., Initial Term Loan, First Lien | | | 4.250% | | | | 6-Month LIBOR | | | | 3.250% | | | | 2/28/25 | | | | B3 | | | | 921 | |
| | 109 | | | Sabert Corporation, Initial Term Loan | | | 5.500% | | | | 1-Month LIBOR | | | | 4.500% | | | | 12/10/26 | | | | B | | | | 108,857 | |
| | 134 | | | Harland Clarke Holdings Corporation, Term Loan B7 | | | 5.750% | | | | 3-Month LIBOR | | | | 4.750% | | | | 11/03/23 | | | | CCC+ | | | | 95,177 | |
| | 327 | | | West Corporation, Incremental Term Loan B1 | | | 4.500% | | | | 3-Month LIBOR | | | | 3.500% | | | | 10/10/24 | | | | BB+ | | | | 286,098 | |
| | 6,790 | | | Total Commercial Services & Supplies | | | | 6,164,941 | |
| |
| | | | Communications Equipment – 3.3% (2.1% of Total Investments) | |
| | | | | | | |
| | 2,495 | | | Avaya, Inc., Term Loan B | | | 4.425% | | | | 1-Month LIBOR | | | | 4.250% | | | | 12/15/24 | | | | BB– | | | | 2,366,354 | |
| | 865 | | | CommScope, Inc., Term Loan B | | | 3.411% | | | | 1-Month LIBOR | | | | 3.250% | | | | 4/04/26 | | | | Ba3 | | | | 850,415 | |
| | 665 | | | Mitel US Holdings, Inc., Term Loan, First Lien | | | 4.666% | | | | 1-Month LIBOR | | | | 4.500% | | | | 11/30/25 | | | | B– | | | | 549,051 | |
| | 563 | | | Plantronics, Term Loan B, (DD1) | | | 2.861% | | | | 6-Month LIBOR | | | | 2.500% | | | | 7/02/25 | | | | Ba2 | | | | 522,076 | |
| | 379 | | | Riverbed Technology, Inc., Term Loan B, First Lien | | | 3.511% | | | | 3-Month LIBOR | | | | 3.250% | | | | 4/24/22 | | | | B2 | | | | 346,154 | |
| | 67 | | | Univision Communications, Inc., Term Loan C5 | | | 3.750% | | | | 1-Month LIBOR | | | | 2.750% | | | | 3/15/24 | | | | B | | | | 64,230 | |
| | 5,034 | | | Total Communications Equipment | | | | 4,698,280 | |
| |
| | | | Construction & Engineering – 0.8% (0.5% of Total Investments) | |
| | | | | | | |
| | 1,307 | | | Traverse Midstream Partners, Term Loan B | | | 5.000% | | | | 1-Month LIBOR | | | | 4.000% | | | | 9/27/24 | | | | B | | | | 1,148,569 | |
| |
| | | | Consumer Finance – 0.5% (0.3% of Total Investments) | |
| | | | | | | |
| | 730 | | | Verscend Technologies, Tern Loan B | | | 4.661% | | | | 1-Month LIBOR | | | | 4.500% | | | | 8/27/25 | | | | B+ | | | | 728,860 | |
| |
| | | | Containers & Packaging – 1.3% (0.8% of Total Investments) | |
| | | | | | | |
| | 742 | | | Berry Global, Inc., Term Loan Y | | | 2.188% | | | | 1-Month LIBOR | | | | 2.000% | | | | 7/01/26 | | | | BBB– | | | | 721,966 | |
| | 339 | | | Berry Global, Inc., Term Loan W | | | 2.188% | | | | 1-Month LIBOR | | | | 2.000% | | | | 10/01/22 | | | | BBB– | | | | 333,448 | |
| | 831 | | | Reynolds Group Holdings, Inc., Term Loan, First Lien | | | 1.911% | | | | 1-Month LIBOR | | | | 1.750% | | | | 2/04/27 | | | | BB+ | | | | 817,035 | |
| | 1,912 | | | Total Containers & Packaging | | | | 1,872,449 | |
| |
| | | | Distributors – 0.6% (0.3% of Total Investments) | |
| | | | | | | |
| | 210 | | | Insurance Auto Actions Inc., Term Loan | | | 2.438% | | | | 1-Month LIBOR | | | | 2.250% | | | | 6/28/26 | | | | BB+ | | | | 206,336 | |
| | 573 | | | SRS Distribution, Inc., Term Loan B | | | 4.072% | | | | 3-Month LIBOR | | | | 3.000% | | | | 5/24/25 | | | | B | | | | 555,889 | |
| | 783 | | | Total Distributors | | | | 762,225 | |
| |
| | | | Diversified Consumer Services – 1.6% (1.0% of Total Investments) | |
| | | | | | | |
| | 1,352 | | | Cengage Learning Acquisitions, Inc., Term Loan B | | | 5.250% | | | | 6-Month LIBOR | | | | 4.250% | | | | 6/07/23 | | | | B | | | | 1,109,137 | |
| | 1,169 | | | Refinitiv, Term Loan B | | | 3.411% | | | | 1-Month LIBOR | | | | 3.250% | | | | 10/01/25 | | | | BB+ | | | | 1,161,740 | |
| | 2,521 | | | Total Diversified Consumer Services | | | | 2,270,877 | |
| |
| | | | Diversified Financial Services – 1.6% (1.0% of Total Investments) | |
| | | | | | | |
| | 421 | | | Blackstone CQP, Term Loan | | | 3.806% | | | | 3-Month LIBOR | | | | 3.500% | | | | 9/30/24 | | | | B+ | | | | 410,757 | |
| | 990 | | | Ditech Holding Corporation., Term Loan B, First Lien, (5) | | | 0.000% | | | | N/A | | | | N/A | | | | 6/30/22 | | | | D | | | | 232,688 | |
| | 873 | | | Inmarsat Finance, Term Loan, First Lien | | | 5.500% | | | | 1-Month LIBOR | | | | 4.500% | | | | 12/12/26 | | | | B+ | | | | 852,812 | |
| | 335 | | | Lions Gate Entertainment Corp., Term Loan B | | | 2.411% | | | | 1-Month LIBOR | | | | 2.250% | | | | 3/24/25 | | | | Ba2 | | | | 323,966 | |
| | 370 | | | Sotheby’s, Term Loan B | | | 6.500% | | | | 1-Month LIBOR | | | | 5.500% | | | | 1/15/27 | | | | B+ | | | | 354,684 | |
| | 2,989 | | | Total Diversified Financial Services | | | | 2,174,907 | |
72
| | | | | | | | | | | | | | | | | | | | | | | | | | | | |
Principal
Amount (000) | | | Description (1) | | Coupon (2) | | | Reference
Rate (2) | | | Spread (2) | | | Maturity (3) | | | Ratings (4) | | | Value | |
| |
| | | | Diversified Telecommunication Services – 6.5% (4.1% of Total Investments) | |
| | | | | | | |
| $ | 379 | | | Altice France S.A., Term Loan B12 | | | 3.862% | | | | 1-Month LIBOR | | | | 3.688% | | | | 1/31/26 | | | | B | | | $ | 372,075 | |
| | 3,300 | | | CenturyLink, Inc, Term Loan B | | | 2.411% | | | | 1-Month LIBOR | | | | 2.250% | | | | 3/15/27 | | | | BB+ | | | | 3,186,747 | |
| | 210 | | | Consolidated Communications Holdings, Initial Term Loan, (WI/DD) | | | TBD | | | | TBD | | | | TBD | | | | TBD | | | | B+ | | | | 204,268 | |
| | 3,407 | | | Frontier Communications Corporation, Term Loan B, (DD1), (5) | | | 3.911% | | | | 1-Month LIBOR | | | | 3.750% | | | | 6/15/24 | | | | N/R | | | | 3,364,312 | |
| | 195 | | | Intelsat Jackson Holdings, S.A., Term Loan B4, (5) | | | 8.750% | | | | Prime | | | | 5.500% | | | | 1/02/24 | | | | B | | | | 196,933 | |
| | 312 | | | Intelsat Jackson Holdings, S.A., Term Loan B5, (5) | | | 8.625% | | | | N/A | | | | N/A | | | | 1/02/24 | | | | B | | | | 315,550 | |
| | 1,368 | | | Numericable Group S.A., Term Loan B13 | | | 4.175% | | | | 1-Month LIBOR | | | | 4.000% | | | | 8/14/26 | | | | B | | | | 1,342,750 | |
| | 110 | | | Zayo Group LLC, Initial Dollar Term Loan | | | 3.161% | | | | 1-Month LIBOR | | | | 3.000% | | | | 3/09/27 | | | | B1 | | | | 106,870 | |
| | 9,281 | | | Total Diversified Telecommunication Services | | | | 9,089,505 | |
| |
| | | | Electric Utilities – 0.8% (0.5% of Total Investments) | |
| | | | | | | |
| | 345 | | | ExGen Renewables, Term Loan | | | 4.000% | | | | 3-Month LIBOR | | | | 3.000% | | | | 11/28/24 | | | | BB– | | | | 341,701 | |
| | 250 | | | Pacific Gas & Electric, Term Loan, First Lien | | | 5.500% | | | | 3-Month LIBOR | | | | 4.500% | | | | 6/23/25 | | | | BB | | | | 247,812 | |
| | 574 | | | Vistra Operations Co., Term Loan B3 | | | 1.911% | | | | 1-Month LIBOR | | | | 1.750% | | | | 12/31/25 | | | | Baa3 | | | | 566,254 | |
| | 1,169 | | | Total Electric Utilities | | | | 1,155,767 | |
| |
| | | | Electrical Equipment – 0.8% (0.5% of Total Investments) | |
| | | | | | | |
| | 724 | | | Avolon LLC, Term Loan B4 | | | 2.250% | | | | 1-Month LIBOR | | | | 1.500% | | | | 2/10/27 | | | | Baa2 | | | | 679,537 | |
| | 499 | | | Vertiv Co.,Term Loan B | | | 3.162% | | | | 1-Month LIBOR | | �� | | 3.000% | | | | 3/02/27 | | | | B+ | | | | 488,775 | |
| | 1,223 | | | Total Electrical Equipment | | | | 1,168,312 | |
| |
| | | | Electronic Equipment, Instruments & Components – 0.3% (0.2% of Total Investments) | |
| | | | | | | |
| | 405 | | | TTM Technologies, Inc., Term Loan B | | | 2.671% | | | | 1-Month LIBOR | | | | 2.500% | | | | 9/28/24 | | | | BB+ | | | | 399,375 | |
| |
| | | | Entertainment – 0.6% (0.4% of Total Investments) | |
| | | | | | | |
| | 478 | | | AMC Entertainment, Inc., Term Loan B | | | 4.080% | | | | 6-Month LIBOR | | | | 3.000% | | | | 4/22/26 | | | | CCC+ | | | | 316,491 | |
| | 500 | | | Springer SBM Two GmbH, Term Loan B16 | | | 4.500% | | | | 1-Month LIBOR | | | | 3.500% | | | | 8/14/24 | | | | B2 | | | | 494,624 | |
| | 978 | | | Total Entertainment | | | | 811,115 | |
| |
| | | | Equity Real Estate Investment Trust – 0.6% (0.4% of Total Investments) | |
| | | | | | | |
| | 947 | | | Realogy Group LLC, Term Loan A, (DD1) | | | 2.437% | | | | 1-Month LIBOR | | | | 2.250% | | | | 2/08/23 | | | | BB– | | | | 890,436 | |
| |
| | | | Food & Staples Retailing – 1.8% (1.2% of Total Investments) | |
| | | | | | | |
| | 488 | | | BellRing Brands, Term Loan, First Lien | | | 6.000% | | | | 1-Month LIBOR | | | | 5.000% | | | | 10/21/24 | | | | B+ | | | | 490,776 | |
| | 116 | | | BJ’s Wholesale Club, Inc., Term Loan, First Lien | | | 2.178% | | | | 1-Month LIBOR | | | | 2.000% | | | | 2/03/24 | | | | BB | | | | 115,088 | |
| | 2,084 | | | US Foods, Inc., New Term Loan | | | 1.911% | | | | 1-Month LIBOR | | | | 1.750% | | | | 6/27/23 | | | | BB | | | | 1,982,568 | |
| | 2,688 | | | Total Food & Staples Retailing | | | | 2,588,432 | |
| |
| | | | Food Products – 0.5% (0.3% of Total Investments) | |
| | | | | | | |
| | 557 | | | American Seafoods Group LLC, Term Loan B | | | 3.750% | | | | 3-Month LIBOR | | | | 2.750% | | | | 8/21/23 | | | | BB– | | | | 548,789 | |
| | 150 | | | Froneri Lux FinCo SARL, Term Loan, First Lien | | | 2.411% | | | | 1-Month LIBOR | | | | 2.250% | | | | 1/31/27 | | | | B1 | | | | 144,295 | |
| | 707 | | | Total Food Products | | | | | | | | | | | | | | | | | | | | | | | 693,084 | |
| |
| | | | Health Care Equipment & Supplies – 1.2% (0.8% of Total Investments) | |
| | | | | | | |
| | 545 | | | Greatbatch Ltd., New Term Loan B | | | 3.500% | | | | 1-Month LIBOR | | | | 2.500% | | | | 10/27/22 | | | | B+ | | | | 540,328 | |
| | 127 | | | LifeScan, Term Loan B | | | 7.175% | | | | 3-Month LIBOR | | | | 6.000% | | | | 10/01/24 | | | | B | | | | 117,147 | |
| | 536 | | | MedPlast, Term Loan, First Lien | | | 3.911% | | | | 1-Month LIBOR | | | | 3.750% | | | | 7/02/25 | | | | B3 | | | | 467,900 | |
| | 714 | | | Vyaire Medical, Inc., Term Loan B | | | 5.750% | | | | 3-Month LIBOR | | | | 4.750% | | | | 4/30/25 | | | | B3 | | | | 596,804 | |
| | 1,922 | | | Total Health Care Equipment & Supplies | | | | | | | | 1,722,179 | |
| |
| | | | Health Care Providers & Services – 11.9% (7.5% of Total Investments) | |
| | | | | | | |
| | 1,433 | | | Air Medical Group Holdings, Inc., Term Loan B | | | 4.250% | | | | 6-Month LIBOR | | | | 3.250% | | | | 4/28/22 | | | | B1 | | | | 1,418,945 | |
| | 239 | | | Air Methods, Term Loan, First Lien | | | 4.500% | | | | 3-Month LIBOR | | | | 3.500% | | | | 4/21/24 | | | | B | | | | 192,381 | |
| | 483 | | | Ardent Health, Term Loan, First Lien | | | 5.500% | | | | 1-Month LIBOR | | | | 4.500% | | | | 6/28/25 | | | | B1 | | | | 480,863 | |
| | 284 | | | Jordan Health, Initial Term Loan, First Lien | | | 5.386% | | | | 3-Month LIBOR | | | | 5.000% | | | | 5/15/25 | | | | Caa1 | | | | 234,092 | |
| | 494 | | | Catalent Pharma Solutions, Inc., Dollar Term Loan B2 | | | 3.250% | | | | 1-Month LIBOR | | | | 2.250% | | | | 5/17/26 | | | | BB+ | | | | 492,311 | |
| | 292 | | | Civitas Solutions, Term Loan B | | | 4.420% | | | | 1-Month LIBOR | | | | 4.250% | | | | 3/08/26 | | | | B | | | | 287,039 | |
| | 13 | | | Civitas Solutions, Term Loan C | | | 4.420% | | | | 1-Month LIBOR | | | | 4.250% | | | | 3/08/26 | | | | B | | | | 13,069 | |
| | 201 | | | DaVita, Inc., Term Loan B | | | 1.911% | | | | 1-Month LIBOR | | | | 1.750% | | | | 8/12/26 | | | | BBB– | | | | 197,304 | |
73
| | |
| |
| JSD | | Nuveen Short Duration Credit Opportunities Fund (continued) |
| | Portfolio of Investments July 31, 2020 |
| | | | | | | | | | | | | | | | | | | | | | | | | | | | |
Principal
Amount (000) | | | Description (1) | | Coupon (2) | | | Reference
Rate (2) | | | Spread (2) | | | Maturity (3) | | | Ratings (4) | | | Value | |
| |
| | | | Health Care Providers & Services (continued) | |
| | | | | | | |
| $ | 916 | | | Envision Healthcare Corporation, Initial Term Loan | | | 3.911% | | | | 1-Month LIBOR | | | | 3.750% | | | | 10/10/25 | | | | Caa1 | | | $ | 609,516 | |
| | 67 | | | HCA, Inc., Term Loan B13 | | | 1.911% | | | | 1-Month LIBOR | | | | 1.750% | | | | 3/18/26 | | | | BBB– | | | | 66,379 | |
| | 465 | | | Heartland Dental Care, Inc., Term Loan, First Lien | | | 3.661% | | | | 1-Month LIBOR | | | | 3.500% | | | | 4/30/25 | | | | B3 | | | | 413,828 | |
| | 1,496 | | | Kindred at Home Hospice, Term Loan B, First Lien | | | 3.438% | | | | 1-Month LIBOR | | | | 3.250% | | | | 7/02/25 | | | | B1 | | | | 1,478,107 | |
| | 1,971 | | | Lifepoint Health, Inc., New Term Loan B | | | 3.911% | | | | 1-Month LIBOR | | | | 3.750% | | | | 11/16/25 | | | | B1 | | | | 1,932,221 | |
| | 488 | | | InnovaCare, Initial Term Loan | | | 6.750% | | | | 3-Month LIBOR | | | | 5.750% | | | | 11/06/26 | | | | B+ | | | | 476,531 | |
| | 4,128 | | | Pharmaceutical Product Development, Inc., Term Loan B | | | 3.500% | | | | 1-Month LIBOR | | | | 2.500% | | | | 8/18/22 | | | | Ba2 | | | | 4,117,611 | |
| | 933 | | | Brightspring Health, Term Loan B | | | 3.425% | | | | 1-Month LIBOR | | | | 3.250% | | | | 3/05/26 | | | | B1 | | | | 915,345 | |
| | 103 | | | Quorum Health Corp, Term Loan, (5) | | | 9.250% | | | | 3-Month LIBOR | | | | 8.250% | | | | 4/29/22 | | | | N/R | | | | 96,060 | |
| | 1,955 | | | Select Medical Corporation, Term Loan B | | | 2.680% | | | | 1-Month LIBOR | | | | 2.500% | | | | 3/06/25 | | | | Ba2 | | | | 1,907,210 | |
| | 691 | | | Surgery Center Holdings Inc., Initial Term Loan, (DD1) | | | 4.250% | | | | 1-Month LIBOR | | | | 3.250% | | | | 9/03/24 | | | | B2 | | | | 655,033 | |
| | 1,027 | | | Team Health, Inc., Initial Term Loan | | | 3.750% | | | | 1-Month LIBOR | | | | 2.750% | | | | 2/06/24 | | | | B+ | | | | 820,045 | |
| | 17,679 | | | Total Health Care Providers & Services | | | | | | | | 16,803,890 | |
| |
| | | | Health Care Technology – 2.9% (1.9% of Total Investments) | |
| | | | | | | |
| | 861 | | | Onex Carestream Finance LP, New Extended Term Loan, Second Lien | | | 5.572% | | | | 3-Month LIBOR | | | | 4.500% | | | | 8/05/23 | | | | Caa1 | | | | 693,370 | |
| | 1,402 | | | Onex Carestream Finance LP, New Extended Term Loan, First Lien | | | 7.822% | | | | 6-Month LIBOR | | | | 6.750% | | | | 5/05/23 | | | | B1 | | | | 1,337,435 | |
| | 51 | | | Emdeon, Inc., Term Loan | | | 3.500% | | | | 1-Month LIBOR | | | | 2.500% | | | | 3/01/24 | | | | B+ | | | | 50,379 | |
| | 1,252 | | | Emdeon, Inc., Term Loan | | | 3.500% | | | | 3-Month LIBOR | | | | 2.500% | | | | 3/01/24 | | | | B+ | | | | 1,228,671 | |
| | 846 | | | Zelis, Term Loan B | | | 4.911% | | | | 1-Month LIBOR | | | | 4.750% | | | | 9/30/26 | | | | B | | | | 845,298 | |
| | 4,412 | | | Total Health Care Technology | | | | | | | | | | | | | | | | | | | | | | | 4,155,153 | |
| | | |
| | | | Hotels, Restaurants & Leisure – 13.6% (8.5% of Total Investments) | | | | | | | |
| | | | | | | |
| | 300 | | | 24 Hour Fitness Worldwide, Inc., DIP Term Loan, (5), (9) | | | 11.000% | | | | 3-Month LIBOR | | | | 10.000% | | | | 6/15/21 | | | | B2 | | | | 289,210 | |
| | 1,008 | | | 24 Hour Fitness Worldwide, Inc., Term Loan B, (5) | | | 0.000% | | | | N/A | | | | N/A | | | | 5/31/25 | | | | D | | | | 238,384 | |
| | 219 | | | Boyd Gaming Corporation, Refinancing Term Loan B | | | 2.361% | | | | 1-Week LIBOR | | | | 2.250% | | | | 9/15/23 | | | | BB– | | | | 212,557 | |
| | 2,164 | | | Burger King Corporation, Term Loan B4 | | | 1.911% | | | | 1-Month LIBOR | | | | 1.750% | | | | 11/19/26 | | | | BB+ | | | | 2,081,314 | |
| | 125 | | | Caesars Resort Collection, Term Loan | | | 4.772% | | | | 3-Month LIBOR | | | | 4.500% | | | | 7/20/25 | | | | B+ | | | | 120,762 | |
| | 250 | | | Caesars Resort Collection, Term Loan | | | 4.687% | | | | 1-Month LIBOR | | | | 4.500% | | | | 7/20/25 | | | | B+ | | | | 241,524 | |
| | 3,854 | | | Caesars Resort Collection, Term Loan, First Lien | | | 2.911% | | | | 1-Month LIBOR | | | | 2.750% | | | | 12/22/24 | | | | B+ | | | | 3,557,275 | |
| | 1,103 | | | CCM Merger, Inc., Term Loan B | | | 3.000% | | | | 1-Month LIBOR | | | | 2.250% | | | | 8/09/21 | | | | BB | | | | 1,086,634 | |
| | 1,604 | | | CityCenter Holdings LLC, Term Loan B | | | 3.000% | | | | 1-Month LIBOR | | | | 2.250% | | | | 4/18/24 | | | | B+ | | | | 1,489,585 | |
| | 1,076 | | | ClubCorp Operations, Inc., Term Loan B | | | 3.058% | | | | 3-Month LIBOR | | | | 2.750% | | | | 9/18/24 | | | | B– | | | | 932,269 | |
| | 1,447 | | | Equinox Holdings, Inc., Term Loan B1 | | | 4.072% | | | | 6-Month LIBOR | | | | 3.000% | | | | 3/08/24 | | | | Caa1 | | | | 1,097,699 | |
| | 379 | | | Golden Nugget LLC, Initial Term Loan B | | | 3.250% | | | | 1-Month LIBOR | | | | 2.500% | | | | 10/04/23 | | | | B | | | | 319,704 | |
| | 127 | | | Hilton Hotels, Term Loan B2 | | | 1.922% | | | | 1-Month LIBOR | | | | 1.750% | | | | 6/21/26 | | | | BBB– | | | | 122,765 | |
| | 1,092 | | | Life Time Fitness, Inc., Term Loan B | | | 3.750% | | | | 3-Month LIBOR | | | | 2.750% | | | | 6/15/22 | | | | B | | | | 990,123 | |
| | 3 | | | Life Time Fitness, Inc., Term Loan B | | | 3.750% | | | | 6-Month LIBOR | | | | 2.750% | | | | 6/15/22 | | | | B | | | | 2,552 | |
| | 439 | | | PCI Gaming, Term Loan, First Lien | | | 2.661% | | | | 1-Month LIBOR | | | | 2.500% | | | | 5/31/26 | | | | BBB– | | | | 422,838 | |
| | 985 | | | Penn National Gaming, Inc., Term Loan B | | | 3.000% | | | | 3-Month LIBOR | | | | 2.250% | | | | 10/15/25 | | | | BB– | | | | 942,522 | |
| | 474 | | | Scientific Games Corp., Initial Term Loan B5 | | | 2.911% | | | | 1-Month LIBOR | | | | 2.750% | | | | 8/14/24 | | | | B+ | | | | 433,245 | |
| | 6 | | | Scientific Games Corp., Initial Term Loan B5 | | | 3.058% | | | | 3-Month LIBOR | | | | 2.750% | | | | 8/14/24 | | | | B+ | | | | 5,652 | |
| | 1,938 | | | Scientific Games Corp., Initial Term Loan B5 | | | 3.612% | | | | 6-Month LIBOR | | | | 2.750% | | | | 8/14/24 | | | | B+ | | | | 1,770,997 | |
| | 1,423 | | | Stars Group Holdings, Term Loan B | | | 3.808% | | | | 3-Month LIBOR | | | | 3.500% | | | | 7/10/25 | | | | BBB– | | | | 1,425,133 | |
| | 1,465 | | | Station Casinos LLC, Term Loan B | | | 2.500% | | | | 1-Month LIBOR | | | | 2.250% | | | | 2/08/27 | | | | BB– | | | | 1,357,642 | |
| | 21,481 | | | Total Hotels, Restaurants & Leisure | | | | | | | | 19,140,386 | |
| |
| | | | Household Durables – 0.3% (0.2% of Total Investments) | |
| | | | | | | |
| | 242 | | | Apex Tool Group LLC, Third Amendment Term Loan | | | 6.500% | | | | 1-Month LIBOR | | | | 5.250% | | | | 8/21/24 | | | | B3 | | | | 222,944 | |
| | 48 | | | Serta Simmons Holdings LLC, First Out Term Loan | | | 8.500% | | | | 2-Month LIBOR | | | | 7.500% | | | | 6/01/27 | | | | B2 | | | | 47,254 | |
| | 217 | | | Serta Simmons Holdings LLC, Second Out Term Loan | | | 8.500% | | | | 2-Month LIBOR | | | | 7.500% | | | | 6/01/27 | | | | B | | | | 167,437 | |
| | 507 | | | Total Household Durables | | | | | | | | 437,635 | |
74
| | | | | | | | | | | | | | | | | | | | | | | | | | | | |
Principal
Amount (000) | | | Description (1) | | Coupon (2) | | | Reference
Rate (2) | | | Spread (2) | | | Maturity (3) | | | Ratings (4) | | | Value | |
| |
| | | | Household Products – 1.0% (0.7% of Total Investments) | |
| | | | | | | |
| $ | 870 | | | KIK Custom Products Inc., Term Loan B2, (DD1) | | | 5.000% | | | | 1-Month LIBOR | | | | 4.000% | | | | 5/15/23 | | | | B– | | | $ | 860,487 | |
| | 612 | | | Reynolds Group Holdings, Inc., Term Loan, First Lien | | | 2.911% | | | | 1-Month LIBOR | | | | 2.750% | | | | 2/05/23 | | | | B+ | | | | 601,232 | |
| | 1,482 | | | Total Household Products | | | | | | | | 1,461,719 | |
| |
| | | | Industrial Conglomerates – 0.5% (0.3% of Total Investments) | |
| | | | | | | |
| | 2 | | | Education Adisory Board, Term Loan, First Lien | | | 6.000% | | | | 1-Month LIBOR | | | | 2.750% | | | | 9/29/24 | | | | B2 | | | | 1,798 | |
| | 731 | | | Education Adisory Board, Term Loan, First Lien | | | 6.000% | | | | 3-Month LIBOR | | | | 2.750% | | | | 9/29/24 | | | | B2 | | | | 701,104 | |
| | 733 | | | Total Industrial Conglomerates | | | | | | | | 702,902 | |
| |
| | | | Insurance – 1.4% (0.9% of Total Investments) | |
| | | | | | | |
| | 884 | | | Acrisure LLC, Term Loan B | | | 3.661% | | | | 1-Month LIBOR | | | | 3.500% | | | | 2/15/27 | | | | B | | | | 854,031 | |
| | 994 | | | Hub International Holdings, Inc., Term Loan B | | | 3.263% | | | | 3-Month LIBOR | | | | 3.000% | | | | 4/25/25 | | | | B | | | | 967,748 | |
| | 175 | | | Ryan Specialty Group LLC, Term Loan B, (WI/DD) | | | TBD | | | | TBD | | | | TBD | | | | TBD | | | | B1 | | | | 174,125 | |
| | 2,053 | | | Total Insurance | | | | | | | | 1,995,904 | |
| |
| | | | Interactive Media & Services – 2.3% (1.5% of Total Investments) | |
| | | | | | | |
| | 2,417 | | | Rackspace Hosting, Inc., Refinancing Term Loan B, First Lien, (DD1) | | | 4.000% | | | | 3-Month LIBOR | | | | 3.000% | | | | 11/03/23 | | | | B+ | | | | 2,373,830 | |
| | 985 | | | WeddingWire, Inc., Term Loan | | | 4.808% | | | | 3-Month LIBOR | | | | 4.500% | | | | 12/21/25 | | | | B+ | | | | 906,200 | |
| | 3,402 | | | Total Interactive Media & Services | | | | | | | | 3,280,030 | |
| |
| | | | Internet Software & Services – 2.2% (1.4% of Total Investments) | |
| | | | | | | |
| | 963 | | | Ancestry.com, Inc., Term Loan, First Lien | | | 4.750% | | | | 1-Month LIBOR | | | | 3.750% | | | | 10/19/23 | | | | B | | | | 948,283 | |
| | 416 | | | Blue Yonder, Term Loan B, (WI/DD) | | | TBD | | | | TBD | | | | TBD | | | | TBD | | | | B1 | | | | 415,574 | |
| | 349 | | | Dynatrace LLC, Term Loan, First Lien | | | 2.411% | | | | 1-Month LIBOR | | | | 2.250% | | | | 8/23/25 | | | | B1 | | | | 344,811 | |
| | 1,388 | | | Epicor Software Corporation, Term Loan, First Lien, (DD1) | | | 5.250% | | | | 3-Month LIBOR | | | | 4.250% | | | | 7/30/27 | | | | B2 | | | | 1,388,468 | |
| | 1,109 | | | SkillSoft Corporation, Term Loan, Second Lien, (5) | | | 0.000% | | | | N/A | | | | N/A | | | | 4/28/22 | | | | CCC | | | | 46,574 | |
| | 4,225 | | | Total Internet Software & Services | | | | | | | | 3,143,710 | |
| |
| | | | IT Services – 5.1% (3.2% of Total Investments) | |
| | | | | | | |
| | 546 | | | Datto, Inc., Term Loan | | | 4.411% | | | | 1-Month LIBOR | | | | 4.250% | | | | 4/02/26 | | | | B | | | | 544,483 | |
| | 1 | | | DTI Holdings, Inc., Replacement Term Loan B1 | | | 5.750% | | | | 2-Month LIBOR | | | | 4.750% | | | | 9/30/23 | | | | CCC+ | | | | 690 | |
| | 332 | | | DTI Holdings, Inc., Replacement Term Loan B1 | | | 5.750% | | | | 3-Month LIBOR | | | | 4.750% | | | | 9/30/23 | | | | CCC+ | | | | 264,861 | |
| | 78 | | | iQor US, Inc., Term Loan, (5) | | | 11.000% | | | | 1-Month LIBOR | | | | 10.000% | | | | 5/27/21 | | | | N/R | | | | 73,159 | |
| | 486 | | | KBR, Inc., New Term Loan B | | | 2.911% | | | | 1-Month LIBOR | | | | 2.750% | | | | 2/07/27 | | | | Ba1 | | | | 480,101 | |
| | 1,247 | | | Sabre, Inc., Term Loan B | | | 2.161% | | | | 1-Month LIBOR | | | | 2.000% | | | | 2/22/24 | | | | Ba3 | | | | 1,145,344 | |
| | 1,500 | | | Syniverse Holdings, Inc., Initial Term Loan, Second Lien | | | 10.000% | | | | 3-Month LIBOR | | | | 9.000% | | | | 3/11/24 | | | | CCC– | | | | 785,092 | |
| | 1,478 | | | Syniverse Holdings, Inc., Term Loan C | | | 6.000% | | | | 3-Month LIBOR | | | | 5.000% | | | | 3/09/23 | | | | CCC+ | | | | 1,178,943 | |
| | 970 | | | Tempo Acquisition LLC, Term Loan B | | | 2.911% | | | | 1-Month LIBOR | | | | 2.750% | | | | 5/01/24 | | | | B1 | | | | 948,903 | |
| | 1,221 | | | West Corporation, Term Loan B, (DD1) | | | 5.000% | | | | 3-Month LIBOR | | | | 4.000% | | | | 10/10/24 | | | | BB– | | | | 1,079,787 | |
| | 720 | | | WEX, Inc., Term Loan B3 | | | 2.411% | | | | 1-Month LIBOR | | | | 2.250% | | | | 5/17/26 | | | | Ba2 | | | | 698,459 | |
| | 8,579 | | | Total IT Services | | | | | | | | 7,199,822 | |
| |
| | | | Leisure Products – 0.2% (0.0% of Total Investments) | |
| | | | | | | |
| | 275 | | | Carnival Corp, Term Loan B, (DD1) | | | 8.500% | | | | 1-Month LIBOR | | | | 7.500% | | | | 6/30/25 | | | | Baa3 | | | | 270,589 | |
| |
| | | | Life Sciences Tools & Services – 0.7% (0.5% of Total Investments) | |
| | | | | | | |
| | 1,049 | | | Parexel International Corp., Term Loan B | | | 2.911% | | | | 1-Month LIBOR | | | | 2.750% | | | | 9/27/24 | | | | B2 | | | | 1,010,872 | |
| |
| | | | Machinery – 1.7% (1.1% of Total Investments) | |
| | | | | | | |
| | 692 | | | Gardner Denver, Inc., Extended Term Loan B | | | 1.911% | | | | 1-Month LIBOR | | | | 1.750% | | | | 2/28/27 | | | | Ba2 | | | | 667,030 | |
| | 77 | | | Gardner Denver, Inc., New Term Loan B | | | 2.916% | | | | 1-Month LIBOR | | | | 2.750% | | | | 1/31/27 | | | | BB+ | | | | 76,669 | |
| | 616 | | | Gates Global LLC, Term Loan B | | | 3.750% | | | | 1-Month LIBOR | | | | 2.750% | | | | 4/01/24 | | | | B1 | | | | 603,143 | |
| | 288 | | | TNT Crane and Rigging Inc., Initial Term Loan, First Lien, (5) | | | 0.000% | | | | N/A | | | | N/A | | | | 11/27/20 | | | | Caa3 | | | | 206,036 | |
| | 400 | | | TNT Crane and Rigging, Inc., Term Loan, Second Lien, (5) | | | 0.000% | | | | N/A | | | | N/A | | | | 11/27/21 | | | | C | | | | 70,530 | |
| | 750 | | | Thyssenkrupp Elevator, Term Loan B, (WI/DD) | | | TBD | | | | TBD | | | | TBD | | | | TBD | | | | B1 | | | | 740,861 | |
| | 2,823 | | | Total Machinery | | | | | | | | 2,364,269 | |
75
| | |
| |
| JSD | | Nuveen Short Duration Credit Opportunities Fund (continued) |
| | Portfolio of Investments July 31, 2020 |
| | | | | | | | | | | | | | | | | | | | | | | | | | | | |
Principal
Amount (000) | | | Description (1) | | Coupon (2) | | | Reference
Rate (2) | | | Spread (2) | | | Maturity (3) | | | Ratings (4) | | | Value | |
| |
| | | | Marine – 0.3% (0.2% of Total Investments) | |
| | | | | | | |
| $ | 969 | | | Harvey Gulf International Marine, Inc., Exit Term Loan | | | 7.713% | | | | 3-Month LIBOR | | | | 6.000% | | | | 7/02/23 | | | | B– | | | $ | 468,747 | |
| |
| | | | Media – 15.2% (9.6% of Total Investments) | |
| | | | | | | |
| | 199 | | | Advantage Sales & Marketing, Inc., Term Loan B2, First Lien | | | 4.250% | | | | 3-Month LIBOR | | | | 3.250% | | | | 7/25/21 | | | | B2 | | | | 188,862 | |
| | 681 | | | Advantage Sales & Marketing, Inc., Term Loan, First Lien | | | 4.250% | | | | 3-Month LIBOR | | | | 3.250% | | | | 7/25/21 | | | | B2 | | | | 648,195 | |
| | 269 | | | Affinion Group Holdings, Inc., Consenting Term Loan, (cash 3.250%, PIK 1.750%) | | | 5.000% | | | | 3-Month LIBOR | | | | 4.000% | | | | 4/10/24 | | | | N/R | | | | 190,291 | |
| | 68 | | | Catalina Marketing Corporation, First Out Term Loan | | | 8.500% | | | | 1-Month LIBOR | | | | 7.500% | | | | 2/15/23 | | | | B2 | | | | 41,654 | |
| | 101 | | | Catalina Marketing Corporation, Last Out Term Loan, (cash 2.000%, PIK 9.500%) | | | 11.500% | | | | 1-Month LIBOR | | | | 1.000% | | | | 8/15/23 | | | | Caa2 | | | | 22,566 | |
| | 600 | | | Cineworld Group PLC, Term Loan B | | | 3.322% | | | | 6-Month LIBOR | | | | 2.250% | | | | 2/28/25 | | | | B | | | | 385,248 | |
| | 5 | | | Clear Channel Outdoor Holdings, Inc., Term Loan B | | | 3.714% | | | | 2-Month LIBOR | | | | 3.500% | | | | 8/21/26 | | | | B1 | | | | 4,478 | |
| | 1,984 | | | Clear Channel Outdoor Holdings, Inc., Term Loan B | | | 3.761% | | | | 3-Month LIBOR | | | | 3.500% | | | | 8/21/26 | | | | B1 | | | | 1,773,326 | |
| | 60 | | | Cox Media/Terrier Media, Term Loan, First Lien | | | 4.411% | | | | 1-Month LIBOR | | | | 4.250% | | | | 12/17/26 | | | | B+ | | | | 58,485 | |
| | 719 | | | CSC Holdings LLC, Refinancing Term Loan | | | 2.425% | | | | 1-Month LIBOR | | | | 2.250% | | | | 7/17/25 | | | | BB | | | | 697,578 | |
| | 839 | | | CSC Holdings, LLC, Term Loan B5 | | | 2.675% | | | | 1-Month LIBOR | | | | 2.500% | | | | 4/15/27 | | | | Ba3 | | | | 814,629 | |
| | 165 | | | Cumulus Media, Inc., Term Loan B | | | 4.822% | | | | 3-Month LIBOR | | | | 3.750% | | | | 3/31/26 | | | | B | | | | 158,501 | |
| | 103 | | | CBS Radio, Inc., Term Loan B2 | | | 2.673% | | | | 1-Month LIBOR | | | | 2.500% | | | | 11/17/24 | | | | BB– | | | | 98,202 | |
| | 494 | | | EW Scripps, Term Loan B2 | | | 2.661% | | | | 1-Month LIBOR | | | | 2.500% | | | | 5/01/26 | | | | BB+ | | | | 477,721 | |
| | 415 | | | Gray Television, Inc., Term Loan B2 | | | 2.421% | | | | 1-Month LIBOR | | | | 2.250% | | | | 2/07/24 | | | | BB+ | | | | 404,834 | |
| | 244 | | | Houghton Mifflin Harcourt, Term Loan | | | 7.250% | | | | 1-Month LIBOR | | | | 6.250% | | | | 11/22/24 | | | | B | | | | 220,594 | |
| | 1,450 | | | iHeartCommunications Inc., Term Loan B | | | 3.161% | | | | 1-Month LIBOR | | | | 3.000% | | | | 5/01/26 | | | | B+ | | | | 1,361,760 | |
| | 678 | | | IMG Worldwide, Inc., Term Loan B | | | 2.920% | | | | 1-Month LIBOR | | | | 2.750% | | | | 5/16/25 | | | | B3 | | | | 541,766 | |
| | 868 | | | Intelsat Jackson Holdings, S.A., DIP Term Loan, (5), (9) | | | 6.500% | | | | 3-Month LIBOR | | | | 5.500% | | | | 7/13/21 | | | | B | | | | 886,120 | |
| | 2,437 | | | Intelsat Jackson Holdings, S.A., Term Loan B, (DD1), (5) | | | 8.000% | | | | Prime | | | | 4.750% | | | | 11/27/23 | | | | B | | | | 2,460,740 | |
| | 402 | | | LCPR Loan Financing LLC, Term Loan B | | | 5.175% | | | | 1-Month LIBOR | | | | 5.000% | | | | 10/15/26 | | | | BB– | | | | 404,932 | |
| | 2,572 | | | McGraw-Hill Education Holdings LLC, Term Loan B | | | 5.000% | | | | 3-Month LIBOR | | | | 4.000% | | | | 5/04/22 | | | | BB+ | | | | 2,251,869 | |
| | 939 | | | Meredith Corporation, Term Loan B2 | | | 2.667% | | | | 1-Month LIBOR | | | | 2.500% | | | | 1/31/25 | | | | BB– | | | | 889,454 | |
| | 200 | | | Meredith Corporation, Incremental Term Loan B | | | 5.250% | | | | 1-Month LIBOR | | | | 4.250% | | | | 1/31/25 | | | | BB– | | | | 195,917 | |
| | 885 | | | Metro-Goldwyn-Mayer, Inc., Term Loan, First Lien | | | 2.670% | | | | 1-Month LIBOR | | | | 2.500% | | | | 7/03/25 | | | | BB | | | | 851,056 | |
| | 400 | | | Metro-Goldwyn-Mayer, Inc., Term Loan, Second Lien | | | 5.500% | | | | 2-Month LIBOR | | | | 4.500% | | | | 7/06/26 | | | | B– | | | | 387,500 | |
| | 576 | | | Nexstar Broadcasting, Inc., Term Loan B | | | 2.921% | | | | 1-Month LIBOR | | | | 2.750% | | | | 9/19/26 | | | | BB | | | | 562,553 | |
| | 253 | | | Nexstar Broadcasting, Inc., Term Loan B3 | | | 2.421% | | | | 1-Month LIBOR | | | | 2.250% | | | | 1/17/24 | | | | BB | | | | 246,544 | |
| | 987 | | | Nexstar Broadcasting, Inc., Term Loan B3 | | | 2.416% | | | | 1-Month LIBOR | | | | 2.250% | | | | 1/17/24 | | | | BB | | | | 960,790 | |
| | 105 | | | Red Ventures, Term Loan B | | | 2.661% | | | | 1-Month LIBOR | | | | 2.500% | | | | 11/08/24 | | | | B+ | | | | 101,098 | |
| | 347 | | | Sinclair Television Group, Term Loan B2 | | | 2.680% | | | | 1-Month LIBOR | | | | 2.500% | | | | 9/30/26 | | | | BB+ | | | | 338,258 | |
| | 617 | | | Sinclair Television Group, Term Loan B2 | | | 2.420% | | | | 1-Month LIBOR | | | | 2.250% | | | | 1/03/24 | | | | BB+ | | | | 602,669 | |
| | 1,224 | | | WideOpenWest Finance LLC, Term Loan B | | | 4.250% | | | | 1-Month LIBOR | | | | 3.250% | | | | 8/19/23 | | | | B | | | | 1,209,605 | |
| | 1,097 | | | Ziggo B.V., Term Loan | | | 2.675% | | | | 1-Month LIBOR | | | | 2.500% | | | | 4/30/28 | | | | BB | | | | 1,056,829 | |
| | 22,983 | | | Total Media | | | | | | | | | | | | | | | | | | | | | | | 21,494,624 | |
| |
| | | | Multiline Retail – 0.9% (0.5% of Total Investments) | |
| | | | | | | |
| | 1,422 | | | Belk, Inc., Term Loan, First Lien | | | 7.750% | | | | 6-Month LIBOR | | | | 6.750% | | | | 7/31/25 | | | | Caa1 | | | | 620,315 | |
| | 611 | | | EG America LLC, Term Loan, First Lien | | | 5.072% | | | | 6-Month LIBOR | | | | 4.000% | | | | 2/07/25 | | | | B2 | | | | 582,361 | |
| | 2,033 | | | Total Multiline Retail | | | | | | | | | | | | | | | | | | | | | | | 1,202,676 | |
| |
| | | | Oil, Gas & Consumable Fuels – 4.0% (2.5% of Total Investments) | |
| | | | | | | |
| | 723 | | | BCP Renaissance Parent, Term Loan B | | | 4.500% | | | | 3-Month LIBOR | | | | 3.500% | | | | 11/01/24 | | | | B+ | | | | 654,926 | |
| | 848 | | | Buckeye Partners, Term Loan, First Lien | | | 2.921% | | | | 1-Month LIBOR | | | | 2.750% | | | | 11/01/26 | | | | BBB– | | | | 830,917 | |
| | 1,253 | | | California Resources Corporation, DIP Term Loan | | | 10.000% | | | | 1-Month LIBOR | | | | 9.000% | | | | 2/21/28 | | | | N/R | | | | 1,240,702 | |
| | 327 | | | California Resources Corporation, Term Loan, (5) | | | 0.000% | | | | N/A | | | | N/A | | | | 12/31/21 | | | | D | | | | 14,197 | |
| | 2,115 | | | California Resources Corporation, Term Loan B, (5) | | | 0.000% | | | | N/A | | | | N/A | | | | 12/31/22 | | | | D | | | | 815,787 | |
| | 2,670 | | | Fieldwood Energy LLC, Exit Term Loan, (DD1), (5) | | | 7.027% | | | | 3-Month LIBOR | | | | 5.250% | | | | 4/11/22 | | | | CCC | | | | 663,094 | |
| | 1,811 | | | Fieldwood Energy LLC, Exit Term Loan, second Lien, (5) | | | 0.000% | | | | N/A | | | | N/A | | | | 4/11/23 | | | | C | | | | 31,133 | |
| | 595 | | | Gulf Finance, LLC, Term Loan B | | | 6.250% | | | | 1-Month LIBOR | | | | 5.250% | | | | 8/25/23 | | | | CCC+ | | | | 388,798 | |
| | 990 | | | Oryx, Initial Term Loan | | | 4.161% | | | | 1-Month LIBOR | | | | 4.000% | | | | 5/22/26 | | | | B+ | | | | 879,452 | |
76
| | | | | | | | | | | | | | | | | | | | | | | | | | | | |
Principal
Amount (000) | | | Description (1) | | Coupon (2) | | | Reference
Rate (2) | | | Spread (2) | | | Maturity (3) | | | Ratings (4) | | | Value | |
| |
| | | | Oil, Gas & Consumable Fuels (continued) | |
| | | | | | | |
| $ | 266 | | | Peabody Energy Corporation, Term Loan B | | | 2.911% | | | | 1-Month LIBOR | | | | 2.750% | | | | 3/31/25 | | | | B1 | | | $ | 142,142 | |
| | 11,598 | | | Total Oil, Gas & Consumable Fuels | | | | 5,661,148 | |
| |
| | | | Personal Products – 0.8% (0.5% of Total Investments) | |
| | | | | | | |
| | 524 | | | Coty, Inc., Term Loan A | | | 1.916% | | | | 1-Month LIBOR | | | | 1.750% | | | | 4/05/23 | | | | B | | | | 476,760 | |
| | 131 | | | Coty, Inc., Term Loan B | | | 2.416% | | | | 1-Month LIBOR | | | | 2.250% | | | | 4/05/25 | | | | B | | | | 113,931 | |
| | 2,140 | | | Revlon Consumer Products Corporation, Term Loan B, First Lien | | | 3.863% | | | | 3-Month LIBOR | | | | 3.500% | | | | 9/07/23 | | | | C | | | | 584,980 | |
| | 2,795 | | | Total Personal Products | | | | | | | | | | | | | | | | | | | | | | | 1,175,671 | |
| |
| | | | Pharmaceuticals – 4.8% (3.0% of Total Investments) | |
| | | | | | | |
| | 1,663 | | | Concordia Healthcare Corp, Exit Term Loan | | | 6.568% | | | | 6-Month LIBOR | | | | 5.500% | | | | 9/06/24 | | | | B– | | | | 1,556,149 | |
| | 330 | | | Elanco Animal Health, Term Loan B, (WI/DD) | | | TBD | | | | TBD | | | | TBD | | | | TBD | | | | Baa3 | | | | 322,575 | |
| | 1,338 | | | Endo Health Solutions, Inc., Term Loan B | | | 5.000% | | | | 3-Month LIBOR | | | | 4.250% | | | | 4/29/24 | | | | B+ | | | | 1,285,569 | |
| | 628 | | | Mallinckrodt International Finance S.A., Term Loan B, First Lien | | | 3.500% | | | | 6-Month LIBOR | | | | 2.750% | | | | 9/24/24 | | | | B– | | | | 527,811 | |
| | 375 | | | Mallinckrodt International Finance S.A., Term Loan, First Lien | | | 3.750% | | | | 3-Month LIBOR | | | | 3.000% | | | | 2/24/25 | | | | B– | | | | 316,362 | |
| | 895 | | | Valeant Pharmaceuticals International, Inc., Term Loan B | | | 2.926% | | | | 1-Month LIBOR | | | | 2.750% | | | | 11/27/25 | | | | BB | | | | 878,688 | |
| | 1,921 | | | Valeant Pharmaceuticals International, Inc., Term Loan, First Lien, (DD1) | | | 3.176% | | | | 1-Month LIBOR | | | | 3.000% | | | | 6/02/25 | | | | BB | | | | 1,893,707 | |
| | 7,150 | | | Total Pharmaceuticals | | | | | | | | | | | | | | | | | | | | | | | 6,780,861 | |
| |
| | | | Professional Services – 2.2% (1.4% of Total Investments) | |
| | | | | | | |
| | 973 | | | Ceridian HCM Holding, Inc., Term Loan B | | | 2.611% | | | | 1-Week LIBOR | | | | 2.500% | | | | 4/30/25 | | | | B+ | | | | 947,543 | |
| | 323 | | | Creative Artists Agency, LLC, Term Loan B | | | 3.911% | | | | 1-Month LIBOR | | | | 3.750% | | | | 11/26/26 | | | | B | | | | 308,257 | |
| | 30 | | | Dun & Bradstreet Corp., Term Loan, First Lien | | | 3.922% | | | | 1-Month LIBOR | | | | 3.750% | | | | 2/08/26 | | | | BB | | | | 29,835 | |
| | 823 | | | Nielsen Finance LLC, Term Loan B4 | | | 2.183% | | | | 1-Month LIBOR | | | | 2.000% | | | | 10/04/23 | | | | BBB– | | | | 802,536 | |
| | 1,449 | | | Skillsoft Corporation, Initial Term Loan, First Lien, (5) | | | 0.000% | | | | N/A | | | | N/A | | | | 4/28/21 | | | | CCC+ | | | | 943,174 | |
| | 3,598 | | | Total Professional Services | | | | | | | | | | | | | | | | | | | | | | | 3,031,345 | |
| |
| | | | Real Estate Management & Development – 0.9% (0.5% of Total Investments) | |
| | | | | | | |
| | 1,345 | | | GGP, Initial Term Loan A2 | | | 3.161% | | | | 1-Month LIBOR | | | | 2.500% | | | | 8/24/23 | | | | BB+ | | | | 1,200,100 | |
| |
| | | | Road & Rail – 2.3% (1.4% of Total Investments) | |
| | | | | | | |
| | 373 | | | Avolon LLC, Term Loan B3 | | | 2.500% | | | | 1-Month LIBOR | | | | 1.750% | | | | 1/15/25 | | | | Baa2 | | | | 357,612 | |
| | 733 | | | Ceva Group PLC, Term Loan B | | | 5.308% | | | | 3-Month LIBOR | | | | 5.000% | | | | 8/03/25 | | | | B+ | | | | 628,658 | |
| | 998 | | | Genesee & Wyoming Inc., Term Loan, First Lien | | | 2.308% | | | | 3-Month LIBOR | | | | 2.000% | | | | 12/30/26 | | | | BB+ | | | | 981,136 | |
| | 430 | | | Hertz Corporation, Term Loan, (WI/DD), (5) | | | TBD | | | | TBD | | | | TBD | | | | TBD | | | | N/R | | | | 410,650 | |
| | 886 | | | Quality Distribution, Incremental Term Loan, First Lien | | | 6.500% | | | | 3-Month LIBOR | | | | 5.500% | | | | 8/18/22 | | | | B– | | | | 841,439 | |
| | 29 | | | Savage Enterprises LLC, Term Loan B | | | 3.180% | | | | 1-Month LIBOR | | | | 3.000% | | | | 8/01/25 | | | | BB | | | | 28,366 | |
| | 3,449 | | | Total Road & Rail | | | | | | | | | | | | | | | | | | | | | | | 3,247,861 | |
| |
| | | | Semiconductors & Semiconductor Equipment – 1.1% (0.7% of Total Investments) | |
| | | | | | | |
| | 441 | | | Cabot Microelectronics, Term Loan B1 | | | 2.188% | | | | 1-Month LIBOR | | | | 2.000% | | | | 11/15/25 | | | | Ba2 | | | | 438,653 | |
| | 706 | | | Lumileds, Term Loan B | | | 4.572% | | | | 6-Month LIBOR | | | | 3.500% | | | | 6/30/24 | | | | CCC+ | | | | 281,318 | |
| | 136 | | | Microchip Technology, Inc., Term Loan B | | | 2.170% | | | | 1-Month LIBOR | | | | 2.000% | | | | 5/29/25 | | | | Baa3 | | | | 135,500 | |
| | 708 | | | ON Semiconductor Corporation, New Replacement Term Loan B4 | | | 2.166% | | | | 1-Month LIBOR | | | | 2.000% | | | | 9/19/26 | | | | BB | | | | 697,927 | |
| | 1,991 | | | Total Semiconductors & Semiconductor Equipment | | | | | | | | 1,553,398 | |
| |
| | | | Software – 12.0% (7.6% of Total Investments) | |
| | | | | | | |
| | 844 | | | Blackboard, Inc., Term Loan B5, First Lien | | | 7.000% | | | | 3-Month LIBOR | | | | 6.000% | | | | 6/30/24 | | | | B | | | | 800,916 | |
| | 299 | | | BMC Software, Inc., Term Loan B | | | 4.411% | | | | 1-Month LIBOR | | | | 4.250% | | | | 10/02/25 | | | | B2 | | | | 289,572 | |
| | 992 | | | DiscoverOrg LLC, Term Loan B | | | 3.911% | | | | 1-Month LIBOR | | | | 3.750% | | | | 2/01/26 | | | | B+ | | | | 982,167 | |
| | 622 | | | Ellucian, Term Loan B, First Lien | | | 4.250% | | | | 3-Month LIBOR | | | | 3.250% | | | | 9/30/22 | | | | B | | | | 619,184 | |
| | 618 | | | Misys, New Term Loan, First Lien | | | 4.500% | | | | 6-Month LIBOR | | | | 3.500% | | | | 6/13/24 | | | | BB– | | | | 573,904 | |
| | 1,715 | | | Greeneden U.S. Holdings II LLC, Term Loan B, (DD1) | | | 3.411% | | | | 1-Month LIBOR | | | | 3.250% | | | | 12/01/23 | | | | B2 | | | | 1,692,516 | |
77
| | |
| |
| JSD | | Nuveen Short Duration Credit Opportunities Fund (continued) |
| | Portfolio of Investments July 31, 2020 |
| | | | | | | | | | | | | | | | | | | | | | | | | | | | |
Principal
Amount (000) | | | Description (1) | | Coupon (2) | | | Reference
Rate (2) | | | Spread (2) | | | Maturity (3) | | | Ratings (4) | | | Value | |
| |
| | | | Software (continued) | |
| | | | | | | |
| $ | 118 | | | Greenway Health, Term Loan, First Lien | | | 4.820% | | | | 6-Month LIBOR | | | | 3.750% | | | | 2/16/24 | | | | B– | | | $ | 95,682 | |
| | 1,173 | | | Informatica LLC, Term Loan, First Lien | | | 3.411% | | | | 1-Month LIBOR | | | | 3.250% | | | | 2/14/27 | | | | B1 | | | | 1,148,157 | |
| | 455 | | | Micro Focus International PLC, Term Loan B4 | | | 5.250% | | | | 3-Month LIBOR | | | | 4.250% | | | | 6/05/25 | | | | BB | | | | 451,438 | |
| | 592 | | | McAfee Holdings International, Inc., Term Loan, Second Lien | | | 9.500% | | | | 1-Month LIBOR | | | | 8.500% | | | | 9/28/25 | | | | B– | | | | 603,609 | |
| | 842 | | | McAfee LLC, Term Loan B | | | 3.916% | | | | 1-Month LIBOR | | | | 3.750% | | | | 9/29/24 | | | | B | | | | 835,335 | |
| | 404 | | | Micro Focus International PLC, New Term Loan | | | 2.661% | | | | 1-Month LIBOR | | | | 2.500% | | | | 6/21/24 | | | | BB– | | | | 382,257 | |
| | 2,726 | | | Micro Focus International PLC, Term Loan B | | | 2.661% | | | | 1-Month LIBOR | | | | 2.500% | | | | 6/21/24 | | | | BB | | | | 2,581,474 | |
| | 125 | | | Mitchell International, Inc., Initial Term Loan, First Lien | | | 3.411% | | | | 1-Month LIBOR | | | | 3.250% | | | | 11/29/24 | | | | B2 | | | | 119,061 | |
| | 133 | | | Mitchell International, Inc., Initial Term Loan, Second Lien | | | 7.411% | | | | 1-Month LIBOR | | | | 7.250% | | | | 11/30/25 | | | | CCC | | | | 120,967 | |
| | 447 | | | Perforce Software Inc., Term Loan, First Lien | | | 3.911% | | | | 1-Month LIBOR | | | | 3.750% | | | | 7/01/26 | | | | B– | | | | 434,292 | |
| | 447 | | | Autodata Solutions, Term Loan, First Lien | | | 3.661% | | | | 1-Month LIBOR | | | | 3.500% | | | | 5/30/26 | | | | BB– | | | | 431,178 | |
| | 84 | | | SkillSoft Corporation, DIP Term Loan, (5) | | | 8.500% | | | | 1-Month LIBOR | | | | 7.500% | | | | 6/15/21 | | | | N/R | | | | 83,396 | |
| | 794 | | | SS&C Technologies, Inc./ Sunshine Acquisition II, Inc., New Term Loan B3 | | | 1.911% | | | | 1-Month LIBOR | | | | 1.750% | | | | 4/16/25 | | | | BB+ | | | | 772,036 | |
| | 558 | | | SS&C Technologies, Inc./ Sunshine Acquisition II, Inc., New Term Loan B4 | | | 1.911% | | | | 1-Month LIBOR | | | | 1.750% | | | | 4/16/25 | | | | BB+ | | | | 542,409 | |
| | 982 | | | SS&C Technologies, Inc./ Sunshine Acquisition II, Inc., Term Loan B5 | | | 1.911% | | | | 1-Month LIBOR | | | | 1.750% | | | | 4/16/25 | | | | BB+ | | | | 956,529 | |
| | 259 | | | Thomson Reuters IP & S, Term Loan B | | | 3.161% | | | | 1-Month LIBOR | | | | 3.000% | | | | 10/31/26 | | | | B | | | | 254,011 | |
| | 723 | | | TIBCO Software, Inc., Term Loan, First Lien | | | 3.920% | | | | 1-Month LIBOR | | | | 3.750% | | | | 7/03/26 | | | | B+ | | | | 700,419 | |
| | 717 | | | Ultimate Software, Incremental Term Loan | | | 4.750% | | | | 3-Month LIBOR | | | | 4.000% | | | | 5/03/26 | | | | B1 | | | | 719,045 | |
| | 496 | | | Ultimate Software, Term Loan, First Lien | | | 3.911% | | | | 1-Month LIBOR | | | | 3.750% | | | | 5/03/26 | | | | B1 | | | | 492,374 | |
| | 250 | | | Xperi Holding Corp, Term Loan B | | | 4.161% | | | | 1-Month LIBOR | | | | 4.000% | | | | 6/01/25 | | | | BB– | | | | 245,730 | |
| | 17,415 | | | Total Software | | | | | | | | | | | | | | | | | | | | | | | 16,927,658 | |
| |
| | | | Specialty Retail – 2.3% (1.4% of Total Investments) | |
| | | | | | | |
| | 317 | | | Academy, Ltd., Term Loan B, (DD1) | | | 5.000% | | | | 1-Month LIBOR | | | | 4.000% | | | | 7/01/22 | | | | CCC+ | | | | 283,648 | |
| | 465 | | | Petco Animal Supplies, Inc., Term Loan B1 | | | 4.250% | | | | 3-Month LIBOR | | | | 3.250% | | | | 1/26/23 | | | | B3 | | | | 391,392 | |
| | 907 | | | Petsmart Inc., Term Loan B | | | 4.000% | | | | 3-Month LIBOR | | | | 3.000% | | | | 3/11/22 | | | | B | | | | 897,778 | |
| | 1,621 | | | Petsmart Inc., Term Loan B, First Lien, (DD1) | | | 5.000% | | | | 3-Month LIBOR | | | | 4.000% | | | | 3/11/22 | | | | B | | | | 1,616,722 | |
| | 3,310 | | | Total Specialty Retail | | | | | | | | | | | | | | | | | | | | | | | 3,189,540 | |
| |
| | | | Technology Hardware, Storage & Peripherals – 2.6% (1.6% of Total Investments) | |
| | | | | | | |
| | 1,484 | | | Dell International LLC, Refinancing Term Loan B1 | | | 2.750% | | | | 1-Month LIBOR | | | | 2.000% | | | | 9/19/25 | | | | Baa3 | | | | 1,466,694 | |
| | 397 | | | NCR Corporation, Term Loan B | | | 2.670% | | | | 1-Month LIBOR | | | | 2.500% | | | | 8/28/26 | | | | BB+ | | | | 386,082 | |
| | 265 | | | Tech Data Corporation, Asset Based Term Loan | | | 3.667% | | | | 1-Month LIBOR | | | | 3.500% | | | | 7/01/25 | | | | BBB– | | | | 265,276 | |
| | 1,586 | | | Western Digital, Term Loan B | | | 1.911% | | | | 1-Month LIBOR | | | | 1.750% | | | | 4/29/23 | | | | BBB– | | | | 1,562,677 | |
| | 3,732 | | | Total Technology Hardware, Storage & Peripherals | | | | | | | | 3,680,729 | |
| |
| | | | Trading Companies & Distributors – 0.2% (0.1% of Total Investments) | |
| | | | | | | |
| | 197 | | | Hayward Industries, Inc., Initial Term Loan, First Lien | | | 3.661% | | | | 1-Month LIBOR | | | | 3.500% | | | | 8/04/24 | | | | B | | | | 192,661 | |
| |
| | | | Transportation Infrastructure – 0.7% (0.4% of Total Investments) | |
| | | | | | | |
| | 493 | | | Atlantic Aviation FBO Inc., Term Loan | | | 3.911% | | | | 1-Month LIBOR | | | | 3.750% | | | | 12/06/25 | | | | BB– | | | | 468,695 | |
| | 485 | | | Hanjin International Corp, Initial Term Loan | | | 2.661% | | | | 1-Month LIBOR | | | | 2.500% | | | | 10/18/20 | | | | B1 | | | | 446,200 | |
| | 978 | | | Total Transportation Infrastructure | | | | | | | | 914,895 | |
| |
| | | | Wireless Telecommunication Services – 0.8% (0.5% of Total Investments) | |
| | | | | | | |
| | 750 | | | T-Mobile USA, Term Loan, First Lien | | | 3.161% | | | | 1-Month LIBOR | | | | 3.000% | | | | 4/01/27 | | | | BBB– | | | | 753,607 | |
| | 495 | | | Windstream Corporation, Term Loan, (DD1), (5) | | | 6.250% | | | | Prime | | | | 3.000% | | | | 4/24/21 | | | | D | | | | 295,021 | |
| | 1,245 | | | Total Wireless Telecommunication Services | | | | | | | | 1,048,628 | |
| $ | 213,819 | | | Total Variable Rate Senior Loan Interests (cost $208,615,645) | | | | | | | | 189,250,128 | |
| | | | | | | |
Principal
Amount (000) | | | Description (1) | | | | | | | | Coupon | | | Maturity | | | Ratings (4) | | | Value | |
| |
| | | | CORPORATE BONDS – 16.4% (10.3% of Total Investments) | |
| |
| | | | Airlines – 0.1% (0.1% of Total Investments) | |
| | | | | | |
| $ | 315 | | | American Airlines Group Inc, 144A | | | | | | | | 5.000% | | | | 6/01/22 | | | | Caa1 | | | $ | 175,931 | |
78
| | | | | | | | | | | | | | | | | | | | | | | | | | | | |
Principal
Amount (000) | | | Description (1) | | | | | | | | Coupon | | | Maturity | | | Ratings (4) | | | Value | |
| | | |
| | | | Auto Components – 0.8% (0.5% of Total Investments) | | | | | | | |
| | | | | | |
| $ | 510 | | | Adient Global Holdings Ltd, 144A | | | | | | | | 4.875% | | | | 8/15/26 | | | | B | | | $ | 475,575 | |
| | 530 | | | Adient US LLC, 144A | | | | | | | | | | | 9.000% | | | | 4/15/25 | | | | Ba3 | | | | 590,288 | |
| | 1,040 | | | Total Auto Components | | | | | | | | 1,065,863 | |
| |
| | | | Chemicals – 0.2% (0.1% of Total Investments) | |
| | | | | | | |
| | 230 | | | Olin Corp, 144A | | | | | | | | | | | 9.500% | | | | 6/01/25 | | | | BB– | | | | 262,200 | |
| |
| | | | Communications Equipment – 1.7% (1.1% of Total Investments) | |
| | | | | | | |
| | 2,309 | | | Intelsat Jackson Holdings SA, (5) | | | | | | | | | | | 5.500% | | | | 8/01/23 | | | | N/R | | | | 1,446,011 | |
| | 1,460 | | | Intelsat Jackson Holdings SA, 144A, (5) | | | | | | | | 9.750% | | | | 7/15/25 | | | | N/R | | | | 970,900 | |
| | 3,769 | | | Total Communications Equipment | | | | | | | | 2,416,911 | |
| |
| | | | Diversified Financial Services – 0.2% (0.1% of Total Investments) | |
| | | | | | | |
| | 230 | | | PetSmart Inc, 144A | | | | | | | | | | | 7.125% | | | | 3/15/23 | | | | CCC+ | | | | 232,300 | |
| |
| | | | Diversified Telecommunication Services – 0.3% (0.2% of Total Investments) | |
| | | | | |
| | 415 | | | Consolidated Communications Inc | | | | 6.500% | | | | 10/01/22 | | | | CCC+ | | | | 407,219 | |
| |
| | | | Electric Utilities – 5.7% (3.6% of Total Investments) | |
| | | | | |
| | 1,175 | | | Bruce Mansfield Unit 1 2007 Pass-Through Trust, (5) | | | | 6.850% | | | | 6/01/34 | | | | N/R | | | | 1,469 | |
| | 280 | | | Pacific Gas and Electric Co | | | | | | | | | | | 3.850% | | | | 11/15/23 | | | | BBB– | | | | 296,182 | |
| | 178 | | | Pacific Gas and Electric Co | | | | | | | | | | | 3.450% | | | | 7/01/25 | | | | BBB– | | | | 189,378 | |
| | 1,335 | | | Pacific Gas and Electric Co | | | | | | | | 4.500% | | | | 1/01/26 | | | | BBB– | | | | 1,536,271 | |
| | 935 | | | Pacific Gas and Electric Co | | | | | | | | | | | 3.300% | | | | 12/01/27 | | | | BBB– | | | | 987,938 | |
| | 178 | | | Pacific Gas and Electric Co | | | | | | | | | | | 3.750% | | | | 7/01/28 | | | | BBB– | | | | 193,842 | |
| | 837 | | | Pacific Gas and Electric Co | | | | | | | | | | | 4.550% | | | | 7/01/30 | | | | BBB– | | | | 961,794 | |
| | 1,335 | | | Pacific Gas and Electric Co | | | | | | | | 3.150% | | | | 7/01/40 | | | | BBB– | | | | 1,401,945 | |
| | 915 | | | Pacific Gas and Electric Co | | | | | | | | | | | 4.750% | | | | 2/15/44 | | | | BBB– | | | | 1,058,114 | |
| | 300 | | | Pacific Gas and Electric Co | | | | | | | | | | | 4.250% | | | | 3/15/46 | | | | BBB– | | | | 327,340 | |
| | 838 | | | Pacific Gas and Electric Co | | | | | | | | | | | 4.950% | | | | 7/01/50 | | | | BBB– | | | | 1,014,449 | |
| | 8,306 | | | Total Electric Utilities | | | | | | | | 7,968,722 | |
| |
| | | | Energy Equipment & Services – 0.2% (0.1% of Total Investments) | |
| | | | | | | |
| | 280 | | | Bausch Health Cos Inc, 144A | | | | | | | | | | | 6.125% | | | | 4/15/25 | | | | B | | | | 289,100 | |
| |
| | | | Entertainment – 0.6% (0.4% of Total Investments) | |
| | | | | | |
| | 500 | | | AMC Entertainment Holdings Inc, 144A | | | | | | | | 10.500% | | | | 4/15/25 | | | | CCC+ | | | | 396,875 | |
| | 1,033 | | | AMC Entertainment Holdings Inc, 144A, (cash 10.000%, PIK 12.000%) | | | | 12.000% | | | | 6/15/26 | | | | N/R | | | | 490,913 | |
| | 1,533 | | | Total Entertainment | | | | | | | | 887,788 | |
| |
| | | | Equity Real Estate Investment Trust – 0.8% (0.5% of Total Investments) | |
| | | | | |
| | 1,035 | | | Uniti Group LP / Uniti Fiber Holdings Inc / CSL Capital LLC, 144A | | | | 7.875% | | | | 2/15/25 | | | | B | | | | 1,089,337 | |
| |
| | | | Health Care Equipment & Supplies – 0.0% (0.0% of Total Investments) | |
| | | | | |
| | 350 | | | Mallinckrodt International Finance SA / Mallinckrodt CB LLC, 144A | | | | 5.625% | | | | 10/15/23 | | | | CC | | | | 56,000 | |
| |
| | | | Health Care Providers & Services – 0.7% (0.5% of Total Investments) | |
| | | | | | | |
| | 50 | | | HCA Inc | | | | | | | | | | | 5.375% | | | | 2/01/25 | | | | Ba2 | | | | 56,375 | |
| | 325 | | | Tenet Healthcare Corp | | | | | | | | | | | 8.125% | | | | 4/01/22 | | | | B– | | | | 350,187 | |
| | 125 | | | Tenet Healthcare Corp | | | | | | | | | | | 4.625% | | | | 7/15/24 | | | | BB– | | | | 127,813 | |
| | 485 | | | Tenet Healthcare Corp, 144A | | | | | | | | | | | 6.250% | | | | 2/01/27 | | | | B1 | | | | 515,172 | |
| | 985 | | | Total Health Care Providers & Services | | | | | | | | 1,049,547 | |
| |
| | | | Hotels, Restaurants & Leisure – 0.3% (0.2% of Total Investments) | |
| | | | | |
| | 185 | | | 1011778 BC ULC / New Red Finance Inc, 144A | | | | 5.000% | | | | 10/15/25 | | | | B+ | | | | 189,923 | |
| | 160 | | | Carnival Corp, 144A | | | | | | | | | | | 11.500% | | | | 4/01/23 | | | | Baa3 | | | | 174,107 | |
| | 345 | | | Total Hotels, Restaurants & Leisure | | | | | | | | 364,030 | |
| |
| | | | IT Services – 0.2% (0.1% of Total Investments) | |
| | | | | |
| | 280 | | | Genesys Telecommunications Laboratories Inc/Greeneden Lux 3 Sarl/Greeneden US Ho, 144A | | | | 10.000% | | | | 11/30/24 | | | | CCC+ | | | | 298,900 | |
79
| | |
| |
| JSD | | Nuveen Short Duration Credit Opportunities Fund (continued) |
| | Portfolio of Investments July 31, 2020 |
| | | | | | | | | | | | | | | | | | | | | | | | | | | | |
Principal
Amount (000) | | | Description (1) | | | | | | | | Coupon | | | Maturity | | | Ratings (4) | | | Value | |
| |
| | | | Media – 2.5% (1.6% of Total Investments) | |
| | | | | |
| $ | 1,300 | | | Houghton Mifflin Harcourt Publishers Inc, 144A | | | | 9.000% | | | | 2/15/25 | | | | BB– | | | $ | 1,254,500 | |
| | 671 | | | iHeartCommunications Inc | | | | | | | | | | | 8.375% | | | | 5/01/27 | | | | CCC+ | | | | 665,848 | |
| | 1,075 | | | iHeartCommunications Inc, 144A | | | | | | | | | | | 5.250% | | | | 8/15/27 | | | | B+ | | | | 1,085,750 | |
| | 165 | | | Intelsat Luxembourg SA, (5) | | | | | | | | | | | 8.125% | | | | 6/01/23 | | | | N/R | | | | 8,250 | |
| | 415 | | | Univision Communications Inc, 144A | | | | 9.500% | | | | 5/01/25 | | | | B | | | | 453,388 | |
| | 3,626 | | | Total Media | | | | | | | | 3,467,736 | |
| |
| | | | Oil, Gas & Consumable Fuels – 1.5% (0.9% of Total Investments) | |
| | | | | | | |
| | 1,150 | | | Citgo Holding Inc, 144A | | | | | | | | | | | 9.250% | | | | 8/01/24 | | | | B+ | | | | 1,150,000 | |
| | 150 | | | CITGO Petroleum Corp, 144A | | | | | | | | | | | 6.250% | | | | 8/15/22 | | | | BB | | | | 150,705 | |
| | 385 | | | CITGO Petroleum Corp, 144A | | | | | | | | | | | 7.000% | | | | 6/15/25 | | | | BB | | | | 395,587 | |
| | 210 | | | MEG Energy Corp, 144A | | | | | | | | | | | 7.000% | | | | 3/31/24 | | | | B+ | | | | 200,025 | |
| | 400 | | | Oasis Petroleum Inc, 144A | | | | | | | | | | | 6.250% | | | | 5/01/26 | | | | Caa1 | | | | 71,000 | |
| | 550 | | | Whiting Petroleum Corp, (5) | | | | | | | | | | | 6.625% | | | | 1/15/26 | | | | N/R | | | | 94,875 | |
| | 2,845 | | | Total Oil, Gas & Consumable Fuels | | | | | | | | 2,062,192 | |
| |
| | | | Pharmaceuticals – 0.5% (0.3% of Total Investments) | |
| | | | | | | |
| | 310 | | | Advanz Pharma Corp Ltd | | | | | | | | | | | 8.000% | | | | 9/06/24 | | | | B– | | | | 297,600 | |
| | 181 | | | Endo Dac / Endo Finance LLC / Endo Finco Inc, 144A | | | | 9.500% | | | | 7/31/27 | | | | CCC+ | | | | 195,027 | |
| | 228 | | | Endo Dac / Endo Finance LLC / Endo Finco Inc, 144A | | | | 6.000% | | | | 6/30/28 | | | | CCC+ | | | | 173,850 | |
| | 90 | | | Par Pharmaceutical Inc, 144A | | | | | | | | | | | 7.500% | | | | 4/01/27 | | | | B+ | | | | 95,727 | |
| | 809 | | | Total Pharmaceuticals | | | | | | | | | | | | | | | | | | | | | | | 762,204 | |
| |
| | | | Wireless Telecommunication Services – 0.1% (0.0% of Total Investments) | |
| | | | | |
| | 330 | | | Intelsat Connect Finance SA, 144A, (5) | | | | 9.500% | | | | 2/15/23 | | | | N/R | | | | 95,700 | |
| $ | 26,723 | | | Total Corporate Bonds (cost $25,609,888) | | | | | | | | 22,951,680 | |
| | | | | | | |
| Shares | | | Description (1) | | | | | | | | | | | | | | | | | Value | |
| |
| | | | COMMON STOCKS – 1.8% (1.2% of Total Investments) | |
| |
| | | | Diversified Consumer Services – 0.0% (0.0% of Total Investments) | |
| | | | | |
| | 9,343 | | | Cengage Learning Holdings II Inc, (6), (7) | | | | | | | | | | | | | | | $ | 21,797 | |
| |
| | | | Electric Utilities – 0.4% (0.3% of Total Investments) | |
| | | | | | | |
| | 25,367 | | | Energy Harbor Corp, (6), (7), (10) | | | | | | | | | | | | | | | | | | | | | | | 569,489 | |
| |
| | | | Energy Equipment & Services – 0.1% (0.0% of Total Investments) | |
| | | | | | | |
| | 28,730 | | | Transocean Ltd | | | | | | | | | | | | | | | | | | | | | | | 58,609 | |
| | 3,779 | | | Vantage Drilling International, (6), (7) | | | | | | | | | | | | | | | | 22,361 | |
| | | | Total Energy Equipment & Services | | | | | | | | | | | | | | | | 80,970 | |
| |
| | | | Health Care Providers & Services – 0.0% (0.0% of Total Investments) | |
| | | | | | | |
| | 12,290 | | | Millennium Health LLC, (7), (8) | | | | | | | | | | | | | | | | | | | | | | | 13,642 | |
| | 11,533 | | | Millennium Health LLC, (7), (8) | | | | | | | | | | | | | | | | | | | | | | | 11,648 | |
| | | | Total Health Care Providers & Services | | | | | | | | | | | | 25,290 | |
| |
| | | | Internet & Direct Marketing Retail – 0.0% (0.0% of Total Investments) | |
| | | | | | | |
| | 1,905 | | | Catalina Marketing Corp, (6), (7) | | | | | | | | | | | | | | | | | | | | | | | 952 | |
| |
| | | | Marine – 0.0% (0.0% of Total Investments) | |
| | | | | | | |
| | 430 | | | ACBL HLDG CORP, (6), (7) | | | | | | | | | | | | | | | | | | | | | | | 18,275 | |
| |
| | | | Media – 1.0% (0.7% of Total Investments) | |
| | | | | |
| | 272,893 | | | Clear Channel Outdoor Holdings Inc, (7) | | | | | | | | | | | | | | | | 250,106 | |
| | 20,868 | | | Cumulus Media Inc, (7) | | | | | | | | | | | | | | | | | | | | | | | 82,011 | |
| | 135,343 | | | iHeartMedia Inc, (7) | | | | | | | | | | | | | | | | | | | | | | | 1,131,469 | |
| | | | Total Media | | | | | | | | | | | | | | | | | | | | | | | 1,463,586 | |
| |
| | | | Pharmaceuticals – 0.0% (0.0% of Total Investments) | |
| | | | | | | |
| | 2,753 | | | Advanz Pharma Corp Ltd, (7) | | | | | | | | | | | | | | | | | | | | | | | 9,085 | |
80
| | | | | | | | | | | | | | | | | | | | | | | | | | | | |
| Shares | | | Description (1) | | | | | | | | | | | | | | | | | Value | |
| |
| | | | Software – 0.3% (0.2% of Total Investments) | |
| | | | | | | |
| | 35,589 | | | Avaya Holdings Corp, (7) | | | | | | | | | | | | | | | | | | | | | | $ | 450,557 | |
| | | | Total Common Stocks (cost $7,697,089) | | | | | | | | | | | | 2,640,001 | |
| | | | | | | |
| Shares | | | Description (1) | | | | | | | | | | | | | | | | | Value | |
| |
| | | | WARRANTS – 0.1% (0.1% of Total Investments) | |
| |
| | | | Communications Equipment – 0.0% (0.0% of Total Investments) | |
| | | | | | | |
| | 8,503 | | | Avaya Holdings Corp, (6) | | | | | | | | | | | | | | | | | | | | | | $ | 5,102 | |
| |
| | | | Marine – 0.1% (0.1% of Total Investments) | |
| | | | | | | |
| | 452 | | | ACBL HLDG CORP, (6) | | | | | | | | | | | | | | | | | | | | | | | 16,272 | |
| | 1,682 | | | ACBL HLDG CORP, (6) | | | | | | | | | | | | | | | | | | | | | | | 42,050 | |
| | 1,279 | | | ACBL HLDG CORP, (6) | | | | | | | | | | | | | | | | | | | | | | | 39,649 | |
| | 3,413 | | | Total Marine | | | | | | | | | | | | | | | | | | | | | | | 97,971 | |
| | | | Total Warrants (cost $660,566) | | | | | | | | | | | | | | | | 103,073 | |
| | | | | | | |
| Shares | | | Description (1) | | | | | | | | Coupon | | | | | | Ratings (4) | | | Value | |
| |
| | | | CONVERTIBLE PREFERRED SECURITIES – 0.1% (0.0% of Total Investments) | |
| | | | | | | |
| | | | Marine – 0.1% (0.0% of Total Investments) | | | | | | | | | | | | | | | | | | |
| | | | | | | |
| | 1,600 | | | ACBL HLDG CORP, (6) | | | | | | | | | | | 0.000% | | | | | | | | N/R | | | $ | 40,000 | |
| | 1,821 | | | ACBL HLDG CORP, (6) | | | | | | | | | | | 0.000% | | | | | | | | N/R | | | | 56,450 | |
| | | | Total Marine | | | | | | | | 96,450 | |
| | | | Total Convertible Preferred Securities (cost $97,140) | | | | | | | | | | | | | | | | 96,450 | |
| | | | | | | |
| Shares | | | Description (1) | | | | | | | | | | | | | | | | | Value | |
| |
| | | | COMMON STOCK RIGHTS – 0.0% (0.0% of Total Investments) | |
| |
| | | | Oil, Gas & Consumable Fuels – 0.0% (0.0% of Total Investments) | |
| | | | | | | |
| | 7,268 | | | Fieldwood Energy Inc, (6), (7) | | | | | | | | | | | | | | | | | | | | | | $ | 364 | |
| | 1,468 | | | Fieldwood Energy Inc, (6), (7) | | | | | | | | | | | | | | | | | | | | | | | 73 | |
| | | | Total Common Stock Rights (cost $207,458) | | | | | | | | 437 | |
| | | | Total Long-Term Investments (cost $242,887,786) | | | | | | | | 215,041,769 | |
| | | | | | | |
| Shares | | | Description (1) | | | | | | | | Coupon | | | | | | | | | Value | |
| |
| | | | SHORT-TERM INVESTMENTS – 6.4% (4.0% of Total Investments) | |
| |
| | | | INVESTMENT COMPANIES – 6.4% (4.0% of Total Investments) | |
| | | | | | |
| | 9,059,821 | | | BlackRock Liquidity Funds T-Fund Portfolio, (11) | | | | | | | | 0.065% (12) | | | | | | | | | | | $ | 9,059,821 | |
| | | | Total Short-Term Investments (cost $9,059,821) | | | | | | | | 9,059,821 | |
| | | | Total Investments (cost $251,947,607) – 159.0% | | | | 224,101,590 | |
| | | | Borrowings – (6.0)% (13), (14) | | | | | | | | | | | | | | | | | | | | | | | (8,500,000 | ) |
| | | | Taxable Fund Preferred Shares, net of deferred offering costs – (49.4)% (15) | | | | | | | | | | | | (69,657,866 | ) |
| | | | Other Assets Less Liabilities – (3.6)% | | | | | | | | | | | | (4,962,306 | ) |
| | | | Net Assets Applicable to Common Shares – 100% | | | | | | | $ | 140,981,418 | |
81
| | |
| |
| JSD | | Nuveen Short Duration Credit Opportunities Fund (continued) |
| | Portfolio of Investments July 31, 2020 |
For Fund portfolio compliance purposes, the Fund’s industry classifications refer to any one or more of the industry sub-classifications used by one or more widely recognized market indexes or ratings group indexes, and/or as defined by Fund management. This definition may not apply for purposes of this report, which may combine industry sub-classifications into sectors for reporting ease.
| (1) | All percentages shown in the Portfolio of Investments are based on net assets applicable to common shares unless otherwise noted. |
| (2) | Senior loans generally pay interest at rates which are periodically adjusted by reference to a base short-term, floating lending rate (Reference Rate) plus an assigned fixed rate (Spread). These floating lending rates are generally (i) the lending rate referenced by the London Inter-Bank Offered Rate (“LIBOR”), or (ii) the prime rate offered by one or more major United States banks. Senior loans may be considered restricted in that the Fund ordinarily is contractually obligated to receive approval from the agent bank and/or borrower prior to the disposition of a senior loan. The rate shown is the coupon as of the end of the reporting period. |
| (3) | Senior loans generally are subject to mandatory and/or optional prepayment. Because of these mandatory prepayment conditions and because there may be significant economic incentives for a borrower to prepay, prepayments of senior loans may occur. As a result, the actual remaining maturity of senior loans held may be substantially less than the stated maturities shown. |
| (4) | For financial reporting purposes, the ratings disclosed are the highest of Standard & Poor’s Group (“Standard & Poor’s”), Moody’s Investors Service, Inc. (“Moody’s”) or Fitch, Inc. (“Fitch”) rating. This treatment of split-rated securities may differ from that used for other purposes, such as for Fund investment policies. Ratings below BBB by Standard & Poor’s, Baa by Moody’s or BBB by Fitch are considered to be below investment grade. Holdings designated N/R are not rated by any of these national rating agencies. Ratings are not covered by the report of independent registered public accounting firm. |
| (5) | Defaulted security. A security whose issuer has failed to fully pay principal and/or interest when due, or is under the protection of bankruptcy. |
| (6) | For fair value measurement disclosure purposes, investment classified as Level 2. See Notes to Financial Statements, Note 3 – Investment Valuation and Fair Value Measurements for more information. |
| (7) | Non-income producing; issuer has not declared a dividend within the past twelve months. |
| (8) | Investment valued at fair value using methods determined in good faith by, or at the discretion of, the Board. For fair value measurement disclosure purposes, investment classified as Level 3. See Notes to Financial Statements, Note 3 – Investment Valuation and Fair Value Measurements for more information. |
| (9) | Investment, or portion of investment, represents an outstanding unfunded senior loan commitment. See Notes to Financial Statements, Note 4 – Portfolio Securities and Investments in Derivatives for more information. |
| (10) | Common Stock received as part of the bankruptcy settlements for Bruce Mansfield Unit 1 2007 Pass-Through Trust. |
| (11) | A copy of the most recent financial statements for these investment companies can be obtained directly from the Securities and Exchange Commission on its website at http://www.sec.gov. |
| (12) | The rate shown is the annualized seven-day subsidized yield as of the end of the reporting period. |
| (13) | The Fund segregates 100% of its eligible investments (excluding any investments separately pledged as collateral for specific investments in derivatives, when applicable) in the Portfolio of Investments as collateral for borrowings. |
| (14) | Borrowings as a percentage of Total Investments is 3.8%. |
| (15) | Taxable Fund Preferred Shares, net of deferred offering costs as a percentage of Total Investments is 31.1%. |
| 144A | Investment is exempt from registration under Rule 144A of the Securities Act of 1933, as amended. These investments may only be resold in transactions exempt from registration, which are normally those transactions with qualified institutional buyers. |
| DD1 | Portion of investment purchased on a delayed delivery basis. |
| LIBOR | London Inter-Bank Offered Rate |
| PIK | Payment-in-kind (“PIK”) security. Depending on the terms of the security, income may be received in the form of cash, securities, or a combination of both. The PIK rate shown, where applicable, represents the annualized rate of the last PIK payment made by the issuer as of the end of the reporting period. |
| TBD | Senior loan purchased on a when-issued or delayed-delivery basis. Certain details associated with this purchase are not known prior to the settlement date of the transaction. In addition, senior loans typically trade without accrued interest and therefore a coupon rate is not available prior to settlement. At settlement, if still unknown, the borrower or counterparty will provide the Fund with the final coupon rate and maturity date. |
| WI/DD | Purchased on a when-issued or delayed delivery basis. |
See accompanying notes to financial statements.
82
| | |
| JQC | | Nuveen Credit Strategies Income Fund Portfolio of Investments July 31, 2020 |
| | | | | | | | | | | | | | | | | | | | | | | | | | | | |
Principal
Amount (000) | | | Description (1) | | Coupon (2) | | | Reference
Rate (2) | | | Spread (2) | | | Maturity (3) | | | Ratings (4) | | | Value | |
| |
| | | | LONG-TERM INVESTMENTS – 154.0% (97.5% of Total Investments) | |
| |
| | | | VARIABLE RATE SENIOR LOAN INTERESTS – 124.1% (78.6% of Total Investments) (2) | |
| |
| | | | Aerospace & Defense – 1.3% (0.8% of Total Investments) | |
| | | | | | | |
| $ | 968 | | | Standard Aero, Term Loan B1 | | | 3.808% | | | | 3-Month LIBOR | | | | 3.500% | | | | 4/08/26 | | | | B– | | | $ | 781,828 | |
| | 521 | | | Standard Aero, Term Loan B2 | | | 3.808% | | | | 3-Month LIBOR | | | | 3.500% | | | | 4/08/26 | | | | B– | | | | 420,337 | |
| | 11,731 | | | Transdigm, Inc., Term Loan E | | | 2.411% | | | | 1-Month LIBOR | | | | 2.250% | | | | 5/30/25 | | | | Ba3 | | | | 10,998,798 | |
| | 13,220 | | | Total Aerospace & Defense | | | | | | | | | | | | | | | | | | | | | | | 12,200,963 | |
| | |
| | | | Airlines – 4.0% (2.5% of Total Investments) | | | | |
| | | | | | | |
| | 10,488 | | | American Airlines, Inc., Term Loan 2025 | | | 1.922% | | | | 1-Month LIBOR | | | | 1.750% | | | | 6/27/25 | | | | Ba3 | | | | 5,948,602 | |
| | 3,680 | | | American Airlines, Inc., Term Loan B | | | 2.184% | | | | 1-Month LIBOR | | | | 2.000% | | | | 4/28/23 | | | | Ba3 | | | | 2,818,880 | |
| | 3,267 | | | American Airlines, Inc., Term Loan B | | | 1.916% | | | | 1-Month LIBOR | | | | 1.750% | | | | 1/29/27 | | | | Ba3 | | | | 2,303,039 | |
| | 4,253 | | | American Airlines, Inc., Term Loan B | | | 2.175% | | | | 1-Month LIBOR | | | | 2.000% | | | | 12/14/23 | | | | Ba3 | | | | 3,240,110 | |
| | 8,350 | | | United Air Lines, Inc., Term Loan B, (DD1) | | | 6.250% | | | | 3-Month LIBOR | | | | 5.250% | | | | 6/20/27 | | | | Baa3 | | | | 8,350,543 | |
| | 9,496 | | | United Air Lines, Inc., Term Loan B | | | 1.911% | | | | 1-Month LIBOR | | | | 1.750% | | | | 4/01/24 | | | | Ba1 | | | | 8,602,441 | |
| | 7,960 | | | WestJet Airlines, Term Loan | | | 4.000% | | | | 6-Month LIBOR | | | | 3.000% | | | | 12/11/26 | | | | BB+ | | | | 5,934,657 | |
| | 47,494 | | | Total Airlines | | | | | | | | | | | | | | | | | | | | | | | 37,198,272 | |
| | |
| | | | Auto Components – 0.9% (0.6% of Total Investments) | | | | |
| | | | | | | |
| | 8,933 | | | Johnson Controls Inc., Term Loan B | | | 3.667% | | | | 1-Month LIBOR | | | | 3.500% | | | | 4/30/26 | | | | B1 | | | | 8,746,391 | |
| | |
| | | | Automobiles – 1.5% (1.0% of Total Investments) | | | | |
| | | | | | | |
| | 14,625 | | | Navistar, Inc., Term Loan B | | | 3.690% | | | | 1-Month LIBOR | | | | 3.500% | | | | 11/06/24 | | | | Ba2 | | | | 14,216,670 | |
| | |
| | | | Beverages – 0.9% (0.6% of Total Investments) | | | | |
| | | | | | | |
| | 8,846 | | | Jacobs Douwe Egberts, Term Loan B | | | 2.188% | | | | 1-Month LIBOR | | | | 2.000% | | | | 11/01/25 | | | | BB+ | | | | 8,728,336 | |
| | |
| | | | Building Products – 1.8% (1.2% of Total Investments) | | | | |
| | | | | | | |
| | 93 | | | Advanced Drainage Systems, Term Loan B | | | 2.438% | | | | 1-Month LIBOR | | | | 2.250% | | | | 9/24/26 | | | | Ba1 | | | | 92,076 | |
| | 17,677 | | | Quikrete Holdings, Inc., Term Loan B | | | 2.661% | | | | 1-Month LIBOR | | | | 2.500% | | | | 2/01/27 | | | | BB– | | | | 17,123,956 | |
| | 17,770 | | | Total Building Products | | | | | | | | | | | | | | | | | | | | | | | 17,216,032 | |
| |
| | | | Capital Markets – 1.9% (1.2% of Total Investments) | |
| | | | | | | |
| | 13,746 | | | RPI Finance Trust, Term Loan B1 | | | 1.911% | | | | 1-Month LIBOR | | | | 1.750% | | | | 2/11/27 | | | | BBB– | | | | 13,632,684 | |
| | 4,077 | | | RPI Finance Trust, Term Loan B1 | | | 1.911% | | | | 1-Month LIBOR | | | | 1.750% | | | | 2/11/27 | | | | BBB– | | | | 4,025,988 | |
| | 17,823 | | | Total Capital Markets | | | | | | | | | | | | | | | | | | | | | | | 17,658,672 | |
| | |
| | | | Chemicals – 1.8% (1.1% of Total Investments) | | | | |
| | | | | | | |
| | 6,844 | | | Axalta Coating Systems, Term Loan, First Lien | | | 2.058% | | | | 3-Month LIBOR | | | | 1.750% | | | | 6/01/24 | | | | Ba1 | | | | 6,710,086 | |
| | 5,988 | | | Ineos US Finance LLC, Term Loan | | | 2.214% | | | | 2-Month LIBOR | | | | 2.000% | | | | 3/31/24 | | | | BBB– | | | | 5,782,334 | |
| | 1,000 | | | Lummus Technology, Term Loan | | | 4.308% | | | | 3-Month LIBOR | | | | 4.000% | | | | 6/30/27 | | | | B+ | | | | 991,250 | |
| | 3,259 | | | Univar, Inc., Term Loan B | | | 2.411% | | | | 1-Month LIBOR | | | | 2.250% | | | | 7/01/24 | | | | BB+ | | | | 3,205,511 | |
| | 17,091 | | | Total Chemicals | | | | | | | | | | | | | | | | | | | | | | | 16,689,181 | |
| | |
| | | | Commercial Services & Supplies – 4.1% (2.6% of Total Investments) | | | | |
| | | | | | | |
| | 10,123 | | | Formula One Group, Term Loan B | | | 3.500% | | | | 1-Month LIBOR | | | | 2.500% | | | | 2/01/24 | | | | B+ | | | | 9,831,984 | |
| | 8,712 | | | Garda World Security Corp, Term Loan B, First Lien | | | 4.930% | | | | 1-Month LIBOR | | | | 4.750% | | | | | | | | B | | | | 8,652,094 | |
| | 2,386 | | | GFL Environmental, Term Loan | | | 4.000% | | | | 3-Month LIBOR | | | | 3.000% | | | | 5/31/25 | | | | BB– | | | | 2,378,573 | |
| | 2,985 | | | Sabert Corporation, Initial Term Loan | | | 5.500% | | | | 1-Month LIBOR | | | | 4.500% | | | | 12/10/26 | | | | B | | | | 2,968,836 | |
| | 14,777 | | | Trans Union LLC, Term Loan B5 | | | 1.911% | | | | 1-Month LIBOR | | | | 1.750% | | | | 11/13/26 | | | | BB+ | | | | 14,426,483 | |
| | 38,983 | | | Total Commercial Services & Supplies | | | | | | | | | | | | | | | | | | | | | | | 38,257,970 | |
| |
| | | | Communications Equipment – 1.5% (1.0% of Total Investments) | |
| | | | | | | |
| | 1,817 | | | Avaya, Inc., Term Loan B | | | 4.425% | | | | 1-Month LIBOR | | | | 4.250% | | | | 12/15/24 | | | | BB– | | | | 1,723,206 | |
| | 2,977 | | | Fleet U.S. Bidco Inc., Term Loan B | | | 4.322% | | | | 6-Month LIBOR | | | | 3.250% | | | | 10/07/26 | | | | B+ | | | | 2,932,837 | |
| | 5,832 | | | Plantronics, Term Loan B | | | 2.861% | | | | 1-Month LIBOR | | | | 2.500% | | | | 7/02/25 | | | | Ba2 | | | | 5,410,563 | |
| | 878 | | | Plantronics, Term Loan B | | | 2.861% | | | | 6-Month LIBOR | | | | 2.500% | | | | 7/02/25 | | | | Ba2 | | | | 814,180 | |
| | 3,233 | | | Riverbed Technology, Inc., Term Loan B, First Lien | | | 3.511% | | | | 3-Month LIBOR | | | | 3.250% | | | | 4/24/22 | | | | B2 | | | | 2,952,757 | |
83
| | |
| |
| JQC | | Nuveen Credit Strategies Income Fund (continued) |
| | Portfolio of Investments July 31, 2020 |
| | | | | | | | | | | | | | | | | | | | | | | | | | | | |
Principal
Amount (000) | | | Description (1) | | Coupon (2) | | | Reference
Rate (2) | | | Spread (2) | | | Maturity (3) | | | Ratings (4) | | | Value | |
| |
| | | | Communications Equipment (continued) | |
| | | | | | | |
| $ | 139 | | | Univision Communications, Inc., Term Loan C5 | | | 3.750% | | | | 1-Month LIBOR | | | | 2.750% | | | | 3/15/24 | | | | B | | | $ | 133,679 | |
| | | | | | | |
| | 14,876 | | | Total Communications Equipment | | | | | | | | | | | | | | | | | | | | | | | 13,967,222 | |
| |
| | | | Containers & Packaging – 1.7% (1.1% of Total Investments) | |
| | | | | | | |
| | 8,415 | | | Berry Global, Inc., Term Loan Y | | | 2.188% | | | | 1-Month LIBOR | | | | 2.000% | | | | 7/01/26 | | | | BBB– | | | | 8,182,283 | |
| | 5,397 | | | Berry Global, Inc., Term Loan W | | | 2.188% | | | | 1-Month LIBOR | | | | 2.000% | | | | 10/01/22 | | | | BBB– | | | | 5,313,453 | |
| | 2,485 | | | Kloeckner Pentaplast of America Inc., Dollar Term Loan | | | 5.250% | | | | 6-Month LIBOR | | | | 4.250% | | | | 6/30/22 | | | | B– | | | | 2,372,678 | |
| | 16,297 | | | Total Containers & Packaging | | | | | | | | | | | | | | | | | | | | | | | 15,868,414 | |
| |
| | | | Diversified Consumer Services – 0.2% (0.1% of Total Investments) | |
| | | | | | | |
| | 1,905 | | | Refinitiv, Term Loan B | | | 3.411% | | | | 1-Month LIBOR | | | | 3.250% | | | | 10/01/25 | | | | BB+ | | | | 1,892,998 | |
| |
| | | | Diversified Financial Services – 0.2% (0.2% of Total Investments) | |
| | | | | | | |
| | 4,673 | | | Ditech Holding Corporation., Term Loan B, First Lien, (5) | | | 0.000% | | | | N/A | | | | N/A | | | | 6/30/22 | | | | D | | | | 1,098,202 | |
| | 1,007 | | | Lions Gate Entertainment Corp., Term Loan B | | | 2.411% | | | | 1-Month LIBOR | | | | 2.250% | | | | 3/24/25 | | | | Ba2 | | | | 971,896 | |
| | 5,680 | | | Total Diversified Financial Services | | | | | | | | | | | | | | | | | | | | | | | 2,070,098 | |
| |
| | | | Diversified Telecommunication Services – 3.4% (2.1% of Total Investments) | |
| | | | | | | |
| | 15,407 | | | CenturyLink, Inc, Term Loan A | | | 2.161% | | | | 1-Month LIBOR | | | | 2.000% | | | | 1/31/25 | | | | BBB– | | | | 14,931,551 | |
| | 1,512 | | | CenturyLink, Inc, Term Loan B | | | 2.411% | | | | 1-Month LIBOR | | | | 2.250% | | | | 3/15/27 | | | | BB+ | | | | 1,460,532 | |
| | 1,973 | | | Frontier Communications Corporation, Term Loan B, (5) | | | 3.911% | | | | 1-Month LIBOR | | | | 3.750% | | | | 6/15/24 | | | | N/R | | | | 1,948,387 | |
| | 7 | | | Frontier Communications Corporation, Term Loan B, (5) | | | 6.000% | | | | Prime | | | | 2.750% | | | | 6/15/24 | | | | N/R | | | | 6,511 | |
| | 11,835 | | | Numericable Group S.A., Term Loan B13 | | | 4.175% | | | | 1-Month LIBOR | | | | 4.000% | | | | 8/14/26 | | | | B | | | | 11,616,118 | |
| | 1,995 | | | Zayo Group LLC, Initial Dollar Term Loan | | | 3.161% | | | | 1-Month LIBOR | | | | 3.000% | | | | 3/09/27 | | | | B1 | | | | 1,943,100 | |
| | 32,729 | | | Total Diversified Telecommunication Services | | | | | | | | | | | | | | | | | | | | | | | 31,906,199 | |
| |
| | | | Electric Utilities – 0.6% (0.4% of Total Investments) | |
| | | | | | | |
| | 1,000 | | | Pacific Gas & Electric, Term Loan, First Lien | | | 5.500% | | | | 3-Month LIBOR | | | | 4.500% | | | | 6/23/25 | | | | BB | | | | 991,250 | |
| | 4,871 | | | Vistra Operations Co., Term Loan B3 | | | 1.931% | | | | 1-Month LIBOR | | | | 1.750% | | | | 12/31/25 | | | | Baa3 | | | | 4,805,512 | |
| | 5,871 | | | Total Electric Utilities | | | | | | | | | | | | | | | | | | | | | | | 5,796,762 | |
| |
| | | | Electrical Equipment – 0.4% (0.2% of Total Investments) | |
| | | | | | | |
| | 2,179 | | | Avolon LLC, Term Loan B4 | | | 2.250% | | | | 1-Month LIBOR | | | | 1.500% | | | | 2/10/27 | | | | Baa2 | | | | 2,044,265 | |
| | 1,496 | | | Vertiv Co.,Term Loan B | | | 3.162% | | | | 1-Month LIBOR | | | | 3.000% | | | | 3/02/27 | | | | B+ | | | | 1,466,325 | |
| | 3,675 | | | Total Electrical Equipment | | | | | | | | | | | | | | | | | | | | | | | 3,510,590 | |
| |
| | | | Entertainment – 0.8% (0.5% of Total Investments) | |
| | | | | | | |
| | 994 | | | AMC Entertainment, Inc., Term Loan B | | | 4.080% | | | | 6-Month LIBOR | | | | 3.000% | | | | 4/22/26 | | | | CCC+ | | | | 658,694 | |
| | 2,436 | | | NASCAR Holdings, Inc., Term Loan B | | | 2.922% | | | | 1-Month LIBOR | | | | 2.750% | | | | 10/18/26 | | | | BB | | | | 2,390,082 | |
| | 4,180 | | | Springer SBM Two GmbH, Term Loan B16 | | | 4.500% | | | | 1-Month LIBOR | | | | 3.500% | | | | 8/14/24 | | | | B2 | | | | 4,131,787 | |
| | 7,610 | | | Total Entertainment | | | | | | | | | | | | | | | | | | | | | | | 7,180,563 | |
| |
| | | | Food & Staples Retailing – 3.7% (2.3% of Total Investments) | |
| | | | | | | |
| | 2,805 | | | Aramark Corporation, Term Loan | | | 1.911% | | | | 1-Month LIBOR | | | | 1.750% | | | | 3/11/25 | | | | BBB– | | | | 2,682,870 | |
| | 11,559 | | | Hearthside Group Holdings LLC, Term Loan B | | | 3.849% | | | | 1-Month LIBOR | | | | 3.688% | | | | 5/31/25 | | | | B2 | | | | 11,194,210 | |
| | 673 | | | Hearthside Group Holdings, LLC, Incremental Term Loan B3 | | | 6.000% | | | | 1-Month LIBOR | | | | 5.000% | | | | 5/31/25 | | | | B2 | | | | 666,653 | |
| | 13,603 | | | JBS USA Holdings, Inc., New Term Loan | | | 3.072% | | | | 6-Month LIBOR | | | | 2.000% | | | | 5/01/26 | | | | BBB– | | | | 13,204,936 | |
| | 7,142 | | | US Foods, Inc., New Term Loan | | | 1.911% | | | | 1-Month LIBOR | | | | 1.750% | | | | 6/27/23 | | | | BB | | | | 6,794,009 | |
| | 35,782 | | | Total Food & Staples Retailing | | | | | | | | | | | | | | | | | | | | | | | 34,542,678 | |
| |
| | | | Food Products – 1.0% (0.7% of Total Investments) | |
| | | | | | | |
| | 7,878 | | | Chobani, Inc., Term Loan B | | | 4.500% | | | | 1-Month LIBOR | | | | 3.500% | | | | 10/10/23 | | | | B1 | | | | 7,826,205 | |
| | 2,000 | | | Froneri Lux FinCo SARL, Term Loan, First Lien | | | 2.411% | | | | 1-Month LIBOR | | | | 2.250% | | | | 1/31/27 | | | | B1 | | | | 1,923,930 | |
| | 9,878 | | | Total Food Products | | | | | | | | | | | | | | | | | | | | | | | 9,750,135 | |
| |
| | | | Health Care Equipment & Supplies – 0.6% (0.4% of Total Investments) | |
| | | | | | | |
| | 6,263 | | | MedPlast, Term Loan, First Lien | | | 3.911% | | | | 1-Month LIBOR | | | | 3.750% | | | | 7/02/25 | | | | B3 | | | | 5,469,822 | |
| |
| | | | Health Care Providers & Services – 11.2% (7.1% of Total Investments) | |
| | | | | | | |
| | 5,035 | | | Acadia Healthcare, Inc., Term Loan B3 | | | 2.661% | | | | 1-Month LIBOR | | | | 2.500% | | | | 2/11/22 | | | | Ba3 | | | | 4,971,004 | |
84
| | | | | | | | | | | | | | | | | | | | | | | | | | | | |
Principal
Amount (000) | | | Description (1) | | Coupon (2) | | | Reference
Rate (2) | | | Spread (2) | | | Maturity (3) | | | Ratings (4) | | | Value | |
| |
| | | | Health Care Providers & Services (continued) | |
| | | | | | | |
| $ | 16,945 | | | Air Medical Group Holdings, Inc., Term Loan B, (DD1) | | | 4.250% | | | | 6-Month LIBOR | | | | 3.250% | | | | 4/28/22 | | | | B1 | | | $ | 16,775,750 | |
| | 2,985 | | | Air Methods, Term Loan, First Lien | | | 4.500% | | | | 3-Month LIBOR | | | | 3.500% | | | | 4/21/24 | | | | B | | | | 2,406,018 | |
| | 32 | | | Albany Molecular Research, Inc., Initial Term Loan, First Lien | | | 4.250% | | | | 2-Month LIBOR | | | | 3.250% | | | | 8/31/24 | | | | B2 | | | | 31,634 | |
| | 12,448 | | | Albany Molecular Research, Inc., Initial Term Loan, First Lien | | | 4.250% | | | | 3-Month LIBOR | | | | 3.250% | | | | 8/31/24 | | | | B2 | | | | 12,273,880 | |
| | 9,682 | | | Ardent Health, Term Loan, First Lien | | | 5.500% | | | | 1-Month LIBOR | | | | 4.500% | | | | 6/28/25 | | | | B1 | | | | 9,634,139 | |
| | 7,910 | | | ATI Holdings Acquisition, Inc., Term Loan | | | 4.572% | | | | 3-Month LIBOR | | | | 3.500% | | | | 5/10/23 | | | | B– | | | | 7,356,201 | |
| | 9,357 | | | Civitas Solutions, Term Loan B | | | 4.420% | | | | 1-Month LIBOR | | | | 4.250% | | | | 3/08/26 | | | | B | | | | 9,185,232 | |
| | 426 | | | Civitas Solutions, Term Loan C | | | 4.420% | | | | 1-Month LIBOR | | | | 4.250% | | | | 3/08/26 | | | | B | | | | 418,213 | |
| | 1,985 | | | Envision Healthcare Corporation, Initial Term Loan | | | 3.911% | | | | 1-Month LIBOR | | | | 3.750% | | | | 10/10/25 | | | | Caa1 | | | | 1,320,992 | |
| | 12,516 | | | Kindred at Home Hospice, Term Loan B, First Lien | | | 3.438% | | | | 1-Month LIBOR | | | | 3.250% | | | | 7/02/25 | | | | B1 | | | | 12,367,067 | |
| | 4,463 | | | Lifepoint Health, Inc., New Term Loan B | | | 3.911% | | | | 1-Month LIBOR | | | | 3.750% | | | | 11/16/25 | | | | B1 | | | | 4,375,671 | |
| | 3,729 | | | Pharmaceutical Product Development, Inc., Term Loan B | | | 3.500% | | | | 1-Month LIBOR | | | | 2.500% | | | | 8/18/22 | | | | Ba2 | | | | 3,719,467 | |
| | 12,281 | | | Brightspring Health, Term Loan B | | | 3.425% | | | | 1-Month LIBOR | | | | 3.250% | | | | 3/05/26 | | | | B1 | | | | 12,050,601 | |
| | 140 | | | Quorum Health Corp, Term Loan, (5) | | | 9.250% | | | | 3-Month LIBOR | | | | 8.250% | | | | 4/29/22 | | | | N/R | | | | 130,672 | |
| | 7,957 | | | Select Medical Corporation, Term Loan B | | | 2.680% | | | | 1-Month LIBOR | | | | 2.500% | | | | 3/06/25 | | | | Ba2 | | | | 7,761,151 | |
| | 107,891 | | | Total Health Care Providers & Services | | | | | | | | | | | | | | | | | | | | | | | 104,777,692 | |
| |
| | | | Health Care Technology – 1.9% (1.2% of Total Investments) | |
| | | | | | | |
| | 8,067 | | | Onex Carestream Finance LP, New Extended Term Loan, Second Lien | | | 5.572% | | | | 3-Month LIBOR | | | | 4.500% | | | | 8/05/23 | | | | Caa1 | | | | 6,494,334 | |
| | 5,263 | | | Onex Carestream Finance LP, New Extended Term Loan, First Lien | | | 7.822% | | | | 6-Month LIBOR | | | | 6.750% | | | | 5/05/23 | | | | B1 | | | | 5,019,584 | |
| | 2,346 | | | Emdeon, Inc., Term Loan | | | 3.500% | | | | 3-Month LIBOR | | | | 2.500% | | | | 3/01/24 | | | | B+ | | | | 2,301,209 | |
| | 3,605 | | | Zelis, Term Loan B | | | 4.911% | | | | 1-Month LIBOR | | | | 4.750% | | | | 9/30/26 | | | | B | | | | 3,602,652 | |
| | 19,281 | | | Total Health Care Technology | | | | | | | | | | | | | | | | | | | | | | | 17,417,779 | |
| |
| | | | Hotels, Restaurants & Leisure – 13.9% (8.8% of Total Investments) | |
| | | | | | | |
| | 15,328 | | | Burger King Corporation, Term Loan B4 | | | 1.911% | | | | 1-Month LIBOR | | | | 1.750% | | | | 11/19/26 | | | | BB+ | | | | 14,742,653 | |
| | 1,000 | | | Caesars Resort Collection, Term Loan | | | 4.772% | | | | 1-Month LIBOR | | | | 4.500% | | | | 7/20/25 | | | | B+ | | | | 966,095 | |
| | 500 | | | Caesars Resort Collection, Term Loan | | | 4.772% | | | | 3-Month LIBOR | | | | 4.500% | | | | 7/20/25 | | | | B+ | | | | 483,048 | |
| | 15,053 | | | Caesars Resort Collection, Term Loan, First Lien | | | 2.911% | | | | 1-Month LIBOR | | | | 2.750% | | | | 12/22/24 | | | | B+ | | | | 13,893,740 | |
| | 912 | | | CCM Merger, Inc., Term Loan B | | | 3.000% | | | | 1-Month LIBOR | | | | 2.250% | | | | 8/09/21 | | | | BB | | | | 898,807 | |
| | 439 | | | ClubCorp Operations, Inc., Term Loan B | | | 3.058% | | | | 3-Month LIBOR | | | | 2.750% | | | | 9/18/24 | | | | B– | | | | 380,774 | |
| | 12,338 | | | Equinox Holdings, Inc., Term Loan B1 | | | 4.072% | | | | 6-Month LIBOR | | | | 3.000% | | | | 3/08/24 | | | | Caa1 | | | | 9,358,939 | |
| | 4,682 | | | Hilton Hotels, Term Loan B2 | | | 1.922% | | | | 1-Month LIBOR | | | | 1.750% | | | | 6/21/26 | | | | BBB– | | | | 4,514,637 | |
| | 4,995 | | | Arby’s Restaurant Group, Inc., Term Loan B, (DD1) | | | 3.750% | | | | 6-Month LIBOR | | | | 2.750% | | | | 2/05/25 | | | | B | | | | 4,703,945 | |
| | 21,606 | | | Life Time Fitness, Inc., Term Loan B | | | 3.750% | | | | 3-Month LIBOR | | | | 2.750% | | | | 6/15/22 | | | | B | | | | 19,591,975 | |
| | 56 | | | Life Time Fitness, Inc., Term Loan B | | | 3.750% | | | | 6-Month LIBOR | | | | 2.750% | | | | 6/15/22 | | | | B | | | | 50,495 | |
| | 4,876 | | | Marriott Ownership Resorts, Inc., Term Loan B | | | 1.911% | | | | 1-Month LIBOR | | | | 1.750% | | | | 8/31/25 | | | | BB | | | | 4,680,456 | |
| | 12,237 | | | Scientific Games Corp., Initial Term Loan B5 | | | 2.911% | | | | 1-Month LIBOR | | | | 2.750% | | | | 8/14/24 | | | | B+ | | | | 11,181,754 | |
| | 4,440 | | | Stars Group Holdings, Term Loan B | | | 3.808% | | | | 3-Month LIBOR | | | | 3.500% | | | | 7/10/25 | | | | BBB– | | | | 4,446,460 | |
| | 12,326 | | | Station Casinos LLC, Term Loan B | | | 2.500% | | | | 1-Month LIBOR | | | | 2.250% | | | | 2/08/27 | | | | BB– | | | | 11,422,084 | |
| | 16,873 | | | Whataburger Restaurants, Term Loan B | | | 2.916% | | | | 1-Month LIBOR | | | | 2.750% | | | | 8/03/26 | | | | B+ | | | | 16,324,349 | |
| | 2,456 | | | Wyndham International, Inc., Term Loan B | | | 1.911% | | | | 1-Month LIBOR | | | | 1.750% | | | | 5/30/25 | | | | BB+ | | | | 2,347,770 | |
| | 9,582 | | | YUM Brands, Term Loan B | | | 1.937% | | | | 1-Month LIBOR | | | | 1.750% | | | | 4/03/25 | | | | BBB– | | | | 9,336,112 | |
| | 139,699 | | | Total Hotels, Restaurants & Leisure | | | | | | | | | | | | | | | | | | | | | | | 129,324,093 | |
| |
| | | | Household Durables – 0.4% (0.3% of Total Investments) | |
| | | | | | | |
| | 4,319 | | | Apex Tool Group LLC, Third Amendment Term Loan | | | 6.500% | | | | 1-Month LIBOR | | | | 5.250% | | | | 8/21/24 | | | | B3 | | | | 3,984,121 | |
| | 122 | | | Serta Simmons Holdings LLC, Second Out Term Loan | | | 8.500% | | | | 2-Month LIBOR | | | | 7.500% | | | | 6/01/27 | | | | B | | | | 94,030 | |
| | 4,441 | | | Total Household Durables | | | | | | | | | | | | | | | | | | | | | | | 4,078,151 | |
| | |
| | | | Household Products – 1.8% (1.1% of Total Investments) | | | | |
| | | | | | | |
| | 3,000 | | | KIK Custom Products Inc., Term Loan B2, (DD1) | | | 5.000% | | | | 1-Month LIBOR | | | | 4.000% | | | | 5/15/23 | | | | B– | | | | 2,967,195 | |
| | 13,996 | | | Reynolds Group Holdings, Inc., Term Loan, First Lien | | | 2.911% | | | | 1-Month LIBOR | | | | 2.750% | | | | 2/05/23 | | | | B+ | | | | 13,755,172 | |
| | 16,996 | | | Total Household Products | | | | | | | | | | | | | | | | | | | | | | | 16,722,367 | |
| | |
| | | | Insurance – 4.3% (2.7% of Total Investments) | | | | |
| | | | | | | |
| | 16,945 | | | Acrisure LLC, Term Loan B | | | 3.661% | | | | 1-Month LIBOR | | | | 3.500% | | | | 2/15/27 | | | | B | | | | 16,368,748 | |
| | 14,537 | | | Hub International Holdings, Inc., Term Loan B | | | 3.263% | | | | 3-Month LIBOR | | | | 3.000% | | | | 4/25/25 | | | | B | | | | 14,157,407 | |
| | 250 | | | Ryan Specialty Group LLC, Term Loan B, (WI/DD) | | | TBD | | | | TBD | | | | TBD | | | | TBD | | | | B1 | | | | 248,750 | |
85
| | |
| |
| JQC | | Nuveen Credit Strategies Income Fund (continued) |
| | Portfolio of Investments July 31, 2020 |
| | | | | | | | | | | | | | | | | | | | | | | | | | | | |
Principal
Amount (000) | | | Description (1) | | Coupon (2) | | | Reference
Rate (2) | | | Spread (2) | | | Maturity (3) | | | Ratings (4) | | | Value | |
| | |
| | | | Insurance (continued) | | | | |
| | | | | | | |
| $ | 1,990 | | | USI Holdings Corporation, Incremental Term Loan B | | | 4.308% | | | | 3-Month LIBOR | | | | 4.000% | | | | 12/02/26 | | | | B | | | $ | 1,969,354 | |
| | 7,939 | | | USI Holdings Corporation, NewTerm Loan | | | 3.308% | | | | 3-Month LIBOR | | | | 3.000% | | | | 5/16/24 | | | | B | | | | 7,697,318 | |
| | 41,661 | | | Total Insurance | | | | | | | | | | | | | | | | | | | | | | | 40,441,577 | |
| |
| | | | Interactive Media & Services – 0.9% (0.6% of Total Investments) | |
| | | | | | | |
| | 8,871 | | | Rackspace Hosting, Inc., Refinancing Term Loan B, First Lien | | | 4.000% | | | | 3-Month LIBOR | | | | 3.000% | | | | 11/03/23 | | | | B+ | | | | 8,710,838 | |
| |
| | | | Internet Software & Services – 2.4% (1.5% of Total Investments) | |
| | | | | | | |
| | 4,923 | | | Ancestry.com, Inc., Term Loan, First Lien | | | 4.750% | | | | 1-Month LIBOR | | | | 3.750% | | | | 10/19/23 | | | | B | | | | 4,849,083 | |
| | 2,229 | | | Blue Yonder, Term Loan B, (WI/DD) | | | TBD | | | | TBD | | | | TBD | | | | TBD | | | | B1 | | | | 2,227,532 | |
| | 7,773 | | | Dynatrace LLC, Term Loan, First Lien | | | 2.411% | | | | 1-Month LIBOR | | | | 2.250% | | | | 8/23/25 | | | | B1 | | | | 7,675,606 | |
| | 7,899 | | | Epicor Software Corporation, Term Loan, First Lien | | | 5.250% | | | | 3-Month LIBOR | | | | 4.250% | | | | 7/30/27 | | | | B2 | | | | 7,902,818 | |
| | 4,000 | | | SkillSoft Corporation, Term Loan, Second Lien, (5) | | | 0.000% | | | | N/A | | | | N/A | | | | 4/28/22 | | | | CCC | | | | 168,000 | |
| | 26,824 | | | Total Internet Software & Services | | | | | | | | | | | | | | | | | | | | | | | 22,823,039 | |
| | |
| | | | IT Services – 3.6% (2.3% of Total Investments) | | | | |
| | | | | | | |
| | 18,387 | | | Sabre, Inc., Term Loan B | | | 2.161% | | | | 1-Month LIBOR | | | | 2.000% | | | | 2/22/24 | | | | Ba3 | | | | 16,885,905 | |
| | 5,089 | | | Syniverse Holdings, Inc., Term Loan C | | | 6.000% | | | | 3-Month LIBOR | | | | 5.000% | | | | 3/09/23 | | | | CCC+ | | | | 4,058,346 | |
| | 12,615 | | | Tempo Acquisition LLC, Term Loan B | | | 2.911% | | | | 1-Month LIBOR | | | | 2.750% | | | | 5/01/24 | | | | B1 | | | | 12,340,489 | |
| | 36,091 | | | Total IT Services | | | | | | | | | | | | | | | | | | | | | | | 33,284,740 | |
| | |
| | | | Life Sciences Tools & Services – 2.3% (1.4% of Total Investments) | | | | |
| | | | | | | |
| | 21,986 | | | Parexel International Corp., Term Loan B | | | 2.911% | | | | 1-Month LIBOR | | | | 2.750% | | | | 9/27/24 | | | | B2 | | | | 21,192,707 | |
| | |
| | | | Machinery – 2.0% (1.2% of Total Investments) | | | | |
| | | | | | | |
| | 12,506 | | | Gardner Denver, Inc., Extended Term Loan B | | | 1.911% | | | | 1-Month LIBOR | | | | 1.750% | | | | 2/28/27 | | | | Ba2 | | | | 12,062,605 | |
| | 1,403 | | | Gardner Denver, Inc., New Term Loan B | | | 2.916% | | | | 1-Month LIBOR | | | | 2.750% | | | | 1/31/27 | | | | BB+ | | | | 1,386,474 | |
| | 5,000 | | | Thyssenkrupp Elevator, Term Loan B, (WI/DD) | | | TBD | | | | TBD | | | | TBD | | | | TBD | | | | B1 | | | | 4,939,075 | |
| | 18,909 | | | Total Machinery | | | | | | | | | | | | | | | | | | | | | | | 18,388,154 | |
| | |
| | | | Marine – 0.1% (0.1% of Total Investments) | | | | |
| | | | | | | |
| | 2,669 | | | Harvey Gulf International Marine, Inc., Exit Term Loan | | | 7.713% | | | | 3-Month LIBOR | | | | 6.000% | | | | 7/02/23 | | | | B– | | | | 1,291,080 | |
| | |
| | | | Media – 13.2% (8.3% of Total Investments) | | | | |
| | | | | | | |
| | 6,959 | | | Acquisitions Cogeco Cable II L.P., Term Loan, First Lien | | | 2.161% | | | | 1-Month LIBOR | | | | 2.000% | | | | 1/04/25 | | | | BB | | | | 6,728,408 | |
| | 1,824 | | | Advantage Sales & Marketing, Inc., Term Loan B2, First Lien | | | 4.250% | | | | 3-Month LIBOR | | | | 3.250% | | | | 7/25/21 | | | | B2 | | | | 1,734,941 | |
| | 2,282 | | | Advantage Sales & Marketing, Inc., Term Loan, First Lien | | | 4.250% | | | | 3-Month LIBOR | | | | 3.250% | | | | 7/25/21 | | | | B2 | | | | 2,172,721 | |
| | 9,900 | | | Cequel Communications LLC, Term Loan B | | | 2.425% | | | | 1-Month LIBOR | | | | 2.250% | | | | 1/15/26 | | | | BB | | | | 9,591,673 | |
| | 10,768 | | | Charter Communications Operating Holdings LLC, Term Loan B2 | | | 1.920% | | | | 1-Month LIBOR | | | | 1.750% | | | | 2/01/27 | | | | BBB– | | | | 10,530,880 | |
| | 420 | | | Catalina Marketing Corporation, First Out Term Loan | | | 8.500% | | | | 1-Month LIBOR | | | | 7.500% | | | | 2/15/23 | | | | B2 | | | | 258,450 | |
| | 629 | | | Catalina Marketing Corporation, Last Out Term Loan, (cash 2.000%, PIK 9.500%) | | | 11.500% | | | | 1-Month LIBOR | | | | 1.000% | | | | 8/15/23 | | | | Caa2 | | | | 140,016 | |
| | 8,908 | | | Cineworld Group PLC, Term Loan B | | | 3.322% | | | | 6-Month LIBOR | | | | 2.250% | | | | 2/28/25 | | | | B | | | | 5,721,334 | |
| | 20 | | | Clear Channel Outdoor Holdings, Inc., Term Loan B | | | 3.714% | | | | 2-Month LIBOR | | | | 3.500% | | | | 8/21/26 | | | | B1 | | | | 17,855 | |
| | 7,910 | | | Clear Channel Outdoor Holdings, Inc., Term Loan B | | | 3.761% | | | | 3-Month LIBOR | | | | 3.500% | | | | 8/21/26 | | | | B1 | | | | 7,070,460 | |
| | 11,638 | | | CSC Holdings, LLC, Term Loan B5 | | | 2.675% | | | | 1-Month LIBOR | | | | 2.500% | | | | 4/15/27 | | | | Ba3 | | | | 11,305,009 | |
| | 7,500 | | | Gray Television, Inc., Term Loan B2 | | | 2.421% | | | | 1-Month LIBOR | | | | 2.250% | | | | 2/07/24 | | | | BB+ | | | | 7,318,725 | |
| | 4,280 | | | Gray Television, Inc., Term Loan C | | | 2.671% | | | | 1-Month LIBOR | | | | 2.500% | | | | 1/02/26 | | | | BB+ | | | | 4,184,009 | |
| | 975 | | | Houghton Mifflin Harcourt, Term Loan | | | 7.250% | | | | 1-Month LIBOR | | | | 6.250% | | | | 11/22/24 | | | | B | | | | 882,375 | |
| | 3,821 | | | iHeartCommunications Inc., Term Loan B | | | 3.161% | | | | 1-Month LIBOR | | | | 3.000% | | | | 5/01/26 | | | | B+ | | | | 3,587,118 | |
| | 1,627 | | | Intelsat Jackson Holdings, S.A., Term Loan B, (5), (WI/DD) | | | TBD | | | | TBD | | | | TBD | | | | TBD | | | | B | | | | 1,643,010 | |
| | 242 | | | McGraw-Hill Education Holdings LLC, Term Loan B | | | 5.000% | | | | 3-Month LIBOR | | | | 4.000% | | | | 5/04/22 | | | | BB+ | | | | 211,381 | |
| | 1,921 | | | Nexstar Broadcasting, Inc., Term Loan B | | | 2.921% | | | | 1-Month LIBOR | | | | 2.750% | | | | 9/19/26 | | | | BB | | | | 1,875,179 | |
| | 1,742 | | | Nexstar Broadcasting, Inc., Term Loan B3 | | | 2.421% | | | | 1-Month LIBOR | | | | 2.250% | | | | 1/17/24 | | | | BB | | | | 1,696,183 | |
| | 6,787 | | | Nexstar Broadcasting, Inc., Term Loan B3 | | | 2.416% | | | | 1-Month LIBOR | | | | 2.250% | | | | 1/17/24 | | | | BB | | | | 6,610,075 | |
| | 4,886 | | | Sinclair Television Group, Term Loan B2 | | | 2.420% | | | | 1-Month LIBOR | | | | 2.250% | | | | 1/03/24 | | | | BB+ | | | | 4,770,056 | |
| | 12,000 | | | Virgin Media Investment Holdings Limited, Term Loan N | | | 2.675% | | | | 1-Month LIBOR | | | | 2.500% | | | | 1/31/28 | | | | BB+ | | | | 11,671,860 | |
86
| | | | | | | | | | | | | | | | | | | | | | | | | | | | |
Principal
Amount (000) | | | Description (1) | | Coupon (2) | | | Reference
Rate (2) | | | Spread (2) | | | Maturity (3) | | | Ratings (4) | | | Value | |
| | |
| | | | Media (continued) | | | | |
| | | | | | | |
| $ | 8,014 | | | WideOpenWest Finance LLC, Term Loan B | | | 4.250% | | | | 1-Month LIBOR | | | | 3.250% | | | | 8/19/23 | | | | B | | | $ | 7,917,996 | |
| | 15,595 | | | Ziggo B.V., Term Loan | | | 2.675% | | | | 1-Month LIBOR | | | | 2.500% | | | | 4/30/28 | | | | BB | | | | 15,023,989 | |
| | 130,648 | | | Total Media | | | | | | | | | | | | | | | | | | | | | | | 122,663,703 | |
| | |
| | | | Multiline Retail – 1.2% (0.7% of Total Investments) | | | | |
| | | | | | | |
| | 1,187 | | | 99 Cents Only Stores, Term Loan B2, Second Lien, (cash 6.296%, PIK 1.500%) | | | 7.796% | | | | 2-Month LIBOR | | | | 5.000% | | | | 1/13/22 | | | | CCC+ | | | | 1,076,812 | |
| | 1,561 | | | 99 Cents Only Stores, Term Loan B2, Second Lien, (cash 6.296%, PIK 1.500%) | | | 7.796% | | | | 3-Month LIBOR | | | | 5.000% | | | | 1/13/22 | | | | CCC+ | | | | 1,416,424 | |
| | 1,998 | | | Belk, Inc., Term Loan, First Lien | | | 7.750% | | | | 6-Month LIBOR | | | | 6.750% | | | | 7/31/25 | | | | Caa1 | | | | 871,648 | |
| | 3,990 | | | EG America LLC, Term Loan B, (DD1) | | | 5.072% | | | | 6-Month LIBOR | | | | 4.000% | | | | 2/05/25 | | | | B2 | | | | 3,803,133 | |
| | 3,823 | | | EG America LLC, Term Loan, First Lien | | | 5.072% | | | | 6-Month LIBOR | | | | 4.000% | | | | 2/07/25 | | | | B2 | | | | 3,644,339 | |
| | 12,559 | | | Total Multiline Retail | | | | | | | | | | | | | | | | | | | | | | | 10,812,356 | |
| | |
| | | | Oil, Gas & Consumable Fuels – 2.4% (1.5% of Total Investments) | | | | |
| | | | | | | |
| | 16,958 | | | Buckeye Partners, Term Loan, First Lien | | | 2.921% | | | | 1-Month LIBOR | | | | 2.750% | | | | 11/01/26 | | | | BBB– | | | | 16,618,350 | |
| | 2,370 | | | California Resources Corporation, DIP Term Loan | | | 10.000% | | | | 1-Month LIBOR | | | | 9.000% | | | | 2/21/28 | | | | N/R | | | | 2,346,481 | |
| | 1,094 | | | California Resources Corporation, Term Loan, (5) | | | 0.000% | | | | N/A | | | | N/A | | | | 12/31/21 | | | | D | | | | 47,423 | |
| | 4,000 | | | California Resources Corporation, Term Loan B, (5) | | | 0.000% | | | | N/A | | | | N/A | | | | 12/31/22 | | | | D | | | | 1,542,860 | |
| | 4,969 | | | Fieldwood Energy LLC, Exit Term Loan, (5) | | | 7.027% | | | | 3-Month LIBOR | | | | 5.250% | | | | 4/11/22 | | | | CCC | | | | 1,233,960 | |
| | 7,034 | | | Fieldwood Energy LLC, Exit Term Loan, second Lien, (5) | | | 0.000% | | | | N/A | | | | N/A | | | | 4/11/23 | | | | C | | | | 120,921 | |
| | 36,425 | | | Total Oil, Gas & Consumable Fuels | | | | | | | | | | | | | | | | | | | | | | | 21,909,995 | |
| | |
| | | | Personal Products – 2.8% (1.8% of Total Investments) | | | | |
| | | | | | | |
| | 5,970 | | | Knowlton Development Corp Inc., Term Loan B | | | 4.058% | | | | 3-Month LIBOR | | | | 3.750% | | | | 12/21/25 | | | | B2 | | | | 5,845,348 | |
| | 6,133 | | | Coty, Inc., Term Loan A | | | 1.916% | | | | 1-Month LIBOR | | | | 1.750% | | | | 4/05/23 | | | | B | | | | 5,581,398 | |
| | 11,864 | | | Coty, Inc., Term Loan B | | | 2.416% | | | | 1-Month LIBOR | | | | 2.250% | | | | 4/05/25 | | | | B | | | | 10,292,425 | |
| | 15,056 | | | Revlon Consumer Products Corporation, Term Loan B, First Lien | | | 3.863% | | | | 3-Month LIBOR | | | | 3.500% | | | | 9/07/23 | | | | C | | | | 4,115,276 | |
| | 39,023 | | | Total Personal Products | | | | | | | | | | | | | | | | | | | | | | | 25,834,447 | |
| | |
| | | | Pharmaceuticals – 2.6% (1.7% of Total Investments) | | | | |
| | | | | | | |
| | 15,427 | | | Alphabet Holding Company, Inc., Initial Term Loan, First Lien | | | 3.661% | | | | 1-Month LIBOR | | | | 3.500% | | | | 9/28/24 | | | | B– | | | | 14,841,220 | |
| | 6,737 | | | Valeant Pharmaceuticals International, Inc., Term Loan B | | | 2.926% | | | | 1-Month LIBOR | | | | 2.750% | | | | 11/27/25 | | | | BB | | | | 6,613,356 | |
| | 3,017 | | | Valeant Pharmaceuticals International, Inc., Term Loan, First Lien | | | 3.176% | | | | 1-Month LIBOR | | | | 3.000% | | | | 6/02/25 | | | | BB | | | | 2,974,883 | |
| | 25,181 | | | Total Pharmaceuticals | | | | | | | | | | | | | | | | | | | | | | | 24,429,459 | |
| | |
| | | | Professional Services – 1.9% (1.2% of Total Investments) | | | | |
| | | | | | | |
| | 927 | | | Ceridian HCM Holding, Inc., Term Loan B | | | 2.611% | | | | 1-Week LIBOR | | | | 2.500% | | | | 4/30/25 | | | | B+ | | | | 902,570 | |
| | 2,985 | | | Creative Artists Agency, LLC, Term Loan B | | | 3.911% | | | | 1-Month LIBOR | | | | 3.750% | | | | 11/26/26 | | | | B | | | | 2,845,451 | |
| | 8,931 | | | Nielsen Finance LLC, Term Loan B4 | | | 2.183% | | | | 1-Month LIBOR | | | | 2.000% | | | | 10/04/23 | | | | BBB– | | | | 8,711,028 | |
| | 7,839 | | | Skillsoft Corporation, Initial Term Loan, First Lien, (5) | | | 0.000% | | | | N/A | | | | N/A | | | | 4/28/21 | | | | CCC+ | | | | 5,103,305 | |
| | 20,682 | | | Total Professional Services | | | | | | | | | | | | | | | | | | | | | | | 17,562,354 | |
| | |
| | | | Real Estate Management & Development – 1.3% (0.8% of Total Investments) | | | | |
| | | | | | | |
| | 169 | | | GGP, Initial Term Loan A1 | | | 3.161% | | | | 1-Month LIBOR | | | | 2.500% | | | | 8/24/21 | | | | BB+ | | | | 165,090 | |
| | 6,596 | | | GGP, Initial Term Loan A2 | | | 3.161% | | | | 1-Month LIBOR | | | | 2.500% | | | | 8/24/23 | | | | BB+ | | | | 5,886,838 | |
| | 7,120 | | | GGP, Term Loan B | | | 3.161% | | | | 1-Month LIBOR | | | | 2.500% | | | | 8/24/25 | | | | BB+ | | | | 5,877,910 | |
| | 13,885 | | | Total Real Estate Management & Development | | | | | | | | | | | | | | | | | | | | | | | 11,929,838 | |
| | |
| | | | Road & Rail – 0.5% (0.3% of Total Investments) | | | | |
| | | | | | | |
| | 4,883 | | | Avolon LLC, Term Loan B3 | | | 2.500% | | | | 1-Month LIBOR | | | | 1.750% | | | | 1/15/25 | | | | Baa2 | | | | 4,677,042 | |
| |
| | | | Semiconductors & Semiconductor Equipment – 2.8% (1.8% of Total Investments) | |
| | | | | | | |
| | 5,731 | | | Cabot Microelectronics, Term Loan B1 | | | 2.188% | | | | 1-Month LIBOR | | | | 2.000% | | | | 11/15/25 | | | | BB+ | | | | 5,702,483 | |
| | 14,871 | | | Lumileds, Term Loan B | | | 4.572% | | | | 6-Month LIBOR | | | | 3.500% | | | | 6/30/24 | | | | CCC+ | | | | 5,922,784 | |
| | 8,818 | | | Microchip Technology, Inc., Term Loan B | | | 2.170% | | | | 1-Month LIBOR | | | | 2.000% | | | | 5/29/25 | | | | Baa3 | | | | 8,784,690 | |
| | 6,254 | | | ON Semiconductor Corporation, New Replacement Term Loan B4 | | | 2.166% | | | | 1-Month LIBOR | | | | 2.000% | | | | 9/19/26 | | | | BB | | | | 6,165,022 | |
| | 35,674 | | | Total Semiconductors & Semiconductor Equipment | | | | | | | | | | | | | | | | | | | | 26,574,979 | |
87
| | |
| |
| JQC | | Nuveen Credit Strategies Income Fund (continued) |
| | Portfolio of Investments July 31, 2020 |
| | | | | | | | | | | | | | | | | | | | | | | | | | | | |
Principal
Amount (000) | | | Description (1) | | Coupon (2) | | | Reference
Rate (2) | | | Spread (2) | | | Maturity (3) | | | Ratings (4) | | | Value | |
| | |
| | | | Software – 8.9% (5.7% of Total Investments) | | | | |
| | | | | | | |
| $ | 9,925 | | | Blackboard, Inc., Term Loan B5, First Lien | | | 7.000% | | | | 3-Month LIBOR | | | | 6.000% | | | | 6/30/24 | | | | B | | | $ | 9,422,547 | |
| | 17,165 | | | Ellucian, Term Loan B, First Lien | | | 4.250% | | | | 3-Month LIBOR | | | | 3.250% | | | | 9/30/22 | | | | B | | | | 17,082,962 | |
| | 33 | | | Press Ganey Holdings, Inc., Term Loan, First Lien | | | 3.661% | | | | 1-Month LIBOR | | | | 3.500% | | | | 7/26/26 | | | | B | | | | 32,026 | |
| | 12,870 | | | Press Ganey Holdings, Inc., Term Loan, First Lien | | | 3.761% | | | | 3-Month LIBOR | | | | 3.500% | | | | 7/26/26 | | | | B | | | | 12,682,355 | |
| | 2,160 | | | Greeneden U.S. Holdings II LLC, Term Loan B | | | 3.411% | | | | 1-Month LIBOR | | | | 3.250% | | | | 12/01/23 | | | | B2 | | | | 2,132,482 | |
| | 6,173 | | | Informatica LLC, Term Loan, First Lien | | | 3.411% | | | | 1-Month LIBOR | | | | 3.250% | | | | 2/14/27 | | | | B1 | | | | 6,044,467 | |
| | 3,056 | | | Micro Focus International PLC, Term Loan B4 | | | 5.250% | | | | 3-Month LIBOR | | | | 4.250% | | | | 6/05/25 | | | | BB | | | | 3,031,019 | |
| | 454 | | | SkillSoft Corporation, DIP Term Loan, (5) | | | 8.500% | | | | 1-Month LIBOR | | | | 7.500% | | | | 6/15/21 | | | | N/R | | | | 451,236 | |
| | 4,928 | | | SS&C Technologies, Inc./ Sunshine Acquisition II, Inc., New Term Loan B3 | | | 1.911% | | | | 1-Month LIBOR | | | | 1.750% | | | | 4/16/25 | | | | BB+ | | | | 4,791,312 | |
| | 3,462 | | | SS&C Technologies, Inc./ Sunshine Acquisition II, Inc., New Term Loan B4 | | | 1.911% | | | | 1-Month LIBOR | | | | 1.750% | | | | 4/16/25 | | | | BB+ | | | | 3,366,230 | |
| | 2,452 | | | Ultimate Software, Incremental Term Loan, Second Lien | | | 7.500% | | | | 3-Month LIBOR | | | | 6.750% | | | | 5/03/27 | | | | Caa1 | | | | 2,503,483 | |
| | 6,828 | | | Ultimate Software, Incremental Term Loan B, (DD1) | | | 4.750% | | | | 3-Month LIBOR | | | | 4.000% | | | | 5/03/26 | | | | B1 | | | | 6,842,823 | |
| | 14,888 | | | Ultimate Software, Term Loan, First Lien | | | 3.911% | | | | 1-Month LIBOR | | | | 3.750% | | | | 5/03/26 | | | | B1 | | | | 14,771,229 | |
| | 84,394 | | | Total Software | | | | | | | | | | | | | | | | | | | | | | | 83,154,171 | |
| | |
| | | | Specialty Retail – 2.5% (1.6% of Total Investments) | | | | |
| | | | | | | |
| | 5,069 | | | Academy, Ltd., Term Loan B, (DD1) | | | 5.000% | | | | 1-Month LIBOR | | | | 4.000% | | | | 7/01/22 | | | | CCC+ | | | | 4,542,761 | |
| | 2,430 | | | Camping World, Term Loan, (DD1) | | | 3.500% | | | | 1-Month LIBOR | | | | 2.750% | | | | 11/08/23 | | | | B | | | | 2,303,761 | |
| | 777 | | | Petco Animal Supplies, Inc., Term Loan B1 | | | 4.250% | | | | 3-Month LIBOR | | | | 3.250% | | | | 1/26/23 | | | | B3 | | | | 653,946 | |
| | 15,757 | | | Petsmart Inc., Term Loan B, First Lien, (DD1) | | | 5.000% | | | | 3-Month LIBOR | | | | 4.000% | | | | 3/11/22 | | | | B | | | | 15,717,989 | |
| | 24,033 | | | Total Specialty Retail | | | | | | | | | | | | | | | | | | | | | | | 23,218,457 | |
| | |
| | | | Technology Hardware, Storage & Peripherals – 2.0% (1.2% of Total Investments) | | | | |
| | | | | | | |
| | 14,125 | | | Dell International LLC, Refinancing Term Loan B1 | | | 2.750% | | | | 1-Month LIBOR | | | | 2.000% | | | | 9/19/25 | | | | Baa3 | | | | 13,955,575 | |
| | 4,527 | | | Western Digital, Term Loan B | | | 1.911% | | | | 1-Month LIBOR | | | | 1.750% | | | | 4/29/23 | | | | BBB– | | | | 4,461,597 | |
| | 18,652 | | | Total Technology Hardware, Storage & Peripherals | | | | | | | | | | | | | | | | | | | | 18,417,172 | |
| | |
| | | | Trading Companies & Distributors – 3.0% (1.9% of Total Investments) | | | | |
| | | | | | | |
| | 17,873 | | | Hayward Industries, Inc., Initial Term Loan, First Lien | | | 3.661% | | | | 1-Month LIBOR | | | | 3.500% | | | | 8/04/24 | | | | B | | | | 17,460,052 | |
| | 10,698 | | | HD Supply Waterworks, Ltd., Term Loan B | | | 3.750% | | | | 6-Month LIBOR | | | | 2.750% | | | | 8/01/24 | | | | B | | | | 10,463,546 | |
| | 28,571 | | | Total Trading Companies & Distributors | | | | | | | | | | | | | | | | | | | | | | | 27,923,598 | |
| | |
| | | | Wireless Telecommunication Services – 1.9% (1.2% of Total Investments) | | | | |
| | | | | | | |
| | 17,400 | | | T-Mobile USA, Term Loan, First Lien | | | 3.161% | | | | 1-Month LIBOR | | | | 3.000% | | | | 4/01/27 | | | | BBB– | | | | 17,483,694 | |
| $ | 1,262,680 | | | Total Variable Rate Senior Loan Interests (cost $1,243,509,091) | | | | | | | | | | | | | | | | | | | | 1,157,911,450 | |
| | | | | | | |
Principal
Amount (000) | | | Description (1) | | | | | | | | Coupon | | | Maturity | | | Ratings (4) | | | Value | |
| | |
| | | | CORPORATE BONDS – 28.8% (18.3% of Total Investments) | | | | |
| | |
| | | | Aerospace & Defense – 0.6% (0.4% of Total Investments) | | | | |
| | | | | | | |
| $ | 6,000 | | | Bombardier Inc, 144A, (6) | | | | | | | | | | | 6.000% | | | | 10/15/22 | | | | B | | | $ | 5,565,000 | |
| | |
| | | | Airlines – 1.9% (1.2% of Total Investments) | | | | |
| | | | | | | |
| | 13,000 | | | Delta Air Lines Inc | | | | | | | | | | | 3.400% | | | | 4/19/21 | | | | Baa3 | | | | 12,956,107 | |
| | 5,000 | | | Mileage Plus Holdings LLC / Mileage Plus Intellectual Property Assets Ltd, 144A, (6) | | | | 6.500% | | | | 6/20/27 | | | | Baa3 | | | | 5,175,000 | |
| | 18,000 | | | Total Airlines | | | | | | | | | | | | | | | | | | | | | | | 18,131,107 | |
| |
| | | | Auto Components – 0.3% (0.2% of Total Investments) | |
| | | | | | | |
| | 3,000 | | | Clarios Global LP / Clarios US Finance Co, 144A | | | | | | | | | | | 6.250% | | | | 5/15/26 | | | | B1 | | | | 3,210,360 | |
| |
| | | | Automobiles – 0.9% (0.5% of Total Investments) | |
| | | | | | | |
| | 4,000 | | | Ford Motor Credit Co LLC, (6) | | | | | | | | | | | 3.470% | | | | 4/05/21 | | | | BB+ | | | | 4,000,000 | |
| | 4,000 | | | Ford Motor Credit Co LLC, (6) | | | | | | | | | | | 3.813% | | | | 10/12/21 | | | | BB+ | | | | 4,040,960 | |
| | 8,000 | | | Total Automobiles | | | | | | | | | | | | | | | | | | | | | | | 8,040,960 | |
| |
| | | | Capital Markets – 0.1% (0.1% of Total Investments) | |
| | | | | | | |
| | 1,000 | | | LPL Holdings Inc, 144A, (6) | | | | | | | | | | | 4.625% | | | | 11/15/27 | | | | BB | | | | 1,030,000 | |
88
| | | | | | | | | | | | | | | | | | | | | | | | |
Principal
Amount (000) | | | Description (1) | | | | | | Coupon | | | Maturity | | | Ratings (4) | | | Value | |
| |
| | | | Communications Equipment – 0.8% (0.5% of Total Investments) | |
| | | | | | | |
| $ | 4,000 | | | CommScope Inc, 144A, (6) | | | | | | | 5.500% | | | | 3/01/24 | | | | Ba3 | | | $ | 4,154,080 | |
| | 5,675 | | | Intelsat Jackson Holdings SA, (5), (6) | | | | | | | 5.500% | | | | 8/01/23 | | | | N/R | | | | 3,553,969 | |
| | 9,675 | | | Total Communications Equipment | | | | | | | | | | | | | | | | | | | 7,708,049 | |
| |
| | | | Consumer Finance – 1.1% (0.7% of Total Investments) | |
| | | | | | | |
| | 5,000 | | | DAE Funding LLC, 144A, (6) | | | | | | | 4.500% | | | | 8/01/22 | | | | Baa3 | | | | 4,910,800 | |
| | 5,000 | | | Verscend Escrow Corp, 144A, (6) | | | | | | | 9.750% | | | | 8/15/26 | | | | CCC+ | | | | 5,536,450 | |
| | 10,000 | | | Total Consumer Finance | | | | | | | | | | | | | | | | | | | 10,447,250 | |
| |
| | | | Diversified Consumer Services – 0.7% (0.4% of Total Investments) | |
| | | | | | | |
| | 6,000 | | | Kronos Acquisition Holdings Inc, 144A | | | | | | | 9.000% | | | | 8/15/23 | | | | CCC | | | | 6,105,000 | |
| |
| | | | Diversified Financial Services – 2.6% (1.6% of Total Investments) | |
| | | | | | |
| | 2,000 | | | AerCap Ireland Capital DAC / AerCap Global Aviation Trust | | | | | 4.500% | | | | 5/15/21 | | | | BBB | | | | 2,040,091 | |
| | 22,000 | | | PetSmart Inc, 144A, (6) | | | | | | | 7.125% | | | | 3/15/23 | | | | CCC+ | | | | 22,220,000 | |
| | 24,000 | | | Total Diversified Financial Services | | | | | | | | | | | | | | | | | | | 24,260,091 | |
| |
| | | | Diversified Telecommunication Services – 0.9% (0.6% of Total Investments) | |
| | | | | | | |
| | 1,000 | | | CenturyLink Inc, (6) | | | | | | | 6.450% | | | | 6/15/21 | | | | BB | | | | 1,036,250 | |
| | 5,000 | | | CenturyLink Inc, (6) | | | | | | | 5.800% | | | | 3/15/22 | | | | BB | | | | 5,262,500 | |
| | 2,000 | | | Frontier Communications Corp, 144A, (5), (6) | | | | | | | 8.000% | | | | 4/01/27 | | | | N/R | | | | 2,070,000 | |
| | 8,000 | | | Total Diversified Telecommunication Services | | | | | | | | | | | | | | | | | | | 8,368,750 | |
| |
| | | | Electric Utilities – 1.3% (0.8% of Total Investments) | |
| | | | | | |
| | 3,750 | | | Bruce Mansfield Unit 1 2007 Pass-Through Trust, (5) | | | | | 6.850% | | | | 6/01/34 | | | | N/R | | | | 4,688 | |
| | 265 | | | Pacific Gas and Electric Co | | | | | | | 3.450% | | | | 7/01/25 | | | | BBB– | | | | 282,733 | |
| | 2,484 | | | Pacific Gas and Electric Co | | | | | | | 3.150% | | | | 1/01/26 | | | | BBB– | | | | 2,607,723 | |
| | 265 | | | Pacific Gas and Electric Co | | | | | | | 3.750% | | | | 7/01/28 | | | | BBB– | | | | 289,399 | |
| | 8,000 | | | Pacific Gas and Electric Co | | | | | | | 4.250% | | | | 3/15/46 | | | | BBB– | | | | 8,729,077 | |
| | 14,764 | | | Total Electric Utilities | | | | | | | | | | | | | | | | | | | 11,913,620 | |
| |
| | | | Equity Real Estate Investment Trust – 0.1% (0.1% of Total Investments) | |
| | | | | |
| | 1,000 | | | Uniti Group LP / Uniti Fiber Holdings Inc / CSL Capital LLC, 144A | | | 7.875% | | | | 2/15/25 | | | | B | | | | 1,052,500 | |
| |
| | | | Food & Staples Retailing – 0.7% (0.4% of Total Investments) | |
| | | | | |
| | 4,000 | | | Albertsons Cos Inc / Safeway Inc / New Albertsons LP / Albertsons LLC, 144A, (6) | | | 4.625% | | | | 1/15/27 | | | | BB– | | | | 4,230,000 | |
| | 2,000 | | | JBS Investments II GmbH, 144A, (6) | | | | | | | 5.750% | | | | 1/15/28 | | | | BB+ | | | | 2,123,600 | |
| | 6,000 | | | Total Food & Staples Retailing | | | | | | | | | | | | | | | | | | | 6,353,600 | |
| |
| | | | Food Products – 0.3% (0.2% of Total Investments) | |
| | | | | | |
| | 2,000 | | | H-Food Holdings LLC / Hearthside Finance Co Inc, 144A | | | | | 8.500% | | | | 6/01/26 | | | | CCC | | | | 1,900,000 | |
| | 955 | | | JBS Investments GmbH, 144A, (6) | | | | | | | 6.250% | | | | 2/05/23 | | | | BB+ | | | | 965,027 | |
| | 2,955 | | | Total Food Products | | | | | | | | | | | | | | | | | | | 2,865,027 | |
| |
| | | | Health Care Equipment & Supplies – 0.4% (0.3% of Total Investments) | |
| | | | | | | |
| | 4,069 | | | AMN Healthcare Inc, 144A, (6) | | | | | | | 5.125% | | | | 10/01/24 | | | | BB– | | | | 4,130,035 | |
| |
| | | | Health Care Providers & Services – 3.4% (2.2% of Total Investments) | |
| | | | | | | |
| | 3,000 | | | CHS/Community Health Systems Inc, 144A | | | | | | | 9.875% | | | | 6/30/23 | | | | CCC- | | | | 2,370,000 | |
| | 2,500 | | | Molina Healthcare Inc, (6) | | | | | | | 5.375% | | | | 11/15/22 | | | | BB– | | | | 2,625,000 | |
| | 4,850 | | | RegionalCare Hospital Partners Holdings Inc / LifePoint Health Inc, 144A, (6) | | | 9.750% | | | | 12/01/26 | | | | CCC+ | | | | 5,384,470 | |
| | 10,000 | | | Tenet Healthcare Corp, (6) | | | | | | | 8.125% | | | | 4/01/22 | | | | B– | | | | 10,775,000 | |
| | 3,500 | | | Tenet Healthcare Corp | | | | | | | 5.125% | | | | 5/01/25 | | | | B1 | | | | 3,600,520 | |
| | 6,805 | | | Vizient Inc, 144A, (6) | | | | | | | 6.250% | | | | 5/15/27 | | | | B | | | | 7,247,325 | |
| | 30,655 | | | Total Health Care Providers & Services | | | | | | | | | | | | | | | | | | | 32,002,315 | |
| |
| | | | Health Care Technology – 0.2% (0.1% of Total Investments) | |
| | | | | |
| | 1,840 | | | Change Healthcare Holdings LLC / Change Healthcare Finance Inc, 144A | | | 5.750% | | | | 3/01/25 | | | | B– | | | | 1,881,400 | |
| |
| | | | Hotels, Restaurants & Leisure – 3.9% (2.5% of Total Investments) | |
| | | | | | | |
| | 2,000 | | | 1011778 BC ULC / New Red Finance Inc, 144A | | | | | | | 5.000% | | | | 10/15/25 | | | | B+ | | | | 2,053,220 | |
| | 10,000 | | | Carnival Corp | | | | | | | 3.950% | | | | 10/15/20 | | | | BB+ | | | | 9,900,000 | |
| | 3,000 | | | Carnival Corp, 144A | | | | | | | 11.500% | | | | 4/01/23 | | | | Baa3 | | | | 3,264,510 | |
| | 4,000 | | | ESH Hospitality Inc, 144A, (6) | | | | | | | 4.625% | | | | 10/01/27 | | | | BB– | | | | 3,849,200 | |
| | 1,437 | | | International Game Technology PLC, 144A | | | | | | | 6.250% | | | | 2/15/22 | | | | BB | | | | 1,501,823 | |
89
| | |
| |
| JQC | | Nuveen Credit Strategies Income Fund (continued) |
| | Portfolio of Investments July 31, 2020 |
| | | | | | | | | | | | | | | | | | | | | | | | | | | | |
Principal
Amount (000) | | | Description (1) | | | | | | | | Coupon | | | Maturity | | | Ratings (4) | | | Value | |
| |
| | | | Hotels, Restaurants & Leisure (continued) | |
| | | | | | | |
| $ | 5,285 | | | IRB Holding Corp, 144A | | | | | | | | | | | 6.750% | | | | 2/15/26 | | | | CCC+ | | | $ | 5,311,425 | |
| | 10,870 | | | Royal Caribbean Cruises Ltd | | | | | | | | | | | 2.650% | | | | 11/28/20 | | | | BB | | | | 10,734,125 | |
| | 36,592 | | | Total Hotels, Restaurants & Leisure | | | | | | | | | | | | | | | | | | | | | | | 36,614,303 | |
| | | | | | | |
| | | | IT Services – 0.7% (0.4% of Total Investments) | | | | | | | | | | | | | | | | | | |
| | | | | | | |
| | 6,428 | | | WEX Inc, 144A, (6) | | | | | | | | | | | 4.750% | | | | 2/01/23 | | | | Ba2 | | | | 6,444,070 | |
| | | | | | | |
| | | | Machinery – 0.7% (0.4% of Total Investments) | | | | | | | | | | | | | | | | | | |
| | | | | | |
| | 6,000 | | | Apex Tool Group LLC / BC Mountain Finance Inc, 144A, (6) | | | | | | | | 9.000% | | | | 2/15/23 | | | | CCC | | | | 4,800,000 | |
| | 1,576 | | | Navistar International Corp, 144A | | | | | | | | | | | 6.625% | | | | 11/01/25 | | | | B3 | | | | 1,615,400 | |
| | 7,576 | | | Total Machinery | | | | | | | | | | | | | | | | | | | | | | | 6,415,400 | |
| | | | | | | |
| | | | Media – 1.5% (1.0% of Total Investments) | | | | | | | | | | | | | | | | | | |
| | | | | | | |
| | 3,403 | | | Clear Channel Worldwide Holdings Inc | | | | | | | | | | | 9.250% | | | | 2/15/24 | | | | CCC | | | | 3,088,461 | |
| | 3,000 | | | Clear Channel Worldwide Holdings Inc, 144A, (6) | | | | | | | | | | | 5.125% | | | | 8/15/27 | | | | B1 | | | | 2,940,000 | |
| | 4,000 | | | Houghton Mifflin Harcourt Publishers Inc, 144A, (6) | | | | | | | | | | | 9.000% | | | | 2/15/25 | | | | BB– | | | | 3,860,000 | |
| | 1,360 | | | Nielsen Co Luxembourg SARL, 144A, (6) | | | | | | | | | | | 5.500% | | | | 10/01/21 | | | | BB– | | | | 1,365,100 | |
| | 3,000 | | | Nielsen Finance LLC / Nielsen Finance Co, 144A, (6) | | | | | | | | 5.000% | | | | 4/15/22 | | | | BB– | | | | 3,013,200 | |
| | 14,763 | | | Total Media | | | | | | | | | | | | | | | | | | | | | | | 14,266,761 | |
| |
| | | | Mortgage Real Estate Investment Trust – 0.8% (0.5% of Total Investments) | |
| | | | | |
| | 7,000 | | | Ladder Capital Finance Holdings LLLP / Ladder Capital Finance Corp, 144A | | | | 5.875% | | | | 8/01/21 | | | | BB+ | | | | 6,965,000 | |
| |
| | | | Multiline Retail – 1.2% (0.8% of Total Investments) | |
| | | | | | | |
| | 11,625 | | | Macy’s Retail Holdings LLC | | | | | | | | | | | 3.450% | | | | 1/15/21 | | | | BB | | | | 11,450,625 | |
| |
| | | | Oil, Gas & Consumable Fuels – 0.2% (0.1% of Total Investments) | |
| | | | | | | |
| | 2,000 | | | CITGO Petroleum Corp, 144A | | | | | | | | | | | 7.000% | | | | 6/15/25 | | | | BB | | | | 2,055,000 | |
| |
| | | | Pharmaceuticals – 0.2% (0.1% of Total Investments) | |
| | | | | | |
| | 724 | | | Endo Dac / Endo Finance LLC / Endo Finco Inc, 144A | | | | | | | | 9.500% | | | | 7/31/27 | | | | CCC+ | | | | 780,110 | |
| | 913 | | | Endo Dac / Endo Finance LLC / Endo Finco Inc, 144A | | | | | | | | 6.000% | | | | 6/30/28 | | | | CCC+ | | | | 696,163 | |
| | 362 | | | Par Pharmaceutical Inc, 144A | | | | | | | | | | | 7.500% | | | | 4/01/27 | | | | B+ | | | | 385,034 | |
| | 1,999 | | | Total Pharmaceuticals | | | | | | | | | | | | | | | | | | | | | | | 1,861,307 | |
| |
| | | | Road & Rail – 0.5% (0.4% of Total Investments) | |
| | | | | | | |
| | 5,000 | | | DAE Funding LLC, 144A, (6) | | | | | | | | | | | 5.250% | | | | 11/15/21 | | | | Baa3 | | | | 5,000,000 | |
| |
| | | | Software – 0.2% (0.1% of Total Investments) | |
| | | | | | | |
| | 1,500 | | | SS&C Technologies Inc, 144A | | | | | | | | | | | 5.500% | | | | 9/30/27 | | | | B+ | | | | 1,612,500 | |
| |
| | | | Specialty Retail – 0.4% (0.3% of Total Investments) | |
| | | | | | | |
| | 1,000 | | | L Brands Inc | | | | | | | | | | | 6.625% | | | | 4/01/21 | | | | B+ | | | | 1,035,000 | |
| | 2,000 | | | L Brands Inc | | | | | | | | | | | 5.625% | | | | 2/15/22 | | | | B+ | | | | 2,037,000 | |
| | 545 | | | Staples Inc, 144A | | | | | | | | | | | 7.500% | | | | 4/15/26 | | | | B1 | | | | 478,128 | |
| | 3,545 | | | Total Specialty Retail | | | | | | | | | | | | | | | | | | | | | | | 3,550,128 | |
| |
| | | | Trading Companies & Distributors – 1.3% (0.8% of Total Investments) | |
| | | | | | | |
| | 3,000 | | | Air Lease Corp, (6) | | | | | | | | | | | 2.300% | | | | 2/01/25 | | | | BBB | | | | 2,876,789 | |
| | 6,000 | | | Air Lease Corp, (6) | | | | | | | | | | | 3.000% | | | | 2/01/30 | | | | BBB | | | | 5,660,663 | |
| | 3,000 | | | Aircastle Ltd | | | | | | | | | | | 5.125% | | | | 3/15/21 | | | | BBB | | | | 3,039,007 | |
| | 12,000 | | | Total Trading Companies & Distributors | | | | | | | | | | | | | | | | | | | | | | | 11,576,459 | |
| |
| | | | Wireless Telecommunication Services – 0.9% (0.6% of Total Investments) | |
| | | | | | | |
| | 4,000 | | | Hughes Satellite Systems Corp, (6) | | | | | | | | | | | 5.250% | | | | 8/01/26 | | | | BBB– | | | | 4,391,520 | |
| | 6,000 | | | Intelsat Jackson Holdings SA, 144A, (5), (6) | | | | | | | | | | | 8.500% | | | | 10/15/24 | | | | N/R | | | | 3,960,000 | |
| | 10,000 | | | Total Wireless Telecommunication Services | | | | | | | | | | | | | | | | | | | | | | | 8,351,520 | |
| $ | 274,986 | | | Total Corporate Bonds (cost $265,258,411) | | | | | | | | | | | | | | | | | | | | | | | 269,228,137 | |
| | | | | | | |
| Shares | | | Description (1) | | | | | | | | | | | | | | | | | Value | |
| |
| | | | COMMON STOCKS – 0.6% (0.3% of Total Investments) | |
| |
| | | | Diversified Consumer Services – 0.0% (0.0% of Total Investments) | |
| | | | | | | |
| | 41,905 | | | Cengage Learning Holdings II Inc, (7), (8) | | | | | | | | | | | | | | | | | | | | | | $ | 97,764 | |
90
| | | | | | | | | | | | | | | | | | | | | | | | | | | | |
| Shares | | | Description (1) | | | | | | | | | | | | | | | | | Value | |
| |
| | | | Electric Utilities – 0.2% (0.1% of Total Investments) | |
| | | | | | | |
| | 80,962 | | | Energy Harbor Corp, (7), (8), (10) | | | | | | | | | | | | | | | | | | | | | | $ | 1,817,597 | |
| |
| | | | Energy Equipment & Services – 0.0% (0.0% of Total Investments) | |
| | | | | | | |
| | 31,358 | | | Vantage Drilling International, (7), (8) | | | | | | | | | | | | | | | | | | | | | | | 185,545 | |
| |
| | | | Health Care Providers & Services – 0.1% (0.0% of Total Investments) | |
| | | | | | | |
| | 211,860 | | | Millennium Health LLC, (8), (9) | | | | | | | | | | | | | | | | | | | | | | | 235,165 | |
| | 198,883 | | | Millennium Health LLC, (8), (9) | | | | | | | | | | | | | | | | | | | | | | | 200,872 | |
| | | | Total Health Care Providers & Services | | | | | | | | | | | | | | | | | | | | | | | 436,037 | |
| |
| | | | Internet & Direct Marketing Retail – 0.0% (0.0% of Total Investments) | |
| | | | | | | |
| | 9,796 | | | Catalina Marketing Corp, (7), (8) | | | | | | | | | | | | | | | | | | | | | | | 4,898 | |
| |
| | | | Media – 0.3% (0.2% of Total Investments) | |
| | | | | | | |
| | 338,831 | | | Clear Channel Outdoor Holdings Inc, (8) | | | | | | | | | | | | | | | | | | | | | | | 310,539 | |
| | 75,566 | | | Cumulus Media Inc, (8) | | | | | | | | | | | | | | | | | | | | | | | 296,974 | |
| | 271,046 | | | iHeartMedia Inc, (8) | | | | | | | | | | | | | | | | | | | | | | | 2,265,945 | |
| | 17,987 | | | Tribune Co, (9) | | | | | | | | | | | | | | | | | | | | | | | 18 | |
| | | | Total Media | | | | | | | | | | | | | | | | | | | | | | | 2,873,476 | |
| |
| | | | Pharmaceuticals – 0.0% (0.0% of Total Investments) | |
| | | | | | | |
| | 74,067 | | | Advanz Pharma Corp Ltd, (8) | | | | | | | | | | | | | | | | | | | | | | | 244,421 | |
| | | | Total Common Stocks (cost $21,173,497) | | | | | | | | | | | | | | | | | | | | | | | 5,659,738 | |
| | | | | | | |
Principal
Amount (000) | | | Description (1) | | | | | | | | Coupon | | | Maturity | | | Ratings (4) | | | Value | |
| |
| | | | CONVERTIBLE BONDS – 0.5% (0.3% of Total Investments) | |
| |
| | | | Biotechnology – 0.3% (0.2% of Total Investments) | |
| | | | | | | |
| $ | 4,123 | | | Acorda Therapeutics Inc, 144A | | | | | | | | | | | 6.000% | | | | 12/01/24 | | | | N/R | | | $ | 2,214,366 | |
| | | | | | | |
| | | | Media–0.2% (0.1% of Total Investments) | | | | | | | | | | | | | | | | | | |
| | | | | | | |
| | 2,000 | | | DISH Network Corp | | | | | | | | | | | 3.375% | | | | 8/15/26 | | | | B1 | | | | 1,841,260 | |
| $ | 6,123 | | | Total Convertible Bonds (cost $5,892,777) | | | | | | | | | | | | | | | | | | | | | | | 4,055,626 | |
| | | | | | | |
| Shares | | | Description (1) | | | | | | | | | | | | | | | | | Value | |
| | | | | | | |
| | | | WARRANTS – 0.0% (0.0% of Total Investments) | | | | | | | | | | | | | | | | | | | | | | | | |
| | | | | |
| | | | Communications Equipment – 0.0% (0.0% of Total Investments) | | | | | | | | | | | | | |
| | | | | | | |
| | 37,723 | | | Avaya Holdings Corp, (7) | | | | | | | | | | | | | | | | | | | | | | $ | 22,634 | |
| | | | | | | |
| | | | Media–0.0% (0.0% of Total Investments) | | | | | | | | | | | | | | | | | | |
| | | | | | | |
| | 4,644 | | | Cxloyalty Group Holdings Inc, (9) | | | | | | | | | | | | | | | | | | | | | | | 5 | |
| | | | Total Warrants (cost $6,008,900) | | | | | | | | | | | | | | | | | | | | | | | 22,639 | |
| | | | | | | |
| Shares | | | Description (1) | | | | | | | | | | | | | | | | | Value | |
| | | | | |
| | | | COMMON STOCK RIGHTS – 0.0% (0.0% of Total Investments) | | | | | | | | | | | | | | | | | |
| | | | | |
| | | | Oil, Gas & Consumable Fuels – 0.0% (0.0% of Total Investments) | | | | | | | | | | | | | |
| | | | | | | |
| | 45,924 | | | Fieldwood Energy Inc, (7), (8) | | | | | | | | | | | | | | | | | | | | | | $ | 2,296 | |
| | 9,278 | | | Fieldwood Energy Inc, (7), (8) | | | | | | | | | | | | | | | | | | | | | | | 464 | |
| | | | Total Common Stock Rights (cost $1,310,866) | | | | | | | | | | | | | | | | 2,760 | |
| | | | Total Long-Term Investments (cost $1,543,153,542) | | | | | | | | | | | | | | | | 1,436,880,350 | |
91
| | |
| |
| JQC | | Nuveen Credit Strategies Income Fund (continued) |
| | Portfolio of Investments July 31, 2020 |
| | | | | | | | | | | | | | | | | | | | | | | | |
| Shares | | | Description (1) | | | | | | Coupon | | | | | | | | | Value | |
| | | | | |
| | | | SHORT-TERM INVESTMENTS – 3.9% (2.5% of Total Investments) | | | | | | | | | | | | | | | | |
| | | | | |
| | | | INVESTMENT COMPANIES – 3.9% (2.5% of Total Investments) | | | | | | | | | | | | |
| | | | | | | |
| | 36,609,636 | | | BlackRock Liquidity Funds T-Fund Portfolio, (11) | | | | | | | 0.065% (12) | | | | | | | | | | | $ | 36,609,636 | |
| | | | Total Short-Term Investments (cost $36,609,636) | | | | 36,609,636 | |
| | | | Total Investments (cost $1,579,763,178) – 157.9% | | | | 1,473,489,986 | |
| | | | Borrowings – (43.1)% (13), (14) | | | | (402,000,000 | ) |
| | | | Reverse Repurchase Agreements – (12.5)% (15) | | | | (117,000,000 | ) |
| | | | Other Assets Less Liabilities – (2.3)% | | | | (21,690,059 | ) |
| | | | Net Assets Applicable to Common Shares – 100% | | | $ | 932,799,927 | |
92
For Fund portfolio compliance purposes, the Fund’s industry classifications refer to any one or more of the industry sub-classifications used by one or more widely recognized market indexes or ratings group indexes, and/or as defined by Fund management. This definition may not apply for purposes of this report, which may combine industry sub-classifications into sectors for reporting ease.
| (1) | All percentages shown in the Portfolio of Investments are based on net assets applicable to common shares unless otherwise noted. |
| (2) | Senior loans generally pay interest at rates which are periodically adjusted by reference to a base short-term, floating lending rate (Reference Rate) plus an assigned fixed rate (Spread). These floating lending rates are generally (i) the lending rate referenced by the London Inter-Bank Offered Rate (“LIBOR”), or (ii) the prime rate offered by one or more major United States banks. Senior loans may be considered restricted in that the Fund ordinarily is contractually obligated to receive approval from the agent bank and/or borrower prior to the disposition of a senior loan. The rate shown is the coupon as of the end of the reporting period. |
| (3) | Senior loans generally are subject to mandatory and/or optional prepayment. Because of these mandatory prepayment conditions and because there may be significant economic incentives for a borrower to prepay, prepayments of senior loans may occur. As a result, the actual remaining maturity of senior loans held may be substantially less than the stated maturities shown. |
| (4) | For financial reporting purposes, the ratings disclosed are the highest of Standard & Poor’s Group (“Standard & Poor’s”), Moody’s Investors Service, Inc. (“Moody’s”) or Fitch, Inc. (“Fitch”) rating. This treatment of split-rated securities may differ from that used for other purposes, such as for Fund investment policies. Ratings below BBB by Standard & Poor’s, Baa by Moody’s or BBB by Fitch are considered to be below investment grade. Holdings designated N/R are not rated by any of these national rating agencies. Ratings are not covered by the report of independent registered public accounting firm. |
| (5) | Defaulted security. A security whose issuer has failed to fully pay principal and/or interest when due, or is under the protection of bankruptcy. |
| (6) | Investment, or portion of investment, has been pledged to collateralize the net payment obligations for investments in reverse repurchase agreements. As of the end of the reporting period, investments with a value of $141,235,263 have been pledged as collateral for reverse repurchase agreements. |
| (7) | For fair value measurement disclosure purposes, investment classified as Level 2. See Notes to Financial Statements, Note 3 – Investment Valuation and Fair Value Measurements for more information. |
| (8) | Non-income producing; issuer has not declared a dividend within the past twelve months. |
| (9) | Investment valued at fair value using methods determined in good faith by, or at the discretion of, the Board. For fair value measurement disclosure purposes, investment classified as Level 3. See Notes to Financial Statements, Note 3 – Investment Valuation and Fair Value Measurements for more information. |
| (10) | Common Stock received as part of the bankruptcy settlements for Bruce Mansfield Unit 1 2007 Pass-Through Trust. |
| (11) | A copy of the most recent financial statements for these investment companies can be obtained directly from the Securities and Exchange Commission on its website at http://www.sec.gov. |
| (12) | The rate shown is the annualized seven-day subsidized yield as of the end of the reporting period. |
| (13) | Borrowings as a percentage of Total Investments is 27.3%. |
| (14) | The Fund segregates 100% of its eligible investments (excluding any investments separately pledged as collateral for specific investments in derivatives, when applicable) in the Portfolio of Investments as collateral for borrowings. |
| (15) | Reverse Repurchase Agreements as a percentage of Total Investments is 7.9%. |
| 144A | Investment is exempt from registration under Rule 144A of the Securities Act of 1933, as amended. These investments may only be resold in transactions exempt from registration, which are normally those transactions with qualified institutional buyers. |
| DD1 | Portion of investment purchased on a delayed delivery basis. |
| LIBOR | London Inter-Bank Offered Rate |
| PIK | Payment-in-kind (“PIK”) security. Depending on the terms of the security, income may be received in the form of cash, securities, or a combination of both. The PIK rate shown, where applicable, represents the annualized rate of the last PIK payment made by the issuer as of the end of the reporting period. |
| TBD | Senior loan purchased on a when-issued or delayed-delivery basis. Certain details associated with this purchase are not known prior to the settlement date of the transaction. In addition, senior loans typically trade without accrued interest and therefore a coupon rate is not available prior to settlement. At settlement, if still unknown, the borrower or counterparty will provide the Fund with the final coupon rate and maturity date. |
| WI/DD | Purchased on a when-issued or delayed delivery basis. |
See accompanying notes to financial statements.
93
Statement of Assets and Liabilities
July 31, 2020
| | | | | | | | | | | | | | | | | | | | |
| | | NSL | | | JFR | | | JRO | | | JSD | | | JQC | |
Assets | | | | | | | | | | | | | | | | | | | | |
Long-term investments, at value (cost $365,005,735, $910,228,430, $635,812,729, $242,887,786 and $1,543,153,542, respectively) | | $ | 325,566,992 | | | $ | 817,991,736 | | | $ | 570,640,583 | | | $ | 215,041,769 | | | $ | 1,436,880,350 | |
Short-term investments, at value (cost approximates value) | | | 15,432,067 | | | | 44,809,031 | | | | 33,358,072 | | | | 9,059,821 | | | | 36,609,636 | |
Cash | | | 3,410,706 | | | | 1,145,880 | | | | 33,667 | | | | 1,721,579 | | | | 6,044,998 | |
Unrealized appreciation on interest rate swaps | | | — | | | | 712,604 | | | | 583,039 | | | | — | | | | — | |
Receivable for: | | | | | | | | | | | | | | | | | | | | |
Interest | | | 1,472,828 | | | | 3,694,193 | | | | 2,518,413 | | | | 926,632 | | | | 7,673,200 | |
Investments sold | | | 6,222,967 | | | | 13,089,583 | | | | 14,125,706 | | | | 3,826,419 | | | | 25,988,478 | |
Reclaims | | | — | | | | — | | | | — | | | | — | | | | 17,480 | |
Other assets | | | 121,739 | | | | 172,282 | | | | 109,511 | | | | 76,112 | | | | 448,200 | |
Total assets | | | 352,227,299 | | | | 881,615,309 | | | | 621,368,991 | | | | 230,652,332 | | | | 1,513,662,342 | |
Liabilities | | | | | | | | | | | | | | | | | | | | |
Borrowings | | | 86,200,000 | | | | 208,100,000 | | | | 164,900,000 | | | | 8,500,000 | | | | 402,000,000 | |
Reverse repurchase agreements | | | — | | | | — | | | | — | | | | — | | | | 117,000,000 | |
Cash overdraft denominated in foreign currencies (cost $—, $—, $—, $55 and $174, respectively) | | | — | | | | — | | | | — | | | | 53 | | | | 174 | |
Payable for: | | | | | | | | | | | | | | | | | | | | |
Dividends | | | 1,156,347 | | | | 2,604,743 | | | | 1,803,258 | | | | 690,684 | | | | 10,783,399 | |
Shares repurchased | | | — | | | | — | | | | — | | | | 57,896 | | | | — | |
Investments purchased – regular settlement | | | 18,012 | | | | 58,945 | | | | 34,168 | | | | 17,721 | | | | 9,177 | |
Investments purchased – when-issued/delayed-delivery settlement | | | 17,095,410 | | | | 43,778,662 | | | | 30,584,505 | | | | 9,872,364 | | | | 48,675,827 | |
Unfunded senior loans | | | 780,201 | | | | 1,830,227 | | | | 1,313,001 | | | | 654,173 | | | | — | |
Taxable Fund Preferred (“TFP”) Shares, net of deferred offering costs (liquidation preference $—, $—, $—, $70,000,000 and $—, respectively) | | | — | | | | — | | | | — | | | | 69,657,866 | | | | — | |
Term Preferred Share (“Term Preferred”), net of deferred offering costs (liquidation preference $33,000,000, $90,000,000, $45,000,000, $— and $—, respectively) | | | 32,823,464 | | | | 89,337,109 | | | | 44,596,238 | | | | — | | | | — | |
Accrued expenses: | | | | | | | | | | | | | | | | | | | | |
Interest | | | 74,749 | | | | 197,962 | | | | 135,439 | | | | 5,962 | | | | 698,578 | |
Management fees | | | 225,006 | | | | 556,343 | | | | 395,643 | | | | 148,173 | | | | 991,072 | |
Trustees fees | | | 91,745 | | | | 171,642 | | | | 108,664 | | | | 20,235 | | | | 442,421 | |
Other | | | 72,442 | | | | 119,012 | | | | 92,293 | | | | 45,787 | | | | 261,767 | |
Total liabilities | | | 138,537,376 | | | | 346,754,645 | | | | 243,963,209 | | | | 89,670,914 | | | | 580,862,415 | |
Net assets applicable to common shares | | $ | 213,689,923 | | | $ | 534,860,664 | | | $ | 377,405,782 | | | $ | 140,981,418 | | | $ | 932,799,927 | |
Common shares outstanding | | | 38,611,472 | | | | 56,918,468 | | | | 40,541,218 | | | | 10,085,648 | | | | 135,609,290 | |
Net asset value (“NAV”) per common share outstanding | | $ | 5.53 | | | $ | 9.40 | | | $ | 9.31 | | | $ | 13.98 | | | $ | 6.88 | |
Net assets applicable to common shares consist of: | | | | | | | | | | | | | | | | | | | | |
Common shares, $0.01 par value per share | | $ | 386,115 | | | $ | 569,185 | | | $ | 405,412 | | | $ | 100,856 | | | $ | 1,356,093 | |
Paid-in-surplus | | | 287,115,526 | | | | 708,175,444 | | | | 502,545,303 | | | | 191,107,960 | | | | 1,243,554,340 | |
Total distributable earnings | | | (73,811,718 | ) | | | (173,883,965 | ) | | | (125,544,933 | ) | | | (50,227,398 | ) | | | (312,110,506 | ) |
Net assets applicable to common shares | | $ | 213,689,923 | | | $ | 534,860,664 | | | $ | 377,405,782 | | | $ | 140,981,418 | | | $ | 932,799,927 | |
Authorized shares: | | | | | | | | | | | | | | | | | | | | |
Common | | | Unlimited | | | | Unlimited | | | | Unlimited | | | | Unlimited | | | | Unlimited | |
Preferred | | | Unlimited | | | | Unlimited | | | | Unlimited | | | | Unlimited | | | | Unlimited | |
See accompanying notes to financial statements.
94
Statement of Operations
Year Ended July 31, 2020
| | | | | | | | | | | | | | | | | | | | |
| | | NSL | | | JFR | | | JRO | | | JSD | | | JQC | |
Investment Income | | | | | | | | | | | | | | | | | | | | |
Interest and dividends | | $ | 21,235,855 | | | $ | 50,367,172 | | | $ | 35,528,363 | | | $ | 14,482,587 | | | $ | 83,407,604 | |
Fees | | | 445,757 | | | | 1,079,047 | | | | 773,163 | | | | 295,857 | | | | 1,413,688 | |
Total investment income | | | 21,681,612 | | | | 51,446,219 | | | | 36,301,526 | | | | 14,778,444 | | | | 84,821,292 | |
Expenses | | | | | | | | | | | | | | | | | | | | |
Management fees | | | 3,004,646 | | | | 7,297,618 | | | | 5,156,162 | | | | 2,012,000 | | | | 13,208,570 | |
Interest expense and amortization of offering costs | | | 3,712,257 | | | | 9,437,288 | | | | 6,849,273 | | | | 2,558,534 | | | | 17,718,871 | |
Liquidity fees | | | — | | | | — | | | | — | | | | 50,956 | | | | — | |
Remarketing fees | | | — | | | | — | | | | — | | | | 6,028 | | | | — | |
Custodian fees | | | 162,060 | | | | 294,256 | | | | 234,540 | | | | 131,605 | | | | 378,715 | |
Trustees fees | | | 10,112 | | | | 24,979 | | | | 17,538 | | | | 6,760 | | | | 44,086 | |
Professional fees | | | 78,080 | | | | 75,570 | | | | 76,880 | | | | 255,939 | | | | 103,128 | |
Shareholder reporting expenses | | | 48,823 | | | | 88,283 | | | | 65,544 | | | | 29,210 | | | | 156,398 | |
Shareholder servicing agent fees | | | 12,391 | | | | 10,221 | | | | 16,757 | | | | 3,536 | | | | 4,045 | |
Stock exchange listing fees | | | 10,667 | | | | 15,722 | | | | 11,199 | | | | 6,738 | | | | 37,461 | |
Investor relations expenses | | | 22,681 | | | | 54,962 | | | | 38,980 | | | | 15,146 | | | | 364,285 | |
Other | | | 30,417 | | | | 41,812 | | | | 34,407 | | | | 31,254 | | | | 40,405 | |
Total expenses | | | 7,092,134 | | | | 17,340,711 | | | | 12,501,280 | | | | 5,107,706 | | | | 32,055,964 | |
Net investment income (loss) | | | 14,589,478 | | | | 34,105,508 | | | | 23,800,246 | | | | 9,670,738 | | | | 52,765,328 | |
Realized and Unrealized Gain (Loss) | | | | | | | | | | | | | | | | | | | | |
Net realized gain (loss) from: | | | | | | | | | | | | | | | | | | | | |
Investments and foreign currency | | | (14,776,047 | ) | | | (30,265,712 | ) | | | (21,104,143 | ) | | | (9,233,945 | ) | | | (48,566,692 | ) |
Swaps | | | (147,276 | ) | | | 667,402 | | | | 456,353 | | | | 521,533 | | | | — | |
Change in net unrealized appreciation (depreciation) of: | | | | | | | | | | | | | | | | | | | | |
Investments and foreign currency | | | (24,259,777 | ) | | | (58,340,272 | ) | | | (41,818,574 | ) | | | (19,565,254 | ) | | | (69,625,716 | ) |
Swaps | | | 167,345 | | | | 204,383 | | | | 264,075 | | | | 69,441 | | | | — | |
Net realized and unrealized gain (loss) | | | (39,015,755 | ) | | | (87,734,199 | ) | | | (62,202,289 | ) | | | (28,208,225 | ) | | | (118,192,408 | ) |
Net increase (decrease) in net assets applicable to common shares from operations | | $ | (24,426,277 | ) | | $ | (53,628,691 | ) | | $ | (38,402,043 | ) | | $ | (18,537,487 | ) | | $ | (65,427,080 | ) |
See accompanying notes to financial statements.
95
Statement of Changes in Net Assets
| | | | | | | | | | | | | | | | |
| | | NSL | | | JFR | |
| | | Year Ended 7/31/20 | | | Year
Ended 7/31/19 | | | Year Ended 7/31/20 | | | Year Ended 7/31/19 | |
Operations | | | | | | | | | | | | | | | | |
Net investment income (loss) | | $ | 14,589,478 | | | $ | 17,418,093 | | | $ | 34,105,508 | | | $ | 39,606,948 | |
Net realized gain (loss) from: | | | | | | | | | | | | | | | | |
Investments and foreign currency | | | (14,776,047 | ) | | | (12,961,836 | ) | | | (30,265,712 | ) | | | (22,162,068 | ) |
Swaps | | | (147,276 | ) | | | (534,288 | ) | | | 667,402 | | | | 165,763 | |
Change in net unrealized appreciation (depreciation) of: | | | | | | | | | | | | | | | | |
Investments and foreign currency | | | (24,259,777 | ) | | | (364,248 | ) | | | (58,340,272 | ) | | | (8,136,582 | ) |
Swaps | | | 167,345 | | | | 1,031,635 | | | | 204,383 | | | | 2,938,806 | |
Net increase (decrease) in net assets applicable to common shares from operations | | | (24,426,277 | ) | | | 4,589,356 | | | | (53,628,691 | ) | | | 12,412,867 | |
Distributions to Common Shareholders | | | | | | | | | | | | | | | | |
Dividends | | | (16,371,264 | ) | | | (16,797,816 | ) | | | (39,729,091 | ) | | | (41,351,267 | ) |
Return of capital | | | — | | | | — | | | | — | | | | — | |
Decrease in net assets applicable to common shares from distributions to common shareholders | | | (16,371,264 | ) | | | (16,797,816 | ) | | | (39,729,091 | ) | | | (41,351,267 | ) |
Capital Share Transactions | | | | | | | | | | | | | | | | |
Cost of shares repurchased and retired | | | — | | | | (56,494 | ) | | | — | | | | — | |
Net increase (decrease) in net assets applicable to common shares from capital share transactions | | | — | | | | (56,494 | ) | | | — | | | | — | |
Net increase (decrease) in net assets applicable to common shares | | | (40,797,541 | ) | | | (12,264,954 | ) | | | (93,357,782 | ) | | | (28,938,400 | ) |
Net assets applicable to common shares at the beginning of period | | | 254,487,464 | | | | 266,752,418 | | | | 628,218,446 | | | | 657,156,846 | |
Net assets applicable to common shares at the end of period | | $ | 213,689,923 | | | $ | 254,487,464 | | | $ | 534,860,664 | | | $ | 628,218,446 | |
See accompanying notes to financial statements.
96
| | | | | | | | | | | | | | | | |
| | | JRO | | | JSD | |
| | | Year Ended 7/31/20 | | | Year
Ended 7/31/19 | | | Year Ended 7/31/20 | | | Year
Ended 7/31/19 | |
Operations | | | | | | | | | | | | | | | | |
Net investment income (loss) | | $ | 23,800,246 | | | $ | 28,583,453 | | | $ | 9,670,738 | | | $ | 11,965,447 | |
Net realized gain (loss) from: | | | | | | | | | | | | | | | | |
Investments and foreign currency | | | (21,104,143 | ) | | | (19,639,235 | ) | | | (9,233,945 | ) | | | (6,255,418 | ) |
Swaps | | | 456,353 | | | | (101,789 | ) | | | 521,533 | | | | (396,791 | ) |
Change in net unrealized appreciation (depreciation) of: | | | | | | | | | | | | | | | | |
Investments and foreign currency | | | (41,818,574 | ) | | | (3,169,787 | ) | | | (19,565,254 | ) | | | (3,347,408 | ) |
Swaps | | | 264,075 | | | | 2,650,051 | | | | 69,441 | | | | 146,150 | |
Net increase (decrease) in net assets applicable to common shares from operations | | | (38,402,043 | ) | | | 8,322,693 | | | | (18,537,487 | ) | | | 2,111,980 | |
Distributions to Common Shareholders | | | | | | | | | | | | | | | | |
Dividends | | | (27,892,358 | ) | | | (29,824,066 | ) | | | (10,852,822 | ) | | | (12,508,508 | ) |
Return of capital | | | — | | | | — | | | | — | | | | — | |
Decrease in net assets applicable to common shares from distributions to common shareholders | | | (27,892,358 | ) | | | (29,824,066 | ) | | | (10,852,822 | ) | | | (12,508,508 | ) |
Capital Share Transactions | | | | | | | | | | | | | | | | |
Cost of shares repurchased and retired | | | — | | | | (176,868 | ) | | | (115,771 | ) | | | — | |
Net increase (decrease) in net assets applicable to common shares from capital share transactions | | | — | | | | (176,868 | ) | | | (115,771 | ) | | | — | |
Net increase (decrease) in net assets applicable to common shares | | | (66,294,401 | ) | | | (21,678,241 | ) | | | (29,506,080 | ) | | | (10,396,528 | ) |
Net assets applicable to common shares at the beginning of period | | | 443,700,183 | | | | 465,378,424 | | | | 170,487,498 | | | | 180,884,026 | |
Net assets applicable to common shares at the end of period | | $ | 377,405,782 | | | $ | 443,700,183 | | | $ | 140,981,418 | | | $ | 170,487,498 | |
See accompanying notes to financial statements.
97
Statement of Changes in Net Assets (continued)
| | | | | | | | |
| | | JQC | |
| | | Year Ended 7/31/20 | | | Year
Ended 7/31/19 | |
Operations | | | | | | | | |
Net investment income (loss) | | $ | 52,765,328 | | | $ | 62,624,489 | |
Net realized gain (loss) from: | | | | | | | | |
Investments and foreign currency | | | (48,566,692 | ) | | | (68,293,099 | ) |
Swaps | | | — | | | | — | |
Change in net unrealized appreciation (depreciation) of: | | | | | | | | |
Investments and foreign currency | | | (69,625,716 | ) | | | 44,989,600 | |
Swaps | | | — | | | | — | |
Net increase (decrease) in net assets applicable to common shares from operations | | | (65,427,080 | ) | | | 39,320,990 | |
Distributions to Common Shareholders | | | | | | | | |
Dividends | | | (53,064,705 | ) | | | (80,837,610 | ) |
Return of capital | | | (100,485,694 | ) | | | (42,792,971 | ) |
Decrease in net assets applicable to common shares from distributions to common shareholders | | | (153,550,399 | ) | | | (123,630,581 | ) |
Capital Share Transactions | | | | | | | | |
Cost of shares repurchase and retired | | | — | | | | (1,175,108 | ) |
Net increase (decrease) in net assets applicable to common shares from capital share transactions | | | — | | | | (1,175,108 | ) |
Net increase (decrease) in net assets applicable to common shares | | | (218,977,479 | ) | | | (85,484,699 | ) |
Net assets applicable to common shares at the beginning of period | | | 1,151,777,406 | | | | 1,237,262,105 | |
Net assets applicable to common shares at the end of period | | $ | 932,799,927 | | | $ | 1,151,777,406 | |
See accompanying notes to financial statements.
98
Statement of Cash Flows
Year Ended July 31, 2020
| | | | | | | | | | | | | | | | | | | | |
| | | NSL | | | JFR | | | JRO | | | JSD | | | JQC | |
Cash Flows from Operating Activities: | | | | | | | | | | | | | | | | | | | | |
Net Increase (Decrease) in Net Assets Applicable to Common Shares from Operations | | $ | (24,426,277 | ) | | $ | (53,628,691 | ) | | $ | (38,402,043 | ) | | $ | (18,537,487 | ) | | $ | (65,427,080 | ) |
Adjustments to reconcile the net increase (decrease) in net assets applicable to common shares from operations to net cash provided by (used in) operating activities: | | | | | | | | | | | | | | | | | | | | |
Purchases of investments | | | (156,803,105 | ) | | | (394,774,833 | ) | | | (275,705,611 | ) | | | (99,376,685 | ) | | | (843,730,399 | ) |
Proceeds from sales and maturities of investments | | | 199,376,959 | | | | 476,620,073 | | | | 333,505,772 | | | | 128,228,923 | | | | 1,090,072,118 | |
Proceeds from (Purchase of) short-term investments, net | | | (1,939,494 | ) | | | (996,982 | ) | | | 3,069,788 | | | | 6,506,998 | | | | 68,071,770 | |
Premiums received (paid) for credit default swaps | | | — | | | | — | | | | — | | | | (205,391 | ) | | | — | |
Payment-in-kind distributions | | | (52,367 | ) | | | (198,146 | ) | | | (137,543 | ) | | | (29,934 | ) | | | (176,753 | ) |
Taxes paid | | | (109,845 | ) | | | (111,977 | ) | | | (66,824 | ) | | | (12,783 | ) | | | — | |
Proceeds from litigation settlement | | | 5,150 | | | | 15,859 | | | | 16,531 | | | | — | | | | 21,185 | |
Amortization (Accretion) of premiums and discounts, net | | | (1,748,996 | ) | | | (3,419,473 | ) | | | (2,385,683 | ) | | | (1,095,420 | ) | | | (2,091,875 | ) |
Amortization of deferred offering costs | | | 238,051 | | | | 261,845 | | | | 520,510 | | | | 415,387 | | | | — | |
(Increase) Decrease in: | | | | | | | | | | | | | | | | | | | | |
Receivable for interest | | | 333,636 | | | | 389,968 | | | | 10,554 | | | | 143,078 | | | | 2,684,418 | |
Receivable for investments sold | | | (591,312 | ) | | | (320,787 | ) | | | (6,745,033 | ) | | | (1,322,995 | ) | | | (17,062,498 | ) |
Other assets | | | (13,039 | ) | | | (18,264 | ) | | | (11,432 | ) | | | (49,279 | ) | | | (49,486 | ) |
Increase (Decrease) in: | | | | | | | | | | | | | | | | | | | | |
Investments purchased – regular settlement | | | 13,534 | | | | 36,233 | | | | 18,337 | | | | 16,557 | | | | 5,107 | |
Investments purchased – when-issued/delayed-delivery settlement | | | 3,579,633 | | | | 9,118,559 | | | | 4,403,371 | | | | (1,667,617 | ) | | | (12,133,253 | ) |
Payable for unfunded senior loans | | | 769,899 | | | | 1,808,252 | | | | 1,299,781 | | | | 643,871 | | | | — | |
Payable for variation margin on swap contracts | | | — | | | | — | | | | — | | | | (7,060 | ) | | | — | |
Accrued management fees | | | (56,830 | ) | | | (122,892 | ) | | | (83,972 | ) | | | (41,999 | ) | | | (267,345 | ) |
Accrued interest | |
| 74,607
|
| |
| 197,962
|
| |
| (323,353
| )
| |
| 4,299
|
| |
| (1,424,822
| )
|
Accrued Trustees fees | | | 10,132 | | | | 18,900 | | | | 11,876 | | | | 1,842 | | | | 49,207 | |
Accrued other expenses | | | (70,729 | ) | | | (131,770 | ) | | | (110,821 | ) | | | (67,515 | ) | | | (11,873 | ) |
Net realized (gain) loss from investments and foreign currency | | | 14,776,047 | | | | 30,265,712 | | | | 21,104,143 | | | | 9,233,945 | | | | 48,566,692 | |
Change in net unrealized appreciation (depreciation) of: | | | | | | | | | | | | | | | | | | | | |
Investments and foreign currency | | | 24,259,777 | | | | 58,340,272 | | | | 41,818,574 | | | | 19,565,254 | | | | 69,625,716 | |
Swaps(1) | | | (167,345 | ) | | | (204,383 | ) | | | (264,075 | ) | | | — | | | | — | |
Net cash provided by (used in) operating activities | | | 57,458,086 | | | | 123,145,437 | | | | 81,542,847 | | | | 42,345,989 | | | | 336,720,829 | |
Cash Flow from Financing Activities: | | | | | | | | | | | | | | | | | | | | |
Proceeds from borrowings | | | 13,400,000 | | | | 57,600,000 | | | | 63,700,000 | | | | 8,500,000 | | | | 35,000,000 | |
(Repayments of) borrowings | | | (41,200,000 | ) | | | (114,000,000 | ) | | | (77,600,000 | ) | | | (72,000,000 | ) | | | (113,000,000 | ) |
Proceeds from reverse repurchase agreements | | | — | | | | — | | | | — | | | | — | | | | 12,000,000 | |
(Repayments of) reverse repurchase agreements | | | — | | | | — | | | | — | | | | — | | | | (108,000,000 | ) |
Proceeds from TFP Shares issued, at liquidation preference | | | — | | | | — | | | | — | | | | 100,000,000 | | | | — | |
(Payments for) TFP Shares redeemed, at liquidation preference | | | — | | | | — | | | | — | | | | (30,000,000 | ) | | | — | |
(Payments for) Term Preferred Shares redeemed, at liquidation preference | | | (10,000,000 | ) | | | (25,000,000 | ) | | | (39,000,000 | ) | | | (35,000,000 | ) | | | — | |
(Payments for) deferred offering costs | | | — | | | | — | | | | — | | | | (514,894 | ) | | | — | |
Increase (Decrease) in: | | | | | | | | | | | | | | | | | | | | |
Cash overdraft | | | — | | | | — | | | | — | | | | (718,318 | ) | | | — | |
Cash overdraft denominated in foreign currencies | | | — | | | | — | | | | — | | | | 3 | | | | (1 | ) |
Cash distributions paid to common shareholders | | | (16,634,380 | ) | | | (40,599,557 | ) | | | (28,609,180 | ) | | | (11,179,248 | ) | | | (156,675,830 | ) |
Cost of shares repurchased and retired | | | — | | | | — | | | | — | | | | (57,875 | ) | | | — | |
Net cash provided by (used in) financing activities | | | (54,434,380 | ) | | | (121,999,557 | ) | | | (81,509,180 | ) | | | (40,970,332 | ) | | | (330,675,831 | ) |
Net Increase (Decrease) in Cash, Cash Denominated in Foreign Currencies and Cash Collateral at Brokers | | | 3,023,706 | | | | 1,145,880 | | | | 33,667 | | | | 1,375,657 | | | | 6,044,998 | |
Cash, cash denominated in foreign currencies and cash collateral at brokers at the beginning of period | | | 387,000 | | | | — | | | | — | | | | 345,922 | | | | — | |
Cash, cash denominated in foreign currencies and cash collateral at brokers at the end of period | | $ | 3,410,706 | | | $ | 1,145,880 | | | $ | 33,667 | | | $ | 1,721,579 | | | $ | 6,044,998 | |
| | | | | |
| Supplemental Disclosure of Cash Flow Information | | | | | | | | | | | | | | | |
Cash paid for interest (excluding borrowing and amortization of offering costs) | | $ | 3,303,365 | | | $ | 8,959,163 | | | $ | 6,612,330 | | | $ | 2,117,245 | | | $ | 19,127,315 | |
| (1) | Excluding over-the-counter cleared swaps. |
See accompanying notes to financial statements.
99
Financial Highlights
Selected data for a share outstanding throughout each period:
| | | | | | | | | | | | | | | | | | | | | | | | | | | | | | | | | | | | | | | | | | | | |
| | | | |
| | | | | | Investment Operations | | | Less Distributions to
Common Shareholders | | | Common Share | |
| | | Beginning
Common
Share
NAV | | | Net
Invest
ment
Income
(Loss)(a) | | | Net
Realized/
Unrealized
Gain (Loss) | | | Total | | | From
Net
Investment
Income | | | From
Accumu
lated
Net
Realized
Gains | | | Total | | | Discount
from
Shares
Repurchased
and Retired | | | Premium
from
Shares
Sold
through
Shelf
Offering | | | Ending
NAV | | | Ending
Share
Price | |
|
NSL | |
Year Ended 7/31: | |
2020 | | $ | 6.59 | | | $ | 0.38 | | | $ | (1.02 | ) | | $ | (0.64 | ) | | $ | (0.42 | ) | | $ | — | | | $ | (0.42 | ) | | $ | — | | | $ | — | | | $ | 5.53 | | | $ | 4.78 | |
2019 | | | 6.91 | | | | 0.45 | | | | (0.33 | ) | | | 0.12 | | | | (0.44 | ) | | | — | | | | (0.44 | ) | | | — | * | | | — | | | | 6.59 | | | | 5.90 | |
2018 | | | 6.97 | | | | 0.43 | | | | (0.04 | ) | | | 0.39 | | | | (0.45 | ) | | | — | | | | (0.45 | ) | | | — | | | | — | | | | 6.91 | | | | 6.13 | |
2017 | | | 6.76 | | | | 0.46 | | | | 0.21 | | | | 0.67 | | | | (0.46 | ) | | | — | | | | (0.46 | ) | | | — | | | | — | | | | 6.97 | | | | 6.83 | |
2016 | | | 7.16 | | | | 0.45 | | | | (0.43 | ) | | | 0.02 | | | | (0.42 | ) | | | — | | | | (0.42 | ) | | | — | * | | | — | | | | 6.76 | | | | 6.25 | |
|
JFR | |
Year Ended 7/31: | |
2020 | | | 11.04 | | | | 0.60 | | | | (1.54 | ) | | | (0.94 | ) | | | (0.70 | ) | | | — | | | | (0.70 | ) | | | — | | | | — | | | | 9.40 | | | | 8.03 | |
2019 | | | 11.55 | | | | 0.70 | | | | (0.48 | ) | | | 0.22 | | | | (0.73 | ) | | | — | | | | (0.73 | ) | | | — | | | | — | | | | 11.04 | | | | 9.76 | |
2018 | | | 11.76 | | | | 0.66 | | | | (0.10 | ) | | | 0.56 | | | | (0.77 | ) | | | — | | | | (0.77 | ) | | | — | | | | — | * | | | 11.55 | | | | 10.30 | |
2017 | | | 11.36 | | | | 0.73 | | | | 0.46 | | | | 1.19 | | | | (0.79 | ) | | | — | | | | (0.79 | ) | | | — | | | | — | * | | | 11.76 | | | | 11.83 | |
2016 | | | 12.01 | | | | 0.73 | | | | (0.66 | ) | | | 0.07 | | | | (0.72 | ) | | | — | | | | (0.72 | ) | | | — | | | | — | | | | 11.36 | | | | 10.68 | |
100
| | | | | | | | | | | | | | | | | | | | | | |
| | | | | | | Common Share Supplemental Data/
Ratios Applicable to Common Shares | |
Common Share
Total Returns | | | | | | Ratios to Average Net Assets(c) | | | | |
Based
on
NAV(b) | | | Based
on
Share
Price(b) | | | Ending
Net
Assets
(000) | | | Expenses | | | Net
Investment
Income (Loss) | | | Portfolio
Turnover
Rate(d) | |
| | | | | |
| | | | | | | | | | | | | | | | | | | | | | | |
| | | | | | | | | | | | | | | | | | | | | | |
| | (9.89 | )% | | | (12.19 | )% | | $ | 213,690 | | | | 3.05 | % | | | 6.28 | % | | | 43 | % |
| | 1.81 | | | | 3.60 | | | | 254,487 | | | | 3.26 | | | | 6.77 | | | | 31 | |
| | 5.91 | | | | (3.78 | ) | | | 266,752 | | | | 2.90 | | | | 6.24 | | | | 29 | |
| | 10.22 | | | | 17.00 | | | | 269,083 | | | | 2.64 | | | | 6.70 | | | | 55 | |
| | 0.61 | | | | 5.89 | | | | 261,071 | | | | 2.53 | | | | 6.84 | | | | 29 | |
| | | | | |
| | | | | | | | | | | | | | | | | | | | | | | |
| | | | | | | | | | | | | | | | | | | | | | |
| | (8.82 | ) | | | (10.98 | ) | | | 534,861 | | | | 3.01 | | | | 5.93 | | | | 44 | |
| | 2.03 | | | | 1.98 | | | | 628,218 | | | | 3.43 | | | | 6.25 | | | | 32 | |
| | 5.01 | | | | (6.64 | ) | | | 657,157 | | | | 2.99 | | | | 5.68 | | | | 29 | |
| | 10.76 | | | | 18.63 | | | | 663,863 | | | | 2.63 | | | | 6.28 | | | | 59 | |
| | 0.93 | | | | 7.50 | | | | 626,627 | | | | 2.46 | | | | 6.52 | | | | 26 | |
| (a) | Per share Net Investment Income (Loss) is calculated using the average daily shares method. |
| (b) | Total Return Based on Common Share NAV is the combination of changes in common share NAV, reinvested dividend income at NAV and reinvested capital gains distributions at NAV, if any. The last dividend declared in the period, which is typically paid on the first business day of the following month, is assumed to be reinvested at the ending NAV. The actual reinvest price for the last dividend declared in the period may often be based on the Fund’s market price (and not its NAV), and therefore may be different from the price used in the calculation. Total returns are not annualized. |
Total Return Based on Common Share Price is the combination of changes in the market price per share and the effect of reinvested dividend income and reinvested capital gains distributions, if any, at the average price paid per share at the time of reinvestment. The last dividend declared in the period, which is typically paid on the first business day of the following month, is assumed to be reinvested at the ending market price. The actual reinvestment for the last dividend declared in the period may take place over several days, and in some instances may not be based on the market price, so the actual reinvestment price may be different from the price used in the calculation. Total returns are not annualized.
| | | | |
| (c) | | • | | Net Investment Income (Loss) ratios reflect income earned and expenses incurred on assets attributable to preferred shares (as described in Note 5 – Fund Shares) and/or borrowings (as described in Note 8 – Fund Leverage), where applicable. |
| | • | | Each ratio includes the effect of all interest expense paid and other costs related to preferred shares and/or borrowings, where applicable, as follows: |
| | | | |
Ratios of Interest Expense
to Average Net Assets
Applicable to Common Shares | |
NSL | |
Year Ended 7/31: | |
2020 | | | 1.60 | % |
2019 | | | 1.84 | |
2018 | | | 1.46 | |
2017 | | | 1.19 | |
2016 | | | 1.08 | |
| | | | |
Ratios of Interest Expense
to Average Net Assets
Applicable to Common Shares | |
JFR | |
Year Ended 7/31: | |
2020 | | | 1.64 | % |
2019 | | | 2.07 | |
2018 | | | 1.61 | |
2017 | | | 1.24 | |
2016 | | | 1.08 | |
| (d) | Portfolio Turnover Rate is calculated based on the lesser of long-term purchases or sales (as disclosed in Note 4 – Portfolio Securities and Investments in Derivatives) divided by the average long-term market value during the period. |
| * | Rounds to less than $0.01 per share. |
See accompanying notes to financial statements.
101
Financial Highlights (continued)
Selected data for a share outstanding throughout each period:
| | | | | | | | | | | | | | | | | | | | | | | | | | | | | | | | | | | | | | | | | | | | |
| | | | |
| | | | | | Investment Operations | | | Less Distributions to
Common Shareholders | | | Common Share | |
| | | Beginning
Common
Share
NAV | | | Net
Investment
Income
(Loss)(a) | | | Net
Realized/
Unrealized
Gain (Loss) | | | Total | | | From
Net
Investment
Income | | | From
Accumu
lated
Net
Realized
Gains | | | Total | | | Discount
from
Shares
Repurchased
and Retired | | | Premium
from
Shares
Sold
through
Shelf
Offering | | | Ending
NAV | | | Ending
Share
Price | |
|
JRO | |
Year Ended 7/31: | | | | | | | | | | | | | | | | | | | | | | | | | | | | | | | | | | | | | | | | | | | | |
2020 | | $ | 10.94 | | | $ | 0.59 | | | $ | (1.53 | ) | | $ | (0.94 | ) | | $ | (0.69 | ) | | $ | — | | | $ | (0.69 | ) | | $ | — | | | $ | — | | | $ | 9.31 | | | $ | 7.97 | |
2019 | | | 11.47 | | | | 0.70 | | | | (0.49 | ) | | | 0.21 | | | | (0.74 | ) | | | — | | | | (0.74 | ) | | | — | * | | | — | | | | 10.94 | | | | 9.70 | |
2018 | | | 11.70 | | | | 0.66 | | | | (0.09 | ) | | | 0.57 | | | | (0.80 | ) | | | — | | | | (0.80 | ) | | | — | | | | — | * | | | 11.47 | | | | 10.23 | |
2017 | | | 11.31 | | | | 0.76 | | | | 0.45 | | | | 1.21 | | | | (0.83 | ) | | | — | | | | (0.83 | ) | | | — | | | | 0.01 | | | | 11.70 | | | | 11.87 | |
2016 | | | 12.05 | | | | 0.77 | | | | (0.75 | ) | | | 0.02 | | | | (0.76 | ) | | | — | | | | (0.76 | ) | | | — | | | | — | | | | 11.31 | | | | 10.72 | |
|
JSD | |
Year Ended 7/31: | | | | | | | | | | | | | | | | | | | | | | | | | | | | | | | | | | | | | | | | | | | | |
2020 | | | 16.89 | | | | 0.96 | | | | (2.79 | ) | | | (1.83 | ) | | | (1.08 | ) | | | — | | | | (1.08 | ) | | | — | * | | | — | | | | 13.98 | | | | 11.64 | |
2019 | | | 17.92 | | | | 1.19 | | | | (0.98 | ) | | | 0.21 | | | | (1.24 | ) | | | — | | | | (1.24 | ) | | | — | | | | — | | | | 16.89 | | | | 15.36 | |
2018 | | | 18.07 | | | | 1.19 | | | | (0.04 | ) | | | 1.15 | | | | (1.30 | ) | | | — | | | | (1.30 | ) | | | — | | | | — | | | | 17.92 | | | | 16.67 | |
2017 | | | 17.49 | | | | 1.29 | | | | 0.54 | | | | 1.83 | | | | (1.25 | ) | | | — | | | | (1.25 | ) | | | — | | | | — | * | | | 18.07 | | | | 17.75 | |
2016 | | | 18.63 | | | | 1.21 | | | | (1.16 | ) | | | 0.05 | | | | (1.16 | ) | | | (0.03 | ) | | | (1.19 | ) | | | — | | | | — | | | | 17.49 | | | | 16.16 | |
102
| | | | | | | | | | | | | | | | | | | | | | |
| | | | | | | Common Share Supplemental Data/
Ratios Applicable to Common Shares | |
Common Share
Total Returns | | | | | | Ratios to Average Net Assets(c) | | | | |
| | | | | |
Based
on
NAV(b) | | | Based
on
Share
Price(b) | | | Ending
Net
Assets
(000) | | | Expenses | | | Net
Investment
Income (Loss) | | | Portfolio
Turnover
Rate(d) | |
| | | | | |
| | | | | | | | | | | | | | | | | | | | | | | |
| | | | | | | | | | | | | | | | | | | | | | |
| | (8.91 | )% | | | (11.13 | )% | | $ | 377,406 | | | | 3.07 | % | | | 5.85 | % | | | 43 | % |
| | 1.94 | | | | 2.19 | | | | 443,700 | | | | 3.31 | | | | 6.37 | | | | 34 | |
| | 5.06 | | | | (7.38 | ) | | | 465,378 | | | | 2.99 | | | | 5.77 | | | | 30 | |
| | 11.06 | | | | 18.92 | | | | 465,161 | | | | 2.68 | | | | 6.57 | | | | 57 | |
| | 0.53 | | | | 6.91 | | | | 435,189 | | | | 2.49 | | | | 6.91 | | | | 27 | |
| | | | | |
| | | | | | | | | | | | | | | | | | | | | | | |
| | | | | | | | | | | | | | | | | | | | | | |
| | (11.19 | ) | | | (17.88 | ) | | | 140,981 | | | | 3.31 | | | | 6.27 | | | | 40 | |
| | 1.30 | | | | (0.30 | ) | | | 170,487 | | | | 3.45 | | | | 6.89 | | | | 33 | |
| | 6.66 | | | | 1.33 | | | | 180,884 | | | | 2.96 | | | | 6.69 | | | | 29 | |
| | 10.68 | | | | 17.91 | | | | 182,468 | | | | 2.52 | | | | 7.18 | | | | 58 | |
| | 0.62 | | | | 6.52 | | | | 176,531 | | | | 2.27 | | | | 7.05 | | | | 34 | |
| (a) | Per share Net Investment Income (Loss) is calculated using the average daily shares method. |
| (b) | Total Return Based on Common Share NAV is the combination of changes in common share NAV, reinvested dividend income at NAV and reinvested capital gains distributions at NAV, if any. The last dividend declared in the period, which is typically paid on the first business day of the following month, is assumed to be reinvested at the ending NAV. The actual reinvest price for the last dividend declared in the period may often be based on the Fund’s market price (and not its NAV), and therefore may be different from the price used in the calculation. Total returns are not annualized. |
| | Total Return Based on Common Share Price is the combination of changes in the market price per share and the effect of reinvested dividend income and reinvested capital gains distributions, if any, at the average price paid per share at the time of reinvestment. The last dividend declared in the period, which is typically paid on the first business day of the following month, is assumed to be reinvested at the ending market price. The actual reinvestment for the last dividend declared in the period may take place over several days, and in some instances may not be based on the market price, so the actual reinvestment price may be different from the price used in the calculation. Total returns are not annualized. |
| | | | |
| (c) | | • | | Net Investment Income (Loss) ratios reflect income earned and expenses incurred on assets attributable to preferred shares (as described in Note 5 – Fund Shares) and/or borrowings (as described in Note 8 – Fund Leverage), where applicable. |
| | • | | Each ratio includes the effect of all interest expense paid and other costs related to preferred shares and/or borrowings, where applicable, as follows: |
| | | | |
Ratios of Interest Expense
to Average Net Assets
Applicable to Common Shares | |
JRO | |
Year Ended 7/31: | |
2020 | | | 1.68 | % |
2019 | | | 1.94 | |
2018 | | | 1.59 | |
2017 | | | 1.27 | |
2016 | | | 1.08 | |
| | | | |
Ratios of Interest Expense
to Average Net Assets
Applicable to Common Shares | |
JSD | |
Year Ended 7/31: | |
2020 | | | 1.70 | % |
2019 | | | 2.00 | |
2018 | | | 1.44 | |
2017 | | | 1.07 | |
2016 | | | 0.82 | |
| (d) | Portfolio Turnover Rate is calculated based on the lesser of long-term purchases or sales (as disclosed in Note 4 – Portfolio Securities and Investments in Derivatives) divided by the average long-term market value during the period. |
| * | Rounds to less than $0.01 per share. |
See accompanying notes to financial statements.
103
Financial Highlights (continued)
Selected data for a share outstanding throughout each period:
| | | | | | | | | | | | | | | | | | | | | | | | | | | | | | | | | | | | | | | | | | | | |
| | | | |
| | | | | | Investment Operations | | | Less Distributions to
Common Shareholders | | | Common Share | |
| | | Beginning
Common
Share
NAV | | | Net
Investment
Income
(Loss)(a) | | | Net
Realized/
Unrealized
Gain (Loss) | | | Total | | | From
Net
Investment
Income | | | From
Accumulated
Net
Realized
Gains | | | Return
of
Capital | | | Total | | | Discount
from
Shares
Repurchased
and Retired | | | Ending
NAV | | | Ending
Share
Price | |
|
JQC | |
Year Ended 7/31: | |
2020 | | $ | 8.49 | | | $ | 0.39 | | | $ | (0.87 | ) | | $ | (0.48 | ) | | $ | (0.39 | ) | | $ | — | | | $ | (0.74 | ) | | $ | (1.13 | ) | | $ | — | | | $ | 6.88 | | | $ | 5.88 | |
2019 | | | 9.11 | | | | 0.46 | | | | (0.17 | ) | | | 0.29 | | | | (0.60 | ) | | | — | | | | (0.31 | ) | | | (0.91 | ) | | | — | * | | | 8.49 | | | | 7.68 | |
2018 | | | 9.32 | | | | 0.44 | | | | (0.12 | ) | | | 0.32 | | | | (0.53 | ) | | | — | | | | — | | | | (0.53 | ) | | | — | | | | 9.11 | | | | 7.89 | |
2017 | | | 9.25 | | | | 0.52 | | | | 0.18 | | | | 0.70 | | | | (0.63 | ) | | | — | | | | — | | | | (0.63 | ) | | | — | | | | 9.32 | | | | 8.69 | |
2016 | | | 9.88 | | | | 0.58 | | | | (0.60 | ) | | | (0.02 | ) | | | (0.61 | ) | | | — | | | | — | | | | (0.61 | ) | | | — | * | | | 9.25 | | | | 8.43 | |
104
| | | | | | | | | | | | | | | | | | | | | | |
| | | | | | | Common Share Supplemental Data/
Ratios Applicable to Common Shares | |
Common Share
Total Returns | | | | | | Ratios to Average Net Assets(c) | | | | |
Based
on
NAV(b) | | |
Based
on
Share
Price(b) | | | Ending
Net
Assets
(000) | | | Expenses | | | Net
Investment
Income (Loss) | | | Portfolio
Turnover
Rate(d) | |
| | | | | |
| | | | | | | | | | | | | | | | | | | | | | | |
| | | | | | | | | | | | | | | | | | | | | | |
| | (5.91 | )% | | | (9.54 | )% | | $ | 932,800 | | | | 3.11 | % | | | 5.11 | % | | | 52 | % |
| | 3.43 | | | | 9.33 | | | | 1,151,777 | | | | 3.42 | | | | 5.25 | | | | 59 | |
| | 3.64 | | | | (3.09 | ) | | | 1,237,262 | | | | 3.01 | | | | 4.84 | | | | 45 | |
| | 7.70 | | | | 10.75 | | | | 1,265,447 | | | | 2.57 | | | | 5.59 | | | | 46 | |
| | 0.11 | | | | 5.98 | | | | 1,255,254 | | | | 2.41 | | | | 6.32 | | | | 46 | |
| (a) | Per share Net Investment Income (Loss) is calculated using the average daily shares method. |
| (b) | Total Return Based on Common Share NAV is the combination of changes in common share NAV, reinvested dividend income at NAV and reinvested capital gains distributions at NAV, if any. The last dividend declared in the period, which is typically paid on the first business day of the following month, is assumed to be reinvested at the ending NAV. The actual reinvest price for the last dividend declared in the period may often be based on the Fund’s market price (and not its NAV), and therefore may be different from the price used in the calculation. Total returns are not annualized. |
Total Return Based on Common Share Price is the combination of changes in the market price per share and the effect of reinvested dividend income and reinvested capital gains distributions, if any, at the average price paid per share at the time of reinvestment. The last dividend declared in the period, which is typically paid on the first business day of the following month, is assumed to be reinvested at the ending market price. The actual reinvestment for the last dividend declared in the period may take place over several days, and in some instances may not be based on the market price, so the actual reinvestment price may be different from the price used in the calculation. Total returns are not annualized.
| | | | |
| (c) | | • | | Net Investment Income (Loss) ratios reflect income earned and expenses incurred on assets attributable to reverse repurchase agreements and borrowings (as described in Note 8 – Fund Leverage), where applicable. |
| | • | | Each ratio includes the effect of all interest expense and other costs related to reverse repurchase agreements and borrowings, where applicable, as follows: |
| | | | |
| JQC | | Ratios of Interest Expense
to Average Net Assets
Applicable to Common Shares | |
Year Ended 7/31: | |
2020 | | | 1.72 | % |
2019 | | | 2.08 | |
2018 | | | 1.67 | |
2017 | | | 1.23 | |
2016 | | | 1.01 | |
| (d) | Portfolio Turnover Rate is calculated based on the lesser of long-term purchases or sales (as disclosed in Note 4 – Portfolio Securities and Investments in Derivatives) divided by the average long-term market value during the period. |
| * | Rounds to less than $0.01 per share. |
See accompanying notes to financial statements.
105
Financial Highlights (continued)
| | | | | | | | | | | | | | | | | | | | | | | | | | | | | | | | | | | | |
| | | Borrowings
at the End of Period | | | TFP Shares
at the End of Period | | | VRTP Shares
at the End of Period | | | Term Preferred
at the End of Period | | | Borrowings,
TFP Shares,
VRTP Shares and/or
Term Preferred
at the End of Period | |
| | | Aggregate
Amount
Outstanding
(000) | | | Asset
Coverage
Per $1,000
Share(a) | | | Aggregate
Amount
Outstanding
(000) | | | Asset
Coverage
Per $1,000
Share | | | Aggregate
Amount
Outstanding
(000) | | | Asset
Coverage
Per $100,000
Share | | | Aggregate
Amount
Outstanding
(000) | | | Asset
Coverage
Per $1,000
Share | | | Asset
Coverage
Per $1
Liquidation
Preference | |
NSL | | | | | | | | | | | | | | | | | | | | | | | | | | | | | |
Year Ended 7/31: | | | | | | | | | | | | | | | | | | | | | | | | | | | | | | | | | | | | |
2020 | | $ | 86,200 | | | $ | 3,862 | | | $ | — | | | $ | — | | | $ | — | | | $ | — | | | $ | 33,000 | | | $ | 2,793 | | | $ | 2.79 | |
2019 | | | 114,000 | | | | 3,610 | | | | — | | | | — | | | | — | | | | — | | | | 43,000 | | | | 2,621 | | | | 2.62 | |
2018 | | | 114,000 | | | | 3,717 | | | | — | | | | — | | | | — | | | | — | | | | 43,000 | | | | 2,699 | | | | 2.70 | |
2017 | | | 114,000 | | | | 3,738 | | | | — | | | | — | | | | — | | | | — | | | | 43,000 | | | | 2,714 | | | | 2.71 | |
2016 | | | 101,000 | | | | 4,030 | | | | — | | | | — | | | | 45,000 | | | | 278,816 | | | | — | | | | — | | | | 2.79 | |
| | | | | | | |
JFR | | | | | | | | | | | | | | | | | | | | | | | | | | | | | |
Year Ended 7/31: | | | | | | | | | | | | | | | | | | | | | | | | | | | | | | | | | | | | |
2020 | | | 208,100 | | | | 4,003 | | | | — | | | | — | | | | — | | | | — | | | | 90,000 | | | | 2,794 | | | | 2.79 | |
2019 | | | 264,500 | | | | 3,810 | | | | — | | | | — | | | | — | | | | — | | | | 115,000 | | | | 2,655 | | | | 2.66 | |
2018 | | | 254,300 | | | | 4,077 | | | | — | | | | — | | | | — | | | | — | | | | 125,200 | | | | 2,732 | | | | 2.73 | |
2017 | | | 254,300 | | | | 4,103 | | | | — | | | | — | | | | — | | | | — | | | | 125,200 | | | | 2,749 | | | | 2.75 | |
2016 | | | 240,800 | | | | 4,051 | | | | — | | | | — | | | | 108,000 | | | | 279,652 | | | | — | | | | — | | | | 2.80 | |
| | | | | | | |
JRO | | | | | | | | | | | | | | | | | | | | | | | | | | | | | |
Year Ended 7/31: | | | | | | | | | | | | | | | | | | | | | | | | | | | | | | | | | | | | |
2020 | | | 164,900 | | | | 3,562 | | | | — | | | | — | | | | — | | | | — | | | | 45,000 | | | | 2,798 | | | | 2.80 | |
2019 | | | 178,800 | | | | 3,951 | | | | — | | | | — | | | | — | | | | — | | | | 84,000 | | | | 2,688 | | | | 2.69 | |
2018 | | | 178,800 | | | | 4,073 | | | | — | | | | — | | | | — | | | | — | | | | 84,000 | | | | 2,771 | | | | 2.77 | |
2017 | | | 178,800 | | | | 4,071 | | | | — | | | | — | | | | — | | | | — | | | | 84,000 | | | | 2,770 | | | | 2.77 | |
2016 | | | 166,800 | | | | 4,059 | | | | — | | | | — | | | | 75,000 | | | | 279,979 | | | | — | | | | — | | | | 2.80 | |
| | | | | | | |
JSD | | | | | | | | | | | | | | | | | | | | | | | | | | | | | |
Year Ended 7/31: | | | | | | | | | | | | | | | | | | | | | | | | | | | | | | | | | | | | |
2020 | | | 8,500 | | | | 25,821 | | | | 70,000 | | | | 2,796 | | | | — | | | | — | | | | — | | | | — | | | | 2.80 | |
2019 | | | 72,000 | | | | 3,854 | | | | — | | | | — | | | | — | | | | — | | | | 35,000 | | | | 2,593 | | | | 2.59 | |
2018 | | | 72,000 | | | | 3,998 | | | | — | | | | — | | | | — | | | | — | | | | 35,000 | | | | 2,691 | | | | 2.69 | |
2017 | | | 72,000 | | | | 4,020 | | | | — | | | | — | | | | — | | | | — | | | | 35,000 | | | | 2,705 | | | | 2.71 | |
2016 | | | 64,000 | | | | 4,305 | | | | — | | | | — | | | | — | | | | — | | | | 35,000 | | | | 2,783 | | | | 2.78 | |
| | | | | | | |
JQC | | | | | | | | | | | | | | | | | | | | | | | | | | | | | |
Year Ended 7/31: | | | | | | | | | | | | | | | | | | | | | | | | | | | | | | | | | | | | |
2020 | | | 402,000 | | | | 3,320 | | | | — | | | | — | | | | — | | | | — | | | | — | | | | — | | | | — | |
2019 | | | 480,000 | | | | 3,400 | | | | — | | | | — | | | | — | | | | — | | | | — | | | | — | | | | — | |
2018 | | | 561,000 | | | | 3,205 | | | | — | | | | — | | | | — | | | | — | | | | — | | | | — | | | | — | |
2017 | | | 561,000 | | | | 3,256 | | | | — | | | | — | | | | — | | | | — | | | | — | | | | — | | | | — | |
2016 | | | 561,000 | | | | 3,238 | | | | — | | | | — | | | | — | | | | — | | | | — | | | | — | | | | — | |
106
| (a) | Beginning with the fiscal year ended July 31, 2017, the Funds are calculating Asset Coverage Per $1,000 of Borrowings as defined under the 1940 Act and not as defined for financial reporting purposes. For purposes of calculating Asset Coverage as defined under the 1940 Act, the outstanding preferred shares are excluded because they are treated as equity for regulatory purposes. The Asset Coverage amounts presented in the table above are calculated in accordance with the 1940 Act, and therefore the Asset Coverage per $1,000 of Borrowings reflects the amount of Fund total assets (less all liabilities not represented by borrowings and preferred shares) per $1,000 of borrowings alone. |
For financial reporting purposes, preferred shares are considered to be debt. For the fiscal year ended July 31, 2016, the Asset Coverage amounts per $1,000 of Borrowings reflected the amount of Fund total assets (less all liabilities not represented by borrowings and preferred shares) per $1,000 of the combined amount of borrowings and outstanding preferred shares and the Asset Coverage amounts per financial reporting purposes as follows:
| | | | | | | | |
| | | Borrowings at the End of Period | |
| | | Aggregate Amount Outstanding (000) | | | Asset Coverage Per $1,000 Share | |
NSL | | | | | | | | |
Year Ended 7/31: | | | | | |
2016 | | $ | 101,000 | | | $ | 2,788 | |
| | | | | | | | |
| | | Borrowings at the End of Period | |
| | | Aggregate Amount Outstanding (000) | | | Asset Coverage Per $1,000 Share | |
JFR | | | | | | | | |
Year Ended 7/31: | | | | | |
2016 | | $ | 240,800 | | | $ | 2,797 | |
| | | | | | | | |
| | | Borrowings at the End of Period | |
| | | Aggregate Amount Outstanding (000) | | | Asset Coverage Per $1,000 Share | |
JRO | | | | | | | | |
Year Ended 7/31: | | | | | |
2016 | | $ | 166,800 | | | $ | 2,800 | |
| | | | | | | | |
| | | Borrowings at the End of Period | |
| | | Aggregate Amount Outstanding (000) | | | Asset Coverage Per $1,000 Share | |
JSD | | | | | | | | |
Year Ended 7/31: | | | | | |
2016 | | $ | 64,000 | | | $ | 2,783 | |
See accompanying notes to financial statements.
107
Notes to Financial Statements
1. General Information
Fund Information
The funds covered in this report and their corresponding New York Stock Exchange (“NYSE”) symbols are as follows (each a “Fund” and collectively, the “Funds”):
| | • | | Nuveen Senior Income Fund (NSL) |
| | • | | Nuveen Floating Rate Income Fund (JFR) |
| | • | | Nuveen Floating Rate Income Opportunity Fund (JRO) |
| | • | | Nuveen Short Duration Credit Opportunities Fund (JSD) |
| | • | | Nuveen Credit Strategies Income Fund (JQC) |
The Funds are registered under the Investment Company Act of 1940 (the “1940 Act”), as amended, as diversified closed-end management investment companies. NSL, JFR, JRO, JSD and JQC were organized as Massachusetts business trusts on August 13, 1999, January 15, 2004, April 27, 2004, January 3, 2011 and May 17, 2003, respectively.
The end of the reporting period for the Funds is July 31, 2020, and the period covered by these Notes to Financial Statements is the fiscal year ended July 31, 2020 (the “current fiscal period”).
Investment Adviser and Sub-Adviser
The Funds’ investment adviser is Nuveen Fund Advisors, LLC (the “Adviser”), a subsidiary of Nuveen, LLC (“Nuveen”). Nuveen is the investment management arm of Teachers Insurance and Annuity Association of America (TIAA). The Adviser has overall responsibility for management of the Funds, oversees the management of the Funds’ portfolios, manages the Funds’ business affairs and provides certain clerical, bookkeeping and other administrative services, and, if necessary, asset allocation decisions. The Adviser has entered into sub-advisory agreements with Symphony Asset Management, LLC (“Symphony”), an affiliate of Nuveen, under which Symphony manages the investment portfolios of the Funds. The Adviser is responsible for overseeing the Funds’ investments in interest rate and credit default swap contracts.
Other Matters
The outbreak of the novel coronavirus (“COVID-19”) and subsequent global pandemic began significantly impacting the U.S. and global financial markets and economies during the calendar quarter ended March 31, 2020. The worldwide spread of COVID-19 has created significant uncertainty in the global economy. The duration and extent of COVID-19 over the long-term cannot be reasonably estimated at this time. The ultimate impact of COVID-19 and the extent to which COVID-19 impacts the Funds’ normal course of business, results of operations, investments, and cash flows will depend on future developments, which are highly uncertain and difficult to predict. Management continues to monitor and evaluate this situation.
2. Significant Accounting Policies
The accompanying financial statements were prepared in accordance with accounting principles generally accepted in the United States of America (“U.S. GAAP”), which may require the use of estimates made by management and the evaluation of subsequent events. Actual results may differ from those estimates. Each Fund is an investment company and follows the accounting guidance in the Financial Accounting Standards Board (“FASB”) Accounting Standards Codification 946, Financial Services – Investment Companies. The net asset value (“NAV”) for financial reporting purposes may differ from the NAV for processing security and common share transactions. The NAV for financial reporting purposes includes security and common share transactions through the date of the report. Total return is computed based on the NAV used for processing security and common share transactions. The following is a summary of the significant accounting policies consistently followed by the Funds.
Compensation
The Funds pay no compensation directly to those of its trustees who are affiliated with the Adviser or to its officers, all of whom receive remuneration for their services to the Funds from the Adviser or its affiliates. The Funds’ Board of Trustees (the “Board”) has adopted a deferred compensation plan for independent trustees that enables trustees to elect to defer receipt of all or a portion of the annual compensation they are entitled to receive from certain Nuveen-advised funds. Under the plan, deferred amounts are treated as though equal dollar amounts had been invested in shares of select Nuveen-advised funds.
Distributions to Common Shareholders
Dividends to common shareholders are recorded on the ex-dividend date. The amount, character and timing of distributions are determined in accordance with federal income tax regulations, which may differ from U.S. GAAP.
108
JQC has implemented a capital return plan where a supplemental amount is expected to be included in the Fund’s regular monthly distribution. Under this program, the Fund’s regular monthly distribution is expected to include net investment income, return of capital and potentially capital gains for tax purposes. In the event that total distributions during a calendar year exceed the Fund’s total return on NAV, the difference will reduce NAV per share. If the Fund’s total return on NAV exceeds total distributions during a calendar year, the excess will be reflected as an increase in NAV per share. The final determination of the source and character of all distributions for the fiscal year are made after the end of the fiscal year and is reflected in the financial statements contained in the annual report as of July 31 each year.
Foreign Currency Transactions and Translation
To the extent that the Funds invests in securities and/or contracts that are denominated in a currency other than U.S. dollars, the Funds will be subject to currency risk, which is the risk that an increase in the U.S. dollar relative to the foreign currency will reduce returns or portfolio value. Generally, when the U.S. dollar rises in value against a foreign currency, the Funds’ investments denominated in that currency will lose value because its currency is worth fewer U.S. dollars; the opposite effect occurs if the U.S. dollar falls in relative value. Investments and other assets and liabilities denominated in foreign currencies are converted into U.S. dollars on a spot (i.e. cash) basis at the spot rate prevailing in the foreign currency exchange market at the time of valuation. Purchases and sales of investments and income denominated in foreign currencies are translated into U.S. dollars on the respective dates of such transactions.
The books and records of the Funds are maintained in U.S. dollars. Assets, including investments, and liabilities denominated in foreign currencies are translated into U.S. dollars at the end of each day. Purchases and sales of securities, income and expenses are translated into U.S. dollars at each prevailing exchange rate on the respective dates of the transactions.
Net realized foreign currency gains and losses resulting from changes in exchange rates associated with (i) foreign currency, (ii) investments and (iii) derivatives include foreign currency gains and losses between trade date and settlement date of the transactions, foreign currency transactions, and the difference between the amounts of interest and dividends recorded on the books of the Fund and the amounts actually received are recognized as a component of “Net realized gain (loss) from investments and foreign currency” on the Statement of Operations, when applicable.
The unrealized gains and losses resulting from changes in foreign currency exchange rates and changes in foreign exchange rates associated with (i) investments and (ii) other assets and liabilities are recognized as a component of “Change in net unrealized appreciation (depreciation) of investments and foreign currency” on the Statement of Operations, when applicable. The unrealized gains and losses resulting from changes in foreign exchange rates associated with investments in derivatives are recognized as a component of the respective derivative’s related “Change in net unrealized appreciation (depreciation)” on the Statement of Operations, when applicable.
Indemnifications
Under the Funds’ organizational documents, their officers and trustees are indemnified against certain liabilities arising out of the performance of their duties to the Funds. In addition, in the normal course of business, the Funds enter into contracts that provide general indemnifications to other parties. The Funds’ maximum exposure under these arrangements is unknown as this would involve future claims that may be made against the Funds that have not yet occurred. However, the Funds have not had prior claims or losses pursuant to these contracts and expect the risk of loss to be remote.
Investments and Investment Income
Securities transactions are accounted for as of the trade date for financial reporting purposes. Trade date for senior and subordinated loans purchased in the “primary market” is considered the date on which the loan allocations are determined. Trade date for senior and subordinated loans purchased in the “secondary market” is the date on which the transaction is entered into. Realized gains and losses on securities transactions are based upon the specific identification method. Dividend income is recorded on the ex-dividend date or, for foreign securities, when information is available. Non-cash dividends received in the form of stock, if any, are recognized on the ex-dividend date and recorded at fair value. Interest income, which reflects the amortization of premiums and accretion of discounts for financial reporting purposes and is recorded on an accrual basis. Interest income also reflects payment-in-kind (“PIK”) interest, paydown gains and losses and fee income, if any. PIK interest represents income received in the form of securities in lieu of cash. Fee income consists primarily of amendment fees, when applicable. Amendment fees are earned as compensation for evaluating and accepting changes to an original senior loan agreement and are recognized when received. Fee income and amendment fees, if any, are recognized as “Fees” on the Statement of Operations.
Netting Agreements
In the ordinary course of business, the Funds may enter into transactions subject to enforceable master repurchase agreements, International Swaps and Derivative Association, Inc. (ISDA) master agreements or other similar arrangements (“netting agreements”). Generally, the right to offset in netting agreements allows each Fund to offset certain securities and derivatives with a specific counterparty, when applicable, as well as any collateral received or delivered to that counterparty based on the terms of the agreements. Generally, each Fund manages its cash collateral and securities collateral on a counterparty basis.
The Funds’ investments subject to netting agreements as of the end of the reporting period, if any, are further described in Note 4 – Portfolio Securities and Investments in Derivatives.
109
Notes to Financial Statements (continued)
New Accounting Pronouncements and Rule Issuances
FASB Accounting Standards Update (“ASU”) 2017-08 (“ASU 2017-08”) Premium Amortization on Purchased Callable Debt Securities
The FASB has issued ASU 2017-08, which shortens the premium amortization period for purchased non-contingently callable debt securities. ASU 2017- 08 specifies that the premium amortization period ends at the earliest call date, for purchased non-contingently callable debt securities. ASU 2017-08 is effective for fiscal years, and interim periods within those fiscal years, beginning after December 15, 2018. During the current fiscal period, ASU 2017-08 became effective for the Funds and it did not have a material impact on the Funds’ financial statements.
Fair Value Measurement: Disclosure Framework
During August 2018, the FASB issued ASU 2018-13 (“ASU 2018-13”), Fair Value Measurement: Disclosure Framework – Changes to the Disclosure Requirements for Fair Value Measurements. ASU 2018-13 modifies the disclosures required by Topic 820, Fair Value Measurements. The amendments in ASU 2018-13 are effective for all entities for fiscal years, and interim periods within those fiscal years, beginning after December 15, 2019. Management has early implemented this guidance and it did not have a material impact on the Funds’ financial statements.
Reference Rate Reform
In March 2020, FASB issued ASU 2020-04, Reference Rate Reform: Facilitation of the Effects of Reference Rate Reform on Financial Reporting. The main objective of the new guidance is to provide relief to companies that will be impacted by the expected change in benchmark interest rates at the end of 2021, when participating banks will no longer be required to submit London Interbank Offered Rate (LIBOR) quotes by the UK Financial Conduct Authority (FCA). The new guidance allows companies to, provided the only change to existing contracts are a change to an approved benchmark interest rate, account for modifications as a continuance of the existing contract without additional analysis. For new and existing contracts, the Funds may elect to apply the amendments as of March 12, 2020 through December 31, 2022. Management has not yet elected to apply the amendments, but is currently assessing the impact of the ASU’s adoption to the Fund’s financial statements and various filings.
3. Investment Valuation and Fair Value Measurements
The fair valuation input levels as described below are for fair value measurement purposes.
The Funds’ investments in securities are recorded at their estimated fair value. Fair value is defined as the price that would be received upon selling an investment or transferring a liability in an orderly transaction to an independent buyer in the principal or most advantageous market for the investment. A three-tier hierarchy is used to maximize the use of observable market data and minimize the use of unobservable inputs and to establish classification of fair value measurements for disclosure purposes. Observable inputs reflect the assumptions market participants would use in pricing the asset or liability. Observable inputs are based on market data obtained from sources independent of the reporting entity. Unobservable inputs reflect the reporting entity’s own assumptions about the assumptions market participants would use in pricing the asset or liability. Unobservable inputs are based on the best information available in the circumstances. The following is a summary of the three-tiered hierarchy of valuation input levels.
| | |
| Level 1 – | | Inputs are unadjusted and prices are determined using quoted prices in active markets for identical securities. |
| Level 2 – | | Prices are determined using other significant observable inputs (including quoted prices for similar securities, interest rates, credit spreads, etc.). |
| Level 3 – | | Prices are determined using significant unobservable inputs (including management’s assumptions in determining the fair value of investments). |
Common stocks and other equity-type securities are valued at the last sales price on the securities exchange on which such securities are primarily traded and are generally classified as Level 1. Securities primarily traded on the Nasdaq National Market (“Nasdaq”) are valued at the Nasdaq Official Closing Price and are generally classified as Level 1. However, securities traded on a securities exchange or Nasdaq for which there were no transactions on a given day or securities not listed on a securities exchange or Nasdaq are valued at the quoted bid price and are generally classified as Level 2.
Prices of fixed-income securities are provided by an independent pricing service (“pricing service”) approved by the Board. The pricing service establishes a security’s fair value using methods that may include consideration of the following: yields or prices of investments of comparable quality, type of issue, coupon, maturity and rating, market quotes or indications of value from security dealers, evaluations of anticipated cash flows or collateral, general market conditions and other information and analysis, including the obligor’s credit characteristics considered relevant. These securities are generally classified as Level 2. In pricing certain securities, particularly less liquid and lower quality securities, the pricing service may consider information about a security, its issuer or market activity provided by the Adviser. These securities are generally classified as Level 2 or Level 3 depending on the observability of the significant inputs.
Like most fixed-income securities, the senior and subordinated loans in which the Funds invest are not listed on an organized exchange. The secondary market of such investments may be less liquid relative to markets for other fixed-income securities. Consequently, the value of senior and subordinated loans, determined as described above, may differ significantly from the value that would have been determined had there been an active market for that senior loan. These securities are generally classified as Level 2.
110
Prices of swap contracts are also provided by a pricing service approved by the Board using the same methods as described above and are generally classified as Level 2.
Investments in investment companies are valued at their respective NAV’s on the valuation date and are generally classified as Level 1.
Investments initially valued in currencies other than the U.S. dollar are converted to the U.S. dollar using exchange rates obtained from pricing services. As a result, the NAV of the Funds’ common shares may be affected by changes in the value of currencies in relation to the U.S. dollar. The value of securities traded in markets outside the United States or denominated in currencies other than the U.S. dollar may be affected significantly on a day that the NYSE is closed and an investor is not able to purchase, redeem or exchange shares. If significant market events occur between the time of determination of the closing price of a foreign security on an exchange and the time that the Funds’ NAV is determined, or if under the Funds’ procedures, the closing price of a foreign security is not deemed to be reliable, the security would be valued at fair value as determined in accordance with procedures established in good faith by the Board. These securities are generally classified as Level 2 or Level 3 depending on the observability of the significant inputs.
Certain securities may not be able to be priced by the pre-established pricing methods as described above. Such securities may be valued by the Board and/or its appointee at fair value. These securities generally include, but are not limited to, restricted securities (securities which may not be publicly sold without registration under the Securities Act of 1933, as amended) for which a pricing service is unable to provide a market price; securities whose trading has been formally suspended; debt securities that have gone into default and for which there is no current market quotation; a security whose market price is not available from a pre-established pricing source; a security with respect to which an event has occurred that is likely to materially affect the value of the security after the market has closed but before the calculation of a Fund’s NAV (as may be the case in non-U.S. markets on which the security is primarily traded) or make it difficult or impossible to obtain a reliable market quotation; and a security whose price, as provided by the pricing service, is not deemed to reflect the security’s fair value. As a general principle, the fair value of a security would appear to be the amount that the owner might reasonably expect to receive for it in a current sale. A variety of factors may be considered in determining the fair value of such securities, which may include consideration of the following: yields or prices of investments of comparable quality, type of issue, coupon, maturity and rating, market quotes or indications of value from security dealers, evaluations of anticipated cash flows or collateral, general market conditions and other information and analysis, including the obligor’s credit characteristics considered relevant. These securities are generally classified as Level 2 or Level 3 depending on the observability of the significant inputs. Regardless of the method employed to value a particular security, all valuations are subject to review by the Board and/or its appointee.
The inputs or methodologies used for valuing securities are not an indication of the risks associated with investing in those securities. The following is a summary of each Fund’s fair value measurements as of the end of the reporting period:
| | | | | | | | | | | | | | | | |
| NSL | | Level 1 | | | Level 2 | | | Level 3 | | | Total | |
Long-Term Investments*: | | | | | | | | | | | | | | | | |
Variable Rate Senior Loan Interests | | $ | — | | | $ | 286,822,787 | | | $ | — | | | $ | 286,822,787 | |
Corporate Bonds | | | — | | | | 34,252,809 | | | | — | | | | 34,252,809 | |
Common Stocks** | | | 2,757,607 | | | | 1,458,263 | | | | 73,596 | | | | 4,289,466 | |
Warrants** | | | — | | | | 105,055 | | | | ��� | | | | 105,055 | |
Convertible Preferred Securities** | | | — | | | | 96,451 | | | | — | | | | 96,451 | |
Common Stock Rights** | | | — | | | | 424 | | | | — | | | | 424 | |
| | | | |
Short-Term Investments: | | | | | | | | | | | | | | | | |
Investment Companies | | | 15,432,067 | | | | — | | | | — | | | | 15,432,067 | |
Total | | $ | 18,189,674 | | | $ | 322,735,789 | | | $ | 73,596 | | | $ | 340,999,059 | |
| | | | |
| JFR | | | | | | | | | | | | |
Long-Term Investments*: | | | | | | | | | | | | | | | | |
Variable Rate Senior Loan Interests | | $ | — | | | $ | 707,939,560 | | | $ | — | | | $ | 707,939,560 | |
Corporate Bonds | | | — | | | | 86,273,330 | | | | — | | | | 86,273,330 | |
Common Stocks** | | | 6,021,978 | | | | 4,324,925 | | | | 142,035 | | | | 10,488,938 | |
Investment Companies | | | 9,616,416 | | | | — | | | | — | | | | 9,616,416 | |
Asset-Backed Securities | | | — | | | | 3,271,288 | | | | — | | | | 3,271,288 | |
Warrants** | | | — | | | | 208,518 | | | | — | | | | 208,518 | |
Convertible Preferred Securities** | | | — | | | | 192,902 | | | | — | | | | 192,902 | |
Common Stock Rights** | | | — | | | | 784 | | | | — | | | | 784 | |
| | | | |
Short-Term Investments: | | | | | | | | | | | | | | | | |
Investment Companies | | | 44,809,031 | | | | — | | | | — | | | | 44,809,031 | |
| | | | |
Investments in Derivatives: | | | | | | | | | | | | | | | | |
Interest Rate Swaps*** | | | — | | | | 712,604 | | | | — | | | | 712,604 | |
Total | | $ | 60,447,425 | | | $ | 802,923,911 | | | $ | 142,035 | | | $ | 863,513,371 | |
111
Notes to Financial Statements (continued)
| | | | | | | | | | | | | | | | |
| JRO | | Level 1 | | | Level 2 | | | Level 3 | | | Total | |
Long-Term Investments*: | | | | | | | | | | | | | | | | |
Variable Rate Senior Loan Interests | | $ | — | | | $ | 500,254,711 | | | $ | — | | | $ | 500,254,711 | |
Corporate Bonds | | | — | | | | 59,684,687 | | | | — | | | | 59,684,687 | |
Common Stocks** | | | 4,785,258 | | | | 3,436,769 | | | | 104,094 | | | | 8,326,121 | |
Asset-Backed Securities | | | — | | | | 2,105,621 | | | | — | | | | 2,105,621 | |
Warrants** | | | — | | | | 140,041 | | | | — | | | | 140,041 | |
Convertible Preferred Securities** | | | — | | | | 128,593 | | | | — | | | | 128,593 | |
Common Stock Rights** | | | — | | | | 809 | | | | — | | | | 809 | |
| | | | |
Short-Term Investments: | | | | | | | | | | | | | | | | |
Investment Companies | | | 33,358,072 | | | | — | | | | — | | | | 33,358,072 | |
| | | | |
Investments in Derivatives: | | | | | | | | | | | | | | | | |
Interest Rate Swaps*** | | | — | | | | 583,039 | | | | — | | | | 583,039 | |
Total | | $ | 38,143,330 | | | $ | 566,334,270 | | | $ | 104,094 | | | $ | 604,581,694 | |
| | | | |
| JSD | | | | | | | | | | | | |
Long-Term Investments*: | | | | | | | | | | | | | | | | |
Variable Rate Senior Loan Interests | | $ | — | | | $ | 189,250,128 | | | $ | — | | | $ | 189,250,128 | |
Corporate Bonds | | | — | | | | 22,951,680 | | | | — | | | | 22,951,680 | |
Common Stocks** | | | 1,981,837 | | | | 632,874 | | | | 25,290 | | | | 2,640,001 | |
Warrants** | | | — | | | | 103,073 | | | | — | | | | 103,073 | |
Convertible Preferred Securities** | | | — | | | | 96,450 | | | | — | | | | 96,450 | |
Common Stock Rights** | | | — | | | | 437 | | | | — | | | | 437 | |
| | | | |
Short-Term Investments: | | | | | | | | | | | | | | | | |
Investment Companies | | | 9,059,821 | | | | — | | | | — | | | | 9,059,821 | |
Total | | $ | 11,041,658 | | | $ | 213,034,642 | | | $ | 25,290 | | | $ | 224,101,590 | |
| | | | |
| JQC | | | | | | | | | | | | |
Long-Term Investments*: | | | | | | | | | | | | | | | | |
Variable Rate Senior Loan Interests | | $ | — | | | $ | 1,157,911,450 | | | $ | — | | | $ | 1,157,911,450 | |
Corporate Bonds | | | — | | | | 269,228,137 | | | | — | | | | 269,228,137 | |
Common Stocks** | | | 3,117,879 | | | | 2,105,804 | | | | 436,055 | | | | 5,659,738 | |
Convertible Bonds | | | — | | | | 4,055,626 | | | | — | | | | 4,055,626 | |
Warrants** | | | — | | | | 22,634 | | | | 5 | | | | 22,639 | |
Common Stock Rights** | | | — | | | | 2,760 | | | | — | | | | 2,760 | |
| | | | |
Short-Term Investments: | | | | | | | | | | | | | | | | |
Investment Companies | | | 36,609,636 | | | | — | | | | — | | | | 36,609,636 | |
Total | | $ | 39,727,515 | | | $ | 1,433,326,411 | | | $ | 436,060 | | | $ | 1,473,489,986 | |
| * | Refer to the Fund’s Portfolio of Investments for industry classifications, where applicable. |
| ** | Refer to the Fund’s Portfolio of Investments for securities classified as Level 2 and/or Level 3. |
| *** | Represents net unrealized appreciation (depreciation) as reported in the Fund’s Portfolio of Investments. |
4. Portfolio Securities and Investments in Derivatives
Portfolio Securities
Unfunded Commitments
Pursuant to the terms of certain of the variable rate senior loan agreements, the Funds may have unfunded senior loan commitments. Each Fund will maintain with its custodian, cash, liquid securities and/or liquid senior loans having an aggregate value at least equal to the amount of unfunded senior loan commitments. As of the end of the reporting period, the Funds’ outstanding unfunded senior loan commitments were as follows:
| | | | | | | | | | | | | | | | |
| | | NSL | | | JFR | | | JRO | | | JSD | |
Outstanding unfunded senior loan commitments | | $ | 780,201 | | | $ | 1,830,227 | | | $ | 1,313,001 | | | $ | 654,173 | |
Participation Commitments
With respect to the senior loans held in each Fund’s portfolio, the Funds may: 1) invest in assignments; 2) act as a participant in primary lending syndicates; or 3) invest in participations. If a Fund purchases a participation of a senior loan interest, the Fund would typically enter into a contractual
112
agreement with the lender or other third party selling the participation, rather than directly with the borrower. As such, the Fund not only assumes the credit risk of the borrower, but also that of the selling participant or other persons interpositioned between the Fund and the borrower. As of the end of the reporting period, the Funds had no such outstanding participation commitments.
Zero Coupon Securities
A zero coupon security does not pay a regular interest coupon to its holders during the life of the security. Income to the holder of the security comes from accretion of the difference between the original purchase price of the security at issuance and the par value of the security at maturity and is effectively paid at maturity. The market prices of zero coupon securities generally are more volatile than the market prices of securities that pay interest periodically.
Investment Transactions
Long-term purchases and sales (including maturities but excluding derivative transactions, where applicable) during the current fiscal period were as follows:
| | | | | | | | | | | | | | | | | | | | |
| | | NSL | | | JFR | | | JRO | | | JSD | | | JQC | |
Purchases | | $ | 156,803,105 | | | $ | 394,774,833 | | | $ | 275,705,611 | | | $ | 99,376,685 | | | $ | 843,730,399 | |
Sales and maturities | | | 199,376,959 | | | | 476,620,073 | | | | 333,505,772 | | | | 128,228,923 | | | | 1,090,072,118 | |
The Funds may purchase securities on a when-issued or delayed-delivery basis. Securities purchased on a when-issued or delayed-delivery basis may have extended settlement periods; interest income is not accrued until settlement date. Any securities so purchased are subject to market fluctuation during this period. The Funds have earmarked securities in their portfolios with a current value at least equal to the amount of the when-issued/delayed-delivery purchase commitments. If a Fund has outstanding when-issued/delayed-delivery purchases commitments as of the end of the reporting period, such amounts are recognized on the Statement of Assets and Liabilities.
Investments in Derivatives
Each Fund is authorized to invest in certain derivative instruments, such as futures, options and swap contracts. Each Fund limits its investments in futures, options on futures and swap contracts to the extent necessary for the Adviser to claim the exclusion from registration by the Commodity Futures Trading Commission as a commodity pool operator with respect to the Fund. The Funds record derivative instruments at fair value, with changes in fair value recognized on the Statement of Operations, when applicable. Even though the Funds’ investments in derivatives may represent economic hedges, they are not considered to be hedge transactions for financial reporting purposes.
Interest Rate Swap Contracts
Interest rate swap contracts involve a Fund’s agreement with the counterparty to pay or receive a fixed rate payment in exchange for the counterparty receiving or paying a variable rate payment. Forward interest rate swap contracts involve a Fund’s agreement with a counterparty to pay, in the future, a fixed or variable rate payment in exchange for the counterparty paying the Fund a variable or fixed rate payment, the accruals for which would begin at a specified date in the future (the “effective date”).
The amount of the payment obligation for an interest rate swap is based on the notional amount and the termination date of the contract. Interest rate swap contracts do not involve the delivery of securities or other underlying assets or principal. Accordingly, the risk of loss with respect to the swap counterparty on such transactions is limited to the net amount of interest payments that the Fund is to receive.
Interest rate swap contracts are valued daily. Upon entering into an interest rate swap contract (and beginning on the effective date for a forward interest rate swap contract), the Fund accrues the fixed rate payment expected to be paid or received and the variable rate payment expected to be received or paid on the interest rate swap contracts on a daily basis, and recognizes the daily change in the fair value of the Fund’s contractual rights and obligations under the contracts. For an over-the-counter (“OTC”) swap that is not cleared through a clearing house (“OTC Uncleared”), the amount recorded on these transactions is recognized on the Statement of Assets and Liabilities as a component of “Unrealized appreciation or depreciation on interest rate swaps.”
Upon the execution of an OTC swap cleared through a clearing house (“OTC Cleared”), the Fund is obligated to deposit cash or eligible securities, also known as “initial margin,” into an account at its clearing broker equal to a specified percentage of the contract amount. Cash deposited by the Fund to cover initial margin requirements on open swap contracts, if any, is recognized as a component of “Cash collateral at brokers for investment in swaps” on the Statement of Assets and Liabilities. Investments in OTC Cleared swaps obligate the Fund and the clearing broker to settle monies on a daily basis representing changes in the prior day’s “mark-to-market” of the swap contract. If the Fund has unrealized appreciation, the clearing broker will credit the Fund’s account with an amount equal to the appreciation. Conversely, if the Fund has unrealized depreciation, the clearing broker will debit the Fund’s account with an amount equal to the depreciation. These daily cash settlements are also known as “variation margin.” Variation margin for OTC Cleared swaps is recognized as a receivable and/or payable for “Variation margin on swap contracts” on the Statement of Assets and Liabilities. Upon the execution of an OTC Uncleared swap, neither the Fund nor the counterparty is required to deposit initial margin as the trades are recorded bilaterally
113
Notes to Financial Statements (continued)
between both parties to the swap contract, and the terms of the variation margin are subject to a predetermined threshold negotiated by the Fund and the counterparty. Variation margin for OTC Uncleared swaps is recognized as a component of “Unrealized appreciation or depreciation on interest rate swaps” as described in the preceding paragraph.
The net amount of periodic payments settled in cash are recognized as a component of “Net realized gain (loss) from swaps” on the Statement of Operations, in addition to the net realized gain or loss recorded upon the termination of the swap contract. For tax purposes, payments expected to be received or paid on the swap contracts are treated as ordinary income or expense, respectively. Changes in the value of the swap contracts during the fiscal period are recognized as a component of “Change in net unrealized appreciation (depreciation) of swaps” on the Statement of Operations. In certain instances, payments are made or received upon entering into the swap contract to compensate for differences between the stated terms of the swap agreements and prevailing market conditions (credit spreads, currency exchange rates, interest rates, and other relevant factors). Payments received or made at the beginning of the measurement period, if any, are recognized as “Interest rate swaps premiums received and/or paid” on the Statement of Assets and Liabilities.
During the current fiscal period, NSL, JFR and JRO used cancellable interest rate swaps in which each Fund received payments based upon pre-determined fixed rates and paid one-month LIBOR plus a fixed spread. After a non-callable period, the swap counterparty owns the right on future monthly dates to terminate the swap at par. The purpose of the cancellable interest rate swap is to convert a fixed rate Term Preferred Share issuance to floating rate, and the cancellation dates of the swap correspond to dates on which the Funds can call the Term Preferred Share issue.
The average notional amount of interest rate swap contracts outstanding during the current fiscal period was as follows:
| | | | | | | | | | | | |
| | | NSL | | | JFR | | | JRO | |
Average notional amount of interest rate swap contracts outstanding* | | $ | 17,200,000 | | | $ | 88,000,000 | | | $ | 63,200,000 | |
| * | The average notional amount is calculated based on the outstanding notional at the beginning of the current fiscal period and at the end of each fiscal quarter within the current fiscal period. |
Credit Default Swap Contracts
A Fund may enter into a credit default swap contract to seek to maintain a total return on a particular investment or portion of its portfolio, or to take an active long or short position with respect to the likelihood of a particular issuer’s default. Credit default swap contracts involve one party making a stream of payments to another party in exchange for the right to receive a specified return if/when there is a credit event by a third party. Generally, a credit event means bankruptcy, failure to pay, or restructuring. The specific credit events applicable for each credit default swap are stated in the terms of the particular swap agreement. When a Fund has bought (sold) protection in a credit default swap upon occurrence of a specific credit event with respect to the underlying referenced entity, the Fund will either (i) deliver (receive) that security, or an equivalent amount of cash, from the counterparty in exchange for receipt (payment) of the notional amount to the counterparty, or (ii) receive (pay) a net settlement amount of the credit default swap contract less the recovery value of the referenced obligation or underlying securities comprising the referenced index. The difference between the value of the security received (delivered) and the notional amount delivered (received) is recorded as a realized gain or loss. Payments paid (received) at the beginning of the measurement period are recognized as a component of “Credit default swaps premiums paid and/or received” on the Statement of Assets and Liabilities, when applicable.
Credit default swap contracts are valued daily. Changes in the value of a credit default swap during the fiscal period are recognized as a component of “Change in net unrealized appreciation (depreciation) of swaps” and realized gains and losses are recognized as a component of “Net realized gain (loss) from swaps” on the Statement of Operations.
For OTC swaps not cleared through a clearing house (“OTC Uncleared”), the daily change in the market value of the swap contract, along with any daily interest fees accrued, are recognized as components of “Unrealized appreciation or depreciation on credit default swaps” on the Statement of Assets and Liabilities.
Upon the execution of an OTC swap cleared through a clearing house (“OTC Cleared”), a Fund is obligated to deposit cash or eligible securities, also known as “initial margin,” into an account at its clearing broker equal to a specified percentage of the contract amount. Cash held by the broker to cover initial margin requirements on open swap contracts, if any, is recognized as “Cash collateral at brokers for investments in swaps” on the Statement of Assets and Liabilities. Investments in OTC Cleared swaps obligate a Fund and the clearing broker to settle monies on a daily basis representing changes in the prior day’s “mark-to-market” of the swap. If a Fund has unrealized appreciation, the clearing broker would credit the Fund’s account with an amount equal to the appreciation and conversely if a Fund has unrealized depreciation, the clearing broker will debit the Fund’s account with an amount equal to the depreciation. These daily cash settlements are also known as “variation margin.” Variation margin for OTC Cleared swaps is recognized as a receivable and/or payable for “Variation margin on swap contracts” on the Statement of Assets and Liabilities. Upon the execution of an OTC Uncleared swap, neither the Fund nor the counterparty is required to deposit initial margin as the trades are recorded bilaterally between both parties to the swap contract, and the terms of the variation margin are subject to a predetermined threshold negotiated by the Fund and the counterparty. Variation margin for OTC Uncleared swaps is recognized as a component of “Unrealized appreciation or depreciation on credit default swaps” as described in the
114
preceding paragraph. The maximum potential amount of future payments the Fund could incur as a buyer or seller of protection in a credit default swap contract is limited to the notional amount of the contract. The maximum potential amount would be offset by the recovery value, if any, of the respective referenced entity.
During the current fiscal period, JSD invested in credit default swap contracts to provide a benefit if particular bonds’ credit quality worsened.
The average notional amount of credit default swap contracts outstanding during the current fiscal period was as follows:
| | | | |
| | | JSD | |
Average notional amount of credit default swap contracts outstanding* | | $ | 3,000,000 | |
| * | The average notional amount is calculated based on the outstanding notional at the beginning of the current fiscal period and at the end of each fiscal quarter within the current fiscal period. |
The following table presents the fair value of all swap contracts held by the Funds as of the end of the reporting period, the location of these instruments on the Statement of Assets and Liabilities and the primary underlying risk exposure.
| | | | | | | | | | | | | | | | | | |
| | | | | Location on the Statement of Assets and Liabilities | |
Underlying
Risk Exposure | | Derivative
Instrument | | Asset Derivatives | | | | | | (Liability) Derivatives | |
| | Location | | Value | | | | | | Location | | Value | |
| JFR | | | | | | | | | | | | | | | | | | |
| Interest rate | | Swaps (OTC Uncleared) | | Unrealized appreciation on interest rate swaps | | $ | 712,604 | | | | | | | — | | $ | — | |
| JRO | | | | | | | | | | | | | | | | | | |
| Interest rate | | Swaps (OTC Uncleared) | | Unrealized appreciation on interest rate swaps | | $ | 583,039 | | | | | | | — | | $ | — | |
The following table presents the swap contracts subject to netting agreements and the collateral delivered related to those swap contracts as of end of the reporting period.
| | | | | | | | | | | | | | | | | | | | | | |
| Fund | | Counterparty | | Gross
Unrealized
Appreciation on
Interest Rate
Swaps** | | | Gross
Unrealized
(Depreciation) on
Interest Rate
Swaps** | | | Net
Unrealized
Appreciation
(Depreciation) on
Interest Rate
Swaps | | | Collateral
Pledged
to (from)
Counterparty | | | Net
Exposure | |
| JFR | | Morgan Stanley Capital Services LLC | | $ | 712,604 | | | $ | — | | | $ | 712,604 | | | $ | (559,858 | ) | | $ | 152,746 | |
| JRO | | Morgan Stanley Capital Services LLC | | | 583,039 | | | | — | | | | 583,039 | | | | (583,039 | ) | | | — | |
| ** | Represents gross unrealized appreciation (depreciation) for the counterparty as reported in the Fund’s Portfolio of Investments. |
The following table presents the amount of net realized gain (loss) and change in net unrealized appreciation (depreciation) recognized on swap contracts on the Statement of Operations during the current fiscal period, and the primary underlying risk exposure.
| | | | | | | | | | | | |
| Fund | | Underlying
Risk Exposure | | Derivative
Instrument | | Net Realized
Gain (Loss) from
Swaps | | | Change in Net
Unrealized
Appreciation
(Depreciation) of
Swaps | |
| NSL | | Interest rate | | Swaps | | $ | (147,276 | ) | | $ | 167,345 | |
| JFR | | Interest rate | | Swaps | | $ | 667,402 | | | $ | 204,383 | |
| JRO | | Interest rate | | Swaps | | $ | 456,353 | | | $ | 264,075 | |
| JSD | | Credit | | Swaps | | $ | 521,533 | | | $ | 69,441 | |
Market and Counterparty Credit Risk
In the normal course of business each Fund may invest in financial instruments and enter into financial transactions where risk of potential loss exists due to changes in the market (market risk) or failure of the other party to the transaction to perform (counterparty credit risk). The potential loss could exceed the value of the financial assets recorded on the financial statements. Financial assets, which potentially expose each Fund to counterparty credit risk, consist principally of cash due from counterparties on forward, option and swap transactions, when applicable. The extent of each Fund’s exposure to counterparty credit risk in respect to these financial assets approximates their carrying value as recorded on the Statement of Assets and Liabilities.
115
Notes to Financial Statements (continued)
Each Fund helps manage counterparty credit risk by entering into agreements only with counterparties the Adviser believes have the financial resources to honor their obligations and by having the Adviser monitor the financial stability of the counterparties. Additionally, counterparties may be required to pledge collateral daily (based on the daily valuation of the financial asset) on behalf of each Fund with a value approximately equal to the amount of any unrealized gain above a pre-determined threshold. Reciprocally, when each Fund has an unrealized loss, the Funds have instructed the custodian to pledge assets of the Funds as collateral with a value approximately equal to the amount of the unrealized loss above a pre-determined threshold. Collateral pledges are monitored and subsequently adjusted if and when the valuations fluctuate, either up or down, by at least the pre-determined threshold amount.
5. Fund Shares
Common Shares
Common Shares Equity Shelf Programs and Offering Costs
The following Funds have each filed registration statements with the Securities and Exchange Commission (“SEC”) authorizing each Fund to issue additional common shares through one or more equity shelf program (“Shelf Offering”), which became effective with the SEC during prior fiscal periods.
Under these Shelf Offerings, the Funds, subject to market conditions, may raise additional equity capital by issuing additional common shares from time to time in varying amounts and by different offering methods at a net price at or above each Fund’s NAV per common share. In the event a Fund’s Shelf Offering registration statement is no longer current, the Fund may not issue additional common shares until a post-effective amendment to the registration statement has been filed with the SEC.
Additional authorized common shares, common shares sold and offering proceeds, net of offering costs under each Fund’s Shelf Offering during the Fund’s current and prior fiscal period were as follows:
| | | | | | | | | | | | | | | | |
| | | JFR | | | JRO | |
| | | Year Ended
7/31/20 | | | Year Ended
7/31/19* | | | Year Ended
7/31/20 | | | Year Ended
7/31/19* | |
Additional authorized common shares | | | — | | | | 12,900,000 | | | | — | | | | 8,500,000 | |
Common shares sold | | | — | | | | — | | | | — | | | | — | |
Offering proceeds, net of offering costs | | $ | — | | | $ | — | | | $ | — | | | $ | — | |
| * | Represent additional authorized common shares for the period August 1, 2018 through November 30, 2018. |
Costs incurred by the Funds in connection with their initial shelf registrations were recorded as a prepaid expense and recognized as a component of “Deferred offering costs” on the Statement of Assets and Liabilities. These costs are amortized pro rata as shares are sold and are recognized as a component of “Proceeds from shelf offering, net of offering costs” on the Statement of Changes in Net Assets. Any deferred offering costs remaining one year after effectiveness of the initial shelf registration will be expensed. Costs incurred by the Funds to keep the shelf registration current are expensed as incurred and recognized as a component of “Other expenses” on the Statement of Operations.
Common Share Transactions
Transactions in common shares during the Funds’ current and prior fiscal period, where applicable, were as follows:
| | | | | | | | | | | | | | | | |
| | | NSL | | | JRO | |
| | | Year Ended 7/31/20 | | | Year Ended
7/31/19 | | | Year Ended
7/31/20 | | | Year Ended
7/31/19 | |
Common shares repurchased and retired | | | — | | | | (10,400 | ) | | | — | | | | (20,000 | ) |
Weighted average common share: | | | | | | | | | | | | | | | | |
Price per share repurchased and retired | | | — | | | $ | 5.41 | | | | — | | | $ | 8.82 | |
Discount per share repurchased and retired | | | — | | | | 15.29 | % | | | — | | | | 16.68 | % |
| | | | | | | | | | | | | | | | |
| | |
| | | JSD | | | JQC | |
| | | Year Ended
7/31/20 | | | Year Ended
7/31/19 | | | Year Ended
7/31/20 | | | Year Ended
7/31/19 | |
Common shares repurchased and retired | | | (10,000 | ) | | | — | | | | — | | | | (157,700 | ) |
Weighted average common share: | | | | | | | | | | | | | | | | |
Price per share repurchased and retired | | $ | 11.56 | | | | — | | | | — | | | $ | 7.43 | |
Discount per share repurchased and retired | | | 17.15 | % | | | — | | | | — | | | | 16.16 | % |
116
Preferred Shares
Taxable Fund Preferred Shares
JSD has issued and has outstanding Taxable Fund Preferred (“TFP”) Shares, with a $1,000 liquidation preference per share. These TFP Shares were issued via private placement and are not publicly available.
The Fund is obligated to redeem its TFP Shares by the date as specified in its offering documents (“Term Redemption Date”), unless earlier redeemed by the Fund. TFP Shares are initially issued in a pre-specified mode, however, TFP Shares can be subsequently designated as an alternative mode at a later date at the discretion of the Fund. The modes within TFP Shares detail the dividend mechanics and are described as follows. At a subsequent date, the Fund may establish additional mode structures with the TFP Share.
| | • | | Variable Rate Remarketed Mode (“VRRM”) – Dividends for TFP Shares within this mode will be established by a remarketing agent; therefore, the market value of the TFP Shares is expected to approximate its liquidation preference. Shareholders have the ability to request a bestefforts tender of its shares upon seven days notice. If the remarketing agent is unable to identify an alternative purchaser, the shares will be retained by the shareholder requesting tender and the subsequent dividend rate will increase to its step-up dividend rate. If after one consecutive year of unsuccessful remarketing attempts, the Fund will be required to designate an alternative mode or redeem the shares. |
The Fund will pay a remarketing fee on the aggregate principal amount of all TFP shares while designated in VRRM. Payments made by the Fund to the remarketing agent are recognized as “Remarketing fees” on the Statement of Operations.
| | • | | Variable Rate Mode (“VRM”) – Dividends for TFP Shares designated in this mode are based upon a short-term index plus an additional fixed “spread” amount established at the time of issuance or renewal / conversion of its mode. At the end of the period of the mode, the Fund will be required to either extend the term of the mode, designate an alternative mode or redeem the TFP Shares. |
The fair value of TFP Shares while in VRM are expected to approximate their liquidation preference so long as the fixed “spread” on the shares remains roughly in line with the “spread’ being demanded by investors on instruments having similar terms in the current market. In current market conditions, the Adviser has determined that the fair value of the shares are approximately their liquidation preference, but their fair value could vary if market conditions change materially.
| | • | | Variable Rate Demand Mode (“VRDM”) – Dividends for TFP Shares designated in this mode will be established by a remarketing agent; therefore, the market value of the TFP Shares is expected to approximate its liquidation preference. While in this mode, shares will have an unconditional liquidity feature that enable its shareholders to require a liquidity provider, which the Fund has entered into a contractual agreement, to purchase shares in the event that the shares are not able to be successfully remarketed. In the event that shares within this mode are unable to be successfully remarketed and are purchased by the liquidity provider, the dividend rate will be the maximum rate which is designed to escalate according to a specified schedule in order to enhance the remarketing agent’s ability to successfully remarket the shares. The Fund is required to redeem any shares that are still owned by a liquidity provider after six months of continuous, unsuccessful remarketing. |
The Fund will pay a liquidity and remarketing fee on the aggregate principal amount of all TFP Shares while within VRDM. Payments made by the Fund to the liquidity provider and remarketing agent are recognized as “Liquidity fees” and “Remarketing fees”, respectively, on the Statement of Operations.
For financial reporting purposes, the liquidation preference of TFP Shares is recorded as a liability and is recognized as a component of “Taxable Fund Preferred (“TFP”) Shares, net of deferred offering costs” on the Statement of Assets and Liabilities. Dividends on the TFP shares are treated as interest payments for financial reporting purposes. Unpaid dividends on TFP shares are recognized as a component on “Interest payable” on the Statement of Assets and Liabilities. Dividends accrued on TFP Shares are recognized as a component of “Interest expense and amortization of offering costs” on the Statement of Operations.
Subject to certain conditions, TFP Shares may be redeemed, in whole or in part, at any time at the option of the Fund. The Fund may also be required to redeem certain TFP shares if the Fund fails to maintain certain asset coverage requirements and such failures are not cured by the applicable cure date. The redemption price per share in all circumstances is equal to the liquidation preference per share plus any accumulated but unpaid dividends.
JSD incurred offering costs of $514,894 in connection with its offering of TFP Shares, which were recorded as a deferred charge and are being amortized over the life of the shares. These offering costs are recognized as a component of “Taxable Fund Preferred (“TFP”) Shares, net of deferred offering costs” on the Statement of Assets and Liabilities and “Interest expense and amortization of offering costs” on the Statement of Operations.
In conjunction with JSD’s redemption of Series A TFP Shares, the deferred offering costs of $142,817, was expensed during the current fiscal period as the redemptions were deemed on extinguishment of debt.
117
Notes to Financial Statements (continued)
As of the end of the reporting period, details of the Fund’s TFP Shares outstanding were as follows:
| | | | | | | | | | | | | | | | | | | | | | |
| Fund | | Series | | Shares
Outstanding | | | Liquidation
Preference | | | Liquidation
Preference,
net of deferred
offering costs | | | Term
Redemption Date | | | Mode | |
| JSD | | A | | | 70,000 | | | $ | 70,000,000 | | | $ | 69,657,866 | | | | November 1, 2029 | | | | VRDM | |
The average liquidation preference of TFP Shares outstanding and annualized dividend rate for the Fund during the current fiscal period were as follows:
| | | | |
| | | JSD* | |
Average liquidation preference of TFP Shares outstanding | | $ | 87,212,766 | |
Annualized dividend rate | | | 1.85 | % |
| * | For the period October 24, 2019 (first issuance of shares) through July 31, 2020. |
Term Preferred Shares
The following Funds have issued and have outstanding Term Preferred Shares (“Term Preferred”), with a $1,000 liquidation preference per share.
On October 29, 2019, JSD redeemed all of its outstanding Series 2020 Term Preferred. The Fund’s Term Preferred were redeemed at their $1,000 liquidation preference per share, plus additional amount representing the final accumulated distribution amounts owed, using proceeds from its issuance of TFP (as described above in Taxable Fund Preferred Shares).
As of the end of the reporting, NSL, JFR and JRO had $32,823,464, $89,337,109 and $44,596,238 Term Preferred at liquidation preference, net of deferred offering costs, respectively. Further details of the Funds’ Term Preferred outstanding as of the end of the reporting period, were as follows:
| | | | | | | | | | | | |
| Fund | | Series | | | Shares
Outstanding | | | Liquidation
Preference | |
NSL | | | 2021 | | | | 33,000 | | | $ | 33,000,000 | |
JFR | | | 2024 | | | | 35,000 | | | | 35,000,000 | |
| | | | 2027 | | | | 55,000 | | | | 55,000,000 | |
JRO | | | 2027 | | | | 45,000 | | | | 45,000,000 | |
Each Fund is obligated to redeem its Term Preferred by the date as specified in its offering document (“Term Redemption Date”), unless earlier redeemed or repurchased by the Fund. The Term Preferred are subject to redemption at the option of each Fund, subject to payment of a premium for approximately one year following the date of issuance (“Optional Redemption Premium Expiration Date”), and at liquidation preference per share plus accumulated but unpaid dividends. Term Preferred are subject to mandatory redemption in certain circumstances. Each Fund may be obligated to redeem a certain amount of the Term Preferred if the Fund fails to maintain certain asset coverage and leverage ratio requirements and such failures are not cured by the applicable cure date. The redemption price per share is equal to the sum of the liquidation preference per share (plus any premium) plus any accumulated but unpaid dividends. The Term Redemption Date and Optional Redemption Premium Expiration Date for each Fund’s series of Term Preferred are as follows:
| | | | | | | | | | | | |
| Fund | | Series | | | Term
Redemption Date | | | Optional
Redemption Premium
Expiration Date | |
NSL | | | 2021 | | | | November 1, 2021 | | | | October 31, 2017 | |
JFR | | | 2024 | | | | June 1, 2024 | | | | N/A | |
| | | | 2027 | | | | January 1, 2027 | | | | December 31, 2017 | |
JRO | | | 2027 | | | | January 1, 2027 | | | | December 31, 2017 | |
The average liquidation preference of Term Preferred outstanding and the annualized dividend rate for each Fund during the current fiscal period were as follows:
| | | | | | | | | | | | | | | | |
| | | NSL | | | JFR | | | JRO | | | JSD* | |
Average liquidation preference of Term Preferred outstanding | | $ | 39,994,536 | | | $ | 97,923,497 | | | $ | 65,393,443 | | | $ | 35,000,000 | |
Annualized dividend rate | | | 2.74 | % | | | 3.55 | % | | | 3.62 | % | | | 3.52 | % |
| * | For the period August 1, 2019 through October 29, 2019. |
118
Term Preferred generally do not trade, and market quotations are generally not available. Term Preferred are short-term instruments that pay a dividend rate, subject to adjustment as set forth in accordance with the offering documents. The fair value of Term Preferred is expected to be approximately its liquidation preference so long as the fixed “spread” on the Term Preferred remains roughly in line with the “spread” being demanded by investors on instruments having similar terms in the current market environment. In present market conditions, the Fund’s Adviser has determined that the fair value of Term Preferred is approximately its liquidation preference, but its fair value could vary if market conditions change materially. For financial reporting purposes, the liquidation preference of Term Preferred is a liability and is recognized as “Term Preferred Shares (“Term Preferred”), net of deferred offering costs” on the Statement of Assets and Liabilities.
Dividends on Term Preferred (which are treated as interest payments for financial reporting purposes) are at the rates set forth in its offering document. The initial dividend rate will expire approximately two years after the first issuance of shares and will be adjusted upwards semi-annually thereafter. Unpaid dividends on Term Preferred are recognized as a component of “Interest payable” on the Statement of Assets and Liabilities, when applicable. Dividends accrued on Term Preferred are recognized as a component of “Interest expense and amortization of offering costs” on the Statement of Operations.
Costs incurred in connection with each Fund’s offering of Term Preferred were recorded as a deferred charge, which are amortized over the life of the shares and are recognized as components of “Term Preferred Shares, net of deferred offering costs” on the Statement of Assets and Liabilities and “Interest expense and amortization of offering costs” on the Statement of Operations.
In conjunction with NSL’s redemption of Series 2021, JFR’s redemption of Series 2022, JRO’s redemption of Series 2022, Series 2022-1 and Series 2023 and JSD’s redemption of Series 2020 of Term Preferred, the remaining deferred offering costs of $66,227, $118,049, $374,570 and $195,582, respectively, were fully expensed during the current fiscal period, as the redemptions were deemed an extinguishment of debt.
Preferred Share Transactions
Transactions in preferred shares during the Funds’ current and prior fiscal period, where applicable, are noted in the following table.
Transactions in TFP Shares for the Funds, where applicable, were as follows:
| | | | | | | | | | | | |
| | | Year Ended
July 31, 2020 | |
| JSD | | Series | | | Shares | | | Amount | |
TFP Shares issued | | | A | | | | 100,000 | | | $ | 100,000,000 | |
TFP Shares redeemed | | | A | | | | (30,000 | ) | | | (30,000,000 | ) |
Net increase (decrease) | | | | | | | 70,000 | | | $ | 70,000,000 | |
Transactions in Term Preferred for the Funds, where applicable, were as follows:
| | | | | | | | | | | | |
| | | Year Ended
July 31, 2020 | |
| NSL | | Series | | | Shares | | | Amount | |
Term Preferred redeemed | | | 2021 | | | | (10,000 | ) | | $ | (10,000,000 | ) |
| |
| | | Year Ended
July 31, 2020 | |
| JFR | | Series | | | Shares | | | Amount | |
Term Preferred redeemed | | | 2022 | | | | (25,000 | ) | | $ | (25,000,000 | ) |
| |
| | | Year Ended
July 31, 2019 | |
| JFR | | Series | | | Shares | | | Amount | |
Term Preferred redeemed | | | 2019 | | | | (10,200 | ) | | $ | (10,200,000 | ) |
| |
| | | Year Ended
July 31, 2020 | |
| JRO | | Series | | | Shares | | | Amount | |
Term Preferred redeemed | | | 2022 | | | | (10,000 | ) | | $ | (10,000,000 | ) |
| | | 2022-1 | | | | (21,000 | ) | | $ | (21,000,000 | ) |
| | | | 2023 | | | | (8,000 | ) | | $ | (8,000,000 | ) |
Total | | | | | | | (39,000 | ) | | $ | (39,000,000 | ) |
119
Notes to Financial Statements (continued)
| | | | | | | | | | | | |
| | | Year Ended
July 31, 2020 | |
| JSD | | Series | | | Shares | | | Amount | |
Term Preferred redeemed | | | 2020 | | | | (35,000 | ) | | $ | (35,000,000 | ) |
6. Income Tax Information
Each Fund is a separate taxpayer for federal income tax purposes. Each Fund intends to distribute substantially all of its net investment income and net capital gain to shareholders and to otherwise comply with the requirements of Subchapter M of the Internal Revenue Code applicable to regulated investment companies. Therefore, no federal income tax provision is required.
For all open tax years and all major taxing jurisdictions, management of the Funds has concluded that there are no significant uncertain tax positions that would require recognition in the financial statements. Open tax years are those that are open for examination by taxing authorities (i.e., generally the last four tax year ends and the interim tax period since then). Furthermore, management of the Funds is also not aware of any tax positions for which it is reasonably possible that the total amounts of unrecognized tax benefits will significantly change in the next twelve months.
The following information is presented on an income tax basis. Differences between amounts for financial statement and federal income tax purposes are primarily due to the treatment of timing differences in recognizing certain gains and losses on investment transactions and recognition of premium amortization. To the extent that differences arise that are permanent in nature, such amounts are reclassified within the capital accounts as detailed below. Temporary differences do not require reclassification. Temporary and permanent differences do not impact the NAVs of the Funds.
The table below presents the cost and unrealized appreciation (depreciation) of each Fund’s investment portfolio, as determined on a federal income tax basis, as of July 31, 2020.
For purposes of this disclosure, derivative tax cost is generally the sum of any upfront fees or premiums exchanged and any amounts unrealized for income statement reporting but realized in income and/or capital gains for tax reporting. If a particular derivative category does not disclose any tax unrealized appreciation or depreciation, the change in value of those derivatives have generally been fully realized for tax purposes.
| | | | | | | | | | | | | | | | | | | | |
| | | NSL | | | JFR | | | JRO | | | JSD | | | JQC | |
Tax cost of investments | | $ | 380,776,400 | | | $ | 957,397,785 | | | $ | 670,292,309 | | | $ | 252,128,957 | | | $ | 1,580,768,908 | |
Gross unrealized: | | | | | | | | | | | | | | | | | | | | |
Appreciation | | $ | 2,145,739 | | | $ | 6,563,238 | | | $ | 4,575,075 | | | $ | 1,291,284 | | | $ | 14,077,334 | |
Depreciation | | | (41,923,080 | ) | | | (100,447,652 | ) | | | (70,285,690 | ) | | | (29,318,651 | ) | | | (121,356,256 | ) |
Net unrealized appreciation (depreciation) of investments | | $ | (39,777,341 | ) | | $ | (93,884,414 | ) | | $ | (65,710,615 | ) | | $ | (28,027,367 | ) | | $ | (107,278,922 | ) |
Permanent differences, primarily due to bond premium amortization adjustments, treatment of notional principal contracts, nondeductible offering costs, and federal taxes paid, resulted in reclassifications among the Funds’ components of common share net assets as of July 31, 2020, the Funds’ tax year end.
The tax components of undistributed net ordinary income and net long-term capital gains as of July 31, 2020, the Funds’ tax year end, were as follows:
| | | | | | | | | | | | | | | | | | | | |
| | | NSL | | | JFR | | | JRO | | | JSD | | | JQC | |
Undistributed net ordinary income1 | | $ | 2,474,236 | | | $ | 3,488,487 | | | $ | 2,104,862 | | | $ | 1,637,519 | | | $ | — | |
Undistributed net long-term capital gains | | | — | | | | — | | | | — | | | | — | | | | — | |
|
1 Undistributed net ordinary income (on a tax basis) has not been reduced for the dividend declared on July 1, 2020, paid on August 3, 2020. Net ordinary income consists of net taxable income derived from dividends, interest and net short-term capital gains, if any. | |
The tax character of distributions paid during the Funds’ tax years ended July 31, 2020 and July 31, 2019 was designated for purposes of the dividends paid deduction as follows:
| | | | | | | | | | | | | | | | | | | | |
| 2020 | | NSL | | | JFR | | | JRO | | | JSD | | | JQC | |
Distributions from net ordinary income2 | | $ | 17,466,425 | | | $ | 43,203,962 | | | $ | 30,256,614 | | | $ | 12,396,623 | | | $ | 53,064,705 | |
Distributions from net long-term capital gains | | | — | | | | — | | | | — | | | | — | | | | — | |
Return of capital | | | — | | | | — | | | | — | | | | — | | | | 100,485,694 | |
| | | | | |
| 2019 | | NSL | | | JFR | | | JRO | | | JSD | | | JQC | |
Distributions from net ordinary income2 | | $ | 17,503,719 | | | $ | 45,612,741 | | | $ | 32,437,791 | | | $ | 13,396,971 | | | $ | 71,825,427 | |
Distributions from net long-term capital gains | | | — | | | | — | | | | — | | | | — | | | | — | |
Return of capital | | | — | | | | — | | | | — | | | | — | | | | 42,792,971 | |
| 2 | Net ordinary income consists of net taxable income derived from dividends, interest, and net short-term capital gains, if any. |
120
As of July 31, 2020, the Funds’ tax year end, the Funds had unused capital losses carrying forward available for federal income tax purposes to be applied against future capital gains, if any. The capital losses are not subject to expiration.
| | | | | | | | | | | | | | | | | | | | |
| | | NSL | | | JFR | | | JRO | | | JSD | | | JQC | |
Not subject to expiration: | | | | | | | | | | | | | | | | | | | | |
Short-term | | $ | 3,004,132 | | | $ | 6,727,644 | | | $ | 4,861,896 | | | $ | 2,813,858 | | | $ | 30,500,132 | |
Long-term | | | 32,326,831 | | | | 74,026,821 | | | | 55,158,574 | | | | 20,311,951 | | | | 163,348,920 | |
Total | | $ | 35,330,963 | | | $ | 80,754,465 | | | $ | 60,020,470 | | | $ | 23,125,809 | | | $ | 193,849,052 | |
7. Management Fees
Each Fund’s management fee compensates the Adviser for overall investment advisory and administrative services and general office facilities. Symphony is compensated for its services to the Funds from the management fees paid to the Adviser.
Each Fund’s management fee consists of two components – a fund-level fee, based only on the amount of assets within each individual Fund, and a complex-level fee, based on the aggregate amount of all eligible fund assets managed by the Adviser. This pricing structure enables Fund shareholders to benefit from growth in the assets within their respective Fund as well as from growth in the amount of complex-wide assets managed by the Adviser.
The annual fund-level fee, payable monthly, for each Fund is calculated according to the following schedule:
| | | | | | | | |
| Average Daily Managed Assets* | | NSL JFR JRO JSD
Fund-Level Fee Rate | | | JQC
Fund-Level Fee Rate | |
For the first $500 million | | | 0.6500 | % | | | 0.6800 | % |
For the next $500 million | | | 0.6250 | | | | 0.6550 | |
For the next $500 million | | | 0.6000 | | | | 0.6300 | |
For the next $500 million | | | 0.5750 | | | | 0.6050 | |
For managed assets over $2 billion | | | 0.5500 | | | | 0.5800 | |
The annual complex-level fee, payable monthly, for each Fund is calculated by multiplying the current complex-wide fee rate, determined according to the following schedule by the Funds’ daily managed assets:
| | | | |
| Complex-Level Eligible Asset Breakpoint Level* | | Effective Complex-Level Fee Rate at Breakpoint Level | |
$55 billion | | | 0.2000 | % |
$56 billion | | | 0.1996 | |
$57 billion | | | 0.1989 | |
$60 billion | | | 0.1961 | |
$63 billion | | | 0.1931 | |
$66 billion | | | 0.1900 | |
$71 billion | | | 0.1851 | |
$76 billion | | | 0.1806 | |
$80 billion | | | 0.1773 | |
$91 billion | | | 0.1691 | |
$125 billion | | | 0.1599 | |
$200 billion | | | 0.1505 | |
$250 billion | | | 0.1469 | |
$300 billion | | | 0.1445 | |
| * | For the complex-level fees, managed assets include closed-end fund assets managed by the Adviser that are attributable to certain types of leverage. For these purposes, leverage includes the funds’ use of preferred stock and borrowings and certain investments in the residual interest certificates (also called inverse floating rate securities) in tender option bond (TOB) trusts, including the portion of assets held by a TOB trust that has been effectively financed by the trust’s issuance of floating rate securities, subject to an agreement by the Adviser as to certain funds to limit the amount of such assets for determining managed assets in certain circumstances. The complex-level fee is calculated based upon the aggregate daily managed assets of all Nuveen open-end and closed-end funds that constitute ‘’eligible assets.” Eligible assets do not include assets attributable to investments in other Nuveen funds or assets in excess of a determined amount (originally $2 billion) added to the Nuveen fund complex in connection with the Adviser’s assumption of the management of the former First American Funds effective January 1, 2011, but do not include certain assets of certain Nuveen funds that were reorganized into funds advised by an affiliate of the Adviser during the 2019 calendar year. As of July 31, 2020, the complex-level fee for each Fund was 0.1578%. |
121
Notes to Financial Statements (continued)
8. Fund Leverage
Borrowings
Each Fund has entered into a borrowing arrangement (“Borrowings”) as a means of leverage.
Borrowings Information for NSL, JFR and JRO
The following Funds have entered into a revolving credit and security agreement with certain banks and their affiliates. As of the end of the reporting period, each Fund’s maximum commitment amount under its Borrowings is as follows:
| | | | | | | | | | | | |
| | | NSL | | | JFR | | | JRO | |
Maximum commitment amount | | $ | 130,000,000 | | | $ | 290,000,000 | | | $ | 205,000,000 | |
As of the end of the reporting period, each Fund’s outstanding balance on its Borrowings was as follows:
| | | | | | | | | | | | |
| | | NSL | | | JFR | | | JRO | |
Outstanding balance on Borrowings | | $ | 86,200,000 | | | $ | 208,100,000 | | | $ | 164,900,000 | |
For NSL, interest is charged at a rate equal to the higher of (a) 1-Month LIBOR (London Inter-Bank Offered Rate) plus 0.75% or (b) the Federal Funds rate plus 0.75%. For JFR and JRO, interest is charged at a rate equal to 1-Month LIBOR (London Inter-Bank Offered Rate) plus 0.80%. NSL accrues 0.15% per annum on the undrawn balance if it is less than 50% of the maximum commitment amount; however, if the undrawn portion of the Borrowings is greater than 50% of the maximum commitment amount the Fund will accrue 0.25% per annum on the undrawn portion. JFR accrues 0.25% per annum on the undrawn balance if the undrawn portion of the Borrowings on a particular day is more than 20% of the maximum commitment amount. JRO accrues 0.30% per annum on the undrawn balance if the undrawn portion of the Borrowings on a particular day is more than 10% of the maximum commitment amount. NSL and JRO also accrued an upfront fee of 0.05% and 0.025% per annum on the maximum commitment amount, respectively.
On December 20, 2019, JFR and JRO renewed their Borrowings through December 18, 2020. On January 27, 2020, NSL renewed its Borrowings through January 25, 2021. All other items of the Borrowings remain unchanged.
During the current fiscal period, the average daily balance outstanding (which was for the entire current reporting period) and average annual interest rate on each Fund’s Borrowings were as follows:
| | | | | | | | | | | | |
| | | NSL | | | JFR | | | JRO | |
Average daily balance outstanding | | $ | 100,082,514 | | | $ | 243,599,180 | | | $ | 171,530,601 | |
Average annual interest rate | | | 2.14 | % | | | 2.19 | % | | | 2.17 | % |
Borrowings Information for JSD
The Fund has outstanding a 364-day revolving line of credit. As of the end of the reporting period, the Fund’s maximum commitment amount under its Borrowings is as follows:
| | | | |
| | | JSD | |
Maximum commitment amount | | $ | 10,000,000 | |
As of the end of the reporting period, the Fund’s outstanding balance on its Borrowings was as follows:
| | | | |
| | | JSD | |
Outstanding balance on Borrowings | | $ | 8,500,000 | |
Interest is charged on these Borrowings at a rate per annum equal to 1-Month LIBOR plus 0.80%. The Fund also accrued 0.15% per annum on the undrawn portion if it was less than 50% of the maximum commitment; however, if the undrawn portion of the Borrowings was greater than 50% of the maximum commitment amount the Fund accrued a 0.25% per annum on the undrawn portion of the Borrowings.
On June 22, 2020, JSD renewed its Borrowings through October 28, 2020. The Fund also accrued an upfront fee of 0.05% per annum on the maximum commitment amount. All other items of the Borrowings remain unchanged.
During the Fund’s utilization period(s) during current fiscal period, the average daily balance outstanding and average annual interest rate on the Fund’s Borrowings were as follows:
| | | | |
| | | JSD | |
Utilization period (days outstanding) | | | 315 | |
Average daily balance outstanding | | $ | 23,569,841 | |
Average annual interest rate | | | 2.21 | % |
122
Borrowings Information for JQC
The Fund has entered into a borrowing agreement with a bank and its affiliate. As of the end of the reporting period, the Fund’s maximum commitment amount under its Borrowings is as follows:
| | | | |
| | | JQC | |
Maximum commitment amount | | $ | 405,000,000 | |
As of the end of the reporting period, the Fund’s outstanding balance on its Borrowings was as follows:
| | | | |
| | | JQC | |
Outstanding balance on Borrowings | | $ | 402,000,000 | |
For the period August 1, 2019 to April 30, 2020, the interest was charged on these Borrowings at a rate per annum equal to 3-Month LIBOR plus 1.10%. The Fund also accrued 1.10% per annum on any positive difference between 90% of the maximum commitment amount and the daily drawn amount.
On April 30, 2020, JQC amended its borrowings. Interest is charged on the Borrowings at a rate per annum equal to the 3-Month LIBOR plus 1.40% and the Fund now accrues 1.40% per annum on any positive difference between 90% of the maximum commitment amount and the daily drawn amount. All other items remain unchanged.
During the current fiscal period, the average daily balance outstanding (which was for the entire current reporting period) and average annual interest rate on the Fund’s Borrowings were as follows:
| | | | |
| | | JQC | |
Average daily balance outstanding | | $ | 427,565,574 | |
Average annual interest rate | | | 2.94 | % |
Other Borrowings Information for the Funds
In order to maintain their Borrowings, the Funds must meet certain collateral, asset coverage and other requirements. Each Fund’s Borrowings outstanding is fully secured by eligible securities held in its portfolio of investments.
Each Fund’s Borrowings outstanding is recognized as “Borrowings” on the Statement of Assets and Liabilities. Interest expense incurred on the borrowed amount, undrawn balance and initial fees are recognized as a component of “Interest expense and amortization of offering costs” on the Statement of Operations.
Reverse Repurchase Agreements
During the current fiscal period, JQC used reverse repurchase agreements as a means of leverage.
In a reverse repurchase agreement, the Fund sells to the counterparty a security that it holds with a contemporaneous agreement to repurchase the same security at an agreed-upon price and date, with the Fund retaining the risk of loss that is associated with that security. The Fund will pledge assets determined to be liquid by the Adviser to cover its obligations under reverse repurchase agreements. Securities sold under reverse repurchase agreements are recorded as a liability and recognized as “Reverse repurchase agreements” on the Statement of Assets and Liabilities.
Payments made on reverse repurchase agreements are recognized as a component of “Interest expense and amortization of offering costs” on the Statement of Operations.
As of the end of the reporting period, the Fund’s outstanding balances on its reverse repurchase agreements were as follows:
| | | | | | | | | | | | | | | | | | | | |
| Counterparty | | Rate | | | Principal
Amount | | | Maturity | | | Value | | | Value and
Accrued Interest | |
Societe Generale | | | 3-Month LIBOR plus 0.85 | %* | | $ | (117,000,000 | ) | | | N/A | | | $ | (117,000,000 | ) | | $ | (117,119,808 | ) |
| * | Effective April 30, 2020, the rate changed from 3-Month LIBOR plus 0.75% to 3-Month LIBOR plus 0.85%. |
N/A – Maturity is not applicable. The final repurchase date will be established following pre-specified advance notice by the Fund or the counterparty to the reverse repurchase agreement.
During the current fiscal period, the average daily balance outstanding (which was for the entire current reporting period) and average interest rate on the Fund’s reverse repurchase agreements were as follows:
| | | | |
| | | JQC | |
Average daily balance outstanding | | | $175,426,230 | |
Average interest rate | | | 2.54 | % |
123
Notes to Financial Statements (continued)
The following table presents the reverse repurchase agreements subject to netting agreements and the collateral delivered related to those reverse repurchase agreements.
| | | | | | | | | | | | |
| Counterparty | | Reverse Repurchase
Agreements* | | | Collateral Pledged
to Counterparty** | | | Net
Exposure | |
Societe Generale | | $ | (117,119,808 | ) | | $ | 117,119,808 | | | $ | — | |
| * | Represents gross value and accrued interest for the counterparty as reported in the preceding table. |
| ** | As of the end of the reporting period, the value of the collateral pledged to the counterparty exceeded the value of the reverse repurchase agreements. |
9. Inter-Fund Lending
Inter-Fund Borrowing and Leading
The SEC has granted an exemptive order permitting registered open-end and closed-end Nuveen funds to participate in an inter-fund lending facility whereby the Nuveen funds may directly lend to and borrow money from each other for temporary purposes (e.g., to satisfy redemption requests or when a sale of securities “fails,” resulting in an unanticipated cash shortfall) (the “Inter-Fund Program”). The closed-end Nuveen funds, including the Funds covered by this shareholder report, will participate only as lenders, and not as borrowers, in the Inter-Fund Program because such closed-end funds rarely, if ever, need to borrow cash to meet redemptions. The Inter-Fund Program is subject to a number of conditions, including, among other things, the requirements that (1) no fund may borrow or lend money through the Inter-Fund Program unless it receives a more favorable interest rate than is typically available from a bank or other financial institution for a comparable transaction; (2) no fund may borrow on an unsecured basis through the Inter-Fund Program unless the fund’s outstanding borrowings from all sources immediately after the inter-fund borrowing total 10% or less of its total assets; provided that if the borrowing fund has a secured borrowing outstanding from any other lender, including but not limited to another fund, the inter-fund loan must be secured on at least an equal priority basis with at least an equivalent percentage of collateral to loan value; (3) if a fund’s total outstanding borrowings immediately after an inter-fund borrowing would be greater than 10% of its total assets, the fund may borrow through the inter-fund loan on a secured basis only; (4) no fund may lend money if the loan would cause its aggregate outstanding loans through the Inter-Fund Program to exceed 15% of its net assets at the time of the loan; (5) a fund’s inter-fund loans to any one fund shall not exceed 5% of the lending fund’s net assets; (6) the duration of inter-fund loans will be limited to the time required to receive payment for securities sold, but in no event more than seven days; and (7) each inter-fund loan may be called on one business day’s notice by a lending fund and may be repaid on any day by a borrowing fund. In addition, a Nuveen fund may participate in the Inter-Fund Program only if and to the extent that such participation is consistent with the fund’s investment objective and investment policies. The Board is responsible for overseeing the Inter-Fund Program.
The limitations detailed above and the other conditions of the SEC exemptive order permitting the Inter-Fund Program are designed to minimize the risks associated with Inter-Fund Program for both the lending fund and the borrowing fund. However, no borrowing or lending activity is without risk. When a fund borrows money from another fund, there is a risk that the loan could be called on one day’s notice or not renewed, in which case the fund may have to borrow from a bank at a higher rate or take other actions to payoff such loan if an inter-fund loan is not available from another fund. Any delay in repayment to a lending fund could result in a lost investment opportunity or additional borrowing costs.
During the current reporting period, none of the Funds covered by this shareholder report have entered into any inter-fund loan activity.
10. Subsequent Events
Term Preferred Shares
During August 2020, NSL redeemed 18,000 of its outstanding Series 2021 Term Preferred Shares.
Borrowings
During August 2020, each Fund increased its Borrowings amounts as shown in the following table.
| | | | | | | | | | | | | | | | | | | | |
| | | NSL | | | JFR | | | JRO | | | JSD | | | JQC | |
Outstanding balance on Borrowings | | $ | 107,200,000 | | | $ | 216,100,000 | | | $ | 170,900,000 | | | $ | 10,000,000 | | | $ | 405,000,000 | |
124
Shareholder
Update
(Unaudited)
NUVEEN SENIOR INCOME FUND (NSL)
CURRENT INVESTMENT OBJECTIVE(S), PRINCIPAL INVESTMENT POLICIES
AND PRINCIPAL RISKS OF THE FUNDS
Investment Objective
The Fund has an investment objective to achieve a high level of current income, consistent with preservation of capital.
Investment Policies
The Fund invests primarily in adjustable rate U.S. dollar-denominated secured Senior Loans.
“Managed Assets” means the total assets of the Fund, minus the sum of its accrued liabilities (other than Fund liabilities incurred for the express purpose of creating leverage). Total assets for this purpose shall include assets attributable to the Fund’s use of leverage (whether or not those assets are reflected in the Fund’s financial statements for purposes of generally accepted accounting principles), and derivatives will be valued at their market value. “Assets” means net assets of the Fund plus the amount of any borrowings for investment purposes.
Under normal circumstances:
| | • | | The Fund invests at least 80% of its Assets in adjustable rate, U.S. dollar-denominated secured and unsecured senior loans (“Senior Loans”), which unsecured Senior Loans will be, at the time of investment, investment grade quality. Investment grade quality securities are those securities that, at the time of investment, are rated by at least one nationally recognized statistical rating organization (“NRSRO”) within the four highest grades unrated but judged to be of comparable quality. With respect to the Fund’s Senior Loans included in the 80% policy, such instruments will at all times have a dollar-weighted average time until the next interest rate adjustment of 90 days or less. |
| | • | | No more than 30% of the Fund’s Managed Assets may be invested in Senior Loans and other debt securities that are, at the time of investment, rated CCC+ or Caa or below by Standard & Poor’s Corporation, a division of The McGraw-Hill Companies (“S&P”), Moody’s Investor Service, Inc. (“Moody’s”) or Fitch Ratings, part of the Fitch Group (“Fitch”) or that are unrated but judged to be of comparable quality. |
| | • | | The Fund will invest at least 65% of its Managed Assets in Senior Loans that are secured by specific collateral. Such collateral consists of assets and/or stock of the borrower. |
| | • | | The Fund may invest up to 20% of its Managed Assets in U.S. dollar-denominated Senior Loans of Borrowers that are organized or located in countries outside the United States. |
| | • | | The Fund may invest up to 20% of its Managed Assets, in the aggregate, in: |
| | ¡ | | other income producing securities such as investment and non-investment grade corporate debt securities, of corporate or governmental issuers, and |
| | ¡ | | equity securities and warrants acquired in connection with the Fund’s investments in Senior Loans. |
| | • | | The Fund will not invest more than 10% of its Managed Assets in Senior Loans with interest rates that adjust less often than semi-annually. |
| | • | | The Fund’s portfolio of Senior Loans will at all times have a dollar-weighted average time until the next interest rate adjustment of 90 days or less. The Fund may use interest rate swaps and other investment practices to shorten the effective interest rate adjustment period of Senior Loans. If the Fund does so, it considers the shortened period to be the adjustment period of the Senior Loans. |
| | • | | The Fund has no policy limiting the maturity of the Senior Loans that it purchases. |
| | • | | The Fund does not intend to invest more than 5% of its Managed Assets in Senior Loans or other securities of a single borrower. In addition, the Fund will not invest more than 25% of its Managed Assets in Borrowers that conduct their principal businesses in the same industry. |
| | • | | The Fund will invest no more than 20% of its total assets in Senior Loans in which it acts as an agent or co-agent, and the size of any such individual Senior Loan will not exceed 5% of the Fund’s total assets. |
| | • | | The Fund does not currently intend to invest more than 20% of its Managed Assets in Participations. Participations are when the Fund acquires from a lender a portion of a lender’s rights under a loan agreement. |
125
Shareholder Update (continued)
(Unaudited)
| | • | | The Fund will only acquire Participations if the lender selling the Participation, and any other persons interpositioned between the Fund and the lender, (i) at the time of investment has outstanding debt or deposit obligations rated investment grade (BBB or A-3 or higher by S&P, Baa or P-3 or higher by Moody’s or BBB or F3 or higher by Fitch or has debt or obligations that are unrated by S&P, Moody’s and Fitch and determined by NFAL to be of comparable quality and (ii) has entered into an agreement which provides for the holding of assets in safekeeping for, or the prompt disbursement of assets to, the Fund. |
| | • | | The Fund may invest up to 10% of its Managed Assets in structured notes and up to 10% in securities of other closed-end investment companies that invest primarily in securities of the types in which the Fund may invest directly. |
| | • | | The Fund may invest up to 5% of its Managed Assets in iBoxx Loan Total Return Swaps. Such swaps are standardized total return swaps on loan indices that are designed to provide exposure to the Senior Loan market. |
For purposes of the investment policies provided above such policies only apply at the time of purchase and will not be considered violated unless an excess or deficiency occurs or exists immediately after and as a result of an acquisition of securities.
The Board of Trustees of the Fund may change a policy without a shareholder vote. However, with respect to the Fund’s policy of investing at least 80% of its Assets in adjustable rate, U.S. dollar-denominated, secured and unsecured Senior Loans, which unsecured Senior Loans will be, at the time of investment, investment grade quality, such policy may not be changed without 60 days’ prior written notice.
The Fund may invest in derivatives for both hedging and risk management purposes and to gain investment exposure. Derivatives include total return swaps; interest rate swaps; credit default swaps; interest rate caps; interest rate floors; interest rate collars; swaptions; credit-linked notes; securities indices; other indices or other financial instruments; stock and bond index futures; futures contracts on securities; options on securities; options on futures contracts; options on stock and bond indexes; interest rate futures; exchange-traded and over-the-counter options on securities or indices; index linked securities; currency exchange transactions; financial futures; options on financial futures; index futures; index options; index options on futures contracts; interest rate options; interest rate option on futures contracts; short sales; structured notes; options on U.S. Treasury security or U.S. Government Agency securities; U.S. Treasury security or U.S. Government Agency security futures contracts; and options on U.S. Treasury security or U.S. Government Agency security futures contracts.
The Fund uses leverage to pursue its investment objective. The Fund may use leverage to the extent permitted by the 1940 Act. The Fund may source leverage through a number of methods including through borrowings, issuing preferred shares of beneficial, the issuance of debt securities, and entering into reverse repurchase agreements (effectively a borrowing). In addition, the Fund may use derivatives that may have the economic effect of leverage, such as certain credit default swaps, total return swaps and bond futures. The amount and sources of leverage will vary depending on market conditions.
During temporary defensive periods, the Fund may deviate from its investment policies and objective. During such periods, the Fund may invest up to 100% of its assets in high quality, short-term securities, and in short-, intermediate-, or long-term U.S. Treasury securities. There can be no assurance that such techniques will be successful. Accordingly, during such periods, the Fund may not achieve its investment objective.
Principal Risks
The Fund is a diversified, closed-end management investment company designed primarily as a long-term investment and not as a trading vehicle. The Fund is not intended to be a complete investment program and, due to the uncertainty inherent in all investments, there can be no assurance that the Fund will achieve its investment objective.
Investing in the Fund involves a number of risks, including those described below:
Portfolio Level Risks:
Basis Risk. As short-term rates change, interest from floating rate loans may not increase in concert with increases in floating rate leverage, introducing basis or imperfect hedging risk.
Below Investment Grade Risk. Debt instruments of below investment grade quality are regarded as having predominately speculative characteristics with respect to the issuer’s capacity to pay interest, dividends and repay principal, and are commonly referred to as junk bonds or high yield debt, which implies higher price volatility and default risk than investment grade instruments of comparable terms and duration. Issuers of lower grade instruments may be highly leveraged and may not have available to them more traditional methods of financing. The prices of these lower grade instruments are typically more sensitive to negative developments, such as a decline in the issuer’s revenues or a general economic downturn, than are the prices of higher grade instruments. If a below investment grade security goes into default, or its issuer enters bankruptcy, it might be difficult to sell that security in a timely manner at a reasonable price.
Counterparty Risk. Certain derivative instruments subject the Fund to the risk that the counterparty could default on its obligations under the agreement, either through the counterparty’s bankruptcy or failure to perform its obligations. In the event of default, the Fund could experience lengthy delays in
126
recovering some or all of its assets or no recovery at all. The Fund’s investments in the futures markets also introduce the risk that its futures commission merchant (“FCM”) would default on an obligation set forth in an agreement between the Fund and the FCM, including the FCM’s obligation to return margin posted in connection with the Fund’s futures contracts. The failure or bankruptcy of the Fund’s FCM could result in a substantial loss of Fund assets. The payment obligation for a cleared, over-the-counter derivative transaction is guaranteed by a central counterparty, which exposes the Fund to the creditworthiness of the central counterparty.
Credit Risk. Debt or preferred securities held by the Fund may fail to make dividend or interest payments when due. Investments in securities below investment grade credit quality are predominantly speculative and subject to greater volatility and risk of default. Unrated securities are evaluated by Fund managers using industry data and their own analysis processes that may be similar to that of a nationally recognized rating agency; however, such internal ratings are not equivalent to a national agency credit rating. Counterparty credit risk may arise if counterparties fail to meet their obligations, should the Fund hold any derivative instruments for either investment exposure or hedging purposes.
Deflation Risk. Deflation risk is the risk that prices throughout the economy decline over time, which may have an adverse effect on the market valuation of companies, their assets and revenues. In addition, deflation may have an adverse effect on the creditworthiness of issuers and may make issuer default more likely, which may result in a decline in the value of the Fund’s portfolio.
Derivatives Risk. The use of derivatives involves additional risks and transaction costs which could leave the Fund in a worse position than if it had not used these instruments. Derivative instruments can be used to acquire or to transfer the risk and returns of a security or other asset without buying or selling the security or asset. These instruments may entail investment exposures that are greater than their cost would suggest. As a result, a small investment in derivatives can result in losses that greatly exceed the original investment. Derivatives can be highly volatile, illiquid and difficult to value. An over-the-counter derivative transaction between the Fund and a counterparty that is not cleared through a central counterparty also involves the risk that a loss may be sustained as a result of the failure of the counterparty to the contract to make required payments. The payment obligation for a cleared derivative transaction is guaranteed by a central counterparty, which exposes the Fund to the creditworthiness of the central counterparty.
It is possible that developments in the derivatives market, including changes in government regulation, could adversely impact the Fund’s ability to invest in certain derivatives.
Foreign Security Risk and Risks of Emerging Markets. Securities of foreign issuers, even when dollar-denominated and publicly traded in the United States, may involve risks not associated with the securities of domestic issuers. For certain foreign countries, political or social instability, or diplomatic developments could adversely affect the securities. There is also the risk of loss due to governmental actions such as a change in tax statutes or the modification of individual property rights. In addition, individual foreign economies may differ favorably or unfavorably from the U.S. economy.
The risks of foreign investing are particularly significant in emerging markets. Investing in emerging markets generally involves exposure to economic structures that are less diverse and mature, and to political systems that are less stable, than those of developed countries. In addition, issuers in emerging markets typically are subject to a greater degree of change in earnings and business prospects than are companies in developed markets.
Illiquid Investments Risk. The risk that illiquid investments may be difficult to sell for the value at which they are carried, if at all, or at any price within the desired time frame.
Income Risk. The Fund’s income could decline due to falling market interest rates. This is because, in a falling interest rate environment, the Fund generally will have to invest the proceeds from sales of Fund shares, as well as the proceeds from maturing portfolio securities, in lower-yielding securities.
Inflation Risk. Inflation risk is the risk that the value of assets or income from investments will be worth less in the future as inflation decreases the value of money. As inflation increases, the real value of the Common Shares and distributions can decline.
Interest Rate Risk. Interest rate risk is the risk that debt securities in the Fund’s portfolio will decline in value because of changes in market interest rates. Generally, when market interest rates rise, the market value of such securities will fall, and vice versa. As interest rates decline, issuers of debt securities may prepay principal earlier than scheduled, forcing the Fund to reinvest in lower-yielding securities and potentially reducing the Fund’s income. As interest rates increase, slower than expected principal payments may extend the average life of securities, potentially locking in a below-market interest rate and reducing the Fund’s value. In typical market interest rate environments, the prices of longer-term debt securities generally fluctuate more than prices of shorter-term debt securities as interest rates change. The Federal Reserve recently reduced the federal Funds rate several times.
LIBOR Floor Risk. Many floating rate loans issued after 2008 include a “LIBOR floor”, or minimum interest rate to which the loan’s spread is added, to calculate the loan’s overall interest rate. As short-term market rates rise, such loans will not pay higher interest until prevailing rates exceed the floor rate stated in the loan documents. If such a Fund uses floating rate leverage, the Fund’s leverage costs will likely increase before its loan portfolio income increases, and the additional income provided by leverage may diminish until market rates exceed the LIBOR floor level. The Fund’s investments in floating rate loans that pay interest based on LIBOR may experience increase volatility and/or illiquidity during the transition away from LIBOR, which is scheduled to be phased out by the end of 2021.
127
Shareholder Update (continued)
(Unaudited)
Loan Settlement Risk. Lack of established settlement standards or remedies for failure to settle may cause the Fund to lack timely access to proceeds from selling loans, or to investment exposure from buying loans.
Reinvestment Risk. Reinvestment risk is the risk that income from the Fund’s portfolio will decline if and when the Fund invests the proceeds from matured, traded or called securities at market interest rates that are below the portfolio’s current earnings rate. A decline in income could affect the common shares’ market price, NAV and/or a common shareholder’s overall returns.
Reverse Repurchase Agreement Risk. Reverse repurchase agreements, in economic essence, constitute a securitized borrowing by the Fund from the security purchaser. The Fund may enter into reverse repurchase agreements for the purpose of creating a leveraged investment exposure and, as such, their usage involves essentially the same risks associated with a leveraging strategy generally since the proceeds from these agreements may be invested in additional securities. Reverse repurchase agreements tend to be short-term in tenor, and there can be no assurances that the purchaser (lender) will commit to extend or “roll” a given agreement upon its agreed-upon repurchase date or an alternative purchaser can be identified on similar terms. Reverse repurchase agreements also involve the risk that the purchaser fails to return the securities as agreed upon, files for bankruptcy or becomes insolvent. The Fund may be restricted from taking normal portfolio actions during such time, could be subject to loss to the extent that the proceeds of the agreement are less than the value of securities subject to the agreement and may experience adverse tax consequences.
Senior Loan Risk. Senior loans, both secured and unsecured, may not be rated by a national rating agency, are generally not registered with the Securities and Exchange Commission (SEC) and generally are not listed on a securities exchange. Consequently, the amount of public information available about senior loans generally is less extensive than that available for more widely rated, registered and exchange-listed securities. In addition, some adjustable rate loans may be unsecured or insufficiently collateralized, which increases the risk of Fund losses if the loan’s issuer defaults.
Swap Risk. Swap agreements are typically over-the-counter, two-party contracts entered into primarily by institutional investors for periods typically ranging from a few weeks to more than one year, where the parties agree to exchange the returns (or differentials in rates of return) earned or realized on particular predetermined investments or instruments, which may be adjusted for an interest factor. Interest rate swaps involve the exchange with another party of their respective commitments to pay or receive interest (for example, an exchange of floating rate payments for fixed-rate payments). The use of interest rate swaps is a highly specialized activity that involves investment techniques and risks different from those associated with ordinary portfolio security transactions. Interest rate swaps do not involve the delivery of securities or other underlying assets or principal. Accordingly, the risk of loss with respect to interest rate swaps is limited to the net amount of interest payments that the Fund is contractually obligated to make. If the other party to an interest rate swap defaults, the Fund’s risk of loss generally consists of the net amount of interest payments that the Fund contractually is entitled to receive.
Fund Level and Other Risks:
Anti-Takeover Provisions. The Fund’s Declaration of Trust and By-laws include provisions that could limit the ability of other entities or persons to acquire control of the Fund or convert the Fund to open-end status. These provisions could have the effect of depriving the common shareholders of opportunities to sell their common shares at a premium over the then-current market price of the common shares.
Global economic risk. National and regional economies and financial markets are becoming increasingly interconnected, which increases the possibilities that conditions in one country, region or market might adversely impact issuers in a different country, region or market. Changes in legal, political, regulatory, tax and economic conditions may cause fluctuations in markets and securities prices around the world, which could negatively impact the value of the Fund’s investments. Major economic or political disruptions, particularly in large economies like China’s, may have global negative economic and market repercussions. Additionally, events such as war, terrorism, natural and environmental disasters and the spread of infectious illnesses or other public health emergencies may adversely affect the global economy and the markets and issuers in which the Fund invests. Recent examples of such events include the outbreak of a novel coronavirus known as COVID-19 that was first detected in China in December 2019 and heightened concerns regarding North Korea’s nuclear weapons and long-range ballistic missile programs. These events could reduce consumer demand or economic output, result in market closure, travel restrictions or quarantines, and generally have a significant impact on the economy. These events could also impair the information technology and other operational systems upon which the Fund’s service providers, including the investment adviser and sub-adviser, rely, and could otherwise disrupt the ability of employees of the Fund’s service providers to perform essential tasks on behalf of the Fund. Governmental and quasi-governmental authorities and regulators throughout the world have in the past responded to major economic disruptions with a variety of significant fiscal and monetary policy changes, including but not limited to, direct capital infusions into companies, new monetary programs and dramatically lower interest rates. An unexpected or quick reversal of these policies, or the ineffectiveness of these policies, could increase volatility in securities markets, which could adversely affect the Fund’s investments.
Investment and Market Risk. An investment in common shares is subject to investment risk, including the possible loss of the entire principal amount that you invest. Common shares frequently trade at a discount to their NAV. An investment in common shares represents an indirect investment in the securities owned by the Fund. Common shares at any point in time may be worth less than your original investment, even after taking into account the reinvestment of Fund dividends and distributions.
128
Leverage Risk. The Fund’s use of leverage may cause higher volatility for the Fund’s per share NAV, market price, and distributions. Leverage typically magnifies the total return of the Fund’s portfolio, whether that return is positive or negative. Leverage is intended to increase common share net income, but there is no assurance that the Fund’s leveraging strategy will be successful. Different forms of leverage, including swaps, may introduce additional credit or interest rate risk. Leverage may also increase a Fund’s liquidity risk, as the Fund may need to sell securities at inopportune times to stay within Fund or regulatory limits.
Market Discount from Net Asset Value. Shares of closed-end investment companies like the Fund frequently trade at prices lower than their NAV, which creates a risk of loss for investors when they sell shares. This characteristic is a risk separate and distinct from the risk that the Fund’s NAV could decrease as a result of investment activities. Shares of closed-end investment companies like the Fund have during some periods traded at prices higher than NAV and have during other periods traded at prices lower than NAV. Whether investors will realize gains or losses upon the sale of the common shares will depend not upon the Fund’s NAV but entirely upon whether the market price of the common shares at the time of sale is above or below the investor’s purchase price for the common shares. Furthermore, management may have difficulty meeting the Fund’s investment objective and managing its portfolio when the underlying securities are redeemed or sold during periods of market turmoil and as investors’ perceptions regarding closed-end funds or their underlying investments change. Because the market price of the common shares will be determined by factors such as relative supply of and demand for the common shares in the market, general market and economic circumstances, and other factors beyond the control of the Fund, the Fund cannot predict whether the common shares will trade at, below or above NAV. The common shares are designed primarily for long-term investors, and you should not view the Fund as a vehicle for short-term trading purposes.
Tax Risk. The tax treatment of Fund distributions may be affected by future changes in tax laws and regulations or their interpretation by the Internal Revenue Service or state tax authorities.
Valuation Risk. The Fund utilizes independent pricing services approved by the Board of Trustees to value portfolio instruments at their market value. If the pricing services are unable to provide a market value or if a significant event occurs such that the valuation(s) provided are deemed unreliable, the Fund may value portfolio instrument(s) at their fair value, which is generally the amount an owner might reasonably expect to receive upon a current sale. Valuation risks associated with investing in below investment grade debt instruments including, but not limited to: a limited number of market participants, a lack of publicly-available information, resale restrictions, settlement delays, corporate actions and adverse market conditions may make it difficult to value or sell such instruments. Because non-U.S. instruments may trade on days when Common Shares are not priced or traded, NAV can change at times when Common Shares cannot be sold.
129
Shareholder Update (continued)
(Unaudited)
NUVEEN FLOATING RATE INCOME FUND (JFR)
Investment Objective
The Fund has an investment objective to achieve a high level of current income.
Investment Policies
The Fund invests primarily in adjustable rate secured senior loans and adjustable rate unsecured senior loans (collectively referred to as “Senior Loans”), which unsecured Senior Loans will be, at the time of investment, investment grade quality.
“Managed Assets” means the total assets of the Fund, minus the sum of its accrued liabilities (other than Fund liabilities incurred for the express purpose of creating leverage). Total assets for this purpose shall include assets attributable to the Fund’s use of leverage (whether or not those assets are reflected in the Fund’s financial statements for purposes of generally accepted accounting principles), and derivatives will be valued at their market value. “Assets” means net assets of the Fund plus the amount of any borrowings for investment purposes.
Under normal circumstances:
| | • | | The Fund invests at least 80% of its Assets in secured Senior Loans and unsecured Senior Loans, which unsecured Senior Loans will be, at the time of investment, investment grade quality. With respect to the Fund’s Senior Loans included in the 80% policy, such instruments will at times have a dollar-weighted average time until the next interest rate adjustment of 90 days or less. |
| | • | | The Fund invests at least 65% of its Managed Assets in Senior Loans that are secured by specific collateral. |
| | • | | The Fund may invest its Managed Assets without limit in Senior Loans and other debt instruments that are, at the time of investment, rated below investment grade or unrated but judged to be of comparable quality. Investment grade quality securities are those securities that, at the time of investment, are (i) rated by at least one nationally recognized statistical rating organization NRSRO within the four highest grades (BBB- or Baa3 or better by S&P, Moody’s or Fitch, or (ii) unrated but judged to be of comparable quality. However, no more than 30% of the Fund’s Managed Assets may be invested in Senior Loans and other debt securities that are, at the time of investment, rated CCC+ or Caa or below by S&P, Moody’s or Fitch or that are unrated but judged to be of comparable quality. |
| | • | | The Fund may invest up to 20% of its Managed Assets in (i) other debt securities such as investment and non-investment grade debt securities, convertible securities and structured notes (other than structured notes that are designed to provide returns and risks that emulate those of Senior Loans, which may be treated as an investment in Senior Loans for purposes of the 80% requirement set forth above), (ii) mortgage-related and other asset-backed securities (including collateralized loan obligations and collateralized debt obligations), and (iii) debt securities and other instruments issued by government, government-related or supranational issuers (commonly referred to as sovereign debt securities). No more than 5% of the Fund’s Managed Assets may be invested in each of convertible securities, mortgage-related and other asset-backed securities, and sovereign debt securities. The debt securities in which the Fund may invest may have short-term, intermediate-term or long-term maturities. The Fund also may receive warrants and equity securities issued by a borrower or its affiliates in connection with the Fund’s other investments in such entities. |
| | • | | The Fund maintains an average duration of one year or less for its portfolio investments in Senior Loans and other debt instruments. |
| | • | | The Fund will not invest in inverse floating rate securities. |
| | • | | The Fund may invest up to 20% of its Managed Assets in securities of non-U.S. issuers (which includes borrowers) that are U.S. dollar or non-U.S. dollar denominated. The Fund’s Managed Assets to be invested in Senior Loans and other debt instruments of non-U.S. issuers may include debt securities of issuers located, or conducting their business in, emerging markets countries. |
| | • | | The Fund may not invest more than 20% of its Managed Assets in securities from an industry which (for purposes of this policy) generally refers to the classification of companies in the same or similar lines of business such as the automotive, textiles and apparel, hotels, media production and consumer retailing industries. The Fund may invest more than 20% of its Managed Assets in sectors which (for purposes of this policy) generally refers to broader classifications of industries, such as the consumer discretionary sector which includes the automotive, textiles and apparel, hotels, media production and consumer retailing industries, provided the Fund’s investment in a particular industry within the sector does not exceed the industry limitation. |
| | • | | The Fund may invest up to 5% of its Managed Assets in iBoxx Loan Total Return Swaps. An iBoxx Loan Total Return Swap is a specific type of total return swap on an index that is designed to provide exposure to the Senior Loan market. The iBoxx Loan Total Return Swap’s underlying index is the Markit iBoxx USD Liquid Leveraged Loans Total Return Index, which is one of a subset of indices designed to track the broader, rules-based Markit iBoxx USD Liquid Leveraged Loan Index. “iBoxx Loan Total Return Swaps” means total return swaps written on the Markit iBoxx USD Liquid Leveraged Loans Total Return Index. |
For purposes of the investment policies provided above such policies only apply at the time of purchase and will not be considered violated unless an excess or deficiency occurs or exists immediately after and as a result of an acquisition of securities.
130
The Board of Trustees of the Fund may change a policy without a shareholder vote. However, with respect to the Fund’s policy of investing at least 80% of its Assets in secured Senior Loans and unsecured Senior Loans, which unsecured Senior Loans will be, at the time of investment, investment grade quality, such policy may not be changed without 60 days’ prior written notice.
The Fund may invest in certain derivative instruments as a hedging technique to protect against potential adverse changes in the market value of portfolio securities. The Fund also may use derivatives to attempt to protect the NAV of the Fund, to facilitate the sale of certain portfolio securities, to manage the Fund’s effective interest rate exposure, or as a means of gaining investment exposure.
The Fund uses leverage to pursue its investment objective. The Fund may use leverage to the extent permitted by the 1940 Act. The Fund may source leverage through a number of methods including through borrowings, issuing preferred shares of beneficial, the issuance of debt securities, and entering into reverse repurchase agreements (effectively a borrowing). In addition, the Fund may use derivatives that may have the economic effect of leverage, such as certain credit default swaps, total return swaps and bond futures. The amount and sources of leverage will vary depending on market conditions.
During temporary defensive periods, the Fund may deviate from its investment policies and objective. During such periods, the Fund may invest up to 100% of its assets in high quality, short-term securities, and in short-, intermediate-, or long-term U.S. Treasury securities. There can be no assurance that such techniques will be successful. Accordingly, during such periods, the Fund may not achieve its investment objective.
Principal Risks
The Fund is a diversified, closed-end management investment company designed primarily as a long-term investment and not as a trading vehicle. The Fund is not intended to be a complete investment program and, due to the uncertainty inherent in all investments, there can be no assurance that the Fund will achieve its investment objective.
Investing in the Fund involves a number of risks, including those described below:
Portfolio Level Risks:
Basis Risk. As short-term rates change, interest from floating rate loans may not increase in concert with increases in floating rate leverage, introducing basis or imperfect hedging risk.
Below Investment Grade Risk. Debt instruments of below investment grade quality are regarded as having predominately speculative characteristics with respect to the issuer’s capacity to pay interest, dividends and repay principal, and are commonly referred to as junk bonds or high yield debt, which implies higher price volatility and default risk than investment grade instruments of comparable terms and duration. Issuers of lower grade instruments may be highly leveraged and may not have available to them more traditional methods of financing. The prices of these lower grade instruments are typically more sensitive to negative developments, such as a decline in the issuer’s revenues or a general economic downturn, than are the prices of higher grade instruments. If a below investment grade security goes into default, or its issuer enters bankruptcy, it might be difficult to sell that security in a timely manner at a reasonable price.
Counterparty Risk. Certain derivative instruments subject the Fund to the risk that the counterparty could default on its obligations under the agreement, either through the counterparty’s bankruptcy or failure to perform its obligations. In the event of default, the Fund could experience lengthy delays in recovering some or all of its assets or no recovery at all. The Fund’s investments in the futures markets also introduce the risk that its futures commission merchant (“FCM”) would default on an obligation set forth in an agreement between the Fund and the FCM, including the FCM’s obligation to return margin posted in connection with the Fund’s futures contracts. The failure or bankruptcy of the Fund’s FCM could result in a substantial loss of Fund assets. The payment obligation for a cleared, over-the-counter derivative transaction is guaranteed by a central counterparty, which exposes the Fund to the creditworthiness of the central counterparty.
Credit Risk. Debt or preferred securities held by the Fund may fail to make dividend or interest payments when due. Investments in securities below investment grade credit quality are predominantly speculative and subject to greater volatility and risk of default. Unrated securities are evaluated by Fund managers using industry data and their own analysis processes that may be similar to that of a nationally recognized rating agency; however, such internal ratings are not equivalent to a national agency credit rating. Counterparty credit risk may arise if counterparties fail to meet their obligations, should the Fund hold any derivative instruments for either investment exposure or hedging purposes.
Currency Risk. The prices of any non-U.S. securities held by the Fund that are traded in U.S. dollars are typically indirectly influenced by currency fluctuations. Changes in currency exchange rates may affect the Fund’s net asset value, interest earned, and gains or losses realized on the sale of securities. Changes in currency exchange rates will also affect the value of non-U.S. dollar denominated securities, the value of dividends and interest earned from such securities, gains and losses realized on the sale of such securities, and derivative transactions tied to such securities. A strong U.S. dollar relative to these other currencies will adversely affect the value of the Fund’s portfolio.
131
Shareholder Update (continued)
(Unaudited)
Deflation Risk. Deflation risk is the risk that prices throughout the economy decline over time, which may have an adverse effect on the market valuation of companies, their assets and revenues. In addition, deflation may have an adverse effect on the creditworthiness of issuers and may make issuer default more likely, which may result in a decline in the value of the Fund’s portfolio.
Derivatives Risk. The use of derivatives involves additional risks and transaction costs which could leave the Fund in a worse position than if it had not used these instruments. Derivative instruments can be used to acquire or to transfer the risk and returns of a security or other asset without buying or selling the security or asset. These instruments may entail investment exposures that are greater than their cost would suggest. As a result, a small investment in derivatives can result in losses that greatly exceed the original investment. Derivatives can be highly volatile, illiquid and difficult to value. An over-the-counter derivative transaction between the Fund and a counterparty that is not cleared through a central counterparty also involves the risk that a loss may be sustained as a result of the failure of the counterparty to the contract to make required payments. The payment obligation for a cleared derivative transaction is guaranteed by a central counterparty, which exposes the Fund to the creditworthiness of the central counterparty.
It is possible that developments in the derivatives market, including changes in government regulation, could adversely impact the Fund’s ability to invest in certain derivatives.
Duration Risk. Duration is the sensitivity, expressed in years, of the price of a fixed-income security to changes in the general level of interest rates (or yields). Securities with longer durations tend to be more sensitive to interest rate (or yield) changes, which typically corresponds to increased volatility and risk, than securities with shorter durations. For example, if a security or portfolio has a duration of three years and interest rates increase by 1%, then the security or portfolio would decline in value by approximately 3%. Duration differs from maturity in that it considers potential changes to interest rates, and a security’s coupon payments, yield, price and par value and call features, in addition to the amount of time until the security matures. The duration of a security will be expected to change over time with changes in market factors and time to maturity.
Floating-Rate and Fixed-to-Floating-Rate Securities Risk. The market value of floating-rate securities is a reflection of discounted expected cash flows based on expectations for future interest rate resets. The market value of such securities may fall in a declining interest rate environment and may also fall in a rising interest rate environment if there is a lag between the rise in interest rates and the reset. This risk may also be present with respect to fixed-to-floating-rate securities in which the Fund may invest. A secondary risk associated with declining interest rates is the risk that income earned by the Fund on floating-rate and fixed-to-floating-rate securities will decline due to lower coupon payments on floating rate securities.
Foreign Security Risk and Risks of Emerging Markets. Securities of foreign issuers, even when dollar-denominated and publicly traded in the United States, may involve risks not associated with the securities of domestic issuers. For certain foreign countries, political or social instability, or diplomatic developments could adversely affect the securities. There is also the risk of loss due to governmental actions such as a change in tax statutes or the modification of individual property rights. In addition, individual foreign economies may differ favorably or unfavorably from the U.S. economy.
The risks of foreign investing are particularly significant in emerging markets. Investing in emerging markets generally involves exposure to economic structures that are less diverse and mature, and to political systems that are less stable, than those of developed countries. In addition, issuers in emerging markets typically are subject to a greater degree of change in earnings and business prospects than are companies in developed markets.
Illiquid Investments Risk. The risk that illiquid investments may be difficult to sell for the value at which they are carried, if at all, or at any price within the desired time frame.
Income Risk. The Fund’s income could decline due to falling market interest rates. This is because, in a falling interest rate environment, the Fund generally will have to invest the proceeds from sales of Fund shares, as well as the proceeds from maturing portfolio securities, in lower-yielding securities.
Inflation Risk. Inflation risk is the risk that the value of assets or income from investments will be worth less in the future as inflation decreases the value of money. As inflation increases, the real value of the Common Shares and distributions can decline.
Interest Rate Risk. Interest rate risk is the risk that debt securities in the Fund’s portfolio will decline in value because of changes in market interest rates. Generally, when market interest rates rise, the market value of such securities will fall, and vice versa. As interest rates decline, issuers of debt securities may prepay principal earlier than scheduled, forcing the Fund to reinvest in lower-yielding securities and potentially reducing the Fund’s income. As interest rates increase, slower than expected principal payments may extend the average life of securities, potentially locking in a below-market interest rate and reducing the Fund’s value. In typical market interest rate environments, the prices of longer-term debt securities generally fluctuate more than prices of shorter-term debt securities as interest rates change. The Federal Reserve recently reduced the federal Funds rate several times.
LIBOR Floor Risk. Many floating rate loans issued after 2008 include a “LIBOR floor”, or minimum interest rate to which the loan’s spread is added, to calculate the loan’s overall interest rate. As short-term market rates rise, such loans will not pay higher interest until prevailing rates exceed the floor rate stated in the loan documents. If such a Fund uses floating rate leverage, the Fund’s leverage costs will likely increase before its loan portfolio income increases, and the additional income provided by leverage may diminish until market rates exceed the LIBOR floor level. The Fund’s investments in floating rate loans that pay interest based on LIBOR may experience increase volatility and/or illiquidity during the transition away from LIBOR, which is scheduled to be phased out by the end of 2021.
132
Loan Settlement Risk. Lack of established settlement standards or remedies for failure to settle may cause the Fund to lack timely access to proceeds from selling loans, or to investment exposure from buying loans.
Reinvestment Risk. Reinvestment risk is the risk that income from the Fund’s portfolio will decline if and when the Fund invests the proceeds from matured, traded or called securities at market interest rates that are below the portfolio’s current earnings rate. A decline in income could affect the common shares’ market price, NAV and/or a common shareholder’s overall returns.
Reverse Repurchase Agreement Risk. Reverse repurchase agreements, in economic essence, constitute a securitized borrowing by the Fund from the security purchaser. The Fund may enter into reverse repurchase agreements for the purpose of creating a leveraged investment exposure and, as such, their usage involves essentially the same risks associated with a leveraging strategy generally since the proceeds from these agreements may be invested in additional securities. Reverse repurchase agreements tend to be short-term in tenor, and there can be no assurances that the purchaser (lender) will commit to extend or “roll” a given agreement upon its agreed-upon repurchase date or an alternative purchaser can be identified on similar terms. Reverse repurchase agreements also involve the risk that the purchaser fails to return the securities as agreed upon, files for bankruptcy or becomes insolvent. The Fund may be restricted from taking normal portfolio actions during such time, could be subject to loss to the extent that the proceeds of the agreement are less than the value of securities subject to the agreement and may experience adverse tax consequences.
Risks of When-Issued Purchases. The Fund may purchase securities on a when-issued or forward-commitment basis. Delivery and payment for securities that have been purchased in this manner can take place a month or more after the transaction date. Such securities do not earn interest, are subject to market fluctuation, and may increase or decrease in value prior to their delivery. The purchase of securities on a when-issued or forward commitment basis may increase the volatility of the Fund’s net asset value if the Fund makes such purchases while remaining substantially fully invested.
Senior Loan Risk. Senior loans, both secured and unsecured, may not be rated by a national rating agency, are generally not registered with the Securities and Exchange Commission (SEC) and generally are not listed on a securities exchange. Consequently, the amount of public information available about senior loans generally is less extensive than that available for more widely rated, registered and exchange-listed securities. In addition, some adjustable rate loans may be unsecured or insufficiently collateralized, which increases the risk of Fund losses if the loan’s issuer defaults.
Structured Product Risk. The Fund may invest in structured products such as structured notes. Holders of structured products bear risks of the underlying investments, index or reference obligation and are subject to counterparty risk. The Fund may have the right to receive payments to which it is entitled only from the structured product, and generally does not have direct rights against the issuer or the entity that sold assets to the special purpose trust. While certain structured products enable the investor to acquire interests in a pool of securities without the brokerage and other expenses associated with directly holding the same securities, investors in structured products generally pay their share of the structured product’s administrative and other expenses. When investing in structured products, it is impossible to predict whether the underlying index or prices of the underlying securities will rise or fall, but prices of the underlying indices and securities (and, therefore, the prices of structured products) will be influenced by the same types of political and economic events that affect particular issuers of securities and capital markets generally. Certain structured products may be thinly traded or have a limited trading market and may have the effect of increasing the illiquidity of the Fund’s portfolio to the extent that the Fund, at a particular point in time, may be unable to find qualified buyers for these securities. Investments in structured notes involve risks including income risk, credit and market risk. Structured notes may be less liquid than other types of securities and more volatile than the reference instrument or security underlying the note.
Warrants and Equity Securities Risk. Investments in warrants and equity securities entail certain risks in addition to those associated with investments in adjustable rate instruments or other debt instruments. The value of warrants and equity securities may be affected more rapidly, and to a greater extent, by company-specific developments and general market conditions. These risks may increase fluctuations in the Fund’s NAV. The Fund may possess material non-public information about an issuer as a result of its ownership of an adjustable rate instrument or other debt instrument of such issuer. Because of prohibitions on trading in securities of issuers while in possession of such information, the Fund might be unable to enter into a transaction in a security of such an issuer when it would otherwise be advantageous to do so.
Zero Coupon Bonds Risk. Because interest on zero coupon bonds is not paid on a current basis, the values of zero coupon bonds will be more volatile in response to interest rate changes than the values of bonds that distribute income regularly. Although zero coupon bonds generate income for accounting purposes, they do not produce cash flow, and thus the Fund could be forced to liquidate securities at an inopportune time in order to generate cash to distribute to shareholders as required by tax laws.
Fund Level and Other Risks:
Anti-Takeover Provisions. The Fund’s Declaration of Trust and By-laws include provisions that could limit the ability of other entities or persons to acquire control of the Fund or convert the Fund to open-end status. These provisions could have the effect of depriving the common shareholders of opportunities to sell their common shares at a premium over the then-current market price of the common shares.
Global economic risk. National and regional economies and financial markets are becoming increasingly interconnected, which increases the possibilities that conditions in one country, region or market might adversely impact issuers in a different country, region or market. Changes in legal, political,
133
Shareholder Update (continued)
(Unaudited)
regulatory, tax and economic conditions may cause fluctuations in markets and securities prices around the world, which could negatively impact the value of the Fund’s investments. Major economic or political disruptions, particularly in large economies like China’s, may have global negative economic and market repercussions. Additionally, events such as war, terrorism, natural and environmental disasters and the spread of infectious illnesses or other public health emergencies may adversely affect the global economy and the markets and issuers in which the Fund invests. Recent examples of such events include the outbreak of a novel coronavirus known as COVID-19 that was first detected in China in December 2019 and heightened concerns regarding North Korea’s nuclear weapons and long-range ballistic missile programs. These events could reduce consumer demand or economic output, result in market closure, travel restrictions or quarantines, and generally have a significant impact on the economy. These events could also impair the information technology and other operational systems upon which the Fund’s service providers, including the investment adviser and sub-adviser, rely, and could otherwise disrupt the ability of employees of the Fund’s service providers to perform essential tasks on behalf of the Fund. Governmental and quasi-governmental authorities and regulators throughout the world have in the past responded to major economic disruptions with a variety of significant fiscal and monetary policy changes, including but not limited to, direct capital infusions into companies, new monetary programs and dramatically lower interest rates. An unexpected or quick reversal of these policies, or the ineffectiveness of these policies, could increase volatility in securities markets, which could adversely affect the Fund’s investments.
Investment and Market Risk. An investment in common shares is subject to investment risk, including the possible loss of the entire principal amount that you invest. Common shares frequently trade at a discount to their NAV. An investment in common shares represents an indirect investment in the securities owned by the Fund. Common shares at any point in time may be worth less than your original investment, even after taking into account the reinvestment of Fund dividends and distributions.
Leverage Risk. The Fund’s use of leverage may cause higher volatility for the Fund’s per share NAV, market price, and distributions. Leverage typically magnifies the total return of the Fund’s portfolio, whether that return is positive or negative. Leverage is intended to increase common share net income, but there is no assurance that the Fund’s leveraging strategy will be successful. Different forms of leverage, including swaps, may introduce additional credit or interest rate risk. Leverage may also increase a Fund’s liquidity risk, as the Fund may need to sell securities at inopportune times to stay within Fund or regulatory limits.
Market Discount from Net Asset Value. Shares of closed-end investment companies like the Fund frequently trade at prices lower than their NAV, which creates a risk of loss for investors when they sell shares. This characteristic is a risk separate and distinct from the risk that the Fund’s NAV could decrease as a result of investment activities. Shares of closed-end investment companies like the Fund have during some periods traded at prices higher than NAV and have during other periods traded at prices lower than NAV. Whether investors will realize gains or losses upon the sale of the common shares will depend not upon the Fund’s NAV but entirely upon whether the market price of the common shares at the time of sale is above or below the investor’s purchase price for the common shares. Furthermore, management may have difficulty meeting the Fund’s investment objective and managing its portfolio when the underlying securities are redeemed or sold during periods of market turmoil and as investors’ perceptions regarding closed-end funds or their underlying investments change. Because the market price of the common shares will be determined by factors such as relative supply of and demand for the common shares in the market, general market and economic circumstances, and other factors beyond the control of the Fund, the Fund cannot predict whether the common shares will trade at, below or above NAV. The common shares are designed primarily for long-term investors, and you should not view the Fund as a vehicle for short-term trading purposes.
Tax Risk. The tax treatment of Fund distributions may be affected by future changes in tax laws and regulations or their interpretation by the Internal Revenue Service or state tax authorities.
Valuation Risk. The Fund utilizes independent pricing services approved by the Board of Trustees to value portfolio instruments at their market value. If the pricing services are unable to provide a market value or if a significant event occurs such that the valuation(s) provided are deemed unreliable, the Fund may value portfolio instrument(s) at their fair value, which is generally the amount an owner might reasonably expect to receive upon a current sale. Valuation risks associated with investing in below investment grade debt instruments including, but not limited to: a limited number of market participants, a lack of publicly-available information, resale restrictions, settlement delays, corporate actions and adverse market conditions may make it difficult to value or sell such instruments. Because non-U.S. instruments may trade on days when Common Shares are not priced or traded, NAV can change at times when Common Shares cannot be sold.
134
NUVEEN FLOATING RATE INCOME OPPORTUNITIES FUND (JRO)
Investment Objective
The Fund has an investment objective to achieve a high level of current income.
Investment Policies
The Fund invests primarily in adjustable rate loans, primarily secured senior loans.
“Managed Assets” means the total assets of the Fund, minus the sum of its accrued liabilities (other than Fund liabilities incurred for the express purpose of creating leverage). Total assets for this purpose shall include assets attributable to the Fund’s use of leverage (whether or not those assets are reflected in the Fund’s financial statements for purposes of generally accepted accounting principles), and derivatives will be valued at their market value. “Assets” means net assets of the Fund plus the amount of any borrowings for investment purposes.
Under normal circumstances:
| | • | | The Fund invests at least 80% of its Assets in adjustable rate loans, primarily secured senior loans. With respect to the Fund’s senior loans included in the 80% policy, such instruments will not at all times have a dollar-weighted average time until the next interest rate adjustment of 90 days or less. As part of the 80% requirement, the Fund also may invest in adjustable rate unsecured senior loans (together with secured senior loans referred to herein as “Senior Loans”) and adjustable rate secured and unsecured subordinated loans. “Senior Loans” include floating or variable rate, U.S. dominated secured and unsecured loans that hold the most senior position in the capital structure of an issuer. Adjustable rate Senior Loans and adjustable rate subordinated loans are sometimes collectively referred to as “Adjustable Rate Loans.” Adjustable Rate Loans pay interest at rates that are redetermined periodically at short-term intervals by reference to a base lending rate, primarily the London Interbank Offered Rate (“LIBOR”) (of any tenor, but typically between one month and six months, and currently), plus a premium. The Fund invests no more than 20% of its total assets in Senior Loans in which it acts as an agent or co-agent and the size of any such individual Senior Loan will not exceed 5% of the Fund’s total assets. |
| | • | | The Fund may invest its Managed Assets without limit in Adjustable Rate Loans and other debt instruments that are, at the time of investment, rated below investment grade or unrated but judged to be of comparable quality. Investment grade quality securities are those securities that, at the time of investment, are (i) rated by at least one nationally recognized statistical rating organization (“NRSRO”) within the four highest grades (BBB- or Baa3 or better by Standard & Poor’s Corporation Ratings Group, a division of The McGraw-Hill Companies (“S&P”), Moody’s Investor Service Inc. (“Moody’s”) or Fitch Ratings, part of the Fitch Group (“Fitch”), or (ii) unrated but judged to be of comparable quality. However, the Fund may not invest, at the time of investment, more than 30% of its Managed Assets in securities rated below CCC+ or Caa by any NRSRO that rate such security or are unrated but judged to be of comparable quality, including securities in default. |
| | • | | The Fund may invest up to 20% of its Managed Assets in the following adjustable or fixed rate securities: (i) other debt securities such as investment and non-investment grade debt securities, fixed rate Senior Loans or subordinated loans, convertible securities and structured notes (other than structured notes that are designed to provide returns and risks that emulate those of Adjustable Rate Loans, which may be treated as an investment in Adjustable Rate Loans for purposes of the 80% requirement set forth above); (ii) mortgage-related and other asset-backed securities (including collateralized loan obligations and collateralized debt obligations); and (iii) debt securities and other instruments issued by government, government-related or supranational issuers (commonly referred to as sovereign debt securities). |
| | • | | No more than 5% of the Fund’s Managed Assets may be invested in each of convertible securities, mortgage-related and other asset-backed securities, and sovereign debt securities. |
| | • | | The Fund also may receive warrants and equity securities issued by an issuer or its affiliates in connection with the Fund’s other investments in such entities. |
| | • | | The Fund invests at least 65% of its Managed Assets in Senior Loans that are secured by specific collateral. Such collateral consists of assets and/or stock of the borrower. |
| | • | | The Fund maintains an average duration of one year or less for its portfolio investments in Adjustable Rate Loans and other debt instruments. |
| | • | | The Fund will not invest in inverse floating rate securities. |
| | • | | The Fund may invest up to 20% of its Managed Assets in securities of non-U.S. Issuers that are U.S. dollar or non-U.S. dollar denominated. The Fund’s Managed Assets to be invested in Adjustable Rate Loans and other debt instruments of non-U.S. Issuers may include debt securities of Issuers located, or conducting their business in, emerging markets countries. |
| | • | | The Fund may not invest more than 20% of its Managed Assets in securities from an industry which (for these purposes ) generally refers to the classification of companies in the same or similar lines of business such as the automotive, textiles and apparel, hotels, media production and consumer retailing industries. The Fund may invest more than 20% of its Managed Assets in sectors which (for these purposes) generally refers to |
135
Shareholder Update (continued)
(Unaudited)
| | broader classifications of industries, such as the consumer discretionary sector which includes the automotive, textiles and apparel, hotels, media production and consumer retailing industries, provided the Fund’s investment in a particular industry within the sector does not exceed the industry limitation. |
| | • | | The Fund may invest up to 50% of its Managed Assets in securities and other instruments that, at the time of investment, are illiquid (i.e., securities that are not readily marketable). The appreciation of illiquid securities or the description of liquid securities may put the Fund in a position where more than 50% of the value of its Managed Assets is invested in illiquid securities. In such circumstances, the Fund will not invest in any additional investments that are liquid at the time of investment. |
| | • | | The Fund may invest up to 5% of its Managed Assets in iBoxx Loan Total Return Swaps. An iBoxx Loan Total Return Swap is a specific type of total return swap on an index that is designed to provide exposure to the Senior Loan market. The iBoxx Loan Total Return Swap’s underlying index is the Markit iBoxx USD Liquid Leveraged Loans Total Return Index, which is one of a subset of indices designed to track the broader, rules-based Markit iBoxx USD Liquid Leveraged Loan Index. “iBoxx Loan Total Return Swaps” means total return swaps written on the Markit iBoxx USD Liquid Leveraged Loans Total Return Index. |
For purposes of the investment policies provided above such policies only apply at the time of purchase and will not be considered violated unless an excess or deficiency occurs or exists immediately after and as a result of an acquisition of securities.
The Board of Trustees of the Fund may change a policy without a shareholder vote. However, with respect to the Fund’s policy of investing at least 80% of its Assets in adjustable rate loans, such policy may not be changed without 60 days’ prior written notice.
The Fund uses leverage to pursue its investment objective. The Fund may use leverage to the extent permitted by the 1940 Act. The Fund may source leverage through a number of methods including through borrowings, issuing preferred shares of beneficial and the issuance of debt securities and entering into reverse repurchase agreements (effectively a borrowing). In addition, the Fund may use derivatives that may have the economic effect of leverage, such as certain credit default swaps, total return swaps and bond futures. The amount and sources of leverage will vary depending on market conditions.
During temporary defensive periods, the Fund may deviate from its investment policies and objective. During such periods, the Fund may invest up to 100% of its assets in high quality, short-term securities, and in short-, intermediate-, or long-term U.S. Treasury securities. There can be no assurance that such techniques will be successful. Accordingly, during such periods, the Fund may not achieve its investment objective.
Principal Risks
The Fund is a diversified, closed-end management investment company designed primarily as a long-term investment and not as a trading vehicle. The Fund is not intended to be a complete investment program and, due to the uncertainty inherent in all investments, there can be no assurance that the Fund will achieve its investment objective.
Investing in the Fund involves a number of risks, including those described below:
Portfolio Level Risks:
Basis Risk. As short-term rates change, interest from floating rate loans may not increase in concert with increases in floating rate leverage, introducing basis or imperfect hedging risk.
Below Investment Grade Risk. Debt instruments of below investment grade quality are regarded as having predominately speculative characteristics with respect to the issuer’s capacity to pay interest, dividends and repay principal, and are commonly referred to as junk bonds or high yield debt, which implies higher price volatility and default risk than investment grade instruments of comparable terms and duration. Issuers of lower grade instruments may be highly leveraged and may not have available to them more traditional methods of financing. The prices of these lower grade instruments are typically more sensitive to negative developments, such as a decline in the issuer’s revenues or a general economic downturn, than are the prices of higher grade instruments. If a below investment grade security goes into default, or its issuer enters bankruptcy, it might be difficult to sell that security in a timely manner at a reasonable price.
Counterparty Risk. Certain derivative instruments subject the Fund to the risk that the counterparty could default on its obligations under the agreement, either through the counterparty’s bankruptcy or failure to perform its obligations. In the event of default, the Fund could experience lengthy delays in recovering some or all of its assets or no recovery at all. The Fund’s investments in the futures markets also introduce the risk that its futures commission merchant (“FCM”) would default on an obligation set forth in an agreement between the Fund and the FCM, including the FCM’s obligation to return margin posted in connection with the Fund’s futures contracts. The failure or bankruptcy of the Fund’s FCM could result in a substantial loss of Fund assets. The payment obligation for a cleared, over-the-counter derivative transaction is guaranteed by a central counterparty, which exposes the Fund to the creditworthiness of the central counterparty.
136
Credit Risk. Debt or preferred securities held by the Fund may fail to make dividend or interest payments when due. Investments in securities below investment grade credit quality are predominantly speculative and subject to greater volatility and risk of default. Unrated securities are evaluated by Fund managers using industry data and their own analysis processes that may be similar to that of a nationally recognized rating agency; however, such internal ratings are not equivalent to a national agency credit rating. Counterparty credit risk may arise if counterparties fail to meet their obligations, should the Fund hold any derivative instruments for either investment exposure or hedging purposes.
Currency Risk. The prices of any non-U.S. securities held by the Fund that are traded in U.S. dollars are typically indirectly influenced by currency fluctuations. Changes in currency exchange rates may affect the Fund’s net asset value, interest earned, and gains or losses realized on the sale of securities. Changes in currency exchange rates will also affect the value of non-U.S. dollar denominated securities, the value of dividends and interest earned from such securities, gains and losses realized on the sale of such securities, and derivative transactions tied to such securities. A strong U.S. dollar relative to these other currencies will adversely affect the value of the Fund’s portfolio.
Deflation Risk. Deflation risk is the risk that prices throughout the economy decline over time, which may have an adverse effect on the market valuation of companies, their assets and revenues. In addition, deflation may have an adverse effect on the creditworthiness of issuers and may make issuer default more likely, which may result in a decline in the value of the Fund’s portfolio.
Derivatives Risk. The use of derivatives involves additional risks and transaction costs which could leave the Fund in a worse position than if it had not used these instruments. Derivative instruments can be used to acquire or to transfer the risk and returns of a security or other asset without buying or selling the security or asset. These instruments may entail investment exposures that are greater than their cost would suggest. As a result, a small investment in derivatives can result in losses that greatly exceed the original investment. Derivatives can be highly volatile, illiquid and difficult to value. An over-the-counter derivative transaction between the Fund and a counterparty that is not cleared through a central counterparty also involves the risk that a loss may be sustained as a result of the failure of the counterparty to the contract to make required payments. The payment obligation for a cleared derivative transaction is guaranteed by a central counterparty, which exposes the Fund to the creditworthiness of the central counterparty.
It is possible that developments in the derivatives market, including changes in government regulation, could adversely impact the Fund’s ability to invest in certain derivatives.
Duration Risk. Duration is the sensitivity, expressed in years, of the price of a fixed-income security to changes in the general level of interest rates (or yields). Securities with longer durations tend to be more sensitive to interest rate (or yield) changes, which typically corresponds to increased volatility and risk, than securities with shorter durations. For example, if a security or portfolio has a duration of three years and interest rates increase by 1%, then the security or portfolio would decline in value by approximately 3%. Duration differs from maturity in that it considers potential changes to interest rates, and a security’s coupon payments, yield, price and par value and call features, in addition to the amount of time until the security matures. The duration of a security will be expected to change over time with changes in market factors and time to maturity.
Floating-Rate and Fixed-to-Floating-Rate Securities Risk. The market value of floating-rate securities is a reflection of discounted expected cash flows based on expectations for future interest rate resets. The market value of such securities may fall in a declining interest rate environment and may also fall in a rising interest rate environment if there is a lag between the rise in interest rates and the reset. This risk may also be present with respect to fixed-to-floating-rate securities in which the Fund may invest. A secondary risk associated with declining interest rates is the risk that income earned by the Fund on floating-rate and fixed-to-floating-rate securities will decline due to lower coupon payments on floating rate securities.
Foreign Security Risk and Risks of Emerging Markets. Securities of foreign issuers, even when dollar-denominated and publicly traded in the United States, may involve risks not associated with the securities of domestic issuers. For certain foreign countries, political or social instability, or diplomatic developments could adversely affect the securities. There is also the risk of loss due to governmental actions such as a change in tax statutes or the modification of individual property rights. In addition, individual foreign economies may differ favorably or unfavorably from the U.S. economy.
The risks of foreign investing are particularly significant in emerging markets. Investing in emerging markets generally involves exposure to economic structures that are less diverse and mature, and to political systems that are less stable, than those of developed countries. In addition, issuers in emerging markets typically are subject to a greater degree of change in earnings and business prospects than are companies in developed markets.
Illiquid Investments Risk. The risk that illiquid investments may be difficult to sell for the value at which they are carried, if at all, or at any price within the desired time frame.
Income Risk. The Fund’s income could decline due to falling market interest rates. This is because, in a falling interest rate environment, the Fund generally will have to invest the proceeds from sales of Fund shares, as well as the proceeds from maturing portfolio securities, in lower-yielding securities.
Inflation Risk. Inflation risk is the risk that the value of assets or income from investments will be worth less in the future as inflation decreases the value of money. As inflation increases, the real value of the Common Shares and distributions can decline.
137
Shareholder Update (continued)
(Unaudited)
Interest Rate Risk. Interest rate risk is the risk that debt securities in the Fund’s portfolio will decline in value because of changes in market interest rates. Generally, when market interest rates rise, the market value of such securities will fall, and vice versa. As interest rates decline, issuers of debt securities may prepay principal earlier than scheduled, forcing the Fund to reinvest in lower-yielding securities and potentially reducing the Fund’s income. As interest rates increase, slower than expected principal payments may extend the average life of securities, potentially locking in a below-market interest rate and reducing the Fund’s value. In typical market interest rate environments, the prices of longer-term debt securities generally fluctuate more than prices of shorter-term debt securities as interest rates change. The Federal Reserve recently reduced the federal Funds rate several times.
LIBOR Floor Risk. Many floating rate loans issued after 2008 include a “LIBOR floor”, or minimum interest rate to which the loan’s spread is added, to calculate the loan’s overall interest rate. As short-term market rates rise, such loans will not pay higher interest until prevailing rates exceed the floor rate stated in the loan documents. If such a Fund uses floating rate leverage, the Fund’s leverage costs will likely increase before its loan portfolio income increases, and the additional income provided by leverage may diminish until market rates exceed the LIBOR floor level. The Fund’s investments in floating rate loans that pay interest based on LIBOR may experience increase volatility and/or illiquidity during the transition away from LIBOR, which is scheduled to be phased out by the end of 2021.
Loan Settlement Risk. Lack of established settlement standards or remedies for failure to settle may cause the Fund to lack timely access to proceeds from selling loans, or to investment exposure from buying loans.
Other Investment Companies Risk. The Fund may invest in the securities of other investment companies, including ETFs. Investing in an investment company exposes the Fund to all of the risks of that investment company’s investments. The Fund, as a holder of the securities of other investment companies, will bear its pro rata portion of the other investment companies’ expenses, including advisory fees. These expenses are in addition to the direct expenses of the Fund’s own operations. As a result, the cost of investing in investment company shares may exceed the costs of investing directly in its underlying investments. In addition, securities of other investment companies may be leveraged. As a result, the Fund may be indirectly exposed to leverage through an investment in such securities and therefore magnify the Fund’s leverage risk. Utilization of leverage is a speculative investment technique and involves certain risks. With respect to ETF’s, an ETF that is based on a specific index may not be able to replicate and maintain exactly the composition and relative weighting of securities in the index. The value of an ETF based on a specific index is subject to change as the values of its respective component assets fluctuate according to market volatility. ETFs typically rely on a limited pool of authorized participants to create and redeem shares, and an active trading market for ETF shares may not develop or be maintained. The market value of shares of ETFs and closed-end funds may differ from their NAV.
Reinvestment Risk. Reinvestment risk is the risk that income from the Fund’s portfolio will decline if and when the Fund invests the proceeds from matured, traded or called securities at market interest rates that are below the portfolio’s current earnings rate. A decline in income could affect the common shares’ market price, NAV and/or a common shareholder’s overall returns.
Reverse Repurchase Agreement Risk. Reverse repurchase agreements, in economic essence, constitute a securitized borrowing by the Fund from the security purchaser. The Fund may enter into reverse repurchase agreements for the purpose of creating a leveraged investment exposure and, as such, their usage involves essentially the same risks associated with a leveraging strategy generally since the proceeds from these agreements may be invested in additional securities. Reverse repurchase agreements tend to be short-term in tenor, and there can be no assurances that the purchaser (lender) will commit to extend or “roll” a given agreement upon its agreed-upon repurchase date or an alternative purchaser can be identified on similar terms. Reverse repurchase agreements also involve the risk that the purchaser fails to return the securities as agreed upon, files for bankruptcy or becomes insolvent. The Fund may be restricted from taking normal portfolio actions during such time, could be subject to loss to the extent that the proceeds of the agreement are less than the value of securities subject to the agreement and may experience adverse tax consequences.
Risks of When-Issued Purchases. The Fund may purchase securities on a when-issued or forward-commitment basis. Delivery and payment for securities that have been purchased in this manner can take place a month or more after the transaction date. Such securities do not earn interest, are subject to market fluctuation, and may increase or decrease in value prior to their delivery. The purchase of securities on a when-issued or forward commitment basis may increase the volatility of the Fund’s net asset value if the Fund makes such purchases while remaining substantially fully invested.
Senior Loan Risk. Senior loans, both secured and unsecured, may not be rated by a national rating agency, are generally not registered with the Securities and Exchange Commission (SEC) and generally are not listed on a securities exchange. Consequently, the amount of public information available about senior loans generally is less extensive than that available for more widely rated, registered and exchange-listed securities. In addition, some adjustable rate loans may be unsecured or insufficiently collateralized, which increases the risk of Fund losses if the loan’s issuer defaults.
Structured Product Risk. The Fund may invest in structured products such as structured notes. Holders of structured products bear risks of the underlying investments, index or reference obligation and are subject to counterparty risk. The Fund may have the right to receive payments to which it is entitled only from the structured product, and generally does not have direct rights against the issuer or the entity that sold assets to the special purpose trust. While certain structured products enable the investor to acquire interests in a pool of securities without the brokerage and other expenses associated with directly holding the same securities, investors in structured products generally pay their share of the structured product’s administrative and other
138
expenses. When investing in structured products, it is impossible to predict whether the underlying index or prices of the underlying securities will rise or fall, but prices of the underlying indices and securities (and, therefore, the prices of structured products) will be influenced by the same types of political and economic events that affect particular issuers of securities and capital markets generally. Certain structured products may be thinly traded or have a limited trading market and may have the effect of increasing the illiquidity of the Fund’s portfolio to the extent that the Fund, at a particular point in time, may be unable to find qualified buyers for these securities. Investments in structured notes involve risks including income risk, credit and market risk. Structured notes may be less liquid than other types of securities and more volatile than the reference instrument or security underlying the note.
Warrants and Equity Securities Risk. Investments in warrants and equity securities entail certain risks in addition to those associated with investments in adjustable rate instruments or other debt instruments. The value of warrants and equity securities may be affected more rapidly, and to a greater extent, by company-specific developments and general market conditions. These risks may increase fluctuations in the Fund’s NAV. The Fund may possess material non-public information about an issuer as a result of its ownership of an adjustable rate instrument or other debt instrument of such issuer. Because of prohibitions on trading in securities of issuers while in possession of such information, the Fund might be unable to enter into a transaction in a security of such an issuer when it would otherwise be advantageous to do so.
Zero Coupon Bonds Risk. Because interest on zero coupon bonds is not paid on a current basis, the values of zero coupon bonds will be more volatile in response to interest rate changes than the values of bonds that distribute income regularly. Although zero coupon bonds generate income for accounting purposes, they do not produce cash flow, and thus the Fund could be forced to liquidate securities at an inopportune time in order to generate cash to distribute to shareholders as required by tax laws.
Fund Level and Other Risks:
Anti-Takeover Provisions. The Fund’s Declaration of Trust and By-laws include provisions that could limit the ability of other entities or persons to acquire control of the Fund or convert the Fund to open-end status. These provisions could have the effect of depriving the common shareholders of opportunities to sell their common shares at a premium over the then-current market price of the common shares.
Global economic risk. National and regional economies and financial markets are becoming increasingly interconnected, which increases the possibilities that conditions in one country, region or market might adversely impact issuers in a different country, region or market. Changes in legal, political, regulatory, tax and economic conditions may cause fluctuations in markets and securities prices around the world, which could negatively impact the value of the Fund’s investments. Major economic or political disruptions, particularly in large economies like China’s, may have global negative economic and market repercussions. Additionally, events such as war, terrorism, natural and environmental disasters and the spread of infectious illnesses or other public health emergencies may adversely affect the global economy and the markets and issuers in which the Fund invests. Recent examples of such events include the outbreak of a novel coronavirus known as COVID-19 that was first detected in China in December 2019 and heightened concerns regarding North Korea’s nuclear weapons and long-range ballistic missile programs. These events could reduce consumer demand or economic output, result in market closure, travel restrictions or quarantines, and generally have a significant impact on the economy. These events could also impair the information technology and other operational systems upon which the Fund’s service providers, including the investment adviser and sub-adviser, rely, and could otherwise disrupt the ability of employees of the Fund’s service providers to perform essential tasks on behalf of the Fund. Governmental and quasi-governmental authorities and regulators throughout the world have in the past responded to major economic disruptions with a variety of significant fiscal and monetary policy changes, including but not limited to, direct capital infusions into companies, new monetary programs and dramatically lower interest rates. An unexpected or quick reversal of these policies, or the ineffectiveness of these policies, could increase volatility in securities markets, which could adversely affect the Fund’s investments.
Investment and Market Risk. An investment in common shares is subject to investment risk, including the possible loss of the entire principal amount that you invest. Common shares frequently trade at a discount to their NAV. An investment in common shares represents an indirect investment in the securities owned by the Fund. Common shares at any point in time may be worth less than your original investment, even after taking into account the reinvestment of Fund dividends and distributions.
Leverage Risk. The Fund’s use of leverage may cause higher volatility for the Fund’s per share NAV, market price, and distributions. Leverage typically magnifies the total return of the Fund’s portfolio, whether that return is positive or negative. Leverage is intended to increase common share net income, but there is no assurance that the Fund’s leveraging strategy will be successful. Different forms of leverage, including swaps, may introduce additional credit or interest rate risk. Leverage may also increase a Fund’s liquidity risk, as the Fund may need to sell securities at inopportune times to stay within Fund or regulatory limits.
Market Discount from Net Asset Value. Shares of closed-end investment companies like the Fund frequently trade at prices lower than their NAV, which creates a risk of loss for investors when they sell shares. This characteristic is a risk separate and distinct from the risk that the Fund’s NAV could decrease as a result of investment activities. Shares of closed-end investment companies like the Fund have during some periods traded at prices higher than NAV and have during other periods traded at prices lower than NAV. Whether investors will realize gains or losses upon the sale of the common shares will depend not upon the Fund’s NAV but entirely upon whether the market price of the common shares at the time of sale is above or below the investor’s
139
Shareholder Update (continued)
(Unaudited)
purchase price for the common shares. Furthermore, management may have difficulty meeting the Fund’s investment objective and managing its portfolio when the underlying securities are redeemed or sold during periods of market turmoil and as investors’ perceptions regarding closed-end funds or their underlying investments change. Because the market price of the common shares will be determined by factors such as relative supply of and demand for the common shares in the market, general market and economic circumstances, and other factors beyond the control of the Fund, the Fund cannot predict whether the common shares will trade at, below or above NAV. The common shares are designed primarily for long-term investors, and you should not view the Fund as a vehicle for short-term trading purposes.
Tax Risk. The tax treatment of Fund distributions may be affected by future changes in tax laws and regulations or their interpretation by the Internal Revenue Service or state tax authorities.
Valuation Risk. The Fund utilizes independent pricing services approved by the Board of Trustees to value portfolio instruments at their market value. If the pricing services are unable to provide a market value or if a significant event occurs such that the valuation(s) provided are deemed unreliable, the Fund may value portfolio instrument(s) at their fair value, which is generally the amount an owner might reasonably expect to receive upon a current sale. Valuation risks associated with investing in below investment grade debt instruments including, but not limited to: a limited number of market participants, a lack of publicly-available information, resale restrictions, settlement delays, corporate actions and adverse market conditions may make it difficult to value or sell such instruments. Because non-U.S. instruments may trade on days when Common Shares are not priced or traded, NAV can change at times when Common Shares cannot be sold.
140
NUVEEN SHORT DURATION CREDIT OPPORTUNITIES FUND (JSD)
Investment Objective
The Fund has an investment objective to provide current income and the potential for capital appreciation.
Investment Policies
The Fund’s portfolio will be invested primarily in below investment grade adjustable rate corporate debt instruments, including senior secured loans, second lien loans, and other adjustable rate corporate debt instruments. The Fund also may invest in other types of debt instruments and enter into short positions consisting primarily of high yield debt.
“Managed Assets” means the total assets of the Fund, minus the sum of its accrued liabilities (other than Fund liabilities incurred for the express purpose of creating leverage). Total assets for this purpose shall include assets attributable to the Fund’s use of leverage (whether or not those assets are reflected in the Fund’s financial statements for purposes of generally accepted accounting principles), and derivatives will be valued at their market value. “Assets” means net assets of the Fund plus the amount of any borrowings for investment purposes.
Under normal circumstances:
| | • | | The Fund will invest at least 80% of Assets, at time of purchase, in loans or securities in the issuing company’s capital structure that are senior to its common equity, including but not limited to debt securities and preferred securities. |
| | • | | The Fund invests at least 70% of its Managed Assets in adjustable rate corporate debt instruments, including senior secured loans, second lien loans, and other adjustable rate corporate debt instruments. |
| | • | | The Fund may invest in high yield debt and other debt instruments as described herein in an aggregate amount of up to 30% of its Managed Assets. |
| | • | | The Fund will invest at least 80% of its Managed Assets in corporate debt instruments that are, at the time of investment, rated below investment grade or unrated but judged by the Fund’s sub-adviser to be of comparable quality. Investment grade quality securities are those securities that, at the time of investment, are (i) rated by at least one nationally recognized statistical rating organization (“NRSRO”) within the four highest grades (BBB- or Baa3 or better by Standard & Poor’s Corporation, a division of The McGraw-Hill Companies (“S&P”), Moody’s Investor Service Inc. (“Moody’s”) or Fitch Ratings, part of the Fitch Group (“Fitch”), or (ii) unrated but judged to be of comparable quality. However, the Fund may not invest, at the time of investment, more than 30% of its Managed Assets in securities rated below CCC+ or Caa by any NRSRO that rate such security or are unrated but judged to be of comparable quality, including securities in default. |
| | • | | The Fund may enter into short positions, consisting primarily of high yield debt, either directly or through the use of derivatives, including credit default swaps, creating a negative investment exposure or hedging existing long (positive) investment exposure in a notional amount up to 20% of its Managed Assets. |
| | • | | The Fund will maintain an average duration of two years or less for its portfolio (including the effect of leverage, but after the effect of derivatives used to shorten duration). “Average duration” and “average portfolio duration” are each defined to be the modified duration of the Fund’s portfolio, which is the measure of a debt instrument’s or a portfolio’s price sensitivity with respect to changes in market yields adjusted to reflect the effect of the Fund’s use of leverage. |
| | • | | The Fund may invest up to 20% of its Managed Assets in debt instruments of non-U.S. issuers (which term includes borrowers) that are U.S. dollar or non-U.S. dollar denominated. The Fund’s investments in debt instruments of non-U.S. issuers may include debt instruments located, or conducting their business, in emerging market countries. |
| | • | | The Fund may invest up to 10% of its Managed Assets in securities of other open- or closed-end investment companies (including exchange traded Funds (“ETFs”)) that invest primarily in securities of the types in which the Fund may invest directly. |
For purposes of the investment policies provided above such policies only apply at the time of purchase and will not be considered violated unless an excess or deficiency occurs or exists immediately after and as a result of an acquisition of securities.
The Board of Trustees of the Fund may change a policy without a shareholder vote. However, with respect to the Fund’s policy of investing at least 80% of its Assets in loans or securities in the issuing company’s capital structure that are senior to its common equity, such policy may not be changed without 60 days’ prior written notice.
The Fund may enter into certain derivative transactions, such as credit default swaps and interest rate swaps, as a hedging technique to protect against potential adverse changes in the market value of portfolio instruments. The Fund also may use derivatives to attempt to protect the net asset value (“NAV”) of the Fund, to facilitate the sale of certain portfolio instruments, to manage the Fund’s effective interest rate exposure, and as a temporary substitute for purchasing or selling particular instruments. From time to time, the Fund also may enter into derivative transactions such as total return
141
Shareholder Update (continued)
(Unaudited)
swaps on an underlying index to create investment exposure to the extent such transactions may facilitate implementation of its strategy more efficiently than through outright purchases or sales of portfolio instruments. The Fund will not enter into interest rate swap transactions having a notional amount that exceeds the outstanding amount of the Fund’s leverage.
The Fund uses leverage to pursue its investment objective. The Fund may use leverage to the extent permitted by the 1940 Act. The Fund may source leverage through a number of methods including through borrowings, issuing preferred shares of beneficial and the issuance of debt securities. In addition, the Fund may use derivatives that may have the economic effect of leverage, such as certain credit default swaps, total return swaps and bond futures. The amount and sources of leverage will vary depending on market conditions.
During temporary defensive periods, the Fund may deviate from its investment policies and objective. During such periods, the Fund may invest up to 100% of its assets in high quality, short-term securities, and in short-, intermediate, or long-term U.S. Treasury securities. There can be no assurance that such techniques will be successful. Accordingly, during such periods, the Fund may not achieve its investment objective.
Principal Risks
The Fund is a diversified, closed-end management investment company designed primarily as a long-term investment and not as a trading vehicle. The Fund is not intended to be a complete investment program and, due to the uncertainty inherent in all investments, there can be no assurance that the Fund will achieve its investment objective.
Investing in the Fund involves a number of risks, including those described below:
Portfolio Level Risks:
Basis Risk. As short-term rates change, interest from floating rate loans may not increase in concert with increases in floating rate leverage, introducing basis or imperfect hedging risk.
Below Investment Grade Risk. Debt instruments of below investment grade quality are regarded as having predominately speculative characteristics with respect to the issuer’s capacity to pay interest, dividends and repay principal, and are commonly referred to as junk bonds or high yield debt, which implies higher price volatility and default risk than investment grade instruments of comparable terms and duration. Issuers of lower grade instruments may be highly leveraged and may not have available to them more traditional methods of financing. The prices of these lower grade instruments are typically more sensitive to negative developments, such as a decline in the issuer’s revenues or a general economic downturn, than are the prices of higher grade instruments. If a below investment grade security goes into default, or its issuer enters bankruptcy, it might be difficult to sell that security in a timely manner at a reasonable price.
Call Risk. During periods of declining interest rates or for other purposes, issuers may exercise their option to prepay principal earlier than scheduled, forcing the Fund to reinvest in lower yielding instruments. This is known as prepayment or “call” risk. The Fund may invest in securities that are subject to call risk. Debt and preferred instruments may be redeemed at the option of the issuer, or “called,” before their stated maturity or redemption date. In general, an issuer will call its debt or preferred instruments if they can be refinanced by issuing new instruments which bear a lower interest or dividend rate. The Fund is subject to the possibility that during periods of falling interest rates, an issuer will call its high yielding debt or preferred instruments. The Fund would then be forced to invest the unanticipated proceeds at lower interest or dividend rates, resulting in a decline in the Fund’s income.
Counterparty Risk. Certain derivative instruments subject the Fund to the risk that the counterparty could default on its obligations under the agreement, either through the counterparty’s bankruptcy or failure to perform its obligations. In the event of default, the Fund could experience lengthy delays in recovering some or all of its assets or no recovery at all. The Fund’s investments in the futures markets also introduce the risk that its futures commission merchant (“FCM”) would default on an obligation set forth in an agreement between the Fund and the FCM, including the FCM’s obligation to return margin posted in connection with the Fund’s futures contracts. The failure or bankruptcy of the Fund’s FCM could result in a substantial loss of Fund assets. The payment obligation for a cleared, over-the-counter derivative transaction is guaranteed by a central counterparty, which exposes the Fund to the creditworthiness of the central counterparty.
Credit Risk. Debt or preferred securities held by the Fund may fail to make dividend or interest payments when due. Investments in securities below investment grade credit quality are predominantly speculative and subject to greater volatility and risk of default. Unrated securities are evaluated by Fund managers using industry data and their own analysis processes that may be similar to that of a nationally recognized rating agency; however, such internal ratings are not equivalent to a national agency credit rating. Counterparty credit risk may arise if counterparties fail to meet their obligations, should the Fund hold any derivative instruments for either investment exposure or hedging purposes.
Deflation Risk. Deflation risk is the risk that prices throughout the economy decline over time, which may have an adverse effect on the market valuation of companies, their assets and revenues. In addition, deflation may have an adverse effect on the creditworthiness of issuers and may make issuer default more likely, which may result in a decline in the value of the Fund’s portfolio.
142
Derivatives Risk. The use of derivatives involves additional risks and transaction costs which could leave the Fund in a worse position than if it had not used these instruments. Derivative instruments can be used to acquire or to transfer the risk and returns of a security or other asset without buying or selling the security or asset. These instruments may entail investment exposures that are greater than their cost would suggest. As a result, a small investment in derivatives can result in losses that greatly exceed the original investment. Derivatives can be highly volatile, illiquid and difficult to value. An over-the-counter derivative transaction between the Fund and a counterparty that is not cleared through a central counterparty also involves the risk that a loss may be sustained as a result of the failure of the counterparty to the contract to make required payments. The payment obligation for a cleared derivative transaction is guaranteed by a central counterparty, which exposes the Fund to the creditworthiness of the central counterparty.
It is possible that developments in the derivatives market, including changes in government regulation, could adversely impact the Fund’s ability to invest in certain derivatives.
Duration Risk. Duration is the sensitivity, expressed in years, of the price of a fixed-income security to changes in the general level of interest rates (or yields). Securities with longer durations tend to be more sensitive to interest rate (or yield) changes, which typically corresponds to increased volatility and risk, than securities with shorter durations. For example, if a security or portfolio has a duration of three years and interest rates increase by 1%, then the security or portfolio would decline in value by approximately 3%. Duration differs from maturity in that it considers potential changes to interest rates, and a security’s coupon payments, yield, price and par value and call features, in addition to the amount of time until the security matures. The duration of a security will be expected to change over time with changes in market factors and time to maturity.
Floating-Rate and Fixed-to-Floating-Rate Securities Risk. The market value of floating-rate securities is a reflection of discounted expected cash flows based on expectations for future interest rate resets. The market value of such securities may fall in a declining interest rate environment and may also fall in a rising interest rate environment if there is a lag between the rise in interest rates and the reset. This risk may also be present with respect to fixed-to-floating-rate securities in which the Fund may invest. A secondary risk associated with declining interest rates is the risk that income earned by the Fund on floating-rate and fixed-to-floating-rate securities will decline due to lower coupon payments on floating rate securities.
Foreign Security Risk. Securities of foreign issuers, even when dollar-denominated and publicly traded in the United States, may involve risks not associated with the securities of domestic issuers. For certain foreign countries, political or social instability, or diplomatic developments could adversely affect the securities. There is also the risk of loss due to governmental actions such as a change in tax statutes or the modification of individual property rights. In addition, individual foreign economies may differ favorably or unfavorably from the U.S. economy.
Illiquid Investments Risk. The risk that illiquid investments may be difficult to sell for the value at which they are carried, if at all, or at any price within the desired time frame.
Income Risk. The Fund’s income could decline due to falling market interest rates. This is because, in a falling interest rate environment, the Fund generally will have to invest the proceeds from sales of Fund shares, as well as the proceeds from maturing portfolio securities, in lower-yielding securities.
Inflation Risk. Inflation risk is the risk that the value of assets or income from investments will be worth less in the future as inflation decreases the value of money. As inflation increases, the real value of the Common Shares and distributions can decline.
Interest Rate Risk. Interest rate risk is the risk that debt securities in the Fund’s portfolio will decline in value because of changes in market interest rates. Generally, when market interest rates rise, the market value of such securities will fall, and vice versa. As interest rates decline, issuers of debt securities may prepay principal earlier than scheduled, forcing the Fund to reinvest in lower-yielding securities and potentially reducing the Fund’s income. As interest rates increase, slower than expected principal payments may extend the average life of securities, potentially locking in a below-market interest rate and reducing the Fund’s value. In typical market interest rate environments, the prices of longer-term debt securities generally fluctuate more than prices of shorter-term debt securities as interest rates change. The Federal Reserve recently reduced the federal Funds rate several times.
LIBOR Floor Risk. Many floating rate loans issued after 2008 include a “LIBOR floor”, or minimum interest rate to which the loan’s spread is added, to calculate the loan’s overall interest rate. As short-term market rates rise, such loans will not pay higher interest until prevailing rates exceed the floor rate stated in the loan documents. If such a Fund uses floating rate leverage, the Fund’s leverage costs will likely increase before its loan portfolio income increases, and the additional income provided by leverage may diminish until market rates exceed the LIBOR floor level. The Fund’s investments in floating rate loans that pay interest based on LIBOR may experience increase volatility and/or illiquidity during the transition away from LIBOR, which is scheduled to be phased out by the end of 2021.
Loan Settlement Risk. Lack of established settlement standards or remedies for failure to settle may cause the Fund to lack timely access to proceeds from selling loans, or to investment exposure from buying loans.
Other Investment Companies Risk. The Fund may invest in the securities of other investment companies, including ETFs. Investing in an investment company exposes the Fund to all of the risks of that investment company’s investments. The Fund, as a holder of the securities of other investment companies, will bear its pro rata portion of the other investment companies’ expenses, including advisory fees. These expenses are in addition to the direct expenses of the Fund’s own operations. As a result, the cost of investing in investment company shares may exceed the costs of investing directly in
143
Shareholder Update (continued)
(Unaudited)
its underlying investments. In addition, securities of other investment companies may be leveraged. As a result, the Fund may be indirectly exposed to leverage through an investment in such securities and therefore magnify the Fund’s leverage risk. Utilization of leverage is a speculative investment technique and involves certain risks. With respect to ETF’s, an ETF that is based on a specific index may not be able to replicate and maintain exactly the composition and relative weighting of securities in the index. The value of an ETF based on a specific index is subject to change as the values of its respective component assets fluctuate according to market volatility. ETFs typically rely on a limited pool of authorized participants to create and redeem shares, and an active trading market for ETF shares may not develop or be maintained. The market value of shares of ETFs and closed-end funds may differ from their NAV.
Reinvestment Risk. Reinvestment risk is the risk that income from the Fund’s portfolio will decline if and when the Fund invests the proceeds from matured, traded or called securities at market interest rates that are below the portfolio’s current earnings rate. A decline in income could affect the common shares’ market price, NAV and/or a common shareholder’s overall returns.
Risks of When-Issued Purchases. The Fund may purchase securities on a when-issued or forward-commitment basis. Delivery and payment for securities that have been purchased in this manner can take place a month or more after the transaction date. Such securities do not earn interest, are subject to market fluctuation, and may increase or decrease in value prior to their delivery. The purchase of securities on a when-issued or forward commitment basis may increase the volatility of the Fund’s net asset value if the Fund makes such purchases while remaining substantially fully invested.
Senior Loan Risk. Senior loans, both secured and unsecured, may not be rated by a national rating agency, are generally not registered with the Securities and Exchange Commission (SEC) and generally are not listed on a securities exchange. Consequently, the amount of public information available about senior loans generally is less extensive than that available for more widely rated, registered and exchange-listed securities. In addition, some adjustable rate loans may be unsecured or insufficiently collateralized, which increases the risk of Fund losses if the loan’s issuer defaults.
Short Exposure Risk. The Fund may enter into tactical short positions, either directly or through derivatives, to create negative investment exposure to or hedge existing investment exposure. Short selling involves selling securities that may be owned, and if not owned, borrowing the same securities for delivery to the purchaser, with an obligation to replace the borrowed securities at a later date. Short selling allows the short seller to profit from declines in market prices to the extent such declines exceed the transaction costs and the costs of borrowing the securities. A short sale creates the risk of an unlimited loss, in that the price of the underlying security could theoretically increase without limit, thus increasing the cost of buying those securities to cover the short position. There can be no assurance that the securities necessary to cover a short position will be available for purchase. Purchasing securities to close out the short position can itself cause the price of the securities to rise further, thereby exacerbating the loss.
Structured Product Risk. The Fund may invest in structured products such as structured notes. Holders of structured products bear risks of the underlying investments, index or reference obligation and are subject to counterparty risk. The Fund may have the right to receive payments to which it is entitled only from the structured product, and generally does not have direct rights against the issuer or the entity that sold assets to the special purpose trust. While certain structured products enable the investor to acquire interests in a pool of securities without the brokerage and other expenses associated with directly holding the same securities, investors in structured products generally pay their share of the structured product’s administrative and other expenses. When investing in structured products, it is impossible to predict whether the underlying index or prices of the underlying securities will rise or fall, but prices of the underlying indices and securities (and, therefore, the prices of structured products) will be influenced by the same types of political and economic events that affect particular issuers of securities and capital markets generally. Certain structured products may be thinly traded or have a limited trading market and may have the effect of increasing the illiquidity of the Fund’s portfolio to the extent that the Fund, at a particular point in time, may be unable to find qualified buyers for these securities. Investments in structured notes involve risks including income risk, credit and market risk. Structured notes may be less liquid than other types of securities and more volatile than the reference instrument or security underlying the note.
Swap Risk. Swap agreements are typically over-the-counter, two-party contracts entered into primarily by institutional investors for periods typically ranging from a few weeks to more than one year, where the parties agree to exchange the returns (or differentials in rates of return) earned or realized on particular predetermined investments or instruments, which may be adjusted for an interest factor. Interest rate swaps involve the exchange with another party of their respective commitments to pay or receive interest (for example, an exchange of floating rate payments for fixed-rate payments). The use of interest rate swaps is a highly specialized activity that involves investment techniques and risks different from those associated with ordinary portfolio security transactions. Interest rate swaps do not involve the delivery of securities or other underlying assets or principal. Accordingly, the risk of loss with respect to interest rate swaps is limited to the net amount of interest payments that the Fund is contractually obligated to make. If the other party to an interest rate swap defaults, the Fund’s risk of loss generally consists of the net amount of interest payments that the Fund contractually is entitled to receive.
Warrants and Equity Securities Risk. Investments in warrants and equity securities entail certain risks in addition to those associated with investments in adjustable rate instruments or other debt instruments. The value of warrants and equity securities may be affected more rapidly, and to a greater extent, by company-specific developments and general market conditions. These risks may increase fluctuations in the Fund’s NAV. The Fund may possess material non-public information about an issuer as a result of its ownership of an adjustable rate instrument or other debt instrument of such issuer.
144
Because of prohibitions on trading in securities of issuers while in possession of such information, the Fund might be unable to enter into a transaction in a security of such an issuer when it would otherwise be advantageous to do so.
Zero Coupon Bonds Risk. Because interest on zero coupon bonds is not paid on a current basis, the values of zero coupon bonds will be more volatile in response to interest rate changes than the values of bonds that distribute income regularly. Although zero coupon bonds generate income for accounting purposes, they do not produce cash flow, and thus the Fund could be forced to liquidate securities at an inopportune time in order to generate cash to distribute to shareholders as required by tax laws.
Fund Level and Other Risks:
Anti-Takeover Provisions. The Fund’s Declaration of Trust and By-laws include provisions that could limit the ability of other entities or persons to acquire control of the Fund or convert the Fund to open-end status. These provisions could have the effect of depriving the common shareholders of opportunities to sell their common shares at a premium over the then-current market price of the common shares.
Global economic risk. National and regional economies and financial markets are becoming increasingly interconnected, which increases the possibilities that conditions in one country, region or market might adversely impact issuers in a different country, region or market. Changes in legal, political, regulatory, tax and economic conditions may cause fluctuations in markets and securities prices around the world, which could negatively impact the value of the Fund’s investments. Major economic or political disruptions, particularly in large economies like China’s, may have global negative economic and market repercussions. Additionally, events such as war, terrorism, natural and environmental disasters and the spread of infectious illnesses or other public health emergencies may adversely affect the global economy and the markets and issuers in which the Fund invests. Recent examples of such events include the outbreak of a novel coronavirus known as COVID-19 that was first detected in China in December 2019 and heightened concerns regarding North Korea’s nuclear weapons and long-range ballistic missile programs. These events could reduce consumer demand or economic output, result in market closure, travel restrictions or quarantines, and generally have a significant impact on the economy. These events could also impair the information technology and other operational systems upon which the Fund’s service providers, including the investment adviser and sub-adviser, rely, and could otherwise disrupt the ability of employees of the Fund’s service providers to perform essential tasks on behalf of the Fund. Governmental and quasi-governmental authorities and regulators throughout the world have in the past responded to major economic disruptions with a variety of significant fiscal and monetary policy changes, including but not limited to, direct capital infusions into companies, new monetary programs and dramatically lower interest rates. An unexpected or quick reversal of these policies, or the ineffectiveness of these policies, could increase volatility in securities markets, which could adversely affect the Fund’s investments.
Investment and Market Risk. An investment in common shares is subject to investment risk, including the possible loss of the entire principal amount that you invest. Common shares frequently trade at a discount to their NAV. An investment in common shares represents an indirect investment in the securities owned by the Fund. Common shares at any point in time may be worth less than your original investment, even after taking into account the reinvestment of Fund dividends and distributions.
Leverage Risk. The Fund’s use of leverage may cause higher volatility for the Fund’s per share NAV, market price, and distributions. Leverage typically magnifies the total return of the Fund’s portfolio, whether that return is positive or negative. Leverage is intended to increase common share net income, but there is no assurance that the Fund’s leveraging strategy will be successful. Different forms of leverage, including swaps, may introduce additional credit or interest rate risk. Leverage may also increase a Fund’s liquidity risk, as the Fund may need to sell securities at inopportune times to stay within Fund or regulatory limits.
Market Discount from Net Asset Value. Shares of closed-end investment companies like the Fund frequently trade at prices lower than their NAV, which creates a risk of loss for investors when they sell shares. This characteristic is a risk separate and distinct from the risk that the Fund’s NAV could decrease as a result of investment activities. Shares of closed-end investment companies like the Fund have during some periods traded at prices higher than NAV and have during other periods traded at prices lower than NAV. Whether investors will realize gains or losses upon the sale of the common shares will depend not upon the Fund’s NAV but entirely upon whether the market price of the common shares at the time of sale is above or below the investor’s purchase price for the common shares. Furthermore, management may have difficulty meeting the Fund’s investment objective and managing its portfolio when the underlying securities are redeemed or sold during periods of market turmoil and as investors’ perceptions regarding closed-end funds or their underlying investments change. Because the market price of the common shares will be determined by factors such as relative supply of and demand for the common shares in the market, general market and economic circumstances, and other factors beyond the control of the Fund, the Fund cannot predict whether the common shares will trade at, below or above NAV. The common shares are designed primarily for long-term investors, and you should not view the Fund as a vehicle for short-term trading purposes.
Tax Risk. The tax treatment of Fund distributions may be affected by future changes in tax laws and regulations or their interpretation by the Internal Revenue Service or state tax authorities.
145
Shareholder Update (continued)
(Unaudited)
Valuation Risk. The Fund utilizes independent pricing services approved by the Board of Trustees to value portfolio instruments at their market value. If the pricing services are unable to provide a market value or if a significant event occurs such that the valuation(s) provided are deemed unreliable, the Fund may value portfolio instrument(s) at their fair value, which is generally the amount an owner might reasonably expect to receive upon a current sale. Valuation risks associated with investing in below investment grade debt instruments including, but not limited to: a limited number of market participants, a lack of publicly-available information, resale restrictions, settlement delays, corporate actions and adverse market conditions may make it difficult to value or sell such instruments. Because non-U.S. instruments may trade on days when Common Shares are not priced or traded, NAV can change at times when Common Shares cannot be sold.
146
NUVEEN CREDIT STRATEGIES INCOME FUND (JQC)
Investment Objectives
The Fund has a primary investment objective to achieve a high level of current income. The Fund’s secondary objective is total return.
Investment Policies
The Fund invests in in adjustable rate loans, primarily secured senior loans and other debt instruments. Adjustable rate loans are made to U.S. or non-U.S. corporations, partnerships and other business entities that operate in various industries and geographical regions. Such adjustable rate loans pay interest at rates that are redetermined periodically at short-term intervals on the basis of an adjustable base lending rate plus a premium.
“Managed Assets” means the total assets of the Fund, minus the sum of its accrued liabilities (other than Fund liabilities incurred for the express purpose of creating leverage). Total assets for this purpose shall include assets attributable to the Fund’s use of leverage (whether or not those assets are reflected in the Fund’s financial statements for purposes of generally accepted accounting principles), and derivatives will be valued at their market value. “Assets” means net assets of the Fund plus the amount of any borrowings for investment purposes.
Under normal circumstances:
| | • | | The Fund will invest at least 80% of its Assets, at time of purchase, in loans or securities that are senior to its common equity in the issuing company’s capital structure, including but not limited to debt securities and preferred securities. |
| | • | | The Fund invests at least 70% of its Managed Assets in adjustable rate senior loans and second lien loans. |
| | • | | The Fund may invest up to 30% of its Managed Assets in the following securities: |
| | ¡ | | other debt securities such as investment and non-investment grade debt securities, fixed rate senior loans or subordinated loans, convertible securities and structured notes (other than structured notes that are designed to provide returns and risks that emulate those of Adjustable Rate Loans, which may be treated as an investment in Adjustable Rate Loans for purposes of the 70% requirement set forth above); |
| | ¡ | | (ii) mortgage-related and other asset-backed securities (including collateralized loan obligations and collateralized debt obligations); |
| | ¡ | | (iii) debt securities and other instruments issued by government, government-related or supranational issuers (commonly referred to as sovereign debt securities); and |
| | ¡ | | (iv) domestic and international equity securities. |
| | • | | Substantially all of the Fund’s portfolio likely will be invested in senior loans that are, at the time of investment, rated below investment grade or unrated but judged to be of comparable quality. Investment grade quality securities are those securities that, at the time of investment, are (i) rated by at least one nationally recognized statistical rating organization (“NRSRO”) within the four highest grades (BBB- or Baa3 or better by Standard & Poor’s Corporation, a division of The McGraw-Hill Companies (“S&P”), Moody’s Investors Service, Inc. (“Moody’s”) or Fitch Ratings (“Fitch”)), or (ii) unrated but judged to be of comparable quality. The Fund may also purchase other debt securities that are rated below investment grade or that are unrated but judged to be of comparable quality. |
| | • | | The Fund maintains an average duration of two years or less for its portfolio investments in Adjustable Rate Loans and other debt instruments. “Average duration” and “average portfolio duration” are each defined to be the modified duration of the Fund’s portfolio, which is the measure of a debt instrument’s or a portfolio’s price sensitivity with respect to changes in market yields adjusted to reflect the effect of the Fund’s effective leverage. |
| | • | | The Fund will not invest in inverse floating rate securities. |
| | • | | The Fund may invest up to 20% of its Managed Assets in securities of non-U.S. Issuers that are U.S. dollar or non-U.S. dollar denominated. The Fund’s Managed Assets to be invested in Adjustable Rate Loans and other debt instruments of non-U.S. Issuers may include debt securities of Issuers located, or conducting their business in, emerging markets countries. |
| | • | | The Fund may not invest more than 25% of its total assets in securities from an industry which (for the purposes of this policy) generally refers to the classification of companies in the same or similar lines of business such as the automotive, textiles and apparel, hotels, media production and consumer retailing industries. |
For purposes of the investment policies provided above such policies only apply at the time of purchase and will not be considered violated unless an excess or deficiency occurs or exists immediately after and as a result of an acquisition of securities.
The Board of Trustees of the Fund may change a policy without a shareholder vote. However, with respect to the Fund’s policy of investing at least 80% of its Assets in in loans or securities that are senior to its common equity in the issuing company’s capital structure, such policy may not be changed without 60 days’ prior written notice.
147
Shareholder Update (continued)
(Unaudited)
The Fund may enter into certain derivative transactions, primarily but not limited to credit default and interest rate swaps, as a hedging technique to protect against potential adverse changes in the market value of portfolio instruments. The Fund also may use derivatives to attempt to protect the net asset value of the Fund, to facilitate the sale of certain portfolio instruments, to manage the Fund’s effective interest rate exposure, and as a temporary substitute for purchasing or selling particular instruments. From time to time, the Fund also may enter into derivative transactions to create investment exposure to the extent such transactions may facilitate implementation of its strategy more efficiently than through outright purchases or sales of portfolio instruments.
The Fund uses leverage to pursue its investment objective. The Fund may use leverage to the extent permitted by the 1940 Act. The Fund may source leverage through a number of methods including through borrowings, issuing preferred shares of beneficial and the issuance of debt securities. In addition, the Fund may use derivatives that may have the economic effect of leverage. The amount and sources of leverage will vary depending on market conditions.
During temporary defensive periods, the Fund may deviate from its investment policies and objective. During such periods, the Fund may invest up to 100% of its assets in high quality, short-term securities, and in short-, intermediate-, or long-term U.S. Treasury securities. There can be no assurance that such techniques will be successful. Accordingly, during such periods, the Fund may not achieve its investment objective.
Principal Risks
The Fund is a diversified, closed-end management investment company designed primarily as a long-term investment and not as a trading vehicle. The Fund is not intended to be a complete investment program and, due to the uncertainty inherent in all investments, there can be no assurance that the Fund will achieve its investment objective.
Investing in the Fund involves a number of risks, including those described below:
Portfolio Level Risks:
Basis Risk. As short-term rates change, interest from floating rate loans may not increase in concert with increases in floating rate leverage, introducing basis or imperfect hedging risk.
Below Investment Grade Risk. Debt instruments of below investment grade quality are regarded as having predominately speculative characteristics with respect to the issuer’s capacity to pay interest, dividends and repay principal, and are commonly referred to as junk bonds or high yield debt, which implies higher price volatility and default risk than investment grade instruments of comparable terms and duration. Issuers of lower grade instruments may be highly leveraged and may not have available to them more traditional methods of financing. The prices of these lower grade instruments are typically more sensitive to negative developments, such as a decline in the issuer’s revenues or a general economic downturn, than are the prices of higher grade instruments. If a below investment grade security goes into default, or its issuer enters bankruptcy, it might be difficult to sell that security in a timely manner at a reasonable price.
Call Risk. During periods of declining interest rates or for other purposes, issuers may exercise their option to prepay principal earlier than scheduled, forcing the Fund to reinvest in lower yielding instruments. This is known as prepayment or “call” risk. The Fund may invest in securities that are subject to call risk. Debt and preferred instruments may be redeemed at the option of the issuer, or “called,” before their stated maturity or redemption date. In general, an issuer will call its debt or preferred instruments if they can be refinanced by issuing new instruments which bear a lower interest or dividend rate. The Fund is subject to the possibility that during periods of falling interest rates, an issuer will call its high yielding debt or preferred instruments. The Fund would then be forced to invest the unanticipated proceeds at lower interest or dividend rates, resulting in a decline in the Fund’s income.
Counterparty Risk. Certain derivative instruments subject the Fund to the risk that the counterparty could default on its obligations under the agreement, either through the counterparty’s bankruptcy or failure to perform its obligations. In the event of default, the Fund could experience lengthy delays in recovering some or all of its assets or no recovery at all. The Fund’s investments in the futures markets also introduce the risk that its futures commission merchant (“FCM”) would default on an obligation set forth in an agreement between the Fund and the FCM, including the FCM’s obligation to return margin posted in connection with the Fund’s futures contracts. The failure or bankruptcy of the Fund’s FCM could result in a substantial loss of Fund assets. The payment obligation for a cleared, over-the-counter derivative transaction is guaranteed by a central counterparty, which exposes the Fund to the creditworthiness of the central counterparty.
Credit Risk. Debt or preferred securities held by the Fund may fail to make dividend or interest payments when due. Investments in securities below investment grade credit quality are predominantly speculative and subject to greater volatility and risk of default. Unrated securities are evaluated by Fund managers using industry data and their own analysis processes that may be similar to that of a nationally recognized rating agency; however, such internal ratings are not equivalent to a national agency credit rating. Counterparty credit risk may arise if counterparties fail to meet their obligations, should the Fund hold any derivative instruments for either investment exposure or hedging purposes.
148
Currency Risk. The prices of any non-U.S. securities held by the Fund that are traded in U.S. dollars are typically indirectly influenced by currency fluctuations. Changes in currency exchange rates may affect the Fund’s net asset value, interest earned, and gains or losses realized on the sale of securities. Changes in currency exchange rates will also affect the value of non-U.S. dollar denominated securities, the value of dividends and interest earned from such securities, gains and losses realized on the sale of such securities, and derivative transactions tied to such securities. A strong U.S. dollar relative to these other currencies will adversely affect the value of the Fund’s portfolio.
Deflation Risk. Deflation risk is the risk that prices throughout the economy decline over time, which may have an adverse effect on the market valuation of companies, their assets and revenues. In addition, deflation may have an adverse effect on the creditworthiness of issuers and may make issuer default more likely, which may result in a decline in the value of the Fund’s portfolio.
Derivatives Risk. The use of derivatives involves additional risks and transaction costs which could leave the Fund in a worse position than if it had not used these instruments. Derivative instruments can be used to acquire or to transfer the risk and returns of a security or other asset without buying or selling the security or asset. These instruments may entail investment exposures that are greater than their cost would suggest. As a result, a small investment in derivatives can result in losses that greatly exceed the original investment. Derivatives can be highly volatile, illiquid and difficult to value. An over-the-counter derivative transaction between the Fund and a counterparty that is not cleared through a central counterparty also involves the risk that a loss may be sustained as a result of the failure of the counterparty to the contract to make required payments. The payment obligation for a cleared derivative transaction is guaranteed by a central counterparty, which exposes the Fund to the creditworthiness of the central counterparty.
It is possible that developments in the derivatives market, including changes in government regulation, could adversely impact the Fund’s ability to invest in certain derivatives.
Duration Risk. Duration is the sensitivity, expressed in years, of the price of a fixed-income security to changes in the general level of interest rates (or yields). Securities with longer durations tend to be more sensitive to interest rate (or yield) changes, which typically corresponds to increased volatility and risk, than securities with shorter durations. For example, if a security or portfolio has a duration of three years and interest rates increase by 1%, then the security or portfolio would decline in value by approximately 3%. Duration differs from maturity in that it considers potential changes to interest rates, and a security’s coupon payments, yield, price and par value and call features, in addition to the amount of time until the security matures. The duration of a security will be expected to change over time with changes in market factors and time to maturity.
Floating-Rate and Fixed-to-Floating-Rate Securities Risk. The market value of floating-rate securities is a reflection of discounted expected cash flows based on expectations for future interest rate resets. The market value of such securities may fall in a declining interest rate environment and may also fall in a rising interest rate environment if there is a lag between the rise in interest rates and the reset. This risk may also be present with respect to fixed-to-floating-rate securities in which the Fund may invest. A secondary risk associated with declining interest rates is the risk that income earned by the Fund on floating-rate and fixed-to-floating-rate securities will decline due to lower coupon payments on floating rate securities.
Foreign Security Risk and Risks of Emerging Markets. Securities of foreign issuers, even when dollar-denominated and publicly traded in the United States, may involve risks not associated with the securities of domestic issuers. For certain foreign countries, political or social instability, or diplomatic developments could adversely affect the securities. There is also the risk of loss due to governmental actions such as a change in tax statutes or the modification of individual property rights. In addition, individual foreign economies may differ favorably or unfavorably from the U.S. economy.
The risks of foreign investing are particularly significant in emerging markets. Investing in emerging markets generally involves exposure to economic structures that are less diverse and mature, and to political systems that are less stable, than those of developed countries. In addition, issuers in emerging markets typically are subject to a greater degree of change in earnings and business prospects than are companies in developed markets.
Illiquid Investments Risk. The risk that illiquid investments may be difficult to sell for the value at which they are carried, if at all, or at any price within the desired time frame.
Income Risk. The Fund’s income could decline due to falling market interest rates. This is because, in a falling interest rate environment, the Fund generally will have to invest the proceeds from sales of Fund shares, as well as the proceeds from maturing portfolio securities, in lower-yielding securities.
Inflation Risk. Inflation risk is the risk that the value of assets or income from investments will be worth less in the future as inflation decreases the value of money. As inflation increases, the real value of the Common Shares and distributions can decline.
Interest Rate Risk. Interest rate risk is the risk that debt securities in the Fund’s portfolio will decline in value because of changes in market interest rates. Generally, when market interest rates rise, the market value of such securities will fall, and vice versa. As interest rates decline, issuers of debt securities may prepay principal earlier than scheduled, forcing the Fund to reinvest in lower-yielding securities and potentially reducing the Fund’s income. As interest rates increase, slower than expected principal payments may extend the average life of securities, potentially locking in a below-market interest rate and reducing the Fund’s value. In typical market interest rate environments, the prices of longer-term debt securities generally fluctuate more than prices of shorter-term debt securities as interest rates change. The Federal Reserve recently reduced the federal Funds rate several times.
149
Shareholder Update (continued)
(Unaudited)
LIBOR Floor Risk. Many floating rate loans issued after 2008 include a “LIBOR floor”, or minimum interest rate to which the loan’s spread is added, to calculate the loan’s overall interest rate. As short-term market rates rise, such loans will not pay higher interest until prevailing rates exceed the floor rate stated in the loan documents. If such a Fund uses floating rate leverage, the Fund’s leverage costs will likely increase before its loan portfolio income increases, and the additional income provided by leverage may diminish until market rates exceed the LIBOR floor level. The Fund’s investments in floating rate loans that pay interest based on LIBOR may experience increase volatility and/or illiquidity during the transition away from LIBOR, which is scheduled to be phased out by the end of 2021.
Loan Settlement Risk. Lack of established settlement standards or remedies for failure to settle may cause the Fund to lack timely access to proceeds from selling loans, or to investment exposure from buying loans.
Mortgage- and Asset-Backed Securities Risk. Mortgage-backed securities are secured by and payable from pools of mortgage loans. Similarly, asset-backed securities are supported by obligations such as automobile loans, home equity loans, corporate bonds, or commercial loans. These mortgages and other obligations generally can be prepaid at any time without penalty. As a result, mortgage- and asset-backed securities are subject to prepayment risk, which is the risk that falling interest rates could cause prepayments of the securities to occur more quickly than expected. This occurs because, as interest rates fall, more individuals refinance the mortgages underlying mortgage-related securities or prepay the debt obligations underlying asset-backed securities. The Fund must reinvest the prepayments at a time when interest rates are falling, reducing the income of the Fund. In addition, when interest rates fall, prices on mortgage- and asset-backed securities may not rise as much as for other types of comparable debt securities because investors may anticipate an increase in prepayments.
Mortgage- and asset-backed securities are also subject to extension risk, which is the risk that rising interest rates could cause mortgages or other obligations underlying the securities to be prepaid more slowly than expected, resulting in slower prepayments of the securities. This would, in effect, convert a short- or medium-duration mortgage- or asset-backed security into a longer-duration security, increasing its sensitivity to interest rate changes and causing its price to decline.
Other Investment Companies Risk. The Fund may invest in the securities of other investment companies, including ETFs. Investing in an investment company exposes the Fund to all of the risks of that investment company’s investments. The Fund, as a holder of the securities of other investment companies, will bear its pro rata portion of the other investment companies’ expenses, including advisory fees. These expenses are in addition to the direct expenses of the Fund’s own operations. As a result, the cost of investing in investment company shares may exceed the costs of investing directly in its underlying investments. In addition, securities of other investment companies may be leveraged. As a result, the Fund may be indirectly exposed to leverage through an investment in such securities and therefore magnify the Fund’s leverage risk. Utilization of leverage is a speculative investment technique and involves certain risks. With respect to ETF’s, an ETF that is based on a specific index may not be able to replicate and maintain exactly the composition and relative weighting of securities in the index. The value of an ETF based on a specific index is subject to change as the values of its respective component assets fluctuate according to market volatility. ETFs typically rely on a limited pool of authorized participants to create and redeem shares, and an active trading market for ETF shares may not develop or be maintained. The market value of shares of ETFs and closed-end funds may differ from their NAV.
Preferred Security Risk. Preferred securities generally are subordinated to bonds and other debt instruments in a company’s capital structure and therefore will be subject to greater credit risk than those debt instruments. In addition, preferred securities are subject to other risks, such as having no or limited voting rights, being subject to special redemption rights, having distributions deferred or skipped, having floating interest rates or dividends, which may result in a decline in value in a falling interest rate environment, having fixed interest rates or dividends, which may result in a decline in value in a rising interest rate environment, having limited liquidity, changing or unfavorable tax treatments and possibly being issued by companies in heavily regulated industries.
Reinvestment Risk. Reinvestment risk is the risk that income from the Fund’s portfolio will decline if and when the Fund invests the proceeds from matured, traded or called securities at market interest rates that are below the portfolio’s current earnings rate. A decline in income could affect the common shares’ market price, NAV and/or a common shareholder’s overall returns.
Reverse Repurchase Agreement Risk. Reverse repurchase agreements, in economic essence, constitute a securitized borrowing by the Fund from the security purchaser. The Fund may enter into reverse repurchase agreements for the purpose of creating a leveraged investment exposure and, as such, their usage involves essentially the same risks associated with a leveraging strategy generally since the proceeds from these agreements may be invested in additional securities. Reverse repurchase agreements tend to be short-term in tenor, and there can be no assurances that the purchaser (lender) will commit to extend or “roll” a given agreement upon its agreed-upon repurchase date or an alternative purchaser can be identified on similar terms. Reverse repurchase agreements also involve the risk that the purchaser fails to return the securities as agreed upon, files for bankruptcy or becomes insolvent. The Fund may be restricted from taking normal portfolio actions during such time, could be subject to loss to the extent that the proceeds of the agreement are less than the value of securities subject to the agreement and may experience adverse tax consequences.
150
Risks of When-Issued Purchases. The Fund may purchase securities on a when-issued or forward-commitment basis. Delivery and payment for securities that have been purchased in this manner can take place a month or more after the transaction date. Such securities do not earn interest, are subject to market fluctuation, and may increase or decrease in value prior to their delivery. The purchase of securities on a when-issued or forward commitment basis may increase the volatility of the Fund’s net asset value if the Fund makes such purchases while remaining substantially fully invested.
Senior Loan Risk. Senior loans, both secured and unsecured, may not be rated by a national rating agency, are generally not registered with the Securities and Exchange Commission (SEC) and generally are not listed on a securities exchange. Consequently, the amount of public information available about senior loans generally is less extensive than that available for more widely rated, registered and exchange-listed securities. In addition, some adjustable rate loans may be unsecured or insufficiently collateralized, which increases the risk of Fund losses if the loan’s issuer defaults.
Structured Product Risk. The Fund may invest in structured products such as structured notes. Holders of structured products bear risks of the underlying investments, index or reference obligation and are subject to counterparty risk. The Fund may have the right to receive payments to which it is entitled only from the structured product, and generally does not have direct rights against the issuer or the entity that sold assets to the special purpose trust. While certain structured products enable the investor to acquire interests in a pool of securities without the brokerage and other expenses associated with directly holding the same securities, investors in structured products generally pay their share of the structured product’s administrative and other expenses. When investing in structured products, it is impossible to predict whether the underlying index or prices of the underlying securities will rise or fall, but prices of the underlying indices and securities (and, therefore, the prices of structured products) will be influenced by the same types of political and economic events that affect particular issuers of securities and capital markets generally. Certain structured products may be thinly traded or have a limited trading market and may have the effect of increasing the illiquidity of the Fund’s portfolio to the extent that the Fund, at a particular point in time, may be unable to find qualified buyers for these securities. Investments in structured notes involve risks including income risk, credit and market risk. Structured notes may be less liquid than other types of securities and more volatile than the reference instrument or security underlying the note.
Swap Risk. Swap agreements are typically over-the-counter, two-party contracts entered into primarily by institutional investors for periods typically ranging from a few weeks to more than one year, where the parties agree to exchange the returns (or differentials in rates of return) earned or realized on particular predetermined investments or instruments, which may be adjusted for an interest factor. Interest rate swaps involve the exchange with another party of their respective commitments to pay or receive interest (for example, an exchange of floating rate payments for fixed-rate payments). The use of interest rate swaps is a highly specialized activity that involves investment techniques and risks different from those associated with ordinary portfolio security transactions. Interest rate swaps do not involve the delivery of securities or other underlying assets or principal. Accordingly, the risk of loss with respect to interest rate swaps is limited to the net amount of interest payments that the Fund is contractually obligated to make. If the other party to an interest rate swap defaults, the Fund’s risk of loss generally consists of the net amount of interest payments that the Fund contractually is entitled to receive.
Warrants and Equity Securities Risk. Investments in warrants and equity securities entail certain risks in addition to those associated with investments in adjustable rate instruments or other debt instruments. The value of warrants and equity securities may be affected more rapidly, and to a greater extent, by company-specific developments and general market conditions. These risks may increase fluctuations in the Fund’s NAV. The Fund may possess material non-public information about an issuer as a result of its ownership of an adjustable rate instrument or other debt instrument of such issuer. Because of prohibitions on trading in securities of issuers while in possession of such information, the Fund might be unable to enter into a transaction in a security of such an issuer when it would otherwise be advantageous to do so.
Zero Coupon Bonds Risk. Because interest on zero coupon bonds is not paid on a current basis, the values of zero coupon bonds will be more volatile in response to interest rate changes than the values of bonds that distribute income regularly. Although zero coupon bonds generate income for accounting purposes, they do not produce cash flow, and thus the Fund could be forced to liquidate securities at an inopportune time in order to generate cash to distribute to shareholders as required by tax laws.
Fund Level and Other Risks:
Anti-Takeover Provisions. The Fund’s Declaration of Trust and By-laws include provisions that could limit the ability of other entities or persons to acquire control of the Fund or convert the Fund to open-end status. These provisions could have the effect of depriving the common shareholders of opportunities to sell their common shares at a premium over the then-current market price of the common shares.
Global economic risk. National and regional economies and financial markets are becoming increasingly interconnected, which increases the possibilities that conditions in one country, region or market might adversely impact issuers in a different country, region or market. Changes in legal, political, regulatory, tax and economic conditions may cause fluctuations in markets and securities prices around the world, which could negatively impact the value of the Fund’s investments. Major economic or political disruptions, particularly in large economies like China’s, may have global negative economic and market repercussions. Additionally, events such as war, terrorism, natural and environmental disasters and the spread of infectious illnesses or other public health emergencies may adversely affect the global economy and the markets and issuers in which the Fund invests. Recent examples of such
151
Shareholder Update (continued)
(Unaudited)
events include the outbreak of a novel coronavirus known as COVID-19 that was first detected in China in December 2019 and heightened concerns regarding North Korea’s nuclear weapons and long-range ballistic missile programs. These events could reduce consumer demand or economic output, result in market closure, travel restrictions or quarantines, and generally have a significant impact on the economy. These events could also impair the information technology and other operational systems upon which the Fund’s service providers, including the investment adviser and sub-adviser, rely, and could otherwise disrupt the ability of employees of the Fund’s service providers to perform essential tasks on behalf of the Fund. Governmental and quasi-governmental authorities and regulators throughout the world have in the past responded to major economic disruptions with a variety of significant fiscal and monetary policy changes, including but not limited to, direct capital infusions into companies, new monetary programs and dramatically lower interest rates. An unexpected or quick reversal of these policies, or the ineffectiveness of these policies, could increase volatility in securities markets, which could adversely affect the Fund’s investments.
Investment and Market Risk. An investment in common shares is subject to investment risk, including the possible loss of the entire principal amount that you invest. Common shares frequently trade at a discount to their NAV. An investment in common shares represents an indirect investment in the securities owned by the Fund. Common shares at any point in time may be worth less than your original investment, even after taking into account the reinvestment of Fund dividends and distributions.
Leverage Risk. The Fund’s use of leverage may cause higher volatility for the Fund’s per share NAV, market price, and distributions. Leverage typically magnifies the total return of the Fund’s portfolio, whether that return is positive or negative. Leverage is intended to increase common share net income, but there is no assurance that the Fund’s leveraging strategy will be successful. Different forms of leverage, including swaps, may introduce additional credit or interest rate risk. Leverage may also increase a Fund’s liquidity risk, as the Fund may need to sell securities at inopportune times to stay within Fund or regulatory limits.
Market Discount from Net Asset Value. Shares of closed-end investment companies like the Fund frequently trade at prices lower than their NAV, which creates a risk of loss for investors when they sell shares. This characteristic is a risk separate and distinct from the risk that the Fund’s NAV could decrease as a result of investment activities. Shares of closed-end investment companies like the Fund have during some periods traded at prices higher than NAV and have during other periods traded at prices lower than NAV. Whether investors will realize gains or losses upon the sale of the common shares will depend not upon the Fund’s NAV but entirely upon whether the market price of the common shares at the time of sale is above or below the investor’s purchase price for the common shares. Furthermore, management may have difficulty meeting the Fund’s investment objective and managing its portfolio when the underlying securities are redeemed or sold during periods of market turmoil and as investors’ perceptions regarding closed-end funds or their underlying investments change. Because the market price of the common shares will be determined by factors such as relative supply of and demand for the common shares in the market, general market and economic circumstances, and other factors beyond the control of the Fund, the Fund cannot predict whether the common shares will trade at, below or above NAV. The common shares are designed primarily for long-term investors, and you should not view the Fund as a vehicle for short-term trading purposes.
Tax Risk. The tax treatment of Fund distributions may be affected by future changes in tax laws and regulations or their interpretation by the Internal Revenue Service or state tax authorities.
Valuation Risk. The Fund utilizes independent pricing services approved by the Board of Trustees to value portfolio instruments at their market value. If the pricing services are unable to provide a market value or if a significant event occurs such that the valuation(s) provided are deemed unreliable, the Fund may value portfolio instrument(s) at their fair value, which is generally the amount an owner might reasonably expect to receive upon a current sale. Valuation risks associated with investing in below investment grade debt instruments including, but not limited to: a limited number of market participants, a lack of publicly-available information, resale restrictions, settlement delays, corporate actions and adverse market conditions may make it difficult to value or sell such instruments. Because non-U.S. instruments may trade on days when Common Shares are not priced or traded, NAV can change at times when Common Shares cannot be sold.
EFFECTS OF LEVERAGE
The following table is furnished in response to requirements of the SEC. It is designed to illustrate the effects of leverage through the use of senior securities, as that term is defined under Section 18 of the 1940 Act, as well as certain other forms of leverage, such as reverse repurchase agreements, on common share total return, assuming investment portfolio total returns (consisting of income and changes in the value of investments held in a Fund’s portfolio) of -10%, -5%, 0%, 5% and 10%. The table below reflects each Fund’s (i) estimated use of leverage at approximately the same percentage of Managed Assets (including assets attributable to such leverage) set forth in the table, (ii) the estimated annual effective interest expense rate payable by the Fund on such instruments (based on market conditions as of the date hereof) as set forth in the table and (iii) the annual return that the Fund’s portfolio must experience (net of expenses) in order to cover such costs of leverage based on such estimated annual effective interest expense rate. The information below does not reflect any Fund’s use of certain other forms of economic leverage achieved through the use of other instruments or transactions not considered to be senior securities under the 1940 Act, such as certain derivative instruments.
152
The numbers are merely estimates, used for illustration. The costs of leverage may vary frequently and may be significantly higher or lower than the estimated rate. The assumed investment portfolio returns in the table below are hypothetical figures and are not necessarily indicative of the investment portfolio returns experienced or expected to be experienced by the Fund. Your actual returns may be greater or less than those appearing below.
| | | | | | | | | | | | | | | | | | | | |
| | | Nuveen
Senior
Income Fund (NSL) | | | Nuveen
Floating Rate
Income Fund
(JFR) | | | Nuveen Floating
Rate Income
Opportunity
Fund (JRO) | | | Nuveen Short
Duration Credit
Opportunities
Fund (JSD) | | | Nuveen Credit
Strategies
Income Fund
(JQC) | |
Estimated Leverage as a Percentage of Managed Assets (Including Assets Attributable to Leverage) | | | 36.5 | % | | | 36.5 | % | | | 36.5 | % | | | 36.5 | % | | | 36.5 | % |
Estimated Annual Effective Interest Expense Rate Payable by Fund on Leverage | | | 1.20 | % | | | 1.25 | % | | | 1.20 | % | | | 1.30 | % | | | 1.40 | % |
Annual Return Fund Portfolio Must Experience (net of expenses) to Cover Estimated Annual Effective Interest Expense Rate on Leverage | | | 0.44 | % | | | 0.46 | % | | | 0.44 | % | | | 0.47 | % | | | 0.51 | % |
Common Share Total Return for (10.00)% Assumed Portfolio Total Return | | | (16.4 | )% | | | (16.5 | )% | | | (16.4 | )% | | | (16.5 | )% | | | (16.6 | )% |
Common Share Total Return for (5.00)% Assumed Portfolio Total Return | | | (8.6 | )% | | | (8.6 | )% | | | (8.6 | )% | | | (8.6 | )% | | | (8.7 | )% |
Common Share Total Return for 0.00% Assumed Portfolio Total Return | | | (0.7 | )% | | | (0.7 | )% | | | (0.7 | )% | | | (0.8 | )% | | | (0.8 | )% |
Common Share Total Return for 5.00% Assumed Portfolio Total Return | | | 7.2 | % | | | 7.2 | % | | | 7.2 | % | | | 7.1 | % | | | 7.1 | % |
Common Share total return is composed of two elements — the distributions paid by a Fund to holders of common shares (the amount of which is largely determined by the net investment income of the Fund after paying dividend payments on any preferred shares issued by the Fund and expenses on any forms of leverage outstanding) and gains or losses on the value of the securities and other instruments the Fund owns. As required by SEC rules, the table assumes that a Fund is more likely to suffer capital losses than to enjoy capital appreciation. For example, to assume a total return of 0%, a Fund must assume that the income it receives on its investments is entirely offset by losses in the value of those investments. This table reflects hypothetical performance of a Fund’s portfolio and not the actual performance of the Fund’s common shares, the value of which is determined by market forces and other factors. Should a Fund elect to add additional leverage to its portfolio, any benefits of such additional leverage cannot be fully achieved until the proceeds resulting from the use of such leverage have been received by the Fund and invested in accordance with the Fund’s investment objectives and policies. As noted above, a Fund’s willingness to use additional leverage, and the extent to which leverage is used at any time, will depend on many factors.
CHANGES OCCURRING DURING THE PRIOR FISCAL YEAR
The following information in this annual report is a summary of certain changes during the most recent fiscal year. This information may not reflect all of the changes that have occurred since you purchased shares of a Fund.
During the most recent fiscal year, there have been no changes to: (i) the Funds investment objectives and principal investment policies that have not been approved by shareholders, (ii) the principal risks of the Fund, (iii) the portfolio managers of the Funds; (iv) a Fund’s charter or by-laws that would delay or prevent a change of control of the Fund that have not been approved by shareholders except as follows:
Investment Objectives and Principal Investment Policies
As previously disclosed in the each Fund’s most recent semi-annual report, each Fund has adopted the following policy regarding limits to investments in illiquid securities: “While there are no such limits imposed by applicable regulations, certain Nuveen Closed-End Funds formerly had investment policies that placed limits on a Fund’s ability to invest in illiquid securities. All exchange-listed Nuveen Closed-End Funds now have no formal limit on their ability to invest in such illiquid securities, but each Fund’s portfolio management team will monitor such investments in the regular, overall management of the Funds’ portfolio securities.”
153
Additional Fund Information (Unaudited)
| | | | | | | | | | |
| Board of Trustees* | | | | | | | | | | |
| Jack B. Evans | | William C. Hunter | | Albin F. Moschner | | John K. Nelson | | Judith M. Stockdale | | Carole E. Stone |
| Terence J. Toth | | Margaret L Wolff | | Robert L. Young | | | | | | |
| * | Matthew Thornton III has been appointed to the Board of Trustees effective November 16, 2020. |
| | | | | | | | |
| | | | | |
Investment Adviser Nuveen Fund Advisors, LLC 333 West Wacker Drive Chicago, IL 60606 | | Custodian State Street Bank
& Trust Company One Lincoln Street Boston, MA 02111 | | Legal Counsel Chapman and Cutler LLP Chicago, IL 60603 | | Independent Registered
Public Accounting Firm KPMG LLP 200 East Randolph Street Chicago, IL 60601 | | Transfer Agent and
Shareholder Services Computershare Trust Company, N.A. 150 Royall Street Canton, MA 02021 (800) 257-8787 |
Distribution Information
The Funds hereby designate their percentages of dividends paid from net ordinary income as dividends qualifying as Interest-Related Dividends as defined in the Internal Revenue Code Section 871(k) for the taxable periods ending December 31, 2019 and July 31, 2020:
| | | | | | | | | | | | | | | | | | | | |
| | | NSL | | | JFR | | | JRO | | | JSD | | | JQC | |
% of Interest-Related Dividends for the period August 1, 2019 through December 31, 2019 | | | 80.5% | | | | 80.3% | | | | 80.5% | | | | 80.9% | | | | 89.8% | |
% of Interest-Related Dividends for the period January 1, 2020 through July 31, 2020 | | | 73.8% | | | | 70.5% | | | | 70.2% | | | | 62.6% | | | | 77.9% | |
Distribution Information
The following Funds hereby designate their percentages of dividends paid from net ordinary income as dividends qualifying for the dividends received deduction (“DRD”) for corporations and their percentages of qualified dividend income (“QDI”) for individuals under Section 1(h)(11) of the Internal Revenue Code as shown in the accompanying table. The actual qualified dividend income distributions will be reported to shareholders on Form 1099-DIV which will be sent to shareholders shortly after calendar year end.
| | | | | | | | |
| | | JFR | | | JQC | |
% QDI | | | 1.9% | | | | 1.1% | |
% DRD | | | 0.0% | | | | 0.0% | |
Portfolio of Investments Information
Each Fund is required to file its complete schedule of portfolio holdings with the Securities and Exchange Commission (SEC) for the first and third quarters of each fiscal year as an exhibit to its report on Form N-PORT. You may obtain this information on the SEC’s website at http://www.sec.gov.
Nuveen Funds’ Proxy Voting Information
You may obtain (i) information regarding how each fund voted proxies relating to portfolio securities held during the most recent twelve-month period ended June 30, without charge, upon request, by calling Nuveen toll-free at (800) 257-8787 or on Nuveen’s website at www.nuveen.com and (ii) a description of the policies and procedures that each fund used to determine how to vote proxies relating to portfolio securities without charge, upon request, by calling Nuveen toll free at (800) 257-8787. You may also obtain this information directly from the SEC. Visit the SEC on-line at http://www.sec.gov.
CEO Certification Disclosure
Each Fund’s Chief Executive Officer (CEO) has submitted to the New York Stock Exchange (NYSE) the annual CEO certification as required by Section 303A.12(a) of the NYSE Listed Company Manual. Each Fund has filed with the SEC the certification of its CEO and Chief Financial Officer required by Section 302 of the Sarbanes-Oxley Act.
Common Share Repurchases
Each Fund intends to repurchase, through its open market share repurchase program, shares of its own common stock at such times and in such amounts as is deemed advisable. During the period covered by this report, each Fund repurchased shares of its common stock, as shown in the accompanying table. Any future repurchases will be reported to shareholders in the next annual or semi-annual report.
| | | | | | | | | | | | | | | | | | | | |
| | | NSL | | | JFR | | | JRO | | | JSD | | | JQC | |
Common shares repurchased | | | — | | | | — | | | | — | | | | 10,000 | | | | — | |
FINRA BrokerCheck
The Financial Industry Regulatory Authority (FINRA) provides information regarding the disciplinary history of FINRA member firms and associated investment professionals. This information as well as an investor brochure describing FINRA BrokerCheck is available to the public by calling the FINRA BrokerCheck Hotline number at (800) 289-9999 or by visiting www.FINRA.org.
154
Glossary of Terms Used in this Report
(Unaudited)
| ∎ | | Average Annual Total Return: This is a commonly used method to express an investment’s performance over a particular, usually multi-year time period. It expresses the return that would have been necessary each year to equal the investment’s actual cumulative performance (including change in NAV or offer price and reinvested dividends and capital gains distributions, if any) over the time period being considered. |
| ∎ | | Collateralized Loan Obligation (CLO): A security backed by a pool of debt, often low rated corporate loans. Collateralized loan obligations (CLOs) are similar to collateralized mortgage obligations, except for the different type of underlying loan. |
| ∎ | | Convexity: A tool used in risk management to measure the sensitivity of bond duration to interest rate changes. Higher convexity generally means higher sensitivity to interest rate changes. |
| ∎ | | Credit Suisse Leveraged Loan Index: A representative, unmanaged index of tradeable, senior, U.S. dollar-denominated leveraged loans. Index returns assume reinvestment of distributions, but do not include the effects of any applicable sales charges or management fees. |
| ∎ | | Effective Leverage: Effective leverage is a fund’s effective economic leverage, and includes both regulatory leverage (see below) and the leverage effects of certain derivative investments in the fund’s portfolio. |
| ∎ | | Gross Domestic Product (GDP): The total market value of all final goods and services produced in a country/region in a given year, equal to total consumer, investment and government spending, plus the value of exports, minus the value of imports. |
| ∎ | | ICE BofA U.S. High Yield Index: An index that tracks the performance of U.S. dollar denominated below investment grade corporate debt publicly issued in the U.S. domestic market. Index returns assume reinvestment of distributions, but do not include the effects of any applicable sales charges or management fees. |
| ∎ | | Leverage: Leverage is created whenever a fund has investment exposure (both reward and/or risk) equivalent to more than 100% of the investment capital. |
| ∎ | | Net Asset Value (NAV) Per Share: A fund’s Net Assets is equal to its total assets (securities, cash, accrued earnings and receivables) less its total liabilities. NAV per share is equal to the fund’s Net Assets divided by its number of shares outstanding. |
| ∎ | | Regulatory Leverage: Regulatory leverage consists of preferred shares issued by or borrowings of a fund. Both of these are part of a fund’s capital structure. Regulatory leverage is subject to asset coverage limits set forth in the Investment Company Act of 1940. |
155
Reinvest Automatically, Easily and Conveniently
Nuveen makes reinvesting easy. A phone call is all it takes to set up your reinvestment account.
Your Nuveen Closed-End Funds Automatic Reinvestment Plan
Nuveen Closed-End Fund allows you to conveniently reinvest distributions in additional Fund shares.
By choosing to reinvest, you’ll be able to invest money regularly and automatically, and watch your investment grow through the power of compounding. Just like distributions in cash, there may be times when income or capital gains taxes may be payable on distributions that are reinvested.
It is important to note that an automatic reinvestment plan does not ensure a profit, nor does it protect you against loss in a declining market.
Easy and convenient
To make recordkeeping easy and convenient, each quarter you’ll receive a statement showing your total distributions, the date of investment, the shares acquired and the price per share, and the total number of shares you own.
How shares are purchased
The shares you acquire by reinvesting will either be purchased on the open market or newly issued by the Fund. If the shares are trading at or above net asset value at the time of valuation, the Fund will issue new shares at the greater of the net asset value or 95% of the then-current market price. If the shares are trading at less than net asset value, shares for your account will be purchased on the open market. If the Plan Agent begins purchasing Fund shares on the open market while shares are trading below net asset value, but the Fund’s shares subsequently trade at or above their net asset value before the Plan Agent is able to complete its purchases, the Plan Agent may cease open-market purchases and may invest the uninvested portion of the distribution in newly-issued Fund shares at a price equal to the greater of the shares’ net asset value or 95% of the shares’ market value on the last business day immediately prior to the purchase date. Distributions received to purchase shares in the open market will normally be invested shortly after the distribution payment date. No interest will be paid on distributions awaiting reinvestment. Because the market price of the shares may increase before purchases are completed, the average purchase price per share may exceed the market price at the time of valuation, resulting in the acquisition of fewer shares than if the distribution had been paid in shares issued by the Fund. A pro rata portion of any applicable brokerage commissions on open market purchases will be paid by Plan participants. These commissions usually will be lower than those charged on individual transactions.
Flexible
You may change your distribution option or withdraw from the Plan at any time, should your needs or situation change.
You can reinvest whether your shares are registered in your name, or in the name of a brokerage firm, bank, or other nominee. Ask your investment advisor if his or her firm will participate on your behalf. Participants whose shares are registered in the name of one firm may not be able to transfer the shares to another firm and continue to participate in the Plan.
The Fund reserves the right to amend or terminate the Plan at any time. Although the Fund reserves the right to amend the Plan to include a service charge payable by the participants, there is no direct service charge to participants in the Plan at this time.
Call today to start reinvesting distributions
For more information on the Nuveen Automatic Reinvestment Plan or to enroll in or withdraw from the Plan, speak with your financial professional or call us at (800) 257-8787.
156
Annual Investment Management Agreement Approval Process
(Unaudited)
At a meeting held on May 19-21, 2020 (the “May Meeting”), the Boards of Trustees (collectively, the “Board” and each Trustee, a “Board Member”) of the Funds, which are comprised entirely of Board Members who are not “interested persons” (as defined under the Investment Company Act of 1940 (the “1940 Act”)) (the “Independent Board Members”), approved, for their respective Fund, the renewal of the management agreement (each, an “Investment Management Agreement”) with Nuveen Fund Advisors, LLC (the “Adviser”) pursuant to which the Adviser serves as investment adviser to such Fund and the sub-advisory agreement (each, a “Sub-Advisory Agreement”) with Symphony Asset Management LLC (the “Sub-Adviser”) pursuant to which the Sub-Adviser serves as the investment sub-adviser to such Fund. Although the 1940 Act requires that continuances of the Advisory Agreements (as defined below) be approved by the in-person vote of a majority of the Independent Board Members, the May Meeting was held virtually through the internet in view of the health risks associated with holding an in-person meeting during the COVID-19 pandemic and governmental restrictions on gatherings. The May Meeting was held in reliance on an order issued by the Securities and Exchange Commission on March 13, 2020, as extended on March 25, 2020, which provided registered investment companies temporary relief from the in-person voting requirements of the 1940 Act with respect to the approval of a fund’s advisory agreement in response to the challenges arising in connection with the COVID-19 pandemic.
Following up to an initial two-year period, the Board considers the renewal of each Investment Management Agreement and Sub-Advisory Agreement on behalf of the applicable Fund on an annual basis. The Investment Management Agreements and Sub-Advisory Agreements are collectively referred to as the “Advisory Agreements” and the Adviser and the Sub-Adviser are collectively, the “Fund Advisers” and each, a “Fund Adviser.” Throughout the year, the Board and its committees meet regularly and, at these meetings, review an extensive array of topics and information that are relevant to its annual consideration of the renewal of the advisory agreements for the Nuveen funds. Such information may address, among other things, fund performance; the Adviser’s strategic plans; the review of the funds and investment teams; compliance, regulatory and risk management matters; the trading practices of the various sub-advisers to the funds; valuation of securities; fund expenses; overall market and regulatory developments; the management of leverage financing; and the secondary market trading of the closed-end funds and any actions to address discounts.
In addition to the information and materials received during the year, the Board, in response to a request made on its behalf by independent legal counsel, received extensive materials and information prepared specifically for its annual consideration of the renewal of the advisory agreements for the Nuveen funds by the Adviser and by Broadridge Financial Solutions, Inc. (“Broadridge”), an independent provider of investment company data. The materials cover a wide range of topics including, but not limited to, a description of the nature, extent and quality of services provided by the Fund Advisers; a review of each sub-adviser to the Nuveen funds and the applicable investment teams; an analysis of fund performance in absolute terms and as compared to the performance of certain peer funds and benchmarks with a focus on any performance outliers; an analysis of the fees and expense ratios of the Nuveen funds in absolute terms and as compared to those of certain peer funds with a focus on any expense outliers; a description of portfolio manager compensation; a review of the secondary market trading of shares of the Nuveen closed-end funds (including, among other things, an analysis of performance, distribution and valuation and capital raising trends in the broader closed-end fund market and in particular with respect to Nuveen closed-end funds; a review of the leverage management actions taken on behalf of the Nuveen closed-end funds and their resulting impact on performance; and a description of the distribution management process and any capital management activities); a review of the performance of various service providers; a description of various initiatives Nuveen had undertaken or continued during the year for the benefit of particular fund(s) and/or the complex; a description of the profitability or financial data of Nuveen and the sub-advisers to the Nuveen funds; and a description of indirect benefits received by the Adviser and the sub-advisers as a result of their relationships with the Nuveen funds.
In continuing its practice, the Board met prior to the May Meeting to begin its considerations of the renewal of the Advisory Agreements. Accordingly, on April 27-28, 2020 (the “April Meeting”), the Board met to review and discuss, in part, the performance of the Nuveen funds and the Adviser’s evaluation of each sub-adviser to the Nuveen funds. In its review, the Board recognized the volatile market conditions occurring during the first half of 2020 arising, in part, from the public health crisis caused by the novel coronavirus known as COVID-19 and the resulting impact on fund performance. Accordingly, the Board
157
Annual Investment Management Agreement Approval Process (continued)
(Unaudited)
reviewed, among other things, fund performance reflecting the more volatile periods, including for various time periods ended the first quarter of 2020 and for various time periods ended April 17, 2020. At the April Meeting, the Board Members asked questions and requested additional information that was provided for the May Meeting. In continuing its review of the Nuveen funds in light of the extraordinary market conditions experienced in early 2020, the Board received updated fund performance data reflecting various time periods ended May 8, 2020 for its May Meeting. The Board also continued its practice of seeking to meet periodically with the various sub-advisers to the Nuveen funds and their investment teams, when feasible.
The Independent Board Members considered the review of the advisory agreements for the Nuveen funds to be an ongoing process and employed the accumulated information, knowledge, and experience the Board Members had gained during their tenure on the boards governing the Nuveen funds and working with the Adviser and sub-advisers in their review of the advisory agreements. The contractual arrangements are a result of multiple years of review, negotiation and information provided in connection with the boards’ annual review of the Nuveen funds’ advisory arrangements and oversight of the Nuveen funds.
The Independent Board Members were advised by independent legal counsel during the annual review process as well as throughout the year, including meeting in executive sessions with such counsel at which no representatives from the Adviser or the Sub-Adviser were present. In connection with their annual review, the Independent Board Members also received a memorandum from independent legal counsel outlining their fiduciary duties and legal standards in reviewing the Advisory Agreements.
The Board’s decision to renew the Advisory Agreements was not based on a single identified factor, but rather the decision reflected the comprehensive consideration of all the information provided throughout the year and at the April and May Meetings, and each Board Member may have attributed different levels of importance to the various factors and information considered in connection with the approval process. The following summarizes the principal factors and information, but not all the factors, the Board considered in deciding to renew the Advisory Agreements and its conclusions.
| A. | | Nature, Extent and Quality of Services |
In evaluating the renewal of the Advisory Agreements, the Independent Board Members received and considered information regarding the nature, extent and quality of the applicable Fund Adviser’s services provided to the respective Fund with particular focus on the services and enhancements to such services provided during the last year. The Independent Board Members considered the Investment Management Agreements and the Sub-Advisory Agreements separately in the course of their review. With this approach, they considered the respective roles of the Adviser and the Sub-Adviser in providing services to the Funds.
With respect to the Adviser, the Board recognized that the Adviser has provided a vast array of services the scope of which has expanded over the years in light of regulatory, market and other developments, such as the development of expanded compliance programs for the Nuveen funds. The Board also noted the extensive resources, tools and capabilities the Adviser and its affiliates devoted to the various operations of the Nuveen funds. These services include, but are not limited to: investment oversight, risk management and securities valuation services (such as analyzing investment performance and risk data; overseeing and reviewing the various sub-advisers to the Nuveen funds and their investment teams; overseeing trade execution, soft dollar practices and securities lending activities; providing daily valuation services and developing related valuation policies, procedures and methodologies; overseeing risk disclosure; periodic testing of investment and liquidity risks; participating in financial statement and marketing disclosures; participating in product development; and participating in leverage management and liquidity monitoring); product management (such as analyzing a fund’s position in the marketplace, setting dividends, preparing shareholder and intermediary communications and other due diligence support); fund administration (such as preparing fund tax returns and other tax compliance services, overseeing the funds’ independent public accountants and other service providers; managing fund budgets and expenses; and helping to fulfill the funds’ regulatory filing requirements); oversight of shareholder services and transfer agency functions (such as overseeing transfer agent service providers which include registered shareholder customer service and transaction processing; and overseeing proxy solicitation and tabulation services); Board relations services (such as organizing and administering Board and committee meetings, preparing various reports to the Board and committees and providing other support services); compliance and regulatory oversight services (such as devising compliance programs; managing compliance policies; monitoring compliance with applicable fund policies and laws and regulations; and evaluating the compliance programs of
158
the various sub-advisers to the Nuveen funds and certain other service providers); legal support and oversight of outside law firms (such as helping to prepare and file registration statements and proxy statements; overseeing fund activities and providing legal interpretations regarding such activities; and negotiating agreements with other fund service providers); and providing leverage, capital and distribution management services.
The Board also recognized that the Adviser and its affiliates have undertaken a number of initiatives over the previous year that benefited the complex and/or particular Nuveen funds including, but not limited to:
| | • | | Fund Improvements and Product Management Initiatives – continuing to proactively manage the Nuveen fund complex as a whole and at the individual fund level with an aim to enhance the shareholder outcomes through, among other things, rationalizing the product line and gaining efficiencies through mergers, repositionings and liquidations; reviewing and updating investment policies and benchmarks; and integrating certain investment teams and changing the portfolio managers serving various funds; |
| | • | | Capital Initiatives – continuing to invest capital to support new Nuveen funds with initial capital as well as to facilitate modifications to the strategies or structure of existing funds; |
| | • | | Compliance Program Initiatives – continuing efforts to mitigate compliance risk, increase operating efficiencies, strengthen key compliance program elements and support international business growth and other objectives through, among other things, integrating various investment teams across affiliates, consolidating marketing review functions, enhancing compliance related technologies and establishing and maintaining shared broad-based compliance policies throughout the organization and its affiliates; |
| | • | | Risk Management and Valuation Services – continuing efforts to provide Nuveen with a more disciplined and consistent approach to identifying and mitigating the firm’s operational risks through, among other things, enhancing the interaction and reporting between the investment risk management team and various affiliates and adopting a risk operational framework across the complex; |
| | • | | Regulatory Matters – continuing efforts to monitor regulatory trends and advocate on behalf of the Nuveen funds, to implement and comply with new or revised rules and mandates and to respond to regulatory inquiries and exams; |
| | • | | Government Relations – continuing efforts of various Nuveen teams and affiliates to develop policy positions on a broad range of issues that may impact the Nuveen funds, advocate and communicate these positions to lawmakers and other regulatory authorities and work with trade associations to ensure these positions are represented; |
| | • | | Business Continuity, Disaster Recovery and Information Services – continuing to periodically test business continuity and disaster recovery plans, maintain an information security program designed to identify and manage information security risks, and provide reports to the Board, at least annually, addressing, among other things, management’s security risk assessment, cyber risk profile, potential impact of new or revised laws and regulations, incident tracking and other relevant information technology risk-related reports; |
| | • | | Expanded Dividend Management Services – continuing to manage the dividends among the varying types of Nuveen funds within the Nuveen complex to be consistent with the respective fund’s product design and investing resources to develop systems to assist in the process for newer products such as target term funds; and |
| | • | | with respect specifically to closed-end funds, such initiatives also included: |
| | •• | Leverage Management Services – continuing to actively manage leverage including developing new leverage instruments, managing leverage exposure and costs through various providers, and managing and adapting tender option bond structures to comply with regulations and developing further relationships with leverage providers; |
| | •• | Capital Management, Market Intelligence and Secondary Market Services – ongoing capital management efforts through shelf offerings, share repurchases as appropriate to address discounts, tender offers and capital return programs as well as providing market data analysis to help understand closed-end fund ownership cycles and their impact on secondary market trading as well as to improve proxy solicitation efforts; and |
159
Annual Investment Management Agreement Approval Process (continued)
(Unaudited)
| | •• | Closed-end Fund Investor Relations Program – maintaining the closed-end fund investor relations program which, among other things, raises awareness, provides educational materials and cultivates advocacy for closed-end funds and the Nuveen closed-end fund product line. |
The Board also noted the benefits to shareholders of investing in a Nuveen fund, as each Nuveen fund is a part of a large fund complex with a variety of investment disciplines, capabilities, expertise and resources available to navigate and support the funds including during stressed times as occurred in the market in the first half of 2020. In addition to the services provided by the Adviser, the Board also considered the risks borne by the Adviser and its affiliates in managing the Nuveen funds, including entrepreneurial, operational, reputational, regulatory and litigation risks.
The Board further considered the division of responsibilities between the Adviser and the Sub-Adviser and recognized that the Sub-Adviser and its investment personnel generally are responsible for the management of each Fund’s portfolio under the oversight of the Adviser and the Board. The Board considered an analysis of the Sub-Adviser provided by the Adviser which included, among other things, the Sub-Adviser’s assets under management and changes thereto, a summary of the applicable investment team and changes thereto, the investment approach of the team and the performance of the funds sub-advised by the Sub-Adviser over various periods. The Board further considered at the May Meeting or prior meetings evaluations of the Sub-Adviser’s compliance program and trade execution. The Board also considered the structure of investment personnel compensation programs and whether this structure provides appropriate incentives to act in the best interests of the respective Nuveen funds. The Board noted that the Adviser recommended the renewal of the Sub-Advisory Agreements.
Based on its review, the Board determined, in the exercise of its reasonable business judgment, that it was satisfied with the nature, extent and quality of services provided to the respective Funds under each applicable Advisory Agreement.
| B. | | The Investment Performance of the Funds and Fund Advisers |
In evaluating the quality of the services provided by the Fund Advisers, the Board also received and considered a variety of investment performance data of the Nuveen funds they advise. In this regard, the Board reviewed, among other things, Fund performance over the quarter, one-, three- and five-year periods ending December 31, 2019. Unless otherwise indicated, the performance data referenced below reflects the periods ended December 31, 2019. In general, the year 2019 was a period of strong market performance. However, as noted above, the Board recognized the unprecedented market volatility and decline that occurred in early 2020 and the significant impact it would have on fund performance. As a result, the Board reviewed performance data capturing more recent time periods, including performance data reflecting the first quarter of 2020 as well as performance data for various periods ended April 17, 2020 for its April Meeting and May 8, 2020 for its May Meeting.
The Board reviewed both absolute and relative fund performance during the annual review over the various time periods. With respect to the latter, the Board considered fund performance in comparison to the performance of peer funds (the “Performance Peer Group”) and recognized and/or customized benchmarks (i.e., generally benchmarks derived from multiple recognized benchmarks). For funds that had changes in portfolio managers, the Board considered performance data of such funds before and after such changes. In considering performance data, the Board is aware of certain inherent limitations with such data, including that differences between the objective(s), strategies and other characteristics of the Nuveen funds compared to the respective Performance Peer Group and/or benchmark(s) (such as differences in the use of leverage) as well as differences in the composition of the Performance Peer Group over time will necessarily contribute to differences in performance results and limit the value of the comparative information. To assist the Board in its review of the comparability of the relative performance, the Adviser has ranked the relevancy of the peer group to the funds as low, medium or high.
As noted above, the Board reviewed fund performance over various periods ended December 31, 2019 as well as the first quarter of 2020 and various time periods ended April 17, 2020 and May 8, 2020. In light of the significant market decline in the early part of 2020, the Board noted that a shorter period of underperformance may significantly impact longer term performance. Further, the Board recognized that performance data may differ significantly depending on the ending date selected and accordingly, performance results for periods ended at the year-end of 2019 may vary significantly from performance results for periods ended in the first quarter of 2020, particularly given the extraordinary market conditions at
160
that time as the impact of COVID-19 and other market developments unfolded. The Board considered a fund’s performance in light of the overall financial market conditions. In addition, the Board recognized that shareholders may evaluate performance based on their own holding periods which may differ from the periods reviewed by the Board and lead to differing results.
The secondary market trading of shares of the Nuveen closed-end funds continues to be a priority for the Board given its importance to shareholders, and therefore data reflecting the premiums and discounts at which the shares of the closed-end funds trade is reviewed by the Board during its annual review and by the Board and/or its Closed-end Fund committee during its respective quarterly meetings throughout the year.
In addition to the performance data prepared in connection with the annual review of the advisory agreements of the Nuveen funds, the Board reviewed fund performance throughout the year at its quarterly meetings representing differing time periods and took into account the discussions that occurred at these Board meetings in evaluating a fund’s overall performance. The Board also considered, among other things, the Adviser’s analysis of each Nuveen fund’s performance, with particular focus on funds that were considered performance outliers (both overperformance and underperformance), the factors contributing to the performance and any steps taken to address any performance concerns. Given the volatile market conditions of early 2020, the Board considered the Adviser’s analysis of the impact of such conditions on the Nuveen funds’ performance.
The Board evaluated performance in light of various factors, including general market conditions, issuer-specific information, asset class information, fund cash flows and other factors. Accordingly, depending on the facts and circumstances, the Board may be satisfied with a fund’s performance notwithstanding that its performance may be below its benchmark or peer group for certain periods. However, with respect to any Nuveen funds for which the Board had identified performance issues, the Board monitors such funds closely until performance improves, discusses with the Adviser the reasons for such results, considers whether any steps are necessary or appropriate to address such issues, and reviews the results of any efforts undertaken.
The Board’s determinations with respect to each Fund are summarized below.
For Nuveen Senior Income Fund, the Board noted that the Fund ranked in the first quartile of its Performance Peer Group for the one-year period ended December 31, 2019 and second quartile for the three- and five-year periods ended December 31, 2019 and outperformed its benchmark for the one-, three- and five-year periods ended December 31, 2019. With the market decline in the first quarter of 2020, the Fund’s performance was below its benchmark for the one-, three- and five-year periods ended March 31, 2020 and ranked in the third quartile of its Performance Peer Group for the one- and five-year periods ended March 31, 2020 and fourth quartile of its Performance Peer Group for the three-year period ended March 31, 2020. The Board considered the factors that detracted from Fund performance during the first quarter and was satisfied with the Adviser’s explanation. The Board was satisfied with the Fund’s overall performance.
For Nuveen Floating Rate Income Fund, the Board noted that the Fund outperformed its benchmark for the one-, three- and five-year periods ended December 31, 2019. Further, the Fund ranked in the third quartile of its Performance Peer Group for the five-year period, second quartile for the three-year period and first quartile for the one-year period ended December 31, 2019. With the market decline in the first quarter of 2020, the Fund’s performance was below the performance of its benchmark for the one-, three- and five-year periods ended March 31, 2020 and the Fund ranked in the third quartile of its Performance Peer Group for such periods. The Board considered the factors that detracted from Fund performance during the first quarter and was satisfied with the Adviser’s explanation. The Board was satisfied with the Fund’s overall performance.
For Nuveen Floating Rate Income Opportunity Fund, the Board noted that the Fund outperformed its benchmark for the one-, three- and five-year periods ended December 31, 2019 and ranked in the first quartile of its Performance Peer Group for the one-year period ended December 31, 2019 and second quartile of its Performance Peer Group for the three- and five-year periods ended December 31, 2019. With the market decline in the first quarter of 2020, the Fund’s performance was below the performance of its benchmark for the one-, three- and five-year periods ended March 31, 2020 and the Fund ranked in the third quartile of its Performance Peer Group for such periods. The Board considered the factors that detracted from Fund performance during the first quarter and was satisfied with the Adviser’s explanation. The Board was satisfied with the Fund’s overall performance.
161
Annual Investment Management Agreement Approval Process (continued)
(Unaudited)
For Nuveen Short Duration Credit Opportunities Fund, the Board noted that although the Fund’s performance was slightly below the performance of its benchmark for the three-year period ended December 31, 2019, the Fund outperformed its benchmark for the one- and five-year periods ended December 31, 2019 and ranked in the second quartile of its Performance Peer Group for the one-, three- and five-year periods ended December 31, 2019. With the market decline in the first quarter of 2020, the Fund’s performance was below the performance of its benchmark and ranked in the fourth quartile of its Performance Peer Group for the one-, three- and five-year periods ended March 31, 2020. The Board considered the factors that detracted from Fund performance during the first quarter and was satisfied with the Adviser’s explanation. The Board was satisfied with the Fund’s overall performance.
For Nuveen Credit Strategies Income Fund, the Board noted that although the Fund’s performance was below the performance of its benchmark for the three- and five-year periods ended December 31, 2019 and ranked in the third quartile of its Performance Peer Group for such periods, the Fund ranked in the first quartile and outperformed its benchmark for the one-year period ended December 31, 2019. With the market decline in the first quarter of 2020, the Fund’s performance was below the performance of its benchmark for the one-, three- and five-year periods ended March 31, 2020 but ranked in the third quartile of its Performance Peer Group for the five-year period ended March 31, 2020 and second quartile of its Performance Peer Group for the one- and three-year periods ended March 31, 2020. The Board considered the factors that detracted from Fund performance during the first quarter and was satisfied with the Adviser’s explanation. The Board was satisfied with the Fund’s overall performance.
| C. | | Fees, Expenses and Profitability |
As part of its annual review, the Board considered the contractual management fee and net management fee (the management fee after taking into consideration fee waivers and/or expense reimbursements, if any) paid by a Nuveen fund to the Adviser in light of the nature, extent and quality of the services provided. The Board also considered the total operating expense ratio of each Nuveen fund before and after any fee waivers and/or expense reimbursements. More specifically, the Independent Board Members reviewed, among other things, each fund’s gross and net management fee rates (i.e., before and after expense reimbursements and/or fee waivers, if any) and net total expense ratio in relation to those of a comparable universe of funds (the “Peer Universe”) established by Broadridge. The Independent Board Members reviewed the methodology Broadridge employed to establish its Peer Universe and recognized that differences between the applicable fund and its respective Peer Universe as well as changes to the composition of the Peer Universe from year to year may limit some of the value of the comparative data. The Independent Board Members also considered a fund’s operating expense ratio as it more directly reflected the shareholder’s costs in investing in the respective fund.
In their review, the Independent Board Members considered, in particular, each Nuveen fund with a net expense ratio (excluding investment-related costs of leverage) of six basis points or higher compared to that of its peer average (each, an “Expense Outlier Fund”) and an analysis as to the factors contributing to each such fund’s higher relative net expense ratio. In addition, although the Board reviewed a fund’s total net expenses both including and excluding investment-related expenses (i.e., leverage costs) and taxes for certain of the closed-end funds, the Board recognized that leverage expenses will vary across the Nuveen funds and in comparison to peers because of differences in the forms and terms of leverage employed by the respective fund. Accordingly, in reviewing the comparative data between a fund and its peers, the Board generally considered the fund’s net expense ratio and fees (excluding leverage costs and leveraged assets) to be higher if they were over 10 basis points higher, slightly higher if they were 6 to 10 basis points higher, in line if they were within approximately 5 basis points higher than the peer average and below if they were below the peer average of the Peer Universe. The Independent Board Members also considered, in relevant part, a fund’s net management fee and net total expense ratio in light of its performance history.
In their review of the fee arrangements for the Nuveen funds, the Independent Board Members considered the management fee schedules, including the complex-wide and fund-level breakpoint schedules, as applicable. The Board noted that across the Nuveen fund complex, the complex-wide fee breakpoints reduced fees by $56.6 million and fund-level breakpoints reduced fees by $66.8 million in 2019.
162
With respect to the Sub-Adviser, the Board also considered the sub-advisory fee schedule paid to the Sub-Adviser in light of the sub-advisory services provided to the respective Fund, the breakpoint schedule and comparative data of the fees the Sub-Adviser charges to other clients, if any. In its review, the Board recognized that the compensation paid to the Sub-Adviser is the responsibility of the Adviser, not the Funds.
The Independent Board Members noted that each Fund had a net management fee and a net expense ratio that were below its respective peer averages.
Based on its review of the information provided, the Board determined that each Fund’s management fees (as applicable) to a Fund Adviser were reasonable in light of the nature, extent and quality of services provided to the Fund.
| | 2. | | Comparisons with the Fees of Other Clients |
In determining the appropriateness of fees, the Board also considered information regarding the fee rates the respective Fund Advisers charged to certain other types of clients and the type of services provided to these other clients. With respect to the Adviser and/or the Sub-Adviser, such other clients may include retail and institutional managed accounts advised by the Sub-Adviser; hedge funds managed by the Sub-Adviser; and investment companies offered outside the Nuveen family and sub-advised by the Sub-Adviser. The Board further noted that the Adviser also advised certain exchange-traded funds (“ETFs”) sponsored by Nuveen.
The Board recognized that each Fund had an affiliated sub-adviser and, with respect to affiliated sub-advisers, reviewed, among other things, the range of fees assessed for managed accounts and hedge funds (along with the performance fees for such hedge funds). The Board also reviewed the fee range and average fee rate of certain selected investment strategies offered in retail and institutional managed accounts advised by the Sub-Adviser, hedge funds advised by the Sub-Adviser (along with their performance fees) and non-Nuveen investment companies sub-advised by certain affiliated sub-advisers.
In considering the fee data of other clients, the Board considered, among other things, the differences in the amount, type and level of services provided to the Nuveen funds relative to other clients as well as the differences in portfolio investment policies, investor profiles, account sizes and regulatory requirements, all of which contribute to the variations in the fee schedules. The Board recognized the complexity and myriad of services the Adviser had provided to the Nuveen funds compared to the other types of clients as the Adviser is principally responsible for all aspects of operating the funds, including complying with the increased regulatory requirements required when managing the funds as well as the increased entrepreneurial, legal and regulatory risks that the Adviser incurs in sponsoring and managing the funds. Further, with respect to ETFs, the Board considered that Nuveen ETFs are passively managed compared to the active management of the other Nuveen funds which contributed to the differences in fee levels between the Nuveen ETFs and other Nuveen funds. In general, higher fee levels reflect higher levels of service provided by the Adviser, increased investment management complexity, greater product management requirements, and higher levels of business risk or some combination of these factors. The Board further considered that the Sub-Adviser’s fee is essentially for portfolio management services and therefore more comparable to the fees it receives for retail wrap accounts and other external sub-advisory mandates. The Board concluded the varying levels of fees were justified given, among other things, the inherent differences in the products and the level of services provided to the Nuveen funds versus other clients, the differing regulatory requirements and legal liabilities and the entrepreneurial, legal and regulatory risks incurred in sponsoring and advising a registered investment company.
| | 3. | | Profitability of Fund Advisers |
In their review, the Independent Board Members considered information regarding Nuveen’s level of profitability for its advisory services to the Nuveen funds for the calendar years 2019 and 2018. The Board reviewed, among other things, Nuveen’s net margins (pre-tax) (both including and excluding distribution expenses); gross and net revenue margins (pre- and post-tax); revenues, expenses, and net income (pre-tax and after-tax and before distribution) of Nuveen for fund advisory services; and comparative profitability data comparing the margins of Nuveen compared to the adjusted margins of certain peers with publicly available data and with the most comparable assets under management (based on asset size and asset composition) for each of the last two calendar years. The Board also reviewed the revenues and expenses the Adviser derived from its ETF product line for the 2018 and 2019 calendar years.
163
Annual Investment Management Agreement Approval Process (continued)
(Unaudited)
In reviewing the profitability data, the Independent Board Members recognized the subjective nature of calculating profitability as the information is not audited and is dependent on cost allocation methodologies to allocate expenses of Nuveen and its affiliates between the fund and non-fund businesses. The expenses to be allocated include direct expenses in servicing the Nuveen funds as well as indirect and/or shared costs (such as overhead, legal and compliance) some of which are attributed to the Nuveen funds pursuant to the cost allocation methodologies. The Independent Board Members reviewed a description of the cost allocation methodologies employed to develop the financial information and a summary of the history of changes to the methodology over the eleven-year period from 2008 to 2019. The Board had also appointed three Independent Board Members, along with the assistance of independent counsel, to serve as the Board’s liaisons to review the development of the profitability data and any proposed changes to the cost allocation methodology prior to incorporating any such changes and to report to the full Board. The Board recognized that other reasonable and valid allocation methodologies could be employed and could lead to significantly different results. Based on the data, the Independent Board Members noted that Nuveen’s net margins were higher in 2019 than the previous year and considered the key drivers behind the revenue and expense changes that impacted Nuveen’s net margins between the years. The Board also noted the reinvestments of some of the profits into the business through, among other things, the investment of seed capital in certain funds and continued investments in enhancements to information technology, internal infrastructure and data management improvements and global investment and innovation projects.
As noted above, the Independent Board Members also considered Nuveen’s margins from its relationship to the Nuveen funds compared to the adjusted margins of certain peers with publicly available data and with the most comparable assets under management (based on asset size and asset composition) to Nuveen for the calendar years 2019 and 2018. The Independent Board Members noted that Nuveen’s margins from its relationships with the Nuveen funds were on the low range compared to the adjusted margins of the peers. The Independent Board Members, however, recognized that it is difficult to make comparisons of profitability with other investment adviser peers given that comparative data is not generally public and the calculation of profitability is subjective and affected by numerous factors (such as types of funds a peer manages, its business mix, its cost of capital, the numerous assumptions underlying the methodology used to allocate expenses and other factors) which can have a significant impact on the results.
Aside from Nuveen’s profitability, the Board recognized that the Adviser is a subsidiary of Nuveen, LLC, the investment management arm of Teachers Insurance and Annuity Association of America (“TIAA”). As such, the Board also reviewed a balance sheet for TIAA reflecting its assets, liabilities and capital and contingency reserves for the 2019 and 2018 calendar years to consider the financial strength of TIAA. The Board recognized the benefit of having an investment adviser and its parent with significant resources, particularly during periods of market stress.
In addition to Nuveen, the Independent Board Members also considered the profitability of the Sub-Adviser from its relationships with the Nuveen funds. In this regard, the Independent Board Members reviewed, among other things, the Sub-Adviser’s revenues, expenses and net revenue margins (pre- and post-tax) for its advisory activities for the calendar year ended December 31, 2019 as well as its pre-tax and after-tax net revenue margins for 2019 compared to such margins for 2018.
In evaluating the reasonableness of the compensation, the Independent Board Members also considered any other ancillary benefits derived by the respective Fund Adviser from its relationship with the Nuveen funds as discussed in further detail below.
Based on a consideration of all the information provided, the Board noted that Nuveen’s and the Sub-Adviser’s level of profitability was acceptable and not unreasonable in light of the services provided.
| D. | | Economies of Scale and Whether Fee Levels Reflect These Economies of Scale |
The Board considered whether there have been economies of scale with respect to the management of the Nuveen funds and whether these economies of scale have been appropriately shared with the funds. The Board recognized that although economies of scale are difficult to measure, there are several methods to help share the benefits of economies of scale, including breakpoints in the management fee schedule, fee waivers and/or expense limitations, the pricing of Nuveen funds
164
at scale at inception and investments in Nuveen’s business which can enhance the services provided to the funds for the fees paid. The Board noted that Nuveen generally has employed these various methods. In this regard, the Board noted that the management fee of the Adviser is generally comprised of a fund-level component and a complex-level component each with its own breakpoint schedule, subject to certain exceptions. The Board reviewed the fund-level and complex-level fee schedules. The Board considered that the fund-level breakpoint schedules are designed to share economies of scale with shareholders if the particular fund grows, and the complex-level breakpoint schedule is designed to deliver the benefits of economies of scale to shareholders when the eligible assets in the complex pass certain thresholds even if the assets of a particular fund are unchanged or have declined. With respect to the Nuveen closed-end funds, the Board noted that, although such funds may from time to time make additional share offerings, the growth of their assets would occur primarily through the appreciation of such funds’ investment portfolios. Further, in the calculation of the complex-level component, the Board noted that it had approved the acquisition of several Nuveen funds by similar TIAA-CREF funds in 2019. However, to mitigate the loss of the assets of these Nuveen funds deemed eligible to be included in the calculation of the complex-wide fee when these Nuveen funds left the complex upon acquisition, Nuveen agreed to credit approximately $460 million to assets under management to the Nuveen complex in calculating the complex-wide component.
The Independent Board Members also recognized the Adviser’s continued reinvestment in its business through, among other things, investments in its business infrastructure and information technology, portfolio accounting system and other systems and platforms that will, among other things, support growth, simplify and enhance information sharing, and enhance the investment process to the benefit of all of the Nuveen funds.
Based on its review, the Board concluded that the current fee arrangements together with the Adviser’s reinvestment in its business appropriately shared any economies of scale with shareholders.
The Independent Board Members received and considered information regarding other benefits the respective Fund Adviser or its affiliates may receive as a result of their relationship with the Nuveen funds. The Board considered the compensation that an affiliate of the Adviser received for serving as co-manager in the initial public offerings of new closed-end funds and for serving as an underwriter on shelf offerings of existing closed-end funds. In addition, the Independent Board Members also noted that various sub-advisers (including the Sub-Adviser) may engage in soft dollar transactions pursuant to which they may receive the benefit of research products and other services provided by broker-dealers executing portfolio transactions on behalf of the applicable Nuveen funds, although the Board recognized that certain sub-advisers may be phasing out the use of soft dollars over time.
The Board, however, noted that the benefits for the Sub-Adviser when transacting in fixed-income securities may be more limited as such securities generally trade on a principal basis and therefore do not generate brokerage commissions. Further, the Board considered that although the Sub-Adviser may benefit from the receipt of research and other services that it may otherwise have to pay for out of its own resources, the research may also benefit the Nuveen funds to the extent it enhances the ability of the Sub-Adviser to manage such funds or is acquired through the commissions paid on portfolio transactions of other clients.
Based on its review, the Board concluded that any indirect benefits received by a Fund Adviser as a result of its relationship with the Funds were reasonable and within acceptable parameters.
The Board Members did not identify any single factor discussed previously as all-important or controlling. The Board Members, including the Independent Board Members, concluded that the terms of each Advisory Agreement were fair and reasonable, that the respective Fund Adviser’s fees were reasonable in light of the services provided to each Fund and that the Advisory Agreements be renewed.
165
Board Members & Officers
(Unaudited)
The management of the Funds, including general supervision of the duties performed for the Funds by the Adviser, is the responsibility of the Board of Trustees of the Funds. None of the trustees who are not “interested” persons of the Funds (referred to herein as “independent board members”) has ever been a director or employee of, or consultant to, Nuveen or its affiliates. The names and business addresses of the trustees and officers of the Funds, their principal occupations and other affiliations during the past five years, the number of portfolios each Trustee oversees and other directorships they hold are set forth below.
| | | | | | | | |
| | | | |
| | | | | | | | | |
Name,
Year of Birth
& Address | | Position(s) Held
with the Funds | | Year First
Elected or
Appointed
and Term(1)
| | Principal
Occupation(s)
Including other
Directorships
During Past 5 Years | | Number
of Portfolios
in Fund Complex
Overseen by
Board Member |
| | | | |
| | | | | | | | | |
| | |
| Independent Board Members(2): | | | | |
| | | | |
∎ TERENCE J. TOTH | | | | | | Formerly, a Co-Founding Partner, Promus Capital (2008-2017); Director, Quality Control Corporation (since 2012); member: Catalyst Schools of Chicago Board (since 2008) and Mather Foundation Board (since 2012), and chair of its Investment Committee; formerly, Director, Fulcrum IT Services LLC (2010-2019); formerly, Director, Legal & General Investment Management America, Inc. (2008-2013); formerly, CEO and President, Northern Trust Global Investments (2004-2007): Executive Vice President, Quantitative Management & Securities Lending (2000-2004); prior thereto, various positions with Northern Trust Company (since 1994); formerly, Member, Northern Trust Mutual Funds Board (2005-2007), Northern Trust Global Investments Board (2004-2007), Northern Trust Japan Board (2004-2007), Northern Trust Securities Inc. Board (2003-2007) and Northern Trust Hong Kong Board (1997-2004). | | |
1959 333 W. Wacker Drive Chicago, IL 6o6o6 | | Chairman and Board Member | | 2008 Class II | | 155 |
| | | | | | |
| | | | |
∎ JACK B. EVANS | | | | | | Chairman (since 2019), formerly, President (1996-2019), The Hall-Perrine Foundation, a private philanthropic corporation; Director and Chairman, United Fire Group, a publicly held company; Director, Public Member, American Board of Orthopaedic Surgery (since 2015); Life Trustee of Coe College and the Iowa College Foundation; formerly, President Pro-Tem of the Board of Regents for the State of Iowa University System; formerly, Director, Alliant Energy and The Gazette Company; formerly, Director, Federal Reserve Bank of Chicago; formerly, President and Chief Operating Officer, SCI Financial Group, Inc., a regional financial services firm. | | |
1948 333 W. Wacker Drive Chicago, IL 6o6o6 | | Board Member | | 1999 Class III | | 155 |
| | | | | | |
| | | | |
∎ WILLIAM C. HUNTER | | | | | | Dean Emeritus, formerly, Dean, Tippie College of Business, University of Iowa (2006-2012); Director of Wellmark, Inc. (since 2009); past Director (2005-2015), and past President (2010-2014) Beta Gamma Sigma, Inc., The International Business Honor Society; formerly, Director (2004-2018) of Xerox Corporation; Dean and Distinguished Professor of Finance, School of Business at the University of Connecticut (2003-2006); previously, Senior Vice President and Director of Research at the Federal Reserve Bank of Chicago (1995-2003); formerly, Director (1997-2007), Credit Research Center at Georgetown University. | | |
1948 333 W. Wacker Drive Chicago, IL 6o6o6 | | Board Member | | 2003 Class I | | 155 |
| | | | | | |
166
| | | | | | | | |
| | | | |
| | | | | | | | | |
Name,
Year of Birth
& Address | | Position(s) Held
with the Funds | | Year First
Elected or
Appointed
and Term(1)
| | Principal
Occupation(s)
Including other
Directorships
During Past 5 Years | | Number
of Portfolios
in Fund Complex
Overseen by
Board Member |
| | | | |
| | | | | | | | | |
| | |
| Independent Board Members(2) (continued): | | | | |
| | | | |
∎ ALBIN F. MOSCHNER | | | | | | Founder and Chief Executive Officer, Northcroft Partners, LLC, a management consulting firm (since 2012); formerly, Chairman (2019), and Director (2012-2019), USA Technologies, Inc., a provider of solutions and services to facilitate electronic payment transactions; formerly, Director, Wintrust Financial Corporation (1996-2016); previously, held positions at Leap Wireless International, Inc., including Consultant (2011-2012), Chief Operating Officer (2008-2011), and Chief Marketing Officer (2004-2008); formerly, President, Verizon Card Services division of Verizon Communications, Inc. (2000-2003); formerly, President, One Point Services at One Point Communications (1999- 2000); formerly, Vice Chairman of the Board, Diba, Incorporated (1996-1997); formerly, various executive positions (1991-1996) and Chief Executive Officer (1995-1996) of Zenith Electronics Corporation. | | |
1952 333 W. Wacker Drive Chicago, IL 6o6o6 | | Board Member | | 2016 Class III | | 155 |
| | | | | | |
| | | | |
∎ JOHN K. NELSON | | | | | | Member of Board of Directors of Core12 LLC. (since 2008), a private firm which develops branding, marketing and communications strategies for clients; served on The President’s Council of Fordham University (2010-2019) and previously a Director of the Curran Center for Catholic American Studies (2009-2018); formerly, senior external advisor to the Financial Services practice of Deloitte Consulting LLP. (2012-2014); former Chair of the Board of Trustees of Marian University (2010-2014 as trustee, 2011-2014 as Chair); formerly Chief Executive Officer of ABN AMRO Bank N.V., North America, and Global Head of the Financial Markets Division (2007-2008), with various executive leadership roles in ABN AMRO Bank N.V. between 1996 and 2007. | | |
1962 333 W. Wacker Drive Chicago, IL 6o6o6 | | Board Member | | 2013 Class II | | 155 |
| | | | | | |
| | | | |
∎ JUDITH M. STOCKDALE | | | | | | Board Member, Land Trust Alliance (since 2013); formerly, Board Member, U.S. Endowment for Forestry and Communities (2013-2019); formerly, Executive Director (1994-2012), Gaylord and Dorothy Donnelley Foundation; prior thereto, Executive Director, Great Lakes Protection Fund (1990-1994). | | |
1947 333 W. Wacker Drive Chicago, IL 6o6o6 | | Board Member | | 1997 Class I | | 155 |
| | | | |
∎ CAROLE E. STONE | | | | | | Former Director, Chicago Board Options Exchange, Inc. (2006-2017); and C2 Options Exchange, Incorporated (2009-2017); former Director, Cboe, Global Markets, Inc., formerly, CBOE Holdings, Inc. (2010-May 2020); formerly, Commissioner, New York State Commission on Public Authority Reform (2005-2010). | | |
1947 333 W. Wacker Drive Chicago, IL 6o6o6 | | Board Member | | 2007 Class I | | 155 |
| | | | | | |
| | | | |
∎ MARGARET L. WOLFF | | | | | | Formerly, member of the Board of Directors (2013-2017) of Travelers Insurance Company of Canada and The Dominion of Canada General Insurance Company (each, a part of Travelers Canada, the Canadian operation of The Travelers Companies, Inc.); formerly, Of Counsel, Skadden, Arps, Slate, Meagher & Flom LLP (Mergers & Acquisitions Group) (2005-2014); Member of the Board of Trustees of New York-Presbyterian Hospital (since 2005); Member (since 2004) and Chair (since 2015) of the Board of Trustees of The John A. Hartford Foundation (a philanthropy dedicated to improving the care of older adults); formerly, Member (2005-2015) and Vice Chair (2011-2015) of the Board of Trustees of Mt. Holyoke College. | | |
1955 333 W. Wacker Drive Chicago, IL 6o6o6 | | Board Member | | 2016 Class I | | 155 |
| | | | | | |
| | | | |
∎ ROBERT L. YOUNG | | | | | | Formerly, Chief Operating Officer and Director, J.P.Morgan Investment Management Inc. (2010-2016); formerly, President and Principal Executive Officer (2013-2016), and Senior Vice President and Chief Operating Officer (2005-2010), of J.P.Morgan Funds; formerly, Director and various officer positions for J.P.Morgan Investment Management Inc. (formerly, JPMorgan Funds Management, Inc. and formerly, One Group Administrative Services) and JPMorgan Distribution Services, Inc. (formerly, One Group Dealer Services, Inc.) (1999-2017). | | |
1963 333 W. Wacker Drive Chicago, IL 6o6o6 | | Board Member | | 2017 Class II | | 155 |
| | | | | | |
167
Board Members & Officers (continued)
(Unaudited)
| | | | | | | | |
| | | | |
| | | | | | | | | |
| | | | |
| | | | | | | | | |
Name, Year of Birth & Address | | Position(s) Held
with the Funds | | Year First
Elected or
Appointed(3)
| | Principal Occupation(s) During Past 5 Years | | |
| | | | |
| | | | | | | | | |
| | | |
| Officers of the Funds: | | | | | | |
| | | | |
∎ NATHANIEL T. JONES | | | | | | Managing Director (since 2017), formerly, Senior Vice President (2016-2017), formerly, Vice President (2011-2016) of Nuveen; Managing Director (since 2015) of Nuveen Fund Advisors, LLC; Chartered Financial Analyst. | | |
1979 333 W. Wacker Drive Chicago, IL 6o6o6 | | Vice President and Treasurer | | 2016 | | |
| | | | |
∎ WALTER M. KELLY | | | | | | Managing Director (since 2017), formerly, Senior Vice President (2008-2017) of Nuveen. | | |
1970 333 W. Wacker Drive Chicago, IL 6o6o6 | | Chief Compliance Officer and Vice President | | 2003 | | |
| | | | |
∎ DAVID J. LAMB | | | | | | Managing Director (since 2017), formerly, Senior Vice President of Nuveen (since 2006), Vice President prior to 2006. | | |
1963 333 W. Wacker Drive Chicago, IL 6o6o6 | | Chief Administrative Officer | | 2015 | | |
| | | | |
∎ TINA M. LAZAR | | | | | | Managing Director (since 2017), formerly, Senior Vice President (2014-2017) of Nuveen Securities, LLC. | | |
1961 333 W. Wacker Drive Chicago, IL 6o6o6 | | Vice President | | 2002 | | |
| | | | |
∎ BRIAN J. LOCKHART | | | | | | Managing Director (since 2019) of Nuveen Fund Advisors, LLC; Managing Director (since 2017), formerly, Vice President (2010-2017) of Nuveen; Head of Investment Oversight (since 2017), formerly, Team Leader of Manager Oversight (2015-2017); Chartered Financial Analyst and Certified Financial Risk Manager. | | |
1974 333 W. Wacker Drive Chicago, IL 6o6o6 | | Vice President | | 2019 | | |
| | | |
∎ JACQUES M. LONGERSTAEY | | | | Senior Managing Director, Chief Risk Officer, Nuveen, LLC (since May 2019); Senior Managing Director (since May 2019) of Nuveen Fund Advisors, LLC; formerly, Chief Investment and Model Risk Officer, Wealth & Investment Management Division, Wells Fargo Bank (NA) (from 2013-2019). | | |
1963 8500 Andrew Carnegie Blvd. Charlotte, NC 28262 | | Vice President | | 2019 | | |
| | | | |
∎ KEVIN J. MCCARTHY | | | | | | Senior Managing Director (since 2017) and Secretary and General Counsel (since 2016) of Nuveen Investments, Inc., formerly, Executive Vice President (2016-2017) and Managing Director and Assistant Secretary (2008-2016); Senior Managing Director (since 2017) and Assistant Secretary (since 2008) of Nuveen Securities, LLC, formerly Executive Vice President (2016-2017) and Managing Director (2008-2016); Senior Managing Director (since 2017), Secretary (since 2016) and Co-General Counsel (since 2011) of Nuveen Fund Advisors, LLC, formerly, Executive Vice President (2016-2017), Managing Director (2008-2016) and Assistant Secretary (2007-2016); Senior Managing Director (since 2017), Secretary (since 2016) and Associate General Counsel (since 2011) of Nuveen Asset Management, LLC, formerly Executive Vice President (2016-2017) and Managing Director and Assistant Secretary (2011- 2016); Senior Managing Director (since 2017) and Secretary (since 2016) of Nuveen Investments Advisers, LLC, formerly Executive Vice President (2016- 2017); Vice President (since 2007) and Secretary (since 2016), formerly, Assistant Secretary, of NWQ Investment Management Company, LLC, Symphony Asset Management LLC, Santa Barbara Asset Management, LLC and Winslow Capital Management, LLC (since 2010). Senior Managing Director (since 2017) and Secretary (since 2016) of Nuveen Alternative Investments, LLC. | | |
1966 333 W. Wacker Drive Chicago, IL 6o6o6 | | Vice President and Assistant Secretary | | 2007 | | |
| | | | | | |
| | | | |
∎ JON SCOTT MEISSNER | | | | | | Managing Director of Mutual Fund Tax and Financial Reporting groups at Nuveen (since 2017); Managing Director of Nuveen Fund Advisors, LLC (since 2019); Senior Director of Teachers Advisors, LLC and TIAA-CREF Investment Management, LLC (since 2016); Senior Director (since 2015) Mutual Fund Taxation to the TIAA-CREF Funds, the TIAA-CREF Life Funds, the TIAA Separate Account VA-1 and the CREF Accounts; has held various positions with TIAA since 2004. | | |
1973 8500 Andrew Carnegie Blvd. Charlotte, NC 28262 | | Vice President | | 2019 | | |
| | | | | | |
168
| | | | | | | | |
| | | | |
| | | | | | | | | |
| | | | |
| | | | | | | | | |
Name, Year of Birth & Address | | Position(s) Held
with the Funds | | Year First
Elected or
Appointed(3)
| | Principal Occupation(s) During Past 5 Years | | |
| | | | |
| | | | | | | | | |
| | | |
| Officers of the Funds (continued): | | | | | | |
| | | | |
∎ WILLIAM T. MEYERS | | | | | | Senior Managing Director (since 2017), formerly, Managing Director (2016-2017), Senior Vice President (2010-2016) of Nuveen Securities, LLC and Nuveen Fund Advisors, LLC; Senior Managing Director (since 2017), formerly, Managing Director (2016-2017), Senior Vice President (2010-2016) of Nuveen, has held various positions with Nuveen since 1991. | | |
1966 333 W. Wacker Drive Chicago, IL 60606 | | Vice President | | 2018 | | |
| | | | |
∎ DEANN D. MORGAN | | | | | | Executive Vice President, Global Head of Product at Nuveen (since November 2019); Co-Chief Executive Officer of Nuveen Securities, LLC (since March 2020); Managing Member MDR Collaboratory LLC (since 2018); Managing Director, Head of Wealth Management Product Structuring & COO Multi Asset Investing, The Blackstone Group (2013-2017). | | |
1969 100 Park Avenue New York, NY 10016 | | Vice President | | 2020 | | |
| | |
∎ CHRISTOPHER M. ROHRBACHER | | Managing Director (since 2017) and Assistant Secretary of Nuveen Securities, LLC; Managing Director (since 2017), formerly, Senior Vice President (2016-2017), Co-General Counsel (since 2019) and Assistant Secretary (since 2016) of Nuveen Fund Advisors, LLC; Managing Director (since 2017), formerly, Senior Vice President (2012-2017) and Associate General Counsel (since 2016), formerly, Assistant General Counsel (2008-2016) of Nuveen. | | |
1971 333 W. Wacker Drive Chicago, IL 6o6o6 | | Vice President and Assistant Secretary | | 2008 | | |
| | | | | | |
| | | | |
∎ WILLIAM A. SIFFERMANN | | | | | | Managing Director (since 2017), formerly Senior Vice President (2016-2017) and Vice President (2011-2016) of Nuveen. | | |
1975 333 W. Wacker Drive Chicago, IL 6o6o6 | | Vice President | | 2017 | | |
| | | | |
∎ E. SCOTT WICKERHAM | | | | | | Senior Managing Director, Head of Fund Administration at Nuveen, LLC (since 2019), formerly, Managing Director; Senior Managing Director (since 2019), Nuveen Fund Advisers, LLC; Principal Financial Officer, Principal Accounting Officer and Treasurer (since 2017) to the TIAA-CREF Funds, the TIAA-CREF Life Funds, the TIAA Separate Account VA-1 and the Treasurer (since 2017) to the CREF Accounts; Senior Director, TIAA-CREF Fund Administration (2014-2015); has held various positions with TIAA since 2006. | | |
1973 TIAA 730 Third Avenue New York, NY 10017 | | Vice President and Controller | | 2019 | | |
| | | | | | |
| | | | |
∎ MARK L. WINGET | | | | | | Vice President and Assistant Secretary of Nuveen Securities, LLC (since 2008); Vice President and Assistant Secretary of Nuveen Fund Advisors, LLC (since 2019); Vice President (since 2010) and Associate General Counsel (since 2016), formerly, Assistant General Counsel (2008-2016) of Nuveen. | | |
1968 333 W. Wacker Drive Chicago, IL 60606 | | Vice President and Assistant Secretary | | 2008 | | |
169
Board Members & Officers (continued)
(Unaudited)
| | | | | | | | |
| | | | |
| | | | | | | | | |
| | | | |
| | | | | | | | | |
Name, Year of Birth & Address | | Position(s) Held
with the Funds | | Year First
Elected or
Appointed(3)
| | Principal Occupation(s) During Past 5 Years | | |
| | | | |
| | | | | | | | | |
| | | |
| Officers of the Funds (continued): | | | | | | |
| | | | |
∎ GIFFORD R. ZIMMERMAN | | | | | | Managing Director (since 2002), and Assistant Secretary of Nuveen Securities, LLC; Managing Director (since 2004) and Assistant Secretary (since 1994) of Nuveen Investments, Inc.; Managing Director (since 2002), Assistant Secretary (since 1997) and Co-General Counsel (since 2011) of Nuveen Fund Advisors, LLC; Managing Director, Assistant Secretary and Associate General Counsel of Nuveen Asset Management, LLC (since 2011); Vice President (since 2017), formerly, Managing Director (2003-2017) and Assistant Secretary (since 2003) of Symphony Asset Management LLC; Managing Director and Assistant Secretary (since 2002) of Nuveen Investments Advisers, LLC; Vice President and Assistant Secretary of NWQ Investment Management Company, LLC (since 2002), Santa Barbara Asset Management, LLC (since 2006), and of Winslow Capital Management, LLC, (since 2010); Chartered Financial Analyst. | | |
1956 333 W. Wacker Drive Chicago, IL 60606 | | Vice President Secretary | | 1988 | | |
| | | | | | |
| (1) | The Board of Trustees is divided into three classes, Class I, Class II, and Class III, with each being elected to serve until the third succeeding annual shareholders’ meeting subsequent to its election or thereafter in each case when its respective successors are duly elected or appointed, except two board members are elected by the holders of Preferred Shares, when applicable, to serve until the next annual shareholders’ meeting subsequent to its election or thereafter in each case when its respective successors are duly elected or appointed. The year first elected or appointed represents the year in which the board member was first elected or appointed to any fund in the Nuveen complex. |
| (2) | Matthew Thornton III has been appointed to the Board of Trustees of the Fund as a Class III Trustee, the boards of all other closed-end funds in the Nuveen complex and the Board of Trustees of Nushares ETF Trust, each such appointment effective November 16, 2020. Mr. Thornton has also been nominated for election to the boards of all mutual funds in the Nuveen complex. If Mr. Thornton is elected to the board of each such fund for which he has been nominated and assuming his appointments become effective, Mr. Thornton will oversee all the portfolios in the Nuveen fund complex. Mr. Thornton’s principal occupation and other directorships during the past five years are as follows: |
| | Formerly, Executive Vice President and Chief Operating Officer (2018-2019), FedEx Freight Corporation, a subsidiary of FedEx Corporation (“FedEx”) (provider of transportation, e-commerce and business services through its portfolio of companies); formerly, Senior Vice President, U.S. Operations (2006-2018), Federal Express Corporation, a subsidiary of FedEx; formerly, Member of the Board of Directors (2012-2018), Safe Kids Worldwide® (a non-profit organization dedicated to preventing childhood injuries); member of the Board of Directors (since 2014), The Sherwin-Williams Company (develops, manufactures, distributes and sells paints, coatings and related products). |
| (3) | Officers serve one year terms through August of each year. The year first elected or appointed represents the year in which the Officer was first elected or appointed to any fund in the Nuveen complex. |
170
Notes
171
Nuveen:
Serving Investors for Generations
Since 1898, financial professionals and their clients have relied on Nuveen to provide dependable investment solutions through continued adherence to proven, long-term investing principles. Today, we offer a range of high quality solutions designed to be integral components of a well-diversified core portfolio.
Focused on meeting investor needs.
Nuveen is the investment manager of TIAA. We have grown into one of the world’s premier global asset managers, with specialist knowledge across all major asset classes and particular strength in solutions that provide income for investors and that draw on our expertise in alternatives and responsible investing. Nuveen is driven not only by the independent investment processes across the firm, but also the insights, risk management, analytics and other tools and resources that a truly world-class platform provides. As a global asset manager, our mission is to work in partnership with our clients to create solutions which help them secure their financial future.
Find out how we can help you.
To learn more about how the products and services of Nuveen may be able to help you meet your financial goals, talk to your financial professional, or call us at (800) 257-8787. Please read the information provided carefully before you invest. Investors should consider the investment objective and policies, risk considerations, charges and expenses of any investment carefully. Where applicable, be sure to obtain a prospectus, which contains this and other relevant information. To obtain a prospectus, please contact your securities representative or Nuveen, 333 W. Wacker Dr., Chicago, IL 60606. Please read the prospectus carefully before you invest or send money.
Learn more about Nuveen Funds at: www.nuveen.com/closed-end-funds
| | | | |
| Nuveen Securities, LLC, member FINRA and SIPC | 333 West Wacker Drive Chicago, IL 60606 | www.nuveen.com | | | | EAN-A-0720D
1316905-INV-Y-09/21 |
As of the end of the period covered by this report, the registrant has adopted a code of ethics that applies to the registrant’s principal executive officer, principal financial officer, principal accounting officer or controller, or persons performing similar functions. There were no amendments to or waivers from the Code during the period covered by this report. The registrant has posted the code of ethics on its website at www.nuveen.com/fund-governance. (To view the code, click on Code of Conduct.)
| ITEM 3. | AUDIT COMMITTEE FINANCIAL EXPERT. |
As of the end of the period covered by this report, the registrant’s Board of Directors or Trustees (“Board”) determined that the registrant has at least one “audit committee financial expert” (as defined in Item 3 of Form N-CSR) serving on its Audit Committee. The registrant’s audit committee financial experts are Carole E. Stone, Jack B. Evans and William C. Hunter, who are “independent” for purposes of Item 3 of Form N-CSR.
Ms. Stone served for five years as Director of the New York State Division of the Budget. As part of her role as Director, Ms. Stone was actively involved in overseeing the development of the State’s operating, local assistance and capital budgets, its financial plan and related documents; overseeing the development of the State’s bond-related disclosure documents and certifying that they fairly presented the State’s financial position; reviewing audits of various State and local agencies and programs; and coordinating the State’s system of internal audit and control. Prior to serving as Director, Ms. Stone worked as a budget analyst/examiner with increasing levels of responsibility over a 30 year period, including approximately five years as Deputy Budget Director. Ms. Stone has also served as Chair of the New York State Racing Association Oversight Board, as Chair of the Public Authorities Control Board, as a Commissioner on the New York State Commission on Public Authority Reform and as a member of the Boards of Directors of several New York State public authorities. These positions have involved overseeing operations and finances of certain entities and assessing the adequacy of project/entity financing and financial reporting. Currently, Ms. Stone is on the Board of Directors of CBOE Holdings, Inc., of the Chicago Board Options Exchange, and of C2 Options Exchange. Ms. Stone’s position on the boards of these entities and as a member of both CBOE Holdings’ Audit Committee and its Finance Committee has involved, among other things, the oversight of audits, audit plans and preparation of financial statements.
Mr. Evans was formerly President and Chief Operating Officer of SCI Financial Group, Inc., a full service registered broker-dealer and registered investment adviser (“SCI”). As part of his role as President and Chief Operating Officer, Mr. Evans actively supervised the Chief Financial Officer (the “CFO”) and actively supervised the CFO’s preparation of financial statements and other filings with various regulatory authorities. In such capacity, Mr. Evans was actively involved in the preparation of SCI’s financial statements and the resolution of issues raised in connection therewith. Mr. Evans has also served on the audit committee of various reporting companies. At such companies, Mr. Evans was involved in the oversight of audits, audit plans, and the preparation of financial statements. Mr. Evans also formerly chaired the audit committee of the Federal Reserve Bank of Chicago.
Mr. Hunter was formerly a Senior Vice President at the Federal Reserve Bank of Chicago. As part of his role as Senior Vice President, Mr. Hunter was the senior officer responsible for all operations of each of the Economic Research, Statistics, and Community and Consumer Affairs units at the Federal Reserve Bank of Chicago. In such capacity, Mr. Hunter oversaw the subunits of the Statistics and Community and Consumer Affairs divisions responsible for the analysis and evaluation of bank and bank holding company financial statements and financial filings. Prior to serving as Senior Vice President at the Federal Reserve Bank of Chicago, Mr. Hunter was the Vice President of the Financial Markets unit at the Federal Reserve Bank of Atlanta where he supervised financial staff and bank holding company analysts who analyzed and evaluated bank and bank holding company financial statements. Mr. Hunter also currently serves on the Boards of Directors of Xerox Corporation and Wellmark, Inc. as well as on the Audit Committees of such Boards. As an Audit Committee member, Mr. Hunter’s responsibilities include, among other things, reviewing financial statements, internal audits and internal controls over financial reporting. Mr. Hunter also formerly was a Professor of Finance at the University of Connecticut School of Business and has authored numerous scholarly articles on the topics of finance, accounting and economics.
| ITEM 4. | PRINCIPAL ACCOUNTANT FEES AND SERVICES. |
Nuveen Floating Rate Income Fund
The following tables show the amount of fees that KPMG LLP, the Fund’s auditor, billed to the Fund during the Fund’s last two full fiscal years. For engagements with KPMG LLP the Audit Committee approved in advance all audit services and non-audit services that KPMG LLP provided to the Fund, except for those non-audit services that were subject to the pre-approval exception under Rule 2-01 of Regulation S-X (the “pre-approval exception”). The pre-approval exception for services provided directly to the Fund waives the pre-approval requirement for services other than audit, review or attest services if: (A) the aggregate amount of all such services provided constitutes no more than 5% of the total amount of revenues paid by the Fund to its accountant during the fiscal year in which the services are provided; (B) the Fund did not recognize the services as non-audit services at the time of the engagement; and (C) the services are promptly brought to the Audit Committee’s attention, and the Committee (or its delegate) approves the services before the audit is completed.
The Audit Committee has delegated certain pre-approval responsibilities to its Chair (or, in her absence, any other member of the Audit Committee).
SERVICES THAT THE FUND’S AUDITOR BILLED TO THE FUND
| | | | | | | | | | | | | | | | |
Fiscal Year Ended | | Audit Fees
Billed to Fund 1 | | | Audit-Related Fees
Billed to Fund 2 | | | Tax Fees
Billed to Fund 3 | | | All Other Fees
Billed to Fund 4 | |
July 31, 2020 | | $ | 41,150 | | | $ | 0 | | | $ | 0 | | | $ | 0 | |
| | | | | | | | | | | | | | | | |
| | | | |
Percentage approved pursuant to pre-approval exception | | | 0 | % | | | 0 | % | | | 0 | % | | | 0 | % |
| | | | | | | | | | | | | | | | |
| | | | |
July 31, 2019 | | $ | 34,470 | | | $ | 5,000 | | | $ | 0 | | | $ | 0 | |
| | | | | | | | | | | | | | | | |
| | | | |
Percentage approved pursuant to pre-approval exception | | | 0 | % | | | 0 | % | | | 0 | % | | | 0 | % |
| | | | | | | | | | | | | | | | |
1 “Audit Fees” are the aggregate fees billed for professional services for the audit of the Fund’s annual financial statements and services provided in connection with statutory and regulatory filings or engagements.
2 “Audit Related Fees” are the aggregate fees billed for assurance and related services reasonably related to the performance of the audit or review of financial statements that are not reported under “Audit Fees”. These fees include offerings related to the Fund’s common shares and leverage.
3 “Tax Fees” are the aggregate fees billed for professional services for tax advice, tax compliance, and tax planning. These fees include: all global withholding tax services; excise and state tax reviews; capital gain, tax equalization and taxable basis calculation performed by the principal accountant.
4 “All Other Fees” are the aggregate fees billed for products and services other than “Audit Fees”, “Audit-Related Fees” and “Tax Fees”. These fees represent all “Agreed-Upon Procedures” engagements pertaining to the Fund’s use of leverage.
SERVICES THAT THE FUND’S AUDITOR BILLED TO THE
ADVISER AND AFFILIATED FUND SERVICE PROVIDERS
The following tables show the amount of fees billed by KPMG LLP to Nuveen Fund Advisors, LLC (formerly Nuveen Fund Advisors, Inc.) (the “Adviser”), and any entity controlling, controlled by or under common control with the Adviser that provides ongoing services to the Fund (“Affiliated Fund Service Provider”), for engagements directly related to the Fund’s operations and financial reporting, during the Fund’s last two full fiscal years.
The tables also show the percentage of fees subject to the pre-approval exception. The pre-approval exception for services provided to the Adviser and any Affiliated Fund Service Provider (other than audit, review or attest services) waives the pre-approval requirement if: (A) the aggregate amount of all such services provided constitutes no more than 5% of the total amount of revenues paid to KPMG LLP by the Fund, the Adviser and Affiliated Fund Service Providers during the fiscal year in which the services are provided that would have to be pre-approved by the Audit Committee; (B) the Fund did not recognize the services as non-audit services at the time of the engagement; and (C) the services are promptly brought to the Audit Committee’s attention, and the Committee (or its delegate) approves the services before the Fund’s audit is completed.
| | | | | | | | | | | | |
Fiscal Year Ended | | Audit-Related Fees
Billed to Adviser and
Affiliated Fund
Service Providers | | | Tax Fees
Billed to Adviser and
Affiliated Fund
Service Providers | | | All Other Fees
Billed to Adviser and
Affiliated Fund
Service Providers | |
July 31, 2020 | | $ | 0 | | | $ | 0 | | | $ | 0 | |
| | | | | | | | | | | | |
| | | |
Percentage approved pursuant to pre-approval exception | | | 0 | % | | | 0 | % | | | 0 | % |
| | | | | | | | | | | | |
| | | |
July 31, 2019 | | $ | 0 | | | $ | 0 | | | $ | 0 | |
| | | | | | | | | | | | |
| | | |
Percentage approved pursuant to pre-approval exception | | | 0 | % | | | 0 | % | | | 0 | % |
| | | | | | | | | | | | |
NON-AUDIT SERVICES
The following table shows the amount of fees that KPMG LLP billed during the Fund’s last two full fiscal years for non-audit services. The Audit Committee is required to pre-approve non-audit services that KPMG LLP provides to the Adviser and any Affiliated Fund Services Provider, if the engagement related directly to the Fund’s operations and financial reporting (except for those subject to the pre-approval exception described above). The Audit Committee requested and received information from KPMG LLP about any non-audit services that KPMG LLP rendered during the Fund’s last fiscal year to the Adviser and any Affiliated Fund Service Provider. The Committee considered this information in evaluating KPMG LLP ’s independence.
| | | | | | | | | | | | | | | | |
Fiscal Year Ended | | Total Non-Audit Fees
Billed to Fund | | | Total Non-Audit Fees
billed to Adviser and
Affiliated Fund Service
Providers (engagements
related directly to the
operations and financial
reporting of the Fund) | | | Total Non-Audit Fees
billed to Adviser and
Affiliated Fund Service
Providers (all other
engagements) | | | Total | |
July 31, 2020 | | $ | 0 | | | $ | 0 | | | $ | 0 | | | $ | 0 | |
July 31, 2019 | | $ | 0 | | | $ | 0 | | | $ | 0 | | | $ | 0 | |
“Non-Audit Fees billed to Fund” for both fiscal year ends represent “Tax Fees” and “All Other Fees” billed to Fund in their respective amounts from the previous table.
Less than 50 percent of the hours expended on the principal accountant’s engagement to audit the registrant’s financial statements for the most recent fiscal year were attributed to work performed by persons other than the principal accountant’s full-time, permanent employees.
Audit Committee Pre-Approval Policies and Procedures. Generally, the Audit Committee must approve (i) all non-audit services to be performed for the Fund by the Fund’s independent accountants and (ii) all audit and non-audit services to be performed by the Fund’s independent accountants for the Affiliated Fund Service Providers with respect to operations and financial reporting of the Fund. Regarding tax and research projects conducted by the independent accountants for the Fund and Affiliated Fund Service Providers (with respect to operations and financial reports of the Fund) such engagements will be (i) pre-approved by the Audit Committee if they are expected to be for amounts greater than $10,000; (ii) reported to the Audit Committee chair for her verbal approval prior to engagement if they are expected to be for amounts under $10,000 but greater than $5,000; and (iii) reported to the Audit Committee at the next Audit Committee meeting if they are expected to be for an amount under $5,000.
| ITEM 5. | AUDIT COMMITTEE OF LISTED REGISTRANTS. |
The registrant’s Board has a separately designated Audit Committee established in accordance with Section 3(a)(58)(A) of the Securities Exchange Act of 1934, as amended (15 U.S.C. 78c(a)(58)(A)). As of the end of the period covered by this report, the members of the audit committee are Jack B. Evans, William C. Hunter, John K. Nelson, Judith M. Stockdale and Carole E. Stone, Chair.
| ITEM 6. | SCHEDULE OF INVESTMENTS. |
| (a) | | See Portfolio of Investments in Item 1. |
| ITEM 7. | DISCLOSURE OF PROXY VOTING POLICIES AND PROCEDURES FOR CLOSED-END MANAGEMENT INVESTMENT COMPANIES. |
Nuveen Fund Advisors, LLC is the registrant’s investment adviser (also referred to as the “Adviser”). The Adviser is responsible for the on-going monitoring of the Fund’s investment portfolio, managing the Fund’s business affairs and providing certain clerical, bookkeeping and administrative services. The Adviser has engaged Symphony Asset Management, LLC (“Symphony” or “Sub-Adviser”) as Sub-Adviser to provide discretionary investment advisory services. As part of these services, the Adviser has delegated to the Sub-Adviser the full responsibility for proxy voting on securities held in the registrant’s portfolio and related duties in accordance with the Sub-Adviser’s policies and procedures. The Adviser periodically monitors the Sub-Adviser’s voting to ensure that it is carrying out its duties. The Sub-Adviser’s proxy voting policies and procedures are summarized as follows:
555 California Street, Suite 3100,
San Francisco, California 94104
T:415.676.4000 F: 415.676.2480
www.nuveen.com/symphony

Symphony Asset Management Proxy Voting Policy
Symphony has adopted and implemented a proxy voting policy and procedures (the “Policy”) to ensure that proxies are voted in the best interest of its clients (“Clients”). These are merely guidelines and specific situations could call for a vote which does not follow the guidelines. In determining how to vote proxies, Symphony will typically follow the proxy voting guidelines of the independent third party Symphony has retained to provide proxy voting services, which are available from Symphony upon request (Third Party Proxy Guidelines”). As a rule, Symphony will vote proxies in accordance with its determination of its Client’s best interest and fully and fairly disclose conflict of interests as appropriate.
Symphony has created a Proxy Voting Committee to periodically review the Policy, address conflicts of interest, evaluate proxy voting service providers, and oversee portfolio manager decisions for consistency with client instructions, policies, procedures, that deviate from the Third Party Proxy Guidelines. The Policy provides that under certain circumstances, Symphony can vote one way for some Clients and another way for other Clients. For example, votes for a Client who provides specific voting instructions may differ from votes for Clients who do not provide proxy voting instructions. However, when Symphony has discretion, proxies will generally be voted the same way for all Clients. In addition, conflicts of interest in voting proxies can arise between Clients, Symphony and/or its Employees due to the existence of a lending or other material relationship or otherwise. As a general rule, conflicts will be resolved by Symphony voting in accordance with the Third Party Proxy Guidelines when:
| | • | | Symphony manages the account of a corporation or a pension fund sponsored by a corporation in which other Clients of Symphony also own stock. Symphony will vote the proxy for its other Clients in accordance with Third-party Proxy Guidelines and will follow any directions from the corporation or the pension plan, if different than the Third Party Proxy Guidelines. |
| | • | | Symphony has knowledge that an Employee or a member of his/her immediate family is on the Board of Directors or a member of senior management of the company that is the issuer of securities held in a Client’s account. |
| | • | | Symphony has a borrowing or other material relationship with a corporation whose securities are the subject of the proxy. |
In seeking to address conflicts, Symphony’s fundamental objective is to vote proxies in the best interest of its Clients, and not place its own interests ahead of the Client interests. As a general rule, Symphony’s Client’s Investment Management Agreements delegate proxy voting
authority to Symphony. In voting proxies for its Clients, when Symphony follows Third Party Proxy Guidelines, prior to such vote it will consider the best interest of the Client and if appropriate independently analyze certain events such as mergers and acquisitions to determine if Symphony in in agreement with the Third Party Proxy Guidelines. . Clients can also decide not to delegate voting rights to Symphony or can set restrictions on Symphony’s voting authority, which Symphony will comply with. Examples of possible voting arrangements could include:
| | • | | parameters based on the client’s preferences, such as proposals relating to corporate events (mergers and acquisition transactions, dissolutions, conversions, or consolidations) or contested elections for directors; |
| | • | | voting in accordance with the voting recommendations of management of the issuer; |
| | • | | voting in favor of all (or certain) proposals made by particular shareholder proponents; |
| | • | | agreeing that Symphony would not exercise voting authority in circumstances under which voting could impose costs on the client and the vote would not reasonably be expected to have a material effect on the value of the client’s investment; or, |
| | • | | voting pursuant to certain environmental, social, or governance standards or factors. |
Proxies will always be voted by Symphony based upon its reasonable belief about what is in the best interest of Clients. Those situations that do not fit within the general rules for the resolution of conflicts of interest will be reviewed by the Proxy Voting Committee. The Proxy Voting Committee, after consulting with Symphony’s Risk Committee if deemed appropriate, will determine how the proxy should be voted. For example, when a portfolio manager decides not to follow the Third Party Proxy Guidelines, the Proxy Voting Committee will review a portfolio manager’s recommendation and determine how to vote the proxy. Decisions by the Proxy Voting Committee will be documented and kept with records related to the voting of proxies. A summary of specific votes will be retained in accordance with Symphony’s recordkeeping requirements.
| ITEM 8. | PORTFOLIO MANAGERS OF CLOSED-END MANAGEMENT INVESTMENT COMPANIES. |
Nuveen Fund Advisors, LLC is the registrant’s investment adviser (also referred to as the “Adviser”). The Adviser is responsible for the selection and on-going monitoring of the Fund’s investment portfolio, managing the Fund’s business affairs and providing certain clerical, bookkeeping and administrative services. The Adviser has engaged Symphony Asset Management LLC (“Symphony”, also referred to as “Sub-Adviser”) as Sub-Adviser to provide discretionary investment advisory services. The following section provides information on the portfolio managers.
| Item 8 (a)(1). | Portfolio Manager Biographies |
As of the date of filing this report, the following individuals at the Sub-Adviser (the “Portfolio Manager”) have primary responsibility for the day-to-day implementation of the Fund’s investment strategy:
Scott Caraher, Senior Portfolio Manager, Co-Head of Investments, Head of Loans, is a member of the Risk Committee and responsible for Symphony’s retail and institutional bank loan-focused portfolios, including credit trading related to bank loans. Prior to joining Symphony in 2002, Scott was an Investment Banking Analyst in the industrial group at Deutsche Banc Alex Brown in New York.
Kevin Lorenz, CFA, head of high yield and responsible for retail and institutional high yield bond focused portfolio management. He has served in a variety of roles since joining the firm in 1987. He has been investing in high yield over his entire career and has focused exclusively on high yield since 1995. Kevin is also a member of the global fixed income investment committee, which discusses and debates investment policy for all global fixed income products. Kevin has served in a variety of roles since joining the firm in 1987. He joined the portfolio management team for the registrant on August 17, 2020.
| Item 8 (a)(2). | Other Accounts Managed By Portfolio Managers |
In addition to the Fund, as of July 31, 2020, the portfolio managers are also primarily responsible for the day-to-day portfolio management of the following accounts:
| | | | | | | | |
| | | Scott Caraher | | | Kevin Lorenz* | |
(a) Registered Investment Companies | | | | | | | | |
Number of accounts | | | 11 | | | | 12 | |
Assets | | $ | 5.06 billion | | | | 13.88 billion | |
(b) Other pooled accounts | | | | | | | | |
Non-performance fee accounts | | | | | | | | |
Number of accounts | | | 5 | | | | 0 | |
Assets | | $ | 875 million | | | $ | 0 | |
Performance fee accounts | | | | | | | | |
Number of accounts | | | 0 | | | | 0 | |
Assets | | $ | 0 | | | $ | 0 | |
| | | | | | | | |
| | | Scott Caraher | | | Kevin Lorenz* | |
(c) Other | | | | | | | | |
Non-performance fee accounts | | | | | | | | |
Number of accounts | | | 5 | | | | 0 | |
Assets | | $ | 1.40 billion | | | $ | 0 | |
Performance fee accounts | | | | | | | | |
Number of accounts | | | 0 | | | | 0 | |
Assets | | $ | 0 | | | $ | 0 | |
* Assets are as of 8/31/20, Kevin Lorenz joined the portfolio management team on 8/17/20.
Potential Material Conflicts of Interest
The portfolio managers may manage other accounts with investment strategies similar to the Funds, including other investment companies and separately managed accounts. Fees earned by the Sub-Adviser may vary among these accounts and the portfolio managers may personally invest in some but not all of these accounts. These factors could create conflicts of interest because a portfolio manager may have incentives to favor certain accounts over others, resulting in other accounts outperforming the Funds. A conflict may also exist if a portfolio manager identified a limited investment opportunity that may be appropriate for more than one account, but the Funds are not able to take full advantage of that opportunity due to the need to allocate that opportunity among multiple accounts. In addition, the portfolio managers may execute transactions for another account that may adversely impact the value of securities held by the Funds. However, the Sub-Adviser believes that these risks are mitigated by the fact that accounts with like investment strategies managed by a particular portfolio manager are generally managed in a similar fashion, subject to exceptions to account for particular investment restrictions or policies applicable only to certain accounts, differences in cash flows and account sizes, and other factors. In addition, the Sub-Adviser has adopted trade allocation procedures so that accounts with like investment strategies are treated fairly and equitably over time.
| Item 8 (a)(3). | Fund Manager Compensation |
As of the most recently completed fiscal year end, the primary portfolio managers’ compensation is as follows:
Symphony investment professionals receive compensation based on three elements: fixed-base salary, participation in a bonus pool and certain long-term incentives.
The fixed-base salary is set at a level determined by Symphony and is reviewed periodically to ensure that it is competitive with base salaries paid by similar financial services companies for persons playing similar roles.
Each portfolio manager is also eligible to receive an annual bonus from a pool based on Symphony’s aggregate asset-based and performance fees after all operating expenses. Bonus compensation for each individual is based on a variety of factors, including the performance of Symphony, the Funds, the team and the individual. Fund performance is assessed on a pre-tax total return risk-adjusted basis, and generally measured relative to the Fund’s primary benchmark and/or industry peer group for one, three or five year periods as applicable.
Finally, certain key employees of Symphony, including the portfolio managers, have received profits interests in Symphony which entitle their holders to participate in the firm’s growth over time.
| Item 8 (a)(4). | Ownership of JFR Securities As of July 31, 2020 |
| | | | | | | | | | | | | | |
Name of Portfolio Manager | | None | | $1-
$10,000 | | $10,001-
$50,000 | | $50,001-
$100,000 | | $100,001-
$500,000 | | $500,001-
$1,000,000 | | Over $1,000,000 |
Scott Caraher | | | | | | | | X | | | | | | |
Kevin Lorenz | | X | | | | | | | | | | | | |
| ITEM 9. | PURCHASES OF EQUITY SECURITIES BY CLOSED-END MANAGEMENT INVESTMENT COMPANY AND AFFILIATED PURCHASERS. |
Not applicable.
| ITEM 10. | SUBMISSION OF MATTERS TO A VOTE OF SECURITY HOLDERS. |
There have been no material changes to the procedures by which shareholders may recommend nominees to the registrant’s Board implemented after the registrant last provided disclosure in response to this Item.
| ITEM 11. | CONTROLS AND PROCEDURES. |
| (a) | | The registrant’s principal executive and principal financial officers, or persons performing similar functions, have concluded that the registrant’s disclosure controls and procedures (as defined in Rule 30a-3(c) under the Investment Company Act of 1940, as amended (the “1940 Act”) (17 CFR 270.30a-3(c))) are effective, as of a date within 90 days of the filing date of this report that includes the disclosure required by this paragraph, based on their evaluation of the controls and procedures required by Rule 30a-3(b) under the 1940 Act (17 CFR 270.30a-3(b)) and Rules 13a-15(b) or 15d-15 (b) under the Securities Exchange Act of 1934, as amended (the “Exchange Act”) (17 CFR 240.13a-15(b) or 240.15d-15(b)). |
| (b) | | There were no changes in the registrant’s internal control over financial reporting (as defined in Rule 30a-3(d) under the 1940 Act (17 CFR 270.30a-3(d)) that occurred during the period covered by this report that has materially affected, or is reasonably likely to materially affect, the registrant’s internal control over financial reporting. |
| ITEM 12. | DISCLOSURE OF SECURITIES LENDING ACTIVITIES FOR CLOSED-END MANAGEMENT INVESTMENT COMPANIES. |
Not applicable
File the exhibits listed below as part of this Form.
(a)(1) Any code of ethics, or amendment thereto, that is the subject of the disclosure required by Item 2, to the extent that the registrant intends to satisfy the Item 2 requirements through filing of an exhibit: Not applicable because the code is posted on registrant’s website at www.nuveen.com/fund-governance and there were no amendments during the period covered by this report. (To view the code, click on Code of Conduct.)
(a)(2) A separate certification for each principal executive officer and principal financial officer of the registrant as required by Rule 30a-2(a) under the 1940 Act (17 CFR 270.30a-2(a)) in the exact form set forth below: Ex-99.CERT Attached hereto.
(a)(3) Any written solicitation to purchase securities under Rule 23c-1 under the 1940 Act (17 CFR 270.23c-1) sent or given during the period covered by the report by or on behalf of the registrant to 10 or more persons. Not applicable.
(a)(4) Change in the registrant’s independent public accountant. Not applicable.
(b) If the report is filed under Section 13(a) or 15(d) of the Exchange Act, provide the certifications required by Rule 30a-2(b) under the 1940 Act (17 CFR 270.30a-2(b)); Rule 13a-14(b) or Rule 15d-14(b) under the Exchange Act (17 CFR 240.13a-14(b) or 240.15d-14(b)), and Section 1350 of Chapter 63 of Title 18 of the United States Code (18 U.S.C. 1350) as an exhibit. A certification furnished pursuant to this paragraph will not be deemed “filed” for purposes of Section 18 of the Exchange Act (15 U.S.C. 78r), or otherwise subject to the liability of that section. Such certification will not be deemed to be incorporated by reference into any filing under the Securities Act of 1933 or the Exchange Act, except to the extent that the registrant specifically incorporates it by reference. Ex-99.906 CERT attached hereto.
SIGNATURES
Pursuant to the requirements of the Securities Exchange Act of 1934 and the Investment Company Act of 1940, the registrant has duly caused this report to be signed on its behalf by the undersigned, thereunto duly authorized.
(Registrant) Nuveen Floating Rate Income Fund
| | |
| By (Signature and Title) | | /s/ Gifford R. Zimmerman |
| | Gifford R. Zimmerman |
| | Vice President and Secretary |
Date: October 7, 2020
Pursuant to the requirements of the Securities Exchange Act of 1934 and the Investment Company Act of 1940, this report has been signed below by the following persons on behalf of the registrant and in the capacities and on the dates indicated.
| | |
| By (Signature and Title) | | /s/ David J. Lamb |
| | David J. Lamb |
| | Chief Administrative Officer |
| | (principal executive officer) |
| |
| Date: October 7, 2020 | | |
| |
| By (Signature and Title) | | /s/ E. Scott Wickerham |
| | E. Scott Wickerham |
| | Vice President and Controller |
| | (principal financial officer) |
| |
| Date: October 7, 2020 | | |