UNITED STATES
SECURITIES AND EXCHANGE COMMISSION
Washington, D.C. 20549
FORM N-CSR
CERTIFIED SHAREHOLDER REPORT OF REGISTERED
MANAGEMENT INVESTMENT COMPANIES
| | |
| Investment Company Act file number | | 811-21494 |
Nuveen Floating Rate Income Fund
(Exact name of registrant as specified in charter)
Nuveen Investments
333 West Wacker Drive
Chicago, IL 60606
(Address of principal executive offices) (Zip code)
Mark L. Winget
Nuveen Investments
333 West Wacker Drive
Chicago, IL 60606
(Name and address of agent for service)
| | |
| Registrant’s telephone number, including area code: | | (312) 917-7700 |
| | |
| Date of fiscal year end: | | July 31 |
| | |
| Date of reporting period: | | July 31, 2021 |
Form N-CSR is to be used by management investment companies to file reports with the Commission not later than 10 days after the transmission to stockholders of any report that is required to be transmitted to stockholders under Rule 30e-1 under the Investment Company Act of 1940 (17 CFR 270.30e-1). The Commission may use the information provided on Form N-CSR in its regulatory, disclosure review, inspection, and policymaking roles.
A registrant is required to disclose the information specified by Form N-CSR, and the Commission will make this information public. A registrant is not required to respond to the collection of information contained in Form N-CSR unless the Form displays a currently valid Office of Management and Budget (“OMB”) control number. Please direct comments concerning the accuracy of the information collection burden estimate and any suggestions for reducing the burden to Secretary, Securities and Exchange Commission, 450 Fifth Street, NW, Washington, DC 20549-0609. The OMB has reviewed this collection of information under the clearance requirements of 44 U.S.C. ss. 3507.
| ITEM 1. | REPORTS TO STOCKHOLDERS. |

Closed-End Funds
31 July 2021
Nuveen
Closed-End Funds
| | |
| NSL | | Nuveen Senior Income Fund |
| JFR | | Nuveen Floating Rate Income Fund |
| JRO | | Nuveen Floating Rate Income Opportunity Fund |
| JSD | | Nuveen Short Duration Credit Opportunities Fund |
| JQC | | Nuveen Credit Strategies Income Fund |
As permitted by regulations adopted by the Securities and Exchange Commission, paper copies of the Funds’ annual and semi-annual shareholder reports will not be sent to you by mail unless you specifically request paper copies of the reports. Instead, the reports will be made available on the Funds’ website (www.nuveen.com), and you will be notified by mail each time a report is posted and provided with a website link to access the report.
You may elect to receive shareholder reports and other communications from the Funds electronically at any time by contacting the financial intermediary (such as a broker-dealer or bank) through which you hold your Fund shares or, if you are a direct investor, by enrolling at www.nuveen.com/e-reports.
You may elect to receive all future shareholder reports in paper free of charge at any time by contacting your financial intermediary or, if you are a direct investor, by calling 800-257-8787 and selecting option #2 or (ii) by logging into your Investor Center account at www.computershare.com/investor and clicking on “Communication Preferences”. Your election to receive reports in paper will apply to all funds held in your account with your financial intermediary or, if you are a direct investor, to all your directly held Nuveen Funds and any other directly held funds within the same group of related investment companies.
Annual Report
Life is Complex.
Nuveen makes things e-simple.
It only takes a minute to sign up for e-Reports. Once enrolled, you’ll receive an e-mail as soon as your Nuveen Fund information is ready—no more waiting for delivery by regular mail. Just click on the link within the e-mail to see the report and save it on your computer if you wish.
Free e-Reports right to your email!
www.investordelivery.com
If you receive your Nuveen Fund dividends and statements from your financial professional or brokerage account.
or
www.nuveen.com/client-access
If you receive your Nuveen Fund dividends and statements directly from Nuveen.
NOT FDIC INSURED MAY LOSE VALUE NO BANK GUARANTEE
Table of Contents
3
Chair’s Letter to Shareholders

Dear Shareholders,
More than a year has passed since the World Health Organization declared COVID-19 a global pandemic in March 2020, resulting in a year marked by a global economic downturn, financial market turbulence and some immeasurable losses of life. Although the health crisis persists, with the widespread distribution of vaccines in the U.S. and extraordinary economic interventions by governments and central banks around the world, we collectively look forward to what our “new normal” might be.
Rebounding global economic activity has driven both gross domestic product growth and inflation higher, especially in the U.S. Vaccinations have enabled a further reopening of economies while governments and central banks have taken extraordinary measures to support the recoveries. Since the crisis began, the U.S. government has enacted six relief measures totaling $5.3 trillion to support individuals and families, small and large businesses, state and local governments, education, public health and vaccinations. Currently, Congress is working on an infrastructure spending plan, although its final shape and whether it passes remains to be seen. The U.S. Federal Reserve (Fed) and other central banks around the world have acknowledged the economic progress to date but remain committed to sustaining the recovery by maintaining accommodative monetary conditions. However, as economies have reopened, the surge in consumer demand has outpaced supply chain capacity, resulting in a jump in inflation indicators in recent months. Whether inflation persists is a subject of debate by economists and some market observers, while the Fed and other central banks believe it to be more transitory. Additionally, the recent impact of the COVID-19 delta variant is likely to be factored into central bank forecasts, which could complicate the timing of monetary policy changes.
While the markets’ longer-term outlook has brightened, we expect intermittent bouts of volatility to continue. There are some signs that the first economies to recover – including China, the U.S. and Europe not far behind – have reached their growth peaks and are moving toward stabilization, while the delta variant is adding caution to the growth outlook. Markets are closely monitoring central bank signals, particularly if inflation remains elevated, as a sooner-than-expected shift to monetary tightening could slow the economic recovery. Additionally, as more virulent strains of COVID-19 such as the delta variant have spread, both case counts and hospitalizations are rising again, and vaccination rollouts have been uneven around the country and around the world. The recovery hinges on controlling the virus, and estimates vary considerably on when economic activity might be fully restored and what level of public inoculation would be sufficient to contain the spread of the virus, particularly in light of new variants. On the political front, the Biden administration’s full policy agenda and the potential for Congressional gridlock remain to be seen, either of which could cause investment outlooks to shift. Short-term market fluctuations can provide your Fund opportunities to invest in new ideas as well as upgrade existing positioning while providing long-term value for shareholders. For more than 120 years, the careful consideration of risk and reward has guided Nuveen’s focus on delivering long-term results to our shareholders.
If you have concerns about what’s coming next, it may be an opportune time to assess your portfolio. We encourage you to review your time horizon, risk tolerance and investment goals with your financial professional.
On behalf of the other members of the Nuveen Fund Board, we look forward to continuing to earn your trust in the months and years ahead.

Terence J. Toth
Chair of the Board
September 22, 2021
4
Portfolio Managers’ Comments
Nuveen Senior Income Fund (NSL)
Nuveen Floating Rate Income Fund (JFR)
Nuveen Floating Rate Income Opportunity Fund (JRO)
Nuveen Short Duration Credit Opportunities Fund (JSD)
Nuveen Credit Strategies Income Fund (JQC)
The Funds’ are sub-advised by Nuveen Asset Management, LLC (NAM), an affiliate of Nuveen Fund Advisors, LLC, the Funds’ investment adviser (the “Adviser”). On December 31, 2020, the Funds’ previous sub-adviser, Symphony Asset Management, LLC (“Symphony”), also an affiliate of the Adviser, was merged with and into NAM (the “Reorganization”). Effective as of the date of the Reorganization, NAM assumed the portfolio management responsibilities for the Funds’ investment portfolio and, as previously approved by the Fund’s Board of Trustees, the Funds’ entered into an amended and restated sub-advisory agreement with NAM, the terms of which were substantially identical to the prior sub-advisory agreement with Symphony. Scott Caraher and Kevin Lorenz, CFA, continue as portfolio managers for the Funds.
Here the portfolio management team discusses economic and market conditions, key investment strategies and the Funds’ performance for the twelve-month reporting period ended July 31, 2021. For more information on the Funds’ investment objectives and policies, please refer to the Shareholder Update section of the report.
What factors affected the economy and the markets during the twelve-month annual reporting period ended July 31, 2021?
Supported by massive fiscal and monetary stimulus and economic reopening, the U.S. economy rebounded more quickly than expected from the deep downturn caused by the COVID-19 crisis and containment measures. The federal government’s relief measures have totaled approximately $5.3 trillion across six aid packages that have allocated direct payments to individuals and families, expanded unemployment insurance, provided loans to large and small businesses, funded hospitals and health agencies, and supported state and local governments, education and public health/vaccination. (Additionally, in August 2021, after the close of this reporting period, the Senate approved a $1 trillion infrastructure and jobs plan, which moves to the House for consideration.) The U.S. Federal Reserve (Fed) has maintained short-term interest rates near zero and enacted credit facilities to help keep the financial system stable, lowering borrowing costs for businesses and individuals. Gross domestic product (GDP) expanded at an annualized rate of 6.3% in the first quarter and 6.5% in the second quarter, according to the “advance” estimate released by the Bureau of Economic Analysis, after shrinking 3.5% (annualized) in 2020 compared to 2019’s annual level.
By the start of this reporting period, markets had largely stabilized from the initial health crisis shock. In March 2020, equity and commodity markets sold off and safe-haven assets rallied as countries initiated quarantines, restricted travel and shuttered factories and businesses, while an ill-timed oil price war between the Organization of the Petroleum Exporting Countries (OPEC) and non-OPEC member Russia amplified price volatility. In late 2020, the announcement of high efficacy rates in several COVID-19 vaccine trials, followed by regulatory authorizations and public vaccination drives across Western countries, improved the outlook for 2021, which contributed to risk-on sentiment in the markets. Increasing vaccination rates and certain surprisingly strong economic readings in the first few months of 2021 led to rising inflation concerns. However, recent Fed commentary pointed to Fed Fund rate hikes by 2023, calming market fears of inaction.
The loan market enjoyed solid performance during the twelve-month reporting period, supported by healthy economic data, better-than-expected corporate earnings and further improvement in credit fundamentals. Loans also benefited
5
Portfolio Managers’ Comments (continued)
from an improving supply and demand backdrop in the second half of the reporting period. On the supply side, issues brought to market were generally absorbed given the level of demand for loans amid the global search for yield. In terms of demand, following heavy outflows during the first five months of the reporting period (August 1, 2020 – December 31, 2020), loan mutual funds and exchange-traded funds (ETFs) garnered a combined $32 billion of inflows over the next seven months ending July 31, 2021. Meanwhile, collateralized loan obligations (CLO) demand also remained robust. It’s notable that investor demand for loans stayed strong despite a fairly benign rate backdrop, an indication that longer-term investors continued to maintain a positive outlook for growth while preparing themselves for potentially higher rates.
For the reporting period, lower quality, discounted and higher spread assets outperformed. These assets tend to have more price appreciation potential and higher coupons to drive returns.
What key strategies were used to manage the Funds during this twelve-month reporting period ended July 31, 2021?
The Funds invested predominantly in first-lien, senior secured corporate loans. NAM generally focuses on loans of issuers with businesses in defensive sectors that have strong asset coverage, as well as loans of larger issuance and facility sizes. These loans are generally referred to as broadly syndicated loans. Consistent with their investment policies, the Funds also invest opportunistically in below investment grade corporate bonds to seek relative value opportunities across the capital structure.
How did the Funds perform during this twelve-month reporting period ended July 31, 2021?
For the twelve-month reporting period ended July 31, 2021, all five Funds outperformed the Credit Suisse Leveraged Loan Index. For purposes of this Performance Commentary references to relative performance are in comparison to the Credit Suisse Leveraged Loan Index.
For the reporting period, relative outperformance for the NSL, JFR, JRO and JSD portfolios was driven by increased allocations to B-rated senior loans. Select exposure to energy-related companies given higher energy prices also contributed to relative performance. In particular, the post-reorganization equity of exploration and production (E&P) company California Resources notched gains due to the energy rally and the firm’s earnings. Similarly, loans issued by Fieldwood Energy found favor in the “risk-on” market environment and on approval of its debt restructuring plan. Lastly, the term loans of deep-water marine transportation specialist Harvey Gulf International Marine, Inc. also contributed. The Funds’ portfolios continue to maintain exposure to these companies.
Offsetting some of the portfolios’ relative outperformance were individual positions that included Diamond Sports Group LLC, a media and entertainment company. Its loans were volatile due to potential restructuring talks and disappointing earnings results during the reporting period. The portfolios’ exposure to the specialty pharmaceutical company, Endo Health Solutions, Inc., also hurt relative performance as the company faced continued costs from opioid lawsuits. The Funds’ portfolios continue to maintain exposure to these companies.
The Funds noted above (NSL, JFR, JRO and JSD) are managed in a similar manner. However, JQC has a different mandate, and therefore, has a relatively higher credit quality profile in its loan portfolio compared to the other Funds. During the reporting period, the JQC portfolio’s relative outperformance was driven by select exposure to some of the same energy-related companies previously mentioned. Among the most notable contributors was the post-reorganization equity of E&P company California Resources and loans issued by Fieldwood Energy. Additionally, the portfolio’s overweight to and security selection within Transportation, including exposure to the loans of American Airlines, aided relative performance during the reporting period. The Fund’s portfolio continues to maintain exposure to these companies.
6
Fund Leverage
IMPACT OF THE FUNDS’ LEVERAGE STRATEGIES ON PERFORMANCE
One important factor impacting the returns of the Funds’ common shares relative to their comparative benchmarks was the Funds’ use of leverage through bank borrowings, Term Preferred Shares (Term Preferred) for NSL, JFR and JRO, Taxable Fund Preferred Shares (TFP) for NSL, JFR, JRO and JSD and reverse repurchase agreements for JQC. The Funds use leverage because our research has shown that, over time, leveraging provides opportunities for additional income. The opportunity arises when short-term rates that a Fund pays on its leveraging instruments are lower than the interest the Fund earns on its portfolio securities that it has bought with the proceeds of that leverage. This has been particularly true in the recent market environment where short-term rates have been low by historical standards.
However, use of leverage can expose Fund common shares to additional price volatility. When a Fund uses leverage, the Fund’s common shares will experience a greater increase in their net asset value if the securities acquired through the use of leverage increase in value, but will also experience a correspondingly larger decline in their net asset value if the securities acquired through leverage decline in value. All this will make the shares’ total return performance more variable over time.
In addition, common share income in levered funds will typically decrease in comparison to unlevered funds when shortterm interest rates increase and increase when short-term interest rates decrease. In recent quarters, fund leverage expenses have generally tracked the overall movement of short-term interest rates. While fund leverage expenses are somewhat higher than their recent lows, leverage nevertheless continues to provide the opportunity for incremental common share income, particularly over longer-term periods.
The Funds’ use of leverage had a positive impact on total return performance during this reporting period.
During the current fiscal period, JFR and JRO used cancellable interest rate swaps to partially hedge the interest cost of leverage. Each Fund received payments based upon pre-determined fixed rates and paid one-month LIBOR plus a fixed spread. After a non-callable period, the swap counterparty owns the right on future monthly dates to terminate the swap at par. The purpose of the cancellable interest rate swap is to convert a fixed rate Term Preferred Share issuance to floating rate, and the cancellation dates of the swap correspond to dates on which the Funds can call the Term Preferred Share issue. Collectively, these interest rate swap contracts had a negligible impact on the Funds’ total return performance during the period.
As of July 31, 2021, the Funds’ percentages of leverage are as shown in the accompanying table.
| | | | | | | | | | | | | | | | | | | | |
| | | NSL | | | JFR | | | JRO | | | JSD | | | JQC | |
Effective Leverage* | | | 36.35 | % | | | 36.47 | % | | | 36.52 | % | | | 36.38 | % | | | 36.72 | % |
Regulatory Leverage* | | | 36.35 | % | | | 36.47 | % | | | 36.52 | % | | | 36.38 | % | | | 30.01 | % |
| * | Effective leverage is a Fund’s effective economic leverage, and includes both regulatory leverage and the leverage effects of reverse repurchase agreements, certain derivatives and other investments in a Fund’s portfolio that increase the Fund’s investment exposure. Regulatory leverage consists of preferred shares issued or borrowings of a Fund. Both of these are part of a Fund’s capital structure. A Fund, however, may from time to time borrow on a typically transient basis in connection with its day-to-day operations, primarily in connection with the need to settle portfolio trades. Such incidental borrowings are excluded from the calculation of a Fund’s effective leverage ratio. Regulatory leverage is subject to asset coverage limits set forth in the Investment Company Act of 1940. |
7
Fund Leverage (continued)
THE FUNDS’ LEVERAGE
Bank Borrowings
As noted previously, the Funds employ leverage through the use of bank borrowings. The Funds’ bank borrowing activities are as shown in the accompanying table. Paydowns reflect on-going leverage management activity that seeks to maintain each Fund’s leverage ratio within a specified internal operating range.
| | | | | | | | | | | | | | | | | | | | | | | | | | | | | | | | | | | | |
| | | Current Reporting Period | | | | | | Subsequent to the Close of
the Reporting Period | |
| Fund | | Outstanding
Balance as of
August 1, 2020 | | | Draws | | | Paydowns | | | Outstanding
Balance as of
July 31, 2021 | | | Average
Balance
Outstanding | | | | | | Draws | | | Paydowns | | | Outstanding
Balance as of
September 28, 2021 | |
NSL | | $ | 86,200,000 | | | $ | 33,100,000 | | | $ | (25,000,000 | ) | | $ | 94,300,000 | | | $ | 91,798,082 | | | | | | | $ | — | | | $ | — | | | $ | 94,300,000 | |
JFR | | $ | 208,100,000 | | | $ | 80,300,000 | | | $ | (50,000,000 | ) | | $ | 238,400,000 | | | $ | 227,504,384 | | | | | | | $ | — | | | $ | — | | | $ | 238,400,000 | |
JRO | | $ | 164,900,000 | | | $ | 44,600,000 | | | $ | (45,000,000 | ) | | $ | 164,500,000 | | | $ | 160,261,096 | | | | | | | $ | — | | | $ | — | | | $ | 164,500,000 | |
JSD | | $ | 8,500,000 | | | $ | 11,000,000 | | | $ | — | | | $ | 19,500,000 | | | $ | 14,519,178 | | | | | | | $ | — | | | $ | — | | | $ | 19,500,000 | |
JQC | | $ | 402,000,000 | | | $ | 25,000,000 | | | $ | (25,000,000 | ) | | $ | 402,000,000 | | | $ | 399,021,918 | | | | | | | $ | — | | | $ | — | | | $ | 402,000,000 | |
Refer to Notes to Financial Statements, Note 9 – Fund Leverage for further details.
Reverse Repurchase Agreements
As noted previously, in addition to bank borrowings, JQC also used reverse repurchase agreements, in which the Fund sells to a counterparty a security that it holds with a contemporaneous agreement to repurchase the same security at an agreed-upon price and date. The Fund’s transactions in reverse repurchase agreements are as shown in the accompanying table.
| | | | | | | | | | | | | | | | | | | | | | | | | | | | | | | | | | |
| Current Reporting Period | | | | | | Subsequent to the Close of
the Reporting Period | |
Outstanding
Balance as of
August 1, 2020 | | | Sales | | | Purchases | | | Outstanding
Balance as of
July 31, 2021 | | | Average Balance
Outstanding | | | | | | Sales | | | Purchases | | | Outstanding
Balance as of
September 28, 2021 | |
| | $117,000,000 | | | | $ — | | | | $25,000,000 | | | | $142,000,000 | | | | $135,082,192 | | | | | | | | $ — | | | | $ — | | | | $142,000,000 | |
Refer to Notes to Financial Statements, Note 9 – Fund Leverage for further details.
Term Preferred Shares
As noted previously, in addition to bank borrowings, the following Funds also issued Term Preferred. The Funds' transactions in Term Preferred are as shown in the accompanying table.
| | | | | | | | | | | | | | | | | | | | | | | | | | | | | | | | | | | | |
| | | Current Reporting Period | | | | | | Subsequent to the Close of
the Reporting Period | |
| Fund | | Outstanding
Balance as of
August 1, 2020 | | | Issuance | | | Redemptions | | | Outstanding
Balance as of
July 31, 2021 | | | Average Balance
Outstanding | | | | | | Issuance | | | Redemptions | | | Outstanding
Balance as of
September 28, 2021 | |
NSL* | | $ | 33,000,000 | | | $ | — | | | $ | (33,000,000 | ) | | $ | — | | | $ | 17,219,178 | | | | | | | $ | — | | | $ | — | | | $ | — | |
JFR** | | $ | 90,000,000 | | | $ | — | | | $ | (90,000,000 | ) | | $ | — | | | $ | 81,076,923 | | | | | | | $ | — | | | $ | — | | | $ | — | |
JRO*** | | $ | 45,000,000 | | | $ | — | | | $ | (45,000,000 | ) | | $ | — | | | $ | 41,732,673 | | | | | | | $ | — | | | $ | — | | | $ | — | |
| * | For the period August 1, 2020 through October 12, 2020. |
| ** | For the period August 1, 2020 through December 8, 2020. |
| *** | For the period August 1, 2020 through November 9, 2020. |
8
Refer to Notes to Financial Statements, Note 5 – Fund Shares for further details on Term Preferred.
Taxable Fund Preferred Shares
As noted previously, in addition to bank borrowings, NSL, JFR, JRO and JSD also issued TFP. The Funds’ transactions in TFP are as shown in the accompanying table.
| | | | | | | | | | | | | | | | | | | | | | | | | | | | | | | | | | | | |
| | | Current Reporting Period | | | | | | Subsequent to the Close of
the Reporting Period | |
| Fund | | Outstanding
Balance as of
August 1, 2020 | | | Issuance | | | Redemptions | | | Outstanding
Balance as of
July 31, 2021 | | | Average
Balance
Outstanding | | | | | | Issuance | | | Redemptions | | | Outstanding
Balance as of
September 27, 2021 | |
NSL* | | $ | — | | | $ | 40,000,000 | | | $ | — | | | $ | 40,000,000 | | | $ | 40,000,000 | | | | | | | $ | — | | | $ | — | | | $ | 40,000,000 | |
JFR** | | $ | — | | | $ | 100,000,000 | | | $ | — | | | $ | 100,000,000 | | | $ | 100,000,000 | | | | | | | $ | — | | | $ | — | | | $ | 100,000,000 | |
JRO*** | | $ | — | | | $ | 75,000,000 | | | $ | — | | | $ | 75,000,000 | | | $ | 75,000,000 | | | | | | | $ | — | | | $ | — | | | $ | 75,000,000 | |
JSD | | $ | 70,000,000 | | | $ | — | | | $ | — | | | $ | 70,000,000 | | | $ | 70,000,000 | | | | | | | $ | — | | | $ | — | | | $ | 70,000,000 | |
| * | For the period October 5, 2020 (first issuance date of shares) through July 31, 2021. |
| ** | For the period December 4, 2020 (first issuance date of shares) through July 31, 2021. |
| *** | For the period November 5, 2020 (first issuance date of shares) through July 31, 2021. |
Refer to Notes to Financial Statements, Note 5 – Fund Shares for further details on TFP.
9
Common Share Information
DISTRIBUTION INFORMATION
The following information regarding the Funds’ distributions is current as of July 31, 2021, the Funds’ fiscal and tax year end, and may differ from previously issued distribution notifications.
NSL, JFR, JRO and JSD
Effective with each Fund’s distribution payable April 1, 2021, NSL, JFR, JRO and JSD have implemented a level distribution policy. The level distribution policy is intended to provide shareholders with stable, but not guaranteed, cash flow, independent of the amount or timing of income earned or capital gains realized by the Funds. The Funds intend to distribute all or substantially all of their net investment income through their regular monthly distribution and to distribute realized capital gains at least annually. In addition, in any monthly period, in order to maintain its level distribution amount, each Fund may pay out more or less than its net investment income during the period. As a result, distributions sources may include net investment income, realized gains and return of capital. You should not draw any conclusions about the Fund’s investment performance from the amount of the distribution or from the terms of the level distribution program. A return of capital is a non-taxable distribution of a portion of a Fund’s capital. A return of capital distribution does not necessarily reflect a Fund’s investment performance and should not be confused with “yield” or “income.”
JQC
JQC has a capital return plan where a supplemental amount is expected to be included in the Fund’s regular monthly distribution. Under this program, the Fund’s regular monthly distribution is expected to include net investment income, return of capital and potentially capital gains for tax purposes. On September 20, 2021 (subsequent to the close of this reporting period), JQC announced that its Board of Trustees approved the adoption of a level distribution policy. The level distribution policy will become effective with the Fund’s distribution payable November 1, 2021.
The amounts and sources of distributions reported in this notice are for financial reporting purposes and are not being provided for tax reporting purposes. The actual amounts and character of the distributions for tax reporting purposes will be reported to shareholders on Form 1099-DIV, which will be sent to shareholders shortly after calendar year-end. Because distribution source estimates are updated throughout the current fiscal year based on a Fund’s performance, those estimates may differ from both the tax information reported to you in your Fund’s 1099 statement, as well as the ultimate economic sources of distributions over the life of your investment. The figures in the table below provide the sources of distributions and may include amounts attributed to realized gains and/or returns of capital. More details about each Fund’s distributions are available on www.nuveen.com/en-us/closed-end-funds.
Data as of July 31, 2021
| | | | | | | | | | | | | | | | | | | | | | | | | | | | |
| | | Current Month
Percentage of Distributions | | | Calendar YTD
Per Share Amounts | |
| Fund | | Net
Investment
Income | | | Realized
Gains | | | Return of
Capital | | | Total
Distributions | | | Net
Investment
Income | | | Realized
Gains | | | Return of
Capital | |
NSL | | | 100.00 | % | | | 0.00 | % | | | 0.00 | % | | $ | 0.3835 | | | $ | 0.3835 | | | $ | 0.0000 | | | $ | 0.0000 | |
JFR | | | 100.00 | % | | | 0.00 | % | | | 0.00 | % | | $ | 0.6245 | | | $ | 0.6245 | | | $ | 0.0000 | | | $ | 0.0000 | |
JRO | | | 100.00 | % | | | 0.00 | % | | | 0.00 | % | | $ | 0.6150 | | | $ | 0.6150 | | | $ | 0.0000 | | | $ | 0.0000 | |
JSD | | | 100.00 | % | | | 0.00 | % | | | 0.00 | % | | $ | 0.9410 | | | $ | 0.9410 | | | $ | 0.0000 | | | $ | 0.0000 | |
JQC | | | 35.18 | % | | | 0.00 | % | | | 64.82 | % | | $ | 0.8516 | | | $ | 0.2996 | | | $ | 0.0000 | | | $ | 0.5520 | |
10
The following table provides information regarding Fund distributions and total return performance over various time periods. This information is intended to help you better understand whether Fund returns for the specified time periods were sufficient to meet Fund distributions.
Data as of July 31, 2021
| | | | | | | | | | | | | | | | | | | | | | | | | | | | |
| | | | | | | | | Annualized | | | Cumulative | |
| Fund | | Inception
Date | | | Latest
Monthly
Per Share
Distribution | | | Current
Distribution on
NAV | | | 1-Year
Return on
NAV | | | 5-Year
Return on
NAV | | | Fiscal YTD
Distributions
on NAV | | | Fiscal
YTD Return
on NAV | |
NSL | | | 10/26/1999 | | | $ | 0.0340 | | | | 6.70 | % | | | 17.48 | % | | | 4.70 | % | | | 6.30 | % | | | 17.48 | % |
JFR | | | 3/25/2004 | | | $ | 0.0580 | | | | 6.72 | % | | | 17.36 | % | | | 4.89 | % | | | 6.03 | % | | | 17.36 | % |
JRO | | | 7/27/2004 | | | $ | 0.0575 | | | | 6.72 | % | | | 17.42 | % | | | 4.93 | % | | | 5.99 | % | | | 17.42 | % |
JSD | | | 5/25/2011 | | | $ | 0.0865 | | | | 6.69 | % | | | 18.24 | % | | | 4.66 | % | | | 6.06 | % | | | 18.24 | % |
JQC | | | 6/25/2003 | | | $ | 0.0509 | | | | 8.84 | % | | | 13.42 | % | | | 4.26 | % | | | 12.32 | % | | | 13.42 | % |
NUVEEN CLOSED-END FUND DISTRIBUTION AMOUNTS
The Nuveen Closed-End Funds’ monthly and quarterly periodic distributions to shareholders are posted on www.nuveen.com and can be found on Nuveen’s enhanced closed-end fund resource page, which is at https://www.nuveen.com/resource-center-closed-end-funds, along with other Nuveen closed-end fund product updates. To ensure timely access to the latest information, shareholders may use a subscribe function, which can be activated at this web page (https://www.nuveen.com/subscriptions).
COMMON SHARE REPURCHASES
During August 2021 (subsequent to the close of the reporting period), the Funds’ Board of Trustees reauthorized an open-market share repurchase program, allowing each Fund to repurchase an aggregate of up to approximately 10% of its outstanding common shares.
As of July 31, 2021, and since the inception of the Funds’ repurchase programs, the Funds have cumulatively repurchased and retired their outstanding common shares as shown in the accompanying table.
| | | | | | | | | | | | | | | | | | | | |
| | | NSL | | | JFR | | | JRO | | | JSD | | | JQC | |
Common shares cumulatively repurchased and retired | | | 15,400 | | | | 147,593 | | | | 39,400 | | | | 10,000 | | | | 5,473,400 | |
Common shares authorized for repurchase | | | 3,860,000 | | | | 5,690,000 | | | | 4,050,000 | | | | 1,005,000 | | | | 13,560,000 | |
During the current reporting period, the Funds did not repurchase any of their outstanding common shares.
OTHER COMMON SHARE INFORMATION
As of July 31, 2021, the Funds’ common share prices were trading at a premium/ (discount) to their common share NAVs and trading at an average premium/(discount) to NAV during the current reporting period, as follows:
| | | | | | | | | | | | | | | | | | | | |
| | | NSL | | | JFR | | | JRO | | | JSD | | | JQC | |
Common share NAV | | | $6.09 | | | | $10.36 | | | | $10.27 | | | | $15.52 | | | | $6.91 | |
Common share pirce | | | $5.74 | | | | $9.76 | | | | $9.69 | | | | $14.40 | | | | $6.53 | |
Premium/(Discount) to NAV | | | (5.75 | )% | | | (5.79 | )% | | | (5.65 | )% | | | (7.22 | )% | | | (5.50 | )% |
Average premium/(discount) to NAV | | | (9.77 | )% | | | (9.86 | )% | | | (10.12 | )% | | | (10.49 | )% | | | (9.15 | )% |
11
| | |
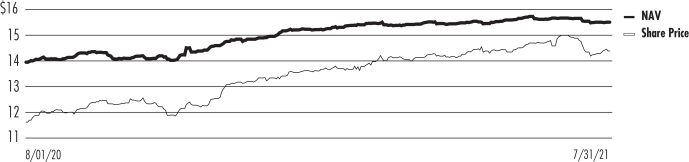
| NSL | | Nuveen Senior Income Fund Performance Overview and Holding Summaries as of July 31, 2021 |
Refer to Glossary of Terms Used in this Report for further definition of the terms used within this section.
Average Annual Total Returns as of July 31, 2021
| | | | | | | | | | | | |
| | | Average Annual | |
| | | 1-Year | | | 5-Year | | | 10-Year | |
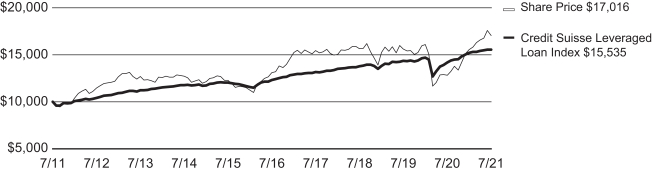
| NSL at Common Share NAV | | | 17.48% | | | | 4.70% | | | | 5.25% | |
| NSL at Common Share Price | | | 28.97% | | | | 5.72% | | | | 5.31% | |
| Credit Suisse Leveraged Loan Index | | | 9.60% | | | | 4.75% | | | | 4.50% | |
Past performance is not predictive of future results. Current performance may be higher or lower than the data shown. Returns do not reflect the deduction of taxes that shareholders may have to pay on Fund distributions or upon the sale of Fund shares. Returns at NAV are net of Fund expenses, and assume reinvestment of distributions. Comparative index return information is provided for the Fund’s shares at NAV only. Indexes are not available for direct investment.
Daily Common Share NAV and Share Price
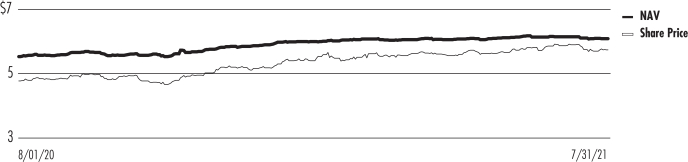
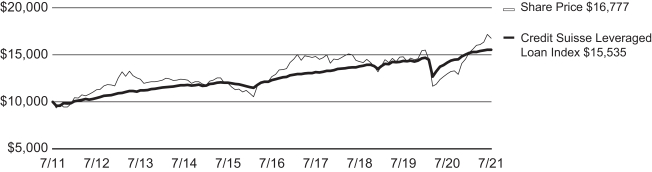
Growth of an Assumed $10,000 Investment as of July 31, 2021 — Common Share Price
12
This data relates to the securities held in the Fund’s portfolio of investments as of the end of the reporting period. It should not be construed as a measure of performance for the Fund itself. Holdings are subject to change.
For financial reporting purposes, the ratings disclosed are the highest rating given by one of the following national rating agencies: Standard & Poor’s Group, Moody’s Investors Service, Inc. or Fitch, Inc. This treatment of split-rated securities may differ from that used for other purposes, such as for Fund investment policies. Credit ratings are subject to change. AAA, AA, A and BBB are investment grade ratings; BB, B, CCC, CC, C and D are below-investment grade ratings. Holdings designated N/R are not rated by these national rating agencies.
Fund Allocation
(% of net assets)
| | | | |
Variable Rate Senior Loan
Interests | | | 139.1% | |
| Corporate Bonds | | | 11.0% | |
| Common Stocks | | | 3.6% | |
| Warrants | | | 0.1% | |
| Convertible Preferred Securities | | | 0.1% | |
| Common Stock Rights | | | 0.0% | |
| Short-Term Investment Companies | | | 4.4% | |
| Other Assets Less Liabilities | | | (1.4)% | |
| Net Assets Plus Borrowings and Taxable Fund Preferred Shares, net of deferred offering costs | | | 156.9% | |
| Borrowings | | | (40.1)% | |
| Taxable Fund Preferred Shares, net of deferred offering costs | | | (16.8)% | |
Net Assets | | | 100% | |
Top Five Issuers
(% of total long-term investments)
| | | | |
| B.C. Unlimited Liability Company | | | 2.0% | |
| Seattle Spinco, Inc. | | | 1.4% | |
| Parexel International Corporation | | | 1.2% | |
| Delta 2 (LUX) S.a.r.l. | | | 1.2% | |
| PetSmart, Inc. | | | 1.1% | |
Portfolio Composition
(% of total investments)
| | | | |
| Media | | | 10.8% | |
| Hotels, Restaurants & Leisure | | | 10.5% | |
| Software | | | 7.7% | |
| Health Care Providers & Services | | | 6.0% | |
| Oil, Gas & Consumable Fuels | | | 4.4% | |
| Pharmaceuticals | | | 4.0% | |
| Commercial Services & Supplies | | | 3.7% | |
| IT Services | | | 3.3% | |
| Diversified Telecommunication Services | | | 2.8% | |
| Life Sciences Tools & Services | | | 2.6% | |
| Insurance | | | 2.3% | |
| Entertainment | | | 2.1% | |
| Specialty Retail | | | 2.0% | |
| Communications Equipment | | | 1.8% | |
| Auto Components | | | 1.7% | |
| Technology Hardware, Storage & Peripherals | | | 1.6% | |
| Professional Services | | | 1.5% | |
| Airlines | | | 1.5% | |
| Road & Rail | | | 1.4% | |
| Health Care Technology | | | 1.3% | |
| Building Products | | | 1.3% | |
| Internet Software & Services | | | 1.2% | |
| Personal Products | | | 1.2% | |
| Electric Utilities | | | 1.2% | |
| Other1 | | | 19.3% | |
| Short-Term Investment Companies | | | 2.8% | |
Total | | | 100% | |
Portfolio Credit Quality
(% of total long-term fixed income investments)
| | | | |
| BBB | | | 10.0% | |
| BB or Lower | | | 86.1% | |
| N/R (not rated) | | | 3.9% | |
Total | | | 100% | |
| 1 | See Portfolio of Investments for details on “other” Portfolio Composition. |
13
| | |
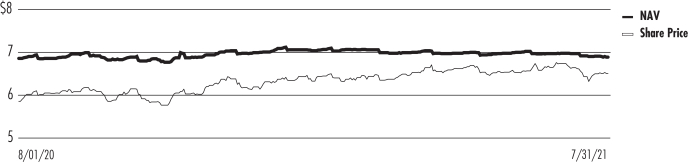
| JFR | | Nuveen Floating Rate Income Fund Performance Overview and Holding Summaries as of July 31, 2021 |
Refer to Glossary of Terms Used in this Report for further definition of the terms used within this section.
Average Annual Total Returns as of July 31, 2021
| | | | | | | | | | | | |
| | | Average Annual | |
| | | 1-Year | | | 5-Year | | | 10-Year | |
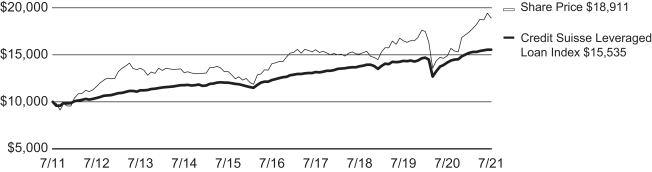
| JFR at Common Share NAV | | | 17.36% | | | | 4.89% | | | | 5.38% | |
| JFR at Common Share Price | | | 30.14% | | | | 5.52% | | | | 5.82% | |
| Credit Suisse Leveraged Loan Index | | | 9.60% | | | | 4.75% | | | | 4.50% | |
Past performance is not predictive of future results. Current performance may be higher or lower than the data shown. Returns do not reflect the deduction of taxes that shareholders may have to pay on Fund distributions or upon the sale of Fund shares. Returns at NAV are net of Fund expenses, and assume reinvestment of distributions. Comparative index return information is provided for the Fund’s shares at NAV only. Indexes are not available for direct investment.
Daily Common Share NAV and Share Price
Growth of an Assumed $10,000 Investment as of July 31, 2021 — Common Share Price

14
This data relates to the securities held in the Fund’s portfolio of investments as of the end of the reporting period. It should not be construed as a measure of performance for the Fund itself. Holdings are subject to change.
For financial reporting purposes, the ratings disclosed are the highest rating given by one of the following national rating agencies: Standard & Poor’s Group, Moody’s Investors Service, Inc. or Fitch, Inc. This treatment of split-rated securities may differ from that used for other purposes, such as for Fund investment policies. Credit ratings are subject to change. AAA, AA, A and BBB are investment grade ratings; BB, B, CCC, CC, C and D are below-investment grade ratings. Holdings designated N/R are not rated by these national rating agencies.
Fund Allocation
(% of net assets)
| | | | |
| Variable Rate Senior Loan Interests | | | 138.1% | |
| Corporate Bonds | | | 11.0% | |
| Common Stocks | | | 3.6% | |
| Long-Term Investment Companies | | | 2.0% | |
| Asset-Backed Securities | | | 0.6% | |
| Warrants | | | 0.1% | |
| Convertible Preferred Securities | | | 0.0% | |
| Common Stock Rights | | | 0.0% | |
| Short-Term Investment Companies | | | 6.8% | |
| Other Assets Less Liabilities | | | (5.0)% | |
| Net Assets Plus Borrowings and Taxable Fund Preferred Shares, net of deferred offering costs | | | 157.2% | |
| Borrowings | | | (40.4)% | |
| Taxable Fund Preferred Shares, net of deferred offering costs | | | (16.8)% | |
Net Assets | | | 100% | |
Top Five Issuers
(% of total long-term investments)
| | | | |
| B.C. Unlimited Liability Company | | | 2.4% | |
| Parexel International Corporation | | | 1.3% | |
| Clear Channel Outdoor Holdings, Inc. | | | 1.2% | |
| Caesars Resort Collection, LLC | | | 1.1% | |
| Seattle Spinco, Inc. | | | 1.1% | |
Portfolio Composition
(% of total investments)
| | | | |
| Media | | | 11.3% | |
| Hotels, Restaurants & Leisure | | | 11.1% | |
| Software | | | 6.9% | |
| Health Care Providers & Services | | | 6.1% | |
| Oil, Gas & Consumable Fuels | | | 4.2% | |
| Pharmaceuticals | | | 4.0% | |
| Commercial Services & Supplies | | | 3.4% | |
| Life Sciences Tools & Services | | | 2.8% | |
| IT Services | | | 2.7% | |
| Diversified Telecommunication Services | | | 2.5% | |
| Insurance | | | 2.4% | |
| Entertainment | | | 2.1% | |
| Communications Equipment | | | 2.0% | |
| Specialty Retail | | | 1.9% | |
| Technology Hardware, Storage & Peripherals | | | 1.6% | |
| Auto Components | | | 1.4% | |
| Building Products | | | 1.3% | |
| Road & Rail | | | 1.3% | |
| Professional Services | | | 1.3% | |
| Airlines | | | 1.2% | |
| Health Care Technology | | | 1.2% | |
| Interactive Media & Services | | | 1.2% | |
| Personal Products | | | 1.1% | |
| Other1 | | | 19.2% | |
| Long-Term Investment Companies | | | 1.2% | |
| Asset-Backed Securities | | | 0.4% | |
| Short-Term Investment Companies | | | 4.2% | |
Total | | | 100% | |
Portfolio Credit Quality
(% of total long-term fixed income investments)
| | | | |
| BBB | | | 10.5% | |
| BB or Lower | | | 85.9% | |
| N/R (not rated) | | | 3.6% | |
Total | | | 100% | |
| 1 | See Portfolio of Investments for details on “other” Portfolio Composition. |
15
| | |
| JRO | | Nuveen Floating Rate Income Opportunity Fund Performance Overview and Holding Summaries as of July 31, 2021 |
Refer to Glossary of Terms Used in this Report for further definition of the terms used within this section.
Average Annual Total Returns as of July 31, 2021
| | | | | | | | | | | | |
| | | Average Annual | |
| | | 1-Year | | | 5-Year | | | 10-Year | |
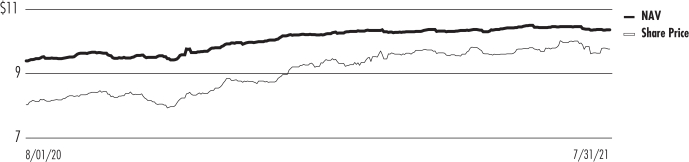
| JRO at Common Share NAV | | | 17.42% | | | | 4.93% | | | | 5.64% | |
| JRO at Common Share Price | | | 30.14% | | | | 5.42% | | | | 5.92% | |
| Credit Suisse Leveraged Loan Index | | | 9.60% | | | | 4.75% | | | | 4.50% | |
Past performance is not predictive of future results. Current performance may be higher or lower than the data shown. Returns do not reflect the deduction of taxes that shareholders may have to pay on Fund distributions or upon the sale of Fund shares. Returns at NAV are net of Fund expenses, and assume reinvestment of distributions. Comparative index return information is provided for the Fund’s shares at NAV only. Indexes are not available for direct investment.
Daily Common Share NAV and Share Price
Growth of an Assumed $10,000 Investment as of July 31, 2021 — Common Share Price

16
This data relates to the securities held in the Fund’s portfolio of investments as of the end of the reporting period. It should not be construed as a measure of performance for the Fund itself. Holdings are subject to change.
For financial reporting purposes, the ratings disclosed are the highest rating given by one of the following national rating agencies: Standard & Poor’s Group, Moody’s Investors Service, Inc. or Fitch, Inc. This treatment of split-rated securities may differ from that used for other purposes, such as for Fund investment policies. Credit ratings are subject to change. AAA, AA, A and BBB are investment grade ratings; BB, B, CCC, CC, C and D are below-investment grade ratings. Holdings designated N/R are not rated by these national rating agencies.
Fund Allocation
(% of net assets)
| | | | |
| Variable Rate Senior Loan Interests | | | 138.6% | |
| Corporate Bonds | | | 11.4% | |
| Common Stocks | | | 3.7% | |
| Asset-Backed Securities | | | 0.6% | |
| Warrants | | | 0.1% | |
| Convertible Preferred Securities | | | 0.0% | |
| Common Stock Rights | | | 0.0% | |
| Short-Term Investment Companies | | | 6.3% | |
| Other Assets Less Liabilities | | | (3.3)% | |
| Net Assets Plus Borrowings and Taxable Fund Preferred Shares, net of deferred offering costs | | | 157.4% | |
| Borrowings | | | (39.5)% | |
| Taxable Fund Preferred Shares, net of deferred offering costs | | | (17.9)% | |
Net Assets | | | 100% | |
Top Five Issuers
(% of total long-term investments)
| | | | |
| B.C. Unlimited Liability Company | | | 2.4% | |
| Parexel International Corporation | | | 1.2% | |
Clear Channel Outdoor
Holdings, Inc. | | | 1.2% | |
| Caesars Resort Collection, LLC, Term Loan | | | 1.2% | |
| Seattle Spinco, Inc. | | | 1.2% | |
Portfolio Composition
(% of total investments)
| | | | |
| Media | | | 11.8% | |
| Hotels, Restaurants & Leisure | | | 11.1% | |
| Software | | | 7.0% | |
| Health Care Providers & Services | | | 6.4% | |
| Oil, Gas & Consumable Fuels | | | 4.0% | |
| Commercial Services & Supplies | | | 3.7% | |
| Pharmaceuticals | | | 3.4% | |
| IT Services | | | 3.2% | |
| Life Sciences Tools & Services | | | 2.8% | |
| Diversified Telecommunication Services | | | 2.5% | |
| Entertainment | | | 2.3% | |
| Insurance | | | 2.2% | |
| Communications Equipment | | | 1.9% | |
| Specialty Retail | | | 1.9% | |
| Technology Hardware, Storage & Peripherals | | | 1.5% | |
| Road & Rail | | | 1.5% | |
| Building Products | | | 1.5% | |
| Auto Components | | | 1.4% | |
| Health Care Technology | | | 1.3% | |
| Capital Markets | | | 1.3% | |
| Airlines | | | 1.3% | |
| Professional Services | | | 1.3% | |
| Interactive Media & Services | | | 1.2% | |
| Other1 | | | 19.2% | |
| Asset-Backed Securities | | | 0.4% | |
| Short-Term Investment Companies | | | 3.9% | |
Total | | | 100% | |
Portfolio Credit Quality
(% of total long-term fixed income investments)
| | | | |
| BBB | | | 9.9% | |
| BB or Lower | | | 86.3% | |
| N/R (not rated) | | | 3.8% | |
Total | | | 100% | |
| 1 | See Portfolio of Investments for details on “other” Portfolio Composition. |
17
| | |
| JSD | | Nuveen Short Duration Credit Opportunities Fund Performance Overview and Holding Summaries as of July 31, 2021 |
Refer to the Glossary of Terms Used in this Report for further definition of the terms used within this section.
Average Annual Total Returns as of July 31, 2021
| | | | | | | | | | | | |
| | | Average Annual | |
| | | 1-Year | | | 5-Year | | | 10-Year | |
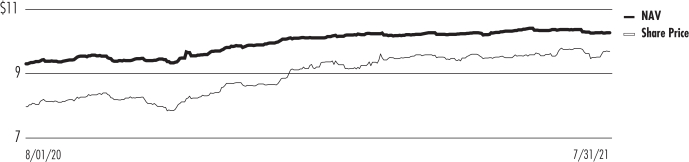
| JSD at Common Share NAV | | | 18.24% | | | | 4.66% | | | | 5.31% | |
| JSD at Common Share Price | | | 32.61% | | | | 5.34% | | | | 5.46% | |
| Credit Suisse Leveraged Loan Index | | | 9.60% | | | | 4.75% | | | | 4.50% | |
Past performance is not predictive of future results. Current performance may be higher or lower than the data shown. Returns do not reflect the deduction of taxes that shareholders may have to pay on Fund distributions or upon the sale of Fund shares. Returns at NAV are net of Fund expenses, and assume reinvestment of distributions. Comparative index return information is provided for the Fund’s shares at NAV only. Indexes are not available for direct investment.
Daily Common Share NAV and Share Price
Growth of an Assumed $10,000 Investment as of July 31, 2021 — Common Share Price
18
This data relates to the securities held in the Fund’s portfolio of investments as of the end of the reporting period. It should not be construed as a measure of performance for the Fund itself. Holdings are subject to change.
For financial reporting purposes, the ratings disclosed are the highest rating given by one of the following national rating agencies: Standard & Poor’s Group, Moody’s Investors Service, Inc. or Fitch, Inc. This treatment of split-rated securities may differ from that used for other purposes, such as for Fund investment policies. Credit ratings are subject to change. AAA, AA, A and BBB are investment grade ratings; BB, B, CCC, CC, C and D are below-investment grade ratings. Holdings designated N/R are not rated by these national rating agencies.
Fund Allocation
(% of net assets)
| | | | |
| Variable Rate Senior Loan Interests | | | 138.5% | |
| Corporate Bonds | | | 12.2% | |
| Common Stocks | | | 3.4% | |
| Warrants | | | 0.1% | |
| Convertible Preferred Securities | | | 0.1% | |
| Common Stock Rights | | | 0.0% | |
| Short-Term Investment Companies | | | 6.8% | |
| Other Assets Less Liabilities | | | (4.1)% | |
| Net Assets Plus Borrowings and Taxable Fund Preferred Shares, net of deferred offering costs | | | 157.0% | |
| Borrowings | | | (12.5)% | |
| Taxable Fund Preferred, net of deferred offering costs | | | (44.5)% | |
Net Assets | | | 100% | |
Top Five Issuers
(% of total long-term investments)
| | | | |
| PPD, Inc. | | | 1.8% | |
| Caesars Resort Collection, LLC | | | 1.6% | |
| Delta 2 (LUX) S.a.r.l. | | | 1.3% | |
| PetSmart, Inc. | | | 1.1% | |
| Seattle Spinco, Inc. | | | 1.1% | |
Portfolio Composition
(% of total investments)
| | | | |
| Hotels, Restaurants & Leisure | | | 10.0% | |
| Media | | | 9.5% | |
| Software | | | 7.7% | |
| Health Care Providers & Services | | | 6.4% | |
| Pharmaceuticals | | | 4.4% | |
| Oil, Gas & Consumable Fuels | | | 4.3% | |
| Commercial Services & Supplies | | | 4.0% | |
| IT Services | | | 3.8% | |
| Life Sciences Tools & Services | | | 3.3% | |
| Diversified Telecommunication Services | | | 2.9% | |
| Specialty Retail | | | 2.2% | |
| Entertainment | | | 1.6% | |
| Insurance | | | 1.6% | |
| Auto Components | | | 1.6% | |
| Electric Utilities | | | 1.6% | |
| Airlines | | | 1.5% | |
| Road & Rail | | | 1.4% | |
| Professional Services | | | 1.4% | |
| Communications Equipment | | | 1.3% | |
| Technology Hardware, Storage & Peripherals | | | 1.2% | |
| Health Care Equipment & Supplies | | | 1.2% | |
| Construction & Engineering | | | 1.2% | |
| Capital Markets | | | 1.2% | |
| Health Care Technology | | | 1.2% | |
| Other1 | | | 19.3% | |
| Short-term Investment Companies | | | 4.2% | |
Total | | | 100% | |
Portfolio Credit Quality
(% of total long-term fixed income investments)
| | | | |
| BBB | | | 9.3% | |
| BB or Lower | | | 86.9% | |
| N/R (not rated) | | | 3.8% | |
Total | | | 100% | |
| 1 | See Portfolio of Investments for details on “other” Portfolio Composition. |
19
| | |
| JQC | | Nuveen Credit Strategies Income Fund Performance Overview and Holding Summaries as of July 31, 2021 |
Refer to Glossary of Terms Used in this Report for further definition of the terms used within this section.
Average Annual Total Returns as of July 31, 2021
| | | | | | | | | | | | |
| | | Average Annual | |
| | | 1-Year | | | 5-Year | | | 10-Year | |
| JQC at Common Share NAV | | | 13.42% | | | | 4.26% | | | | 4.77% | |
| JQC at Common Share Price | | | 26.98% | | | | 6.15% | | | | 6.58% | |
| Credit Suisse Leveraged Loan Index | | | 9.60% | | | | 4.75% | | | | 4.50% | |
Past performance is not predictive of future results. Current performance may be higher or lower than the data shown. Returns do not reflect the deduction of taxes that shareholders may have to pay on Fund distributions or upon the sale of Fund shares. Returns at NAV are net of Fund expenses, and assume reinvestment of distributions. Comparative index return information is provided for the Fund’s shares at NAV only. Indexes are not available for direct investment.
Daily Common Share NAV and Share Price
Growth of an Assumed $10,000 Investment as of July 31, 2021 — Common Share Price
20
This data relates to the securities held in the Fund’s portfolio of investments as of the end of the reporting period. It should not be construed as a measure of performance for the Fund itself. Holdings are subject to change.
For financial reporting purposes, the ratings disclosed are the highest rating given by one of the following national rating agencies: Standard & Poor’s Group, Moody’s Investors Service, Inc. or Fitch, Inc. This treatment of split-rated securities may differ from that used for other purposes, such as for Fund investment policies. Credit ratings are subject to change. AAA, AA, A and BBB are investment grade ratings; BB, B, CCC, CC, C and D are below-investment grade ratings. Holdings designated N/R are not rated by these national rating agencies.
Fund Allocation
(% of net assets)
| | | | |
| Variable Rate Senior Loan Interests | | | 140.0% | |
| Corporate Bonds | | | 19.3% | |
| Common Stocks | | | 1.1% | |
| Convertible Bonds | | | 0.2% | |
| Warrants | | | 0.1% | |
| Common Stock Rights | | | 0.0% | |
| Short-Term Investment Companies | | | 1.4% | |
| Other Assets Less Liabilities | | | (4.0)% | |
| Net Assets Plus Borrowings and Reverse Repurchase Agreements | | | 158.1% | |
| Borrowings | | | (42.9)% | |
| Reverse Repurchase Agreements | | | (15.2)% | |
Net Assets | | | 100% | |
Top Five Issuers
(% of total long-term investments)
| | | | |
| Parexel International Corporation, Term Loan B | | | 1.5% | |
| Sabre GLBL, Inc., Term Loan B | | | 1.2% | |
| Life Time Fitness Inc , Term Loan B | | | 1.2% | |
| Quikrete Holdings, Inc., Term Loan, First Lien | | | 1.1% | |
| Ziggo Financing Partnership, Term Loan I | | | 1.1% | |
Portfolio Composition
(% of total investments)
| | | | |
| Hotels, Restaurants & Leisure | | | 11.1% | |
| Media | | | 10.0% | |
| Health Care Providers & Services | | | 9.5% | |
| Software | | | 8.2% | |
| Pharmaceuticals | | | 4.1% | |
| Insurance | | | 3.5% | |
| Commercial Services & Supplies | | | 3.5% | |
| Diversified Telecommunication Services | | | 3.4% | |
| Airlines | | | 3.1% | |
| IT Services | | | 2.8% | |
| Oil, Gas & Consumable Fuels | | | 2.8% | |
| Food & Staples Retailing | | | 2.6% | |
| Communications Equipment | | | 2.6% | |
| Life Sciences Tools & Services | | | 2.0% | |
| Machinery | | | 1.9% | |
| Personal Products | | | 1.9% | |
| Specialty Retail | | | 1.8% | |
| Building Products | | | 1.7% | |
| Leisure Products | | | 1.4% | |
| Chemicals | | | 1.4% | |
| Other1 | | | 19.8% | |
| Short-Term Investment Companies | | | 0.9% | |
Total | | | 100% | |
Portfolio Credit Quality
(% of total long-term fixed income investments)
| | | | |
| BBB | | | 14.6% | |
| BB or Lower | | | 83.9% | |
| N/R (not rated) | | | 1.5% | |
Total | | | 100% | |
| 1 | See Portfolio of Investments for details on “other” Portfolio Composition. |
21
Shareholder Meeting Report
The annual meeting of shareholders was held on April 6, 2021 for NSL, JFR, JRO, JSD and JQC. The meeting was held virtually due to public health concerns regarding the ongoing COVID-19 pandemic; at this meeting the shareholders were asked to elect Board members.
| | | | | | | | | | | | | | | | | | | | | | | | | | | | | | | | | | | | |
| | | NSL | | | JFR | | | JRO | | | JSD | | | JQC | |
| | | Common and
Preferred
shares voting
together as a
class | | | Preferred
Shares | | | Common and
Preferred
shares voting
together as a
class | | | Preferred
Shares | | | Common and
Preferred
shares voting
together as a
class | | | Preferred
Shares | | | Common and
Preferred
shares voting
together as a
class | | | Preferred
Shares | | | Common
Shares | |
Approval of the Board Members was reached as follows: | | | | | | | | | | | | | | | | | | | | | | | | | | | | | | | | | | | | |
Jack B. Evans | | | | | | | | | | | | | | | | | | | | | | | | | | | | | | | | | | | | |
For | | | 15,269,981 | | | | — | | | | 19,925,265 | | | | — | | | | 12,844,141 | | | | — | | | | 4,221,956 | | | | — | | | | 79,954,539 | |
Withhold | | | 14,250,010 | | | | — | | | | 26,258,372 | | | | — | | | | 18,826,046 | | | | — | | | | 4,260,206 | | | | — | | | | 25,140,111 | |
Total | | | 29,519,991 | | | | — | | | | 46,183,637 | | | | — | | | | 31,670,187 | | | | — | | | | 8,482,162 | | | | — | | | | 105,094,650 | |
Matthew Thornton III | | | | | | | | | | | | | | | | | | | | | | | | | | | | | | | | | | | | |
For | | | 21,919,584 | | | | — | | | | 35,265,261 | | | | — | | | | 23,644,579 | | | | — | | | | 5,846,342 | | | | — | | | | 98,430,207 | |
Withhold | | | 7,600,407 | | | | — | | | | 10,918,376 | | | | — | | | | 8,025,608 | | | | — | | | | 2,635,820 | | | | — | | | | 6,664,443 | |
Total | | | 29,519,991 | | | | — | | | | 46,183,637 | | | | — | | | | 31,670,187 | | | | — | | | | 8,482,162 | | | | — | | | | 105,094,650 | |
William C. Hunter | | | | | | | | | | | | | | | | | | | | | | | | | | | | | | | | | | | | |
For | | | — | | | | 40,000 | | | | — | | | | 66,000 | | | | — | | | | 75,000 | | | | — | | | | 47,000 | | | | — | |
Withhold | | | — | | | | — | | | | — | | | | 34,000 | | | | — | | | | — | | | | — | | | | 23,000 | | | | — | |
Total | | | — | | | | 40,000 | | | | — | | | | 100,000 | | | | — | | | | 75,000 | | | | — | | | | 70,000 | | | | — | |
Albin F. Moschner | | | | | | | | | | | | | | | | | | | | | | | | | | | | | | | | | | | | |
For | | | — | | | | 40,000 | | | | — | | | | 66,000 | | | | — | | | | 75,000 | | | | — | | | | 47,000 | | | | 80,005,675 | |
Withhold | | | — | | | | — | | | | — | | | | 34,000 | | | | — | | | | — | | | | — | | | | 23,000 | | | | 25,088,975 | |
Total | | | — | | | | 40,000 | | | | — | | | | 100,000 | | | | — | | | | 75,000 | | | | — | | | | 70,000 | | | | 105,094,650 | |
22
Report of Independent Registered Public Accounting Firm
To the Shareholders and Board of Trustees
Nuveen Senior Income Fund
Nuveen Floating Rate Income Fund
Nuveen Floating Rate Income Opportunity Fund
Nuveen Short Duration Credit Opportunities Fund
Nuveen Credit Strategies Income Fund:
Opinion on the Financial Statements
We have audited the accompanying statements of assets and liabilities of Nuveen Senior Income Fund, Nuveen Floating Rate Income Fund, Nuveen Floating Rate Income Opportunity Fund, Nuveen Short Duration Credit Opportunities Fund and Nuveen Credit Strategies Income Fund (the Funds), including the portfolios of investments, as of July 31, 2021, the related statements of operations and cash flows for the year then ended, the statements of changes in net assets for each of the years in the two-year period then ended, and the related notes (collectively, the financial statements) and the financial highlights for each of the years in the five-year period then ended. In our opinion, the financial statements and financial highlights present fairly, in all material respects, the financial position of the Funds as of July 31, 2021, the results of their operations and their cash flows for the year then ended, the changes in their net assets for each of the years in the two-year period then ended, and the financial highlights for each of the years in the five-year period then ended, in conformity with U.S. generally accepted accounting principles.
Basis for Opinion
These financial statements and financial highlights are the responsibility of the Funds’ management. Our responsibility is to express an opinion on these financial statements and financial highlights based on our audits. We are a public accounting firm registered with the Public Company Accounting Oversight Board (United States) (PCAOB) and are required to be independent with respect to the Funds in accordance with the U.S. federal securities laws and the applicable rules and regulations of the Securities and Exchange Commission and the PCAOB.
We conducted our audits in accordance with the standards of the PCAOB. Those standards require that we plan and perform the audit to obtain reasonable assurance about whether the financial statements and financial highlights are free of material misstatement, whether due to error or fraud. Our audits included performing procedures to assess the risks of material misstatement of the financial statements and financial highlights, whether due to error or fraud, and performing procedures that respond to those risks. Such procedures included examining, on a test basis, evidence regarding the amounts and disclosures in the financial statements and financial highlights. Such procedures also included confirmation of securities owned as of July 31, 2021, by correspondence with custodians and brokers or other appropriate auditing procedures. Our audits also included evaluating the accounting principles used and significant estimates made by management, as well as evaluating the overall presentation of the financial statements and financial highlights. We believe that our audits provide a reasonable basis for our opinion.
/s/ KPMG LLP
We have served as the auditor of one or more Nuveen investment companies since 2014.
Chicago, Illinois
September 28, 2021
23
| | |
| NSL | | Nuveen Senior Income Fund Portfolio of Investments July 31, 2021 |
| | | | | | | | | | | | | | | | | | | | | | | | | | | | |
Principal
Amount (000) | | | Description (1) | | Coupon (2) | | | Reference
Rate (2) | | | Spread (2) | | | Maturity (3) | | | Ratings (4) | | | Value | |
| |
| | | | LONG-TERM INVESTMENTS – 153.9% (97.2% of Total Investments) | |
| |
| | | | VARIABLE RATE SENIOR LOAN INTERESTS – 139.1% (87.9% of Total Investments) (2) | |
| |
| | | | Aerospace & Defense – 1.5% (1.0% of Total Investments) | |
| | | | | | | |
| $ | 313 | | | Dynasty Acquisition Co., Inc., Term Loan B1 | | | 3.647% | | | | 3-Month LIBOR | | | | 3.500% | | | | 4/08/26 | | | | B– | | | $ | 302,924 | |
| | 168 | | | Dynasty Acquisition Co., Inc., Term Loan B2 | | | 3.647% | | | | 3-Month LIBOR | | | | 3.500% | | | | 4/08/26 | | | | B– | | | | 162,862 | |
| | 731 | | | Maxar Technologies Ltd., Term Loan B | | | 2.850% | | | | 1-Month LIBOR | | | | 2.750% | | | | 10/05/24 | | | | B | | | | 725,116 | |
| | 964 | | | TransDigm, Inc., Term Loan E | | | 2.342% | | | | 1-Month LIBOR | | | | 2.250% | | | | 5/30/25 | | | | Ba3 | | | | 948,089 | |
| | 795 | | | TransDigm, Inc., Term Loan F | | | 2.342% | | | | 1-Month LIBOR | | | | 2.250% | | | | 12/09/25 | | | | Ba3 | | | | 782,569 | |
| | 687 | | | TransDigm, Inc., Term Loan G | | | 2.342% | | | | 1-Month LIBOR | | | | 2.250% | | | | 8/22/24 | | | | Ba3 | | | | 676,992 | |
| | 3,658 | | | Total Aerospace & Defense | | | | | | | | | | | | | | | | | | | | | | | 3,598,552 | |
| |
| | | | Airlines – 2.3% (1.5% of Total Investments) | |
| | | | | | | |
| | 920 | | | AAdvantage Loyalty IP Ltd., Term Loan | | | 5.500% | | | | 3-Month LIBOR | | | | 4.750% | | | | 4/20/28 | | | | Ba2 | | | | 947,493 | |
| | 189 | | | American Airlines, Inc., Incremental Term Loan | | | 2.093% | | | | 1-Month LIBOR | | | | 2.000% | | | | 12/14/23 | | | | Ba3 | | | | 184,697 | |
| | 760 | | | American Airlines, Inc., Term Loan, First Lien | | | 1.840% | | | | 1-Month LIBOR | | | | 1.750% | | | | 1/29/27 | | | | Ba3 | | | | 706,446 | |
| | 963 | | | Kestrel Bidco, Inc., Term Loan B | | | 4.000% | | | | 6-Month LIBOR | | | | 3.000% | | | | 12/11/26 | | | | BB– | | | | 932,275 | |
| | 1,075 | | | SkyMiles IP Ltd., Term Loan B | | | 4.750% | | | | 3-Month LIBOR | | | | 3.750% | | | | 10/20/27 | | | | Baa1 | | | | 1,137,113 | |
| | 1,496 | | | United Airlines, Inc., Term Loan B | | | 4.500% | | | | 1-Month LIBOR | | | | 3.750% | | | | 4/21/28 | | | | Ba1 | | | | 1,500,836 | |
| | 5,403 | | | Total Airlines | | | | | | | | | | | | | | | | | | | | | | | 5,408,860 | |
| |
| | | | Auto Components – 1.7% (1.1% of Total Investments) | |
| | | | | | | |
| | 124 | | | Adient US LLC, Term Loan B | | | 3.592% | | | | 1-Month LIBOR | | | | 3.500% | | | | 4/08/28 | | | | BB– | | | | 123,882 | |
| | 1,363 | | | Clarios Global LP, Term Loan B | | | 3.342% | | | | 1-Month LIBOR | | | | 3.250% | | | | 4/30/26 | | | | B1 | | | | 1,354,463 | |
| | 825 | | | DexKo Global Inc., Term Loan | | | 4.500% | | | | 1-Month LIBOR | | | | 3.500% | | | | 7/24/24 | | | | B1 | | | | 825,614 | |
| | 746 | | | Les Schwab Tire Centers, Term Loan B | | | 4.000% | | | | 6-Month LIBOR | | | | 3.250% | | | | 11/02/27 | | | | B | | | | 746,873 | |
| | 898 | | | Superior Industries International, Inc., Term Loan B, First Lien | | | 4.092% | | | | 1-Month LIBOR | | | | 4.000% | | | | 5/23/24 | | | | Ba3 | | | | 898,521 | |
| | 3,956 | | | Total Auto Components | | | | | | | | | | | | | | | | | | | | | | | 3,949,353 | |
| |
| | | | Automobiles – 0.2% (0.1% of Total Investments) | |
| | | | | | | |
| | 518 | | | Wand NewCo 3, Inc., Term Loan | | | 3.092% | | | | 1-Month LIBOR | | | | 3.000% | | | | 2/05/26 | | | | B1 | | | | 511,757 | |
| |
| | | | Banks – 0.1% (0.0% of Total Investments) | |
| | | | | | | |
| | 157 | | | iQor US, Inc., Exit Term Loan | | | 7.589% | | | | 1-Month LIBOR | | | | 7.500% | | | | 9/15/27 | | | | N/R | | | | 161,171 | |
| |
| | | | Beverages – 1.0% (0.6% of Total Investments) | |
| | | | | | | |
| | 617 | | | Arterra Wines Canada, Inc., Term Loan | | | 4.250% | | | | 3-Month LIBOR | | | | 3.500% | | | | 11/25/27 | | | | B1 | | | | 616,900 | |
| | 469 | | | City Brewing Company, LLC, Term Loan | | | 4.250% | | | | 3-Month LIBOR | | | | 3.500% | | | | 4/05/28 | | | | B+ | | | | 466,948 | |
| | 1,185 | | | Triton Water Holdings, Inc, Term Loan | | | 4.000% | | | | 3-Month LIBOR | | | | 3.500% | | | | 3/31/28 | | | | B1 | | | | 1,177,740 | |
| | 2,271 | | | Total Beverages | | | | | | | | | | | | | | | | | | | | | | | 2,261,588 | |
| |
| | | | Biotechnology – 0.8% (0.5% of Total Investments) | |
| | | | | | | |
| | 2,004 | | | Grifols Worldwide Operations USA, Inc., Term Loan B | | | 2.084% | | | | 1-Week LIBOR | | | | 2.000% | | | | 11/15/27 | | | | BB+ | | | | 1,980,111 | |
| |
| | | | Building Products – 2.0% (1.3% of Total Investments) | |
| | | | | | | |
| | 300 | | | All-Star Bidco AB, Term Loan, (WI/DD) | | | TBD | | | | TBD | | | | TBD | | | | TBD | | | | N/R | | | | 299,625 | |
| | 1,133 | | | Cornerstone Building Brands, Inc., Term Loan B | | | 3.750% | | | | 1-Month LIBOR | | | | 3.250% | | | | 4/12/28 | | | | B+ | | | | 1,132,132 | |
| | 104 | | | LBM Acquisition LLC, Term Loan, (WI/DD) | | | TBD | | | | TBD | | | | TBD | | | | TBD | | | | B+ | | | | 102,827 | |
| | 465 | | | LBM Acquisition LLC, Term Loan B | | | 4.500% | | | | 3-Month LIBOR | | | | 3.750% | | | | 12/17/27 | | | | B+ | | | | 461,564 | |
| | 160 | | | Potters Industries, LLC, Term Loan B | | | 4.750% | | | | 3-Month LIBOR | | | | 4.000% | | | | 12/14/27 | | | | B | | | | 160,100 | |
| | 2,091 | | | Quikrete Holdings, Inc., Term Loan, First Lien | | | 2.592% | | | | 1-Month LIBOR | | | | 2.500% | | | | 1/31/27 | | | | BB– | | | | 2,069,238 | |
| | 427 | | | Resideo Funding, Inc., Term Loan | | | 2.750% | | | | 3-Month LIBOR | | | | 2.250% | | | | 2/12/28 | | | | BBB– | | | | 425,719 | |
| | 162 | | | Resideo Funding, Inc., Term Loan | | | 2.750% | | | | 1-Month LIBOR | | | | 2.250% | | | | 2/12/28 | | | | BBB– | | | | 160,970 | |
| | 4,842 | | | Total Building Products | | | | | | | | | | | | | | | | | | | | | | | 4,812,175 | |
| |
| | | | Capital Markets – 1.3% (0.8% of Total Investments) | |
| | | | | | | |
| | 185 | | | RPI Intermediate Finance Trust, Term Loan B1 | | | 1.842% | | | | 1-Month LIBOR | | | | 1.750% | | | | 2/11/27 | | | | BBB– | | | | 184,202 | |
| | 1,999 | | | Sequa Mezzanine Holdings L.L.C., Extended Term Loan, (cash 6.750%, PIK 1.000%) | | | 7.750% | | | | 3-Month LIBOR | | | | 6.750% | | | | 7/31/23 | | | | B– | | | | 2,028,059 | |
24
| | | | | | | | | | | | | | | | | | | | | | | | | | | | |
Principal
Amount (000) | | | Description (1) | | Coupon (2) | | | Reference
Rate (2) | | | Spread (2) | | | Maturity (3) | | | Ratings (4) | | | Value | |
| |
| | | | Capital Markets (continued) | |
| | | | | | | |
| $ | 823 | | | Sequa Mezzanine Holdings L.L.C., Term Loan, Second Lien, (cash 5.000%, PIK 6.750%) | | | 11.750% | | | | 3-Month LIBOR | | | | 10.750% | | | | 7/31/24 | | | | CCC– | | | $ | 812,850 | |
| | 3,007 | | | Total Capital Markets | | | | | | | | | | | | | | | | | | | | | | | 3,025,111 | |
| |
| | | | Chemicals – 1.0% (0.7% of Total Investments) | |
| | | | | | | |
| | 323 | | | ASP Unifrax Holdings, Inc., Term Loan B | | | 3.897% | | | | 3-Month LIBOR | | | | 3.750% | | | | 12/14/25 | | | | B– | | | | 317,278 | |
| | 373 | | | Atotech B.V., Term Loan B | | | 3.000% | | | | 3-Month LIBOR | | | | 2.500% | | | | 3/18/28 | | | | B+ | | | | 371,911 | |
| | 500 | | | INEOS Styrolution US Holding LLC, Term Loan B | | | 3.250% | | | | 1-Month LIBOR | | | | 2.750% | | | | 1/29/26 | | | | BB+ | | | | 499,250 | |
| | 659 | | | Ineos US Finance LLC, Term Loan B | | | 2.107% | | | | 2-Month LIBOR | | | | 2.000% | | | | 3/31/24 | | | | BBB– | | | | 651,136 | |
| | 398 | | | Lonza Group AG, Term Loan B | | | 4.750% | | | | 3-Month LIBOR | | | | 4.000% | | | | 5/14/28 | | | | B2 | | | | 398,498 | |
| | 177 | | | Sparta US HoldCo LLC, Term Loan, (WI/DD) | | | TBD | | | | TBD | | | | TBD | | | | TBD | | | | B+ | | | | 177,184 | |
| | 2,430 | | | Total Chemicals | | | | | | | | | | | | | | | | | | | | | | | 2,415,257 | |
| |
| | | | Commercial Services & Supplies – 5.6% (3.5% of Total Investments) | |
| | | | | | | |
| | 499 | | | Amentum Government Services Holdings LLC, Term Loan B | | | 5.500% | | | | 3-Month LIBOR | | | | 4.750% | | | | 1/31/27 | | | | B1 | | | | 500,620 | |
| | 523 | | | Brand Energy & Infrastructure Services, Inc., Term Loan | | | 5.250% | | | | 3-Month LIBOR | | | | 4.250% | | | | 6/21/24 | | | | B– | | | | 514,566 | |
| | 4,293 | | | Delta 2 (LUX) S.a.r.l., Term Loan | | | 3.500% | | | | 1-Month LIBOR | | | | 2.500% | | | | 2/01/24 | | | | B+ | | | | 4,267,795 | |
| | 433 | | | Garda World Security Corporation, Term Loan B | | | 4.340% | | | | 1-Month LIBOR | | | | 4.250% | | | | 10/30/26 | | | | BB+ | | | | 432,851 | |
| | 1,037 | | | GFL Environmental, Inc., Term Loan | | | 3.500% | | | | 3-Month LIBOR | | | | 3.000% | | | | 5/30/25 | | | | BB– | | | | 1,037,557 | |
| | 275 | | | KAR Auction Services, Inc., Term Loan B6 | | | 2.375% | | | | 1-Month LIBOR | | | | 2.250% | | | | 9/19/26 | | | | Ba3 | | | | 271,649 | |
| | 500 | | | Madison IAQ LLC, Term Loan | | | 3.750% | | | | 3-Month LIBOR | | | | 3.250% | | | | 6/21/28 | | | | B1 | | | | 496,383 | |
| | 506 | | | PAE Holding Corporation, Term Loan B | | | 5.250% | | | | 1-Month LIBOR | | | | 4.500% | | | | 10/19/27 | | | | B | | | | 508,444 | |
| | 144 | | | Prime Security Services Borrower, LLC, Term Loan | | | 3.500% | | | | 1-Month LIBOR | | | | 2.750% | | | | 9/23/26 | | | | BB– | | | | 143,979 | |
| | 94 | | | Prime Security Services Borrower, LLC, Term Loan | | | 3.500% | | | | 3-Month LIBOR | | | | 2.750% | | | | 9/23/26 | | | | BB– | | | | 93,257 | |
| | 187 | | | Prime Security Services Borrower, LLC, Term Loan | | | 3.500% | | | | 6-Month LIBOR | | | | 2.750% | | | | 9/23/26 | | | | BB– | | | | 186,513 | |
| | 94 | | | Prime Security Services Borrower, LLC, Term Loan | | | 3.500% | | | | 12-Month LIBOR | | | | 2.750% | | | | 9/23/26 | | | | BB– | | | | 93,257 | |
| | 680 | | | Robertshaw US Holding Corp, Term Loan, First Lien | | | 4.500% | | | | 1-Month LIBOR | | | | 3.500% | | | | 2/28/25 | | | | CCC+ | | | | 655,464 | |
| | 89 | | | Sabert Corporation, Term Loan B | | | 5.500% | | | | 1-Month LIBOR | | | | 4.500% | | | | 12/10/26 | | | | B | | | | 89,499 | |
| | 748 | | | Spin Holdco, Inc., Term Loan | | | 4.750% | | | | 3-Month LIBOR | | | | 4.000% | | | | 3/04/28 | | | | B– | | | | 748,499 | |
| | 1,926 | | | Travelport Finance (Luxembourg) S.a.r.l., Term Loan, (cash 2.500%, PIK 6.500%), (DD1) | | | 2.500% | | | | 3-Month LIBOR | | | | 1.500% | | | | 2/28/25 | | | | B– | | | | 1,964,690 | |
| | 368 | | | West Corporation, Term Loan B1 | | | 4.500% | | | | 3-Month LIBOR | | | | 3.500% | | | | 10/10/24 | | | | BB+ | | | | 356,040 | |
| | 730 | | | WEX, Inc., Term Loan | | | 2.342% | | | | 1-Month LIBOR | | | | 2.250% | | | | 4/01/28 | | | | Ba2 | | | | 722,728 | |
| | 13,126 | | | Total Commercial Services & Supplies | | | | | | | | | | | | | | | | | | | | | | | 13,083,791 | |
| |
| | | | Communications Equipment – 2.4% (1.5% of Total Investments) | |
| | | | | | | |
| | 1,647 | | | CommScope, Inc., Term Loan B | | | 3.342% | | | | 1-Month LIBOR | | | | 3.250% | | | | 4/04/26 | | | | Ba3 | | | | 1,633,882 | |
| | 50 | | | MetroNet Systems Holdings, LLC, Delayed Draw Term Loan, (5) | | | 4.500% | | | | 1-Month LIBOR | | | | 3.750% | | | | 6/02/28 | | | | B2 | | | | 50,106 | |
| | 450 | | | MetroNet Systems Holdings, LLC, Term Loan, First Lien | | | 4.500% | | | | 1-Month LIBOR | | | | 3.750% | | | | 6/02/28 | | | | B2 | | | | 450,956 | |
| | 638 | | | MLN US HoldCo LLC, Term Loan, First Lien | | | 4.603% | | | | 1-Month LIBOR | | | | 4.500% | | | | 11/30/25 | | | | B3 | | | | 583,411 | |
| | 968 | | | Plantronics Inc, Term Loan B | | | 2.592% | | | | 1-Month LIBOR | | | | 2.500% | | | | 7/02/25 | | | | Ba2 | | | | 948,376 | |
| | 3 | | | Riverbed Technology, Inc., Term Loan B | | | 7.000% | | | | 2-Month LIBOR | | | | 6.000% | | | | 12/31/25 | | | | B2 | | | | 2,959 | |
| | 1,240 | | | Riverbed Technology, Inc., Term Loan B | | | 7.000% | | | | 3-Month LIBOR | | | | 6.000% | | | | 12/31/25 | | | | B2 | | | | 1,174,929 | |
| | 878 | | | Univision Communications, Inc., Term Loan C5 | | | 3.750% | | | | 1-Month LIBOR | | | | 2.750% | | | | 3/15/24 | | | | B | | | | 875,933 | |
| | 5,874 | | | Total Communications Equipment | | | | | | | | | | | | | | | | | | | | | | | 5,720,552 | |
| |
| | | | Construction & Engineering – 1.6% (1.0% of Total Investments) | |
| | | | | | | |
| | 300 | | | AECOM Technology Corporation , Term Loan B | | | 1.842% | | | | 1-Month LIBOR | | | | 1.750% | | | | 4/13/28 | | | | BBB– | | | | 299,813 | |
| | 465 | | | Aegion Corporation, Term Loan | | | 5.500% | | | | 3-Month LIBOR | | | | 4.750% | | | | 5/17/28 | | | | B | | | | 469,650 | |
| | 1,124 | | | Brown Group Holding, LLC, Term Loan B | | | 3.250% | | | | 3-Month LIBOR | | | | 2.750% | | | | 6/07/28 | | | | B+ | | | | 1,117,698 | |
| | 125 | | | FrontDoor Inc, Term Loan B | | | 2.342% | | | | 1-Month LIBOR | | | | 2.250% | | | | 6/17/28 | | | | Ba2 | | | | 124,974 | |
| | 250 | | | Osmose Utilities Services, Inc., Term Loan | | | 3.750% | | | | 3-Month LIBOR | | | | 3.250% | | | | 6/17/28 | | | | B | | | | 248,126 | |
| | 216 | | | Pike Corporation, Incremental Term Loan B | | | 3.100% | | | | 1-Month LIBOR | | | | 3.000% | | | | 1/21/28 | | | | Ba3 | | | | 215,272 | |
| | 1,218 | | | Traverse Midstream Partners LLC, Term Loan | | | 6.500% | | | | 1-Month LIBOR | | | | 5.500% | | | | 9/27/24 | | | | B | | | | 1,220,351 | |
| | 3,698 | | | Total Construction & Engineering | | | | | | | | | | | | | | | | | | | | | | | 3,695,884 | |
| |
| | | | Containers & Packaging – 1.3% (0.8% of Total Investments) | |
| | | | | | | |
| | 880 | | | Berry Global, Inc., Term Loan Z | | | 1.850% | | | | 1-Month LIBOR | | | | 1.750% | | | | 7/01/26 | | | | BBB– | | | | 870,927 | |
| | 326 | | | Reynolds Consumer Products LLC, Term Loan | | | 1.842% | | | | 1-Month LIBOR | | | | 1.750% | | | | 2/04/27 | | | | BBB– | | | | 322,954 | |
| | 697 | | | Reynolds Group Holdings, Inc., Term Loan B2 | | | 3.342% | | | | 1-Month LIBOR | | | | 3.250% | | | | 2/05/26 | | | | B+ | | | | 689,288 | |
25
| | |
| |
| NSL | | Nuveen Senior Income Fund (continued) |
| | Portfolio of Investments July 31, 2021 |
| | | | | | | | | | | | | | | | | | | | | | | | | | | | |
Principal
Amount (000) | | | Description (1) | | Coupon (2) | | | Reference
Rate (2) | | | Spread (2) | | | Maturity (3) | | | Ratings (4) | | | Value | |
| |
| | | | Containers & Packaging (continued) | |
| | | | | | | |
| $ | 216 | | | TricorBraun Holdings, Inc., Delayed Draw Term Loan, (5) | | | 3.750% | | | | 3-Month LIBOR | | | | 3.250% | | | | 3/03/28 | | | | B2 | | | $ | 213,928 | |
| | 959 | | | TricorBraun Holdings, Inc., Term Loan | | | 3.750% | | | | 3-Month LIBOR | | | | 3.250% | | | | 3/03/28 | | | | B2 | | | | 951,090 | |
| | 3,078 | | | Total Containers & Packaging | | | | | | | | | | | | | | | | | | | | | | | 3,048,187 | |
| |
| | | | Distributors – 0.7% (0.4% of Total Investments) | |
| | | | | | | |
| | 1,000 | | | Core & Main LP, Term Loan, (WI/DD) | | | TBD | | | | TBD | | | | TBD | | | | TBD | | | | Ba3 | | | | 991,875 | |
| | 606 | | | Univar Solutions USA, Inc., Term Loan B6 | | | 2.092% | | | | 1-Month LIBOR | | | | 2.000% | | | | 6/03/28 | | | | BBB– | | | | 601,983 | |
| | 1,606 | | | Total Distributors | | | | | | | | | | | | | | | | | | | | | | | 1,593,858 | |
| |
| | | | Diversified Consumer Services – 0.9% (0.6% of Total Investments) | |
| | | | | | | |
| | 1,470 | | | Cengage Learning, Inc., Term Loan B | | | 5.750% | | | | 3-Month LIBOR | | | | 4.750% | | | | 6/29/26 | | | | B | | | | 1,471,418 | |
| | 550 | | | Sotheby’s, Term Loan B | | | 5.500% | | | | 3-Month LIBOR | | | | 4.750% | | | | 1/15/27 | | | | B+ | | | | 551,253 | |
| | 2,020 | | | Total Diversified Consumer Services | | | | | | | | | | | | | | | | | | | | | | | 2,022,671 | |
| |
| | | | Diversified Financial Services – 1.7% (1.1% of Total Investments) | |
| | | | | | | |
| | 160 | | | Avaya Inc, Term Loan, (WI/DD) | | | TBD | | | | TBD | | | | TBD | | | | TBD | | | | N/R | | | | 160,291 | |
| | 1,034 | | | Ditech Holding Corporation, Term Loan, (6) | | | 0.000% | | | | N/A | | | | N/A | | | | 6/30/22 | | | | N/R | | | | 208,211 | |
| | 700 | | | Fleetcor Technologies Operating Company, LLC, Term Loan B4 | | | 1.842% | | | | 1-Month LIBOR | | | | 1.750% | | | | 4/30/28 | | | | BB+ | | | | 695,751 | |
| | 338 | | | GT Polaris, Inc., Term Loan | | | 4.500% | | | | 3-Month LIBOR | | | | 3.750% | | | | 9/24/27 | | | | BB– | | | | 338,852 | |
| | 331 | | | Lions Gate Capital Holdings LLC, Term Loan B | | | 2.342% | | | | 1-Month LIBOR | | | | 2.250% | | | | 3/24/25 | | | | Ba2 | | | | 328,080 | |
| | 1,505 | | | Verscend Holding Corp., Term Loan B | | | 4.092% | | | | 1-Month LIBOR | | | | 4.000% | | | | 8/27/25 | | | | BB– | | | | 1,504,255 | |
| | 750 | | | Vision Solutions, Inc., Term Loan, First Lien | | | 5.000% | | | | 3-Month LIBOR | | | | 4.250% | | | | 3/04/28 | | | | N/R | | | | 748,185 | |
| | 4,818 | | | Total Diversified Financial Services | | | | | | | | | | | | | | | | | | | | | | | 3,983,625 | |
| |
| | | | Diversified Telecommunication Services – 4.0% (2.5% of Total Investments) | |
| | | | | | | |
| | 592 | | | Altice France S.A., Term Loan B12 | | | 3.814% | | | | 3-Month LIBOR | | | | 3.688% | | | | 1/31/26 | | | | B | | | | 585,497 | |
| | 2,926 | | | Altice France S.A., Term Loan B13 | | | 4.155% | | | | 3-Month LIBOR | | | | 4.000% | | | | 8/14/26 | | | | B | | | | 2,923,074 | |
| | 2,922 | | | CenturyLink, Inc., Term Loan B | | | 2.342% | | | | 1-Month LIBOR | | | | 2.250% | | | | 3/15/27 | | | | BBB– | | | | 2,879,084 | |
| | 646 | | | Connect Finco Sarl, Term Loan B | | | 4.500% | | | | 1-Month LIBOR | | | | 3.500% | | | | 12/12/26 | | | | B+ | | | | 646,730 | |
| | 1,548 | | | Frontier Communications Corp., DIP Term Loan B | | | 4.500% | | | | 1-Month LIBOR | | | | 3.750% | | | | 10/08/27 | | | | BB+ | | | | 1,549,908 | |
| | 52 | | | GTT Communications, Inc., Delayed Draw Term Loan, (6) | | | 6.000% | | | | 1-Month LIBOR | | | | 5.000% | | | | 12/28/21 | | | | CCC+ | | | | 52,992 | |
| | 236 | | | Intelsat Jackson Holdings S.A., Term Loan B4, (6) | | | 8.750% | | | | Prime | | | | 5.500% | | | | 1/02/24 | | | | N/R | | | | 241,358 | |
| | 378 | | | Intelsat Jackson Holdings S.A., Term Loan B5, (6) | | | 8.625% | | | | N/A | | | | N/A | | | | 1/02/24 | | | | N/R | | | | 385,836 | |
| | 196 | | | Zayo Group Holdings, Inc., Term Loan | | | 3.092% | | | | 1-Month LIBOR | | | | 3.000% | | | | 3/09/27 | | | | B1 | | | | 193,052 | |
| | 9,496 | | | Total Diversified Telecommunication Services | | | | | | | | | | | | | | | | | | | | | | | 9,457,531 | |
| |
| | | | Electric Utilities – 0.7% (0.4% of Total Investments) | |
| | | | | | | |
| | 562 | | | ExGen Renewables IV, LLC, Term Loan | | | 3.500% | | | | 3-Month LIBOR | | | | 2.500% | | | | 12/15/27 | | | | BB– | | | | 561,942 | |
| | 495 | | | Pacific Gas & Electric Company, Term Loan | | | 3.500% | | | | 3-Month LIBOR | | | | 3.000% | | | | 6/23/25 | | | | BB | | | | 483,140 | |
| | 602 | | | Vistra Operations Company LLC, Term Loan B3, First Lien | | | 1.841% | | | | 1-Month LIBOR | | | | 1.750% | | | | 12/31/25 | | | | BBB– | | | | 595,115 | |
| | 1,659 | | | Total Electric Utilities | | | | | | | | | | | | | | | | | | | | | | | 1,640,197 | |
| |
| | | | Electrical Equipment – 1.4% (0.9% of Total Investments) | |
| | | | | | | |
| | 1,922 | | | Avolon TLB Borrower 1 (US) LLC, Term Loan B4 | | | 2.250% | | | | 1-Month LIBOR | | | | 1.500% | | | | 2/12/27 | | | | Baa2 | | | | 1,897,686 | |
| | 1,400 | | | Ingram Micro, Inc., Term Loan B | | | 4.000% | | | | 3-Month LIBOR | | | | 3.500% | | | | 7/02/28 | | | | BB | | | | 1,402,800 | |
| | 3,322 | | | Total Electrical Equipment | | | | | | | | | | | | | | | | | | | | | | | 3,300,486 | |
| |
| | | | Electronic Equipment, Instruments & Components – 0.4% (0.2% of Total Investments) | |
| | | | | | | |
| | 866 | | | TTM Technologies, Inc., Term Loan | | | 2.600% | | | | 1-Month LIBOR | | | | 2.500% | | | | 9/28/24 | | | | BB+ | | | | 864,969 | |
| |
| | | | Energy Equipment & Services – 0.2% (0.1% of Total Investments) | |
| | | | | | | |
| | 375 | | | Petroleum Geo-Services ASA, Term Loan | | | 7.647% | | | | 3-Month LIBOR | | | | 7.500% | | | | 3/19/24 | | | | N/R | | | | 348,106 | |
| | | | | | | |
| | | | Entertainment – 2.7% (1.7% of Total Investments) | | | | | | | | | | | | | | | | | | |
| | | | | | | |
| | 236 | | | AMC Entertainment Holdings, Inc., Term Loan B, (DD1) | | | 3.103% | | | | 1-Month LIBOR | | | | 3.000% | | | | 4/22/26 | | | | B– | | | | 210,515 | |
| | 297 | | | Crown Finance US, Inc., Incremental Term Loan | | | 3.750% | | | | 6-Month LIBOR | | | | 2.750% | | | | 9/20/26 | | | | CCC | | | | 239,412 | |
| | 2,361 | | | Crown Finance US, Inc., Term Loan | | | 3.500% | | | | 6-Month LIBOR | | | | 2.500% | | | | 2/28/25 | | | | CCC | | | | 1,922,809 | |
| | 973 | | | Metro-Goldwyn-Mayer, Inc., Term Loan, First Lien | | | 2.600% | | | | 1-Month LIBOR | | | | 2.500% | | | | 7/03/25 | | | | BB– | | | | 969,947 | |
26
| | | | | | | | | | | | | | | | | | | | | | | | | | | | |
Principal
Amount (000) | | | Description (1) | | Coupon (2) | | | Reference
Rate (2) | | | Spread (2) | | | Maturity (3) | | | Ratings (4) | | | Value | |
| |
| | | | Entertainment (continued) | |
| | | | | | | |
| $ | 750 | | | Metro-Goldwyn-Mayer, Inc., Term Loan, Second Lien | | | 5.500% | | | | 1-Month LIBOR | | | | 4.500% | | | | 7/06/26 | | | | B3 | | | $ | 752,497 | |
| | 256 | | | NASCAR Holdings, Inc, Term Loan B | | | 2.842% | | | | 1-Month LIBOR | | | | 2.750% | | | | 10/18/26 | | | | BB | | | | 254,505 | |
| | 1,130 | | | Virgin Media Bristol LLC, Term Loan Q | | | 3.343% | | | | 1-Month LIBOR | | | | 3.250% | | | | 1/31/29 | | | | BB+ | | | | 1,126,390 | |
| | 895 | | | William Morris Endeavor Entertainment, LLC, Term Loan, First Lien | | | 2.850% | | | | 1-Month LIBOR | | | | 2.750% | | | | 5/16/25 | | | | B | | | | 872,001 | |
| | 6,898 | | | Total Entertainment | | | | | | | | | | | | | | | | | | | | | | | 6,348,076 | |
| |
| | | | Equity Real Estate Investment Trust – 0.5% (0.3% of Total Investments) | |
| | | | | | | |
| | 881 | | | Realogy Group LLC, Term Loan A | | | 1.842% | | | | 1-Month LIBOR | | | | 1.750% | | | | 2/08/25 | | | | Ba1 | | | | 858,514 | |
| | 219 | | | Realogy Group LLC, Term Loan B | | | 3.000% | | | | 1-Month LIBOR | | | | 2.250% | | | | 2/08/25 | | | | Ba1 | | | | 218,692 | |
| | 1,100 | | | Total Equity Real Estate Investment Trust | | | | | | | | | | | | | | | | | | | | | | | 1,077,206 | |
| |
| | | | Food & Staples Retailing – 1.8% (1.1% of Total Investments) | |
| | | | | | | |
| | 336 | | | BJ’s Wholesale Club, Inc., Term Loan, First Lien | | | 2.100% | | | | 1-Month LIBOR | | | | 2.000% | | | | 2/03/24 | | | | BB+ | | | | 335,742 | |
| | 29 | | | H Food Holdings LLC, Incremental Term Loan B3 | | | 6.000% | | | | 1-Month LIBOR | | | | 5.000% | | | | 5/31/25 | | | | B2 | | | | 29,895 | |
| | 510 | | | H Food Holdings LLC, Term Loan B | | | 3.780% | | | | 1-Month LIBOR | | | | 3.688% | | | | 5/31/25 | | | | B2 | | | | 505,746 | |
| | 3,358 | | | US Foods, Inc., Term Loan B | | | 1.842% | | | | 1-Month LIBOR | | | | 1.750% | | | | 6/27/23 | | | | BB– | | | | 3,320,540 | |
| | 4,233 | | | Total Food & Staples Retailing | | | | | | | | | | | | | | | | | | | | | | | 4,191,923 | |
| |
| | | | Food Products – 0.5% (0.3% of Total Investments) | |
| | | | | | | |
| | 505 | | | American Seafoods Group LLC, Term Loan, First Lien | | | 3.750% | | | | 1-Month LIBOR | | | | 2.750% | | | | 8/21/23 | | | | BB– | | | | 504,357 | |
| | 4 | | | American Seafoods Group LLC, Term Loan, First Lien | | | 3.750% | | | | 3-Month LIBOR | | | | 2.750% | | | | 8/21/23 | | | | BB– | | | | 3,371 | |
| | 173 | | | Froneri International Ltd., Term Loan | | | 2.342% | | | | 1-Month LIBOR | | | | 2.250% | | | | 1/31/27 | | | | B+ | | | | 170,359 | |
| | 441 | | | UTZ Quality Foods, LLC, Term Loan B | | | 3.092% | | | | 1-Month LIBOR | | | | 3.000% | | | | 1/20/28 | | | | B1 | | | | 439,930 | |
| | 1,123 | | | Total Food Products | | | | | | | | | | | | | | | | | | | | | | | 1,118,017 | |
| |
| | | | Health Care Equipment & Supplies – 1.6% (1.0% of Total Investments) | |
| | | | | | | |
| | 1,472 | | | Carestream Health, Inc., Extended Term Loan | | | 7.750% | | | | 3-Month LIBOR | | | | 6.750% | | | | 5/08/23 | | | | B1 | | | | 1,481,910 | |
| | 451 | | | Greatbatch Ltd., Term Loan B | | | 3.500% | | | | 1-Month LIBOR | | | | 2.500% | | | | 10/27/22 | | | | B+ | | | | 451,105 | |
| | 426 | | | Lifescan Global Corporation, Term Loan, First Lien | | | 6.146% | | | | 3-Month LIBOR | | | | 6.000% | | | | 10/01/24 | | | | B | | | | 423,945 | |
| | 781 | | | Viant Medical Holdings, Inc., Term Loan, First Lien | | | 3.842% | | | | 1-Month LIBOR | | | | 3.750% | | | | 7/02/25 | | | | B3 | | | | 756,466 | |
| | 707 | | | Vyaire Medical, Inc., Term Loan B | | | 5.750% | | | | 3-Month LIBOR | | | | 4.750% | | | | 4/30/25 | | | | B3 | | | | 615,107 | |
| | 3,837 | | | Total Health Care Equipment & Supplies | | | | | | | | | | | | | | | | | | | | | | | 3,728,533 | |
| |
| | | | Health Care Providers & Services – 8.0% (5.0% of Total Investments) | |
| | | | | | | |
| | 740 | | | ADMI Corp., Term Loan B2 | | | 3.625% | | | | 1-Month LIBOR | | | | 3.125% | | | | 12/23/27 | | | | B | | | | 728,858 | |
| | 1,033 | | | AHP Health Partners, Inc., Term Loan | | | 4.750% | | | | 1-Month LIBOR | | | | 3.750% | | | | 6/30/25 | | | | B1 | | | | 1,035,845 | |
| | 206 | | | Air Methods Corporation, Term Loan B | | | 4.500% | | | | 3-Month LIBOR | | | | 3.500% | | | | 4/21/24 | | | | B | | | | 202,393 | |
| | 375 | | | Albany Molecular Research, Inc., Term Loan, First Lien | | | 4.250% | | | | 3-Month LIBOR | | | | 3.250% | | | | 8/30/24 | | | | B | | | | 375,730 | |
| | 837 | | | BW NHHC Holdco, Inc., Term Loan, First Lien | | | 5.155% | | | | 3-Month LIBOR | | | | 5.000% | | | | 5/15/25 | | | | Caa1 | | | | 768,453 | |
| | 337 | | | DaVita, Inc., Term Loan B | | | 1.842% | | | | 1-Month LIBOR | | | | 1.750% | | | | 8/12/26 | | | | BBB– | | | | 333,614 | |
| | 730 | | | Envision Healthcare Corporation, Term Loan, First Lien | | | 3.842% | | | | 1-Month LIBOR | | | | 3.750% | | | | 10/10/25 | | | | CCC+ | | | | 626,711 | |
| | 667 | | | Gates Global LLC, Term Loan B3 | | | 3.500% | | | | 1-Month LIBOR | | | | 2.750% | | | | 3/31/27 | | | | B+ | | | | 664,006 | |
| | 779 | | | Gentiva Health Services, Inc., Term Loan | | | 2.875% | | | | 1-Month LIBOR | | | | 2.750% | | | | 7/02/25 | | | | B+ | | | | 777,058 | |
| | 1,741 | | | Global Medical Response, Inc., Term Loan B | | | 5.750% | | | | 3-Month LIBOR | | | | 4.750% | | | | 10/02/25 | | | | B | | | | 1,746,065 | |
| | 50 | | | National Mentor Holdings, Inc., Delayed Draw Term Loan, (5) | | | 4.500% | | | | 3-Month LIBOR | | | | 3.750% | | | | 3/02/28 | | | | B1 | | | | 50,128 | |
| | 240 | | | National Mentor Holdings, Inc., Term Loan | | | 4.500% | | | | 1-Month LIBOR | | | | 3.750% | | | | 3/02/28 | | | | B1 | | | | 240,007 | |
| | 215 | | | National Mentor Holdings, Inc., Term Loan | | | 4.500% | | | | 3-Month LIBOR | | | | 3.750% | | | | 3/02/28 | | | | B1 | | | | 214,563 | |
| | 15 | | | National Mentor Holdings, Inc., Term Loan C | | | 4.500% | | | | 3-Month LIBOR | | | | 3.750% | | | | 3/02/28 | | | | B1 | | | | 15,190 | |
| | 985 | | | Onex TSG Intermediate Corp., Term Loan B | | | 5.500% | | | | 3-Month LIBOR | | | | 4.750% | | | | 2/26/28 | | | | B | | | | 994,358 | |
| | 1,071 | | | Phoenix Guarantor Inc, Term Loan B | | | 3.339% | | | | 1-Month LIBOR | | | | 3.250% | | | | 3/05/26 | | | | B1 | | | | 1,058,295 | |
| | 998 | | | Phoenix Guarantor Inc, Term Loan B3 | | | 3.596% | | | | 1-Month LIBOR | | | | 3.500% | | | | 3/05/26 | | | | B1 | | | | 988,059 | |
| | 103 | | | Quorum Health Corporation, Term Loan, (6) | | | 7.500% | | | | 3-Month LIBOR | | | | 6.500% | | | | 4/29/25 | | | | B– | | | | 104,042 | |
| | 2,553 | | | RegionalCare Hospital Partners Holdings, Inc., Term Loan B, (DD1) | | | 3.842% | | | | 1-Month LIBOR | | | | 3.750% | | | | 11/16/25 | | | | B1 | | | | 2,534,133 | |
| | 825 | | | Select Medical Corporation, Term Loan B | | | 2.350% | | | | 1-Month LIBOR | | | | 2.250% | | | | 3/06/25 | | | | Ba2 | | | | 815,031 | |
| | 2,361 | | | Surgery Center Holdings, Inc., Term Loan | | | 4.500% | | | | 1-Month LIBOR | | | | 3.750% | | | | 8/31/26 | | | | B1 | | | | 2,362,681 | |
| | 1,414 | | | Team Health Holdings, Inc., Term Loan, First Lien | | | 3.750% | | | | 1-Month LIBOR | | | | 2.750% | | | | 2/06/24 | | | | B | | | | 1,372,639 | |
27
| | |
| |
| NSL | | Nuveen Senior Income Fund (continued) |
| | Portfolio of Investments July 31, 2021 |
| | | | | | | | | | | | | | | | | | | | | | | | | | | | |
Principal
Amount (000) | | | Description (1) | | Coupon (2) | | | Reference
Rate (2) | | | Spread (2) | | | Maturity (3) | | | Ratings (4) | | | Value | |
| |
| | | | Health Care Providers & Services (continued) | |
| | | | | | | |
| $ | 746 | | | US Radiology Specialists, Inc., Term Loan | | | 6.250% | | | | 3-Month LIBOR | | | | 5.500% | | | | 12/15/27 | | | | B– | | | $ | 752,314 | |
| | 19,021 | | | Total Health Care Providers & Services | | | | | | | | | | | | | | | | | | | | | | | 18,760,173 | |
| |
| | | | Health Care Technology – 2.1% (1.3% of Total Investments) | |
| | | | | | | |
| | 1,053 | | | Carestream Health, Inc., Term Loan, Second Lien, (cash 5.500%, PIK 8.000%) | | | 8.000% | | | | 3-Month LIBOR | | | | 8.000% | | | | 8/05/23 | | | | CCC+ | | | | 1,033,630 | |
| | 78 | | | Change Healthcare Holdings LLC, Term Loan B | | | 3.500% | | | | 1-Month LIBOR | | | | 2.500% | | | | 3/01/24 | | | | B+ | | | | 77,746 | |
| | 2,616 | | | Change Healthcare Holdings LLC, Term Loan B | | | 3.500% | | | | 3-Month LIBOR | | | | 2.500% | | | | 3/01/24 | | | | B+ | | | | 2,614,811 | |
| | 1,133 | | | Zelis Healthcare Corporation, Term Loan | | | 3.601% | | | | 1-Month LIBOR | | | | 3.500% | | | | 9/30/26 | | | | B | | | | 1,128,350 | |
| | 4,880 | | | Total Health Care Technology | | | | | | | | | | | | | | | | | | | | | | | 4,854,537 | |
| |
| | | | Hotels, Restaurants & Leisure – 16.4% (10.4% of Total Investments) | |
| | | | | | | |
| | 7,300 | | | B.C. Unlimited Liability Company, Term Loan B4 | | | 1.842% | | | | 1-Month LIBOR | | | | 1.750% | | | | 11/19/26 | | | | BB+ | | | | 7,169,098 | |
| | 235 | | | 24 Hour Fitness Worldwide, Inc., Exit Term Loan, (cash 1.000%, PIK 5.000%) | | | 6.000% | | | | 3-Month LIBOR | | | | 5.000% | | | | 12/29/25 | | | | B3 | | | | 206,290 | |
| | 298 | | | Alterra Mountain Co, Term Loan | | | 5.500% | | | | 1-Month LIBOR | | | | 4.500% | | | | 8/01/26 | | | | B | | | | 296,808 | |
| | 555 | | | Aramark Services, Inc., Term Loan B3 | | | 1.842% | | | | 1-Month LIBOR | | | | 1.750% | | | | 3/11/25 | | | | BB+ | | | | 546,612 | |
| | 332 | | | Boyd Gaming Corporation, Term Loan B3 | | | 2.334% | | | | 1-Week LIBOR | | | | 2.250% | | | | 9/15/23 | | | | BB | | | | 331,230 | |
| | 744 | | | Caesars Resort Collection, LLC, Term Loan B1 | | | 4.592% | | | | 1-Month LIBOR | | | | 4.500% | | | | 7/20/25 | | | | B+ | | | | 746,020 | |
| | 3,173 | | | Caesars Resort Collection, LLC, Term Loan, First Lien B | | | 2.842% | | | | 1-Month LIBOR | | | | 2.750% | | | | 12/22/24 | | | | B+ | | | | 3,141,831 | |
| | 559 | | | Carnival Corporation, Term Loan B | | | 3.750% | | | | 1-Month LIBOR | | | | 3.000% | | | | 6/30/25 | | | | Ba2 | | | | 556,429 | |
| | 731 | | | Churchill Downs Incorporated, Incremental Term Loan B1 | | | 2.100% | | | | 1-Month LIBOR | | | | 2.000% | | | | 3/17/28 | | | | BBB– | | | | 723,484 | |
| | 2,113 | | | CityCenter Holdings, LLC, Term Loan B | | | 3.000% | | | | 1-Month LIBOR | | | | 2.250% | | | | 4/18/24 | | | | B+ | | | | 2,109,608 | |
| | 2,384 | | | ClubCorp Holdings, Inc., Term Loan B | | | 2.897% | | | | 3-Month LIBOR | | | | 2.750% | | | | 9/18/24 | | | | B– | | | | 2,259,757 | |
| | 367 | | | Crown Finance US, Inc., Term Loan B1, (cash 7.000%, PIK 8.250%) | | | 7.000% | | | | 3-Month LIBOR | | | | 7.000% | | | | 5/23/24 | | | | B– | | | | 457,475 | |
| | 1,588 | | | Equinox Holdings, Inc., Term Loan, First Lien | | | 4.000% | | | | 3-Month LIBOR | | | | 3.000% | | | | 3/08/24 | | | | CCC | | | | 1,475,613 | |
| | 478 | | | Four Seasons Hotels Limited, New Term Loan, First Lien | | | 2.092% | | | | 1-Month LIBOR | | | | 2.000% | | | | 11/30/23 | | | | BB+ | | | | 474,781 | |
| | 3,112 | | | Golden Nugget, Inc., Incremental Term Loan B | | | 3.250% | | | | 2-Month LIBOR | | | | 2.500% | | | | 10/04/23 | | | | B | | | | 3,086,311 | |
| | 500 | | | Hilton Grand Vacations Borrower LLC, Term Loan, (WI/DD) | | | TBD | | | | TBD | | | | TBD | | | | TBD | | | | Ba1 | | | | 498,875 | |
| | 1,530 | | | Hilton Worldwide Finance, LLC, Term Loan B2 | | | 1.839% | | | | 1-Month LIBOR | | | | 1.750% | | | | 6/21/26 | | | | BBB– | | | | 1,513,309 | |
| | 1,766 | | | IRB Holding Corp, Fourth Amendment Incremental Term Loan | | | 4.250% | | | | 3-Month LIBOR | | | | 3.250% | | | | 12/15/27 | | | | B | | | | 1,762,813 | |
| | 1,940 | | | Life Time Fitness Inc , Term Loan B | | | 5.750% | | | | 3-Month LIBOR | | | | 4.750% | | | | 12/15/24 | | | | B– | | | | 1,941,472 | |
| | 428 | | | PCI Gaming Authority, Term Loan | | | 2.592% | | | | 1-Month LIBOR | | | | 2.500% | | | | 5/31/26 | | | | BBB– | | | | 424,954 | |
| | 2,844 | | | Scientific Games International, Inc., Term Loan B5 | | | 2.842% | | | | 1-Month LIBOR | | | | 2.750% | | | | 8/14/24 | | | | B+ | | | | 2,805,887 | |
| | 1,194 | | | SeaWorld Parks & Entertainment, Inc., Term Loan B5 | | | 3.750% | | | | 1-Month LIBOR | | | | 3.000% | | | | 3/31/24 | | | | B2 | | | | 1,185,990 | |
| | 2,444 | | | Stars Group Holdings B.V. (The), Incremental Term Loan, (DD1) | | | 3.647% | | | | 3-Month LIBOR | | | | 3.500% | | | | 7/10/25 | | | | BBB | | | | 2,429,184 | |
| | 1,456 | | | Station Casinos LLC, Term Loan B | | | 3.250% | | | | 1-Month LIBOR | | | | 2.250% | | | | 2/08/27 | | | | BB– | | | | 1,434,359 | |
| | 973 | | | Wyndham Hotels & Resorts, Inc., Term Loan B | | | 1.842% | | | | 1-Month LIBOR | | | | 1.750% | | | | 5/30/25 | | | | BB+ | | | | 963,179 | |
| | 39,044 | | | Total Hotels, Restaurants & Leisure | | | | | | | | | | | | | | | | | | | | | | | 38,541,369 | |
| |
| | | | Household Durables–0.8% (0.5% of Total Investments) | |
| | | | | | | |
| | 509 | | | Apex Tool Group, LLC, Term Loan B | | | 6.500% | | | | 1-Month LIBOR | | | | 5.250% | | | | 8/21/24 | | | | B3 | | | | 510,895 | |
| | 300 | | | Osmosis Debt Merger Sub Inc, Term Loan, (WI/DD) | | | TBD | | | | TBD | | | | TBD | | | | TBD | | | | B3 | | | | 300,329 | |
| | 37 | | | Serta Simmons Bedding, LLC, Term Loan, (6) | | | 8.500% | | | | 1-Month LIBOR | | | | 7.500% | | | | 8/10/23 | | | | B | | | | 37,960 | |
| | 835 | | | Serta Simmons Bedding, LLC, Term Loan, (6) | | | 8.500% | | | | 1-Month LIBOR | | | | 7.500% | | | | 8/10/23 | | | | B– | | | | 795,236 | |
| | 50 | | | Weber-Stephen Products LLC, Term Loan B | | | 5.500% | | | | Prime | | | | 2.250% | | | | 10/30/27 | | | | B1 | | | | 49,946 | |
| | 199 | | | Weber-Stephen Products LLC, Term Loan B | | | 5.500% | | | | 1-Month LIBOR | | | | 2.250% | | | | 10/30/27 | | | | B1 | | | | 198,533 | |
| | 1,930 | | | Total Household Durables | | | | | | | | | | | | | | | | | | | | | | | 1,892,899 | |
| |
| | | | Household Products – 0.3% (0.2% of Total Investments) | |
| | | | | | | |
| | 430 | | | Illuminate Merger Sub Corp, Term Loan, (WI/DD) | | | TBD | | | | TBD | | | | TBD | | | | TBD | | | | B1 | | | | 427,448 | |
| | 389 | | | Reynolds Group Holdings, Inc., Term Loan | | | 2.842% | | | | 1-Month LIBOR | | | | 2.750% | | | | 2/05/23 | | | | B+ | | | | 388,363 | |
| | 819 | | | Total Household Products | | | | | | | | | | | | | | | | | | | | | | | 815,811 | |
28
| | | | | | | | | | | | | | | | | | | | | | | | | | | | |
Principal
Amount (000) | | | Description (1) | | Coupon (2) | | | Reference
Rate (2) | | | Spread (2) | | | Maturity (3) | | | Ratings (4) | | | Value | |
| |
| | | | Independent Power & Renewable Electricity Producers – 0.2% (0.1% of Total Investments) | |
| | | | | | | |
| $ | 490 | | | WIN Waste Innovations Holdings, Inc., Term Loan B | | | 3.250% | | | | 3-Month LIBOR | | | | 2.750% | | | | 3/25/28 | | | | B+ | | | $ | 488,649 | |
| | | | | | | |
| | | | Insurance – 3.6% (2.3% of Total Investments) | | | | | | | | | | | | | | | | | | |
| | | | | | | |
| | 2,084 | | | Acrisure, LLC, Term Loan B | | | 3.607% | | | | 2-Month LIBOR | | | | 3.500% | | | | 2/15/27 | | | | B | | | | 2,050,010 | |
| | 1,776 | | | Alliant Holdings Intermediate, LLC, Term Loan B | | | 3.342% | | | | 1-Month LIBOR | | | | 3.250% | | | | 5/10/25 | | | | B | | | | 1,755,677 | |
| | 249 | | | Alliant Holdings Intermediate, LLC, Term Loan B3 | | | 4.250% | | | | 1-Month LIBOR | | | | 3.750% | | | | 11/06/27 | | | | B | | | | 249,631 | |
| | 1,000 | | | Asurion LLC, Term Loan, (WI/DD) | | | TBD | | | | TBD | | | | TBD | | | | TBD | | | | B | | | | 996,560 | |
| | 269 | | | Asurion LLC, Term Loan B6 | | | 3.217% | | | | 1-Month LIBOR | | | | 3.125% | | | | 11/03/23 | | | | Ba3 | | | | 266,271 | |
| | 1,326 | | | Asurion LLC, Term Loan B8 | | | 3.342% | | | | 1-Month LIBOR | | | | 3.250% | | | | 12/23/26 | | | | Ba3 | | | | 1,302,737 | |
| | 1,609 | | | Hub International Limited, Term Loan B | | | 2.875% | | | | 3-Month LIBOR | | | | 2.750% | | | | 4/25/25 | | | | B | | | | 1,587,078 | |
| | 273 | | | Ryan Specialty Group, LLC, Term Loan | | | 3.750% | | | | 1-Month LIBOR | | | | 3.000% | | | | 9/01/27 | | | | BB– | | | | 272,341 | |
| | 8,586 | | | Total Insurance | | | | | | | | | | | | | | | | | | | | | | | 8,480,305 | |
| |
| | | | Interactive Media & Services – 1.8% (1.2% of Total Investments) | |
| | | | | | | |
| | 1,020 | | | Arches Buyer, Inc., Term Loan B | | | 3.750% | | | | 1-Month LIBOR | | | | 3.250% | | | | 12/06/27 | | | | B1 | | | | 1,015,133 | |
| | 85 | | | Mission Broadcasting, Inc., Term Loan B | | | 2.604% | | | | 1-Month LIBOR | | | | 2.500% | | | | 6/03/28 | | | | BBB– | | | | 84,309 | |
| | 2,242 | | | Rackspace Technology Global, Inc., Term Loan, (DD1) | | | 3.500% | | | | 3-Month LIBOR | | | | 2.750% | | | | 2/09/28 | | | | B+ | | | | 2,218,516 | |
| | 2 | | | WeddingWire, Inc., Term Loan, First Lien | | | 4.628% | | | | 2-Month LIBOR | | | | 4.500% | | | | 12/21/25 | | | | B+ | | | | 2,478 | |
| | 963 | | | WeddingWire, Inc., Term Loan, First Lien | | | 4.628% | | | | 3-Month LIBOR | | | | 4.500% | | | | 12/21/25 | | | | B+ | | | | 963,930 | |
| | 4,312 | | | Total Interactive Media & Services | | | | | | | | | | | | | | | | | | | | | | | 4,284,366 | |
| |
| | | | Internet & Direct Marketing Retail – 0.4% (0.3% of Total Investments) | |
| | | | | | | |
| | 998 | | | CNT Holdings I Corp, Term Loan | | | 4.500% | | | | 3-Month LIBOR | | | | 3.750% | | | | 11/08/27 | | | | B | | | | 996,722 | |
| |
| | | | Internet Software & Services –1.9% (1.2% of Total Investments) | |
| | | | | | | |
| | 907 | | | Banff Merger Sub Inc, Term Loan | | | 3.842% | | | | 1-Month LIBOR | | | | 3.750% | | | | 10/02/25 | | | | B2 | | | | 900,347 | |
| | 2,183 | | | Greeneden U.S. Holdings II, LLC, Term Loan B4 | | | 4.750% | | | | 1-Month LIBOR | | | | 4.000% | | | | 12/01/27 | | | | B– | | | | 2,188,469 | |
| | 1,453 | | | Uber Technologies, Inc., Term Loan B, First Lien | | | 3.592% | | | | 1-Month LIBOR | | | | 3.500% | | | | 4/04/25 | | | | B+ | | | | 1,450,074 | |
| | 4,543 | | | Total Internet Software & Services | | | | | | | | | | | | | | | | | | | | | | | 4,538,890 | |
| | | |
| | | | IT Services – 5.2% (3.3% of Total Investments) | | | | | | | |
| | | | | | | |
| | 963 | | | Ahead Data Blue, LLC, Term Loan B | | | 4.500% | | | | 3-Month LIBOR | | | | 3.750% | | | | 10/16/27 | | | | B+ | | | | 964,936 | |
| | 300 | | | DTI Holdco, Inc., Term Loan B | | | 5.750% | | | | 3-Month LIBOR | | | | 4.750% | | | | 9/30/23 | | | | CCC+ | | | | 291,631 | |
| | 1 | | | DTI Holdco, Inc., Term Loan B | | | 5.750% | | | | 2-Month LIBOR | | | | 4.750% | | | | 9/30/23 | | | | CCC+ | | | | 768 | |
| | 2,316 | | | Intrado Corporation, Term Loan | | | 5.000% | | | | 3-Month LIBOR | | | | 4.000% | | | | 10/10/24 | | | | BB– | | | | 2,263,069 | |
| | 642 | | | KBR, Inc., Term Loan B | | | 2.842% | | | | 1-Month LIBOR | | | | 2.750% | | | | 2/07/27 | | | | Ba1 | | | | 642,276 | |
| | 1,000 | | | Magenta Buyer LLC, Term Loan, (WI/DD) | | | TBD | | | | TBD | | | | TBD | | | | TBD | | | | BB– | | | | 996,565 | |
| | 451 | | | NeuStar, Inc., Term Loan B4 | | | 4.500% | | | | 3-Month LIBOR | | | | 3.500% | | | | 8/08/24 | | | | B+ | | | | 441,297 | |
| | 79 | | | NeuStar, Inc., Term Loan B5 | | | 5.500% | | | | 3-Month LIBOR | | | | 4.500% | | | | 8/08/24 | | | | B+ | | | | 77,292 | |
| | 249 | | | Project Ruby Ultimate Parent Corp., Term Loan | | | 4.000% | | | | 1-Month LIBOR | | | | 3.250% | | | | 3/10/28 | | | | B | | | | 248,354 | |
| | 1,070 | | | Sabre GLBL, Inc., Term Loan B | | | 2.092% | | | | 1-Month LIBOR | | | | 2.000% | | | | 2/22/24 | | | | Ba3 | | | | 1,047,292 | |
| | 418 | | | Science Applications International Corporation, Term Loan B | | | 1.967% | | | | 1-Month LIBOR | | | | 1.875% | | | | 10/31/25 | | | | BB+ | | | | 415,370 | |
| | 2,322 | | | Syniverse Holdings, Inc., Term Loan, First Lien | | | 6.000% | | | | 3-Month LIBOR | | | | 5.000% | | | | 3/09/23 | | | | CCC+ | | | | 2,298,168 | |
| | 1,526 | | | Syniverse Holdings, Inc., Term Loan, Second Lien | | | 10.000% | | | | 3-Month LIBOR | | | | 9.000% | | | | 3/11/24 | | | | CCC– | | | | 1,510,984 | |
| | 1,057 | | | Tempo Acquisition LLC, Extended Term Loan | | | 3.750% | | | | 1-Month LIBOR | | | | 3.250% | | | | 10/31/26 | | | | BB– | | | | 1,056,262 | |
| | 12,394 | | | Total IT Services | | | | | | | | | | | | | | | | | | | | | | | 12,254,264 | |
| |
| | | | Leisure Products – 0.3% (0.2% of Total Investments) | |
| | | | | | | |
| | 280 | | | Hayward Industries, Inc., Term Loan | | | 3.250% | | | | 1-Month LIBOR | | | | 2.750% | | | | 5/28/28 | | | | BB– | | | | 277,740 | |
| | 36 | | | SRAM, LLC , Term Loan B | | | 3.250% | | | | 1-Month LIBOR | | | | 2.750% | | | | 5/18/28 | | | | BB– | | | | 36,227 | |
| | 91 | | | SRAM, LLC , Term Loan B | | | 3.250% | | | | 3-Month LIBOR | | | | 2.750% | | | | 5/18/28 | | | | BB– | | | | 90,568 | |
| | 364 | | | SRAM, LLC , Term Loan B | | | 3.250% | | | | 6-Month LIBOR | | | | 2.750% | | | | 5/18/28 | | | | BB– | | | | 362,273 | |
| | 771 | | | Total Leisure Products | | | | | | | | | | | | | | | | | | | | | | | 766,808 | |
| |
| | | | Life Sciences Tools & Services – 4.1% (2.6% of Total Investments) | |
| | | | | | | |
| | 2,402 | | | ICON Luxembourg Sarl, Term Loan, (WI/DD) | | | TBD | | | | TBD | | | | TBD | | | | TBD | | | | BB+ | | | | 2,399,482 | |
| | 598 | | | Indigo Merger Sub Inc, Term Loan, (WI/DD) | | | TBD | | | | TBD | | | | TBD | | | | TBD | | | | BB+ | | | | 597,833 | |
| | 4,388 | | | Parexel International Corporation, Term Loan B | | | 2.842% | | | | 1-Month LIBOR | | | | 2.750% | | | | 9/27/24 | | | | B2 | | | | 4,379,545 | |
| | 2,250 | | | PPD, Inc., Initial Term Loan | | | 2.750% | | | | 1-Month LIBOR | | | | 2.250% | | | | 1/13/28 | | | | Ba2 | | | | 2,246,582 | |
| | 9,638 | | | Total Life Sciences Tools & Services | | | | | | | | | | | | | | | | | | | | | | | 9,623,442 | |
29
| | |
| |
| NSL | | Nuveen Senior Income Fund (continued) |
| | Portfolio of Investments July 31, 2021 |
| | | | | | | | | | | | | | | | | | | | | | | | | | | | |
Principal
Amount (000) | | | Description (1) | | Coupon (2) | | | Reference
Rate (2) | | | Spread (2) | | | Maturity (3) | | | Ratings (4) | | | Value | |
| |
| | | | Machinery – 1.6% (1.0% of Total Investments) | |
| | | | | | | |
| $ | 738 | | | Alliance Laundry Systems LLC, Term Loan B | | | 4.250% | | | | 3-Month LIBOR | | | | 3.500% | | | | 10/08/27 | | | | B | | | $ | 738,557 | |
| | 299 | | | Blount International, Inc., Term Loan B | | | 4.750% | | | | 1-Month LIBOR | | | | 3.750% | | | | 4/12/23 | | | | B2 | | | | 299,291 | |
| | 108 | | | Gardner Denver, Inc., Term Loan B | | | 2.842% | | | | 1-Month LIBOR | | | | 2.750% | | | | 1/31/27 | | | | BB+ | | | | 107,963 | |
| | 838 | | | Gardner Denver, Inc., Term Loan B2 | | | 1.842% | | | | 1-Month LIBOR | | | | 1.750% | | | | 2/28/27 | | | | BB+ | | | | 823,921 | |
| | 1,034 | | | Vertical Midco GmbH, Term Loan B, (DD1) | | | 4.404% | | | | 6-Month LIBOR | | | | 4.250% | | | | 7/31/27 | | | | B+ | | | | 1,033,490 | |
| | 741 | | | Vertiv Group Corporation, Term Loan B | | | 2.851% | | | | 1-Month LIBOR | | | | 2.750% | | | | 3/02/27 | | | | B+ | | | | 734,691 | |
| | 3,758 | | | Total Machinery | | | | | | | | | | | | | | | | | | | | | | | 3,737,913 | |
| |
| | | | Marine – 0.3% (0.2% of Total Investments) | |
| | | | | | | |
| | 1,056 | | | HGIM Corp., Exit Term Loan, (DD1) | | | 7.000% | | | | 3-Month LIBOR | | | | 6.000% | | | | 7/02/23 | | | | Caa3 | | | | 788,223 | |
| | | | | | | |
| | | | Media – 14.5% (9.2% of Total Investments) | | | | | | | | | | | | | | | | | | |
| | | | | | | |
| | 250 | | | Cable One, Inc., Term Loan B4 | | | 2.092% | | | | 1-Month LIBOR | | | | 2.000% | | | | 5/03/28 | | | | BB+ | | | | 247,438 | |
| | 2,683 | | | Charter Communications Operating, LLC, Term Loan B2 | | | 1.850% | | | | 1-Month LIBOR | | | | 1.750% | | | | 2/01/27 | | | | BBB– | | | | 2,655,644 | |
| | 196 | | | Checkout Holding Corp., First Out Term Loan | | | 8.500% | | | | 3-Month LIBOR | | | | 7.500% | | | | 2/15/23 | | | | N/R | | | | 189,720 | |
| | 335 | | | Checkout Holding Corp., Last Out Term Loan, (cash 2.000%, PIK 9.500%) | | | 2.000% | | | | 3-Month LIBOR | | | | 1.000% | | | | 8/15/23 | | | | N/R | | | | 185,916 | |
| | 3,344 | | | Clear Channel Outdoor Holdings, Inc., Term Loan B | | | 3.629% | | | | 3-Month LIBOR | | | | 3.500% | | | | 8/21/26 | | | | B1 | | | | 3,252,411 | |
| | 3,158 | | | CSC Holdings, LLC, Incremental Term Loan | | | 2.343% | | | | 1-Month LIBOR | | | | 2.250% | | | | 1/15/26 | | | | BB | | | | 3,108,371 | |
| | 1,187 | | | CSC Holdings, LLC, Term Loan B1 | | | 2.343% | | | | 1-Month LIBOR | | | | 2.250% | | | | 7/17/25 | | | | BB | | | | 1,171,049 | |
| | 2,857 | | | CSC Holdings, LLC, Term Loan B5 | | | 2.593% | | | | 1-Month LIBOR | | | | 2.500% | | | | 4/15/27 | | | | BB | | | | 2,825,561 | |
| | 223 | | | Cumulus Media New Holdings, Inc., Term Loan B | | | 4.750% | | | | 3-Month LIBOR | | | | 3.750% | | | | 3/31/26 | | | | B | | | | 222,906 | |
| | 769 | | | Diamond Sports Group, LLC, Term Loan | | | 3.350% | | | | 1-Month LIBOR | | | | 3.250% | | | | 8/24/26 | | | | CCC+ | | | | 425,246 | |
| | 2,347 | | | Directv Financing LLC, Term Loan, (WI/DD) | | | TBD | | | | TBD | | | | TBD | | | | TBD | | | | BBB– | | | | 2,345,252 | |
| | 489 | | | E.W. Scripps Company (The), Term Loan B2 | | | 3.313% | | | | 1-Month LIBOR | | | | 2.562% | | | | 5/01/26 | | | | BB | | | | 486,418 | |
| | 129 | | | Entercom Media Corp., Term Loan | | | 2.588% | | | | 3-Month LIBOR | | | | 2.500% | | | | 11/17/24 | | | | BB– | | | | 127,637 | |
| | 233 | | | GCI Holdings, Inc., Term Loan B | | | 3.500% | | | | 1-Month LIBOR | | | | 2.750% | | | | 10/15/25 | | | | Ba2 | | | | 233,230 | |
| | 415 | | | Gray Television, Inc., Term Loan B | | | 2.350% | | | | 1-Month LIBOR | | | | 2.250% | | | | 2/07/24 | | | | BB+ | | | | 412,415 | |
| | 5 | | | Houghton Mifflin Harcourt Publishers Inc, Term Loan B | | | 7.250% | | | | 1-Month LIBOR | | | | 6.250% | | | | 11/22/24 | | | | BB+ | | | | 4,512 | |
| | 2,248 | | | iHeartCommunications, Inc., Term Loan | | | 3.092% | | | | 1-Month LIBOR | | | | 3.000% | | | | 5/01/26 | | | | B+ | | | | 2,221,052 | |
| | 1,192 | | | Intelsat Jackson Holdings S.A., DIP Term Loan, (6) | | | 3.600% | | | | 3-Month LIBOR | | | | 3.600% | | | | 7/13/21 | | | | N/R | | | | 1,205,122 | |
| | 3,422 | | | Intelsat Jackson Holdings S.A., Term Loan B3, (6) | | | 8.000% | | | | Prime | | | | 4.750% | | | | 11/27/23 | | | | N/R | | | | 3,485,291 | |
| | 239 | | | LCPR Loan Financing LLC, Term Loan B | | | 3.843% | | | | 1-Month LIBOR | | | | 3.750% | | | | 10/15/28 | | | | BB+ | | | | 239,518 | |
| | 1,000 | | | Mav Acquisition Corp, Term Loan, (WI/DD) | | | TBD | | | | TBD | | | | TBD | | | | TBD | | | | B2 | | | | 991,000 | |
| | 287 | | | Meredith Corporation, Incremental Term Loan B | | | 5.250% | | | | 3-Month LIBOR | | | | 4.250% | | | | 1/31/25 | | | | BB– | | | | 293,501 | |
| | 1,405 | | | Meredith Corporation, Term Loan B2 | | | 2.592% | | | | 1-Month LIBOR | | | | 2.500% | | | | 1/31/25 | | | | BB– | | | | 1,397,147 | |
| | 1,130 | | | Nexstar Broadcasting, Inc., Term Loan B3 | | | 2.337% | | | | 3-Month LIBOR | | | | 2.250% | | | | 1/17/24 | | | | BBB– | | | | 1,124,071 | |
| | 453 | | | Sinclair Television Group, Inc., Term Loan B1 | | | 2.350% | | | | 1-Month LIBOR | | | | 2.250% | | | | 1/03/24 | | | | Ba2 | | | | 447,755 | |
| | 639 | | | Springer Nature Deutschland GmbH, Term Loan B18 | | | 3.750% | | | | 1-Month LIBOR | | | | 3.000% | | | | 8/14/26 | | | | B+ | | | | 638,229 | |
| | 312 | | | Virgin Media Bristol LLC, Term Loan N | | | 2.593% | | | | 1-Month LIBOR | | | | 2.500% | | | | 1/31/28 | | | | BB+ | | | | 307,581 | |
| | 909 | | | WideOpenWest Finance LLC, Term Loan B | | | 4.250% | | | | 1-Month LIBOR | | | | 3.250% | | | | 8/19/23 | | | | B | | | | 908,464 | |
| | 3,079 | | | Ziggo Financing Partnership, Term Loan I | | | 2.593% | | | | 1-Month LIBOR | | | | 2.500% | | | | 4/30/28 | | | | BB | | | | 3,032,205 | |
| | 34,935 | | | Total Media | | | | | | | | | | | | | | | | | | | | | | | 34,184,662 | |
| |
| | | | Multiline Retail – 0.7% (0.5% of Total Investments) | |
| | | | | | | |
| | 247 | | | Belk, Inc., Term Loan | | | 8.500% | | | | 6-Month LIBOR | | | | 7.500% | | | | 7/31/25 | | | | B– | | | | 248,627 | |
| | 1,088 | | | Belk, Inc., Term Loan, (cash 5.135%, PIK 8.000%) | | | 13.135% | | | | 3-Month LIBOR | | | | 13.000% | | | | 7/31/25 | | | | CCC– | | | | 832,081 | |
| | 648 | | | EG America LLC, Term Loan | | | 4.147% | | | | 3-Month LIBOR | | | | 4.000% | | | | 2/05/25 | | | | B– | | | | 644,697 | |
| | 1,983 | | | Total Multiline Retail | | | | | | | | | | | | | | | | | | | | | | | 1,725,405 | |
| |
| | | | Office Electronics – 0.1% (0.0% of Total Investments) | |
| | | | | | | |
| | 122 | | | Pitney Bowes, Inc., Term Loan B | | | 4.100% | | | | 1-Month LIBOR | | | | 4.000% | | | | 3/19/28 | | | | BBB- | | | | 122,200 | |
| |
| | | | Oil, Gas & Consumable Fuels – 3.1% (2.0% of Total Investments) | |
| | | | | | | |
| | 715 | | | BCP Renaissance Parent LLC, Term Loan B | | | 4.500% | | | | 3-Month LIBOR | | | | 3.500% | | | | 11/01/24 | | | | B+ | | | | 707,406 | |
| | 913 | | | Buckeye Partners, L.P., Term Loan B | | | 2.354% | | | | 1-Month LIBOR | | | | 2.250% | | | | 11/01/26 | | | | BBB– | | | | 905,842 | |
| | 200 | | | DT Midstream Inc, Term Loan, (WI/DD) | | | TBD | | | | TBD | | | | TBD | | | | TBD | | | | Baa2 | | | | 199,732 | |
| | 684 | | | Fieldwood Energy LLC, DIP Delayed Draw Term Loan, (5), (6) | | | 9.750% | | | | 1-Month LIBOR | | | | 8.750% | | | | 8/05/21 | | | | N/R | | | | 710,965 | |
| | 6,218 | | | Fieldwood Energy LLC, Exit Term Loan, First Lien, (DD1), (6) | | | 0.000% | | | | N/A | | | | N/A | | | | 4/11/22 | | | | N/R | | | | 3,356,772 | |
30
| | | | | | | | | | | | | | | | | | | | | | | | | | | | |
Principal
Amount (000) | | | Description (1) | | Coupon (2) | | | Reference
Rate (2) | | | Spread (2) | | | Maturity (3) | | | Ratings (4) | | | Value | |
| |
| | | | Oil, Gas & Consumable Fuels (continued) | |
| | | | | | | |
| $ | 2,186 | | | Fieldwood Energy LLC, Exit Term Loan, Second Lien, (6) | | | 0.000% | | | | N/A | | | | N/A | | | | 4/11/23 | | | | N/R | | | $ | 244,121 | |
| | 1,348 | | | Gulf Finance, LLC, Term Loan B | | | 6.250% | | | | 1-Month LIBOR | | | | 5.250% | | | | 8/25/23 | | | | CCC+ | | | | 1,134,727 | |
| | 12,264 | | | Total Oil, Gas & Consumable Fuels | | | | | | | | | | | | | | | | | | | | | | | 7,259,565 | |
| |
| | | | Paper & Forest Products – 1.0% (0.6% of Total Investments) | |
| | | | | | | |
| | 1,072 | | | Asplundh Tree Expert, LLC, Term Loan B | | | 1.842% | | | | 1-Month LIBOR | | | | 1.750% | | | | 9/04/27 | | | | BBB– | | | | 1,062,103 | |
| | 622 | | | Charter Next Generation Inc, Term Loan | | | 4.770% | | | | 1-Month LIBOR | | | | 3.750% | | | | 12/01/27 | | | | N/R | | | | 622,133 | |
| | 663 | | | Post Holdings, Inc., Term Loan B | | | 4.750% | | | | 1-Month LIBOR | | | | 4.000% | | | | 10/21/24 | | | | B+ | | | | 667,139 | |
| | 2,357 | | | Total Paper & Forest Products | | | | | | | | | | | | | | | | | | | | | | | 2,351,375 | |
| |
| | | | Personal Products – 1.9% (1.2% of Total Investments) | |
| | | | | | | |
| | 500 | | | Conair Holdings, LLC, Term Loan B | | | 4.250% | | | | 3-Month LIBOR | | | | 3.750% | | | | 5/17/28 | | | | B1 | | | | 499,297 | |
| | 81 | | | Coty, Inc., Term Loan B | | | 2.352% | | | | 1-Month LIBOR | | | | 2.250% | | | | 4/05/25 | | | | B | | | | 78,191 | |
| | 495 | | | Journey Personal Care Corp., Term Loan B | | | 5.000% | | | | 3-Month LIBOR | | | | 4.250% | | | | 3/01/28 | | | | B | | | | 496,393 | |
| | 1,454 | | | Kronos Acquisition Holdings, Inc., Term Loan B | | | 4.250% | | | | 3-Month LIBOR | | | | 3.750% | | | | 12/22/26 | | | | B2 | | | | 1,440,175 | |
| | 2,547 | | | Revlon Consumer Products Corporation, Term Loan B, (DD1), (7) | | | 4.250% | | | | 3-Month LIBOR | | | | 3.500% | | | | 9/07/23 | | | | CC | | | | 2,005,844 | |
| | 5,077 | | | Total Personal Products | | | | | | | | | | | | | | | | | | | | | | | 4,519,900 | |
| |
| | | | Pharmaceuticals – 6.2% (3.9% of Total Investments) | |
| | | | | | | |
| | 571 | | | Alphabet Holding Company, Inc., Term Loan, First Lien | | | 3.592% | | | | 1-Month LIBOR | | | | 3.500% | | | | 9/26/24 | | | | B2 | | | | 570,649 | |
| | 2,565 | | | Bausch Health Companies, Inc., Term Loan B, (DD1) | | | 3.092% | | | | 1-Month LIBOR | | | | 3.000% | | | | 6/02/25 | | | | BB | | | | 2,549,744 | |
| | 1,333 | | | Bausch Health Companies, Inc., Term Loan B | | | 2.842% | | | | 1-Month LIBOR | | | | 2.750% | | | | 11/27/25 | | | | BB | | | | 1,321,415 | |
| | 735 | | | Catalent Pharma Solutions, Inc., Term Loan B3 | | | 2.500% | | | | 1-Month LIBOR | | | | 2.000% | | | | 2/22/28 | | | | BBB– | | | | 737,238 | |
| | 474 | | | Elanco Animal Health Incorporated, Term Loan B | | | 1.850% | | | | 1-Month LIBOR | | | | 1.750% | | | | 8/01/27 | | | | Baa3 | | | | 466,465 | |
| | 734 | | | Endo Luxembourg Finance Company I S.a r.l., Term Loan | | | 5.750% | | | | 3-Month LIBOR | | | | 5.000% | | | | 3/25/28 | | | | B | | | | 718,702 | |
| | 807 | | | Gainwell Acquisition Corp., Term Loan B | | | 4.750% | | | | 3-Month LIBOR | | | | 4.000% | | | | 10/01/27 | | | | BB– | | | | 807,857 | |
| | 2,250 | | | Jazz Financing Lux S.a.r.l., Term Loan | | | 4.000% | | | | 1-Month LIBOR | | | | 3.500% | | | | 4/22/28 | | | | BB+ | | | | 2,255,625 | |
| | 2,972 | | | Mallinckrodt International Finance S.A., Term Loan B, (DD1), (6) | | | 6.000% | | | | 6-Month LIBOR | | | | 5.250% | | | | 9/24/24 | | | | D | | | | 2,897,417 | |
| | 757 | | | Mallinckrodt International Finance S.A., Term Loan B, (6) | | | 6.250% | | | | 1-Month LIBOR | | | | 5.500% | | | | 2/24/25 | | | | D | | | | 735,123 | |
| | 1,500 | | | Organon & Co, Term Loan | | | 3.500% | | | | 3-Month LIBOR | | | | 3.000% | | | | 6/02/28 | | | | BB | | | | 1,498,282 | |
| | 14,698 | | | Total Pharmaceuticals | | | | | | | | | | | | | | | | | | | | | | | 14,558,517 | |
| |
| | | | Professional Services – 2.2% (1.4% of Total Investments) | |
| | | | | | | |
| | 448 | | | ASGN Incorporated, Term Loan B3 | | | 1.842% | | | | 1-Month LIBOR | | | | 1.750% | | | | 4/02/25 | | | | BBB– | | | | 448,399 | |
| | 1,160 | | | Ceridian HCM Holding, Inc., Term Loan B | | | 2.584% | | | | 1-Week LIBOR | | | | 2.500% | | | | 4/30/25 | | | | B+ | | | | 1,141,336 | |
| | 493 | | | Creative Artists Agency, LLC , Term Loan B | | | 3.842% | | | | 1-Month LIBOR | | | | 3.750% | | | | 11/26/26 | | | | B | | | | 487,920 | |
| | 1,328 | | | Dun & Bradstreet Corporation (The), Term Loan | | | 3.336% | | | | 1-Month LIBOR | | | | 3.250% | | | | 2/08/26 | | | | BB+ | | | | 1,318,157 | |
| | 727 | | | EAB Global Inc, Term Loan, (WI/DD) | | | TBD | | | | TBD | | | | TBD | | | | TBD | | | | B– | | | | 723,226 | |
| | 299 | | | Nielsen Consumer, Inc., Term Loan B | | | 4.103% | | | | 1-Month LIBOR | | | | 4.000% | | | | 3/05/28 | | | | BB | | | | 299,277 | |
| | 713 | | | Nielsen Finance LLC, Term Loan B4 | | | 2.103% | | | | 1-Month LIBOR | | | | 2.000% | | | | 10/04/23 | | | | BBB– | | | | 712,176 | |
| | 5,168 | | | Total Professional Services | | | | | | | | | | | | | | | | | | | | | | | 5,130,491 | |
| |
| | | | Real Estate Management & Development – 1.3% (0.8% of Total Investments) | |
| | | | | | | |
| | 1,293 | | | Brookfield Property REIT, Inc., Term Loan A2 | | | 3.092% | | | | 1-Month LIBOR | | | | 3.000% | | | | 8/24/23 | | | | BB+ | | | | 1,283,491 | |
| | 1,741 | | | North American Lifting Holdings, Inc., Priority Term Loan | | | 7.500% | | | | 3-Month LIBOR | | | | 6.500% | | | | 10/16/24 | | | | B+ | | | | 1,821,783 | |
| | 3,034 | | | Total Real Estate Management & Development | | | | | | | | | | | | | | | | | | | | | | | 3,105,274 | |
| |
| | | | Road & Rail – 2.2% (1.4% of Total Investments) | |
| | | | | | | |
| | 1,002 | | | Avolon TLB Borrower 1 (US) LLC, Term Loan B3 | | | 2.500% | | | | 1-Month LIBOR | | | | 1.750% | | | | 1/15/25 | | | | Baa2 | | | | 998,066 | |
| | 1,234 | | | Genesee & Wyoming, Inc., Term Loan | | | 2.147% | | | | 3-Month LIBOR | | | | 2.000% | | | | 12/30/26 | | | | BB+ | | | | 1,224,500 | |
| | 947 | | | Hertz Corp, Term Loan, (WI/DD) | | | TBD | | | | TBD | | | | TBD | | | | TBD | | | | B+ | | | | 942,993 | |
| | 179 | | | Hertz Corp, Term Loan, (WI/DD) | | | TBD | | | | TBD | | | | TBD | | | | TBD | | | | BB– | | | | 177,709 | |
| | 828 | | | Hertz Corporation, (The), DIP Delayed Draw Term Loan, (5) | | | 8.250% | | | | 1-Month LIBOR | | | | 7.250% | | | | 12/31/21 | | | | N/R | | | | 831,753 | |
| | 37 | | | Savage Enterprises LLC, Term Loan B | | | 3.100% | | | | 1-Month LIBOR | | | | 3.000% | | | | 8/01/25 | | | | BB | | | | 36,859 | |
| | 1,083 | | | XPO Logistics, Inc., Term Loan B | | | 1.881% | | | | 3-Month LIBOR | | | | 1.750% | | | | 2/23/25 | | | | BBB– | | | | 1,075,071 | |
| | 5,310 | | | Total Road & Rail | | | | | | | | | | | | | | | | | | | | | | | 5,286,951 | |
31
| | |
| |
| NSL | | Nuveen Senior Income Fund (continued) |
| | Portfolio of Investments July 31, 2021 |
| | | | | | | | | | | | | | | | | | | | | | | | | | | | |
Principal
Amount (000) | | | Description (1) | | Coupon (2) | | | Reference
Rate (2) | | | Spread (2) | | | Maturity (3) | | | Ratings (4) | | | Value | |
| |
| | | | Semiconductors & Semiconductor Equipment – 0.6% (0.4% of Total Investments) | |
| | | | | | | |
| $ | 48 | | | Bright Bidco B.V., Term Loan B, (DD1) | | | 4.500% | | | | 3-Month LIBOR | | | | 3.500% | | | | 6/30/24 | | | | CCC | | | $ | 38,201 | |
| | 436 | | | CMC Materials, Inc., Term Loan B1 | | | 2.125% | | | | 1-Month LIBOR | | | | 2.000% | | | | 11/15/25 | | | | BBB– | | | | 434,767 | |
| | 1,051 | | | ON Semiconductor Corporation, Term Loan B | | | 2.092% | | | | 1-Month LIBOR | | | | 2.000% | | | | 9/19/26 | | | | Baa3 | | | | 1,041,762 | |
| | 1,535 | | | Total Semiconductors & Semiconductor Equipment | | | | | | | | | | | | | | | | | | | | | | | 1,514,730 | |
| |
| | | | Software – 12.1% (7.7% of Total Investments) | |
| | | | | | | |
| | 661 | | | Apttus Corporation, Term Loan | | | 5.000% | | | | 3-Month LIBOR | | | | 4.250% | | | | 5/06/28 | | | | BB | | | | 663,559 | |
| | 1,032 | | | Blackboard, Inc., Term Loan B5 | | | 7.000% | | | | 3-Month LIBOR | | | | 6.000% | | | | 6/30/24 | | | | B1 | | | | 1,039,878 | |
| | 549 | | | By Crown Parent, LLC, Term Loan B1 | | | 4.000% | | | | 1-Month LIBOR | | | | 3.000% | | | | 1/30/26 | | | | B1 | | | | 547,185 | |
| | 384 | | | Camelot U.S. Acquisition 1 Co., Term Loan B | | | 3.092% | | | | 1-Month LIBOR | | | | 3.000% | | | | 10/31/26 | | | | B1 | | | | 380,933 | |
| | 1,496 | | | Delta TopCo, Inc., Term Loan B | | | 4.500% | | | | 3-Month LIBOR | | | | 3.750% | | | | 12/01/27 | | | | B2 | | | | 1,497,499 | |
| | 383 | | | Dynatrace LLC, Term Loan, First Lien | | | 2.342% | | | | 1-Month LIBOR | | | | 2.250% | | | | 8/23/25 | | | | BB+ | | | | 381,672 | |
| | 2,321 | | | Epicor Software Corporation, Term Loan | | | 4.000% | | | | 1-Month LIBOR | | | | 3.250% | | | | 7/31/27 | | | | B2 | | | | 2,316,555 | |
| | 1,783 | | | Finastra USA, Inc., Term Loan, First Lien | | | 4.500% | | | | 6-Month LIBOR | | | | 3.500% | | | | 6/13/24 | | | | BB– | | | | 1,758,067 | |
| | 237 | | | Greenway Health, LLC, Term Loan, First Lien | | | 4.750% | | | | 3-Month LIBOR | | | | 3.750% | | | | 2/16/24 | | | | B– | | | | 227,119 | |
| | 1,067 | | | Informatica LLC,, Term Loan B | | | 3.342% | | | | 1-Month LIBOR | | | | 3.250% | | | | 2/14/27 | | | | B1 | | | | 1,057,373 | |
| | 434 | | | iQor US, Inc., Second Out Term Loan | | | 8.500% | | | | 3-Month LIBOR | | | | 7.500% | | | | 11/19/25 | | | | CCC+ | | | | 429,080 | |
| | 802 | | | MA FinanceCo., LLC, Term Loan B | | | 5.250% | | | | 3-Month LIBOR | | | | 4.250% | | | | 6/05/25 | | | | BB | | | | 807,143 | |
| | 769 | | | MA FinanceCo., LLC, Term Loan B3 | | | 2.842% | | | | 1-Month LIBOR | | | | 2.750% | | | | 6/21/24 | | | | BB | | | | 760,144 | |
| | 1,415 | | | McAfee, LLC, Term Loan B | | | 3.840% | | | | 1-Month LIBOR | | | | 3.750% | | | | 9/29/24 | | | | BB | | | | 1,415,741 | |
| | 300 | | | Mitchell International, Inc., Term Loan, Second Lien | | | 7.342% | | | | 1-Month LIBOR | | | | 7.250% | | | | 11/30/25 | | | | CCC | | | | 301,827 | |
| | 688 | | | Perforce Software, Inc., Term Loan B | | | 3.842% | | | | 1-Month LIBOR | | | | 3.750% | | | | 7/01/26 | | | | B2 | | | | 680,727 | |
| | 1,000 | | | Polaris Newco LLC, Term Loan B | | | 4.500% | | | | 6-Month LIBOR | | | | 4.000% | | | | 6/04/28 | | | | B2 | | | | 1,000,510 | |
| | 1,281 | | | Proofpoint Inc, Term Loan, (WI/DD) | | | TBD | | | | TBD | | | | TBD | | | | TBD | | | | BB– | | | | 1,270,112 | |
| | 835 | | | RealPage, Inc, Term Loan, First Lien | | | 3.750% | | | | 1-Month LIBOR | | | | 3.250% | | | | 4/22/28 | | | | B+ | | | | 830,984 | |
| | 5,194 | | | Seattle Spinco, Inc., Term Loan B3 | | | 2.842% | | | | 1-Month LIBOR | | | | 2.750% | | | | 6/21/24 | | | | BB | | | | 5,133,438 | |
| | 1,273 | | | Sophia, L.P., Term Loan, First Lien | | | 4.500% | | | | 3-Month LIBOR | | | | 3.750% | | | | 10/07/27 | | | | B | | | | 1,273,754 | |
| | 701 | | | SS&C European Holdings Sarl, Term Loan B4 | | | 1.842% | | | | 1-Month LIBOR | | | | 1.750% | | | | 4/16/25 | | | | BB+ | | | | 691,486 | |
| | 884 | | | SS&C Technologies, Inc., Term Loan B3 | | | 1.842% | | | | 1-Month LIBOR | | | | 1.750% | | | | 4/16/25 | | | | BB+ | | | | 872,885 | |
| | 657 | | | Tibco Software, Inc., Term Loan B3 | | | 3.850% | | | | 1-Month LIBOR | | | | 3.750% | | | | 7/03/26 | | | | B+ | | | | 652,238 | |
| | 765 | | | Ultimate Software Group Inc(The), Incremental Term Loan | | | 4.000% | | | | 3-Month LIBOR | | | | 3.250% | | | | 5/03/26 | | | | B1 | | | | 765,199 | |
| | 491 | | | Ultimate Software Group Inc(The), Term Loan B | | | 3.842% | | | | 1-Month LIBOR | | | | 3.750% | | | | 5/03/26 | | | | B1 | | | | 491,579 | |
| | 843 | | | ZoomInfo LLC, Term Loan B, (DD1) | | | 3.092% | | | | 1-Month LIBOR | | | | 3.000% | | | | 2/01/26 | | | | BB | | | | 843,309 | |
| | 421 | | | ZoomInfo LLC, Term Loan B, (DD1) | | | 3.092% | | | | 3-Month LIBOR | | | | 3.000% | | | | 2/01/26 | | | | BB | | | | 421,654 | |
| | 28,666 | | | Total Software | | | | | | | | | | | | | | | | | | | | | | | 28,511,650 | |
| |
| | | | Specialty Retail – 3.0% (1.9% of Total Investments) | |
| | | | | | | |
| | 374 | | | Academy, Ltd., Term Loan | | | 4.500% | | | | 1-Month LIBOR | | | | 3.750% | | | | 5/01/69 | | | | N/R | | | | 374,764 | |
| | 540 | | | Birkenstock US BidCo Inc, Term Loan, (WI/DD) | | | TBD | | | | TBD | | | | TBD | | | | TBD | | | | BB– | | | | 539,549 | |
| | 830 | | | Jo-Ann Stores, Inc., Term Loan B1 | | | 5.500% | | | | 3-Month LIBOR | | | | 4.750% | | | | 6/30/28 | | | | B | | | | 827,614 | |
| | 209 | | | LBM Acquisition LLC, Term Loan, (WI/DD) | | | TBD | | | | TBD | | | | TBD | | | | TBD | | | | B+ | | | | 206,231 | |
| | 104 | | | LBM Acquisition LLC, Term Loan, (WI/DD), (5) | | | TBD | | | | TBD | | | | TBD | | | | TBD | | | | B+ | | | | 103,116 | |
| | 632 | | | Mattress Firm Inc, Term Loan B | | | 6.250% | | | | 6-Month LIBOR | | | | 5.250% | | | | 11/25/27 | | | | B+ | | | | 644,123 | |
| | 4,000 | | | PetSmart, Inc., Term Loan B | | | 4.500% | | | | 6-Month LIBOR | | | | 3.750% | | | | 2/12/28 | | | | BB– | | | | 4,003,500 | |
| | 307 | | | Staples, Inc., Term Loan | | | 5.176% | | | | 3-Month LIBOR | | | | 5.000% | | | | 4/12/26 | | | | B | | | | 298,971 | |
| | 6,996 | | | Total Specialty Retail | | | | | | | | | | | | | | | | | | | | | | | 6,997,868 | |
| |
| | | | Technology Hardware, Storage & Peripherals – 2.5% (1.6% of Total Investments) | |
| | | | | | | |
| | 951 | | | Conduent Business Services, LLC, Term Loan A | | | 1.842% | | | | 1-Month LIBOR | | | | 1.750% | | | | 12/07/22 | | | | BB– | | | | 943,948 | |
| | 3,358 | | | Dell International LLC, Term Loan B | | | 2.000% | | | | 1-Month LIBOR | | | | 1.750% | | | | 9/19/25 | | | | BBB– | | | | 3,356,593 | |
| | 489 | | | NCR Corporation, Term Loan | | | 2.630% | | | | 3-Month LIBOR | | | | 2.500% | | | | 8/28/26 | | | | BB+ | | | | 479,586 | |
| | 748 | | | Peraton Corp., Term Loan B | | | 4.500% | | | | 1-Month LIBOR | | | | 3.750% | | | | 2/01/28 | | | | BB– | | | | 748,593 | |
| | 397 | | | Tech Data Corporation, Term Loan | | | 3.592% | | | | 1-Month LIBOR | | | | 3.500% | | | | 7/01/25 | | | | BBB– | | | | 397,786 | |
| | 5,943 | | | Total Technology Hardware, Storage & Peripherals | | | | | | | | | | | | | | | | | | | | | | | 5,926,506 | |
| |
| | | | Textiles, Apparel & Luxury Goods – 0.2% (0.1% of Total Investments) | |
| | | | | | | |
| | 410 | | | CBI Buyer, Inc., Term Loan | | | 3.750% | | | | 3-Month LIBOR | | | | 3.250% | | | | 1/06/28 | | | | B1 | | | | 407,284 | |
| |
| | | | Transportation Infrastructure – 0.2% (0.1% of Total Investments) | |
| | | | | | | |
| | 488 | | | Atlantic Aviation FBO, Inc., Term Loan B | | | 3.850% | | | | 1-Month LIBOR | | | | 3.750% | | | | 12/06/25 | | | | BB | | | | 485,825 | |
32
| | | | | | | | | | | | | | | | | | | | | | | | | | | | |
Principal
Amount (000) | | | Description (1) | | Coupon (2) | | | Reference
Rate (2) | | | Spread (2) | | | Maturity (3) | | | Ratings (4) | | | Value | |
| |
| | | | Wireless Telecommunication Services – 0.4% (0.3% of Total Investments) | |
| | | | | | | |
| $ | 233 | | | Altice Financing SA, Term Loan, First Lien | | | 2.900% | | | | 3-Month LIBOR | | | | 2.750% | | | | 1/31/26 | | | | B | | | $ | 228,523 | |
| | 750 | | | GOGO Intermediate Holdings LLC, Term Loan B | | | 4.500% | | | | 3-Month LIBOR | | | | 3.750% | | | | 4/30/28 | | | | B– | | | | 747,776 | |
| | 983 | | | Total Wireless Telecommunication Services | | | | 976,299 | |
| | 337,584 | | | Total Variable Rate Senior Loan Interests (cost $329,546,150) | | | | 327,236,420 | |
| | | | | | | |
Principal
Amount (000) | | | Description (1) | | | | | | | | Coupon | | | Maturity | | | Ratings (4) | | | Value | |
| |
| | | | CORPORATE BONDS – 11.0% (6.9% of Total Investments) | |
| |
| | | | Auto Components – 0.9% (0.6% of Total Investments) | |
| | | | | | | |
| $ | 1,105 | | | Adient Global Holdings Ltd, 144A | | | | | | | | | | | 4.875% | | | | 8/15/26 | | | | B | | | $ | 1,129,862 | |
| | 810 | | | Adient US LLC, 144A | | | | | | | | | | | 9.000% | | | | 4/15/25 | | | | BB– | | | | 885,492 | |
| | 1,915 | | | Total Auto Components | | | | | | | | | | | | | | | | | | | | | | | 2,015,354 | |
| | | | | | | |
| | | | Chemicals – 0.3% (0.2% of Total Investments) | | | | | | | | | | | | | | | | | | |
| | | | | | | |
| | 345 | | | Olin Corp, 144A | | | | | | | | | | | 9.500% | | | | 6/01/25 | | | | BB | | | | 430,819 | |
| | 250 | | | Rayonier AM Products Inc, 144A | | | | | | | | | | | 7.625% | | | | 1/15/26 | | | | B1 | | | | 256,875 | |
| | 595 | | | Total Chemicals | | | | | | | | | | | | | | | | | | | | | | | 687,694 | |
| |
| | | | Commercial Services & Supplies – 0.3% (0.2% of Total Investments) | |
| | | | | |
| | 750 | | | Prime Security Services Borrower LLC / Prime Finance Inc, 144A | | | | 3.375% | | | | 8/31/27 | | | | BB– | | | | 729,525 | |
| |
| | | | Communications Equipment – 0.5% (0.3% of Total Investments) | |
| | | | | | | |
| | 750 | | | CommScope Inc, 144A | | | | | | | | | | | 8.250% | | | | 3/01/27 | | | | B– | | | | 794,062 | |
| | 400 | | | CommScope Technologies LLC, 144A | | | | | | | | | | | 5.000% | | | | 3/15/27 | | | | B– | | | | 404,720 | |
| | 1,150 | | | Total Communications Equipment | | | | | | | | | | | | | | | | | | | | | | | 1,198,782 | |
| |
| | | | Diversified Telecommunication Services – 0.5% (0.3% of Total Investments) | |
| | | | | | | |
| | 750 | | | Avaya Inc, 144A | | | | | | | | | | | 6.125% | | | | 9/15/28 | | | | B+ | | | | 802,500 | |
| | 340 | | | Windstream Escrow LLC / Windstream Escrow Finance Corp, 144A | | | | | | | | 7.750% | | | | 8/15/28 | | | | BB | | | | 346,800 | |
| | 1,090 | | | Total Diversified Telecommunication Services | | | | | | | | | | | | | | | | | | | | | | | 1,149,300 | |
| |
| | | | Electric Utilities – 0.6% (0.4% of Total Investments) | |
| | | | | | | |
| | 1,735 | | | Bruce Mansfield Unit 1 2007 Pass-Through Trust, (6) | | | | | | | | | | | 6.850% | | | | 6/01/34 | | | | N/R | | | | 2,169 | |
| | 418 | | | Pacific Gas and Electric Co | | | | | | | | | | | 3.850% | | | | 11/15/23 | | | | BBB– | | | | 436,796 | |
| | 258 | | | Pacific Gas and Electric Co | | | | | | | | | | | 3.450% | | | | 7/01/25 | | | | BBB– | | | | 268,568 | |
| | 235 | | | Pacific Gas and Electric Co | | | | | | | | | | | 3.300% | | | | 12/01/27 | | | | BBB– | | | | 239,981 | |
| | 257 | | | Pacific Gas and Electric Co | | | | | | | | | | | 3.750% | | | | 7/01/28 | | | | BBB– | | | | 269,338 | |
| | 260 | | | Pacific Gas and Electric Co | | | | | | | | | | | 4.550% | | | | 7/01/30 | | | | BBB– | | | | 277,462 | |
| | 3,163 | | | Total Electric Utilities | | | | | | | | | | | | | | | | | | | | | | | 1,494,314 | |
| |
| | | | Energy Equipment & Services – 0.2% (0.1% of Total Investments) | |
| | | | | | | |
| | 388 | | | Bausch Health Cos Inc, 144A | | | | | | | | | | | 6.125% | | | | 4/15/25 | | | | B | | | | 396,002 | |
| |
| | | | Entertainment – 0.4% (0.2% of Total Investments) | |
| | | | | | | |
| | 810 | | | AMC Entertainment Holdings Inc, 144A | | | | | | | | | | | 10.500% | | | | 4/15/25 | | | | B– | | | | 861,192 | |
| |
| | | | Equity Real Estate Investment Trust – 0.7% (0.5% of Total Investments) | |
| | | | | |
| | 1,620 | | | Uniti Group LP / Uniti Fiber Holdings Inc / CSL Capital LLC, 144A | | | | 7.875% | | | | 2/15/25 | | | | B | | | | 1,725,300 | |
| |
| | | | Gas Utilities – 0.2% (0.1% of Total Investments) | |
| | | | | | |
| | 250 | | | NGL Energy Partners LP / NGL Energy Finance Corp | | | | | | | | 7.500% | | | | 11/01/23 | | | | CCC+ | | | | 238,125 | |
| | 250 | | | NGL Energy Partners LP / NGL Energy Finance Corp | | | | | | | | 6.125% | | | | 3/01/25 | | | | CCC+ | | | | 212,500 | |
| | 500 | | | Total Gas Utilities | | | | | | | | | | | | | | | | | | | | | | | 450,625 | |
| |
| | | | Health Care Providers & Services – 1.5% (1.0% of Total Investments) | |
| | | | | | | |
| | 770 | | | CHS/Community Health Systems Inc, 144A | | | | | | | | | | | 8.000% | | | | 3/15/26 | | | | B | | | | 825,532 | |
| | 150 | | | CHS/Community Health Systems Inc, 144A | | | | | | | | | | | 8.000% | | | | 12/15/27 | | | | B | | | | 165,902 | |
| | 65 | | | HCA Inc | | | | | | | | | | | 5.375% | | | | 2/01/25 | | | | Baa3 | | | | 73,671 | |
33
| | |
| |
| NSL | | Nuveen Senior Income Fund (continued) |
| | Portfolio of Investments July 31, 2021 |
| | | | | | | | | | | | | | | | | | | | | | | | | | | | |
Principal
Amount (000) | | | Description (1) | | | | | | | | Coupon | | | Maturity | | | Ratings (4) | | | Value | |
| |
| | | | Health Care Providers & Services (continued) | |
| | | | | | | |
| $ | 550 | | | Legacy LifePoint Health LLC, 144A | | | | | | | | | | | 4.375% | | | | 2/15/27 | | | | B1 | | | $ | 551,375 | |
| | 165 | | | Tenet Healthcare Corp | | | | | | | | | | | 4.625% | | | | 7/15/24 | | | | B+ | | | | 167,062 | |
| | 500 | | | Tenet Healthcare Corp, 144A | | | | | | | | | | | 7.500% | | | | 4/01/25 | | | | B+ | | | | 537,500 | |
| | 90 | | | Tenet Healthcare Corp, 144A | | | | | | | | | | | 6.250% | | | | 2/01/27 | | | | B1 | | | | 93,713 | |
| | 1,100 | | | Tenet Healthcare Corp, 144A | | | | | | | | | | | 6.125% | | | | 10/01/28 | | | | B | | | | 1,171,500 | |
| | 3,390 | | | Total Health Care Providers & Services | | | | | | | | | | | | | | | | | | | | | | | 3,586,255 | |
| |
| | | | Hotels, Restaurants & Leisure – 0.0% (0.0% of Total Investments) | |
| | | | | | | |
| | 40 | | | Carnival Corp, 144A | | | | | | | | | | | 11.500% | | | | 4/01/23 | | | | Ba2 | | | | 45,100 | |
| |
| | | | Household Durables – 0.1% (0.0% of Total Investments) | |
| | | | | | |
| | 115 | | | Kronos Acquisition Holdings Inc / KIK Custom Products Inc, 144A | | | | | | | | 5.000% | | | | 12/31/26 | | | | B2 | | | | 116,611 | |
| |
| | | | Media – 2.1% (1.4% of Total Investments) | |
| | | | | | |
| | 1,085 | | | Diamond Sports Group LLC / Diamond Sports Finance Co, 144A | | | | | | | | 5.375% | | | | 8/15/26 | | | | CCC+ | | | | 629,300 | |
| | 1,000 | | | Diamond Sports Group LLC / Diamond Sports Finance Co, 144A | | | | | | | | 6.625% | | | | 8/15/27 | | | | CCC– | | | | 396,250 | |
| | 1,190 | | | Houghton Mifflin Harcourt Publishers Inc, 144A | | | | | | | | | | | 9.000% | | | | 2/15/25 | | | | BB+ | | | | 1,267,350 | |
| | 2 | | | iHeartCommunications Inc | | | | | | | | | | | 6.375% | | | | 5/01/26 | | | | B+ | | | | 2,716 | |
| | 574 | | | iHeartCommunications Inc | | | | | | | | | | | 8.375% | | | | 5/01/27 | | | | CCC+ | | | | 610,234 | |
| | 1,380 | | | iHeartCommunications Inc, 144A | | | | | | | | | | | 5.250% | | | | 8/15/27 | | | | B+ | | | | 1,438,429 | |
| | 245 | | | Intelsat Luxembourg SA, (6) | | | | | | | | | | | 8.125% | | | | 6/01/23 | | | | N/R | | | | 6,737 | |
| | 635 | | | Univision Communications Inc, 144A | | | | | | | | | | | 9.500% | | | | 5/01/25 | | | | B | | | | 693,737 | |
| | 6,111 | | | Total Media | | | | | | | | | | | | | | | | | | | | | | | 5,044,753 | |
| |
| | | | Metals & Mining – 0.2% (0.1% of Total Investments) | |
| | | | | | | |
| | 485 | | | First Quantum Minerals Ltd, 144A | | | | | | | | | | | 6.875% | | | | 10/15/27 | | | | B | | | | 525,619 | |
| |
| | | | Oil, Gas & Consumable Fuels – 2.1% (1.3% of Total Investments) | |
| | | | | | | |
| | 500 | | | Baytex Energy Corp, 144A | | | | | | | | | | | 5.625% | | | | 6/01/24 | | | | B+ | | | | 498,750 | |
| | 1,715 | | | Citgo Holding Inc, 144A | | | | | | | | | | | 9.250% | | | | 8/01/24 | | | | B+ | | | | 1,710,447 | |
| | 595 | | | CITGO Petroleum Corp, 144A | | | | | | | | | | | 7.000% | | | | 6/15/25 | | | | BB | | | | 610,815 | |
| | 325 | | | Gulfport Energy Operating Corp, 144A | | | | | | | | | | | 8.000% | | | | 5/17/26 | | | | BB– | | | | 346,278 | |
| | 437 | | | NGL Energy Operating LLC / NGL Energy Finance Corp, 144A | | | | | | | | 7.500% | | | | 2/01/26 | | | | BB– | | | | 449,017 | |
| | 250 | | | NGL Energy Partners LP / NGL Energy Finance Corp | | | | | | | | 7.500% | | | | 4/15/26 | | | | CCC+ | | | | 210,653 | |
| | 525 | | | PBF Holding Co LLC / PBF Finance Corp, 144A | | | | | | | | | | | 9.250% | | | | 5/15/25 | | | | BB | | | | 480,375 | |
| | 1,125 | | | PBF Holding Co LLC / PBF Finance Corp | | | | | | | | | | | 6.000% | | | | 2/15/28 | | | | B+ | | | | 587,475 | |
| | 5,472 | | | Total Oil, Gas & Consumable Fuels | | | | | | | | | | | | | | | | | | | | | | | 4,893,810 | |
| |
| | | | Pharmaceuticals – 0.2% (0.1% of Total Investments) | |
| | | | | | |
| | 340 | | | Endo Dac / Endo Finance LLC / Endo Finco Inc, 144A | | | | | | | | 6.000% | | | | 6/30/28 | | | | CCC | | | | 229,500 | |
| | 134 | | | Par Pharmaceutical Inc, 144A | | | | | | | | | | | 7.500% | | | | 4/01/27 | | | | B | | | | 136,680 | |
| | 474 | | | Total Pharmaceuticals | | | | | | | | | | | | | | | | | | | | | | | 366,180 | |
| |
| | | | Specialty Retail – 0.2% (0.1% of Total Investments) | |
| | | | | | | |
| | 340 | | | Party City Holdings Inc, 144A | | | | | | | | | | | 8.750% | | | | 2/15/26 | | | | CCC+ | | | | 359,965 | |
| | 125 | | | PetSmart Inc / PetSmart Finance Corp, 144A | | | | | | | | | | | 7.750% | | | | 2/15/29 | | | | CCC+ | | | | 137,034 | |
| | 465 | | | Total Specialty Retail | | | | | | | | | | | | | | | | | | | | | | | 496,999 | |
| | 28,533 | | | Total Corporate Bonds (cost $25,435,294) | | | | | | | | | | | | | | | | | | | | | | | 25,783,415 | |
| | | | | | | |
| Shares | | | Description (1) | | | | | | | | | | | | | | | | | Value | |
| | |
| | | | COMMON STOCKS – 3.6% (2.3% of Total Investments) | | | | | |
| | |
| | | | Banks – 0.1% (0.1% of Total Investments) | | | | |
| | | | | | | |
| | 15,167 | | | iQor US Inc, (8), (9) | | | | | | | | | | | | | | | | | | | | | | $ | 204,754 | |
| | |
| | | | Communications Equipment – 0.1% (0.0% of Total Investments) | | | | |
| | | | | | | |
| | 9,071 | | | Windstream Services PE LLC, (8), (9) | | | | | | | | | | | | | | | | | | | | | | | 131,529 | |
| | | |
| | | | Construction & Engineering – 0.0% (0.0% of Total Investments) | | | | | | | |
| | | | | | | |
| | 2,122 | | | TNT Crane & Rigging Inc, (7), (9) | | | | | | | | | | | | | | | | | | | | | | | 2 | |
| | 1,197 | | | TNT Crane & Rigging Inc, (8), (9) | | | | | | | | | | | | | | | | | | | | | | | 21,322 | |
| | | | Total Construction & Engineering | | | | | | | | | | | | | | | | | | | | | | | 21,324 | |
34
| | | | | | | | | | | | | | | | | | | | | | | | | | | | |
Shares | | | Description (1) | | | | | | | | | | | | | | | | | Value | |
| | | |
| | | | Diversified Consumer Services – 0.1% (0.1% of Total Investments) | | | | | | | |
| | | | | | | |
| | 12,578 | | | Cengage Learning Holdings II Inc, (8), (9) | | | | | | | | | | | | | | | | | | | | | | $ | 268,075 | |
| | |
| | | | Diversified Telecommunication Services – 0.0% (0.0% of Total Investments) | | | | |
| | | | | | | |
| | 8,135 | | | Windstream Services PE LLC, (8), (9) | | | | | | | | | | | | | | | | | | | | | | | 118,470 | |
| | |
| | | | Electric Utilities – 0.6% (0.4% of Total Investments) | | | | |
| | | | | | | |
| | 37,457 | | | Energy Harbor Corp, (8), (9), (10) | | | | | | | | | | | | | | | | | | | | | | | 1,296,949 | |
| | | |
| | | | Energy Equipment & Services – 0.1% (0.0% of Total Investments) | | | | | | | |
| | | | | | | |
| | 40,007 | | | Transocean Ltd, (9) | | | | | | | | | | | | | | | | | | | | | | | 144,426 | |
| | 5,623 | | | Vantage Drilling International, (8), (9) | | | | | | | | | | | | | | | | | | | | | | | 21,086 | |
| | | | Total Energy Equipment & Services | | | | | | | | | | | | | | | | | | | | | | | 165,512 | |
| | |
| | | | Entertainment – 0.3% (0.2% of Total Investments) | | | | |
| | | | | | | |
| | 6,268 | | | Metro-Goldwyn-Mayer Inc, (8), (9) | | | | | | | | | | | | | | | | | | | | | | | 819,541 | |
| | |
| | | | Health Care Providers & Services – 0.0% (0.0% of Total Investments) | | | | |
| | | | | | | |
| | 35,750 | | | Millennium Health LLC, (7), (9) | | | | | | | | | | | | | | | | | | | | | | | 37,180 | |
| | 33,563 | | | Millennium Health LLC, (7), (9) | | | | | | | | | | | | | | | | | | | | | | | 31,549 | |
| | | | Total Health Care Providers & Services | | | | | | | | | | | | | | | | | | | | | | | 68,729 | |
| | |
| | | | Hotels, Restaurants & Leisure – 0.2% (0.1% of Total Investments) | | | | |
| | | | | | | |
| | 55,426 | | | 24 Hour Fitness Worldwide Inc, (8) | | | | | | | | | | | | | | | | | | | | | | | 145,493 | |
| | 116,526 | | | 24 Hour Fitness Worldwide Inc, (8), (9) | | | | | | | | | | | | | | | | | | | | | | | 233,052 | |
| | | | Total Hotels, Restaurants & Leisure | | | | | | | | | | | | | | | | | | | | | | | 378,545 | |
| | |
| | | | Internet & Direct Marketing Retail – 0.0% (0.0% of Total Investments) | | | | |
| | | | | | | |
| | 5,388 | | | Catalina Marketing Corp, (8), (9) | | | | | | | | | | | | | | | | | | | | | | | 16,164 | |
| | | |
| | | | Marine – 0.0% (0.0% of Total Investments) | | | | | | | |
| | | | | | | |
| | 430 | | | ACBL HLDG CORP, (8), (9) | | | | | | | | | | | | | | | | | | | | | | | 9,030 | |
| |
| | | | Media – 0.3% (0.2% of Total Investments) | |
| | | | | | | |
| | 241,352 | | | Clear Channel Outdoor Holdings Inc, (9) | | | | | | | | | | | | | | | | | | | | | | | 641,996 | |
| | 4 | | | Cumulus Media Inc, (9) | | | | | | | | | | | | | | | | | | | | | | | 47 | |
| | 775,233 | | | Hibu plc, (8), (9) | | | | | | | | | | | | | | | | | | | | | | | 5,427 | |
| | 14,825 | | | Tribune Co, (7), (9) | | | | | | | | | | | | | | | | | | | | | | | 15 | |
| | | | Total Media | | | | | | | | | | | | | | | | | | | | | | | 647,485 | |
| |
| | | | Multiline Retail – 0.0% (0.0% of Total Investments) | |
| | | | | | | |
| | 148 | | | Belk Inc, (8), (9) | | | | | | | | | | | | | | | | | | | | | | | 3,552 | |
| |
| | | | Oil, Gas & Consumable Fuels – 1.7% (1.1% of Total Investments) | |
| | | | | | | |
| | 73,362 | | | California Resources Corp, (9) | | | | | | | | | | | | | | | | | | | | | | | 2,062,206 | |
| | 47,903 | | | California Resources Corp, (9) | | | | | | | | | | | | | | | | | | | | | | | 1,346,553 | |
| | 12,452 | | | Whiting Petroleum Corp, (9) | | | | | | | | | | | | | | | | | | | | | | | 583,999 | |
| | | | Total Oil, Gas & Consumable Fuels | | | | | | | | | | | | | | | | | | | | | | | 3,992,758 | |
| |
| | | | Professional Services – 0.1% (0.1% of Total Investments) | |
| | | | | | | |
| | 48,297 | | | Skillsoft Corp, (7), (9) | | | | | | | | | | | | | | | | | | | | | | | 343,733 | |
| | | | Total Common Stocks (cost $14,655,113) | | | | | | | | | | | | | | | | | | | | | | | 8,486,150 | |
| | | | | | | |
| Shares | | | Description (1) | | | | | | | | | | | | | | | | | Value | |
| | | | | | | |
| | | | WARRANTS – 0.1% (0.1% of Total Investments) | | | | | | | | | | | | | | | | | | | | | | | | |
| |
| | | | Communications Equipment – 0.0% (0.0% of Total Investments) | |
| | | | | | | |
| | 11,806 | | | Avaya Holdings Corp, (8) | | | | | | | | | | | | | | | | | | | | | | $ | 76,031 | |
35
| | |
| |
| NSL | | Nuveen Senior Income Fund (continued) |
| | Portfolio of Investments July 31, 2021 |
| | | | | | | | | | | | | | | | | | | | | | | | | | | | |
Shares | | | Description (1) | | | | | | | | | | | | | | | | | Value | |
| |
| | | | Entertainment – 0.0% (0.0% of Total Investments) | |
| | | | | | | |
| | 102,295 | | | Cineworld Warrant, (8) | | | | | | | | | | | | | | | | | | | | | | $ | 40,100 | |
| |
| | | | Industrial Conglomerates – 0.0% (0.0% of Total Investments) | |
| | | | | | | |
| | 5,116 | | | American Commercial Barge Line LLC, (7) | | | | | | | | | | | | | | | | | | | | | | | 2,205 | |
| |
| | | | Marine – 0.1% (0.1% of Total Investments) | |
| | | | | | | |
| | 452 | | �� | ACBL HLDG CORP, (8) | | | | | | | | | | | | | | | | | | | | | | | 9,492 | |
| | 1,682 | | | ACBL HLDG CORP, (8) | | | | | | | | | | | | | | | | | | | | | | | 42,331 | |
| | 1,279 | | | ACBL HLDG CORP, (8) | | | | | | | | | | | | | | | | | | | | | | | 37,730 | |
| | 6,728 | | | American Commercial Barge Line LLC, (7) | | | | | | | | | | | | | | | | | | | | | | | 2,173 | |
| | | | | Total Marine | | | | | | | | | | | | | | | | | | | | | | | 91,726 | |
| |
| | | | Oil, Gas & Consumable Fuels – 0.0% (0.0% of Total Investments) | |
| | | | | | | |
| | 188 | | | California Resources Corp | | | | | | | | | | | | | | | | | | | | | | | 1,021 | |
| | | | Total Warrants (cost $1,204,857) | | | | | | | | | | | | | | | | | | | | | | | 211,083 | |
| | | | | | | |
| Shares | | | Description (1) | | | | | | | | Coupon | | | | | | Ratings (4) | | | Value | |
| |
| | | | CONVERTIBLE PREFERRED SECURITIES – 0.1% (0.0% of Total Investments) | |
| |
| | | | Marine – 0.1% (0.0% of Total Investments) | |
| | | | | | | |
| | 1,600 | | | ACBL HLDG CORP, (8), (9) | | | | | | | | | | | 0.000% | | | | | | | | N/R | | | $ | 40,267 | |
| | 1,821 | | | ACBL HLDG CORP, (8), (9) | | | | | | | | | | | 0.000% | | | | | | | | N/R | | | | 53,720 | |
| | | | Total Marine | | | | | | | | | | | | | | | | | | | | | | | 93,987 | |
| | | | Total Convertible Preferred Securities (cost $97,141) | | | | | | | | | | | | | | | | | | | | | | | 93,987 | |
| | | | | | | |
| Shares | | | Description (1) | | | | | | | | | | | | | | | | | Value | |
| |
| | | | COMMON STOCK RIGHTS – 0.0% (0.0% of Total Investments) | |
| |
| | | | Oil, Gas & Consumable Fuels – 0.0% (0.0% of Total Investments) | |
| | | | | | | |
| | 7,052 | | | Fieldwood Energy Inc, (8), (9) | | | | | | | | | | | | | | | | | | | | | | $ | 7 | |
| | 1,425 | | | Fieldwood Energy Inc, (8), (9) | | | | | | | | | | | | | | | | | | | | | | | 1 | |
| | | | Total Oil, Gas & Consumable Fuels | | | | | | | | | | | | | | | | | | | | | | | 8 | |
| | | | Total Common Stock Rights (cost $201,310) | | | | | | | | | | | | | | | | | | | | | | | 8 | |
| | | | Total Long-Term Investments (cost $371,139,865) | | | | | | | | | | | | | | | | | | | | | | | 361,811,063 | |
| | | | | | | |
| Shares | | | Description (1) | | | | | Coupon | | | | | | | | | | | | Value | |
| | |
| | | | SHORT-TERM INVESTMENTS – 4.4% (2.8% of Total Investments) | | | | | |
| | |
| | | | INVESTMENT COMPANIES – 4.4% (2.8% of Total Investments) | | | | |
| | | | | | | |
| | 10,416,772 | | | BlackRock Liquidity Funds T-Fund Portfolio | | | | | | | 0.005% (11) | | | | | | | | | | | | | | | $ | 10,416,772 | |
| | | | Total Short-Term Investments (cost $10,416,772) | | | | | | | | | | | | | | | | 10,416,772 | |
| | | | Total Investments (cost $381,556,637) – 158.3% | | | | | | | | | | | | | | | | | | | | | | | 372,227,835 | |
| | | | Borrowings – (40.1)% (12), (13) | | | | | | | | | | | | | | | | | | | | | | | (94,300,000 | ) |
| | | | Taxable Fund Preferred Shares, net of deferred offering costs – (16.8)% (14) | | | | | | | | (39,568,793 | ) |
| | | | Other Assets Less Liabilities – (1.4)% | | | | | | | | | | | | | | | | | | | | | | | (3,144,972 | ) |
| | | | Net Assets Applicable to Common Shares – 100% | | | | | | | | | | | | | | | $ | 235,214,070 | |
36
For Fund portfolio compliance purposes, the Fund’s industry classifications refer to any one or more of the industry sub-classifications used by one or more widely recognized market indexes or ratings group indexes, and/or as defined by Fund management. This definition may not apply for purposes of this report, which may combine industry sub-classifications into sectors for reporting ease.
| (1) | All percentages shown in the Portfolio of Investments are based on net assets applicable to common shares unless otherwise noted. |
| (2) | Senior loans generally pay interest at rates which are periodically adjusted by reference to a base short-term, floating lending rate (Reference Rate) plus an assigned fixed rate (Spread). These floating lending rates are generally (i) the lending rate referenced by the London Inter-Bank Offered Rate (“LIBOR”), or (ii) the prime rate offered by one or more major United States banks. Senior loans may be considered restricted in that the Fund ordinarily is contractually obligated to receive approval from the agent bank and/or borrower prior to the disposition of a senior loan. The rate shown is the coupon as of the end of the reporting period. |
| (3) | Senior Loans generally are subject to mandatory and/or optional prepayment. Because of these mandatory prepayment conditions and because there may be significant economic incentives for a borrower to prepay, prepayments of senior loans may occur. As a result, the actual remaining maturity of senior loans held may be substantially less than the stated maturities shown. |
| (4) | For financial reporting purposes, the ratings disclosed are the highest of Standard & Poor’s Group (“Standard & Poor’s”), Moody’s Investors Service, Inc. (“Moody’s”) or Fitch, Inc. (“Fitch”) rating. This treatment of split-rated securities may differ from that used for other purposes, such as for Fund investment policies. Ratings below BBB by Standard & Poor’s, Baa by Moody’s or BBB by Fitch are considered to be below investment grade. Holdings designated N/R are not rated by any of these national rating agencies. Ratings are not covered by the report of independent registered public accounting firm. |
| (5) | Investment, or portion of investment, represents an outstanding unfunded senior loan commitment. |
| (6) | Defaulted security. A security whose issuer has failed to fully pay principal and/or interest when due, or is under the protection of bankruptcy. |
| (7) | Investment valued at fair value using methods determined in good faith by, or at the discretion of, the Board. For fair value measurement disclosure purposes, investment classified as Level 3. |
| (8) | For fair value measurement disclosure purposes, investment classified as Level 2. |
| (9) | Non-income producing; issuer has not declared an ex-dividend date within the past twelve months. |
| (10) | Common Stock received as part of the bankruptcy settlements during February 2020 for Bruce Mansfield Unit 1 2007 Pass-Through Trust. |
| (11) | The rate shown is the annualized seven-day subsidized yield as of end of the reporting period. |
| (12) | Borrowings as a percentage of Total Investments is 25.3%. |
| (13) | The Fund segregates 100% of its eligible investments (excluding any investments separately pledged as collateral for specific investments in derivatives, when applicable) in the Portfolio of Investments as collateral for borrowings. |
| (14) | Taxable Fund Preferred Shares, net of deferred offering costs as a percentage of Total Investments is 10.6%. |
| 144A | Investment is exempt from registration under Rule 144A of the Securities Act of 1933, as amended. These investments may only be resold in transactions exempt from registration, which are normally those transactions with qualified institutional buyers. |
| DD1 | Portion of investment purchased on a delayed delivery basis. |
| LIBOR | London Inter-Bank Offered Rate |
| PIK | Payment-in-kind (“PIK”) security. Depending on the terms of the security, income may be received in the form of cash, securities, or a combination of both. The PIK rate shown, where applicable, represents the annualized rate of the last PIK payment made by the issuer as of the end of the reporting period. |
| REIT | Real Estate Investment Trust |
| TBD | Senior loan purchased on a when-issued or delayed-delivery basis. Certain details associated with this purchase are not known prior to the settlement date of the transaction. In addition, senior loans typically trade without accrued interest and therefore a coupon rate is not available prior to settlement. At settlement, if still unknown, the borrower or counterparty will provide the Fund with the final coupon rate and maturity date. |
| WI/DD | Purchased on a when-issued or delayed delivery basis. |
See accompanying notes to financial statements.
37
| | |
| JFR | | Nuveen Floating Rate Income Fund Portfolio of Investments July 31, 2021 |
| | | | | | | | | | | | | | | | | | | | | | | | | | | | |
Principal
Amount (000) | | | Description (1) | | Coupon (2) | | | Reference
Rate (2) | | | Spread (2) | | | Maturity (3) | | | Ratings (4) | | | Value | |
| | | | | |
| | | | LONG-TERM INVESTMENTS – 155.4% (95.8% of Total Investments) | | | | | | | | | | | | | | | | | |
| | |
| | | | VARIABLE RATE SENIOR LOAN INTERESTS – 138.1% (85.2% of Total Investments) (2) | | | | | |
| | | | | |
| | | | Aerospace & Defense – 1.4% (0.9% of Total Investments) | | | | | | | | | | | | | |
| | | | | | | |
| $ | 774 | | | Dynasty Acquisition Co., Inc., Term Loan B1 | | | 3.647% | | | | 3-Month LIBOR | | | | 3.500% | | | | 4/08/26 | | | | B– | | | $ | 750,078 | |
| | 416 | | | Dynasty Acquisition Co., Inc., Term Loan B2 | | | 3.647% | | | | 3-Month LIBOR | | | | 3.500% | | | | 4/08/26 | | | | B– | | | | 403,268 | |
| | 1,829 | | | Maxar Technologies Ltd., Term Loan B | | | 2.850% | | | | 1-Month LIBOR | | | | 2.750% | | | | 10/05/24 | | | | B | | | | 1,812,789 | |
| | 1,451 | | | TransDigm, Inc., Term Loan E | | | 2.342% | | | | 1-Month LIBOR | | | | 2.250% | | | | 5/30/25 | | | | Ba3 | | | | 1,426,978 | |
| | 1,739 | | | TransDigm, Inc., Term Loan F | | | 2.342% | | | | 1-Month LIBOR | | | | 2.250% | | | | 12/09/25 | | | | Ba3 | | | | 1,710,474 | |
| | 2,211 | | | TransDigm, Inc., Term Loan G | | | 2.342% | | | | 1-Month LIBOR | | | | 2.250% | | | | 8/22/24 | | | | Ba3 | | | | 2,179,914 | |
| | 8,420 | | | Total Aerospace & Defense | | | | | | | | | | | | | | | | | | | | | | | 8,283,501 | |
| | | | | |
| | | | Airlines – 2.0% (1.2% of Total Investments) | | | | | | | | | | | | | |
| | | | | | | |
| | 2,304 | | | AAdvantage Loyalty IP Ltd., Term Loan | | | 5.500% | | | | 3-Month LIBOR | | | | 4.750% | | | | 4/20/28 | | | | Ba2 | | | | 2,372,397 | |
| | 423 | | | American Airlines, Inc., Incremental Term Loan | | | 2.093% | | | | 1-Month LIBOR | | | | 2.000% | | | | 12/14/23 | | | | Ba3 | | | | 414,322 | |
| | 1,558 | | | American Airlines, Inc., Term Loan, First Lien | | | 1.840% | | | | 1-Month LIBOR | | | | 1.750% | | | | 1/29/27 | | | | Ba3 | | | | 1,449,248 | |
| | 1,713 | | | Kestrel Bidco, Inc., Term Loan B | | | 4.000% | | | | 6-Month LIBOR | | | | 3.000% | | | | 12/11/26 | | | | BB– | | | | 1,658,363 | |
| | 2,675 | | | SkyMiles IP Ltd., Term Loan B | | | 4.750% | | | | 3-Month LIBOR | | | | 3.750% | | | | 10/20/27 | | | | Baa1 | | | | 2,829,561 | |
| | 2,993 | | | United Airlines, Inc., Term Loan B | | | 4.500% | | | | 1-Month LIBOR | | | | 3.750% | | | | 4/21/28 | | | | Ba1 | | | | 3,001,672 | |
| | 11,666 | | | Total Airlines | | | | | | | | | | | | | | | | | | | | | | | 11,725,563 | |
| | | | | |
| | | | Auto Components – 1.5% (0.9% of Total Investments) | | | | | | | | | | | | | |
| | | | | | | |
| | 826 | | | Adient US LLC, Term Loan B | | | 3.592% | | | | 1-Month LIBOR | | | | 3.500% | | | | 4/08/28 | | | | BB– | | | | 825,883 | |
| | 3,180 | | | Clarios Global LP, Term Loan B | | | 3.342% | | | | 1-Month LIBOR | | | | 3.250% | | | | 4/30/26 | | | | B1 | | | | 3,160,413 | |
| | 1,376 | | | DexKo Global Inc., Term Loan | | | 4.500% | | | | 1-Month LIBOR | | | | 3.500% | | | | 7/24/24 | | | | B1 | | | | 1,376,023 | |
| | 1,741 | | | Les Schwab Tire Centers, Term Loan B | | | 4.000% | | | | 6-Month LIBOR | | | | 3.250% | | | | 11/02/27 | | | | B | | | | 1,742,704 | |
| | 1,796 | | | Superior Industries International, Inc., Term Loan B, First Lien | | | 4.092% | | | | 1-Month LIBOR | | | | 4.000% | | | | 5/23/24 | | | | Ba3 | | | | 1,797,042 | |
| | 8,919 | | | Total Auto Components | | | | | | | | | | | | | | | | | | | | | | | 8,902,065 | |
| | | | | |
| | | | Automobiles – 0.2% (0.1% of Total Investments) | | | | | | | | | | | | | |
| | | | | | | |
| | 1,036 | | | Wand NewCo 3, Inc., Term Loan | | | 3.092% | | | | 1-Month LIBOR | | | | 3.000% | | | | 2/05/26 | | | | B1 | | | | 1,023,514 | |
| | | | | |
| | | | Banks – 0.1% (0.0% of Total Investments) | | | | | | | | | | | | | |
| | | | | | | |
| | 314 | | | iQor US, Inc., Exit Term Loan | | | 7.589% | | | | 1-Month LIBOR | | | | 7.500% | | | | 9/15/27 | | | | N/R | | | | 322,343 | |
| |
| | | | Beverages – 1.0% (0.6% of Total Investments) | |
| | | | | | | |
| | 1,552 | | | Arterra Wines Canada, Inc., Term Loan | | | 4.250% | | | | 3-Month LIBOR | | | | 3.500% | | | | 11/25/27 | | | | B1 | | | | 1,552,200 | |
| | 1,180 | | | City Brewing Company, LLC, Term Loan | | | 4.250% | | | | 3-Month LIBOR | | | | 3.500% | | | | 4/05/28 | | | | B+ | | | | 1,174,837 | |
| | 2,982 | | | Triton Water Holdings, Inc, Term Loan | | | 4.000% | | | | 3-Month LIBOR | | | | 3.500% | | | | 3/31/28 | | | | B1 | | | | 2,962,820 | |
| | 5,714 | | | Total Beverages | | | | | | | | | | | | | | | | | | | | | | | 5,689,857 | |
| | | | | |
| | | | Biotechnology – 0.6% (0.4% of Total Investments) | | | | | | | | | | | | | |
| | | | | | | |
| | 3,736 | | | Grifols Worldwide Operations USA, Inc., Term Loan B | | | 2.084% | | | | 1-Week LIBOR | | | | 2.000% | | | | 11/15/27 | | | | BB+ | | | | 3,691,017 | |
| | | | | |
| | | | Building Products – 2.1% (1.3% of Total Investments) | | | | | | | | | | | | | |
| | | | | | | |
| | 700 | | | All-Star Bidco AB, Term Loan, (WI/DD) | | | TBD | | | | TBD | | | | TBD | | | | TBD | | | | N/R | | | | 699,125 | |
| | 2,283 | | | Cornerstone Building Brands, Inc., Term Loan B | | | 3.750% | | | | 1-Month LIBOR | | | | 3.250% | | | | 4/12/28 | | | | B+ | | | | 2,282,089 | |
| | 260 | | | LBM Acquisition LLC, Term Loan, (WI/DD) | | | TBD | | | | TBD | | | | TBD | | | | TBD | | | | B+ | | | | 257,969 | |
| | 1,167 | | | LBM Acquisition LLC, Term Loan B | | | 4.500% | | | | 3-Month LIBOR | | | | 3.750% | | | | 12/17/27 | | | | B+ | | | | 1,157,960 | |
| | 389 | | | Potters Industries, LLC, Term Loan B | | | 4.750% | | | | 3-Month LIBOR | | | | 4.000% | | | | 12/14/27 | | | | B | | | | 390,243 | |
| | 6,374 | | | Quikrete Holdings, Inc., Term Loan, First Lien | | | 2.592% | | | | 1-Month LIBOR | | | | 2.500% | | | | 1/31/27 | | | | BB– | | | | 6,303,126 | |
| | 1,071 | | | Resideo Funding, Inc., Term Loan | | | 2.750% | | | | 3-Month LIBOR | | | | 2.250% | | | | 2/12/28 | | | | BBB– | | | | 1,067,905 | |
| | 405 | | | Resideo Funding, Inc., Term Loan | | | 2.750% | | | | 1-Month LIBOR | | | | 2.250% | | | | 2/12/28 | | | | BBB– | | | | 403,789 | |
| | 12,649 | | | Total Building Products | | | | | | | | | | | | | | | | | | | | | | | 12,562,206 | |
| | | | | |
| | | | Capital Markets – 1.3% (0.8% of Total Investments) | | | | | | | | | | | | | |
| | | | | | | |
| | 28 | | | Klockner-Pentaplast of America, Inc., Term Loan B | | | 5.250% | | | | 3-Month LIBOR | | | | 4.750% | | | | 2/09/26 | | | | B | | | | 28,012 | |
| | 711 | | | RPI Intermediate Finance Trust, Term Loan B1 | | | 1.842% | | | | 1-Month LIBOR | | | | 1.750% | | | | 2/11/27 | | | | BBB– | | | | 709,098 | |
38
| | | | | | | | | | | | | | | | | | | | | | | | | | | | |
Principal
Amount (000) | | | Description (1) | | Coupon (2) | | | Reference
Rate (2) | | | Spread (2) | | | Maturity (3) | | | Ratings (4) | | | Value | |
| | | | | |
| | | | Capital Markets (continued) | | | | | | | | | | | | | |
| | | | | | | |
| $ | 5,399 | | | Sequa Mezzanine Holdings L.L.C., Extended Term Loan, (cash 6.750%, PIK 1.000%) | | | 7.750% | | | | 3-Month LIBOR | | | | 6.750% | | | | 7/31/23 | | | | B– | | | $ | 5,477,792 | |
| | 1,495 | | | Sequa Mezzanine Holdings L.L.C., Term Loan, Second Lien, (cash 5.000%, PIK 6.750%) | | | 11.750% | | | | 3-Month LIBOR | | | | 10.750% | | | | 7/31/24 | | | | CCC– | | | | 1,475,081 | |
| | 7,633 | | | Total Capital Markets | | | | | | | | | | | | | | | | | | | | | | | 7,689,983 | |
| | | | | |
| | | | Chemicals – 1.0% (0.6% of Total Investments) | | | | | | | | | | | | | |
| | | | | | | |
| | 809 | | | ASP Unifrax Holdings, Inc., Term Loan B | | | 3.897% | | | | 3-Month LIBOR | | | | 3.750% | | | | 12/14/25 | | | | B– | | | | 795,636 | |
| | 932 | | | Atotech B.V., Term Loan B | | | 3.000% | | | | 3-Month LIBOR | | | | 2.500% | | | | 3/18/28 | | | | B+ | | | | 928,808 | |
| | 1,300 | | | INEOS Styrolution US Holding LLC, Term Loan B | | | 3.250% | | | | 1-Month LIBOR | | | | 2.750% | | | | 1/29/26 | | | | BB+ | | | | 1,298,050 | |
| | 1,175 | | | Ineos US Finance LLC, Term Loan B | | | 2.107% | | | | 2-Month LIBOR | | | | 2.000% | | | | 3/31/24 | | | | BBB– | | | | 1,160,549 | |
| | 999 | | | Lonza Group AG, Term Loan B | | | 4.750% | | | | 3-Month LIBOR | | | | 4.000% | | | | 5/14/28 | | | | B2 | | | | 1,000,249 | |
| | 443 | | | Sparta US HoldCo LLC, Term Loan, (WI/DD) | | | TBD | | | | TBD | | | | TBD | | | | TBD | | | | B+ | | | | 443,461 | |
| | 5,658 | | | Total Chemicals | | | | | | | | | | | | | | | | | | | | | | | 5,626,753 | |
| | | | | |
| | | | Commercial Services & Supplies–5.1% (3.2% of Total Investments) | | | | | | | | | | | | | |
| | | | | | | |
| | 997 | | | Amentum Government Services Holdings LLC, Term Loan B | | | 5.500% | | | | 3-Month LIBOR | | | | 4.750% | | | | 1/31/27 | | | | B1 | | | | 1,001,241 | |
| | 1,085 | | | Brand Energy & Infrastructure Services, Inc., Term Loan | | | 5.250% | | | | 3-Month LIBOR | | | | 4.250% | | | | 6/21/24 | | | | B– | | | | 1,066,737 | |
| | 10,213 | | | Delta 2 (LUX) S.a.r.l., Term Loan | | | 3.500% | | | | 1-Month LIBOR | | | | 2.500% | | | | 2/01/24 | | | | B+ | | | | 10,153,014 | |
| | 1,058 | | | Garda World Security Corporation, Term Loan B | | | 4.340% | | | | 1-Month LIBOR | | | | 4.250% | | | | 10/30/26 | | | | BB+ | | | | 1,058,081 | |
| | 2,380 | | | GFL Environmental, Inc., Term Loan | | | 3.500% | | | | 3-Month LIBOR | | | | 3.000% | | | | 5/30/25 | | | | BB– | | | | 2,381,449 | |
| | 1,000 | | | Herman Miller Inc, Term Loan, (WI/DD) | | | TBD | | | | TBD | | | | TBD | | | | TBD | | | | BBB– | | | | 997,030 | |
| | 413 | | | KAR Auction Services, Inc., Term Loan B6 | | | 2.375% | | | | 1-Month LIBOR | | | | 2.250% | | | | 9/19/26 | | | | Ba3 | | | | 407,474 | |
| | 1,000 | | | Madison IAQ LLC, Term Loan | | | 3.750% | | | | 3-Month LIBOR | | | | 3.250% | | | | 6/21/28 | | | | B1 | | | | 992,765 | |
| | 1,013 | | | PAE Holding Corporation, Term Loan B | | | 5.250% | | | | 1-Month LIBOR | | | | 4.500% | | | | 10/19/27 | | | | B | | | | 1,016,887 | |
| | 359 | | | Prime Security Services Borrower, LLC, Term Loan | | | 3.500% | | | | 1-Month LIBOR | | | | 2.750% | | | | 9/23/26 | | | | BB– | | | | 357,180 | |
| | 464 | | | Prime Security Services Borrower, LLC, Term Loan | | | 3.500% | | | | 3-Month LIBOR | | | | 2.750% | | | | 9/23/26 | | | | BB– | | | | 462,697 | |
| | 464 | | | Prime Security Services Borrower, LLC, Term Loan | | | 3.500% | | | | 6-Month LIBOR | | | | 2.750% | | | | 9/23/26 | | | | BB– | | | | 462,697 | |
| | 1,658 | | | Robertshaw US Holding Corp, Term Loan, First Lien | | | 4.500% | | | | 1-Month LIBOR | | | | 3.500% | | | | 2/28/25 | | | | CCC+ | | | | 1,599,063 | |
| | 185 | | | Sabert Corporation, Term Loan B | | | 5.500% | | | | 1-Month LIBOR | | | | 4.500% | | | | 12/10/26 | | | | B | | | | 185,391 | |
| | 1,496 | | | Spin Holdco, Inc., Term Loan | | | 4.750% | | | | 3-Month LIBOR | | | | 4.000% | | | | 3/04/28 | | | | B– | | | | 1,496,998 | |
| | 4,128 | | | Travelport Finance (Luxembourg) S.a.r.l., Term Loan, (cash 2.500%, PIK 6.500%), (DD1) | | | 2.500% | | | | 3-Month LIBOR | | | | 2.500% | | | | 2/28/25 | | | | B– | | | | 4,210,109 | |
| | 833 | | | West Corporation, Term Loan B1 | | | 4.500% | | | | 3-Month LIBOR | | | | 3.500% | | | | 10/10/24 | | | | BB+ | | | | 805,759 | |
| | 1,459 | | | WEX, Inc., Term Loan | | | 2.342% | | | | 1-Month LIBOR | | | | 2.250% | | | | 4/01/28 | | | | Ba2 | | | | 1,445,457 | |
| | 30,205 | | | Total Commercial Services & Supplies | | | | | | | | | | | | | | | | | | | | | | | 30,100,029 | |
| | | | | |
| | | | Communications Equipment – 2.8% (1.7% of Total Investments) | | | | | | | | | | | | | |
| | | | | | | |
| | 5,225 | | | CommScope, Inc., Term Loan B | | | 3.342% | | | | 1-Month LIBOR | | | | 3.250% | | | | 4/04/26 | | | | Ba3 | | | | 5,182,816 | |
| | 100 | | | MetroNet Systems Holdings, LLC, Delayed Draw Term Loan, (5) | | | 4.500% | | | | 1-Month LIBOR | | | | 3.750% | | | | 6/02/28 | | | | B2 | | | | 100,213 | |
| | 900 | | | MetroNet Systems Holdings, LLC, Term Loan, First Lien | | | 4.500% | | | | 1-Month LIBOR | | | | 3.750% | | | | 6/02/28 | | | | B2 | | | | 901,913 | |
| | 597 | | | MLN US HoldCo LLC, Term Loan, First Lien | | | 4.603% | | | | 1-Month LIBOR | | | | 4.500% | | | | 11/30/25 | | | | B3 | | | | 546,088 | |
| | 2,012 | | | Plantronics Inc, Term Loan B | | | 2.592% | | | | 1-Month LIBOR | | | | 2.500% | | | | 7/02/25 | | | | Ba2 | | | | 1,972,161 | |
| | 8 | | | Riverbed Technology, Inc., Term Loan B | | | 7.000% | | | | 2-Month LIBOR | | | | 6.000% | | | | 12/31/25 | | | | B2 | | | | 7,342 | |
| | 3,076 | | | Riverbed Technology, Inc., Term Loan B | | | 7.000% | | | | 3-Month LIBOR | | | | 6.000% | | | | 12/31/25 | | | | B2 | | | | 2,914,781 | |
| | 4,679 | | | Univision Communications, Inc., Term Loan C5 | | | 3.750% | | | | 1-Month LIBOR | | | | 2.750% | | | | 3/15/24 | | | | B | | | | 4,668,487 | |
| | 16,597 | | | Total Communications Equipment | | | | | | | | | | | | | | | | | | | | | | | 16,293,801 | |
| | | | | |
| | | | Construction & Engineering – 1.3% (0.8% of Total Investments) | | | | | | | | | | | | | |
| | | | | | | |
| | 750 | | | AECOM Technology Corporation , Term Loan B | | | 1.842% | | | | 1-Month LIBOR | | | | 1.750% | | | | 4/13/28 | | | | BBB– | | | | 749,531 | |
| | 1,170 | | | Aegion Corporation, Term Loan | | | 5.500% | | | | 3-Month LIBOR | | | | 4.750% | | | | 5/17/28 | | | | B | | | | 1,181,700 | |
| | 2,108 | | | Brown Group Holding, LLC, Term Loan B | | | 3.250% | | | | 3-Month LIBOR | | | | 2.750% | | | | 6/07/28 | | | | B+ | | | | 2,095,684 | |
| | 625 | | | FrontDoor Inc, Term Loan B | | | 2.342% | | | | 1-Month LIBOR | | | | 2.250% | | | | 6/17/28 | | | | Ba2 | | | | 624,872 | |
| | 1,000 | | | Osmose Utilities Services, Inc., Term Loan | | | 3.750% | | | | 3-Month LIBOR | | | | 3.250% | | | | 6/17/28 | | | | B | | | | 992,505 | |
| | 540 | | | Pike Corporation, Incremental Term Loan B | | | 3.100% | | | | 1-Month LIBOR | | | | 3.000% | | | | 1/21/28 | | | | Ba3 | | | | 537,925 | |
| | 1,612 | | | Traverse Midstream Partners LLC, Term Loan | | | 6.500% | | | | 1-Month LIBOR | | | | 5.500% | | | | 9/27/24 | | | | B | | | | 1,615,311 | |
| | 7,805 | | | Total Construction & Engineering | | | | | | | | | | | | | | | | | | | | | | | 7,797,528 | |
39
| | |
| |
| JFR | | Nuveen Floating Rate Income Fund (continued) |
| | Portfolio of Investments July 31, 2021 |
| | | | | | | | | | | | | | | | | | | | | | | | | | | | |
Principal
Amount (000) | | | Description (1) | | Coupon (2) | | | Reference
Rate (2) | | | Spread (2) | | | Maturity (3) | | | Ratings (4) | | | Value | |
| |
| | | | Containers & Packaging – 1.5% (0.9% of Total Investments) | |
| | | | | | | |
| $ | 2,641 | | | Berry Global, Inc., Term Loan Z | | | 1.850% | | | | 1-Month LIBOR | | | | 1.750% | | | | 7/01/26 | | | | BBB– | | | $ | 2,612,781 | |
| | 1,674 | | | Reynolds Consumer Products LLC, Term Loan | | | 1.842% | | | | 1-Month LIBOR | | | | 1.750% | | | | 2/04/27 | | | | BBB– | | | | 1,658,345 | |
| | 1,716 | | | Reynolds Group Holdings, Inc., Term Loan B2 | | | 3.342% | | | | 1-Month LIBOR | | | | 3.250% | | | | 2/05/26 | | | | B+ | | | | 1,698,602 | |
| | 542 | | | TricorBraun Holdings, Inc., Delayed Draw Term Loan, (5) | | | 3.750% | | | | 3-Month LIBOR | | | | 3.250% | | | | 3/03/28 | | | | B2 | | | | 537,097 | |
| | 2,408 | | | TricorBraun Holdings, Inc., Term Loan | | | 3.750% | | | | 3-Month LIBOR | | | | 3.250% | | | | 3/03/28 | | | | B2 | | | | 2,387,843 | |
| | 8,981 | | | Total Containers & Packaging | | | | | | | | | | | | | | | | | | | | | | | 8,894,668 | |
| |
| | | | Distributors – 0.6% (0.4% of Total Investments) | |
| | | | | | | |
| | 2,277 | | | Core & Main LP, Term Loan, (DD1) | | | 2.706% | | | | 1-Month LIBOR | | | | 2.500% | | | | 7/27/28 | | | | Ba3 | | | | 2,258,135 | |
| | 1,483 | | | Univar Solutions USA, Inc., Term Loan B6 | | | 2.092% | | | | 1-Month LIBOR | | | | 2.000% | | | | 6/03/28 | | | | BBB– | | | | 1,474,245 | |
| | 3,760 | | | Total Distributors | | | | | | | | | | | | | | | | | | | | | | | 3,732,380 | |
| |
| | | | Diversified Consumer Services – 0.9% (0.5% of Total Investments) | |
| | | | | | | |
| | 3,680 | | | Cengage Learning, Inc., Term Loan B | | | 5.750% | | | | 3-Month LIBOR | | | | 4.750% | | | | 6/29/26 | | | | B | | | | 3,683,551 | |
| | 1,375 | | | Sotheby’s, Term Loan B | | | 5.500% | | | | 3-Month LIBOR | | | | 4.750% | | | | 1/15/27 | | | | B+ | | | | 1,378,132 | |
| | 5,055 | | | Total Diversified Consumer Services | | | | | | | | | | | | | | | | | | | | | | | 5,061,683 | |
| |
| | | | Diversified Financial Services – 1.4% (0.8% of Total Investments) | |
| | | | | | | |
| | 412 | | | Avaya Inc, Term Loan, (WI/DD) | | | TBD | | | | TBD | | | | TBD | | | | TBD | | | | N/R | | | | 413,061 | |
| | 2,305 | | | Ditech Holding Corporation, Term Loan, (6) | | | 0.000% | | | | N/A | | | | N/A | | | | 6/30/22 | | | | N/R | | | | 464,390 | |
| | 1,250 | | | Fleetcor Technologies Operating Company, LLC, Term Loan B4 | | | 1.842% | | | | 1-Month LIBOR | | | | 1.750% | | | | 4/30/28 | | | | BB+ | | | | 1,242,413 | |
| | 841 | | | GT Polaris, Inc., Term Loan | | | 4.500% | | | | 3-Month LIBOR | | | | 3.750% | | | | 9/24/27 | | | | BB– | | | | 842,147 | |
| | 663 | | | Lions Gate Capital Holdings LLC, Term Loan B | | | 2.342% | | | | 1-Month LIBOR | | | | 2.250% | | | | 3/24/25 | | | | Ba2 | | | | 656,161 | |
| | 3,010 | | | Verscend Holding Corp., Term Loan B | | | 4.092% | | | | 1-Month LIBOR | | | | 4.000% | | | | 8/27/25 | | | | BB– | | | | 3,008,511 | |
| | 1,500 | | | Vision Solutions, Inc., Term Loan, First Lien | | | 5.000% | | | | 3-Month LIBOR | | | | 4.250% | | | | 3/04/28 | | | | N/R | | | | 1,496,370 | |
| | 9,981 | | | Total Diversified Financial Services | | | | | | | | | | | | | | | | | | | | | | | 8,123,053 | |
| |
| | | | Diversified Telecommunication Services – 3.6% (2.2% of Total Investments) | |
| | | | | | | |
| | 1,778 | | | Altice France S.A., Term Loan B12 | | | 3.814% | | | | 3-Month LIBOR | | | | 3.688% | | | | 1/31/26 | | | | B | | | | 1,759,707 | |
| | 5,896 | | | Altice France S.A., Term Loan B13 | | | 4.155% | | | | 3-Month LIBOR | | | | 4.000% | | | | 8/14/26 | | | | B | | | | 5,890,418 | |
| | 6,566 | | | CenturyLink, Inc., Term Loan B | | | 2.342% | | | | 1-Month LIBOR | | | | 2.250% | | | | 3/15/27 | | | | BBB– | | | | 6,471,219 | |
| | 1,539 | | | Connect Finco Sarl, Term Loan B | | | 4.500% | | | | 1-Month LIBOR | | | | 3.500% | | | | 12/12/26 | | | | B+ | | | | 1,540,453 | |
| | 3,505 | | | Frontier Communications Corp., DIP Term Loan B | | | 4.500% | | | | 1-Month LIBOR | | | | 3.750% | | | | 10/08/27 | | | | BB+ | | | | 3,509,654 | |
| | 131 | | | GTT Communications, Inc., Delayed Draw Term Loan, (6) | | | 6.000% | | | | 1-Month LIBOR | | | | 5.000% | | | | 12/28/21 | | | | CCC+ | | | | 132,929 | |
| | 465 | | | Intelsat Jackson Holdings S.A., Term Loan B4, (6) | | | 8.750% | | | | Prime | | | | 5.500% | | | | 1/02/24 | | | | N/R | | | | 474,695 | |
| | 744 | | | Intelsat Jackson Holdings S.A., Term Loan B5, (6) | | | 8.625% | | | | N/A | | | | N/A | | | | 1/02/24 | | | | N/R | | | | 758,849 | |
| | 428 | | | Zayo Group Holdings, Inc., Term Loan | | | 3.092% | | | | 1-Month LIBOR | | | | 3.000% | | | | 3/09/27 | | | | B1 | | | | 421,204 | |
| | 21,052 | | | Total Diversified Telecommunication Services | | | | | | | | | | | | | | | | | | | | 20,959,128 | |
| |
| | | | Electric Utilities – 0.6% (0.4% of Total Investments) | |
| | | | | | | |
| | 1,222 | | | ExGen Renewables IV, LLC, Term Loan | | | 3.500% | | | | 3-Month LIBOR | | | | 2.500% | | | | 12/15/27 | | | | BB– | | | | 1,221,614 | |
| | 990 | | | Pacific Gas & Electric Company, Term Loan | | | 3.500% | | | | 3-Month LIBOR | | | | 3.000% | | | | 6/23/25 | | | | BB | | | | 966,279 | |
| | 1,266 | | | Vistra Operations Company LLC, Term Loan B3, First Lien | | | 1.841% | | | | 1-Month LIBOR | | | | 1.750% | | | | 12/31/25 | | | | BBB– | | | | 1,251,025 | |
| | 3,478 | | | Total Electric Utilities | | | | | | | | | | | | | | | | | | | | | | | 3,438,918 | |
| |
| | | | Electrical Equipment – 1.5% (0.9% of Total Investments) | |
| | | | | | | |
| | 4,350 | | | Avolon TLB Borrower 1 (US) LLC, Term Loan B4 | | | 2.250% | | | | 1-Month LIBOR | | | | 1.500% | | | | 2/12/27 | | | | Baa2 | | | | 4,295,393 | |
| | 1,791 | | | Energizer Holdings, Inc., Term Loan | | | 2.750% | | | | 1-Month LIBOR | | | | 2.250% | | | | 12/22/27 | | | | BB+ | | | | 1,783,164 | |
| | 2,800 | | | Ingram Micro, Inc., Term Loan B | | | 4.000% | | | | 3-Month LIBOR | | | | 3.500% | | | | 7/02/28 | | | | BB | | | | 2,805,600 | |
| | 8,941 | | | Total Electrical Equipment | | | | | | | | | | | | | | | | | | | | | | | 8,884,157 | |
| |
| | | | Electronic Equipment, Instruments & Components – 0.3% (0.2% of Total Investments) | |
| | | | | | | |
| | 1,863 | | | TTM Technologies, Inc., Term Loan | | | 2.600% | | | | 1-Month LIBOR | | | | 2.500% | | | | 9/28/24 | | | | BB+ | | | | 1,861,044 | |
| |
| | | | Energy Equipment & Services – 0.1% (0.1% of Total Investments) | |
| | | | | | | |
| | 939 | | | Petroleum Geo-Services ASA, Term Loan | | | 7.647% | | | | 3-Month LIBOR | | | | 7.500% | | | | 3/19/24 | | | | N/R | | | | 870,264 | |
40
| | | | | | | | | | | | | | | | | | | | | | | | | | | | |
Principal
Amount (000) | | | Description (1) | | Coupon (2) | | | Reference
Rate (2) | | | Spread (2) | | | Maturity (3) | | | Ratings (4) | | | Value | |
| |
| | | | Entertainment – 2.4% (1.5% of Total Investments) | |
| | | | | | | |
| $ | 686 | | | AMC Entertainment Holdings, Inc., Term Loan B, (DD1) | | | 3.103% | | | | 1-Month LIBOR | | | | 3.000% | | | | 4/22/26 | | | | B– | | | $ | 611,088 | |
| | 682 | | | Crown Finance US, Inc., Incremental Term Loan | | | 3.750% | | | | 6-Month LIBOR | | | | 2.750% | | | | 9/20/26 | | | | CCC | | | | 549,505 | |
| | 4,584 | | | Crown Finance US, Inc., Term Loan | | | 3.500% | | | | 6-Month LIBOR | | | | 2.500% | | | | 2/28/25 | | | | CCC | | | | 3,732,695 | |
| | 1,945 | | | Metro-Goldwyn-Mayer, Inc., Term Loan, First Lien | | | 2.600% | | | | 1-Month LIBOR | | | | 2.500% | | | | 7/03/25 | | | | BB– | | | | 1,939,894 | |
| | 1,250 | | | Metro-Goldwyn-Mayer, Inc., Term Loan, Second Lien | | | 5.500% | | | | 1-Month LIBOR | | | | 4.500% | | | | 7/06/26 | | | | B3 | | | | 1,254,163 | |
| | 645 | | | NASCAR Holdings, Inc, Term Loan B | | | 2.842% | | | | 1-Month LIBOR | | | | 2.750% | | | | 10/18/26 | | | | BB | | | | 640,652 | |
| | 2,830 | | | Virgin Media Bristol LLC, Term Loan Q | | | 3.343% | | | | 1-Month LIBOR | | | | 3.250% | | | | 1/31/29 | | | | BB+ | | | | 2,820,958 | |
| | 2,685 | | | William Morris Endeavor Entertainment, LLC, Term Loan, First Lien | | | 2.850% | | | | 1-Month LIBOR | | | | 2.750% | | | | 5/16/25 | | | | B | | | | 2,616,002 | |
| | 15,307 | | | Total Entertainment | | | | | | | | | | | | | | | | | | | | | | | 14,164,957 | |
| |
| | | | Equity Real Estate Investment Trust – 0.4% (0.3% of Total Investments) | |
| | | | | | | |
| | 1,988 | | | Realogy Group LLC, Term Loan A | | | 1.842% | | | | 1-Month LIBOR | | | | 1.750% | | | | 2/08/25 | | | | Ba1 | | | | 1,938,742 | |
| | 410 | | | Realogy Group LLC, Term Loan B | | | 3.000% | | | | 1-Month LIBOR | | | | 2.250% | | | | 2/08/25 | | | | Ba1 | | | | 408,845 | |
| | 2,398 | | | Total Equity Real Estate Investment Trust | | | | | | | | | | | | | | | | | | | | 2,347,587 | |
| | | | | |
| | | | Food & Staples Retailing – 1.8% (1.1% of Total Investments) | | | | | | | | | | | | | |
| | | | | | | |
| | 461 | | | BJ’s Wholesale Club, Inc., Term Loan, First Lien | | | 2.100% | | | | 1-Month LIBOR | | | | 2.000% | | | | 2/03/24 | | | | BB+ | | | | 461,033 | |
| | 59 | | | H Food Holdings LLC, Incremental Term Loan B3 | | | 6.000% | | | | 1-Month LIBOR | | | | 5.000% | | | | 5/31/25 | | | | B2 | | | | 59,791 | |
| | 1,020 | | | H Food Holdings LLC, Term Loan B | | | 3.780% | | | | 1-Month LIBOR | | | | 3.688% | | | | 5/31/25 | | | | B2 | | | | 1,011,492 | |
| | 9,203 | | | US Foods, Inc., Term Loan B | | | 1.842% | | | | 1-Month LIBOR | | | | 1.750% | | | | 6/27/23 | | | | BB– | | | | 9,100,525 | |
| | 10,743 | | | Total Food & Staples Retailing | | | | | | | | | | | | | | | | | | | | | | | 10,632,841 | |
| | | | | |
| | | | Food Products – 0.6% (0.3% of Total Investments) | | | | | | | | | | | | | |
| | | | | | | |
| | 1,112 | | | American Seafoods Group LLC, Term Loan, First Lien | | | 3.750% | | | | 1-Month LIBOR | | | | 2.750% | | | | 8/21/23 | | | | BB– | | | | 1,109,585 | |
| | 7 | | | American Seafoods Group LLC, Term Loan, First Lien | | | 3.750% | | | | 3-Month LIBOR | | | | 2.750% | | | | 8/21/23 | | | | BB– | | | | 7,416 | |
| | 1,154 | | | Froneri International Ltd., Term Loan | | | 2.342% | | | | 1-Month LIBOR | | | | 2.250% | | | | 1/31/27 | | | | B+ | | | | 1,134,106 | |
| | 1,098 | | | UTZ Quality Foods, LLC, Term Loan B | | | 3.092% | | | | 1-Month LIBOR | | | | 3.000% | | | | 1/20/28 | | | | B1 | | | | 1,094,184 | |
| | 3,371 | | | Total Food Products | | | | | | | | | | | | | | | | | | | | | | | 3,345,291 | |
| | | | | |
| | | | Health Care Equipment & Supplies – 1.5% (0.9% of Total Investments) | | | | | | | | | | | | | |
| | | | | | | |
| | 2,762 | | | Carestream Health, Inc., Extended Term Loan | | | 7.750% | | | | 3-Month LIBOR | | | | 6.750% | | | | 5/08/23 | | | | B1 | | | | 2,781,620 | |
| | 902 | | | Greatbatch Ltd., Term Loan B | | | 3.500% | | | | 1-Month LIBOR | | | | 2.500% | | | | 10/27/22 | | | | B+ | | | | 902,211 | |
| | 750 | | | Insulet Corporation, Term Loan B | | | 3.750% | | | | 1-Month LIBOR | | | | 3.250% | | | | 5/04/28 | | | | Ba3 | | | | 751,526 | |
| | 1,279 | | | Lifescan Global Corporation, Term Loan, First Lien | | | 6.146% | | | | 3-Month LIBOR | | | | 6.000% | | | | 10/01/24 | | | | B | | | | 1,271,089 | |
| | 1,994 | | | Viant Medical Holdings, Inc., Term Loan, First Lien | | | 3.842% | | | | 1-Month LIBOR | | | | 3.750% | | | | 7/02/25 | | | | B3 | | | | 1,931,661 | |
| | 1,414 | | | Vyaire Medical, Inc., Term Loan B | | | 5.750% | | | | 3-Month LIBOR | | | | 4.750% | | | | 4/30/25 | | | | B3 | | | | 1,230,213 | |
| | 9,101 | | | Total Health Care Equipment & Supplies | | | | | | | | | | | | | | | | | | | | 8,868,320 | |
| | | | | |
| | | | Health Care Providers & Services – 8.0% (5.0% of Total Investments) | | | | | | | | | | | | | |
| | | | | | | |
| | 1,452 | | | ADMI Corp., Term Loan B2 | | | 3.625% | | | | 1-Month LIBOR | | | | 3.125% | | | | 12/23/27 | | | | B | | | | 1,430,209 | |
| | 2,225 | | | AHP Health Partners, Inc., Term Loan | | | 4.750% | | | | 1-Month LIBOR | | | | 3.750% | | | | 6/30/25 | | | | B1 | | | | 2,229,840 | |
| | 483 | | | Air Methods Corporation, Term Loan B | | | 4.500% | | | | 3-Month LIBOR | | | | 3.500% | | | | 4/21/24 | | | | B | | | | 473,731 | |
| | 938 | | | Albany Molecular Research, Inc., Term Loan, First Lien | | | 4.250% | | | | 3-Month LIBOR | | | | 3.250% | | | | 8/30/24 | | | | B | | | | 939,326 | |
| | 2,122 | | | BW NHHC Holdco, Inc., Term Loan, First Lien | | | 5.155% | | | | 3-Month LIBOR | | | | 5.000% | | | | 5/15/25 | | | | Caa1 | | | | 1,948,948 | |
| | 673 | | | DaVita, Inc., Term Loan B | | | 1.842% | | | | 1-Month LIBOR | | | | 1.750% | | | | 8/12/26 | | | | BBB– | | | | 667,229 | |
| | 1,775 | | | Envision Healthcare Corporation, Term Loan, First Lien | | | 3.842% | | | | 1-Month LIBOR | | | | 3.750% | | | | 10/10/25 | | | | CCC+ | | | | 1,524,554 | |
| | 1,168 | | | Gates Global LLC, Term Loan B3 | | | 3.500% | | | | 1-Month LIBOR | | | | 2.750% | | | | 3/31/27 | | | | B+ | | | | 1,162,012 | |
| | 2,900 | | | Gentiva Health Services, Inc., Term Loan | | | 2.875% | | | | 1-Month LIBOR | | | | 2.750% | | | | 7/02/25 | | | | B+ | | | | 2,892,433 | |
| | 3,482 | | | Global Medical Response, Inc., Term Loan B | | | 5.750% | | | | 3-Month LIBOR | | | | 4.750% | | | | 10/02/25 | | | | B | | | | 3,492,129 | |
| | 435 | | | MED ParentCo LP, Term Loan, First Lien | | | 4.342% | | | | 1-Month LIBOR | | | | 4.250% | | | | 8/31/26 | | | | B2 | | | | 435,015 | |
| | 100 | | | National Mentor Holdings, Inc., Delayed Draw Term Loan, (5) | | | 4.500% | | | | 3-Month LIBOR | | | | 3.750% | | | | 3/02/28 | | | | B1 | | | | 100,256 | |
| | 480 | | | National Mentor Holdings, Inc., Term Loan | | | 4.500% | | | | 1-Month LIBOR | | | | 3.750% | | | | 3/02/28 | | | | B1 | | | | 480,014 | |
| | 430 | | | National Mentor Holdings, Inc., Term Loan | | | 4.500% | | | | 3-Month LIBOR | | | | 3.750% | | | | 3/02/28 | | | | B1 | | | | 429,127 | |
41
| | |
| |
| JFR | | Nuveen Floating Rate Income Fund (continued) |
| | Portfolio of Investments July 31, 2021 |
| | | | | | | | | | | | | | | | | | | | | | | | | | | | |
Principal
Amount (000) | | | Description (1) | | Coupon (2) | | | Reference
Rate (2) | | | Spread (2) | | | Maturity (3) | | | Ratings (4) | | | Value | |
| | | | | |
| | | | Health Care Providers & Services (continued) | | | | | | | | | | | | | |
| | | | | | | |
| $ | 30 | | | National Mentor Holdings, Inc., Term Loan C | | | 4.500% | | | | 3-Month LIBOR | | | | 3.750% | | | | 3/02/28 | | | | B1 | | | $ | 30,381 | |
| | 1,970 | | | Onex TSG Intermediate Corp., Term Loan B | | | 5.500% | | | | 3-Month LIBOR | | | | 4.750% | | | | 2/26/28 | | | | B | | | | 1,988,715 | |
| | 2,288 | | | Phoenix Guarantor Inc, Term Loan B | | | 3.339% | | | | 1-Month LIBOR | | | | 3.250% | | | | 3/05/26 | | | | B1 | | | | 2,261,930 | |
| | 1,995 | | | Phoenix Guarantor Inc, Term Loan B3 | | | 3.596% | | | | 1-Month LIBOR | | | | 3.500% | | | | 3/05/26 | | | | B1 | | | | 1,976,117 | |
| | 233 | | | Quorum Health Corporation, Term Loan, (6) | | | 7.500% | | | | 3-Month LIBOR | | | | 6.500% | | | | 4/29/25 | | | | B– | | | | 236,386 | |
| | 7,385 | | | RegionalCare Hospital Partners Holdings, Inc., Term Loan B, (DD1) | | | 3.842% | | | | 1-Month LIBOR | | | | 3.750% | | | | 11/16/25 | | | | B1 | | | | 7,331,811 | |
| | 3,261 | | | Select Medical Corporation, Term Loan B | | | 2.350% | | | | 1-Month LIBOR | | | | 2.250% | | | | 3/06/25 | | | | Ba2 | | | | 3,220,508 | |
| | 7,359 | | | Surgery Center Holdings, Inc., Term Loan | | | 4.500% | | | | 1-Month LIBOR | | | | 3.750% | | | | 8/31/26 | | | | B1 | | | | 7,364,979 | |
| | 3,021 | | | Team Health Holdings, Inc., Term Loan, First Lien | | | 3.750% | | | | 1-Month LIBOR | | | | 2.750% | | | | 2/06/24 | | | | B | | | | 2,931,995 | |
| | 1,841 | | | US Radiology Specialists, Inc., Term Loan | | | 6.250% | | | | 3-Month LIBOR | | | | 5.500% | | | | 12/15/27 | | | | B– | | | | 1,855,706 | |
| | 48,046 | | | Total Health Care Providers & Services | | | | | | | | | | | | | | | | | | | | 47,403,351 | |
| | | |
| | | | Health Care Technology – 2.0% (1.2% of Total Investments) | | | | | | | |
| | | | | | | |
| | 2,639 | | | Carestream Health, Inc., Term Loan, Second Lien, (cash 5.500%, PIK 8.000%) | | | 8.000% | | | | 3-Month LIBOR | | | | 4.500% | | | | 8/05/23 | | | | CCC+ | | | | 2,591,173 | |
| | 6,388 | | | Change Healthcare Holdings LLC, Term Loan B | | | 3.500% | | | | 3-Month LIBOR | | | | 2.500% | | | | 3/01/24 | | | | B+ | | | | 6,383,948 | |
| | 190 | | | Change Healthcare Holdings LLC, Term Loan B | | | 3.500% | | | | 1-Month LIBOR | | | | 2.500% | | | | 3/01/24 | | | | B+ | | | | 189,815 | |
| | 2,413 | | | Zelis Healthcare Corporation, Term Loan | | | 3.601% | | | | 1-Month LIBOR | | | | 3.500% | | | | 9/30/26 | | | | B | | | | 2,403,876 | |
| | 11,630 | | | Total Health Care Technology | | | | | | | | | | | | | | | | | | | | | | | 11,568,812 | |
| | | |
| | | | Hotels, Restaurants & Leisure – 17.8% (11.0% of Total Investments) | | | | | | | |
| | | | | | | |
| | 22,800 | | | B.C. Unlimited Liability Company, Term Loan B4 | | | 1.842% | | | | 1-Month LIBOR | | | | 1.750% | | | | 11/19/26 | | | | BB+ | | | | 22,390,192 | |
| | 587 | | | 24 Hour Fitness Worldwide, Inc., Exit Term Loan, (cash 1.000%, PIK 5.000%) | | | 6.000% | | | | 3-Month LIBOR | | | | 5.000% | | | | 12/29/25 | | | | B3 | | | | 515,726 | |
| | 2,028 | | | Alterra Mountain Co, Term Loan, (WI/DD) | | | 5.500% | | | | 1-Month LIBOR | | | | 4.500% | | | | 8/01/26 | | | | B | | | | 2,021,759 | |
| | 931 | | | Aramark Services, Inc., Term Loan B3 | | | 1.842% | | | | 1-Month LIBOR | | | | 1.750% | | | | 3/11/25 | | | | BB+ | | | | 917,592 | |
| | 1,377 | | | Boyd Gaming Corporation, Term Loan B3 | | | 2.334% | | | | 1-Week LIBOR | | | | 2.250% | | | | 9/15/23 | | | | BB | | | | 1,375,371 | |
| | 1,489 | | | Caesars Resort Collection, LLC, Term Loan B1 | | | 4.592% | | | | 1-Month LIBOR | | | | 4.500% | | | | 7/20/25 | | | | B+ | | | | 1,492,040 | |
| | 10,342 | | | Caesars Resort Collection, LLC, Term Loan, First Lien B | | | 2.842% | | | | 1-Month LIBOR | | | | 2.750% | | | | 12/22/24 | | | | B+ | | | | 10,239,692 | |
| | 1,394 | | | Carnival Corporation, Term Loan B | | | 3.750% | | | | 1-Month LIBOR | | | | 3.000% | | | | 6/30/25 | | | | Ba2 | | | | 1,386,169 | |
| | 1,830 | | | Churchill Downs Incorporated, Incremental Term Loan B1 | | | 2.100% | | | | 1-Month LIBOR | | | | 2.000% | | | | 3/17/28 | | | | BBB– | | | | 1,811,508 | |
| | 4,466 | | | CityCenter Holdings, LLC, Term Loan B | | | 3.000% | | | | 1-Month LIBOR | | | | 2.250% | | | | 4/18/24 | | | | B+ | | | | 4,458,620 | |
| | 5,215 | | | ClubCorp Holdings, Inc., Term Loan B | | | 2.897% | | | | 3-Month LIBOR | | | | 2.750% | | | | 9/18/24 | | | | B– | | | | 4,943,932 | |
| | 736 | | | Crown Finance US, Inc., Term Loan B1, (cash 7.000%, PIK 8.250%) | | | 7.000% | | | | 3-Month LIBOR | | | | 7.000% | | | | 5/23/24 | | | | B– | | | | 917,046 | |
| | 4,649 | | | Equinox Holdings, Inc., Term Loan, First Lien | | | 4.000% | | | | 3-Month LIBOR | | | | 3.000% | | | | 3/08/24 | | | | CCC | | | | 4,320,601 | |
| | 955 | | | Four Seasons Hotels Limited, New Term Loan, First Lien | | | 2.092% | | | | 1-Month LIBOR | | | | 2.000% | | | | 11/30/23 | | | | BB+ | | | | 949,561 | |
| | 9,285 | | | Golden Nugget, Inc., Incremental Term Loan B | | | 3.250% | | | | 2-Month LIBOR | | | | 2.500% | | | | 10/04/23 | | | | B | | | | 9,206,601 | |
| | 2,750 | | | Hilton Grand Vacations Borrower LLC, Term Loan, (WI/DD) | | | TBD | | | | TBD | | | | TBD | | | | TBD | | | | Ba1 | | | | 2,743,813 | |
| | 7,788 | | | Hilton Worldwide Finance, LLC, Term Loan B2 | | | 1.839% | | | | 1-Month LIBOR | | | | 1.750% | | | | 6/21/26 | | | | BBB– | | | | 7,700,373 | |
| | 4,875 | | | Life Time Fitness Inc , Term Loan B | | | 5.750% | | | | 3-Month LIBOR | | | | 4.750% | | | | 12/15/24 | | | | B– | | | | 4,878,572 | |
| | 855 | | | PCI Gaming Authority, Term Loan | | | 2.592% | | | | 1-Month LIBOR | | | | 2.500% | | | | 5/31/26 | | | | BBB– | | | | 849,907 | |
| | 7,726 | | | Scientific Games International, Inc., Term Loan B5 | | | 2.842% | | | | 1-Month LIBOR | | | | 2.750% | | | | 8/14/24 | | | | B+ | | | | 7,622,967 | |
| | 3,725 | | | SeaWorld Parks & Entertainment, Inc., Term Loan B5 | | | 3.750% | | | | 1-Month LIBOR | | | | 3.000% | | | | 3/31/24 | | | | B2 | | | | 3,698,819 | |
| | 5,836 | | | Stars Group Holdings B.V. (The), Incremental Term Loan, (DD1) | | | 3.647% | | | | 3-Month LIBOR | | | | 3.500% | | | | 7/21/26 | | | | BBB | | | | 5,800,615 | |
| | 2,912 | | | Station Casinos LLC, Term Loan B | | | 3.250% | | | | 1-Month LIBOR | | | | 2.250% | | | | 2/08/27 | | | | BB– | | | | 2,868,719 | |
| | 1,945 | | | Wyndham Hotels & Resorts, Inc., Term Loan B | | | 1.842% | | | | 1-Month LIBOR | | | | 1.750% | | | | 5/30/25 | | | | BB+ | | | | 1,926,357 | |
| | 106,496 | | | Total Hotels, Restaurants & Leisure | | | | | | | | | | | | | | | | | | | | | | | 105,036,552 | |
| | | |
| | | | Household Durables – 0.9% (0.6% of Total Investments) | | | | | | | |
| | | | | | | |
| | 1,228 | | | Apex Tool Group, LLC, Term Loan B | | | 6.500% | | | | 1-Month LIBOR | | | | 5.250% | | | | 8/21/24 | | | | B3 | | | | 1,232,551 | |
| | 1,250 | | | Osmosis Debt Merger Sub Inc, Term Loan, (WI/DD) | | | TBD | | | | TBD | | | | TBD | | | | TBD | | | | B3 | | | | 1,251,369 | |
| | 99 | | | Serta Simmons Bedding, LLC, Term Loan, (6) | | | 8.500% | | | | 1-Month LIBOR | | | | 7.500% | | | | 8/10/23 | | | | B | | | | 100,412 | |
| | 2,401 | | | Serta Simmons Bedding, LLC, Term Loan, (6) | | | 8.500% | | | | 1-Month LIBOR | | | | 7.500% | | | | 8/10/23 | | | | B– | | | | 2,286,608 | |
42
| | | | | | | | | | | | | | | | | | | | | | | | | | | | |
Principal
Amount (000) | | | Description (1) | | Coupon (2) | | | Reference
Rate (2) | | | Spread (2) | | | Maturity (3) | | | Ratings (4) | | | Value | |
| | | |
| | | | Household Durables (continued) | | | | | | | |
| $ | 497 | | | Weber-Stephen Products LLC, Term Loan B | | | 5.500% | | | | 1-Month LIBOR | | | | 3.250% | | | | 10/30/27 | | | | B1 | | | $ | 496,333 | |
| | 125 | | | Weber-Stephen Products LLC, Term Loan B | | | 5.500% | | | | Prime | | | | 3.250% | | | | 10/30/27 | | | | B1 | | | | 124,864 | |
| | 5,600 | | | Total Household Durables | | | | | | | | | | | | | | | | | | | | | | | 5,492,137 | |
| | | |
| | | | Household Products – 0.8% (0.5% of Total Investments) | | | | | | | |
| | | | | | | |
| | 1,090 | | | Illuminate Merger Sub Corp, Term Loan, (WI/DD) | | | TBD | | | | TBD | | | | TBD | | | | TBD | | | | B1 | | | | 1,083,531 | |
| | 2,241 | | | Reynolds Group Holdings, Inc., Term Loan | | | 2.842% | | | | 1-Month LIBOR | | | | 2.750% | | | | 2/05/23 | | | | B+ | | | | 2,236,119 | |
| | 1,496 | | | Spectrum Brands, Inc., Term Loan | | | 2.500% | | | | 3-Month LIBOR | | | | 2.000% | | | | 3/03/28 | | | | BBB– | | | | 1,484,564 | |
| | 4,827 | | | Total Household Products | | | | | | | | | | | | | | | | | | | | | | | 4,804,214 | |
| | | |
| | | | Independent Power & Renewable Electricity Producers – 0.2% (0.1% of Total Investments) | | | | | | | |
| | | | | | | |
| | 1,232 | | | WIN Waste Innovations Holdings, Inc., Term Loan B | | | 3.250% | | | | 3-Month LIBOR | | | | 2.750% | | | | 3/25/28 | | | | B+ | | | | 1,229,286 | |
| | | | |
| | | | Insurance – 4.0% (2.4% of Total Investments) | | | | | | | | | | |
| | | | | | | |
| | 4,965 | | | Acrisure, LLC, Term Loan B | | | 3.607% | | | | 2-Month LIBOR | | | | 3.500% | | | | 2/15/27 | | | | B | | | | 4,885,118 | |
| | 4,054 | | | Alliant Holdings Intermediate, LLC, Term Loan B | | | 3.342% | | | | 1-Month LIBOR | | | | 3.250% | | | | 5/10/25 | | | | B | | | | 4,006,867 | |
| | 748 | | | Alliant Holdings Intermediate, LLC, Term Loan B3 | | | 4.250% | | | | 1-Month LIBOR | | | | 3.750% | | | | 11/06/27 | | | | B | | | | 748,894 | |
| | 2,750 | | | Asurion LLC, Term Loan B4, (WI/DD) | | | TBD | | | | TBD | | | | TBD | | | | TBD | | | | B | | | | 2,740,540 | |
| | 1,464 | | | Asurion LLC, Term Loan B6 | | | 3.217% | | | | 1-Month LIBOR | | | | 3.125% | | | | 11/03/23 | | | | Ba3 | | | | 1,450,303 | |
| | 5,692 | | | Asurion LLC, Term Loan B8 | | | 3.342% | | | | 1-Month LIBOR | | | | 3.250% | | | | 12/23/26 | | | | Ba3 | | | | 5,592,945 | |
| | 3,268 | | | Hub International Limited, Term Loan B | | | 2.875% | | | | 3-Month LIBOR | | | | 2.750% | | | | 4/25/25 | | | | B | | | | 3,223,127 | |
| | 695 | | | Ryan Specialty Group, LLC, Term Loan | | | 3.750% | | | | 1-Month LIBOR | | | | 3.000% | | | | 9/01/27 | | | | BB– | | | | 693,232 | |
| | 23,636 | | | Total Insurance | | | | | | | | | | | | | | | | | | | | | | | 23,341,026 | |
| | | |
| | | | Interactive Media & Services – 2.0% (1.2% of Total Investments) | | | | | | | |
| | | | | | | |
| | 2,065 | | | Arches Buyer, Inc., Term Loan B | | | 3.750% | | | | 1-Month LIBOR | | | | 3.250% | | | | 12/06/27 | | | | B1 | | | | 2,055,024 | |
| | 728 | | | Mission Broadcasting, Inc., Term Loan B | | | 2.604% | | | | 1-Month LIBOR | | | | 2.500% | | | | 6/03/28 | | | | BBB– | | | | 722,085 | |
| | 6,883 | | | Rackspace Technology Global, Inc., Term Loan, (DD1) | | | 3.500% | | | | 3-Month LIBOR | | | | 2.750% | | | | 2/09/28 | | | | B+ | | | | 6,811,124 | |
| | 5 | | | WeddingWire, Inc., Term Loan, First Lien | | | 4.628% | | | | 2-Month LIBOR | | | | 4.500% | | | | 12/21/25 | | | | B+ | | | | 5,006 | |
| | 1,945 | | | WeddingWire, Inc., Term Loan, First Lien | | | 4.628% | | | | 3-Month LIBOR | | | | 4.500% | | | | 12/21/25 | | | | B+ | | | | 1,947,431 | |
| | 11,626 | | | Total Interactive Media & Services | | | | | | | | | | | | | | | | | | | | | | | 11,540,670 | |
| | | |
| | | | Internet & Direct Marketing Retail – 0.4% (0.3% of Total Investments) | | | | | | | |
| | | | | | | |
| | 2,494 | | | CNT Holdings I Corp, Term Loan | | | 4.500% | | | | 3-Month LIBOR | | | | 3.750% | | | | 11/08/27 | | | | B | | | | 2,491,805 | |
| | | |
| | | | Internet Software & Services – 1.7% (1.0% of Total Investments) | | | | | | | |
| | | | | | | |
| | 2,205 | | | Banff Merger Sub Inc, Term Loan | | | 3.842% | | | | 1-Month LIBOR | | | | 3.750% | | | | 10/02/25 | | | | B2 | | | | 2,189,258 | |
| | 4,104 | | | Greeneden U.S. Holdings II, LLC, Term Loan B4 | | | 4.750% | | | | 1-Month LIBOR | | | | 4.000% | | | | 12/01/27 | | | | B– | | | | 4,112,782 | |
| | 559 | | | Uber Technologies, Inc., Term Loan B | | | 3.592% | | | | 1-Month LIBOR | | | | 3.500% | | | | 2/25/27 | | | | B+ | | | | 557,625 | |
| | 2,905 | | | Uber Technologies, Inc., Term Loan B, First Lien | | | 3.592% | | | | 1-Month LIBOR | | | | 3.500% | | | | 4/04/25 | | | | B+ | | | | 2,900,147 | |
| | 9,773 | | | Total Internet Software & Services | | | | | | | | | | | | | | | | | | | | | | | 9,759,812 | |
| | | |
| | | | IT Services – 4.4% (2.7% of Total Investments) | | | | | | | |
| | | | | | | |
| | 1,977 | | | Ahead Data Blue, LLC, Term Loan B | | | 4.500% | | | | 3-Month LIBOR | | | | 3.750% | | | | 10/16/27 | | | | B+ | | | | 1,980,974 | |
| | 2 | | | DTI Holdco, Inc., Term Loan B | | | 5.750% | | | | 2-Month LIBOR | | | | 4.750% | | | | 9/30/23 | | | | CCC+ | | | | 1,589 | |
| | 620 | | | DTI Holdco, Inc., Term Loan B | | | 5.750% | | | | 3-Month LIBOR | | | | 4.750% | | | | 9/30/23 | | | | CCC+ | | | | 603,319 | |
| | 5,483 | | | Intrado Corporation, Term Loan | | | 5.000% | | | | 3-Month LIBOR | | | | 4.000% | | | | 10/10/24 | | | | BB– | | | | 5,356,114 | |
| | 1,284 | | | KBR, Inc., Term Loan B | | | 2.842% | | | | 1-Month LIBOR | | | | 2.750% | | | | 2/07/27 | | | | Ba1 | | | | 1,284,552 | |
| | 2,000 | | | Magenta Buyer LLC, Term Loan, (WI/DD) | | | TBD | | | | TBD | | | | TBD | | | | TBD | | | | BB– | | | | 1,993,130 | |
| | 1,125 | | | NeuStar, Inc., Term Loan B4 | | | 4.500% | | | | 3-Month LIBOR | | | | 3.500% | | | | 8/08/24 | | | | B+ | | | | 1,100,796 | |
| | 197 | | | NeuStar, Inc., Term Loan B5 | | | 5.500% | | | | 3-Month LIBOR | | | | 4.500% | | | | 8/08/24 | | | | B+ | | | | 193,230 | |
| | 499 | | | Project Ruby Ultimate Parent Corp., Term Loan | | | 4.000% | | | | 1-Month LIBOR | | | | 3.250% | | | | 3/10/28 | | | | B | | | | 496,708 | |
| | 3,532 | | | Sabre GLBL, Inc., Term Loan B | | | 2.092% | | | | 1-Month LIBOR | | | | 2.000% | | | | 2/22/24 | | | | Ba3 | | | | 3,457,596 | |
| | 836 | | | Science Applications International Corporation, Term Loan B | | | 1.967% | | | | 1-Month LIBOR | | | | 1.875% | | | | 10/31/25 | | | | BB+ | | | | 830,741 | |
| | 4,045 | | | Syniverse Holdings, Inc., Term Loan, First Lien | | | 6.000% | | | | 3-Month LIBOR | | | | 5.000% | | | | 3/09/23 | | | | CCC+ | | | | 4,002,968 | |
| | 2,671 | | | Syniverse Holdings, Inc., Term Loan, Second Lien | | | 10.000% | | | | 3-Month LIBOR | | | | 9.000% | | | | 3/11/24 | | | | CCC– | | | | 2,644,717 | |
| | 2,113 | | | Tempo Acquisition LLC, Extended Term Loan | | | 3.750% | | | | 1-Month LIBOR | | | | 3.250% | | | | 10/31/26 | | | | BB– | | | | 2,112,524 | |
| | 26,384 | | | Total IT Services | | | | | | | | | | | | | | | | | | | | | | | 26,058,958 | |
43
| | |
| |
| JFR | | Nuveen Floating Rate Income Fund (continued) |
| | Portfolio of Investments July 31, 2021 |
| | | | | | | | | | | | | | | | | | | | | | | | | | | | |
Principal
Amount (000) | | | Description (1) | | Coupon (2) | | | Reference
Rate (2) | | | Spread (2) | | | Maturity (3) | | | Ratings (4) | | | Value | |
| | | |
| | | | Leisure Products – 0.3% (0.2% of Total Investments) | | | | | | | |
| | | | | | | |
| $ | 680 | | | Hayward Industries, Inc., Term Loan | | | 3.250% | | | | 1-Month LIBOR | | | | 2.750% | | | | 5/28/28 | | | | BB– | | | $ | 674,511 | |
| | 91 | | | SRAM, LLC , Term Loan B | | | 3.250% | | | | 1-Month LIBOR | | | | 2.750% | | | | 5/18/28 | | | | BB– | | | | 90,568 | |
| | 909 | | | SRAM, LLC , Term Loan B | | | 3.250% | | | | 6-Month LIBOR | | | | 2.750% | | | | 5/18/28 | | | | BB– | | | | 905,682 | |
| | 227 | | | SRAM, LLC , Term Loan B | | | 3.250% | | | | 3-Month LIBOR | | | | 2.750% | | | | 5/18/28 | | | | BB– | | | | 226,420 | |
| | 1,907 | | | Total Leisure Products | | | | | | | | | | | | | | | | | | | | | | | 1,897,181 | |
| | | |
| | | | Life Sciences Tools & Services – 4.6% (2.8% of Total Investments) | | | | | | | |
| | | | | | | |
| | 6,404 | | | ICON Luxembourg Sarl, Term Loan, (WI/DD) | | | TBD | | | | TBD | | | | TBD | | | | TBD | | | | BB+ | | | | 6,398,620 | |
| | 1,596 | | | Indigo Merger Sub Inc, Term Loan, (WI/DD) | | | TBD | | | | TBD | | | | TBD | | | | TBD | | | | BB+ | | | | 1,594,220 | |
| | 11,489 | | | Parexel International Corporation, Term Loan B | | | 2.842% | | | | 1-Month LIBOR | | | | 2.750% | | | | 9/27/24 | | | | B2 | | | | 11,465,813 | |
| | 7,697 | | | PPD, Inc., Initial Term Loan | | | 2.750% | | | | 1-Month LIBOR | | | | 2.250% | | | | 1/13/28 | | | | Ba2 | | | | 7,686,879 | |
| | 27,186 | | | Total Life Sciences Tools & Services | | | | | | | | | | | | | | | | | | | | | | | 27,145,532 | |
| | | |
| | | | Machinery – 1.3% (0.8% of Total Investments) | | | | | | | |
| | | | | | | |
| | 1,477 | | | Alliance Laundry Systems LLC, Term Loan B | | | 4.250% | | | | 3-Month LIBOR | | | | 3.500% | | | | 10/08/27 | | | | B | | | | 1,477,115 | |
| | 741 | | | Blount International, Inc., Term Loan B | | | 4.750% | | | | 1-Month LIBOR | | | | 3.750% | | | | 4/12/23 | | | | B2 | | | | 743,239 | |
| | 260 | | | Gardner Denver, Inc., Term Loan B | | | 2.842% | | | | 1-Month LIBOR | | | | 2.750% | | | | 1/31/27 | | | | BB+ | | | | 260,184 | |
| | 2,020 | | | Gardner Denver, Inc., Term Loan B2 | | | 1.842% | | | | 1-Month LIBOR | | | | 1.750% | | | | 2/28/27 | | | | BB+ | | | | 1,985,591 | |
| | 1,810 | | | Vertical Midco GmbH, Term Loan B, (DD1) | | | 4.404% | | | | 6-Month LIBOR | | | | 4.250% | | | | 7/31/27 | | | | B+ | | | | 1,808,607 | |
| | 1,481 | | | Vertiv Group Corporation, Term Loan B | | | 2.851% | | | | 1-Month LIBOR | | | | 2.750% | | | | 3/02/27 | | | | B+ | | | | 1,469,382 | |
| | 7,789 | | | Total Machinery | | | | | | | | | | | | | | | | | | | | | | | 7,744,118 | |
| | | |
| | | | Marine – 0.4% (0.3% of Total Investments) | | | | | | | |
| | 3,191 | | | HGIM Corp., Exit Term Loan, (DD1) | | | 7.000% | | | | 3-Month LIBOR | | | | 6.000% | | | | 7/02/23 | | | | Caa3 | | | | 2,381,329 | |
| | | |
| | | | Media – 15.7% (9.7% of Total Investments) | | | | | | | |
| | | | | | | |
| | 1,500 | | | Cable One, Inc., Term Loan B4 | | | 2.092% | | | | 1-Month LIBOR | | | | 2.000% | | | | 5/03/28 | | | | BB+ | | | | 1,484,625 | |
| | 4,844 | | | Charter Communications Operating, LLC, Term Loan B2 | | | 1.850% | | | | 1-Month LIBOR | | | | 1.750% | | | | 2/01/27 | | | | BBB– | | | | 4,794,286 | |
| | 1,148 | | | Checkout Holding Corp, (cash 2.000%, PIK 9.500%) | | | 2.000% | | | | 3-Month LIBOR | | | | 1.000% | | | | 8/15/23 | | | | N/R | | | | 637,239 | |
| | 673 | | | Checkout Holding Corp., First Out Term Loan | | | 8.500% | | | | 3-Month LIBOR | | | | 7.500% | | | | 2/15/23 | | | | N/R | | | | 650,280 | |
| | 11,620 | | | Clear Channel Outdoor Holdings, Inc., Term Loan B | | | 3.629% | | | | 3-Month LIBOR | | | | 3.500% | | | | 8/21/26 | | | | B1 | | | | 11,301,779 | |
| | 6,836 | | | CSC Holdings, LLC, Incremental Term Loan | | | 2.343% | | | | 1-Month LIBOR | | | | 2.250% | | | | 1/15/26 | | | | BB | | | | 6,729,343 | |
| | 3,416 | | | CSC Holdings, LLC, Term Loan B1 | | | 2.343% | | | | 1-Month LIBOR | | | | 2.250% | | | | 7/17/25 | | | | BB | | | | 3,370,761 | |
| | 6,548 | | | CSC Holdings, LLC, Term Loan B5 | | | 2.593% | | | | 1-Month LIBOR | | | | 2.500% | | | | 4/15/27 | | | | BB | | | | 6,476,375 | |
| | 523 | | | Cumulus Media New Holdings, Inc., Term Loan B | | | 4.750% | | | | 3-Month LIBOR | | | | 3.750% | | | | 3/31/26 | | | | B | | | | 523,097 | |
| | 1,408 | | | Diamond Sports Group, LLC, Term Loan | | | 3.350% | | | | 1-Month LIBOR | | | | 3.250% | | | | 8/24/26 | | | | CCC+ | | | | 778,791 | |
| | 5,867 | | | Directv Financing LLC, Term Loan, (WI/DD) | | | TBD | | | | TBD | | | | TBD | | | | TBD | | | | BBB– | | | | 5,862,629 | |
| | 978 | | | E.W. Scripps Company (The), Term Loan B2 | | | 3.313% | | | | 1-Month LIBOR | | | | 2.562% | | | | 5/01/26 | | | | BB | | | | 972,836 | |
| | 314 | | | Entercom Media Corp., Term Loan | | | 2.588% | | | | 3-Month LIBOR | | | | 2.500% | | | | 11/17/24 | | | | BB– | | | | 309,977 | |
| | 588 | | | GCI Holdings, Inc., Term Loan B | | | 3.500% | | | | 1-Month LIBOR | | | | 2.750% | | | | 10/15/25 | | | | Ba2 | | | | 587,062 | |
| | 830 | | | Gray Television, Inc., Term Loan B | | | 2.350% | | | | 1-Month LIBOR | | | | 2.250% | | | | 2/07/24 | | | | BB+ | | | | 824,831 | |
| | 850 | | | Gray Television, Inc., Term Loan C | | | 2.600% | | | | 1-Month LIBOR | | | | 2.500% | | | | 1/02/26 | | | | BB+ | | | | 843,113 | |
| | 9 | | | Houghton Mifflin Harcourt Publishers Inc, Term Loan | | | 7.250% | | | | N/A | | | | N/A | | | | 11/22/24 | | | | BB+ | | | | 9,024 | |
| | 6,122 | | | iHeartCommunications, Inc., Term Loan | | | 3.092% | | | | 1-Month LIBOR | | | | 3.000% | | | | 5/01/26 | | | | B+ | | | | 6,049,043 | |
| | 2,688 | | | Intelsat Jackson Holdings S.A., DIP Term Loan, (6) | | | 5.912% | | | | 3-Month LIBOR | | | | 3.600% | | | | 7/13/21 | | | | N/R | | | | 2,717,833 | |
| | 8,553 | | | Intelsat Jackson Holdings S.A., Term Loan B3, (6) | | | 8.000% | | | | Prime | | | | 4.750% | | | | 11/27/23 | | | | N/R | | | | 8,710,842 | |
| | 597 | | | LCPR Loan Financing LLC, Term Loan B | | | 3.843% | | | | 1-Month LIBOR | | | | 3.750% | | | | 10/15/28 | | | | BB+ | | | | 598,796 | |
| | 2,400 | | | Mav Acquisition Corp, Term Loan, (WI/DD) | | | TBD | | | | TBD | | | | TBD | | | | TBD | | | | B2 | | | | 2,378,400 | |
| | 683 | | | Meredith Corporation, Incremental Term Loan B | | | 5.250% | | | | 3-Month LIBOR | | | | 4.250% | | | | 1/31/25 | | | | BB– | | | | 698,330 | |
| | 3,315 | | | Meredith Corporation, Term Loan B2 | | | 2.592% | | | | 1-Month LIBOR | | | | 2.500% | | | | 1/31/25 | | | | BB– | | | | 3,297,448 | |
| | 2,815 | | | Nexstar Broadcasting, Inc., Term Loan B3 | | | 2.337% | | | | 3-Month LIBOR | | | | 2.250% | | | | 1/17/24 | | | | BBB– | | | | 2,799,575 | |
| | 1,294 | | | Nexstar Broadcasting, Inc., Term Loan B4 | | | 2.600% | | | | 1-Month LIBOR | | | | 2.500% | | | | 9/19/26 | | | | BBB– | | | | 1,283,513 | |
| | 415 | | | Red Ventures, LLC, Term Loan B2 | | | 2.592% | | | | 1-Month LIBOR | | | | 2.500% | | | | 11/08/24 | | | | BB | | | | 407,677 | |
| | 2,696 | | | Sinclair Television Group, Inc., Term Loan B1 | | | 2.350% | | | | 1-Month LIBOR | | | | 2.250% | | | | 1/03/24 | | | | Ba2 | | | | 2,665,149 | |
| | 1,228 | | | Sinclair Television Group, Inc., Term Loan B2B | | | 2.600% | | | | 1-Month LIBOR | | | | 2.500% | | | | 9/30/26 | | | | Ba2 | | | | 1,212,387 | |
| | 1,144 | | | Springer Nature Deutschland GmbH, Term Loan B18 | | | 3.750% | | | | 1-Month LIBOR | | | | 3.000% | | | | 8/14/26 | | | | B+ | | | | 1,142,538 | |
| | 1,785 | | | Virgin Media Bristol LLC, Term Loan N | | | 2.593% | | | | 1-Month LIBOR | | | | 2.500% | | | | 1/31/28 | | | | BB+ | | | | 1,759,715 | |
| | 3,222 | | | WideOpenWest Finance LLC, Term Loan B | | | 4.250% | | | | 1-Month LIBOR | | | | 3.250% | | | | 8/19/23 | | | | B | | | | 3,221,012 | |
| | 7,474 | | | Ziggo Financing Partnership, Term Loan I | | | 2.593% | | | | 1-Month LIBOR | | | | 2.500% | | | | 4/30/28 | | | | BB | | | | 7,359,708 | |
| | 94,383 | | | Total Media | | | | | | | | | | | | | | | | | | | | | | | 92,458,014 | |
44
| | | | | | | | | | | | | | | | | | | | | | | | | | | | |
Principal
Amount (000) | | | Description (1) | | Coupon (2) | | | Reference
Rate (2) | | | Spread (2) | | | Maturity (3) | | | Ratings (4) | | | Value | |
| | | |
| | | | Multiline Retail – 0.6% (0.4% of Total Investments) | | | | | | | |
| | | | | | | |
| $ | 459 | | | Belk, Inc., Term Loan | | | 8.500% | | | | 3-Month LIBOR | | | | 7.500% | | | | 7/31/25 | | | | B– | | | $ | 460,677 | |
| | 2,015 | | | Belk, Inc., Term Loan, (cash 5.135%, PIK 8.000%) | | | 13.135% | | | | 3-Month LIBOR | | | | 13.000% | | | | 7/31/25 | | | | CCC– | | | | 1,541,749 | |
| | 1,435 | | | EG America LLC, Term Loan | | | 4.147% | | | | 3-Month LIBOR | | | | 4.000% | | | | 2/05/25 | | | | B– | | | | 1,427,809 | |
| | 3,909 | | | Total Multiline Retail | | | | | | | | | | | | | | | | | | | | | | | 3,430,235 | |
| | | |
| | | | Office Electronics – 0.0% (0.0% of Total Investments) | | | | | | | |
| | | | | | | |
| | 249 | | | Pitney Bowes, Inc., Term Loan B | | | 4.100% | | | | 1-Month LIBOR | | | | 4.000% | | | | 3/19/28 | | | | BBB– | | | | 249,878 | |
| | | |
| | | | Oil, Gas & Consumable Fuels – 3.0% (1.9% of Total Investments) | | | | | | | |
| | | | | | | |
| | 954 | | | BCP Renaissance Parent LLC, Term Loan B | | | 4.500% | | | | 3-Month LIBOR | | | | 3.500% | | | | 11/01/24 | | | | B+ | | | | 943,207 | |
| | 3,061 | | | Buckeye Partners, L.P., Term Loan B | | | 2.354% | | | | 1-Month LIBOR | | | | 2.250% | | | | 11/01/26 | | | | BBB– | | | | 3,037,044 | |
| | 550 | | | DT Midstream Inc, Term Loan, (WI/DD) | | | TBD | | | | TBD | | | | TBD | | | | TBD | | | | Baa2 | | | | 549,263 | |
| | 1,670 | | | Fieldwood Energy LLC, DIP Delayed Draw Term Loan, (5), (6) | | | 9.750% | | | | 1-Month LIBOR | | | | 3.000% | | | | 8/05/21 | | | | N/R | | | | 1,736,844 | |
| | 14,952 | | | Fieldwood Energy LLC, Exit Term Loan, First Lien, (DD1), (6) | | | 0.000% | | | | N/A | | | | N/A | | | | 4/11/22 | | | | N/R | | | | 8,071,452 | |
| | 4,881 | | | Fieldwood Energy LLC, Exit Term Loan, Second Lien, (6) | | | 0.000% | | | | N/A | | | | N/A | | | | 4/11/23 | | | | N/R | | | | 545,073 | |
| | 3,546 | | | Gulf Finance, LLC, Term Loan B | | | 6.250% | | | | 1-Month LIBOR | | | | 5.250% | | | | 8/25/23 | | | | CCC+ | | | | 2,985,504 | |
| | 29,614 | | | Total Oil, Gas & Consumable Fuels | | | | | | | | | | | | | | | | | | | | | | | 17,868,387 | |
| | | |
| | | | Paper & Forest Products – 1.0% (0.6% of Total Investments) | | | | | | | |
| | | | | | | |
| | 2,680 | | | Asplundh Tree Expert, LLC, Term Loan B | | | 1.842% | | | | 1-Month LIBOR | | | | 1.750% | | | | 9/04/27 | | | | BBB– | | | | 2,655,257 | |
| | 1,567 | | | Charter Next Generation Inc, Term Loan | | | 4.477% | | | | 1-Month LIBOR | | | | 3.750% | | | | 12/01/27 | | | | N/R | | | | 1,567,775 | |
| | 1,547 | | | Post Holdings, Inc., Term Loan B | | | 4.750% | | | | 1-Month LIBOR | | | | 4.000% | | | | 10/21/24 | | | | B+ | | | | 1,556,657 | |
| | 5,794 | | | Total Paper & Forest Products | | | | | | | | | | | | | | | | | | | | | | | 5,779,689 | |
| | | |
| | | | Personal Products – 1.8% (1.1% of Total Investments) | | | | | | | |
| | | | | | | |
| | 1,250 | | | Conair Holdings, LLC, Term Loan B | | | 4.250% | | | | 3-Month LIBOR | | | | 3.750% | | | | 5/17/28 | | | | B1 | | | | 1,248,244 | |
| | 162 | | | Coty, Inc., Term Loan B | | | 2.352% | | | | 1-Month LIBOR | | | | 2.250% | | | | 4/05/25 | | | | B | | | | 156,381 | |
| | 1,240 | | | Journey Personal Care Corp., Term Loan B | | | 5.000% | | | | 3-Month LIBOR | | | | 4.250% | | | | 3/01/28 | | | | B | | | | 1,243,490 | |
| | 4,264 | | | Kronos Acquisition Holdings, Inc., Term Loan B | | | 4.250% | | | | 3-Month LIBOR | | | | 3.750% | | | | 12/22/26 | | | | B2 | | | | 4,222,857 | |
| | 5,124 | | | Revlon Consumer Products Corporation, Term Loan B, (DD1), (7) | | | 4.250% | | | | 3-Month LIBOR | | | | 3.500% | | | | 9/07/23 | | | | CC | | | | 4,035,068 | |
| | 12,040 | | | Total Personal Products | | | | | | | | | | | | | | | | | | | | | | | 10,906,040 | |
| | | |
| | | | Pharmaceuticals – 6.2% (3.9% of Total Investments) | | | | | | | |
| | | | | | | |
| | 1,277 | | | Alphabet Holding Company, Inc., Term Loan, First Lien | | | 3.592% | | | | 1-Month LIBOR | | | | 3.500% | | | | 9/26/24 | | | | B2 | | | | 1,276,706 | |
| | 1,954 | | | Amneal Pharmaceuticals LLC, Term Loan B | | | 3.625% | | | | 1-Month LIBOR | | | | 3.500% | | | | 5/04/25 | | | | B | | | | 1,893,899 | |
| | 6,513 | | | Bausch Health Companies, Inc., Term Loan B, (DD1) | | | 3.092% | | | | 1-Month LIBOR | | | | 3.000% | | | | 6/02/25 | | | | BB | | | | 6,474,229 | |
| | 3,359 | | | Bausch Health Companies, Inc., Term Loan B | | | 2.842% | | | | 1-Month LIBOR | | | | 2.750% | | | | 11/27/25 | | | | BB | | | | 3,329,718 | |
| | 1,225 | | | Catalent Pharma Solutions, Inc., Term Loan B3 | | | 2.500% | | | | 1-Month LIBOR | | | | 2.000% | | | | 2/22/28 | | | | BBB– | | | | 1,228,730 | |
| | 1,181 | | | Elanco Animal Health Incorporated, Term Loan B | | | 1.850% | | | | 1-Month LIBOR | | | | 1.750% | | | | 8/01/27 | | | | Baa3 | | | | 1,161,404 | |
| | 3,608 | | | Endo Luxembourg Finance Company I S.a r.l., Term Loan | | | 5.750% | | | | 3-Month LIBOR | | | | 5.000% | | | | 3/25/28 | | | | B | | | | 3,532,442 | |
| | 2,017 | | | Gainwell Acquisition Corp., Term Loan B | | | 4.750% | | | | 3-Month LIBOR | | | | 4.000% | | | | 10/01/27 | | | | BB– | | | | 2,019,641 | |
| | 4,000 | | | Jazz Financing Lux S.a.r.l., Term Loan | | | 4.000% | | | | 1-Month LIBOR | | | | 3.500% | | | | 4/22/28 | | | | BB+ | | | | 4,010,000 | |
| | 7,186 | | | Mallinckrodt International Finance S.A., Term Loan B, (DD1), (6) | | | 6.000% | | | | 6-Month LIBOR | | | | 5.250% | | | | 9/24/24 | | | | D | | | | 7,005,338 | |
| | 1,867 | | | Mallinckrodt International Finance S.A., Term Loan B, (6) | | | 6.250% | | | | 1-Month LIBOR | | | | 5.500% | | | | 2/24/25 | | | | D | | | | 1,813,512 | |
| | 3,000 | | | Organon & Co, Term Loan | | | 3.500% | | | | 3-Month LIBOR | | | | 3.000% | | | | 6/02/28 | | | | BB | | | | 2,996,565 | |
| | 37,187 | | | Total Pharmaceuticals | | | | | | | | | | | | | | | | | | | | | | | 36,742,184 | |
| | | |
| | | | Professional Services – 2.0% (1.2% of Total Investments) | | | | | | | |
| | | | | | | |
| | 746 | | | ASGN Incorporated, Term Loan B3 | | | 1.842% | | | | 1-Month LIBOR | | | | 1.750% | | | | 4/02/25 | | | | BBB– | | | | 747,332 | |
| | 2,195 | | | Ceridian HCM Holding, Inc., Term Loan B | | | 2.584% | | | | 1-Week LIBOR | | | | 2.500% | | | | 4/30/25 | | | | B+ | | | | 2,159,536 | |
| | 1,108 | | | Creative Artists Agency, LLC , Term Loan B | | | 3.842% | | | | 1-Month LIBOR | | | | 3.750% | | | | 11/26/26 | | | | B | | | | 1,097,820 | |
| | 3,053 | | | Dun & Bradstreet Corporation (The), Term Loan | | | 3.336% | | | | 1-Month LIBOR | | | | 3.250% | | | | 2/08/26 | | | | BB+ | | | | 3,030,711 | |
| | 1,455 | | | EAB Global Inc, Term Loan, (WI/DD) | | | TBD | | | | TBD | | | | TBD | | | | TBD | | | | B– | | | | 1,446,452 | |
| | 753 | | | Nielsen Consumer, Inc., Term Loan B | | | 4.103% | | | | 1-Month LIBOR | | | | 4.000% | | | | 3/05/28 | | | | BB | | | | 753,180 | |
45
| | |
| |
| JFR | | Nuveen Floating Rate Income Fund (continued) |
| | Portfolio of Investments July 31, 2021 |
| | | | | | | | | | | | | | | | | | | | | | | | | | | | |
Principal
Amount (000) | | | Description (1) | | Coupon (2) | | | Reference
Rate (2) | | | Spread (2) | | | Maturity (3) | | | Ratings (4) | | | Value | |
| | | |
| | | | Professional Services (continued) | | | | | | | |
| | | | | | | |
| $ | 2,445 | | | Nielsen Finance LLC, Term Loan B4 | | | 2.103% | | | | 1-Month LIBOR | | | | 2.000% | | | | 10/04/23 | | | | BBB– | | | $ | 2,442,433 | |
| | 11,755 | | | Total Professional Services | | | | | | | | | | | | | | | | | | | | | | | 11,677,464 | |
| | | |
| | | | Real Estate Management & Development – 1.4% (0.9% of Total Investments) | | | | | | | |
| | | | | | | |
| | 4,310 | | | Brookfield Property REIT, Inc., Term Loan A2 | | | 3.092% | | | | 1-Month LIBOR | | | | 3.000% | | | | 8/24/23 | | | | BB+ | | | | 4,278,303 | |
| | 3,632 | | | North American Lifting Holdings, Inc., Priority Term Loan | | | 7.500% | | | | 3-Month LIBOR | | | | 6.500% | | | | 10/16/24 | | | | B+ | | | | 3,799,719 | |
| | 7,942 | | | Total Real Estate Management & Development | | | | | | | | | | | | | | | | | | | | | | | 8,078,022 | |
| | | |
| | | | Road & Rail – 2.1% (1.3% of Total Investments) | | | | | | | |
| | | | | | | |
| | 2,278 | | | Avolon TLB Borrower 1 (US) LLC, Term Loan B3 | | | 2.500% | | | | 1-Month LIBOR | | | | 1.750% | | | | 1/15/25 | | | | Baa2 | | | | 2,270,038 | |
| | 853 | | | First Student Bidco Inc, Term Loan, (WI/DD) | | | TBD | | | | TBD | | | | TBD | | | | TBD | | | | BB+ | | | | 848,298 | |
| | 2,313 | | | First Student Bidco Inc, Term Loan, (WI/DD) | | | TBD | | | | TBD | | | | TBD | | | | TBD | | | | BB+ | | | | 2,298,659 | |
| | 2,469 | | | Genesee & Wyoming, Inc., Term Loan | | | 2.147% | | | | 3-Month LIBOR | | | | 2.000% | | | | 12/30/26 | | | | BB+ | | | | 2,449,000 | |
| | 2,058 | | | Hertz Corp, Term Loan, (WI/DD) | | | TBD | | | | TBD | | | | TBD | | | | TBD | | | | B+ | | | | 2,048,297 | |
| | 388 | | | Hertz Corp, Term Loan, (WI/DD) | | | TBD | | | | TBD | | | | TBD | | | | TBD | | | | BB– | | | | 386,020 | |
| | 74 | | | Savage Enterprises LLC, Term Loan B | | | 3.100% | | | | 1-Month LIBOR | | | | 3.000% | | | | 8/01/25 | | | | BB | | | | 73,718 | |
| | 2,166 | | | XPO Logistics, Inc., Term Loan B | | | 1.881% | | | | 3-Month LIBOR | | | | 1.750% | | | | 2/23/25 | | | | BBB– | | | | 2,150,142 | |
| | 12,599 | | | Total Road & Rail | | | | | | | | | | | | | | | | | | | | | | | 12,524,172 | |
| | | |
| | | | Semiconductors & Semiconductor Equipment – 0.5% (0.3% of Total Investments) | | | | | | | |
| | | | | | | |
| | 153 | | | Bright Bidco B.V., Term Loan B, (DD1) | | | 4.500% | | | | 3-Month LIBOR | | | | 3.500% | | | | 6/30/24 | | | | CCC | | | | 123,209 | |
| | 872 | | | CMC Materials, Inc., Term Loan B1 | | | 2.125% | | | | 1-Month LIBOR | | | | 2.000% | | | | 11/15/25 | | | | BBB– | | | | 869,534 | |
| | 1,986 | | | ON Semiconductor Corporation, Term Loan B | | | 2.092% | | | | 1-Month LIBOR | | | | 2.000% | | | | 9/19/26 | | | | Baa3 | | | | 1,967,774 | |
| | 3,011 | | | Total Semiconductors & Semiconductor Equipment | | | | | | | | 2,960,517 | |
| | | |
| | | | Software – 11.1% (6.9% of Total Investments) | | | | | | | |
| | | | | | | |
| | 1,322 | | | Apttus Corporation, Term Loan | | | 5.000% | | | | 3-Month LIBOR | | | | 4.250% | | | | 5/06/28 | | | | BB | | | | 1,327,118 | |
| | 2,063 | | | Blackboard, Inc., Term Loan B5 | | | 7.000% | | | | 3-Month LIBOR | | | | 6.000% | | | | 6/30/24 | | | | B1 | | | | 2,079,756 | |
| | 1,098 | | | By Crown Parent, LLC, Term Loan B1 | | | 4.000% | | | | 1-Month LIBOR | | | | 3.000% | | | | 1/30/26 | | | | B1 | | | | 1,094,371 | |
| | 926 | | | Camelot U.S. Acquisition 1 Co., Term Loan B | | | 3.092% | | | | 1-Month LIBOR | | | | 3.000% | | | | 10/31/26 | | | | B1 | | | | 918,145 | |
| | 2,992 | | | Delta TopCo, Inc., Term Loan B | | | 4.500% | | | | 3-Month LIBOR | | | | 3.750% | | | | 12/01/27 | | | | B2 | | | | 2,994,999 | |
| | 811 | | | Dynatrace LLC, Term Loan, First Lien | | | 2.342% | | | | 1-Month LIBOR | | | | 2.250% | | | | 8/23/25 | | | | BB+ | | | | 808,114 | |
| | 6,895 | | | Epicor Software Corporation, Term Loan | | | 4.000% | | | | 1-Month LIBOR | | | | 3.250% | | | | 7/31/27 | | | | B2 | | | | 6,882,830 | |
| | 4,571 | | | Finastra USA, Inc., Term Loan, First Lien | | | 4.500% | | | | 6-Month LIBOR | | | | 3.500% | | | | 6/13/24 | | | | BB– | | | | 4,506,364 | |
| | 680 | | | Greenway Health, LLC, Term Loan, First Lien | | | 4.750% | | | | 3-Month LIBOR | | | | 3.750% | | | | 2/16/24 | | | | B– | | | | 652,384 | |
| | 3,433 | | | Informatica LLC,, Term Loan B | | | 3.342% | | | | 1-Month LIBOR | | | | 3.250% | | | | 2/14/27 | | | | B1 | | | | 3,401,717 | |
| | 869 | | | iQor US, Inc., Second Out Term Loan | | | 8.500% | | | | 3-Month LIBOR | | | | 7.500% | | | | 11/19/25 | | | | CCC+ | | | | 858,161 | |
| | 2,152 | | | MA FinanceCo., LLC, Term Loan B | | | 5.250% | | | | 3-Month LIBOR | | | | 4.250% | | | | 6/05/25 | | | | BB | | | | 2,167,269 | |
| | 1,532 | | | MA FinanceCo., LLC, Term Loan B3 | | | 2.842% | | | | 1-Month LIBOR | | | | 2.750% | | | | 6/21/24 | | | | BB | | | | 1,514,346 | |
| | 3,139 | | | McAfee, LLC, Term Loan B | | | 3.840% | | | | 1-Month LIBOR | | | | 3.750% | | | | 9/29/24 | | | | BB | | | | 3,139,755 | |
| | 667 | | | Mitchell International, Inc., Term Loan, Second Lien | | | 7.342% | | | | 1-Month LIBOR | | | | 7.250% | | | | 11/30/25 | | | | CCC | | | | 670,727 | |
| | 1,670 | | | Perforce Software, Inc., Term Loan B | | | 3.842% | | | | 1-Month LIBOR | | | | 3.750% | | | | 7/01/26 | | | | B2 | | | | 1,653,193 | |
| | 2,500 | | | Polaris Newco LLC, Term Loan B | | | 4.500% | | | | 6-Month LIBOR | | | | 4.000% | | | | 6/04/28 | | | | B2 | | | | 2,501,275 | |
| | 3,277 | | | Proofpoint Inc, Term Loan, (WI/DD) | | | TBD | | | | TBD | | | | TBD | | | | TBD | | | | BB– | | | | 3,249,145 | |
| | 2,090 | | | RealPage, Inc, Term Loan, First Lien | | | 3.750% | | | | 1-Month LIBOR | | | | 3.250% | | | | 4/22/28 | | | | B+ | | | | 2,079,947 | |
| | 10,347 | | | Seattle Spinco, Inc., Term Loan B3 | | | 2.842% | | | | 1-Month LIBOR | | | | 2.750% | | | | 6/21/24 | | | | BB | | | | 10,226,754 | |
| | 2,912 | | | Sophia, L.P., Term Loan, First Lien | | | 4.500% | | | | 3-Month LIBOR | | | | 3.750% | | | | 10/07/27 | | | | B | | | | 2,913,653 | |
| | 1,296 | | | SS&C European Holdings Sarl, Term Loan B4 | | | 1.842% | | | | 1-Month LIBOR | | | | 1.750% | | | | 4/16/25 | | | | BB+ | | | | 1,279,339 | |
| | 1,636 | | | SS&C Technologies, Inc., Term Loan B3 | | | 1.842% | | | | 1-Month LIBOR | | | | 1.750% | | | | 4/16/25 | | | | BB+ | | | | 1,614,951 | |
| | 1,644 | | | Tibco Software, Inc., Term Loan B3 | | | 3.850% | | | | 1-Month LIBOR | | | | 3.750% | | | | 7/03/26 | | | | B+ | | | | 1,632,029 | |
| | 1,299 | | | Ultimate Software Group Inc(The), Incremental Term Loan | | | 4.000% | | | | 3-Month LIBOR | | | | 3.250% | | | | 5/03/26 | | | | B1 | | | | 1,299,621 | |
| | 982 | | | Ultimate Software Group Inc(The), Term Loan B | | | 3.842% | | | | 1-Month LIBOR | | | | 3.750% | | | | 5/03/26 | | | | B1 | | | | 983,158 | |
| | 2,047 | | | ZoomInfo LLC, Term Loan B, (DD1) | | | 3.092% | | | | 1-Month LIBOR | | | | 3.000% | | | | 2/01/26 | | | | BB | | | | 2,047,998 | |
| | 1,024 | | | ZoomInfo LLC, Term Loan B, (DD1) | | | 3.092% | | | | 3-Month LIBOR | | | | 3.000% | | | | 2/01/26 | | | | BB | | | | 1,023,999 | |
| | 65,874 | | | Total Software | | | | | | | | | | | | | | | | | | | | | | | 65,521,118 | |
| | | |
| | | | Specialty Retail – 2.9% (1.8% of Total Investments) | | | | | | | |
| | | | | | | |
| | 1,197 | | | Academy, Ltd., Term Loan | | | 4.500% | | | | 1-Month LIBOR | | | | 3.750% | | | | 5/01/69 | | | | N/R | | | | 1,199,244 | |
| | 1,357 | | | Birkenstock US BidCo Inc, Term Loan, (WI/DD) | | | TBD | | | | TBD | | | | TBD | | | | TBD | | | | BB– | | | | 1,355,867 | |
| | 2,080 | | | Jo-Ann Stores, Inc., Term Loan B1 | | | 5.500% | | | | 3-Month LIBOR | | | | 4.750% | | | | 6/30/28 | | | | B | | | | 2,074,020 | |
46
| | | | | | | | | | | | | | | | | | | | | | | | | | | | |
Principal
Amount (000) | | | Description (1) | | Coupon (2) | | | Reference
Rate (2) | | | Spread (2) | | | Maturity (3) | | | Ratings (4) | | | Value | |
| | | |
| | | | Specialty Retail (continued) | | | | | | | |
| | | | | | | |
| $ | 524 | | | LBM Acquisition LLC, Term Loan, (WI/DD) | | | TBD | | | | TBD | | | | TBD | | | | TBD | | | | B+ | | | $ | 517,885 | |
| | 262 | | | LBM Acquisition LLC, Term Loan, (WI/DD), (5) | | | TBD | | | | TBD | | | | TBD | | | | TBD | | | | B+ | | | | 258,943 | |
| | 1,349 | | | Mattress Firm Inc, Term Loan B | | | 6.250% | | | | 6-Month LIBOR | | | | 5.250% | | | | 11/25/27 | | | | B+ | | | | 1,375,420 | |
| | 9,410 | | | PetSmart, Inc., Term Loan B | | | 4.500% | | | | 6-Month LIBOR | | | | 3.750% | | | | 2/12/28 | | | | BB– | | | | 9,418,234 | |
| | 774 | | | Staples, Inc., Term Loan | | | 5.176% | | | | 3-Month LIBOR | | | | 5.000% | | | | 4/12/26 | | | | B | | | | 752,251 | |
| | 16,953 | | | Total Specialty Retail | | | | | | | | | | | | | | | | | | | | | | | 16,951,864 | |
| | | |
| | | | Technology Hardware, Storage & Peripherals – 2.5% (1.6% of Total Investments) | | | | | | | |
| | | | | | | |
| | 2,389 | | | Conduent Business Services, LLC, Term Loan A | | | 1.842% | | | | 1-Month LIBOR | | | | 1.750% | | | | 12/07/22 | | | | BB– | | | | 2,371,270 | |
| | 8,482 | | | Dell International LLC, Term Loan B | | | 2.000% | | | | 1-Month LIBOR | | | | 1.750% | | | | 9/19/25 | | | | BBB– | | | | 8,479,306 | |
| | 782 | | | NCR Corporation, Term Loan | | | 2.630% | | | | 3-Month LIBOR | | | | 2.500% | | | | 8/28/26 | | | | BB+ | | | | 767,338 | |
| | 1,496 | | | Peraton Corp., Term Loan B | | | 4.500% | | | | 1-Month LIBOR | | | | 3.750% | | | | 2/01/28 | | | | BB– | | | | 1,497,185 | |
| | 993 | | | Tech Data Corporation, Term Loan | | | 3.592% | | | | 1-Month LIBOR | | | | 3.500% | | | | 7/01/25 | | | | BBB– | | | | 994,465 | |
| | 669 | | | Western Digital Corporation, Term Loan B4 | | | 1.842% | | | | 1-Month LIBOR | | | | 1.750% | | | | 4/29/23 | | | | Baa2 | | | | 669,804 | |
| | 14,811 | | | Total Technology Hardware, Storage & Peripherals | | | | | | | | 14,779,368 | |
| | | |
| | | | Textiles, Apparel & Luxury Goods – 0.2% (0.1% of Total Investments) | | | | | | | |
| | | | | | | |
| | 1,035 | | | CBI Buyer, Inc., Term Loan | | | 3.750% | | | | 3-Month LIBOR | | | | 3.250% | | | | 1/06/28 | | | | B1 | | | | 1,028,143 | |
| | 292 | | | Samsonite IP Holdings Sarl, Term Loan | | | 5.500% | | | | 1-Month LIBOR | | | | 4.500% | | | | 4/25/25 | | | | N/R | | | | 290,358 | |
| | 1,327 | | | Total Textiles, Apparel & Luxury Goods | | | | | | | | | | | | | | | | | | | | | | | 1,318,501 | |
| | | |
| | | | Transportation Infrastructure – 0.4% (0.2% of Total Investments) | | | | | | | |
| | | | | | | |
| | 975 | | | Atlantic Aviation FBO, Inc., Term Loan B | | | 3.850% | | | | 1-Month LIBOR | | | | 3.750% | | | | 12/06/25 | | | | BB | | | | 971,651 | |
| | 1,350 | | | KKR Apple Bidco LLC, Term Loan, (WI/DD) | | | TBD | | | | TBD | | | | TBD | | | | TBD | | | | B+ | | | | 1,342,197 | |
| | 2,325 | | | Total Transportation Infrastructure | | | | | | | | | | | | | | | | | | | | | | | 2,313,848 | |
| | | |
| | | | Wireless Telecommunication Services – 0.3% (0.2% of Total Investments) | | | | | | | |
| | | | | | | |
| | 586 | | | Altice Financing SA, Term Loan, First Lien | | | 2.900% | | | | 3-Month LIBOR | | | | 2.750% | | | | 1/31/26 | | | | B | | | | 575,213 | |
| | 1,200 | | | GOGO Intermediate Holdings LLC, Term Loan B | | | 4.500% | | | | 3-Month LIBOR | | | | 3.750% | | | | 4/30/28 | | | | B– | | | | 1,196,442 | |
| | 1,786 | | | Total Wireless Telecommunication Services | | | | | | | | | | | | | | | | | | | | | | | 1,771,655 | |
| | 838,698 | | | Total Variable Rate Senior Loan Interests (cost $818,959,319) | | | | | | | | 814,118,190 | |
| | | | | | | |
Principal
Amount (000) | | | Description (1) | | | | | | | | Coupon | | | Maturity | | | Ratings (4) | | | Value | |
| | | |
| | | | CORPORATE BONDS – 11.0% (6.8% of Total Investments) | | | | | | | |
| |
| | | | Auto Components – 0.9% (0.5% of Total Investments) | |
| | | | | | | |
| $ | 2,740 | | | Adient Global Holdings Ltd, 144A | | | | | | | | | | | 4.875% | | | | 8/15/26 | | | | B | | | $ | 2,801,650 | |
| | 2,025 | | | Adient US LLC, 144A | | | | | | | | | | | 9.000% | | | | 4/15/25 | | | | BB– | | | | 2,213,730 | |
| | 4,765 | | | Total Auto Components | | | | | | | | | | | | | | | | | | | | | | | 5,015,380 | |
| |
| | | | Chemicals – 0.3% (0.2% of Total Investments) | |
| | | | | | | |
| | 840 | | | Olin Corp, 144A | | | | | | | | | | | 9.500% | | | | 6/01/25 | | | | BB | | | | 1,048,950 | |
| | 750 | | | Rayonier AM Products Inc, 144A | | | | | | | | | | | 7.625% | | | | 1/15/26 | | | | B1 | | | | 770,625 | |
| | 1,590 | | | Total Chemicals | | | | | | | | | | | | | | | | | | | | | | | 1,819,575 | |
| |
| | | | Commercial Services & Supplies – 0.3% (0.2% of Total Investments) | |
| | | | | | |
| | 2,000 | | | Prime Security Services Borrower LLC / Prime Finance Inc, 144A | | | | | | | | 3.375% | | | | 8/31/27 | | | | BB– | | | | 1,945,400 | |
| |
| | | | Communications Equipment – 0.4% (0.3% of Total Investments) | |
| | | | | | | |
| | 1,500 | | | CommScope Inc, 144A | | | | | | | | | | | 8.250% | | | | 3/01/27 | | | | B– | | | | 1,588,125 | |
| | 1,000 | | | CommScope Technologies LLC, 144A | | | | | | | | | | | 5.000% | | | | 3/15/27 | | | | B– | | | | 1,011,800 | |
| | 2,500 | | | Total Communications Equipment | | | | | | | | | | | | | | | | | | | | | | | 2,599,925 | |
| |
| | | | Diversified Telecommunication Services – 0.4% (0.3% of Total Investments) | |
| | | | | | | |
| | 1,500 | | | Avaya Inc, 144A | | | | | | | | | | | 6.125% | | | | 9/15/28 | | | | B+ | | | | 1,605,000 | |
| | 845 | | | Windstream Escrow LLC / Windstream Escrow Finance Corp, 144A | | | | | | | | 7.750% | | | | 8/15/28 | | | | BB | | | | 861,900 | |
| | 2,345 | | | Total Diversified Telecommunication Services | | | | | | | | | | | | | | | | | | | | | | | 2,466,900 | |
47
| | |
| |
| JFR | | Nuveen Floating Rate Income Fund (continued) |
| | Portfolio of Investments July 31, 2021 |
| | | | | | | | | | | | | | | | | | | | | | | | | | |
Principal
Amount (000) | | | Description (1) | | | | | | | Coupon | | | Maturity | | | Ratings (4) | | | Value | |
| |
| | | | Electric Utilities – 0.6% (0.4% of Total Investments) | |
| | | | | |
| $ | 4,250 | | | Bruce Mansfield Unit 1 2007 Pass-Through Trust, (6) | | | | 6.850% | | | | 6/01/34 | | | | N/R | | | $ | 5,313 | |
| | 1,025 | | | Pacific Gas and Electric Co | | | | | | | | | 3.850% | | | | 11/15/23 | | | | BBB– | | | | 1,071,091 | |
| | 638 | | | Pacific Gas and Electric Co | | | | | | | | | 3.450% | | | | 7/01/25 | | | | BBB– | | | | 664,900 | |
| | 590 | | | Pacific Gas and Electric Co | | | | | | | | | 3.300% | | | | 12/01/27 | | | | BBB– | | | | 602,507 | |
| | 637 | | | Pacific Gas and Electric Co | | | | | | | | | 3.750% | | | | 7/01/28 | | | | BBB– | | | | 666,807 | |
| | 633 | | | Pacific Gas and Electric Co | | | | | | | | | 4.550% | | | | 7/01/30 | | | | BBB– | | | | 674,980 | |
| | 7,773 | | | Total Electric Utilities | | | | | | | | | | | | | | | | | | | | | 3,685,598 | |
| |
| | | | Energy Equipment & Services – 0.2% (0.1% of Total Investments) | |
| | | | | | | |
| | 974 | | | Bausch Health Cos Inc, 144A | | | | | | | | | 6.125% | | | | 4/15/25 | | | | B | | | | 994,089 | |
| |
| | | | Entertainment – 0.4% (0.2% of Total Investments) | |
| | | | | | | |
| | 2,025 | | | AMC Entertainment Holdings Inc, 144A | | | | | | | | | 10.500% | | | | 4/15/25 | | | | B– | | | | 2,152,980 | |
| |
| | | | Equity Real Estate Investment Trust – 0.7% (0.4% of Total Investments) | |
| | | | | |
| | 3,880 | | | Uniti Group LP / Uniti Fiber Holdings Inc / CSL Capital LLC, 144A | | | | 7.875% | | | | 2/15/25 | | | | B | | | | 4,132,200 | |
| |
| | | | Gas Utilities – 0.1% (0.1% of Total Investments) | |
| | | | | |
| | 350 | | | NGL Energy Partners LP / NGL Energy Finance Corp | | | | 7.500% | | | | 11/01/23 | | | | CCC+ | | | | 333,375 | |
| | 350 | | | NGL Energy Partners LP / NGL Energy Finance Corp | | | | 6.125% | | | | 3/01/25 | | | | CCC+ | | | | 297,500 | |
| | 700 | | | Total Gas Utilities | | | | | | | | | | | | | | | | | | | | | 630,875 | |
| | | |
| | | | Health Care Providers & Services – 1.7% (1.1% of Total Investments) | | | | | | | |
| | | | | | | |
| | 1,940 | | | CHS/Community Health Systems Inc, 144A | | | | | | | | | 8.000% | | | | 3/15/26 | | | | B | | | | 2,079,913 | |
| | 375 | | | CHS/Community Health Systems Inc, 144A | | | | | | | | | 8.000% | | | | 12/15/27 | | | | B | | | | 414,754 | |
| | 165 | | | HCA Inc | | | | | | | | | 5.375% | | | | 2/01/25 | | | | Baa3 | | | | 187,011 | |
| | 4,100 | | | Legacy LifePoint Health LLC, 144A | | | | | | | | | 4.375% | | | | 2/15/27 | | | | B1 | | | | 4,110,250 | |
| | 415 | | | Tenet Healthcare Corp | | | | | | | | | 4.625% | | | | 7/15/24 | | | | B+ | | | | 420,187 | |
| | 1,250 | | | Tenet Healthcare Corp, 144A | | | | | | | | | 7.500% | | | | 4/01/25 | | | | B+ | | | | 1,343,750 | |
| | 1,365 | | | Tenet Healthcare Corp, 144A | | | | | | | | | 6.250% | | | | 2/01/27 | | | | B1 | | | | 1,421,306 | |
| | 9,610 | | | Total Health Care Providers & Services | | | | | | | | | | | | | | | | | | | | | 9,977,171 | |
| | | |
| | | | Hotels, Restaurants & Leisure – 0.0% (0.0% of Total Investments) | | | | | | | |
| | | | | | | |
| | 97 | | | Carnival Corp, 144A | | | | | | | | | 11.500% | | | | 4/01/23 | | | | Ba2 | | | | 109,367 | |
| | | |
| | | | Household Durables – 0.1% (0.0% of Total Investments) | | | | | | | |
| | | | | | |
| | 295 | | | Kronos Acquisition Holdings Inc / KIK Custom Products Inc, 144A | | | | | | | 5.000% | | | | 12/31/26 | | | | B2 | | | | 299,131 | |
| | | | | | | |
| | | | Media – 2.2% (1.4% of Total Investments) | | | | | | | | | | | | | | | | | |
| | | | | | | |
| | 1,250 | | | Clear Channel Outdoor Holdings Inc, 144A | | | | | | | | | 7.750% | | | | 4/15/28 | | | | CCC | | | | 1,303,525 | |
| | 2,250 | | | Diamond Sports Group LLC / Diamond Sports Finance Co, 144A | | | | 5.375% | | | | 8/15/26 | | | | CCC+ | | | | 1,305,000 | |
| | 2,000 | | | Diamond Sports Group LLC / Diamond Sports Finance Co, 144A | | | | 6.625% | | | | 8/15/27 | | | | CCC– | | | | 792,500 | |
| | 2,800 | | | Houghton Mifflin Harcourt Publishers Inc, 144A | | | | | | | | | 9.000% | | | | 2/15/25 | | | | BB+ | | | | 2,982,000 | |
| | 5 | | | iHeartCommunications Inc | | | | | | | | | 6.375% | | | | 5/01/26 | | | | B+ | | | | 4,872 | |
| | 1,481 | | | iHeartCommunications Inc | | | | | | | | | 8.375% | | | | 5/01/27 | | | | CCC+ | | | | 1,575,849 | |
| | 3,080 | | | iHeartCommunications Inc, 144A | | | | | | | | | 5.250% | | | | 8/15/27 | | | | B+ | | | | 3,210,407 | |
| | 605 | | | Intelsat Luxembourg SA, (6) | | | | | | | | | 8.125% | | | | 6/01/23 | | | | N/R | | | | 16,638 | |
| | 1,590 | | | Univision Communications Inc, 144A | | | | | | | | | 9.500% | | | | 5/01/25 | | | | B | | | | 1,737,075 | |
| | 15,061 | | | Total Media | | | | | | | | | | | | | | | | | | | | | 12,927,866 | |
| | | | | | |
| | | | Metals & Mining – 0.2% (0.1% of Total Investments) | | | | | | | | | | | | | | | |
| | | | | | | |
| | 1,220 | | | First Quantum Minerals Ltd, 144A | | | | | | | | | 6.875% | | | | 10/15/27 | | | | B | | | | 1,322,175 | |
| | | | | | |
| | | | Oil, Gas & Consumable Fuels – 2.1% (1.3% of Total Investments) | | | | | | | | | | | | | | | |
| | | | | | | |
| | 1,250 | | | Baytex Energy Corp, 144A | | | | | | | | | 5.625% | | | | 6/01/24 | | | | B+ | | | | 1,246,875 | |
| | 4,200 | | | Citgo Holding Inc, 144A | | | | | | | | | 9.250% | | | | 8/01/24 | | | | B+ | | | | 4,188,849 | |
| | 1,480 | | | CITGO Petroleum Corp, 144A | | | | | | | | | 7.000% | | | | 6/15/25 | | | | BB | | | | 1,519,338 | |
| | 900 | | | Gulfport Energy Operating Corp, 144A | | | | | | | | | 8.000% | | | | 5/17/26 | | | | BB– | | | | 958,923 | |
| | 1,500 | | | NGL Energy Operating LLC / NGL Energy Finance Corp, 144A | | | | 7.500% | | | | 2/01/26 | | | | BB– | | | | 1,541,250 | |
| | 350 | | | NGL Energy Partners LP / NGL Energy Finance Corp | | | | 7.500% | | | | 4/15/26 | | | | CCC+ | | | | 294,914 | |
| | 1,350 | | | PBF Holding Co LLC / PBF Finance Corp, 144A | | | | | | | | | 9.250% | | | | 5/15/25 | | | | BB | | | | 1,235,250 | |
| | 2,625 | | | PBF Holding Co LLC / PBF Finance Corp | | | | | | | | | 6.000% | | | | 2/15/28 | | | | B+ | | | | 1,370,775 | |
| | 13,655 | | | Total Oil, Gas & Consumable Fuels | | | | | | | | | | | | | | | | | | | | | 12,356,174 | |
48
| | | | | | | | | | | | | | | | | | | | | | | | | | |
Principal
Amount (000) | | | Description (1) | | | | | | | Coupon | | | Maturity | | | Ratings (4) | | | Value | |
| | | |
| | | | Pharmaceuticals – 0.2% (0.1% of Total Investments) | | | | | | | |
| | | | | | |
| $ | 831 | | | Endo Dac / Endo Finance LLC / Endo Finco Inc, 144A | | | | | | | 6.000% | | | | 6/30/28 | | | | CCC | | | $ | 560,925 | |
| | 329 | | | Par Pharmaceutical Inc, 144A | | | | | | | | | 7.500% | | | | 4/01/27 | | | | B | | | | 335,580 | |
| | 1,160 | | | Total Pharmaceuticals | | | | | | | | | | | | | | | | | | | | | 896,505 | |
| | | |
| | | | Specialty Retail – 0.2% (0.1% of Total Investments) | | | | | | | |
| | | | | | | |
| | 850 | | | Party City Holdings Inc, 144A | | | | | | | | | 8.750% | | | | 2/15/26 | | | | CCC+ | | | | 899,912 | |
| | 300 | | | PetSmart Inc / PetSmart Finance Corp, 144A | | | | | | | | | 7.750% | | | | 2/15/29 | | | | CCC+ | | | | 328,881 | |
| | 1,150 | | | Total Specialty Retail | | | | | | | | | | | | | | | | | | | | | 1,228,793 | |
| | 70,800 | | | Total Corporate Bonds (cost $63,796,861) | | | | | | | | | | | | | | | | | | | | | 64,560,104 | |
| | |
| Shares | | | Description (1) | | | Value | |
| | |
| | | | COMMON STOCKS – 3.6% (2.2% of Total Investments) | | | | | |
| | |
| | | | Banks – 0.1% (0.1% of Total Investments) | | | | |
| | |
| | 30,335 | | | iQor US Inc, (8), (9) | | | $ | 409,522 | |
| | |
| | | | Communications Equipment – 0.1% (0.0% of Total Investments) | | | | |
| | |
| | 24,553 | | | Windstream Services PE LLC, (8), (9) | | | | 356,019 | |
| | |
| | | | Construction & Engineering – 0.0% (0.0% of Total Investments) | | | | |
| | |
| | 3,607 | | | TNT Crane & Rigging Inc, (7), (9) | | | | 4 | |
| | 2,034 | | | TNT Crane & Rigging Inc, (8), (9) | | | | 36,232 | |
| | | | Total Construction & Engineering | | | | 36,236 | |
| | |
| | | | Diversified Consumer Services – 0.1% (0.0% of Total Investments) | | | | |
| | |
| | 18,448 | | | Cengage Learning Holdings II Inc, (8), (9) | | | | 393,182 | |
| | |
| | | | Diversified Telecommunication Services – 0.0% (0.0% of Total Investments) | | | | |
| | |
| | 18,781 | | | Windstream Services PE LLC, (8), (9) | | | | 273,508 | |
| | |
| | | | Electric Utilities – 0.5% (0.3% of Total Investments) | | | | |
| | |
| | 91,757 | | | Energy Harbor Corp, (8), (9), (10) | | | | 3,177,086 | |
| | |
| | | | Energy Equipment & Services – 0.1% (0.0% of Total Investments) | | | | |
| | |
| | 83,230 | | | Transocean Ltd, (9) | | | | 300,460 | |
| | 7,777 | | | Vantage Drilling International, (8), (9) | | | | 29,164 | |
| | | | Total Energy Equipment & Services | | | | 329,624 | |
| | |
| | | | Entertainment – 0.6% (0.4% of Total Investments) | | | | |
| | |
| | 26,045 | | | Metro-Goldwyn-Mayer Inc, (8), (9) | | | | 3,405,384 | |
| | |
| | | | Health Care Providers & Services – 0.0% (0.0% of Total Investments) | | | | |
| | |
| | 68,990 | | | Millennium Health LLC, (7), (9) | | | | 71,750 | |
| | 64,762 | | | Millennium Health LLC, (7), (9) | | | | 60,876 | |
| | | | Total Health Care Providers & Services | | | | 132,626 | |
| | |
| | | | Hotels, Restaurants & Leisure – 0.2% (0.1% of Total Investments) | | | | |
| | |
| | 138,556 | | | 24 Hour Fitness Worldwide Inc, (8) | | | | 363,709 | |
| | 291,314 | | | 24 Hour Fitness Worldwide Inc, (8), (9) | | | | 582,628 | |
| | | | Total Hotels, Restaurants & Leisure | | | | 946,337 | |
| | |
| | | | Internet & Direct Marketing Retail – 0.0% (0.0% of Total Investments) | | | | |
| | |
| | 17,539 | | | Catalina Marketing Corp, (8), (9) | | | | 52,617 | |
| | |
| | | | Marine – 0.0% (0.0% of Total Investments) | | | | |
| | |
| | 860 | | | ACBL HLDG CORP, (8), (9) | | | | 18,060 | |
| | |
| | | | Media – 0.2% (0.2% of Total Investments) | | | | |
| | |
| | 539,694 | | | Clear Channel Outdoor Holdings Inc, (9) | | | | 1,435,586 | |
| | 8 | | | Cumulus Media Inc, (9) | | | | 95 | |
49
| | |
| |
| JFR | | Nuveen Floating Rate Income Fund (continued) |
| | Portfolio of Investments July 31, 2021 |
| | | | | | | | | | | | | | | | | | | | | | | | | | |
| | |
| Shares | | | Description (1) | | | Value | |
| | |
| | | | Media (continued) | | | | |
| | 1,973,746 | | | Hibu plc, (8), (9) | | | $ | 13,816 | |
| | 45,942 | | | Tribune Co, (7), (9) | | | | 46 | |
| | | | Total Media | | | | 1,449,543 | |
| | |
| | | | Multiline Retail – 0.0% (0.0% of Total Investments) | | | | |
| | |
| | 274 | | | Belk Inc, (8), (9) | | | | 6,576 | |
| | |
| | | | Oil, Gas & Consumable Fuels – 1.6% (1.0% of Total Investments) | | | | |
| | |
| | 171,257 | | | California Resources Corp, (9) | | | | 4,814,033 | |
| | 111,960 | | | California Resources Corp, (9) | | | | 3,147,196 | |
| | 31,131 | | | Whiting Petroleum Corp, (9) | | | | 1,460,044 | |
| | | | Total Oil, Gas & Consumable Fuels | | | | 9,421,273 | |
| | |
| | | | Professional Services – 0.1% (0.1% of Total Investments) | | | | |
| | |
| | 103,578 | | | Skillsoft Corp, (7), (9) | | | | 737,174 | |
| | | | Total Common Stocks (cost $34,461,932) | | | | 21,144,767 | |
| | | | | | |
| Shares | | | Description (1) | | | | | | | | | | | | | | Value | |
| | | | | |
| | | | INVESTMENT COMPANIES – 2.0% (1.2% of Total Investments) | | | | | | | | | | | | | | | | | |
| | | | | | |
| | 353,668 | | | Eaton Vance Floating-Rate Income Trust | | | | | | | | | | | | | | | | | | $ | 5,106,966 | |
| | 968,586 | | | Eaton Vance Senior Income Trust | | | | | | | | | | | | | | | | | | | 6,470,154 | |
| | | | Total Investment Companies (cost $11,981,509) | | | | | | | | | | | | | | | | | | | 11,577,120 | |
| | | | | | |
Principal
Amount (000) | | | Description (1) | | | | | Coupon | | | Maturity | | | Ratings (4) | | | Value | |
| | | | |
| | | | ASSET-BACKED SECURITIES – 0.6% ( 0.4% of Total Investments) | | | | | | | | | | | | | |
| | | | | | |
| $ | 1,200 | | | Dryden 50 Senior Loan Fund, 144A, (3-Month LIBOR reference rate + 6.260% spread), (11) | | | | | | | 6.386% | | | | 7/15/30 | | | | Ba3 | | | $ | 1,184,492 | |
| | 600 | | | Flatiron CLO 19 Ltd, 144A, (3-Month LIBOR reference rate + 7.200% spread), (11) | | | | | | | 7.356% | | | | 11/16/32 | | | | BB– | | | | 600,863 | |
| | 1,250 | | | Gilbert Park CLO Ltd, 144A, (3-Month LIBOR reference rate + 6.400% spread), (11) | | | | | | | 6.526% | | | | 10/15/30 | | | | Ba3 | | | | 1,249,979 | |
| | 600 | | | Neuberger Berman Loan Advisers CLO 28 Ltd, 144A, (3-Month LIBOR reference rate + 5.600% spread), (11) | | | | | | | 5.734% | | | | 4/20/30 | | | | BB– | | | | 590,479 | |
| | 3,650 | | | Total Asset-Backed Securities (cost $3,615,632) | | | | | | | | | | | | | | | | | | | 3,625,813 | |
| | | | | | |
| Shares | | | Description (1) | | | | | | | | | | | | | | Value | |
| | | | | | |
| | | | WARRANTS – 0.1% (0.0% of Total Investments) | | | | | | | | | | | | | | | | | | | | |
| | | | |
| | | | Communications Equipment – 0.0% (0.0% of Total Investments) | | | | | | | | | | | | | |
| | | | | | |
| | 21,002 | | | Avaya Holdings Corp, (8) | | | | | | | | | | | | | | | | | | $ | 135,253 | |
| | | | | | |
| | | | Marine – 0.1% (0.0% of Total Investments) | | | | | | | | | | | | | | | |
| | | | | | |
| | 904 | | | ACBL HLDG CORP, (8) | | | | | | | | | | | | | | | | | | | 18,984 | |
| | 3,363 | | | ACBL HLDG CORP, (8) | | | | | | | | | | | | | | | | | | | 84,636 | |
| | 2,558 | | | ACBL HLDG CORP, (8) | | | | | | | | | | | | | | | | | | | 75,461 | |
| | 13,452 | | | American Commercial Barge Line LLC, (7) | | | | | | | | | | | | | | | | | | | 4,345 | |
| | | | Total Marine | | | | | | | | | | | | | | | | | | | 183,426 | |
| | | | |
| | | | Industrial Conglomerates – 0.0% (0.0% of Total Investments) | | | | | | | | | | |
| | | | | | |
| | 10,232 | | | American Commercial Barge Line LLC, (7) | | | | | | | | | | | | | | | | | | | 4,410 | |
| | | | | | |
| | | | Oil, Gas & Consumable Fuels – 0.0% (0.0% of Total Investments) | | | | | | | | | | | | | | | |
| | | | | | |
| | 439 | | | California Resources Corp | | | | | | | | | | | | | | | | | | | 2,384 | |
50
| | | | | | | | | | | | | | | | | | | | | | | | | | | | |
| | | | | | |
| Shares | | | Description (1) | | | | | | | | | | | | | | | Value | |
| | | | | | |
| | | | Entertainment – 0.0% (0.0% of Total Investments) | | | | | | | | | | | | | | | | |
| | | | | | |
| | 224,650 | | | Cineworld Warrant, (8) | | | | | | | | | | | | | | | | | | | $ | 88,063 | |
| | | | Total Warrants (cost $2,119,370) | | | | | | | | | | | | | | | | | | | | 413,536 | |
| | | | | | |
| Shares | | | Description (1) | | | | | | Coupon | | | | | | Ratings (4) | | | Value | |
| | | |
| | | | CONVERTIBLE PREFERRED SECURITIES – 0.0% (0.0% of Total Investments) | | | | | | | | | |
| | | | | | |
| | | | Marine – 0.0% (0.0% of Total Investments) | | | | | | | | | | | | | | | | |
| | | | | | |
| | 3,200 | | | ACBL HLDG CORP, (8), (9) | | | | | | | | 0.000% | | | | | | | | N/R | | | $ | 80,534 | |
| | 3,642 | | | ACBL HLDG CORP, (8), (9) | | | | | | | | 0.000% | | | | | | | | N/R | | | | 107,439 | |
| | | | Total Marine | | | | | | | | | | | | | | | | | | | | 187,973 | |
| | | | Total Convertible Preferred Securities (cost $194,281) | | | | | | | | | | | | | | | | | | | | 187,973 | |
| | | | | | |
| Shares | | | Description (1) | | | | | | | | | | | | | | | Value | |
| | | | | |
| | | | COMMON STOCK RIGHTS – 0.0% (0.0% of Total Investments) | | | | | | | | | | | | | | | | | |
| | | | | |
| | | | Oil, Gas & Consumable Fuels – 0.0% (0.0% of Total Investments) | | | | | | | | | | | | | |
| | | | | | |
| | 13,053 | | | Fieldwood Energy Inc, (8), (9) | | | | | | | | | | | | | | | | | | | $ | 13 | |
| | 2,637 | | | Fieldwood Energy Inc, (8), (9) | | | | | | | | | | | | | | | | | | | | 3 | |
| | | | Total Oil, Gas & Consumable Fuels | | | | | | | | | | | | | | | | | | | | 16 | |
| | | | Total Common Stock Rights (cost $372,581) | | | | | | | | | | | | | | | | | | | | 16 | |
| | | | Total Long-Term Investments (cost $935,501,485) | | | | | | | | | | | | | | | | | | | | 915,627,519 | |
| | | | | | | |
| Shares | | | Description (1) | | | | | | | | Coupon | | | | | | | | | Value | |
| | | |
| | | | SHORT-TERM INVESTMENTS – 6.8% (4.2% of Total Investments) | | | | | | | |
| | | |
| | | | INVESTMENT COMPANIES – 6.8% (4.2% of Total Investments) | | | | | | | |
| | | | | | | |
| | 40,257,885 | | | BlackRock Liquidity Funds T-Fund Portfolio | | | | | | | | | | | 0.000% (12) | | | | | | | | | | | $ | 40,257,885 | |
| | | | Total Short-Term Investments (cost $40,257,885) | | | | | | | | 40,257,885 | |
| | | | Total Investments (cost $975,759,370) – 162.2% | | | | | | | | 955,885,404 | |
| | | | Borrowings – (40.4)% (13), (14) | | | | | | | | (238,400,000 | ) |
| | | | Taxable Fund Preferred Shares, net of deferred offering costs – (16.8)% (15) | | | | | | | | (99,311,385 | ) |
| | | | Other Assets Less Liabilities – (5.0)% | | | | | | | | (28,704,999 | ) |
| | | | Net Assets Applicable to Common Shares – 100% | | | | | | | $ | 589,469,020 | |
51
| | |
| |
| JFR | | Nuveen Floating Rate Income Fund (continued) |
| | Portfolio of Investments July 31, 2021 |
For Fund portfolio compliance purposes, the Fund’s industry classifications refer to any one or more of the industry sub-classifications used by one or more widely recognized market indexes or ratings group indexes, and/or as defined by Fund management. This definition may not apply for purposes of this report, which may combine industry sub-classifications into sectors for reporting ease.
| (1) | All percentages shown in the Portfolio of Investments are based on net assets applicable to common shares unless otherwise noted. |
| (2) | Senior loans generally pay interest at rates which are periodically adjusted by reference to a base short-term, floating lending rate (Reference Rate) plus an assigned fixed rate (Spread). These floating lending rates are generally (i) the lending rate referenced by the London Inter-Bank Offered Rate (“LIBOR”), or (ii) the prime rate offered by one or more major United States banks. Senior loans may be considered restricted in that the Fund ordinarily is contractually obligated to receive approval from the agent bank and/or borrower prior to the disposition of a senior loan. The rate shown is the coupon as of the end of the reporting period. |
| (3) | Senior Loans generally are subject to mandatory and/or optional prepayment. Because of these mandatory prepayment conditions and because there may be significant economic incentives for a borrower to prepay, prepayments of senior loans may occur. As a result, the actual remaining maturity of senior loans held may be substantially less than the stated maturities shown. |
| (4) | For financial reporting purposes, the ratings disclosed are the highest of Standard & Poor’s Group (“Standard & Poor’s”), Moody’s Investors Service, Inc. (“Moody’s”) or Fitch, Inc. (“Fitch”) rating. This treatment of split-rated securities may differ from that used for other purposes, such as for Fund investment policies. Ratings below BBB by Standard & Poor’s, Baa by Moody’s or BBB by Fitch are considered to be below investment grade. Holdings designated N/R are not rated by any of these national rating agencies. Ratings are not covered by the report of independent registered public accounting firm. |
| (5) | Investment, or portion of investment, represents an outstanding unfunded senior loan commitment. |
| (6) | Defaulted security. A security whose issuer has failed to fully pay principal and/or interest when due, or is under the protection of bankruptcy. |
| (7) | Investment valued at fair value using methods determined in good faith by, or at the discretion of, the Board. For fair value measurement disclosure purposes, investment classified as Level 3. |
| (8) | For fair value measurement disclosure purposes, investment classified as Level 2. |
| (9) | Non-income producing; issuer has not declared an ex-dividend date within the past twelve months. |
| (10) | Common Stock received as part of the bankruptcy settlements during February 2020 for Bruce Mansfield Unit 1 2007 Pass-Through Trust. |
| (11) | Variable rate security. The rate shown is the coupon as of the end of the reporting period. |
| (12) | The rate shown is the annualized seven-day subsidized yield as of end of the reporting period. |
| (13) | Borrowings as a percentage of Total Investments is 24.9%. |
| (14) | The Fund segregates 100% of its eligible investments (excluding any investments separately pledged as collateral for specific investments in derivatives, when applicable) in the Portfolio of Investments as collateral for borrowings. |
| (15) | Taxable Fund Preferred Shares, net of deferred offering costs as a percentage of Total Investments is 10.4%. |
| 144A | Investment is exempt from registration under Rule 144A of the Securities Act of 1933, as amended. These investments may only be resold in transactions exempt from registration, which are normally those transactions with qualified institutional buyers. |
| DD1 | Portion of investment purchased on a delayed delivery basis. |
| LIBOR | London Inter-Bank Offered Rate |
| PIK | Payment-in-kind (“PIK”) security. Depending on the terms of the security, income may be received in the form of cash, securities, or a combination of both. The PIK rate shown, where applicable, represents the annualized rate of the last PIK payment made by the issuer as of the end of the reporting period. |
| REIT | Real Estate Investment Trust |
| TBD | Senior loan purchased on a when-issued or delayed-delivery basis. Certain details associated with this purchase are not known prior to the settlement date of the transaction. In addition, senior loans typically trade without accrued interest and therefore a coupon rate is not available prior to settlement. At settlement, if still unknown, the borrower or counterparty will provide the Fund with the final coupon rate and maturity date. |
| WI/DD | Purchased on a when-issued or delayed delivery basis. |
See accompanying notes to financial statements.
52
| | |
| JRO | | Nuveen Floating Rate Income
Opportunity Fund Portfolio of Investments July 31, 2021 |
| | | | | | | | | | | | | | | | | | | | | | | | | | | | |
Principal
Amount (000) | | | Description (1) | | Coupon (2) | | | Reference
Rate (2) | | | Spread (2) | | | Maturity (3) | | | Ratings (4) | | | Value | |
| |
| | | | LONG-TERM INVESTMENTS – 154.4% (96.1% of Total Investments) | |
| |
| | | | VARIABLE RATE SENIOR LOAN INTERESTS – 138.6% (86.2% of Total Investments) (2) | |
| |
| | | | Aerospace & Defense – 1.4% (0.9% of Total Investments) | |
| | | | | | | |
| $ | 536 | | | Dynasty Acquisition Co., Inc., Term Loan B1 | | | 3.647% | | | | 3-Month LIBOR | | | | 3.500% | | | | 4/08/26 | | | | B– | | | $ | 519,083 | |
| | 288 | | | Dynasty Acquisition Co., Inc., Term Loan B2 | | | 3.647% | | | | 3-Month LIBOR | | | | 3.500% | | | | 4/08/26 | | | | B– | | | | 279,077 | |
| | 1,280 | | | Maxar Technologies Ltd., Term Loan B | | | 2.850% | | | | 1-Month LIBOR | | | | 2.750% | | | | 10/05/24 | | | | B | | | | 1,268,953 | |
| | 1,663 | | | TransDigm, Inc., Term Loan E | | | 2.342% | | | | 1-Month LIBOR | | | | 2.250% | | | | 5/30/25 | | | | Ba3 | | | | 1,635,730 | |
| | 1,260 | | | TransDigm, Inc., Term Loan F | | | 2.342% | | | | 1-Month LIBOR | | | | 2.250% | | | | 12/09/25 | | | | Ba3 | | | | 1,239,255 | |
| | 1,050 | | | TransDigm, Inc., Term Loan G | | | 2.342% | | | | 1-Month LIBOR | | | | 2.250% | | | | 8/22/24 | | | | Ba3 | | | | 1,035,345 | |
| | 6,077 | | | Total Aerospace & Defense | | | | | | | | | | | | | | | | | | | | | | | 5,977,443 | |
| |
| | | | Airlines – 2.0% (1.3% of Total Investments) | |
| | | | | | | |
| | 1,620 | | | AAdvantage Loyalty IP Ltd., Term Loan | | | 5.500% | | | | 3-Month LIBOR | | | | 4.750% | | | | 4/20/28 | | | | Ba2 | | | | 1,668,288 | |
| | 260 | | | American Airlines, Inc., Incremental Term Loan | | | 2.093% | | | | 1-Month LIBOR | | | | 2.000% | | | | 12/14/23 | | | | Ba3 | | | | 253,965 | |
| | 940 | | | American Airlines, Inc., Term Loan, First Lien | | | 1.840% | | | | 1-Month LIBOR | | | | 1.750% | | | | 1/29/27 | | | | Ba3 | | | | 874,020 | |
| | 1,446 | | | Kestrel Bidco, Inc., Term Loan B | | | 4.000% | | | | 6-Month LIBOR | | | | 3.000% | | | | 12/11/26 | | | | BB– | | | | 1,399,604 | |
| | 1,900 | | | SkyMiles IP Ltd., Term Loan B | | | 4.750% | | | | 3-Month LIBOR | | | | 3.750% | | | | 10/20/27 | | | | Baa1 | | | | 2,009,782 | |
| | 2,244 | | | United Airlines, Inc., Term Loan B | | | 4.500% | | | | 1-Month LIBOR | | | | 3.750% | | | | 4/21/28 | | | | Ba1 | | | | 2,251,254 | |
| | 8,410 | | | Total Airlines | | | | | | | | | | | | | | | | | | | | | | | 8,456,913 | |
| |
| | | | Auto Components – 1.5% (0.9% of Total Investments) | |
| | | | | | | |
| | 619 | | | Adient US LLC, Term Loan B | | | 3.592% | | | | 1-Month LIBOR | | | | 3.500% | | | | 4/08/28 | | | | BB– | | | | 619,413 | |
| | 2,181 | | | Clarios Global LP, Term Loan B | | | 3.342% | | | | 1-Month LIBOR | | | | 3.250% | | | | 4/30/26 | | | | B1 | | | | 2,167,140 | |
| | 1,100 | | | DexKo Global Inc., Term Loan | | | 4.500% | | | | 1-Month LIBOR | | | | 3.500% | | | | 7/24/24 | | | | B1 | | | | 1,100,819 | |
| | 995 | | | Les Schwab Tire Centers, Term Loan B | | | 4.000% | | | | 6-Month LIBOR | | | | 3.250% | | | | 11/02/27 | | | | B | | | | 995,831 | |
| | 1,347 | | | Superior Industries International, Inc., Term Loan B, First Lien | | | 4.092% | | | | 1-Month LIBOR | | | | 4.000% | | | | 5/23/24 | | | | Ba3 | | | | 1,347,781 | |
| | 6,242 | | | Total Auto Components | | | | | | | | | | | | | | | | | | | | | | | 6,230,984 | |
| |
| | | | Automobiles – 0.2% (0.1% of Total Investments) | |
| | | | | | | |
| | 777 | | | Wand NewCo 3, Inc., Term Loan | | | 3.092% | | | | 1-Month LIBOR | | | | 3.000% | | | | 2/05/26 | | | | B1 | | | | 767,635 | |
| |
| | | | Banks – 0.1% (0.0% of Total Investments) | |
| | | | | | | |
| | 220 | | | iQor US, Inc., Exit Term Loan | | | 7.589% | | | | 1-Month LIBOR | | | | 7.500% | | | | 9/15/27 | | | | N/R | | | | 225,640 | |
| |
| | | | Beverages – 1.0% (0.6% of Total Investments) | |
| | | | | | | |
| | 1,085 | | | Arterra Wines Canada, Inc., Term Loan | | | 4.250% | | | | 3-Month LIBOR | | | | 3.500% | | | | 11/25/27 | | | | B1 | | | | 1,084,550 | |
| | 830 | | | City Brewing Company, LLC, Term Loan | | | 4.250% | | | | 3-Month LIBOR | | | | 3.500% | | | | 4/05/28 | | | | B+ | | | | 826,369 | |
| | 2,097 | | | Triton Water Holdings, Inc, Term Loan | | | 4.000% | | | | 3-Month LIBOR | | | | 3.500% | | | | 3/31/28 | | | | B1 | | | | 2,084,149 | |
| | 4,012 | | | Total Beverages | | | | | | | | | | | | | | | | | | | | | | | 3,995,068 | |
| |
| | | | Biotechnology – 0.6% (0.4% of Total Investments) | |
| | | | | | | |
| | 2,663 | | | Grifols Worldwide Operations USA, Inc., Term Loan B | | | 2.084% | | | | 1-Week LIBOR | | | | 2.000% | | | | 11/15/27 | | | | BB+ | | | | 2,630,417 | |
| |
| | | | Building Products – 2.4% (1.5% of Total Investments) | |
| | | | | | | |
| | 500 | | | All-Star Bidco AB, Term Loan, (WI/DD) | | | TBD | | | | TBD | | | | TBD | | | | TBD | | | | N/R | | | | 499,375 | |
| | 1,795 | | | Cornerstone Building Brands, Inc., Term Loan B | | | 3.750% | | | | 1-Month LIBOR | | | | 3.250% | | | | 4/12/28 | | | | B+ | | | | 1,793,619 | |
| | 184 | | | LBM Acquisition LLC, Term Loan, (WI/DD) | | | TBD | | | | TBD | | | | TBD | | | | TBD | | | | B+ | | | | 182,202 | |
| | 824 | | | LBM Acquisition LLC, Term Loan B | | | 4.500% | | | | 3-Month LIBOR | | | | 3.750% | | | | 12/17/27 | | | | B+ | | | | 817,860 | |
| | 279 | | | Potters Industries, LLC, Term Loan B | | | 4.750% | | | | 3-Month LIBOR | | | | 4.000% | | | | 12/14/27 | | | | B | | | | 280,174 | |
| | 5,551 | | | Quikrete Holdings, Inc., Term Loan, First Lien | | | 2.592% | | | | 1-Month LIBOR | | | | 2.500% | | | | 1/31/27 | | | | BB– | | | | 5,489,718 | |
| | 752 | | | Resideo Funding, Inc., Term Loan | | | 2.750% | | | | 3-Month LIBOR | | | | 2.250% | | | | 2/12/28 | | | | BBB– | | | | 750,420 | |
| | 285 | | | Resideo Funding, Inc., Term Loan | | | 2.750% | | | | 1-Month LIBOR | | | | 2.250% | | | | 2/12/28 | | | | BBB– | | | | 283,744 | |
| | 10,170 | | | Total Building Products | | | | | | | | | | | | | | | | | | | | | | | 10,097,112 | |
53
| | |
| |
| JRO | | Nuveen Floating Rate Income Opportunity Fund (continued) |
| | Portfolio of Investments July 31, 2021 |
| | | | | | | | | | | | | | | | | | | | | | | | | | | | |
Principal
Amount (000) | | | Description (1) | | Coupon (2) | | | Reference
Rate (2) | | | Spread (2) | | | Maturity (3) | | | Ratings (4) | | | Value | |
| |
| | | | Capital Markets – 2.0% (1.3% of Total Investments) | |
| | | | | | | |
| $ | 887 | | | Advisor Group, Inc., Term Loan | | | 4.592% | | | | 1-Month LIBOR | | | | 4.500% | | | | 7/31/26 | | | | B2 | | | $ | 887,365 | |
| | 1,950 | | | AI Alpine AT Bidco GmbH, Term Loan B | | | 3.138% | | | | 3-Month LIBOR | | | | 3.000% | | | | 11/06/25 | | | | B– | | | | 1,901,250 | |
| | 18 | | | Klockner-Pentaplast of America, Inc., Term Loan B | | | 5.250% | | | | 3-Month LIBOR | | | | 4.750% | | | | 2/09/26 | | | | B | | | | 17,574 | |
| | 481 | | | RPI Intermediate Finance Trust, Term Loan B1 | | | 1.842% | | | | 1-Month LIBOR | | | | 1.750% | | | | 2/11/27 | | | | BBB– | | | | 479,602 | |
| | 4,039 | | | Sequa Mezzanine Holdings L.L.C., Extended Term Loan, (cash 6.750%, PIK 1.000%) | | | 7.750% | | | | 3-Month LIBOR | | | | 6.750% | | | | 7/31/23 | | | | B– | | | | 4,098,356 | |
| | 1,142 | | | Sequa Mezzanine Holdings L.L.C., Term Loan, Second Lien, (cash 5.000%, PIK 6.750%) | | | 11.750% | | | | 3-Month LIBOR | | | | 10.750% | | | | 7/31/24 | | | | CCC– | | | | 1,126,866 | |
| | 8,517 | | | Total Capital Markets | | | | | | | | | | | | | | | | | | | | | | | 8,511,013 | |
| |
| | | | Chemicals – 1.0% (0.6% of Total Investments) | |
| | | | | | | |
| | 566 | | | ASP Unifrax Holdings, Inc., Term Loan B | | | 3.897% | | | | 3-Month LIBOR | | | | 3.750% | | | | 12/14/25 | | | | B– | | | | 556,457 | |
| | 657 | | | Atotech B.V., Term Loan B | | | 3.000% | | | | 3-Month LIBOR | | | | 2.500% | | | | 3/18/28 | | | | B+ | | | | 654,795 | |
| | 900 | | | INEOS Styrolution US Holding LLC, Term Loan B | | | 3.250% | | | | 1-Month LIBOR | | | | 2.750% | | | | 1/29/26 | | | | BB+ | | | | 898,650 | |
| | 865 | | | Ineos US Finance LLC, Term Loan B | | | 2.107% | | | | 2-Month LIBOR | | | | 2.000% | | | | 3/31/24 | | | | BBB– | | | | 854,901 | |
| | 704 | | | Lonza Group AG, Term Loan B | | | 4.750% | | | | 3-Month LIBOR | | | | 4.000% | | | | 5/14/28 | | | | B2 | | | | 704,880 | |
| | 312 | | | Sparta US HoldCo LLC, Term Loan, (WI/DD) | | | TBD | | | | TBD | | | | TBD | | | | TBD | | | | B+ | | | | 312,324 | |
| | 4,004 | | | Total Chemicals | | | | | | | | | | | | | | | | | | | | | | | 3,982,007 | |
| |
| | | | Commercial Services & Supplies – 5.7% (3.5% of Total Investments) | |
| | | | | | | |
| | 748 | | | Amentum Government Services Holdings LLC, Term Loan B | | | 5.500% | | | | 3-Month LIBOR | | | | 4.750% | | | | 1/31/27 | | | | B1 | | | | 750,930 | |
| | 692 | | | Brand Energy & Infrastructure Services, Inc., Term Loan | | | 5.250% | | | | 3-Month LIBOR | | | | 4.250% | | | | 6/21/24 | | | | B– | | | | 680,595 | |
| | 7,211 | | | Delta 2 (LUX) S.a.r.l., Term Loan | | | 3.500% | | | | 1-Month LIBOR | | | | 2.500% | | | | 2/01/24 | | | | B+ | | | | 7,168,155 | |
| | 1,000 | | | Fort Dearborn Company, Term Loan, Second Lien | | | 9.500% | | | | 3-Month LIBOR | | | | 8.500% | | | | 10/21/24 | | | | CCC | | | | 1,002,500 | |
| | 721 | | | Garda World Security Corporation, Term Loan B | | | 4.340% | | | | 1-Month LIBOR | | | | 4.250% | | | | 10/30/26 | | | | BB+ | | | | 721,419 | |
| | 2,686 | | | GFL Environmental, Inc., Term Loan | | | 3.500% | | | | 3-Month LIBOR | | | | 3.000% | | | | 5/30/25 | | | | BB– | | | | 2,687,455 | |
| | 750 | | | Herman Miller Inc, Term Loan, (WI/DD) | | | TBD | | | | TBD | | | | TBD | | | | TBD | | | | BBB– | | | | 747,772 | |
| | 344 | | | KAR Auction Services, Inc., Term Loan B6 | | | 2.375% | | | | 1-Month LIBOR | | | | 2.250% | | | | 9/19/26 | | | | Ba3 | | | | 339,561 | |
| | 750 | | | Madison IAQ LLC, Term Loan | | | 3.750% | | | | 3-Month LIBOR | | | | 3.250% | | | | 6/21/28 | | | | B1 | | | | 744,574 | |
| | 675 | | | PAE Holding Corporation, Term Loan B | | | 5.250% | | | | 1-Month LIBOR | | | | 4.500% | | | | 10/19/27 | | | | B | | | | 677,925 | |
| | 327 | | | Prime Security Services Borrower, LLC, Term Loan | | | 3.500% | | | | 6-Month LIBOR | | | | 2.750% | | | | 9/23/26 | | | | BB– | | | | 326,399 | |
| | 164 | | | Prime Security Services Borrower, LLC, Term Loan | | | 3.500% | | | | 12-Month LIBOR | | | | 2.750% | | | | 9/23/26 | | | | BB– | | | | 163,199 | |
| | 164 | | | Prime Security Services Borrower, LLC, Term Loan | | | 3.500% | | | | 3-Month LIBOR | | | | 2.750% | | | | 9/23/26 | | | | BB– | | | | 163,199 | |
| | 253 | | | Prime Security Services Borrower, LLC, Term Loan | | | 3.500% | | | | 1-Month LIBOR | | | | 2.750% | | | | 9/23/26 | | | | BB– | | | | 251,964 | |
| | 1,164 | | | Robertshaw US Holding Corp, Term Loan, First Lien | | | 4.500% | | | | 1-Month LIBOR | | | | 3.500% | | | | 2/28/25 | | | | CCC+ | | | | 1,122,733 | |
| | 134 | | | Sabert Corporation, Term Loan B | | | 5.500% | | | | 1-Month LIBOR | | | | 4.500% | | | | 12/10/26 | | | | B | | | | 134,249 | |
| | 997 | | | Spin Holdco, Inc., Term Loan | | | 4.750% | | | | 3-Month LIBOR | | | | 4.000% | | | | 3/04/28 | | | | B– | | | | 997,999 | |
| | 3,388 | | | Travelport Finance (Luxembourg) S.a.r.l., Term Loan, (cash 2.500%, PIK 6.500%), (DD1) | | | 2.500% | | | | 3-Month LIBOR | | | | 1.500% | | | | 2/28/25 | | | | B– | | | | 3,454,792 | |
| | 600 | | | West Corporation, Term Loan B1 | | | 4.500% | | | | 3-Month LIBOR | | | | 3.500% | | | | 10/10/24 | | | | BB+ | | | | 580,900 | |
| | 973 | | | WEX, Inc., Term Loan | | | 2.342% | | | | 1-Month LIBOR | | | | 2.250% | | | | 4/01/28 | | | | Ba2 | | | | 963,638 | |
| | 23,741 | | | Total Commercial Services & Supplies | | | | | | | | | | | | | | | | | | | | | | | 23,679,958 | |
| |
| | | | Communications Equipment – 2.7% (1.6% of Total Investments) | |
| | | | | | | |
| | 4,368 | | | CommScope, Inc., Term Loan B | | | 3.342% | | | | 1-Month LIBOR | | | | 3.250% | | | | 4/04/26 | | | | Ba3 | | | | 4,332,040 | |
| | 75 | | | MetroNet Systems Holdings, LLC, Delayed Draw Term Loan, (5) | | | 4.500% | | | | 1-Month LIBOR | | | | 3.750% | | | | 6/02/28 | | | | B2 | | | | 75,159 | |
| | 675 | | | MetroNet Systems Holdings, LLC, Term Loan, First Lien | | | 4.500% | | | | 1-Month LIBOR | | | | 3.750% | | | | 6/02/28 | | | | B2 | | | | 676,435 | |
| | 634 | | | MLN US HoldCo LLC, Term Loan, First Lien | | | 4.603% | | | | 1-Month LIBOR | | | | 4.500% | | | | 11/30/25 | | | | B3 | | | | 580,137 | |
| | 1,463 | | | Plantronics Inc, Term Loan B | | | 2.592% | | | | 1-Month LIBOR | | | | 2.500% | | | | 7/02/25 | | | | Ba2 | | | | 1,434,583 | |
| | 2,161 | | | Riverbed Technology, Inc., Term Loan B | | | 7.000% | | | | 3-Month LIBOR | | | | 6.000% | | | | 12/31/25 | | | | B2 | | | | 2,047,233 | |
| | 5 | | | Riverbed Technology, Inc., Term Loan B | | | 7.000% | | | | 2-Month LIBOR | | | | 6.000% | | | | 12/31/25 | | | | B2 | | | | 5,157 | |
| | 1,872 | | | Univision Communications, Inc., Term Loan C5 | | | 3.750% | | | | 1-Month LIBOR | | | | 2.750% | | | | 3/15/24 | | | | B | | | | 1,867,890 | |
| | 11,253 | | | Total Communications Equipment | | | | | | | | | | | | | | | | | | | | | | | 11,018,634 | |
54
| | | | | | | | | | | | | | | | | | | | | | | | | | | | |
Principal
Amount (000) | | | Description (1) | | Coupon (2) | | | Reference
Rate (2) | | | Spread (2) | | | Maturity (3) | | | Ratings (4) | | | Value | |
| |
| | | | Construction & Engineering – 1.4% (0.9% of Total Investments) | |
| | | | | | | |
| $ | 500 | | | AECOM Technology Corporation , Term Loan B | | | 1.842% | | | | 1-Month LIBOR | | | | 1.750% | | | | 4/13/28 | | | | BBB– | | | $ | 499,688 | |
| | 820 | | | Aegion Corporation, Term Loan | | | 5.500% | | | | 3-Month LIBOR | | | | 4.750% | | | | 5/17/28 | | | | B | | | | 828,200 | |
| | 1,640 | | | Brown Group Holding, LLC, Term Loan B | | | 3.250% | | | | 3-Month LIBOR | | | | 2.750% | | | | 6/07/28 | | | | B+ | | | | 1,629,976 | |
| | 250 | | | FrontDoor Inc, Term Loan B | | | 2.342% | | | | 1-Month LIBOR | | | | 2.250% | | | | 6/17/28 | | | | Ba2 | | | | 249,949 | |
| | 700 | | | Osmose Utilities Services, Inc., Term Loan | | | 3.750% | | | | 3-Month LIBOR | | | | 3.250% | | | | 6/17/28 | | | | B | | | | 694,753 | |
| | 380 | | | Pike Corporation, Incremental Term Loan B | | | 3.100% | | | | 1-Month LIBOR | | | | 3.000% | | | | 1/21/28 | | | | Ba3 | | | | 378,576 | |
| | 1,612 | | | Traverse Midstream Partners LLC, Term Loan | | | 6.500% | | | | 1-Month LIBOR | | | | 5.500% | | | | 9/27/24 | | | | B | | | | 1,615,311 | |
| | 5,902 | | | Total Construction & Engineering | | | | | | | | | | | | | | | | | | | | | | | 5,896,453 | |
| |
| | | | Containers & Packaging – 1.3% (0.8% of Total Investments) | |
| | | | | | | |
| | 1,760 | | | Berry Global, Inc., Term Loan Z | | | 1.850% | | | | 1-Month LIBOR | | | | 1.750% | | | | 7/01/26 | | | | BBB– | | | | 1,741,854 | |
| | 435 | | | Reynolds Consumer Products LLC, Term Loan | | | 1.842% | | | | 1-Month LIBOR | | | | 1.750% | | | | 2/04/27 | | | | BBB– | | | | 430,605 | |
| | 1,194 | | | Reynolds Group Holdings, Inc., Term Loan B2 | | | 3.342% | | | | 1-Month LIBOR | | | | 3.250% | | | | 2/05/26 | | | | B+ | | | | 1,181,636 | |
| | 382 | | | TricorBraun Holdings, Inc., Delayed Draw Term Loan, (5) | | | 3.750% | | | | 3-Month LIBOR | | | | 3.250% | | | | 3/03/28 | | | | B2 | | | | 378,699 | |
| | 1,698 | | | TricorBraun Holdings, Inc., Term Loan | | | 3.750% | | | | 3-Month LIBOR | | | | 3.250% | | | | 3/03/28 | | | | B2 | | | | 1,683,631 | |
| | 5,469 | | | Total Containers & Packaging | | | | | | | | | | | | | | | | | | | | | | | 5,416,425 | |
| |
| | | | Distributors – 0.2% (0.1% of Total Investments) | |
| | | | | | | |
| | 1,000 | | | Core & Main LP, Term Loan, (WI/DD) | | | TBD | | | | TBD | | | | TBD | | | | TBD | | | | Ba3 | | | | 991,875 | |
| |
| | | | Diversified Consumer Services – 0.8% (0.5% of Total Investments) | |
| | | | | | | |
| | 2,590 | | | Cengage Learning, Inc., Term Loan B | | | 5.750% | | | | 3-Month LIBOR | | | | 4.750% | | | | 6/29/26 | | | | B | | | | 2,592,499 | |
| | 916 | | | Sotheby’s, Term Loan B | | | 5.500% | | | | 3-Month LIBOR | | | | 4.750% | | | | 1/15/27 | | | | B+ | | | | 918,755 | |
| | 3,506 | | | Total Diversified Consumer Services | | | | | | | | | | | | | | | | | | | | | | | 3,511,254 | |
| |
| | | | Diversified Financial Services – 1.4% (0.9% of Total Investments) | |
| | | | | | | |
| | 328 | | | Avaya Inc, Term Loan, (WI/DD) | | | TBD | | | | TBD | | | | TBD | | | | TBD | | | | N/R | | | | 328,651 | |
| | 1,626 | | | Ditech Holding Corporation, Term Loan, (6) | | | 0.000% | | | | N/A | | | | N/A | | | | 6/30/22 | | | | N/R | | | | 327,450 | |
| | 1,000 | | | Fleetcor Technologies Operating Company, LLC, Term Loan B4 | | | 1.842% | | | | 1-Month LIBOR | | | | 1.750% | | | | 4/30/28 | | | | BB+ | | | | 993,930 | |
| | 592 | | | GT Polaris, Inc., Term Loan | | | 4.500% | | | | 3-Month LIBOR | | | | 3.750% | | | | 9/24/27 | | | | BB– | | | | 592,990 | |
| | 497 | | | Lions Gate Capital Holdings LLC, Term Loan B | | | 2.342% | | | | 1-Month LIBOR | | | | 2.250% | | | | 3/24/25 | | | | Ba2 | | | | 492,121 | |
| | 2,257 | | | Verscend Holding Corp., Term Loan B | | | 4.092% | | | | 1-Month LIBOR | | | | 4.000% | | | | 8/27/25 | | | | BB– | | | | 2,256,383 | |
| | 1,000 | | | Vision Solutions, Inc., Term Loan, First Lien | | | 5.000% | | | | 3-Month LIBOR | | | | 4.250% | | | | 3/04/28 | | | | N/R | | | | 997,580 | |
| | 7,300 | | | Total Diversified Financial Services | | | | | | | | | | | | | | | | | | | | | | | 5,989,105 | |
| |
| | | | Diversified Telecommunication Services – 3.6% (2.2% of Total Investments) | |
| | | | | | | |
| | 1,237 | | | Altice France S.A., Term Loan B12 | | | 3.814% | | | | 3-Month LIBOR | | | | 3.688% | | | | 1/31/26 | | | | B | | | | 1,223,737 | |
| | 3,795 | | | Altice France S.A., Term Loan B13 | | | 4.155% | | | | 3-Month LIBOR | | | | 4.000% | | | | 8/14/26 | | | | B | | | | 3,791,265 | |
| | 4,897 | | | CenturyLink, Inc., Term Loan B | | | 2.342% | | | | 1-Month LIBOR | | | | 2.250% | | | | 3/15/27 | | | | BBB– | | | | 4,826,240 | |
| | 1,077 | | | Connect Finco Sarl, Term Loan B | | | 4.500% | | | | 1-Month LIBOR | | | | 3.500% | | | | 12/12/26 | | | | B+ | | | | 1,078,217 | |
| | 2,542 | | | Frontier Communications Corp., DIP Term Loan B | | | 4.500% | | | | 1-Month LIBOR | | | | 3.750% | | | | 10/08/27 | | | | BB+ | | | | 2,544,677 | |
| | 92 | | | GTT Communications, Inc., Delayed Draw Term Loan, (6) | | | 6.000% | | | | 1-Month LIBOR | | | | 5.000% | | | | 12/28/21 | | | | CCC+ | | | | 93,410 | |
| | 383 | | | Intelsat Jackson Holdings S.A., Term Loan B4, (6) | | | 8.750% | | | | Prime | | | | 5.500% | | | | 1/02/24 | | | | N/R | | | | 391,558 | |
| | 614 | | | Intelsat Jackson Holdings S.A., Term Loan B5, (6) | | | 8.625% | | | | N/A | | | | N/A | | | | 1/02/24 | | | | N/R | | | | 625,946 | |
| | 374 | | | Zayo Group Holdings, Inc., Term Loan | | | 3.092% | | | | 1-Month LIBOR | | | | 3.000% | | | | 3/09/27 | | | | B1 | | | | 368,553 | |
| | 15,011 | | | Total Diversified Telecommunication Services | | | | | | | | | | | | | | | | | | | | | | | 14,943,603 | |
| |
| | | | Electric Utilities – 0.6% (0.4% of Total Investments) | |
| | | | | | | |
| | 904 | | | ExGen Renewables IV, LLC, Term Loan | | | 3.500% | | | | 3-Month LIBOR | | | | 2.500% | | | | 12/15/27 | | | | BB– | | | | 903,994 | |
| | 742 | | | Pacific Gas & Electric Company, Term Loan | | | 3.500% | | | | 3-Month LIBOR | | | | 3.000% | | | | 6/23/25 | | | | BB | | | | 724,710 | |
| | 894 | | | Vistra Operations Company LLC, Term Loan B3, First Lien | | | 1.841% | | | | 1-Month LIBOR | | | | 1.750% | | | | 12/31/25 | | | | BBB– | | | | 883,400 | |
| | 2,540 | | | Total Electric Utilities | | | | | | | | | | | | | | | | | | | | | | | 2,512,104 | |
| |
| | | | Electrical Equipment – 1.3% (0.8% of Total Investments) | |
| | | | | | | |
| | 3,267 | | | Avolon TLB Borrower 1 (US) LLC, Term Loan B4 | | | 2.250% | | | | 1-Month LIBOR | | | | 1.500% | | | | 2/12/27 | | | | Baa2 | | | | 3,226,170 | |
| | 1,960 | | | Ingram Micro, Inc., Term Loan B | | | 4.000% | | | | 3-Month LIBOR | | | | 3.500% | | | | 7/02/28 | | | | BB | | | | 1,963,920 | |
| | 5,227 | | | Total Electrical Equipment | | | | | | | | | | | | | | | | | | | | | | | 5,190,090 | |
55
| | |
| |
| JRO | | Nuveen Floating Rate Income Opportunity Fund (continued) |
| | Portfolio of Investments July 31, 2021 |
| | | | | | | | | | | | | | | | | | | | | | | | | | | | |
Principal
Amount (000) | | | Description (1) | | Coupon (2) | | | Reference
Rate (2) | | | Spread (2) | | | Maturity (3) | | | Ratings (4) | | | Value | |
| |
| | | | Electronic Equipment, Instruments & Components – 0.3% (0.2% of Total Investments) | |
| | | | | | | |
| $ | 1,322 | | | TTM Technologies, Inc., Term Loan | | | 2.600% | | | | 1-Month LIBOR | | | | 2.500% | | | | 9/28/24 | | | | BB+ | | | $ | 1,320,660 | |
| |
| | | | Energy Equipment & Services – 0.2% (0.1% of Total Investments) | |
| | | | | | | |
| | 657 | | | Petroleum Geo-Services ASA, Term Loan | | | 7.647% | | | | 3-Month LIBOR | | | | 7.500% | | | | 3/19/24 | | | | N/R | | | | 609,185 | |
| |
| | | | Entertainment – 2.5% (1.6% of Total Investments) | |
| | | | | | | |
| | 457 | | | AMC Entertainment Holdings, Inc., Term Loan B, (DD1) | | | 3.103% | | | | 1-Month LIBOR | | | | 3.000% | | | | 4/22/26 | | | | B– | | | | 407,310 | |
| | 387 | | | Crown Finance US, Inc., Incremental Term Loan | | | 3.750% | | | | 6-Month LIBOR | | | | 2.750% | | | | 9/20/26 | | | | CCC | | | | 312,171 | |
| | 3,323 | | | Crown Finance US, Inc., Term Loan | | | 3.500% | | | | 6-Month LIBOR | | | | 2.500% | | | | 2/28/25 | | | | CCC | | | | 2,705,570 | |
| | 1,802 | | | Metro-Goldwyn-Mayer, Inc., Term Loan, First Lien | | | 2.600% | | | | 1-Month LIBOR | | | | 2.500% | | | | 7/03/25 | | | | BB– | | | | 1,796,968 | |
| | 1,000 | | | Metro-Goldwyn-Mayer, Inc., Term Loan, Second Lien | | | 5.500% | | | | 1-Month LIBOR | | | | 4.500% | | | | 7/06/26 | | | | B3 | | | | 1,003,330 | |
| | 455 | | | NASCAR Holdings, Inc, Term Loan B | | | 2.842% | | | | 1-Month LIBOR | | | | 2.750% | | | | 10/18/26 | | | | BB | | | | 451,967 | |
| | 1,995 | | | Virgin Media Bristol LLC, Term Loan Q | | | 3.343% | | | | 1-Month LIBOR | | | | 3.250% | | | | 1/31/29 | | | | BB+ | | | | 1,988,626 | |
| | 1,790 | | | William Morris Endeavor Entertainment, LLC, Term Loan, First Lien | | | 2.850% | | | | 1-Month LIBOR | | | | 2.750% | | | | 5/16/25 | | | | B | | | | 1,744,001 | |
| | 11,209 | | | Total Entertainment | | | | | | | | | | | | | | | | | | | | | | | 10,409,943 | |
| |
| | | | Equity Real Estate Investment Trust – 0.4% (0.2% of Total Investments) | |
| | | | | | | |
| | 1,365 | | | Realogy Group LLC, Term Loan A | | | 1.842% | | | | 1-Month LIBOR | | | | 1.750% | | | | 2/08/25 | | | | Ba1 | | | | 1,330,810 | |
| | 279 | | | Realogy Group LLC, Term Loan B | | | 3.000% | | | | 1-Month LIBOR | | | | 2.250% | | | | 2/08/25 | | | | Ba1 | | | | 278,116 | |
| | 1,644 | | | Total Equity Real Estate Investment Trust | | | | | | | | | | | | | | | | | | | | | | | 1,608,926 | |
| |
| | | | Food & Staples Retailing – 1.8% (1.1% of Total Investments) | |
| | | | | | | |
| | 469 | | | BJ’s Wholesale Club, Inc., Term Loan, First Lien | | | 2.100% | | | | 1-Month LIBOR | | | | 2.000% | | | | 2/03/24 | | | | BB+ | | | | 468,509 | |
| | 44 | | | H Food Holdings LLC, Incremental Term Loan B3 | | | 6.000% | | | | 1-Month LIBOR | | | | 5.000% | | | | 5/31/25 | | | | B2 | | | | 44,843 | |
| | 765 | | | H Food Holdings LLC, Term Loan B | | | 3.780% | | | | 1-Month LIBOR | | | | 3.688% | | | | 5/31/25 | | | | B2 | | | | 758,619 | |
| | 6,412 | | | US Foods, Inc., Term Loan B | | | 1.842% | | | | 1-Month LIBOR | | | | 1.750% | | | | 6/27/23 | | | | BB– | | | | 6,340,772 | |
| | 7,690 | | | Total Food & Staples Retailing | | | | | | | | | | | | | | | | | | | | | | | 7,612,743 | |
| |
| | | | Food Products – 0.6% (0.4% of Total Investments) | |
| | | | | | | |
| | 809 | | | American Seafoods Group LLC, Term Loan, First Lien | | | 3.750% | | | | 1-Month LIBOR | | | | 2.750% | | | | 8/21/23 | | | | BB– | | | | 806,971 | |
| | 5 | | | American Seafoods Group LLC, Term Loan, First Lien | | | 3.750% | | | | 3-Month LIBOR | | | | 2.750% | | | | 8/21/23 | | | | BB– | | | | 5,393 | |
| | 772 | | | Froneri International Ltd., Term Loan | | | 2.342% | | | | 1-Month LIBOR | | | | 2.250% | | | | 1/31/27 | | | | B+ | | | | 759,316 | |
| | 781 | | | UTZ Quality Foods, LLC, Term Loan B | | | 3.092% | | | | 1-Month LIBOR | | | | 3.000% | | | | 1/20/28 | | | | B1 | | | | 778,337 | |
| | 2,367 | | | Total Food Products | | | | | | | | | | | | | | | | | | | | | | | 2,350,017 | |
| |
| | | | Health Care Equipment & Supplies – 1.6% (1.0% of Total Investments) | |
| | | | | | | |
| | 2,117 | | | Carestream Health, Inc., Extended Term Loan | | | 7.750% | | | | 3-Month LIBOR | | | | 6.750% | | | | 5/08/23 | | | | B1 | | | | 2,131,765 | |
| | 676 | | | Greatbatch Ltd., Term Loan B | | | 3.500% | | | | 1-Month LIBOR | | | | 2.500% | | | | 10/27/22 | | | | B+ | | | | 676,658 | |
| | 500 | | | Insulet Corporation, Term Loan B | | | 3.750% | | | | 1-Month LIBOR | | | | 3.250% | | | | 5/04/28 | | | | Ba3 | | | | 501,018 | |
| | 904 | | | Lifescan Global Corporation, Term Loan, First Lien | | | 6.146% | | | | 3-Month LIBOR | | | | 6.000% | | | | 10/01/24 | | | | B | | | | 898,197 | |
| | 1,385 | | | Viant Medical Holdings, Inc., Term Loan, First Lien | | | 3.842% | | | | 1-Month LIBOR | | | | 3.750% | | | | 7/02/25 | | | | B3 | | | | 1,341,672 | |
| | 1,061 | | | Vyaire Medical, Inc., Term Loan B | | | 5.750% | | | | 3-Month LIBOR | | | | 4.750% | | | | 4/30/25 | | | | B3 | | | | 922,660 | |
| | 6,643 | | | Total Health Care Equipment & Supplies | | | | | | | | | | | | | | | | | | | | | | | 6,471,970 | |
| |
| | | | Health Care Providers & Services – 8.1% (5.0% of Total Investments) | |
| | | | | | | |
| | 556 | | | ADMI Corp., Term Loan B2 | | | 3.625% | | | | 1-Month LIBOR | | | | 3.125% | | | | 12/23/27 | | | | B | | | | 547,253 | |
| | 1,751 | | | AHP Health Partners, Inc., Term Loan | | | 4.750% | | | | 1-Month LIBOR | | | | 3.750% | | | | 6/30/25 | | | | B1 | | | | 1,755,242 | |
| | 351 | | | Air Methods Corporation, Term Loan B | | | 4.500% | | | | 3-Month LIBOR | | | | 3.500% | | | | 4/21/24 | | | | B | | | | 344,967 | |
| | 661 | | | Albany Molecular Research, Inc., Term Loan, First Lien | | | 4.250% | | | | 3-Month LIBOR | | | | 3.250% | | | | 8/30/24 | | | | B | | | | 662,472 | |
| | 1,439 | | | BW NHHC Holdco, Inc., Term Loan, First Lien | | | 5.155% | | | | 3-Month LIBOR | | | | 5.000% | | | | 5/15/25 | | | | Caa1 | | | | 1,321,657 | |
| | 505 | | | DaVita, Inc., Term Loan B | | | 1.842% | | | | 1-Month LIBOR | | | | 1.750% | | | | 8/12/26 | | | | BBB– | | | | 500,422 | |
| | 1,644 | | | Envision Healthcare Corporation, Term Loan, First Lien | | | 3.842% | | | | 1-Month LIBOR | | | | 3.750% | | | | 10/10/25 | | | | CCC+ | | | | 1,412,017 | |
| | 834 | | | Gates Global LLC, Term Loan B3 | | | 3.500% | | | | 1-Month LIBOR | | | | 2.750% | | | | 3/31/27 | | | | B+ | | | | 830,008 | |
56
| | | | | | | | | | | | | | | | | | | | | | | | | | | | |
Principal
Amount (000) | | | Description (1) | | Coupon (2) | | | Reference
Rate (2) | | | Spread (2) | | | Maturity (3) | | | Ratings (4) | | | Value | |
| |
| | | | Health Care Providers & Services (continued) | |
| | | | | | | |
| $ | 2,402 | | | Gentiva Health Services, Inc., Term Loan | | | 2.875% | | | | 1-Month LIBOR | | | | 2.750% | | | | 7/02/25 | | | | B+ | | | $ | 2,395,979 | |
| | 2,488 | | | Global Medical Response, Inc., Term Loan B | | | 5.750% | | | | 3-Month LIBOR | | | | 4.750% | | | | 10/02/25 | | | | B | | | | 2,494,378 | |
| | 306 | | | MED ParentCo LP, Term Loan, First Lien | | | 4.342% | | | | 1-Month LIBOR | | | | 4.250% | | | | 8/31/26 | | | | B2 | | | | 306,488 | |
| | 75 | | | National Mentor Holdings, Inc., Delayed Draw Term Loan, (5) | | | 4.500% | | | | 3-Month LIBOR | | | | 3.750% | | | | 3/02/28 | | | | B1 | | | | 75,192 | |
| | 360 | | | National Mentor Holdings, Inc., Term Loan | | | 4.500% | | | | 1-Month LIBOR | | | | 3.750% | | | | 3/02/28 | | | | B1 | | | | 360,011 | |
| | 322 | | | National Mentor Holdings, Inc., Term Loan | | | 4.500% | | | | 3-Month LIBOR | | | | 3.750% | | | | 3/02/28 | | | | B1 | | | | 321,845 | |
| | 23 | | | National Mentor Holdings, Inc., Term Loan C | | | 4.500% | | | | 3-Month LIBOR | | | | 3.750% | | | | 3/02/28 | | | | B1 | | | | 22,785 | |
| | 1,315 | | | Onex TSG Intermediate Corp., Term Loan B | | | 5.500% | | | | 3-Month LIBOR | | | | 4.750% | | | | 2/26/28 | | | | B | | | | 1,327,492 | |
| | 1,768 | | | Phoenix Guarantor Inc, Term Loan B | | | 3.339% | | | | 1-Month LIBOR | | | | 3.250% | | | | 3/05/26 | | | | B1 | | | | 1,747,677 | |
| | 1,496 | | | Phoenix Guarantor Inc, Term Loan B3 | | | 3.596% | | | | 1-Month LIBOR | | | | 3.500% | | | | 3/05/26 | | | | B1 | | | | 1,482,088 | |
| | 178 | | | Quorum Health Corporation, Term Loan, (6) | | | 7.500% | | | | 3-Month LIBOR | | | | 6.500% | | | | 4/29/25 | | | | B– | | | | 179,776 | |
| | 4,927 | | | RegionalCare Hospital Partners Holdings, Inc., Term Loan B, (DD1) | | | 3.842% | | | | 1-Month LIBOR | | | | 3.750% | | | | 11/16/25 | | | | B1 | | | | 4,891,110 | |
| | 2,716 | | | Select Medical Corporation, Term Loan B | | | 2.350% | | | | 1-Month LIBOR | | | | 2.250% | | | | 3/06/25 | | | | Ba2 | | | | 2,683,046 | |
| | 4,477 | | | Surgery Center Holdings, Inc., Term Loan | | | 4.500% | | | | 1-Month LIBOR | | | | 3.750% | | | | 8/31/26 | | | | B1 | | | | 4,480,448 | |
| | 2,394 | | | Team Health Holdings, Inc., Term Loan, First Lien | | | 3.750% | | | | 1-Month LIBOR | | | | 2.750% | | | | 2/06/24 | | | | B | | | | 2,323,775 | |
| | 1,294 | | | US Radiology Specialists, Inc., Term Loan | | | 6.250% | | | | 3-Month LIBOR | | | | 5.500% | | | | 12/15/27 | | | | B– | | | | 1,304,010 | |
| | 34,282 | | | Total Health Care Providers & Services | | | | | | | | | | | | | | | | | | | | | | | 33,770,138 | |
| |
| | | | Health Care Technology – 2.2% (1.3% of Total Investments) | |
| | | | | | | |
| | 2,539 | | | Carestream Health, Inc., Term Loan, Second Lien, (cash 5.500%, PIK 8.000%) | | | 5.500% | | | | 3-Month LIBOR | | | | 6.750% | | | | 8/05/23 | | | | CCC+ | | | | 2,493,489 | |
| | 136 | | | Change Healthcare Holdings LLC, Term Loan B | | | 3.500% | | | | 1-Month LIBOR | | | | 2.500% | | | | 3/01/24 | | | | B+ | | | | 135,807 | |
| | 4,571 | | | Change Healthcare Holdings LLC, Term Loan B | | | 3.500% | | | | 3-Month LIBOR | | | | 2.500% | | | | 3/01/24 | | | | B+ | | | | 4,567,552 | |
| | 1,773 | | | Zelis Healthcare Corporation, Term Loan | | | 3.601% | | | | 1-Month LIBOR | | | | 3.500% | | | | 9/30/26 | | | | B | | | | 1,766,113 | |
| | 9,019 | | | Total Health Care Technology | | | | | | | | | | | | | | | | | | | | | | | 8,962,961 | |
| |
| | | | Hotels, Restaurants & Leisure – 17.6% (11.0% of Total Investments) | |
| | | | | | | |
| | 16,030 | | | B.C. Unlimited Liability Company, Term Loan B4 | | | 1.842% | | | | 1-Month LIBOR | | | | 1.750% | | | | 11/19/26 | | | | BB+ | | | | 15,741,508 | |
| | 352 | | | 24 Hour Fitness Worldwide, Inc., Exit Term Loan, (cash 1.000%, PIK 5.000%) | | | 6.000% | | | | 3-Month LIBOR | | | | 5.000% | | | | 12/29/25 | | | | B3 | | | | 309,435 | |
| | 743 | | | Aramark Services, Inc., Term Loan B3 | | | 1.842% | | | | 1-Month LIBOR | | | | 1.750% | | | | 3/11/25 | | | | BB+ | | | | 732,102 | |
| | 1,410 | | | Alterra Mountain Co, Term Loan | | | 5.500% | | | | 1-Month LIBOR | | | | 4.500% | | | | 8/01/26 | | | | B | | | | 1,405,387 | |
| | 580 | | | Boyd Gaming Corporation, Term Loan B3 | | | 2.334% | | | | 1-Week LIBOR | | | | 2.250% | | | | 9/15/23 | | | | BB | | | | 579,653 | |
| | 1,117 | | | Caesars Resort Collection, LLC, Term Loan B1 | | | 4.592% | | | | 1-Month LIBOR | | | | 4.500% | | | | 7/20/25 | | | | B+ | | | | 1,119,030 | |
| | 7,633 | | | Caesars Resort Collection, LLC, Term Loan, First Lien B | | | 2.842% | | | | 1-Month LIBOR | | | | 2.750% | | | | 12/22/24 | | | | B+ | | | | 7,557,949 | |
| | 979 | | | Carnival Corporation, Term Loan B | | | 3.750% | | | | 1-Month LIBOR | | | | 3.000% | | | | 6/30/25 | | | | Ba2 | | | | 973,779 | |
| | 1,287 | | | Churchill Downs Incorporated, Incremental Term Loan B1 | | | 2.100% | | | | 1-Month LIBOR | | | | 2.000% | | | | 3/17/28 | | | | BBB– | | | | 1,273,867 | |
| | 3,174 | | | CityCenter Holdings, LLC, Term Loan B | | | 3.000% | | | | 1-Month LIBOR | | | | 2.250% | | | | 4/18/24 | | | | B+ | | | | 3,169,007 | |
| | 3,881 | | | ClubCorp Holdings, Inc., Term Loan B | | | 2.897% | | | | 3-Month LIBOR | | | | 2.750% | | | | 9/18/24 | | | | B– | | | | 3,679,356 | |
| | 511 | | | Crown Finance US, Inc., Term Loan B1, (cash 7.000%, PIK 8.250%) | | | 7.000% | | | | 3-Month LIBOR | | | | 7.000% | | | | 5/23/24 | | | | B– | | | | 636,870 | |
| | 3,346 | | | Equinox Holdings, Inc., Term Loan, First Lien | | | 4.000% | | | | 3-Month LIBOR | | | | 3.000% | | | | 3/08/24 | | | | CCC | | | | 3,109,213 | |
| | 955 | | | Four Seasons Hotels Limited, New Term Loan, First Lien | | | 2.092% | | | | 1-Month LIBOR | | | | 2.000% | | | | 11/30/23 | | | | BB+ | | | | 949,561 | |
| | 5,080 | | | Golden Nugget, Inc., Incremental Term Loan B | | | 3.250% | | | | 2-Month LIBOR | | | | 2.500% | | | | 10/04/23 | | | | B | | | | 5,037,792 | |
| | 2,000 | | | Hilton Grand Vacations Borrower LLC, Term Loan, (WI/DD) | | | TBD | | | | TBD | | | | TBD | | | | TBD | | | | Ba1 | | | | 1,995,500 | |
| | 4,246 | | | Hilton Worldwide Finance, LLC, Term Loan B2 | | | 1.839% | | | | 1-Month LIBOR | | | | 1.750% | | | | 6/21/26 | | | | BBB– | | | | 4,198,764 | |
| | 3,085 | | | IRB Holding Corp, Fourth Amendment Incremental Term Loan | | | 4.250% | | | | 3-Month LIBOR | | | | 3.250% | | | | 12/15/27 | | | | B | | | | 3,078,717 | |
| | 3,433 | | | Life Time Fitness Inc , Term Loan B | | | 5.750% | | | | 3-Month LIBOR | | | | 4.750% | | | | 12/15/24 | | | | B– | | | | 3,434,913 | |
| | 641 | | | PCI Gaming Authority, Term Loan | | | 2.592% | | | | 1-Month LIBOR | | | | 2.500% | | | | 5/31/26 | | | | BBB– | | | | 637,430 | |
| | 5,177 | | | Scientific Games International, Inc., Term Loan B5 | | | 2.842% | | | | 1-Month LIBOR | | | | 2.750% | | | | 8/14/24 | | | | B+ | | | | 5,107,282 | |
| | 1,028 | | | SeaWorld Parks & Entertainment, Inc., Term Loan B5 | | | 3.750% | | | | 1-Month LIBOR | | | | 3.000% | | | | 3/31/24 | | | | B2 | | | | 1,020,649 | |
| | 4,267 | | | Stars Group Holdings B.V. (The), Incremental Term Loan, (DD1) | | | 3.647% | | | | 3-Month LIBOR | | | | 3.500% | | | | 7/10/25 | | | | BBB | | | | 4,241,466 | |
| | 2,184 | | | Station Casinos LLC, Term Loan B | | | 3.250% | | | | 1-Month LIBOR | | | | 2.250% | | | | 2/08/27 | | | | BB– | | | | 2,151,539 | |
57
| | |
| |
| JRO | | Nuveen Floating Rate Income Opportunity Fund (continued) |
| | Portfolio of Investments July 31, 2021 |
| | | | | | | | | | | | | | | | | | | | | | | | | | | | |
Principal
Amount (000) | | | Description (1) | | Coupon (2) | | | Reference
Rate (2) | | | Spread (2) | | | Maturity (3) | | | Ratings (4) | | | Value | |
| |
| | | | Hotels, Restaurants & Leisure (continued) | |
| | | | | | | |
| $ | 1,459 | | | Wyndham Hotels & Resorts, Inc., Term Loan B | | | 1.842% | | | | 1-Month LIBOR | | | | 1.750% | | | | 5/30/25 | | | | BB+ | | | $ | 1,444,768 | |
| | 74,598 | | | Total Hotels, Restaurants & Leisure | | | | | | | | | | | | | | | | | | | | | | | 73,585,537 | |
| |
| | | | Household Durables – 0.9% (0.6% of Total Investments) | |
| | | | | | | |
| | 856 | | | Apex Tool Group, LLC, Term Loan B | | | 6.500% | | | | 1-Month LIBOR | | | | 5.250% | | | | 8/21/24 | | | | B3 | | | | 859,133 | |
| | 800 | | | Osmosis Debt Merger Sub Inc, Term Loan, (WI/DD) | | | TBD | | | | TBD | | | | TBD | | | | TBD | | | | B3 | | | | 800,876 | |
| | 57 | | | Serta Simmons Bedding, LLC, Term Loan, (6) | | | 8.500% | | | | 1-Month LIBOR | | | | 7.500% | | | | 8/10/23 | | | | B | | | | 58,284 | |
| | 1,705 | | | Serta Simmons Bedding, LLC, Term Loan, (6) | | | 8.500% | | | | 1-Month LIBOR | | | | 7.500% | | | | 8/10/23 | | | | B– | | | | 1,623,581 | |
| | 358 | | | Weber-Stephen Products LLC, Term Loan B | | | 5.500% | | | | 1-Month LIBOR | | | | 3.250% | | | | 10/30/27 | | | | B1 | | | | 357,360 | |
| | 90 | | | Weber-Stephen Products LLC, Term Loan B | | | 5.500% | | | | Prime | | | | 3.250% | | | | 10/30/27 | | | | B1 | | | | 89,902 | |
| | 3,866 | | | Total Household Durables | | | | | | | | | | | | | | | | | | | | | | | 3,789,136 | |
| |
| | | | Household Products – 0.4% (0.3% of Total Investments) | |
| | | | | | | |
| | 765 | | | Illuminate Merger Sub Corp, Term Loan, (WI/DD) | | | TBD | | | | TBD | | | | TBD | | | | TBD | | | | B1 | | | | 760,460 | |
| | 938 | | | Reynolds Group Holdings, Inc., Term Loan | | | 2.842% | | | | 1-Month LIBOR | | | | 2.750% | | | | 2/05/23 | | | | B+ | | | | 935,580 | |
| | 1,703 | | | Total Household Products | | | | | | | | | | | | | | | | | | | | | | | 1,696,040 | |
| |
| | | | Independent Power & Renewable Electricity Producers – 0.2% (0.1% of Total Investments) | |
| | | | | | | |
| | 867 | | | WIN Waste Innovations Holdings, Inc., Term Loan B | | | 3.250% | | | | 3-Month LIBOR | | | | 2.750% | | | | 3/25/28 | | | | B+ | | | | 864,722 | |
| |
| | | | Insurance – 3.5% (2.2% of Total Investments) | |
| | | | | | | |
| | 3,521 | | | Acrisure, LLC, Term Loan B | | | 3.607% | | | | 2-Month LIBOR | | | | 3.500% | | | | 2/15/27 | | | | B | | | | 3,464,412 | |
| | 2,529 | | | Alliant Holdings Intermediate, LLC, Term Loan B | | | 3.342% | | | | 1-Month LIBOR | | | | 3.250% | | | | 5/10/25 | | | | B | | | | 2,498,946 | |
| | 499 | | | Alliant Holdings Intermediate, LLC, Term Loan B3 | | | 4.250% | | | | 1-Month LIBOR | | | | 3.750% | | | | 11/06/27 | | | | B | | | | 499,262 | |
| | 2,000 | | | Asurion LLC, Term Loan, (WI/DD) | | | TBD | | | | TBD | | | | TBD | | | | TBD | | | | B | | | | 1,993,120 | |
| | 664 | | | Asurion LLC, Term Loan B6 | | | 3.217% | | | | 1-Month LIBOR | | | | 3.125% | | | | 11/03/23 | | | | Ba3 | | | | 657,165 | |
| | 2,917 | | | Asurion LLC, Term Loan B8 | | | 3.342% | | | | 1-Month LIBOR | | | | 3.250% | | | | 12/23/26 | | | | Ba3 | | | | 2,866,708 | |
| | 2,158 | | | Hub International Limited, Term Loan B | | | 2.875% | | | | 3-Month LIBOR | | | | 2.750% | | | | 4/25/25 | | | | B | | | | 2,128,833 | |
| | 496 | | | Ryan Specialty Group, LLC, Term Loan | | | 3.750% | | | | 1-Month LIBOR | | | | 3.000% | | | | 9/01/27 | | | | BB– | | | | 495,166 | |
| | 14,784 | | | Total Insurance | | | | | | | | | | | | | | | | | | | | | | | 14,603,612 | |
| |
| | | | Interactive Media & Services – 1.9% (1.2% of Total Investments) | |
| | | | | | | |
| | 1,542 | | | Arches Buyer, Inc., Term Loan B | | | 3.750% | | | | 1-Month LIBOR | | | | 3.250% | | | | 12/06/27 | | | | B1 | | | | 1,535,079 | |
| | 415 | | | Mission Broadcasting, Inc., Term Loan B | | | 2.604% | | | | 1-Month LIBOR | | | | 2.500% | | | | 6/03/28 | | | | BBB– | | | | 411,628 | |
| | 4,581 | | | Rackspace Technology Global, Inc., Term Loan, (DD1) | | | 3.500% | | | | 3-Month LIBOR | | | | 2.750% | | | | 2/09/28 | | | | B+ | | | | 4,533,140 | |
| | 1,459 | | | WeddingWire, Inc., Term Loan, First Lien | | | 4.628% | | | | 3-Month LIBOR | | | | 4.500% | | | | 12/21/25 | | | | B+ | | | | 1,460,573 | |
| | 4 | | | WeddingWire, Inc., Term Loan, First Lien | | | 4.628% | | | | 2-Month LIBOR | | | | 4.500% | | | | 12/21/25 | | | | B+ | | | | 3,755 | |
| | 8,001 | | | Total Interactive Media & Services | | | | | | | | | | | | | | | | | | | | | | | 7,944,175 | |
| |
| | | | Internet & Direct Marketing Retail – 0.5% (0.3% of Total Investments) | |
| | | | | | | |
| | 1,995 | | | CNT Holdings I Corp, Term Loan | | | 4.500% | | | | 3-Month LIBOR | | | | 3.750% | | | | 11/08/27 | | | | B | | | | 1,993,444 | |
| |
| | | | Internet Software & Services – 1.7% (1.1% of Total Investments) | |
| | | | | | | |
| | 1,785 | | | Banff Merger Sub Inc, Term Loan | | | 3.842% | | | | 1-Month LIBOR | | | | 3.750% | | | | 10/02/25 | | | | B2 | | | | 1,773,009 | |
| | 2,751 | | | Greeneden U.S. Holdings II, LLC, Term Loan B4 | | | 4.750% | | | | 1-Month LIBOR | | | | 4.000% | | | | 12/01/27 | | | | B– | | | | 2,756,882 | |
| | 559 | | | Uber Technologies, Inc., Term Loan B | | | 3.592% | | | | 1-Month LIBOR | | | | 3.500% | | | | 2/25/27 | | | | B+ | | | | 557,625 | |
| | 2,034 | | | Uber Technologies, Inc., Term Loan B, First Lien | | | 3.592% | | | | 1-Month LIBOR | | | | 3.500% | | | | 4/04/25 | | | | B+ | | | | 2,029,958 | |
| | 7,129 | | | Total Internet Software & Services | | | | | | | | | | | | | | | | | | | | | | | 7,117,474 | |
| |
| | | | IT Services – 5.1% (3.2% of Total Investments) | |
| | | | | | | |
| | 1,614 | | | Ahead Data Blue, LLC, Term Loan B | | | 4.500% | | | | 3-Month LIBOR | | | | 3.750% | | | | 10/16/27 | | | | B+ | | | | 1,617,244 | |
| | 418 | | | DTI Holdco, Inc., Term Loan B | | | 5.750% | | | | 3-Month LIBOR | | | | 4.750% | | | | 9/30/23 | | | | CCC+ | | | | 406,186 | |
| | 1 | | | DTI Holdco, Inc., Term Loan B | | | 5.750% | | | | 2-Month LIBOR | | | | 4.750% | | | | 9/30/23 | | | | CCC+ | | | | 1,070 | |
| | 3,936 | | | Intrado Corporation, Term Loan | | | 5.000% | | | | 3-Month LIBOR | | | | 4.000% | | | | 10/10/24 | | | | BB– | | | | 3,845,486 | |
| | 963 | | | KBR, Inc., Term Loan B | | | 2.842% | | | | 1-Month LIBOR | | | | 2.750% | | | | 2/07/27 | | | | Ba1 | | | | 963,414 | |
| | 1,500 | | | Magenta Buyer LLC, Term Loan, (WI/DD) | | | TBD | | | | TBD | | | | TBD | | | | TBD | | | | BB– | | | | 1,494,848 | |
| | 792 | | | NeuStar, Inc., Term Loan B4 | | | 4.500% | | | | 3-Month LIBOR | | | | 3.500% | | | | 8/08/24 | | | | B+ | | | | 774,960 | |
| | 139 | | | NeuStar, Inc., Term Loan B5 | | | 5.500% | | | | 3-Month LIBOR | | | | 4.500% | | | | 8/08/24 | | | | B+ | | | | 136,181 | |
| | 500 | | | Optiv Security, Inc., Term Loan, Second Lien | | | 8.250% | | | | 3-Month LIBOR | | | | 7.250% | | | | 2/01/25 | | | | CCC | | | | 491,750 | |
| | 399 | | | Project Ruby Ultimate Parent Corp., Term Loan | | | 4.000% | | | | 1-Month LIBOR | | | | 3.250% | | | | 3/10/28 | | | | B | | | | 397,366 | |
58
| | | | | | | | | | | | | | | | | | | | | | | | | | | | |
Principal
Amount (000) | | | Description (1) | | Coupon (2) | | | Reference
Rate (2) | | | Spread (2) | | | Maturity (3) | | | Ratings (4) | | | Value | |
| |
| | | | IT Services (continued) | |
| | | | | | | |
| $ | 3,532 | | | Sabre GLBL, Inc., Term Loan B | | | 2.092% | | | | 1-Month LIBOR | | | | 2.000% | | | | 2/22/24 | | | | Ba3 | | | $ | 3,457,597 | |
| | 697 | | | Science Applications International Corporation, Term Loan B | | | 1.967% | | | | 1-Month LIBOR | | | | 1.875% | | | | 10/31/25 | | | | BB+ | | | | 692,284 | |
| | 2,816 | | | Syniverse Holdings, Inc., Term Loan, First Lien | | | 6.000% | | | | 3-Month LIBOR | | | | 5.000% | | | | 3/09/23 | | | | CCC+ | | | | 2,786,774 | |
| | 2,671 | | | Syniverse Holdings, Inc., Term Loan, Second Lien | | | 10.000% | | | | 3-Month LIBOR | | | | 9.000% | | | | 3/11/24 | | | | CCC– | | | | 2,644,717 | |
| | 1,479 | | | Tempo Acquisition LLC, Extended Term Loan | | | 3.750% | | | | 1-Month LIBOR | | | | 3.250% | | | | 10/31/26 | | | | BB– | | | | 1,478,767 | |
| | 21,457 | | | Total IT Services | | | | | | | | | | | | | | | | | | | | | | | 21,188,644 | |
| |
| | | | Leisure Products – 0.3% (0.2% of Total Investments) | |
| | | | | | | |
| | 480 | | | Hayward Industries, Inc., Term Loan | | | 3.250% | | | | 1-Month LIBOR | | | | 2.750% | | | | 5/28/28 | | | | BB– | | | | 476,125 | |
| | 545 | | | SRAM, LLC , Term Loan B | | | 3.250% | | | | 6-Month LIBOR | | | | 2.750% | | | | 5/18/28 | | | | BB– | | | | 543,409 | |
| | 55 | | | SRAM, LLC , Term Loan B | | | 3.250% | | | | 1-Month LIBOR | | | | 2.750% | | | | 5/18/28 | | | | BB– | | | | 54,341 | |
| | 136 | | | SRAM, LLC , Term Loan B | | | 3.250% | | | | 3-Month LIBOR | | | | 2.750% | | | | 5/18/28 | | | | BB– | | | | 135,852 | |
| | 1,216 | | | Total Leisure Products | | | | | | | | | | | | | | | | | | | | | | | 1,209,727 | |
| |
| | | | Life Sciences Tools & Services – 4.5% (2.8% of Total Investments) | |
| | | | | | | |
| | 4,003 | | | ICON Luxembourg Sarl, Term Loan, (WI/DD) | | | TBD | | | | TBD | | | | TBD | | | | TBD | | | | BB+ | | | | 3,999,137 | |
| | 997 | | | Indigo Merger Sub Inc, Term Loan, (WI/DD) | | | TBD | | | | TBD | | | | TBD | | | | TBD | | | | BB+ | | | | 996,388 | |
| | 7,993 | | | Parexel International Corporation, Term Loan B | | | 2.842% | | | | 1-Month LIBOR | | | | 2.750% | | | | 9/27/24 | | | | B2 | | | | 7,976,759 | |
| | 5,745 | | | PPD, Inc., Initial Term Loan | | | 2.750% | | | | 1-Month LIBOR | | | | 2.250% | | | | 1/13/28 | | | | Ba2 | | | | 5,737,351 | |
| | 18,738 | | | Total Life Sciences Tools & Services | | | | | | | | | | | | | | | | | | | | | | | 18,709,635 | |
| |
| | | | Machinery – 1.4% (0.8% of Total Investments) | |
| | | | | | | |
| | 984 | | | Alliance Laundry Systems LLC, Term Loan B | | | 4.250% | | | | 3-Month LIBOR | | | | 3.500% | | | | 10/08/27 | | | | B | | | | 984,743 | |
| | 527 | | | Blount International, Inc., Term Loan B | | | 4.750% | | | | 1-Month LIBOR | | | | 3.750% | | | | 4/12/23 | | | | B2 | | | | 528,747 | |
| | 192 | | | Gardner Denver, Inc., Term Loan B | | | 2.842% | | | | 1-Month LIBOR | | | | 2.750% | | | | 1/31/27 | | | | BB+ | | | | 192,471 | |
| | 1,716 | | | Gardner Denver, Inc., Term Loan B2 | | | 1.842% | | | | 1-Month LIBOR | | | | 1.750% | | | | 2/28/27 | | | | BB+ | | | | 1,687,025 | |
| | 1,293 | | | Vertical Midco GmbH, Term Loan B, (DD1) | | | 4.404% | | | | 6-Month LIBOR | | | | 4.250% | | | | 7/31/27 | | | | B+ | | | | 1,291,862 | |
| | 988 | | | Vertiv Group Corporation, Term Loan B | | | 2.851% | | | | 1-Month LIBOR | | | | 2.750% | | | | 3/02/27 | | | | B+ | | | | 979,588 | |
| | 5,700 | | | Total Machinery | | | | | | | | | | | | | | | | | | | | | | | 5,664,436 | |
| |
| | | | Marine – 0.4% (0.2% of Total Investments) | |
| | | | | | | |
| | 2,061 | | | HGIM Corp., Exit Term Loan, (DD1) | | | 7.000% | | | | 3-Month LIBOR | | | | 6.000% | | | | 7/02/23 | | | | Caa3 | | | | 1,537,741 | |
| |
| | | | Media – 16.3% (10.1% of Total Investments) | |
| | | | | | | |
| | 1,250 | | | Cable One, Inc., Term Loan B4 | | | 2.092% | | | | 1-Month LIBOR | | | | 2.000% | | | | 5/03/28 | | | | BB+ | | | | 1,237,187 | |
| | 3,720 | | | Charter Communications Operating, LLC, Term Loan B2 | | | 1.850% | | | | 1-Month LIBOR | | | | 1.750% | | | | 2/01/27 | | | | BBB– | | | | 3,681,710 | |
| | 458 | | | Checkout Holding Corp., First Out Term Loan | | | 8.500% | | | | 3-Month LIBOR | | | | 7.500% | | | | 2/15/23 | | | | N/R | | | | 442,680 | |
| | 782 | | | Checkout Holding Corp., Last Out Term Loan, (cash 2.000%, PIK 9.500%) | | | 2.000% | | | | 3-Month LIBOR | | | | 1.000% | | | | 8/15/23 | | | | N/R | | | | 433,803 | |
| | 8,099 | | | Clear Channel Outdoor Holdings, Inc., Term Loan B | | | 3.629% | | | | 3-Month LIBOR | | | | 3.500% | | | | 8/21/26 | | | | B1 | | | | 7,876,993 | |
| | 5,013 | | | CSC Holdings, LLC, Incremental Term Loan | | | 2.343% | | | | 1-Month LIBOR | | | | 2.250% | | | | 1/15/26 | | | | BB | | | | 4,934,505 | |
| | 2,929 | | | CSC Holdings, LLC, Term Loan B1 | | | 2.343% | | | | 1-Month LIBOR | | | | 2.250% | | | | 7/17/25 | | | | BB | | | | 2,890,329 | |
| | 4,613 | | | CSC Holdings, LLC, Term Loan B5 | | | 2.593% | | | | 1-Month LIBOR | | | | 2.500% | | | | 4/15/27 | | | | BB | | | | 4,562,496 | |
| | 371 | | | Cumulus Media New Holdings, Inc., Term Loan B | | | 4.750% | | | | 3-Month LIBOR | | | | 3.750% | | | | 3/31/26 | | | | B | | | | 371,802 | |
| | 1,090 | | | Diamond Sports Group, LLC, Term Loan | | | 3.350% | | | | 1-Month LIBOR | | | | 3.250% | | | | 8/24/26 | | | | CCC+ | | | | 602,846 | |
| | 4,664 | | | Directv Financing LLC, Term Loan, (WI/DD) | | | TBD | | | | TBD | | | | TBD | | | | TBD | | | | BBB– | | | | 4,660,525 | |
| | 733 | | | E.W. Scripps Company (The), Term Loan B2 | | | 3.313% | | | | 1-Month LIBOR | | | | 2.562% | | | | 5/01/26 | | | | BB | | | | 729,627 | |
| | 203 | | | Entercom Media Corp., Term Loan | | | 2.588% | | | | 3-Month LIBOR | | | | 2.500% | | | | 11/17/24 | | | | BB– | | | | 200,573 | |
| | 413 | | | GCI Holdings, Inc., Term Loan B | | | 3.500% | | | | 1-Month LIBOR | | | | 2.750% | | | | 10/15/25 | | | | Ba2 | | | | 412,638 | |
| | 553 | | | Gray Television, Inc., Term Loan B | | | 2.350% | | | | 1-Month LIBOR | | | | 2.250% | | | | 2/07/24 | | | | BB+ | | | | 549,887 | |
| | 637 | | | Gray Television, Inc., Term Loan C | | | 2.600% | | | | 1-Month LIBOR | | | | 2.500% | | | | 1/02/26 | | | | BB+ | | | | 632,335 | |
| | 8 | | | Houghton Mifflin Harcourt Publishers Inc, Term Loan | | | 7.250% | | | | N/A | | | | N/A | | | | 11/22/24 | | | | BB+ | | | | 7,520 | |
| | 4,703 | | | iHeartCommunications, Inc., Term Loan | | | 3.092% | | | | 1-Month LIBOR | | | | 3.000% | | | | 5/01/26 | | | | B+ | | | | 4,647,452 | |
| | 2,056 | | | Intelsat Jackson Holdings S.A., DIP Term Loan, (6) | | | 3.600% | | | | 3-Month LIBOR | | | | 5.500% | | | | 7/13/21 | | | | N/R | | | | 2,078,404 | |
| | 6,367 | | | Intelsat Jackson Holdings S.A., Term Loan B3, (6) | | | 8.000% | | | | Prime | | | | 4.750% | | | | 11/27/23 | | | | N/R | | | | 6,484,314 | |
| | 418 | | | LCPR Loan Financing LLC, Term Loan B | | | 3.843% | | | | 1-Month LIBOR | | | | 3.750% | | | | 10/15/28 | | | | BB+ | | | | 419,157 | |
| | 1,760 | | | Mav Acquisition Corp, Term Loan, (WI/DD) | | | TBD | | | | TBD | | | | TBD | | | | TBD | | | | B2 | | | | 1,744,160 | |
| | 456 | | | Meredith Corporation, Incremental Term Loan B | | | 5.250% | | | | 3-Month LIBOR | | | | 4.250% | | | | 1/31/25 | | | | BB– | | | | 465,553 | |
| | 2,200 | | | Meredith Corporation, Term Loan B2 | | | 2.592% | | | | 1-Month LIBOR | | | | 2.500% | | | | 1/31/25 | | | | BB– | | | | 2,188,770 | |
| | 2,056 | | | Nexstar Broadcasting, Inc., Term Loan B3 | | | 2.337% | | | | 3-Month LIBOR | | | | 2.250% | | | | 1/17/24 | | | | BBB– | | | | 2,043,910 | |
59
| | |
| |
| JRO | | Nuveen Floating Rate Income Opportunity Fund (continued) |
| | Portfolio of Investments July 31, 2021 |
| | | | | | | | | | | | | | | | | | | | | | | | | | | | |
Principal
Amount (000) | | | Description (1) | | Coupon (2) | | | Reference
Rate (2) | | | Spread (2) | | | Maturity (3) | | | Ratings (4) | | | Value | |
| |
| | | | Media (continued) | |
| | | | | | | |
| $ | 949 | | | Nexstar Broadcasting, Inc., Term Loan B4 | | | 2.600% | | | | 1-Month LIBOR | | | | 2.500% | | | | 9/19/26 | | | | BBB– | | | $ | 941,243 | |
| | 311 | | | Red Ventures, LLC, Term Loan B2 | | | 2.592% | | | | 1-Month LIBOR | | | | 2.500% | | | | 11/08/24 | | | | BB | | | | 305,758 | |
| | 1,856 | | | Sinclair Television Group, Inc., Term Loan B1 | | | 2.350% | | | | 1-Month LIBOR | | | | 2.250% | | | | 1/03/24 | | | | Ba2 | | | | 1,834,763 | |
| | 884 | | | Sinclair Television Group, Inc., Term Loan B2B | | | 2.600% | | | | 1-Month LIBOR | | | | 2.500% | | | | 9/30/26 | | | | Ba2 | | | | 872,918 | |
| | 733 | | | Springer Nature Deutschland GmbH, Term Loan B18 | | | 3.750% | | | | 1-Month LIBOR | | | | 3.000% | | | | 8/14/26 | | | | B+ | | | | 731,932 | |
| | 1,052 | | | Virgin Media Bristol LLC, Term Loan N | | | 2.593% | | | | 1-Month LIBOR | | | | 2.500% | | | | 1/31/28 | | | | BB+ | | | | 1,037,098 | |
| | 2,221 | | | WideOpenWest Finance LLC, Term Loan B | | | 4.250% | | | | 1-Month LIBOR | | | | 3.250% | | | | 8/19/23 | | | | B | | | | 2,220,379 | |
| | 5,519 | | | Ziggo Financing Partnership, Term Loan I | | | 2.593% | | | | 1-Month LIBOR | | | | 2.500% | | | | 4/30/28 | | | | BB | | | | 5,433,747 | |
| | 69,077 | | | Total Media | | | | | | | | | | | | | | | | | | | | | | | 67,677,014 | |
| |
| | | | Multiline Retail – 0.6% (0.4% of Total Investments) | |
| | | | | | | |
| | 313 | | | Belk, Inc., Term Loan | | | 8.500% | | | | 6-Month LIBOR | | | | 7.500% | | | | 7/31/25 | | | | B– | | | | 313,904 | |
| | 1,373 | | | Belk, Inc., Term Loan, (cash 5.135%, PIK 8.000%) | | | 13.135% | | | | 3-Month LIBOR | | | | 13.000% | | | | 7/31/25 | | | | CCC– | | | | 1,050,541 | |
| | 1,098 | | | EG America LLC, Term Loan | | | 4.147% | | | | 3-Month LIBOR | | | | 4.000% | | | | 2/05/25 | | | | B– | | | | 1,092,437 | |
| | 2,784 | | | Total Multiline Retail | | | | | | | | | | | | | | | | | | | | | | | 2,456,882 | |
| |
| | | | Office Electronics – 0.0% (0.0% of Total Investments) | |
| | | | | | | |
| | 181 | | | Pitney Bowes, Inc., Term Loan B | | | 4.100% | | | | 1-Month LIBOR | | | | 4.000% | | | | 3/19/28 | | | | BBB– | | | | 181,880 | |
| |
| | | | Oil, Gas & Consumable Fuels – 2.8% (1.8% of Total Investments) | |
| | | | | | | |
| | 954 | | | BCP Renaissance Parent LLC, Term Loan B | | | 4.500% | | | | 3-Month LIBOR | | | | 3.500% | | | | 11/01/24 | | | | B+ | | | | 943,208 | |
| | 1,131 | | | Buckeye Partners, L.P., Term Loan B | | | 2.354% | | | | 1-Month LIBOR | | | | 2.250% | | | | 11/01/26 | | | | BBB– | | | | 1,122,070 | |
| | 375 | | | DT Midstream Inc, Term Loan, (WI/DD) | | | TBD | | | | TBD | | | | TBD | | | | TBD | | | | Baa2 | | | | 374,497 | |
| | 1,190 | | | Fieldwood Energy LLC, DIP Delayed Draw Term Loan, (5), (6) | | | 9.750% | | | | 1-Month LIBOR | | | | 8.750% | | | | 8/05/21 | | | | N/R | | | | 1,238,170 | |
| | 10,614 | | | Fieldwood Energy LLC, Exit Term Loan, First Lien, (DD1), (6) | | | 0.000% | | | | N/A | | | | N/A | | | | 4/11/22 | | | | N/R | | | | 5,729,871 | |
| | 3,211 | | | Fieldwood Energy LLC, Exit Term Loan, Second Lien, (6) | | | 0.000% | | | | N/A | | | | N/A | | | | 4/11/23 | | | | N/R | | | | 358,546 | |
| | 2,460 | | | Gulf Finance, LLC, Term Loan B | | | 6.250% | | | | 1-Month LIBOR | | | | 5.250% | | | | 8/25/23 | | | | CCC+ | | | | 2,071,179 | |
| | 19,935 | | | Total Oil, Gas & Consumable Fuels | | | | | | | | | | | | | | | | | | | | | | | 11,837,541 | |
| |
| | | | Paper & Forest Products – 1.0% (0.6% of Total Investments) | |
| | | | | | | |
| | 1,886 | | | Asplundh Tree Expert, LLC, Term Loan B | | | 1.842% | | | | 1-Month LIBOR | | | | 1.750% | | | | 9/04/27 | | | | BBB– | | | | 1,868,514 | |
| | 1,094 | | | Charter Next Generation Inc, Term Loan | | | 4.770% | | | | 1-Month LIBOR | | | | 3.750% | | | | 12/01/27 | | | | N/R | | | | 1,094,954 | |
| | 1,105 | | | Post Holdings, Inc., Term Loan B | | | 4.750% | | | | 1-Month LIBOR | | | | 4.000% | | | | 10/21/24 | | | | B+ | | | | 1,111,898 | |
| | 4,085 | | | Total Paper & Forest Products | | | | | | | | | | | | | | | | | | | | | | | 4,075,366 | |
| |
| | | | Personal Products – 1.8% (1.1% of Total Investments) | |
| | | | | | | |
| | 750 | | | Conair Holdings, LLC, Term Loan B | | | 4.250% | | | | 3-Month LIBOR | | | | 3.750% | | | | 5/17/28 | | | | B1 | | | | 748,946 | |
| | 34 | | | Coty, Inc., Term Loan B | | | 2.352% | | | | 1-Month LIBOR | | | | 2.250% | | | | 4/05/25 | | | | B | | | | 33,086 | |
| | 880 | | | Journey Personal Care Corp., Term Loan B | | | 5.000% | | | | 3-Month LIBOR | | | | 4.250% | | | | 3/01/28 | | | | B | | | | 882,477 | |
| | 2,983 | | | Kronos Acquisition Holdings, Inc., Term Loan B | | | 4.250% | | | | 3-Month LIBOR | | | | 3.750% | | | | 12/22/26 | | | | B2 | | | | 2,953,829 | |
| | 3,700 | | | Revlon Consumer Products Corporation, Term Loan B, (DD1), (7) | | | 4.250% | | | | 3-Month LIBOR | | | | 3.500% | | | | 9/07/23 | | | | CC | | | | 2,913,510 | |
| | 8,347 | | | Total Personal Products | | | | | | | | | | | | | | | | | | | | | | | 7,531,848 | |
| |
| | | | Pharmaceuticals – 5.2% (3.3% of Total Investments) | |
| | | | | | | |
| | 938 | | | Alphabet Holding Company, Inc., Term Loan, First Lien | | | 3.592% | | | | 1-Month LIBOR | | | | 3.500% | | | | 9/26/24 | | | | B2 | | | | 938,185 | |
| | 4,637 | | | Bausch Health Companies, Inc., Term Loan B, (DD1) | | | 3.092% | | | | 1-Month LIBOR | | | | 3.000% | | | | 6/02/25 | | | | BB | | | | 4,609,149 | |
| | 2,260 | | | Bausch Health Companies, Inc., Term Loan B | | | 2.842% | | | | 1-Month LIBOR | | | | 2.750% | | | | 11/27/25 | | | | BB | | | | 2,240,529 | |
| | 980 | | | Catalent Pharma Solutions, Inc., Term Loan B3 | | | 2.500% | | | | 1-Month LIBOR | | | | 2.000% | | | | 2/22/28 | | | | BBB– | | | | 982,984 | |
| | 823 | | | Elanco Animal Health Incorporated, Term Loan B | | | 1.850% | | | | 1-Month LIBOR | | | | 1.750% | �� | | | 8/01/27 | | | | Baa3 | | | | 809,175 | |
| | 844 | | | Endo Luxembourg Finance Company I S.a r.l., Term Loan | | | 5.750% | | | | 3-Month LIBOR | | | | 5.000% | | | | 3/25/28 | | | | B | | | | 826,742 | |
| | 1,210 | | | Gainwell Acquisition Corp., Term Loan B | | | 4.750% | | | | 3-Month LIBOR | | | | 4.000% | | | | 10/01/27 | | | | BB– | | | | 1,211,785 | |
| | 3,250 | | | Jazz Financing Lux S.a.r.l., Term Loan | | | 4.000% | | | | 1-Month LIBOR | | | | 3.500% | | | | 4/22/28 | | | | BB+ | | | | 3,258,125 | |
| | 4,384 | | | Mallinckrodt International Finance S.A., Term Loan B, (DD1), (6) | | | 6.000% | | | | 6-Month LIBOR | | | | 5.250% | | | | 9/24/24 | | | | D | | | | 4,272,990 | |
| | 617 | | | Mallinckrodt International Finance S.A., Term Loan B, (6) | | | 6.250% | | | | 1-Month LIBOR | | | | 5.500% | | | | 2/24/25 | | | | D | | | | 599,460 | |
60
| | | | | | | | | | | | | | | | | | | | | | | | | | | | |
Principal
Amount (000) | | | Description (1) | | Coupon (2) | | | Reference
Rate (2) | | | Spread (2) | | | Maturity (3) | | | Ratings (4) | | | Value | |
| |
| | | | Pharmaceuticals (continued) | |
| | | | | | | |
| $ | 2,000 | | | Organon & Co, Term Loan | | | 3.500% | | | | 3-Month LIBOR | | | | 3.000% | | | | 6/02/28 | | | | BB | | | $ | 1,997,710 | |
| | 21,943 | | | Total Pharmaceuticals | | | | | | | | | | | | | | | | | | | | | | | 21,746,834 | |
| |
| | | | Professional Services – 1.9% (1.2% of Total Investments) | |
| | | | | | | |
| | 597 | | | ASGN Incorporated, Term Loan B3 | | | 1.842% | | | | 1-Month LIBOR | | | | 1.750% | | | | 4/02/25 | | | | BBB– | | | | 597,865 | |
| | 1,037 | | | Ceridian HCM Holding, Inc., Term Loan B | | | 2.584% | | | | 1-Week LIBOR | | | | 2.500% | | | | 4/30/25 | | | | B+ | | | | 1,020,692 | |
| | 788 | | | Creative Artists Agency, LLC , Term Loan B | | | 3.842% | | | | 1-Month LIBOR | | | | 3.750% | | | | 11/26/26 | | | | B | | | | 780,672 | |
| | 2,170 | | | Dun & Bradstreet Corporation (The), Term Loan | | | 3.336% | | | | 1-Month LIBOR | | | | 3.250% | | | | 2/08/26 | | | | BB+ | | | | 2,154,863 | |
| | 970 | | | EAB Global Inc, Term Loan, (WI/DD) | | | TBD | | | | TBD | | | | TBD | | | | TBD | | | | B– | | | | 964,301 | |
| | 529 | | | Nielsen Consumer, Inc., Term Loan B | | | 4.103% | | | | 1-Month LIBOR | | | | 4.000% | | | | 3/05/28 | | | | BB | | | | 528,723 | |
| | 1,689 | | | Nielsen Finance LLC, Term Loan B4 | | | 2.103% | | | | 1-Month LIBOR | | | | 2.000% | | | | 10/04/23 | | | | BBB– | | | | 1,686,682 | |
| | 7,780 | | | Total Professional Services | | | | | | | | | | | | | | | | | | | | | | | 7,733,798 | |
| |
| | | | Real Estate Management & Development – 1.3% (0.8% of Total Investments) | |
| | | | | | | |
| | 2,587 | | | Brookfield Property REIT, Inc., Term Loan A2 | | | 3.092% | | | | 1-Month LIBOR | | | | 3.000% | | | | 8/24/23 | | | | BB+ | | | | 2,566,982 | |
| | 2,736 | | | North American Lifting Holdings, Inc., Priority Term Loan | | | 7.500% | | | | 3-Month LIBOR | | | | 6.500% | | | | 10/16/24 | | | | B+ | | | | 2,862,802 | |
| | 5,323 | | | Total Real Estate Management & Development | | | | | | | | | | | | | | | | | | | | | | | 5,429,784 | |
| |
| | | | Road & Rail – 2.4% (1.5% of Total Investments) | |
| | | | | | | |
| | 1,708 | | | Avolon TLB Borrower 1 (US) LLC, Term Loan B3 | | | 2.500% | | | | 1-Month LIBOR | | | | 1.750% | | | | 1/15/25 | | | | Baa2 | | | | 1,701,278 | |
| | 641 | | | First Student Bidco Inc, Term Loan, (WI/DD) | | | TBD | | | | TBD | | | | TBD | | | | TBD | | | | BB+ | | | | 636,930 | |
| | 1,734 | | | First Student Bidco Inc, Term Loan, (WI/DD) | | | TBD | | | | TBD | | | | TBD | | | | TBD | | | | BB+ | | | | 1,723,784 | |
| | 1,975 | | | Genesee & Wyoming, Inc., Term Loan | | | 2.147% | | | | 3-Month LIBOR | | | | 2.000% | | | | 12/30/26 | | | | BB+ | | | | 1,959,200 | |
| | 1,402 | | | Hertz Corp, Term Loan, (WI/DD) | | | TBD | | | | TBD | | | | TBD | | | | TBD | | | | B+ | | | | 1,395,414 | |
| | 264 | | | Hertz Corp, Term Loan, (WI/DD) | | | TBD | | | | TBD | | | | TBD | | | | TBD | | | | BB– | | | | 262,987 | |
| | 939 | | | Hertz Corporation, (The), DIP Delayed Draw Term Loan, (5) | | | 8.250% | | | | 1-Month LIBOR | | | | 7.250% | | | | 12/31/21 | | | | N/R | | | | 943,702 | |
| | 46 | | | Savage Enterprises LLC, Term Loan B | | | 3.100% | | | | 1-Month LIBOR | | | | 3.000% | | | | 8/01/25 | | | | BB | | | | 46,074 | |
| | 1,444 | | | XPO Logistics, Inc., Term Loan B | | | 1.881% | | | | 3-Month LIBOR | | | | 1.750% | | | | 2/23/25 | | | | BBB– | | | | 1,433,428 | |
| | 10,153 | | | Total Road & Rail | | | | | | | | | | | | | | | | | | | | | | | 10,102,797 | |
| |
| | | | Semiconductors & Semiconductor Equipment – 0.5% (0.3% of Total Investments) | |
| | | | | | | |
| | 138 | | | Bright Bidco B.V., Term Loan B, (DD1) | | | 4.500% | | | | 3-Month LIBOR | | | | 3.500% | | | | 6/30/24 | | | | CCC | | | | 111,405 | |
| | 654 | | | CMC Materials, Inc., Term Loan B1 | | | 2.125% | | | | 1-Month LIBOR | | | | 2.000% | | | | 11/15/25 | | | | BBB– | | | | 652,151 | |
| | 1,402 | | | ON Semiconductor Corporation, Term Loan B | | | 2.092% | | | | 1-Month LIBOR | | | | 2.000% | | | | 9/19/26 | | | | Baa3 | | | | 1,389,016 | |
| | 2,194 | | | Total Semiconductors & Semiconductor Equipment | | | | | | | | | | | | | | | | | | | | 2,152,572 | |
| |
| | | | Software – 11.2% (7.0% of Total Investments) | |
| | | | | | | |
| | 991 | | | Apttus Corporation, Term Loan | | | 5.000% | | | | 3-Month LIBOR | | | | 4.250% | | | | 5/06/28 | | | | BB | | | | 995,339 | |
| | 1,474 | | | Blackboard, Inc., Term Loan B5 | | | 7.000% | | | | 3-Month LIBOR | | | | 6.000% | | | | 6/30/24 | | | | B1 | | | | 1,485,540 | |
| | 823 | | | By Crown Parent, LLC, Term Loan B1 | | | 4.000% | | | | 1-Month LIBOR | | | | 3.000% | | | | 1/30/26 | | | | B1 | | | | 820,778 | |
| | 498 | | | Camelot U.S. Acquisition 1 Co., Incremental Term Loan B | | | 4.000% | | | | 1-Month LIBOR | | | | 3.000% | | | | 10/31/26 | | | | B1 | | | | 498,045 | |
| | 650 | | | Camelot U.S. Acquisition 1 Co., Term Loan B | | | 3.092% | | | | 1-Month LIBOR | | | | 3.000% | | | | 10/31/26 | | | | B1 | | | | 644,655 | |
| | 1,995 | | | Delta TopCo, Inc., Term Loan B | | | 4.500% | | | | 3-Month LIBOR | | | | 3.750% | | | | 12/01/27 | | | | B2 | | | | 1,996,666 | |
| | 636 | | | Dynatrace LLC, Term Loan, First Lien | | | 2.342% | | | | 1-Month LIBOR | | | | 2.250% | | | | 8/23/25 | | | | BB+ | | | | 633,310 | |
| | 3,916 | | | Epicor Software Corporation, Term Loan | | | 4.000% | | | | 1-Month LIBOR | | | | 3.250% | | | | 7/31/27 | | | | B2 | | | | 3,909,658 | |
| | 3,151 | | | Finastra USA, Inc., Term Loan, First Lien | | | 4.500% | | | | 6-Month LIBOR | | | | 3.500% | | | | 6/13/24 | | | | BB– | | | | 3,106,282 | |
| | 429 | | | Greenway Health, LLC, Term Loan, First Lien | | | 4.750% | | | | 3-Month LIBOR | | | | 3.750% | | | | 2/16/24 | | | | B– | | | | 412,272 | |
| | 2,283 | | | Informatica LLC,, Term Loan B | | | 3.342% | | | | 1-Month LIBOR | | | | 3.250% | | | | 2/14/27 | | | | B1 | | | | 2,262,366 | |
| | 608 | | | iQor US, Inc., Second Out Term Loan | | | 8.500% | | | | 3-Month LIBOR | | | | 7.500% | | | | 11/19/25 | | | | CCC+ | | | | 600,713 | |
| | 1,284 | | | MA FinanceCo., LLC, Term Loan B | | | 5.250% | | | | 3-Month LIBOR | | | | 4.250% | | | | 6/05/25 | | | | BB | | | | 1,293,459 | |
| | 1,111 | | | MA FinanceCo., LLC, Term Loan B3 | | | 2.842% | | | | 1-Month LIBOR | | | | 2.750% | | | | 6/21/24 | | | | BB | | | | 1,097,626 | |
| | 2,328 | | | McAfee, LLC, Term Loan B | | | 3.840% | | | | 1-Month LIBOR | | | | 3.750% | | | | 9/29/24 | | | | BB | | | | 2,328,768 | |
| | 667 | | | Mitchell International, Inc., Term Loan, Second Lien | | | 7.342% | | | | 1-Month LIBOR | | | | 7.250% | | | | 11/30/25 | | | | CCC | | | | 670,727 | |
| | 1,179 | | | Perforce Software, Inc., Term Loan B | | | 3.842% | | | | 1-Month LIBOR | | | | 3.750% | | | | 7/01/26 | | | | B2 | | | | 1,166,960 | |
| | 1,500 | | | Polaris Newco LLC, Term Loan B | | | 4.500% | | | | 6-Month LIBOR | | | | 4.000% | | | | 6/04/28 | | | | B2 | | | | 1,500,765 | |
| | 2,074 | | | Proofpoint Inc, Term Loan, (WI/DD) | | | TBD | | | | TBD | | | | TBD | | | | TBD | | | | BB– | | | | 2,056,371 | |
| | 1,475 | | | RealPage, Inc, Term Loan, First Lien | | | 3.750% | | | | 1-Month LIBOR | | | | 3.250% | | | | 4/22/28 | | | | B+ | | | | 1,467,905 | |
| | 7,500 | | | Seattle Spinco, Inc., Term Loan B3 | | | 2.842% | | | | 1-Month LIBOR | | | | 2.750% | | | | 6/21/24 | | | | BB | | | | 7,412,542 | |
| | 1,725 | | | Sophia, L.P., Term Loan, First Lien | | | 4.500% | | | | 3-Month LIBOR | | | | 3.750% | | | | 10/07/27 | | | | B | | | | 1,725,422 | |
| | 1,105 | | | SS&C European Holdings Sarl, Term Loan B4 | | | 1.842% | | | | 1-Month LIBOR | | | | 1.750% | | | | 4/16/25 | | | | BB+ | | | | 1,090,354 | |
61
| | |
| |
| JRO | | Nuveen Floating Rate Income Opportunity Fund (continued) |
| | Portfolio of Investments July 31, 2021 |
| | | | | | | | | | | | | | | | | | | | | | | | | | | | |
Principal
Amount (000) | | | Description (1) | | Coupon (2) | | | Reference
Rate (2) | | | Spread (2) | | | Maturity (3) | | | Ratings (4) | | | Value | |
| |
| | | | Software (continued) | |
| | | | | | | |
| $ | 1,394 | | | SS&C Technologies, Inc., Term Loan B3 | | | 1.842% | | | | 1-Month LIBOR | | | | 1.750% | | | | 4/16/25 | | | | BB+ | | | $ | 1,376,389 | |
| | 1,000 | | | Tibco Software Inc., Term Loan, Second Lien | | | 7.350% | | | | 1-Month LIBOR | | | | 7.250% | | | | 3/04/28 | | | | B– | | | | 1,010,625 | |
| | 1,159 | | | Tibco Software, Inc., Term Loan B3 | | | 3.850% | | | | 1-Month LIBOR | | | | 3.750% | | | | 7/03/26 | | | | B+ | | | | 1,150,329 | |
| | 1,030 | | | Ultimate Software Group Inc(The), Incremental Term Loan | | | 4.000% | | | | 3-Month LIBOR | | | | 3.250% | | | | 5/03/26 | | | | B1 | | | | 1,030,336 | |
| | 737 | | | Ultimate Software Group Inc(The), Term Loan B | | | 3.842% | | | | 1-Month LIBOR | | | | 3.750% | | | | 5/03/26 | | | | B1 | | | | 737,369 | |
| | 1,434 | | | ZoomInfo LLC, Term Loan B, (DD1) | | | 3.092% | | | | 1-Month LIBOR | | | | 3.000% | | | | 2/01/26 | | | | BB | | | | 1,434,863 | |
| | 717 | | | ZoomInfo LLC, Term Loan B, (DD1) | | | 3.092% | | | | 3-Month LIBOR | | | | 3.000% | | | | 2/01/26 | | | | BB | | | | 717,431 | |
| | 46,873 | | | Total Software | | | | | | | | | | | | | | | | | | | | | | | 46,633,865 | |
| |
| | | | Specialty Retail – 2.9% (1.8% of Total Investments) | |
| | | | | | | |
| | 860 | | | Academy, Ltd., Term Loan | | | 4.500% | | | | 1-Month LIBOR | | | | 3.750% | | | | 5/01/69 | | | | N/R | | | | 861,957 | |
| | 956 | | | Birkenstock US BidCo Inc, Term Loan, (WI/DD) | | | TBD | | | | TBD | | | | TBD | | | | TBD | | | | BB– | | | | 955,202 | |
| | 1,460 | | | Jo-Ann Stores, Inc., Term Loan B1 | | | 5.500% | | | | 3-Month LIBOR | | | | 4.750% | | | | 6/30/28 | | | | B | | | | 1,455,802 | |
| | 369 | | | LBM Acquisition LLC, Term Loan, (WI/DD) | | | TBD | | | | TBD | | | | TBD | | | | TBD | | | | B+ | | | | 365,023 | |
| | 185 | | | LBM Acquisition LLC, Term Loan, (WI/DD), (5) | | | TBD | | | | TBD | | | | TBD | | | | TBD | | | | B+ | | | | 182,512 | |
| | 993 | | | Mattress Firm Inc, Term Loan B | | | 6.250% | | | | 6-Month LIBOR | | | | 5.250% | | | | 11/25/27 | | | | B+ | | | | 1,012,193 | |
| | 6,570 | | | PetSmart, Inc., Term Loan B | | | 4.500% | | | | 6-Month LIBOR | | | | 3.750% | | | | 2/12/28 | | | | BB– | | | | 6,575,749 | |
| | 546 | | | Staples, Inc., Term Loan | | | 5.176% | | | | 3-Month LIBOR | | | | 5.000% | | | | 4/12/26 | | | | B | | | | 530,433 | |
| | 11,939 | | | Total Specialty Retail | | | | | | | | | | | | | | | | | | | | | | | 11,938,871 | |
| |
| | | | Technology Hardware, Storage & Peripherals – 2.5% (1.5% of Total Investments) | |
| | | | | | | |
| | 1,677 | | | Conduent Business Services, LLC, Term Loan A | | | 1.842% | | | | 1-Month LIBOR | | | | 1.750% | | | | 12/07/22 | | | | BB– | | | | 1,664,449 | |
| | 5,992 | | | Dell International LLC, Term Loan B | | | 2.000% | | | | 1-Month LIBOR | | | | 1.750% | | | | 9/19/25 | | | | BBB– | | | | 5,990,326 | |
| | 587 | | | NCR Corporation, Term Loan | | | 2.630% | | | | 3-Month LIBOR | | | | 2.500% | | | | 8/28/26 | | | | BB+ | | | | 575,503 | |
| | 997 | | | Peraton Corp., Term Loan B | | | 4.500% | | | | 1-Month LIBOR | | | | 3.750% | | | | 2/01/28 | | | | BB– | | | | 998,124 | |
| | 705 | | | Tech Data Corporation, Term Loan | | | 3.592% | | | | 1-Month LIBOR | | | | 3.500% | | | | 7/01/25 | | | | BBB– | | | | 706,070 | |
| | 405 | | | Western Digital Corporation, Term Loan B4 | | | 1.842% | | | | 1-Month LIBOR | | | | 1.750% | | | | 4/29/23 | | | | Baa2 | | | | 405,312 | |
| | 10,363 | | | Total Technology Hardware, Storage & Peripherals | | | | | | | | | | | | | | | | | | | | 10,339,784 | |
| |
| | | | Textiles, Apparel & Luxury Goods – 0.2% (0.1% of Total Investments) | |
| | | | | | | |
| | 725 | | | CBI Buyer, Inc., Term Loan | | | 3.750% | | | | 3-Month LIBOR | | | | 3.250% | | | | 1/06/28 | | | | B1 | | | | 720,197 | |
| | 204 | | | Samsonite IP Holdings Sarl, Term Loan | | | 5.500% | | | | 1-Month LIBOR | | | | 4.500% | | | | 4/25/25 | | | | N/R | | | | 203,448 | |
| | 929 | | | Total Textiles, Apparel & Luxury Goods | | | | | | | | | | | | | | | | | | | | | | | 923,645 | |
| |
| | | | Transportation Infrastructure – 0.4% (0.3% of Total Investments) | |
| | | | | | | |
| | 731 | | | Atlantic Aviation FBO, Inc., Term Loan B | | | 3.850% | | | | 1-Month LIBOR | | | | 3.750% | | | | 12/06/25 | | | | BB | | | | 728,738 | |
| | 1,100 | | | KKR Apple Bidco LLC, Term Loan, (WI/DD) | | | TBD | | | | TBD | | | | TBD | | | | TBD | | | | B+ | | | | 1,093,642 | |
| | 1,831 | | | Total Transportation Infrastructure | | | | | | | | | | | | | | | | | | | | | | | 1,822,380 | |
| |
| | | | Wireless Telecommunication Services – 0.3% (0.2% of Total Investments) | |
| | | | | | | |
| | 412 | | | Altice Financing SA, Term Loan, First Lien | | | 2.900% | | | | 3-Month LIBOR | | | | 2.750% | | | | 1/31/26 | | | | B | | | | 404,309 | |
| | 1,000 | | | GOGO Intermediate Holdings LLC, Term Loan B | | | 4.500% | | | | 3-Month LIBOR | | | | 3.750% | | | | 4/30/28 | | | | B– | | | | 997,035 | |
| | 1,412 | | | Total Wireless Telecommunication Services | | | | | | | | | | | | | | | | | | | | | | | 1,401,344 | |
| | 594,138 | | | Total Variable Rate Senior Loan Interests (cost $580,551,402) | | | | | | | | | | | | | | | | | | | | 577,030,804 | |
| | | | | | | |
Principal
Amount (000) | | | Description (1) | | | | | | | | Coupon | | | Maturity | | | Ratings (4) | | | Value | |
| |
| | | | CORPORATE BONDS – 11.4% (7.1% of Total Investments) | |
| |
| | | | Auto Components – 0.8% (0.5% of Total Investments) | |
| | | | | | | |
| $ | 1,925 | | | Adient Global Holdings Ltd, 144A | | | | | | | | | | | 4.875% | | | | 8/15/26 | | | | B | | | $ | 1,968,312 | |
| | 1,425 | | | Adient US LLC, 144A | | | | | | | | | | | 9.000% | | | | 4/15/25 | | | | BB– | | | | 1,557,810 | |
| | 3,350 | | | Total Auto Components | | | | | | | | | | | | | | | | | | | | | | | 3,526,122 | |
| |
| | | | Chemicals – 0.3% (0.2% of Total Investments) | |
| | | | | | | |
| | 585 | | | Olin Corp, 144A | | | | | | | | | | | 9.500% | | | | 6/01/25 | | | | BB | | | | 730,519 | |
| | 500 | | | Rayonier AM Products Inc, 144A | | | | | | | | | | | 7.625% | | | | 1/15/26 | | | | B1 | | | | 513,750 | |
| | 1,085 | | | Total Chemicals | | | | | | | | | | | | | | | | | | | | | | | 1,244,269 | |
62
| | | | | | | | | | | | | | | | | | | | | | | | | | | | |
Principal
Amount (000) | | | Description (1) | | | | | | | | Coupon | | | Maturity | | | Ratings (4) | | | Value | |
| |
| | | | Commercial Services & Supplies – 0.4% (0.2% of Total Investments) | |
| | | | | | |
| $ | 1,500 | | | Prime Security Services Borrower LLC / Prime Finance Inc, 144A | | | | | | | | 3.375% | | | | 8/31/27 | | | | BB– | | | $ | 1,459,050 | |
| |
| | | | Communications Equipment – 0.4% (0.3% of Total Investments) | |
| | | | | | | |
| | 1,125 | | | CommScope Inc, 144A | | | | | | | | | | | 8.250% | | | | 3/01/27 | | | | B– | | | | 1,191,094 | |
| | 600 | | | CommScope Technologies LLC, 144A | | | | | | | | | | | 5.000% | | | | 3/15/27 | | | | B– | | | | 607,080 | |
| | 1,725 | | | Total Communications Equipment | | | | | | | | | | | | | | | | | | | | | | | 1,798,174 | |
| |
| | | | Diversified Telecommunication Services – 0.4% (0.3% of Total Investments) | |
| | | | | | | |
| | 1,125 | | | Avaya Inc, 144A | | | | | | | | | | | 6.125% | | | | 9/15/28 | | | | B+ | | | | 1,203,750 | |
| | 595 | | | Windstream Escrow LLC / Windstream Escrow Finance Corp, 144A | | | | | | | | 7.750% | | | | 8/15/28 | | | | BB | | | | 606,900 | |
| | 1,720 | | | Total Diversified Telecommunication Services | | | | | | | | | | | | | | | | | | | | | | | 1,810,650 | |
| |
| | | | Electric Utilities – 0.6% (0.4% of Total Investments) | |
| | | | | | |
| | 2,980 | | | Bruce Mansfield Unit 1 2007 Pass-Through Trust, (6) | | | | | | | | 6.850% | | | | 6/01/34 | | | | N/R | | | | 3,725 | |
| | 715 | | | Pacific Gas and Electric Co | | | | | | | | | | | 3.850% | | | | 11/15/23 | | | | BBB– | | | | 747,151 | |
| | 447 | | | Pacific Gas and Electric Co | | | | | | | | | | | 3.450% | | | | 7/01/25 | | | | BBB– | | | | 466,734 | |
| | 410 | | | Pacific Gas and Electric Co | | | | | | | | | | | 3.300% | | | | 12/01/27 | | | | BBB– | | | | 418,691 | |
| | 447 | | | Pacific Gas and Electric Co | | | | | | | | | | | 3.750% | | | | 7/01/28 | | | | BBB– | | | | 468,072 | |
| | 378 | | | Pacific Gas and Electric Co | | | | | | | | | | | 4.550% | | | | 7/01/30 | | | | BBB– | | | | 402,854 | |
| | — | (16) | | Pacific Gas and Electric Co | | | | | | | | | | | 4.500% | | | | 7/01/40 | | | | BBB– | | | | 1 | |
| | 5,377 | | | Total Electric Utilities | | | | | | | | | | | | | | | | | | | | | | | 2,507,228 | |
| |
| | | | Energy Equipment & Services – 0.2% (0.1% of Total Investments) | |
| | | | | | | |
| | 688 | | | Bausch Health Cos Inc, 144A | | | | | | | | | | | 6.125% | | | | 4/15/25 | | | | B | | | | 702,190 | |
| |
| | | | Entertainment – 0.4% (0.2% of Total Investments) | |
| | | | | | | |
| | 1,415 | | | AMC Entertainment Holdings Inc, 144A | | | | | | | | | | | 10.500% | | | | 4/15/25 | | | | B– | | | | 1,504,428 | |
| |
| | | | Equity Real Estate Investment Trust – 0.7% (0.4% of Total Investments) | |
| | | | | | |
| | 2,700 | | | Uniti Group LP / Uniti Fiber Holdings Inc / CSL Capital LLC, 144A | | | | | | | | 7.875% | | | | 2/15/25 | | | | B | | | | 2,875,500 | |
| |
| | | | Gas Utilities – 0.1% (0.1% of Total Investments) | |
| | | | | | |
| | 250 | | | NGL Energy Partners LP / NGL Energy Finance Corp | | | | | | | | 7.500% | | | | 11/01/23 | | | | CCC+ | | | | 238,125 | |
| | 250 | | | NGL Energy Partners LP / NGL Energy Finance Corp | | | | | | | | 6.125% | | | | 3/01/25 | | | | CCC+ | | | | 212,500 | |
| | 500 | | | Total Gas Utilities | | | | | | | | | | | | | | | | | | | | | | | 450,625 | |
| |
| | | | Health Care Providers & Services – 2.2% (1.4% of Total Investments) | |
| | | | | | | |
| | 1,360 | | | CHS/Community Health Systems Inc, 144A | | | | | | | | | | | 8.000% | | | | 3/15/26 | | | | B | | | | 1,458,083 | |
| | 225 | | | CHS/Community Health Systems Inc, 144A | | | | | | | | | | | 8.000% | | | | 12/15/27 | | | | B | | | | 248,852 | |
| | 120 | | | HCA Inc | | | | | | | | | | | 5.375% | | | | 2/01/25 | | | | Baa3 | | | | 136,008 | |
| | 2,750 | | | Legacy LifePoint Health LLC, 144A | | | | | | | | | | | 4.375% | | | | 2/15/27 | | | | B1 | | | | 2,756,875 | |
| | 295 | | | Tenet Healthcare Corp | | | | | | | | | | | 4.625% | | | | 7/15/24 | | | | B+ | | | | 298,688 | |
| | 1,000 | | | Tenet Healthcare Corp, 144A | | | | | | | | | | | 7.500% | | | | 4/01/25 | | | | B+ | | | | 1,075,000 | |
| | 1,060 | | | Tenet Healthcare Corp, 144A | | | | | | | | | | | 6.250% | | | | 2/01/27 | | | | B1 | | | | 1,103,725 | |
| | 1,940 | | | Tenet Healthcare Corp, 144A | | | | | | | | | | | 6.125% | | | | 10/01/28 | | | | B | | | | 2,066,100 | |
| | 8,750 | | | Total Health Care Providers & Services | | | | | | | | | | | | | | | | | | | | | | | 9,143,331 | |
| |
| | | | Hotels, Restaurants & Leisure – 0.0% (0.0% of Total Investments) | |
| | | | | | | |
| | 67 | | | Carnival Corp, 144A | | | | | | | | | | | 11.500% | | | | 4/01/23 | | | | Ba2 | | | | 75,543 | |
| |
| | | | Household Durables – 0.0% (0.0% of Total Investments) | |
| | | | | | |
| | 205 | | | Kronos Acquisition Holdings Inc / KIK Custom Products Inc, 144A | | | | | | | | 5.000% | | | | 12/31/26 | | | | B2 | | | | 207,871 | |
| |
| | | | Media – 2.3% (1.5% of Total Investments) | |
| | | | | | | |
| | 950 | | | Clear Channel Outdoor Holdings Inc, 144A | | | | | | | | | | | 7.750% | | | | 4/15/28 | | | | CCC | | | | 990,679 | |
| | 1,630 | | | Diamond Sports Group LLC / Diamond Sports Finance Co, 144A | | | | | | | | 5.375% | | | | 8/15/26 | | | | CCC+ | | | | 945,400 | |
| | 1,500 | | | Diamond Sports Group LLC / Diamond Sports Finance Co, 144A | | | | | | | | 6.625% | | | | 8/15/27 | | | | CCC– | | | | 594,375 | |
| | 2,100 | | | Houghton Mifflin Harcourt Publishers Inc, 144A | | | | | | | | | | | 9.000% | | | | 2/15/25 | | | | BB+ | | | | 2,236,500 | |
| | 4 | | | iHeartCommunications Inc | | | | | | | | | | | 6.375% | | | | 5/01/26 | | | | B+ | | | | 4,429 | |
| | 1,127 | | | iHeartCommunications Inc | | | | | | | | | | | 8.375% | | | | 5/01/27 | | | | CCC+ | | | | 1,198,303 | |
| | 2,465 | | | iHeartCommunications Inc, 144A | | | | | | | | | | | 5.250% | | | | 8/15/27 | | | | B+ | | | | 2,569,368 | |
| | 420 | | | Intelsat Luxembourg SA, (6) | | | | | | | | | | | 8.125% | | | | 6/01/23 | | | | N/R | | | | 11,550 | |
63
| | |
| |
| JRO | | Nuveen Floating Rate Income Opportunity Fund (continued) |
| | Portfolio of Investments July 31, 2021 |
| | | | | | | | | | | | | | | | | | | | | | | | | | | | |
Principal
Amount (000) | | | Description (1) | | | | | | | | Coupon | | | Maturity | | | Ratings (4) | | | Value | |
| |
| | | | Media (continued) | |
| | | | | | | |
| $ | 1,110 | | | Univision Communications Inc, 144A | | | | | | | | | | | 9.500% | | | | 5/01/25 | | | | B | | | $ | 1,212,675 | |
| | 11,306 | | | Total Media | | | | | | | | | | | | | | | | | | | | | | | 9,763,279 | |
| |
| | | | Metals & Mining – 0.2% (0.1% of Total Investments) | |
| | | | | | | |
| | 855 | | | First Quantum Minerals Ltd, 144A | | | | | | | | | | | 6.875% | | | | 10/15/27 | | | | B | | | | 926,606 | |
| |
| | | | Oil, Gas & Consumable Fuels – 2.0% (1.2% of Total Investments) | |
| | | | | | |
| | 950 | | | Baytex Energy Corp, 144A | | | | | | | | 5.625% | | | | 6/01/24 | | | | B+ | | | | 947,625 | |
| | 2,935 | | | Citgo Holding Inc, 144A | | | | | | | | | | | 9.250% | | | | 8/01/24 | | | | B+ | | | | 2,927,208 | |
| | 1,040 | | | CITGO Petroleum Corp, 144A | | | | | | | | | | | 7.000% | | | | 6/15/25 | | | | BB | | | | 1,067,643 | |
| | 600 | | | Gulfport Energy Operating Corp, 144A | | | | | | | | | | | 8.000% | | | | 5/17/26 | | | | BB– | | | | 639,282 | |
| | 1,063 | | | NGL Energy Operating LLC / NGL Energy Finance Corp, 144A | | | | | | | | 7.500% | | | | 2/01/26 | | | | BB– | | | | 1,092,232 | |
| | 250 | | | NGL Energy Partners LP / NGL Energy Finance Corp | | | | | | | | 7.500% | | | | 4/15/26 | | | | CCC+ | | | | 210,653 | |
| | 750 | | | PBF Holding Co LLC / PBF Finance Corp, 144A | | | | | | | | | | | 9.250% | | | | 5/15/25 | | | | BB | | | | 686,250 | |
| | 1,500 | | | PBF Holding Co LLC / PBF Finance Corp | | | | | | | | | | | 6.000% | | | | 2/15/28 | | | | B+ | | | | 783,300 | |
| | 9,088 | | | Total Oil, Gas & Consumable Fuels | | | | | | | | | | | | | | | | | | | | | | | 8,354,193 | |
| |
| | | | Pharmaceuticals – 0.2% (0.1% of Total Investments) | |
| | | | | | |
| | 582 | | | Endo Dac / Endo Finance LLC / Endo Finco Inc, 144A | | | | | | | | 6.000% | | | | 6/30/28 | | | | CCC | | | | 392,850 | |
| | 230 | | | Par Pharmaceutical Inc, 144A | | | | | | | | | | | 7.500% | | | | 4/01/27 | | | | B | | | | 234,600 | |
| | 812 | | | Total Pharmaceuticals | | | | | | | | | | | | | | | | | | | | | | | 627,450 | |
| |
| | | | Specialty Retail – 0.2% (0.1% of Total Investments) | |
| | | | | | | |
| | 450 | | | Party City Holdings Inc, 144A | | | | | | | | | | | 8.750% | | | | 2/15/26 | | | | CCC+ | | | | 476,424 | |
| | 200 | | | PetSmart Inc / PetSmart Finance Corp, 144A | | | | | | | | | | | 7.750% | | | | 2/15/29 | | | | CCC+ | | | | 219,254 | |
| | 650 | | | Total Specialty Retail | | | | | | | | | | | | | | | | | | | | | | | 695,678 | |
| | 51,793 | | | Total Corporate Bonds (cost $47,043,373) | | | | | | | | | | | | | | | | | | | | | | | 47,672,187 | |
| | | | | | | |
| Shares | | | Description (1) | | | | | | | | | | | | | | | | | Value | |
| |
| | | | COMMON STOCKS – 3.7% (2.3% of Total Investments) | |
| |
| | | | Banks – 0.1% (0.0% of Total Investments) | |
| | | | | | | |
| | 21,193 | | | iQor US Inc, (8), (9) | | | | | | | | | | | | | | | | | | | | | | $ | 286,105 | |
| |
| | | | Communications Equipment – 0.0% (0.0% of Total Investments) | |
| | | | | | | |
| | 5,616 | | | Windstream Services PE LLC, (8), (9) | | | | | | | | | | | | | | | | | | | | | | | 81,432 | |
| | | | | | |
| | | | Construction & Engineering – 0.0% (0.0% of Total Investments) | | | | | | | | | | | | | | | | |
| | | | | | | |
| | 2,758 | | | TNT Crane & Rigging Inc, (7), (9) | | | | | | | | | | | | | | | | | | | | | | | 3 | |
| | 1,556 | | | TNT Crane & Rigging Inc, (8), (9) | | | | | | | | | | | | | | | | | | | | | | | 27,717 | |
| | | | Total Construction & Engineering | | | | | | | | | | | | | | | | | | | | | | | 27,720 | |
| |
| | | | Diversified Consumer Services – 0.1% (0.1% of Total Investments) | |
| | | | | | | |
| | 16,910 | | | Cengage Learning Holdings II Inc, (8), (9) | | | | | | | | | | | | | | | | | | | | | | | 360,403 | |
| |
| | | | Diversified Telecommunication Services – 0.1% (0.0% of Total Investments) | |
| | | | | | | |
| | 16,271 | | | Windstream Services PE LLC, (8), (9) | | | | | | | | | | | | | | | | | | | | | | | 236,955 | |
| |
| | | | Electric Utilities – 0.5% (0.3% of Total Investments) | |
| | | | | | | |
| | 64,338 | | | Energy Harbor Corp, (8), (9), (10) | | | | | | | | | | | | | | | | | | | | | | | 2,227,703 | |
| | | | | | |
| | | | Energy Equipment & Services – 0.1% (0.0% of Total Investments) | | | | | | | | | | | | | | | | |
| | | | | | | |
| | 63,862 | | | Transocean Ltd, (9) | | | | | | | | | | | | | | | | | | | | | | | 230,542 | |
| | 7,266 | | | Vantage Drilling International, (8), (9) | | | | | | | | | | | | | | | | | | | | | | | 27,247 | |
| | | | Total Energy Equipment & Services | | | | | | | | | | | | | | | | | | | | | | | 257,789 | |
| |
| | | | Entertainment – 0.7% (0.5% of Total Investments) | |
| | | | | | | |
| | 23,363 | | | Metro-Goldwyn-Mayer Inc, (8), (9) | | | | | | | | | | | | | | | | | | | | | | | 3,054,712 | |
64
| | | | | | | | | | | | | | | | | | | | | | | | | | | | |
Shares | | | Description (1) | | | | | | | | | | | | | | | | | Value | |
| | | | |
| | | | Health Care Providers & Services – 0.0% (0.0% of Total Investments) | | | | | | | | | | |
| | | | | | | |
| | 50,560 | | | Millennium Health LLC, (7), (9) | | | | | | | | | | | | | | | | | | | | | | $ | 52,583 | |
| | 47,462 | | | Millennium Health LLC, (7), (9) | | | | | | | | | | | | | | | | | | | | | | | 44,614 | |
| | | | Total Health Care Providers & Services | | | | | | | | | | | | | | | | | | | | | | | 97,197 | |
| |
| | | | Hotels, Restaurants & Leisure – 0.1% (0.1% of Total Investments) | |
| | | | | | | |
| | 83,129 | | | 24 Hour Fitness Worldwide Inc, (8) | | | | | | | | | | | | | | | | | | | | | | | 218,214 | |
| | 174,788 | | | 24 Hour Fitness Worldwide Inc, (8), (9) | | | | | | | | | | | | | | | | | | | | | | | 349,576 | |
| | | | Total Hotels, Restaurants & Leisure | | | | | | | | | | | | | | | | | | | | | | | 567,790 | |
| |
| | | | Internet & Direct Marketing Retail – 0.0% (0.0% of Total Investments) | |
| | | | | | | |
| | 12,030 | | | Catalina Marketing Corp, (8), (9) | | | | | | | | | | | | | | | | | | | | | | | 36,090 | |
| |
| | | | Marine – 0.0% (0.0% of Total Investments) | |
| | | | | | | |
| | 573 | | | ACBL HLDG CORP, (8), (9) | | | | | | | | | | | | | | | | | | | | | | | 12,033 | |
| | | | | | | |
| | | | Media – 0.3% (0.2% of Total Investments) | | | | | | | | | | | | | | | | | | |
| | | | | | | |
| | 424,962 | | | Clear Channel Outdoor Holdings Inc, (9) | | | | | | | | | | | | | | | | | | | | | | | 1,130,399 | |
| | 7 | | | Cumulus Media Inc, (9) | | | | | | | | | | | | | | | | | | | | | | | 82 | |
| | 1,318,561 | | | Hibu plc, (8), (9) | | | | | | | | | | | | | | | | | | | | | | | 9,230 | |
| | 36,087 | | | Tribune Co, (7), (9) | | | | | | | | | | | | | | | | | | | | | | | 36 | |
| | | | Total Media | | | | | | | | | | | | | | | | | | | | | | | 1,139,747 | |
| |
| | | | Multiline Retail – 0.0% (0.0% of Total Investments) | |
| | | | | | | |
| | 187 | | | Belk Inc, (8), (9) | | | | | | | | | | | | | | | | | | | | | | | 4,488 | |
| | | | | |
| | | | Oil, Gas & Consumable Fuels – 1.6% (1.0% of Total Investments) | | | | | | | | | | | | | |
| | | | | | | |
| | 117,421 | | | California Resources Corp, (9) | | | | | | | | | | | | | | | | | | | | | | | 3,300,704 | |
| | 76,755 | | | California Resources Corp, (9) | | | | | | | | | | | | | | | | | | | | | | | 2,157,583 | |
| | 21,791 | | | Whiting Petroleum Corp, (9) | | | | | | | | | | | | | | | | | | | | | | | 1,021,998 | |
| | | | Total Oil, Gas & Consumable Fuels | | | | | | | | | | | | | | | | | | | | | | | 6,480,285 | |
| |
| | | | Professional Services – 0.1% (0.1% of Total Investments) | |
| | | | | | | |
| | 70,691 | | | Skillsoft Corp, (7), (9) | | | | | | | | | | | | | | | | | | | | | | | 503,112 | |
| | | | Total Common Stocks (cost $24,697,201) | | | | | | | | | | | | | | | | | | | | | | | 15,373,561 | |
| | | | | | | |
Principal
Amount (000) | | | Description (1) | | | | | | | | Coupon | | | Maturity | | | Ratings (4) | | | Value | |
| | | | | |
| | | | ASSET-BACKED SECURITIES – 0.6% ( 0.4% of Total Investments) | | | | | | | | | | | | | | | | | |
| | | | | |
| $ | 800 | | | Dryden 50 Senior Loan Fund, 144A, (3-Month LIBOR reference rate + 6.260% spread), (11) | | | | 6.386% | | | | 7/15/30 | | | | Ba3 | | | $ | 789,662 | |
| | 400 | | | Flatiron CLO 19 Ltd, 144A, (3-Month LIBOR reference rate + 7.200% spread), (11) | | | | 7.356% | | | | 11/16/32 | | | | BB- | | | | 400,575 | |
| | 750 | | | Gilbert Park CLO Ltd, 144A, (3-Month LIBOR reference rate + 6.400% spread), (11) | | | | 6.526% | | | | 10/15/30 | | | | Ba3 | | | | 749,987 | |
| | 400 | | | Neuberger Berman Loan Advisers CLO 28 Ltd, 144A, (3-Month LIBOR reference rate + 5.600% spread), (11) | | | | 5.734% | | | | 4/20/30 | | | | BB– | | | | 393,653 | |
| | 2,350 | | | Total Asset-Backed Securities (cost $2,327,088) | | | | | | | | | | | | | | | | | | | | 2,333,877 | |
| | | | | | | |
| Shares | | | Description (1) | | | | | | | | | | | | | | | | | Value | |
| | | | | | |
| | | | WARRANTS – 0.1% (0.1% of Total Investments) | | | | | | | | | | | | | | | | | | | | | |
| | | | | | |
| | | | Communications Equipment – 0.0% (0.0% of Total Investments) | | | | | | | | | | | | | | | | |
| | | | | | | |
| | 15,619 | | | Avaya Holdings Corp, (8) | | | | | | | | | | | | | | | | | | | | | | $ | 100,586 | |
| | | | | | | |
| | | | Marine – 0.1% (0.1% of Total Investments) | | | | | | | | | | | | | | | | | | |
| | | | | | | |
| | 603 | | | ACBL HLDG CORP, (8) | | | | | | | | | | | | | | | | | | | | | | | 12,663 | |
| | 2,243 | | | ACBL HLDG CORP, (8) | | | | | | | | | | | | | | | | | | | | | | | 56,450 | |
| | 1,706 | | | ACBL HLDG CORP, (8) | | | | | | | | | | | | | | | | | | | | | | | 50,327 | |
| | 8,972 | | | American Commercial Barge Line LLC, (7) | | | | | | | | | | | | | | | | | | | | | | | 2,898 | |
| | | | Total Marine | | | | | | | | | | | | | | | | | | | | | | | 122,338 | |
65
| | |
| |
| JRO | | Nuveen Floating Rate Income Opportunity Fund (continued) |
| | Portfolio of Investments July 31, 2021 |
| | | | | | | | | | | | | | | | | | | | | | | | | | | | |
Shares | | | Description (1) | | | | | | | | | | | | | | | | | Value | |
| | | | | |
| | | | Industrial Conglomerates – 0.0% (0.0% of Total Investments) | | | | | | | | | | | | | |
| | | | | | | |
| | 6,824 | | | American Commercial Barge Line LLC, (7) | | | | | | | | | | | | | | | | | | | | | | $ | 2,941 | |
| | | | | |
| | | | Oil, Gas & Consumable Fuels – 0.0% (0.0% of Total Investments) | | | | | | | | | | | | | |
| | | | | | | |
| | 314 | | | California Resources Corp | | | | | | | | | | | | | | | | | | | | | | | 1,705 | |
| | | | | | |
| | | | Entertainment – 0.0% (0.0% of Total Investments) | | | | | | | | | | | | | | | | |
| | | | | | | |
| | 138,768 | | | Cineworld Warrant, (8) | | | | | | | | | | | | | | | | | | | | | | | 54,397 | |
| | | | Total Warrants (cost $1,597,505) | | | | | | | | | | | | | | | | | | | | | | | 281,967 | |
| | | | | | | |
| Shares | | | Description (1) | | | | | | | | Coupon | | | | | | Ratings (4) | | | Value | |
| | | | | |
| | | | CONVERTIBLE PREFERRED SECURITIES – 0.0% (0.0% of Total Investments) | | | | | | | | | | | | | | | | | |
| | | | | | | |
| | | | Marine – 0.0% (0.0% of Total Investments) | | | | | | | | | | | | | | | | | | |
| | | | | | | |
| | 2,133 | | | ACBL HLDG CORP, (8), (9) | | | | | | | | | | | 0.000% | | | | | | | | N/R | | | $ | 53,681 | |
| | 2,428 | | | ACBL HLDG CORP, (8), (9) | | | | | | | | | | | 0.000% | | | | | | | | N/R | | | | 71,626 | |
| | | | Total Marine | | | | | | | | | | | | | | | | | | | | | | | 125,307 | |
| | | | Total Convertible Preferred Securities (cost $129,512) | | | | | | | | 125,307 | |
| | | | | | | |
| Shares | | | Description (1) | | | | | | | | | | | | | | | | | Value | |
| | | | | |
| | | | COMMON STOCK RIGHTS – 0.0% (0.0% of Total Investments) | | | | | | | | | | | | | |
| | | | | |
| | | | Oil, Gas & Consumable Fuels – 0.0% (0.0% of Total Investments) | | | | | | | | | | | | | |
| | | | | | | |
| | 13,466 | | | Fieldwood Energy Inc, (8), (9) | | | | | | | | | | | | | | | | | | | | | | $ | 13 | |
| | 2,721 | | | Fieldwood Energy Inc, (8), (9) | | | | | | | | | | | | | | | | | | | | | | | 3 | |
| | | | Total Oil, Gas & Consumable Fuels | | | | | | | | | | | | | | | | | | | | | | | 16 | |
| | | | Total Common Stock Rights (cost $384,387) | | | | | | | | | | | | | | | | | | | | 16 | |
| | | | Total Long-Term Investments (cost $656,730,468) | | | | | | | | | | | | | | | | | | | | 642,817,719 | |
| | | | | | | |
| Shares | | | Description (1) | | | | | | | | Coupon | | | | | | | | | Value | |
| | | | | |
| | | | SHORT-TERM INVESTMENTS – 6.3% (3.9% of Total Investments) | | | | | | | | | | | | | |
| | | | | |
| | | | INVESTMENT COMPANIES – 6.3% (3.9% of Total Investments) | | | | | | | | | | | | | |
| | | | | | | |
| | 26,360,204 | | | BlackRock Liquidity Funds T-Fund Portfolio | | | | | | | | | | | 0.005% (12) | | | | | | | | | | | $ | 26,360,204 | |
| | | | Total Short-Term Investments (cost $26,360,204) | | | | | | | | | | | | | | | | | | | | 26,360,204 | |
| | | | Total Investments (cost $683,090,672) – 160.7% | | | | | | | | | | | | | | | | | | | | 669,177,923 | |
| | | | Borrowings – (39.5)% (13), (14) | | | | | | | | | | | | | | | | | | | | (164,500,000 | ) |
| | | | Taxable Fund Preferred Shares, net of deferred offering costs – (17.9)% (15) | | | | | | | | | | | | (74,674,414 | ) |
| | | | Other Assets Less Liabilities – (3.3)% | | | | | | | | | | | | | | | | | | | | (13,701,081 | ) |
| | | | Net Assets Applicable to Common Shares – 100% | | | | | | | | | | | | | | | | | | | $ | 416,302,428 | |
66
For Fund portfolio compliance purposes, the Fund’s industry classifications refer to any one or more of the industry sub-classifications used by one or more widely recognized market indexes or ratings group indexes, and/or as defined by Fund management. This definition may not apply for purposes of this report, which may combine industry sub-classifications into sectors for reporting ease.
| (1) | All percentages shown in the Portfolio of Investments are based on net assets applicable to common shares unless otherwise noted. |
| (2) | Senior loans generally pay interest at rates which are periodically adjusted by reference to a base short-term, floating lending rate (Reference Rate) plus an assigned fixed rate (Spread). These floating lending rates are generally (i) the lending rate referenced by the London Inter-Bank Offered Rate (“LIBOR”), or (ii) the prime rate offered by one or more major United States banks. Senior loans may be considered restricted in that the Fund ordinarily is contractually obligated to receive approval from the agent bank and/or borrower prior to the disposition of a senior loan. The rate shown is the coupon as of the end of the reporting period. |
| (3) | Senior Loans generally are subject to mandatory and/or optional prepayment. Because of these mandatory prepayment conditions and because there may be significant economic incentives for a borrower to prepay, prepayments of senior loans may occur. As a result, the actual remaining maturity of senior loans held may be substantially less than the stated maturities shown. |
| (4) | For financial reporting purposes, the ratings disclosed are the highest of Standard & Poor’s Group (“Standard & Poor’s”), Moody’s Investors Service, Inc. (“Moody’s”) or Fitch, Inc. (“Fitch”) rating. This treatment of split-rated securities may differ from that used for other purposes, such as for Fund investment policies. Ratings below BBB by Standard & Poor’s, Baa by Moody’s or BBB by Fitch are considered to be below investment grade. Holdings designated N/R are not rated by any of these national rating agencies. Ratings are not covered by the report of independent registered public accounting firm. |
| (5) | Investment, or portion of investment, represents an outstanding unfunded senior loan commitment. |
| (6) | Defaulted security. A security whose issuer has failed to fully pay principal and/or interest when due, or is under the protection of bankruptcy. |
| (7) | Investment valued at fair value using methods determined in good faith by, or at the discretion of, the Board. For fair value measurement disclosure purposes, investment classified as Level 3. |
| (8) | For fair value measurement disclosure purposes, investment classified as Level 2. |
| (9) | Non-income producing; issuer has not declared an ex-dividend date within the past twelve months. |
| (10) | Common Stock received as part of the bankruptcy settlements during February 2020 for Bruce Mansfield Unit 1 2007 Pass-Through Trust. |
| (11) | Variable rate security. The rate shown is the coupon as of the end of the reporting period. |
| (12) | The rate shown is the annualized seven-day subsidized yield as of end of the reporting period. |
| (13) | Borrowings as a percentage of Total Investments is 24.6%. |
| (14) | The Fund segregates 100% of its eligible investments (excluding any investments separately pledged as collateral for specific investments in derivatives, when applicable) in the Portfolio of Investments as collateral for borrowings. |
| (15) | Taxable Fund Preferred Shares, net of deferred offering costs as a percentage of Total Investments is 11.2%. |
| (16) | Principal Amount (000) rounds to less than $1,000. |
| 144A | Investment is exempt from registration under Rule 144A of the Securities Act of 1933, as amended. These investments may only be resold in transactions exempt from registration, which are normally those transactions with qualified institutional buyers. |
| DD1 | Portion of investment purchased on a delayed delivery basis. |
| LIBOR | London Inter-Bank Offered Rate |
| PIK | Payment-in-kind (“PIK”) security. Depending on the terms of the security, income may be received in the form of cash, securities, or a combination of both. The PIK rate shown, where applicable, represents the annualized rate of the last PIK payment made by the issuer as of the end of the reporting period. |
| REIT | Real Estate Investment Trust |
| TBD | Senior loan purchased on a when-issued or delayed-delivery basis. Certain details associated with this purchase are not known prior to the settlement date of the transaction. In addition, senior loans typically trade without accrued interest and therefore a coupon rate is not available prior to settlement. At settlement, if still unknown, the borrower or counterparty will provide the Fund with the final coupon rate and maturity date. |
| WI/DD | Purchased on a when-issued or delayed delivery basis. |
See accompanying notes to financial statements.
67
| | |
| JSD | | Nuveen Short Duration
Credit Opportunities Fund Portfolio of Investments July 31, 2021 |
| | | | | | | | | | | | | | | | | | | | | | | | | | | | |
Principal
Amount (000) | | | Description (1) | | Coupon (2) | | | Reference
Rate (2) | | | Spread (2) | | | Maturity (3) | | | Ratings (4) | | | Value | |
| |
| | | | LONG-TERM INVESTMENTS – 154.3% (95.8% of Total Investments) | |
| |
| | | | VARIABLE RATE SENIOR LOAN INTERESTS – 138.5% (86.0% of Total Investments) (2) | |
| |
| | | | Aerospace & Defense – 1.8% (1.1% of Total Investments) | |
| | | | | | | |
| $ | 209 | | | Dynasty Acquisition Co., Inc., Term Loan B1 | | | 3.647% | | | | 3-Month LIBOR | | | | 3.500% | | | | 4/08/26 | | | | B– | | | $ | 202,825 | |
| | 113 | | | Dynasty Acquisition Co., Inc., Term Loan B2 | | | 3.647% | | | | 3-Month LIBOR | | | | 3.500% | | | | 4/08/26 | | | | B– | | | | 109,046 | |
| | 503 | | | Maxar Technologies Ltd., Term Loan B | | | 2.850% | | | | 1-Month LIBOR | | | | 2.750% | | | | 10/05/24 | | | | B | | | | 498,517 | |
| | 1,826 | | | TransDigm, Inc., Term Loan F | | | 2.342% | | | | 1-Month LIBOR | | | | 2.250% | | | | 12/09/25 | | | | Ba3 | | | | 1,796,115 | |
| | 247 | | | TransDigm, Inc., Term Loan G | | | 2.342% | | | | 1-Month LIBOR | | | | 2.250% | | | | 8/22/24 | | | | Ba3 | | | | 243,986 | |
| | 2,898 | | | Total Aerospace & Defense | | | | | | | | | | | | | | | | | | | | | | | 2,850,489 | |
| |
| | | | Airlines – 2.4% (1.5% of Total Investments) | |
| | | | | | | |
| | 609 | | | AAdvantage Loyalty IP Ltd., Term Loan | | | 5.500% | | | | 3-Month LIBOR | | | | 4.750% | | | | 4/20/28 | | | | Ba2 | | | | 626,886 | |
| | 157 | | | American Airlines, Inc., Incremental Term Loan | | | 2.093% | | | | 1-Month LIBOR | | | | 2.000% | | | | 12/14/23 | | | | Ba3 | | | | 153,458 | |
| | 770 | | | American Airlines, Inc., Term Loan, First Lien | | | 1.840% | | | | 1-Month LIBOR | | | | 1.750% | | | | 1/29/27 | | | | Ba3 | | | | 716,684 | |
| | 736 | | | Kestrel Bidco, Inc., Term Loan B | | | 4.000% | | | | 6-Month LIBOR | | | | 3.000% | | | | 12/11/26 | | | | BB– | | | | 712,296 | |
| | 700 | | | SkyMiles IP Ltd., Term Loan B | | | 4.750% | | | | 3-Month LIBOR | | | | 3.750% | | | | 10/20/27 | | | | Baa1 | | | | 740,446 | |
| | 748 | | | United Airlines, Inc., Term Loan B | | | 4.500% | | | | 1-Month LIBOR | | | | 3.750% | | | | 4/21/28 | | | | Ba1 | | | | 750,418 | |
| | 3,720 | | | Total Airlines | | | | | | | | | | | | | | | | | | | | | | | 3,700,188 | |
| |
| | | | Auto Components – 1.8% (1.1% of Total Investments) | |
| | | | | | | |
| | 83 | | | Adient US LLC, Term Loan B | | | 3.592% | | | | 1-Month LIBOR | | | | 3.500% | | | | 4/08/28 | | | | BB– | | | | 82,588 | |
| | 909 | | | Clarios Global LP, Term Loan B | | | 3.342% | | | | 1-Month LIBOR | | | | 3.250% | | | | 4/30/26 | | | | B1 | | | | 902,975 | |
| | 825 | | | DexKo Global Inc., Term Loan | | | 4.500% | | | | 1-Month LIBOR | | | | 3.500% | | | | 7/24/24 | | | | B1 | | | | 825,614 | |
| | 497 | | | Les Schwab Tire Centers, Term Loan B | | | 4.000% | | | | 6-Month LIBOR | | | | 3.250% | | | | 11/02/27 | | | | B | | | | 497,915 | |
| | 449 | | | Superior Industries International, Inc., Term Loan B, First Lien | | | 4.092% | | | | 1-Month LIBOR | | | | 4.000% | | | | 5/23/24 | | | | Ba3 | | | | 449,261 | |
| | 2,763 | | | Total Auto Components | | | | | | | | | | | | | | | | | | | | | | | 2,758,353 | |
| |
| | | | Banks – 0.1% (0.0% of Total Investments) | |
| | | | | | | |
| | 126 | | | iQor US, Inc., Exit Term Loan | | | 7.589% | | | | 1-Month LIBOR | | | | 7.500% | | | | 9/15/27 | | | | N/R | | | | 128,937 | |
| |
| | | | Beverages – 0.9% (0.6% of Total Investments) | |
| | | | | | | |
| | 408 | | | Arterra Wines Canada, Inc., Term Loan | | | 4.250% | | | | 3-Month LIBOR | | | | 3.500% | | | | 11/25/27 | | | | B1 | | | | 407,950 | |
| | 312 | | | City Brewing Company, LLC, Term Loan | | | 4.250% | | | | 3-Month LIBOR | | | | 3.500% | | | | 4/05/28 | | | | B+ | | | | 310,635 | |
| | 788 | | | Triton Water Holdings, Inc, Term Loan | | | 4.000% | | | | 3-Month LIBOR | | | | 3.500% | | | | 3/31/28 | | | | B1 | | | | 783,037 | |
| | 1,508 | | | Total Beverages | | | | | | | | | | | | | | | | | | | | | | | 1,501,622 | |
| |
| | | | Biotechnology – 0.6% (0.4% of Total Investments) | |
| | | | | | | |
| | 903 | | | Grifols Worldwide Operations USA, Inc., Term Loan B | | | 2.084% | | | | 1-Week LIBOR | | | | 2.000% | | | | 11/15/27 | | | | BB+ | | | | 891,942 | |
| |
| | | | Building Products – 1.9% (1.2% of Total Investments) | |
| | | | | | | |
| | 200 | | | All-Star Bidco AB, Term Loan, (WI/DD) | | | TBD | | | | TBD | | | | TBD | | | | TBD | | | | N/R | | | | 199,750 | |
| | 755 | | | Cornerstone Building Brands, Inc., Term Loan B | | | 3.750% | | | | 1-Month LIBOR | | | | 3.250% | | | | 4/12/28 | | | | B+ | | | | 754,755 | |
| | 69 | | | LBM Acquisition LLC, Term Loan, (WI/DD) | | | TBD | | | | TBD | | | | TBD | | | | TBD | | | | B+ | | | | 68,551 | |
| | 310 | | | LBM Acquisition LLC, Term Loan B | | | 4.500% | | | | 3-Month LIBOR | | | | 3.750% | | | | 12/17/27 | | | | B+ | | | | 307,710 | |
| | 100 | | | Potters Industries, LLC, Term Loan B | | | 4.750% | | | | 3-Month LIBOR | | | | 4.000% | | | | 12/14/27 | | | | B | | | | 100,062 | |
| | 1,127 | | | Quikrete Holdings, Inc., Term Loan, First Lien | | | 2.592% | | | | 1-Month LIBOR | | | | 2.500% | | | | 1/31/27 | | | | BB– | | | | 1,114,541 | |
| | 107 | | | Resideo Funding, Inc., Term Loan | | | 2.750% | | | | 1-Month LIBOR | | | | 2.250% | | | | 2/12/28 | | | | BBB– | | | | 106,404 | |
| | 282 | | | Resideo Funding, Inc., Term Loan | | | 2.750% | | | | 3-Month LIBOR | | | | 2.250% | | | | 2/12/28 | | | | BBB– | | | | 281,407 | |
| | 2,950 | | | Total Building Products | | | | | | | | | | | | | | | | | | | | | | | 2,933,180 | |
| |
| | | | Capital Markets – 2.0% (1.2% of Total Investments) | |
| | | | | | | |
| | 154 | | | RPI Intermediate Finance Trust, Term Loan B1 | | | 1.842% | | | | 1-Month LIBOR | | | | 1.750% | | | | 2/11/27 | | | | BBB– | | | | 153,801 | |
| | 2,305 | | | Sequa Mezzanine Holdings L.L.C., Extended Term Loan, (cash 6.750%, PIK 1.000%) | | | 7.750% | | | | 3-Month LIBOR | | | | 6.750% | | | | 7/31/23 | | | | B– | | | | 2,338,583 | |
| | 611 | | | Sequa Mezzanine Holdings L.L.C., Term Loan, Second Lien, (cash 5.000%, PIK 6.750%) | | | 11.750% | | | | 3-Month LIBOR | | | | 10.750% | | | | 7/31/24 | | | | CCC– | | | | 602,672 | |
| | 3,070 | | | Total Capital Markets | | | | | | | | | | | | | | | | | | | | | | | 3,095,056 | |
68
| | | | | | | | | | | | | | | | | | | | | | | | | | | | |
Principal
Amount (000) | | | Description (1) | | Coupon (2) | | | Reference
Rate (2) | | | Spread (2) | | | Maturity (3) | | | Ratings (4) | | | Value | |
| |
| | | | Chemicals – 0.8% (0.5% of Total Investments) | |
| | | | | | | |
| $ | 213 | | | ASP Unifrax Holdings, Inc., Term Loan B | | | 3.897% | | | | 3-Month LIBOR | | | | 3.750% | | | | 12/14/25 | | | | B– | | | $ | 209,892 | |
| | 248 | | | Atotech B.V., Term Loan B | | | 3.000% | | | | 3-Month LIBOR | | | | 2.500% | | | | 3/18/28 | | | | B+ | | | | 246,947 | |
| | 325 | | | INEOS Styrolution US Holding LLC, Term Loan B | | | 3.250% | | | | 1-Month LIBOR | | | | 2.750% | | | | 1/29/26 | | | | BB+ | | | | 324,512 | |
| | 413 | | | Ineos US Finance LLC, Term Loan B | | | 2.107% | | | | 2-Month LIBOR | | | | 2.000% | | | | 3/31/24 | | | | BBB– | | | | 407,531 | |
| | 1,199 | | | Total Chemicals | | | | | | | | | | | | | | | | | | | | | | | 1,188,882 | |
| |
| | | | Commercial Services & Supplies – 6.1% (3.8% of Total Investments) | |
| | | | | | | |
| | 249 | | | Amentum Government Services Holdings LLC, Term Loan B | | | 5.500% | | | | 3-Month LIBOR | | | | 4.750% | | | | 1/31/27 | | | | B1 | | | | 250,310 | |
| | 356 | | | Brand Energy & Infrastructure Services, Inc., Term Loan | | | 5.250% | | | | 3-Month LIBOR | | | | 4.250% | | | | 6/21/24 | | | | B– | | | | 350,307 | |
| | 3,068 | | | Delta 2 (LUX) S.a.r.l., Term Loan | | | 3.500% | | | | 1-Month LIBOR | | | | 2.500% | | | | 2/01/24 | | | | B+ | | | | 3,049,752 | |
| | 288 | | | Garda World Security Corporation, Term Loan B | | | 4.340% | | | | 1-Month LIBOR | | | | 4.250% | | | | 10/30/26 | | | | BB+ | | | | 288,567 | |
| | 649 | | | GFL Environmental, Inc., Term Loan | | | 3.500% | | | | 3-Month LIBOR | | | | 3.000% | | | | 5/30/25 | | | | BB– | | | | 649,200 | |
| | 275 | | | KAR Auction Services, Inc., Term Loan B6 | | | 2.375% | | | | 1-Month LIBOR | | | | 2.250% | | | | 9/19/26 | | | | Ba3 | | | | 271,649 | |
| | 500 | | | Madison IAQ LLC, Term Loan | | | 3.750% | | | | 3-Month LIBOR | | | | 3.250% | | | | 6/21/28 | | | | B1 | | | | 496,383 | |
| | 506 | | | PAE Holding Corporation, Term Loan B | | | 5.250% | | | | 1-Month LIBOR | | | | 4.500% | | | | 10/19/27 | | | | B | | | | 508,444 | |
| | 95 | | | Prime Security Services Borrower, LLC, Term Loan | | | 3.500% | | | | 1-Month LIBOR | | | | 2.750% | | | | 9/23/26 | | | | BB– | | | | 94,141 | |
| | 122 | | | Prime Security Services Borrower, LLC, Term Loan | | | 3.500% | | | | 3-Month LIBOR | | | | 2.750% | | | | 9/23/26 | | | | BB– | | | | 121,951 | |
| | 122 | | | Prime Security Services Borrower, LLC, Term Loan | | | 3.500% | | | | 6-Month LIBOR | | | | 2.750% | | | | 9/23/26 | | | | BB– | | | | 121,951 | |
| | 422 | | | Robertshaw US Holding Corp, Term Loan, First Lien | | | 4.500% | | | | 1-Month LIBOR | | | | 3.500% | | | | 2/28/25 | | | | CCC+ | | | | 406,909 | |
| | 70 | | | Sabert Corporation, Term Loan B | | | 5.500% | | | | 1-Month LIBOR | | | | 4.500% | | | | 12/10/26 | | | | B | | | | 70,321 | |
| | 499 | | | Spin Holdco, Inc., Term Loan | | | 4.750% | | | | 3-Month LIBOR | | | | 4.000% | | | | 3/04/28 | | | | B– | | | | 498,999 | |
| | 1,278 | | | Travelport Finance (Luxembourg) S.a.r.l., Term Loan, (cash 2.500%, PIK 6.500%), (DD1) | | | 2.500% | | | | 3-Month LIBOR | | | | 2.500% | | | | 2/28/25 | | | | B– | | | | 1,303,022 | |
| | 289 | | | West Corporation, Term Loan B1 | | | 4.500% | | | | 3-Month LIBOR | | | | 3.500% | | | | 10/10/24 | | | | BB+ | | | | 279,392 | |
| | 730 | | | WEX, Inc., Term Loan | | | 2.342% | | | | 1-Month LIBOR | | | | 2.250% | | | | 4/01/28 | | | | Ba2 | | | | 722,728 | |
| | 9,518 | | | Total Commercial Services & Supplies | | | | | | | | | | | | | | | | | | | | 9,484,026 | |
| |
| | | | Communications Equipment – 1.8% (1.1% of Total Investments) | |
| | | | | | | |
| | 857 | | | CommScope, Inc., Term Loan B | | | 3.342% | | | | 1-Month LIBOR | | | | 3.250% | | | | 4/04/26 | | | | Ba3 | | | | 850,061 | |
| | 25 | | | MetroNet Systems Holdings, LLC, Delayed Draw Term Loan, (5) | | | 4.500% | | | | 1-Month LIBOR | | | | 3.750% | | | | 6/02/28 | | | | B2 | | | | 25,053 | |
| | 225 | | | MetroNet Systems Holdings, LLC, Term Loan, First Lien | | | 4.500% | | | | 1-Month LIBOR | | | | 3.750% | | | | 6/02/28 | | | | B2 | | | | 225,478 | |
| | 479 | | | MLN US HoldCo LLC, Term Loan, First Lien | | | 4.603% | | | | 1-Month LIBOR | | | | 4.500% | | | | 11/30/25 | | | | B3 | | | | 437,558 | |
| | 512 | | | Plantronics Inc, Term Loan B | | | 2.592% | | | | 1-Month LIBOR | | | | 2.500% | | | | 7/02/25 | | | | Ba2 | | | | 502,282 | |
| | 2 | | | Riverbed Technology, Inc., Term Loan B | | | 7.000% | | | | 2-Month LIBOR | | | | 6.000% | | | | 12/31/25 | | | | B2 | | | | 1,743 | |
| | 730 | | | Riverbed Technology, Inc., Term Loan B | | | 7.000% | | | | 3-Month LIBOR | | | | 6.000% | | | | 12/31/25 | | | | B2 | | | | 691,926 | |
| | 66 | | | Univision Communications, Inc., Term Loan C5 | | | 3.750% | | | | 1-Month LIBOR | | | | 2.750% | | | | 3/15/24 | | | | B | | | | 65,735 | |
| | 2,896 | | | Total Communications Equipment | | | | | | | | | | | | | | | | | | | | | | | 2,799,836 | |
| |
| | | | Construction & Engineering – 2.0% (1.2% of Total Investments) | |
| | | | | | | |
| | 225 | | | AECOM Technology Corporation , Term Loan B | | | 1.842% | | | | 1-Month LIBOR | | | | 1.750% | | | | 4/13/28 | | | | BBB– | | | | 224,859 | |
| | 310 | | | Aegion Corporation, Term Loan | | | 5.500% | | | | 3-Month LIBOR | | | | 4.750% | | | | 5/17/28 | | | | B | | | | 313,100 | |
| | 937 | | | Brown Group Holding, LLC, Term Loan B | | | 3.250% | | | | 3-Month LIBOR | | | | 2.750% | | | | 6/07/28 | | | | B+ | | | | 931,415 | |
| | 250 | | | Osmose Utilities Services, Inc., Term Loan | | | 3.750% | | | | 3-Month LIBOR | | | | 3.250% | | | | 6/17/28 | | | | B | | | | 248,126 | |
| | 142 | | | Pike Corporation, Incremental Term Loan B | | | 3.100% | | | | 1-Month LIBOR | | | | 3.000% | | | | 1/21/28 | | | | Ba3 | | | | 141,840 | |
| | 1,218 | | | Traverse Midstream Partners LLC, Term Loan | | | 6.500% | | | | 1-Month LIBOR | | | | 5.500% | | | | 9/27/24 | | | | B | | | | 1,220,351 | |
| | 3,082 | | | Total Construction & Engineering | | | | | | | | | | | | | | | | | | | | | | | 3,079,691 | |
| |
| | | | Containers & Packaging – 1.6% (1.0% of Total Investments) | |
| | | | | | | |
| | 660 | | | Berry Global, Inc., Term Loan Z | | | 1.850% | | | | 1-Month LIBOR | | | | 1.750% | | | | 7/01/26 | | | | BBB– | | | | 653,195 | |
| | 722 | | | Reynolds Consumer Products LLC, Term Loan | | | 1.842% | | | | 1-Month LIBOR | | | | 1.750% | | | | 2/04/27 | | | | BBB– | | | | 715,112 | |
| | 448 | | | Reynolds Group Holdings, Inc., Term Loan B2 | | | 3.342% | | | | 1-Month LIBOR | | | | 3.250% | | | | 2/05/26 | | | | B+ | | | | 443,113 | |
| | 142 | | | TricorBraun Holdings, Inc., Delayed Draw Term Loan, (5) | | | 3.750% | | | | 3-Month LIBOR | | | | 3.250% | | | | 3/03/28 | | | | B2 | | | | 141,102 | |
| | 633 | | | TricorBraun Holdings, Inc., Term Loan | | | 3.750% | | | | 3-Month LIBOR | | | | 3.250% | | | | 3/03/28 | | | | B2 | | | | 627,315 | |
| | 2,605 | | | Total Containers & Packaging | | | | | | | | | | | | | | | | | | | | | | | 2,579,837 | |
| |
| | | | Distributors – 0.6% (0.4% of Total Investments) | |
| | | | | | | |
| | 500 | | | Core & Main LP, Term Loan, (WI/DD) | | | TBD | | | | TBD | | | | TBD | | | | TBD | | | | Ba3 | | | | 495,937 | |
| | 407 | | | Univar Solutions USA, Inc., Term Loan B6 | | | 2.092% | | | | 1-Month LIBOR | | | | 2.000% | | | | 6/03/28 | | | | BBB– | | | | 404,245 | |
| | 907 | | | Total Distributors | | | | | | | | | | | | | | | | | | | | | | | 900,182 | |
69
| | |
| |
| JSD | | Nuveen Short Duration Credit Opportunities Fund (continued) |
| | Portfolio of Investments July 31, 2021 |
| | | | | | | | | | | | | | | | | | | | | | | | | | | | |
Principal
Amount (000) | | | Description (1) | | Coupon (2) | | | Reference
Rate (2) | | | Spread (2) | | | Maturity (3) | | | Ratings (4) | | | Value | |
| |
| | | | Diversified Consumer Services – 0.8% (0.5% of Total Investments) | |
| | | | | | | |
| $ | 970 | | | Cengage Learning, Inc., Term Loan B | | | 5.750% | | | | 3-Month LIBOR | | | | 4.750% | | | | 6/29/26 | | | | B | | | $ | 970,936 | |
| | 367 | | | Sotheby’s, Term Loan B | | | 5.500% | | | | 3-Month LIBOR | | | | 4.750% | | | | 1/15/27 | | | | B+ | | | | 367,502 | |
| | 1,337 | | | Total Diversified Consumer Services | | | | | | | | | | | | | | | | | | | | | | | 1,338,438 | |
| |
| | | | Diversified Financial Services – 1.5% (0.9% of Total Investments) | |
| | | | | | | |
| | 147 | | | Avaya Inc, Term Loan, (WI/DD) | | | TBD | | | | TBD | | | | TBD | | | | TBD | | | | N/R | | | | 146,782 | |
| | 817 | | | Ditech Holding Corporation, Term Loan, (6) | | | 0.000% | | | | N/A | | | | N/A | | | | 6/30/22 | | | | N/R | | | | 164,657 | |
| | 250 | | | Fleetcor Technologies Operating Company, LLC, Term Loan B4 | | | 1.842% | | | | 1-Month LIBOR | | | | 1.750% | | | | 4/30/28 | | | | BB+ | | | | 248,482 | |
| | 219 | | | GT Polaris, Inc., Term Loan | | | 4.500% | | | | 3-Month LIBOR | | | | 3.750% | | | | 9/24/27 | | | | BB– | | | | 219,257 | |
| | 331 | | | Lions Gate Capital Holdings LLC, Term Loan B | | | 2.342% | | | | 1-Month LIBOR | | | | 2.250% | | | | 3/24/25 | | | | Ba2 | | | | 328,081 | |
| | 752 | | | Verscend Holding Corp., Term Loan B | | | 4.092% | | | | 1-Month LIBOR | | | | 4.000% | | | | 8/27/25 | | | | BB– | | | | 752,128 | |
| | 500 | | | Vision Solutions, Inc., Term Loan, First Lien | | | 5.000% | | | | 3-Month LIBOR | | | | 4.250% | | | | 3/04/28 | | | | N/R | | | | 498,790 | |
| | 3,016 | | | Total Diversified Financial Services | | | | | | | | | | | | | | | | | | | | | | | 2,358,177 | |
| |
| | | | Diversified Telecommunication Services – 4.2% (2.6% of Total Investments) | |
| | | | | | | |
| | 376 | | | Altice France S.A., Term Loan B12 | | | 3.814% | | | | 3-Month LIBOR | | | | 3.688% | | | | 1/31/26 | | | | B | | | | 371,515 | |
| | 1,354 | | | Altice France S.A., Term Loan B13 | | | 4.155% | | | | 3-Month LIBOR | | | | 4.000% | | | | 8/14/26 | | | | B | | | | 1,352,706 | |
| | 2,589 | | | CenturyLink, Inc., Term Loan B | | | 2.342% | | | | 1-Month LIBOR | | | | 2.250% | | | | 3/15/27 | | | | BBB– | | | | 2,551,700 | |
| | 431 | | | Connect Finco Sarl, Term Loan B | | | 4.500% | | | | 1-Month LIBOR | | | | 3.500% | | | | 12/12/26 | | | | B+ | | | | 431,487 | |
| | 1,186 | | | Frontier Communications Corp., DIP Term Loan B | | | 4.500% | | | | N/A | | | | N/A | | | | 10/08/27 | | | | BB+ | | | | 1,187,054 | |
| | 34 | | | GTT Communications, Inc., Delayed Draw Term Loan, (6) | | | 6.000% | | | | 1-Month LIBOR | | | | 5.000% | | | | 12/28/21 | | | | CCC+ | | | | 35,029 | |
| | 195 | | | Intelsat Jackson Holdings S.A., Term Loan B4, (6) | | | 8.750% | | | | Prime | | | | 5.500% | | | | 1/02/24 | | | | N/R | | | | 199,064 | |
| | 312 | | | Intelsat Jackson Holdings S.A., Term Loan B5, (6) | | | 8.625% | | | | N/A | | | | N/A | | | | 1/02/24 | | | | N/R | | | | 318,224 | |
| | 98 | | | Zayo Group Holdings, Inc., Term Loan | | | 3.092% | | | | 1-Month LIBOR | | | | 3.000% | | | | 3/09/27 | | | | B1 | | | | 96,526 | |
| | 6,575 | | | Total Diversified Telecommunication Services | | | | | | | | | | | | | | | | | | | | 6,543,305 | |
| |
| | | | Electric Utilities – 0.7% (0.5% of Total Investments) | |
| | | | | | | |
| | 367 | | | ExGen Renewables IV, LLC, Term Loan | | | 3.500% | | | | 3-Month LIBOR | | | | 2.500% | | | | 12/15/27 | | | | BB– | | | | 366,484 | |
| | 247 | | | Pacific Gas & Electric Company, Term Loan | | | 3.500% | | | | 3-Month LIBOR | | | | 3.000% | | | | 6/23/25 | | | | BB | | | | 241,570 | |
| | 568 | | | Vistra Operations Company LLC, Term Loan B3, First Lien | | | 1.841% | | | | 1-Month LIBOR | | | | 1.750% | | | | 12/31/25 | | | | BBB– | | | | 561,010 | |
| | 1,182 | | | Total Electric Utilities | | | | | | | | | | | | | | | | | | | | | | | 1,169,064 | |
| |
| | | | Electrical Equipment – 1.2% (0.7% of Total Investments) | |
| | | | | | | |
| | 717 | | | Avolon TLB Borrower 1 (US) LLC, Term Loan B4 | | | 2.250% | | | | 1-Month LIBOR | | | | 1.500% | | | | 2/12/27 | | | | Baa2 | | | | 708,062 | |
| | 1,120 | | | Ingram Micro, Inc., Term Loan B | | | 4.000% | | | | 3-Month LIBOR | | | | 3.500% | | | | 7/02/28 | | | | BB | | | | 1,122,240 | |
| | 1,837 | | | Total Electrical Equipment | | | | | | | | | | | | | | | | | | | | | | | 1,830,302 | |
| |
| | | | Electronic Equipment, Instruments & Components – 0.2% (0.2% of Total Investments) | |
| | | | | | | |
| | 405 | | | TTM Technologies, Inc., Term Loan | | | 2.600% | | | | 1-Month LIBOR | | | | 2.500% | | | | 9/28/24 | | | | BB+ | | | | 404,520 | |
| |
| | | | Entertainment – 2.3% (1.4% of Total Investments) | |
| | | | | | | |
| | 177 | | | AMC Entertainment Holdings, Inc., Term Loan B, (DD1) | | | 3.103% | | | | 1-Month LIBOR | | | | 3.000% | | | | 4/22/26 | | | | B– | | | | 157,838 | |
| | 115 | | | Crown Finance US, Inc., Incremental Term Loan | | | 3.750% | | | | 6-Month LIBOR | | | | 2.750% | | | | 9/20/26 | | | | CCC | | | | 92,975 | |
| | 1,131 | | | Crown Finance US, Inc., Term Loan | | | 3.500% | | | | 6-Month LIBOR | | | | 2.500% | | | | 2/28/25 | | | | CCC | | | | 920,630 | |
| | 428 | | | Metro-Goldwyn-Mayer, Inc., Term Loan, First Lien | | | 2.600% | | | | 1-Month LIBOR | | | | 2.500% | | | | 7/03/25 | | | | BB– | | | | 426,384 | |
| | 400 | | | Metro-Goldwyn-Mayer, Inc., Term Loan, Second Lien | | | 5.500% | | | | 1-Month LIBOR | | | | 4.500% | | | | 7/06/26 | | | | B3 | | | | 401,332 | |
| | 168 | | | NASCAR Holdings, Inc, Term Loan B | | | 2.842% | | | | 1-Month LIBOR | | | | 2.750% | | | | 10/18/26 | | | | BB | | | | 166,745 | |
| | 745 | | | Virgin Media Bristol LLC, Term Loan Q | | | 3.343% | | | | 1-Month LIBOR | | | | 3.250% | | | | 1/31/29 | | | | BB+ | | | | 742,620 | |
| | 671 | | | William Morris Endeavor Entertainment, LLC, Term Loan, First Lien | | | 2.850% | | | | 1-Month LIBOR | | | | 2.750% | | | | 5/16/25 | | | | B | | | | 654,000 | |
| | 3,835 | | | Total Entertainment | | | | | | | | | | | | | | | | | | | | | | | 3,562,524 | |
| |
| | | | Equity Real Estate Investment Trust – 0.4% (0.2% of Total Investments) | |
| | | | | | | |
| | 585 | | | Realogy Group LLC, Term Loan A | | | 1.842% | | | | 1-Month LIBOR | | | | 1.750% | | | | 2/08/25 | | | | Ba1 | | | | 570,195 | |
| |
| | | | Food & Staples Retailing – 1.2% (0.7% of Total Investments) | |
| | | | | | | |
| | 70 | | | BJ’s Wholesale Club, Inc., Term Loan, First Lien | | | 2.100% | | | | 1-Month LIBOR | | | | 2.000% | | | | 2/03/24 | | | | BB+ | | | | 70,209 | |
70
| | | | | | | | | | | | | | | | | | | | | | | | | | | | |
Principal
Amount (000) | | | Description (1) | | Coupon (2) | | | Reference
Rate (2) | | | Spread (2) | | | Maturity (3) | | | Ratings (4) | | | Value | |
| |
| | | | Food & Staples Retailing (continued) | |
| | | | | | | |
| $ | 1,776 | | | US Foods, Inc., Term Loan B | | | 1.842% | | | | 1-Month LIBOR | | | | 1.750% | | | | 6/27/23 | | | | BB– | | | $ | 1,755,908 | |
| | 1,846 | | | Total Food & Staples Retailing | | | | | | | | | | | | | | | | | | | | | | | 1,826,117 | |
| |
| | | | Food Products – 0.6% (0.4% of Total Investments) | |
| | | | | | | |
| | 505 | | | American Seafoods Group LLC, Term Loan, First Lien | | | 3.750% | | | | 1-Month LIBOR | | | | 2.750% | | | | 8/21/23 | | | | BB– | | | | 504,357 | |
| | 4 | | | American Seafoods Group LLC, Term Loan, First Lien | | | 3.750% | | | | 3-Month LIBOR | | | | 2.750% | | | | 8/21/23 | | | | BB– | | | | 3,371 | |
| | 149 | | | Froneri International Ltd., Term Loan | | | 2.342% | | | | 1-Month LIBOR | | | | 2.250% | | | | 1/31/27 | | | | B+ | | | | 146,022 | |
| | 294 | | | UTZ Quality Foods, LLC, Term Loan B | | | 3.092% | | | | 1-Month LIBOR | | | | 3.000% | | | | 1/20/28 | | | | B1 | | | | 293,286 | |
| | 952 | | | Total Food Products | | | | | | | | | | | | | | | | | | | | | | | 947,036 | |
| |
| | | | Health Care Equipment & Supplies – 2.0% (1.2% of Total Investments) | |
| | | | | | | |
| | 1,334 | | | Carestream Health, Inc., Extended Term Loan | | | 7.750% | | | | 3-Month LIBOR | | | | 6.750% | | | | 5/08/23 | | | | B1 | | | | 1,343,234 | |
| | 451 | | | Greatbatch Ltd., Term Loan B | | | 3.500% | | | | 1-Month LIBOR | | | | 2.500% | | | | 10/27/22 | | | | B+ | | | | 451,105 | |
| | 178 | | | Lifescan Global Corporation, Term Loan, First Lien | | | 6.146% | | | | 3-Month LIBOR | | | | 6.000% | | | | 10/01/24 | | | | B | | | | 176,773 | |
| | 530 | | | Viant Medical Holdings, Inc., Term Loan, First Lien | | | 3.842% | | | | 1-Month LIBOR | | | | 3.750% | | | | 7/02/25 | | | | B3 | | | | 513,780 | |
| | 707 | | | Vyaire Medical, Inc., Term Loan B | | | 5.750% | | | | 3-Month LIBOR | | | | 4.750% | | | �� | 4/30/25 | | | | B3 | | | | 615,107 | |
| | 3,200 | | | Total Health Care Equipment & Supplies | | | | | | | | | | | | | | | | | | | | 3,099,999 | |
| |
| | | | Health Care Providers & Services – 8.4% (5.2% of Total Investments) | |
| | | | | | | |
| | 488 | | | ADMI Corp., Term Loan B2 | | | 3.625% | | | | 1-Month LIBOR | | | | 3.125% | | | | 12/23/27 | | | | B | | | | 480,339 | |
| | 597 | | | AHP Health Partners, Inc., Term Loan | | | 4.750% | | | | 1-Month LIBOR | | | | 3.750% | | | | 6/30/25 | | | | B1 | | | | 598,846 | |
| | 137 | | | Air Methods Corporation, Term Loan B | | | 4.500% | | | | 3-Month LIBOR | | | | 3.500% | | | | 4/21/24 | | | | B | | | | 134,244 | |
| | 558 | | | BW NHHC Holdco, Inc., Term Loan, First Lien | | | 5.155% | | | | 3-Month LIBOR | | | | 5.000% | | | | 5/15/25 | | | | Caa1 | | | | 512,302 | |
| | 199 | | | DaVita, Inc., Term Loan B | | | 1.842% | | | | 1-Month LIBOR | | | | 1.750% | | | | 8/12/26 | | | | BBB– | | | | 196,947 | |
| | 390 | | | Envision Healthcare Corporation, Term Loan, First Lien | | | 3.842% | | | | 1-Month LIBOR | | | | 3.750% | | | | 10/10/25 | | | | CCC+ | | | | 335,084 | |
| | 500 | | | Gates Global LLC, Term Loan B3 | | | 3.500% | | | | 1-Month LIBOR | | | | 2.750% | | | | 3/31/27 | | | | B+ | | | | 498,005 | |
| | 798 | | | Gentiva Health Services, Inc., Term Loan | | | 2.875% | | | | 1-Month LIBOR | | | | 2.750% | | | | 7/02/25 | | | | B+ | | | | 796,305 | |
| | 995 | | | Global Medical Response, Inc., Term Loan B | | | 5.750% | | | | 3-Month LIBOR | | | | 4.750% | | | | 10/02/25 | | | | B | | | | 997,751 | |
| | 25 | | | National Mentor Holdings, Inc., Delayed Draw Term Loan, (5) | | | 4.500% | | | | 3-Month LIBOR | | | | 3.750% | | | | 3/02/28 | | | | B1 | | | | 25,064 | |
| | 107 | | | National Mentor Holdings, Inc., Term Loan | | | 4.500% | | | | 3-Month LIBOR | | | | 3.750% | | | | 3/02/28 | | | | B1 | | | | 107,282 | |
| | 120 | | | National Mentor Holdings, Inc., Term Loan | | | 4.500% | | | | 1-Month LIBOR | | | | 3.750% | | | | 3/02/28 | | | | B1 | | | | 120,003 | |
| | 8 | | | National Mentor Holdings, Inc., Term Loan C | | | 4.500% | | | | 3-Month LIBOR | | | | 3.750% | | | | 3/02/28 | | | | B1 | | | | 7,595 | |
| | 655 | | | Onex TSG Intermediate Corp., Term Loan B | | | 5.500% | | | | 3-Month LIBOR | | | | 4.750% | | | | 2/26/28 | | | | B | | | | 661,223 | |
| | 923 | | | Phoenix Guarantor Inc, Term Loan B | | | 3.339% | | | | 1-Month LIBOR | | | | 3.250% | | | | 3/05/26 | | | | B1 | | | | 912,956 | |
| | 499 | | | Phoenix Guarantor Inc, Term Loan B3 | | | 3.596% | | | | 1-Month LIBOR | | | | 3.500% | | | | 3/05/26 | | | | B1 | | | | 494,029 | |
| | 103 | | | Quorum Health Corporation, Term Loan, (6) | | | 7.500% | | | | 3-Month LIBOR | | | | 6.500% | | | | 4/29/25 | | | | B– | | | | 104,041 | |
| | 2,056 | | | RegionalCare Hospital Partners Holdings, Inc., Term Loan B, (DD1) | | | 3.842% | | | | 1-Month LIBOR | | | | 3.750% | | | | 11/16/25 | | | | B1 | | | | 2,040,805 | |
| | 1,201 | | | Select Medical Corporation, Term Loan B | | | 2.350% | | | | 1-Month LIBOR | | | | 2.250% | | | | 3/06/25 | | | | Ba2 | | | | 1,186,501 | |
| | 1,335 | | | Surgery Center Holdings, Inc., Term Loan | | | 4.500% | | | | 1-Month LIBOR | | | | 3.750% | | | | 8/31/26 | | | | B1 | | | | 1,336,545 | |
| | 1,121 | | | Team Health Holdings, Inc., Term Loan, First Lien | | | 3.750% | | | | 1-Month LIBOR | | | | 2.750% | | | | 2/06/24 | | | | B | | | | 1,087,664 | |
| | 498 | | | US Radiology Specialists, Inc., Term Loan | | | 6.250% | | | | 3-Month LIBOR | | | | 5.500% | | | | 12/15/27 | | | | B– | | | | 501,542 | |
| | 13,313 | | | Total Health Care Providers & Services | | | | | | | | | | | | | | | | | | | | 13,135,073 | |
| |
| | | | Health Care Technology – 1.9% (1.2% of Total Investments) | |
| | | | | | | |
| | 953 | | | Carestream Health, Inc., Term Loan, Second Lien, (cash 5.500%, PIK 8.000%) | | | 5.500% | | | | 3-Month LIBOR | | | | 4.500% | | | | 8/05/23 | | | | CCC+ | | | | 935,945 | |
| | 1,152 | | | Change Healthcare Holdings LLC, Term Loan B | | | 3.500% | | | | 3-Month LIBOR | | | | 2.500% | | | | 3/01/24 | | | | B+ | | | | 1,150,645 | |
| | 34 | | | Change Healthcare Holdings LLC, Term Loan B | | | 3.500% | | | | 1-Month LIBOR | | | | 2.500% | | | | 3/01/24 | | | | B+ | | | | 34,212 | |
| | 837 | | | Zelis Healthcare Corporation, Term Loan | | | 3.601% | | | | 1-Month LIBOR | | | | 3.500% | | | | 9/30/26 | | | | B | | | | 833,998 | |
| | 2,976 | | | Total Health Care Technology | | | | | | | | | | | | | | | | | | | | | | | 2,954,800 | |
| |
| | | | Hotels, Restaurants & Leisure – 15.6% (9.8% of Total Investments) | |
| | | | | | | |
| | 2,540 | | | B.C. Unlimited Liability Company, Term Loan B4 | | | 1.842% | | | | 1-Month LIBOR | | | | 1.750% | | | | 11/19/26 | | | | BB+ | | | | 2,494,573 | |
| | 235 | | | 24 Hour Fitness Worldwide, Inc., Exit Term Loan, (cash 1.000%, PIK 5.000%) | | | 6.000% | | | | 3-Month LIBOR | | | | 5.000% | | | | 12/29/25 | | | | B3 | | | | 206,290 | |
| | 198 | | | Alterra Mountain Co, Term Loan | | | 5.500% | | | | 1-Month LIBOR | | | | 4.500% | | | | 8/01/26 | | | | B | | | | 197,872 | |
| | 215 | | | Boyd Gaming Corporation, Term Loan B3 | | | 2.334% | | | | 1-Week LIBOR | | | | 2.250% | | | | 9/15/23 | | | | BB | | | | 214,326 | |
71
| | |
| |
| JSD | | Nuveen Short Duration Credit Opportunities Fund (continued) |
| | Portfolio of Investments July 31, 2021 |
| | | | | | | | | | | | | | | | | | | | | | | | | | | | |
Principal
Amount (000) | | | Description (1) | | Coupon (2) | | | Reference
Rate (2) | | | Spread (2) | | | Maturity (3) | | | Ratings (4) | | | Value | |
| |
| | | | Hotels, Restaurants & Leisure (continued) | |
| $ | 372 | | | Caesars Resort Collection, LLC, Term Loan B1 | | | 4.592% | | | | 1-Month LIBOR | | | | 4.500% | | | | 7/20/25 | | | | B+ | | | $ | 373,010 | |
| | 3,815 | | | Caesars Resort Collection, LLC, Term Loan, First Lien B | | | 2.842% | | | | 1-Month LIBOR | | | | 2.750% | | | | 12/22/24 | | | | B+ | | | | 3,776,916 | |
| | | | | | | |
| | 365 | | | Carnival Corporation, Term Loan B | | | 3.750% | | | | 1-Month LIBOR | | | | 3.000% | | | | 6/30/25 | | | | Ba2 | | | | 363,077 | |
| | 484 | | | Churchill Downs Incorporated, Incremental Term Loan B1 | | | 2.100% | | | | 1-Month LIBOR | | | | 2.000% | | | | 3/17/28 | | | | BBB– | | | | 478,676 | |
| | 1,587 | | | CityCenter Holdings, LLC, Term Loan B | | | 3.000% | | | | 1-Month LIBOR | | | | 2.250% | | | | 4/18/24 | | | | B+ | | | | 1,584,595 | |
| | 1,610 | | | ClubCorp Holdings, Inc., Term Loan B | | | 2.897% | | | | 3-Month LIBOR | | | | 2.750% | | | | 9/18/24 | | | | B– | | | | 1,526,270 | |
| | 172 | | | Crown Finance US, Inc., Term Loan B1, (cash 7.000%, PIK 8.250%) | | | 7.000% | | | | 3-Month LIBOR | | | | 7.000% | | | | 5/23/24 | | | | B– | | | | 214,183 | |
| | 2,020 | | | Equinox Holdings, Inc., Term Loan, First Lien | | | 4.000% | | | | 3-Month LIBOR | | | | 3.000% | | | | 3/08/24 | | | | CCC | | | | 1,877,536 | |
| | 2,018 | | | Golden Nugget, Inc., Incremental Term Loan B | | | 3.250% | | | | 2-Month LIBOR | | | | 2.500% | | | | 10/04/23 | | | | B | | | | 2,000,851 | |
| | 127 | | | Hilton Worldwide Finance, LLC, Term Loan B2 | | | 1.839% | | | | 1-Month LIBOR | | | | 1.750% | | | | 6/21/26 | | | | BBB– | | | | 125,874 | |
| | 1,169 | | | IRB Holding Corp, Fourth Amendment Incremental Term Loan | | | 4.250% | | | | 3-Month LIBOR | | | | 3.250% | | | | 12/15/27 | | | | B | | | | 1,166,933 | |
| | 1,293 | | | Life Time Fitness Inc , Term Loan B | | | 5.750% | | | | 3-Month LIBOR | | | | 4.750% | | | | 12/15/24 | | | | B– | | | | 1,294,315 | |
| | 428 | | | PCI Gaming Authority, Term Loan | | | 2.592% | | | | 1-Month LIBOR | | | | 2.500% | | | | 5/31/26 | | | | BBB– | | | | 424,954 | |
| | 873 | | | Penn National Gaming, Inc., Term Loan B, First Lien | | | 3.000% | | | | 1-Month LIBOR | | | | 2.250% | | | | 10/15/25 | | | | BB– | | | | 866,870 | |
| | 2,222 | | | Scientific Games International, Inc., Term Loan B5 | | | 2.842% | | | | 1-Month LIBOR | | | | 2.750% | | | | 8/14/24 | | | | B+ | | | | 2,192,259 | |
| | 234 | | | SeaWorld Parks & Entertainment, Inc., Term Loan B5 | | | 3.750% | | | | 1-Month LIBOR | | | | 3.000% | | | | 3/31/24 | | | | B2 | | | | 232,545 | |
| | 1,506 | | | Stars Group Holdings B.V. (The), Incremental Term Loan, (DD1) | | | 3.647% | | | | 3-Month LIBOR | | | | 3.500% | | | | 7/21/26 | | | | BBB | | | | 1,496,722 | |
| | 1,456 | | | Station Casinos LLC, Term Loan B | | | 3.250% | | | | 1-Month LIBOR | | | | 2.250% | | | | 2/08/27 | | | | BB– | | | | 1,434,359 | |
| | 24,939 | | | Total Hotels, Restaurants & Leisure | | | | | | | | | | | | | | | | | | | | | | | 24,543,006 | |
| |
| | | | Household Durables – 0.8% (0.5% of Total Investments) | |
| | | | | | | |
| | 122 | | | Apex Tool Group, LLC, Term Loan B | | | 6.500% | | | | 1-Month LIBOR | | | | 5.250% | | | | 8/21/24 | | | | B3 | | | | 122,711 | |
| | 300 | | | Osmosis Debt Merger Sub Inc, Term Loan, (WI/DD) | | | TBD | | | | TBD | | | | TBD | | | | TBD | | | | B3 | | | | 300,328 | |
| | 47 | | | Serta Simmons Bedding, LLC, Term Loan, (6) | | | 8.500% | | | | 1-Month LIBOR | | | | 7.500% | | | | 8/10/23 | | | | B | | | | 47,700 | |
| | 581 | | | Serta Simmons Bedding, LLC, Term Loan, (6) | | | 8.500% | | | | 1-Month LIBOR | | | | 7.500% | | | | 8/10/23 | | | | B– | | | | 552,572 | |
| | 139 | | | Weber-Stephen Products LLC, Term Loan B | | | 4.000% | | | | 1-Month LIBOR | | | | 3.250% | | | | 10/30/27 | | | | B1 | | | | 138,973 | |
| | 35 | | | Weber-Stephen Products LLC, Term Loan B | | | 5.500% | | | | Prime | | | | 2.250% | | | | 10/30/27 | | | | B1 | | | | 34,962 | |
| | 1,224 | | | Total Household Durables | | | | | | | | | | | | | | | | | | | | | | | 1,197,246 | |
| |
| | | | Household Products – 0.4% (0.3% of Total Investments) | |
| | | | | | | |
| | 290 | | | Illuminate Merger Sub Corp, Term Loan, (WI/DD) | | | TBD | | | | TBD | | | | TBD | | | | TBD | | | | B1 | | | | 288,279 | |
| | 367 | | | Reynolds Group Holdings, Inc., Term Loan | | | 2.842% | | | | 1-Month LIBOR | | | | 2.750% | | | | 2/05/23 | | | | B+ | | | | 366,705 | |
| | 657 | | | Total Household Products | | | | | | | | | | | | | | | | | | | | | | | 654,984 | |
| |
| | | | Independent Power & Renewable Electricity Producers – 0.2% (0.1% of Total Investments) | |
| | | | | | | |
| | 326 | | | WIN Waste Innovations Holdings, Inc., Term Loan B | | | 3.250% | | | | 3-Month LIBOR | | | | 2.750% | | | | 3/25/28 | | | | B+ | | | | 324,885 | |
| |
| | | | Insurance – 2.5% (1.6% of Total Investments) | |
| | | | | | | |
| | 1,510 | | | Acrisure, LLC, Term Loan B | | | 3.607% | | | | 2-Month LIBOR | | | | 3.500% | | | | 2/15/27 | | | | B | | | | 1,485,704 | |
| | 499 | | | Alliant Holdings Intermediate, LLC, Term Loan B3 | | | 4.250% | | | | 1-Month LIBOR | | | | 3.750% | | | | 11/06/27 | | | | B | | | | 499,262 | |
| | 850 | | | Asurion LLC, Term Loan, (WI/DD) | | | TBD | | | | TBD | | | | TBD | | | | TBD | | | | B | | | | 847,076 | |
| | 350 | | | Asurion LLC, Term Loan B8 | | | 3.342% | | | | 1-Month LIBOR | | | | 3.250% | | | | 12/23/26 | | | | Ba3 | | | | 344,153 | |
| | 634 | | | Hub International Limited, Term Loan B | | | 2.875% | | | | 3-Month LIBOR | | | | 2.750% | | | | 4/25/25 | | | | B | | | | 625,840 | |
| | 174 | | | Ryan Specialty Group, LLC, Term Loan | | | 3.750% | | | | 1-Month LIBOR | | | | 3.000% | | | | 9/01/27 | | | | BB– | | | | 173,308 | |
| | 4,017 | | | Total Insurance | | | | | | | | | | | | | | | | | | | | | | | 3,975,343 | |
| |
| | | | Interactive Media & Services – 1.8% (1.1% of Total Investments) | |
| | | | | | | |
| | 1,020 | | | Arches Buyer, Inc., Term Loan B | | | 3.750% | | | | 1-Month LIBOR | | | | 3.250% | | | | 12/06/27 | | | | B1 | | | | 1,015,133 | |
| | 789 | | | Rackspace Technology Global, Inc., Term Loan, (DD1) | | | 3.500% | | | | 3-Month LIBOR | | | | 2.750% | | | | 2/09/28 | | | | B+ | | | | 780,831 | |
| | 973 | | | WeddingWire, Inc., Term Loan, First Lien | | | 4.629% | | | | 3-Month LIBOR | | | | 4.500% | | | | 12/21/25 | | | | B+ | | | | 973,716 | |
| | 2 | | | WeddingWire, Inc., Term Loan, First Lien | | | 4.607% | | | | 2-Month LIBOR | | | | 4.500% | | | | 12/21/25 | | | | B+ | | | | 2,503 | |
| | 2,784 | | | Total Interactive Media & Services | | | | | | | | | | | | | | | | | | | | | | | 2,772,183 | |
| |
| | | | Internet & Direct Marketing Retail – 0.5% (0.3% of Total Investments) | |
| | | | | | | |
| | 748 | | | CNT Holdings I Corp, Term Loan | | | 4.500% | | | | 3-Month LIBOR | | | | 3.750% | | | | 11/08/27 | | | | B | | | | 747,541 | |
72
| | | | | | | | | | | | | | | | | | | | | | | | | | | | |
Principal
Amount (000) | | | Description (1) | | Coupon (2) | | | Reference
Rate (2) | | | Spread (2) | | | Maturity (3) | | | Ratings (4) | | | Value | |
| |
| | | | Internet Software & Services – 1.3% (0.8% of Total Investments) | |
| | | | | | | |
| $ | 264 | | | Banff Merger Sub Inc, Term Loan | | | 3.842% | | | | 1-Month LIBOR | | | | 3.750% | | | | 10/02/25 | | | | B2 | | | $ | 262,067 | |
| | 1,706 | | | Greeneden U.S. Holdings II, LLC, Term Loan B4 | | | 4.750% | | | | 1-Month LIBOR | | | | 4.000% | | | | 12/01/27 | | | | B– | | | | 1,709,909 | |
| | 1,970 | | | Total Internet Software & Services | | | | | | | | | | | | | | | | | | | | | | | 1,971,976 | |
| |
| | | | IT Services – 6.1% (3.8% of Total Investments) | |
| | | | | | | |
| | 929 | | | Ahead Data Blue, LLC, Term Loan B | | | 4.500% | | | | 3-Month LIBOR | | | | 3.750% | | | | 10/16/27 | | | | B+ | | | | 930,867 | |
| | 199 | | | DTI Holdco, Inc., Term Loan B | | | 5.750% | | | | 3-Month LIBOR | | | | 4.750% | | | | 9/30/23 | | | | CCC+ | | | | 193,469 | |
| | 1 | | | DTI Holdco, Inc., Term Loan B | | | 5.750% | | | | 1-Month LIBOR | | | | 4.750% | | | | 9/30/23 | | | | CCC+ | | | | 510 | |
| | 1,674 | | | Intrado Corporation, Term Loan | | | 5.000% | | | | 3-Month LIBOR | | | | 4.000% | | | | 10/10/24 | | | | BB– | | | | 1,635,353 | |
| | 482 | | | KBR, Inc., Term Loan B | | | 2.842% | | | | 1-Month LIBOR | | | | 2.750% | | | | 2/07/27 | | | | Ba1 | | | | 481,707 | |
| | 750 | | | Magenta Buyer LLC, Term Loan, (WI/DD) | | | TBD | | | | TBD | | | | TBD | | | | TBD | | | | BB– | | | | 747,424 | |
| | 292 | | | NeuStar, Inc., Term Loan B4 | | | 4.500% | | | | 3-Month LIBOR | | | | 3.500% | | | | 8/08/24 | | | | B+ | | | | 285,718 | |
| | 51 | | | NeuStar, Inc., Term Loan B5 | | | 5.500% | | | | 3-Month LIBOR | | | | 4.500% | | | | 8/08/24 | | | | B+ | | | | 50,301 | |
| | 250 | | | Project Ruby Ultimate Parent Corp., Term Loan | | | 4.000% | | | | 1-Month LIBOR | | | | 3.250% | | | | 3/10/28 | | | | B | | | | 248,354 | |
| | 1,234 | | | Sabre GLBL, Inc., Term Loan B | | | 2.092% | | | | 1-Month LIBOR | | | | 2.000% | | | | 2/22/24 | | | | Ba3 | | | | 1,208,400 | |
| | 1,817 | | | Syniverse Holdings, Inc., Term Loan, First Lien | | | 6.000% | | | | 3-Month LIBOR | | | | 5.000% | | | | 3/09/23 | | | | CCC+ | | | | 1,798,570 | |
| | 1,145 | | | Syniverse Holdings, Inc., Term Loan, Second Lien | | | 10.000% | | | | 3-Month LIBOR | | | | 9.000% | | | | 3/11/24 | | | | CCC– | | | | 1,133,733 | |
| | 845 | | | Tempo Acquisition LLC, Extended Term Loan | | | 3.750% | | | | 1-Month LIBOR | | | | 3.250% | | | | 10/31/26 | | | | BB– | | | | 845,010 | |
| | 9,669 | | | Total IT Services | | | | | | | | | | | | | | | | | | | | | | | 9,559,416 | |
| |
| | | | Leisure Products – 0.4% (0.3% of Total Investments) | |
| | | | | | | |
| | 160 | | | Hayward Industries, Inc., Term Loan | | | 3.250% | | | | 1-Month LIBOR | | | | 2.750% | | | | 5/28/28 | | | | BB– | | | | 158,709 | |
| | 36 | | | SRAM, LLC , Term Loan B | | | 3.250% | | | | 1-Month LIBOR | | | | 2.750% | | | | 5/18/28 | | | | BB– | | | | 36,227 | |
| | 364 | | | SRAM, LLC , Term Loan B | | | 3.250% | | | | 6-Month LIBOR | | | | 2.750% | | | | 5/18/28 | | | | BB– | | | | 362,273 | |
| | 91 | | | SRAM, LLC , Term Loan B | | | 3.250% | | | | 3-Month LIBOR | | | | 2.750% | | | | 5/18/28 | | | | BB– | | | | 90,568 | |
| | 651 | | | Total Leisure Products | | | | | | | | | | | | | | | | | | | | | | | 647,777 | |
| |
| | | | Life Sciences Tools & Services – 5.4% (3.3% of Total Investments) | |
| | | | | | | |
| | 1,601 | | | ICON Luxembourg Sarl, Term Loan, (WI/DD) | | | TBD | | | | TBD | | | | TBD | | | | TBD | | | | BB+ | | | | 1,599,655 | |
| | 399 | | | Indigo Merger Sub Inc, Term Loan, (WI/DD) | | | TBD | | | | TBD | | | | TBD | | | | TBD | | | | BB+ | | | | 398,555 | |
| | 2,163 | | | Parexel International Corporation, Term Loan B | | | 2.842% | | | | 1-Month LIBOR | | | | 2.750% | | | | 9/27/24 | | | | B2 | | | | 2,159,111 | |
| | 4,282 | | | PPD, Inc., Initial Term Loan | | | 2.750% | | | | 1-Month LIBOR | | | | 2.250% | | | | 1/13/28 | | | | Ba2 | | | | 4,276,127 | |
| | 8,445 | | | Total Life Sciences Tools & Services | | | | | | | | | | | | | | | | | | | | | | | 8,433,448 | |
| |
| | | | Machinery – 1.9% (1.2% of Total Investments) | |
| | | | | | | |
| | 738 | | | Alliance Laundry Systems LLC, Term Loan B | | | 4.250% | | | | 3-Month LIBOR | | | | 3.500% | | | | 10/08/27 | | | | B | | | | 738,558 | |
| | 199 | | | Blount International, Inc., Term Loan B | | | 4.750% | | | | 1-Month LIBOR | | | | 3.750% | | | | 4/12/23 | | | | B2 | | | | 199,527 | |
| | 77 | | | Gardner Denver, Inc., Term Loan B | | | 2.842% | | | | 1-Month LIBOR | | | | 2.750% | | | | 1/31/27 | | | | BB+ | | | | 76,799 | |
| | 684 | | | Gardner Denver, Inc., Term Loan B2 | | | 1.842% | | | | 1-Month LIBOR | | | | 1.750% | | | | 2/28/27 | | | | BB+ | | | | 673,146 | |
| | 776 | | | Vertical Midco GmbH, Term Loan B, (DD1) | | | 4.404% | | | | 6-Month LIBOR | | | | 4.250% | | | | 7/31/27 | | | | B+ | | | | 775,117 | |
| | 494 | | | Vertiv Group Corporation, Term Loan B | | | 2.851% | | | | 1-Month LIBOR | | | | 2.750% | | | | 3/02/27 | | | | B+ | | | | 489,794 | |
| | 2,968 | | | Total Machinery | | | | | | | | | | | | | | | | | | | | | | | 2,952,941 | |
| |
| | | | Marine – 0.5% (0.3% of Total Investments) | |
| | | | | | | |
| | 986 | | | HGIM Corp., Exit Term Loan, (DD1) | | | 7.000% | | | | 3-Month LIBOR | | | | 6.000% | | | | 7/02/23 | | | | Caa3 | | | | 735,484 | |
| |
| | | | Media – 12.3% (7.6% of Total Investments) | |
| | | | | | | |
| | 65 | | | Checkout Holding Corp., First Out Term Loan | | | 8.500% | | | | 3-Month LIBOR | | | | 7.500% | | | | 2/15/23 | | | | N/R | | | | 63,240 | |
| | 112 | | | Checkout Holding Corp., Last Out Term Loan, (cash 2.000%, PIK 9.500%) | | | 2.000% | | | | 3-Month LIBOR | | | | 1.000% | | | | 8/15/23 | | | | N/R | | | | 61,972 | |
| | 2,261 | | | Clear Channel Outdoor Holdings, Inc., Term Loan B | | | 3.629% | | | | 3-Month LIBOR | | | | 3.500% | | | | 8/21/26 | | | | B1 | | | | 2,198,969 | |
| | 218 | | | CSC Holdings, LLC, Incremental Term Loan | | | 2.343% | | | | 1-Month LIBOR | | | | 2.250% | | | | 1/15/26 | | | | BB | | | | 214,364 | |
| | 712 | | | CSC Holdings, LLC, Term Loan B1 | | | 2.343% | | | | 1-Month LIBOR | | | | 2.250% | | | | 7/17/25 | | | | BB | | | | 702,377 | |
| | 1,508 | | | CSC Holdings, LLC, Term Loan B5 | | | 2.593% | | | | 1-Month LIBOR | | | | 2.500% | | | | 4/15/27 | | | | BB | | | | 1,491,599 | |
| | 113 | | | Cumulus Media New Holdings, Inc., Term Loan B | | | 4.750% | | | | 3-Month LIBOR | | | | 3.750% | | | | 3/31/26 | | | | B | | | | 113,176 | |
| | 488 | | | Diamond Sports Group, LLC, Term Loan | | | 3.350% | | | | 1-Month LIBOR | | | | 3.250% | | | | 8/24/26 | | | | CCC+ | | | | 269,669 | |
| | 1,752 | | | Directv Financing LLC, Term Loan, (WI/DD) | | | TBD | | | | TBD | | | | TBD | | | | TBD | | | | BBB– | | | | 1,750,695 | |
| | 489 | | | E.W. Scripps Company (The), Term Loan B2 | | | 3.313% | | | | 1-Month LIBOR | | | | 2.562% | | | | 5/01/26 | | | | BB | | | | 486,418 | |
| | 92 | | | Entercom Media Corp., Term Loan | | | 2.588% | | | | 3-Month LIBOR | | | | 2.500% | | | | 11/17/24 | | | | BB– | | | | 91,170 | |
| | 415 | | | Gray Television, Inc., Term Loan B | | | 2.350% | | | | 1-Month LIBOR | | | | 2.250% | | | | 2/07/24 | | | | BB+ | | | | 412,415 | |
| | 3 | | | Houghton Mifflin Harcourt Publishers Inc, Term Loan | | | 7.250% | | | | N/A | | | | N/A | | | | 11/22/24 | | | | BB+ | | | | 3,008 | |
| | 1,293 | | | iHeartCommunications, Inc., Term Loan | | | 3.092% | | | | 1-Month LIBOR | | | | 3.000% | | | | 5/01/26 | | | | B+ | | | | 1,277,750 | |
| | 916 | | | Intelsat Jackson Holdings S.A., DIP Term Loan, (6) | | | 3.600% | | | | 3-Month LIBOR | | | | 5.500% | | | | 7/13/21 | | | | N/R | | | | 925,989 | |
73
| | |
| |
| JSD | | Nuveen Short Duration Credit Opportunities Fund (continued) |
| | Portfolio of Investments July 31, 2021 |
| | | | | | | | | | | | | | | | | | | | | | | | | | | | |
Principal
Amount (000) | | | Description (1) | | Coupon (2) | | | Reference
Rate (2) | | | Spread (2) | | | Maturity (3) | | | Ratings (4) | | | Value | |
| |
| | | | Media (continued) | |
| $ | 2,437 | | | Intelsat Jackson Holdings S.A., Term Loan B3, (6) | | | 8.000% | | | | Prime | | | | 4.750% | | | | 11/27/23 | | | | N/R | | | $ | 2,481,881 | |
| | 149 | | | LCPR Loan Financing LLC, Term Loan B | | | 3.843% | | | | 1-Month LIBOR | | | | 3.750% | | | | 10/15/28 | | | | BB+ | | | | 149,699 | |
| | 600 | | | Mav Acquisition Corp, Term Loan, (WI/DD) | | | TBD | | | | TBD | | | | TBD | | | | TBD | | | | B2 | | | | 594,600 | |
| | 198 | | | Meredith Corporation, Incremental Term Loan B | | | 5.250% | | | | 3-Month LIBOR | | | | 4.250% | | | | 1/31/25 | | | | BB– | | | | 202,414 | |
| | 939 | | | Meredith Corporation, Term Loan B2 | | | 2.592% | | | | 1-Month LIBOR | | | | 2.500% | | | | 1/31/25 | | | | BB– | | | | 933,781 | |
| | 817 | | | Nexstar Broadcasting, Inc., Term Loan B3 | | | 2.337% | | | | 3-Month LIBOR | | | | 2.250% | | | | 1/17/24 | | | | BBB– | | | | 812,793 | |
| | 517 | | | Nexstar Broadcasting, Inc., Term Loan B4 | | | 2.600% | | | | 1-Month LIBOR | | | | 2.500% | | | | 9/19/26 | | | | BBB– | | | | 513,405 | |
| | 104 | | | Red Ventures, LLC, Term Loan B2 | | | 2.592% | | | | 1-Month LIBOR | | | | 2.500% | | | | 11/08/24 | | | | BB | | | | 101,919 | |
| | 335 | | | Sinclair Television Group, Inc., Term Loan B1 | | | 2.350% | | | | 1-Month LIBOR | | | | 2.250% | | | | 1/03/24 | | | | Ba2 | | | | 331,727 | |
| | 344 | | | Sinclair Television Group, Inc., Term Loan B2B | | | 2.600% | | | | 1-Month LIBOR | | | | 2.500% | | | | 9/30/26 | | | | Ba2 | | | | 339,468 | |
| | 456 | | | Springer Nature Deutschland GmbH, Term Loan B18 | | | 3.750% | | | | 1-Month LIBOR | | | | 3.000% | | | | 8/14/26 | | | | B+ | | | | 455,247 | |
| | 1,213 | | | WideOpenWest Finance LLC, Term Loan B | | | 4.250% | | | | 1-Month LIBOR | | | | 3.250% | | | | 8/19/23 | | | | B | | | | 1,212,490 | |
| | 1,097 | | | Ziggo Financing Partnership, Term Loan I | | | 2.593% | | | | 1-Month LIBOR | | | | 2.500% | | | | 4/30/28 | | | | BB | | | | 1,080,151 | |
| | 19,643 | | | Total Media | | | | | | | | | | | | | | | | | | | | | | | 19,272,386 | |
| |
| | | | Multiline Retail – 0.9% (0.6% of Total Investments) | |
| | | | | | | |
| | 233 | | | Belk, Inc., Term Loan | | | 8.500% | | | | 3-Month LIBOR | | | | 7.500% | | | | 7/31/25 | | | | B– | | | | 234,403 | |
| | 1,026 | | | Belk, Inc., Term Loan, (cash 5.135%, PIK 8.000%) | | | 13.135% | | | | 3-Month LIBOR | | | | 13.000% | | | | 7/31/25 | | | | CCC– | | | | 784,478 | |
| | 473 | | | EG America LLC, Term Loan | | | 4.147% | | | | 3-Month LIBOR | | | | 4.000% | | | | 2/05/25 | | | | B– | | | | 470,561 | |
| | 1,732 | | | Total Multiline Retail | | | | | | | | | | | | | | | | | | | | | | | 1,489,442 | |
| |
| | | | Office Electronics – 0.0% (0.0% of Total Investments) | |
| | | | | | | |
| | 63 | | | Pitney Bowes, Inc., Term Loan B | | | 4.100% | | | | 1-Month LIBOR | | | | 4.000% | | | | 3/19/28 | | | | BBB– | | | | 63,129 | |
| |
| | | | Oil, Gas & Consumable Fuels – 3.3% (2.0% of Total Investments) | |
| | | | | | | |
| | 715 | | | BCP Renaissance Parent LLC, Term Loan B | | | 4.500% | | | | 3-Month LIBOR | | | | 3.500% | | | | 11/01/24 | | | | B+ | | | | 707,406 | |
| | 840 | | | Buckeye Partners, L.P., Term Loan B | | | 2.354% | | | | 1-Month LIBOR | | | | 2.250% | | | | 11/01/26 | | | | BBB- | | | | 832,738 | |
| | 443 | | | Fieldwood Energy LLC, DIP Delayed Draw Term Loan, (5), (6) | | | 9.750% | | | | 1-Month LIBOR | | | | 8.750% | | | | 8/05/21 | | | | N/R | | | | 460,636 | |
| | 4,159 | | | Fieldwood Energy LLC, Exit Term Loan, First Lien, (DD1), (6) | | | 0.000% | | | | N/A | | | | N/A | | | | 4/11/22 | | | | N/R | | | | 2,245,226 | |
| | 1,811 | | | Fieldwood Energy LLC, Exit Term Loan, Second Lien, (6) | | | 0.000% | | | | N/A | | | | N/A | | | | 4/11/23 | | | | N/R | | | | 202,238 | |
| | 856 | | | Gulf Finance, LLC, Term Loan B | | | 6.250% | | | | 1-Month LIBOR | | | | 5.250% | | | | 8/25/23 | | | | CCC+ | | | | 721,066 | |
| | 8,824 | | | Total Oil, Gas & Consumable Fuels | | | | | | | | | | | | | | | | | | | | | | | 5,169,310 | |
| |
| | | | Paper & Forest Products – 1.0% (0.6% of Total Investments) | |
| | | | | | | |
| | 704 | | | Asplundh Tree Expert, LLC, Term Loan B | | | 1.842% | | | | 1-Month LIBOR | | | | 1.750% | | | | 9/04/27 | | | | BBB– | | | | 698,234 | |
| | 423 | | | Charter Next Generation Inc, Term Loan | | | 4.770% | | | | 1-Month LIBOR | | | | 3.750% | | | | 12/01/27 | | | | N/R | | | | 423,051 | |
| | 442 | | | Post Holdings, Inc., Term Loan B | | | 4.750% | | | | 1-Month LIBOR | | | | 4.000% | | | | 10/21/24 | | | | B+ | | | | 444,759 | |
| | 1,569 | | | Total Paper & Forest Products | | | | | | | | | | | | | | | | | | | | | | | 1,566,044 | |
| |
| | | | Personal Products – 1.7% (1.1% of Total Investments) | |
| | | | | | | |
| | 250 | | | Conair Holdings, LLC, Term Loan B | | | 4.250% | | | | 3-Month LIBOR | | | | 3.750% | | | | 5/17/28 | | | | B1 | | | | 249,649 | |
| | 81 | | | Coty, Inc., Term Loan B | | | 2.352% | | | | 1-Month LIBOR | | | | 2.250% | | | | 4/05/25 | | | | B | | | | 78,190 | |
| | 330 | | | Journey Personal Care Corp., Term Loan B | | | 5.000% | | | | 3-Month LIBOR | | | | 4.250% | | | | 3/01/28 | | | | B | | | | 330,929 | |
| | 383 | | | Kronos Acquisition Holdings, Inc., Term Loan B | | | 4.250% | | | | 3-Month LIBOR | | | | 3.750% | | | | 12/22/26 | | | | B2 | | | | 379,222 | |
| | 2,158 | | | Revlon Consumer Products Corporation, Term Loan B, (DD1), (7) | | | 4.250% | | | | 3-Month LIBOR | | | | 3.500% | | | | 9/07/23 | | | | CC | | | | 1,699,036 | |
| | 3,202 | | | Total Personal Products | | | | | | | | | | | | | | | | | | | | | | | 2,737,026 | |
| |
| | | | Pharmaceuticals – 6.9% (4.3% of Total Investments) | |
| | | | | | | |
| | 1,795 | | | Bausch Health Companies, Inc., Term Loan B, (DD1) | | | 3.092% | | | | 1-Month LIBOR | | | | 3.000% | | | | 6/02/25 | | | | BB | | | | 1,784,720 | |
| | 764 | | | Bausch Health Companies, Inc., Term Loan B | | | 2.842% | | | | 1-Month LIBOR | | | | 2.750% | | | | 11/27/25 | | | | BB | | | | 757,744 | |
| | 490 | | | Catalent Pharma Solutions, Inc., Term Loan B3 | | | 2.500% | | | | 1-Month LIBOR | | | | 2.000% | | | | 2/22/28 | | | | BBB– | | | | 491,492 | |
| | 320 | | | Elanco Animal Health Incorporated, Term Loan B | | | 1.850% | | | | 1-Month LIBOR | | | | 1.750% | | | | 8/01/27 | | | | Baa3 | | | | 314,150 | |
| | 1,290 | | | Endo Luxembourg Finance Company I S.a r.l., Term Loan | | | 5.750% | | | | 3-Month LIBOR | | | | 5.000% | | | | 3/25/28 | | | | B | | | | 1,263,600 | |
| | 807 | | | Gainwell Acquisition Corp., Term Loan B | | | 4.750% | | | | 3-Month LIBOR | | | | 4.000% | | | | 10/01/27 | | | | BB– | | | | 807,857 | |
| | 2,000 | | | Jazz Financing Lux S.a.r.l., Term Loan | | | 4.000% | | | | 1-Month LIBOR | | | | 3.500% | | | | 4/22/28 | | | | BB+ | | | | 2,005,000 | |
| | 2,023 | | | Mallinckrodt International Finance S.A., Term Loan B, (DD1), (6) | | | 6.000% | | | | 6-Month LIBOR | | | | 5.250% | | | | 9/24/24 | | | | D | | | | 1,971,626 | |
| | 490 | | | Mallinckrodt International Finance S.A., Term Loan B, (6) | | | 6.250% | | | | 1-Month LIBOR | | | | 5.500% | | | | 2/24/25 | | | | D | | | | 476,325 | |
74
| | | | | | | | | | | | | | | | | | | | | | | | | | | | |
Principal
Amount (000) | | | Description (1) | | Coupon (2) | | | Reference
Rate (2) | | | Spread (2) | | | Maturity (3) | | | Ratings (4) | | | Value | |
| |
| | | | Pharmaceuticals (continued) | |
| $ | 1,000 | | | Organon & Co, Term Loan | | | 3.500% | | | | 3-Month LIBOR | | | | 3.000% | | | | 6/02/28 | | | | BB | | | $ | 998,855 | |
| | 10,979 | | | Total Pharmaceuticals | | | | | | | | | | | | | | | | | | | | | | | 10,871,369 | |
| |
| | | | Professional Services – 2.0% (1.3% of Total Investments) | |
| | | | | | | |
| | 963 | | | Ceridian HCM Holding, Inc., Term Loan B | | | 2.584% | | | | 1-Week LIBOR | | | | 2.500% | | | | 4/30/25 | | | | B+ | | | | 947,892 | |
| | 320 | | | Creative Artists Agency, LLC , Term Loan B | | | 3.842% | | | | 1-Month LIBOR | | | | 3.750% | | | | 11/26/26 | | | | B | | | | 317,148 | |
| | 418 | | | Dun & Bradstreet Corporation (The), Term Loan | | | 3.336% | | | | 1-Month LIBOR | | | | 3.250% | | | | 2/08/26 | | | | BB+ | | | | 414,673 | |
| | 727 | | | EAB Global Inc, Term Loan | | | 4.103% | | | | 1-Month LIBOR | | | | 3.500% | | | | 8/16/28 | | | | B– | | | | 723,226 | |
| | 200 | | | Nielsen Consumer, Inc., Term Loan B | | | 4.103% | | | | 1-Month LIBOR | | | | 4.000% | | | | 3/05/28 | | | | BB | | | | 199,518 | |
| | 586 | | | Nielsen Finance LLC, Term Loan B4 | | | 2.103% | | | | 1-Month LIBOR | | | | 2.000% | | | | 10/04/23 | | | | BBB– | | | | 585,366 | |
| | 3,214 | | | Total Professional Services | | | | | | | | | | | | | | | | | | | | | | | 3,187,823 | |
| |
| | | | Real Estate Management & Development – 1.5% (0.9% of Total Investments) | |
| | | | | | | |
| | 1,293 | | | Brookfield Property REIT, Inc., Term Loan A2 | | | 3.092% | | | | 1-Month LIBOR | | | | 3.000% | | | | 8/24/23 | | | | BB+ | | | | 1,283,491 | |
| | 995 | | | North American Lifting Holdings, Inc., Priority Term Loan | | | 7.500% | | | | 3-Month LIBOR | | | | 6.500% | | | | 10/16/24 | | | | B+ | | | | 1,041,019 | |
| | 2,288 | | | Total Real Estate Management & Development | | | | | | | | | | | | | | | | | | | | 2,324,510 | |
| |
| | | | Road & Rail – 2.3% (1.4% of Total Investments) | |
| | | | | | | |
| | 373 | | | Avolon TLB Borrower 1 (US) LLC, Term Loan B3 | | | 2.500% | | | | 1-Month LIBOR | | | | 1.750% | | | | 1/15/25 | | | | Baa2 | | | | 372,017 | |
| | 218 | | | First Student Bidco Inc, Term Loan, (WI/DD) | | | TBD | | | | TBD | | | | TBD | | | | TBD | | | | BB+ | | | | 217,035 | |
| | 593 | | | First Student Bidco Inc, Term Loan, (WI/DD) | | | TBD | | | | TBD | | | | TBD | | | | TBD | | | | BB+ | | | | 589,087 | |
| | 987 | | | Genesee & Wyoming, Inc., Term Loan | | | 2.147% | | | | 3-Month LIBOR | | | | 2.000% | | | | 12/30/26 | | | | BB+ | | | | 979,600 | |
| | 630 | | | Hertz Corp, Term Loan, (WI/DD) | | | TBD | | | | TBD | | | | TBD | | | | TBD | | | | B+ | | | | 626,587 | |
| | 119 | | | Hertz Corp, Term Loan, (WI/DD) | | | TBD | | | | TBD | | | | TBD | | | | TBD | | | | BB– | | | | 118,090 | |
| | 28 | | | Savage Enterprises LLC, Term Loan B | | | 3.100% | | | | 1-Month LIBOR | | | | 3.000% | | | | 8/01/25 | | | | BB | | | | 27,644 | |
| | 722 | | | XPO Logistics, Inc., Term Loan B | | | 1.881% | | | | 3-Month LIBOR | | | | 1.750% | | | | 2/23/25 | | | | BBB– | | | | 716,714 | |
| | 3,670 | | | Total Road & Rail | | | | | | | | | | | | | | | | | | | | | | | 3,646,774 | |
| |
| | | | Semiconductors & Semiconductor Equipment – 0.7% (0.5% of Total Investments) | |
| | | | | | | |
| | 33 | | | Bright Bidco B.V., Term Loan B, (DD1) | | | 4.500% | | | | 3-Month LIBOR | | | | 3.500% | | | | 6/30/24 | | | | CCC | | �� | | 26,700 | |
| | 436 | | | CMC Materials, Inc., Term Loan B1 | | | 2.125% | | | | 1-Month LIBOR | | | | 2.000% | | | | 11/15/25 | | | | BBB– | | | | 434,767 | |
| | 701 | | | ON Semiconductor Corporation, Term Loan B | | | 2.092% | | | | 1-Month LIBOR | | | | 2.000% | | | | 9/19/26 | | | | Baa3 | | | | 694,509 | |
| | 1,170 | | | Total Semiconductors & Semiconductor Equipment | | | | | | | | | | | | | | | | | | | | 1,155,976 | |
| |
| | | | Software – 12.4% (7.7% of Total Investments) | |
| | | | | | | |
| | 661 | | | Apttus Corporation, Term Loan | | | 5.000% | | | | 3-Month LIBOR | | | | 4.250% | | | | 5/06/28 | | | | BB | | | | 663,559 | |
| | 835 | | | Blackboard, Inc., Term Loan B5 | | | 7.000% | | | | 3-Month LIBOR | | | | 6.000% | | | | 6/30/24 | | | | B1 | | | | 841,806 | |
| | 412 | | | By Crown Parent, LLC, Term Loan B1 | | | 4.000% | | | | 1-Month LIBOR | | | | 3.000% | | | | 1/30/26 | | | | B1 | | | | 410,389 | |
| | 256 | | | Camelot U.S. Acquisition 1 Co., Term Loan B | | | 3.092% | | | | 1-Month LIBOR | | | | 3.000% | | | | 10/31/26 | | | | B1 | | | | 253,955 | |
| | 1,247 | | | Delta TopCo, Inc., Term Loan B | | | 4.500% | | | | 3-Month LIBOR | | | | 3.750% | | | | 12/01/27 | | | | B2 | | | | 1,247,916 | |
| | 243 | | | Dynatrace LLC, Term Loan, First Lien | | | 2.342% | | | | 1-Month LIBOR | | | | 2.250% | | | | 8/23/25 | | | | BB+ | | | | 241,533 | |
| | 1,627 | | | Epicor Software Corporation, Term Loan | | | 4.000% | | | | 1-Month LIBOR | | | | 3.250% | | | | 7/31/27 | | | | B2 | | | | 1,624,049 | |
| | 686 | | | Finastra USA, Inc., Term Loan, First Lien | | | 4.500% | | | | 6-Month LIBOR | | | | 3.500% | | | | 6/13/24 | | | | BB– | | | | 676,272 | |
| | 157 | | | Greenway Health, LLC, Term Loan, First Lien | | | 4.750% | | | | 3-Month LIBOR | | | | 3.750% | | | | 2/16/24 | | | | B– | | | | 150,923 | |
| | 1,161 | | | Informatica LLC,, Term Loan B | | | 3.342% | | | | 1-Month LIBOR | | | | 3.250% | | | | 2/14/27 | | | | B1 | | | | 1,150,264 | |
| | 347 | | | iQor US, Inc., Second Out Term Loan | | | 8.500% | | | | 3-Month LIBOR | | | | 7.500% | | | | 11/19/25 | | | | CCC+ | | | | 343,264 | |
| | 447 | | | MA FinanceCo., LLC, Term Loan B | | | 5.250% | | | | 3-Month LIBOR | | | | 4.250% | | | | 6/05/25 | | | | BB | | | | 449,857 | |
| | 394 | | | MA FinanceCo., LLC, Term Loan B3 | | | 2.842% | | | | 1-Month LIBOR | | | | 2.750% | | | | 6/21/24 | | | | BB | | | | 389,537 | |
| | 750 | | | McAfee, LLC, Term Loan B | | | 3.840% | | | | 1-Month LIBOR | | | | 3.750% | | | | 9/29/24 | | | | BB | | | | 750,621 | |
| | 133 | | | Mitchell International, Inc., Term Loan, Second Lien | | | 7.342% | | | | 1-Month LIBOR | | | | 7.250% | | | | 11/30/25 | | | | CCC | | | | 134,145 | |
| | 442 | | | Perforce Software, Inc., Term Loan B | | | 3.842% | | | | 1-Month LIBOR | | | | 3.750% | | | | 7/01/26 | | | | B2 | | | | 437,610 | |
| | 750 | | | Polaris Newco LLC, Term Loan B | | | 4.500% | | | | 6-Month LIBOR | | | | 4.000% | | | | 6/04/28 | | | | B2 | | | | 750,383 | |
| | 690 | | | Proofpoint Inc, Term Loan, (WI/DD) | | | TBD | | | | TBD | | | | TBD | | | | TBD | | | | BB– | | | | 684,135 | |
| | 550 | | | RealPage, Inc, Term Loan, First Lien | | | 3.750% | | | | 1-Month LIBOR | | | | 3.250% | | | | 4/22/28 | | | | B+ | | | | 547,355 | |
| | 2,662 | | | Seattle Spinco, Inc., Term Loan B3 | | | 2.842% | | | | 1-Month LIBOR | | | | 2.750% | | | | 6/21/24 | | | | BB | | | | 2,630,636 | |
| | 545 | | | Sophia, L.P., Term Loan, First Lien | | | 4.500% | | | | 3-Month LIBOR | | | | 3.750% | | | | 10/07/27 | | | | B | | | | 545,349 | |
| | 444 | | | SS&C European Holdings Sarl, Term Loan B4 | | | 1.842% | | | | 1-Month LIBOR | | | | 1.750% | | | | 4/16/25 | | | | BB+ | | | | 438,067 | |
| | 972 | | | SS&C Technologies Inc., Term Loan B5 | | | 1.842% | | | | 1-Month LIBOR | | | | 1.750% | | | | 4/16/25 | | | | BB+ | | | | 958,914 | |
| | 560 | | | SS&C Technologies, Inc., Term Loan B3 | | | 1.842% | | | | 1-Month LIBOR | | | | 1.750% | | | | 4/16/25 | | | | BB+ | | | | 552,986 | |
| | 443 | | | Tibco Software, Inc., Term Loan B3 | | | 3.850% | | | | 1-Month LIBOR | | | | 3.750% | | | | 7/03/26 | | | | B+ | | | | 439,382 | |
| | 712 | | | Ultimate Software Group Inc(The), Incremental Term Loan | | | 4.000% | | | | 3-Month LIBOR | | | | 3.250% | | | | 5/03/26 | | | | B1 | | | | 712,618 | |
| | 491 | | | Ultimate Software Group Inc(The), Term Loan B | | | 3.842% | | | | 1-Month LIBOR | | | | 3.750% | | | | 5/03/26 | | | | B1 | | | | 491,579 | |
75
| | |
| |
| JSD | | Nuveen Short Duration Credit Opportunities Fund (continued) |
| | Portfolio of Investments July 31, 2021 |
| | | | | | | | | | | | | | | | | | | | | | | | | | | | |
Principal
Amount (000) | | | Description (1) | | Coupon (2) | | | Reference
Rate (2) | | | Spread (2) | | | Maturity (3) | | | Ratings (4) | | | Value | |
| |
| | | | Software (continued) | |
| $ | 552 | | | ZoomInfo LLC, Term Loan B, (DD1) | | | 3.092% | | | | 1-Month LIBOR | | | | 3.000% | | | | 2/01/26 | | | | BB | | | $ | 553,163 | |
| | 277 | | | ZoomInfo LLC, Term Loan B, (DD1) | | | 3.092% | | | | 3-Month LIBOR | | | | 3.000% | | | | 2/01/26 | | | | BB | | | | 276,582 | |
| | 19,446 | | | Total Software | | | | | | | | | | | | | | | | | | | | | | | 19,346,849 | |
| |
| | | | Specialty Retail – 3.2% (2.0% of Total Investments) | |
| | | | | | | |
| | 374 | | | Academy, Ltd., Term Loan | | | 4.500% | | | | 1-Month LIBOR | | | | 3.750% | | | | 5/01/69 | | | | N/R | | | | 374,764 | |
| | 360 | | | Birkenstock US BidCo Inc, Term Loan, (WI/DD) | | | TBD | | | | TBD | | | | TBD | | | | TBD | | | | BB– | | | | 359,699 | |
| | 550 | | | Jo-Ann Stores, Inc., Term Loan B1 | | | 5.500% | | | | 3-Month LIBOR | | | | 4.750% | | | | 6/30/28 | | | | B | | | | 548,419 | |
| | 137 | | | LBM Acquisition LLC, Term Loan, (WI/DD) | | | TBD | | | | TBD | | | | TBD | | | | TBD | | | | B+ | | | | 135,731 | |
| | 69 | | | LBM Acquisition LLC, Term Loan, (WI/DD), (5) | | | TBD | | | | TBD | | | | TBD | | | | TBD | | | | B+ | | | | 67,865 | |
| | 580 | | | Mattress Firm Inc, Term Loan B | | | 6.250% | | | | 6-Month LIBOR | | | | 5.250% | | | | 11/25/27 | | | | B+ | | | | 590,850 | |
| | 2,750 | | | PetSmart, Inc., Term Loan B | | | 4.500% | | | | 6-Month LIBOR | | | | 3.750% | | | | 2/12/28 | | | | BB– | | | | 2,752,406 | |
| | 203 | | | Staples, Inc., Term Loan | | | 5.176% | | | | 3-Month LIBOR | | | | 5.000% | | | | 4/12/26 | | | | B | | | | 197,707 | |
| | 5,023 | | | Total Specialty Retail | | | | | | | | | | | | | | | | | | | | | | | 5,027,441 | |
| |
| | | | Technology Hardware, Storage & Peripherals – 2.0% (1.2% of Total Investments) | |
| | | | | | | |
| | 629 | | | Conduent Business Services, LLC, Term Loan A | | | 1.842% | | | | 1-Month LIBOR | | | | 1.750% | | | | 12/07/22 | | | | BB– | | | | 624,738 | |
| | 990 | | | Dell International LLC, Term Loan B | | | 2.000% | | | | 1-Month LIBOR | | | | 1.750% | | | | 9/19/25 | | | | BBB– | | | | 989,444 | |
| | 391 | | | NCR Corporation, Term Loan | | | 2.630% | | | | 3-Month LIBOR | | | | 2.500% | | | | 8/28/26 | | | | BB+ | | | | 383,669 | |
| | 499 | | | Peraton Corp., Term Loan B | | | 4.500% | | | | 1-Month LIBOR | | | | 3.750% | | | | 2/01/28 | | | | BB– | | | | 499,062 | |
| | 263 | | | Tech Data Corporation, Term Loan | | | 3.592% | | | | 1-Month LIBOR | | | | 3.500% | | | | 7/01/25 | | | | BBB– | | | | 263,533 | |
| | 364 | | | Western Digital Corporation, Term Loan B4 | | | 1.842% | | | | 1-Month LIBOR | | | | 1.750% | | | | 4/29/23 | | | | Baa2 | | | | 364,085 | |
| | 3,136 | | | Total Technology Hardware, Storage & Peripherals | | | | | | | | | | | | | | | | | | | | 3,124,531 | |
| |
| | | | Textiles, Apparel & Luxury Goods – 0.2% (0.1% of Total Investments) | |
| | | | | | | |
| | 270 | | | CBI Buyer, Inc., Term Loan | | | 3.750% | | | | 3-Month LIBOR | | | | 3.250% | | | | 1/06/28 | | | | B1 | | | | 268,211 | |
| |
| | | | Transportation Infrastructure – 0.6% (0.3% of Total Investments) | |
| | | | | | | |
| | 487 | | | Atlantic Aviation FBO, Inc., Term Loan B | | | 3.850% | | | | 1-Month LIBOR | | | | 3.750% | | | | 12/06/25 | | | | BB | | | | 485,825 | |
| | 400 | | | KKR Apple Bidco LLC, Term Loan, (WI/DD) | | | TBD | | | | TBD | | | | TBD | | | | TBD | | | | B+ | | | | 397,688 | |
| | 887 | | | Total Transportation Infrastructure | | | | | | | | | | | | | | | | | | | | 883,513 | |
| |
| | | | Wireless Telecommunication Services – 0.3% (0.2% of Total Investments) | |
| | | | | | | |
| | 500 | | | GOGO Intermediate Holdings LLC, Term Loan B | | | 4.500% | | | | 3-Month LIBOR | | | | 3.750% | | | | 4/30/28 | | | | B– | | | | 498,518 | |
| $ | 224,204 | | | Total Variable Rate Senior Loan Interests (cost $218,667,569) | | | | | | | | | | | | | | | | 216,780,853 | |
| | | | | | | |
Principal
Amount (000) | | | Description (1) | | | | | | | | Coupon | | | Maturity | | | Ratings (4) | | | Value | |
| |
| | | | CORPORATE BONDS – 12.2% (7.6% of Total Investments) | |
| |
| | | | Auto Components – 0.8% (0.5% of Total Investments) | |
| | | | | | | |
| $ | 730 | | | Adient Global Holdings Ltd, 144A | | | | | | | | | | | 4.875% | | | | 8/15/26 | | | | B | | | $ | 746,425 | |
| | 530 | | | Adient US LLC, 144A | | | | | | | | | | | 9.000% | | | | 4/15/25 | | | | BB– | | | | 579,396 | |
| | 1,260 | | | Total Auto Components | | | | | | | | | | | | | | | | | | | | | | | 1,325,821 | |
| |
| | | | Chemicals – 0.3% (0.2% of Total Investments) | |
| | | | | | | |
| | 230 | | | Olin Corp, 144A | | | | | | | | | | | 9.500% | | | | 6/01/25 | | | | BB | | | | 287,212 | |
| | 200 | | | Rayonier AM Products Inc, 144A | | | | | | | | | | | 7.625% | | | | 1/15/26 | | | | B1 | | | | 205,500 | |
| | 430 | | | Total Chemicals | | | | | | | | | | | | | | | | | | | | | | | 492,712 | |
| |
| | | | Commercial Services & Supplies – 0.3% (0.2% of Total Investments) | |
| | | | | |
| | 500 | | | Prime Security Services Borrower LLC / Prime Finance Inc, 144A | | | | 3.375% | | | | 8/31/27 | | | | BB– | | | | 486,350 | |
| |
| | | | Communications Equipment – 0.3% (0.2% of Total Investments) | |
| | | | | | | |
| | 375 | | | CommScope Inc, 144A | | | | | | | | | | | 8.250% | | | | 3/01/27 | | | | B– | | | | 397,031 | |
| |
| | | | Diversified Telecommunication Services – 0.4% (0.3% of Total Investments) | |
| | | | | | | |
| | 375 | | | Avaya Inc, 144A | | | | | | | | | | | 6.125% | | | | 9/15/28 | | | | B+ | | | | 401,250 | |
| | 220 | | | Windstream Escrow LLC / Windstream Escrow Finance Corp, 144A | | | | 7.750% | | | | 8/15/28 | | | | BB | | | | 224,400 | |
| | 595 | | | Total Diversified Telecommunication Services | | | | | | | | | | | | | | | | | | | | 625,650 | |
76
| | | | | | | | | | | | | | | | | | | | | | | | | | | | |
Principal
Amount (000) | | | Description (1) | | | | | | | | Coupon | | | Maturity | | | Ratings (4) | | | Value | |
| |
| | | | Electric Utilities – 1.2% (0.7% of Total Investments) | |
| | | | | | | |
| $ | 1,175 | | | Bruce Mansfield Unit 1 2007 Pass-Through Trust, (6) | | | | | | | | | | | 6.850% | | | | 6/01/34 | | | | N/R | | | $ | 1,469 | |
| | 280 | | | Pacific Gas and Electric Co | | | | | | | | | | | 3.850% | | | | 11/15/23 | | | | BBB– | | | | 292,591 | |
| | 178 | | | Pacific Gas and Electric Co | | | | | | | | | | | 3.450% | | | | 7/01/25 | | | | BBB– | | | | 185,129 | |
| | 935 | | | Pacific Gas and Electric Co | | | | | | | | | | | 3.300% | | | | 12/01/27 | | | | BBB– | | | | 954,820 | |
| | 177 | | | Pacific Gas and Electric Co | | | | | | | | | | | 3.750% | | | | 7/01/28 | | | | BBB– | | | | 185,660 | |
| | 202 | | | Pacific Gas and Electric Co | | | | | | | | | | | 4.550% | | | | 7/01/30 | | | | BBB– | | | | 216,100 | |
| | 2,947 | | | Total Electric Utilities | | | | | | | | | | | | | | | | | | | | | | | 1,835,769 | |
| |
| | | | Energy Equipment & Services – 0.2% (0.1% of Total Investments) | |
| | | | | | | |
| | 258 | | | Bausch Health Cos Inc, 144A | | | | | | | | | | | 6.125% | | | | 4/15/25 | | | | B | | | | 263,321 | |
| |
| | | | Entertainment – 0.3% (0.2% of Total Investments) | |
| | | | | | | |
| | 500 | | | AMC Entertainment Holdings Inc, 144A | | | | | | | | | | | 10.500% | | | | 4/15/25 | | | | B– | | | | 531,600 | |
| |
| | | | Equity Real Estate Investment Trust – 0.7% (0.4% of Total Investments) | |
| | | | | |
| | 1,035 | | | Uniti Group LP / Uniti Fiber Holdings Inc / CSL Capital LLC, 144A | | | | 7.875% | | | | 2/15/25 | | | | B | | | | 1,102,275 | |
| |
| | | | Gas Utilities – 0.2% (0.1% of Total Investments) | |
| | | | | |
| | 150 | | | NGL Energy Partners LP / NGL Energy Finance Corp | | | | 7.500% | | | | 11/01/23 | | | | CCC+ | | | | 142,875 | |
| | 150 | | | NGL Energy Partners LP / NGL Energy Finance Corp | | | | 6.125% | | | | 3/01/25 | | | | CCC+ | | | | 127,500 | |
| | 300 | | | Total Gas Utilities | | | | | | | | | | | | | | | | | | | | | | | 270,375 | |
| |
| | | | Health Care Providers & Services – 2.0% (1.2% of Total Investments) | |
| | | | | | | |
| | 510 | | | CHS/Community Health Systems Inc, 144A | | | | | | | | | | | 8.000% | | | | 3/15/26 | | | | B | | | | 546,781 | |
| | 100 | | | CHS/Community Health Systems Inc, 144A | | | | | | | | | | | 8.000% | | | | 12/15/27 | | | | B | | | | 110,601 | |
| | 50 | | | HCA Inc | | | | | | | | | | | 5.375% | | | | 2/01/25 | | | | Baa3 | | | | 56,670 | |
| | 700 | | | Legacy LifePoint Health LLC, 144A | | | | | | | | | | | 4.375% | | | | 2/15/27 | | | | B1 | | | | 701,750 | |
| | 125 | | | Tenet Healthcare Corp | | | | | | | | | | | 4.625% | | | | 7/15/24 | | | | B+ | | | | 126,563 | |
| | 250 | | | Tenet Healthcare Corp, 144A | | | | | | | | | | | 7.500% | | | | 4/01/25 | | | | B+ | | | | 268,750 | |
| | 485 | | | Tenet Healthcare Corp, 144A | | | | | | | | | | | 6.250% | | | | 2/01/27 | | | | B1 | | | | 505,006 | |
| | 725 | | | Tenet Healthcare Corp, 144A | | | | | | | | | | | 6.125% | | | | 10/01/28 | | | | B | | | | 772,125 | |
| | 2,945 | | | Total Health Care Providers & Services | | | | | | | | | | | | | | | | | | | | 3,088,246 | |
| |
| | | | Hotels, Restaurants & Leisure – 0.0% (0.0% of Total Investments) | |
| | | | | | | |
| | 27 | | | Carnival Corp, 144A | | | | | | | | | | | 11.500% | | | | 4/01/23 | | | | Ba2 | | | | 30,443 | |
| |
| | | | Household Durables – 0.1% (0.0% of Total Investments) | |
| | | | | |
| | 80 | | | Kronos Acquisition Holdings Inc / KIK Custom Products Inc, 144A | | | | 5.000% | | | | 12/31/26 | | | | B2 | | | | 81,120 | |
| |
| | | | Media – 2.7% (1.7% of Total Investments) | |
| | 300 | | | Clear Channel Outdoor Holdings Inc, 144A | | | | | | | | | | | 7.750% | | | | 4/15/28 | | | | CCC | | | | 312,846 | |
| | 1,030 | | | Diamond Sports Group LLC / Diamond Sports Finance Co, 144A | | | | 5.375% | | | | 8/15/26 | | | | CCC+ | | | | 597,400 | |
| | 1,000 | | | Diamond Sports Group LLC / Diamond Sports Finance Co, 144A | | | | 6.625% | | | | 8/15/27 | | | | CCC– | | | | 396,250 | |
| | 910 | | | Houghton Mifflin Harcourt Publishers Inc, 144A | | | | | | | | | | | 9.000% | | | | 2/15/25 | | | | BB+ | | | | 969,150 | |
| | 2 | | | iHeartCommunications Inc | | | | | | | | | | | 6.375% | | | | 5/01/26 | | | | B+ | | | | 1,789 | |
| | 396 | | | iHeartCommunications Inc | | | | | | | | | | | 8.375% | | | | 5/01/27 | | | | CCC+ | | | | 421,113 | |
| | 1,075 | | | iHeartCommunications Inc, 144A | | | | | | | | | | | 5.250% | | | | 8/15/27 | | | | B+ | | | | 1,120,515 | |
| | 165 | | | Intelsat Luxembourg SA, (6) | | | | | | | | | | | 8.125% | | | | 6/01/23 | | | | N/R | | | | 4,538 | |
| | 415 | | | Univision Communications Inc, 144A | | | | | | | | | | | 9.500% | | | | 5/01/25 | | | | B | | | | 453,388 | |
| | 5,293 | | | Total Media | | | | | | | | | | | | | | | | | | | | | | | 4,276,989 | |
| |
| | | | Metals & Mining – 0.2% (0.2% of Total Investments) | |
| | | | | | | |
| | 320 | | | First Quantum Minerals Ltd, 144A | | | | | | | | | | | 6.875% | | | | 10/15/27 | | | | B | | | | 346,800 | |
| |
| | | | Oil, Gas & Consumable Fuels – 2.1% (1.3% of Total Investments) | |
| | 300 | | | Baytex Energy Corp, 144A | | | | | | | | | | | 5.625% | | | | 6/01/24 | | | | B+ | | | | 299,250 | |
| | 1,150 | | | Citgo Holding Inc, 144A | | | | | | | | | | | 9.250% | | | | 8/01/24 | | | | B+ | | | | 1,146,947 | |
| | 385 | | | CITGO Petroleum Corp, 144A | | | | | | | | | | | 7.000% | | | | 6/15/25 | | | | BB | | | | 395,233 | |
| | 225 | | | Gulfport Energy Operating Corp, 144A | | | | | | | | | | | 8.000% | | | | 5/17/26 | | | | BB– | | | | 239,731 | |
| | 387 | | | NGL Energy Operating LLC / NGL Energy Finance Corp, 144A | | | | 7.500% | | | | 2/01/26 | | | | BB– | | | | 397,642 | |
| | 150 | | | NGL Energy Partners LP / NGL Energy Finance Corp | | | | 7.500% | | | | 4/15/26 | | | | CCC+ | | | | 126,392 | |
| | 375 | | | PBF Holding Co LLC / PBF Finance Corp, 144A | | | | | | | | | | | 9.250% | | | | 5/15/25 | | | | BB | | | | 343,125 | |
| | 750 | | | PBF Holding Co LLC / PBF Finance Corp | | | | | | | | | | | 6.000% | | | | 2/15/28 | | | | B+ | | | | 391,650 | |
| | 3,722 | | | Total Oil, Gas & Consumable Fuels | | | | | | | | | | | | | | | | | | | | | | | 3,339,970 | |
77
| | |
| |
| JSD | | Nuveen Short Duration Credit Opportunities Fund (continued) |
| | Portfolio of Investments July 31, 2021 |
| | | | | | | | | | | | | | | | | | | | | | | | | | | | |
Principal
Amount (000) | | | Description (1) | | | | | | | | Coupon | | | Maturity | | | Ratings (4) | | | Value | |
| |
| | | | Pharmaceuticals – 0.2% (0.1% of Total Investments) | |
| | | | | |
| $ | 228 | | | Endo Dac / Endo Finance LLC / Endo Finco Inc, 144A | | | | 6.000% | | | | 6/30/28 | | | | CCC | | | $ | 153,900 | |
| | 90 | | | Par Pharmaceutical Inc, 144A | | | | | | | | | | | 7.500% | | | | 4/01/27 | | | | B | | | | 91,800 | |
| | 318 | | | Total Pharmaceuticals | | | | | | | | | | | | | | | | | | | | | | | 245,700 | |
| |
| | | | Specialty Retail – 0.2% (0.2% of Total Investments) | |
| | | | | | | |
| | 230 | | | Party City Holdings Inc, 144A | | | | | | | | | | | 8.750% | | | | 2/15/26 | | | | CCC+ | | | | 243,506 | |
| | 100 | | | PetSmart Inc / PetSmart Finance Corp, 144A | | | | | | | | | | | 7.750% | | | | 2/15/29 | | | | CCC+ | | | | 109,627 | |
| | 330 | | | Total Specialty Retail | | | | | | | | | | | | | | | | | | | | | | | 353,133 | |
| $ | 21,235 | | | Total Corporate Bonds (cost $18,939,618) | | | | | | | | | | | | | | | | | | | | 19,093,305 | |
| | | | | | | |
| Shares | | | Description (1) | | | | | | | | | | | | | | | | | Value | |
| |
| | | | COMMON STOCKS – 3.4% (2.1% of Total Investments) | |
| |
| | | | Banks – 0.1% (0.1% of Total Investments) | |
| | | | | | | |
| | 12,051 | | | iQor US Inc, (8), (9) | | | | | | | | | | | | | | | | | | | | | | $ | 162,689 | |
| |
| | | | Communications Equipment – 0.1% (0.0% of Total Investments) | |
| | | | | | | |
| | 5,845 | | | Windstream Services PE LLC, (8), (9) | | | | | | | | | | | | | | | | | | | | | | | 84,753 | |
| |
| | | | Construction & Engineering – 0.0% (0.0% of Total Investments) | |
| | | | | | | |
| | 1,697 | | | TNT Crane & Rigging Inc, (7), (9) | | | | | | | | | | | | | | | | | | | | | | | 2 | |
| | | | | | | |
| | 957 | | | TNT Crane & Rigging Inc, (8), (9) | | | | | | | | | | | | | | | | | | | | | | | 17,047 | |
| | | | Total Construction & Engineering | | | | | | | | | | | | | | | | | | | | 17,049 | |
| |
| | | | Diversified Consumer Services – 0.1% (0.1% of Total Investments) | |
| | | | | | | |
| | 9,343 | | | Cengage Learning Holdings II Inc, (8), (9) | | | | | | | | | | | | | | | | | | | | | | | 199,127 | |
| |
| | | | Diversified Telecommunication Services – 0.0% (0.0% of Total Investments) | |
| | | | | | | |
| | 3,347 | | | Windstream Services PE LLC, (8), (9) | | | | | | | | | | | | | | | | | | | | | | | 48,742 | |
| |
| | | | Electric Utilities – 0.6% (0.4% of Total Investments) | |
| | | | | | | |
| | 25,367 | | | Energy Harbor Corp, (8), (9), (10) | | | | | | | | | | | | | | | | | | | | | | | 878,332 | |
| |
| | | | Energy Equipment & Services – 0.1% (0.0% of Total Investments) | |
| | | | | | | |
| | 28,730 | | | Transocean Ltd, (9) | | | | | | | | | | | | | | | | | | | | | | | 103,716 | |
| | 3,779 | | | Vantage Drilling International, (8), (9) | | | | | | | | | | | | | | | | | | | | | | | 14,171 | |
| | | | Total Energy Equipment & Services | | | | | | | | | | | | | | | | | | | | 117,887 | |
| |
| | | | Health Care Providers & Services – 0.0% (0.0% of Total Investments) | |
| | | | | | | |
| | 12,290 | | | Millennium Health LLC, (7), (9) | | | | | | | | | | | | | | | | | | | | | | | 12,782 | |
| | 11,533 | | | Millennium Health LLC, (7), (9) | | | | | | | | | | | | | | | | | | | | | | | 10,841 | |
| | | | Total Health Care Providers & Services | | | | | | | | | | | | | | | | | | | | 23,623 | |
| |
| | | | Hotels, Restaurants & Leisure – 0.2% (0.2% of Total Investments) | |
| | | | | | | |
| | 55,426 | | | 24 Hour Fitness Worldwide Inc, (8) | | | | | | | | | | | | | | | | | | | | | | | 145,493 | |
| | 116,526 | | | 24 Hour Fitness Worldwide Inc, (8), (9) | | | | | | | | | | | | | | | | | | | | | | | 233,052 | |
| | | | Total Hotels, Restaurants & Leisure | | | | | | | | | | | | | | | | | | | | 378,545 | |
| |
| | | | Internet & Direct Marketing Retail – 0.0% (0.0% of Total Investments) | |
| | | | | | | |
| | 1,905 | | | Catalina Marketing Corp, (8), (9) | | | | | | | | | | | | | | | | | | | | | | | 5,715 | |
| |
| | | | Marine – 0.0% (0.0% of Total Investments) | |
| | | | | | | |
| | 430 | | | ACBL HLDG CORP, (8), (9) | | | | | | | | | | | | | | | | | | | | | | | 9,030 | |
| |
| | | | Media – 0.3% (0.2% of Total Investments) | |
| | | | | | | |
| | 181,016 | | | Clear Channel Outdoor Holdings Inc, (9) | | | | | | | | | | | | | | | | | | | | | | | 481,502 | |
| | 2 | | | Cumulus Media Inc, (9) | | | | | | | | | | | | | | | | | | | | | | | 24 | |
| | | | Total Media | | | | | | | | | | | | | | | | | | | | | | | 481,526 | |
78
| | | | | | | | | | | | | | | | | | | | | | | | | | | | |
| Shares | | | Description (1) | | | | | | | | | | | | | | | | | Value | |
| |
| | | | Multiline Retail – 0.0% (0.0% of Total Investments) | |
| | | | | | | |
| | 140 | | | Belk Inc, (8), (9) | | | | | | | | | | | | | | | | | | | | | | $ | 3,360 | |
| |
| | | | Oil, Gas & Consumable Fuels – 1.7% (1.0% of Total Investments) | |
| | | | | | | |
| | 47,288 | | | California Resources Corp, (9) | | | | | | | | | | | | | | | | | | | | | | | 1,329,265 | |
| | 30,871 | | | California Resources Corp, (9) | | | | | | | | | | | | | | | | | | | | | | | 867,784 | |
| | 8,561 | | | Whiting Petroleum Corp, (9) | | | | | | | | | | | | | | | | | | | | | | | 401,511 | |
| | | | Total Oil, Gas & Consumable Fuels | | | | | | | | | | | | | | | | | | | | 2,598,560 | |
| |
| | | | Professional Services – 0.2% (0.1% of Total Investments) | |
| | | | | | | |
| | 32,859 | | | Skillsoft Corp, (7), (9) | | | | | | | | | | | | | | | | | | | | | | | 233,863 | |
| | | | Total Common Stocks (cost $9,086,232) | | | | | | | | | | | | | | | | | | | | 5,242,801 | |
| | | | | | | |
| Shares | | | Description (1) | | | | | | | | | | | | | | | | | Value | |
| |
| | | | WARRANTS – 0.1% (0.1% of Total Investments) | |
| |
| | | | Communications Equipment – 0.0% (0.0% of Total Investments) | |
| | | | | | | |
| | 8,503 | | | Avaya Holdings Corp, (8) | | | | | | | | | | | | | | | | | | | | | | $ | 54,759 | |
| |
| | | | Marine – 0.1% (0.1% of Total Investments) | |
| | | | | | | |
| | 452 | | | ACBL HLDG CORP, (8) | | | | | | | | | | | | | | | | | | | | | | | 9,492 | |
| | 1,682 | | | ACBL HLDG CORP, (8) | | | | | | | | | | | | | | | | | | | | | | | 42,331 | |
| | 1,279 | | | ACBL HLDG CORP, (8) | | | | | | | | | | | | | | | | | | | | | | | 37,730 | |
| | 6,728 | | | American Commercial Barge Line LLC, (7) | | | | | | | | | | | | | | | | | | | | | | | 2,173 | |
| | | | Total Marine | | | | | | | | | | | | | | | | | | | | | | | 91,726 | |
| |
| | | | Industrial Conglomerates – 0.0% (0.0% of Total Investments) | |
| | | | | | | |
| | 5,116 | | | American Commercial Barge Line LLC, (7) | | | | | | | | | | | | | | | | | | | | | | | 2,205 | |
| |
| | | | Oil, Gas & Consumable Fuels – 0.0% (0.0% of Total Investments) | |
| | | | | | | |
| | 188 | | | California Resources Corp | | | | | | | | | | | | | | | | | | | | | | | 1,021 | |
| |
| | | | Entertainment – 0.0% (0.0% of Total Investments) | |
| | 45,953 | | | Cineworld Warrant, (8) | | | | | | | | | | | | | | | | | | | | | | | 18,014 | |
| | | | Total Warrants (cost $666,828) | | | | | | | | | | | | | | | | | | | | | | | 167,725 | |
| | | | | | | |
| Shares | | | Description (1) | | | | | | | | Coupon | | | | | | Ratings (4) | | | Value | |
| |
| | | | CONVERTIBLE PREFERRED SECURITIES – 0.1% (0.0% of Total Investments) | |
| | | | |
| | | | Marine – 0.1% (0.0% of Total Investments) | | | | | | | | | | |
| | | | | | | |
| | 1,600 | | | ACBL HLDG CORP, (8), (9) | | | | | | | | | | | 0.000% | | | | | | | | N/R | | | $ | 40,267 | |
| | 1,821 | | | ACBL HLDG CORP, (8), (9) | | | | | | | | | | | 0.000% | | | | | | | | N/R | | | | 53,720 | |
| | | | Total Marine | | | | | | | | | | | | | | | | | | | | | | | 93,987 | |
| | | | Total Convertible Preferred Securities (cost $97,141) | | | | | | | | | | | | | | | | | | | | 93,987 | |
| | | | | | | |
| Shares | | | Description (1) | | | | | | | | | | | | | | | | | Value | |
| |
| | | | COMMON STOCK RIGHTS – 0.0% (0.0% of Total Investments) | |
| |
| | | | Oil, Gas & Consumable Fuels – 0.0% (0.0% of Total Investments) | |
| | | | | | | |
| | 7,268 | | | Fieldwood Energy Inc, (8), (9) | | | | | | | | | | | | | | | | | | | | | | $ | 7 | |
| | 1,468 | | | Fieldwood Energy Inc, (8), (9) | | | | | | | | | | | | | | | | | | | | | | | 2 | |
| | | | Total Oil, Gas & Consumable Fuels | | | | | | | | | | | | | | | | | | | | | | | 9 | |
| | | | Total Common Stock Rights (cost $207,458) | | | | | | | | | | | | | | | | | | | | 9 | |
| | | | Total Long-Term Investments (cost $247,664,846) | | | | | | | | | | | | | | | | | | | | 241,378,680 | |
79
| | |
| |
| JSD | | Nuveen Short Duration Credit Opportunities Fund (continued) |
| | Portfolio of Investments July 31, 2021 |
| | | | | | | | | | | | | | | | | | | | | | | | | | | | |
| Shares | | | Description (1) | | | | | | | | Coupon | | | | | | | | | Value | |
| |
| | | | SHORT-TERM INVESTMENTS – 6.8% (4.2% of Total Investments) | |
| |
| | | | INVESTMENT COMPANIES – 6.8% (4.2% of Total Investments) | |
| | | | | | | |
| | 10,699,368 | | | BlackRock Liquidity Funds T-Fund Portfolio | | | | | | | | | | | 0.000% (11) | | | | | | | | | | | $ | 10,699,368 | |
| | | | Total Short-Term Investments (cost $10,699,368) | | | | | | | | | | | | | | | | | | | | 10,699,368 | |
| | | | Total Investments (cost $258,364,214) – 161.1% | | | | | | | | | | | | | | | | | | | | 252,078,048 | |
| | | | Borrowings – (12.5)% (12), (13) | | | | | | | | | | | | | | | | | | | | | | | (19,500,000 | ) |
| | | | Taxable Fund Preferred Shares, net of deferred offering costs – (44.5)% (14) | | | | | | | | | | | | (69,580,756 | ) |
| | | | Other Assets Less Liabilities – (4.1)% | | | | | | | | | | | | | | | | (6,505,246 | ) |
| | | | Net Assets Applicable to Common Shares – 100% | | | | | | | | | | | | | | | $ | 156,492,046 | |
For Fund portfolio compliance purposes, the Fund’s industry classifications refer to any one or more of the industry sub-classifications used by one or more widely recognized market indexes or ratings group indexes, and/or as defined by Fund management. This definition may not apply for purposes of this report, which may combine industry sub-classifications into sectors for reporting ease.
| (1) | All percentages shown in the Portfolio of Investments are based on net assets applicable to common shares unless otherwise noted. |
| (2) | Senior loans generally pay interest at rates which are periodically adjusted by reference to a base short-term, floating lending rate (Reference Rate) plus an assigned fixed rate (Spread). These floating lending rates are generally (i) the lending rate referenced by the London Inter-Bank Offered Rate (“LIBOR”), or (ii) the prime rate offered by one or more major United States banks. Senior loans may be considered restricted in that the Fund ordinarily is contractually obligated to receive approval from the agent bank and/or borrower prior to the disposition of a senior loan. The rate shown is the coupon as of the end of the reporting period. |
| (3) | Senior Loans generally are subject to mandatory and/or optional prepayment. Because of these mandatory prepayment conditions and because there may be significant economic incentives for a borrower to prepay, prepayments of senior loans may occur. As a result, the actual remaining maturity of senior loans held may be substantially less than the stated maturities shown. |
| (4) | For financial reporting purposes, the ratings disclosed are the highest of Standard & Poor’s Group (“Standard & Poor’s”), Moody’s Investors Service, Inc. (“Moody’s”) or Fitch, Inc. (“Fitch”) rating. This treatment of split-rated securities may differ from that used for other purposes, such as for Fund investment policies. Ratings below BBB by Standard & Poor’s, Baa by Moody’s or BBB by Fitch are considered to be below investment grade. Holdings designated N/R are not rated by any of these national rating agencies. Ratings are not covered by the report of independent registered public accounting firm. |
| (5) | Investment, or portion of investment, represents an outstanding unfunded senior loan commitment. |
| (6) | Defaulted security. A security whose issuer has failed to fully pay principal and/or interest when due, or is under the protection of bankruptcy. |
| (7) | Investment valued at fair value using methods determined in good faith by, or at the discretion of, the Board. For fair value measurement disclosure purposes, investment classified as Level 3. |
| (8) | For fair value measurement disclosure purposes, investment classified as Level 2. |
| (9) | Non-income producing; issuer has not declared an ex-dividend date within the past twelve months. |
| (10) | Common Stock received as part of the bankruptcy settlements during February 2020 for Bruce Mansfield Unit 1 2007 Pass-Through Trust. |
| (11) | The rate shown is the annualized seven-day subsidized yield as of end of the reporting period. |
| (12) | Borrowings as a percentage of Total Investments is 7.7%. |
| (13) | The Fund segregates 100% of its eligible investments (excluding any investments separately pledged as collateral for specific investments in derivatives, when applicable) in the Portfolio of Investments as collateral for borrowings. |
| (14) | Taxable Fund Preferred Shares, net of deferred offering costs as a percentage of Total Investments is 27.6%. |
| 144A | Investment is exempt from registration under Rule 144A of the Securities Act of 1933, as amended. These investments may only be resold in transactions exempt from registration, which are normally those transactions with qualified institutional buyers. |
| DD1 | Portion of investment purchased on a delayed delivery basis. |
| LIBOR | London Inter-Bank Offered Rate |
| PIK | Payment-in-kind (“PIK”) security. Depending on the terms of the security, income may be received in the form of cash, securities, or a combination of both. The PIK rate shown, where applicable, represents the annualized rate of the last PIK payment made by the issuer as of the end of the reporting period. |
| REIT | Real Estate Investment Trust |
| TBD | Senior loan purchased on a when-issued or delayed-delivery basis. Certain details associated with this purchase are not known prior to the settlement date of the transaction. In addition, senior loans typically trade without accrued interest and therefore a coupon rate is not available prior to settlement. At settlement, if still unknown, the borrower or counterparty will provide the Fund with the final coupon rate and maturity date. |
| WI/DD | Purchased on a when-issued or delayed delivery basis. |
See accompanying notes to financial statements.
80
| | |
| JQC | | Nuveen Credit Strategies Income Fund Portfolio of Investments July 31, 2021 |
| | | | | | | | | | | | | | | | | | | | | | | | | | | | |
Principal
Amount (000) | | | Description (1) | | Coupon (2) | | | Reference
Rate (2) | | | Spread (2) | | | Maturity (3) | | | Ratings (4) | | | Value | |
| |
| | | | LONG-TERM INVESTMENTS – 160.7% (99.1% of Total Investments) | |
| |
| | | | VARIABLE RATE SENIOR LOAN INTERESTS – 140.0% (86.4% of Total Investments) (2) | |
| |
| | | | Aerospace & Defense – 1.5% (0.9% of Total Investments) | |
| | | | | | | |
| $ | 650 | | | Dynasty Acquisition Co., Inc., Term Loan B1 | | | 3.647% | | | | 3-Month LIBOR | | | | 3.500% | | | | 4/08/26 | | | | B– | | | $ | 629,109 | |
| | 349 | | | Dynasty Acquisition Co., Inc., Term Loan B2 | | | 3.647% | | | | 3-Month LIBOR | | | | 3.500% | | | | 4/08/26 | | | | B– | | | | 338,231 | |
| | 11,613 | | | TransDigm, Inc., Term Loan E | | | 2.342% | | | | 1-Month LIBOR | | | | 2.250% | | | | 5/30/25 | | | | Ba3 | | | | 11,421,881 | |
| | 1,985 | | | TransDigm, Inc., Term Loan G | | | 2.342% | | | | 1-Month LIBOR | | | | 2.250% | | | | 8/22/24 | | | | Ba3 | | | | 1,956,801 | |
| | 14,597 | | | Total Aerospace & Defense | | | | | | | | | | | | | | | | | | | | | | | 14,346,022 | |
| |
| | | | Airlines – 4.6% (2.8% of Total Investments) | |
| | | | | | | |
| | 3,895 | | | AAdvantage Loyalty IP Ltd., Term Loan | | | 5.500% | | | | 3-Month LIBOR | | | | 4.750% | | | | 4/20/28 | | | | Ba2 | | | | 4,010,942 | |
| | 2,730 | | | Air Canada, (WI/DD) | | | TBD | | | | TBD | | | | TBD | | | | TBD | | | | Ba2 | | | | 2,737,972 | |
| | 1,067 | | | American Airlines, Inc., Incremental Term Loan | | | 2.093% | | | | 1-Month LIBOR | | | | 2.000% | | | | 12/14/23 | | | | Ba3 | | | | 1,043,908 | |
| | 10,381 | | | American Airlines, Inc., Term Loan B | | | 1.836% | | | | 1-Month LIBOR | | | | 1.750% | | | | 6/27/25 | | | | Ba3 | | | | 9,697,406 | |
| | 3,234 | | | American Airlines, Inc., Term Loan, First Lien | | | 1.840% | | | | 1-Month LIBOR | | | | 1.750% | | | | 1/29/27 | | | | Ba3 | | | | 3,008,819 | |
| | 7,880 | | | Kestrel Bidco, Inc., Term Loan B | | | 4.000% | | | | 6-Month LIBOR | | | | 3.000% | | | | 12/11/26 | | | | BB– | | | | 7,626,658 | |
| | 10,350 | | | Mileage Plus Holdings LLC, Term Loan B | | | 6.250% | | | | 3-Month LIBOR | | | | 5.250% | | | | 6/20/27 | | | | Baa3 | | | | 10,986,577 | |
| | 3,990 | | | United Airlines, Inc., Term Loan B | | | 4.500% | | | | 1-Month LIBOR | | | | 3.750% | | | | 4/21/28 | | | | Ba1 | | | | 4,002,229 | |
| | 43,527 | | | Total Airlines | | | | | | | | | | | | | | | | | | | | | | | 43,114,511 | |
| |
| | | | Auto Components – 1.1% (0.7% of Total Investments) | |
| | | | | | | |
| | 8,178 | | | Clarios Global LP, Term Loan B | | | 3.342% | | | | 1-Month LIBOR | | | | 3.250% | | | | 4/30/26 | | | | B1 | | | | 8,126,776 | |
| | 2,487 | | | Les Schwab Tire Centers, Term Loan B | | | 4.000% | | | | 6-Month LIBOR | | | | 3.250% | | | | 11/02/27 | | | | B | | | | 2,489,577 | |
| | 10,665 | | | Total Auto Components | | | | | | | | | | | | | | | | | | | | | | | 10,616,353 | |
| |
| | | | Beverages – 0.7% (0.4% of Total Investments) | |
| | | | | | | |
| | 1,736 | | | Arterra Wines Canada, Inc., Term Loan | | | 4.250% | | | | 3-Month LIBOR | | | | 3.500% | | | | 11/25/27 | | | | B1 | | | | 1,736,275 | |
| | 1,976 | | | City Brewing Company, LLC, Term Loan | | | 4.250% | | | | 3-Month LIBOR | | | | 3.500% | | | | 4/05/28 | | | | B+ | | | | 1,967,355 | |
| | 3,000 | | | Triton Water Holdings, Inc, Term Loan | | | 4.000% | | | | 3-Month LIBOR | | | | 3.500% | | | | 3/31/28 | | | | B1 | | | | 2,981,070 | |
| | 6,712 | | | Total Beverages | | | | | | | | | | | | | | | | | | | | | | | 6,684,700 | |
| |
| | | | Building Products – 2.8% (1.7% of Total Investments) | |
| | | | | | | |
| | 63 | | | Advanced Drainage Systems Inc, Term Loan B | | | 2.375% | | | | 1-Month LIBOR | | | | 2.250% | | | | 9/24/26 | | | | Baa3 | | | | 63,224 | |
| | 1,000 | | | All-Star Bidco AB, Term Loan, (WI/DD) | | | TBD | | | | TBD | | | | TBD | | | | TBD | | | | N/R | | | | 998,750 | |
| | 2,768 | | | Cornerstone Building Brands, Inc., Term Loan B | | | 3.750% | | | | 1-Month LIBOR | | | | 3.250% | | | | 4/12/28 | | | | B+ | | | | 2,766,332 | |
| | 287 | | | LBM Acquisition LLC, Term Loan, (WI/DD) | | | TBD | | | | TBD | | | | TBD | | | | TBD | | | | B+ | | | | 285,029 | |
| | 1,289 | | | LBM Acquisition LLC, Term Loan B | | | 4.500% | | | | 3-Month LIBOR | | | | 3.750% | | | | 12/17/27 | | | | B+ | | | | 1,279,424 | |
| | 995 | | | MI Windows and Doors, LLC, Term Loan | | | 4.500% | | | | 1-Month LIBOR | | | | 3.750% | | | | 12/18/27 | | | | B+ | | | | 995,995 | |
| | 998 | | | Park River Holdings Inc, Term Loan | | | 4.000% | | | | 3-Month LIBOR | | | | 3.250% | | | | 12/28/27 | | | | B1 | | | | 989,306 | |
| | 439 | | | Potters Industries, LLC, Term Loan B | | | 4.750% | | | | 3-Month LIBOR | | | | 4.000% | | | | 12/14/27 | | | | B | | | | 440,274 | |
| | 17,500 | | | Quikrete Holdings, Inc., Term Loan, First Lien | | | 2.592% | | | | 1-Month LIBOR | | | | 2.500% | | | | 1/31/27 | | | | BB– | | | | 17,306,489 | |
| | 410 | | | Resideo Funding, Inc., Term Loan | | | 2.750% | | | | 1-Month LIBOR | | | | 2.250% | | | | 2/12/28 | | | | BBB– | | | | 409,246 | |
| | 1,086 | | | Resideo Funding, Inc., Term Loan | | | 2.750% | | | | 3-Month LIBOR | | | | 2.250% | | | | 2/12/28 | | | | BBB– | | | | 1,082,336 | |
| | 26,835 | | | Total Building Products | | | | | | | | | | | | | | | | | | | | | | | 26,616,405 | |
| |
| | | | Capital Markets – 0.4% (0.3% of Total Investments) | |
| | | | | | | |
| | 618 | | | Klockner-Pentaplast of America, Inc., Term Loan B | | | 5.250% | | | | 3-Month LIBOR | | | | 4.750% | | | | 2/09/26 | | | | B | | | | 619,401 | |
| | 3,243 | | | RPI Intermediate Finance Trust, Term Loan B1 | | | 1.842% | | | | 1-Month LIBOR | | | | 1.750% | | | | 2/11/27 | | | | BBB– | | | | 3,231,404 | |
| | 3,861 | | | Total Capital Markets | | | | | | | | | | | | | | | | | | | | | | | 3,850,805 | |
| |
| | | | Chemicals – 2.1% (1.3% of Total Investments) | |
| | 903 | | | ASP Unifrax Holdings, Inc., Term Loan B | | | 3.897% | | | | 3-Month LIBOR | | | | 3.750% | | | | 12/14/25 | | | | B– | | | | 888,379 | |
| | 1,578 | | | Atotech B.V., Term Loan B | | | 3.000% | | | | 3-Month LIBOR | | | | 2.500% | | | | 3/18/28 | | | | B+ | | | | 1,572,961 | |
| | 6,764 | | | Axalta Coating Systems US Holdings, Inc., Term Loan B3 | | | 1.897% | | | | 3-Month LIBOR | | | | 1.750% | | | | 6/01/24 | | | | BBB– | | | | 6,696,823 | |
| | 2,175 | | | INEOS Styrolution US Holding LLC, Term Loan B | | | 3.250% | | | | 1-Month LIBOR | | | | 2.750% | | | | 1/29/26 | | | | BB+ | | | | 2,171,738 | |
| | 5,927 | | | Ineos US Finance LLC, Term Loan B | | | 2.107% | | | | 2-Month LIBOR | | | | 2.000% | | | | 3/31/24 | | | | BBB– | | | | 5,853,713 | |
| | 1,662 | | | Lonza Group AG, Term Loan B | | | 4.750% | | | | 3-Month LIBOR | | | | 4.000% | | | | 5/14/28 | | | | B2 | | | | 1,664,078 | |
| | 737 | | | Sparta US HoldCo LLC, Term Loan, (WI/DD) | | | TBD | | | | TBD | | | | TBD | | | | TBD | | | | B+ | | | | 737,766 | |
| | 19,746 | | | Total Chemicals | | | | | | | | | | | | | | | | | | | | | | | 19,585,458 | |
81
| | |
| |
| JQC | | Nuveen Credit Strategies Income Fund (continued) |
| | Portfolio of Investments July 31, 2021 |
| | | | | | | | | | | | | | | | | | | | | | | | | | | | |
Principal
Amount (000) | | | Description (1) | | Coupon (2) | | | Reference
Rate (2) | | | Spread (2) | | | Maturity (3) | | | Ratings (4) | | | Value | |
| |
| | | | Commercial Services & Supplies – 5.3% (3.3% of Total Investments) | |
| | | | | | | |
| $ | 1,247 | | | Amentum Government Services Holdings LLC, Term Loan B | | | 5.500% | | | | 3-Month LIBOR | | | | 4.750% | | | | 1/31/27 | | | | B1 | | | $ | 1,251,551 | |
| | 10,123 | | | Delta 2 (LUX) S.a.r.l., Term Loan | | | 3.500% | | | | 1-Month LIBOR | | | | 2.500% | | | | 2/01/24 | | | | B+ | | | | 10,063,244 | |
| | 8,712 | | | Garda World Security Corporation, Term Loan B | | | 4.340% | | | | 1-Month LIBOR | | | | 4.250% | | | | 10/30/26 | | | | BB+ | | | | 8,711,989 | |
| | 3,664 | | | GFL Environmental, Inc., Term Loan | | | 3.500% | | | | 3-Month LIBOR | | | | 3.000% | | | | 5/30/25 | | | | BB– | | | | 3,666,411 | |
| | 1,500 | | | Madison IAQ LLC, Term Loan | | | 3.750% | | | | 3-Month LIBOR | | | | 3.250% | | | | 6/21/28 | | | | B1 | | | | 1,489,148 | |
| | 1,914 | | | Sabert Corporation, Term Loan B | | | 5.500% | | | | 1-Month LIBOR | | | | 4.500% | | | | 12/10/26 | | | | B | | | | 1,917,840 | |
| | 2,369 | | | Spin Holdco, Inc., Term Loan | | | 4.750% | | | | 3-Month LIBOR | | | | 4.000% | | | | 3/04/28 | | | | B– | | | | 2,370,247 | |
| | 13,242 | | | Trans Union, LLC, Term Loan B5 | | | 1.842% | | | | 1-Month LIBOR | | | | 1.750% | | | | 11/13/26 | | | | BBB– | | | | 13,098,574 | |
| | 7,306 | | | Travelport Finance (Luxembourg) S.a.r.l., Term Loan, (cash 2.500%, PIK 6.500%), (DD1) | | | 2.500% | | | | 3-Month LIBOR | | | | 2.500% | | | | 2/28/25 | | | | B– | | | | 7,451,321 | |
| | 50,077 | | | Total Commercial Services & Supplies | | | | | | | | | | | | | | | | | | | | | | | 50,020,325 | |
| |
| | | | Communications Equipment – 2.7% (1.7% of Total Investments) | |
| | | | | | | |
| | 5,115 | | | Avaya, Inc., Term Loan B | | | 4.343% | | | | 1-Month LIBOR | | | | 4.250% | | | | 12/15/27 | | | | BB | | | | 5,130,538 | |
| | 1,492 | | | CommScope, Inc., Term Loan B | | | 3.342% | | | | 1-Month LIBOR | | | | 3.250% | | | | 4/04/26 | | | | Ba3 | | | | 1,480,279 | |
| | 3,570 | | | Eagle Broadband Investments LLC, Term Loan | | | 3.750% | | | | 3-Month LIBOR | | | | 3.000% | | | | 11/12/27 | | | | B+ | | | | 3,563,619 | |
| | 2,947 | | | Fleet U.S. Bidco, Inc., Term Loan B | | | 3.104% | | | | 1-Month LIBOR | | | | 3.000% | | | | 10/07/26 | | | | B+ | | | | 2,910,656 | |
| | 150 | | | MetroNet Systems Holdings, LLC, Delayed Draw Term Loan, (5) | | | 4.500% | | | | 1-Month LIBOR | | | | 3.750% | | | | 6/02/28 | | | | B2 | | | | 150,319 | |
| | 1,350 | | | MetroNet Systems Holdings, LLC, Term Loan, First Lien | | | 4.500% | | | | 1-Month LIBOR | | | | 3.750% | | | | 6/02/28 | | | | B2 | | | | 1,352,869 | |
| | 6,109 | | | Plantronics Inc, Term Loan B | | | 2.592% | | | | 1-Month LIBOR | | | | 2.500% | | | | 7/02/25 | | | | Ba2 | | | | 5,988,740 | |
| | 12 | | | Riverbed Technology, Inc., Term Loan B | | | 7.000% | | | | 2-Month LIBOR | | | | 6.000% | | | | 12/31/25 | | | | B2 | | | | 11,749 | |
| | 4,923 | | | Riverbed Technology, Inc., Term Loan B | | | 7.000% | | | | 3-Month LIBOR | | | | 6.000% | | | | 12/31/25 | | | | B2 | | | | 4,664,281 | |
| | 137 | | | Univision Communications, Inc., Term Loan C5 | | | 3.750% | | | | 1-Month LIBOR | | | | 2.750% | | | | 3/15/24 | | | | B | | | | 136,810 | |
| | 25,805 | | | Total Communications Equipment | | | | | | | | | | | | | | | | | | | | | | | 25,389,860 | |
| |
| | | | Construction & Engineering – 0.7% (0.4% of Total Investments) | |
| | | | | | | |
| | 750 | | | AECOM Technology Corporation , Term Loan B | | | 1.842% | | | | 1-Month LIBOR | | | | 1.750% | | | | 4/13/28 | | | | BBB– | | | | 749,531 | |
| | 1,805 | | | Aegion Corporation, Term Loan | | | 5.500% | | | | 3-Month LIBOR | | | | 4.750% | | | | 5/17/28 | | | | B | | | | 1,823,050 | |
| | 2,237 | | | Brown Group Holding, LLC, Term Loan B | | | 3.250% | | | | 3-Month LIBOR | | | | 2.750% | | | | 6/07/28 | | | | B+ | | | | 2,223,754 | |
| | 600 | | | FrontDoor Inc, Term Loan B | | | 2.342% | | | | 1-Month LIBOR | | | | 2.250% | | | | 6/17/28 | | | | Ba2 | | | | 599,877 | |
| | 1,000 | | | Osmose Utilities Services, Inc., Term Loan | | | 3.750% | | | | 3-Month LIBOR | | | | 3.250% | | | | 6/17/28 | | | | B | | | | 992,505 | |
| | 6,392 | | | Total Construction & Engineering | | | | | | | | | | | | | | | | | | | | | | | 6,388,717 | |
| |
| | | | Containers & Packaging – 1.4% (0.9% of Total Investments) | |
| | 4,354 | | | Berry Global, Inc., Term Loan Z | | | 1.850% | | | | 1-Month LIBOR | | | | 1.750% | | | | 7/01/26 | | | | BBB– | | | | 4,308,215 | |
| | 4,975 | | | Reynolds Group Holdings, Inc., Term Loan B2 | | | 3.342% | | | | 1-Month LIBOR | | | | 3.250% | | | | 2/05/26 | | | | B+ | | | | 4,923,484 | |
| | 696 | | | TricorBraun Holdings, Inc., Delayed Draw Term Loan, (5) | | | 3.750% | | | | 3-Month LIBOR | | | | 3.250% | | | | 3/03/28 | | | | B2 | | | | 690,033 | |
| | 3,094 | | | TricorBraun Holdings, Inc., Term Loan | | | 3.750% | | | | 3-Month LIBOR | | | | 3.250% | | | | 3/03/28 | | | | B2 | | | | 3,067,771 | |
| | 13,119 | | | Total Containers & Packaging | | | | | | | | | | | | | | | | | | | | | | | 12,989,503 | |
| |
| | | | Distributors – 1.8% (1.1% of Total Investments) | |
| | | | | | | |
| | 13,827 | | | Core & Main LP, Term Loan, (DD1) | | | 2.706% | | | | 1-Month LIBOR | | | | 2.500% | | | | 7/27/28 | | | | Ba3 | | | | 13,714,708 | |
| | 3,427 | | | Univar Solutions USA, Inc., Term Loan B6 | | | 2.092% | | | | 1-Month LIBOR | | | | 2.000% | | | | 6/03/28 | | | | BBB– | | | | 3,406,567 | |
| | 17,254 | | | Total Distributors | | | | | | | | | | | | | | | | | | | | | | | 17,121,275 | |
| |
| | | | Diversified Consumer Services – 0.5% (0.3% of Total Investments) | |
| | | | | | | |
| | 4,900 | | | Cengage Learning, Inc., Term Loan B | | | 5.750% | | | | 3-Month LIBOR | | | | 4.750% | | | | 6/29/26 | | | | B | | | | 4,904,729 | |
| |
| | | | Diversified Financial Services – 1.0% (0.6% of Total Investments) | |
| | 2,355 | | | Avaya Inc, Term Loan, (WI/DD) | | | TBD | | | | TBD | | | | TBD | | | | TBD | | | | N/R | | | | 2,359,350 | |
| | 3,858 | | | Ditech Holding Corporation, Term Loan, (6) | | | 0.000% | | | | N/A | | | | N/A | | | | 6/30/22 | | | | N/R | | | | 777,118 | |
| | 1,725 | | | Fleetcor Technologies Operating Company, LLC, Term Loan B4 | | | 1.842% | | | | 1-Month LIBOR | | | | 1.750% | | | | 4/30/28 | | | | BB+ | | | | 1,714,529 | |
| | 994 | | | Lions Gate Capital Holdings LLC, Term Loan B | | | 2.342% | | | | 1-Month LIBOR | | | | 2.250% | | | | 3/24/25 | | | | Ba2 | | | | 984,242 | |
| | 1,500 | | | Verscend Holding Corp., Term Loan B | | | 4.092% | | | | 1-Month LIBOR | | | | 4.000% | | | | 8/27/25 | | | | BB– | | | | 1,499,438 | |
| | 2,250 | | | Vision Solutions, Inc., Term Loan, First Lien | | | 5.000% | | | | 3-Month LIBOR | | | | 4.250% | | | | 3/04/28 | | | | N/R | | | | 2,244,555 | |
| | 12,682 | | | Total Diversified Financial Services | | | | | | | | | | | | | | | | | | | | | | | 9,579,232 | |
| |
| | | | Diversified Telecommunication Services – 3.7% (2.3% of Total Investments) | |
| | | | | | | |
| | 1,314 | | | Altice France S.A., Term Loan B12 | | | 3.814% | | | | 3-Month LIBOR | | | | 3.688% | | | | 1/31/26 | | | | B | | | | 1,300,414 | |
| | 11,714 | | | Altice France S.A., Term Loan B13 | | | 4.155% | | | | 3-Month LIBOR | | | | 4.000% | | | | 8/14/26 | | | | B | | | | 11,702,246 | |
82
| | | | | | | | | | | | | | | | | | | | | | | | | | | | |
Principal
Amount (000) | | | Description (1) | | Coupon (2) | | | Reference
Rate (2) | | | Spread (2) | | | Maturity (3) | | | Ratings (4) | | | Value | |
| |
| | | | Diversified Telecommunication Services (continued) | |
| | | | | | | |
| $ | 14,617 | | | CenturyLink, Inc., Term Loan A | | | 2.092% | | | | 1-Month LIBOR | | | | 2.000% | | | | 1/31/25 | | | | BBB– | | | $ | 14,532,411 | |
| | 192 | | | CenturyLink, Inc., Term Loan B | | | 2.342% | | | | 1-Month LIBOR | | | | 2.250% | | | | 3/15/27 | | | | BBB– | | | | 188,948 | |
| | 4,883 | | | Frontier Communications Corp., DIP Term Loan B | | | 4.500% | | | | N/A | | | | N/A | | | | 10/08/27 | | | | BB+ | | | | 4,889,332 | |
| | 1,782 | | | Zayo Group Holdings, Inc., Term Loan | | | 3.092% | | | | 1-Month LIBOR | | | | 3.000% | | | | 3/09/27 | | | | B1 | | | | 1,755,015 | |
| | 34,502 | | | Total Diversified Telecommunication Services | | | | | | | | | | | | | | | | | | | | | | | 34,368,366 | |
| | | | |
| | | | Electric Utilities – 0.2% (0.1% of Total Investments) | | | | | | | | | | | | | |
| | | | | | | |
| | 990 | | | Pacific Gas & Electric Company, Term Loan | | | 3.500% | | | | 3-Month LIBOR | | | | 3.000% | | | | 6/23/25 | | | | BB | | | | 966,280 | |
| | 1,337 | | | Vistra Operations Company LLC, Term Loan B3, First Lien | | | 1.841% | | | | 1-Month LIBOR | | | | 1.750% | | | | 12/31/25 | | | | BBB– | | | | 1,321,058 | |
| | 2,327 | | | Total Electric Utilities | | | | | | | | | | | | | | | | | | | | | | | 2,287,338 | |
| | | | |
| | | | Electrical Eaquipment – 0.7% (0.4% of Total Investments) | | | | | | | | | | | | | |
| | | | | | | |
| | 2,157 | | | Avolon TLB Borrower 1 (US) LLC, Term Loan B4 | | | 2.250% | | | | 1-Month LIBOR | | | | 1.500% | | | | 2/12/27 | | | | Baa2 | | | | 2,130,080 | |
| | 4,480 | | | Ingram Micro, Inc., Term Loan B | | | 4.000% | | | | 3-Month LIBOR | | | | 3.500% | | | | 7/02/28 | | | | BB | | | | 4,488,960 | |
| | 6,637 | | | Total Electrical Equipment | | | | | | | | | | | | | | | | | | | | | | | 6,619,040 | |
| | | | |
| | | | Entertainment – 0.9% (0.6% of Total Investments) | | | | | | | | | | | | | |
| | | | | | | |
| | 958 | | | AMC Entertainment Holdings, Inc., Term Loan B, (DD1) | | | 3.103% | | | | 1-Month LIBOR | | | | 3.000% | | | | 4/22/26 | | | | B– | | | | 854,040 | |
| | 6,912 | | | Crown Finance US, Inc., Term Loan | | | 3.500% | | | | 6-Month LIBOR | | | | 2.500% | | | | 2/28/25 | | | | CCC | | | | 5,628,681 | |
| | 2,005 | | | NASCAR Holdings, Inc, Term Loan B | | | 2.842% | | | | 1-Month LIBOR | | | | 2.750% | | | | 10/18/26 | | | | BB | | | | 1,990,719 | |
| | 9,875 | | | Total Entertainment | | | | | | | | | | | | | | | | | | | | | | | 8,473,440 | |
| | | | |
| | | | Food & Staples Retailing – 3.5% (2.2% of Total Investments) | | | | | | | | | | | | | |
| | | | | | | |
| | 1,489 | | | Chobani, LLC, Term Loan B | | | 4.500% | | | | 1-Month LIBOR | | | | 3.500% | | | | 10/23/27 | | | | B– | | | | 1,489,867 | |
| | 666 | | | H Food Holdings LLC, Incremental Term Loan B3 | | | 6.000% | | | | 1-Month LIBOR | | | | 5.000% | | | | 5/31/25 | | | | B2 | | | | 670,806 | |
| | 11,441 | | | H Food Holdings LLC, Term Loan B | | | 3.780% | | | | 1-Month LIBOR | | | | 3.687% | | | | 5/31/25 | | | | B2 | | | | 11,348,105 | |
| | 13,465 | | | JBS USA Lux S.A., Term Loan B | | | 2.092% | | | | 1-Month LIBOR | | | | 2.000% | | | | 5/01/26 | | | | BBB | | | | 13,334,865 | |
| | 6,391 | | | US Foods, Inc., Term Loan B | | | 1.842% | | | | 1-Month LIBOR | | | | 1.750% | | | | 6/27/23 | | | | BB– | | | | 6,320,536 | |
| | 33,452 | | | Total Food & Staples Retailing | | | | | | | | | | | | | | | | | | | | | | | 33,164,179 | |
| | | | |
| | | | Food Products – 0.2% (0.1% of Total Investments) | | | | | | | | | | | | | |
| | | | | | | |
| | 1,980 | | | Froneri International Ltd., Term Loan | | | 2.342% | | | | 1-Month LIBOR | | | | 2.250% | | | | 1/31/27 | | | | B+ | | | | 1,946,964 | |
| | | | |
| | | | Health Care Equipment & Supplies – 1.2% (0.7% of Total Investments) | | | | | | | | | | | | | |
| | | | | | | |
| | 5,013 | | | Carestream Health, Inc., Extended Term Loan | | | 7.750% | | | | 3-Month LIBOR | | | | 6.750% | | | | 5/08/23 | | | | B1 | | | | 5,048,032 | |
| | 6,199 | | | Viant Medical Holdings, Inc., Term Loan, First Lien | | | 3.842% | | | | 1-Month LIBOR | | | | 3.750% | | | | 7/02/25 | | | | B3 | | | | 6,006,161 | |
| | 11,212 | | | Total Health Care Equipment & Supplies | | | | | | | | | | | | | | | | | | | | | | | 11,054,193 | |
| | | | |
| | | | Health Care Providers & Services – 12.2% (7.5% of Total Investments) | | | | | | | | | | |
| | | | | | | |
| | 1,995 | | | ADMI Corp., Term Loan B2 | | | 3.625% | | | | 1-Month LIBOR | | | | 3.125% | | | | 12/23/27 | | | | B | | | | 1,964,576 | |
| | 9,683 | | | AHP Health Partners, Inc., Term Loan | | | 4.750% | | | | 1-Month LIBOR | | | | 3.750% | | | | 6/30/25 | | | | B1 | | | | 9,705,741 | |
| | 974 | | | Air Methods Corporation, Term Loan B | | | 4.500% | | | | 3-Month LIBOR | | | | 3.500% | | | | 4/21/24 | | | | B | | | | 956,224 | |
| | 12,352 | | | Albany Molecular Research, Inc., Term Loan, First Lien | | | 4.250% | | | | 3-Month LIBOR | | | | 3.250% | | | | 8/30/24 | | | | B | | | | 12,371,731 | |
| | 2,321 | | | BW NHHC Holdco, Inc., Term Loan, First Lien | | | 5.155% | | | | 3-Month LIBOR | | | | 5.000% | | | | 5/15/25 | | | | Caa1 | | | | 2,131,489 | |
| | 1,593 | | | Envision Healthcare Corporation, Term Loan, First Lien | | | 3.842% | | | | 1-Month LIBOR | | | | 3.750% | | | | 10/10/25 | | | | CCC+ | | | | 1,367,871 | |
| | 11,080 | | | Gentiva Health Services, Inc., Term Loan | | | 2.875% | | | | 1-Month LIBOR | | | | 2.750% | | | | 7/02/25 | | | | B+ | | | | 11,052,492 | |
| | 10,447 | | | Global Medical Response, Inc., Term Loan B | | | 5.750% | | | | 3-Month LIBOR | | | | 4.750% | | | | 10/02/25 | | | | B | | | | 10,476,387 | |
| | 802 | | | National Mentor Holdings, Inc., Delayed Draw Term Loan, (5) | | | 4.500% | | | | 3-Month LIBOR | | | | 3.750% | | | | 3/02/28 | | | | B1 | | | | 802,049 | |
| | 3,842 | | | National Mentor Holdings, Inc., Term Loan | | | 4.500% | | | | 1-Month LIBOR | | | | 3.750% | | | | 3/02/28 | | | | B1 | | | | 3,840,115 | |
| | 3,434 | | | National Mentor Holdings, Inc., Term Loan | | | 3.897% | | | | 3-Month LIBOR | | | | 3.750% | | | | 3/02/28 | | | | B1 | | | | 3,433,014 | |
| | 243 | | | National Mentor Holdings, Inc., Term Loan C | | | 4.500% | | | | 3-Month LIBOR | | | | 3.750% | | | | 3/02/28 | | | | B1 | | | | 243,045 | |
| | 3,385 | | | Onex TSG Intermediate Corp., Term Loan B | | | 5.500% | | | | 3-Month LIBOR | | | | 4.750% | | | | 2/26/28 | | | | B | | | | 3,417,157 | |
| | 12,157 | | | Phoenix Guarantor Inc, Term Loan B | | | 3.339% | | | | 1-Month LIBOR | | | | 3.250% | | | | 3/05/26 | | | | B1 | | | | 12,019,151 | |
| | 4,107 | | | Phoenix Guarantor Inc, Term Loan B3 | | | 3.596% | | | | 1-Month LIBOR | | | | 3.500% | | | | 3/05/26 | | | | B1 | | | | 4,068,023 | |
| | 140 | | | Quorum Health Corporation, Term Loan, (6) | | | 7.500% | | | | 3-Month LIBOR | | | | 6.500% | | | | 4/29/25 | | | | B– | | | | 141,528 | |
| | 15,363 | | | RegionalCare Hospital Partners Holdings, Inc., Term Loan B, (DD1) | | | 3.842% | | | | 1-Month LIBOR | | | | 3.750% | | | | 11/16/25 | | | | B1 | | | | 15,251,712 | |
83
| | |
| |
| JQC | | Nuveen Credit Strategies Income Fund (continued) |
| | Portfolio of Investments July 31, 2021 |
| | | | | | | | | | | | | | | | | | | | | | | | | | | | |
Principal
Amount (000) | | | Description (1) | | Coupon (2) | | | Reference
Rate (2) | | | Spread (2) | | | Maturity (3) | | | Ratings (4) | | | Value | |
| | | | |
| | | | Health Care Providers & Services (continued) | | | | | | | | | | |
| | | | | | | |
| $ | 7,957 | | | Select Medical Corporation, Term Loan B | | | 2.350% | | | | 1-Month LIBOR | | | | 2.250% | | | | 3/06/25 | | | | Ba2 | | | $ | 7,858,900 | |
| | 11,583 | | | Surgery Center Holdings, Inc., Term Loan | | | 4.500% | | | | 1-Month LIBOR | | | | 3.750% | | | | 8/31/26 | | | | B1 | | | | 11,592,433 | |
| | 1,741 | | | Team Health Holdings, Inc., Term Loan, First Lien | | | 3.750% | | | | 1-Month LIBOR | | | | 2.750% | | | | 2/06/24 | | | | B | | | | 1,689,500 | |
| | 115,199 | | | Total Health Care Providers & Services | | | | | | | | | | | | | | | | | | | | | | | 114,383,138 | |
| | | | |
| | | | Health Care Technology – 1.5% (0.9% of Total Investments) | | | | | | | | | | | | | |
| | | | | | | |
| | 8,926 | | | Carestream Health, Inc., Term Loan, Second Lien, (cash 5.500%, PIK 8.000%) | | | 5.500% | | | | 3-Month LIBOR | | | | 4.500% | | | | 8/05/23 | | | | CCC+ | | | | 8,766,372 | |
| | 2,071 | | | Change Healthcare Holdings LLC, Term Loan B | | | 3.500% | | | | 3-Month LIBOR | | | | 2.500% | | | | 3/01/24 | | | | B+ | | | | 2,070,188 | |
| | 62 | | | Change Healthcare Holdings LLC, Term Loan B | | | 3.500% | | | | 1-Month LIBOR | | | | 2.500% | | | | 3/01/24 | | | | B+ | | | | 61,553 | |
| | 3,569 | | | Zelis Healthcare Corporation, Term Loan | | | 3.601% | | | | 1-Month LIBOR | | | | 3.500% | | | | 9/30/26 | | | | B | | | | 3,554,492 | |
| | 14,628 | | | Total Health Care Technology | | | | | | | | | | | | | | | | | | | | | | | 14,452,605 | |
| | | | |
| | | | Hotels, Restaurants & Leisure – 17.3% (10.7% of Total Investments) | | | | | | | | | | | | | |
| | | | | | | |
| | 15,174 | | | B.C. Unlimited Liability Company, Term Loan B4 | | | 1.842% | | | | 1-Month LIBOR | | | | 1.750% | | | | 11/19/26 | | | | BB+ | | | | 14,901,536 | |
| | 347 | | | Alterra Mountain Co, Term Loan, (WI/DD) | | | TBD | | | | TBD | | | | TBD | | | | TBD | | | | B | | | | 346,276 | |
| | 2,805 | | | Aramark Services, Inc., Term Loan B3 | | | 1.842% | | | | 1-Month LIBOR | | | | 1.750% | | | | 3/11/25 | | | | BB+ | | | | 2,765,113 | |
| | 1,489 | | | Caesars Resort Collection, LLC, Term Loan B1 | | | 4.592% | | | | 1-Month LIBOR | | | | 4.500% | | | | 7/20/25 | | | | B+ | | | | 1,492,040 | |
| | 14,898 | | | Caesars Resort Collection, LLC, Term Loan, First Lien B | | | 2.842% | | | | 1-Month LIBOR | | | | 2.750% | | | | 12/22/24 | | | | B+ | | | | 14,751,595 | |
| | 580 | | | Carnival Corporation, Term Loan B | | | 3.750% | | | | 1-Month LIBOR | | | | 3.000% | | | | 6/30/25 | | | | Ba2 | | | | 576,459 | |
| | 3,094 | | | Churchill Downs Incorporated, Incremental Term Loan B1 | | | 2.100% | | | | 1-Month LIBOR | | | | 2.000% | | | | 3/17/28 | | | | BBB– | | | | 3,062,664 | |
| | 1,807 | | | ClubCorp Holdings, Inc., Term Loan B | | | 2.897% | | | | 3-Month LIBOR | | | | 2.750% | | | | 9/18/24 | | | | B– | | | | 1,712,842 | |
| | 958 | | | Crown Finance US, Inc., Term Loan B1, (cash 7.000%, PIK 8.250%) | | | 7.000% | | | | 3-Month LIBOR | | | | 7.000% | | | | 5/23/24 | | | | B– | | | | 1,192,868 | |
| | 12,212 | | | Equinox Holdings, Inc., Term Loan, First Lien | | | 4.000% | | | | 3-Month LIBOR | | | | 3.000% | | | | 3/08/24 | | | | CCC | | | | 11,349,032 | |
| | 15,055 | | | Golden Nugget, Inc., Incremental Term Loan B | | | 3.250% | | | | 2-Month LIBOR | | | | 2.500% | | | | 10/04/23 | | | | B | | | | 14,929,006 | |
| | 3,000 | | | Hilton Grand Vacations Borrower LLC, Term Loan, (WI/DD) | | | TBD | | | | TBD | | | | TBD | | | | TBD | | | | Ba1 | | | | 2,993,250 | |
| | 4,681 | | | Hilton Worldwide Finance, LLC, Term Loan B2 | | | 1.839% | | | | 1-Month LIBOR | | | | 1.750% | | | | 6/21/26 | | | | BBB– | | | | 4,628,980 | |
| | 4,925 | | | IRB Holding Corp, Fourth Amendment Incremental Term Loan | | | 4.250% | | | | 3-Month LIBOR | | | | 3.250% | | | | 12/15/27 | | | | B | | | | 4,916,015 | |
| | 4,944 | | | IRB Holding Corp, Term Loan B | | | 3.750% | | | | 3-Month LIBOR | | | | 2.750% | | | | 2/05/25 | | | | B | | | | 4,924,691 | |
| | 9,509 | | | KFC Holding Co, (WI/DD) | | | TBD | | | | TBD | | | | TBD | | | | TBD | | | | BBB– | | | | 9,524,108 | |
| | 17,413 | | | Life Time Fitness Inc , Term Loan B | | | 5.750% | | | | 3-Month LIBOR | | | | 4.750% | | | | 12/15/24 | | | | B– | | | | 17,423,470 | |
| | 4,302 | | | Marriott Ownership Resorts, Inc., Term Loan B | | | 1.842% | | | | 1-Month LIBOR | | | | 1.750% | | | | 8/31/25 | | | | Ba1 | | | | 4,239,497 | |
| | 12,112 | | | Scientific Games International, Inc., Term Loan B5 | | | 2.842% | | | | 1-Month LIBOR | | | | 2.750% | | | | 8/14/24 | | | | B+ | | | | 11,949,724 | |
| | 5,000 | | | Stars Group Holdings B.V. (The), Incremental Term Loan, (DD1) | | | 3.647% | | |
| 3-Month LIBOR
|
| | | 3.500% | | | | 7/10/25 | | | | BBB | | | | 4,969,693 | |
| | 12,251 | | | Station Casinos LLC, Term Loan B | | | 3.250% | | | | 1-Month LIBOR | | | | 2.250% | | | | 2/08/27 | | | | BB– | | | | 12,067,522 | |
| | 15,552 | | | Whatabrands LLC, Term Loan B | | | 2.839% | | | | 1-Month LIBOR | | | | 2.750% | | | | 8/03/26 | | | | B+ | | | | 15,546,369 | |
| | 2,431 | | | Wyndham Hotels & Resorts, Inc., Term Loan B | | | 1.842% | | | | 1-Month LIBOR | | | | 1.750% | | | | 5/30/25 | | | | BB+ | | | | 2,407,947 | |
| | 164,539 | | | Total Hotels, Restaurants & Leisure | | | | | | | | | | | | | | | | | | | | | | | 162,670,697 | |
| | | | |
| | | | Household Durables – 1.0% (0.6% of Total Investments) | | | | | | | | | | | | | |
| | | | | | | |
| | 3,498 | | | Apex Tool Group, LLC, Term Loan B | | | 6.500% | | | | 1-Month LIBOR | | | | 5.250% | | | | 8/21/24 | | | | B3 | | | | 3,511,755 | |
| | 1,067 | | | Osmosis Debt Merger Sub Inc, Term Loan, (WI/DD) | | | TBD | | | | TBD | | | | TBD | | | | TBD | | | | B3 | | | | 1,067,835 | |
| | 2,740 | | | Serta Simmons Bedding, LLC, Term Loan, (6) | | | 8.500% | | | | 1-Month LIBOR | | | | 7.500% | | | | 8/10/23 | | | | B– | | | | 2,609,104 | |
| | 1,990 | | | Weber-Stephen Products LLC, Term Loan B | | | 5.500% | | | | 1-Month LIBOR | | | | 3.250% | | | | 10/30/27 | | | | B1 | | | | 1,987,831 | |
| | 9,295 | | | Total Household Durables | | | | | | | | | | | | | | | | | | | | | | | 9,176,525 | |
| | | | |
| | | | Household Products – 0.8% (0.5% of Total Investments) | | | | | | | | | | | | | |
| | | | | | | |
| | 1,790 | | | Illuminate Merger Sub Corp, Term Loan, (WI/DD) | | | TBD | | | | TBD | | | | TBD | | | | TBD | | | | B1 | | | | 1,779,376 | |
| | 5,299 | | | Reynolds Group Holdings, Inc., Term Loan | | | 2.842% | | | | 1-Month LIBOR | | | | 2.750% | | | | 2/05/23 | | | | B+ | | | | 5,287,925 | |
| | 7,089 | | | Total Household Products | | | | | | | | | | | | | | | | | | | | | | | 7,067,301 | |
| | | | |
| | | | Independent Power & Renewable Electricity Producers – 0.2% (0.1% of Total Investments) | | | | | | | | | | | | | |
| | | | | | | |
| | 1,500 | | | WIN Waste Innovations Holdings, Inc., Term Loan B | | | 3.250% | | | | 3-Month LIBOR | | | | 2.750% | | | | 3/25/28 | | | | B+ | | | | 1,496,250 | |
84
| | | | | | | | | | | | | | | | | | | | | | | | | | | | |
Principal
Amount (000) | | | Description (1) | | Coupon (2) | | | Reference
Rate (2) | | | Spread (2) | | | Maturity (3) | | | Ratings (4) | | | Value | |
| | | | |
| | | | Insurance – 5.6% (3.5% of Total Investments) | | | | | | | | | | | | | |
| | | | | | | |
| $ | 16,775 | | | Acrisure, LLC, Term Loan B | | | 3.607% | | | | 2-Month LIBOR | | | | 3.500% | | | | 2/15/27 | | | | B | | | $ | 16,504,503 | |
| | 3,136 | | | Alliant Holdings Intermediate, LLC, Term Loan B3 | | | 4.250% | | | | 1-Month LIBOR | | | | 3.750% | | | | 11/06/27 | | | | B | | | | 3,137,844 | |
| | 4,800 | | | Asurion LLC, Term Loan, (WI/DD) | | | TBD | | | | TBD | | | | TBD | | | | TBD | | | | B | | | | 4,783,488 | |
| | 1,463 | | | Asurion LLC, Term Loan B8 | | | 3.342% | | | | 1-Month LIBOR | | | | 3.250% | | | | 12/23/26 | | | | Ba3 | | | | 1,437,942 | |
| | 2,494 | | | Asurion LLC, Term Loan B9 | | | 3.342% | | | | 1-Month LIBOR | | | | 3.250% | | | | 7/31/27 | | | | Ba3 | | | | 2,452,453 | |
| | 14,389 | | | Hub International Limited, Term Loan B | | | 2.875% | | | | 3-Month LIBOR | | | | 2.750% | | | | 4/25/25 | | | | B | | | | 14,193,306 | |
| | 248 | | | Ryan Specialty Group, LLC, Term Loan | | | 3.750% | | | | 1-Month LIBOR | | | | 3.000% | | | | 9/01/27 | | | | BB– | | | | 247,583 | |
| | 1,970 | | | USI, Inc., Incremental Term Loan B | | | 3.397% | | | | 3-Month LIBOR | | | | 3.250% | | | | 12/02/26 | | | | B | | | | 1,949,784 | |
| | 7,857 | | | USI, Inc., Repriced Term Loan | | | 3.147% | | | | 3-Month LIBOR | | | | 3.000% | | | | 5/16/24 | | | | B | | | | 7,782,225 | |
| | 53,132 | | | Total Insurance | | | | | | | | | | | | | | | | | | | | | | | 52,489,128 | |
| | | | |
| | | | Interactive Media & Services – 1.4% (0.8% of Total Investments) | | | | | | | | | | | | | |
| | | | | | | |
| | 1,350 | | | Adevinta ASA, (WI/DD) | | | TBD | | | | TBD | | | | TBD | | | | TBD | | | | BB+ | | | | 1,350,675 | |
| | 5,249 | | | Arches Buyer, Inc., Term Loan B | | | 3.750% | | | | 1-Month LIBOR | | | | 3.250% | | | | 12/06/27 | | | | B1 | | | | 5,224,219 | |
| | 415 | | | Mission Broadcasting, Inc., Term Loan B | | | 2.604% | | | | 1-Month LIBOR | | | | 2.500% | | | | 6/03/28 | | | | BBB– | | | | 411,628 | |
| | 5,752 | | | Rackspace Technology Global, Inc., Term Loan, (DD1) | | | 3.500% | | | | 3-Month LIBOR | | | | 2.750% | | | | 2/09/28 | | | | B+ | | | | 5,691,669 | |
| | 12,766 | | | Total Interactive Media & Services | | | | | | | | | | | | | | | | | | | | | | | 12,678,191 | |
| | | | |
| | | | Internet & Direct Marketing Retail – 0.4% (0.3% of Total Investments) | | | | | | | | | | | | | |
| | | | | | | |
| | 3,990 | | | CNT Holdings I Corp, Term Loan | | | 4.500% | | | | 3-Month LIBOR | | | | 3.750% | | | | 11/08/27 | | | | B | | | | 3,986,888 | |
| | | | |
| | | | Internet Software & Services – 0.5% (0.3% of Total Investments) | | | | | | | | | | | | | |
| | | | | | | |
| | 4,557 | | | Greeneden U.S. Holdings II, LLC, Term Loan B4 | | | 4.750% | | | | 1-Month LIBOR | | | | 4.000% | | | | 12/01/27 | | | | B– | | | | 4,567,026 | |
| | | | |
| | | | IT Services – 4.5% (2.8% of Total Investments) | | | | | | | | | | | | | |
| | | | | | | |
| | 2,156 | | | Ahead Data Blue, LLC, Term Loan B | | | 4.500% | | | | 3-Month LIBOR | | | | 3.750% | | | | 10/16/27 | | | | B+ | | | | 2,160,334 | |
| | 2,217 | | | Intrado Corporation, Term Loan | | | 5.000% | | | | 3-Month LIBOR | | | | 4.000% | | | | 10/10/24 | | | | BB– | | | | 2,165,203 | |
| | 847 | | | Intrado Corporation, Term Loan | | | 5.000% | | | | 2-Month LIBOR | | | | 4.000% | | | | 10/10/24 | | | | BB– | | | | 827,669 | |
| | 2,750 | | | Magenta Buyer LLC, Term Loan, (WI/DD) | | | TBD | | | | TBD | | | | TBD | | | | TBD | | | | BB– | | | | 2,740,554 | |
| | 748 | | | Project Ruby Ultimate Parent Corp., Term Loan | | | 4.000% | | | | 1-Month LIBOR | | | | 3.250% | | | | 3/10/28 | | | | B | | | | 745,061 | |
| | 18,198 | | | Sabre GLBL, Inc., Term Loan B | | | 2.092% | | | | 1-Month LIBOR | | | | 2.000% | | | | 2/22/24 | | | | Ba3 | | | | 17,815,540 | |
| | 5,037 | | | Syniverse Holdings, Inc., Term Loan, First Lien | | | 6.000% | | | | 3-Month LIBOR | | | | 5.000% | | | | 3/09/23 | | | | CCC+ | | | | 4,984,972 | |
| | 10,994 | | | Tempo Acquisition LLC, Extended Term Loan | | | 3.750% | | | | 1-Month LIBOR | | | | 3.250% | | | | 10/31/26 | | | | BB– | | | | 10,989,363 | |
| | 42,947 | | | Total IT Services | | | | | | | | | | | | | | | | | | | | | | | 42,428,696 | |
| | | | |
| | | | Leisure Products – 1.8% (1.1% of Total Investments) | | | | | | | | | | | | | |
| | | | | | | |
| | 15,566 | | | Hayward Industries, Inc., Term Loan | | | 3.250% | | | | 1-Month LIBOR | | | | 2.750% | | | | 5/28/28 | | | | BB– | | | | 15,449,327 | |
| | 127 | | | SRAM, LLC , Term Loan B | | | 3.250% | | | | 1-Month LIBOR | | | | 2.750% | | | | 5/18/28 | | | | BB– | | | | 126,795 | |
| | 318 | | | SRAM, LLC , Term Loan B | | | 3.250% | | | | 3-Month LIBOR | | | | 2.750% | | | | 5/18/28 | | | | BB– | | | | 316,989 | |
| | 1,273 | | | SRAM, LLC , Term Loan B | | | 3.250% | | | | 6-Month LIBOR | | | | 2.750% | | | | 5/18/28 | | | | BB– | | | | 1,267,955 | |
| | 17,284 | | | Total Leisure Products | | | | | | | | | | | | | | | | | | | | | | | 17,161,066 | |
| | | | |
| | | | Life Sciences Tools & Services – 3.3% (2.0% of Total Investments) | | | | | | | | | | | | | |
| | | | | | | |
| | 23,354 | | | Parexel International Corporation, Term Loan B | | | 2.842% | | | | 1-Month LIBOR | | | | 2.750% | | | | 9/27/24 | | | | B2 | | | | 23,306,917 | |
| | 7,161 | | | PPD, Inc., Initial Term Loan | | | 2.750% | | | | 1-Month LIBOR | | | | 2.250% | | | | 1/13/28 | | | | Ba2 | | | | 7,151,813 | |
| | 30,515 | | | Total Life Sciences Tools & Services | | | | | | | | | | | | | | | | | | | | | | | 30,458,730 | |
| | | | |
| | | | Machinery – 2.5% (1.5% of Total Investments) | | | | | | | | | | | | | |
| | | | | | | |
| | 1,969 | | | Alliance Laundry Systems LLC, Term Loan B | | | 4.250% | | | | 3-Month LIBOR | | | | 3.500% | | | | 10/08/27 | | | | B | | | | 1,969,487 | |
| | 960 | | | Blount International, Inc., Term Loan B | | | 4.750% | | | | 1-Month LIBOR | | | | 3.750% | | | | 4/12/23 | | | | B2 | | | | 962,718 | |
| | 1,389 | | | Gardner Denver, Inc., Term Loan B | | | 2.842% | | | | 1-Month LIBOR | | | | 2.750% | | | | 1/31/27 | | | | BB+ | | | | 1,388,828 | |
| | 12,381 | | | Gardner Denver, Inc., Term Loan B2 | | | 1.842% | | | | 1-Month LIBOR | | | | 1.750% | | | | 2/28/27 | | | | BB+ | | | | 12,173,206 | |
| | 5,172 | | | Vertical Midco GmbH, Term Loan B, (DD1) | | | 4.404% | | | | 6-Month LIBOR | | | | 4.250% | | | | 7/31/27 | | | | B+ | | | | 5,167,448 | |
| | 1,481 | | | Vertiv Group Corporation, Term Loan B | | | 2.851% | | | | 1-Month LIBOR | | | | 2.750% | | | | 3/02/27 | | | | B+ | | | | 1,469,382 | |
| | 23,352 | | | Total Machinery | | | | | | | | | | | | | | | | | | | | | | | 23,131,069 | |
| | | | |
| | | | Marine – 0.2% (0.1% of Total Investments) | | | | | | | | | | | | | |
| | | | | | | |
| | 2,827 | | | HGIM Corp., Exit Term Loan, (DD1) | | | 7.000% | | | | 3-Month LIBOR | | | | 6.000% | | | | 7/02/23 | | | | Caa3 | | | | 2,109,814 | |
85
| | |
| |
| JQC | | Nuveen Credit Strategies Income Fund (continued) |
| | Portfolio of Investments July 31, 2021 |
| | | | | | | | | | | | | | | | | | | | | | | | | | | | |
Principal
Amount (000) | | | Description (1) | | Coupon (2) | | | Reference
Rate (2) | | | Spread (2) | | | Maturity (3) | | | Ratings (4) | | | Value | |
| | | | |
| | | | Media – 14.5% (9.0% of Total Investments) | | | | | | | | | | | | | |
| | | | | | | |
| $ | 2,000 | | | Cable One, Inc., Term Loan B4 | | | 2.092% | | | | 1-Month LIBOR | | | | 2.000% | | | | 5/03/28 | | | | BB+ | | | $ | 1,979,500 | |
| | 10,660 | | | Charter Communications Operating, LLC, Term Loan B2 | | | 1.850% | | | | 1-Month LIBOR | | | | 1.750% | | | | 2/01/27 | | | | BBB– | | | | 10,549,706 | |
| | 406 | | | Checkout Holding Corp., First Out Term Loan | | | 8.500% | | | | 3-Month LIBOR | | | | 7.500% | | | | 2/15/23 | | | | N/R | | | | 392,388 | |
| | 693 | | | Checkout Holding Corp., Last Out Term Loan, (cash 2.000%, PIK 9.500%) | | | 2.000% | | | | 3-Month LIBOR | | | | 1.000% | | | | 8/15/23 | | | | N/R | | | | 384,519 | |
| | 10,244 | | | Clear Channel Outdoor Holdings, Inc., Term Loan B | | | 3.629% | | | | 3-Month LIBOR | | | | 3.500% | | | | 8/21/26 | | | | B1 | | | | 9,963,033 | |
| | 6,887 | | | Cogeco Communications Finance (USA), LP, Term Loan B | | | 2.092% | | | | 1-Month LIBOR | | | | 2.000% | | | | 1/04/25 | | | | BB | | | | 6,781,723 | |
| | 9,799 | | | CSC Holdings, LLC, Incremental Term Loan | | | 2.343% | | | | 1-Month LIBOR | | | | 2.250% | | | | 1/15/26 | | | | BB | | | | 9,645,886 | |
| | 986 | | | CSC Holdings, LLC, Term Loan B1 | | | 2.343% | | | | 1-Month LIBOR | | | | 2.250% | | | | 7/17/25 | | | | BB | | | | 972,706 | |
| | 11,832 | | | CSC Holdings, LLC, Term Loan B5 | | | 2.593% | | | | 1-Month LIBOR | | | | 2.500% | | | | 4/15/27 | | | | BB | | | | 11,703,160 | |
| | 2,591 | | | Diamond Sports Group, LLC, Term Loan | | | 3.350% | | | | 1-Month LIBOR | | | | 3.250% | | | | 8/24/26 | | | | CCC+ | | | | 1,432,971 | |
| | 7,190 | | | Directv Financing LLC, Term Loan, (WI/DD) | | | TBD | | | | TBD | | | | TBD | | | | TBD | | | | BBB– | | | | 7,184,643 | |
| | 989 | | | GCI Holdings, Inc., Term Loan B | | | 3.500% | | | | 1-Month LIBOR | | | | 2.750% | | | | 10/15/25 | | | | Ba2 | | | | 987,739 | |
| | 7,500 | | | Gray Television, Inc., Term Loan B | | | 2.350% | | | | 1-Month LIBOR | | | | 2.250% | | | | 2/07/24 | | | | BB+ | | | | 7,455,788 | |
| | 4,280 | | | Gray Television, Inc., Term Loan C | | | 2.600% | | | | 1-Month LIBOR | | | | 2.500% | | | | 1/02/26 | | | | BB+ | | | | 4,247,422 | |
| | 12 | | | Houghton Mifflin Harcourt Publishers Inc, Term Loan | | | 7.250% | | | | N/A | | | | N/A | | | | 11/22/24 | | | | BB+ | | | | 12,032 | |
| | 3,406 | | | iHeartCommunications, Inc., Term Loan | | | 3.092% | | | | 1-Month LIBOR | | | | 3.000% | | | | 5/01/26 | | | | B+ | | | | 3,365,821 | |
| | 3,627 | | | Intelsat Jackson Holdings S.A., Term Loan B3, (6) | | | 8.000% | | | | Prime | | | | 4.750% | | | | 11/27/23 | | | | N/R | | | | 3,694,005 | |
| | 4,000 | | | Mav Acquisition Corp, Term Loan, (WI/DD) | | | TBD | | | | TBD | | | | TBD | | | | TBD | | | | B2 | | | | 3,964,000 | |
| | 5,624 | | | Nexstar Broadcasting, Inc., Term Loan B3 | | | 2.337% | | | | 3-Month LIBOR | | | | 2.250% | | | | 1/17/24 | | | | BBB– | | | | 5,591,882 | |
| | 1,725 | | | Nexstar Broadcasting, Inc., Term Loan B4 | | | 2.600% | | | | 1-Month LIBOR | | | | 2.500% | | | | 9/19/26 | | | | BBB– | | | | 1,711,351 | |
| | 2,656 | | | Sinclair Television Group, Inc., Term Loan B1 | | | 2.350% | | | | 1-Month LIBOR | | | | 2.250% | | | | 1/03/24 | | | | Ba2 | | | | 2,625,579 | |
| | 3,809 | | | Springer Nature Deutschland GmbH, Term Loan B18 | | | 3.750% | | | | 1-Month LIBOR | | | | 3.000% | | | | 8/14/26 | | | | B+ | | | | 3,802,852 | |
| | 13,321 | | | Virgin Media Bristol LLC, Term Loan N | | | 2.593% | | | | 1-Month LIBOR | | | | 2.500% | | | | 1/31/28 | | | | BB+ | | | | 13,132,308 | |
| | 7,938 | | | WideOpenWest Finance LLC, Term Loan B | | | 4.250% | | | | 1-Month LIBOR | | | | 3.250% | | | | 8/19/23 | | | | B | | | | 7,936,882 | |
| | 16,916 | | | Ziggo Financing Partnership, Term Loan I | | | 2.593% | | | | 1-Month LIBOR | | | | 2.500% | | | | 4/30/28 | | | | BB | | | | 16,656,265 | |
| | 139,091 | | | Total Media | | | | | | | | | | | | | | | | | | | | | | | 136,174,161 | |
| | | | |
| | | | Multiline Retail – 0.3% (0.2% of Total Investments) | | | | | | | | | | | | | |
| | | | | | | |
| | 328 | | | Belk, Inc., Term Loan | | | 8.500% | | | | 3-Month LIBOR | | | | 7.500% | | | | 7/31/25 | | | | B– | | | | 329,377 | |
| | 1,441 | | | Belk, Inc., Term Loan, (cash 5.135%, PIK 8.000%) | | | 13.135% | | | | 3-Month LIBOR | | | | 13.000% | | | | 7/31/25 | | | | CCC- | | | | 1,102,324 | |
| | 955 | | | EG America LLC, Term Loan | | | 4.147% | | | | 3-Month LIBOR | | | | 4.000% | | | | 2/05/25 | | | | B– | | | | 950,259 | |
| | 2,724 | | | Total Multiline Retail | | | | | | | | | | | | | | | | | | | | | | | 2,381,960 | |
| | | | |
| | | | Oil, Gas & Consumable Fuels – 3.0% (1.9% of Total Investments) | | | | | | | | | | | | | |
| | | | | | | |
| | 16,788 | | | Buckeye Partners, L.P., Term Loan B | | | 2.354% | | | | 1-Month LIBOR | | | | 2.250% | | | | 11/01/26 | | | | BBB– | | | | 16,654,756 | |
| | 600 | | | DT Midstream Inc, Term Loan, (WI/DD) | | | TBD | | | | TBD | | | | TBD | | | | TBD | | | | Baa2 | | | | 599,196 | |
| | 3,949 | | | EG Group Limited, Term Loan B | | | 4.147% | | | | 3-Month LIBOR | | | | 4.000% | | | | 2/05/25 | | | | B– | | | | 3,928,306 | |
| | 824 | | | Fieldwood Energy LLC, DIP Delayed Draw Term Loan, (5), (6) | | | 9.750% | | | | 1-Month LIBOR | | | | 8.750% | | | | 8/05/21 | | | | N/R | | | | 857,204 | |
| | 4,969 | | | Fieldwood Energy LLC, Exit Term Loan, First Lien, (6) | | | 0.000% | | | | N/A | | | | N/A | | | | 4/11/22 | | | | N/R | | | | 2,682,384 | |
| | 7,034 | | | Fieldwood Energy LLC, Exit Term Loan, Second Lien, (6) | | | 0.000% | | | | N/A | | | | N/A | | | | 4/11/23 | | | | N/R | | | | 785,494 | |
| | 2,095 | | | Gulf Finance, LLC, Term Loan B | | | 6.250% | | | | 1-Month LIBOR | | | | 5.250% | | | | 8/25/23 | | | | CCC+ | | | | 1,764,003 | |
| | 995 | | | Numericable Group SA, Term Loan B11 | | | 2.879% | | | | 3-Month LIBOR | | | | 2.750% | | | | 7/31/25 | | | | B | | | | 970,970 | |
| | 37,254 | | | Total Oil, Gas & Consumable Fuels | | | | | | | | | | | | | | | | | | | | | | | 28,242,313 | |
| | | | |
| | | | Personal Products – 3.1% (1.9% of Total Investments) | | | | | | | | | | |
| | | | | | | |
| | 1,750 | | | Conair Holdings, LLC, Term Loan B | | | 4.250% | | | | 3-Month LIBOR | | | | 3.750% | | | | 5/17/28 | | | | B1 | | | | 1,747,541 | |
| | 7,332 | | | Coty, Inc., Term Loan B | | | 2.352% | | | | 1-Month LIBOR | | | | 2.250% | | | | 4/05/25 | | | | B | | | | 7,063,665 | |
| | 2,115 | | | Journey Personal Care Corp., Term Loan B | | | 5.000% | | | | 3-Month LIBOR | | | | 4.250% | | | | 3/01/28 | | | | B | | | | 2,120,954 | |
| | 5,909 | | | Knowlton Development Corporation, Inc., Term Loan B | | | 3.837% | | | | 1-Month LIBOR | | | | 3.750% | | | | 12/21/25 | | | | N/R | | | | 5,859,248 | |
| | 128 | | | Kronos Acquisition Holdings, Inc., Term Loan B | | | 4.250% | | | | 3-Month LIBOR | | | | 3.750% | | | | 12/22/26 | | | | B2 | | | | 127,078 | |
| | 14,900 | | | Revlon Consumer Products Corporation, Term Loan B, (7) | | | 4.250% | | | | 3-Month LIBOR | | | | 3.500% | | | | 9/07/23 | | | | CC | | | | 11,733,256 | |
| | 32,134 | | | Total Personal Products | | | | | | | | | | | | | | | | | | | | | | | 28,651,742 | |
| | | | |
| | | | Pharmaceuticals – 5.8% (3.6% of Total Investments) | | | | | | | | | | |
| | | | | | | |
| | 15,268 | | | Alphabet Holding Company, Inc., Term Loan, First Lien | | | 3.592% | | | | 1-Month LIBOR | | | | 3.500% | | | | 9/26/24 | | | | B2 | | | | 15,266,213 | |
86
| | | | | | | | | | | | | | | | | | | | | | | | | | | | |
Principal
Amount (000) | | | Description (1) | | Coupon (2) | | | Reference
Rate (2) | | | Spread (2) | | | Maturity (3) | | | Ratings (4) | | | Value | |
| | | | |
| | | | Pharmaceuticals (continued) | | | | | | | | | | |
| | | | | | | |
| $ | 11,043 | | | Bausch Health Companies, Inc., Term Loan B, (DD1) | | | 3.092% | | | | 1-Month LIBOR | | | | 3.000% | | | | 6/02/25 | | | | BB | | | $ | 10,977,559 | |
| | 5,392 | | | Bausch Health Companies, Inc., Term Loan B | | | 2.842% | | | | 1-Month LIBOR | | | | 2.750% | | | | 11/27/25 | | | | BB | | | | 5,344,472 | |
| | 396 | | | Catalent Pharma Solutions, Inc., Term Loan B3 | | | 2.500% | | | | 1-Month LIBOR | | | | 2.000% | | | | 2/22/28 | | | | BBB– | | | | 397,165 | |
| | 2,659 | | | Endo Luxembourg Finance Company I S.a r.l., Term Loan | | | 5.750% | | | | 3-Month LIBOR | | | | 5.000% | | | | 3/25/28 | | | | B | | | | 2,603,596 | |
| | 2,425 | | | Gainwell Acquisition Corp., Term Loan B | | | 4.750% | | | | 3-Month LIBOR | | | | 4.000% | | | | 10/01/27 | | | | BB– | | | | 2,428,564 | |
| | 5,525 | | | Jazz Financing Lux S.a.r.l., Term Loan | | | 4.000% | | | | 1-Month LIBOR | | | | 3.500% | | | | 4/22/28 | | | | BB+ | | | | 5,538,812 | |
| | 9,263 | | | Mallinckrodt International Finance S.A., Term Loan B, (DD1), (6) | | | 6.000% | | | | 6-Month LIBOR | | | | 5.250% | | | | 9/24/24 | | | | D | | | | 9,029,911 | |
| | 3,000 | | | Organon & Co, Term Loan | | | 3.500% | | | | 3-Month LIBOR | | | | 3.000% | | | | 6/02/28 | | | | BB | | | | 2,996,565 | |
| | 54,971 | | | Total Pharmaceuticals | | | | | | | | | | | | | | | | | | | | | | | 54,582,857 | |
| | | | |
| | | | Professional Services – 1.5% (0.9% of Total Investments) | | | | | | | | | | | | | |
| | | | | | | |
| | 2,907 | | | Ceridian HCM Holding, Inc., Term Loan B | | | 2.584% | | | | 1-Week LIBOR | | | | 2.500% | | | | 4/30/25 | | | | B+ | | | | 2,861,084 | |
| | 2,955 | | | Creative Artists Agency, LLC , Term Loan B | | | 3.842% | | | | 1-Month LIBOR | | | | 3.750% | | | | 11/26/26 | | | | B | | | | 2,927,518 | |
| | 178 | | | Dun & Bradstreet Corporation (The), Term Loan | | | 3.336% | | | | 1-Month LIBOR | | | | 3.250% | | | | 2/08/26 | | | | BB+ | | | | 176,921 | |
| | 1,292 | | | Nielsen Consumer, Inc., Term Loan B | | | 4.103% | | | | 1-Month LIBOR | | | | 4.000% | | | | 3/05/28 | | | | BB | | | | 1,291,879 | |
| | 6,361 | | | Nielsen Finance LLC, Term Loan B4 | | | 2.103% | | | | 1-Month LIBOR | | | | 2.000% | | | | 10/04/23 | | | | BBB– | | | | 6,353,789 | |
| | 13,693 | | | Total Professional Services | | | | | | | | | | | | | | | | | | | | | | | 13,611,191 | |
| | | | |
| | | | Real Estate Management & Development – 1.6% (1.0% of Total Investments) | | | | | | | | | | | | | |
| | | | | | | |
| | 6,343 | | | Brookfield Property REIT, Inc., Term Loan A2 | | | 3.092% | | | | 1-Month LIBOR | | | | 3.000% | | | | 8/24/23 | | | | BB+ | | | | 6,295,897 | |
| | 7,048 | | | Brookfield Property REIT, Inc., Term Loan, First Lien B | | | 2.592% | | | | 1-Month LIBOR | | | | 2.500% | | | | 8/24/25 | | | | BB+ | | | | 6,854,130 | |
| | 1,493 | | | North American Lifting Holdings, Inc., Priority Term Loan | | | 7.500% | | | | 3-Month LIBOR | | | | 6.500% | | | | 10/16/24 | | | | B+ | | | | 1,561,528 | |
| | 14,884 | | | Total Real Estate Management & Development | | | | | | | | | | | | | | | | | | | | | | | 14,711,555 | |
| | | | |
| | | | Road & Rail – 0.9% (0.6% of Total Investments) | | | | | | | | | | | | | |
| | | | | | | |
| | 4,883 | | | Avolon TLB Borrower 1 (US) LLC, Term Loan B3 | | | 2.500% | | | | 1-Month LIBOR | | | | 1.750% | | | | 1/15/25 | | | | Baa2 | | | | 4,865,442 | |
| | 2,994 | | | Hertz Corp, Term Loan, (WI/DD) | | | TBD | | | | TBD | | | | TBD | | | | TBD | | | | B+ | | | | 2,980,233 | |
| | 565 | | | Hertz Corp, Term Loan, (WI/DD) | | | TBD | | | | TBD | | | | TBD | | | | TBD | | | | BB– | | | | 561,736 | |
| | 8,442 | | | Total Road & Rail | | | | | | | | | | | | | | | | | | | | | | | 8,407,411 | |
| | | |
| | | | Semiconductors & Semiconductor Equipment – 1.3% (0.8% of Total Investments) | | | | | | | |
| | | | | | | |
| | 388 | | | Bright Bidco B.V., Term Loan B, (DD1) | | | 4.500% | | | | 3-Month LIBOR | | | | 3.500% | | | | 6/30/24 | | | | CCC | | | | 311,697 | |
| | 5,666 | | | CMC Materials, Inc., Term Loan B1 | | | 2.125% | | | | 1-Month LIBOR | | | | 2.000% | | | | 11/15/25 | | | | BBB– | | | | 5,651,973 | |
| | 6,191 | | | ON Semiconductor Corporation, Term Loan B | | | 2.092% | | | | 1-Month LIBOR | | | | 2.000% | | | | 9/19/26 | | | | Baa3 | | | | 6,134,823 | |
| | 12,245 | | | Total Semiconductors & Semiconductor Equipment | | | | | | | | | | | | | | | | | | | | | | | 12,098,493 | |
| |
| | | | Software – 13.1% (8.1% of Total Investments) | |
| | | | | | | |
| | 2,643 | | | Apttus Corporation, Term Loan | | | 5.000% | | | | 3-Month LIBOR | | | | 4.250% | | | | 5/06/28 | | | | BB | | | | 2,654,237 | |
| | 9,825 | | | Blackboard, Inc., Term Loan B5 | | | 7.000% | | | | 3-Month LIBOR | | | | 6.000% | | | | 6/30/24 | | | | B1 | | | | 9,903,600 | |
| | 2,207 | | | By Crown Parent, LLC, Term Loan B1 | | | 4.000% | | | | 1-Month LIBOR | | | | 3.000% | | | | 1/30/26 | | | | B1 | | | | 2,199,740 | |
| | 3,990 | | | Delta TopCo, Inc., Term Loan B | | | 4.500% | | | | 3-Month LIBOR | | | | 3.750% | | | | 12/01/27 | | | | B2 | | | | 3,993,332 | |
| | 5,399 | | | Dynatrace LLC, Term Loan, First Lien | | | 2.342% | | | | 1-Month LIBOR | | | | 2.250% | | | | 8/23/25 | | | | BB+ | | | | 5,376,609 | |
| | 12,740 | | | Emerald TopCo Inc, Term Loan | | | 3.628% | | | | 3-Month LIBOR | | | | 3.500% | | | | 7/25/26 | | | | B | | | | 12,618,588 | |
| | 32 | | | Emerald TopCo Inc, Term Loan | | | 3.628% | | | | 1-Month LIBOR | | | | 3.500% | | | | 7/25/26 | | | | B | | | | 32,190 | |
| | 9,185 | | | Epicor Software Corporation, Term Loan | | | 4.000% | | | | 1-Month LIBOR | | | | 3.250% | | | | 7/31/27 | | | | B2 | | | | 9,169,184 | |
| | 5,613 | | | Finastra USA, Inc., Term Loan, First Lien | | | 4.500% | | | | 6-Month LIBOR | | | | 3.500% | | | | 6/13/24 | | | | BB– | | | | 5,533,185 | |
| | 6,112 | | | Informatica LLC,, Term Loan B | | | 3.342% | | | | 1-Month LIBOR | | | | 3.250% | | | | 2/14/27 | | | | B1 | | | | 6,055,559 | |
| | 2,999 | | | MA FinanceCo., LLC, Term Loan B | | | 5.250% | | | | 3-Month LIBOR | | | | 4.250% | | | | 6/05/25 | | | | BB | | | | 3,020,404 | |
| | 1,394 | | | MA FinanceCo., LLC, Term Loan B3 | | | 2.842% | | | | 1-Month LIBOR | | | | 2.750% | | | | 6/21/24 | | | | BB | | | | 1,378,253 | |
| | 894 | | | McAfee, LLC, Term Loan B | | | 3.840% | | | | 1-Month LIBOR | | | | 3.750% | | | | 9/29/24 | | | | BB | | | | 893,875 | |
| | 3,125 | | | Polaris Newco LLC, Term Loan B | | | 4.500% | | | | 6-Month LIBOR | | | | 4.000% | | | | 6/04/28 | | | | B2 | | | | 3,126,594 | |
| | 3,151 | | | Proofpoint Inc, Term Loan, (WI/DD) | | | TBD | | | | TBD | | | | TBD | | | | TBD | | | | BB– | | | | 3,124,217 | |
| | 3,550 | | | RealPage, Inc, Term Loan, First Lien | | | 3.750% | | | | 1-Month LIBOR | | | | 3.250% | | | | 4/22/28 | | | | B+ | | | | 3,532,924 | |
| | 9,418 | | | Seattle Spinco, Inc., Term Loan B3 | | | 2.842% | | | | 1-Month LIBOR | | | | 2.750% | | | | 6/21/24 | | | | BB | | | | 9,307,685 | |
| | 115 | | | Software Luxembourg Acquisition Sarl, Term Loan | | | 8.500% | | | | 3-Month LIBOR | | | | 7.500% | | | | 12/27/24 | | | | B1 | | | | 115,632 | |
| | 10,063 | | | Sophia, L.P., Term Loan, First Lien | | | 4.500% | | | | 3-Month LIBOR | | | | 3.750% | | | | 10/07/27 | | | | B | | | | 10,068,235 | |
| | 2,974 | | | SS&C European Holdings Sarl, Term Loan B4 | | | 1.842% | | | | 1-Month LIBOR | | | | 1.750% | | | | 4/16/25 | | | | BB+ | | | | 2,935,835 | |
| | 3,754 | | | SS&C Technologies, Inc., Term Loan B3 | | | 1.842% | | | | 1-Month LIBOR | | | | 1.750% | | | | 4/16/25 | | | | BB+ | | | | 3,705,998 | |
| | 6,777 | | | Ultimate Software Group Inc(The), Incremental Term Loan | | | 4.000% | | | | 3-Month LIBOR | | | | 3.250% | | | | 5/03/26 | | | | B1 | | | | 6,781,659 | |
87
| | |
| |
| JQC | | Nuveen Credit Strategies Income Fund (continued) |
| | Portfolio of Investments July 31, 2021 |
| | | | | | | | | | | | | | | | | | | | | | | | | | | | |
Principal
Amount (000) | | | Description (1) | | Coupon (2) | | | Reference
Rate (2) | | | Spread (2) | | | Maturity (3) | | | Ratings (4) | | | Value | |
| |
| | | | Software (continued) | |
| | | | | | | |
| $ | 2,452 | | | Ultimate Software Group Inc(The), Incremental Term Loan, Second Lien | | | 7.500% | | | | 3-Month LIBOR | | | | 6.750% | | | | 5/03/27 | | | | Caa1 | | | $ | 2,498,370 | |
| | 14,737 | | | Ultimate Software Group Inc(The), Term Loan B | | | 3.842% | | | | 1-Month LIBOR | | | | 3.750% | | | | 5/03/26 | | | | B1 | | | | 14,747,374 | |
| | 123,149 | | | Total Software | | | | | | | | | | | | | | | | | | | | | | | 122,773,279 | |
| |
| | | | Specialty Retail – 2.6% (1.6% of Total Investments) | |
| | | | | | | |
| | 1,309 | | | Academy, Ltd., Term Loan | | | 4.500% | | | | 1-Month LIBOR | | | | 3.750% | | | | 5/01/69 | | | | N/R | | | | 1,311,673 | |
| | 2,290 | | | Birkenstock US BidCo Inc, Term Loan, (WI/DD) | | | TBD | | | | TBD | | | | TBD | | | | TBD | | | | BB– | | | | 2,288,088 | |
| | 3,430 | | | Jo-Ann Stores, Inc., Term Loan B1 | | | 5.500% | | | | 3-Month LIBOR | | | | 4.750% | | | | 6/30/28 | | | | B | | | | 3,420,139 | |
| | 861 | | | LBM Acquisition LLC, Term Loan, (WI/DD) | | | TBD | | | | TBD | | | | TBD | | | | TBD | | | | B+ | | | | 851,282 | |
| | 431 | | | LBM Acquisition LLC, Term Loan, (WI/DD), (5) | | | TBD | | | | TBD | | | | TBD | | | | TBD | | | | B+ | | | | 425,641 | |
| | 16,360 | | | PetSmart, Inc., Term Loan B | | | 4.500% | | | | 6-Month LIBOR | | | | 3.750% | | | | 2/12/28 | | | | BB– | | | | 16,374,315 | |
| | 24,681 | | | Total Specialty Retail | | | | | | | | | | | | | | | | | | | | | | | 24,671,138 | |
| |
| | | | Technology Hardware, Storage & Peripherals – 1.6% (1.0% of Total Investments) | |
| | | | | | | |
| | 9,418 | | | Dell International LLC, Term Loan B | | | 2.000% | | | | 1-Month LIBOR | | | | 1.750% | | | | 9/19/25 | | | | BBB– | | | | 9,414,544 | |
| | 2,569 | | | Peraton Corp., Term Loan B | | | 4.500% | | | | 1-Month LIBOR | | | | 3.750% | | | | 2/01/28 | | | | BB– | | | | 2,570,168 | |
| | 2,767 | | | Western Digital Corporation, Term Loan B4 | | | 1.842% | | | | 1-Month LIBOR | | | | 1.750% | | | | 4/29/23 | | | | Baa2 | | | | 2,770,701 | |
| | 14,754 | | | Total Technology Hardware, Storage & Peripherals | | | | | | | | | | | | | | | | | | | | | | | 14,755,413 | |
| |
| | | | Textiles, Apparel & Luxury Goods – 0.2% (0.1% of Total Investments) | |
| | | | | | | |
| | 1,745 | | | CBI Buyer, Inc., Term Loan | | | 3.750% | | | | 3-Month LIBOR | | | | 3.250% | | | | 1/06/28 | | | | B1 | | | | 1,733,439 | |
| |
| | | | Wireless Telecommunication Services – 0.3% (0.2% of Total Investments) | |
| | | | | | | |
| | 986 | | | Altice Financing SA, Term Loan, First Lien | | | 2.900% | | | | 3-Month LIBOR | | | | 2.750% | | | | 1/31/26 | | | | B | | | | 967,802 | |
| | 1,500 | | | GOGO Intermediate Holdings LLC, Term Loan B | | | 4.500% | | | | 3-Month LIBOR | | | | 3.750% | | | | 4/30/28 | | | | B– | | | | 1,495,553 | |
| | 2,486 | | | Total Wireless Telecommunication Services | | | | | | | | | | | | | | | | | | | | | | | 2,463,355 | |
| $ | 1,342,030 | | | Total Variable Rate Senior Loan Interests (cost $1,326,573,281) | | | | | | | | | | | | | | | | | | | | 1,312,636,846 | |
| | | | | | | |
Principal
Amount (000) | | | Description (1) | | | | | | | | Coupon | | | Maturity | | | Ratings (4) | | | Value | |
| | | | | | |
| | | | CORPORATE BONDS – 19.3% (11.9% of Total Investments) | | | | | | | | | | | | | | | | | | | | | |
| | | | | | | |
| | | | Airlines – 0.6% (0.3% of Total Investments) | | | | | | | | | | | | | | | | | | | | | | | | |
| | | | | | | |
| $ | 5,000 | | | Mileage Plus Holdings LLC / Mileage Plus Intellectual Property Assets Ltd, 144A, (8) | | | | | | | | | | | 6.500% | | | | 6/20/27 | | | | Baa3 | | | $ | 5,443,750 | |
| | | | | | |
| | | | Auto Components – 0.3% (0.2% of Total Investments) | | | | | | | | | | | | | | | | |
| | | | | | | |
| | 2,699 | | | Clarios Global LP / Clarios US Finance Co, 144A, (8) | | | | | | | | | | | 6.250% | | | | 5/15/26 | | | | B1 | | | | 2,854,193 | |
| | | | | | | |
| | | | Automobiles – 0.4% (0.3% of Total Investments) | | | | | | | | | | | | | | | | | | | | | | | | |
| | | | | | | |
| | 4,000 | | | Ford Motor Credit Co LLC, (8) | | | | | | | | | | | 3.813% | | | | 10/12/21 | | | | BB+ | | | | 4,018,637 | |
| | | | | | |
| | | | Capital Markets – 0.1% (0.1% of Total Investments) | | | | | | | | | | | | | | | | |
| | | | | | | |
| | 1,000 | | | LPL Holdings Inc, 144A, (8) | | | | | | | | | | | 4.625% | | | | 11/15/27 | | | | BB | | | | 1,031,250 | |
| | | | | | | |
| | | | Chemicals – 0.1% (0.1% of Total Investments) | | | | | | | | | | | | | | | | | | | | | | | | |
| | | | | | | |
| | 1,000 | | | Rayonier AM Products Inc, 144A | | | | | | | | | | | 7.625% | | | | 1/15/26 | | | | B1 | | | | 1,027,500 | |
| | | | | | |
| | | | Commercial Services & Supplies – 0.3% (0.2% of Total Investments) | | | | | | | | | | | | | | | | |
| | | | | | | |
| | 2,500 | | | Prime Security Services Borrower LLC / Prime Finance Inc, 144A | | | | | | | | | | | 3.375% | | | | 8/31/27 | | | | BB– | | | | 2,431,750 | |
| | | | | | |
| | | | Communications Equipment – 1.4% (0.9% of Total Investments) | | | | | | | | | | | | | | | | |
| | | | | | | |
| | 4,000 | | | CommScope Inc, 144A, (8) | | | | | | | | | | | 5.500% | | | | 3/01/24 | | | | BB– | | | | 4,114,360 | |
| | 2,250 | | | CommScope Inc, 144A, (8) | | | | | | | | | | | 8.250% | | | | 3/01/27 | | | | B– | | | | 2,382,187 | |
| | 6,750 | | | CommScope Technologies LLC, 144A, (8) | | | | | | | | | | | 5.000% | | | | 3/15/27 | | | | B– | | | | 6,829,650 | |
| | 13,000 | | | Total Communications Equipment | | | | | | | | | | | | | | | | | | | | | | | 13,326,197 | |
88
| | | | | | | | | | | | | | | | | | | | | | | | | | | | |
Principal
Amount (000) | | | Description (1) | | | | | | | | Coupon | | | Maturity | | | Ratings (4) | | | Value | |
| | | | | | | |
| | | | Consumer Finance – 1.1% (0.7% of Total Investments) | | | | | | | | | | | | | | | | | | | | | | | | |
| | | | | | | |
| $ | 5,000 | | | DAE Funding LLC, 144A | | | | | | | | | | | 4.500% | | | | 8/01/22 | | | | Baa3 | | | $ | 5,000,000 | |
| | 5,000 | | | Verscend Escrow Corp, 144A, (8) | | | | | | | | | | | 9.750% | | | | 8/15/26 | | | | CCC+ | | | | 5,281,250 | |
| | 10,000 | | | Total Consumer Finance | | | | | | | | | | | | | | | | | | | | | | | 10,281,250 | |
| | | | | |
| | | | Diversified Telecommunication Services – 1.8% (1.1% of Total Investments) | | | | | | | | | | | | | | | | | |
| | | | | | | |
| | 6,000 | | | Avaya Inc, 144A, (8) | | | | | | | | | | | 6.125% | | | | 9/15/28 | | | | B+ | | | | 6,420,000 | |
| | 5,000 | | | DIRECTV Holdings LLC / DIRECTV Financing Co Inc, 144A | | | | | | | | | | | 5.875% | | | | 8/15/27 | | | | BBB– | | | | 5,169,500 | |
| | 5,000 | | | Lumen Technologies Inc, (8) | | | | | | | | | | | 5.800% | | | | 3/15/22 | | | | BB | | | | 5,130,425 | |
| | 16,000 | | | Total Diversified Telecommunication Services | | | | | | | | | | | | | | | | | | | | | | | 16,719,925 | |
| | | | | | | |
| | | | Electric Utilities – 0.1% (0.0% of Total Investments) | | | | | | | | | | | | | | | | | | | | | | | | |
| | | | | | | |
| | 3,750 | | | Bruce Mansfield Unit 1 2007 Pass-Through Trust, (6) | | | | | | | | | | | 6.850% | | | | 6/01/34 | | | | N/R | | | | 4,687 | |
| | 265 | | | Pacific Gas and Electric Co | | | | | | | | | | | 3.450% | | | | 7/01/25 | | | | BBB– | | | | 276,390 | |
| | 265 | | | Pacific Gas and Electric Co | | | | | | | | | | | 3.750% | | | | 7/01/28 | | | | BBB– | | | | 277,183 | |
| | 4,280 | | | Total Electric Utilities | | | | | | | | | | | | | | | | | | | | | | | 558,260 | |
| | | | | |
| | | | Equity Real Estate Investment Trust – 0.7% (0.4% of Total Investments) | | | | | | | | | | | | | | | | | |
| | | | | | | |
| | 6,000 | | | Uniti Group LP / Uniti Fiber Holdings Inc / CSL Capital LLC, 144A, (8) | | | | | | | | | | | 7.875% | | | | 2/15/25 | | | | B | | | | 6,390,000 | |
| | | | | | |
| | | | Food & Staples Retailing – 0.7% (0.4% of Total Investments) | | | | | | | | | | | | | | | | | | | | | |
| | | | | | | |
| | 4,000 | | | Albertsons Cos Inc / Safeway Inc / New Albertsons LP / Albertsons LLC, 144A, (8) | | | | | | | | | | | 4.625% | | | | 1/15/27 | | | | BB | | | | 4,232,000 | |
| | 2,000 | | | JBS USA Food Co, 144A, (8) | | | | | | | | | | | 5.750% | | | | 1/15/28 | | | | BBB– | | | | 2,108,000 | |
| | 6,000 | | | Total Food & Staples Retailing | | | | | | | | | | | | | | | | | | | | | | | 6,340,000 | |
| | | | | | | |
| | | | Food Products – 0.2% (0.1% of Total Investments) | | | | | | | | | | | | | | | | | | | | | | | | |
| | | | | | | |
| | 2,000 | | | H-Food Holdings LLC / Hearthside Finance Co Inc, 144A, (8) | | | | | | | | | | | 8.500% | | | | 6/01/26 | | | | CCC | | | | 2,080,000 | |
| | | | | | | |
| | | | Gas Utilities – 0.1% (0.1% of Total Investments) | | | | | | | | | | | | | | | | | | | | | | | | |
| | | | | | | |
| | 500 | | | NGL Energy Partners LP / NGL Energy Finance Corp, (8) | | | | | | | | | | | 7.500% | | | | 11/01/23 | | | | CCC+ | | | | 476,250 | |
| | 500 | | | NGL Energy Partners LP / NGL Energy Finance Corp, (8) | | | | | | | | | | | 6.125% | | | | 3/01/25 | | | | CCC+ | | | | 425,000 | |
| | 1,000 | | | Total Gas Utilities | | | | | | | | | | | | | | | | | | | | | | | 901,250 | |
| | | | | |
| | | | Health Care Providers & Services – 3.2% (2.0% of Total Investments) | | | | | | | | | | | | | | | | | |
| | | | | | | |
| | 2,000 | | | CHS/Community Health Systems Inc, 144A, (8) | | | | | | | | | | | 6.625% | | | | 2/15/25 | | | | B | | | | 2,097,180 | |
| | 3,335 | | | CHS/Community Health Systems Inc, 144A, (8) | | | | | | | | | | | 8.000% | | | | 3/15/26 | | | | B | | | | 3,575,520 | |
| | 725 | | | CHS/Community Health Systems Inc, 144A, (8) | | | | | | | | | | | 8.000% | | | | 12/15/27 | | | | B | | | | 801,857 | |
| | 2,000 | | | CHS/Community Health Systems Inc, 144A, (8) | | | | | | | | | | | 6.875% | | | | 4/15/29 | | | | CCC | | | | 2,105,000 | |
| | 2,650 | | | Legacy LifePoint Health LLC, 144A, (8) | | | | | | | | | | | 4.375% | | | | 2/15/27 | | | | B1 | | | | 2,656,625 | |
| | 2,500 | | | Molina Healthcare Inc, (8) | | | | | | | | | | | 5.375% | | | | 11/15/22 | | | | BB– | | | | 2,605,000 | |
| | 4,850 | | | RegionalCare Hospital Partners Holdings Inc / LifePoint Health Inc, 144A, (8) | | | | | | | | | | | 9.750% | | | | 12/01/26 | | | | CCC+ | | | | 5,153,853 | |
| | 2,000 | | | Tenet Healthcare Corp, 144A, (8) | | | | | | | | | | | 7.500% | | | | 4/01/25 | | | | B+ | | | | 2,150,000 | |
| | 8,500 | | | Tenet Healthcare Corp, 144A, (8) | | | | | | | | | | | 6.125% | | | | 10/01/28 | | | | B | | | | 9,052,500 | |
| | 28,560 | | | Total Health Care Providers & Services | | | | | | | | | | | | | | | | | | | | | | | 30,197,535 | |
| | | | | | |
| | | | Health Care Technology – 0.2% (0.1% of Total Investments) | | | | | | | | | | | | | | | | | | | | | |
| | | | | | | |
| | 1,840 | | | Change Healthcare Holdings LLC / Change Healthcare Finance Inc, 144A, (8) | | | | | | | | | | | 5.750% | | | | 3/01/25 | | | | B– | | | | 1,860,700 | |
| | | | | |
| | | | Hotels, Restaurants & Leisure – 0.6% (0.4% of Total Investments) | | | | | | | | | | | | | | | | | |
| | | | | | | |
| | 501 | | | Carnival Corp, 144A, (8) | | | | | | | | | | | 11.500% | | | | 4/01/23 | | | | Ba2 | | | | 564,878 | |
| | 5,285 | | | IRB Holding Corp, 144A, (8) | | | | | | | | | | | 6.750% | | | | 2/15/26 | | | | CCC+ | | | | 5,430,337 | |
| | 5,786 | | | Total Hotels, Restaurants & Leisure | | | | | | | | | | | | | | | | | | | | | | | 5,995,215 | |
| | | | |
| | | | Household Durables – 0.1% (0.0% of Total Investments) | | | | | | | | | | |
| | | | | | | |
| | 505 | | | Kronos Acquisition Holdings Inc / KIK Custom Products Inc, 144A, (8) | | | | | | | | | | | 5.000% | | | | 12/31/26 | | | | B2 | | | | 512,073 | |
89
| | |
| |
| JQC | | Nuveen Credit Strategies Income Fund (continued) |
| | Portfolio of Investments July 31, 2021 |
| | | | | | | | | | | | | | | | | | | | | | | | | | | | |
Principal
Amount (000) | | | Description (1) | | | | | | | | Coupon | | | Maturity | | | Ratings (4) | | | Value | |
| | | | |
| | | | Leisure Products – 0.4% (0.3% of Total Investments) | | | | | | | | | | |
| | | | | | | |
| $ | 3,900 | | | Academy Ltd, 144A, (8) | | | | | | | | | | | 6.000% | | | | 11/15/27 | | | | Ba3 | | | $ | 4,187,625 | |
| | | | |
| | | | Machinery – 0.6% (0.4% of Total Investments) | | | | | | | | | | |
| | | | | | | |
| | 6,000 | | | Apex Tool Group LLC / BC Mountain Finance Inc, 144A, (8) | | | | | | | | | | | 9.000% | | | | 2/15/23 | | | | CCC | | | | 6,015,000 | |
| | | | |
| | | | Media – 1.5% (0.9% of Total Investments) | | | | | | | | | | |
| | | | | | | |
| | 3,675 | | | Clear Channel Outdoor Holdings Inc, 144A, (8) | | | | | | | | | | | 7.750% | | | | 4/15/28 | | | | CCC | | | | 3,832,364 | |
| | 3,000 | | | Clear Channel Worldwide Holdings Inc, 144A, (8) | | | | | | | | | | | 5.125% | | | | 8/15/27 | | | | B+ | | | | 3,080,100 | |
| | 3,415 | | | Diamond Sports Group LLC / Diamond Sports Finance Co, 144A | | | | | | | | | | | 5.375% | | | | 8/15/26 | | | | CCC+ | | | | 1,980,700 | |
| | 3,000 | | | Diamond Sports Group LLC / Diamond Sports Finance Co, 144A | | | | | | | | | | | 6.625% | | | | 8/15/27 | | | | CCC– | | | | 1,188,750 | |
| | 4,000 | | | Houghton Mifflin Harcourt Publishers Inc, 144A, (8) | | | | | | | | | | | 9.000% | | | | 2/15/25 | | | | BB+ | | | | 4,260,000 | |
| | 12 | | | iHeartCommunications Inc | | | | | | | | | | | 6.375% | | | | 5/01/26 | | | | B+ | | | | 12,510 | |
| | 17,102 | | | Total Media | | | | | | | | | | | | | | | | | | | | | | | 14,354,424 | |
| | | | |
| | | | Metals & Mining – 0.5% (0.3% of Total Investments) | | | | | | | | | | |
| | | | | | | |
| | 2,000 | | | First Quantum Minerals Ltd, 144A, (8) | | | | | | | | | | | 6.500% | | | | 3/01/24 | | | | B | | | | 2,038,000 | |
| | 2,120 | | | First Quantum Minerals Ltd, 144A, (8) | | | | | | | | | | | 6.875% | | | | 10/15/27 | | | | B | | | | 2,297,550 | |
| | 4,120 | | | Total Metals & Mining | | | | | | | | | | | | | | | | | | | | | | | 4,335,550 | |
| | | | |
| | | | Oil, Gas & Consumable Fuels – 0.9% (0.6% of Total Investments) | | | | | | | | | | |
| | | | | | | |
| | 2,000 | | | Baytex Energy Corp, 144A | | | | | | | | | | | 5.625% | | | | 6/01/24 | | | | B+ | | | | 1,995,000 | |
| | 2,000 | | | CITGO Petroleum Corp, 144A, (8) | | | | | | | | | | | 7.000% | | | | 6/15/25 | | | | BB | | | | 2,053,160 | |
| | 1,450 | | | Gulfport Energy Operating Corp, 144A, (8) | | | | | | | | | | | 8.000% | | | | 5/17/26 | | | | BB– | | | | 1,544,931 | |
| | 2,313 | | | NGL Energy Operating LLC / NGL Energy Finance Corp, 144A, (8) | | | | | | | | | | | 7.500% | | | | 2/01/26 | | | | BB– | | | | 2,376,607 | |
| | 750 | | | NGL Energy Partners LP / NGL Energy Finance Corp, (8) | | | | | | | | | | | 7.500% | | | | 4/15/26 | | | | CCC+ | | | | 631,958 | |
| | 8,513 | | | Total Oil, Gas & Consumable Fuels | | | | | | | | | | | | | | | | | | | | | | | 8,601,656 | |
| | | | |
| | | | Pharmaceuticals – 0.9% (0.5% of Total Investments) | | | | | | | | | | |
| | | | | | | |
| | 913 | | | Endo Dac / Endo Finance LLC / Endo Finco Inc, 144A | | | | | | | | | | | 6.000% | | | | 6/30/28 | | | | CCC | | | | 616,275 | |
| | 7,000 | | | Horizon Therapeutics USA Inc, 144A, (8) | | | | | | | | | | | 5.500% | | | | 8/01/27 | | | | BB– | | | | 7,424,970 | |
| | 362 | | | Par Pharmaceutical Inc, 144A, (8) | | | | | | | | | | | 7.500% | | | | 4/01/27 | | | | B | | | | 369,240 | |
| | 8,275 | | | Total Pharmaceuticals | | | | | | | | | | | | | | | | | | | | | | | 8,410,485 | |
| | | | |
| | | | Road & Rail – 0.5% (0.3% of Total Investments) | | | | | | | | | | |
| | | | | | | |
| | 5,000 | | | DAE Funding LLC, 144A, (8) | | | | | | | | | | | 5.250% | | | | 11/15/21 | | | | Baa3 | | | | 5,045,750 | |
| | | | |
| | | | Software – 0.2% (0.1% of Total Investments) | | | | | | | | | | |
| | | | | | | |
| | 1,500 | | | SS&C Technologies Inc, 144A, (8) | | | | | | | | | | | 5.500% | | | | 9/30/27 | | | | B+ | | | | 1,587,525 | |
| | | | |
| | | | Specialty Retail – 0.3% (0.2% of Total Investments) | | | | | | | | | | |
| | | | | | | |
| | 1,140 | | | Party City Holdings Inc, 144A, (8) | | | | | | | | | | | 8.750% | | | | 2/15/26 | | | | CCC+ | | | | 1,206,941 | |
| | 675 | | | PetSmart Inc / PetSmart Finance Corp, 144A, (8) | | | | | | | | | | | 7.750% | | | | 2/15/29 | | | | CCC+ | | | | 739,982 | |
| | 545 | | | Staples Inc, 144A, (8) | | | | | | | | | | | 7.500% | | | | 4/15/26 | | | | B | | | | 553,175 | |
| | 2,360 | | | Total Specialty Retail | | | | | | | | | | | | | | | | | | | | | | | 2,500,098 | |
| | | | |
| | | | Trading Companies & Distributors – 1.0% (0.6% of Total Investments) | | | | | | | | | | |
| | | | | | | |
| | 3,000 | | | Air Lease Corp, (8) | | | | | | | | | | | 2.300% | | | | 2/01/25 | | | | BBB | | | | 3,117,916 | |
| | 6,000 | | | Air Lease Corp, (8) | | | | | | | | | | | 3.000% | | | | 2/01/30 | | | | BBB | | | | 6,200,799 | |
| | 9,000 | | | Total Trading Companies & Distributors | | | | | | | | | | | | | | | | | | | | 9,318,715 | |
| | | | |
| | | | Wireless Telecommunication Services – 0.5% (0.3% of Total Investments) | | | | | | | | | | |
| | | | | | | |
| | 4,000 | | | Hughes Satellite Systems Corp, (8) | | | | | | | | | | | 5.250% | | | | 8/01/26 | | | | BBB– | | | | 4,470,000 | |
| $ | 180,940 | | | Total Corporate Bonds (cost $173,163,550) | | | | | | | | | | | | | | | | | | | | 180,796,313 | |
90
| | | | | | | | | | | | | | | | | | | | | | | | | | | | |
| Shares | | | Description (1) | | | | | | | | | | | | | | | | | Value | |
| | | | |
| | | | COMMON STOCKS – 1.1% (0.7% of Total Investments) | | | | | | | | | | | | | |
| | | | |
| | | | Diversified Consumer Services – 0.1% (0.1% of Total Investments) | | | | | | | | | | |
| | | | | | | |
| | 41,905 | | | Cengage Learning Holdings II Inc, (9), (10) | | | | | | | | | | | | | | | | | | | | | | $ | 893,121 | |
| | | | |
| | | | Electric Utilities – 0.3% (0.2% of Total Investments) | | | | | | | | | | |
| | | | | | | |
| | 80,962 | | | Energy Harbor Corp, (9), (10), (11) | | | | | | | | | | | | | | | | | | | | | | | 2,803,309 | |
| | | | |
| | | | Energy Equipment & Services – 0.0% (0.0% of Total Investments) | | | | | | | | | | |
| | | | | | | |
| | 31,358 | | | Vantage Drilling International, (9), (10) | | | | | | | | | | | | | | | | | | | | | | | 117,593 | |
| | | | |
| | | | Health Care Providers & Services – 0.0% (0.0% of Total Investments) | | | | | | | | | | |
| | | | | | | |
| | 211,860 | | | Millennium Health LLC, (7), (10) | | | | | | | | | | | | | | | | | | | | | | | 220,335 | |
| | 198,883 | | | Millennium Health LLC, (7), (10) | | | | | | | | | | | | | | | | | | | | | | | 186,950 | |
| | | | Total Health Care Providers & Services | | | | | | | | | | | | | | | | | | | | 407,285 | |
| | | | |
| | | | Internet & Direct Marketing Retail – 0.0% (0.0% of Total Investments) | | | | | | | | | | |
| | | | | | | |
| | 9,796 | | | Catalina Marketing Corp, (9), (10) | | | | | | | | | | | | | | | | | | | | | | | 29,388 | |
| | | | |
| | | | Media – 0.1% (0.0% of Total Investments) | | | | | | | | | | |
| | | | | | | |
| | 224,754 | | | Clear Channel Outdoor Holdings Inc, (10) | | | | | | | | | | | | | | | | | | | | | | | 597,846 | |
| | 8 | | | Cumulus Media Inc, (10) | | | | | | | | | | | | | | | | | | | | | | | 94 | |
| | 17,987 | | | Tribune Co, (7), (10) | | | | | | | | | | | | | | | | | | | | | | | 18 | |
| | | | Total Media | | | | | | | | | | | | | | | | | | | | | | | 597,958 | |
| | | | |
| | | | Multiline Retail – 0.0% (0.0% of Total Investments) | | | | | | | | | | |
| | | | | | | |
| | 196 | | | Belk Inc, (9), (10) | | | | | | | | | | | | | | | | | | | | | | | 4,704 | |
| | | | |
| | | | Oil, Gas & Consumable Fuels – 0.5% (0.3% of Total Investments) | | | | | | | | | | |
| | | | | | | |
| | 99,641 | | | California Resources Corp, (10) | | | | | | | | | | | | | | | | | | | | | | | 2,800,909 | |
| | 64,647 | | | California Resources Corp, (10) | | | | | | | | | | | | | | | | | | | | | | | 1,817,227 | |
| | | | Total Oil, Gas & Consumable Fuels | | | | | | | | | | | | | | | | | | | | | | | 4,618,136 | |
| | | | |
| | | | Professional Services – 0.1% (0.1% of Total Investments) | | | | | | | | | | |
| | | | | | | |
| | 164,472 | | | Skillsoft Corp, (7), (10) | | | | | | | | | | | | | | | | | | | | | | | 1,170,560 | |
| | | | Total Common Stocks (cost $20,209,956) | | | | | | | | | | | | | | | | | | | | 10,642,054 | |
| | | | | | | |
Principal
Amount (000) | | | Description (1) | | | | | | | | Coupon | | | Maturity | | | Ratings (4) | | | Value | |
| | | | |
| | | | CONVERTIBLE BONDS – 0.2% (0.1% of Total Investments) | | | | | | | | | | | | | |
| | | | |
| | | | Media – 0.2% (0.1% of Total Investments) | | | | | | | | | | |
| | | | | | | |
| $ | 2,000 | | | DISH Network Corp, (8) | | | �� | | | | | | | | 3.375% | | | | 8/15/26 | | | | B1 | | | $ | 2,050,000 | |
| $ | 2,000 | | | Total Convertible Bonds (cost $2,058,069) | | | | | | | | | | | | | | | | | | | | 2,050,000 | |
| | | | | | | |
| Shares | | | Description (1) | | | | | | | | | | | | | | | | | Value | |
| | | | |
| | | | WARRANTS – 0.1% (0.0% of Total Investments) | | | | | | | | | | | | | |
| | | | |
| | | | Communications Equipment – 0.1% (0.0% of Total Investments) | | | | | | | | | | |
| | | | | | | |
| | 37,723 | | | Avaya Holdings Corp, (9) | | | | | | | | | | | | | | | | | | | | | | $ | 242,936 | |
| | | | |
| | | | Media – 0.0% (0.0% of Total Investments) | | | | | | | | | | |
| | | | | | | |
| | 4,644 | | | Affinion Group Holdings Inc, (7) | | | | | | | | | | | | | | | | | | | | | | | 5 | |
| | | | |
| | | | Oil, Gas & Consumable Fuels – 0.0% (0.0% of Total Investments) | | | | | | | | | | |
| | | | |
| | 629 | | | California Resources Corp | | | | | | | | | | | | 3,415 | |
| | | | |
| | | | Entertainment – 0.0% (0.0% of Total Investments) | | | | | | | | | | |
| | 266,347 | | | Cineworld Warrant, (9) | | | | | | | | | | | | | | | | | | | | | | | 104,408 | |
| | | | Total Warrants (cost $6,030,510) | | | | | | | | | | | | | | | | | | | | | | | 350,764 | |
91
| | |
| |
| JQC | | Nuveen Credit Strategies Income Fund (continued) |
| | Portfolio of Investments July 31, 2021 |
| | | | | | | | | | | | | | | | | | | | | | | | | | | | |
| Shares | | | Description (1) | | | | | | | | | | | | | | | | | Value | |
| | | | |
| | | | COMMON STOCK RIGHTS – 0.0% (0.0% of Total Investments) | | | | | | | | | | | | | |
| | | | |
| | | | Oil, Gas & Consumable Fuels – 0.0% (0.0% of Total Investments) | | | | | | | | | | |
| | | | | | | |
| | 45,924 | | | Fieldwood Energy Inc, (9), (10) | | | | | | | | | | | | | | | | | | | | | | $ | 46 | |
| | 9,278 | | | Fieldwood Energy Inc, (9), (10) | | | | | | | | | | | | | | | | | | | | | | | 9 | |
| | | | Total Oil, Gas & Consumable Fuels | | | | | | | | | | | | | | | | | | | | | | | 55 | |
| | | | Total Common Stock Rights (cost $1,310,866) | | | | | | | | | | | | | | | | | | | | 55 | |
| | | | Total Long-Term Investments (cost $1,529,346,232) | | | | | | | | | | | | | | | | | | | | 1,506,476,032 | |
| | | | | | | |
| Shares | | | Description (1) | | | | | | | | Coupon | | | | | | | | | Value | |
| | | | |
| | | | SHORT-TERM INVESTMENTS – 1.4% (0.9% of Total Investments) | | | | | | | | | | | | | |
| | | | |
| | | | INVESTMENT COMPANIES – 1.4% (0.9% of Total Investments) | | | | | | | | | | |
| | | | | | | |
| | 13,396,077 | | | BlackRock Liquidity Funds T-Fund Portfolio | | | | | | | | | | | 0.005% | (12) | | | | | | | | | | $ | 13,396,077 | |
| | | | Total Short-Term Investments (cost $13,396,077) | | | | | | | | | | | | | | | | 13,396,077 | |
| | | | Total Investments (cost $1,542,742,309) – 162.1% | | | | | | | | | | | | | | | | 1,519,872,109 | |
| | | | Borrowings – (42.9)% (13), (14) | | | | | | | | | | | | | | | | | | | | | | | (402,000,000 | ) |
| | | | Reverse Repurchase Agreements, including accrued interest – (15.2)% (15) | | | | | | | | | | | | | | | | (142,119,265 | ) |
| | | | Other Assets Less Liabilities – (4.0)% | | | | | | | | | | | | | | | | | | | | (38,041,023 | ) |
| | | | Net Assets Applicable to Common Shares – 100% | | | | | | | | | | | | | | | $ | 937,711,821 | |
92
For Fund portfolio compliance purposes, the Fund’s industry classifications refer to any one or more of the industry sub-classifications used by one or more widely recognized market indexes or ratings group indexes, and/or as defined by Fund management. This definition may not apply for purposes of this report, which may combine industry sub-classifications into sectors for reporting ease.
| (1) | All percentages shown in the Portfolio of Investments are based on net assets applicable to common shares unless otherwise noted. |
| (2) | Senior loans generally pay interest at rates which are periodically adjusted by reference to a base short-term, floating lending rate (Reference Rate) plus an assigned fixed rate (Spread). These floating lending rates are generally (i) the lending rate referenced by the London Inter-Bank Offered Rate (“LIBOR”), or (ii) the prime rate offered by one or more major United States banks. Senior loans may be considered restricted in that the Fund ordinarily is contractually obligated to receive approval from the agent bank and/or borrower prior to the disposition of a senior loan. The rate shown is the coupon as of the end of the reporting period. |
| (3) | Senior Loans generally are subject to mandatory and/or optional prepayment. Because of these mandatory prepayment conditions and because there may be significant economic incentives for a borrower to prepay, prepayments of senior loans may occur. As a result, the actual remaining maturity of senior loans held may be substantially less than the stated maturities shown. |
| (4) | For financial reporting purposes, the ratings disclosed are the highest of Standard & Poor’s Group (“Standard & Poor’s”), Moody’s Investors Service, Inc. (“Moody’s”) or Fitch, Inc. (“Fitch”) rating. This treatment of split-rated securities may differ from that used for other purposes, such as for Fund investment policies. Ratings below BBB by Standard & Poor’s, Baa by Moody’s or BBB by Fitch are considered to be below investment grade. Holdings designated N/R are not rated by any of these national rating agencies. Ratings are not covered by the report of independent registered public accounting firm. |
| (5) | Investment, or portion of investment, represents an outstanding unfunded senior loan commitment. |
| (6) | Defaulted security. A security whose issuer has failed to fully pay principal and/or interest when due, or is under the protection of bankruptcy. |
| (7) | Investment valued at fair value using methods determined in good faith by, or at the discretion of, the Board. For fair value measurement disclosure purposes, investment classified as Level 3. |
| (8) | Investment, or portion of investment, has been pledged to collateralize the net payment obligations for investments in reverse repurchase agreements. As of the end of the reporting period, investments with a value of $159,252,969 have been pledged as collateral for reverse repurchase agreements. |
| (9) | For fair value measurement disclosure purposes, investment classified as Level 2. |
| (10) | Non-income producing; issuer has not declared an ex-dividend date within the past twelve months. |
| (11) | Common Stock received as part of the bankruptcy settlements during February 2020 for Bruce Mansfield Unit 1 2007 Pass-Through Trust. |
| (12) | The rate shown is the annualized seven-day subsidized yield as of end of the reporting period. |
| (13) | Borrowings as a percentage of Total Investments is 26.4%. |
| (14) | The Fund segregates 100% of its eligible investments (excluding any investments separately pledged as collateral for specific investments in derivatives, when applicable) in the Portfolio of Investments as collateral for borrowings. |
| (15) | Reverse Repurchase Agreements, including accrued interest as a percentage of Total Investments is 9.4%. |
| 144A | Investment is exempt from registration under Rule 144A of the Securities Act of 1933, as amended. These investments may only be resold in transactions exempt from registration, which are normally those transactions with qualified institutional buyers. |
| DD1 | Portion of investment purchased on a delayed delivery basis. |
| LIBOR | London Inter-Bank Offered Rate |
| PIK | Payment-in-kind (“PIK”) security. Depending on the terms of the security, income may be received in the form of cash, securities, or a combination of both. The PIK rate shown, where applicable, represents the annualized rate of the last PIK payment made by the issuer as of the end of the reporting period. |
| REIT | Real Estate Investment Trust |
| TBD | Senior loan purchased on a when-issued or delayed-delivery basis. Certain details associated with this purchase are not known prior to the settlement date of the transaction. In addition, senior loans typically trade without accrued interest and therefore a coupon rate is not available prior to settlement. At settlement, if still unknown, the borrower or counterparty will provide the Fund with the final coupon rate and maturity date. |
| WI/DD | Purchased on a when-issued or delayed delivery basis. |
See accompanying notes to financial statements.
93
Statement of Assets and Liabilities
July 31, 2021
| | | | | | | | | | | | | | | | | | | | |
| | | NSL | | | JFR | | | JRO | | | JSD | | | JQC | |
Assets | | | | | | | | | | | | | | | | | | | | |
Long-term investments, at value (cost $371,139,865, $935,501,485, | | | | | | | | | | | | | | | | | | | | |
$656,730,468, $247,664,846 and $1,529,346,232, respectively) | | $ | 361,811,063 | | | $ | 915,627,519 | | | $ | 642,817,719 | | | $ | 241,378,680 | | | $ | 1,506,476,032 | |
Short-term investments, at value (cost approximates value) | | | 10,416,772 | | | | 40,257,885 | | | | 26,360,204 | | | | 10,699,368 | | | | 13,396,077 | |
Cash | | | 719,768 | | | | 787,135 | | | | 1,132,926 | | | | 173,978 | | | | 3,790,409 | |
Receivable for: | | | | | | | | | | | | | | | | | | | | |
Interest | | | 2,225,569 | | | | 4,805,237 | | | | 3,796,542 | | | | 1,378,189 | | | | 8,461,390 | |
Investments sold | | | 19,509,845 | | | | 33,937,084 | | | | 31,829,398 | | | | 8,991,691 | | | | 49,117,152 | |
Reclaims | | | — | | | | — | | | | — | | | | — | | | | 16,645 | |
Other assets | | | 116,489 | | | | 331,333 | | | | 137,471 | | | | 87,268 | | | | 535,902 | |
Total assets | | | 394,799,506 | | | | 995,746,193 | | | | 706,074,260 | | | | 262,709,174 | | | | 1,581,793,607 | |
Liabilities | | | | | | | | | | | | | | | | | | | | |
Borrowings | | | 94,300,000 | | | | 238,400,000 | | | | 164,500,000 | | | | 19,500,000 | | | | 402,000,000 | |
Reverse repurchase agreements, including accrued interest | | | — | | | | — | | | | — | | | | — | | | | 142,119,265 | |
Cash overdraft denominated in foreign currencies (cost $—, $—, $—, $55 and $174, respectively) | | | — | | | | — | | | | — | | | | 53 | | | | 186 | |
Payable for: | | | | | | | | | | | | | | | | | | | | |
Dividends | | | 1,285,257 | | | | 3,281,018 | | | | 2,303,433 | | | | 838,442 | | | | 6,771,546 | |
Investments purchased – regular settlement | | | 833,223 | | | | 2,165,887 | | | | 1,385,216 | | | | 567,509 | | | | 8,801,411 | |
Investments purchased – when-issued/delayed-delivery settlement | | | 21,298,555 | | | | 59,465,241 | | | | 42,908,650 | | | | 14,849,768 | | | | 79,960,056 | |
Unfunded senior loans | | | 1,696,924 | | | | 2,074,558 | | | | 3,109,780 | | | | 549,012 | | | | 1,841,762 | |
Taxable Fund Preferred (“TFP”) Shares, net of deferred offering costs (liquidation preference $40,000,000, $100,000,000, $75,000,000, $70,000,000 and $—, respectively) | | | 39,568,793 | | | | 99,311,385 | | | | 74,674,414 | | | | 69,580,756 | | | | — | |
Accrued expenses: | | | | | | | | | | | | | | | | | | | | |
Interest | | | 75,280 | | | | 186,176 | | | | 127,620 | | | | 15,397 | | | | 431,324 | |
Management fees | | | 253,023 | | | | 626,265 | | | | 445,656 | | | | 168,478 | | | | 1,021,879 | |
Trustees fees | | | 112,433 | | | | 211,333 | | | | 134,108 | | | | 25,228 | | | | 542,082 | |
Other | | | 161,948 | | | | 555,310 | | | | 182,955 | | | | 122,485 | | | | 592,275 | |
Total liabilities | | | 159,585,436 | | | | 406,277,173 | | | | 289,771,832 | | | | 106,217,128 | | | | 644,081,786 | |
Commitments and contingencies (as disclosed in Note 8) | | | | | | | | | | | | | | | | | | | | |
Net assets applicable to common shares | | $ | 235,214,070 | | | $ | 589,469,020 | | | $ | 416,302,428 | | | $ | 156,492,046 | | | $ | 937,711,821 | |
Common shares outstanding | | | 38,611,472 | | | | 56,918,468 | | | | 40,541,218 | | | | 10,085,648 | | | | 135,609,290 | |
Net asset value (“NAV”) per common share outstanding | | $ | 6.09 | | | $ | 10.36 | | | $ | 10.27 | | | $ | 15.52 | | | $ | 6.91 | |
Net assets applicable to common shares consist of: | | | | | | | | | | | | | | | | | | | | |
Common shares, $0.01 par value per share | | $ | 386,115 | | | $ | 569,185 | | | $ | 405,412 | | | $ | 100,856 | | | $ | 1,356,093 | |
Paid-in-surplus | | | 286,877,671 | | | | 707,413,061 | | | | 502,096,361 | | | | 191,046,401 | | | | 1,168,703,452 | |
Total distributable earnings | | | (52,049,716 | ) | | | (118,513,226 | ) | | | (86,199,345 | ) | | | (34,655,211 | ) | | | (232,347,724 | ) |
Net assets applicable to common shares | | $ | 235,214,070 | | | $ | 589,469,020 | | | $ | 416,302,428 | | | $ | 156,492,046 | | | $ | 937,711,821 | |
Authorized shares: | | | | | | | | | | | | | | | | | | | | |
Common | | | Unlimited | | | | Unlimited | | | | Unlimited | | | | Unlimited | | | | Unlimited | |
Preferred | | | Unlimited | | | | Unlimited | | | | Unlimited | | | | Unlimited | | | | Unlimited | |
See accompanying notes to financial statements.
94
Statement of Operations
Year Ended July 31, 2021
| | | | | | | | | | | | | | | | | | | | |
| | | NSL | | | JFR | | | JRO | | | JSD | | | JQC | |
Investment Income | | | | | | | | | | | | | | | | | | | | |
Interest and dividends | | $ | 16,633,380 | | | $ | 41,027,697 | | | $ | 28,990,167 | | | $ | 11,062,515 | | | $ | 63,106,364 | |
Fees | | | 899,647 | | | | 2,380,404 | | | | 1,533,878 | | | | 613,260 | | | | 1,793,853 | |
Total investment income | | | 17,533,027 | | | | 43,408,101 | | | | 30,524,045 | | | | 11,675,775 | | | | 64,900,217 | |
Expenses | | | | | | | | | | | | | | | | | | | | |
Management fees | | | 2,860,785 | | | | 7,085,497 | | | | 5,036,593 | | | | 1,898,227 | | | | 12,003,274 | |
Interest expense and amortization of offering costs | | | 1,672,353 | | | | 4,035,488 | | | | 3,197,193 | | | | 392,589 | | | | 7,613,853 | |
Liquidity fees | | | — | | | | 577,150 | | | | — | | | | 599,968 | | | | — | |
Remarketing fees | | | — | | | | 66,667 | | | | — | | | | 70,971 | | | | — | |
Custodian fees | | | 130,253 | | | | 250,756 | | | | 199,093 | | | | 101,105 | | | | 347,552 | |
Trustees fees | | | 9,629 | | | | 24,446 | | | | 17,334 | | | | 6,592 | | | | 39,909 | |
Professional fees | | | 231,380 | | | | 357,332 | | | | 216,335 | | | | 435,642 | | | | 505,654 | |
Shareholder reporting expenses | | | 42,378 | | | | 68,275 | | | | 53,932 | | | | 23,487 | | | | 132,842 | |
Shareholder servicing agent fees | | | 13,179 | | | | 16,161 | | | | 6,573 | | | | 583 | | | | 9,532 | |
Stock exchange listing fees | | | 10,491 | | | | 15,465 | | | | 11,015 | | | | 6,627 | | | | 36,845 | |
Investor relations expenses | | | 22,130 | | | | 48,396 | | | | 34,611 | | | | 10,817 | | | | 317,846 | |
Other | | | 29,054 | | | | 43,918 | | | | 41,867 | | | | 42,218 | | | | 10,136 | |
Total expenses | | | 5,021,632 | | | | 12,589,551 | | | | 8,814,546 | | | | 3,588,826 | | | | 21,017,443 | |
Net investment income (loss) | | | 12,511,395 | | | | 30,818,550 | | | | 21,709,499 | | | | 8,086,949 | | | | 43,882,774 | |
Realized and Unrealized Gain (Loss) | | | | | | | | | | | | | | | | | | | | |
Net realized gain (loss) from: | | | | | | | | | | | | | | | | | | | | |
Investments and foreign currency | | | (6,289,690 | ) | | | (13,015,328 | ) | | | (9,129,575 | ) | | | (4,645,577 | ) | | | (6,889,132 | ) |
Swaps | | | — | | | | 700,593 | | | | 573,213 | | | | — | | | | — | |
Change in net unrealized appreciation (depreciation) of: | | | | | | | | | | | | | | | | | | | | |
Investments and foreign currency | | | 30,109,941 | | | | 72,362,728 | | | | 51,259,397 | | | | 21,559,851 | | | | 83,403,124 | |
Swaps | | | — | | | | (712,604 | ) | | | (583,039 | ) | | | — | | | | — | |
Net realized and unrealized gain (loss) | | | 23,820,251 | | | | 59,335,389 | | | | 42,119,996 | | | | 16,914,274 | | | | 76,513,992 | |
Net increase (decrease) in net assets applicable to common shares from operations | | $ | 36,331,646 | | | $ | 90,153,939 | | | $ | 63,829,495 | | | $ | 25,001,223 | | | $ | 120,396,766 | |
See accompanying notes to financial statements.
95
Statement of Changes in Net Assets
| | | | | | | | | | | | | | | | |
| | | NSL | | | JFR | |
| | | Year
Ended
7/31/21 | | | Year Ended 7/31/20 | | | Year
Ended
7/31/21 | | | Year Ended 7/31/20 | |
Operations | | | | | | | | | | | | | | | | |
Net investment income (loss) | | $ | 12,511,395 | | | $ | 14,589,478 | | | $ | 30,818,550 | | | $ | 34,105,508 | |
Net realized gain (loss) from: | | | | | | | | | | | | | | | | |
Investments and foreign currency | | | (6,289,690 | ) | | | (14,776,047 | ) | | | (13,015,328 | ) | | | (30,265,712 | ) |
Swaps | | | — | | | | (147,276 | ) | | | 700,593 | | | | 667,402 | |
Change in net unrealized appreciation (depreciation) of: | | | | | | | | | | | | | | | | |
Investments and foreign currency | | | 30,109,941 | | | | (24,259,777 | ) | | | 72,362,728 | | | | (58,340,272 | ) |
Swaps | | | — | | | | 167,345 | | | | (712,604 | ) | | | 204,383 | |
Net increase (decrease) in net assets applicable to common shares from operations | | | 36,331,646 | | | | (24,426,277 | ) | | | 90,153,939 | | | | (53,628,691 | ) |
Distributions to Common Shareholders | | | | | | | | | | | | | | | | |
Dividends | | | (14,807,499 | ) | | | (16,371,264 | ) | | | (35,545,583 | ) | | | (39,729,091 | ) |
Return of Capital | | | — | | | | — | | | | — | | | | — | |
Decrease in net assets applicable to common shares from distributions to common shareholders | | | (14,807,499 | ) | | | (16,371,264 | ) | | | (35,545,583 | ) | | | (39,729,091 | ) |
Capital Share Transactions | | | | | | | | | | | | | | | | |
Cost of shares repurchased and retired | | | — | | | | — | | | | — | | | | — | |
Net increase (decrease) in net assets applicable to common shares from capital share transactions | | | — | | | | — | | | | — | | | | — | |
Net increase (decrease) in net assets applicable to common shares | | | 21,524,147 | | | | (40,797,541 | ) | | | 54,608,356 | | | | (93,357,782 | ) |
Net assets applicable to common shares at the beginning of period | | | 213,689,923 | | | | 254,487,464 | | | | 534,860,664 | | | | 628,218,446 | |
Net assets applicable to common shares at the end of period | | $ | 235,214,070 | | | $ | 213,689,923 | | | $ | 589,469,020 | | | $ | 534,860,664 | |
See accompanying notes to financial statements.
96
| | | | | | | | | | | | | | | | |
| | | JRO | | | JSD | |
| | | Year
Ended
7/31/21 | | | Year Ended 7/31/20 | | | Year
Ended
7/31/21 | | | Year Ended 7/31/20 | |
Operations | | | | | | | | | | | | | | | | |
Net investment income (loss) | | $ | 21,709,499 | | | $ | 23,800,246 | | | $ | 8,086,949 | | | $ | 9,670,738 | |
Net realized gain (loss) from: | | | | | | | | | | | | | | | | |
Investments and foreign currency | | | (9,129,575 | ) | | | (21,104,143 | ) | | | (4,645,577 | ) | | | (9,233,945 | ) |
Swaps | | | 573,213 | | | | 456,353 | | | | — | | | | 521,533 | |
Change in net unrealized appreciation (depreciation) of: | | | | | | | | | | | | | | | | |
Investments and foreign currency | | | 51,259,397 | | | | (41,818,574 | ) | | | 21,559,851 | | | | (19,565,254 | ) |
Swaps | | | (583,039 | ) | | | 264,075 | | | | — | | | | 69,441 | |
Net increase (decrease) in net assets applicable to common shares from operations | | | 63,829,495 | | | | (38,402,043 | ) | | | 25,001,223 | | | | (18,537,487 | ) |
Distributions to Common Shareholders | | | | | | | | | | | | | | | | |
Dividends | | | (24,932,849 | ) | | | (27,892,358 | ) | | | (9,490,595 | ) | | | (10,852,822 | ) |
Return of Capital | | | — | | | | — | | | | — | | | | — | |
Decrease in net assets applicable to common shares from distributions to common shareholders | | | (24,932,849 | ) | | | (27,892,358 | ) | | | (9,490,595 | ) | | | (10,852,822 | ) |
Capital Share Transactions | | | | | | | | | | | | | | | | |
Cost of shares repurchased and retired | | | — | | | | — | | | | — | | | | (115,771 | ) |
Net increase (decrease) in net assets applicable to common shares from capital share transactions | | | — | | | | — | | | | — | | | | (115,771 | ) |
Net increase (decrease) in net assets applicable to common shares | | | 38,896,646 | | | | (66,294,401 | ) | | | 15,510,628 | | | | (29,506,080 | ) |
Net assets applicable to common shares at the beginning of period | | | 377,405,782 | | | | 443,700,183 | | | | 140,981,418 | | | | 170,487,498 | |
Net assets applicable to common shares at the end of period | | $ | 416,302,428 | | | $ | 377,405,782 | | | $ | 156,492,046 | | | $ | 140,981,418 | |
See accompanying notes to financial statements.
97
Statement of Changes in Net Assets (continued)
| | | | | | | | |
| | | JQC | |
| | | Year
Ended
7/31/21 | | | Year Ended 7/31/20 | |
Operations | | | | | | | | |
Net investment income (loss) | | $ | 43,882,774 | | | $ | 52,765,328 | |
Net realized gain (loss) from: | | | | | | | | |
Investments and foreign currency | | | (6,889,132 | ) | | | (48,566,692 | ) |
Swaps | | | — | | | | — | |
Change in net unrealized appreciation (depreciation) of: | | | | | | | | |
Investments and foreign currency | | | 83,403,124 | | | | (69,625,716 | ) |
Swaps | | | — | | | | — | |
Net increase (decrease) in net assets applicable to common shares from operations | | | 120,396,766 | | | | (65,427,080 | ) |
Distributions to Common Shareholders | | | | | | | | |
Dividends | | | (40,633,984 | ) | | | (53,064,705 | ) |
Return of Capital | | | (74,850,888 | ) | | | (100,485,694 | ) |
Decrease in net assets applicable to common shares from distributions to common shareholders | | | (115,484,872 | ) | | | (153,550,399 | ) |
Capital Share Transactions | | | | | | | | |
Cost of shares repurchased and retired | | | — | | | | — | |
Net increase (decrease) in net assets applicable to common shares from capital share transactions | | | — | | | | — | |
Net increase (decrease) in net assets applicable to common shares | | | 4,911,894 | | | | (218,977,479 | ) |
Net assets applicable to common shares at the beginning of period | | | 932,799,927 | | | | 1,151,777,406 | |
Net assets applicable to common shares at the end of period | | $ | 937,711,821 | | | $ | 932,799,927 | |
See accompanying notes to financial statements.
98
Statement of Cash Flows
Year Ended July 31, 2021
| | | | | | | | | | | | | | | | | | | | |
| | | NSL | | | JFR | | | JRO | | | JSD | | | JQC | |
Cash Flows from Operating Activities: | | | | | | | | | | | | | | | | | | | | |
Net Increase (Decrease) in Net Assets Applicable to Common Shares from Operations | | $ | 36,331,646 | | | $ | 90,153,939 | | | $ | 63,829,495 | | | $ | 25,001,223 | | | $ | 120,396,766 | |
Adjustments to reconcile the net increase (decrease) in net assets applicable to common shares from operations to net cash provided by (used in) operating activities: | | | | | | | | | | | | | | | | | | | | |
Purchases of investments | | | (155,755,126 | ) | | | (400,969,335 | ) | | | (275,248,040 | ) | | | (110,174,944 | ) | | | (617,325,245 | ) |
Proceeds from sales and maturities of investments | | | 145,911,463 | | | | 368,849,391 | | | | 249,483,477 | | | | 102,375,907 | | | | 631,484,524 | |
Proceeds from (Purchase of) short-term investments, net | | | 5,015,295 | | | | 4,551,146 | | | | 6,997,868 | | | | (1,639,547 | ) | | | 23,213,559 | |
Payment-in-kind distributions | | | (283,032 | ) | | | (663,349 | ) | | | (548,314 | ) | | | (219,987 | ) | | | (1,118,773 | ) |
Proceeds from litigation settlement | | | 90 | | | | 90 | | | | 90 | | | | 90 | | | | 2,813 | |
Taxes paid | | | (23,399 | ) | | | (54,963 | ) | | | (11,232 | ) | | | (17,852 | ) | | | — | |
Amortization (Accretion) of premiums and discounts, net | | | (2,273,816 | ) | | | (5,450,217 | ) | | | (3,723,295 | ) | | | (1,385,851 | ) | | | (6,125,009 | ) |
Amortization of deferred offering costs | | | 210,329 | | | | 649,276 | | | | 543,176 | | | | 43,708 | | | | — | |
(Increase) Decrease in: | | | | | | | | | | | | | | | | | | | | |
Receivable for interest | | | (752,741 | ) | | | (1,111,044 | ) | | | (1,278,129 | ) | | | (451,557 | ) | | | (788,190 | ) |
Receivable for investments sold | | | (13,286,878 | ) | | | (20,847,501 | ) | | | (17,703,692 | ) | | | (5,165,272 | ) | | | (23,128,674 | ) |
Receivable for reclaims | | | — | | | | — | | | | — | | | | — | | | | 835 | |
Other assets | | | 5,250 | | | | (159,051 | ) | | | (27,960 | ) | | | (11,156 | ) | | | (87,702 | ) |
Increase (Decrease) in: | | | | | | | | | | | | | | | | | | | | |
Payable for investments purchased – regular settlement | | | 815,211 | | | | 2,106,942 | | | | 1,351,048 | | | | 549,788 | | | | 8,792,234 | |
Payable for investments purchased – when-issued/delayed-delivery settlement | | | 4,203,145 | | | | 15,686,579 | | | | 12,324,145 | | | | 4,977,404 | | | | 31,284,229 | |
Payable for unfunded senior loans | | | 916,723 | | | | 244,331 | | | | 1,796,779 | | | | (105,161 | ) | | | 1,841,762 | |
Accrued management fees | | | 28,017 | | | | 69,922 | | | | 50,013 | | | | 20,305 | | | | 30,807 | |
Accrued interest | | | 531 | | | | (11,786 | ) | | | (7,819 | ) | | | 9,435 | | | | (147,989 | ) |
Accrued Trustees fees | | | 20,688 | | | | 39,691 | | | | 25,444 | | | | 4,993 | | | | 99,661 | |
Accrued other expenses | | | 89,506 | | | | 436,298 | | | | 90,662 | | | | 76,698 | | | | 330,508 | |
Net realized (gain) loss from investments and foreign currency | | | 6,289,690 | | | | 13,015,328 | | | | 9,129,575 | | | | 4,645,577 | | | | 6,889,132 | |
Change in net unrealized appreciation (depreciation) of: | | | | | | | | | | | | | | | | | | | | |
Investments and foreign currency | | | (30,109,941 | ) | | | (72,362,728 | ) | | | (51,259,397 | ) | | | (21,559,851 | ) | | | (83,403,124 | ) |
Swaps | | | — | | | | 712,604 | | | | 583,039 | | | | — | | | | — | |
Net cash provided by (used in) operating activities | | | (2,647,349 | ) | | | (5,114,437 | ) | | | (3,603,067 | ) | | | (3,026,050 | ) | | | 92,242,124 | |
Cash Flow from Financing Activities: | | | | | | | | | | | | | | | | | | | | |
Proceeds from borrowings | | | 33,100,000 | | | | 80,300,000 | | | | 44,600,000 | | | | 11,000,000 | | | | 25,000,000 | |
(Repayments of) borrowings | | | (25,000,000 | ) | | | (50,000,000 | ) | | | (45,000,000 | ) | | | — | | | | (25,000,000 | ) |
Proceeds from reverse repurchase agreements | | | — | | | | — | | | | — | | | | — | | | | 25,000,000 | |
Proceeds from TFP Shares issued, at liquidation preference | | | 40,000,000 | | | | 100,000,000 | | | | 75,000,000 | | | | — | | | | — | |
(Payments for) Term Preferred Shares redeemed, at liquidation preference | | | (33,000,000 | ) | | | (90,000,000 | ) | | | (45,000,000 | ) | | | — | | | | — | |
(Payments for) deferred offering costs | | | (465,000 | ) | | | (675,000 | ) | | | (465,000 | ) | | | (120,818 | ) | | | — | |
Increase (Decrease) in cash overdraft denominated in foreign currencies | | | — | | | | — | | | | — | | | | — | | | | 12 | |
Cash distributions paid to common shareholders | | | (14,678,589 | ) | | | (34,869,308 | ) | | | (24,432,674 | ) | | | (9,342,837 | ) | | | (119,496,725 | ) |
Cost of shares repurchased and retired | | | — | | | | — | | | | — | | | | (57,896 | ) | | | — | |
Net cash provided by (used in) financing activities | | | (43,589 | ) | | | 4,755,692 | | | | 4,702,326 | | | | 1,478,449 | | | | (94,496,713 | ) |
Net Increase (Decrease) in Cash | | | (2,690,938 | ) | | | (358,745 | ) | | | 1,099,259 | | | | (1,547,601 | ) | | | (2,254,589 | ) |
Cash at the beginning of period | | | 3,410,706 | | | | 1,145,880 | | | | 33,667 | | | | 1,721,579 | | | | 6,044,998 | |
Cash at the end of period | | $ | 719,768 | | | $ | 787,135 | | | $ | 1,132,926 | | | $ | 173,978 | | | $ | 3,790,409 | |
| | | | | |
| Supplemental Disclosure of Cash Flow Information | | | | | | | | | | | | | | | |
Cash paid for interest (excluding borrowing and amortization of offering costs) | | $ | 1,401,949 | | | $ | 3,151,225 | | | $ | 2,720,928 | | | $ | 319,649 | | | $ | 7,761,842 | |
See accompanying notes to financial statements.
99
Financial Highlights
Selected data for a share outstanding throughout each period:
| | | | | | | | | | | | | | | | | | | | | | | | | | | | | | | | | | | | | | | | | | | | |
| | | | |
| | | | | | Investment Operations | | | Less Distributions to
Common Shareholders | | | Common Share | |
| | | Beginning
Common
Share
NAV | | | Net
Invest
ment
Income
(Loss)(a) | | | Net
Realized/
Unrealized
Gain (Loss) | | | Total | | | From
Net
Investment
Income | | | From
Accumu
lated
Net
Realized
Gains | | | Total | | | Discount
Per
Shares
Repurchased
and Retired | | | Premium
Per
Shares
Sold
through
Shelf
Offering | | | Ending
NAV | | | Ending
Share
Price | |
|
NSL | |
Year Ended 7/31: | |
2021 | | $ | 5.53 | | | $ | 0.32 | | | $ | 0.62 | | | $ | 0.94 | | | $ | (0.38 | ) | | $ | — | | | $ | (0.38 | ) | | $ | — | | | $ | — | | | $ | 6.09 | | | $ | 5.74 | |
2020 | | | 6.59 | | | | 0.38 | | | | (1.02 | ) | | | (0.64 | ) | | | (0.42 | ) | | | — | | | | (0.42 | ) | | | — | | | | — | | | | 5.53 | | | | 4.78 | |
2019 | | | 6.91 | | | | 0.45 | | | | (0.33 | ) | | | 0.12 | | | | (0.44 | ) | | | — | | | | (0.44 | ) | | | — | * | | | — | | | | 6.59 | | | | 5.90 | |
2018 | | | 6.97 | | | | 0.43 | | | | (0.04 | ) | | | 0.39 | | | | (0.45 | ) | | | — | | | | (0.45 | ) | | | — | | | | — | | | | 6.91 | | | | 6.13 | |
2017 | | | 6.76 | | | | 0.46 | | | | 0.21 | | | | 0.67 | | | | (0.46 | ) | | | — | | | | (0.46 | ) | | | — | | | | — | | | | 6.97 | | | | 6.83 | |
|
JFR | |
Year Ended 7/31: | |
2021 | | | 9.40 | | | | 0.54 | | | | 1.04 | | | | 1.58 | | | | (0.62 | ) | | | — | | | | (0.62 | ) | | | — | | | | — | | | | 10.36 | | | | 9.76 | |
2020 | | | 11.04 | | | | 0.60 | | | | (1.54 | ) | | | (0.94 | ) | | | (0.70 | ) | | | — | | | | (0.70 | ) | | | — | | | | — | | | | 9.40 | | | | 8.03 | |
2019 | | | 11.55 | | | | 0.70 | | | | (0.48 | ) | | | 0.22 | | | | (0.73 | ) | | | — | | | | (0.73 | ) | | | — | | | | — | | | | 11.04 | | | | 9.76 | |
2018 | | | 11.76 | | | | 0.66 | | | | (0.10 | ) | | | 0.56 | | | | (0.77 | ) | | | — | | | | (0.77 | ) | | | — | | | | — | * | | | 11.55 | | | | 10.30 | |
2017 | | | 11.36 | | | | 0.73 | | | | 0.46 | | | | 1.19 | | | | (0.79 | ) | | | — | | | | (0.79 | ) | | | — | | | | — | * | | | 11.76 | | | | 11.83 | |
100
| | | | | | | | | | | | | | | | | | | | | | |
| | | | | | | Common Share Supplemental Data/
Ratios Applicable to Common Shares | |
Common Share
Total Returns | | | | | | Ratios to Average Net Assets(c) | | | | |
Based
on
NAV(b) | | | Based
on
Share
Price(b) | | | Ending
Net
Assets
(000) | | | Expenses | | | Net
Investment
Income (Loss) | | | Portfolio
Turnover
Rate(d) | |
| | | | | |
| | | | | | | | | | | | | | | | | | | | | | | |
| | | | | | | | | | | | | | | | | | | | | | |
| | 17.48 | % | | | 28.97 | % | | $ | 235,214 | | | | 2.20 | % | | | 5.49 | % | | | 43 | % |
| | (9.89 | ) | | | (12.19 | ) | | | 213,690 | | | | 3.05 | | | | 6.28 | | | | 43 | |
| | 1.81 | | | | 3.60 | | | | 254,487 | | | | 3.26 | | | | 6.77 | | | | 31 | |
| | 5.91 | | | | (3.78 | ) | | | 266,752 | | | | 2.90 | | | | 6.24 | | | | 29 | |
| | 10.22 | | | | 17.00 | | | | 269,083 | | | | 2.64 | | | | 6.70 | | | | 55 | |
| | | | | |
| | | | | | | | | | | | | | | | | | | | | | | |
| | | | | | | | | | | | | | | | | | | | | | |
| | 17.36 | | | | 30.14 | | | | 589,469 | | | | 2.20 | | | | 5.39 | | | | 43 | |
| | (8.82 | ) | | | (10.98 | ) | | | 534,861 | | | | 3.01 | | | | 5.93 | | | | 44 | |
| | 2.03 | | | | 1.98 | | | | 628,218 | | | | 3.43 | | | | 6.25 | | | | 32 | |
| | 5.01 | | | | (6.64 | ) | | | 657,157 | | | | 2.99 | | | | 5.68 | | | | 29 | |
| | 10.76 | | | | 18.63 | | | | 663,863 | | | | 2.63 | | | | 6.28 | | | | 59 | |
| (a) | Per share Net Investment Income (Loss) is calculated using the average daily shares method. |
| (b) | Total Return Based on Common Share NAV is the combination of changes in common share NAV, reinvested dividend income at NAV and reinvested capital gains distributions at NAV, if any. The last dividend declared in the period, which is typically paid on the first business day of the following month, is assumed to be reinvested at the ending NAV. The actual reinvest price for the last dividend declared in the period may often be based on the Fund’s market price (and not its NAV), and therefore may be different from the price used in the calculation. Total returns are not annualized. |
Total Return Based on Common Share Price is the combination of changes in the market price per common share and the effect of reinvested dividend income and reinvested capital gains distributions, if any, at the average price paid per share at the time of reinvestment. The last dividend declared in the period, which is typically paid on the first business day of the following month, is assumed to be reinvested at the ending market price. The actual reinvestment for the last dividend declared in the period may take place over several days, and in some instances may not be based on the market price, so the actual reinvestment price may be different from the price used in the calculation. Total returns are not annualized.
| | | | |
| (c) | | • | | Net Investment Income (Loss) ratios reflect income earned and expenses incurred on assets attributable to preferred shares (as described in Note 5 – Fund Shares) and/or borrowings (as described in Note 9 – Fund Leverage), where applicable. |
| | • | | Each ratio includes the effect of all interest expense paid and other costs related to preferred shares and/or borrowings, where applicable, as follows: |
| | | | |
Ratios of Interest Expense
to Average Net Assets
Applicable to Common Shares | |
NSL | |
Year Ended 7/31: | |
2021 | | | 0.73 | % |
2020 | | | 1.60 | |
2019 | | | 1.84 | |
2018 | | | 1.46 | |
2017 | | | 1.19 | |
| | | | |
Ratios of Interest Expense
to Average Net Assets
Applicable to Common Shares | |
JFR | |
Year Ended 7/31: | |
2021 | | | 0.82 | % |
2020 | | | 1.64 | |
2019 | | | 2.07 | |
2018 | | | 1.61 | |
2017 | | | 1.24 | |
| (d) | Portfolio Turnover Rate is calculated based on the lesser of long-term purchases or sales (as disclosed in Note 4 – Portfolio Securities and Investments in Derivatives) divided by the average long-term market value during the period. |
| * | Rounds to less than $0.01 per share. |
See accompanying notes to financial statements.
101
Financial Highlights (continued)
Selected data for a share outstanding throughout each period:
| | | | | | | | | | | | | | | | | | | | | | | | | | | | | | | | | | | | | | | | | | | | |
| | | | |
| | | | | | Investment Operations | | | Less Distributions to
Common Shareholders | | | Common Share | |
| | | Beginning
Common
Share
NAV | | | Net
Investment
Income
(Loss)(a) | | | Net
Realized/
Unrealized
Gain (Loss) | | | Total | | | From
Net
Investment
Income | | | From
Accumu
lated
Net
Realized
Gains | | | Total | | | Discount Per
Shares
Repurchased
and Retired | | | Premium
Per
Shares
Sold
through
Shelf
Offering | | | Ending
NAV | | | Ending
Share
Price | |
|
JRO | |
Year Ended 7/31: | | | | | | | | | | | | | | | | | | | | | | | | | | | | | | | | | | | | | | | | | | | | |
2021 | | $ | 9.31 | | | $ | 0.54 | | | $ | 1.04 | | | $ | 1.58 | | | $ | (0.62 | ) | | $ | — | | | $ | (0.62 | ) | | $ | — | | | $ | — | | | $ | 10.27 | | | $ | 9.69 | |
2020 | | | 10.94 | | | | 0.59 | | | | (1.53 | ) | | | (0.94 | ) | | | (0.69 | ) | | | — | | | | (0.69 | ) | | | — | | | | — | | | | 9.31 | | | | 7.97 | |
2019 | | | 11.47 | | | | 0.70 | | | | (0.49 | ) | | | 0.21 | | | | (0.74 | ) | | | — | | | | (0.74 | ) | | | — | * | | | — | | | | 10.94 | | | | 9.70 | |
2018 | | | 11.70 | | | | 0.66 | | | | (0.09 | ) | | | 0.57 | | | | (0.80 | ) | | | — | | | | (0.80 | ) | | | — | | | | — | * | | | 11.47 | | | | 10.23 | |
2017 | | | 11.31 | | | | 0.76 | | | | 0.45 | | | | 1.21 | | | | (0.83 | ) | | | — | | | | (0.83 | ) | | | — | | | | 0.01 | | | | 11.70 | | | | 11.87 | |
|
JSD | |
Year Ended 7/31: | | | | | | | | | | | | | | | | | | | | | | | | | | | | | | | | | | | | | | | | | | | | |
2021 | | | 13.98 | | | | 0.80 | | | | 1.68 | | | | 2.48 | | | | (0.94 | ) | | | — | | | | (0.94 | ) | | | — | | | | — | | | | 15.52 | | | | 14.40 | |
2020 | | | 16.89 | | | | 0.96 | | | | (2.79 | ) | | | (1.83 | ) | | | (1.08 | ) | | | — | | | | (1.08 | ) | | | — | * | | | — | | | | 13.98 | | | | 11.64 | |
2019 | | | 17.92 | | | | 1.19 | | | | (0.98 | ) | | | 0.21 | | | | (1.24 | ) | | | — | | | | (1.24 | ) | | | — | | | | — | | | | 16.89 | | | | 15.36 | |
2018 | | | 18.07 | | | | 1.19 | | | | (0.04 | ) | | | 1.15 | | | | (1.30 | ) | | | — | | | | (1.30 | ) | | | — | | | | — | | | | 17.92 | | | | 16.67 | |
2017 | | | 17.49 | | | | 1.29 | | | | 0.54 | | | | 1.83 | | | | (1.25 | ) | | | — | | | | (1.25 | ) | | | — | | | | — | * | | | 18.07 | | | | 17.75 | |
102
| | | | | | | | | | | | | | | | | | | | | | |
| | | | | | | Common Share Supplemental Data/
Ratios Applicable to Common Shares | |
Common Share
Total Returns | | | | | | Ratios to Average Net Assets(c) | | | | |
| | | | | |
Based
on
NAV(b) | | | Based
on
Share
Price(b) | | | Ending
Net
Assets
(000) | | | Expenses | | | Net
Investment
Income (Loss) | | | Portfolio
Turnover
Rate(d) | |
| | | | | |
| | | | | | | | | | | | | | | | | | | | | | | |
| | | | | | | | | | | | | | | | | | | | | | |
| | 17.42 | % | | | 30.14 | % | | $ | 416,302 | | | | 2.19 | % | | | 5.39 | % | | | 41 | % |
| | (8.91 | ) | | | (11.13 | ) | | | 377,406 | | | | 3.07 | | | | 5.85 | | | | 43 | |
| | 1.94 | | | | 2.19 | | | | 443,700 | | | | 3.31 | | | | 6.37 | | | | 34 | |
| | 5.06 | | | | (7.38 | ) | | | 465,378 | | | | 2.99 | | | | 5.77 | | | | 30 | |
| | 11.06 | | | | 18.92 | | | | 465,161 | | | | 2.68 | | | | 6.57 | | | | 57 | |
| | | | | |
| | | | | | | | | | | | | | | | | | | | | | | |
| | | | | | | | | | | | | | | | | | | | | | |
| | 18.24 | | | | 32.61 | | | | 156,492 | | | | 2.37 | | | | 5.35 | | | | 45 | |
| | (11.19 | ) | | | (17.88 | ) | | | 140,981 | | | | 3.31 | | | | 6.27 | | | | 40 | |
| | 1.30 | | | | (0.30 | ) | | | 170,487 | | | | 3.45 | | | | 6.89 | | | | 33 | |
| | 6.66 | | | | 1.33 | | | | 180,884 | | | | 2.96 | | | | 6.69 | | | | 29 | |
| | 10.68 | | | | 17.91 | | | | 182,468 | | | | 2.52 | | | | 7.18 | | | | 58 | |
| (a) | Per share Net Investment Income (Loss) is calculated using the average daily shares method. |
| (b) | Total Return Based on Common Share NAV is the combination of changes in common share NAV, reinvested dividend income at NAV and reinvested capital gains distributions at NAV, if any. The last dividend declared in the period, which is typically paid on the first business day of the following month, is assumed to be reinvested at the ending NAV. The actual reinvest price for the last dividend declared in the period may often be based on the Fund’s market price (and not its NAV), and therefore may be different from the price used in the calculation. Total returns are not annualized. |
| | Total Return Based on Common Share Price is the combination of changes in the market price per common share and the effect of reinvested dividend income and reinvested capital gains distributions, if any, at the average price paid per share at the time of reinvestment. The last dividend declared in the period, which is typically paid on the first business day of the following month, is assumed to be reinvested at the ending market price. The actual reinvestment for the last dividend declared in the period may take place over several days, and in some instances may not be based on the market price, so the actual reinvestment price may be different from the price used in the calculation. Total returns are not annualized. |
| | | | |
| (c) | | • | | Net Investment Income (Loss) ratios reflect income earned and expenses incurred on assets attributable to preferred shares (as described in Note 5 – Fund Shares) and/or borrowings (as described in Note 9 – Fund Leverage), where applicable. |
| | • | | Each ratio includes the effect of all interest expense paid and other costs related to preferred shares and/or borrowings, where applicable, as follows: |
| | | | |
Ratios of Interest Expense
to Average Net Assets
Applicable to Common Shares | |
JRO | |
Year Ended 7/31: | |
2021 | | | 0.79 | % |
2020 | | | 1.68 | |
2019 | | | 1.94 | |
2018 | | | 1.59 | |
2017 | | | 1.27 | |
| | | | |
Ratios of Interest Expense
to Average Net Assets
Applicable to Common Shares | |
JSD | |
Year Ended 7/31: | |
2021 | | | 0.70 | % |
2020 | | | 1.70 | |
2019 | | | 2.00 | |
2018 | | | 1.44 | |
2017 | | | 1.07 | |
| (d) | Portfolio Turnover Rate is calculated based on the lesser of long-term purchases or sales (as disclosed in Note 4 – Portfolio Securities and Investments in Derivatives) divided by the average long-term market value during the period. |
| * | Rounds to less than $0.01 per share. |
See accompanying notes to financial statements.
103
Financial Highlights (continued)
Selected data for a share outstanding throughout each period:
| | | | | | | | | | | | | | | | | | | | | | | | | | | | | | | | | | | | | | | | | | | | |
| | | | |
| | | | | | Investment Operations | | | Less Distributions to
Common Shareholders | | | Common Share | |
| | | Beginning
Common
Share
NAV | | | Net
Investment
Income
(Loss)(a) | | | Net
Realized/
Unrealized
Gain (Loss) | | | Total | | | From
Net
Investment
Income | | | From
Accumulated
Net
Realized
Gains | | | Return
of
Capital | | | Total | | | Discount
Per
Shares
Repurchased
and Retired | | | Ending
NAV | | | Ending
Share
Price | |
|
JQC | |
Year Ended 7/31: | |
2021 | | $ | 6.88 | | | $ | 0.32 | | | $ | 0.56 | | | $ | 0.88 | | | $ | (0.30 | ) | | $ | — | | | $ | (0.55 | ) | | $ | (0.85 | ) | | $ | — | | | $ | 6.91 | | | $ | 6.53 | |
2020 | | | 8.49 | | | | 0.39 | | | | (0.87 | ) | | | (0.48 | ) | | | (0.39 | ) | | | — | | | | (0.74 | ) | | | (1.13 | ) | | | — | | | | 6.88 | | | | 5.88 | |
2019 | | | 9.11 | | | | 0.46 | | | | (0.17 | ) | | | 0.29 | | | | (0.60 | ) | | | — | | | | (0.31 | ) | | | (0.91 | ) | | | — | * | | | 8.49 | | | | 7.68 | |
2018 | | | 9.32 | | | | 0.44 | | | | (0.12 | ) | | | 0.32 | | | | (0.53 | ) | | | — | | | | — | | | | (0.53 | ) | | | — | | | | 9.11 | | | | 7.89 | |
2017 | | | 9.25 | | | | 0.52 | | | | 0.18 | | | | 0.70 | | | | (0.63 | ) | | | — | | | | — | | | | (0.63 | ) | | | — | | | | 9.32 | | | | 8.69 | |
104
| | | | | | | | | | | | | | | | | | | | | | |
| | | | | | | Common Share Supplemental Data/
Ratios Applicable to Common Shares | |
Common Share
Total Returns | | | | | | Ratios to Average Net Assets(c) | | | | |
Based
on
NAV(b) | | |
Based
on
Share
Price(b) | | | Ending
Net
Assets
(000) | | | Expenses | | | Net
Investment
Income (Loss) | | | Portfolio
Turnover
Rate(d) | |
| | | | | |
| | | | | | | | | | | | | | | | | | | | | | | |
| | | | | | | | | | | | | | | | | | | | | | |
| | 13.42 | % | | | 26.98 | % | | $ | 937,712 | | | | 2.22 | % | | | 4.64 | % | | | 43 | % |
| | (5.91 | ) | | | (9.54 | ) | | | 932,800 | | | | 3.11 | | | | 5.11 | | | | 52 | |
| | 3.43 | | | | 9.33 | | | | 1,151,777 | | | | 3.42 | | | | 5.25 | | | | 59 | |
| | 3.64 | | | | (3.09 | ) | | | 1,237,262 | | | | 3.01 | | | | 4.84 | | | | 45 | |
| | 7.70 | | | | 10.75 | | | | 1,265,447 | | | | 2.57 | | | | 5.59 | | | | 46 | |
| (a) | Per share Net Investment Income (Loss) is calculated using the average daily shares method. |
| (b) | Total Return Based on Common Share NAV is the combination of changes in common share NAV, reinvested dividend income at NAV and reinvested capital gains distributions at NAV, if any. The last dividend declared in the period, which is typically paid on the first business day of the following month, is assumed to be reinvested at the ending NAV. The actual reinvest price for the last dividend declared in the period may often be based on the Fund’s market price (and not its NAV), and therefore may be different from the price used in the calculation. Total returns are not annualized. |
Total Return Based on Common Share Price is the combination of changes in the market price per common share and the effect of reinvested dividend income and reinvested capital gains distributions, if any, at the average price paid per share at the time of reinvestment. The last dividend declared in the period, which is typically paid on the first business day of the following month, is assumed to be reinvested at the ending market price. The actual reinvestment for the last dividend declared in the period may take place over several days, and in some instances may not be based on the market price, so the actual reinvestment price may be different from the price used in the calculation. Total returns are not annualized.
| | | | |
| (c) | | • | | Net Investment Income (Loss) ratios reflect income earned and expenses incurred on assets attributable to reverse repurchase agreements and borrowings (as described in Note 9 – Fund Leverage), where applicable. |
| | • | | Each ratio includes the effect of all interest expense and other costs related to reverse repurchase agreements and borrowings, where applicable, as follows: |
| | | | |
| JQC | | Ratios of Interest Expense
to Average Net Assets
Applicable to Common Shares | |
Year Ended 7/31: | |
2021 | | | 0.80 | % |
2020 | | | 1.72 | |
2019 | | | 2.08 | |
2018 | | | 1.67 | |
2017 | | | 1.23 | |
| (d) | Portfolio Turnover Rate is calculated based on the lesser of long-term purchases or sales (as disclosed in Note 4 – Portfolio Securities and Investments in Derivatives) divided by the average long-term market value during the period. |
| * | Rounds to less than $0.01 per share. |
See accompanying notes to financial statements.
105
Financial Highlights (continued)
Selected data for a share outstanding throughout each period:
| | | | | | | | | | | | | | | | | | | | | | | | | | | | |
| | | Borrowings
at the End of Period | | | TFP Shares
at the End of Period | | | Term Preferred
at the End of Period | | | Borrowings,
TFP Shares, and/or
Term Preferred
at the End of Period | |
| | | Aggregate
Amount
Outstanding
(000) | | | Asset
Coverage
Per $1,000
Share | | | Aggregate
Amount
Outstanding
(000) | | | Asset
Coverage
Per $1,000
Share | | | Aggregate
Amount
Outstanding
(000) | | | Asset
Coverage
Per $1,000
Share | | | Asset
Coverage
Per $1
Liquidation
Preference | |
NSL | | | | | | | | | | | | | | | | | | | | | |
Year Ended 7/31: | | | | | | | | | | | | | | | | | | | | | | | | | | | | |
2021 | | $ | 94,300 | | | $ | 3,918 | | | $ | 40,000 | | | | 2,751 | | | $ | — | | | $ | — | | | $ | 2.75 | |
2020 | | | 86,200 | | | | 3,862 | | | | — | | | | — | | | | 33,000 | | | | 2,793 | | | | 2.79 | |
2019 | | | 114,000 | | | | 3,610 | | | | — | | | | — | | | | 43,000 | | | | 2,621 | | | | 2.62 | |
2018 | | | 114,000 | | | | 3,717 | | | | — | | | | — | | | | 43,000 | | | | 2,699 | | | | 2.70 | |
2017 | | | 114,000 | | | | 3,738 | | | | — | | | | — | | | | 43,000 | | | | 2,714 | | | | 2.71 | |
| | | | | |
JFR | | | | | | | | | | | | | | | | | | | | | |
Year Ended 7/31: | | | | | | | | | | | | | | | | | | | | | | | | | | | | |
2021 | | | 238,400 | | | | 3,892 | | | | 100,000 | | | | 2,742 | | | | — | | | | — | | | | 2.74 | |
2020 | | | 208,100 | | | | 4,003 | | | | — | | | | — | | | | 90,000 | | | | 2,794 | | | | 2.79 | |
2019 | | | 264,500 | | | | 3,810 | | | | — | | | | — | | | | 115,000 | | | | 2,655 | | | | 2.66 | |
2018 | | | 254,300 | | | | 4,077 | | | | — | | | | — | | | | 125,200 | | | | 2,732 | | | | 2.73 | |
2017 | | | 254,300 | | | | 4,103 | | | | — | | | | — | | | | 125,200 | | | | 2,749 | | | | 2.75 | |
| | | | | |
JRO | | | | | | | | | | | | | | | | | | | | | |
Year Ended 7/31: | | | | | | | | | | | | | | | | | | | | | | | | | | | | |
2021 | | | 164,500 | | | | 3,987 | | | | 75,000 | | | | 2,738 | | | | — | | | | — | | | | 2.74 | |
2020 | | | 164,900 | | | | 3,562 | | | | — | | | | — | | | | 45,000 | | | | 2,798 | | | | 2.80 | |
2019 | | | 178,800 | | | | 3,951 | | | | — | | | | — | | | | 84,000 | | | | 2,688 | | | | 2.69 | |
2018 | | | 178,800 | | | | 4,073 | | | | — | | | | — | | | | 84,000 | | | | 2,771 | | | | 2.77 | |
2017 | | | 178,800 | | | | 4,071 | | | | — | | | | — | | | | 84,000 | | | | 2,770 | | | | 2.77 | |
| | | | | |
JSD | | | | | | | | | | | | | | | | | | | | | |
Year Ended 7/31: | | | | | | | | | | | | | | | | | | | | | | | | | | | | |
2021 | | | 19,500 | | | | 12,615 | | | | 70,000 | | | | 2,749 | | | | — | | | | — | | | | 2.75 | |
2020 | | | 8,500 | | | | 25,821 | | | | 70,000 | | | | 2,796 | | | | — | | | | — | | | | 2.80 | |
2019 | | | 72,000 | | | | 3,854 | | | | — | | | | — | | | | 35,000 | | | | 2,593 | | | | 2.59 | |
2018 | | | 72,000 | | | | 3,998 | | | | — | | | | — | | | | 35,000 | | | | 2,691 | | | | 2.69 | |
2017 | | | 72,000 | | | | 4,020 | | | | — | | | | — | | | | 35,000 | | | | 2,705 | | | | 2.71 | |
| | | | | |
JQC | | | | | | | | | | | | | | | | | | | | | |
Year Ended 7/31: | | | | | | | | | | | | | | | | | | | | | | | | | | | | |
2021 | | | 402,000 | | | | 3,333 | | | | — | | | | — | | | | — | | | | — | | | | — | |
2020 | | | 402,000 | | | | 3,320 | | | | — | | | | — | | | | — | | | | — | | | | — | |
2019 | | | 480,000 | | | | 3,400 | | | | — | | | | — | | | | — | | | | — | | | | — | |
2018 | | | 561,000 | | | | 3,205 | | | | — | | | | — | | | | — | | | | — | | | | — | |
2017 | | | 561,000 | | | | 3,256 | | | | — | | | | — | | | | — | | | | — | | | | — | |
106
Notes to Financial Statements
1. General Information
Fund Information
The funds covered in this report and their corresponding New York Stock Exchange (“NYSE”) symbols are as follows (each a “Fund” and collectively, the “Funds”):
| | • | | Nuveen Senior Income Fund (NSL) |
| | • | | Nuveen Floating Rate Income Fund (JFR) |
| | • | | Nuveen Floating Rate Income Opportunity Fund (JRO) |
| | • | | Nuveen Short Duration Credit Opportunities Fund (JSD) |
| | • | | Nuveen Credit Strategies Income Fund (JQC) |
The Funds are registered under the Investment Company Act of 1940 (the “1940 Act”), as amended, as diversified closed-end management investment companies. NSL, JFR, JRO, JSD and JQC were organized as Massachusetts business trusts on August 13, 1999, January 15, 2004, April 27, 2004, January 3, 2011 and May 17, 2003, respectively.
The end of the reporting period for the Funds is July 31, 2021, and the period covered by these Notes to Financial Statements is the fiscal year ended July 31, 2021 (the “current fiscal period”).
Investment Adviser and Sub-Adviser
The Funds’ investment adviser is Nuveen Fund Advisors, LLC (the “Adviser”), a subsidiary of Nuveen, LLC (“Nuveen”). Nuveen is the investment management arm of Teachers Insurance and Annuity Association of America (TIAA). The Adviser has overall responsibility for management of the Funds, oversees the management of the Funds’ portfolios, manages the Funds’ business affairs and provides certain clerical, bookkeeping and other administrative services, and, if necessary, asset allocation decisions.
Prior to December 31, 2020, the Adviser had entered into a sub-advisory agreement with Symphony Asset Management, LLC (”Symphony”), an affiliate of the Adviser, under which Symphony managed the investment portfolios of the Funds. Effective as of December 31, 2020, Symphony merged into Nuveen Asset Management, LLC (“NAM” and the “Sub-Adviser”), also an affiliate of the Adviser, and assumed management responsibilities for the Funds’ investment portfolios. In connection with the transfer of sub-advisory responsibilities from Symphony to NAM, the Funds entered into an amended and restated sub-advisory agreement with NAM that is substantially identical to the prior sub-advisory agreement with Symphony.
Developments Regarding NSL, JFR, JRO and JSD’s Control Share By-Law
On January 14, 2021, the Funds’ Board of Trustees (the “Board”) received a shareholder demand letter from Saba Capital CEF Opportunities 1, Ltd. and Saba Capital Management, L.P. (collectively, “Saba”) demanding that NSL, JFR, JRO and JSD (i) rescind each Fund’s by-law provisions pursuant to which, in summary, a shareholder who obtains beneficial ownership of common shares in a control share acquisition shall have the same voting rights as other common shareholders only to the extent authorized by the other disinterested shareholders (the “Control Share By-Law”) and (ii) commence judicial action against the Board to ensure that the Control Share By-Law is withdrawn. Also on January 14, 2021, Saba filed a civil complaint in the U.S. District Court for the Southern District of New York against the Funds, certain other Nuveen funds and the Board, seeking a declaration that the Control Share By-Law violates the 1940 Act, rescission of the Control Share By-Law and a permanent injunction against applying the Control Share By-Law. Management has determined that this complaint is unlikely to have an impact to each Fund’s financial statements.
Other Matters
The outbreak of the novel coronavirus (“COVID-19”) and subsequent global pandemic began significantly impacting the U.S. and global financial markets and economies during the calendar quarter ended March 31, 2020. The worldwide spread of COVID-19 has created significant uncertainty in the global economy. The duration and extent of COVID-19 over the long term cannot be reasonably estimated at this time. The ultimate impact of COVID-19 and the extent to which COVID-19 impacts the Funds’ normal course of business, results of operations, investments, and cash flows will depend on future developments, which are highly uncertain and difficult to predict. Management continues to monitor and evaluate this situation.
107
Notes to Financial Statements (continued)
2. Significant Accounting Policies
The accompanying financial statements were prepared in accordance with accounting principles generally accepted in the United States of America (“U.S. GAAP”), which may require the use of estimates made by management and the evaluation of subsequent events. Actual results may differ from those estimates. Each Fund is an investment company and follows the accounting guidance in the Financial Accounting Standards Board (“FASB”) Accounting Standards Codification 946, Financial Services – Investment Companies. The net asset value (“NAV”) for financial reporting purposes may differ from the NAV for processing security and common share transactions. The NAV for financial reporting purposes includes security and common share transactions through the date of the report. Total return is computed based on the NAV used for processing security and common share transactions. The following is a summary of the significant accounting policies consistently followed by the Funds.
Compensation
The Funds pay no compensation directly to those of its trustees who are affiliated with the Adviser or to its officers, all of whom receive remuneration for their services to the Funds from the Adviser or its affiliates. The Board has adopted a deferred compensation plan for independent trustees that enables trustees to elect to defer receipt of all or a portion of the annual compensation they are entitled to receive from certain Nuveen-advised funds. Under the plan, deferred amounts are treated as though equal dollar amounts had been invested in shares of select Nuveen-advised funds.
Distributions to Common Shareholders
Dividends to common shareholders are recorded on the ex-dividend date. The amount, character and timing of distributions are determined in accordance with federal income tax regulations, which may differ from U.S. GAAP.
Effective in conjunction with the declaration of the March 2021 distribution, NSL, JFR, JRO and JSD have implemented a level distribution policy. The level distribution policy is intended to provide shareholders with stable, but not guaranteed, cash flow, independent of the amount or timing of income earned or capital gains realized by the Funds. Each Fund intends to distribute all or substantially all of its net investment income through its regular monthly distribution, and to distribute realized capital gains at least annually. In addition, in any monthly period, in order to maintain its level distribution amount, each Fund may pay out more than its net investment income during the period. As a result, distribution sources may include net investment income, realized gains and return of capital. The amounts and sources of distributions are reported for financial reporting purposes and are not being provided for tax reporting purposes. The actual amounts and character of the distributions for tax reporting purposes will be reported to shareholders on Form 1099-DIV which will be sent to shareholders shortly after calendar year-end. More details about the Fund’s distributions and the basis for these estimates are available on www.nuveen.com/cef.
JQC has implemented a capital return plan where a supplemental amount is expected to be included in the Fund’s regular monthly distribution. Under this program, the Fund’s regular monthly distribution is expected to include net investment income, return of capital and potentially capital gains for tax purposes. In the event that total distributions during a calendar year exceed the Fund’s total return on NAV, the difference will reduce NAV per share. If the Fund’s total return on NAV exceeds total distributions during a calendar year, the excess will be reflected as an increase in NAV per share. The final determination of the source and character of all distributions for the fiscal year are made after the end of the fiscal year and is reflected in the financial statements contained in the annual report as of July 31 each year.
Foreign Currency Transactions and Translation
To the extent that the Funds invest in securities and/or contracts that are denominated in a currency other than U.S. dollars, the Funds will be subject to currency risk, which is the risk that an increase in the U.S. dollar relative to the foreign currency will reduce returns or portfolio value. Generally, when the U.S. dollar rises in value against a foreign currency, the Funds’ investments denominated in that currency will lose value because its currency is worth fewer U.S. dollars; the opposite effect occurs if the U.S. dollar falls in relative value. Investments and other assets and liabilities denominated in foreign currencies are converted into U.S. dollars on a spot (i.e. cash) basis at the spot rate prevailing in the foreign currency exchange market at the time of valuation. Purchases and sales of investments and income denominated in foreign currencies are translated into U.S. dollars on the respective dates of such transactions.
The books and records of the Funds are maintained in U.S. dollars. Assets, including investments, and liabilities denominated in foreign currencies are translated into U.S. dollars at the end of each day. Purchases and sales of securities, income and expenses are translated into U.S. dollars at the prevailing exchange rate on the respective dates of the transactions.
Net realized foreign currency gains and losses resulting from changes in exchange rates associated with (i) foreign currency, (ii) investments and (iii) derivatives include foreign currency gains and losses between trade date and settlement date of the transactions, foreign currency transactions, and the difference between the amounts of interest and dividends recorded on the books of the Fund and the amounts actually received are recognized as a component of “Net realized gain (loss) from investments and foreign currency” on the Statement of Operations, when applicable.
The unrealized gains and losses resulting from changes in foreign currency exchange rates and changes in foreign exchange rates associated with (i) investments and (ii) other assets and liabilities are recognized as a component of “Change in net unrealized appreciation (depreciation) of investments and foreign currency” on the Statement of Operations, when applicable. The unrealized gains and losses resulting from changes in foreign exchange rates
108
associated with investments in derivatives are recognized as a component of the respective derivative’s related “Change in net unrealized appreciation (depreciation)” on the Statement of Operations, when applicable.
Indemnifications
Under the Funds’ organizational documents, their officers and trustees are indemnified against certain liabilities arising out of the performance of their duties to the Funds. In addition, in the normal course of business, the Funds enter into contracts that provide general indemnifications to other parties. The Funds’ maximum exposure under these arrangements is unknown as this would involve future claims that may be made against the Funds that have not yet occurred. However, the Funds have not had prior claims or losses pursuant to these contracts and expect the risk of loss to be remote.
Investments and Investment Income
Securities transactions are accounted for as of the trade date for financial reporting purposes. Trade date for senior and subordinated loans purchased in the “primary market” is considered the date on which the loan allocations are determined. Trade date for senior and subordinated loans purchased in the “secondary market” is the date on which the transaction is entered into. Realized gains and losses on securities transactions are based upon the specific identification method. Dividend income is recorded on the ex-dividend date or, for foreign securities, when information is available. Non-cash dividends received in the form of stock, if any, are recognized on the ex-dividend date and recorded at fair value. Interest income, which is recorded on an accrual basis and includes accretion of discounts and amortization of premiums for financial reporting purposes. Interest income also reflects payment-in-kind (“PIK”) interest and paydown gains and losses, if any. PIK interest represents income received in the form of securities in lieu of cash. Fee income consists primarily of amendment fees, when applicable. Amendment fees are earned as compensation for evaluating and accepting changes to an original senior loan agreement and are recognized when received. Fee income and amendment fees, if any, are recognized as “Fees” on the Statement of Operations.
Netting Agreements
In the ordinary course of business, the Funds may enter into transactions subject to enforceable master repurchase agreements, International Swaps and Derivative Association, Inc. (ISDA) master agreements or other similar arrangements (“netting agreements”). Generally, the right to offset in netting agreements allows each Fund to offset certain securities and derivatives with a specific counterparty, when applicable, as well as any collateral received or delivered to that counterparty based on the terms of the agreements. Generally, each Fund manages its cash collateral and securities collateral on a counterparty basis.
The Funds’ investments subject to netting agreements as of the end of the reporting period, if any, are further described in Note 4 – Portfolio Securities and Investments in Derivatives.
New Accounting Pronouncements and Rule Issuances
Reference Rate Reform
In March 2020, FASB issued Accounting Standards Update (“ASU”) 2020-04, Reference Rate Reform: Facilitation of the Effects of Reference Rate Reform on Financial Reporting. The main objective of the new guidance is to provide relief to companies that will be impacted by the expected change in benchmark interest rates, when participating banks will no longer be required to submit London Interbank Offered Rate (LIBOR) quotes by the UK Financial Conduct Authority (FCA). The new guidance allows companies to, provided the only change to existing contracts are a change to an approved benchmark interest rate, account for modifications as a continuance of the existing contract without additional analysis. For new and existing contracts, the Funds may elect to apply the amendments as of March 12, 2020 through December 31, 2022. Management has not yet elected to apply the amendments, is continuously evaluating the potential effect a discontinuation of LIBOR could have on the Funds’ investments and has currently determined that it is unlikely the ASU’s adoption will have a significant impact on the Funds’ financial statements and various filings.
Securities and Exchange Commission (“SEC”) Adopts New Rules to Modernize Fund Valuation Framework
In December 2020, the SEC voted to adopt a new rule governing fund valuation practices. New Rule 2a-5 under the 1940 Act establishes requirements for determining fair value in good faith for purposes of the 1940 Act. Rule 2a-5 will permit fund boards to designate certain parties to perform fair value determinations, subject to board oversight and certain other conditions. Rule 2a-5 also defines when market quotations are “readily available” for purposes of Section 2(a)(41) of the 1940 Act, which requires a fund to fair value a security when market quotations are not readily available. The SEC also adopted new Rule 31a-4 under the 1940 Act, which sets forth the recordkeeping requirements associated with fair value determinations. Finally, the SEC is rescinding previously issued guidance on related issues, including the role of a board in determining fair value and the accounting and auditing of fund investments. Rule 2a-5 and Rule 31a-4 became effective on March 8, 2021, with a compliance date of September 8, 2022. A fund may voluntarily comply with the rules after the effective date, and in advance of the compliance date, under certain conditions. Management is currently assessing the impact of these provisions on the Funds’ financial statements.
3. Investment Valuation and Fair Value Measurements
The Funds’ investments in securities are recorded at their estimated fair value utilizing valuation methods approved by the Board. Fair value is defined as the price that would be received upon selling an investment or transferring a liability in an orderly transaction to an independent buyer in the principal or most advantageous market for the investment. U.S. GAAP establishes the three-tier hierarchy which is used to maximize the use of observable market
109
Notes to Financial Statements (continued)
data and minimize the use of unobservable inputs and to establish classification of fair value measurements for disclosure purposes. Observable inputs reflect the assumptions market participants would use in pricing the asset or liability. Observable inputs are based on market data obtained from sources independent of the reporting entity. Unobservable inputs reflect management’s assumptions about the assumptions market participants would use in pricing the asset or liability. Unobservable inputs are based on the best information available in the circumstances. The following is a summary of the three-tiered hierarchy of valuation input levels.
| | |
Level 1 – | | Inputs are unadjusted and prices are determined using quoted prices in active markets for identical securities. |
Level 2 – | | Prices are determined using other significant observable inputs (including quoted prices for similar securities, interest rates, credit spreads, etc.). |
Level 3 – | | Prices are determined using significant unobservable inputs (including management’s assumptions in determining the fair value of investments). |
A description of the valuation techniques applied to the Funds’ major classifications of assets and liabilities measured at fair value follows:
Equity securities and exchange-traded funds listed or traded on a national market or exchange are valued based on their sale price at the official close of business of such market or exchange on the valuation date. Foreign equity securities and registered investment companies that trade on a foreign exchange are valued at the last sale price or official closing price reported on the exchange where traded and converted to U.S. dollars at the prevailing rates of exchange on the date of valuation. To the extent these securities are actively traded and that valuation adjustments are not applied, they are generally classified as Level 1. If there is no official close of business, then the latest available sale price is utilized. If no sales are reported, then the mean of the latest available bid and ask prices is utilized and these securities are generally classified as Level 2.
Prices of fixed-income securities are generally provided by an independent pricing service (“pricing service”) approved by the Board. The pricing service establishes a security’s fair value using methods that may include consideration of the following: yields or prices of investments of comparable quality, type of issue, coupon, maturity and rating, market quotes or indications of value from security dealers, evaluations of anticipated cash flows or collateral, general market conditions and other information and analysis, including the obligor’s credit characteristics considered relevant. In pricing certain securities, particularly less liquid and lower quality securities, the pricing service may consider information about a security, its issuer or market activity provided by the Adviser. These securities are generally classified as Level 2.
For events affecting the value of foreign securities between the time when the exchange on which they are traded closes and the time when the Funds’ net assets are calculated, such securities will be valued at fair value in accordance with procedures adopted by the Board. These foreign securities are generally classified as Level 2.
Investments in investment companies are valued at their respective NAVs on the valuation date and are generally classified as Level 1.
Swap contracts are marked-to-market daily based upon a price supplied by a pricing service. Swaps are generally classified as Level 2.
Any portfolio security or derivative for which market quotations are not readily available or for which the above valuation procedures are deemed not to reflect fair value are valued at fair value, as determined in good faith using procedures approved by the Board. As a general principle, the fair value of a security would appear to be the amount that the owner might reasonably expect to receive for it in a current sale. A variety of factors may be considered in determining the fair value of such securities, which may include consideration of the following: yields or prices of investments of comparable quality, type of issue, coupon, maturity and rating, market quotes or indications of value from security dealers, evaluations of anticipated cash flows or collateral, general market conditions and other information and analysis, including the obligor’s credit characteristics considered relevant. To the extent the inputs are observable and timely, the values would be classified as Level 2 of the fair value hierarchy; otherwise they would be classified as Level 3.
The following table summarizes the market value of the Funds’ investments as of the end of the reporting period, based on the inputs used to value them:
| | | | | | | | | | | | | | | | |
| NSL | | Level 1 | | | Level 2 | | | Level 3 | | | Total | |
Long-Term Investments*: | | | | | | | | | | | | | | | | |
Variable Rate Senior Loan Interests** | | $ | — | | | $ | 325,230,576 | | | $ | 2,005,844 | | | $ | 327,236,420 | |
Corporate Bonds | | | — | | | | 25,783,415 | | | | — | | | | 25,783,415 | |
Common Stocks** | | | 4,779,227 | | | | 3,294,444 | | | | 412,479 | | | | 8,486,150 | |
Warrants** | | | 1,021 | | | | 205,684 | | | | 4,378 | | | | 211,083 | |
Convertible Preferred Securities** | | | — | | | | 93,987 | | | | — | | | | 93,987 | |
Common Stocks Rights** | | | — | | | | 8 | | | | — | | | | 8 | |
| | | | |
Short-Term Investments: | | | | | | | | | | | | | | | | |
Investment Companies | | | 10,416,772 | | | | — | | | | — | | | | 10,416,772 | |
Total | | $ | 15,197,020 | | | $ | 354,608,114 | | | $ | 2,422,701 | | | $ | 372,227,835 | |
110
| | | | | | | | | | | | | | | | |
| | | | |
| JFR | | Level 1 | | | Level 2 | | | Level 3 | | | Total | |
Long-Term Investments*: | | | | | | | | | | | | | | | | |
Variable Rate Senior Loan Interests** | | $ | — | | | $ | 810,083,122 | | | $ | 4,035,068 | | | $ | 814,118,190 | |
Corporate Bonds | | | — | | | | 64,560,104 | | | | — | | | | 64,560,104 | |
Common Stocks** | | | 11,157,414 | | | | 9,117,503 | | | | 869,850 | | | | 21,144,767 | |
Investment Companies | | | 11,577,120 | | | | — | | | | — | | | | 11,577,120 | |
Asset-Backed Securities | | | — | | | | 3,625,813 | | | | — | | | | 3,625,813 | |
Warrants** | | | 2,384 | | | | 402,397 | | | | 8,755 | | | | 413,536 | |
Convertible Preferred Securities** | | | — | | | | 187,973 | | | | — | | | | 187,973 | |
Common Stocks Rights** | | | — | | | | 16 | | | | — | | | | 16 | |
| | | | |
Short-Term Investments: | | | | | | | | | | | | | | | | |
Investment Companies | | | 40,257,885 | | | | — | | | | — | | | | 40,257,885 | |
Total | | $ | 62,994,803 | | | $ | 887,976,928 | | | $ | 4,913,673 | | | $ | 955,885,404 | |
| JRO | | Level 1 | | | Level 2 | | | Level 3 | | | Total | |
Long-Term Investments*: | | | | | | | | | | | | | | | | |
Variable Rate Senior Loan Interests** | | $ | — | | | $ | 574,117,294 | | | $ | 2,913,510 | | | $ | 577,030,804 | |
Corporate Bonds | | | — | | | | 47,672,187 | | | | — | | | | 47,672,187 | |
Common Stocks** | | | 7,841,308 | | | | 6,931,905 | | | | 600,348 | | | | 15,373,561 | |
Asset-Backed Securities | | | — | | | | 2,333,877 | | | | — | | | | 2,333,877 | |
Warrants** | | | 1,705 | | | | 274,423 | | | | 5,839 | | | | 281,967 | |
Convertible Preferred Securities** | | | — | | | | 125,307 | | | | — | | | | 125,307 | |
Common Stocks Rights** | | | — | | | | 16 | | | | — | | | | 16 | |
| | | | |
Short-Term Investments: | | | | | | | | | | | | | | | | |
Investment Companies | | | 26,360,204 | | | | — | | | | — | | | | 26,360,204 | |
Total | | $ | 34,203,217 | | | $ | 631,455,009 | | | $ | 3,519,697 | | | $ | 669,177,923 | |
| | | | |
| JSD | | Level 1 | | | Level 2 | | | Level 3 | | | Total | |
Long-Term Investments*: | | | | | | | | | | | | | | | | |
Variable Rate Senior Loan Interests** | | $ | — | | | $ | 215,081,817 | | | $ | 1,699,036 | | | $ | 216,780,853 | |
Corporate Bonds | | | — | | | | 19,093,305 | | | | — | | | | 19,093,305 | |
Common Stocks** | | | 3,183,802 | | | | 1,801,511 | | | | 257,488 | | | | 5,242,801 | |
Warrants** | | | 1,021 | | | | 162,326 | | | | 4,378 | | | | 167,725 | |
Convertible Preferred Securities** | | | — | | | | 93,987 | | | | — | | | | 93,987 | |
Common Stocks Rights** | | | — | | | | 9 | | | | — | | | | 9 | |
| | | | |
Short-Term Investments: | | | | | | | | | | | | | | | | |
Investment Companies | | | 10,699,368 | | | | — | | | | — | | | | 10,699,368 | |
Total | | $ | 13,884,191 | | | $ | 236,232,955 | | | $ | 1,960,902 | | | $ | 252,078,048 | |
| | | | |
| JQC | | Level 1 | | | Level 2 | | | Level 3 | | | Total | |
Long-Term Investments*: | | | | | | | | | | | | | | | | |
Variable Rate Senior Loan Interests** | | $ | — | | | $ | 1,300,903,590 | | | $ | 11,733,256 | | | $ | 1,312,636,846 | |
Corporate Bonds | | | — | | | | 180,796,313 | | | | — | | | | 180,796,313 | |
Common Stocks** | | | 5,216,076 | | | | 3,848,115 | | | | 1,577,863 | | | | 10,642,054 | |
Convertible Bonds | | | — | | | | 2,050,000 | | | | — | | | | 2,050,000 | |
Warrants** | | | 3,415 | | | | 347,344 | | | | 5 | | | | 350,764 | |
Common Stocks Rights** | | | — | | | | 55 | | | | — | | | | 55 | |
| | | | |
Short-Term Investments: | | | | | | | | | | | | | | | | |
Investment Companies | | | 13,396,077 | | | | — | | | | — | | | | 13,396,077 | |
Total | | $ | 18,615,568 | | | $ | 1,487,945,417 | | | $ | 13,311,124 | | | $ | 1,519,872,109 | |
| * | Refer to the Fund’s Portfolio of Investments for industry classifications, where applicable. |
| ** | Refer to the Fund’s Portfolio of Investments for securities classified as Level 2 and/or Level 3. |
The Funds hold liabilities in preferred shares, where applicable, which are not reflected in the tables above. The fair values of the Funds’ liabilities for preferred shares approximate their liquidation preference. Preferred shares are generally classified as Level 2 and further described in Note 5 – Fund Shares.
111
Notes to Financial Statements (continued)
The following is a reconciliation of the Funds’ Level 3 investments held at the beginning and end of the measurement period:
| | | | | | | | | | | | | | | | | | | | | | | | | | | | | | | | | | | | |
| | | NSL | | | JFR | | | JRO | |
| | | Level 3 | | | Level 3 | | | Level 3 | |
| | | Variable Rate
Senior Loan
Interests | | | Common
Stocks | | | Warrant | | | Variable Rate
Senior Loan
Interests | | | Common
Stocks | | | Warrant | | | Variable Rate
Senior Loan
Interests | | | Common
Stocks | | | Warrant | |
Balance at the beginning of period | | $ | — | | | $ | 73,596 | | | $ | — | | | $ | — | | | $ | 142,034 | | | $ | — | | | $ | — | | | $ | 104,094 | | | $ | — | |
Gains (losses): | | | | | | | | | | | | | | | | | | | | | | | | | | | | | | | | | | | | |
Net realized gains (losses) | | | — | | | | — | | | | — | | |
| —
|
| | | — | | | | — | | |
| —
|
| | | — | | | | — | |
Change in net unrealized appreciation (depreciation) | | | — | | | | (207,599 | ) | | | 4,378 | | |
| —
|
| | | (312,637 | ) | | | 8,755 | | |
| —
|
| | | (258,791 | ) | | | 5,839 | |
Purchases at cost | | | — | | | | 546,482 | | | | — | | |
| —
|
| | | 1,040,453 | | | | — | | |
| —
|
| | | 755,045 | | | | — | |
Sales at proceeds | | | — | | | | — | | | | — | | |
| —
|
| | | — | | | | — | | |
| —
|
| | | — | | | | — | |
Net discounts (premiums) | | | — | | | | — | | | | — | | |
| —
|
| | | — | | | | — | | |
| —
|
| | | — | | | | — | |
Transfers into | | | 2,005,844 | | | | — | | | | — | | | | 4,035,068 | | | | — | | | | — | | | | 2,913,510 | | | | — | | | | — | |
Transfers (out of) | | | — | | | | — | | | | — | | | | — | | | | — | | | | — | | | | — | | | | — | | | | — | |
Balance at the end of period | | $ | 2,005,844 | | | $ | 412,479 | | | $ | 4,378 | | | $ | 4,035,068 | | | $ | 869,850 | | | $ | 8,755 | | | $ | 2,913,510 | | | $ | 600,348 | | | $ | 5,839 | |
Change in net unrealized appreciation (depreciation) during the period of Level 3 securities held as of period end | | $ | 1,276,349 | | | $ | (207,599) | | | $ | 4,378 | | | $ | 2,568,582 | | | $ | (312,637 | ) | | $ | 8,755 | | | $ | 1,855,150 | | | $ | (258,791 | ) | | $ | 5,839 | |
| | | | | | | | | | | | | | | | | | | | | | | | |
| | | JSD | | | JQC | |
| | | Level 3 | | | Level 3 | |
| | | Variable Rate
Senior Loan
Interests | | | Common Stocks | | | Warrant | | | Variable Rate
Senior Loan
Interests | | | Common Stocks | | | Warrant | |
Balance at the beginning of period | | $ | — | | | $ | 25,290 | | | $ | — | | | $ | — | | | $ | 436,054 | | | $ | 5 | |
Gains (losses): | | | | | | | | | | | | | | | | | | | | | | | | |
Net realized gains (losses) | |
| —
|
| | | — | | | | — | | |
| —
|
| | | — | | | | — | |
Change in net unrealized appreciation (depreciation) | |
| —
|
| | | (180,311 | ) | | | 4,378 | | |
| —
|
| | | 293,040 | | | | — | |
Purchases at cost | |
| —
|
| | | 412,509 | | | | — | | |
| —
|
| | | 848,769 | | | | — | |
Sales at proceeds | |
| —
|
| | | — | | | | — | | |
| —
|
| | | — | | | | — | |
Net discounts (premiums) | |
| —
|
| | | — | | | | — | | |
| —
|
| | | — | | | | — | |
Transfers into | | | 1,699,036 | | | | — | | | | — | | | | 11,733,256 | | | | — | | | | — | |
Transfers (out of) | | | — | | | | — | | | | — | | | | — | | | | — | | | | — | |
Balance at the end of period | | $ | 1,699,036 | | | $ | 257,488 | | | $ | 4,378 | | | $ | 11,733,256 | | | $ | 1,577,863 | | | $ | 5 | |
Change in net unrealized appreciation (depreciation) during the period of Level 3 securities held as of period end | | $ | 1,084,505 | | | $ | (180,311) | | | $ | 4,378 | | | $ | 7,394,089 | | | $ | 293,040 | | | $ | — | |
As of the measurement date, the following Common Stocks categorized as Level 3: (1) Millennium Health LLC are priced based on updated financial statements which reflect the most recent net asset values; (2) TNT Crane & Rigging Inc. are priced at a placeholder value; (3) Tribune Co are priced at last trade price less the distribution amount; (4) Skillsoft Corp are priced at an 18.19% amortized discount applied to the closing price of the common shares. The Variable Rate Senior Loan Interests categorized as Level 3 are valued utilizing a weighted probability model which is weighted at 50% to a full recovery and 50% to the current vendor price of the loan. The following warrants categorized as Level 3: (1) ACBL HLDG CORP are valued utilizing the weighted average of quarterly cash payments received with a 25% discount; (2) Tenerity Inc. are priced at placeholder value.
112
The table below presents the transfers in and out of the three valuation levels for the Funds as of the end of the reporting period when compared to the valuation levels at the end of the previous fiscal year. Changes in valuation inputs or methodologies may result in transfers into or out of an assigned level within the fair value hierarchy. Transfers in or out of levels are generally due to the availability of publicly available information and to the significance or extent the Adviser determines that the valuation inputs or methodologies may impact the valuation of those securities.
| | | | | | | | | | | | | | | | | | | | | | | | |
| | | Level 1 | | | Level 2 | | | Level 3 | |
| | | Transfers In | | | (Transfers Out) | | | Transfers In | | | (Transfers Out) | | | Transfers In | | | (Transfers Out) | |
| NSL | | | | | | | | | | | | | | | | | | |
Variable Rate Senior Loan Interests | | $ | — | | | $ | — | | | $ | — | | | $ | (2,005,844 | ) | | $ | 2,005,844 | | | $ | — | |
| JFR | | | | | | | | | | | | | | | | | | |
Variable Rate Senior Loan Interests | | $ | — | | | $ | — | | | $ | — | | | $ | (4,035,068 | ) | | $ | 4,035,068 | | | $ | — | |
| JRO | | | | | | | | | | | | | | | | | | |
Variable Rate Senior Loan Interests | | $ | — | | | $ | — | | | $ | — | | | $ | (2,913,510 | ) | | $ | 2,913,510 | | | $ | — | |
| JSD | | | | | | | | | | | | | | | | | | |
Variable Rate Senior Loan Interests | | $ | — | | | $ | — | | | $ | — | | | $ | (1,699,036 | ) | | $ | 1,699,036 | | | $ | — | |
| JQC | | | | | | | | | | | | | | | | | | |
Variable Rate Senior Loan Interests | | $ | — | | | $ | — | | | $ | — | | | $ | (11,733,256 | ) | | $ | 11,733,256 | | | $ | — | |
4. Portfolio Securities and Investments in Derivatives
Portfolio Securities
Unfunded Commitments
Pursuant to the terms of certain of the variable rate senior loan agreements, the Funds may have unfunded senior loan commitments. Each Fund will maintain with its custodian, cash, liquid securities and/or liquid senior loans having an aggregate value at least equal to the amount of unfunded senior loan commitments. As of the end of the reporting period, the Funds’ outstanding unfunded senior loan commitments were as follows:
| | | | | | | | | | | | | | | | | | | | |
| | | NSL | | | JFR | | | JRO | | | JSD | | | JQC | |
Outstanding unfunded senior loan commitments | | $ | 1,696,924 | | | $ | 2,074,558 | | | $ | 3,109,780 | | | $ | 549,012 | | | $ | 1,841,762 | |
Participation Commitments
With respect to the senior loans held in each Fund’s portfolio, the Funds may: 1) invest in assignments; 2) act as a participant in primary lending syndicates; or 3) invest in participations. If a Fund purchases a participation of a senior loan interest, the Fund would typically enter into a contractual agreement with the lender or other third party selling the participation, rather than directly with the borrower. As such, the Fund not only assumes the credit risk of the borrower, but also that of the selling participant or other persons interpositioned between the Fund and the borrower. As of the end of the reporting period, the Funds had no such outstanding participation commitments.
Zero Coupon Securities
A zero coupon security does not pay a regular interest coupon to its holders during the life of the security. Income to the holder of the security comes from accretion of the difference between the original purchase price of the security at issuance and the par value of the security at maturity and is effectively paid at maturity. The market prices of zero coupon securities generally are more volatile than the market prices of securities that pay interest periodically.
Investment Transactions
Long-term purchases and sales (including maturities but excluding derivative transactions, where applicable) during the current fiscal period were as follows:
| | | | | | | | | | | | | | | | | | | | |
| | | NSL | | | JFR | | | JRO | | | JSD | | | JQC | |
Purchases | | $ | 155,755,126 | | | $ | 400,969,335 | | | $ | 275,248,040 | | | $ | 110,174,944 | | | $ | 617,325,245 | |
Sales and maturities | | | 145,911,463 | | | | 368,849,391 | | | | 249,483,477 | | | | 102,375,907 | | | | 631,484,524 | |
The Funds may purchase securities on a when-issued or delayed-delivery basis. Securities purchased on a when-issued or delayed-delivery basis may have extended settlement periods; interest income is not accrued until settlement date. Any securities so purchased are subject to market fluctuation during this period. The Funds have earmarked securities in their portfolios with a current value at least equal to the amount of the when-issued/delayed-delivery purchase commitments. If a Fund has outstanding when-issued/delayed-delivery purchases commitments as of the end of the reporting period, such amounts are recognized on the Statement of Assets and Liabilities.
113
Notes to Financial Statements (continued)
Investments in Derivatives
Each Fund is authorized to invest in certain derivative instruments, such as futures, options and swap contracts. Each Fund limits its investments in futures, options on futures and swap contracts to the extent necessary for the Adviser to claim the exclusion from registration by the Commodity Futures Trading Commission as a commodity pool operator with respect to the Fund. The Funds record derivative instruments at fair value, with changes in fair value recognized on the Statement of Operations, when applicable. Even though the Funds’ investments in derivatives may represent economic hedges, they are not considered to be hedge transactions for financial reporting purposes.
Interest Rate Swap Contracts
Interest rate swap contracts involve a Fund’s agreement with the counterparty to pay or receive a fixed rate payment in exchange for the counterparty receiving or paying a variable rate payment. Forward interest rate swap contracts involve a Fund’s agreement with a counterparty to pay, in the future, a fixed or variable rate payment in exchange for the counterparty paying the Fund a variable or fixed rate payment, the accruals for which would begin at a specified date in the future (the “effective date”).
The amount of the payment obligation for an interest rate swap is based on the notional amount and the termination date of the contract. Interest rate swap contracts do not involve the delivery of securities or other underlying assets or principal. Accordingly, the risk of loss with respect to the swap counterparty on such transactions is limited to the net amount of interest payments that the Fund is to receive.
Interest rate swap contracts are valued daily. Upon entering into an interest rate swap contract (and beginning on the effective date for a forward interest rate swap contract), the Fund accrues the fixed rate payment expected to be paid or received and the variable rate payment expected to be received or paid on the interest rate swap contracts on a daily basis, and recognizes the daily change in the fair value of the Fund’s contractual rights and obligations under the contracts. For an over-the-counter (“OTC”) swap that is not cleared through a clearing house (“OTC Uncleared”), the amount recorded on these transactions is recognized on the Statement of Assets and Liabilities as a component of “Unrealized appreciation or depreciation on interest rate swaps.”
Upon the execution of an OTC swap cleared through a clearing house (“OTC Cleared”), the Fund is obligated to deposit cash or eligible securities, also known as “initial margin,” into an account at its clearing broker equal to a specified percentage of the contract amount. Cash deposited by the Fund to cover initial margin requirements on open swap contracts, if any, is recognized as a component of “Cash collateral at brokers for investment in swaps” on the Statement of Assets and Liabilities. Investments in OTC Cleared swaps obligate the Fund and the clearing broker to settle monies on a daily basis representing changes in the prior day’s “mark-to-market” of the swap contract. If the Fund has unrealized appreciation, the clearing broker will credit the Fund’s account with an amount equal to the appreciation. Conversely, if the Fund has unrealized depreciation, the clearing broker will debit the Fund’s account with an amount equal to the depreciation. These daily cash settlements are also known as “variation margin.” Variation margin for OTC Cleared swaps is recognized as a receivable and/or payable for “Variation margin on swap contracts” on the Statement of Assets and Liabilities. Upon the execution of an OTC Uncleared swap, neither the Fund nor the counterparty is required to deposit initial margin as the trades are recorded bilaterally between both parties to the swap contract, and the terms of the variation margin are subject to a predetermined threshold negotiated by the Fund and the counterparty. Variation margin for OTC Uncleared swaps is recognized as a component of “Unrealized appreciation or depreciation on interest rate swaps” as described in the preceding paragraph.
The net amount of periodic payments settled in cash are recognized as a component of “Net realized gain (loss) from swaps” on the Statement of Operations, in addition to the net realized gain or loss recorded upon the termination of the swap contract. For tax purposes, payments expected to be received or paid on the swap contracts are treated as ordinary income or expense, respectively. Changes in the value of the swap contracts during the fiscal period are recognized as a component of “Change in net unrealized appreciation (depreciation) of swaps” on the Statement of Operations. In certain instances, payments are made or received upon entering into the swap contract to compensate for differences between the stated terms of the swap agreements and prevailing market conditions (credit spreads, currency exchange rates, interest rates, and other relevant factors). Payments received or made at the beginning of the measurement period, if any, are recognized as “Interest rate swaps premiums received and/or paid” on the Statement of Assets and Liabilities.
During the current fiscal period, JFR and JRO used cancellable interest rate swaps in which each Fund received payments based upon pre-determined fixed rates and paid one-month LIBOR plus a fixed spread. After a non-callable period, the swap counterparty owns the right on future monthly dates to terminate the swap at par. The purpose of the cancellable interest rate swap is to convert a fixed rate Term Preferred Share issuance to floating rate, and the cancellation dates of the swap correspond to dates on which the Funds can call the Term Preferred Share issue.
The average notional amount of interest rate swap contracts outstanding during the current fiscal period was as follows:
| | | | | | | | |
| | | JFR | | | JRO | |
Average notional amount of interest rate swap contracts outstanding* | | $ | 22,000,000 | | | $ | 18,000,000 | |
| * | The average notional amount is calculated based on the outstanding notional at the beginning of the current fiscal period and at the end of each fiscal quarter within the current fiscal period. |
114
The following table presents the amount of net realized gain (loss) and change in net unrealized appreciation (depreciation) recognized on swap contracts on the Statement of Operations during the current fiscal period, and the primary underlying risk exposure.
| | | | | | | | | | | | |
| Fund | | Underlying
Risk Exposure | | Derivative
Instrument | | Net Realized
Gain (Loss) from
Swaps | | | Change in Net
Unrealized
Appreciation
(Depreciation) of
Swaps | |
| JFR | | Interest rate | | Swaps | | $ | 700,593 | | | $ | (712,604 | ) |
| JRO | | Interest rate | | Swaps | | | 573,213 | | | | (583,039 | ) |
Market and Counterparty Credit Risk
In the normal course of business each Fund may invest in financial instruments and enter into financial transactions where risk of potential loss exists due to changes in the market (market risk) or failure of the other party to the transaction to perform (counterparty credit risk). The potential loss could exceed the value of the financial assets recorded on the financial statements. Financial assets, which potentially expose each Fund to counterparty credit risk, consist principally of cash due from counterparties on forward, option and swap transactions, when applicable. The extent of each Fund’s exposure to counterparty credit risk in respect to these financial assets approximates their carrying value as recorded on the Statement of Assets and Liabilities.
Each Fund helps manage counterparty credit risk by entering into agreements only with counterparties the Adviser believes have the financial resources to honor their obligations and by having the Adviser monitor the financial stability of the counterparties. Additionally, counterparties may be required to pledge collateral daily (based on the daily valuation of the financial asset) on behalf of each Fund with a value approximately equal to the amount of any unrealized gain above a pre-determined threshold. Reciprocally, when each Fund has an unrealized loss, the Funds have instructed the custodian to pledge assets of the Funds as collateral with a value approximately equal to the amount of the unrealized loss above a pre-determined threshold. Collateral pledges are monitored and subsequently adjusted if and when the valuations fluctuate, either up or down, by at least the pre-determined threshold amount.
5. Fund Shares
Common Shares
Common Share Transactions
Transactions in common shares during the Funds’ current and prior fiscal period, where applicable, were as follows:
| | | | | | | | |
| |
| | | JSD | |
| | | Year Ended
7/31/21 | | | Year Ended
7/31/20 | |
Common shares repurchased and retired | | | — | | | | (10,000 | ) |
Weighted average common share: | | | | | | | | |
Price per share repurchased and retired | | $ | — | | | $ | 11.56 | |
Discount per share repurchased and retired | | | — | % | | | 17.15 | % |
Preferred Shares
Taxable Fund Preferred Shares
NSL, JFR, JRO and JSD have issued and have outstanding Taxable Fund Preferred (“TFP”) Shares, with a $1,000 liquidation preference per share. These TFP Shares were issued via private placement and are not publicly available.
Each Fund is obligated to redeem its TFP Shares by the date as specified in its offering documents (“Term Redemption Date”), unless earlier redeemed by the Fund. TFP Shares are initially issued in a pre-specified mode, however, TFP Shares can be subsequently designated as an alternative mode at a later date at the discretion of the Funds. The modes within TFP Shares detail the dividend mechanics and are described as follows. At a subsequent date, the Funds may establish additional mode structures with the TFP Share.
| | • | | Variable Rate Remarketed Mode (“VRRM”) – Dividends for TFP Shares within this mode will be established by a remarketing agent; therefore, the market value of the TFP Shares is expected to approximate its liquidation preference. Shareholders have the ability to request a bestefforts tender of its shares upon seven days notice. If the remarketing agent is unable to identify an alternative purchaser, the shares will be retained by the shareholder requesting tender and the subsequent dividend rate will increase to its step-up dividend rate. If after one consecutive year of unsuccessful remarketing attempts, the Funds will be required to designate an alternative mode or redeem the shares. |
115
Notes to Financial Statements (continued)
The Funds will pay a remarketing fee on the aggregate principal amount of all TFP shares while designated in VRRM. Payments made by the Funds to the remarketing agent are recognized as “Remarketing fees” on the Statement of Operations.
| | • | | Variable Rate Mode (“VRM”) – Dividends for TFP Shares designated in this mode are based upon a short-term index plus an additional fixed “spread” amount established at the time of issuance or renewal / conversion of its mode. At the end of the period of the mode, the Funds will be required to either extend the term of the mode, designate an alternative mode or redeem the TFP Shares. |
The fair value of TFP Shares while in VRM are expected to approximate their liquidation preference so long as the fixed “spread” on the shares remains roughly in line with the “spread’ being demanded by investors on instruments having similar terms in the current market. In current market conditions, the Adviser has determined that the fair value of the shares are approximately their liquidation preference, but their fair value could vary if market conditions change materially.
| | • | | Variable Rate Demand Mode (“VRDM”) – Dividends for TFP Shares designated in this mode will be established by a remarketing agent; therefore, the market value of the TFP Shares is expected to approximate its liquidation preference. While in this mode, shares will have an unconditional liquidity feature that enable its shareholders to require a liquidity provider, which each Fund has entered into a contractual agreement, to purchase shares in the event that the shares are not able to be successfully remarketed. In the event that shares within this mode are unable to be successfully remarketed and are purchased by the liquidity provider, the dividend rate will be the maximum rate which is designed to escalate according to a specified schedule in order to enhance the remarketing agent’s ability to successfully remarket the shares. Each Fund is required to redeem any shares that are still owned by a liquidity provider after six months of continuous, unsuccessful remarketing. |
Each Fund will pay a liquidity and remarketing fee on the aggregate principal amount of all TFP Shares while within VRDM. Payments made by the Funds to the liquidity provider and remarketing agent are recognized as “Liquidity fees” and “Remarketing fees”, respectively, on the Statement of Operations.
For financial reporting purposes, the liquidation preference of TFP Shares is recorded as a liability and is recognized as a component of “Taxable Fund Preferred (“TFP”) Shares, net of deferred offering costs” on the Statement of Assets and Liabilities. Dividends on the TFP shares are treated as interest payments for financial reporting purposes. Unpaid dividends on TFP shares are recognized as a component on “Interest payable” on the Statement of Assets and Liabilities. Dividends accrued on TFP Shares are recognized as a component of “Interest expense and amortization of offering costs” on the Statement of Operations.
Subject to certain conditions, TFP Shares may be redeemed, in whole or in part, at any time at the option of the Funds. Each Fund may also be required to redeem certain TFP shares if the Fund fails to maintain certain asset coverage requirements and such failures are not cured by the applicable cure date. The redemption price per share in all circumstances is equal to the liquidation preference per share plus any accumulated but unpaid dividends.
NSL, JFR and JRO incurred offering costs of $465,000, $675,000 and $465,000, respectively, in connection with their offering of TFP Shares, which were recorded as a deferred charge and are being amortized over the life of the shares. These offering costs are recognized as a component of “Taxable Fund Preferred (“TFP”) Shares, net of deferred offering costs” on the Statement of Assets and Liabilities and “Interest expense and amortization of offering costs” on the Statement of Operations.
As of the end of the reporting period, NSL, JFR, JRO and JSD had $39,568,793, $99,311,385, $74,674,414 and $69,580,756 TFP Shares at liquidation preference, net of deferred offering costs, respectively. Further details of the Funds’ TFP Shares outstanding as of the end of the reporting period, were as follows:
| | | | | | | | | | | | | | | | | | |
| Fund | | Series | | Shares
Outstanding | | | Liquidation
Preference | | | Term
Redemption
Date | | | Mode | |
| NSL | | A | | | 40,000 | | | $ | 40,000,000 | | | | November 1, 2030 | | | | VRM | |
| JFR | | A | | | 100,000 | | | $ | 100,000,000 | | | | January 1, 2031 | | | | VRDM | |
| JRO | | A | | | 75,000 | | | $ | 75,000,000 | | | | December 1, 2030 | | | | VRM | |
| JSD | | A | | | 70,000 | | | $ | 70,000,000 | | | | November 1, 2029 | | | | VRDM | |
The average liquidation preference of TFP Shares outstanding and the annualized dividend rate for each Fund during the current fiscal period were as follows:
| | | | | | | | | | | | | | | | |
| | | NSL* | | | JFR** | | | JRO*** | | | JSD | |
Average liquidation preference of TFP Shares outstanding | | $ | 40,000,000 | | | $ | 100,000,000 | | | $ | 75,000,000 | | | $ | 70,000,000 | |
Annualized dividend rate | | | 1.35 | % | | | 0.25 | % | | | 1.34 | % | | | 0.28 | % |
| * | For the period October 5, 2020 (first issuance date of shares) through July 31, 2021. |
| ** | For the period December 4, 2020 (first issuance date of shares) through July 31, 2021. |
| *** | For the period November 5, 2020 (first issuance date of shares) through July 31, 2021. |
116
Term Preferred Shares
The following Funds had issued and had outstanding Term Preferred Shares (“Term Preferred”), with a $1,000 liquidation preference per share.
On October 12, 2020, December 8, 2020 and November 9, 2020, respectively, NSL, JFR and JRO redeemed all of their outstanding Series 2021, Series 2024 and Series 2027, and Series 2027, respectively, Term Preferred. The Funds’ Term Preferred were redeemed at their $1,000 liquidation preference per share, plus additional amount representing the final accumulated distribution amounts owed, using proceeds from its issuance of TFP (as described above in Taxable Fund Preferred Shares).
The average liquidation preference of Term Preferred outstanding and annualized dividend rate for each Fund during the current fiscal period were as follows:
| | | | | | | | | | | | |
| | | NSL* | | | JFR** | | | JRO*** | |
Average liquidation preference of Term Preferred outstanding | | $ | 17,219,178 | | | $ | 81,076,923 | | | $ | 41,732,673 | |
Annualized dividend rate | | | 2.93 | % | | | 2.91 | % | | | 3.94 | % |
| * | For the period August 1, 2020 through October 12, 2020. |
| ** | For the period August 1, 2020 through December 8, 2020. |
| *** | For the period August 1, 2020 through November 9, 2020. |
Term Preferred generally do not trade, and market quotations are generally not available. Term Preferred are short-term instruments that pay a dividend rate, subject to adjustment as set forth in accordance with the offering documents. The fair value of Term Preferred is expected to be approximately its liquidation preference so long as the fixed “spread” on the Term Preferred remains roughly in line with the “spread” being demanded by investors on instruments having similar terms in the current market environment. In present market conditions, the Funds’ Adviser has determined that the fair value of Term Preferred is approximately its liquidation preference, but its fair value could vary if market conditions change materially. For financial reporting purposes, the liquidation preference of Term Preferred is a liability and is recognized as “Term Preferred Shares (“Term Preferred”), net of deferred offering costs” on the Statement of Assets and Liabilities.
Dividends on Term Preferred (which are treated as interest payments for financial reporting purposes) are at the rates set forth in its offering document. The initial dividend rate will expire approximately two years after the first issuance of shares and will be adjusted upwards semi-annually thereafter. Unpaid dividends on Term Preferred are recognized as a component of “Interest payable” on the Statement of Assets and Liabilities, when applicable. Dividends accrued on Term Preferred are recognized as a component of “Interest expense and amortization of offering costs” on the Statement of Operations.
Costs incurred in connection with each Fund’s offering of Term Preferred were recorded as a deferred charge, which are amortized over the life of the shares and are recognized as components of “Term Preferred Shares, net of deferred offering costs” on the Statement of Assets and Liabilities and “Interest expense and amortization of offering costs” on the Statement of Operations.
In conjunction with NSL’s redemption of Series 2021, JFR’s redemption of Series 2024 and Series 2027 and JRO’s redemption of Series 2027 of Term Preferred, the remaining deferred offering costs of $233,332, $628,538 and $387,633, respectively, were fully expensed during the current fiscal period, as the redemptions were deemed an extinguishment of debt.
Preferred Share Transactions
Transactions in preferred shares during the Funds’ current and prior fiscal period, where applicable, are noted in the following table.
Transactions in TFP Shares for the Funds, where applicable, were as follows:
| | | | | | | | | | | | |
| | | Year Ended
July 31, 2021 | |
| NSL | | Series | | | Shares | | | Amount | |
TFP Shares issued | | | A | | | | 40,000 | | | $ | 40,000,000 | |
| |
| | | Year Ended
July 31, 2021 | |
| JFR | | Series | | | Shares | | | Amount | |
TFP Shares issued | | | A | | | | 100,000 | | | $ | 100,000,000 | |
| |
| | | Year Ended
July 31, 2021 | |
| JRO | | Series | | | Shares | | | Amount | |
TFP Shares issued | | | A | | | | 75,000 | | | $ | 75,000,000 | |
117
Notes to Financial Statements (continued)
| | | | | | | | | | | | |
| | | Year Ended
July 31, 2020 | |
| JSD | | Series | | | Shares | | | Amount | |
TFP Shares issued | | | A | | | | 100,000 | | | $ | 100,000,000 | |
TFP Shares redeemed | | | A | | | | (30,000 | ) | | | (30,000,000 | ) |
Net increase (decrease) | | | | | | | 70,000 | | | $ | 70,000,000 | |
Transactions in Term Preferred for the Funds, where applicable, were as follows:
| | | | | | | | | | | | |
| | | Year Ended
July 31, 2021 | |
| NSL | | Series | | | Shares | | | Amount | |
Term Preferred redeemed | | | 2021 | | | | (33,000 | ) | | $ | (33,000,000 | ) |
| |
| | | Year Ended
July 31, 2021 | |
| JFR | | Series | | | Shares | | | Amount | |
Term Preferred redeemed | | | 2024 | | | | (35,000 | ) | | $ | (35,000,000 | ) |
| | | | 2027 | | | | (55,000 | ) | | | (55,000,000 | ) |
Total | | | | | | | (90,000 | ) | | $ | (90,000,000 | ) |
| |
| | | Year Ended
July 31, 2021 | |
| JRO | | Series | | | Shares | | | Amount | |
Term Preferred redeemed | | | 2027 | | | | (45,000 | ) | | $ | (45,000,000 | ) |
| |
| | | Year Ended
July 31, 2020 | |
| NSL | | Series | | | Shares | | | Amount | |
Term Preferred redeemed | | | 2021 | | | | (10,000 | ) | | $ | (10,000,000 | ) |
| |
| | | Year Ended
July 31, 2020 | |
| JFR | | Series | | | Shares | | | Amount | |
Term Preferred redeemed | | | 2022 | | | | (25,000 | ) | | $ | (25,000,000 | ) |
| |
| | | Year Ended
July 31, 2020 | |
| JRO | | Series | | | Shares | | | Amount | |
Term Preferred redeemed | | | 2022 | | | | (10,000 | ) | | $ | (10,000,000 | ) |
| | | 2022-1 | | | | (21,000 | ) | | | (21,000,000 | ) |
| | | | 2023 | | | | (8,000 | ) | | | (8,000,000 | ) |
Total | | | | | | | (39,000 | ) | | $ | (39,000,000 | ) |
| |
| | | Year Ended
July 31, 2020 | |
| JSD | | Series | | | Shares | | | Amount | |
Term Preferred redeemed | | | 2020 | | | | (35,000 | ) | | $ | (35,000,000 | ) |
6. Income Tax Information
Each Fund is a separate taxpayer for federal income tax purposes. Each Fund intends to distribute substantially all of its net investment income and net capital gain to shareholders and to otherwise comply with the requirements of Subchapter M of the Internal Revenue Code applicable to regulated investment companies. Therefore, no federal income tax provision is required.
118
For all open tax years and all major taxing jurisdictions, management of the Funds has concluded that there are no significant uncertain tax positions that would require recognition in the financial statements. Open tax years are those that are open for examination by taxing authorities (i.e., generally the last four tax year ends and the interim tax period since then). Furthermore, management of the Funds is also not aware of any tax positions for which it is reasonably possible that the total amounts of unrecognized tax benefits will significantly change in the next twelve months.
The following information is presented on an income tax basis. Differences between amounts for financial statement and federal income tax purposes are primarily due to the treatment of timing differences in recognizing certain gains and losses on investment transactions and recognition of premium amortization. To the extent that differences arise that are permanent in nature, such amounts are reclassified within the capital accounts as detailed below. Temporary differences do not require reclassification. Temporary and permanent differences do not impact the NAVs of the Funds.
The table below presents the cost and unrealized appreciation (depreciation) of each Fund’s investment portfolio, as determined on a federal income tax basis, as of July 31, 2021.
| | | | | | | | | | | | | | | | | | | | |
| | | NSL | | | JFR | | | JRO | | | JSD | | | JQC | |
Tax cost of investments | | $ | 381,795,889 | | | $ | 976,262,176 | | | $ | 683,663,295 | | | $ | 258,589,961 | | | $ | 1,543,972,331 | |
Gross unrealized: | | | | | | | | | | | | | | | | | | | | |
Appreciation | | $ | 5,433,737 | | | $ | 13,695,453 | | | $ | 9,953,278 | | | $ | 3,313,169 | | | $ | 20,493,123 | |
Depreciation | | | (15,001,791 | ) | | | (34,072,225 | ) | | | (24,438,650 | ) | | | (9,825,082 | ) | | | (44,593,345 | ) |
Net unrealized appreciation (depreciation) of investments | | $ | (9,568,054 | ) | | $ | (20,376,772 | ) | | $ | (14,485,372 | ) | | $ | (6,511,913 | ) | | $ | (24,100,222 | ) |
Permanent differences, primarily due to bond premium amortization adjustments, treatment of notional principal contracts, nondeductible offering costs, and federal taxes paid, resulted in reclassifications among the Funds’ components of common share net assets as of July 31, 2021, the Funds’ tax year end.
The tax components of undistributed net ordinary income and net long-term capital gains as of July 31, 2021, the Funds’ tax year end, were as follows:
| | | | | | | | | | | | | | | | | | | | |
| | | NSL | | | JFR | | | JRO | | | JSD | | | JQC | |
Undistributed net ordinary income1, 2 | | $ | 604,450 | | | $ | 1,614,569 | | | $ | 935,637 | | | $ | 659,733 | | | | — | |
Undistributed net long-term capital gains | | | — | | | | — | | | | — | | | | — | | | | — | |
|
1 Undistributed net ordinary income (on a tax basis) has not been reduced for the dividend declared on July 1, 2021, paid on August 2, 2021. 2 Net ordinary income consists of net taxable income derived from dividends, interest and net short-term capital gains, if any. | |
The tax character of distributions paid during the Funds’ tax years ended July 31, 2021 and July 31, 2020 was designated for purposes of the dividends paid deduction as follows:
| | | | | | | | | | | | | | | | | | | | |
| 2021 | | NSL | | | JFR | | | JRO | | | JSD | | | JQC | |
Distributions from net ordinary income2 | | $ | 14,807,499 | | | $ | 35,545,583 | | | $ | 24,932,849 | | | $ | 9,490,595 | | | $ | 40,633,984 | |
Distributions from net long-term capital gains | | | — | | | | — | | | | — | | | | — | | | | — | |
Return of capital | | | — | | | | — | | | | — | | | | — | | | | 74,850,888 | |
| | | | | | | | | | | | | | | | | | | | |
| 2020 | | NSL | | | JFR | | | JRO | | | JSD | | | JQC | |
Distributions from net ordinary income2 | | $ | 17,466,425 | | | $ | 43,203,962 | | | $ | 30,256,614 | | | $ | 12,396,623 | | | $ | 53,064,705 | |
Distributions from net long-term capital gains | | | — | | | | — | | | | — | | | | — | | | | — | |
Return of capital | | | — | | | | — | | | | — | | | | — | | | | 100,485,694 | |
| 2 | Net ordinary income consists of net taxable income derived from dividends, interest, and net short-term capital gains, if any. |
As of July 31, 2021, the Funds’ tax year end, the Funds had unused capital losses carrying forward available for federal income tax purposes to be applied against future capital gains, if any. The capital losses are not subject to expiration.
| | | | | | | | | | | | | | | | | | | | |
| | | NSL | | | JFR | | | JRO | | | JSD | | | JQC | |
Not subject to expiration: | | | | | | | | | | | | | | | | | | | | |
Short-term | | $ | 2,300,950 | | | $ | 4,896,511 | | | $ | 3,285,667 | | | $ | 2,606,605 | | | $ | 29,554,323 | |
Long-term | | | 39,472,372 | | | | 91,553,241 | | | | 67,032,823 | | | | 25,324,019 | | | | 171,792,619 | |
Total | | $ | 41,773,322 | | | $ | 96,449,752 | | | $ | 70,318,490 | | | $ | 27,930,624 | | | $ | 201,346,942 | |
7. Management Fees
Each Fund’s management fee compensates the Adviser for overall investment advisory and administrative services and general office facilities. The Sub-Adviser is compensated for its services to the Funds from the management fees paid to the Adviser.
119
Notes to Financial Statements (continued)
Each Fund’s management fee consists of two components – a fund-level fee, based only on the amount of assets within each individual Fund, and a complex-level fee, based on the aggregate amount of all eligible fund assets managed by the Adviser. This pricing structure enables Fund shareholders to benefit from growth in the assets within their respective Fund as well as from growth in the amount of complex-wide assets managed by the Adviser.
The annual fund-level fee, payable monthly, for each Fund is calculated according to the following schedule:
| | | | | | | | |
| Average Daily Managed Assets* | | NSL JFR JRO JSD
Fund-Level Fee Rate | | | JQC
Fund-Level Fee Rate | |
For the first $500 million | | | 0.6500 | % | | | 0.6800 | % |
For the next $500 million | | | 0.6250 | | | | 0.6550 | |
For the next $500 million | | | 0.6000 | | | | 0.6300 | |
For the next $500 million | | | 0.5750 | | | | 0.6050 | |
For managed assets over $2 billion | | | 0.5500 | | | | 0.5800 | |
The annual complex-level fee, payable monthly, for each Fund is calculated by multiplying the current complex-wide fee rate, determined according to the following schedule by the Funds’ daily managed assets:
| | | | |
| Complex-Level Eligible Asset Breakpoint Level* | | Effective Complex-Level Fee Rate at Breakpoint Level | |
$55 billion | | | 0.2000 | % |
$56 billion | | | 0.1996 | |
$57 billion | | | 0.1989 | |
$60 billion | | | 0.1961 | |
$63 billion | | | 0.1931 | |
$66 billion | | | 0.1900 | |
$71 billion | | | 0.1851 | |
$76 billion | | | 0.1806 | |
$80 billion | | | 0.1773 | |
$91 billion | | | 0.1691 | |
$125 billion | | | 0.1599 | |
$200 billion | | | 0.1505 | |
$250 billion | | | 0.1469 | |
$300 billion | | | 0.1445 | |
| * | For the complex-level fees, managed assets include closed-end fund assets managed by the Adviser that are attributable to certain types of leverage. For these purposes, leverage includes the funds’ use of preferred stock and borrowings and certain investments in the residual interest certificates (also called inverse floating rate securities) in tender option bond (TOB) trusts, including the portion of assets held by a TOB trust that has been effectively financed by the trust’s issuance of floating rate securities, subject to an agreement by the Adviser as to certain funds to limit the amount of such assets for determining managed assets in certain circumstances. The complex-level fee is calculated based upon the aggregate daily managed assets of all Nuveen open-end and closed-end funds that constitute ‘’eligible assets.” Eligible assets do not include assets attributable to investments in other Nuveen funds or assets in excess of a determined amount (originally $2 billion) added to the Nuveen fund complex in connection with the Adviser’s assumption of the management of the former First American Funds effective January 1, 2011, but do not include certain assets of certain Nuveen funds that were reorganized into funds advised by an affiliate of the Adviser during the 2019 calendar year. As of July 31, 2021, the complex-level fee for each Fund was 0.1536%. |
8. Commitments and Contingencies
In the normal course of business, each Fund enters into a variety of agreements that may expose the Fund to some risk of loss. These could include certain agreements related to preferred shares, which are described elsewhere in these Notes to Financial Statements. The risk of future loss arising from such agreements, while not quantifiable, is expected to be remote. As of the end of the reporting period, the Funds did not have any unfunded commitments.
From time to time, the Funds may be a party to certain legal proceedings in the ordinary course of business, including proceedings relating to the enforcement of the Funds’ rights under contracts. As of the end of the reporting period, the Funds are not subject to any material legal proceedings.
9. Fund Leverage
Borrowings
Each Fund has entered into a borrowing arrangement (“Borrowings”) as a means of leverage.
120
Borrowing Information for NSL, JFR and JRO
The following Funds have entered into a revolving credit and security agreement with certain banks and their affiliates. As of the end of the reporting period, each Fund’s maximum commitment amount under its Borrowings is as follows:
| | | | | | | | | | | | |
| | | NSL | | | JFR | | | JRO | |
Maximum commitment amount | | $ | 102,500,000 | | | $ | 260,000,000 | | | $ | 180,000,000 | |
As of the end of the reporting period, each Fund’s outstanding balance on its Borrowings was as follows:
| | | | | | | | | | | | |
| | | NSL | | | JFR | | | JRO | |
Outstanding balance on Borrowings | | $ | 94,300,000 | | | $ | 238,400,000 | | | $ | 164,500,000 | |
NSL interest is charged at a rate equal 1-Month LIBOR (London Inter-Bank Offered Rate) plus 0.80% (prior to October 5, 2020 the interest rate was equal to the higher of (a) 1-Month LIBOR plus 0.75% or (b) the Federal Funds rate plus 0.75%). For JFR and JRO, interest is charged at a rate equal to 1-Month LIBOR plus 0.80%. JFR accrues 0.25% per annum on the undrawn balance if the undrawn portion of the Borrowings on a particular day is more than 25% of the maximum commitment amount. NSL and JRO accrue 0.30% per annum on the undrawn balance if the undrawn portion of the Borrowings on a particular day is more than 10% of the maximum commitment amount. NSL also accrued an upfront fee of 0.05% on the maximum commitment amount and which was/will be paid in two installments, half at the closing of the agreement in October 2020 and the other half upon its 12-month anniversary in 2021.
On October 5, 2020, NSL entered into a new Borrowing facility and on March 26, 2021, NSL renewed its Borrowing through October 4, 2021. On November 5, 2020, JRO renewed its Borrowings through November 4, 2021. On December 18, 2020, January 22, 2021 and January 29, 2021, JFR renewed its Borrowings through December 18, 2021. Maximum commitment downsized to $260,000,000 on December 10, 2020. All other items of the Borrowings remain unchanged.
During the Funds’ utilization period(s) during the current fiscal period, the average daily balance outstanding (which was for the entire current reporting period) and average annual interest rate on each Fund’s Borrowings were as follows:
| | | | | | | | | | | | |
| | | NSL | | | JFR | | | JRO | |
Average daily balance outstanding | | $ | 91,798,082 | | | $ | 227,504,384 | | | $ | 160,261,096 | |
Average annual interest rate | | | 1.00 | % | | | 1.02 | % | | | 0.98 | % |
Borrowings Information for JSD
The Fund has outstanding a 364-day revolving line of credit. As of the end of the reporting period, the Fund’s maximum commitment amount under its Borrowings is as follows:
| | | | |
| | | JSD | |
Maximum commitment amount | | $ | 30,000,000 | |
As of the end of the reporting period, the Fund’s outstanding balance on its Borrowings was as follows:
| | | | |
| | | JSD | |
Outstanding balance on Borrowings | | $ | 19,500,000 | |
Interest is charged on these Borrowings at a rate per annum equal to 1-Month LIBOR plus 0.80%. The Fund also accrued 0.15% per annum on the undrawn portion if it was less than 50% of the maximum commitment; however, if the undrawn portion of the Borrowings was greater than 50% of the maximum commitment amount the Fund accrued a 0.25% per annum on the undrawn portion of the Borrowings.
On October 28, 2020 and May 3, 2021, JSD renewed its Borrowings through October 27, 2021. The Fund also accrued a 0.05% amendment fee based on the maximum commitment amount. Maximum commitment increased to $30,000,000. All other items of the Borrowings remain unchanged.
During the Fund’s utilization period(s) during the current fiscal period, the average daily balance outstanding (which was for the entire current reporting period) and average annual interest rate on the Fund’s Borrowings were as follows:
| | | | |
| | | JSD | |
Average daily balance outstanding | | $ | 14,519,178 | |
Average annual interest rate | | | 1.07 | % |
121
Notes to Financial Statements (continued)
Borrowings Information for JQC
The Fund has entered into a borrowing agreement with a bank and its affiliate. As of the end of the reporting period, the Fund’s maximum commitment amount under its Borrowings is as follows:
| | | | |
| | | JQC | |
Maximum commitment amount | | $ | 430,000,000 | |
As of the end of the reporting period, the Fund’s outstanding balance on its Borrowings was as follows:
| | | | |
| | | JQC | |
Outstanding balance on Borrowings | | $ | 402,000,000 | |
Interest is charged on the Borrowings at a rate per annum equal to the 3-Month LIBOR plus 1.10% (1.40% prior to March 31, 2021) and the Fund accrues 1.10% per annum on any positive difference between 90% of the maximum commitment amount and the daily drawn amount. On March 31, 2021, the Fund renewed its Borrowings through April 1, 2023 and increased its maximum commitment to $430,000,000. All other items remain unchanged.
During the Fund’s utilization period(s) during the current fiscal period, the average daily balance outstanding (which was for the entire current reporting period) and average annual interest rate on the Fund’s Borrowings were as follows:
| | | | |
| | | JQC | |
Average daily balance outstanding | | $ | 399,021,918 | |
Average annual interest rate | | | 1.55 | % |
Other Borrowings Information for the Funds
In order to maintain their Borrowings, the Funds must meet certain collateral, asset coverage and other requirements. Each Fund’s Borrowings outstanding is fully secured by eligible securities held in its portfolio of investments.
Each Fund’s Borrowings outstanding is recognized as “Borrowings” on the Statement of Assets and Liabilities. Interest expense incurred on the borrowed amount, undrawn balance and initial fees are recognized as a component of “Interest expense and amortization of offering costs” on the Statement of Operations.
Reverse Repurchase Agreements
During the current fiscal period, JQC used reverse repurchase agreements as a means of leverage.
The Fund may enter into a reverse repurchase agreement with brokers, dealers, banks or other financial institutions that have been determined by the Adviser to be creditworthy. In a reverse repurchase agreement, a Fund sells to the counterparty a security that it holds with a contemporaneous agreement to repurchase the same security at an agreed-upon price and date, reflecting the interest rate effective for the term of the agreement. It may also be viewed as the borrowing of money by the Fund. Cash received in exchange for securities delivered, plus accrued interest payments to be made by the Fund to a counterparty, are reflected as a liability on the Statement of Assets and Liabilities. Interest payments made by the Fund to counterparties are recognized as a component of “Interest expense and amortization of offering costs” on the Statement of Operations.
In a reverse repurchase agreement, the Fund retains the risk of loss associated with the sold security. In order to minimize risk, the Fund identifies for coverage securities and cash as collateral with a fair value at least equal to its purchase obligations under these agreements (including accrued interest). Reverse repurchase agreements also involve the risk that the purchaser fails to return the securities as agreed upon, files for bankruptcy or becomes insolvent. Upon a bankruptcy or insolvency of a counterparty, the Fund is considered to be an unsecured creditor with respect to excess collateral and as such the return of excess collateral may be delayed. The Fund will identify assets determined to be liquid by the Adviser to cover its obligations under reverse repurchase agreements.
As of the end of the reporting period, the Fund’s outstanding balances on its reverse repurchase agreements were as follows:
| | | | | | | | | | | | | | | | | | | | |
| Counterparty | | Rate | | | Principal
Amount | | | Maturity | | | Value | | | Value and
Accrued Interest | |
Societe Generale | | | 3-Month LIBOR plus 0.80 | %* | | $ | (142,000,000 | ) | | | N/A | | | $ | (142,000,000 | ) | | $ | (142,119,265 | ) |
| * | Effective April 1, 2021, the rate changed from 3-Month LIBOR plus 0.85% to 3-Month LIBOR plus 0.80%. |
N/A – Maturity is not applicable. The final repurchase date will be established following pre-specified advance notice by the Fund or the counterparty to the reverse repurchase agreement.
122
During the current fiscal period, the average daily balance outstanding (which was for the entire current reporting period) and average interest rate on the Fund’s reverse repurchase agreements were as follows:
| | | | |
| | | JQC | |
Average daily balance outstanding | | | $135,082,192 | |
Average interest rate | | | 1.07 | % |
The following table presents the reverse repurchase agreements subject to netting agreements and the collateral delivered related to those reverse repurchase agreements.
| | | | | | | | |
| Counterparty | | Reverse Repurchase
Agreements* | | | Collateral Pledged
to Counterparty | |
Societe Generale | | $ | (142,119,265 | ) | | $ | 159,252,969 | |
| * | Represents gross value and accrued interest for the counterparty as reported in the preceding table. |
10. Inter-Fund Lending
Inter-Fund Borrowing and Leading
The SEC has granted an exemptive order permitting registered open-end and closed-end Nuveen funds to participate in an inter-fund lending facility whereby the Nuveen funds may directly lend to and borrow money from each other for temporary purposes (e.g., to satisfy redemption requests or when a sale of securities “fails,” resulting in an unanticipated cash shortfall) (the “Inter-Fund Program”). The closed-end Nuveen funds, including the Funds covered by this shareholder report, will participate only as lenders, and not as borrowers, in the Inter-Fund Program because such closed-end funds rarely, if ever, need to borrow cash to meet redemptions. The Inter-Fund Program is subject to a number of conditions, including, among other things, the requirements that (1) no fund may borrow or lend money through the Inter-Fund Program unless it receives a more favorable interest rate than is typically available from a bank or other financial institution for a comparable transaction; (2) no fund may borrow on an unsecured basis through the Inter-Fund Program unless the fund’s outstanding borrowings from all sources immediately after the inter-fund borrowing total 10% or less of its total assets; provided that if the borrowing fund has a secured borrowing outstanding from any other lender, including but not limited to another fund, the inter-fund loan must be secured on at least an equal priority basis with at least an equivalent percentage of collateral to loan value; (3) if a fund’s total outstanding borrowings immediately after an inter-fund borrowing would be greater than 10% of its total assets, the fund may borrow through the inter-fund loan on a secured basis only; (4) no fund may lend money if the loan would cause its aggregate outstanding loans through the Inter-Fund Program to exceed 15% of its net assets at the time of the loan; (5) a fund’s inter-fund loans to any one fund shall not exceed 5% of the lending fund’s net assets; (6) the duration of inter-fund loans will be limited to the time required to receive payment for securities sold, but in no event more than seven days; and (7) each inter-fund loan may be called on one business day’s notice by a lending fund and may be repaid on any day by a borrowing fund. In addition, a Nuveen fund may participate in the Inter-Fund Program only if and to the extent that such participation is consistent with the fund’s investment objective and investment policies. The Board is responsible for overseeing the Inter-Fund Program.
The limitations detailed above and the other conditions of the SEC exemptive order permitting the Inter-Fund Program are designed to minimize the risks associated with Inter-Fund Program for both the lending fund and the borrowing fund. However, no borrowing or lending activity is without risk. When a fund borrows money from another fund, there is a risk that the loan could be called on one day’s notice or not renewed, in which case the fund may have to borrow from a bank at a higher rate or take other actions to payoff such loan if an inter-fund loan is not available from another fund. Any delay in repayment to a lending fund could result in a lost investment opportunity or additional borrowing costs.
During the current reporting period, none of the Funds covered by this shareholder report have entered into any inter-fund loan activity.
11. Subsequent Events
Distributions to Common Shareholders
On September 20, 2021, JQC announced that the Board approved the adoption of a level distribution policy. The level distribution policy is intended to provide shareholders with stable, but not guaranteed, cash flow, independent of the amount or timing of income earned or capital gains realized by the Fund. The Fund intends to distribute all or substantially all of its net investment income through its regular monthly distribution and to distribute realized capital gains at least annually. In addition, in any monthly period, in order to maintain its level distribution amount, the Fund may pay out more than its net investment income during the period. As a result, distribution sources may include net investment income, realized gains and return of capital. The level distribution policy will become effective with the Fund’s distribution payable November 1, 2021.
123
Shareholder Update
(Unaudited)
CURRENT INVESTMENT OBJECTIVES, INVESTMENT POLICIES AND PRINCIPAL RISKS OF THE FUNDS
NUVEEN SENIOR INCOME FUND (NSL)
Investment Objective
The Fund’s investment objective is to achieve a high level of current income, consistent with preservation of capital.
Investment Policies
The Fund invests at least 80% of its Assets (as defined below) in adjustable rate, U.S. dollar-denominated secured and unsecured senior loans (“Senior Loans”), which unsecured Senior Loans will be, at the time of investment, investment grade quality. Investment grade quality securities are those securities that, at the time of investment, are rated by at least one nationally recognized statistical rating organization (“NRSRO”) within the four highest grades unrated but judged to be of comparable quality.
With respect to the Fund’s Senior Loans included in the 80% policy, such instruments will at all times have a dollar-weighted average time until the next interest rate adjustment of 90 days or less.
The Fund invests primarily in adjustable rate U.S. dollar-denominated secured Senior Loans.
“Assets” mean the net assets of the Fund plus the amount of any borrowings for investment purposes. “Managed Assets” mean the total assets of the Fund, minus the sum of its accrued liabilities (other than Fund liabilities incurred for the express purpose of creating leverage). Total assets for this purpose shall include assets attributable to the Fund’s use of leverage (whether or not those assets are reflected in the Fund’s financial statements for purposes of generally accepted accounting principles), and derivatives will be valued at their market value.
Under normal circumstances:
| | • | | No more than 30% of the Fund’s Managed Assets may be invested in Senior Loans and other debt securities that are, at the time of investment, rated CCC+ or Caa or below by Standard & Poor’s Corporation, a division of The McGraw-Hill Companies (“S&P”), Moody’s Investor Service, Inc. (“Moody’s”) or Fitch Ratings, part of the Fitch Group (“Fitch”) or that are unrated but judged to be of comparable quality. |
| | • | | The Fund will invest at least 65% of its Managed Assets in Senior Loans that are secured by specific collateral. Such collateral consists of assets and/or stock of the borrower. |
| | • | | The Fund may invest up to 20% of its Managed Assets in U.S. dollar-denominated Senior Loans of Borrowers that are organized or located in countries outside the United States. |
| | • | | The Fund may invest up to 20% of its Managed Assets, in the aggregate, in: |
| | ¡ | | other income producing securities such as investment and non-investment grade corporate debt securities, of corporate or governmental issuers; and |
| | ¡ | | equity securities and warrants acquired in connection with the Fund’s investments in Senior Loans. |
| | • | | The Fund will not invest more than 10% of its Managed Assets in Senior Loans with interest rates that adjust less often than semi-annually. |
| | • | | The Fund’s portfolio of Senior Loans will at all times have a dollar-weighted average time until the next interest rate adjustment of 90 days or less. The Fund may use interest rate swaps and other investment practices to shorten the effective interest rate adjustment period of Senior Loans. If the Fund does so, it considers the shortened period to be the adjustment period of the Senior Loans. |
| | • | | The Fund has no policy limiting the maturity of the Senior Loans that it purchases. |
| | • | | The Fund does not intend to invest more than 5% of its Managed Assets in Senior Loans or other securities of a single borrower. In addition, the Fund will not invest more than 25% of its Managed Assets in borrowers that conduct their principal businesses in the same industry. |
| | • | | The Fund will invest no more than 20% of its total assets in Senior Loans in which it acts as an agent or co-agent, and the size of any such individual Senior Loan will not exceed 5% of the Fund’s total assets. |
| | • | | The Fund does not currently intend to invest more than 20% of its Managed Assets in participations. Participations are when the Fund acquires from a lender a portion of a lender’s rights under a loan agreement. |
| | • | | The Fund will only acquire participations if the lender selling the participation, and any other persons interpositioned between the Fund and the lender, (i) at the time of investment has outstanding debt or deposit obligations rated investment grade (BBB or A-3 or higher by |
124
| | S&P, Baa or P-3 or higher by Moody’s or BBB or F3 or higher by Fitch or has debt or obligations that are unrated by S&P, Moody’s and Fitch and determined by the Fund’s investment adviser to be of comparable quality and (ii) has entered into an agreement which provides for the holding of assets in safekeeping for, or the prompt disbursement of assets to, the Fund. |
| | • | | The Fund may invest up to 10% of its Managed Assets in securities of other open- or closed-end investment companies (including exchange-traded funds (“ETFs”)) that invest primarily in the types in which the Fund may invest directly. |
| | • | | The Fund may invest up to 5% of its Managed Assets in iBoxx Loan Total Return Swaps. Such swaps are standardized total return swaps on loan indices that are designed to provide exposure to the Senior Loan market. |
The foregoing policies apply only at the time of any new investment.
Approving Changes in Investment Policies
The Board of Trustees of the Fund may change the policies described above without a shareholder vote. However, with respect to the Fund’s policy of investing at least 80% of its Assets in adjustable rate, U.S. dollar-denominated, secured and unsecured Senior Loans, which unsecured Senior Loans will be, at the time of investment, investment grade quality, such policy may not be changed without 60 days’ prior written notice.
Portfolio Contents
The Fund generally invests in Senior Loans. Senior Loans typically hold the most senior position in the capital structure of a business entity, are typically secured with specific collateral and have a claim on the assets and/or stock of the issuer that is senior to that held by subordinated debt holders and stockholders of the issuer.
Senior Loans generally include: (i) Senior Loans made by banks or other financial institutions to U.S. and non-U.S. corporations, partnerships and other business entities (each a “Borrower” and, collectively, “Borrowers”), (ii) assignments of such interests in Senior Loans, or (iii) participation interests in Senior Loans. Generally, an assignment is the actual sale of the loan, in whole or in part. A participation, on the other hand, means that the original lender maintains ownership over the loan and the participant has only a contract right against the original lender, not a credit relationship with the Borrower. Senior Loans typically hold the most senior position in the capital structure of a Borrower, are typically secured with specific collateral and have a claim on the assets and/or stock of the Borrower that is senior to that held by subordinated debt holders and stockholders of the Borrower. The capital structure of a Borrower may include Senior Loans, senior and junior subordinated debt, preferred stock and common stock issued by the Borrower, typically in descending order of seniority with respect to claims on the Borrower’s assets. The proceeds of Senior Loans primarily are used by Borrowers to finance leveraged buyouts, recapitalizations, mergers, acquisitions, stock repurchases, refinancings, internal growth and for other corporate purposes. A Senior Loan is typically originated, negotiated and structured by a U.S. or non-U.S. commercial bank, insurance company, finance company or other financial institution (“Agent”) for a lending syndicate of financial institutions which typically includes the Agent (“Lenders”). The Agent typically administers and enforces the Senior Loan on behalf of the other Lenders in the syndicate. In addition, an institution, typically but not always the Agent, holds any collateral on behalf of the Lenders. The Fund normally will rely primarily on the Agent to collect principal of and interest on a Senior Loan. Also, the Fund usually will rely on the Agent to monitor compliance by the Borrower with the restrictive covenants in a loan agreement.
Senior Loans typically have rates of interest that are redetermined either daily, monthly, quarterly or semi-annually by reference to a base lending rate plus a premium or credit spread. These base lending rates are primarily the London Inter-Bank Offered Rate (“LIBOR”), and secondarily the prime rate offered by one or more major U.S. banks and the certificate of deposit rate or other base lending rates used by commercial lenders. The base rate for Senior Loans after 2021 has not yet been determined with the discontinuation of LIBOR. As adjustable rate loans, the frequency of how often a Senior Loan resets its interest rate will impact how closely such Senior Loans track current market interest rates.
The Fund may purchase participations in Senior Loans. By purchasing a participation interest in a loan, the Fund acquires some or all of the interest of a bank or other financial institution in a loan to a Borrower. Under a participation, the Fund generally will have rights that are more limited than the rights of lenders or of persons who acquire a Senior Loan by assignment. In a participation, the Fund typically has a contractual relationship with the lender selling the participation, but not with the Borrower. As a result, the Fund assumes the credit risk of the lender selling the participation in addition to the credit risk of the Borrower. In the event of insolvency of the lender selling the participation, the Fund may be treated as a general creditor of the lender and may not have a senior claim to the lenders’ interest in the Senior Loan. A lender selling a participation and other persons interpositioned between the lender and the Fund with respect to participations will likely conduct their principal business activities in the banking, finance and financial services industries.
The Fund may invest in U.S. dollar denominated Senior Loans of Borrowers that are organized or located in countries outside the United States, including Borrowers organized or located in emerging markets countries. Although the Senior Loans will require payment of interest and principal in U.S. dollars, these Borrowers may have significant non-U.S. dollar revenues. Investment in foreign Borrowers involves special risks and investors should understand and consider carefully the risks involved in investing in securities of non-U.S. issuers.
125
Shareholder Update (continued)
(Unaudited)
The Fund may invest in corporate debt securities, including corporate bonds. Corporate debt securities are fully taxable debt obligations issued by corporations. These securities fund capital improvements, expansions, debt refinancing or acquisitions that require more capital than would ordinarily be available from a single lender. Investors in corporate debt securities lend money to the issuing corporation in exchange for interest payments and repayment of the principal at a set maturity date. Rates on corporate debt securities are set according to prevailing interest rates at the time of the issue, the credit rating of the issuer, the length of the maturity and other terms of the security, such as a call feature.
The Fund may utilize structured notes and similar instruments for investment purposes and also for hedging purposes. Structured notes are privately negotiated debt obligations where the principal and/or interest is determined by reference to the performance of a benchmark asset, market or interest rate (an “embedded index”), such as selected securities, an index of securities or specified interest rates, or the differential performance of two assets or markets.
The Fund may acquire equity securities and warrants issued by a Borrower or its affiliates as part of a package of investments in the Borrower or its affiliates issued in connection with a Senior Loan of the Borrower. The Fund also may convert a warrant so acquired into the underlying security. Investments in warrants and equity securities entail certain risks in addition to those associated with investments in Senior Loans. The value of these securities may be affected more rapidly, and to a greater extent, by company-specific developments and general market conditions. These risks may increase fluctuations in the Fund’s net asset value. The Fund may possess material non-public information about a Borrower as a result of its ownership of a Senior Loan of such Borrower. Because of prohibitions on trading in securities of issuers while in possession of such information the Fund might be unable to enter into a transaction in a security of such a Borrower when it would otherwise be advantageous to do so.
The Fund may invest in commercial paper. Commercial paper represents short-term unsecured promissory notes issued in bearer form by corporations such as banks or bank holding companies and finance companies. The rate of return on commercial paper may be linked or indexed to the level of exchange rates between the U.S. dollar and a foreign currency or currencies.
The Fund may invest in U.S. Government securities. U.S. Government securities include (1) U.S. Treasury obligations, which differ in their interest rates, maturities and times of issuance: U.S. Treasury bills (maturities of one year or less), U.S. Treasury notes (maturities of one year to ten years) and U.S. Treasury bonds (generally maturities of greater than ten years) and (2) obligations issued or guaranteed by U.S. Government agencies and instrumentalities that are supported by any of the following: (i) the full faith and credit of the U.S. Treasury, (ii) the right of the issuer to borrow an amount limited to a specific line of credit from the U.S. Treasury, (iii) discretionary authority of the U.S. Government to purchase certain obligations of the U.S. Government agency or instrumentality or (iv) the credit of the agency or instrumentality.
The Fund may invest in zero coupon bonds. A zero coupon bond is a bond that typically does not pay interest for the entire life of the obligation or for an initial period after the issuance of the obligation.
The Fund may buy and sell securities on a when-issued or delayed delivery basis, making payment or taking delivery at a later date, normally within 15 to 45 days of the trade date.
The Fund may invest in illiquid securities (i.e., securities that are not readily marketable), including, but not limited to, restricted securities (securities the disposition of which is restricted under the federal securities laws), securities that may be resold only pursuant to Rule 144A under the Securities Act of 1933, as amended (the “1933 Act”), and repurchase agreements with maturities in excess of seven days.
The Fund may enter into certain derivative instruments in pursuit of its investment objective, including to seek to enhance return, to hedge certain risks of its investments in Senior Loans or as a substitute for a position in the underlying asset. Such instruments include total return swaps; interest rate swaps; credit default swaps; interest rate caps; interest rate floors; interest rate collars; swaptions; credit-linked notes; securities indices; other indices or other financial instruments; stock and bond index futures; futures contracts on securities; options on securities; options on futures contracts; options on stock and bond indexes; interest rate futures; exchange-traded and over-the-counter options on securities or indices; index linked securities; currency exchange transactions; financial futures; options on financial futures; index futures; index options; index options on futures contracts; interest rate options; interest rate option on futures contracts; short sales; structured notes; options on U.S. Treasury security or U.S. Government Agency securities; U.S. Treasury security or U.S. Government Agency security futures contracts; and options on U.S. Treasury security or U.S. Government Agency security futures contracts.
The Fund may also invest in securities of other open- or closed-end investment companies (including ETFs) that invest primarily in the types in which the Fund may invest directly, to the extent permitted by the Investment Company Act of 1940, as amended (the “1940 Act”), the rules and regulations issued thereunder and applicable exemptive orders issued by the Securities and Exchange Commission (“SEC”).
Use of Leverage
The Fund uses leverage to pursue its investment objective. The Fund may use leverage to the extent permitted by the 1940 Act. The Fund may source leverage through a number of methods including through borrowings, issuing preferred shares of beneficial (“Preferred Shares”), the issuance of debt
126
securities, and entering into reverse repurchase agreements (effectively a borrowing). In addition, the Fund may use derivatives that may have the economic effect of leverage, such as certain credit default swaps, total return swaps and bond futures. The amount and sources of leverage will vary depending on market conditions.
Temporary Defensive Periods
During temporary defensive periods (e.g., times when, in the Fund’s investment adviser’s and/or the Fund’s sub-adviser’s opinion, temporary imbalances of supply and demand or other temporary dislocations in the Senior Loan market adversely affect the price at which Senior Loans are available), the Fund may invest up to 100% of its assets in high quality, short-term securities, and in short-, intermediate-, or long-term U.S. Treasury securities. There can be no assurance that such techniques will be successful. Accordingly, during such periods, the Fund may not achieve its investment objective.
127
Shareholder Update (continued)
(Unaudited)
NUVEEN FLOATING RATE INCOME FUND (JFR)
Investment Objective
The Fund’s investment objective is to achieve a high level of current income.
Investment Policies
The Fund invests at least 80% of its Assets (as defined below) in secured Senior Loans and unsecured Senior Loans, which unsecured Senior Loans will be, at the time of investment, investment grade quality.
With respect to the Fund’s Senior Loans included in the 80% policy, such instruments will at times have a dollar-weighted average time until the next interest rate adjustment of 90 days or less.
“Assets” mean the net assets of the Fund plus the amount of any borrowings for investment purposes. “Managed Assets” mean the total assets of the Fund, minus the sum of its accrued liabilities (other than Fund liabilities incurred for the express purpose of creating leverage). Total assets for this purpose shall include assets attributable to the Fund’s use of leverage (whether or not those assets are reflected in the Fund’s financial statements for purposes of generally accepted accounting principles), and derivatives will be valued at their market value.
Under normal circumstances:
| | • | | The Fund invests at least 65% of its Managed Assets in Senior Loans that are secured by specific collateral. |
| | • | | The Fund may invest its Managed Assets without limit in Senior Loans and other debt instruments that are, at the time of investment, rated below investment grade or unrated but judged to be of comparable quality. Investment grade quality securities are those securities that, at the time of investment, are (i) rated by at least one nationally recognized statistical rating organization NRSRO within the four highest grades (BBB- or Baa3 or better by S&P, Moody’s or Fitch, or (ii) unrated but judged to be of comparable quality. However, no more than 30% of the Fund’s Managed Assets may be invested in Senior Loans and other debt securities that are, at the time of investment, rated CCC+ or Caa or below by S&P, Moody’s or Fitch or that are unrated but judged to be of comparable quality. |
| | • | | The Fund may invest up to 20% of its Managed Assets in (i) other debt securities such as investment and non-investment grade debt securities, convertible securities and structured notes (other than structured notes that are designed to provide returns and risks that emulate those of Senior Loans, which may be treated as an investment in Senior Loans for purposes of the 80% requirement set forth above), (ii) mortgage-related and other asset-backed securities (including collateralized loan obligations and collateralized debt obligations), and (iii) debt securities and other instruments issued by government, government-related or supranational issuers (commonly referred to as sovereign debt securities). No more than 5% of the Fund’s Managed Assets may be invested in each of convertible securities, mortgage-related and other asset-backed securities, and sovereign debt securities. The debt securities in which the Fund may invest may have short-term, intermediate-term or long-term maturities. The Fund also may receive warrants and equity securities issued by a borrower or its affiliates in connection with the Fund’s other investments in such entities. |
| | • | | The Fund maintains an average duration of one year or less for its portfolio investments in Senior Loans and other debt instruments. |
| | • | | The Fund will not invest in inverse floating rate securities. |
| | • | | The Fund may invest up to 20% of its Managed Assets in securities of non-U.S. issuers (which includes borrowers) that are U.S. dollar or non-U.S. dollar denominated. The Fund’s Managed Assets to be invested in Senior Loans and other debt instruments of non-U.S. issuers may include debt securities of issuers located, or conducting their business in, emerging markets countries. |
| | • | | The Fund may not invest more than 20% of its Managed Assets in securities from an industry which (for purposes of this policy) generally refers to the classification of companies in the same or similar lines of business such as the automotive, textiles and apparel, hotels, media production and consumer retailing industries. The Fund may invest more than 20% of its Managed Assets in sectors which (for purposes of this policy) generally refers to broader classifications of industries, such as the consumer discretionary sector which includes the automotive, textiles and apparel, hotels, media production and consumer retailing industries, provided the Fund’s investment in a particular industry within the sector does not exceed the industry limitation. |
| | • | | The Fund may invest up to 5% of its Managed Assets in iBoxx Loan Total Return Swaps. An iBoxx Loan Total Return Swap is a specific type of total return swap on an index that is designed to provide exposure to the Senior Loan market. The iBoxx Loan Total Return Swap’s underlying index is the Markit iBoxx USD Liquid Leveraged Loans Total Return Index, which is one of a subset of indices designed to track the broader, rules-based Markit iBoxx USD Liquid Leveraged Loan Index. “iBoxx Loan Total Return Swaps” means total return swaps written on the Markit iBoxx USD Liquid Leveraged Loans Total Return Index. |
The foregoing policies apply only at the time of any new investment.
128
Approving Changes in Investment Policies
The Board of Trustees of the Fund may change the policies described above without a shareholder vote. However, with respect to the Fund’s policy of investing at least 80% of its Assets in secured Senior Loans and unsecured Senior Loans, which unsecured Senior Loans will be, at the time of investment, investment grade quality, such policy may not be changed without 60 days’ prior written notice.
Portfolio Contents
The Fund generally invests in Senior Loans. Senior Loans typically hold the most senior position in the capital structure of a business entity, are typically secured with specific collateral and have a claim on the assets and/or stock of the issuer that is senior to that held by subordinated debt holders and stockholders of the issuer.
Senior Loans generally include: (i) Senior Loans made by banks or other financial institutions to U.S. and non-U.S. corporations, partnerships and other business entities (each a “Borrower” and, collectively, “Borrowers”), (ii) assignments of such interests in Senior Loans, or (iii) participation interests in Senior Loans. Generally, an assignment is the actual sale of the loan, in whole or in part. A participation, on the other hand, means that the original lender maintains ownership over the loan and the participant has only a contract right against the original lender, not a credit relationship with the Borrower. Senior Loans typically hold the most senior position in the capital structure of a Borrower, are typically secured with specific collateral and have a claim on the assets and/or stock of the Borrower that is senior to that held by subordinated debt holders and stockholders of the Borrower. The capital structure of a Borrower may include Senior Loans, senior and junior subordinated debt, preferred stock and common stock issued by the Borrower, typically in descending order of seniority with respect to claims on the Borrower’s assets. The proceeds of Senior Loans primarily are used by Borrowers to finance leveraged buyouts, recapitalizations, mergers, acquisitions, stock repurchases, refinancings, internal growth and for other corporate purposes. A Senior Loan is typically originated, negotiated and structured by a U.S. or non-U.S. commercial bank, insurance company, finance company or other financial institution (“Agent”) for a lending syndicate of financial institutions which typically includes the Agent (“Lenders”). The Agent typically administers and enforces the Senior Loan on behalf of the other Lenders in the syndicate. In addition, an institution, typically but not always the Agent, holds any collateral on behalf of the Lenders. The Fund normally will rely primarily on the Agent to collect principal of and interest on a Senior Loan. Also, the Fund usually will rely on the Agent to monitor compliance by the Borrower with the restrictive covenants in a loan agreement.
Senior Loans typically have rates of interest that are redetermined either daily, monthly, quarterly or semi-annually by reference to a base lending rate plus a premium or credit spread. These base lending rates are primarily the London Inter-Bank Offered Rate (“LIBOR”), and secondarily the prime rate offered by one or more major U.S. banks and the certificate of deposit rate or other base lending rates used by commercial lenders. The base rate for Senior Loans after 2021 has not yet been determined with the discontinuation of LIBOR. As adjustable rate loans, the frequency of how often a Senior Loan resets its interest rate will impact how closely such Senior Loans track current market interest rates.
The Fund may purchase participations in Senior Loans. By purchasing a participation interest in a loan, the Fund acquires some or all of the interest of a bank or other financial institution in a loan to a Borrower. Under a participation, the Fund generally will have rights that are more limited than the rights of lenders or of persons who acquire a Senior Loan by assignment. In a participation, the Fund typically has a contractual relationship with the lender selling the participation, but not with the Borrower. As a result, the Fund assumes the credit risk of the lender selling the participation in addition to the credit risk of the Borrower. In the event of insolvency of the lender selling the participation, the Fund may be treated as a general creditor of the lender and may not have a senior claim to the lenders’ interest in the Senior Loan. A lender selling a participation and other persons interpositioned between the lender and the Fund with respect to participations will likely conduct their principal business activities in the banking, finance and financial services industries.
The Fund may invest in corporate debt securities, including corporate bonds. Corporate debt securities are fully taxable debt obligations issued by corporations. These securities fund capital improvements, expansions, debt refinancing or acquisitions that require more capital than would ordinarily be available from a single lender. Investors in corporate debt securities lend money to the issuing corporation in exchange for interest payments and repayment of the principal at a set maturity date. Rates on corporate debt securities are set according to prevailing interest rates at the time of the issue, the credit rating of the issuer, the length of the maturity and other terms of the security, such as a call feature.
The Fund may utilize structured notes and similar instruments for investment purposes and also for hedging purposes. Structured notes are privately negotiated debt obligations where the principal and/or interest is determined by reference to the performance of a benchmark asset, market or interest rate (an “embedded index”), such as selected securities, an index of securities or specified interest rates, or the differential performance of two assets or markets.
The Fund may invest in debtor-in-possession financings (commonly called “DIP financings”). DIP financings are arranged when an entity seeks the protections of the bankruptcy court under chapter 11 of the U.S. Bankruptcy Code. These financings allow the entity to continue its business operations while reorganizing under chapter 11. Such financings are senior liens on unencumbered security (i.e., security not subject to other creditors claims).
The Fund may acquire equity securities and warrants issued by a Borrower or its affiliates as part of a package of investments in the Borrower or its affiliates issued in connection with a Senior Loan of the Borrower. The Fund also may convert a warrant so acquired into the underlying security.
129
Shareholder Update (continued)
(Unaudited)
Investments in warrants and equity securities entail certain risks in addition to those associated with investments in Senior Loans. The value of these securities may be affected more rapidly, and to a greater extent, by company-specific developments and general market conditions. These risks may increase fluctuations in the Fund’s net asset value. The Fund may possess material non-public information about a Borrower as a result of its ownership of a Senior Loan of such Borrower. Because of prohibitions on trading in securities of issuers while in possession of such information the Fund might be unable to enter into a transaction in a security of such a Borrower when it would otherwise be advantageous to do so.
The Fund may invest in convertible securities, which may include convertible debt, convertible preferred stock, synthetic convertible securities and may also include secured and unsecured debt, based upon the judgment of the Fund’s sub-adviser. Convertible securities may pay interest or dividends that are based on a fixed or floating rate. A convertible security is a preferred stock, warrant or other security that may be converted into or exchanged for a prescribed amount of common stock or other security of the same or a different issuer or into cash within a particular period of time at a specified price or formula.
The Fund may invest in mortgage-related securities. Mortgage-related securities are debt instruments that provide periodic payments consisting of interest and/or principal that are derived from or related to payments of interest and/or principal on underlying mortgages. Additional payments on mortgage-related securities may be made out of unscheduled prepayments of principal resulting from the sale of the underlying property, or from refinancing or foreclosure, net of fees or costs that may be incurred. The mortgage-related securities in which the Fund invests will typically pay variable rates of interest, although the Fund may invest in fixed-rate obligations as well.
The Fund may invest in certain asset-backed securities (“ABS”). ABS are payment claims that are securitized in the form of negotiable paper that is issued by a financing company (generally called a Special Purpose Vehicle or “SPV”). These securitized payment claims are, as a rule, corporate financial assets brought into a pool according to specific diversification rules. The SPV is a company founded solely for the purpose of securitizing these claims and its only asset is the risk arising out of this diversified asset pool. On this basis, marketable securities are issued which, due to the diversification of the underlying risk, generally represent a lower level of risk than the original assets. The redemption of the securities issued by the SPV takes place at maturity out of the cash flow generated by the collected claims.
The Fund may invest in collateralized loan obligations (“CLOs”). A CLO is a structured credit security issued by an SPV that was created to reapportion the risk and return characteristics of a pool of assets. The assets, typically Senior Loans, are used as collateral supporting the various debt tranches issued by the SPV. The key feature of the CLO structure is the prioritization of the cash flows from a pool of debt securities among the several classes of CLO holders, thereby creating a series of obligations with varying rates and maturities appealing to a wide range of investors. CLOs generally are secured by an assignment to a trustee under an indenture pursuant to which the bonds are issued of collateral consisting of a pool of debt instruments, usually, non-investment grade bank loans. Payments with respect to the underlying debt securities generally are made to the trustee under the indenture. CLOs are designed to be retired as the underlying debt instruments are repaid. In the event of sufficient early prepayments on such debt instruments, the class or series of CLO first to mature generally will be retired prior to maturity. Therefore, although in most cases the issuer of CLOs will not supply additional collateral in the event of such prepayments, there will be sufficient collateral to secure their priority with respect to other CLO tranches that remain outstanding. The credit quality of these securities depends primarily upon the quality of the underlying assets, their priority with respect to other CLO tranches and the level of credit support and/or enhancement provided.
The Fund also may invest in collateralized debt obligations (“CDOs”). A CDO is a structured credit security issued by an SPV that was created to reapportion the risk and return characteristics of a pool of assets. The assets, typically non-investment grade bonds, leveraged loans, and other asset-backed obligations, are used as collateral supporting the various debt and equity tranches issued by the SPV. CDOs operate similarly to CLOs.
The Fund may invest in commercial paper. Commercial paper represents short-term unsecured promissory notes issued in bearer form by corporations such as banks or bank holding companies and finance companies. The rate of return on commercial paper may be linked or indexed to the level of exchange rates between the U.S. dollar and a foreign currency or currencies.
The Fund may invest in U.S. Government securities. U.S. Government securities include (1) U.S. Treasury obligations, which differ in their interest rates, maturities and times of issuance: U.S. Treasury bills (maturities of one year or less), U.S. Treasury notes (maturities of one year to ten years) and U.S. Treasury bonds (generally maturities of greater than ten years) and (2) obligations issued or guaranteed by U.S. Government agencies and instrumentalities that are supported by any of the following: (i) the full faith and credit of the U.S. Treasury, (ii) the right of the issuer to borrow an amount limited to a specific line of credit from the U.S. Treasury, (iii) discretionary authority of the U.S. Government to purchase certain obligations of the U.S. Government agency or instrumentality or (iv) the credit of the agency or instrumentality.
The Fund may invest in securities of non-U.S. issuers that are U.S. dollar or non-U.S. dollar denominated. The Fund may invest in any region of the world and invest in companies operating in developed countries such as Canada, Japan, Australia, New Zealand and most Western European countries. An “emerging market” country is any country determined to have an emerging markets economy, considering, among other things, factors such as whether the country has a low-to-middle income economy according to the World Bank or its related organizations, the country’s credit rating, its political and economic stability and the development of its financial and capital markets. These countries generally include countries located in Latin America, the
130
Caribbean, Asia, Africa, the Middle East and Eastern and Central Europe. Securities of non-U.S. issuers include American Depository Receipts (“ADRs”), Global Depositary Receipts (“GDRs”) or other securities representing underlying shares of non-U.S. issuers. Positions in those securities are not necessarily denominated in the same currency as the common stocks into which they may be converted. ADRs are receipts typically issued by an American bank or trust company evidencing ownership of the underlying securities. GDRs are U.S. dollar- denominated receipts evidencing ownership of non-U.S. securities. Generally, ADRs, in registered form, are designed for the U.S. securities markets and GDRs, in bearer form, are designed for use in non-U.S. securities markets. The Fund may invest in sponsored or unsponsored ADRs. In the case of an unsponsored ADR, the Fund is likely to bear its proportionate share of the expenses of the depository and it may have greater difficulty in receiving shareholder communications than it would have with a sponsored ADR.
The Fund may invest in Eurodollar instruments and Yankee bonds. Yankee bonds are U.S. dollar denominated bonds typically issued in the U.S. by non-U.S. governments and their agencies and non-U.S. banks and corporations. These investments involve risks that are different from investments in securities issued by U.S. issuers, including potential unfavorable political and economic developments, non-U.S. withholding or other taxes, seizure of non-U.S. deposits, currency controls, interest limitations or other governmental restrictions which might affect payment of principal or interest.
The Fund may invest in sovereign debt securities issued by issuers located, or conducting their business, in emerging markets countries, and a wide variety of bonds and other debt instruments of varying maturities issued by domestic and non-U.S. corporations, including high yield debt securities.
The Fund may invest in zero coupon bonds. A zero coupon bond is a bond that typically does not pay interest for the entire life of the obligation or for an initial period after the issuance of the obligation.
The Fund may buy and sell securities on a when-issued or delayed delivery basis, making payment or taking delivery at a later date, normally within 15 to 45 days of the trade date.
The Fund may invest in illiquid securities (i.e., securities that are not readily marketable), including, but not limited to, restricted securities (securities the disposition of which is restricted under the federal securities laws), securities that may be resold only pursuant to Rule 144A under the 1933 Act, and repurchase agreements with maturities in excess of seven days.
The Fund may enter into certain derivative instruments in pursuit of its investment objective, including to seek to enhance return, to hedge certain risks of its investments in Senior Loans or as a substitute for a position in the underlying asset. Such instruments include total return swaps; interest rate swaps; credit default swaps; interest rate caps; interest rate floors; interest rate collars; swaptions; credit-linked notes; securities indices; other indices or other financial instruments; stock and bond index futures; futures contracts on securities; options on securities; options on futures contracts; options on stock and bond indexes; interest rate futures; exchange-traded and over-the-counter options on securities or indices; index linked securities; currency exchange transactions; financial futures; options on financial futures; index futures; index options; index options on futures contracts; interest rate options; interest rate option on futures contracts; short sales; structured notes; options on U.S. Treasury security or U.S. Government Agency securities; U.S. Treasury security or U.S. Government Agency security futures contracts; and options on U.S. Treasury security or U.S. Government Agency security futures contracts.
The Fund may also invest in securities of other open- or closed-end investment companies (including ETFs) that invest primarily in the types in which the Fund may invest directly, to the extent permitted by the 1940 Act, the rules and regulations issued thereunder and applicable exemptive orders issued by the SEC.
Use of Leverage
The Fund uses leverage to pursue its investment objective. The Fund may use leverage to the extent permitted by the 1940 Act. The Fund may source leverage through a number of methods including through borrowings, issuing Preferred Shares, the issuance of debt securities, and entering into reverse repurchase agreements (effectively a borrowing). In addition, the Fund may use derivatives that may have the economic effect of leverage, such as certain credit default swaps, total return swaps and bond futures. The amount and sources of leverage will vary depending on market conditions.
Temporary Defensive Periods
During temporary defensive periods (e.g., times when, in the Fund’s investment adviser’s and/or the Fund’s sub-adviser’s opinion, temporary imbalances of supply and demand or other temporary dislocations in the Senior Loan market adversely affect the price at which Senior Loans are available), the Fund may invest up to 100% of its assets in high quality, short-term securities, and in short-, intermediate-, or long-term U.S. Treasury securities. There can be no assurance that such techniques will be successful. Accordingly, during such periods, the Fund may not achieve its investment objective.
131
Shareholder Update (continued)
(Unaudited)
NUVEEN FLOATING RATE INCOME OPPORTUNITY FUND (JRO)
Investment Objective
The Fund’s investment objective is to achieve a high level of current income.
Investment Policies
The Fund invests at least 80% of its Assets (as defined below) in adjustable rate loans, primarily secured senior loans. With respect to the Fund’s senior loans included in the 80% policy, such instruments will not at all times have a dollar-weighted average time until the next interest rate adjustment of 90 days or less. As part of the 80% requirement, the Fund also may invest in adjustable rate unsecured senior loans (together with secured senior loans referred to herein as “Senior Loans”) and adjustable rate secured and unsecured subordinated loans.
“Senior Loans” include floating or variable rate, U.S. dominated secured and unsecured loans that hold the most senior position in the capital structure of an issuer. Adjustable rate Senior Loans and adjustable rate subordinated loans are sometimes collectively referred to as “Adjustable Rate Loans.” Adjustable Rate Loans pay interest at rates that are redetermined periodically at short-term intervals by reference to a base lending rate, primarily LIBOR (of any tenor, but typically between one month and six months, and currently), plus a premium.
“Assets” mean the net assets of the Fund plus the amount of any borrowings for investment purposes. “Managed Assets” mean the total assets of the Fund, minus the sum of its accrued liabilities (other than Fund liabilities incurred for the express purpose of creating leverage). Total assets for this purpose shall include assets attributable to the Fund’s use of leverage (whether or not those assets are reflected in the Fund’s financial statements for purposes of generally accepted accounting principles), and derivatives will be valued at their market value.
Under normal circumstances:
| | • | | The Fund will invest no more than 20% of its total assets in Senior Loans in which it acts as an agent or co-agent and the size of any such individual Senior Loan will not exceed 5% of the Fund’s total assets. |
| | • | | The Fund may invest its Managed Assets without limit in Adjustable Rate Loans and other debt instruments that are, at the time of investment, rated below investment grade or unrated but judged to be of comparable quality. Investment grade quality securities are those securities that, at the time of investment, are (i) rated by at least one NRSRO within the four highest grades (BBB- or Baa3 or better by S&P, Moody’s or Fitch, or (ii) unrated but judged to be of comparable quality. However, the Fund may not invest, at the time of investment, more than 30% of its Managed Assets in securities rated below CCC+ or Caa by any NRSRO that rate such security or are unrated but judged to be of comparable quality, including securities in default. |
| | • | | The Fund may invest up to 20% of its Managed Assets in the following adjustable or fixed rate securities: (i) other debt securities such as investment and non-investment grade debt securities, fixed rate Senior Loans or subordinated loans, convertible securities and structured notes (other than structured notes that are designed to provide returns and risks that emulate those of Adjustable Rate Loans, which may be treated as an investment in Adjustable Rate Loans for purposes of the 80% requirement set forth above); (ii) mortgage-related and other asset-backed securities (including collateralized loan obligations and collateralized debt obligations); and (iii) debt securities and other instruments issued by government, government-related or supranational issuers (commonly referred to as sovereign debt securities). |
| | • | | No more than 5% of the Fund’s Managed Assets may be invested in each of convertible securities, mortgage-related and other asset-backed securities, and sovereign debt securities. |
| | • | | The Fund also may receive warrants and equity securities issued by an issuer or its affiliates in connection with the Fund’s other investments in such entities. |
| | • | | The Fund will invest at least 65% of its Managed Assets in Senior Loans that are secured by specific collateral. Such collateral consists of assets and/or stock of the borrower. |
| | • | | The Fund maintains an average duration of one year or less for its portfolio investments in Adjustable Rate Loans and other debt instruments. |
| | • | | The Fund will not invest in inverse floating rate securities. |
| | • | | The Fund may invest up to 20% of its Managed Assets in securities of non-U.S. Issuers that are U.S. dollar or non-U.S. dollar denominated. The Fund’s Managed Assets to be invested in Adjustable Rate Loans and other debt instruments of non-U.S. Issuers may include debt securities of Issuers located, or conducting their business in, emerging markets countries. |
| | • | | The Fund may not invest more than 20% of its Managed Assets in securities from an industry which (for these purposes ) generally refers to the classification of companies in the same or similar lines of business such as the automotive, textiles and apparel, hotels, media production and consumer retailing industries. The Fund may invest more than 20% of its Managed Assets in sectors which (for these purposes) generally refers to broader classifications of industries, such as the consumer discretionary sector which includes the |
132
| | automotive, textiles and apparel, hotels, media production and consumer retailing industries, provided the Fund’s investment in a particular industry within the sector does not exceed the industry limitation. |
| | • | | The Fund may invest up to 5% of its Managed Assets in iBoxx Loan Total Return Swaps. An iBoxx Loan Total Return Swap is a specific type of total return swap on an index that is designed to provide exposure to the Senior Loan market. The iBoxx Loan Total Return Swap’s underlying index is the Markit iBoxx USD Liquid Leveraged Loans Total Return Index, which is one of a subset of indices designed to track the broader, rules-based Markit iBoxx USD Liquid Leveraged Loan Index. “iBoxx Loan Total Return Swaps” means total return swaps written on the Markit iBoxx USD Liquid Leveraged Loans Total Return Index. |
The foregoing policies apply only at the time of any new investment.
Approving Changes in Investment Policies
The Board of Trustees of the Fund may change the policies described above without a shareholder vote. However, with respect to the Fund’s policy of investing at least 80% of its Assets in adjustable rate loans, such policy may not be changed without 60 days’ prior written notice.
Portfolio Contents
The Fund generally invests in Senior Loans. Senior Loans typically hold the most senior position in the capital structure of a business entity, are typically secured with specific collateral and have a claim on the assets and/or stock of the issuer that is senior to that held by subordinated debt holders and stockholders of the issuer.
Senior Loans generally include: (i) Senior Loans made by banks or other financial institutions to U.S. and non-U.S. corporations, partnerships and other business entities (each a “Borrower” and, collectively, “Borrowers”), (ii) assignments of such interests in Senior Loans, or (iii) participation interests in Senior Loans. Generally, an assignment is the actual sale of the loan, in whole or in part. A participation, on the other hand, means that the original lender maintains ownership over the loan and the participant has only a contract right against the original lender, not a credit relationship with the Borrower. Senior Loans typically hold the most senior position in the capital structure of a Borrower, are typically secured with specific collateral and have a claim on the assets and/or stock of the Borrower that is senior to that held by subordinated debt holders and stockholders of the Borrower. The capital structure of a Borrower may include Senior Loans, senior and junior subordinated debt, preferred stock and common stock issued by the Borrower, typically in descending order of seniority with respect to claims on the Borrower’s assets. The proceeds of Senior Loans primarily are used by Borrowers to finance leveraged buyouts, recapitalizations, mergers, acquisitions, stock repurchases, refinancings, internal growth and for other corporate purposes. A Senior Loan is typically originated, negotiated and structured by a U.S. or non-U.S. commercial bank, insurance company, finance company or other financial institution (“Agent”) for a lending syndicate of financial institutions which typically includes the Agent (“Lenders”). The Agent typically administers and enforces the Senior Loan on behalf of the other Lenders in the syndicate. In addition, an institution, typically but not always the Agent, holds any collateral on behalf of the Lenders. The Fund normally will rely primarily on the Agent to collect principal of and interest on a Senior Loan. Also, the Fund usually will rely on the Agent to monitor compliance by the Borrower with the restrictive covenants in a loan agreement.
Senior Loans typically have rates of interest that are redetermined either daily, monthly, quarterly or semi-annually by reference to a base lending rate plus a premium or credit spread. These base lending rates are primarily LIBOR, and secondarily the prime rate offered by one or more major U.S. banks and the certificate of deposit rate or other base lending rates used by commercial lenders. The base rate for Senior Loans after 2021 has not yet been determined with the discontinuation of LIBOR. As adjustable rate loans, the frequency of how often a Senior Loan resets its interest rate will impact how closely such Senior Loans track current market interest rates.
The Fund may purchase participations in Senior Loans. By purchasing a participation interest in a loan, the Fund acquires some or all of the interest of a bank or other financial institution in a loan to a Borrower. Under a participation, the Fund generally will have rights that are more limited than the rights of lenders or of persons who acquire a Senior Loan by assignment. In a participation, the Fund typically has a contractual relationship with the lender selling the participation, but not with the Borrower. As a result, the Fund assumes the credit risk of the lender selling the participation in addition to the credit risk of the Borrower. In the event of insolvency of the lender selling the participation, the Fund may be treated as a general creditor of the lender and may not have a senior claim to the lenders’ interest in the Senior Loan. A lender selling a participation and other persons interpositioned between the lender and the Fund with respect to participations will likely conduct their principal business activities in the banking, finance and financial services industries.
The Fund may invest in subordinated loans. The subordinated loans in which the Fund may invest are typically privately-negotiated investments that rank subordinate in priority of payment to senior debt, such as Senior Loans, and are often unsecured. However, such subordinated loans rank senior to common and preferred equity in a Borrower’s capital structure. Subordinated loans may have elements of both debt and equity instruments, offering fixed or adjustable rates of return in the form of interest payments associated with senior debt, while providing lenders an opportunity to participate in the capital appreciation of a Borrower, if any, through an equity interest. This equity interest may take the form of warrants or direct equity investments which will be in conjunction with the subordinated loans. Due to their higher risk profile and often less restrictive covenants as compared to Senior Loans, subordinated loans generally earn a higher return than secured Senior Loans. The warrants associated with subordinated loans are typically detachable,
133
Shareholder Update (continued)
(Unaudited)
which allows lenders the opportunity to receive repayment of their principal on an agreed amortization schedule while retaining their equity interest in the Borrower. Subordinated loans also may include a “put” feature, which permits the holder to sell its equity interest back to the Borrower at a price determined through an agreed formula.
The Fund may invest in subordinated loans that are primarily unsecured and that provide for relatively high, adjustable rates of interest, providing the Fund with significant current interest income. The subordinated loans in which the Fund may invest may have interest-only payments in the early years, with amortization of principal deferred to the later years of the subordinated loans. In some cases, the Fund may acquire subordinated loans that, by their terms, convert into equity or additional debt securities or defer payments of interest for the first few years after issuance. Also, in some cases the subordinated loans in which the Fund may invest will be collateralized by a subordinated lien on some or all of the assets of the Borrower. Typically, subordinated loans in which the Fund may invest will have maturities of four to eight years.
The Fund may invest in mezzanine loans. Structurally, mezzanine loans usually rank subordinate in priority of payment to senior debt, such as senior bank debt, and are often unsecured. However, mezzanine loans rank senior to common and preferred equity in a borrower’s capital structure. Mezzanine debt is often used in leveraged buyout and real estate finance transactions. Typically, mezzanine loans have elements of both debt and equity instruments, offering the fixed returns in the form of interest payments associated with senior debt, while providing lenders an opportunity to participate in the capital appreciation of a borrower, if any, through an equity interest. This equity interest typically takes the form of warrants. Due to their higher risk profile and often less restrictive covenants as compared to senior loans, mezzanine loans generally earn a higher return than senior secured loans. The warrants associated with mezzanine loans are typically detachable, which allows lenders to receive repayment of their principal on an agreed amortization schedule while retaining their equity interest in the borrower. Mezzanine loans also may include a “put” feature, which permits the holder to sell its equity interest back to the borrower at a price determined through an agreed-upon formula. Mezzanine investments may be issued with or without registration rights. Similar to other high yield securities, maturities of mezzanine investments are typically seven to ten years, but the expected average life is significantly shorter at three to five years. Mezzanine investments are usually unsecured and subordinate to other obligations of the issuer.
The Fund may invest in corporate debt instruments. Corporate debt instruments generally are used by corporations to borrow money from investors. The Issuer pays the investor a fixed or variable rate of interest and normally must repay the amount borrowed on or before maturity. Certain debt instruments in which the Fund may invest may be “perpetual” in that they have no maturity date and some may be convertible into equity securities of the Issuer or its affiliates. The Fund may invest in debt instruments of any quality and such debt instruments may be secured or unsecured. In addition, certain debt instruments in which the Fund may invest may be subordinated to the payment of an Issuer’s senior debt.
The Fund may utilize structured notes and similar instruments for investment purposes and also for hedging purposes. Structured notes are privately negotiated debt obligations where the principal and/or interest is determined by reference to the performance of a benchmark asset, market or interest rate (an “embedded index”), such as selected securities, an index of securities or specified interest rates, or the differential performance of two assets or markets.
For cash management purposes, the Fund may enter into repurchase agreements (a purchase of, and a simultaneous commitment to resell, a financial instrument at an agreed upon price on an agreed upon date) only with member banks of the Federal Reserve System and member firms of the New York Stock Exchange. When participating in repurchase agreements, the Fund buys securities from a vendor, e.g., a bank or brokerage firm, with the agreement that the vendor will repurchase the securities at a higher price at a later date. Such transactions afford an opportunity for the Fund to earn a return on available cash at minimal market risk, although the Fund may be subject to various delays and risks of loss if the vendor is unable to meet its obligation to repurchase.
The Fund may invest in debtor-in-possession financings (commonly called “DIP financings”). DIP financings are arranged when an entity seeks the protections of the bankruptcy court under chapter 11 of the U.S. Bankruptcy Code. These financings allow the entity to continue its business operations while reorganizing under chapter 11. Such financings are senior liens on unencumbered security (i.e., security not subject to other creditors claims).
The Fund may acquire equity securities and warrants issued by a Borrower or its affiliates as part of a package of investments in the Borrower or its affiliates issued in connection with a Senior Loan of the Borrower. The Fund also may convert a warrant so acquired into the underlying security. Investments in warrants and equity securities entail certain risks in addition to those associated with investments in Senior Loans. The value of these securities may be affected more rapidly, and to a greater extent, by company-specific developments and general market conditions. These risks may increase fluctuations in the Fund’s net asset value. The Fund may possess material non-public information about a Borrower as a result of its ownership of a Senior Loan of such Borrower. Because of prohibitions on trading in securities of issuers while in possession of such information the Fund might be unable to enter into a transaction in a security of such a Borrower when it would otherwise be advantageous to do so.
The Fund may invest in convertible securities, which may include convertible debt, convertible preferred stock, synthetic convertible securities and may also include secured and unsecured debt, based upon the judgment of the Fund’s sub-adviser. Convertible securities may pay interest or dividends that are based on a fixed or floating rate. A convertible security is a preferred stock, warrant or other security that may be converted into or exchanged for a prescribed amount of common stock or other security of the same or a different issuer or into cash within a particular period of time at a specified price or formula.
134
The Fund may invest in mortgage-related securities. Mortgage-related securities are debt instruments that provide periodic payments consisting of interest and/or principal that are derived from or related to payments of interest and/or principal on underlying mortgages. Additional payments on mortgage-related securities may be made out of unscheduled prepayments of principal resulting from the sale of the underlying property, or from refinancing or foreclosure, net of fees or costs that may be incurred. The mortgage-related securities in which the Fund invests will typically pay variable rates of interest, although the Fund may invest in fixed-rate obligations as well.
The Fund may invest in certain ABS. ABS are payment claims that are securitized in the form of negotiable paper that is issued by a financing company (generally called a Special Purpose Vehicle or “SPV”). These securitized payment claims are, as a rule, corporate financial assets brought into a pool according to specific diversification rules. The SPV is a company founded solely for the purpose of securitizing these claims and its only asset is the risk arising out of this diversified asset pool. On this basis, marketable securities are issued which, due to the diversification of the underlying risk, generally represent a lower level of risk than the original assets. The redemption of the securities issued by the SPV takes place at maturity out of the cash flow generated by the collected claims.
The Fund may invest in CLOs. A CLO is a structured credit security issued by an SPV that was created to reapportion the risk and return characteristics of a pool of assets. The assets, typically Senior Loans, are used as collateral supporting the various debt tranches issued by the SPV. The key feature of the CLO structure is the prioritization of the cash flows from a pool of debt securities among the several classes of CLO holders, thereby creating a series of obligations with varying rates and maturities appealing to a wide range of investors. CLOs generally are secured by an assignment to a trustee under an indenture pursuant to which the bonds are issued of collateral consisting of a pool of debt instruments, usually, non-investment grade bank loans. Payments with respect to the underlying debt securities generally are made to the trustee under the indenture. CLOs are designed to be retired as the underlying debt instruments are repaid. In the event of sufficient early prepayments on such debt instruments, the class or series of CLO first to mature generally will be retired prior to maturity. Therefore, although in most cases the issuer of CLOs will not supply additional collateral in the event of such prepayments, there will be sufficient collateral to secure their priority with respect to other CLO tranches that remain outstanding. The credit quality of these securities depends primarily upon the quality of the underlying assets, their priority with respect to other CLO tranches and the level of credit support and/or enhancement provided.
The Fund also may invest in CDOs. A CDO is a structured credit security issued by an SPV that was created to reapportion the risk and return characteristics of a pool of assets. The assets, typically non-investment grade bonds, leveraged loans, and other asset-backed obligations, are used as collateral supporting the various debt and equity tranches issued by the SPV. CDOs operate similarly to CLOs.
The Fund may invest in commercial paper. Commercial paper represents short-term unsecured promissory notes issued in bearer form by corporations such as banks or bank holding companies and finance companies. The rate of return on commercial paper may be linked or indexed to the level of exchange rates between the U.S. dollar and a foreign currency or currencies.
The Fund may invest in U.S. Government securities. U.S. Government securities include (1) U.S. Treasury obligations, which differ in their interest rates, maturities and times of issuance: U.S. Treasury bills (maturities of one year or less), U.S. Treasury notes (maturities of one year to ten years) and U.S. Treasury bonds (generally maturities of greater than ten years) and (2) obligations issued or guaranteed by U.S. Government agencies and instrumentalities that are supported by any of the following: (i) the full faith and credit of the U.S. Treasury, (ii) the right of the issuer to borrow an amount limited to a specific line of credit from the U.S. Treasury, (iii) discretionary authority of the U.S. Government to purchase certain obligations of the U.S. Government agency or instrumentality or (iv) the credit of the agency or instrumentality.
The Fund may invest in securities of non-U.S. issuers that are U.S. dollar or non-U.S. dollar denominated. The Fund may invest in any region of the world and invest in companies operating in developed countries such as Canada, Japan, Australia, New Zealand and most Western European countries. An “emerging market” country is any country determined to have an emerging markets economy, considering, among other things, factors such as whether the country has a low-to-middle income economy according to the World Bank or its related organizations, the country’s credit rating, its political and economic stability and the development of its financial and capital markets. These countries generally include countries located in Latin America, the Caribbean, Asia, Africa, the Middle East and Eastern and Central Europe. Securities of non-U.S. issuers include ADRs, GDRs or other securities representing underlying shares of non-U.S. issuers. Positions in those securities are not necessarily denominated in the same currency as the common stocks into which they may be converted. ADRs are receipts typically issued by an American bank or trust company evidencing ownership of the underlying securities. GDRs are U.S. dollar- denominated receipts evidencing ownership of non-U.S. securities. Generally, ADRs, in registered form, are designed for the U.S. securities markets and GDRs, in bearer form, are designed for use in non-U.S. securities markets. The Fund may invest in sponsored or unsponsored ADRs. In the case of an unsponsored ADR, the Fund is likely to bear its proportionate share of the expenses of the depository and it may have greater difficulty in receiving shareholder communications than it would have with a sponsored ADR.
The Fund may invest in Eurodollar instruments and Yankee bonds. Yankee bonds are U.S. dollar denominated bonds typically issued in the U.S. by non-U.S. governments and their agencies and non-U.S. banks and corporations. These investments involve risks that are different from investments in securities issued by U.S. issuers, including potential unfavorable political and economic developments, non-U.S. withholding or other taxes, seizure of non-U.S. deposits, currency controls, interest limitations or other governmental restrictions which might affect payment of principal or interest.
135
Shareholder Update (continued)
(Unaudited)
The Fund may invest in sovereign debt securities issued by issuers located, or conducting their business, in emerging markets countries, and a wide variety of bonds and other debt instruments of varying maturities issued by domestic and non-U.S. corporations, including high yield debt securities.
The Fund may invest in zero coupon bonds. A zero coupon bond is a bond that typically does not pay interest for the entire life of the obligation or for an initial period after the issuance of the obligation.
The Fund may buy and sell securities on a when-issued or delayed delivery basis, making payment or taking delivery at a later date, normally within 15 to 45 days of the trade date.
The Fund may invest in illiquid securities (i.e., securities that are not readily marketable), including, but not limited to, restricted securities (securities the disposition of which is restricted under the federal securities laws), securities that may be resold only pursuant to Rule 144A under the 1933 Act, and repurchase agreements with maturities in excess of seven days.
The Fund may enter into certain derivative instruments in pursuit of its investment objective, including to seek to enhance return, to hedge certain risks of its investments in Senior Loans or as a substitute for a position in the underlying asset. Such instruments include total return swaps; interest rate swaps; credit default swaps; interest rate caps; interest rate floors; interest rate collars; swaptions; credit-linked notes; securities indices; other indices or other financial instruments; stock and bond index futures; futures contracts on securities; options on securities; options on futures contracts; options on stock and bond indexes; interest rate futures; exchange-traded and over-the-counter options on securities or indices; index linked securities; currency exchange transactions; financial futures; options on financial futures; index futures; index options; index options on futures contracts; interest rate options; interest rate option on futures contracts; short sales; structured notes; options on U.S. Treasury security or U.S. Government Agency securities; U.S. Treasury security or U.S. Government Agency security futures contracts; and options on U.S. Treasury security or U.S. Government Agency security futures contracts.
Such instruments may include total return swaps whose prices, in the sub-adviser’s opinion, correlate with the prices of the Adjustable Rate Loans, primarily Senior Loans, in which the Fund primarily invests. Total return swaps are contracts in which one party agrees to make payments of the total return from the underlying asset(s), which may include indices, securities or baskets of securities during the specified period, in return for payments equal to a fixed or floating rate of interest or the total return from other underlying asset(s).
The Fund may also invest in securities of other open- or closed-end investment companies (including ETFs) that invest primarily in the types in which the Fund may invest directly, to the extent permitted by the 1940 Act, the rules and regulations issued thereunder and applicable exemptive orders issued by the SEC.
Use of Leverage
The Fund uses leverage to pursue its investment objective. The Fund may use leverage to the extent permitted by the 1940 Act. The Fund may source leverage through a number of methods including through borrowings, issuing Preferred Shares, the issuance of debt securities, and entering into reverse repurchase agreements (effectively a borrowing). In addition, the Fund may use derivatives that may have the economic effect of leverage, such as certain credit default swaps, total return swaps and bond futures. The amount and sources of leverage will vary depending on market conditions.
Temporary Defensive Periods
During temporary defensive periods (e.g., times when, in the Fund’s investment adviser’s and/or the Fund’s sub-adviser’s opinion, temporary imbalances of supply and demand or other temporary dislocations in the Senior Loan market adversely affect the price at which Senior Loans are available), the Fund may invest up to 100% of its assets in high quality, short-term securities, and in short-, intermediate-, or long-term U.S. Treasury securities. There can be no assurance that such techniques will be successful. Accordingly, during such periods, the Fund may not achieve its investment objective.
136
NUVEEN SHORT DURATION CREDIT OPPORTUNITIES FUND (JSD)
Investment Objective
The Fund’s investment objective is to provide current income and the potential for capital appreciation.
Investment Policies
The Fund will invest at least 80% of Assets (as defined below), at time of purchase, in loans or securities in the issuing company’s capital structure that are senior to its common equity, including but not limited to debt securities and preferred securities.
The Fund’s portfolio will be invested primarily in below investment grade adjustable rate corporate debt instruments, including senior secured loans, second lien loans, and other adjustable rate corporate debt instruments. The Fund also may invest in other types of debt instruments and enter into short positions consisting primarily of high yield debt.
“Assets” mean the net assets of the Fund plus the amount of any borrowings for investment purposes. “Managed Assets” mean the total assets of the Fund, minus the sum of its accrued liabilities (other than Fund liabilities incurred for the express purpose of creating leverage). Total assets for this purpose shall include assets attributable to the Fund’s use of leverage (whether or not those assets are reflected in the Fund’s financial statements for purposes of generally accepted accounting principles), and derivatives will be valued at their market value.
Under normal circumstances:
| | • | | The Fund will invest at least 70% of its Managed Assets in adjustable rate corporate debt instruments, including senior secured loans, second lien loans, and other adjustable rate corporate debt instruments. |
| | • | | The Fund may invest in high yield debt and other debt instruments as described herein in an aggregate amount of up to 30% of its Managed Assets. |
| | • | | The Fund will invest at least 80% of its Managed Assets in corporate debt instruments that are, at the time of investment, rated below investment grade or unrated but judged by the Fund’s sub-adviser to be of comparable quality. Investment grade quality securities are those securities that, at the time of investment, are (i) rated by at least one NRSRO within the four highest grades (BBB- or Baa3 or better by S&P, Moody’s or Fitch, or (ii) unrated but judged to be of comparable quality. However, the Fund may not invest, at the time of investment, more than 30% of its Managed Assets in securities rated below CCC+ or Caa by any NRSRO that rate such security or are unrated but judged to be of comparable quality, including securities in default. |
| | • | | The Fund may enter into short positions, consisting primarily of high yield debt, either directly or through the use of derivatives, including credit default swaps, creating a negative investment exposure or hedging existing long (positive) investment exposure in a notional amount up to 20% of its Managed Assets. |
| | • | | The Fund will maintain an average duration of two years or less for its portfolio (including the effect of leverage, but after the effect of derivatives used to shorten duration). “Average duration” and “average portfolio duration” are each defined to be the modified duration of the Fund’s portfolio, which is the measure of a debt instrument’s or a portfolio’s price sensitivity with respect to changes in market yields adjusted to reflect the effect of the Fund’s use of leverage. |
| | • | | The Fund may invest up to 20% of its Managed Assets in debt instruments of non-U.S. issuers (which term includes borrowers) that are U.S. dollar or non-U.S. dollar denominated. The Fund’s investments in debt instruments of non-U.S. issuers may include debt instruments located, or conducting their business, in emerging market countries. |
| | • | | The Fund may invest up to 10% of its Managed Assets in securities of other open- or closed-end investment companies (including ETFs) that invest primarily in the types in which the Fund may invest directly. |
The foregoing policies apply only at the time of any new investment.
Approving Changes in Investment Policies
The Board of Trustees of the Fund may change the policies described above without a shareholder vote. However, with respect to the Fund’s policy of investing at least 80% of its Assets in loans or securities in the issuing company’s capital structure that are senior to its common equity, such policy may not be changed without 60 days’ prior written notice.
Portfolio Contents
The Fund’s portfolio will be invested primarily in adjustable rate corporate debt instruments, including senior secured loans, second lien loans, and other adjustable rate corporate debt instruments. Adjustable rate instruments pay interest at rates which are determined periodically at short-term intervals on the basis of an adjustable base lending rate plus a premium.
137
Shareholder Update (continued)
(Unaudited)
The Fund invests in senior loans. Senior loans typically hold the most senior position in the capital structure of a business entity, are typically secured with specific collateral and have a claim on the assets and/or stock of the issuer that is senior to that held by subordinated debt holders and stockholders of the issuer.
Senior loans generally include: (i) senior loans made by banks or other financial institutions to U.S. and non-U.S. corporations, partnerships and other business entities (each a “Borrower” and, collectively, “Borrowers”), (ii) assignments of such interests in senior loans, or (iii) participation interests in senior loans. Generally, an assignment is the actual sale of the loan, in whole or in part. A participation, on the other hand, means that the original lender maintains ownership over the loan and the participant has only a contract right against the original lender, not a credit relationship with the Borrower. Senior loans typically hold the most senior position in the capital structure of a Borrower, are typically secured with specific collateral and have a claim on the assets and/or stock of the Borrower that is senior to that held by subordinated debt holders and stockholders of the Borrower. The capital structure of a Borrower may include senior loans, senior and junior subordinated debt, preferred stock and common stock issued by the Borrower, typically in descending order of seniority with respect to claims on the Borrower’s assets. The proceeds of senior loans primarily are used by Borrowers to finance leveraged buyouts, recapitalizations, mergers, acquisitions, stock repurchases, refinancings, internal growth and for other corporate purposes. A senior loan is typically originated, negotiated and structured by a U.S. or non-U.S. commercial bank, insurance company, finance company or other financial institution (“Agent”) for a lending syndicate of financial institutions which typically includes the Agent (“Lenders”). The Agent typically administers and enforces the senior loan on behalf of the other Lenders in the syndicate. In addition, an institution, typically but not always the Agent, holds any collateral on behalf of the Lenders. The Fund normally will rely primarily on the Agent to collect principal of and interest on a senior loan. Also, the Fund usually will rely on the Agent to monitor compliance by the Borrower with the restrictive covenants in a loan agreement.
Senior loans typically have rates of interest that are redetermined either daily, monthly, quarterly or semi-annually by reference to a base lending rate plus a premium or credit spread. These base lending rates are primarily LIBOR, and secondarily the prime rate offered by one or more major U.S. banks and the certificate of deposit rate or other base lending rates used by commercial lenders. The base rate for senior loans after 2021 has not yet been determined with the discontinuation of LIBOR. As adjustable rate loans, the frequency of how often a senior loan resets its interest rate will impact how closely such senior loans track current market interest rates.
The Fund may invest in second lien loans and other unsecured loans. Such loans are made by public and private corporations and other non-governmental Borrowers for a variety of purposes. As in the case of senior loans, the Fund may purchase interests in second lien loans and unsecured loans through assignments or participations.
Second lien loans have similar characteristics as senior loans except that such interests are second in lien property rather than first. Second lien loans are second in priority of payment to one or more senior loans of the related Borrower and are typically secured by a second priority security interest or lien to or on specified collateral securing the Borrower’s obligation under the interest. They typically have similar protections and rights as senior loans. Second lien loans are not (and by their terms cannot become) subordinate in priority of payment to any obligation of the related Borrower other than senior loans of such Borrower. Second lien loans may feature fixed or floating rate interest payments. Because second lien loans are second to senior loans, they present a greater degree of investment risk but often pay interest at higher rates reflecting this additional risk. In addition, second lien loans of below investment grade quality share many of the risk characteristics of other below investment grade debt instruments.
Unsecured loans generally have lower priority in right of payment compared to holders of secured interests of the Borrower. Unsecured loans are not secured by a security interest or lien to or on specified collateral securing the Borrower’s obligation under the interest. Unsecured loans by their terms may be or may become subordinate in right of payment to other obligations of the Borrower, including senior loans, second lien loans and other interests. Unsecured loans may have fixed or adjustable floating rate interest payments. Because unsecured loans are subordinate to Senior Loans and other secured debt of the Borrower, they present a greater degree of investment risk but often pay interest at higher rates reflecting this additional risk. Such investments generally are of below investment grade quality. Unsecured loans of below investment grade quality share the same risks of other below investment grade debt instruments.
The subordinated loans in which the Fund may invest are typically privately-negotiated investments that rank subordinate in priority of payment to senior debt, such as senior loans, and are often unsecured. Because subordinated interests may rank lower as to priority of payment than senior loans and second lien loans of the Borrower, they may present a greater degree of investment risk than senior loans and second lien loans but often pay interest at higher rates reflecting this additional risk. Other than their more subordinated status, such investments have many characteristics and risks similar to senior loans and second lien loans discussed above. Subordinated interests of below investment grade quality share risks of other below investment grade debt instruments. Subordinated loans rank senior to common and preferred equity in a Borrower’s capital structure. Subordinated loans may have elements of both debt and equity instruments, offering fixed or adjustable rates of return in the form of interest payments associated with senior debt, while providing lenders an opportunity to participate in the capital appreciation of a Borrower, if any, through an equity interest. This equity interest may take the form of warrants or direct equity investments which will be in conjunction with the subordinated loans. Due to their higher risk profile and often less restrictive covenants as compared to senior loans, subordinated loans generally earn a higher return than secured senior loans. The warrants associated with subordinated loans are typically detachable, which allows lenders the opportunity to receive repayment of their principal on an agreed amortization
138
schedule while retaining their equity interest in the Borrower. Subordinated loans also may include a “put” feature, which permits the holder to sell its equity interest back to the Borrower at a price determined through an agreed formula.
The Fund may invest in subordinated loans that are primarily unsecured and that provide for relatively high, adjustable rates of interest, providing the Fund with significant current interest income. The subordinated loans in which the Fund may invest may have interest-only payments in the early years, with amortization of principal deferred to the later years of the subordinated loans. In some cases, the Fund may acquire subordinated loans that, by their terms, convert into equity or additional debt instruments or defer payments of interest for the first few years after issuance. Also, in some cases the subordinated loans in which the Fund may invest will be collateralized by a subordinated lien on some or all of the assets of the Borrower. Typically, subordinated loans in which the Fund may invest will have maturities of four to eight years.
The Fund may utilize structured notes and similar instruments for investment purposes and also for hedging purposes. Structured notes are privately negotiated debt obligations where the principal and/or interest is determined by reference to the performance of a benchmark asset, market or interest rate (an “embedded index”), such as selected securities, an index of securities or specified interest rates, or the differential performance of two assets or markets.
For cash management purposes, the Fund may enter into repurchase agreements (a purchase of, and a simultaneous commitment to resell, a financial instrument at an agreed upon price on an agreed upon date) only with member banks of the Federal Reserve System and member firms of the New York Stock Exchange. When participating in repurchase agreements, the Fund buys securities from a vendor, e.g., a bank or brokerage firm, with the agreement that the vendor will repurchase the securities at a higher price at a later date. Such transactions afford an opportunity for the Fund to earn a return on available cash at minimal market risk, although the Fund may be subject to various delays and risks of loss if the vendor is unable to meet its obligation to repurchase.
The Fund may invest in debtor-in-possession financings (commonly called “DIP financings”). DIP financings are arranged when an entity seeks the protections of the bankruptcy court under chapter 11 of the U.S. Bankruptcy Code. These financings allow the entity to continue its business operations while reorganizing under chapter 11. Such financings are senior liens on unencumbered security (i.e., security not subject to other creditors claims).
The Fund may invest in corporate debt instruments. Corporate debt instruments generally are used by corporations to borrow money from investors. The Issuer pays the investor a fixed or variable rate of interest and normally must repay the amount borrowed on or before maturity. Certain debt instruments in which the Fund may invest may be “perpetual” in that they have no maturity date and some may be convertible into equity securities of the Issuer or its affiliates. The Fund may invest in debt instruments of any quality and such debt instruments may be secured or unsecured. In addition, certain debt instruments in which the Fund may invest may be subordinated to the payment of an Issuer’s senior debt.
The Fund may acquire equity securities and warrants issued by a Borrower or its affiliates as part of a package of investments in the Borrower or its affiliates issued in connection with a Senior Loan of the Borrower. The Fund also may convert a warrant so acquired into the underlying security. Investments in warrants and equity securities entail certain risks in addition to those associated with investments in Senior Loans. The value of these securities may be affected more rapidly, and to a greater extent, by company-specific developments and general market conditions. These risks may increase fluctuations in the Fund’s net asset value. The Fund may possess material non-public information about a Borrower as a result of its ownership of a Senior Loan of such Borrower. Because of prohibitions on trading in securities of issuers while in possession of such information the Fund might be unable to enter into a transaction in a security of such a Borrower when it would otherwise be advantageous to do so.
The Fund may invest in convertible securities, which may include convertible debt, convertible preferred stock, synthetic convertible securities and may also include secured and unsecured debt, based upon the judgment of the Fund’s sub-adviser. Convertible securities may pay interest or dividends that are based on a fixed or floating rate. A convertible security is a preferred stock, warrant or other security that may be converted into or exchanged for a prescribed amount of common stock or other security of the same or a different issuer or into cash within a particular period of time at a specified price or formula.
The Fund may invest in commercial paper. Commercial paper represents short-term unsecured promissory notes issued in bearer form by corporations such as banks or bank holding companies and finance companies. The rate of return on commercial paper may be linked or indexed to the level of exchange rates between the U.S. dollar and a foreign currency or currencies.
The Fund may invest in U.S. Government securities. U.S. Government securities include (1) U.S. Treasury obligations, which differ in their interest rates, maturities and times of issuance: U.S. Treasury bills (maturities of one year or less), U.S. Treasury notes (maturities of one year to ten years) and U.S. Treasury bonds (generally maturities of greater than ten years) and (2) obligations issued or guaranteed by U.S. Government agencies and instrumentalities that are supported by any of the following: (i) the full faith and credit of the U.S. Treasury, (ii) the right of the issuer to borrow an amount limited to a specific line of credit from the U.S. Treasury, (iii) discretionary authority of the U.S. Government to purchase certain obligations of the U.S. Government agency or instrumentality or (iv) the credit of the agency or instrumentality.
139
Shareholder Update (continued)
(Unaudited)
The Fund may invest in securities of non-U.S. companies. The Fund will classify an issuer of a security as being located in a country based on the determination of an unaffiliated, recognized financial data provider. Such determinations are based on a number of criteria, such as the issuer’s country of domicile, the primary stock exchange on which the security trades, the location from which the majority of the issuer’s revenue, comes and the issuer’s reporting currency.
The Fund may invest in securities of emerging markets issuers. Emerging markets issuers are those (i) whose securities are traded principally on a stock exchange or over-the-counter in an emerging market country, (ii) organized under the laws of an emerging market country or (iii) whose principal place of business or principal office(s) is in an emerging market country. Emerging market countries include any country other than Canada, the United States and the countries comprising the MSCI EAFE® Index (currently, Australia, Austria, Belgium, Denmark, Finland, France, Germany, Greece, Hong Kong, Ireland, Israel, Italy, Japan, the Netherlands, New Zealand, Norway, Portugal, Singapore, Spain, Sweden, Switzerland and the United Kingdom).
The Fund may invest in preferred securities. Preferred securities, which generally pay fixed or adjustable rate dividends or interest to investors, have preference over common stock in the payment of dividends or interest and the liquidation of a company’s assets, which means that a company typically must pay dividends or interest on its preferred securities before paying any dividends on its common stock. On the other hand, preferred securities are junior to all forms of the company’s debt, including both senior and subordinated debt. Because of their subordinated position in the capital structure of an issuer, the ability to defer dividend or interest payments for extended periods of time without triggering a default from legal action and certain other features, preferred securities are often treated as equity-like instruments by both issuers and investors, as their quality and value are heavily dependent on the profitability and cash flows of the issuer rather than on any legal claims to specific assets.
The Fund may invest in zero coupon bonds. A zero coupon bond is a bond that typically does not pay interest for the entire life of the obligation or for an initial period after the issuance of the obligation.
The Fund may buy and sell securities on a when-issued or delayed delivery basis, making payment or taking delivery at a later date, normally within 15 to 45 days of the trade date.
The Fund may invest in illiquid securities (i.e., securities that are not readily marketable), including, but not limited to, restricted securities (securities the disposition of which is restricted under the federal securities laws), securities that may be resold only pursuant to Rule 144A under the 1933 Act, and repurchase agreements with maturities in excess of seven days.
The Fund may enter into certain derivative transactions, such as credit default swaps and interest rate swaps, as a hedging technique to protect against potential adverse changes in the market value of portfolio instruments. The Fund also may use derivatives to attempt to protect the net asset value (“NAV”) of the Fund, to facilitate the sale of certain portfolio instruments, to manage the Fund’s effective interest rate exposure, and as a temporary substitute for purchasing or selling particular instruments. From time to time, the Fund also may enter into derivative transactions such as total return swaps on an underlying index to create investment exposure to the extent such transactions may facilitate implementation of its strategy more efficiently than through outright purchases or sales of portfolio instruments. The Fund will not enter into interest rate swap transactions having a notional amount that exceeds the outstanding amount of the Fund’s leverage.
The Fund may also invest in securities of other open- or closed-end investment companies (including ETFs) that invest primarily in the types in which the Fund may invest directly, to the extent permitted by the 1940 Act, the rules and regulations issued thereunder and applicable exemptive orders issued by the SEC.
Use of Leverage
The Fund uses leverage to pursue its investment objective. The Fund may use leverage to the extent permitted by the 1940 Act. The Fund may source leverage through a number of methods including through borrowings, issuing Preferred Shares and the issuance of debt securities. In addition, the Fund may use derivatives that may have the economic effect of leverage, such as certain credit default swaps, total return swaps and bond futures. The amount and sources of leverage will vary depending on market conditions.
Temporary Defensive Periods
During temporary defensive periods (e.g., times when, in the Fund’s investment adviser’s and/or the Fund’s sub-adviser’s opinion, temporary imbalances of supply and demand or other temporary dislocations in the Senior Loan market adversely affect the price at which Senior Loans are available), the Fund may invest up to 100% of its assets in high quality, short-term securities, and in short-, intermediate-, or long-term U.S. Treasury securities. There can be no assurance that such techniques will be successful. Accordingly, during such periods, the Fund may not achieve its investment objective.
140
NUVEEN CREDIT STRATEGIES INCOME FUND (JQC)
Investment Objectives
The Fund’s primary investment objective is to achieve a high level of current income. The Fund’s secondary investment objective is total return.
Investment Policies
The Fund will invest at least 80% of its Assets (as defined below), at time of purchase, in loans or securities that are senior to its common equity in the issuing company’s capital structure, including but not limited to debt securities and preferred securities.
The Fund invests in in adjustable rate loans, primarily secured senior loans and other debt instruments. Adjustable rate loans are made to U.S. or non-U.S. corporations, partnerships and other business entities that operate in various industries and geographical regions. Such adjustable rate loans pay interest at rates that are redetermined periodically at short-term intervals on the basis of an adjustable base lending rate plus a premium.
“Assets” mean the net assets of the Fund plus the amount of any borrowings for investment purposes. “Managed Assets” mean the total assets of the Fund, minus the sum of its accrued liabilities (other than Fund liabilities incurred for the express purpose of creating leverage). Total assets for this purpose shall include assets attributable to the Fund’s use of leverage (whether or not those assets are reflected in the Fund’s financial statements for purposes of generally accepted accounting principles), and derivatives will be valued at their market value.
Under normal circumstances:
| | • | | The Fund invests at least 70% of its Managed Assets in adjustable rate senior loans and second lien loans. |
| | • | | The Fund may invest up to 30% of its Managed Assets in the following securities: |
| | ¡ | | (i) other debt securities such as investment and non-investment grade debt securities, fixed rate senior loans or subordinated loans, convertible securities and structured notes (other than structured notes that are designed to provide returns and risks that emulate those of Adjustable Rate Loans, which may be treated as an investment in Adjustable Rate Loans for purposes of the 70% requirement set forth above); |
| | ¡ | | (ii) mortgage-related and other asset-backed securities (including collateralized loan obligations and collateralized debt obligations); |
| | ¡ | | (iii) debt securities and other instruments issued by government, government-related or supranational issuers (commonly referred to as sovereign debt securities); and |
| | ¡ | | (iv) domestic and international equity securities. |
| | • | | Substantially all of the Fund’s portfolio likely will be invested in senior loans that are, at the time of investment, rated below investment grade or unrated but judged to be of comparable quality. Investment grade quality securities are those securities that, at the time of investment, are (i) rated by at least one NRSRO within the four highest grades (BBB- or Baa3 or better by S&P, Moody’s or Fitch), or (ii) unrated but judged to be of comparable quality. The Fund may also purchase other debt securities that are rated below investment grade or that are unrated but judged to be of comparable quality. |
| | • | | The Fund maintains an average duration of two years or less for its portfolio investments in Adjustable Rate Loans and other debt instruments. “Average duration” and “average portfolio duration” are each defined to be the modified duration of the Fund’s portfolio, which is the measure of a debt instrument’s or a portfolio’s price sensitivity with respect to changes in market yields adjusted to reflect the effect of the Fund’s effective leverage. |
| | • | | The Fund will not invest in inverse floating rate securities. |
| | • | | The Fund may invest up to 20% of its Managed Assets in securities of non-U.S. Issuers that are U.S. dollar or non-U.S. dollar denominated. The Fund’s Managed Assets to be invested in Adjustable Rate Loans and other debt instruments of non-U.S. Issuers may include debt securities of Issuers located, or conducting their business in, emerging markets countries. |
| | • | | The Fund may not invest more than 25% of its total assets in securities from an industry which (for the purposes of this policy) generally refers to the classification of companies in the same or similar lines of business such as the automotive, textiles and apparel, hotels, media production and consumer retailing industries. |
The foregoing policies apply only at the time of any new investment.
Approving Changes in Investment Policies
The Board of Trustees of the Fund may change the policies described above without a shareholder vote. However, with respect to the Fund’s policy of investing at least 80% of its Assets in loans or securities that are senior to its common equity in the issuing company’s capital structure, such policy may not be changed without 60 days’ prior written notice.
141
Shareholder Update (continued)
(Unaudited)
Portfolio Contents
The Fund invests in senior loans. Senior loans typically hold the most senior position in the capital structure of a business entity, are typically secured with specific collateral and have a claim on the assets and/or stock of the issuer that is senior to that held by subordinated debt holders and stockholders of the issuer.
Senior loans generally include: (i) senior loans made by banks or other financial institutions to U.S. and non-U.S. corporations, partnerships and other business entities (each a “Borrower” and, collectively, “Borrowers”), (ii) assignments of such interests in senior loans, or (iii) participation interests in senior loans. Generally, an assignment is the actual sale of the loan, in whole or in part. A participation, on the other hand, means that the original lender maintains ownership over the loan and the participant has only a contract right against the original lender, not a credit relationship with the Borrower. Senior loans typically hold the most senior position in the capital structure of a Borrower, are typically secured with specific collateral and have a claim on the assets and/or stock of the Borrower that is senior to that held by subordinated debt holders and stockholders of the Borrower. The capital structure of a Borrower may include senior loans, senior and junior subordinated debt, preferred stock and common stock issued by the Borrower, typically in descending order of seniority with respect to claims on the Borrower’s assets. The proceeds of senior loans primarily are used by Borrowers to finance leveraged buyouts, recapitalizations, mergers, acquisitions, stock repurchases, refinancings, internal growth and for other corporate purposes. A senior loan is typically originated, negotiated and structured by a U.S. or non-U.S. commercial bank, insurance company, finance company or other financial institution (“Agent”) for a lending syndicate of financial institutions which typically includes the Agent (“Lenders”). The Agent typically administers and enforces the senior loan on behalf of the other Lenders in the syndicate. In addition, an institution, typically but not always the Agent, holds any collateral on behalf of the Lenders. The Fund normally will rely primarily on the Agent to collect principal of and interest on a senior loan. Also, the Fund usually will rely on the Agent to monitor compliance by the Borrower with the restrictive covenants in a loan agreement.
Senior loans typically have rates of interest that are redetermined either daily, monthly, quarterly or semi-annually by reference to a base lending rate plus a premium or credit spread. These base lending rates are primarily LIBOR, and secondarily the prime rate offered by one or more major U.S. banks and the certificate of deposit rate or other base lending rates used by commercial lenders. The base rate for senior loans after 2021 has not yet been determined with the discontinuation of LIBOR. As adjustable rate loans, the frequency of how often a senior loan resets its interest rate will impact how closely such senior loans track current market interest rates.
The Fund may invest in adjustable rate subordinated loans. The subordinated loans in which the Fund may invest are typically privately-negotiated investments that rank subordinate in priority of payment to senior debt, such as Senior Loans, and are often unsecured. However, such subordinated loans rank senior to common and preferred equity in a Borrower’s capital structure. Subordinated loans may have elements of both debt and equity instruments, offering fixed or adjustable rates of return in the form of interest payments associated with senior debt, while providing lenders an opportunity to participate in the capital appreciation of a Borrower, if any, through an equity interest. This equity interest may take the form of warrants or direct equity investments which will be in conjunction with the subordinated loans. Due to their higher risk profile and often less restrictive covenants as compared to Senior Loans, subordinated loans generally earn a higher return than secured Senior Loans. The warrants associated with subordinated loans are typically detachable, which allows lenders the opportunity to receive repayment of their principal on an agreed amortization schedule while retaining their equity interest in the Borrower. Subordinated loans also may include a “put” feature, which permits the holder to sell its equity interest back to the Borrower at a price determined through an agreed formula.
The Fund may invest in subordinated loans that are primarily unsecured and that provide for relatively high, adjustable rates of interest, providing the Fund with significant current interest income. The subordinated loans in which the Fund may invest may have interest-only payments in the early years, with amortization of principal deferred to the later years of the subordinated loans. In some cases, the Fund may acquire subordinated loans that, by their terms, convert into equity or additional debt instruments or defer payments of interest for the first few years after issuance. Also, in some cases the subordinated loans in which the Fund may invest will be collateralized by a subordinated lien on some or all of the assets of the Borrower. Typically, subordinated loans in which the Fund may invest will have maturities of four to eight years.
The Fund may invest in common stocks and other equity securities. Common stocks generally represent an ownership interest in an issuer, without preference over any other class of securities, including such issuer’s fixed income securities and senior equity securities. Dividend payments generally are not guaranteed and so may be discontinued by the issuer at its discretion or because of the issuer’s inability to satisfy its liabilities. Further, an issuer’s history of paying dividends does not guarantee that it will continue to pay dividends in the future. In addition to dividends, under certain circumstances the Fund may benefit from capital appreciation of an issuer’s common stock.
The Fund may invest in convertible securities, which may include convertible debt, convertible preferred stock, synthetic convertible securities and may also include secured and unsecured debt, based upon the judgment of the Fund’s sub-adviser. Convertible securities may pay interest or dividends that are based on a fixed or floating rate. A convertible security is a preferred stock, warrant or other security that may be converted into or exchanged for a prescribed amount of common stock or other security of the same or a different issuer or into cash within a particular period of time at a specified price or formula.
142
The Fund may invest in corporate debt instruments. Corporate debt instruments generally are used by corporations to borrow money from investors. The Issuer pays the investor a fixed or variable rate of interest and normally must repay the amount borrowed on or before maturity. Certain debt instruments in which the Fund may invest may be “perpetual” in that they have no maturity date and some may be convertible into equity securities of the Issuer or its affiliates. The Fund may invest in debt instruments of any quality and such debt instruments may be secured or unsecured. In addition, certain debt instruments in which the Fund may invest may be subordinated to the payment of an Issuer’s senior debt.
The Fund may utilize structured notes and similar instruments for investment purposes and also for hedging purposes. Structured notes are privately negotiated debt obligations where the principal and/or interest is determined by reference to the performance of a benchmark asset, market or interest rate (an “embedded index”), such as selected securities, an index of securities or specified interest rates, or the differential performance of two assets or markets.
For cash management purposes, the Fund may enter into repurchase agreements (a purchase of, and a simultaneous commitment to resell, a financial instrument at an agreed upon price on an agreed upon date) only with member banks of the Federal Reserve System and member firms of the New York Stock Exchange. When participating in repurchase agreements, the Fund buys securities from a vendor, e.g., a bank or brokerage firm, with the agreement that the vendor will repurchase the securities at a higher price at a later date. Such transactions afford an opportunity for the Fund to earn a return on available cash at minimal market risk, although the Fund may be subject to various delays and risks of loss if the vendor is unable to meet its obligation to repurchase.
The Fund may invest in debtor-in-possession financings (commonly called “DIP financings”). DIP financings are arranged when an entity seeks the protections of the bankruptcy court under chapter 11 of the U.S. Bankruptcy Code. These financings allow the entity to continue its business operations while reorganizing under chapter 11. Such financings are senior liens on unencumbered security (i.e., security not subject to other creditors claims).
The Fund may acquire equity securities and warrants issued by a Borrower or its affiliates as part of a package of investments in the Borrower or its affiliates issued in connection with a Senior Loan of the Borrower. The Fund also may convert a warrant so acquired into the underlying security. Investments in warrants and equity securities entail certain risks in addition to those associated with investments in Senior Loans. The value of these securities may be affected more rapidly, and to a greater extent, by company-specific developments and general market conditions. These risks may increase fluctuations in the Fund’s net asset value. The Fund may possess material non-public information about a Borrower as a result of its ownership of a Senior Loan of such Borrower. Because of prohibitions on trading in securities of issuers while in possession of such information the Fund might be unable to enter into a transaction in a security of such a Borrower when it would otherwise be advantageous to do so.
The Fund may invest in mortgage-related securities. Mortgage-related securities are debt instruments that provide periodic payments consisting of interest and/or principal that are derived from or related to payments of interest and/or principal on underlying mortgages. Additional payments on mortgage-related securities may be made out of unscheduled prepayments of principal resulting from the sale of the underlying property, or from refinancing or foreclosure, net of fees or costs that may be incurred. The mortgage-related securities in which the Fund invests will typically pay variable rates of interest, although the Fund may invest in fixed-rate obligations as well.
The Fund may invest in certain ABS. ABS are payment claims that are securitized in the form of negotiable paper that is issued by a financing company (generally called a Special Purpose Vehicle or “SPV”). These securitized payment claims are, as a rule, corporate financial assets brought into a pool according to specific diversification rules. The SPV is a company founded solely for the purpose of securitizing these claims and its only asset is the risk arising out of this diversified asset pool. On this basis, marketable securities are issued which, due to the diversification of the underlying risk, generally represent a lower level of risk than the original assets. The redemption of the securities issued by the SPV takes place at maturity out of the cash flow generated by the collected claims.
The Fund may invest in CLOs. A CLO is a structured credit security issued by an SPV that was created to reapportion the risk and return characteristics of a pool of assets. The assets, typically Senior Loans, are used as collateral supporting the various debt tranches issued by the SPV. The key feature of the CLO structure is the prioritization of the cash flows from a pool of debt securities among the several classes of CLO holders, thereby creating a series of obligations with varying rates and maturities appealing to a wide range of investors. CLOs generally are secured by an assignment to a trustee under an indenture pursuant to which the bonds are issued of collateral consisting of a pool of debt instruments, usually, non-investment grade bank loans. Payments with respect to the underlying debt securities generally are made to the trustee under the indenture. CLOs are designed to be retired as the underlying debt instruments are repaid. In the event of sufficient early prepayments on such debt instruments, the class or series of CLO first to mature generally will be retired prior to maturity. Therefore, although in most cases the issuer of CLOs will not supply additional collateral in the event of such prepayments, there will be sufficient collateral to secure their priority with respect to other CLO tranches that remain outstanding. The credit quality of these securities depends primarily upon the quality of the underlying assets, their priority with respect to other CLO tranches and the level of credit support and/or enhancement provided.
The Fund also may invest in CDOs. A CDO is a structured credit security issued by an SPV that was created to reapportion the risk and return characteristics of a pool of assets. The assets, typically non-investment grade bonds, leveraged loans, and other asset-backed obligations, are used as collateral supporting the various debt and equity tranches issued by the SPV. CDOs operate similarly to CLOs.
143
Shareholder Update (continued)
(Unaudited)
The Fund may invest in commercial paper. Commercial paper represents short-term unsecured promissory notes issued in bearer form by corporations such as banks or bank holding companies and finance companies. The rate of return on commercial paper may be linked or indexed to the level of exchange rates between the U.S. dollar and a foreign currency or currencies.
The Fund may invest in U.S. Government securities. U.S. Government securities include (1) U.S. Treasury obligations, which differ in their interest rates, maturities and times of issuance: U.S. Treasury bills (maturities of one year or less), U.S. Treasury notes (maturities of one year to ten years) and U.S. Treasury bonds (generally maturities of greater than ten years) and (2) obligations issued or guaranteed by U.S. Government agencies and instrumentalities that are supported by any of the following: (i) the full faith and credit of the U.S. Treasury, (ii) the right of the issuer to borrow an amount limited to a specific line of credit from the U.S. Treasury, (iii) discretionary authority of the U.S. Government to purchase certain obligations of the U.S. Government agency or instrumentality or (iv) the credit of the agency or instrumentality.
The Fund may invest in securities of non-U.S. Issuers that are U.S. dollar or non-U.S. dollar denominated, including debt securities of issuers located, or conducting their business, in emerging markets countries. The Fund’s Managed Assets to be invested in Adjustable Rate Loans and other debt instruments of non-U.S. Issuers may include debt securities of Issuers located, or conducting their business in, emerging markets countries. The Fund may invest in any region of the world and invest in companies operating in developed countries such as Canada, Japan, Australia, New Zealand and most Western European countries. An “emerging market” country is any country determined to have an emerging markets economy, considering, among other things, factors such as whether the country has a low-to-middle-income economy according to the World Bank or its related organizations, the country’s credit rating, its political and economic stability and the development of its financial and capital markets. These countries generally include countries located in Latin America, the Caribbean, Asia, Africa, the Middle East and Eastern and Central Europe.
The Fund may invest in preferred securities. Preferred securities, which generally pay fixed or adjustable rate dividends or interest to investors, have preference over common stock in the payment of dividends or interest and the liquidation of a company’s assets, which means that a company typically must pay dividends or interest on its preferred securities before paying any dividends on its common stock. On the other hand, preferred securities are junior to all forms of the company’s debt, including both senior and subordinated debt. Because of their subordinated position in the capital structure of an issuer, the ability to defer dividend or interest payments for extended periods of time without triggering a default from legal action and certain other features, preferred securities are often treated as equity-like instruments by both issuers and investors, as their quality and value are heavily dependent on the profitability and cash flows of the issuer rather than on any legal claims to specific assets.
The Fund may invest in contingent capital securities (sometimes referred to as “CoCos”). CoCos are hybrid securities, issued primarily by non-U.S. financial institutions, which have loss absorption mechanisms benefitting the issuer built into their terms. CoCos generally provide for mandatory conversion into the common stock of the issuer or a write-down of the principal amount or value of the CoCos upon the occurrence of certain triggers linked to regulatory capital thresholds. In addition, they may provide for mandatory conversion or a principal write-down upon the occurrence of certain events such as regulatory actions calling into question the issuing banking institution’s continued viability as a going-concern. Equity conversion or principal write-down features are tailored to the issuer and its regulatory requirements and, unlike traditional convertible securities, conversions are not voluntary.
The Fund may invest in zero coupon bonds. A zero coupon bond is a bond that typically does not pay interest for the entire life of the obligation or for an initial period after the issuance of the obligation.
The Fund may buy and sell securities on a when-issued or delayed delivery basis, making payment or taking delivery at a later date, normally within 15 to 45 days of the trade date.
The Fund may invest in illiquid securities (i.e., securities that are not readily marketable), including, but not limited to, restricted securities (securities the disposition of which is restricted under the federal securities laws), securities that may be resold only pursuant to Rule 144A under the 1933 Act, and repurchase agreements with maturities in excess of seven days.
The Fund may enter into certain derivative transactions, primarily but not limited to credit default and interest rate swaps, as a hedging technique to protect against potential adverse changes in the market value of portfolio instruments. The Fund also may use derivatives to attempt to protect the net asset value of the Fund, to facilitate the sale of certain portfolio instruments, to manage the Fund’s effective interest rate exposure, and as a temporary substitute for purchasing or selling particular instruments. From time to time, the Fund also may enter into derivative transactions to create investment exposure to the extent such transactions may facilitate implementation of its strategy more efficiently than through outright purchases or sales of portfolio instruments.
The Fund may also invest in securities of other open- or closed-end investment companies (including ETFs) that invest primarily in the types in which the Fund may invest directly, to the extent permitted by the 1940 Act, the rules and regulations issued thereunder and applicable exemptive orders issued by the SEC.
144
Use of Leverage
The Fund uses leverage to pursue its investment objective. The Fund may use leverage to the extent permitted by the 1940 Act. The Fund may source leverage through a number of methods including through borrowings, issuing Preferred Shares and the issuance of debt securities. In addition, the Fund may use derivatives that may have the economic effect of leverage, such as certain credit default swaps, total return swaps and bond futures. The amount and sources of leverage will vary depending on market conditions.
Temporary Defensive Periods
During temporary defensive periods (e.g., times when, in the Fund’s investment adviser’s and/or the Fund’s sub-adviser’s opinion, temporary imbalances of supply and demand or other temporary dislocations in the Senior Loan market adversely affect the price at which Senior Loans are available), the Fund may invest up to 100% of its assets in high quality, short-term securities, and in short-, intermediate-, or long-term U.S. Treasury securities. There can be no assurance that such techniques will be successful. Accordingly, during such periods, the Fund may not achieve its investment objective.
145
Shareholder Update (continued)
(Unaudited)
PRINCIPAL RISKS OF THE FUNDS
The factors that are most likely to have a material effect on a particular Fund’s portfolio as a whole are called “principal risks.” Each Fund is subject to the principal risks indicated below, whether through direct investment or derivative positions. Each Fund may be subject to additional risks other than those identified and described below because the types of investments made by a Fund can change over time.
| | | | | | | | | | |
| Risk | | Nuveen Senior
Income Fund (NSL) | | Nuveen Floating
Rate Income Fund (JFR) | | Nuveen Floating
Rate Income
Opportunity Fund (JRO) | | Nuveen Short
Duration Credit
Opportunities Fund (JSD) | | Nuveen Credit
Strategies
Income Fund (JQC) |
| | | | | |
| Portfolio Level Risks | | | | | | | | | | |
| | | | | |
Asset-Back Securities Risk | | — | | — | | — | | — | | X |
Basis Risk | | X | | X | | X | | X | | X |
Below Investment Grade Risk | | X | | X | | X | | X | | X |
Call Risk | | X | | X | | X | | X | | X |
Collateralized Debt Obligation Risk | | — | | — | | — | | — | | X |
Collateralized Loan Obligation Risk | | — | | — | | — | | — | | X |
Contingent Capital Securities (“CoCos”) Risk | | — | | — | | — | | — | | X |
Convertible Securities Risk | | — | | — | | — | | — | | X |
Credit Risk | | X | | X | | X | | X | | X |
Credit Spread Risk | | X | | X | | X | | X | | X |
Debt Securities Risk | | X | | X | | X | | X | | X |
Defaulted and Distressed Securities Risk | | — | | — | | X | | X | | — |
Deflation Risk | | X | | X | | X | | X | | X |
Derivatives Risk | | X | | X | | X | | X | | X |
Duration Risk | | X | | X | | X | | X | | X |
Emerging Markets Risk | | X | | X | | X | | X | | X |
Financial Futures and Options Transactions Risk | | X | | X | | X | | X | | X |
Floating-Rate and Fixed-to-Floating Rate Securities Risk | | X | | X | | X | | X | | X |
Foreign Currency Risk | | — | | X | | X | | X | | X |
Hedging Risk | | X | | X | | X | | X | | X |
Illiquid Investments Risk | | X | | X | | X | | X | | X |
Income Risk | | X | | X | | X | | X | | X |
Inflation Risk | | X | | X | | X | | X | | X |
Interest Rate Risk | | X | | X | | X | | X | | X |
LIBOR Floor Risk | | X | | X | | X | | X | | X |
LIBOR Replacement Risk | | X | | X | | X | | X | | X |
Loan Participation Risk | | X | | X | | X | | X | | X |
Loan Risk | | X | | X | | X | | X | | X |
Mortgage-Backed Securities Risk | | — | | — | | — | | — | | X |
Non-U.S. Securities Risk | | X | | X | | X | | X | | X |
Other Investment Companies Risk | | X | | X | | X | | X | | X |
Preferred Securities Risk | | — | | — | | — | | X | | X |
Reinvestment Risk | | X | | X | | X | | X | | X |
146
| | | | | | | | | | |
| Risk | | Nuveen Senior
Income Fund (NSL) | | Nuveen Floating
Rate Income Fund (JFR) | | Nuveen Floating
Rate Income
Opportunity Fund (JRO) | | Nuveen Short
Duration Credit
Opportunities Fund (JSD) | | Nuveen Credit
Strategies
Income Fund (JQC) |
Second Lien Loans and Unsecured Loans Risk | | X | | X | | X | | X | | X |
Senior Loan Agent Risk | | X | | X | | X | | X | | X |
Senior Loan Risk | | X | | X | | X | | X | | X |
Short Exposure Risk | | — | | — | | — | | X | | — |
Structured Product Risk | | X | | X | | X | | X | | X |
Sovereign Government and Supranational Debt Risk | | — | | — | | — | | — | | X |
Subordinated Loans and Other Subordinated Debt Instruments Risk | | X | | X | | X | | X | | X |
Swap Transactions Risk | | X | | X | | X | | X | | X |
Unrated Securities Risk | | X | | X | | X | | X | | X |
Valuation Risk | | X | | X | | X | | X | | X |
Warrants and Equity Securities Risk | | X | | X | | X | | X | | X |
When-Issued and Delayed-Delivery Transactions | | X | | X | | X | | X | | X |
Zero Coupon Bonds Risk | | X | | X | | X | | X | | X |
| | | | | |
| Fund Level and Other Risks | | | | | | | | | | |
| | | | | |
Anti-Takeover Provisions | | X | | X | | X | | X | | X |
Borrowing Risk | | X | | X | | X | | X | | X |
Counterparty Risk | | X | | X | | X | | X | | X |
Cybersecurity Risk | | X | | X | | X | | X | | X |
Global Economic Risk | | X | | X | | X | | X | | X |
Investment and Market Risk | | X | | X | | X | | X | | X |
Legislation and Regulatory Risk | | X | | X | | X | | X | | X |
Leverage Risk | | X | | X | | X | | X | | X |
Market Discount from Net Asset Value | | X | | X | | X | | X | | X |
Recent Market Conditions | | X | | X | | X | | X | | X |
Reverse Repurchase Agreement Risk | | X | | X | | X | | X | | X |
Tax Risk | | X | | X | | X | | X | | X |
Portfolio Level Risks:
Asset-Backed Securities Risk. Asset-backed securities represent participations in, or are secured by and payable from, pools of assets including company receivables, truck and auto loans, leases and credit card receivables. These securities may be in the form of pass-through instruments or asset-backed bonds. Asset-backed securities are issued by non-governmental entities and carry no direct or indirect government guarantee; the asset pools that back asset-backed securities are securitized through the use of privately-formed trusts or special purpose corporations. Payments on asset-backed securities depend upon assets held by the issuer and collections of the underlying loans. The value of these securities depends on many factors, including changing interest rates, the availability of information about the pool and its structure, the credit quality of the underlying assets, the market’s perception of the servicer of the pool, and any credit enhancement provided. In certain market conditions, asset-backed securities may experience volatile fluctuations in value and periods of illiquidity.
Basis Risk. As short-term rates change, interest income from floating rate loans may not increase in concert with increases in the costs of floating rate leverage or other borrowings, introducing basis or imperfect hedging risk.
147
Shareholder Update (continued)
(Unaudited)
Below Investment Grade Risk. Securities of below investment grade quality are regarded as having speculative characteristics with respect to the issuer’s capacity to pay interest and repay principal, and may be subject to higher price volatility and default risk than investment grade securities of comparable terms and duration. Issuers of lower grade securities may be highly leveraged and may not have available to them more traditional methods of financing. The prices of these lower grade securities are typically more sensitive to negative developments, such as a decline in the issuer’s revenues or a general economic downturn. The secondary market for lower rated securities may not be as liquid as the secondary market for more highly rated securities, a factor which may have an adverse effect on the Fund’s ability to dispose of a particular security. If a below investment grade security goes into default, or its issuer enters bankruptcy, it might be difficult to sell that security in a timely manner at a reasonable price.
Call Risk. The Fund may invest in securities that are subject to call risk. Such securities may be redeemed at the option of the issuer, or “called,” before their stated maturity or redemption date. In general, an issuer will call its instruments if they can be refinanced by issuing new instruments that bear a lower interest rate. The Fund is subject to the possibility that during periods of falling interest rates, an issuer will call its high yielding securities. The Fund would then be forced to invest the unanticipated proceeds at lower interest rates, resulting in a decline in the Fund’s income.
Collateralized Debt Obligation (“CDO”) Risk. The risks of an investment in CDOs depend largely on the type of the collateral securities and the class of the CDO in which the Fund invests. In addition to the normal risks associated with fixed-income securities, CDOs carry additional risks including, but not limited to, the risk that: (1) distributions from collateral securities may not be adequate to make interest or other payments; (2) the quality of the collateral may decline in value or default; (3) the fact that the CDOs may be subordinate to other classes; and (4) the complex structure of the security may not be fully understood at the time of investment and may produce disputes with the issuer or unexpected investment results.
Collateralized Loan Obligation (“CLO”) Risk. A CLO is an asset-backed security whose underlying collateral is a pool of loans, which may include, among others, domestic and foreign floating rate and fixed rate senior secured loans, senior unsecured loans, and subordinate corporate loans, including loans that may be rated below investment grade or equivalent unrated loans. In addition to the risks associated with loans, illiquid investments and high-yield securities described below, investments in CLOs carry additional risks including, but not limited to, the risk that: (1) distributions from the collateral may not be adequate to make interest or other payments; (2) the quality of the collateral may decline in value or default; (3) the Fund may invest in tranches of CLOs that are subordinate to other tranches; (4) the complex structure of the CLO may not be fully understood at the time of investment and may produce disputes with the issuer or unexpected investment results; and (5) the CLO’s manager may perform poorly. CLOs may charge management and other administrative fees, which are in addition to those of the Fund.
Contingent Capital Securities (“CoCos”) Risk. A loss absorption mechanism trigger event for CoCos would likely be the result of, or related to, the deterioration of the issuer’s financial condition (e.g., a decrease in the issuer’s capital ratio) and status as a going concern. In such a case, with respect to CoCos that provide for conversion into common stock upon the occurrence of the trigger event, the market price of the issuer’s common stock received by the Fund will have likely declined, perhaps substantially, and may continue to decline, which may adversely affect the Fund’s net asset value. Further, the issuer’s common stock would be subordinate to the issuer’s other classes of securities and therefore would worsen the Fund’s standing in a bankruptcy proceeding. In addition, because the common stock of the issuer may not pay a dividend, investors in these instruments could experience a reduced income rate, potentially to zero. In view of the foregoing, CoCos are often rated below investment grade and are subject to the risks of below investment grade securities.
CoCos may be subject to an automatic write-down (i.e., the automatic write-down of the principal amount or value of the securities, potentially to zero, and the cancellation of the securities) under certain circumstances, which could result in the Fund losing a portion or all of its investment in such securities. In addition, the Fund may not have any rights with respect to repayment of the principal amount of the securities that has not become due or the payment of interest or dividends on such securities for any period from (and including) the interest or dividend payment date falling immediately prior to the occurrence of such automatic write-down. An automatic write-down could also result in a reduced income rate if the dividend or interest payment is based on the security’s par value. Coupon payments on CoCos may be discretionary and may be cancelled by the issuer for any reason or may be subject to approval by the issuer’s regulator and may be suspended in the event there are insufficient distributable reserves.
In certain scenarios, investors in CoCos may suffer a loss of capital ahead of equity holders or when equity holders do not. There is no guarantee that the Fund will receive a return of principal on CoCos. Any indication that an automatic write-down or conversion event may occur can be expected to have a material adverse effect on the market price of CoCos.
The prices of CoCos may be volatile. Additionally, the trading behavior of a given issuer’s CoCo may be strongly impacted by the trading behavior of other issuers’ CoCos, such that negative information from an unrelated CoCo may cause a decline in value of one or more CoCos held by afund. Accordingly, the trading behavior of CoCos may not follow the trading behavior of other similarly structured securities.
CoCos are issued primarily by financial institutions. Therefore, CoCos present substantially increased risks at times of financial turmoil, which could affect financial institutions more than companies in other sectors and industries.
148
Convertible Securities Risk. Convertible securities have characteristics of both equity and debt securities and, as a result, are exposed to certain additional risks that are typically associated with debt, including but not limited to Interest Rate Risk, Credit Risk, Below Investment Grade Risk and Unrated Securities Risk. The value of a convertible security is influenced by both the yield of non-convertible securities of comparable issuers and by the value of the underlying common stock. Convertible securities generally offer lower interest or dividend yields than non-convertible securities of similar credit quality. The market values of convertible securities tend to decline as interest rates increase and, conversely, to increase as interest rates decline. However, the convertible security’s market value tends to reflect the market price of the common stock of the issuing company when that stock price is greater than the convertible security’s “conversion price.” The conversion price is defined as the predetermined price at which the convertible security could be exchanged for the associated common stock. As the market price of the underlying common stock declines, the price of the convertible security tends to be influenced more by the yield of the convertible security. Thus, the convertible security may not decline in price to the same extent as the underlying common stock. Convertible securities fall below debt obligations of the same issuer in order of preference or priority in the event of a liquidation and are typically unrated or rated lower than such debt obligations.
Credit Risk. Issuers of securities in which the Fund may invest may default on their obligations to pay principal or interest when due. This non-payment would result in a reduction of income to the Fund, a reduction in the value of a security experiencing non-payment and potentially a decrease in the net asset value (“NAV”) of the Fund. To the extent that the credit rating assigned to a security in the Fund’s portfolio is downgraded, the market price and liquidity of such security may be adversely affected.
Credit Spread Risk. Credit spread risk is the risk that credit spreads (i.e., the difference in yield between securities that is due to differences in their credit quality) may increase when the market believes that securities generally have a greater risk of default. Increasing credit spreads may reduce the market values of the Fund’s securities. Credit spreads often increase more for lower rated and unrated securities than for investment grade securities. In addition, when credit spreads increase, reductions in market value will generally be greater for longer-maturity securities.
Debt Securities Risk. Issuers of debt instruments in which the Fund may invest may default on their obligations to pay principal or interest when due. This non-payment would result in a reduction of income to the Fund, a reduction in the value of a debt instrument experiencing non-payment and, potentially, a decrease in the NAV of the Fund. There can be no assurance that liquidation of collateral would satisfy the issuer’s obligation in the event of non-payment of scheduled interest or principal or that such collateral could be readily liquidated. In the event of bankruptcy of an issuer, the Fund could experience delays or limitations with respect to its ability to realize the benefits of any collateral securing a security. To the extent that the credit rating assigned to a security in the Fund’s portfolio is downgraded, the market price and liquidity of such security may be adversely affected.
Defaulted and Distressed Securities Risk. The Fund may hold investments that at the time of purchase are in default or involved in bankruptcy or insolvency proceedings, or may later become so. Moreover, the Fund may invest in low-rated securities that, although not in default, may be “distressed,” meaning that the issuer is experiencing financial difficulties or distress at the time of acquisition. Such securities would present a substantial risk of future default which may cause the Fund to incur losses, including additional expenses, to the extent it is required to seek recovery upon a default in the payment of principal or interest on those securities. In any reorganization or liquidation proceeding relating to a portfolio security, the Fund may lose its entire investment or may be required to accept cash or securities with a value less than its original investment. Defaulted or distressed securities may be subject to restrictions on resale.
Deflation Risk. Deflation risk is the risk that prices throughout the economy decline over time. Deflation may have an adverse effect on the creditworthiness of issuers and may make issuer default more likely, which may result in a decline in the value of the Fund’s portfolio.
Derivatives Risk. The use of derivatives involves additional risks and transaction costs which could leave the Fund in a worse position than if it had not used these instruments. Derivative instruments can be used to acquire or to transfer the risk and returns of a security or other asset without buying or selling the security or asset. These instruments may entail investment exposures that are greater than their cost would suggest. As a result, a small investment in derivatives can result in losses that greatly exceed the original investment. Derivatives can be highly volatile, illiquid and difficult to value. An over-the-counter derivative transaction between the Fund and a counterparty that is not cleared through a central counterparty also involves the risk that a loss may be sustained as a result of the failure of the counterparty to the contract to make required payments. The payment obligation for a cleared derivative transaction is guaranteed by a central counterparty, which exposes the Fund to the creditworthiness of the central counterparty.
It is possible that developments in the derivatives market, including changes in government regulation, could adversely impact the Fund’s ability to invest in certain derivatives.
Duration Risk. Duration is the sensitivity, expressed in years, of the price of a fixed-income security to changes in the general level of interest rates (or yields). Securities with longer durations tend to be more sensitive to interest rate (or yield) changes, which typically corresponds to increased volatility and risk, than securities with shorter durations. For example, if a security or portfolio has a duration of three years and interest rates increase by 1%, then the security or portfolio would decline in value by approximately 3%. Duration differs from maturity in that it considers potential changes to interest rates, and a security’s coupon payments, yield, price and par value and call features, in addition to the amount of time until the security matures. The duration of a security will be expected to change over time with changes in market factors and time to maturity.
149
Shareholder Update (continued)
(Unaudited)
Emerging Markets Risk. Risks of investing in securities of emerging markets issuers include: smaller market capitalization of securities markets, which may suffer periods of relative illiquidity; significant price volatility; restrictions on foreign investment; and possible restrictions on repatriation of investment income and capital. In addition, foreign investors may be required to register the proceeds of sales; and future economic or political crises could lead to price controls, forced mergers, expropriation or confiscatory taxation, seizure, nationalization, or creation of government monopolies. Certain emerging markets also may face other significant internal or external risks, including a heightened risk of war, and ethnic, religious and racial conflicts. In addition, governments in many emerging market countries participate to a significant degree in their economies and securities markets, which may impair investment and economic growth, and which may in turn diminish the value of the securities in those markets. The considerations noted below in “Non-U.S. Securities Risk” are generally intensified for investments in emerging market countries.
Financial Futures and Options Transactions Risk. The Fund may use certain transactions for hedging the portfolio’s exposure to credit risk and the risk of increases in interest rates, which could result in poorer overall performance for the Fund. There may be an imperfect correlation between price movements of the futures and options and price movements of the portfolio securities being hedged.
If the Fund engages in futures transactions or in the writing of options on futures, it will be required to maintain initial margin and maintenance margin and may be required to make daily variation margin payments in accordance with applicable rules of the exchanges and the Commodity Futures Trading Commission (“CFTC”). If the Fund purchases a financial futures contract or a call option or writes a put option in order to hedge the anticipated purchase of securities, and if the Fund fails to complete the anticipated purchase transaction, the Fund may have a loss or a gain on the futures or options transaction that will not be offset by price movements in the securities that were the subject of the anticipatory hedge. There can be no assurance that a liquid market will exist at a time when the Fund seeks to close out a derivatives or futures or a futures option position, and the Fund would remain obligated to meet margin requirements until the position is closed.
Floating-Rate and Fixed-to-Floating-Rate Securities Risk. The market value of floating-rate securities is a reflection of discounted expected cash flows based on expectations for future interest rate resets. The market value of such securities may fall in a declining interest rate environment and may also fall in a rising interest rate environment if there is a lag between the rise in interest rates and the reset. This risk may also be present with respect to fixed-to-floating-rate securities in which the Fund may invest. A secondary risk associated with declining interest rates is the risk that income earned by the Fund on floating-rate and fixed-to-floating-rate securities will decline due to lower coupon payments on floating rate securities.
Foreign Currency Risk. Because the Fund may invest in securities denominated or quoted in currencies other than the U.S. dollar, changes in foreign currency exchange rates may affect the value of securities held by the Fund and the unrealized appreciation or depreciation of investments. Currencies of certain countries may be volatile and therefore may affect the value of securities denominated in such currencies, which means that the Fund’s NAV could decline as a result of changes in the exchange rates between foreign currencies and the U.S. dollar. In addition, certain countries, particularly emerging market countries, may impose foreign currency exchange controls or other restrictions on the transferability, repatriation or convertibility of currency.
Hedging Risk. The Fund’s use of derivatives or other transactions to reduce risk involves costs and will be subject to the investment adviser’s and/or the sub-adviser’s ability to predict correctly changes in the relationships of such hedge instruments to the Fund’s portfolio holdings or other factors. No assurance can be given that the investment adviser’s and/or the sub-adviser’s judgment in this respect will be correct, and no assurance can be given that the Fund will enter into hedging or other transactions at times or under circumstances in which it may be advisable to do so. Hedging activities may reduce the Fund’s opportunities for gain by offsetting the positive effects of favorable price movements and may result in net losses.
Illiquid Investments Risk. Illiquid investments are investments that are not readily marketable and may include restricted securities, which are securities that may not be resold unless they have been registered under the 1933 Act or that can be sold in a private transaction pursuant to an available exemption from such registration. Illiquid investments involve the risk that the investments will not be able to be sold at the time desired by the Fund or at prices approximating the value at which the Fund is carrying the investments on its books from time to time.
Income Risk. The Fund’s income could decline due to falling market interest rates. This is because, in a falling interest rate environment, the Fund generally will have to invest the proceeds from maturing portfolio securities in lower-yielding securities.
Inflation Risk. Inflation risk is the risk that the value of assets or income from investments will be worth less in the future as inflation decreases the value of money. As inflation increases, the real value of the common shares and distributions can decline.
Interest Rate Risk. Interest rate risk is the risk that securities in the Fund’s portfolio will decline in value because of changes in market interest rates. Generally, when market interest rates rise, the market value of such securities will fall, and vice versa. As interest rates decline, issuers of securities may prepay principal earlier than scheduled, forcing the Fund to reinvest in lower-yielding securities and potentially reducing the Fund’s income. As interest rates increase, slower than expected principal payments may extend the average life of securities, potentially locking in a below-market interest rate and reducing the Fund’s value. In typical market interest rate environments, the prices of longer-term securities generally fluctuate more than prices of shorter-term securities as interest rates change.
150
LIBOR Floor Risk. Many floating rate loans issued after 2008 include a “LIBOR floor,” based on the London Interbank Offered Rate (“LIBOR”), or a minimum interest rate to which the loan’s spread is added, to calculate the loan’s overall interest rate. As short-term market rates rise, such loans will not pay higher interest until prevailing rates exceed the floor rate stated in the loan documents. If the Fund uses floating rate leverage, the Fund’s leverage costs will likely increase before its loan portfolio income increases, and the additional income provided by leverage may diminish until market rates exceed the LIBOR floor level.
LIBOR Replacement Risk. The use of LIBOR will begin to be phased out in the near future, which may adversely affect the Fund’s investments whose value is tied to LIBOR. There remains uncertainty regarding the future use of LIBOR and the nature of any replacement reference rate. Actions by regulators have resulted in the establishment of alternative reference rates to LIBOR in most major currencies and markets are slowly developing in response to these new rates. The transition process away from LIBOR may involve, among other things, increased volatility in markets for instruments that currently rely on LIBOR. The potential effect of a discontinuation of LIBOR on the Fund’s investments will vary depending on, among other things: (1) existing fallback provisions that provide a replacement reference rate if LIBOR is no longer available; (2) termination provisions in individual contracts; and (3) whether, how, and when industry participants develop and adopt new reference rates and fallbacks for both legacy and new products and instruments held by the Fund. Accordingly, it is difficult to predict the full impact of the transition away from LIBOR until it is clearer how the Fund’s products an instruments will be impacted by this transition.
Loan Participation Risk. The Fund may purchase a participation interest in a loan and by doing so acquire some or all of the interest of a bank or other lending institution in a loan to a borrower. A participation typically will result in the Fund having a contractual relationship only with the lender, not the borrower. As a result, the Fund assumes the credit risk of the lender selling the participation in addition to the credit risk of the borrower. By purchasing a participation, the Fund will have the right to receive payments of principal, interest and any fees to which it is entitled only from the lender selling the participation and only upon receipt by the lender of the payments from the borrower. In the event of insolvency or bankruptcy of the lender selling the participation, the Fund may be treated as a general creditor of the lender and may not have a senior claim to the lender’s interest in the loan. If the Fund only acquires a participation in the loan made by a third party, the Fund may not be able to control the exercise of any remedies that the lender would have under the loan. Such third party participation arrangements are designed to give loan investors preferential treatment over high yield investors in the event of a deterioration in the credit quality of the borrower. Even when these arrangements exist, however, there can be no assurance that the principal and interest owed on the loan will be repaid in full.
Loan Risk. The lack of an active trading market for certain loans may impair the ability of the Fund to realize full value in the event of the need to sell a loan and may make it difficult to value such loans. Portfolio transactions in loans may settle in as short as seven days but typically can take up to two or three weeks, and in some cases much longer. As a result of these extended settlement periods, the Fund may incur losses if it is required to sell other investments or temporarily borrow to meet its cash needs. The risks associated with unsecured loans, which are not backed by a security interest in any specific collateral, are higher than those for comparable loans that are secured by specific collateral. For secured loans, there is a risk that the value of any collateral securing a loan in which the Fund has an interest may decline and that the collateral may not be sufficient to cover the amount owed on the loan. Interests in loans made to finance highly leveraged companies or transactions such as corporate acquisitions may be especially vulnerable to adverse changes in economic or market conditions. Loans may have restrictive covenants limiting the ability of a borrower to further encumber its assets. However, in periods of high demand by lenders like the Fund for loan investments, borrowers may limit these covenants and weaken a lender’s ability to access collateral securing the loan; reprice the credit risk associated with the borrower; and mitigate potential loss. The Fund may experience relatively greater realized or unrealized losses or delays and expenses in enforcing its rights with respect to loans with fewer restrictive covenants. Additionally, loans may not be considered “securities” and, as a result, the Fund may not be entitled to rely on the anti-fraud protections of the securities laws. Because junior loans have a lower place in an issuer’s capital structure and may be unsecured, junior loans involve a higher degree of overall risk than senior loans of the issuer.
Mortgage-Backed Securities Risk. Investing in mortgage-backed securities (“MBS”) entails various risks: credit risks, liquidity risks, interest rate risks, market risks, operations risks, structural risks, geographical concentration risks, basis risks and legal risks. Most MBS are subject to the significant credit risks inherent in the underlying collateral and to the risk that the servicer fails to perform. MBS are subject to risks associated with their structure and execution, including the process by which principal and interest payments are allocated and distributed to investors, how credit losses affect the issuing vehicle and the return to investors in such MBS, whether the collateral represents a fixed set of specific assets or accounts, whether the underlying collateral assets are revolving or closed-end, under what terms (including maturity of the MBS) any remaining balance in the accounts may revert to the issuing entity and the extent to which the entity that is the actual source of the collateral assets is obligated to provide support to the issuing vehicle or to the investors in such MBS. In addition, concentrations of MBS of a particular type, as well as concentrations of MBS issued or guaranteed by affiliated obligors, serviced by the same servicer or backed by underlying collateral located in a specific geographic region, may subject the MBS to additional risk.
The risks associated with MBS include: (1) credit risk associated with the performance of the underlying mortgage properties and of the borrowers owning these properties; (2) adverse changes in economic conditions and circumstances, which are more likely to have an adverse impact on MBS secured by loans on certain types of commercial properties than on those secured by loans on residential properties; (3) prepayment risk, which can lead to significant
151
Shareholder Update (continued)
(Unaudited)
fluctuations in value of the MBS; (4) loss of all or part of the premium, if any, paid; and (5) decline in the market value of the security, whether resulting from changes in interest rates, prepayments on the underlying mortgage collateral or perceptions of the credit risk associated with the underlying mortgage collateral.
MBS represent an interest in a pool of mortgages. When market interest rates decline, more mortgages are refinanced and the securities are paid off earlier than expected. Prepayments may also occur on a scheduled basis or due to foreclosure. When market interest rates increase, the market values of MBS decline. At the same time, however, mortgage refinancings and prepayments slow, which lengthens the effective maturities of these securities. As a result, the negative effect of the rate increase on the market value of MBS is usually more pronounced than it is for other types of debt securities. In addition, in the event of increased instability in the credit markets, the market for some MBS may experience reduced liquidity and greater volatility with respect to the value of such securities, making it more difficult to value such securities.
Moreover, the relationship between borrower prepayments and changes in interest rates may mean some high-yielding MBS have less potential for increases in value if market interest rates were to fall than conventional bonds with comparable maturities. In addition, in periods of falling interest rates, the rate of prepayments tends to increase. During such periods, the reinvestment of prepayment proceeds by the Fund will generally be at lower rates than the rates that were carried by the obligations that have been prepaid. Because of these and other reasons, MBS’ total return and maturity may be difficult to predict precisely. To the extent that the Fund purchases MBS at a premium, prepayments (which may be made without penalty) may result in loss of the Fund’s principal investment to the extent of premium paid.
MBS generally are classified as either CMBS or RMBS, each of which are subject to certain specific risks as further described herein.
Non-U.S. Securities Risk. Investments in securities of non-U.S. issuers involve special risks, including: less publicly available information about non-U.S. issuers or markets due to less rigorous disclosure or accounting standards or regulatory practices; many non-U.S. markets are smaller, less liquid and more volatile; the economies of non-U.S. countries may grow at slower rates than expected or may experience a downturn or recession; the impact of economic, political, social or diplomatic events; and withholding and other non-U.S. taxes may decrease the Fund’s return. These risks are more pronounced to the extent that the Fund invests a significant amount of its assets in issuers located in one region.
Other Investment Companies Risk. The Fund may invest in the securities of other investment companies, including ETFs. Investing in an investment company exposes the Fund to all of the risks of that investment company’s investments. The Fund, as a holder of the securities of other investment companies, will bear its pro rata portion of the other investment companies’ expenses, including advisory fees. These expenses are in addition to the direct expenses of the Fund’s own operations. As a result, the cost of investing in investment company shares may exceed the costs of investing directly in its underlying investments. In addition, securities of other investment companies may be leveraged. As a result, the Fund may be indirectly exposed to leverage through an investment in such securities and therefore magnify the Fund’s leverage risk.
With respect to ETF’s, an ETF that is based on a specific index may not be able to replicate and maintain exactly the composition and relative weighting of securities in the index. The value of an ETF based on a specific index is subject to change as the values of its respective component assets fluctuate according to market volatility. ETFs typically rely on a limited pool of authorized participants to create and redeem shares, and an active trading market for ETF shares may not develop or be maintained. The market value of shares of ETFs and closed-end funds may differ from their NAV.
Preferred Securities Risk. Preferred securities are subordinated to bonds and other debt instruments in a company’s capital structure, and therefore are subject to greater credit risk. In addition, preferred stockholders (such as the Fund, to the extent it invests in preferred stocks of other issuers) generally have no voting rights with respect to the issuing company unless preferred dividends have been in arrears for a specified number of periods, at which time the preferred stockholders may elect a number of directors to the issuer’s board. Generally, once all the arrearages have been paid, the preferred stockholders no longer have voting rights. In the case of certain taxable preferred stocks, holders generally have no voting rights, except (i) if the issuer fails to pay dividends for a specified period of time or (ii) if a declaration of default occurs and is continuing. In such an event, rights of preferred stockholders generally would include the right to appoint and authorize a trustee to enforce the trust or special purpose entity’s rights as a creditor under the agreement with its operating company. In certain varying circumstances, an issuer of preferred stock may redeem the securities prior to a specified date. For instance, for certain types of preferred stock, a redemption may be triggered by a change in U.S. federal income tax or securities laws. As with call provisions, a redemption by the issuer may negatively impact the return of the security held by the Fund.
Reinvestment Risk. Reinvestment risk is the risk that income from the Fund’s portfolio will decline if and when the Fund invests the proceeds from matured, traded or called securities at market interest rates that are below the portfolio’s current earnings rate. A decline in income could affect the common shares’ market price, NAV and/or a common shareholder’s overall returns.
Second Lien Loans and Unsecured Loans Risk. Second lien loans and unsecured loans generally are subject to the same risks associated with investments in senior loans, as discussed below. Because second lien loans and unsecured loans are lower in priority of payment to senior loans, they are subject to the additional risk that the cash flow of the borrower and property securing the loan, if any, may be insufficient to meet scheduled payments after giving effect to the senior secured obligations of the borrower. This risk is generally higher for unsecured loans, which are not backed by a security interest in any
152
specific collateral. Second lien loans and unsecured loans are expected to have greater price volatility than senior loans and may be less liquid. Second lien loans and unsecured loans of below investment grade quality also share the same risks of other below investment grade debt instruments.
Senior Loan Agent Risk. A financial institution’s employment as an agent under a senior loan might be terminated in the event that it fails to observe a requisite standard of care or becomes insolvent. A successor agent would generally be appointed to replace the terminated agent, and assets held by the agent under the loan agreement would likely remain available to holders of such indebtedness. However, if assets held by the terminated agent for the benefit of the Fund were determined to be subject to the claims of the agent’s general creditors, the Fund might incur certain costs and delays in realizing payment on a senior loan or loan participation and could suffer a loss of principal and/or interest. In situations involving other interposed financial institutions (e.g., an insurance company or government agency) similar risks may arise.
Senior Loan Risk. Senior loans typically hold the most senior position in the capital structure of a business entity, are typically secured with specific collateral and have a claim on the assets and/or stock of the issuer that is senior to that held by subordinated debt holders and stockholders of the issuer. Senior loans are usually rated below investment grade, and share the same risks of other below investment grade debt instruments.
Although the Fund may invest in senior loans that are secured by specific collateral, there can be no assurance that the liquidation of such collateral would satisfy an issuer’s obligation to the Fund in the event of issuer default or that such collateral could be readily liquidated under such circumstances. If the terms of a senior loan do not require the issuer to pledge additional collateral in the event of a decline in the value of the already pledged collateral, the Fund will be exposed to the risk that the value of the collateral will not at all times equal or exceed the amount of the issuer’s obligations under the senior loan.
In the event of bankruptcy of an issuer, the Fund could also experience delays or limitations with respect to its ability to realize the benefits of any collateral securing a senior loan. Some senior loans are subject to the risk that a court, pursuant to fraudulent conveyance or other similar laws, could subordinate the senior loans to presently existing or future indebtedness of the issuer or take other action detrimental to lenders, including the Fund. Such court action could under certain circumstances include invalidation of senior loans.
Short Exposure Risk. The Fund may enter into tactical short positions, either directly or through derivatives, to create negative investment exposure to or hedge existing investment exposure. Short selling involves selling securities that may be owned, and if not owned, borrowing the same securities for delivery to the purchaser, with an obligation to replace the borrowed securities at a later date. Short selling allows the short seller to profit from declines in market prices to the extent such declines exceed the transaction costs and the costs of borrowing the securities. A short sale creates the risk of an unlimited loss, in that the price of the underlying security could theoretically increase without limit, thus increasing the cost of buying those securities to cover the short position. There can be no assurance that the securities necessary to cover a short position will be available for purchase. Purchasing securities to close out the short position can itself cause the price of the securities to rise further, thereby exacerbating the loss.
Sovereign Government and Supranational Debt Risk. Investments in sovereign debt, including supranational debt, involve special risks. Foreign governmental issuers of debt or the governmental authorities that control the repayment of the debt may be unable or unwilling to repay principal or pay interest when due. In the event of default, there may be limited or no legal recourse in that, generally, remedies for defaults must be pursued in the courts of the defaulting party. Political conditions, especially a sovereign entity’s willingness to meet the terms of its debt obligations, are of considerable significance. The ability of a foreign sovereign issuer, especially an emerging market country, to make timely payments on its debt obligations will also be strongly influenced by the sovereign issuer’s balance of payments, including export performance, its access to international credit facilities and investments, fluctuations of interest rates and the extent of its foreign reserves. A country whose exports are concentrated in a few commodities or whose economy depends on certain strategic imports could be vulnerable to fluctuations in international prices of these commodities or imports. If a sovereign issuer cannot generate sufficient earnings from foreign trade to service its external debt, it may need to depend on continuing loans and aid from foreign governments, commercial banks, and multinational organizations. The cost of servicing external debt will also generally be adversely affected by rising international interest rates, as many external debt obligations bear interest at rates which are adjusted based upon international interest rates. Foreign investment in certain sovereign debt is restricted or controlled to varying degrees, including requiring governmental approval for the repatriation of income, capital or proceeds of sales by foreign investors. There are no bankruptcy proceedings similar to those in the U.S. by which defaulted sovereign debt may be collected.
Structured Product Risk. The Fund may invest in structured products such as structured notes. Holders of structured products bear risks of the underlying investments, index or reference obligation and are subject to counterparty risk. The Fund may have the right to receive payments to which it is entitled only from the structured product, and generally does not have direct rights against the issuer or the entity that sold assets to the special purpose trust. While certain structured products enable the investor to acquire interests in a pool of securities without the brokerage and other expenses associated with directly holding the same securities, investors in structured products generally pay their share of the structured product’s administrative and other expenses. When investing in structured products, it is impossible to predict whether the underlying index or prices of the underlying securities will rise or fall, but prices of the underlying indices and securities (and, therefore, the prices of structured products) will be influenced by the same types of political and economic events that affect particular issuers of securities and capital markets generally. Certain structured products may be thinly traded or have a
153
Shareholder Update (continued)
(Unaudited)
limited trading market and may have the effect of increasing the illiquidity of the Fund’s portfolio to the extent that the Fund, at a particular point in time, may be unable to find qualified buyers for these securities. Investments in structured notes involve risks including income risk, credit and market risk. Structured notes may be less liquid than other types of securities and more volatile than the reference instrument or security underlying the note.
Subordinated Loans and Other Subordinated Debt Instruments Risk. Issuers of subordinated loans and other subordinated debt instruments in which the Fund may invest usually will have, or may be permitted to incur, other debt that ranks equally with, or senior to, the subordinated loans or other subordinated debt instruments. By their terms, such debt instruments may provide that the holders are entitled to receive payment of interest or principal on or before the dates on which the Fund is entitled to receive payments in respect of subordinated loans or other subordinated debt instruments in which it invests. Also, in the event of insolvency, liquidation, dissolution, reorganization or bankruptcy of an issuer, holders of debt instruments ranking senior to the subordinated loan or other debt instrument in which the Fund invests would typically be entitled to receive payment in full before the Fund receives any distribution in respect of its investment. After repaying such senior creditors, such issuer may not have any remaining assets to use for repaying its obligation to the Fund. In the case of debt ranking equally with subordinated loans or other subordinated debt instruments in which the Fund invests, the Fund would have to share on an equal basis any distributions with other creditors holding such debt in the event of an insolvency, liquidation, dissolution, reorganization or bankruptcy of the relevant issuer. In addition, the Fund will likely not be in a position to control any issuer by investing in its debt instruments. As a result, the Fund will be subject to the risk that an issuer in which it invests may make business decisions with which the Fund disagrees and the management of such issuer, as representatives of the holders of their common equity, may take risks or otherwise act in ways that do not serve the Fund’s interests as a debt investor.
Swap Transactions Risk. The Fund may enter into derivative instruments such as credit default swap contracts and interest rate swaps. Like most derivative instruments, the use of swaps is a highly specialized activity that involves investment techniques and risks different from those associated with ordinary portfolio securities transactions. In addition, the use of swaps requires an understanding by the investment adviser and/or the sub-adviser of not only the referenced asset, rate or index, but also of the swap itself. If the investment adviser and/or the sub-adviser is incorrect in its forecasts of default risks, market spreads or other applicable factors or events, the investment performance of the Fund would diminish compared with what it would have been if these techniques were not used.
Unrated Securities Risk. The Fund may purchase securities that are not rated by any rating organization. The investment adviser may, after assessing such securities’ credit quality, internally assign ratings to certain of those securities in categories similar to those of rating organizations. Some unrated securities may not have an active trading market or may be difficult to value, which means the Fund might have difficulty selling them promptly at an acceptable price. To the extent that the Fund invests in unrated securities, the Fund’s ability to achieve its investment objectives will be more dependent on the investment adviser’s credit analysis than would be the case when the Fund invests in rated securities.
Valuation Risk. The securities in which the Fund invests typically are valued by a pricing service utilizing a range of market-based inputs and assumptions, including readily available market quotations obtained from broker-dealers making markets in such instruments, cash flows and transactions for comparable instruments. There is no assurance that the Fund will be able to sell a portfolio security at the price established by the pricing service, which could result in a loss to the Fund. Pricing services generally price securities assuming orderly transactions of an institutional “round lot” size, but some trades may occur in smaller, “odd lot” sizes, often at lower prices than institutional round lot trades. Different pricing services may incorporate different assumptions and inputs into their valuation methodologies, potentially resulting in different values for the same securities. As a result, if the Fund were to change pricing services, or if the Fund’s pricing service were to change its valuation methodology, there could be a material impact, either positive or negative, on the Fund’s NAV.
Warrants and Equity Securities Risk. Investments in warrants and equity securities entail certain risks in addition to those associated with investments in adjustable rate instruments or other debt instruments. The value of warrants and equity securities may be affected more rapidly, and to a greater extent, by company-specific developments and general market conditions. These risks may increase fluctuations in the Fund’s NAV. The Fund may possess material non-public information about an issuer as a result of its ownership of an adjustable rate instrument or other debt instrument of such issuer. Because of prohibitions on trading in securities of issuers while in possession of such information, the Fund might be unable to enter into a transaction in a security of such an issuer when it would otherwise be advantageous to do so.
When-Issued and Delayed-Delivery Transactions Risk. The Fund may invest in securities on a “when-issued” or “delayed-delivery” basis. When-issued and delayed-delivery transactions may involve an element of risk because no interest accrues on the securities prior to settlement and, because securities are subject to market fluctuations, the value of the securities at time of delivery may be less (or more) than their cost. A separate account of the Fund will be established with its custodian consisting of cash equivalents or liquid securities having a market value at all times at least equal to the amount of any delayed payment commitment.
Zero Coupon Bonds Risk. Because interest on zero coupon bonds is not paid on a current basis, the values of zero coupon bonds will be more volatile in response to interest rate changes than the values of bonds that distribute income regularly. Although zero coupon bonds generate income for accounting purposes, they do not produce cash flow, and thus the Fund could be forced to liquidate securities at an inopportune time in order to generate cash to distribute to shareholders as required by tax laws.
154
Fund Level and Other Risks:
Anti-Takeover Provisions. The Fund’s organizational documents include provisions that could limit the ability of other entities or persons to acquire control of the Fund or convert the Fund to open-end status. These provisions could have the effect of depriving the common shareholders of opportunities to sell their common shares at a premium over the then-current market price of the common shares.
Borrowing Risk. In addition to borrowing for leverage, the Fund may borrow for temporary or emergency purposes, to pay dividends, repurchase its shares, or clear portfolio transactions. Borrowing may exaggerate changes in the NAV of the Fund’s shares and may affect the Fund’s net income. When the Fund borrows money, it must pay interest and other fees, which will reduce the Fund’s returns if such costs exceed the returns on the portfolio securities purchased or retained with such borrowings. Any such borrowings are intended to be temporary. However, under certain market circumstances, such borrowings might be outstanding for longer periods of time.
Counterparty Risk. Changes in the credit quality of the companies that serve as the Fund’s counterparties with respect to derivatives or other transactions supported by another party’s credit will affect the value of those instruments. Certain entities that have served as counterparties in the markets for these transactions have incurred or may incur in the future significant financial hardships including bankruptcy and losses as a result of exposure to sub-prime mortgages and other lower-quality credit investments. As a result, such hardships have reduced these entities’ capital and called into question their continued ability to perform their obligations under such transactions. By using such derivatives or other transactions, the Fund assumes the risk that its counterparties could experience similar financial hardships. In the event of the insolvency of a counterparty, the Fund may sustain losses or be unable to liquidate a derivatives position.
Cybersecurity Risk. The Fund and its service providers are susceptible to operational and information security risk resulting from cyber incidents. Cyber incidents refer to both intentional attacks and unintentional events including: processing errors, human errors, technical errors including computer glitches and system malfunctions, inadequate or failed internal or external processes, market-wide technical-related disruptions, unauthorized access to digital systems (through “hacking” or malicious software coding), computer viruses, and cyber-attacks which shut down, disable, slow or otherwise disrupt operations, business processes or website access or functionality (including denial of service attacks). Cyber incidents could adversely impact the Fund and cause the Fund to incur financial loss and expense, as well as face exposure to regulatory penalties, reputational damage, and additional compliance costs associated with corrective measures. In addition, substantial costs may be incurred in order to prevent any cyber incidents in the future. Furthermore, the Fund cannot control the cybersecurity plans and systems put in place by its service providers or any other third parties whose operations may affect the Fund.
Global Economic Risk. National and regional economies and financial markets are becoming increasingly interconnected, which increases the possibilities that conditions in one country, region or market might adversely impact issuers in a different country, region or market. Changes in legal, political, regulatory, tax and economic conditions may cause fluctuations in markets and securities prices around the world, which could negatively impact the value of the Fund’s investments. Major economic or political disruptions, particularly in large economies like China’s, may have global negative economic and market repercussions. Additionally, events such as war, terrorism, natural and environmental disasters and the spread of infectious illnesses or other public health emergencies may adversely affect the global economy and the markets and issuers in which the Fund invests. Recent examples of such events include the outbreak of a novel coronavirus known as COVID-19 that was first detected in China in December 2019 and heightened concerns regarding North Korea’s nuclear weapons and long-range ballistic missile programs. These events could reduce consumer demand or economic output, result in market closure, travel restrictions or quarantines, and generally have a significant impact on the economy. These events could also impair the information technology and other operational systems upon which the Fund’s service providers, including the investment adviser and sub-adviser, rely, and could otherwise disrupt the ability of employees of the Fund’s service providers to perform essential tasks on behalf of the Fund. Governmental and quasi-governmental authorities and regulators throughout the world have in the past responded to major economic disruptions with a variety of significant fiscal and monetary policy changes, including but not limited to, direct capital infusions into companies, new monetary programs and dramatically lower interest rates. An unexpected or quick reversal of these policies, or the ineffectiveness of these policies, could increase volatility in securities markets, which could adversely affect the Fund’s investments.
Investment and Market Risk. An investment in the Fund’s common shares is subject to investment risk, including the possible loss of the entire principal amount that you invest. Common shares frequently trade at a discount to their NAV. An investment in common shares represents an indirect investment in the securities owned by the Fund. Common shares at any point in time may be worth less than your original investment, even after taking into account the reinvestment of Fund dividends and distributions.
Legislation and Regulatory Risk. At any time after the date of this report, legislation or additional regulations may be enacted that could negatively affect the assets of the Fund, securities held by the Fund or the issuers of such securities. Fund shareholders may incur increased costs resulting from such legislation or additional regulation. There can be no assurance that future legislation, regulation or deregulation will not have a material adverse effect on the Fund or will not impair the ability of the Fund to achieve its investment objectives.
155
Shareholder Update (continued)
(Unaudited)
The SEC recently adopted rules governing the use of derivatives by registered investment companies, which could affect the nature and extent of derivatives used by the Fund. The full impact of such rules is uncertain at this time. It is possible that such rules, as interpreted, applied and enforced by the SEC, could limit the implementation of the Fund’s use of derivatives, which could have an adverse impact on the Fund.
Leverage Risk. The use of leverage creates special risks for common shareholders, including potential interest rate risks and the likelihood of greater volatility of NAV and market price of, and distributions on, the common shares. The use of leverage in a declining market will likely cause a greater decline in the Fund’s NAV, which may result at a greater decline of the common share price, than if the Fund were not to have used leverage.
The Fund will pay (and common shareholders will bear) any costs and expenses relating to the Fund’s use of leverage, which will result in a reduction in the Fund’s NAV. The investment adviser may, based on its assessment of market conditions and composition of the Fund’s holdings, increase or decrease the amount of leverage. Such changes may impact the Fund’s distributions and the price of the common shares in the secondary market.
The Fund may seek to refinance its leverage over time, in the ordinary course, as current forms of leverage mature or it is otherwise desirable to refinance; however, the form that such leverage will take cannot be predicted at this time. If the Fund is unable to replace existing leverage on comparable terms, its costs of leverage will increase. Accordingly, there is no assurance that the use of leverage may result in a higher yield or return to common shareholders.
The amount of fees paid to the investment adviser and the sub-advisor for investment advisory services will be higher if the Fund uses leverage because the fees will be calculated based on the Fund’s Managed Assets—this may create an incentive for the investment adviser and the sub-advisor to leverage the Fund or increase the Fund’s leverage.
Market Discount from Net Asset Value. Shares of closed-end investment companies like the Fund frequently trade at prices lower than their NAV. This characteristic is a risk separate and distinct from the risk that the Fund’s NAV could decrease as a result of investment activities. Whether investors will realize gains or losses upon the sale of the common shares will depend not upon the Fund’s NAV but entirely upon whether the market price of the common shares at the time of sale is above or below the investor’s purchase price for the common shares. Furthermore, management may have difficulty meeting the Fund’s investment objectives and managing its portfolio when the underlying securities are redeemed or sold during periods of market turmoil and as investors’ perceptions regarding closed-end funds or their underlying investments change. Because the market price of the common shares will be determined by factors such as relative supply of and demand for the common shares in the market, general market and economic circumstances, and other factors beyond the control of the Fund, the Fund cannot predict whether the common shares will trade at, below or above NAV. The common shares are designed primarily for long-term investors, and you should not view the Fund as a vehicle for short-term trading purposes.
Recent Market Conditions. In response to the financial crisis and recent market events, policy and legislative changes by the United States government and the Federal Reserve to assist in the ongoing support of financial markets, both domestically and in other countries, are changing many aspects of financial regulation. The impact of these changes on the markets, and the practical implications for market participants, may not be fully known for some time. Withdrawal of government support, failure of efforts in response to the crisis, or investor perception that such efforts are not succeeding, could adversely impact the value and liquidity of certain securities. The severity or duration of adverse economic conditions may also be affected by policy changes made by governments or quasi-governmental organizations, including changes in tax laws and the imposition of trade barriers. The impact of new financial regulation legislation on the markets and the practical implications for market participants may not be fully known for some time. Changes to the Federal Reserve policy may affect the value, volatility and liquidity of dividend and interest paying securities. In addition, the contentious domestic political environment, as well as political and diplomatic events within the United States and abroad, such as the U.S. government’s inability at times to agree on a long-term budget and deficit reduction plan, the threat of a federal government shutdown and threats not to increase the federal government’s debt limit, may affect investor and consumer confidence and may adversely impact financial markets and the broader economy, perhaps suddenly and to a significant degree.
Interest rates have been unusually low in recent years in the United States and abroad but there is consensus that interest rates will increase during the life of the Fund, which could negatively impact the price of debt securities. Because there is little precedent for this situation, it is difficult to predict the impact of a significant rate increase on various markets.
The current political climate has intensified concerns about a potential trade war between China and the United States, as each country has recently imposed tariffs on the other country’s products. These actions may trigger a significant reduction in international trade, the oversupply of certain manufactured goods, substantial price reductions of goods and possible failure of individual companies and/or large segments of China’s export industry, which could have a negative impact on the Fund’s performance.
The impact of these developments in the near- and long-term is unknown and could have additional adverse effects on economies, financial markets and asset valuations around the world.
Reverse Repurchase Agreement Risk. A reverse repurchase agreement, in economic essence, constitutes a securitized borrowing by the Fund from the security purchaser. The Fund may enter into reverse repurchase agreements for the purpose of creating a leveraged investment exposure and, as such, their usage involves essentially the same risks associated with a leveraging strategy generally since the proceeds from these agreements may be invested
156
in additional portfolio securities. Reverse repurchase agreements tend to be short-term in tenor, and there can be no assurances that the purchaser (lender) will commit to extend or “roll” a given agreement upon its agreed-upon repurchase date or an alternative purchaser can be identified on similar terms. Reverse repurchase agreements also involve the risk that the purchaser fails to return the securities as agreed upon, files for bankruptcy or becomes insolvent. The Fund may be restricted from taking normal portfolio actions during such time, could be subject to loss to the extent that the proceeds of the agreement are less than the value of securities subject to the agreement and may experience adverse tax consequences.
Tax Risk. The Fund has elected to be treated and intends to qualify each year as a Regulated Investment Company (“RIC”) under the Internal Revenue Code of 1986, as amended (the “Code”). As a RIC, the Fund is not expected to be subject to U.S. federal income tax to the extent that it distributes its investment company taxable income and net capital gains. To qualify for the special tax treatment available to a RIC, the Fund must comply with certain investment, distribution, and diversification requirements. Under certain circumstances, the Fund may be forced to sell certain assets when it is not advantageous in order to meet these requirements, which may reduce the Fund’s overall return. If the Fund fails to meet any of these requirements, subject to the opportunity to cure such failures under applicable provisions of the Code, the Fund’s income would be subject to a double level of U.S. federal income tax. The Fund’s income, including its net capital gain, would first be subject to U.S. federal income tax at regular corporate rates, even if such income were distributed to shareholders and, second, all distributions by the Fund from earnings and profits, including distributions of net capital gain (if any), would be taxable to shareholders as dividends.
157
Shareholder Update (continued)
(Unaudited)
EFFECTS OF LEVERAGE
The following table is furnished in response to requirements of the SEC. It is designed to illustrate the effects of leverage through the use of senior securities, as that term is defined under Section 18 of the 1940 Act, as well as certain other forms of leverage, such as reverse repurchase agreements, on common share total return, assuming investment portfolio total returns (consisting of income and changes in the value of investments held in the Fund’s portfolio) of -10%, -5%, 0%, 5% and 10%. The table below reflects each Fund’s (i) continued use of leverage as of July 31, 2021 as a percentage of Managed Assets (including assets attributable to such leverage), (ii) the estimated annual effective interest expense rate payable by the Funds on such instruments (based on actual leverage costs incurred during the fiscal year ended July 31, 2021) as set forth in the table, and (iii) the annual return that the Fund’s portfolio must experience (net of expenses) in order to cover such costs of leverage based on such estimated annual effective interest expense rate. The information below does not reflect any Fund’s use of certain other forms of economic leverage achieved through the use of certain derivative instruments.
The numbers are merely estimates, used for illustration. The costs of leverage may vary frequently and may be significantly higher or lower than the estimated rate. The assumed investment portfolio returns in the table below are hypothetical figures and are not necessarily indicative of the investment portfolio returns experienced or expected to be experienced by the Funds. Your actual returns may be greater or less than those appearing below.
| | | | | | | | | | | | | | | | | | | | |
| | | Nuveen Senior
Income Fund (NSL) | | | Nuveen Floating
Rate Income
Fund (JFR) | | | Nuveen Floating
Rate Income
Opportunity
Fund (JRO) | | | Nuveen Short
Duration Credit
Opportunities
Fund (JSD) | | | Nuveen Credit
Strategies
Income Fund (JQC) | |
Estimated Leverage as a Percentage of Managed Assets (Including Assets Attributable to Leverage) | | | 36.35% | | | | 36.47% | | | | 36.52% | | | | 36.39% | | | | 36.72% | |
Estimated Annual Effective Leverage Expense Rate Payable by Fund on Leverage | | | 1.09% | | | | 1.08% | | | | 1.06% | | | | 1.20% | | | | 1.22% | |
Annual Return Fund Portfolio Must Experience (net of expenses) to Cover Estimated Annual Effective Interest Expense Rate on Leverage | | | 0.39% | | | | 0.39% | | | | 0.39% | | | | 0.44% | | | | 0.45% | |
Common Share Total Return for (10.00)% Assumed Portfolio Total Return | | | -16.33% | | | | -16.36% | | | | -16.36% | | | | -16.41% | | | | -16.51% | |
Common Share Total Return for (5.00)% Assumed Portfolio Total Return | | | -8.48% | | | | -8.49% | | | | -8.49% | | | | -8.55% | | | | -8.61% | |
Common Share Total Return for 0.00% Assumed Portfolio Total Return | | | -0.62% | | | | -0.62% | | | | -0.61% | | | | -0.69% | | | | -0.71% | |
Common Share Total Return for 5.00% Assumed Portfolio Total Return | | | 7.24% | | | | 7.25% | | | | 7.27% | | | | 7.17% | | | | 7.20% | |
Common Share Total Return for 10.00% Assumed Portfolio Total Return | | | 15.09% | | | | 15.12% | | | | 15.14% | | | | 15.03% | | | | 15.10% | |
Common Share total return is composed of two elements — the distributions paid by the Fund to holders of common shares (the amount of which is largely determined by the net investment income of the Fund after paying dividend payments on any preferred shares issued by the Fund and expenses on any forms of leverage outstanding) and gains or losses on the value of the securities and other instruments the Fund owns. As required by SEC rules, the table assumes that the Funds are more likely to suffer capital losses than to enjoy capital appreciation. For example, to assume a total return of 0%, the Fund must assume that the income it receives on its investments is entirely offset by losses in the value of those investments. This table reflects hypothetical performance of the Fund’s portfolio and not the actual performance of the Fund’s common shares, the value of which is determined by market forces and other factors. Should the Fund elect to add additional leverage to its portfolio, any benefits of such additional leverage cannot be fully achieved until the proceeds resulting from the use of such leverage have been received by the Fund and invested in accordance with the Fund’s investment objectives and policies. As noted above, the Fund’s willingness to use additional leverage, and the extent to which leverage is used at any time, will depend on many factors.
158
DIVIDEND REINVESTMENT PLAN
Nuveen Closed-End Funds Automatic Reinvestment Plan
Your Nuveen Closed-End Fund allows you to conveniently reinvest distributions in additional Fund shares. By choosing to reinvest, you’ll be able to invest money regularly and automatically, and watch your investment grow through the power of compounding. Just like distributions in cash, there may be times when income or capital gains taxes may be payable on distributions that are reinvested. It is important to note that an automatic reinvestment plan does not ensure a profit, nor does it protect you against loss in a declining market.
Easy and convenient
To make recordkeeping easy and convenient, each quarter you’ll receive a statement showing your total distributions, the date of investment, the shares acquired and the price per share, and the total number of shares you own.
How shares are purchased
The shares you acquire by reinvesting will either be purchased on the open market or newly issued by the Fund. If the shares are trading at or above NAV at the time of valuation, the Fund will issue new shares at the greater of the NAV or 95% of the then-current market price. If the shares are trading at less than NAV, shares for your account will be purchased on the open market. If Computershare Trust Company, N.A. (the “Plan Agent”) begins purchasing Fund shares on the open market while shares are trading below NAV, but the Fund’s shares subsequently trade at or above their NAV before the Plan Agent is able to complete its purchases, the Plan Agent may cease open-market purchases and may invest the uninvested portion of the distribution in newly-issued Fund shares at a price equal to the greater of the shares’ NAV or 95% of the shares’ market value on the last business day immediately prior to the purchase date. Distributions received to purchase shares in the open market will normally be invested shortly after the distribution payment date. No interest will be paid on distributions awaiting reinvestment. Because the market price of the shares may increase before purchases are completed, the average purchase price per share may exceed the market price at the time of valuation, resulting in the acquisition of fewer shares than if the distribution had been paid in shares issued by the Fund. A pro rata portion of any applicable brokerage commissions on open market purchases will be paid by Dividend Reinvestment Plan (the “Plan”) participants. These commissions usually will be lower than those charged on individual transactions.
Flexible
You may change your distribution option or withdraw from the Plan at any time, should your needs or situation change. You can reinvest whether your shares are registered in your name, or in the name of a brokerage firm, bank, or other nominee. Ask your investment advisor if his or her firm will participate on your behalf. Participants whose shares are registered in the name of one firm may not be able to transfer the shares to another firm and continue to participate in the Plan. The Fund reserves the right to amend or terminate the Plan at any time. Although the Fund reserves the right to amend the Plan to include a service charge payable by the participants, there is no direct service charge to participants in the Plan at this time.
Call today to start reinvesting distributions
For more information on the Nuveen Automatic Reinvestment Plan or to enroll in or withdraw from the Plan, speak with your financial professional or call us at (800) 257-8787.
159
Shareholder Update (continued)
(Unaudited)
CHANGES OCCURRING DURING THE FISCAL YEAR
The following information in this annual report is a summary of certain changes during the most recent fiscal year. This information may not reflect all of the changes that have occurred since you purchased shares of a Fund.
During the most recent fiscal year, there have been no changes to: (i) the Funds’ investment objectives and principal investment policies that have not been approved by shareholders, (ii) the principal risks of the Fund, (iii) the portfolio managers of the Funds; (iv) a Fund’s charter or by-laws that would delay or prevent a change of control of the Fund that have not been approved by shareholders except as follows:
Changes to Portfolio Managers
Effective August 17, 2020, Bernard Wong, CFA, is no longer a portfolio manager of JQC. Additionally, effective October 1, 2020, Jenny Rhee is no longer a portfolio manager of NSL, JFR, JRO, JSD and JQC.
Effective August 17, 2020, Kevin Lorenz, CFA, was added as portfolio managers to NSL, JFR, JRO, JSD and JQC. Kevn Lorenz bio is as follows:
Mr. Lorenz is head of high yield and responsible for retail and institutional high yield bond focused portfolio management. He has served in a variety of roles since joining the firm in 1987. He has been investing in high yield over his entire career and has focused exclusively on high yield since 1995. He is also a member of the global fixed income investment committee, which discusses and debates investment policy for all global fixed income products. He began his career at the firm as a generalist focusing on the private placement market. He graduated with a B.S. in Accounting from Rider University and an M.B.A. in Finance from Indiana University. He holds the CFA designation and is a member of the New York Society of Security Analysts.
Amended and Restated By-Laws
On October 5, 2020, after a rigorous and deliberative review, and consistent with the interests of the Nuveen Senior Income Fund, Nuveen Floating Rate Income Fund, Nuveen Floating Rate Income Opportunity Fund, Nuveen Short Duration Credit Opportunity Fund and the Nuveen Credit Strategies Income Fund (each a “Fund” and collectively the “Funds”) long-term shareholders, the Board of Trustees of each Fund adopted Amended and Restated By-Laws.
Among other changes, the Amended and Restated By-Laws require compliance with certain amended deadlines and procedural and informational requirements in connection with advance notice of shareholder proposals or nominations, including certain information about the proponent and the proposal, or in the case of a nomination, the nominee. Any shareholder considering making a nomination or other proposal should carefully review and comply with those provisions of the Amended and Restated By-Laws.
The Amended and Restated By-Laws also include provisions (the “Control Share By-Law”) pursuant to which, in summary, a shareholder who obtains beneficial ownership of common shares of a Fund in a “Control Share Acquisition” may exercise voting rights with respect to such shares only to the extent the authorization of such voting rights is approved by other shareholders of the Fund. The Control Share By-Law is primarily intended to protect the interests of the Fund and its long-term shareholders by limiting the risk that the Fund will become subject to undue influence by opportunistic traders pursuing short-term agendas adverse to the best interests of the Fund and its long-term shareholders. The Control Share By-Law does not eliminate voting rights for common shares acquired in Control Share Acquisitions, but rather entrusts the Fund’s other “non-interested” shareholders with determining whether to approve the authorization of the voting rights of the person acquiring such shares.
Subject to various conditions and exceptions, the Control Share By-Law defines a “Control Share Acquisition” to include an acquisition of common shares that, but for the Control Share By-Law, would give the beneficial owner, upon the acquisition of such shares, the ability to exercise voting power in the election of Trustees of a Fund in any of the following ranges:
| | (i) | one-tenth or more, but less than one-fifth of all voting power; |
| | (ii) | one-fifth or more, but less than one-third of all voting power; |
| | (iii) | one-third or more, but less than a majority of all voting power; or |
| | (iv) | a majority or more of all voting power. |
The Control Share By-Law generally excludes certain acquisitions of common shares from the definition of a Control Share Acquisition, including acquisitions of common shares that occurred prior to October 5, 2020, though such shares are included in assessing whether any subsequent share acquisition exceeds one of the enumerated thresholds.
Subject to certain conditions and procedural requirements set forth in the Control Share By-Law, including the delivery of a “Control Share Acquisition Statement” to the Funds’ Secretary setting forth certain required information, a shareholder who obtains or proposes to obtain beneficial ownership of
160
common shares in a Control Share Acquisition generally may demand a special meeting of shareholders for the purpose of considering whether the voting rights of such acquiring person with respect to such shares shall be authorized.
This discussion is only a high-level summary of certain aspects of the Amended and Restated By-Laws, and is qualified in its entirety by reference to the Amended and Restated By-Laws. Shareholders should refer to the Amended and Restated By-Laws for more information. A copy of the Amended and Restated By-Laws can be found in the Current Report on Form 8-K filed by the Funds with the Securities and Exchange Commission on October 6, 2020, which is available at www.sec.gov, and may also be obtained by writing to the Secretary of the Funds at 333 West Wacker Drive, Chicago, Illinois 60606.
161
Additional Fund Information (Unaudited)
| | | | | | | | | | |
| Board of Trustees | | | | | | | | | | |
| Jack B. Evans | | William C. Hunter | | Amy B.R. Lancellotta | | Joanne T. Medero | | Albin F. Moschner | | John K. Nelson |
| Judith M. Stockdale | | Carole E. Stone | | Matthew Thornton III | | Terence J. Toth | | Margaret L Wolff | | Robert L. Young |
| | | | | | | | |
| | | | | |
Investment Adviser Nuveen Fund Advisors, LLC 333 West Wacker Drive Chicago, IL 60606 | | Custodian State Street Bank
& Trust Company One Lincoln Street Boston, MA 02111 | | Legal Counsel Chapman and Cutler LLP Chicago, IL 60603 | | Independent Registered
Public Accounting Firm KPMG LLP 200 East Randolph Street Chicago, IL 60601 | | Transfer Agent and
Shareholder Services Computershare Trust Company, N.A. 150 Royall Street Canton, MA 02021 (800) 257-8787 |
Distribution Information
The Funds hereby designate their percentages of dividends paid from net ordinary income as dividends qualifying as Interest-Related Dividends and/or short term capital gain dividends as defined in Internal Revenue Code Section 871(k) for the taxable periods ending December 31, 2020 and July 31, 2021:
| | | | | | | | | | | | | | | | | | | | |
| | | NSL | | | JFR | | | JRO | | | JSD | | | JQC | |
August 1, 2020 through December 31, 2020 | | | 77.1% | | | | 72.2% | | | | 73.8% | | | | 77.2% | | | | 81.4% | |
January 1, 2021 through July 31, 2021 | | | 72.1% | | | | 71.2% | | | | 71.2% | | | | 77.9% | | | | 80.4% | |
The Funds had the following percentages, or maximum amount allowable, of ordinary dividends treated as Section 163(j) interest dividends pursuant to Section 163(j) of the Internal Revenue Code for the taxable year ended July 31, 2021:
| | | | | | | | | | | | | | | | | | | | |
| | | NSL | | | JFR | | | JRO | | | JSD | | | JQC | |
% of Section 163(j) Interest Dividends | | | 94.7% | | | | 89.9% | | | | 91.5% | | | | 94.9% | | | | 97.3% | |
Portfolio of Investments Information
Each Fund is required to file its complete schedule of portfolio holdings with the Securities and Exchange Commission (SEC) for the first and third quarters of each fiscal year as an exhibit to its report on Form N-PORT. You may obtain this information on the SEC’s website at http://www.sec.gov.
Nuveen Funds’ Proxy Voting Information
You may obtain (i) information regarding how each fund voted proxies relating to portfolio securities held during the most recent twelve-month period ended June 30, without charge, upon request, by calling Nuveen toll-free at (800) 257-8787 or on Nuveen’s website at www.nuveen.com and (ii) a description of the policies and procedures that each fund used to determine how to vote proxies relating to portfolio securities without charge, upon request, by calling Nuveen toll free at (800) 257-8787. You may also obtain this information directly from the SEC. Visit the SEC on-line at http://www.sec.gov.
CEO Certification Disclosure
Each Fund’s Chief Executive Officer (CEO) has submitted to the New York Stock Exchange (NYSE) the annual CEO certification as required by Section 303A.12(a) of the NYSE Listed Company Manual. Each Fund has filed with the SEC the certification of its CEO and Chief Financial Officer required by Section 302 of the Sarbanes-Oxley Act.
Common Share Repurchases
Each Fund intends to repurchase, through its open market share repurchase program, shares of its own common stock at such times and in such amounts as is deemed advisable. During the period covered by this report, each Fund repurchased shares of its common stock, as shown in the accompanying table. Any future repurchases will be reported to shareholders in the next annual or semi-annual report.
| | | | | | | | | | | | | | | | | | | | |
| | | NSL | | | JFR | | | JRO | | | JSD | | | JQC | |
Common shares repurchased | | | 0 | | | | 0 | | | | 0 | | | | 0 | | | | 0 | |
FINRA BrokerCheck
The Financial Industry Regulatory Authority (FINRA) provides information regarding the disciplinary history of FINRA member firms and associated investment professionals. This information as well as an investor brochure describing FINRA BrokerCheck is available to the public by calling the FINRA BrokerCheck Hotline number at (800) 289-9999 or by visiting www.FINRA.org.
162
Glossary of Terms Used in this Report
(Unaudited)
| ∎ | | Average Annual Total Return: This is a commonly used method to express an investment’s performance over a particular, usually multi-year time period. It expresses the return that would have been necessary each year to equal the investment’s actual cumulative performance (including change in NAV or offer price and reinvested dividends and capital gains distributions, if any) over the time period being considered. |
| ∎ | | Collateralized Loan Obligation (CLO): A security backed by a pool of debt, often low rated corporate loans. Collateralized loan obligations (CLOs) are similar to collateralized mortgage obligations, except for the different type of underlying loan. |
| ∎ | | Convexity: A tool used in risk management to measure the sensitivity of bond duration to interest rate changes. Higher convexity generally means higher sensitivity to interest rate changes. |
| ∎ | | Credit Suisse Leveraged Loan Index: A representative, unmanaged index of tradeable, senior, U.S. dollar-denominated leveraged loans. Index returns assume reinvestment of distributions, but do not include the effects of any applicable sales charges or management fees. |
| ∎ | | Effective Leverage: Effective leverage is a fund’s effective economic leverage, and includes both regulatory leverage (see below) and the leverage effects of certain derivative investments in the fund’s portfolio. |
| ∎ | | Gross Domestic Product (GDP): The total market value of all final goods and services produced in a country/region in a given year, equal to total consumer, investment and government spending, plus the value of exports, minus the value of imports. |
| ∎ | | ICE BofA U.S. High Yield Index: An index that tracks the performance of U.S. dollar denominated below investment grade corporate debt publicly issued in the U.S. domestic market. Index returns assume reinvestment of distributions, but do not include the effects of any applicable sales charges or management fees. |
| ∎ | | Leverage: Leverage is created whenever a fund has investment exposure (both reward and/or risk) equivalent to more than 100% of the investment capital. |
| ∎ | | Net Asset Value (NAV) Per Share: A fund’s Net Assets is equal to its total assets (securities, cash, accrued earnings and receivables) less its total liabilities. NAV per share is equal to the fund’s Net Assets divided by its number of shares outstanding. |
| ∎ | | Regulatory Leverage: Regulatory leverage consists of preferred shares issued by or borrowings of a fund. Both of these are part of a fund’s capital structure. Regulatory leverage is subject to asset coverage limits set forth in the Investment Company Act of 1940. |
163
Annual Investment Management Agreement Approval Process
(Unaudited)
At a meeting held on May 25-27, 2021 (the “May Meeting”), the Boards of Trustees (collectively, the “Board” and each Trustee, a “Board Member”) of the Funds, which are comprised entirely of Board Members who are not “interested persons” (as defined under the Investment Company Act of 1940 (the “1940 Act”)) (the “Independent Board Members”), approved, for their respective Fund, the renewal of the management agreement (each, an “Investment Management Agreement”) with Nuveen Fund Advisors, LLC (the “Adviser”), pursuant to which the Adviser serves as the investment adviser to such Fund and the sub-advisory agreement (each, a “Sub-Advisory Agreement”) with Nuveen Asset Management, LLC (the “Sub-Adviser”), pursuant to which the Sub-Adviser serves as the investment sub-adviser to such Fund. Although the 1940 Act requires that continuances of the Advisory Agreements (as defined below) be approved by the in-person vote of a majority of the Independent Board Members, the May Meeting was held virtually through the internet in view of the health risks associated with holding an in-person meeting during the COVID-19 pandemic and governmental restrictions on gatherings. The May Meeting was held virtually in reliance on certain exemptive relief the Securities and Exchange Commission provided to registered investment companies providing temporary relief from the in-person voting requirements of the 1940 Act with respect to the approval of a fund’s advisory agreement in light of these challenges.
Following up to an initial two-year period, the Board considers the renewal of each Investment Management Agreement and Sub-Advisory Agreement on behalf of the applicable Fund on an annual basis. The Investment Management Agreements and Sub-Advisory Agreements are collectively referred to as the “Advisory Agreements” and the Adviser and the Sub-Adviser are collectively, the “Fund Advisers” and each, a “Fund Adviser.” Throughout the year, the Board and its committees meet regularly and, at these meetings, receive regular and/or special reports that cover an extensive array of topics and information that are relevant to its annual consideration of the renewal of the advisory agreements for the Nuveen funds. Such information may address, among other things, fund performance and risk information; the Adviser’s strategic plans; product initiatives for various funds; the review of the funds and investment teams; compliance, regulatory and risk management matters; the trading practices of the various sub-advisers to the funds; valuation of securities; fund expenses; securities lending; liquidity management; overall market and regulatory developments; and with respect to closed-end funds, capital management initiatives, institutional ownership, management of leverage financing and the secondary market trading of the closed-end funds and any actions to address discounts. The Board also seeks to meet periodically with the Nuveen funds’ sub-advisers and portfolio teams, when feasible.
In addition, in connection with the annual consideration of the advisory agreements for the Nuveen funds, the Board, through its independent legal counsel, requested and received extensive materials and information prepared specifically for its annual consideration of the renewal of such advisory agreements by the Adviser and by Broadridge Financial Solutions, Inc. (“Broadridge”), an independent provider of investment company data. The materials cover a wide range of topics including, but not limited to, a description of the nature, extent and quality of services provided by the Fund Advisers; a review of product actions taken during 2020 (such as mergers, liquidations, fund launches, changes to investment teams, and changes to investment policies); a review of each sub-adviser to the Nuveen funds and the applicable investment teams; an analysis of fund performance in absolute terms and as compared to the performance of certain peer funds and benchmarks with a focus on any performance outliers; an analysis of the fees and expense ratios of the Nuveen funds in absolute terms and as compared to those of certain peer funds with a focus on any expense outliers; a review of management fee schedules; a description of portfolio manager compensation; an overview of the secondary market trading of shares of the Nuveen closed-end funds (including, among other things, an analysis of performance, distribution and valuation and capital-raising trends in the broader closed-end fund market and with respect to Nuveen closed-end funds and a review of the leverage management actions taken on behalf of the closed-end funds particularly during the periods of market volatility generally caused by the COVID-19 pandemic); a review of the performance of various service providers; a description of various initiatives Nuveen had undertaken or continued during the year for the benefit of particular fund(s) and/or the complex; a description of the profitability or financial data of Nuveen and the sub-advisers to the Nuveen funds; and a description of indirect benefits received by the Adviser and the sub-advisers as a result of their relationships with the Nuveen funds. The information prepared specifically for the annual review supplemented the information provided to the Board and its committees and the evaluations of the Nuveen funds by the Board and its committees during the year.
164
In continuing its practice, the Board met prior to the May Meeting to begin its considerations of the renewal of the Advisory Agreements. Accordingly, on April 21-22, 2021 (the “April Meeting”), the Board met to review and discuss, in part, the performance of the Nuveen funds and the Adviser’s evaluation of each sub-adviser to the Nuveen funds. At the April Meeting, the Board Members asked questions and requested additional information that was provided for the May Meeting. The Board reviewed fund performance throughout the year and in its review, the Board recognized the volatile market conditions that occurred in early 2020 arising, in part, from the public health crisis caused by the novel coronavirus known as COVID-19 and the resulting impact on a fund’s performance for 2020 and thereafter. Accordingly, the Board considered performance data measured over various periods of time as summarized in more detail below.
The Independent Board Members considered the review of the advisory agreements for the Nuveen funds to be an ongoing process and employed the accumulated information, knowledge and experience the Board Members had gained during their tenure on the boards governing the Nuveen funds and working with the Adviser and sub-advisers in their review of the advisory agreements. The contractual arrangements are a result of multiple years of review, negotiation and information provided in connection with the boards’ annual review of the Nuveen funds’ advisory arrangements and oversight of the Nuveen funds.
The Independent Board Members were advised by independent legal counsel during the annual review process as well as throughout the year, including meeting in executive sessions with such counsel at which no representatives from the Adviser or the Sub-Adviser were present. In connection with their annual review, the Independent Board Members also received a memorandum from independent legal counsel outlining their fiduciary duties and legal standards in reviewing the Advisory Agreements.
The Board’s decision to renew the Advisory Agreements was not based on a single identified factor, but rather the decision reflected the comprehensive consideration of all the information provided throughout the year and at the April and May Meetings, and each Board Member may have attributed different levels of importance to the various factors and information considered in connection with the approval process. The following summarizes the principal factors and information, but not all the factors, the Board considered in deciding to renew the Advisory Agreements as well as the Board’s conclusions.
| A. | | Nature, Extent and Quality of Services |
In evaluating the renewal of the Advisory Agreements, the Independent Board Members received and considered information regarding the nature, extent and quality of the applicable Fund Adviser’s services provided to the respective Fund with particular focus on the services and enhancements to such services provided during the last year. The Independent Board Members considered the Investment Management Agreements and the Sub-Advisory Agreements separately in the course of their review. With this approach, they considered the respective roles of the Adviser and the Sub-Adviser in providing services to the Funds.
The Board recognized that the Nuveen funds operate in a highly regulated industry and, therefore, the Adviser has provided a wide array of management, oversight and administrative services to manage and operate the funds, and the scope and complexity of these services have expanded over time as a result of, among other things, regulatory and other developments. The Board accordingly considered the extensive resources, tools and capabilities available to the Adviser to operate and manage the Nuveen funds. With respect to the Adviser, as a general matter, some of these services it and its affiliates provide to the Nuveen funds include, but are not limited to: product management (such as setting dividends, analyzing fund expenses, providing competitive analysis, and providing due diligence support); investment oversight, risk management and securities valuation services (such as overseeing and reviewing the various sub-advisers to the Nuveen funds and their investment teams; analyzing fund performance and risk data; overseeing operational and risk management; participating in financial statement, marketing and risk disclosures; providing daily valuation services and developing related valuation policies, procedures and methodologies; periodic testing of audit and regulatory requirements; participating in product development and management processes; participating in leverage management, liquidity monitoring and counterparty credit oversight; providing due diligence and overseeing fund accounting and custody providers; overseeing third party pricing services and periodically assessing investment and liquidity risks); fund administration (such as preparing fund tax returns and other tax compliance services; preparing regulatory filings; overseeing the funds’ independent public accountants and other service providers; analyzing products and enhancements; and managing fund budgets and expenses); oversight of
165
Annual Investment Management Agreement Approval Process (continued)
(Unaudited)
shareholder services and transfer agency functions (such as overseeing transfer agent service providers which include registered shareholder customer service and transaction processing; overseeing proxy solicitation and tabulation services; and overseeing the production and distribution of financial reports by service providers); Board relations services (such as organizing and administering Board and committee meetings, preparing various reports to the Board and committees and providing other support services); compliance and regulatory oversight services (such as managing compliance policies; monitoring compliance with applicable fund policies and laws and regulations; devising internal compliance programs and a framework to review and assess compliance programs; evaluating the compliance programs of the various sub-advisers to the Nuveen funds and certain other service providers; responding to regulatory requests; and preparing compliance training materials); legal support and oversight of outside law firms (such as helping to prepare and file registration statements and proxy statements; overseeing fund activities and providing legal interpretations regarding such activities; maintaining regulatory registrations and negotiating agreements with other fund service providers; and monitoring changes in regulatory requirements and commenting on rule proposals impacting investment companies); and with respect to closed-end funds, managing leverage, monitoring asset coverage and promoting an orderly secondary market.
In evaluating services, the Board reviewed various highlights of the initiatives the Adviser and its affiliates have undertaken or continued in 2020 to benefit the Nuveen complex and/or particular Nuveen funds and meet the requirements of an increasingly complex regulatory environment including, but not limited to:
| | • | | Centralization of Functions – ongoing initiatives to centralize investment leadership, market approach and shared support functions within Nuveen and its affiliates in seeking to operate more effectively the business and enhance the services to the Nuveen funds; |
| | • | | Fund Improvements and Product Management Initiatives – continuing to proactively manage the Nuveen fund complex as a whole and at the individual fund level with an aim to continually improve product platforms and investment strategies to better serve shareholders through, among other things, rationalizing the product line and gaining efficiencies through mergers, repositionings and liquidations; launching new funds; reviewing and updating investment policies and benchmarks; and modifying portfolio management teams for various funds; |
| | • | | Investment Team Integrations – continuing to integrate and adjust the members of certain investment teams, in part, to allow greater access to tools and resources within the Nuveen organization and its affiliates; |
| | • | | Capital Initiatives – continuing to invest capital to support new Nuveen funds with initial capital as well as to support existing funds and facilitate regulatory or logistical changes; |
| | • | | Compliance Program Initiatives – continuing efforts to mitigate compliance risk, increase operating efficiencies, implement enhancements to strengthen key compliance program elements and support international business growth and other corporate objectives; |
| | • | | Investment Oversight – preparing reports to the Board addressing, among other things, fund performance; market conditions; investment teams; new products; changes to mandates, policies and benchmarks; and other management proposals; |
| | • | | Risk Management and Valuation Services – continuing to oversee and manage risk including, among other things, conducting daily calculations and monitoring of risk measures across the Nuveen funds, instituting appropriate investment risk controls, providing risk reporting throughout the firm, participating in internal oversight committees, and continuing to implement an operational risk framework that seeks to provide greater transparency of operational risk matters across the complex as well as provide multiple other risk programs that seek to provide a more disciplined and consistent approach to identifying and mitigating Nuveen’s operational risks. Further, the securities valuation team continues, among other things, to oversee the daily valuation process of the portfolio securities of the funds, maintains the valuation policies and procedures, facilitates valuation committee meetings, manages relationships with pricing vendors, and prepares relevant valuation reports and designs methods to simplify and enhance valuation workflow within the organization; |
166
| | • | | Regulatory Matters – continuing efforts to monitor regulatory trends and advocate on behalf of Nuveen and/or the Nuveen funds, to implement and comply with new or revised rules and mandates and to respond to regulatory inquiries and exams; |
| | • | | Government Relations – continuing efforts of various Nuveen teams and Nuveen’s affiliates to develop policy positions on a broad range of issues that may impact the Nuveen funds, advocate and communicate these positions to lawmakers and other regulatory authorities and work with trade associations to ensure these positions are represented; |
| | • | | Business Continuity, Disaster Recovery and Information Security – continuing efforts of Nuveen to periodically test and update business continuity and disaster recovery plans and, together with its affiliates, to maintain an information security program designed to identify and manage information security risks, and provide reports to the Board, at least annually, addressing, among other things, management’s security risk assessment, cyber risk profile, potential impact of new or revised laws and regulations, incident tracking and other relevant information technology risk-related reports; |
| | • | | Dividend Management Services – continuing to manage the dividends among the varying types of Nuveen funds within the Nuveen complex to be consistent with the respective fund’s product design and positioning in striving to deliver those earnings to shareholders in a relatively consistent manner over time as well as assisting in the development of new products or the restructuring of existing funds; and |
| | • | | with respect specifically to closed-end funds, such continuing services also included: |
| | • | | Leverage Management Services – continuing to actively manage the various forms of leverage utilized across the complex, including through committing resources and focusing on sourcing/structure development and bank provider management, which was key to navigating the respective funds through the COVID-related market volatility in 2020; |
| | • | | Capital Management, Market Intelligence and Secondary Market Services – ongoing capital management efforts through shelf offerings, share repurchases, tender offers and capital return programs as well as providing market data analysis to help understand closed-end fund ownership cycles and their impact on secondary market trading as well as to improve proxy solicitation efforts; and |
| | • | | Closed-end Fund Investor Relations Program – maintaining the closed-end fund investor relations program which, among other things, raises awareness, provides educational materials and cultivates advocacy for closed-end funds and the Nuveen closed-end fund product line. |
In its review, the Board recognized that Nuveen’s risk management, compliance, technology and operations capabilities are all integral to providing its investment management services to the Nuveen funds. Further, the Board noted the benefits to shareholders of investing in a Nuveen fund, as each Nuveen fund is a part of a large fund complex with a variety of investment disciplines, capabilities, expertise and resources available to navigate and support the funds including during stressed times as occurred in the market in the first half of 2020. The Board recognized the impact of the COVID-19 pandemic during the year and the adaptations required by service providers to continue to deliver their services to the Nuveen funds, including working remotely. In this regard, the Board noted the ability of the Adviser and the various sub-advisers to the Nuveen funds to provide continuously their services notwithstanding the significant disruptions caused by the pandemic. In addition to the services provided by the Adviser, the Board also considered the risks borne by the Adviser and its affiliates in managing the Nuveen funds, including entrepreneurial, operational, reputational, regulatory and litigation risks.
The Board further considered the division of responsibilities between the Adviser and the Sub-Adviser and recognized that the Sub-Adviser and its investment personnel generally are responsible for the management of each Fund’s portfolio under the oversight of the Adviser and the Board. The Board considered an analysis of the Sub-Adviser provided by the Adviser which included, among other things, the assets under management of the applicable investment team and changes thereto, a summary of the applicable investment team and changes thereto, the investment process and philosophy of the applicable investment team, the performance of the Nuveen funds sub-advised by the Sub-Adviser over various periods of time and a summary of any significant policy and/or other changes to the Nuveen funds sub-advised by the Sub-Adviser. The Board further considered at the May Meeting or prior meetings evaluations of the Sub-Adviser’s compliance programs and trade
167
Annual Investment Management Agreement Approval Process (continued)
(Unaudited)
execution. The Board also considered the structure of investment personnel compensation programs and whether this structure provides appropriate incentives to act in the best interests of the respective Nuveen funds. The Board noted that the Adviser recommended the renewal of the Sub-Advisory Agreements.
Based on its review, the Board determined, in the exercise of its reasonable business judgment, that it was satisfied with the nature, extent and quality of services provided to the respective Funds under each applicable Advisory Agreement.
| B. | | The Investment Performance of the Funds and Fund Advisers |
In evaluating the quality of the services provided by the Fund Advisers, the Board also received and considered a variety of investment performance data of the Nuveen funds they advise. In evaluating performance, the Board recognized that performance data may differ significantly depending on the ending date selected, particularly during periods of market volatility, and therefore considered performance over a variety of time periods that may include full market cycles. In this regard, the Board reviewed, among other things, Fund performance over the quarter, one-, three- and five-year periods ending December 31, 2020 as well as performance data periods ending nearer to the May Meeting, including the quarter, one-, three- and five-year periods ending March 31, 2021 and May 14, 2021. The performance data prepared for the annual review of the advisory agreements for the Nuveen funds supplemented the fund performance data that the Board received throughout the year at its meetings representing differing time periods. In its review, the Board took into account the discussions with representatives of the Adviser; the Adviser’s analysis regarding fund performance that occurred at these Board meetings with particular focus on funds that were considered performance outliers (both overperformance and underperformance); the factors contributing to the performance; and any recommendations or steps taken to address performance concerns. Regardless of the time period reviewed by the Board, the Board recognized that shareholders may evaluate performance based on their own holding periods which may differ from the periods reviewed by the Board and lead to differing results.
In its review, the Board reviewed both absolute and relative fund performance during the annual review over the various time periods. With respect to the latter, the Board considered fund performance in comparison to the performance of peer funds (the “Performance Peer Group”) and recognized and/or customized benchmarks (i.e., generally benchmarks derived from multiple recognized benchmarks). For Nuveen funds that had changes in portfolio managers since 2018 or significant changes, among other things, to their investment strategies or policies since 2019, the Board reviewed certain performance data comparing the performance of such funds before and after such changes. In considering performance data, the Board is aware of certain inherent limitations with such data, including that differences between the objective(s), strategies and other characteristics of the Nuveen funds compared to the respective Performance Peer Group and/or benchmark(s) (such as differences in the use of leverage) as well as differences in the composition of the Performance Peer Group over time will necessarily contribute to differences in performance results and limit the value of the comparative information. To assist the Board in its review of the comparability of the relative performance, the Adviser has ranked the relevancy of the peer group to the funds as low, medium or high.
The Board also evaluated performance in light of various relevant factors, including, among other things, general market conditions, issuer-specific information, asset class information, leverage and fund cash flows. In relation to general market conditions, the Board recognized the significant market decline in the early part of 2020 in connection with, among other things, the impact of the COVID-19 pandemic and that such a period of underperformance and market volatility may significantly weigh on the longer term performance results. Accordingly, depending on the facts and circumstances including any differences between the respective Nuveen fund and its benchmark and/or Performance Peer Group, the Board may be satisfied with a fund’s performance notwithstanding that its performance may be below that of its benchmark or peer group for certain periods. However, with respect to any Nuveen funds for which the Board had identified performance issues, the Board monitors such funds closely until performance improves, discusses with the Adviser the reasons for such results, considers whether any steps are necessary or appropriate to address such issues, and reviews the results of any steps undertaken.
The secondary market trading of shares of the Nuveen closed-end funds continues to be a priority for the Board given its importance to shareholders, and therefore data reflecting the premiums and discounts at which the shares of the closed-end funds trade are reviewed by the Board during its annual review and by the Board and/or its Closed-end Fund committee
168
during its respective quarterly meetings throughout the year. The Board continuously reviews all closed-end fund discounts and the fund’s performance relative to both primary and secondary benchmarks and peers. In its review, the Board considers, among other things, changes to investment mandates and guidelines, enhanced and attractive distribution policies, leverage levels and types, fund reorganizations, share repurchases and similar capital market actions and effective communications programs to build greater awareness and deepen understanding of closed-end funds.
The Board’s determinations with respect to each Fund are summarized below.
For Nuveen Senior Income Fund (the “Senior Income Fund”), the Board noted that the Fund’s performance was below the performance of its benchmark for the one-, three- and five-year periods ended December 31, 2020 and the Fund ranked in the fourth quartile of its Performance Peer Group for the one-year period and third quartile for the three- and five-year periods ended December 31, 2020. Although the Fund’s performance was below the performance of its benchmark for the three-year period ended March 31, 2021, the Fund outperformed its benchmark for the one-year period and matched the performance of its benchmark for the five-year period ended March 31, 2021. In addition, although the Fund ranked in the fourth quartile of its Performance Peer Group for the three-year period ended March 31, 2021, the Fund ranked in the second quartile for the one-year period and third quartile for the five-year period ended March 31, 2021. For the periods ended May 14, 2021, the Fund’s performance was below the performance of its benchmark for the three-year period, but the Fund outperformed its benchmark for the one- and five-year periods. Further, although the Fund ranked in the fourth quartile of its Performance Peer Group for the three-year period ended May 14, 2021, the Fund ranked in the first quartile of its Performance Peer Group for the one-year period and third quartile for the five-year period ended May 14, 2021. In reviewing performance, the Board also recognized the changes to the Fund’s portfolio management team in 2020. Based on its review, the Board was satisfied with the Fund’s overall performance.
For Nuveen Floating Rate Income Fund (the “Floating Rate Income Fund”), the Board noted that the Fund’s performance was below the performance of its benchmark for the one- and three-year periods ended December 31, 2020, but the Fund outperformed its benchmark for the five-year period ended December 31, 2020. Further, the Fund ranked in the fourth quartile of its Performance Peer Group for the one-year period and third quartile for the three- and five-year periods ended December 31, 2020. Although the Fund’s performance was below the performance of its benchmark for the three-year period ended March 31, 2021, the Fund outperformed its benchmark for the one- and five-year periods ended March 31, 2021 and ranked in the second quartile of its Performance Peer Group for the one-year period ended March 31, 2021 and third quartile for the three- and five-year periods ended March 31, 2021. For the periods ended May 14, 2021, the Fund’s performance was below the performance of its benchmark for the three-year period, but the Fund outperformed its benchmark for the one- and five-year periods. Further, the Fund ranked in the first quartile of its Performance Peer Group for the one-year period, third quartile for the three-year period and second quartile for the five-year period ended May 14, 2021. In reviewing performance, the Board also noted the changes to the Fund’s portfolio management team in 2020. Based on its review, the Board was satisfied with the Fund’s overall performance.
For Nuveen Floating Rate Income Opportunity Fund (the “Floating Rate Income Opportunity Fund”), the Board noted that although the Fund’s performance was below the performance of its benchmark for the one- and three-year periods ended December 31, 2020, the Fund outperformed its benchmark for the five-year period ended December 31, 2020. Further, although the Fund ranked in the fourth quartile of its Performance Peer Group for the one-year period ended December 31, 2020, the Fund ranked in the third quartile of its Performance Peer Group for the three-year period and second quartile for the five-year period ended December 31, 2020. For the periods ended March 31, 2021, the Fund’s performance was below the performance of its benchmark for the three-year period, but the Fund outperformed its benchmark for the one- and five-year periods and ranked in the second quartile of its Performance Peer Group for the one- and five-year periods and third quartile for the three-year period. For the periods ended May 14, 2021, although the Fund’s performance was below the performance of its benchmark for the three-year period, the Fund outperformed its benchmark for the one- and five-year periods. In addition, the Fund ranked in the second quartile of its Performance Peer Group for the one- and five-year periods and third quartile for the three-year period ended May 14, 2021. In reviewing performance, the Board also recognized the changes to the Fund’s portfolio management team in 2020. Based on its review, the Board was satisfied with the Fund’s overall performance.
169
Annual Investment Management Agreement Approval Process (continued)
(Unaudited)
For Nuveen Short Duration Credit Opportunities Fund (the “Short Duration Fund”), the Board noted that the Fund’s performance was below the performance of its benchmark for the one-, three- and five-year periods ended December 31, 2020 and the Fund ranked in the fourth quartile of its Performance Peer Group for the one- and three-year periods ended December 31, 2020 and third quartile for the five-year period ended December 31, 2020. While the Fund’s performance was below the performance of its benchmark for the three- and five-year periods ended March 31, 2021, the Fund outperformed its benchmark for the one-year period ended March 31, 2021. Further, although the Fund ranked in the fourth quartile of its Performance Peer Group for the three-year period ended March 31, 2021, the Fund ranked in the second quartile of its Performance Peer Group for the one-year period and third quartile for the five-year period ended March 31, 2021. For the periods ended May 14, 2021, the Fund’s performance was below the performance of its benchmark for the three-year period, but the Fund outperformed its benchmark for the one-year period and matched the performance of its benchmark for the five-year period. Although the Fund ranked in the fourth quartile of its Performance Peer Group for the three-year period ended May 14, 2021, the Fund ranked in the first quartile for the one-year period and third quartile for the five-year period ended May 14, 2021. In reviewing performance, the Board also recognized the changes to the Fund’s portfolio management team in 2020. Based on its review, the Board was satisfied with the Fund’s overall performance.
For Nuveen Credit Strategies Income Fund (the “Credit Strategies Fund”), the Board noted that although the Fund’s performance was below the performance of its benchmark for the one-, three- and five-year periods ended December 31, 2020 and the Fund ranked in the fourth quartile of its Performance Peer Group for the one-year period ended December 31, 2020, the Fund ranked in the second quartile of its Performance Peer Group for the three-year period and third quartile for the five-year period ended December 31, 2020. Although the Fund’s performance was below the performance of its benchmark for the three- and five-year periods ended March 31, 2021, the Fund outperformed its benchmark for the one-year period ended March 31, 2021. Further, although the Fund ranked in the fourth quartile of its Performance Peer Group for the five-year period ended March 31, 2021, the Fund ranked in the third quartile of its Performance Peer Group for the one-year period and second quartile for the three-year period ended March 31, 2021. In addition, for the periods ended May 14, 2021, although the Fund’s performance was below the performance of its benchmark for the three- and five-year periods, the Fund outperformed its benchmark for the one-year period and ranked in the third quartile of its Performance Peer Group for the one-, three- and five-year periods. In reviewing performance, the Board also noted the changes to the Fund’s portfolio management team in 2020. Based on its review, the Board was satisfied with the Fund’s overall performance.
| C. | | Fees, Expenses and Profitability |
As part of its annual review, the Board considered the contractual management fee and net management fee (the management fee after taking into consideration fee waivers and/or expense reimbursements, if any) paid by a Nuveen fund to the Adviser in light of the nature, extent and quality of the services provided. The Board also considered the total operating expense ratio of each fund before and after any fee waivers and/or expense reimbursements. More specifically, the Independent Board Members reviewed, among other things, each fund’s gross and net management fee rates (i.e., before and after expense reimbursements and/or fee waivers, if any) and net total expense ratio in relation to those of a comparable universe of funds (the “Peer Universe”) established by Broadridge. The Independent Board Members reviewed the methodology Broadridge employed to establish its Peer Universe and recognized that differences between the applicable fund and its respective Peer Universe as well as changes to the composition of the Peer Universe from year to year may limit some of the value of the comparative data. The Independent Board Members also considered a fund’s operating expense ratio as it more directly reflected the shareholder’s costs in investing in the respective fund.
In their review, the Independent Board Members considered, in particular, each fund with a net expense ratio (excluding investment-related costs of leverage) of six basis points or higher compared to that of its peer average (each, an “Expense Outlier Fund”), including the Short Duration Fund, and an analysis as to the factors contributing to each such fund’s higher relative net expense ratio. In addition, although the Board reviewed a fund’s total net expenses both including and excluding investment-related expenses (i.e., leverage costs) and taxes for certain of the closed-end funds, the Board recognized that leverage expenses will vary across funds and in comparison to peers because of differences in the forms and terms of leverage employed by the respective fund. Accordingly, in reviewing the comparative data between a fund and its peers, the
170
Board generally considered the fund’s net expense ratio and fees (excluding leverage costs and leveraged assets) to be higher if they were over 10 basis points higher, slightly higher if they were 6 to 10 basis points higher, in line if they were within approximately 5 basis points higher than the peer average and below if they were below the peer average of the Peer Universe. The Independent Board Members also considered, in relevant part, a fund’s net management fee and net total expense ratio in light of its performance history.
In their review of the fee arrangements for the Nuveen funds, the Independent Board Members considered the management fee schedules, including the complex-wide and fund-level breakpoint schedules. The Board noted that across the Nuveen fund complex, the complex-wide fee breakpoints reduced fees by approximately $58.4 million and fund-level breakpoints reduced fees by approximately $69.6 million in 2020.
With respect to the Sub-Adviser, the Board also considered the sub-advisory fee schedule paid to the Sub-Adviser in light of the sub-advisory services provided to the respective Fund, the breakpoint schedule and comparative data of the fees the Sub-Adviser charges to other clients, if any. In its review, the Board recognized that the compensation paid to the Sub-Adviser is the responsibility of the Adviser, not the Funds.
The Independent Board Members noted that (a) the Floating Rate Income Fund and the Floating Rate Income Opportunity Fund each had a net management fee and a net expense ratio that were below the respective peer averages; (b) the Senior Income Fund and the Credit Strategies Fund each had a net management fee that was in line with the respective peer averages and a net expense ratio that was below the respective peer averages; and (c) the Short Duration Fund had a net management fee that was in line with the peer average, but a net expense ratio that was slightly higher than the peer average. The Independent Board Members noted that the Short Duration Fund’s net expense ratio was slightly higher than the peer average due, in part, to one-time legal expenses associated with a leverage mode change.
Based on its review of the information provided, the Board determined that each Fund’s management fees (as applicable) to a Fund Adviser were reasonable in light of the nature, extent and quality of services provided to the Fund.
| | 2. | | Comparisons with the Fees of Other Clients |
In determining the appropriateness of fees, the Board also considered information regarding the fee rates the respective Fund Advisers charged to certain other types of clients and the type of services provided to these other clients. With respect to the Adviser and/or the Sub-Adviser, such other clients may include retail and institutional managed accounts advised by the Sub-Adviser; hedge funds managed by the Sub-Adviser; investment companies offered outside the Nuveen family and sub-advised by the Sub-Adviser; foreign investment companies offered by Nuveen and sub-advised by the Sub-Adviser; and collective investment trusts sub-advised by the Sub-Adviser. The Board further noted that the Adviser also advised certain exchange-traded funds (“ETFs”) sponsored by Nuveen.
The Board recognized that the Sub-Adviser was an affiliated sub-adviser and, with respect to affiliated sub-advisers, reviewed, among other things, the range of fees assessed for managed accounts, hedge funds (along with their performance fee) and foreign investment companies offered by Nuveen. The Board also reviewed the fee range and average fee rate of certain selected investment strategies offered in retail and institutional managed accounts advised by the Sub-Adviser, the hedge funds advised by the Sub-Adviser (along with their performance fee) and non-Nuveen investment companies sub-advised by certain affiliated sub-advisers.
In considering the fee data of other clients, the Board recognized, among other things, the differences in the amount, type and level of services provided to the Nuveen funds relative to other clients as well as the differences in portfolio investment policies, investor profiles, account sizes and regulatory requirements, all of which contribute to the variations in the fee schedules. The Board recognized the breadth of services the Adviser had provided to the Nuveen funds compared to the other types of clients as the funds operate in a highly regulated industry with increasing regulatory requirements as well as the increased entrepreneurial, legal and regulatory risks that the Adviser incurs in sponsoring and managing the funds. Further, with respect to ETFs, the Board considered that Nuveen ETFs were passively managed compared to the active management of the other Nuveen funds which contributed to the differences in fee levels between the Nuveen ETFs and other Nuveen funds. In general, higher fee levels reflect higher levels of service provided by the Adviser, increased investment management complexity, greater product management requirements, and higher levels of business risk or some combination
171
Annual Investment Management Agreement Approval Process (continued)
(Unaudited)
of these factors. The Board further considered that the Sub-Adviser’s fee is essentially for portfolio management services and therefore more comparable to the fees it receives for retail wrap accounts and other external sub-advisory mandates. The Board concluded the varying levels of fees were justified given, among other things, the inherent differences in the products and the level of services provided to the Nuveen funds versus other clients, the differing regulatory requirements and legal liabilities and the entrepreneurial, legal and regulatory risks incurred in sponsoring and advising a registered investment company.
| | 3. | | Profitability of Fund Advisers |
In their review, the Independent Board Members considered information regarding Nuveen’s level of profitability for its advisory services to the Nuveen funds for the calendar years 2020 and 2019. The Board reviewed, among other things, Nuveen’s net margins (pre-tax) (both including and excluding distribution expenses); gross and net revenue margins (pre- and post-tax and excluding distribution) from Nuveen funds only; revenues, expenses and net income (pre- and post-tax and before distribution expenses) of Nuveen for fund advisory services; and comparative profitability data comparing the operating margins of Nuveen compared to the adjusted operating margins of certain peers that had publicly available data and with the most comparable assets under management (based on asset size and asset composition) for each of the last two calendar years. In reviewing the peer comparison data, the Independent Board Members noted that Nuveen Investments, Inc.’s operating margins were on the low range compared to the total company adjusted operating margins of the peers. The Board also reviewed the revenues and expenses the Adviser derived from its ETF product line for the 2019 and 2020 calendar years.
In reviewing the profitability data, the Independent Board Members recognized the subjective nature of calculating profitability as the information is not audited and is dependent on cost allocation methodologies to allocate corporate-wide expenses to the Nuveen complex and its affiliates and to further allocate such Nuveen complex expenses between the Nuveen fund and non-fund businesses. Generally, fund-specific expenses are allocated to the Nuveen funds and partial fund-related expenses and/or corporate overhead and shared costs (such as legal and compliance, accounting and finance, information technology and human resources and office services) are partially attributed to the funds pursuant to cost allocation methodologies. The Independent Board Members reviewed a description of the cost allocation methodologies employed to develop the financial information, a summary of the history of changes to the methodology over the years from 2010 to 2020, and the net revenue margins derived from the Nuveen funds (pre-tax and including and excluding distribution) and total company margins from Nuveen Investments, Inc. compared to the firm-wide adjusted margins of the peers for each calendar year from 2010 to 2020. The Board had also appointed three Independent Board Members to serve as the Board’s liaisons, with the assistance of independent counsel, to review the development of the profitability data and any proposed changes to the cost allocation methodology prior to incorporating any such changes and to report to the full Board. The Board recognized that other reasonable and valid allocation methodologies could be employed and could lead to significantly different results. The Independent Board Members also considered the key drivers behind the revenue and expense changes that impacted Nuveen’s net margins between 2019 and 2020. The Board also noted the reinvestments Nuveen and/or its parent made into its business through, among other things, the investment of seed capital in certain Nuveen funds and continued investments in enhancements to information technology, portfolio accounting systems and the global trading platform.
In reviewing the comparative peer data noted above, the Board considered that the operating margins of Nuveen Investments, Inc. were in the lower half of the peer group range; however, the Independent Board Members also recognized the limitations of the comparative data given that peer data is not generally public and the calculation of profitability is subjective and affected by numerous factors (such as types of funds a peer manages, its business mix, its cost of capital, the numerous assumptions underlying the methodology used to allocate expenses and other factors) that can have a significant impact on the results.
Aside from Nuveen’s profitability, the Board recognized that the Adviser is a subsidiary of Nuveen, LLC, the investment management arm of Teachers Insurance and Annuity Association of America (“TIAA”). Accordingly, the Board also reviewed a balance sheet for TIAA reflecting its assets, liabilities and capital and contingency reserves for the 2020 and 2019 calendar
172
years to consider the financial strength of TIAA. The Board recognized the benefit of an investment adviser and its parent with significant resources, particularly during periods of market volatility as experienced with the COVID-19 pandemic.
In addition to Nuveen, the Independent Board Members considered the profitability of the Sub-Adviser from its relationships with the Nuveen funds. In this regard, the Independent Board Members reviewed, among other things, the Sub-Adviser’s revenues, expenses and net revenue margins (pre- and post-tax) for its advisory activities for the calendar year ended December 31, 2020 as well as its pre- and post-tax net revenue margins for 2020 compared to such margins for 2019. The Independent Board Members also reviewed a profitability analysis reflecting the revenues, expenses and revenue margin (pre- and post-tax) by asset type for the Sub-Adviser for the calendar year ending December 31, 2020 and the pre- and post-tax revenue margins from 2020 and 2019.
In evaluating the reasonableness of the compensation, the Independent Board Members also considered any other ancillary benefits derived by the respective Fund Adviser from its relationship with the Nuveen funds as discussed in further detail below.
Based on a consideration of all the information provided, the Board noted that Nuveen’s and the Sub-Adviser’s level of profitability was acceptable and not unreasonable in light of the services provided.
| D. | | Economies of Scale and Whether Fee Levels Reflect These Economies of Scale |
The Board considered whether there have been economies of scale with respect to the management of the Nuveen funds and whether these economies of scale have been appropriately shared with the funds. The Board recognized that although economies of scale are difficult to measure and certain expenses may not decline with a rise in assets, there are several methods to help share the benefits of economies of scale, including breakpoints in the management fee schedule, fee waivers and/or expense limitations, the pricing of Nuveen funds at scale at inception and investments in Nuveen’s business which can enhance the services provided to the funds for the fees paid. The Board noted that Nuveen generally has employed these various methods, and the Board considered the extent to which the Nuveen funds will benefit from economies of scale as their assets grow. In this regard, the Board noted that the management fee of the Adviser is generally comprised of a fund-level component and a complex-level component each with its own breakpoint schedule, subject to certain exceptions. The Board reviewed the fund-level and complex-level fee schedules. The Board considered that the fund-level breakpoint schedules are designed to share economies of scale with shareholders if the particular fund grows, and the complex-level breakpoint schedule is designed to deliver the benefits of economies of scale to shareholders when the eligible assets in the complex pass certain thresholds even if the assets of a particular fund are unchanged or have declined. With respect to the Nuveen closed-end funds, the Independent Board Members noted that, although such funds may from time to time make additional share offerings, the growth of their assets would occur primarily through the appreciation of such funds’ investment portfolios. Further, in the calculation of the complex-level component, the Board noted that it had approved the acquisition of several Nuveen funds by similar TIAA-CREF funds in 2019. However, to mitigate the loss of the assets of these Nuveen funds deemed eligible to be included in the calculation of the complex-wide fee when these Nuveen funds left the complex upon acquisition, Nuveen agreed to credit approximately $604.5 million to assets under management to the Nuveen complex in calculating the complex-wide component.
The Independent Board Members also recognized the Adviser’s continued reinvestment in its business through various initiatives including maintaining a seed account available for investments into Nuveen funds and investing in its internal infrastructure, information technology and other systems that will, among other things, consolidate and enhance accounting systems, integrate technology platforms to support growth and efficient data processing, and further develop its global trading platform to enhance the investment process for the investment teams.
Based on its review, the Board concluded that the current fee arrangements together with the Adviser’s reinvestment in its business appropriately shared any economies of scale with shareholders.
The Independent Board Members received and considered information regarding other benefits the respective Fund Adviser or its affiliates may receive as a result of their relationship with the Nuveen funds. The Board considered the compensation
173
Annual Investment Management Agreement Approval Process (continued)
(Unaudited)
that an affiliate of the Adviser received for serving as co-manager in the initial public offerings of new closed-end funds and for serving as an underwriter on shelf offerings of existing closed-end funds. In addition, the Independent Board Members also noted that various sub-advisers (including the Sub-Adviser) may engage in soft dollar transactions pursuant to which they may receive the benefit of research products and other services provided by broker-dealers executing portfolio transactions on behalf of the applicable Nuveen funds. However, the Board noted that any benefits for the Sub-Adviser when transacting in fixed-income securities may be more limited as such securities generally trade on a principal basis and therefore do not generate brokerage commissions.
Based on its review, the Board concluded that any indirect benefits received by a Fund Adviser as a result of its relationship with the Funds were reasonable and within acceptable parameters.
The Board Members did not identify any single factor discussed previously as all-important or controlling. The Board Members, including the Independent Board Members, concluded that the terms of each Advisory Agreement were fair and reasonable, that the respective Fund Adviser’s fees were reasonable in light of the services provided to each Fund and that the Advisory Agreements be renewed.
174
Board Members & Officers
(Unaudited)
The management of the Funds, including general supervision of the duties performed for the Funds by the Adviser, is the responsibility of the Board of Trustees of the Funds. None of the trustees who are not “interested” persons of the Funds (referred to herein as “independent board members”) has ever been a director or employee of, or consultant to, Nuveen or its affiliates. The names and business addresses of the trustees and officers of the Funds, their principal occupations and other affiliations during the past five years, the number of portfolios each Trustee oversees and other directorships they hold are set forth below.
| | | | | | | | |
| | | | | |
| | | | | | | | | |
Name, Year of Birth & Address | | Position(s) Held
with the Funds | | Year First
Elected or
Appointed
and Term(1)
| | Principal Occupation(s) Including other Directorships During Past 5 Years | | Number
of Portfolios
in Fund Complex
Overseen by
Board Member |
| | | | | |
| | | | | | | | | |
| | | |
| Independent Board Members: | | | | |
| | | | |
∎ TERENCE J. TOTH | | | | Formerly, a Co-Founding Partner, Promus Capital (investment advisory firm) (2008-2017); Director, Quality Control Corporation (manufacturing) (since 2012); member: Catalyst Schools of Chicago Board (since 2008) and Mather Foundation Board (philanthropy) (since 2012), and chair of its Investment Committee; formerly, Director, Fulcrum IT Services LLC (information technology services firm to government entities) (2010-2019); formerly, Director, LogicMark LLC (health services) (2012-2016); formerly, Director, Legal & General Investment Management America, Inc. (asset management) (2008-2013); formerly, CEO and President, Northern Trust Global Investments (financial services) (2004-2007): Executive Vice President, Quantitative Management & Securities Lending (2000-2004); prior thereto, various positions with Northern Trust Company (financial services) (since 1994); formerly, Member, Northern Trust Mutual Funds Board (2005-2007), Northern Trust Global Investments Board (2004-2007), Northern Trust Japan Board (2004-2007), Northern Trust Securities Inc. Board (2003-2007) and Northern Trust Hong Kong Board (1997-2004). | | |
1959 333 W. Wacker Drive Chicago, IL 6o6o6 | | Chair and Board Member | | 2008 Class II | | 146 |
| | | | | | | |
| | | | |
∎ JACK B. EVANS | | | | Chairman (since 2019), formerly, President (1996-2019), The Hall-Perrine Foundation, (private philanthropic corporation); Life Trustee of Coe College and the Iowa College Foundation; formerly, Member and President Pro-Tem of the Board of Regents for the State of Iowa University System (2007- 2013); Director and Chairman (2009-2021), United Fire Group, a publicly held company; Director, Public Member, American Board of Orthopaedic Surgery (2015-2020); Director (2000-2004), Alliant Energy; Director (1996-2015), The Gazette Company (media and publishing); Director (1997- 2003), Federal Reserve Bank of Chicago; President and Chief Operating Officer (1972-1995), SCI Financial Group, Inc., (regional financial services firm). | | |
1948 333 W. Wacker Drive Chicago, IL 6o6o6 | | Board Member | | 1999 Class III | | 146 |
| | | | | | | |
| | | | |
∎ WILLIAM C. HUNTER | | | | Dean Emeritus, formerly, Dean, Tippie College of Business, University of Iowa (2006-2012); Director of Wellmark, Inc. (since 2009); past Director (2005-2015), and past President (2010-2014) Beta Gamma Sigma, Inc., The International Business Honor Society; formerly, Director (2004-2018) of Xerox Corporation; formerly, Dean and Distinguished Professor of Finance, School of Business at the University of Connecticut (2003-2006); previously, Senior Vice President and Director of Research at the Federal Reserve Bank of Chicago (1995-2003); formerly, Director (1997-2007), Credit Research Center at Georgetown University. | | |
1948 333 W. Wacker Drive Chicago, IL 6o6o6 | | Board Member | | 2003 Class I | | 146 |
| | | | | | | |
| | | | |
∎ AMY B. R. LANCELLOTTA | | | | Formerly, Managing Director, Independent Directors Council (IDC) (supports the fund independent director community and is part of the Investment Company Institute (ICI), which represents regulated investment companies) (2006-2019); formerly, various positions with ICI (1989-2006); Member of the Board of Directors, Jewish Coalition Against Domestic Abuse (JCADA) (since 2020). | | |
1959 333 W. Wacker Drive Chicago, IL 6o6o6 | | Board Member | | 2021 Class II | | 146 |
| | | | | | | |
175
Board Members & Officers (continued)
(Unaudited)
| | | | | | | | |
| | | | | |
| | | | | | | | | |
Name, Year of Birth & Address | | Position(s) Held
with the Funds | | Year First
Elected or
Appointed
and Term(1)
| | Principal Occupation(s) Including other Directorships During Past 5 Years | | Number
of Portfolios
in Fund Complex
Overseen by
Board Member |
| | | | | |
| | | | | | | | | |
| | | |
| Independent Board Members (continued): | | | | |
| | | | |
∎ JOANNE T. MEDERO | | | | Formerly, Managing Director, Government Relations and Public Policy (2009-2020) and Senior Advisor to the Vice Chairman (2018-2020), BlackRock, Inc. (global investment management firm); formerly, Managing Director, Global Head of Government Relations and Public Policy, Barclays Group (IBIM) (investment banking, investment management and wealth management businesses) (2006-2009); formerly, Managing Director, Global General Counsel and Corporate Secretary, Barclays Global Investors (global investment management firm) (1996-2006); formerly, Partner, Orrick, Herrington & Sutcliffe LLP (law firm) (1993-1995); formerly, General Counsel, Commodity Futures Trading Commission (government agency overseeing U.S. derivatives markets) (1989-1993); formerly, Deputy Associate Director/ Associate Director for Legal and Financial Affairs, Office of Presidential Personnel, The White House (1986-1989); Member of the Board of Directors, Baltic-American Freedom Foundation (seeks to provide opportunities for citizens of the Baltic states to gain education and professional development through exchanges in the U.S.) (since 2019). | | |
1954 333 W. Wacker Drive Chicago, IL 6o6o6 | | Board Member | | 2021 Class III | | 146 |
| | | | | | | |
| | | | |
∎ ALBIN F. MOSCHNER | | | | Founder and Chief Executive Officer, Northcroft Partners, LLC, (management consulting) (since 2012); formerly, Chairman (2019), and Director (2012-2019), USA Technologies, Inc., (provider of solutions and services to facilitate electronic payment transactions); formerly, Director, Wintrust Financial Corporation (1996-2016); previously, held positions at Leap Wireless International, Inc., (consumer wireless services) including Consultant (2011-2012), Chief Operating Officer (2008-2011), and Chief Marketing Officer (2004-2008); formerly, President, Verizon Card Services division of Verizon Communications, Inc. (2000-2003); formerly, President, One Point Services at One Point Communications (telecommunication services) (1999-2000); formerly, Vice Chairman of the Board, Diba, Incorporated (internet technology provider) (1996-1997); formerly, various executive positions (1991-1996) including Chief Executive Officer (1995-1996) of Zenith Electronics Corporation (consumer electronics). | | |
1952 333 W. Wacker Drive Chicago, IL 6o6o6 | | Board Member | | 2016 Class III | | 146 |
| | | | | | | |
| | | | |
∎ JOHN K. NELSON | | | | Member of Board of Directors of Core12 LLC. (private firm which develops branding, marketing and communications strategies for clients) (since 2008); served on The President’s Council of Fordham University (2010- 2019) and previously a Director of the Curran Center for Catholic American Studies (2009-2018); formerly, senior external advisor to the Financial Services practice of Deloitte Consulting LLP. (2012-2014); former Chair of the Board of Trustees of Marian University (2010-2014 as trustee, 2011-2014 as Chair); formerly Chief Executive Officer of ABN AMRO Bank N.V., North America, and Global Head of the Financial Markets Division (2007-2008), with various executive leadership roles in ABN AMRO Bank N.V. between 1996 and 2007. | | |
1962 333 W. Wacker Drive Chicago, IL 6o6o6 | | Board Member | | 2013 Class II | | 146 |
| | | | | | | |
| | | | |
∎ JUDITH M. STOCKDALE | | | | Board Member, Land Trust Alliance (national public charity addressing natural land and water conservation in the U.S.) (since 2013); formerly, Board Member, U.S. Endowment for Forestry and Communities (national endowment addressing forest health, sustainable forest production and markets, and economic health of forest-reliant communities in the U.S.) (2013-2019); formerly, Executive Director (1994-2012), Gaylord and Dorothy Donnelley Foundation (private foundation endowed to support both natural land conservation and artistic vitality); prior thereto, Executive Director, Great Lakes Protection Fund (endowment created jointly by seven of the eight Great Lake states’ Governors to take a regional approach to improving the health of the Great Lakes) (1990-1994). | | |
1947 333 W. Wacker Drive Chicago, IL 6o6o6 | | Board Member | | 1997 Class I | | 146 |
| | | | | | | |
176
| | | | | | | | |
| | | | | |
| | | | | | | | | |
Name, Year of Birth & Address | | Position(s) Held
with the Funds | | Year First
Elected or
Appointed
and Term(1)
| | Principal Occupation(s) Including other Directorships During Past 5 Years | | Number
of Portfolios
in Fund Complex
Overseen by
Board Member |
| | | | | |
| | | | | | | | | |
| | | |
| Independent Board Members (continued): | | | | |
| | | | | |
∎ CAROLE E. STONE | | | | | | Former Director, Chicago Board Options Exchange, Inc. (2006-2017); and C2 Options Exchange, Incorporated (2009-2017); formerly, Director, Cboe, Global Markets, Inc. (2010-2020) (formerly named CBOE Holdings, Inc.; formerly, Commissioner, New York State Commission on Public Authority Reform (2005-2010). | | |
1947 333 W. Wacker Drive Chicago, IL 6o6o6 | | Board Member | | 2007 Class I | | 146 |
| | | | | | | |
| | | | | |
∎ MATTHEW THORNTON III | | | | | | Formerly, Executive Vice President and Chief Operating Officer (2018-2019), FedEx Freight Corporation, a subsidiary of FedEx Corporation (“FedEx”) (provider of transportation, e-commerce and business services through its portfolio of companies); formerly, Senior Vice President, U.S. Operations (2006-2018), Federal Express Corporation, a subsidiary of FedEx; formerly, Member of the Board of Directors (2012-2018), Safe Kids Worldwide® (a non-profit organization dedicated to preventing childhood injuries). Member of the Board of Directors (since 2014), The Sherwin-Williams Company (develops, manufactures, distributes and sells paints, coatings and related products); Director (since 2020), Crown Castle International (provider of communications infrastructure) | | |
1958 333 W. Wacker Drive Chicago, IL 6o6o6 | | Board Member | | 2020 Class III | | 146 |
| | | | | | | |
| | | | | |
∎ MARGARET L. WOLFF | | | | | | Formerly, member of the Board of Directors (2013-2017) of Travelers Insurance Company of Canada and The Dominion of Canada General Insurance Company (each, a part of Travelers Canada, the Canadian operation of The Travelers Companies, Inc.); formerly, Of Counsel, Skadden, Arps, Slate, Meagher & Flom LLP (legal services, Mergers & Acquisitions Group) (2005-2014); Member of the Board of Trustees of New York-Presbyterian Hospital (since 2005); Member (since 2004) and Chair (since 2015) of the Board of Trustees of The John A. Hartford Foundation (philanthropy dedicated to improving the care of older adults); formerly, Member (2005-2015) and Vice Chair (2011-2015) of the Board of Trustees of Mt. Holyoke College. | | |
1955 333 W. Wacker Drive Chicago, IL 6o6o6 | | Board Member | | 2016 Class I | | 146 |
| | | | | | | |
| | | | | |
∎ ROBERT L. YOUNG | | | | | | Formerly, Chief Operating Officer and Director, J.P.Morgan Investment Management Inc. (financial services) (2010-2016); formerly, President and Principal Executive Officer (2013-2016), and Senior Vice President and Chief Operating Officer (2005-2010), of J.P.Morgan Funds; formerly, Director and various officer positions for J.P.Morgan Investment Management Inc. (formerly, JPMorgan Funds Management, Inc. and formerly, One Group Administrative Services) and JPMorgan Distribution Services, Inc. (financial services) (formerly, One Group Dealer Services, Inc.) (1999-2017). | | |
1963 333 W. Wacker Drive Chicago, IL 6o6o6 | | Board Member | | 2017 Class II | | 146 |
| | | | | | | |
177
Board Members & Officers (continued)
(Unaudited)
| | | | | | |
| | | | |
| | | | | | | |
Name, Year of Birth & Address | | Position(s) Held
with the Funds | | Year First
Elected or
Appointed(2) | | Principal Occupation(s) During Past 5 Years |
| | | | |
| | | | | | | |
| | |
| Officers of the Funds: | | |
| | | |
∎ DAVID J. LAMB | | | | Managing Director of Nuveen Fund Advisors, LLC (since 2019) Senior Managing Director (since 2021), formerly, Managing Director (2020-2021) of Nuveen Securities, LLC; Senior Managing Director (since 2021), formerly, Managing Director (2017-2021), Senior Vice President of Nuveen (2006-2017), Vice President prior to 2006 |
1963 333 W. Wacker Drive Chicago, IL 6o6o6 | | Chief Administrative Officer | | 2015 |
| | | | | |
| | | |
∎ MARK J. CZARNIECKI | | | | Vice President and Assistant Secretary of Nuveen Securities, LLC (since 2016) and Nuveen Fund Advisors, LLC (since 2017); Vice President and Associate General Counsel of Nuveen (since 2013) and Vice President, Assistant Secretary and Associate General Counsel of Nuveen Asset Management, LLC (since 2018). |
1979 901 Marquette Avenue Minneapolis, MN 55402 | | Vice President and Assistant Secretary | | 2013 |
| | | | | |
| | | |
∎ DIANA R. GONZALEZ | | | | Vice President and Assistant Secretary of Nuveen Fund Advisors, LLC (since 2017); Vice President and Associate General Counsel of Nuveen (since 2017); Associate General Counsel of Jackson National Asset Management, LLC (2012-2017). |
1978 333 W. Wacker Drive Chicago, IL 6o6o6 | | Vice President and Assistant Secretary | | 2017 |
| | | | | |
| | | |
∎ NATHANIEL T. JONES | | | | Senior Managing Director (since 2021), formerly, Managing Director (2017-2021), Senior Vice President (2016-2017), formerly, Vice President (2011-2016) of Nuveen; Managing Director (since 2015) of Nuveen Fund Advisors, LLC; Chartered Financial Analyst. |
1979 333 W. Wacker Drive Chicago, IL 6o6o6 | | Vice President and Treasurer | | 2016 |
| | | | | |
| | | |
∎ TINA M. LAZAR | | | | Managing Director (since 2017), formerly, Senior Vice President (2014-2017) of Nuveen Securities, LLC. |
1961 333 W. Wacker Drive Chicago, IL 6o6o6 | | Vice President | | 2002 |
| | | | | |
| | | |
∎ BRIAN J. LOCKHART | | | | Managing Director (since 2019) of Nuveen Fund Advisors, LLC; Senior Managing Director (since 2021), formerly, Managing Director (2017-2021), Vice President (2010-2017) of Nuveen; Head of Investment Oversight (since 2017), formerly, Team Leader of Manager Oversight (2015-2017); Chartered Financial Analyst and Certified Financial Risk Manager. |
1974 333 W. Wacker Drive Chicago, IL 6o6o6 | | Vice President | | 2019 |
| | | | | |
| | | |
∎ JACQUES M. LONGERSTAEY | | | | Senior Managing Director, Chief Risk Officer, Nuveen (since May 2019); Senior Managing Director (since May 2019) of Nuveen Fund Advisors, LLC; formerly, Chief Investment and Model Risk Officer, Wealth & Investment Management Division, Wells Fargo Bank (NA) (2013-2019). |
1963 8500 Andrew Carnegie Blvd. Charlotte, NC 28262 | | Vice President | | 2019 |
| | | | | |
| | | |
∎ KEVIN J. MCCARTHY | | | | Senior Managing Director (since 2017) and Secretary and General Counsel (since 2016) of Nuveen Investments, Inc., formerly, Executive Vice President (2016-2017) and Managing Director and Assistant Secretary (2008-2016); Senior Managing Director (since 2017) and Assistant Secretary (since 2008) of Nuveen Securities, LLC, formerly Executive Vice President (2016-2017) and Managing Director (2008-2016); Senior Managing Director (since 2017), and Secretary (since 2016) of Nuveen Fund Advisors, LLC, formerly, Co-General Counsel (2011-2020), Executive Vice President (2016-2017), Managing Director (2008-2016) and Assistant Secretary (2007-2016); Senior Managing Director (since 2017), Secretary (since 2016) of Nuveen Asset Management, LLC, formerly, Associate General Counsel (2011-2020), Executive Vice President (2016-2017) and Managing Director and Assistant Secretary (2011- 2016); Vice President (since 2007) and Secretary (since 2016), formerly, Assistant Secretary, of NWQ Investment Management Company, LLC, Santa Barbara Asset Management, LLC and Winslow Capital Management, LLC (since 2010). Senior Managing Director (since 2017) and Secretary (since 2016) of Nuveen Alternative Investments, LLC. |
1966 333 W. Wacker Drive Chicago, IL 6o6o6 | | Vice President and Assistant Secretary | | 2007 |
| | | | | |
178
| | | | | | |
| | | | |
| | | | | | | |
Name, Year of Birth & Address | | Position(s) Held
with the Funds | | Year First
Elected or
Appointed(2) | | Principal Occupation(s) During Past 5 Years |
| | | | |
| | | | | | | |
| | |
| Officers of the Funds (continued): | | |
| | | |
∎ JON SCOTT MEISSNER | | | | Managing Director of Mutual Fund Tax and Financial Reporting groups at Nuveen (since 2017); Managing Director of Nuveen Fund Advisors, LLC (since 2019); Senior Director of Teachers Advisors, LLC and TIAA-CREF Investment Management, LLC (since 2016); Senior Director (since 2015) Mutual Fund Taxation to the TIAA-CREF Funds, the TIAA-CREF Life Funds, the TIAA Separate Account VA-1 and the CREF Accounts; has held various positions with TIAA since 2004. |
1973 8500 Andrew Carnegie Blvd. Charlotte, NC 28262 | | Vice President and Assistant Secretary | | 2019 |
| | | | | |
| | | |
∎ DEANN D. MORGAN | | | | President, Nuveen Fund Advisors, LLC (since 2020); Executive Vice President, Global Head of Product at Nuveen (since 2019); Co-Chief Executive Officer of Nuveen Securities, LLC since 2020); Managing Member of MDR Collaboratory LLC (since 2018); Managing Director, (Head of Wealth Management Product Structuring & COO Multi Asset Investing. The Blackstone Group (2013-2017) |
1969 730 Third Avenue New York, NY 10017 | | Vice President | | 2020 |
| | | | | |
| | | |
∎ CHRISTOPHER M. ROHRBACHER | | | | Managing Director and Assistant Secretary (since 2017) of Nuveen Securities, LLC; Managing Director (since 2017) General Counsel (since 2020), and Assistant Secretary (since 2016), formerly, Senior Vice President (2016-2017), of Nuveen Fund Advisors, LLC; Managing Director, Associate General Counsel and Assistant Secretary of Nuveen Asset Management, LLC (since 2020); Managing Director (since 2017), and Associate General Counsel (since 2016), formerly, Senior Vice President (2012-2017) and Assistant General Counsel (2008-2016) of Nuveen. |
1971 333 W. Wacker Drive Chicago, IL 6o6o6 | | Vice President and Assistant Secretary | | 2008 |
| | | | | |
| | | |
∎ WILLIAM A. SIFFERMANN | | | | Managing Director (since 2017), formerly Senior Vice President (2016-2017) and Vice President (2011-2016) of Nuveen. |
1975 333 W. Wacker Drive Chicago, IL 6o6o6 | | Vice President | | 2017 |
| | | | | |
| | | |
∎ E. SCOTT WICKERHAM | | | | Senior Managing Director, Head of Public Investment Finance at Nuveen (since 2019), formerly, Managing Director; Senior Managing Director (since 2019) of Nuveen Fund Advisers, (LLC; Principal Financial Officer, Principal Accounting Officer and Treasurer (since 2017) of the TIAA-CREF Funds, the TIAA-CREF Life Funds, the TIAA Separate Account VA-1 and Principal Financial Officer, Principal Accounting Officer (since 2020) and Treasurer (since 2017) to the CREF Accounts; formerly, Senior Director, TIAA-CREF Fund Administration (2014-2015); has held various positions with TIAA since 2006. |
1973 8500 Andrew Carnegie Blvd. Charlotte, NC 28262 | | Vice President and Controller | | 2019 |
| | | | | |
| | | |
∎ MARK L. WINGET | | | | Vice President and Assistant Secretary of Nuveen Securities, LLC (since 2008), and Nuveen Fund Advisors, LLC (since 2019); Vice President, Associate General Counsel and Assistant Secretary of Nuveen Asset Management, LLC (since 2020); Vice President (since 2010) and Associate General Counsel (since 2019), formerly, Assistant General Counsel (2008-2016) of Nuveen. |
1968 333 W. Wacker Drive Chicago, IL 60606 | | Vice President and Secretary | | 2008 |
| | | | | |
| | | |
∎ GIFFORD R. ZIMMERMAN | | | | Formerly: Managing Director (2002-2020) and Assistant Secretary (2002-2020) of Nuveen Securities, LLC; formerly, Managing Director (2002-2020), Assistant Secretary (1997-2020) and Co-General Counsel (2011- 2020) of Nuveen Fund Advisors, LLC; formerly, Managing Director (2004-2020) and Assistant Secretary (1994-2020) of Nuveen Investments, Inc.; formerly, Managing Director, Assistant Secretary and Associate General Counsel of Nuveen Asset Management, LLC (2011-2020); formerly, Vice President and Assistant Secretary of NWQ Investment Management Company, LLC (2002-2020), Santa Barbara Asset Management, LLC (2006-2020) and Winslow Capital Management, LLC (2010-2020); Chartered Financial Analyst. |
1956 333 W. Wacker Drive Chicago, IL 60606 | | Vice President and Chief Compliance Officer | | 1988 |
| | | | | |
| (1) | The Board of Trustees is divided into three classes, Class I, Class II, and Class III, with each being elected to serve until the third succeeding annual shareholders’ meeting subsequent to its election or thereafter in each case when its respective successors are duly elected or appointed, except two board members are elected by the holders of Preferred Shares, when applicable, to serve until the next annual shareholders’ meeting subsequent to its election or thereafter in each case when its respective successors are duly elected or appointed. The year first elected or appointed represents the year in which the board member was first elected or appointed to any fund in the Nuveen complex. |
| (2) | Officers serve indefinite terms until their successor has been duly elected and qualified, their death or their resignation or removal. The year first elected or appointed represents the year in which the Officer was first elected or appointed to any fund in the Nuveen complex. |
179
Nuveen:
Serving Investors for Generations
Since 1898, financial professionals and their clients have relied on Nuveen to provide dependable investment solutions through continued adherence to proven, long-term investing principles. Today, we offer a range of high quality solutions designed to be integral components of a well-diversified core portfolio.
Focused on meeting investor needs.
Nuveen is the investment manager of TIAA. We have grown into one of the world’s premier global asset managers, with specialist knowledge across all major asset classes and particular strength in solutions that provide income for investors and that draw on our expertise in alternatives and responsible investing. Nuveen is driven not only by the independent investment processes across the firm, but also the insights, risk management, analytics and other tools and resources that a truly world-class platform provides. As a global asset manager, our mission is to work in partnership with our clients to create solutions which help them secure their financial future.
Find out how we can help you.
To learn more about how the products and services of Nuveen may be able to help you meet your financial goals, talk to your financial professional, or call us at (800) 257-8787. Please read the information provided carefully before you invest. Investors should consider the investment objective and policies, risk considerations, charges and expenses of any investment carefully. Where applicable, be sure to obtain a prospectus, which contains this and other relevant information. To obtain a prospectus, please contact your securities representative or Nuveen, 333 W. Wacker Dr., Chicago, IL 60606. Please read the prospectus carefully before you invest or send money.
Learn more about Nuveen Funds at: www.nuveen.com/closed-end-funds
| | | | |
| Nuveen Securities, LLC, member FINRA and SIPC | 333 West Wacker Drive Chicago, IL 60606 | www.nuveen.com | | | | EAN-A-0721D
1819426-INV-Y-09/22 |
As of the end of the period covered by this report, the registrant has adopted a code of ethics that applies to the registrant’s principal executive officer, principal financial officer, principal accounting officer or controller, or persons performing similar functions. There were no amendments to or waivers from the Code during the period covered by this report. The registrant has posted the code of ethics on its website at www.nuveen.com/fund-governance. (To view the code, click on Code of Conduct.)
| ITEM 3. | AUDIT COMMITTEE FINANCIAL EXPERT. |
As of the end of the period covered by this report, the registrant’s Board of Directors or Trustees (“Board”) determined that the registrant has at least one “audit committee financial expert” (as defined in Item 3 of Form N-CSR) serving on its Audit Committee. The registrant’s audit committee financial experts are Carole E. Stone, Jack B. Evans, William C. Hunter and Albin F. Moschner, who are “independent” for purposes of Item 3 of Form N-CSR.
Ms. Stone served for five years as Director of the New York State Division of the Budget. As part of her role as Director, Ms. Stone was actively involved in overseeing the development of the State’s operating, local assistance and capital budgets, its financial plan and related documents; overseeing the development of the State’s bond-related disclosure documents and certifying that they fairly presented the State’s financial position; reviewing audits of various State and local agencies and programs; and coordinating the State’s system of internal audit and control. Prior to serving as Director, Ms. Stone worked as a budget analyst/examiner with increasing levels of responsibility over a 30 year period, including approximately five years as Deputy Budget Director. Ms. Stone has also served as Chair of the New York State Racing Association Oversight Board, as Chair of the Public Authorities Control Board, as a Commissioner on the New York State Commission on Public Authority Reform and as a member of the Boards of Directors of several New York State public authorities. These positions have involved overseeing operations and finances of certain entities and assessing the adequacy of project/entity financing and financial reporting. Currently, Ms. Stone is on the Board of Directors of CBOE Holdings, Inc., of the Chicago Board Options Exchange, and of C2 Options Exchange. Ms. Stone’s position on the boards of these entities and as a member of both CBOE Holdings’ Audit Committee and its Finance Committee has involved, among other things, the oversight of audits, audit plans and preparation of financial statements.
Mr. Evans was formerly President and Chief Operating Officer of SCI Financial Group, Inc., a full service registered broker-dealer and registered investment adviser (“SCI”). As part of his role as President and Chief Operating Officer, Mr. Evans actively supervised the Chief Financial Officer (the “CFO”) and actively supervised the CFO’s preparation of financial statements and other filings with various regulatory authorities. In such capacity, Mr. Evans was actively involved in the preparation of SCI’s financial statements and the resolution of issues raised in connection therewith. Mr. Evans has also served on the audit committee of various reporting companies. At such companies, Mr. Evans was involved in the oversight of audits, audit plans, and the preparation of financial statements. Mr. Evans also formerly chaired the audit committee of the Federal Reserve Bank of Chicago.
Mr. Hunter was formerly a Senior Vice President at the Federal Reserve Bank of Chicago. As part of his role as Senior Vice President, Mr. Hunter was the senior officer responsible for all operations of each of the Economic Research, Statistics, and Community and Consumer Affairs units at the Federal Reserve Bank of Chicago. In such capacity, Mr. Hunter oversaw the subunits of the Statistics and Community and Consumer Affairs divisions responsible for the analysis and evaluation of bank and bank holding company financial statements and financial filings. Prior to serving as Senior Vice President at the Federal Reserve Bank of Chicago, Mr. Hunter was the Vice President of the Financial Markets unit at the Federal Reserve Bank of Atlanta where he supervised financial staff and bank holding company analysts who analyzed and evaluated bank and bank holding company financial statements. Mr. Hunter also currently serves on the Boards of Directors of Xerox Corporation and Wellmark, Inc. as well as on the Audit Committees of such Boards. As an Audit Committee member, Mr. Hunter’s responsibilities include, among other things, reviewing financial statements, internal audits and internal controls over financial reporting. Mr. Hunter also formerly was a Professor of Finance at the University of Connecticut School of Business and has authored numerous scholarly articles on the topics of finance, accounting and economics.
Mr. Moschner, Founder and Chief Executive Officer, Northcroft Partners, LLC, (management consulting) (since 2012); formerly, Chairman (2019), and Director (2012-2019), USA Technologies, Inc., (provider of solutions and services to facilitate electronic payment transactions); formerly, Director, Wintrust Financial Corporation (1996-2016); previously, held positions at Leap Wireless International, Inc., (consumer wireless services) including Consultant (2011-2012), Chief Operating Officer (2008-2011), and Chief Marketing Officer (2004-2008); formerly, President, Verizon Card Services division of Verizon Communications, Inc. (2000-2003); formerly, President, One Point Services at One Point Communications (telecommunication services) (1999-2000); formerly, Vice Chairman of the Board, Diba, Incorporated (internet technology provider) (1996-1997); formerly, various executive positions (1991-1996), including Chief Executive Officer (1995-1996) of Zenith Electronics Corporation (consumer electronics).
| ITEM 4. | PRINCIPAL ACCOUNTANT FEES AND SERVICES. |
Nuveen Floating Rate Income Fund
The following tables show the amount of fees that KPMG LLP, the Fund’s auditor, billed to the Fund during the Fund’s last two full fiscal years. For engagements with KPMG LLP the Audit Committee approved in advance all audit services and non-audit services that KPMG LLP provided to the Fund, except for those non-audit services that were subject to the pre-approval exception under Rule 2-01 of Regulation S-X (the “pre-approval exception”). The pre-approval exception for services provided directly to the Fund waives the pre-approval requirement for services other than audit, review or attest services if: (A) the aggregate amount of all such services provided constitutes no more than 5% of the total amount of revenues paid by the Fund to its accountant during the fiscal year in which the services are provided; (B) the Fund did not recognize the services as non-audit services at the time of the engagement; and (C) the services are promptly brought to the Audit Committee’s attention, and the Committee (or its delegate) approves the services before the audit is completed.
The Audit Committee has delegated certain pre-approval responsibilities to its Chair (or, in her absence, any other member of the Audit Committee).
SERVICES THAT THE FUND’S AUDITOR BILLED TO THE FUND
| | | | | | | | | | | | | | | | |
Fiscal Year Ended | | Audit Fees
Billed to Fund 1 | | | Audit-Related Fees
Billed to Fund 2 | | | Tax Fees
Billed to Fund 3 | | | All Other Fees
Billed to Fund 4 | |
July 31, 2021 | | $ | 43,960 | | | $ | 24,000 | | | $ | 0 | | | $ | 0 | |
| | | | | | | | | | | | | | | | |
| | | | |
Percentage approved pursuant to pre-approval exception | | | 0 | % | | | 0 | % | | | 0 | % | | | 0 | % |
| | | | | | | | | | | | | | | | |
| | | | |
July 31, 2020 | | $ | 41,150 | | | $ | 0 | | | $ | 0 | | | $ | 0 | |
| | | | | | | | | | | | | | | | |
| | | | |
Percentage approved pursuant to pre-approval exception | | | 0 | % | | | 0 | % | | | 0 | % | | | 0 | % |
| | | | | | | | | | | | | | | | |
1 “Audit Fees” are the aggregate fees billed for professional services for the audit of the Fund’s annual financial statements and services provided in connection with statutory and regulatory filings or engagements.
2 “Audit Related Fees” are the aggregate fees billed for assurance and related services reasonably related to the performance of the audit or review of financial statements that are not reported under “Audit Fees”. These fees include offerings related to the Fund’s common shares and leverage.
3 “Tax Fees” are the aggregate fees billed for professional services for tax advice, tax compliance, and tax planning. These fees include: all global withholding tax services; excise and state tax reviews; capital gain, tax equalization and taxable basis calculation performed by the principal accountant.
4 “All Other Fees” are the aggregate fees billed for products and services other than “Audit Fees”, “Audit-Related Fees” and “Tax Fees”. These fees represent all “Agreed-Upon Procedures” engagements pertaining to the Fund’s use of leverage.
SERVICES THAT THE FUND’S AUDITOR BILLED TO THE
ADVISER AND AFFILIATED FUND SERVICE PROVIDERS
The following tables show the amount of fees billed by KPMG LLP to Nuveen Fund Advisors, LLC (formerly Nuveen Fund Advisors, Inc.) (the “Adviser”), and any entity controlling, controlled by or under common control with the Adviser that provides ongoing services to the Fund (“Affiliated Fund Service Provider”), for engagements directly related to the Fund’s operations and financial reporting, during the Fund’s last two full fiscal years.
The tables also show the percentage of fees subject to the pre-approval exception. The pre-approval exception for services provided to the Adviser and any Affiliated Fund Service Provider (other than audit, review or attest services) waives the pre-approval requirement if: (A) the aggregate amount of all such services provided constitutes no more than 5% of the total amount of revenues paid to KPMG LLP by the Fund, the Adviser and Affiliated Fund Service Providers during the fiscal year in which the services are provided that would have to be pre-approved by the Audit Committee; (B) the Fund did not recognize the services as non-audit services at the time of the engagement; and (C) the services are promptly brought to the Audit Committee’s attention, and the Committee (or its delegate) approves the services before the Fund’s audit is completed.
| | | | | | | | | | | | |
Fiscal Year Ended | | Audit-Related Fees
Billed to Adviser and
Affiliated Fund
Service Providers | | | Tax Fees
Billed to Adviser and
Affiliated Fund
Service Providers | | | All Other Fees
Billed to Adviser and
Affiliated Fund
Service Providers | |
July 31, 2021 | | $ | 0 | | | $ | 0 | | | $ | 0 | |
| | | | | | | | | | | | |
| | | |
Percentage approved pursuant to pre-approval exception | | | 0 | % | | | 0 | % | | | 0 | % |
| | | | | | | | | | | | |
| | | |
July 31, 2020 | | $ | 0 | | | $ | 0 | | | $ | 0 | |
| | | | | | | | | | | | |
| | | |
Percentage approved pursuant to pre-approval exception | | | 0 | % | | | 0 | % | | | 0 | % |
| | | | | | | | | | | | |
NON-AUDIT SERVICES
The following table shows the amount of fees that KPMG LLP billed during the Fund’s last two full fiscal years for non-audit services. The Audit Committee is required to pre-approve non-audit services that KPMG LLP provides to the Adviser and any Affiliated Fund Services Provider, if the engagement related directly to the Fund’s operations and financial reporting (except for those subject to the pre-approval exception described above). The Audit Committee requested and received information from KPMG LLP about any non-audit services that KPMG LLP rendered during the Fund’s last fiscal year to the Adviser and any Affiliated Fund Service Provider. The Committee considered this information in evaluating KPMG LLP ’s independence.
| | | | | | | | | | | | | | | | |
Fiscal Year Ended | | Total Non-Audit Fees
Billed to Fund | | | Total Non-Audit Fees
billed to Adviser and
Affiliated Fund Service
Providers (engagements
related directly to the
operations and financial
reporting of the Fund) | | | Total Non-Audit Fees
billed to Adviser and
Affiliated Fund Service
Providers (all other
engagements) | | | Total | |
July 31, 2021 | | $ | 0 | | | $ | 0 | | | $ | 0 | | | $ | 0 | |
July 31, 2020 | | $ | 0 | | | $ | 0 | | | $ | 0 | | | $ | 0 | |
“Non-Audit Fees billed to Fund” for both fiscal year ends represent “Tax Fees” and “All Other Fees” billed to Fund in their respective amounts from the previous table.
Less than 50 percent of the hours expended on the principal accountant’s engagement to audit the registrant’s financial statements for the most recent fiscal year were attributed to work performed by persons other than the principal accountant’s full-time, permanent employees.
Audit Committee Pre-Approval Policies and Procedures. Generally, the Audit Committee must approve (i) all non-audit services to be performed for the Fund by the Fund’s independent accountants and (ii) all audit and non-audit services to be performed by the Fund’s independent accountants for the Affiliated Fund Service Providers with respect to operations and financial reporting of the Fund. Regarding tax and research projects conducted by the independent accountants for the Fund and Affiliated Fund Service Providers (with respect to operations and financial reports of the Fund) such engagements will be (i) pre-approved by the Audit Committee if they are expected to be for amounts greater than $10,000; (ii) reported to the Audit Committee chair for her verbal approval prior to engagement if they are expected to be for amounts under $10,000 but greater than $5,000; and (iii) reported to the Audit Committee at the next Audit Committee meeting if they are expected to be for an amount under $5,000.
| ITEM 5. | AUDIT COMMITTEE OF LISTED REGISTRANTS. |
The registrant’s Board has a separately designated Audit Committee established in accordance with Section 3(a)(58)(A) of the Securities Exchange Act of 1934, as amended (15 U.S.C. 78c(a)(58)(A)). As of the end of the period covered by this report, the members of the audit committee are Jack B. Evans, William C. Hunter, John K. Nelson, Judith M. Stockdale, Albin F. Moschner and Carole E. Stone, Chair.
| ITEM 6. | SCHEDULE OF INVESTMENTS. |
| (a) | | See Portfolio of Investments in Item 1. |
| ITEM 7. | DISCLOSURE OF PROXY VOTING POLICIES AND PROCEDURES FOR CLOSED-END MANAGEMENT INVESTMENT COMPANIES. |
Nuveen Fund Advisors, LLC, is the registrant’s investment adviser (also referred to as the “Adviser”). The Adviser is responsible for the on-going monitoring of the Fund’s investment portfolio, managing the Fund’s business affairs and providing certain clerical, bookkeeping and administrative services. The Adviser has engaged Nuveen Asset Management, LLC (“Sub-Adviser”) as Sub-Adviser to provide discretionary investment advisory services. As part of these services, the Adviser has delegated to the Sub-Adviser the full responsibility for proxy voting on securities held in the registrant’s portfolio and related duties in accordance with the Sub-Adviser’s policies and procedures. The Adviser periodically monitors the Sub-Adviser’s voting to ensure that it is carrying out its duties. The Sub-Adviser’s proxy voting policies and procedures are attached to this filing as an exhibit and incorporated herein by reference.
| ITEM 8. | PORTFOLIO MANAGERS OF CLOSED-END MANAGEMENT INVESTMENT COMPANIES. |
Nuveen Fund Advisors, LLC is the registrant’s investment adviser (also referred to as the “Adviser”). The Adviser is responsible for the selection and on-going monitoring of the Fund’s investment portfolio, managing the Fund’s business affairs and providing certain clerical, bookkeeping and administrative services. The Adviser has engaged Nuveen Asset Management, LLC (“Nuveen Asset Management” or “Sub-Adviser”) as Sub-Adviser to provide discretionary investment advisory services. The following section provides information on the portfolio managers at the Sub-Adviser:
| Item 8 (a)(1). | Portfolio Manager Biographies |
As of the date of filing this report, the following individuals at the Sub-Adviser (the “Portfolio Managers”) have primary responsibility for the day-to-day implementation of the Fund’s investment strategy:
Scott Caraher, Head of Senior Loans and responsible for retail and institutional bank loan-focused portfolio management and co-PM on the firm’s Long-Short Credit Strategy. When Scott joined Nuveen affiliate Symphony Asset Management in 2002, he was a gaming and industrials analyst providing long and short credit ideas to the investment team up and down the capital structure. Scott began trading loans for the platform in 2003 and in 2005 was named an associate portfolio manager on the firm’s loan strategies. He became the lead portfolio manager on the firm’s loan strategies in 2008. Prior to joining the firm, Scott was an Investment Banking Analyst in the industrial group at Deutsche Banc Alex Brown in New York.
Kevin Lorenz, CFA, head of high yield and responsible for retail and institutional high yield bond focused portfolio management. He has served in a variety of roles since joining the firm in 1987. He has been investing in high yield over his entire career and has focused exclusively on high yield since 1995. Kevin is also a member of the global fixed income investment committee, which discusses and debates investment policy for all global fixed income products.
| Item 8 (a)(2). | Other Accounts Managed By Portfolio Managers |
Other Accounts Managed. In addition to managing the registrant, the Portfolio Managers are primarily responsible for the day-to-day portfolio management of the following accounts:
OTHER ACCOUNTS MANAGED
| | | | | | | | |
| | | Scott Caraher | | | Kevin Lorenz | |
(a) Registered Investment Companies | | | | | | | | |
Number of accounts | | | 14 | | | | 13 | |
Assets* | | $ | 6.48 billion | | | $ | 45.66 billion | |
(b) Other pooled accounts | | | | | | | | |
Non-performance fee accounts | | | | | | | | |
Number of accounts | | | 3 | | | | 0 | |
Assets* | | $ | 582 million | | | $ | 0 | |
Performance fee accounts | | | | | | | | |
Number of accounts | | | 1 | | | | 0 | |
Assets | | $ | 104 million | | | $ | 0 | |
| | | | | | | | |
| | | Scott Caraher | | | Kevin Lorenz | |
(c) Other | | | | | | | | |
Non-performance fee accounts | | | | | | | | |
Number of accounts | | | 4 | | | | 0 | |
Assets* | | $ | 1.75 billion | | | $ | 0 | |
Performance fee accounts | | | | | | | | |
Number of accounts | | | 0 | | | | 0 | |
Assets* | | $ | 0 | | | $ | 0 | |
* Assets are as of July 31, 2021.
Potential Material Conflicts Of Interest
Actual or apparent conflicts of interest may arise when a portfolio manager has day-to-day management responsibilities with respect to more than one account. More specifically, portfolio managers who manage multiple accounts are presented a number of potential conflicts, including, among others, those discussed below.
The management of multiple accounts may result in a portfolio manager devoting unequal time and attention to the management of each account. Nuveen Asset Management seeks to manage such competing interests for the time and attention of portfolio managers by having portfolio managers focus on a particular investment discipline. Most accounts managed by a portfolio manager in a particular investment strategy are managed using the same investment models.
If a portfolio manager identifies a limited investment opportunity which may be suitable for more than one account, an account may not be able to take full advantage of that opportunity due to an allocation of filled purchase or sale orders across all eligible accounts. To deal with these situations, Nuveen Asset Management has adopted procedures for allocating limited opportunities across multiple accounts.
With respect to many of its clients’ accounts, Nuveen Asset Management determines which broker to use to execute transaction orders, consistent with its duty to seek best execution of the transaction. However, with respect to certain other accounts, Nuveen Asset Management may be limited by the client with respect to the selection of brokers or may be instructed to direct trades through a particular broker. In these cases, Nuveen Asset Management may place separate, non-simultaneous, transactions for a Fund and other accounts which may temporarily affect the market price of the security or the execution of the transaction, or both, to the detriment of the Fund or the other accounts.
Some clients are subject to different regulations. As a consequence of this difference in regulatory requirements, some clients may not be permitted to engage in all the investment techniques or transactions or to engage in these transactions to the same extent as the other accounts managed by a portfolio manager. Finally, the appearance of a conflict of interest may arise where Nuveen Asset Management has an incentive, such as a performance-based management fee, which relates to the management of some accounts, with respect to which a portfolio manager has day-to-day management responsibilities.
Conflicts of interest may also arise when the Sub-Adviser invests one or more of its client accounts in different or multiple parts of the same issuer’s capital structure, including investments in public versus private securities, debt versus equity, or senior versus junior/subordinated debt, or otherwise where there are different or inconsistent rights or benefits. Decisions or actions such as investing, trading, proxy voting, exercising, waiving or amending rights or covenants, workout activity, or serving on a board, committee or other involvement in governance may result in conflicts of interest between clients holding different securities or investments. Generally, individual portfolio managers will seek to act in a manner that they believe serves the best interest of the accounts they manage. In cases where a portfolio manager or team faces a conflict among its client accounts, it will seek to act in a manner that it believes best reflects its overall fiduciary duty, which may result in relative advantages or disadvantages for particular accounts.
Nuveen Asset Management has adopted certain compliance procedures which are designed to address these types of conflicts common among investment managers. However, there is no guarantee that such procedures will detect each and every situation in which a conflict arises.
| Item 8 (a)(3). | Fund Manager Compensation |
As of the most recently completed fiscal year end, the primary Portfolio Managers’ compensation is as follows:
Portfolio managers are compensated through a combination of base salary and variable components consisting of (i) a cash bonus; (ii) a long-term performance award; and (iii) participation in a profits interest plan.
Base salary. A portfolio manager’s base salary is determined based upon an analysis of the portfolio manager’s general performance, experience and market levels of base pay for such position.
Cash bonus. A portfolio manager is eligible to receive an annual cash bonus that is based on three variables: risk-adjusted investment performance relative to benchmark generally measured over the most recent one, three and five year periods (unless the portfolio manager’s tenure is shorter), ranking versus Morningstar peer funds generally measured over the most recent one, three and five year periods (unless the portfolio manager’s tenure is shorter), and management and peer reviews.
Long-term performance award. A portfolio manager is eligible to receive a long-term performance award that vests after three years. The amount of the award when granted is based on the same factors used in determining the cash bonus. The value of the award at the completion of the three-year vesting period is adjusted based on the risk-adjusted investment performance of Fund(s) managed by the portfolio manager during the vesting period and the performance of the TIAA organization as a whole.
Profits interest plan. Portfolio managers are eligible to receive profits interests in Nuveen Asset Management and its affiliate, Teachers Advisors, LLC, which vest over time and entitle their holders to a percentage of the firms’ annual profits. Profits interests are allocated to each portfolio manager based on such person’s overall contribution to the firms.
There are generally no differences between the methods used to determine compensation with respect to the Fund and the Other Accounts shown in the table above.
| Item 8 (a)(4). | Ownership of JFR Securities as of July 31, 2021 |
| | | | | | | | | | | | | | |
Name of Portfolio Manager | | None | | $1-
$10,000 | | $10,001-
$50,000 | | $50,001-
$100,000 | | $100,001-
$500,000 | | $500,001-
$1,000,000 | | Over $1,000,000 |
Scott Caraher | | | | | | | | | | X | | | | |
Kevin Lorenz | | X | | | | | | | | | | | | |
| ITEM 9. | PURCHASES OF EQUITY SECURITIES BY CLOSED-END MANAGEMENT INVESTMENT COMPANY AND AFFILIATED PURCHASERS. |
Not applicable.
| ITEM 10. | SUBMISSION OF MATTERS TO A VOTE OF SECURITY HOLDERS. |
There have been no material changes to the procedures by which shareholders may recommend nominees to the registrant’s Board implemented after the registrant last provided disclosure in response to this Item.
| ITEM 11. | CONTROLS AND PROCEDURES. |
| (a) | | The registrant’s principal executive and principal financial officers, or persons performing similar functions, have concluded that the registrant’s disclosure controls and procedures (as defined in Rule 30a-3(c) under the Investment Company Act of 1940, as amended (the “1940 Act”) (17 CFR 270.30a-3(c))) are effective, as of a date within 90 days of the filing date of this report that includes the disclosure required by this paragraph, based on their evaluation of the controls and procedures required by Rule 30a-3(b) under the 1940 Act (17 CFR 270.30a-3(b)) and Rules 13a-15(b) or 15d-15 (b) under the Securities Exchange Act of 1934, as amended (the “Exchange Act”) (17 CFR 240.13a-15(b) or 240.15d-15(b)). |
| (b) | | There were no changes in the registrant’s internal control over financial reporting (as defined in Rule 30a-3(d) under the 1940 Act (17 CFR 270.30a-3(d)) that occurred during the period covered by this report that has materially affected, or is reasonably likely to materially affect, the registrant’s internal control over financial reporting. |
| ITEM 12. | DISCLOSURE OF SECURITIES LENDING ACTIVITIES FOR CLOSED-END MANAGEMENT INVESTMENT COMPANIES. |
Not applicable
File the exhibits listed below as part of this Form.
(a)(1) Any code of ethics, or amendment thereto, that is the subject of the disclosure required by Item 2, to the extent that the registrant intends to satisfy the Item 2 requirements through filing of an exhibit: Not applicable because the code is posted on registrant’s website at www.nuveen.com/fund-governance and there were no amendments during the period covered by this report. (To view the code, click on Code of Conduct.)
(a)(2) A separate certification for each principal executive officer and principal financial officer of the registrant as required by Rule 30a-2(a) under the 1940 Act (17 CFR 270.30a-2(a)) in the exact form set forth below: Ex-99.CERT Attached hereto.
(a)(3) Any written solicitation to purchase securities under Rule 23c-1 under the 1940 Act (17 CFR 270.23c-1) sent or given during the period covered by the report by or on behalf of the registrant to 10 or more persons. Not applicable.
(a)(4) Change in the registrant’s independent public accountant. Not applicable.
(b) If the report is filed under Section 13(a) or 15(d) of the Exchange Act, provide the certifications required by Rule 30a-2(b) under the 1940 Act (17 CFR 270.30a-2(b)); Rule 13a-14(b) or Rule 15d-14(b) under the Exchange Act (17 CFR 240.13a-14(b) or 240.15d-14(b)), and Section 1350 of Chapter 63 of Title 18 of the United States Code (18 U.S.C. 1350) as an exhibit. A certification furnished pursuant to this paragraph will not be deemed “filed” for purposes of Section 18 of the Exchange Act (15 U.S.C. 78r), or otherwise subject to the liability of that section. Such certification will not be deemed to be incorporated by reference into any filing under the Securities Act of 1933 or the Exchange Act, except to the extent that the registrant specifically incorporates it by reference. Ex-99.906 CERT attached hereto.
SIGNATURES
Pursuant to the requirements of the Securities Exchange Act of 1934 and the Investment Company Act of 1940, the registrant has duly caused this report to be signed on its behalf by the undersigned, thereunto duly authorized.
(Registrant) Nuveen Floating Rate Income Fund
| | |
| By (Signature and Title) | | /s/ Mark L. Winget |
| | Mark L. Winget |
| | Vice President and Secretary |
Date: October 6, 2021
Pursuant to the requirements of the Securities Exchange Act of 1934 and the Investment Company Act of 1940, this report has been signed below by the following persons on behalf of the registrant and in the capacities and on the dates indicated.
| | |
| By (Signature and Title) | | /s/ David J. Lamb |
| | David J. Lamb |
| | Chief Administrative Officer |
| | (principal executive officer) |
| |
| Date: October 6, 2021 | | |
| |
| By (Signature and Title) | | /s/ E. Scott Wickerham |
| | E. Scott Wickerham |
| | Vice President and Controller |
| | (principal financial officer) |
| |
| Date: October 6, 2021 | | |