Searchable text section of graphics shown above
[GRAPHIC]
[LOGO]
Industry Overview
June 1, 2006
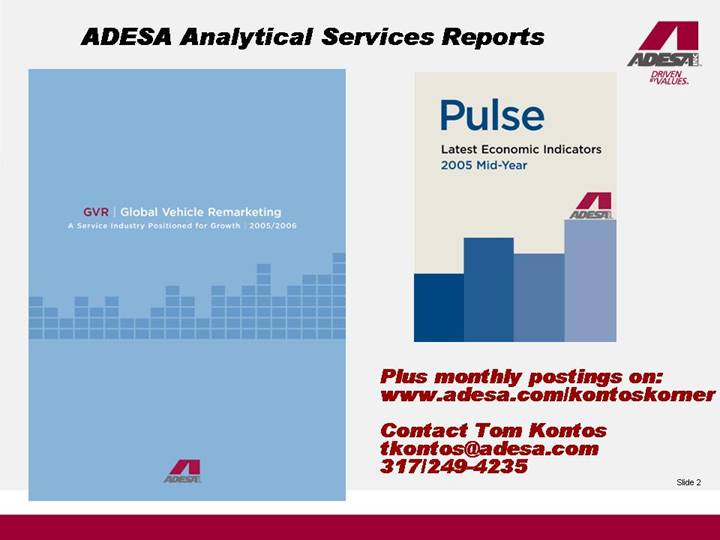
| | ADESA Analytical Services Reports | | [LOGO] |
GVR Global Vehicle Remarketing
A Service Industry Positioned for Growth 2005/2006
[GRAPHIC]
Pulse
Latest Economic Indicators
2005 Mid-Year
[GRAPHIC]
Plus monthly postings on:
www.adesa.com/kontoskorner
Contact Tom Kontos
tkontos@adesa.com
317/249-4235
2
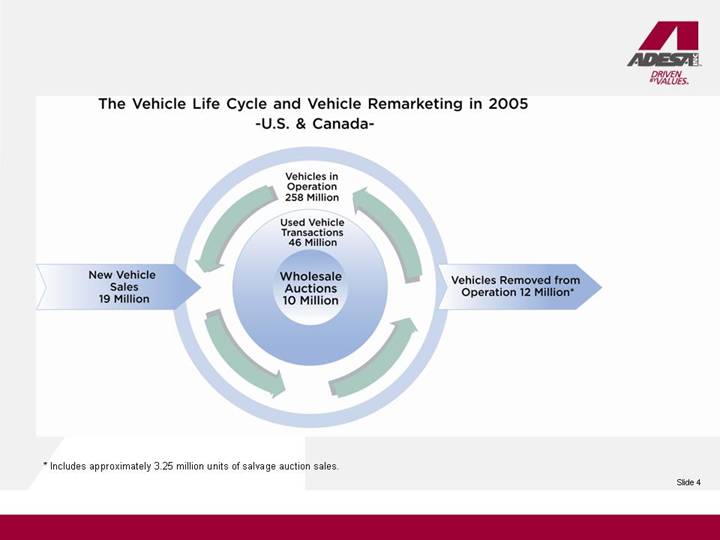
The Vehicle Life Cycle and Vehicle Remarketing in 2005
- -U.S. & Canada-
[GRAPHIC]
* Includes approximately 3.25 million units of salvage auction sales.
4
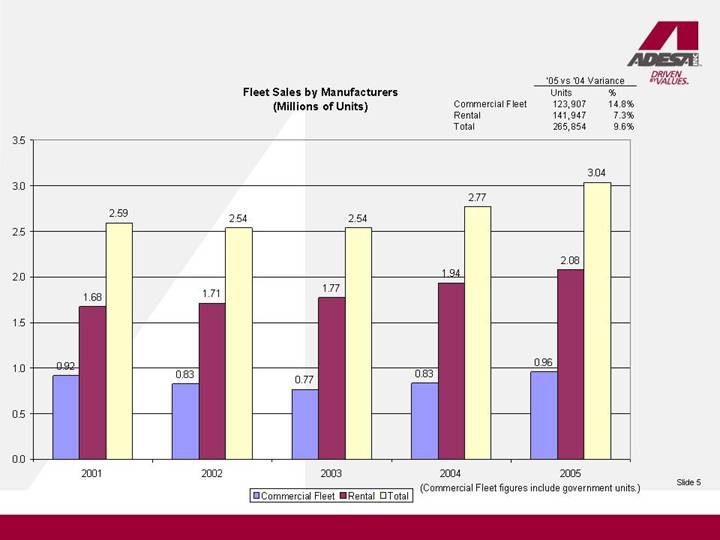
Fleet Sales by Manufacturers
(Millions of Units)
| | ’05 vs ’04 Variance | |
| | Units | | % | |
Commercial Fleet | | 123,907 | | 14.8 | % |
Rental | | 141,947 | | 7.3 | % |
Total | | 265,854 | | 9.6 | % |
[CHART]
5
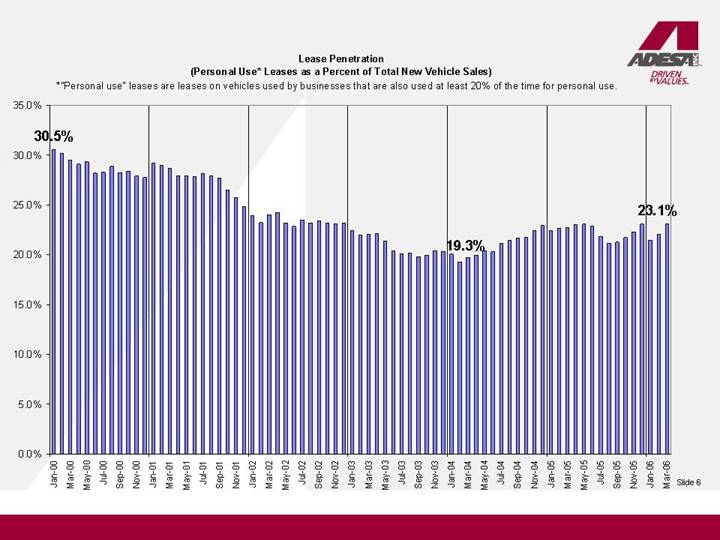
Lease Penetration
(Personal Use* Leases as a Percent of Total New Vehicle Sales)
*“Personal use” leases are leases on vehicles used by businesses that are also used at least 20% of the time for personal use.
[CHART]
6
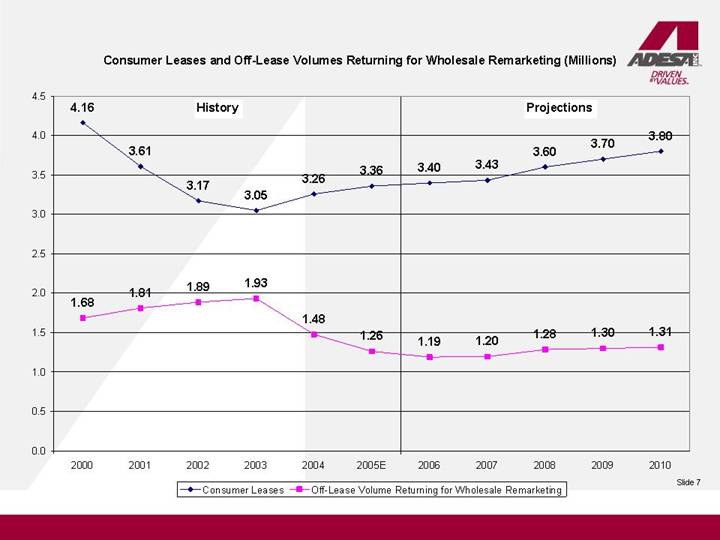
Consumer Leases and Off-Lease Volumes Returning for Wholesale Remarketing (Millions)
[CHART]
7
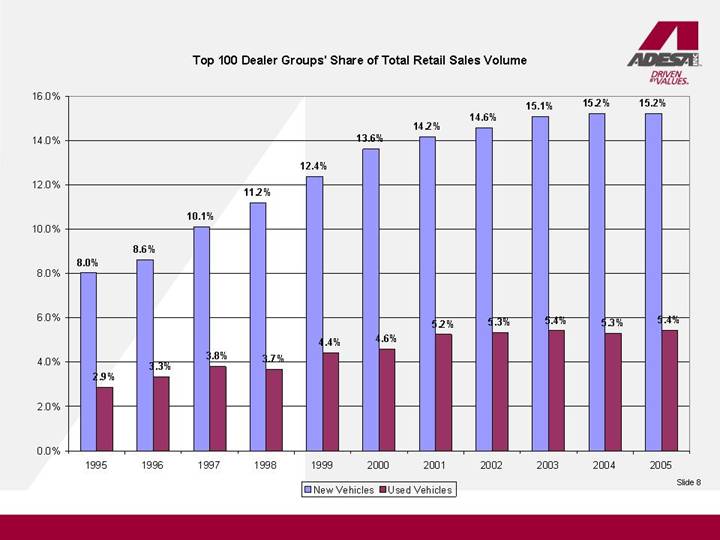
Top 100 Dealer Groups’ Share of Total Retail Sales Volume
[CHART]
8
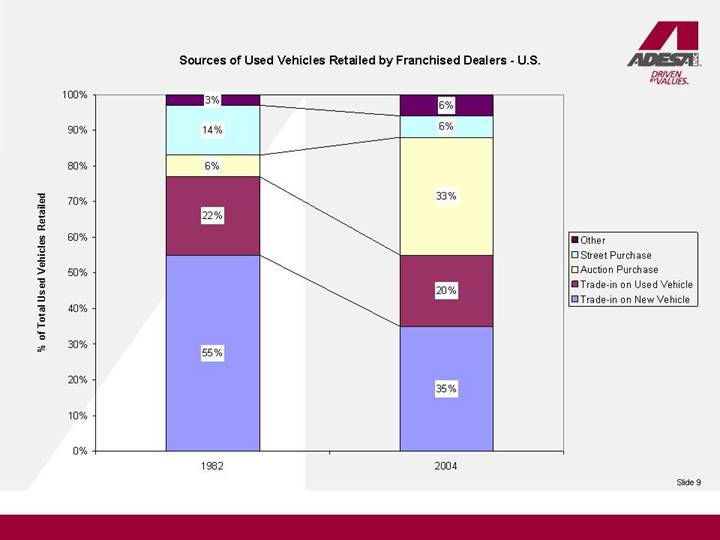
Sources of Used Vehicles Retailed by Franchised Dealers - U.S.
[CHART]
9
Current Market Conditions
10
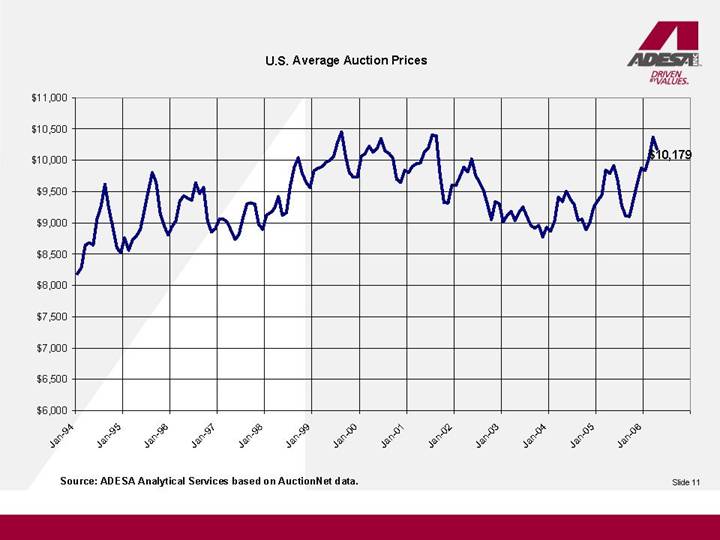
U.S. Average Auction Prices
[CHART]
Source: ADESA Analytical Services based on AuctionNet data.
11
Year-on-Year % Change in Average AuctionNet Price by Model Class - April 2006
[CHART]
12
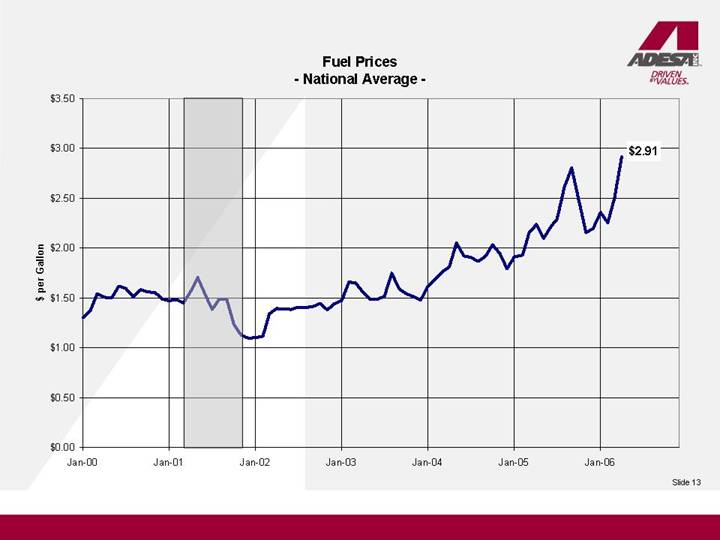
Fuel Prices
- National Average -
[CHART]
13
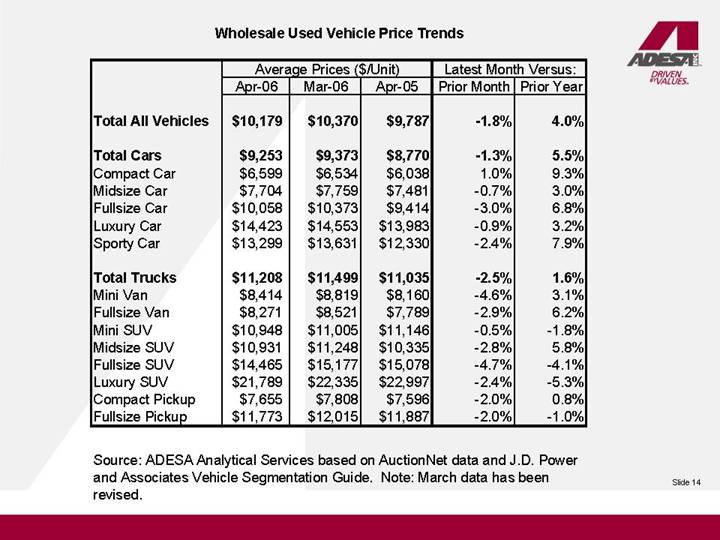
Wholesale Used Vehicle Price Trends
| | Average Prices ($/Unit) | | Latest Month Versus: | |
| | Apr-06 | | Mar-06 | | Apr-05 | | Prior Month | | Prior Year | |
| | | | | | | | | | | |
Total All Vehicles | | $ | 10,179 | | $ | 10,370 | | $ | 9,787 | | -1.8 | % | 4.0 | % |
| | | | | | | | | | | |
Total Cars | | $ | 9,253 | | $ | 9,373 | | $ | 8,770 | | -1.3 | % | 5.5 | % |
Compact Car | | $ | 6,599 | | $ | 6,534 | | $ | 6,038 | | 1.0 | % | 9.3 | % |
Midsize Car | | $ | 7,704 | | $ | 7,759 | | $ | 7,481 | | -0.7 | % | 3.0 | % |
Fullsize Car | | $ | 10,058 | | $ | 10,373 | | $ | 9,414 | | -3.0 | % | 6.8 | % |
Luxury Car | | $ | 14,423 | | $ | 14,553 | | $ | 13,983 | | -0.9 | % | 3.2 | % |
Sporty Car | | $ | 13,299 | | $ | 13,631 | | $ | 12,330 | | -2.4 | % | 7.9 | % |
| | | | | | | | | | | |
Total Trucks | | $ | 11,208 | | $ | 11,499 | | $ | 11,035 | | -2.5 | % | 1.6 | % |
Mini Van | | $ | 8,414 | | $ | 8,819 | | $ | 8,160 | | -4.6 | % | 3.1 | % |
Fullsize Van | | $ | 8,271 | | $ | 8,521 | | $ | 7,789 | | -2.9 | % | 6.2 | % |
Mini SUV | | $ | 10,948 | | $ | 11,005 | | $ | 11,146 | | -0.5 | % | -1.8 | % |
Midsize SUV | | $ | 10,931 | | $ | 11,248 | | $ | 10,335 | | -2.8 | % | 5.8 | % |
Fullsize SUV | | $ | 14,465 | | $ | 15,177 | | $ | 15,078 | | -4.7 | % | -4.1 | % |
Luxury SUV | | $ | 21,789 | | $ | 22,335 | | $ | 22,997 | | -2.4 | % | -5.3 | % |
Compact Pickup | | $ | 7,655 | | $ | 7,808 | | $ | 7,596 | | -2.0 | % | 0.8 | % |
Fullsize Pickup | | $ | 11,773 | | $ | 12,015 | | $ | 11,887 | | -2.0 | % | -1.0 | % |
Source: ADESA Analytical Services based on AuctionNet data and J.D. Power and Associates Vehicle Segmentation Guide. Note: March data has been revised.
14
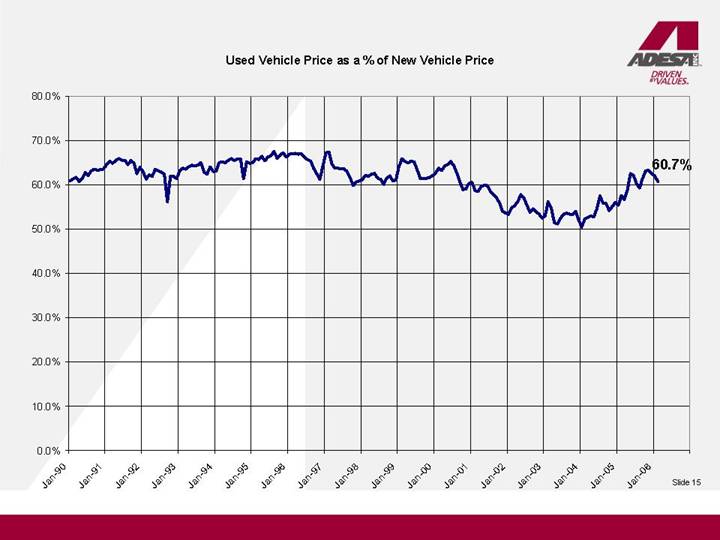
Used Vehicle Price as a % of New Vehicle Price
[CHART]
15
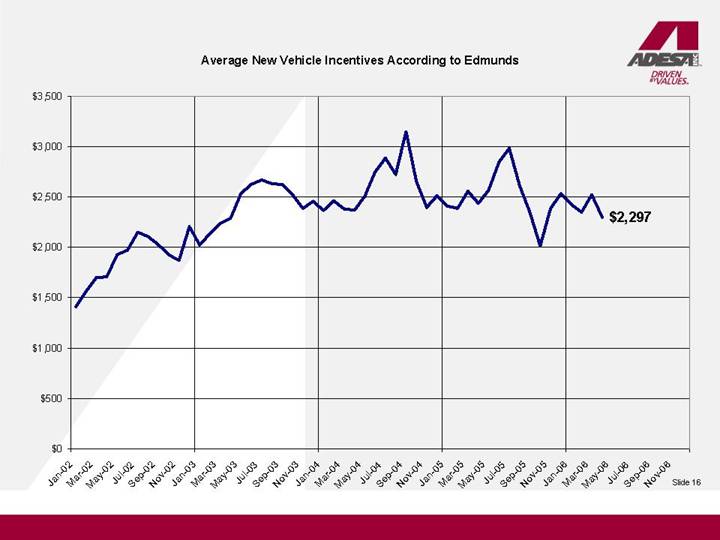
Average New Vehicle Incentives According to Edmunds
[CHART]
16
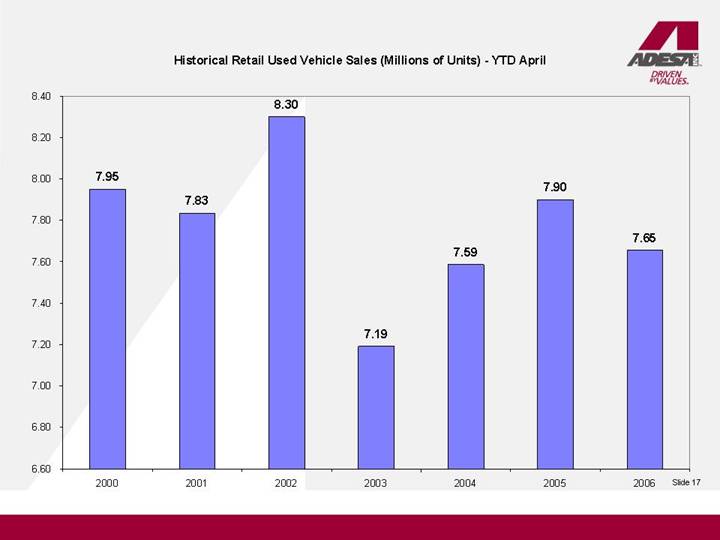
Historical Retail Used Vehicle Sales (Millions of Units) - YTD April
[CHART]
17
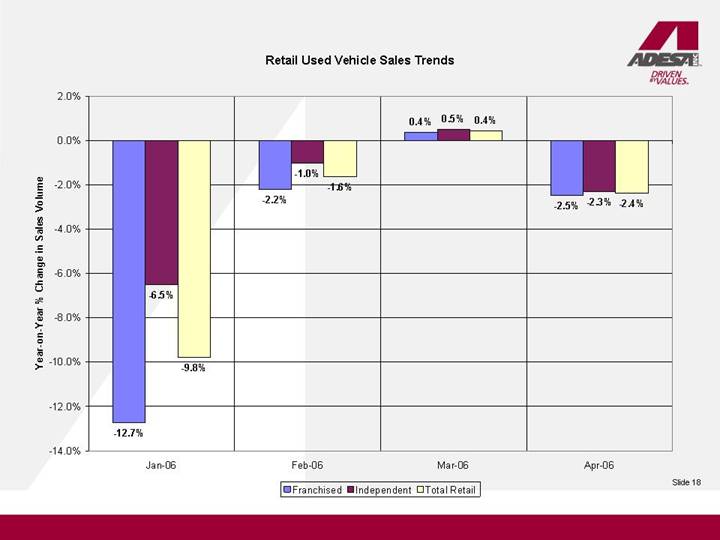
Retail Used Vehicle Sales Trends
[CHART]
18
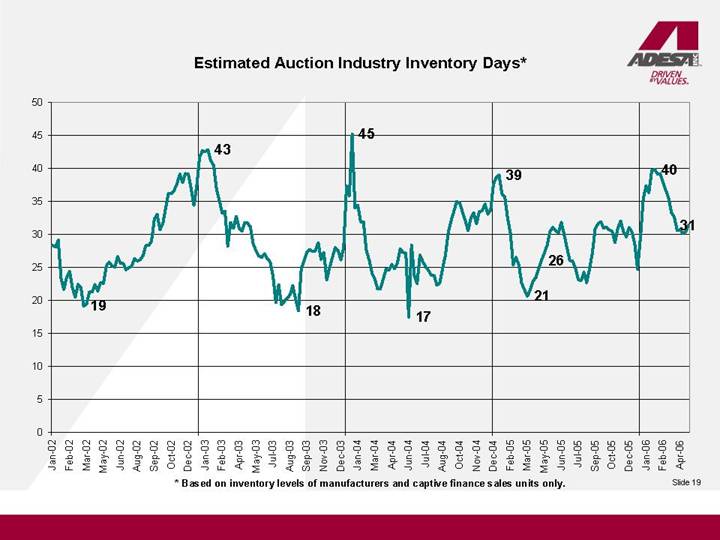
Estimated Auction Industry Inventory Days*
[CHART]
* Based on inventory levels of manufacturers and captive finance sales units only.
19
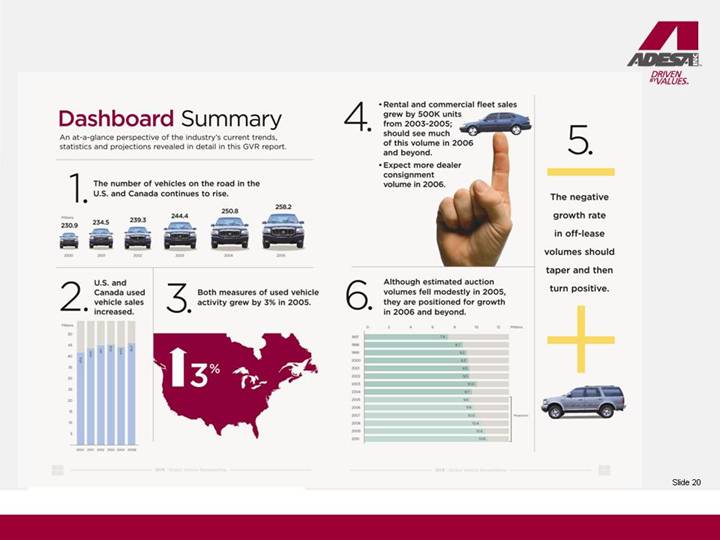
Dashboard Summary
An at-a-glance perspective of the industry’s current trends, statistics and projections revealed in detail in this GVR report.
1. | | The number of vehicles on the road in the U.S. and Canada continues to rise. | | 4. | | • Rental and commercial fleet sales grew by 500k units from 2003-2005; should see much of this volume in 2006 and beyond. • Expect more dealer consignment volume in 2006. | | 5. The negative growth rate in off-lease volumes should taper and then turn positive |
| | | | | | | | |
| | [GRAPHIC] | | | | [GRAPHIC] | | [GRAPHIC] |
| | | | | | | | |
2. | | U.S. and Canada used vehicle sales increased. | | 3. | | Both measures of used vehicle activity grew by 3% in 2005. | | 6. | | Although estimated auction volumes fell modestly in 2005, they are positioned for growth in 2006 and beyond. | | |
| | | | | | | | | | | | |
| | [CHART] | | | | [GRAPHIC] | | | | [CHART] | | |
20
In Summary:
[GRAPHIC]
• VIO, off-fleet, off-lease, and dealer consignment trends appear positive for future auction volumes.
• Retail market started the year soft, but VIO churn and hurricane replacement should support solid retail sales for remainder of 2006.
• Prices should stabilize, around typical seasonal fluctuations.
21