Searchable text section of graphics shown above
[GRAPHIC]
[LOGO]
Auction Services Group
Used Vehicle Auctions
June 1, 2006
Forward-Looking Statements | | [LOGO] |
This presentation includes forward-looking statements within the meaning of the Private Securities Litigation Reform Act of 1995. Such statements, including statements regarding anticipated financial results, the Company’s competitive position, capital deployment priorities and growth opportunities are subject to certain risks, trends, and uncertainties that could cause actual results to differ materially from those projected, expressed or implied by such forward-looking statements. The statements are based on assumptions about important factors, including general business conditions; market trends; competition; weather; vehicle production; trends in new and used vehicle sales; business development activities, including acquisitions; economic conditions, including exchange rate and interest rate fluctuations; litigation developments; and the other risk factors described in the Company’s Annual Report on Form 10-K, and other risks described from time to time in the Company’s filings with the Securities and Exchange Commission. Many of these risk factors are outside of the Company’s control, and as such, they involve risks which are not currently known to the Company that could cause actual results to differ materially from forecasted results. Any forward-looking statements in this presentation are made as of the date hereof and the Company does not undertake to update its forward-looking statements.
2
• Brad Todd, President – Auction Services Group
• Paul Lips, SVP Operations
• Q & A
3
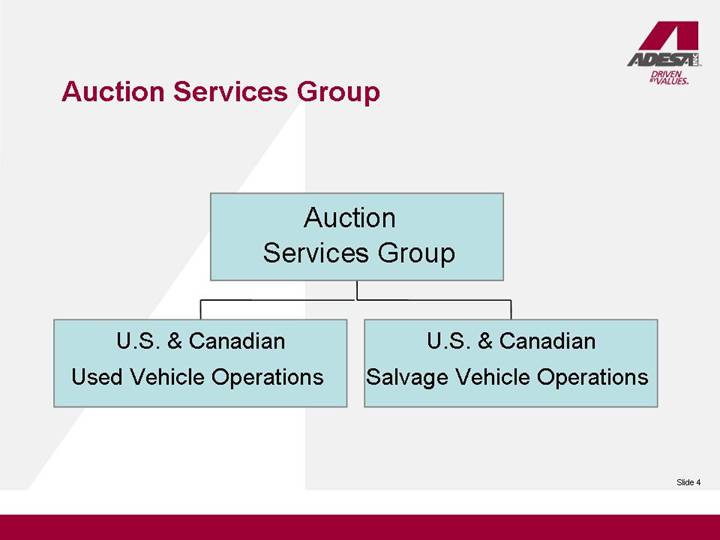
Auction Services Group
Auction
Services Group |
| | |
U.S. & Canadian
Used Vehicle Operations | | U.S. & Canadian
Salvage Vehicle Operations |
4
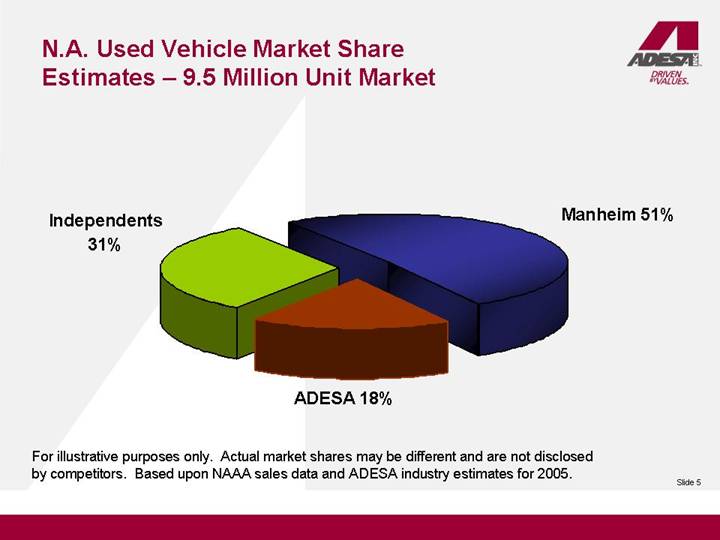
N.A. Used Vehicle Market Share
Estimates – 9.5 Million Unit Market
[CHART]
For illustrative purposes only. Actual market shares may be different and are not disclosed by competitors. Based upon NAAA sales data and ADESA industry estimates for 2005.
5
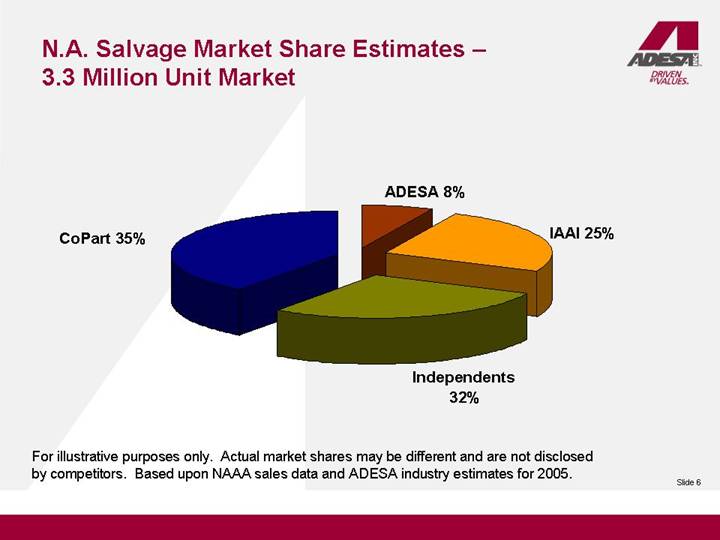
N.A. Salvage Market Share Estimates –
3.3 Million Unit Market
[CHART]
For illustrative purposes only. Actual market shares may be different and are not disclosed by competitors. Based upon NAAA sales data and ADESA industry estimates for 2005.
6
Optimistic Industry Outlook
• North American “VIO” up 3% in 2005 to 258M units
• Used vehicle prices up year-over-year
• Rental & commercial fleet sales up 10% in 2005
• Off-lease volumes in 2006 at inflection point
• Anticipate institutional volume increase in 2007
• Increasing dealer consignment volume
8
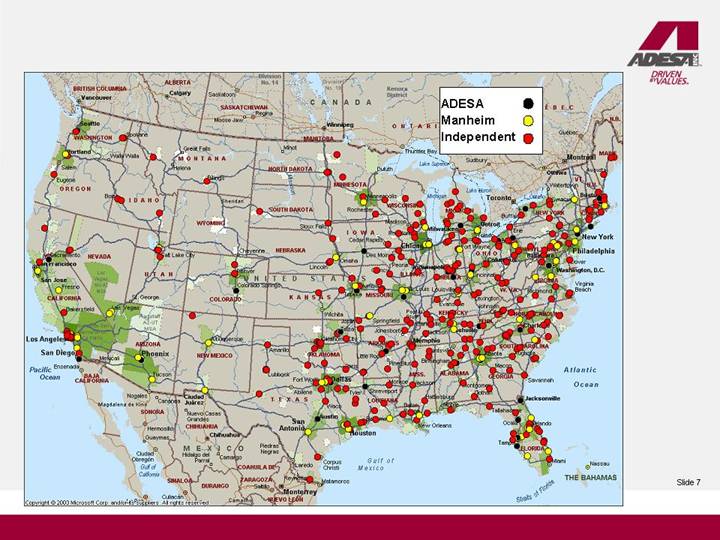
Used Vehicle Auctions Overview
• 54 locations (8 combo facilities with salvage)
• 40 United States
• 13 Canada
• 1 Mexico
• Wholesale consignment auctions
• Minimal inventory risk
• 2nd largest North American auction provider
• 18% share of auction market (>70% share in Canada)
• Independent auctions control 31% of market
• Approximately 160 locations
• Over 2.5 million vehicles sold
[GRAPHIC]
9
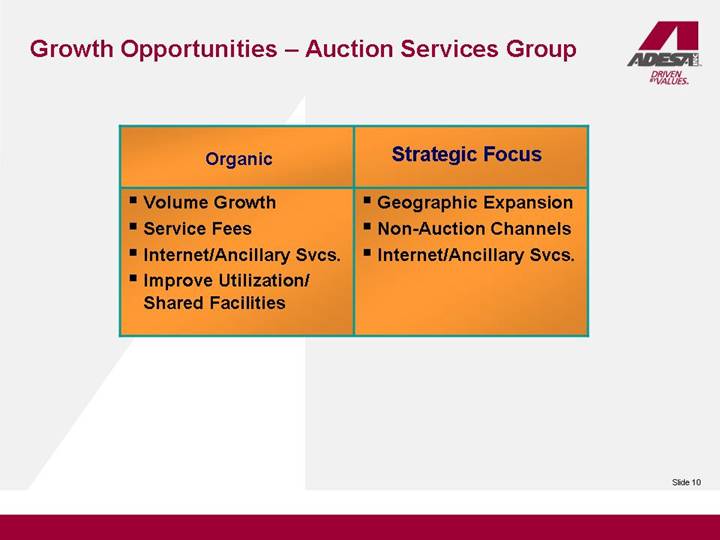
Growth Opportunities – Auction Services Group
Organic | | Strategic Focus |
• Volume Growth | | • Geographic Expansion |
• Service Fees | | • Non-Auction Channels |
• Internet/Ancillary Svcs. | | • Internet/Ancillary Svcs. |
• Improve Utilization/ | | |
Shared Facilities | | |
10
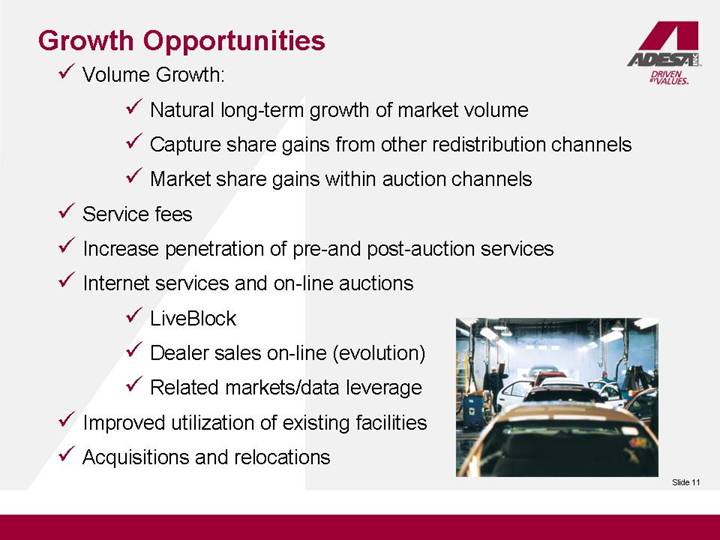
Growth Opportunities
• Volume Growth:
• Natural long-term growth of market volume
• Capture share gains from other redistribution channels
• Market share gains within auction channels
• Service fees
• Increase penetration of pre-and post-auction services
• Internet services and on-line auctions
• LiveBlock
• Dealer sales on-line (evolution)
• Related markets/data leverage
• Improved utilization of existing facilities
• Acquisitions and relocations
[GRAPHIC]
11
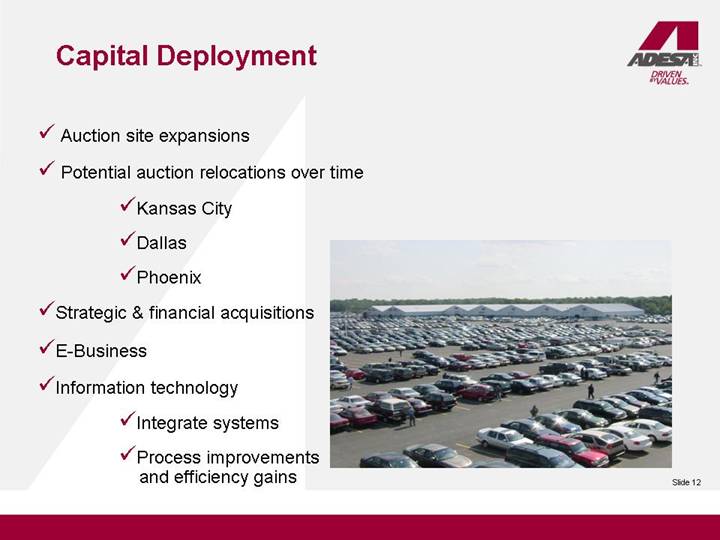
Capital Deployment
• Auction site expansions
• Potential auction relocations over time
• Kansas City
• Dallas
• Phoenix
• Strategic & financial acquisitions
• E-Business
• Information technology
• Integrate systems
• Process improvements and efficiency gains
[GRAPHIC]
12
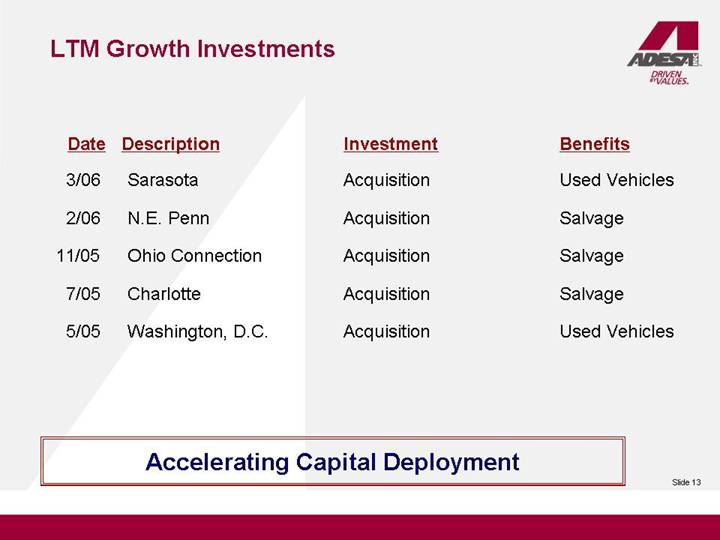
LTM Growth Investments
Date | | Description | | Investment | | Benefits | |
3/06 | | | Sarasota | | Acquisition | | Used Vehicles | |
2/06 | | | N.E. Penn | | Acquisition | | Salvage | |
11/05 | | | Ohio Connection | | Acquisition | | Salvage | |
7/05 | | | Charlotte | | Acquisition | | Salvage | |
5/05 | | | Washington, D.C. | | Acquisition | | Used Vehicles | |
Accelerating Capital Deployment
13
• Brad Todd, President – Auction Services Group
• Paul Lips, SVP Operations
• Q & A
14
Diverse Sources of Revenue - Auctions
Pre-Auction Services | 
| Revenue Per Vehicle Sold* |
• Detail | |
• Inspection (AutoVIN) | [CHART] |
• Transportation | |
• Body work and PDR | |
• Mechanical | |
• Certification | |
• Remarketing and Titling | |
| |
Auction Services | Growing Revenue Per Vehicle |
• Buy and sell | |
• Entry, no sale and rerun | |
• Late title, drafts, and administrative | |
• Titling and marshalling | Diverse revenue sources |
| facilitate selective price |
Post-Auction Services | increases |
• Inspection | |
• Transportation | |
• Arbitration |
* Restated to exclude the revenues of Comsearch, Inc. which was sold in the third quarter of 2005.
Includes Used Vehicle, Salvage Auctions and Related Services
15
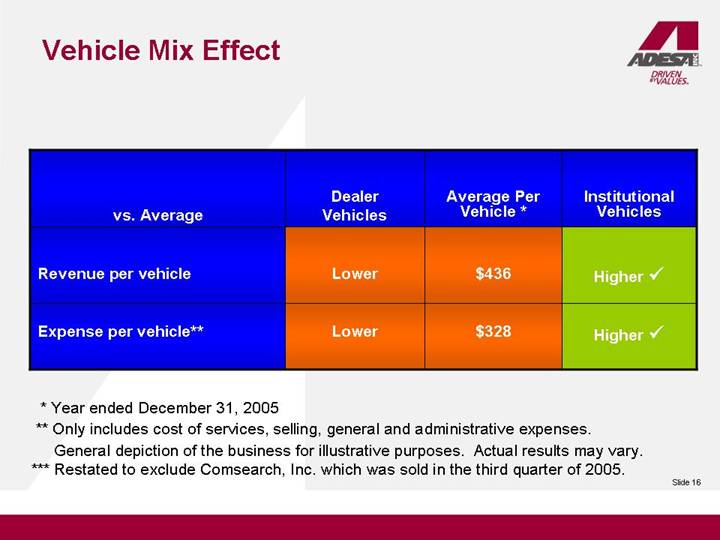
Vehicle Mix Effect
vs. Average | | Dealer
Vehicles | | Average Per
Vehicle * | | Institutional
Vehicles | |
Revenue per vehicle | | Lower | | $ | 436 | | Higher  | |
Expense per vehicle** | | Lower | | $ | 328 | | Higher  | |
* | | Year ended December 31, 2005 |
** | | Only includes cost of services, selling, general and administrative expenses.
General depiction of the business for illustrative purposes. Actual results may vary. |
*** | | Restated to exclude Comsearch, Inc. which was sold in the third quarter of 2005. |
16
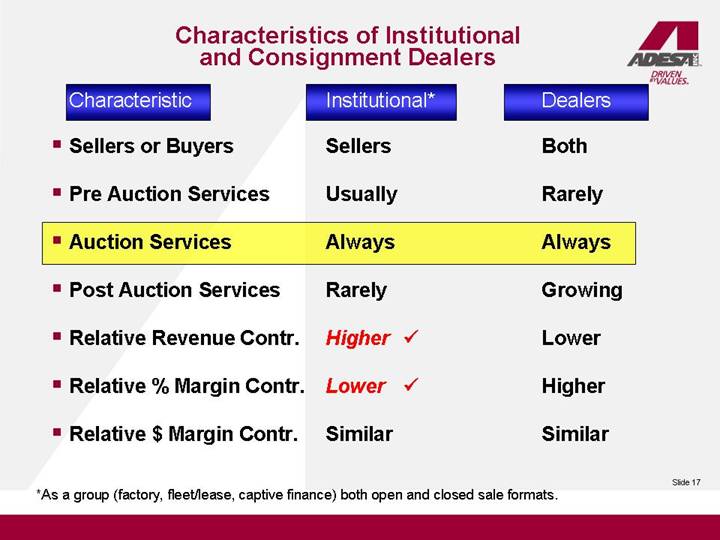
Characteristics of Institutional and Consignment Dealers
Characteristic | | Institutional* | | Dealers | |
| | | | | |
• Sellers or Buyers | | Sellers | | Both | |
| | | | | |
• Pre Auction Services | | Usually | | Rarely | |
| | | | | |
• Auction Services | | Always | | Always | |
| | | | | |
• Post Auction Services | | Rarely | | Growing | |
| | | | | |
• Relative Revenue Contr. | | Higher | | Lower | |
| | | | | |
• Relative % Margin Contr. | | Lower | | Higher | |
| | | | | |
• Relative $ Margin Contr. | | Similar | | Similar | |
*As a group (factory, fleet/lease, captive finance) both open and closed sale formats.
17
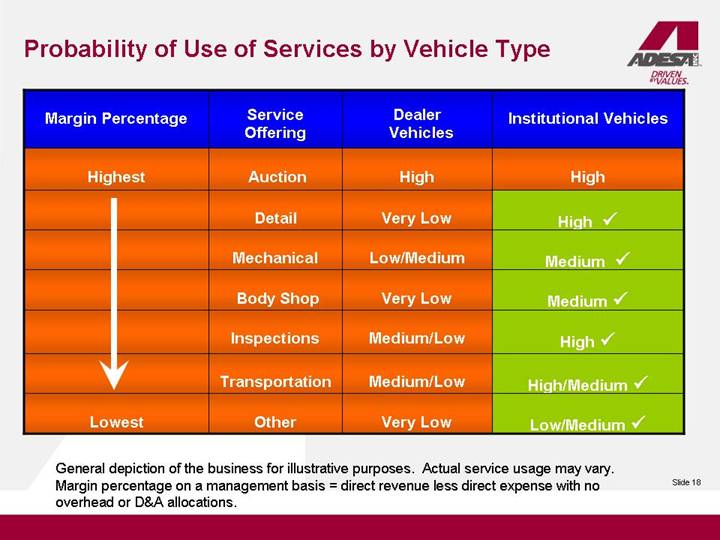
Probability of Use of Services by Vehicle Type
Margin Percentage | | Service
Offering | | Dealer
Vehicles | | Institutional Vehicles | |
| | | | | | | |
Highest | | Auction | | High | | High | |
| | Detail | | Very Low | | High | |
| | Mechanical | | Low/Medium | | Medium | |
| | Body Shop | | Very Low | | Medium | |
| | Inspections | | Medium/Low | | High | |
| | Transportation | | Medium/Low | | High/Medium | |
Lowest | | Other | | Very Low | | Low/Medium | |
General depiction of the business for illustrative purposes. Actual service usage may vary. Margin percentage on a management basis = direct revenue less direct expense with no overhead or D&A allocations.
18
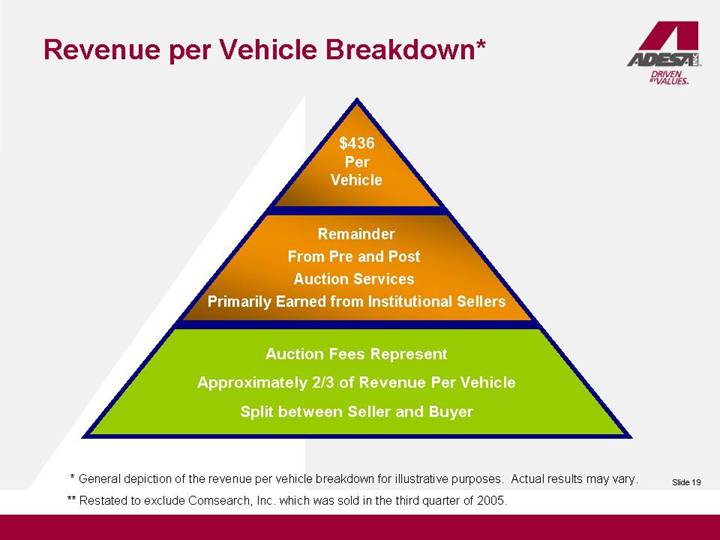
Revenue per Vehicle Breakdown*
$436
Per
Vehicle
Remainder
From Pre and Post
Auction Services
Primarily Earned from Institutional Sellers
Auction Fees Represent
Approximately 2/3 of Revenue Per Vehicle
Split between Seller and Buyer
* | | General depiction of the revenue per vehicle breakdown for illustrative purposes. Actual results may vary. |
** | | Restated to exclude Comsearch, Inc. which was sold in the third quarter of 2005. |
19
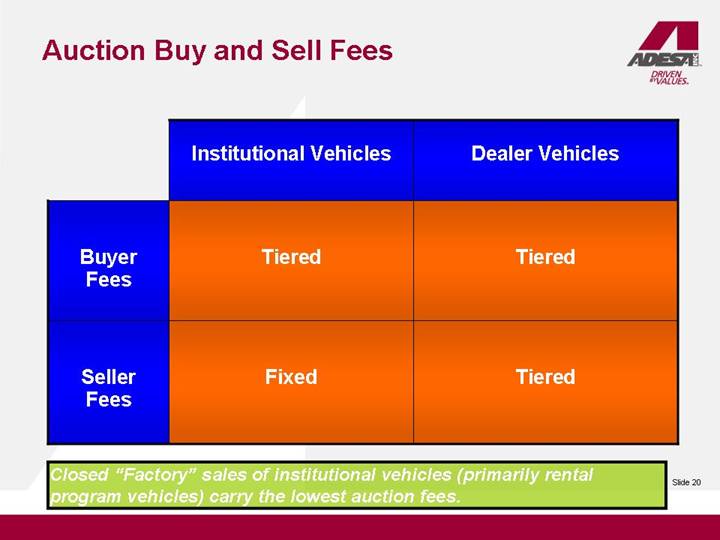
Auction Buy and Sell Fees
| | Institutional Vehicles | | Dealer Vehicles | |
Buyer Fees | | Tiered | | Tiered | |
Seller Fees | | Fixed | | Tiered | |
Closed “Factory” sales of institutional vehicles (primarily rental program vehicles) carry the lowest auction fees.
20
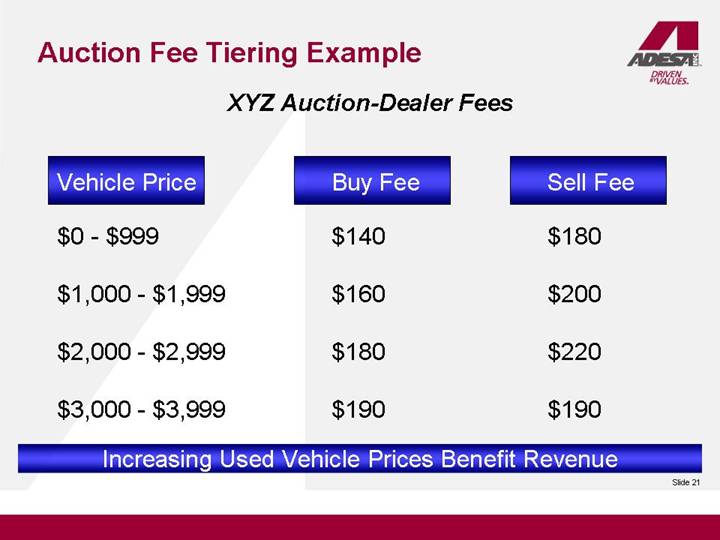
Auction Fee Tiering Example
XYZ Auction-Dealer Fees
Vehicle Price | | Buy Fee | | Sell Fee | |
$0 - $999 | | $ | 140 | | $ | 180 | |
$1,000 - $1,999 | | $ | 160 | | $ | 200 | |
$2,000 - $2,999 | | $ | 180 | | $ | 220 | |
$3,000 - $3,999 | | $ | 190 | | $ | 190 | |
Increasing Used Vehicle Prices Benefit Revenue
21
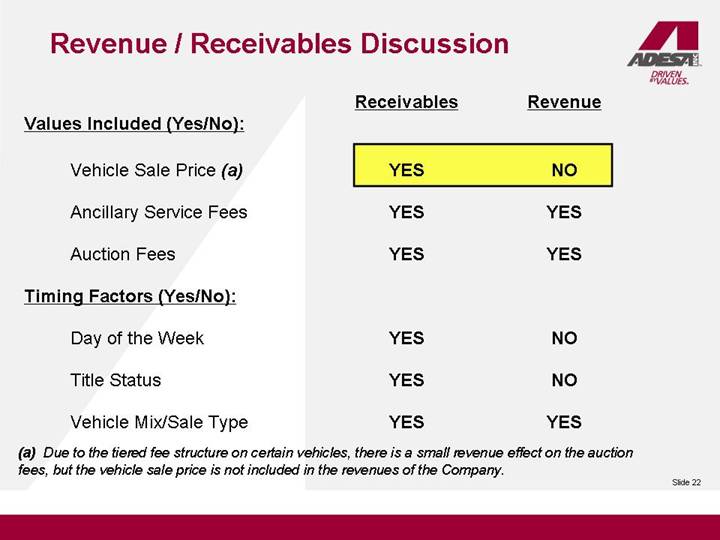
Revenue / Receivables Discussion
| | Receivables | | Revenue | |
Values Included (Yes/No): | | | | | |
| | | | | |
Vehicle Sale Price (a) | | YES | | NO | |
| | | | | |
Ancillary Service Fees | | YES | | YES | |
| | | | | |
Auction Fees | | YES | | YES | |
| | | | | |
Timing Factors (Yes/No): | | | | | |
| | | | | |
Day of the Week | | YES | | NO | |
| | | | | |
Title Status | | YES | | NO | |
| | | | | |
Vehicle Mix/Sale Type | | YES | | YES | |
(a) Due to the tiered fee structure on certain vehicles, there is a small revenue effect on the auction fees, but the vehicle sale price is not included in the revenues of the Company.
22
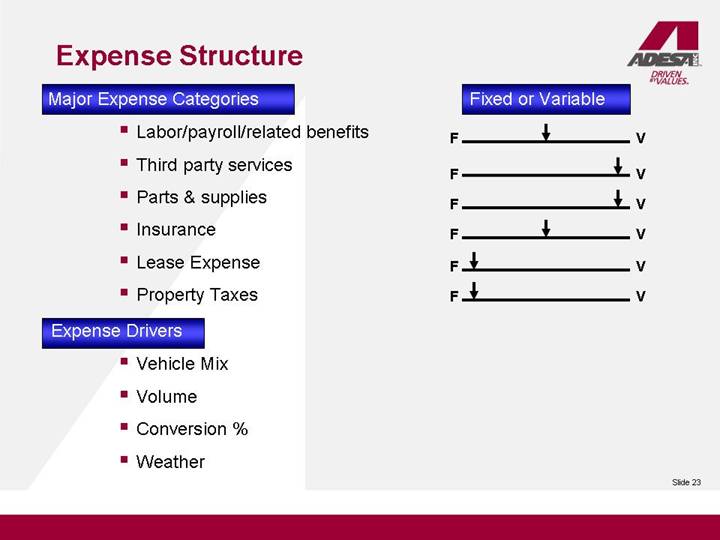
Expense Structure
| | Fixed or Variable | |
Major Expense Categories | | | |
• Labor/payroll/related benefits | | F | | â | | V | |
• Third party services | | F | | | â | V | |
• Parts & supplies | | F | | | â | V | |
• Insurance | | F | | â | | V | |
• Lease Expense | | F | â | | | V | |
• Property Taxes | | F | â | | | V | |
Expense Drivers | | | | | | | |
• Vehicle Mix | | | | | | | |
• Volume | | | | | | | |
• Conversion % | | | | | | | |
• Weather | | | | | | | |
23
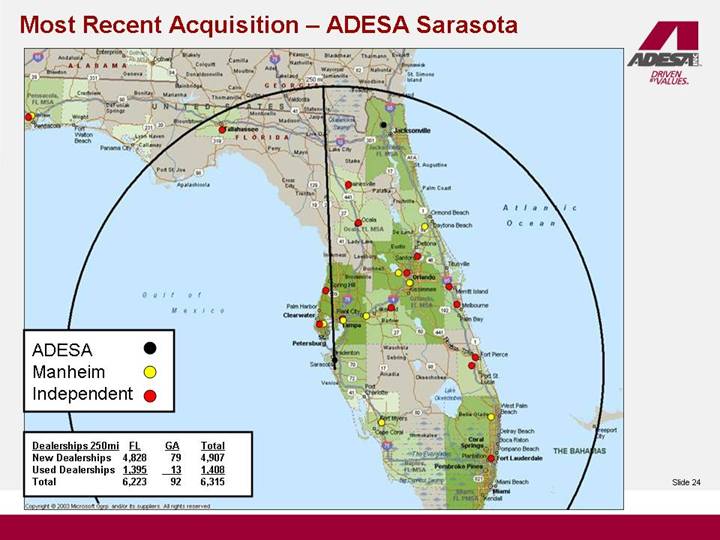
Most Recent Acquisition – ADESA Sarasota
[GRAPHIC]
24
Most Recent Acquisition – ADESA Sarasota
• Approximately 200 employees
• Established operation in a growth market
• Institutional customer base; Strong dealer business
• Strategic fit with other ADESA locations in Florida
• Opportunity for efficiency and revenue gains
• Facility
• 63 acres / 6 auction lanes / full reconditioning
• Asset deal / owned facility
25
Acquisition Integration Process
• On-site visits during due diligence—operations and finance
• Meet with local management prior to closing (if possible)
• Acquisition integration team on the ground 24 hours prior to closing
• Detailed checklists by functional area in hand
• Due diligence information reviewed prior to closing
• Timeline for integration in hand
• Senior executive of ADESA meeting with all employees
• Integration typically lasts 2-4 weeks
• System conversion typically completed in 12-16 weeks
26
Auction Summary
• Track record of profitable growth
• Comprehensive service offering with minimal inventory risk
• Customer Dynamics:
• Significant institutional volumes
• Diverse buyer base
• No one seller accounts for 10% or more of revenue
• Broad geographic coverage
• Close to large populations of dealers
• Leveraging technology for efficiency, profitability and volume gains
• Opportunity for accretive acquisitions
27
• Brad Todd, President – Auction Services Group
• Paul Lips, SVP Operations
• Q & A
28