UNITED STATES
SECURITIES AND EXCHANGE COMMISSION
Washington, D.C. 20549
FORM N-CSR
CERTIFIED SHAREHOLDER REPORT OF REGISTERED
MANAGEMENT INVESTMENT COMPANIES
Investment Company Act file number: 811-21580
CORTINA FUNDS, INC.
(Exact name of registrant as specified in charter)
825 N. Jefferson St., Suite 400, Milwaukee, WI 53202
(Address of principal executive offices) (Zip code)
(414) 397-1629
Registrant’s telephone number, including area code
Lori Hoch
825 N. Jefferson St., Suite 400
Milwaukee, WI 53202
(Name and address of agent for service)
Date of fiscal year end: June 30
Date of reporting period: July 1, 2011 - December 31, 2011
Item 1. Reports to Stockholders.
The following is a copy of the report to shareholders pursuant to Rule 30e-1 under the Investment Company Act of 1940 (17 CFR 270.30e-1).
TA B L E O F C O N T E N T S
| | |
 | | Shareholder Letter |
| Cortina Small Cap Growth Fund | | December 31, 2011 (Unaudited) |
DEAR FELLOW SHAREHOLDERS:
The fourth calendar quarter of 2011 is the inaugural quarter for the Cortina Small Cap Growth Fund. The stock market traveled a wild and unpredictable road in 2011 and the year’s final quarter did not deviate. Macroeconomic woes across the globe had been weighing on investment performance coming into October, but better economic reports and releases initiated the handoff from skepticism and doubt to optimism and hopefulness, which resulted in strong performance to close the year.
The Fund’s results in the fourth quarter were led by solid absolute and relative performance from the Information Technology sector. Consumer technology product cycles, most notably those coming from Apple, Inc., continued to drive demand. This was heightened during the holiday shopping rush. The Apple portfolio of devices is revolutionizing how technology is used in the lives of consumers and businesses alike. As small cap investors, we cannot invest in Apple shares; however, we are positioned in holdings that stand to benefit from the growth in smart phones and other connected devices. Another major influence in the blistering performance of the Tech sector was a flurry of acquisitions. The Fund benefitted directly from two tech company acquisitions in the quarter—RightNow Technologies and Demand Tec—and indirectly from several other high-profile deals that put a charge into the sector at large. With the economy at a crossroads, confidence improving and corporate balance sheets generally in solid shape, the conditions are right for more merger and acquisition activity. Since the motives behind the deals are more strategic than financial, at present, smaller companies should continue having increased involvement as takeover targets.
Balancing the Fund’s robust returns in the Technology sector, security selection within the Consumer Discretionary sector weighed on portfolio performance. Given the importance of the holiday selling season to annual earnings, stocks within the Consumer Discretionary sector are often volatile in the fourth quarter. Shutterfly, Inc. was hit particularly hard as aggressive pricing by competitors led to lower earnings estimates. Shares of Crocs, Inc. also suffered following a negative earnings preannouncement by the company early in the quarter. Investors have long memories and feared that this could signal a repeat of the troubles that beset the company in the fall of 2007. Considering the difference behind this recent disappointment, we do not share that viewpoint. In 2007, the company had excessive inventory relative to demand, whereas the disappointment in October was in part due to insufficient inventory relative to demand.
Heading into the new year, odds are that many industries that constitute a meaningful part of the backbone of the U.S. economy will improve. The housing, auto, manufacturing and banking industries enter 2012 with high prospects for improvement. Should these expectations manifest themselves, the primary constituent that ultimately determines the strength of the economy—employment—should enjoy a commensurate revival. While we are cognizant of these factors, we will continue to construct the portfolio from the bottom up by seeking innovative growth companies with strong underlying fundamentals that we believe can succeed in a variety of economic backdrops. We will utilize our thematic investment process and aggressive company meeting schedule to identify promising ideas before they can be discovered through quantitative or more passive means. Lastly, we will continue to place a heavy emphasis on managing the risk within the portfolio.
Investing involves risks, including loss of principal.
| | | | |
Semi-Annual Report | December 31, 2011 | | | 1 | |
| | |
| | Portfolio Information |
| Cortina Small Cap Growth Fund | | December 31, 2011 (Unaudited) |
Growth of $10,000 Investment (Unaudited)
For the period from September 30, 2011 (Inception) to December 31, 2011.
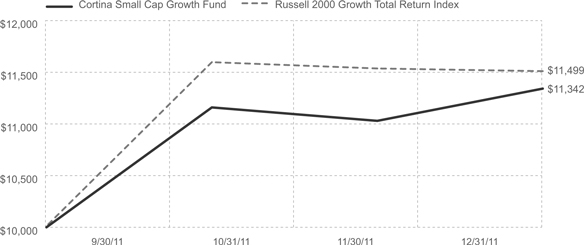
This graph assumes an initial $10,000 investment at September 30, 2011 (Inception Date). The Cortina Small Cap Growth Fund (the “Fund”) will deduct a 2.00% redemption proceeds fee on Fund shares held 60 days or less. This graph depicts the performance of the Fund versus the Russell 2000 Growth Total Return Index. It is important to note the Fund is a professionally managed mutual fund while the indices are not available for investment and are unmanaged. The comparison is shown for illustrative purposes only.
The Fund is new and has limited operating history. Funds that emphasize investments in smaller companies generally experience greater price volatility.
Performance Returns for the period ended December 31, 2011
| | | | |
| | | Since Inception* | | Gross Expense Ratio** |
Cortina Small Cap Growth Fund | | 13.42% | | 3.09% |
Russell 2000 Growth Total Return Index | | 14.99% | | |
| * | The Fund’s inception date is September 30, 2011. |
| ** | Cortina Asset Management, LLC (“Adviser”) has contractually agreed to waive management fees and/or reimburse the Fund’s operating expenses in order to limit the Fund’s total annual fund operating expenses to 1.10% of average daily net assets of the Fund. The agreement will continue in effect at least through December 31, 2012, subject thereafter to annual re-approval of the agreement by the Fund’s Board of Directors. |
Past performance does not guarantee future results. The performance data quoted represents past performance and current returns may be lower or higher. Total return figures include change in share price, reinvestment of dividends and capital gains. The investment return and principal value will fluctuate so that an investor’s shares, when redeemed may be worth more or less than their original cost. To obtain performance information current to the most recent month end, call 1-855-612-3936.
Russell 2000 Total Return Index measures the performance of the small-cap growth segment of the U.S. equity universe. It includes those Russell 2000 companies with higher price-to-value ratios and higher forecasted growth values. All indices are unmanaged. It is not possible to invest directly in an index.
Sector Allocations
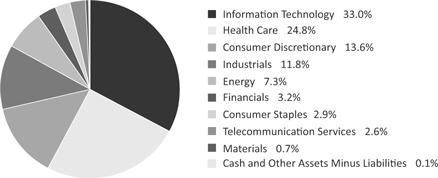
| | |
2 | | 1-855-612-3936 | www.cortinafunds.com |
| | |
| | Shareholder Letter |
| Cortina Small Cap Value Fund | | December 31, 2011 (Unaudited) |
DEAR FELLOW SHAREHOLDERS:
The fourth quarter of 2011 capped off a tumultuous year in the financial markets, and marked the first full quarter for the Cortina Small Cap Value Fund. We were pleased to see the equity markets rebound from the challenges faced in the summer months.
The Producer Durables sector was the most meaningful contributor to the Fund’s performance. On a company-specific basis, Greenbrier, a rail car manufacturer, Nara Bancorp and Boston Private Financial all rebounded strongly from depressed valuations, while Acco Brands, an office products company, and RSC Equipment Rental both added material gains to the Fund’s performance due to those companies’ merger and acquisition activity. Stock selection within the Energy sector was an added contributor.
On the negative side, stock selection within the Consumer Discretionary and Health Care sectors was a negative factor, as disappointing results from both Maidenform and Hanger Orthopedic detracted from the Fund’s performance.
Although the volatility in financial markets is daunting, it is often a reasonable reflection of changing facts on the ground. While we study the past for clues to the future, we also believe reversion to the mean is not a given. As a result, in evaluating each investment position, we are very cautious in the use of companies’ past results, trends and valuations, as many industries are changing structurally. However, change creates opportunity.
The cornerstone of our philosophy and process is evolution. We seek out companies that are changing for the better. Usually these changes are underappreciated by Wall Street, and our rigorous company-specific, bottom-up approach for each investment prospect enables us to see through short-term challenges and focus on long-term opportunity. In that light, we continue to seek, and find, companies whose securities are underappreciated by the majority of investors.
Our outlook for the year is one of cautious optimism. Certain economic indicators are trending in positive directions, with many companies posting record profits and reinvesting internally. The Fund’s investments are focused upon those companies that are evolving in positive directions, trade at reasonable valuations and have prospects that, in our opinion, are greater than consensus expectations. At the same time, we are also ever mindful to manage risk and preserve capital throughout the market’s gyrations.
Investing involves risks, including loss of principal.
| | | | |
Semi-Annual Report | December 31, 2011 | | | 3 | |
| | |
| | Portfolio Information |
| Cortina Small Cap Value Fund | | December 31, 2011 (Unaudited) |
Growth of $10,000 Investment (Unaudited)
For the period from September 30, 2011 (Inception) to December 31, 2011.
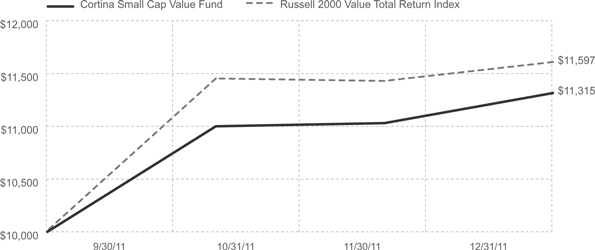
This graph assumes an initial $10,000 investment at September 30, 2011 (Inception Date). The Cortina Small Cap Value Fund (the “Fund”) will deduct a 2.00% redemption proceeds fee on Fund shares held 60 days or less. This graph depicts the performance of the Fund versus the Russell 2000 Value Total Return Index. It is important to note the Fund is a professionally managed mutual fund, while the indices are not available for investment and are unmanaged. The comparison is shown for illustrative purposes only.
The Fund is new and has limited operating history. Funds that emphasize investments in smaller companies generally experience greater price volatility.
Performance Returns for the period ended December 31, 2011
| | | | | | | | | | |
| | | Since Inception* | | Gross Expense Ratio** |
Cortina Small Cap Value Fund | | 13.15% | | 3.09% |
Russell 2000 Value Total Return Index | | 15.97% | | |
| * | The Fund’s inception date is September 30, 2011. |
| ** | Cortina Asset Management, LLC (“Adviser”) has contractually agreed to waive management fees and/or reimburse the Fund’s operating expenses in order to limit the Fund’s total annual fund operating expenses to 1.10% of average daily net assets of the Fund. The agreement will continue in effect at least through December 31, 2012, subject thereafter to annual re-approval of the agreement by the Fund’s Board of Directors. |
Past performance does not guarantee future results. The performance data quoted represents past performance and current returns may be lower or higher. Total return figures include change in share price, reinvestment of dividends and capital gains. The investment return and principal value will fluctuate so that an investor’s shares, when redeemed may be worth more or less than their original cost. To obtain performance information current to the most recent month end, call 1-855-612-3936.
Russell 2000 Value Total Return Index measures the performance of those Russell 2000 companies with lower price-to-book ratios and lower forecasted growth values. All indices are unmanaged. It is not possible to invest directly in an index.
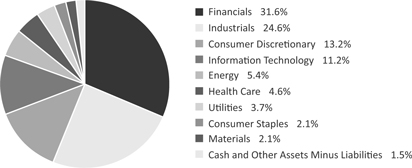
Sector Allocations
| | |
4 | | 1-855-612-3936 | www.cortinafunds.com |
| | |
| | Disclosure of Fund Expenses |
| | December 31, 2011 (Unaudited) |
As a shareholder of the Fund(s), you incur ongoing costs, including management fees and other Fund expenses. This example is intended to help you understand your ongoing costs (in dollars) of investing in each Fund and to compare these costs with the ongoing costs of investing in other mutual funds. The example is based on an investment of $1,000 invested at the beginning of the period and held for the entire period, as indicated below.
Actual Expenses – The first line of the table below provides information about the actual account values and actual expenses. You may use the information in this line, together with the amount you invested, to estimate the expenses that you paid over the period. Simply divide your account value by $1,000 (for example, an $8,600 account value divided by $1,000 = 8.6) then multiply the result by the number in the first line under the heading entitled “Expenses Paid During Period” to estimate the expenses you paid on your account during this period.
Hypothetical Example for Comparison Purposes – The second line of the table below provides information about hypothetical account values and hypothetical expenses based on each Fund’s actual expense ratio and an assumed annual rate of return of 5% before expenses, which is not each Fund’s actual return. The hypothetical account values and expenses may not be used to estimate the actual ending account balance or expenses you paid for the period. You may use this information to compare the ongoing costs of investing in each Fund and other funds by comparing these 5% hypothetical examples with the 5% hypothetical examples that appear in the shareholder reports of other funds.
| | | | | | | | | | | | | | | | | | | | |
| | | Beginning Account Value July 1, 2011 | | Ending Account Value December 31, 2011 | | Expense Paid During Period(a) | | Net Expense Ratios(b) |
Cortina Small Cap Growth Fund | | | | | | | | | | | | | | | | | | | | |
Actual Fund Return(c) | | | | $ 1,000.00 | | | | | $ 1,134.20 | | | | | $ 2.95 | | | | | 1.10 | % |
Hypothetical Fund Return (assuming a 5% return before expenses) | | | | $ 1,000.00 | | | | | $ 1,009.80 | | | | | $ 5.56 | | | | | 1.10 | % |
Cortina Small Cap Value Fund | | | | | | | | | | | | | | | | | | | | |
Actual Fund Return(c) | | | | $ 1,000.00 | | | | | $ 1,131.50 | | | | | $ 2.95 | | | | | 1.10 | % |
Hypothetical Fund Return (assuming a 5% return before expenses) | | | | $ 1,000.00 | | | | | $ 1,009.80 | | | | | $ 5.56 | | | | | 1.10 | % |
| (a) | Expenses are equal to the Fund’s annualized expense ratio multiplied by the average account value over the period, multiplied by the number of days in the most recent fiscal half year (93), divided by 366. Note this expense example is typically based on a six-month period. As the Funds’ period of operations is less than six months as of the date of this report (September 30, 2011 to December 31, 2011), the expense examples shown are from inception date of the Funds through December 31, 2011 (93 days). |
| (b) | Annualized, based on the Fund’s expenses from September 30, 2011 (inception) through December 31, 2011. |
| (c) | The Fund commenced operations on September 30, 2011. |
| | | | |
Semi-Annual Report | December 31, 2011 | | | 5 | |
| | |
| | Schedule of Investments |
| Cortina Small Cap Growth Fund | | December 31, 2011 (Unaudited) |
| | | | | | | | |
| | | Shares | | | Value | |
COMMON STOCKS (99.9%) | | | | | | | | |
Consumer Discretionary (13.6%) | | | | | | | | |
Amerigon, Inc.(a) | | | 465 | | | $ | 6,631 | |
Body Central Corp.(a) | | | 485 | | | | 12,106 | |
Crocs, Inc.(a) | | | 716 | | | | 10,575 | |
Envestnet, Inc.(a) | | | 606 | | | | 7,248 | |
Francesca’s Holdings Corp.(a) | | | 369 | | | | 6,384 | |
Fuel Systems Solutions, Inc.(a) | | | 353 | | | | 5,821 | |
G-III Apparel Group, Ltd.(a) | | | 378 | | | | 9,416 | |
hhgregg, Inc.(a) | | | 923 | | | | 13,337 | |
Morgans Hotel Group Co.(a) | | | 1,222 | | | | 7,210 | |
Shutterfly, Inc.(a) | | | 271 | | | | 6,168 | |
Skullcandy, Inc.(a) | | | 840 | | | | 10,517 | |
Steven Madden, Ltd.(a) | | | 319 | | | | 11,005 | |
Teavana Holdings, Inc.(a) | | | 399 | | | | 7,493 | |
Ulta Salon Cosmetics & Fragrance, Inc.(a) | | | 139 | | | | 9,024 | |
| | | | | | | | |
| | | | | | | 122,935 | |
| | | | | | | | |
| | |
Consumer Staples (2.9%) | | | | | | | | |
The Andersons, Inc. | | | 201 | | | | 8,776 | |
The Fresh Market, Inc.(a) | | | 235 | | | | 9,376 | |
Summer Infant, Inc.(a) | | | 1,115 | | | | 7,850 | |
| | | | | | | | |
| | | | | | | 26,002 | |
| | | | | | | | |
| | |
Energy (7.3%) | | | | | | | | |
Carrizo Oil & Gas, Inc.(a) | | | 240 | | | | 6,324 | |
Comstock Resources, Inc.(a) | | | 504 | | | | 7,711 | |
Lufkin Industries, Inc. | | | 114 | | | | 7,673 | |
Northern Oil & Gas, Inc.(a) | | | 520 | | | | 12,470 | |
Rex Energy Corp.(a) | | | 482 | | | | 7,114 | |
Sanchez Energy Corp.(a) | | | 379 | | | | 6,542 | |
Synergy Resources Corp.(a) | | | 1,888 | | | | 5,343 | |
Triangle Petroleum Corp.(a) | | | 2,118 | | | | 12,644 | |
| | | | | | | | |
| | | | | | | 65,821 | |
| | | | | | | | |
| | |
Financials (3.2%) | | | | | | | | |
Greenhill & Co., Inc | | | 282 | | | | 10,256 | |
Pinnacle Financial Partners, Inc.(a) | | | 579 | | | | 9,351 | |
Texas Capital Bancshares, Inc.(a) | | | 303 | | | | 9,275 | |
| | | | | | | | |
| | | | | | | 28,882 | |
| | | | | | | | |
| | |
Health Care (24.8%) | | | | | | | | |
Accuray, Inc.(a) | | | 1,915 | | | | 8,100 | |
Align Technology, Inc.(a) | | | 511 | | | | 12,123 | |
AtriCure, Inc.(a) | | | 1,000 | | | | 11,100 | |
Cepheid, Inc.(a) | | | 334 | | | | 11,493 | |
Cerus Corp.(a) | | | 3,061 | | | | 8,571 | |
Complete Genomics, Inc.(a) | | | 1,409 | | | | 4,128 | |
Conceptus, Inc.(a) | | | 396 | | | | 5,005 | |
DexCom, Inc.(a) | | | 883 | | | | 8,221 | |
Endologix, Inc.(a) | | | 1,137 | | | | 13,053 | |
Fluidigm Corp.(a) | | | 730 | | | | 9,607 | |
HealthStream, Inc.(a) | | | 366 | | | | 6,753 | |
Insulet Corp.(a) | | | 584 | | | | 10,997 | |
Luminex Corp.(a) | | | 565 | | | | 11,995 | |
Medidata Solutions, Inc.(a) | | | 531 | | | | 11,549 | |
Myriad Genetics, Inc.(a) | | | 416 | | | | 8,711 | |
OraSure Technologies, Inc.(a) | | | 1,138 | | | | 10,367 | |
Quidel Corp.(a) | | | 549 | | | | 8,306 | |
Soltra Medical, Inc.(a) | | | 3,433 | | | | 10,780 | |
| | |
| | |
See Notes to Financial Statements. | | |
6 | | 1-855-612-3936 | www.cortinafunds.com |
| | |
| | Schedule of Investments |
| Cortina Small Cap Growth Fund | | December 31, 2011 (Unaudited) |
| | | | | | | | |
| | |
| | | Shares | | | Value | |
Health Care (continued) | | | | | | | | |
Staar Surgical Co.(a) | | | 1,045 | | | $ | 10,962 | |
Synergetics USA, Inc.(a) | | | 1,393 | | | | 10,280 | |
Uroplasty, Inc.(a) | | | 1,686 | | | | 7,165 | |
Volcano Corp.(a) | | | 369 | | | | 8,779 | |
Zoll Medical Corp.(a) | | | 270 | | | | 17,059 | |
| | | | | | | | |
| | | | | | | 225,104 | |
| | | | | | | | |
| | |
Industrials (11.8%) | | | | | | | | |
AO Smith Corp. | | | 194 | | | | 7,783 | |
Astronics Corp.(a) | | | 241 | | | | 8,630 | |
Chart Industries, Inc.(a) | | | 219 | | | | 11,842 | |
Dynamic Materials Corp. | | | 291 | | | | 5,756 | |
Flow International Corp.(a) | | | 2,480 | | | | 8,680 | |
GrafTech International, Ltd.(a) | | | 520 | | | | 7,098 | |
Heritage Crystal, Inc.(a) | | | 449 | | | | 7,436 | |
Marten Transport, Ltd. | | | 278 | | | | 5,001 | |
Mistras Group, Inc.(a) | | | 370 | | | | 9,431 | |
Primoris Services Corp. | | | 688 | | | | 10,272 | |
Rush Enterprises, Inc., Class A(a) | | | 496 | | | | 10,376 | |
Westport Innovations, Inc.(a) | | | 430 | | | | 14,293 | |
| | | | | | | | |
| | | | | | | 106,598 | |
| | | | | | | | |
| | |
Information Technology (33.0%) | | | | | | | | |
Axcelis Technologies, Inc.(a) | | | 2,865 | | | | 3,810 | |
BroadSoft, Inc.(a) | | | 244 | | | | 7,369 | |
CommVault Systems, Inc.(a) | | | 324 | | | | 13,841 | |
Computer Task Group, Inc.(a) | | | 594 | | | | 8,364 | |
Constant Contact, Inc.(a) | | | 446 | | | | 10,352 | |
Convio, Inc.(a) | | | 853 | | | | 9,434 | |
Echo Global Logistics, Inc.(a) | | | 636 | | | | 10,271 | |
FSI International, Inc.(a) | | | 3,100 | | | | 11,346 | |
Higher One Holdings, Inc.(a) | | | 497 | | | | 9,165 | |
Imperva, Inc.(a) | | | 121 | | | | 4,212 | |
Inphi Corp.(a) | | | 996 | | | | 11,912 | |
Interactive Intelligence, Inc.(a) | | | 262 | | | | 6,005 | |
Ixia(a) | | | 995 | | | | 10,458 | |
Kenexa Corp.(a) | | | 252 | | | | 6,728 | |
LivePerson, Inc.(a) | | | 684 | | | | 8,584 | |
LogMeIn, Inc.(a) | | | 220 | | | | 8,481 | |
Maxwell Technologies, Inc.(a) | | | 1,011 | | | | 16,419 | |
Netgear, Inc.(a) | | | 228 | | | | 7,654 | |
NIC, Inc. | | | 435 | | | | 5,790 | |
QLIK Technologies, Inc.(a) | | | 312 | | | | 7,550 | |
Responsys, Inc.(a) | | | 726 | | | | 6,454 | |
Rudolph Technologies, Inc.(a) | | | 1,009 | | | | 9,343 | |
Sapient Corp. | | | 726 | | | | 9,148 | |
Semtech Corp.(a) | | | 414 | | | | 10,276 | |
ShoreTel, Inc.(a) | | | 1,593 | | | | 10,163 | |
SPS Commerce, Inc.(a) | | | 338 | | | | 8,771 | |
Synchronoss Technologies, Inc.(a) | | | 477 | | | | 14,410 | |
Taleo Corp., Class A(a) | | | 265 | | | | 10,253 | |
Tangoe, Inc.(a) | | | 570 | | | | 8,778 | |
TechTarget, Inc.(a) | | | 1,395 | | | | 8,147 | |
TeleTech Holdings, Inc.(a) | | | 476 | | | | 7,711 | |
ValueClick, Inc.(a) | | | 507 | | | | 8,259 | |
Volterra Semiconductor Corp.(a) | | | 391 | | | | 10,014 | |
| | | | | | | | |
| | | | | | | 299,472 | |
| | | | | | | | |
| | | | |
See Notes to Financial Statements. | | | | |
Semi-Annual Report | December 31, 2011 | | | 7 | |
| | |
| | Schedule of Investments |
| Cortina Small Cap Growth Fund | | December 31, 2011 (Unaudited) |
| | | | | | | | |
| | |
| | | Shares | | | Value | |
Materials (0.7%) | | | | | | | | |
Codexis, Inc.(a) | | | 1,189 | | | $ | 6,302 | |
| | | | | | | | |
| | |
Telecommunication Services (2.6%) | | | | | | | | |
AboveNet, Inc.(a) | | | 147 | | | | 9,556 | |
Cogent Communications Group, Inc.(a) | | | 153 | | | | 2,584 | |
inContact, Inc.(a) | | | 2,636 | | | | 11,678 | |
| | | | | | | | |
| | | | | | | 23,818 | |
| | | | | | | | |
| | |
TOTAL COMMON STOCKS
(COST $800,674) | | | | | | | 904,934 | |
| | | | | | | | |
| | |
SHORT TERM INVESTMENT (1.3%) | | | | | | | | |
HighMark Diversified Money Market Fund, 7 Day Yield 0.020% | | | 12,331 | | | | 12,331 | |
| | | | | | | | |
| | |
TOTAL SHORT TERM INVESTMENT
(COST $12,331) | | | | | | | 12,331 | |
| | | | | | | | |
| | |
TOTAL INVESTMENTS (101.2%)
(COST $813,005) | | | | | | | 917,265 | |
| | | | | | | | |
| | |
TOTAL LIABILITIES IN EXCESS OF OTHER ASSETS (1.2%) | | | | | | | (11,089) | |
| | | | | | | | |
| | |
NET ASSETS 100.0% | | | | | | $ | 906,176 | |
| | | | | | | | |
| (a) | Non Income Producing Security. |
| | |
See Notes to Financial Statements. |
8 | | 1-855-612-3936 | www.cortinafunds.com |
| | |
| | Schedule of Investments |
| Cortina Small Cap Value Fund | | December 31, 2011 (Unaudited) |
| | | | | | | | |
| | |
| | | Shares | | | Value | |
COMMON STOCKS (98.5%) | | | | | | | | |
Consumer Discretionary (13.2%) | | | | | | | | |
AFC Enterprises, Inc.(a) | | | 627 | | | $ | 9,217 | |
Cabela’s, Inc.(a) | | | 317 | | | | 8,058 | |
Denny’s Corp.(a) | | | 2,676 | | | | 10,062 | |
DreamWorks Animation SKG, Inc., Class A(a) | | | 395 | | | | 6,555 | |
Express, Inc.(a) | | | 504 | | | | 10,050 | |
Maidenform Brands, Inc.(a) | | | 545 | | | | 9,974 | |
PF Chang’s China Bistro, Inc. | | | 217 | | | | 6,707 | |
Regis Corp. | | | 1,022 | | | | 16,914 | |
Stage Stores, Inc. | | | 197 | | | | 2,736 | |
| | | | | | | | |
| | | | | | | 80,273 | |
| | | | | | | | |
| | |
Consumer Staples (2.1%) | | | | | | | | |
Darling International, Inc.(a) | | | 579 | | | | 7,695 | |
Prestige Brands Holdings, Inc.(a) | | | 441 | | | | 4,970 | |
| | | | | | | | |
| | | | | | | 12,665 | |
| | | | | | | | |
| | |
Energy (5.4%) | | | | | | | | |
Carrizo Oil & Gas, Inc.(a) | | | 279 | | | | 7,351 | |
GeoResources, Inc.(a) | | | 287 | | | | 8,412 | |
Northern Oil & Gas, Inc.(a) | | | 207 | | | | 4,964 | |
Tetra Technologies, Inc.(a) | | | 1,288 | | | | 12,030 | |
| | | | | | | | |
| | | | | | | 32,757 | |
| | | | | | | | |
| | |
Financials (31.6%) | | | | | | | | |
AerCap Holdings NV(a) | | | 796 | | | | 8,987 | |
Altisource Portfolio Solutions SA(a) | | | 351 | | | | 17,613 | |
BBCN Bancorp, Inc.(a) | | | 1,806 | | | | 17,067 | |
Boston Private Financial Holdings, Inc. | | | 1,712 | | | | 13,593 | |
Capitol Federal Financial, Inc. | | | 1,150 | | | | 13,271 | |
CNO Financial Group, Inc.(a) | | | 2,007 | | | | 12,664 | |
Cowen Group, Inc., Class A(a) | | | 2,058 | | | | 5,330 | |
Kennedy-Wilson Holdings, Inc. | | | 1,147 | | | | 12,135 | |
Maiden Holdings, Ltd. | | | 1,238 | | | | 10,845 | |
MB Financial, Inc. | | | 443 | | | | 7,575 | |
Northwest Bancshares, Inc. | | | 607 | | | | 7,551 | |
Ocwen Financial Corp.(a) | | | 684 | | | | 9,905 | |
Oritani Financial Corp. | | | 1,108 | | | | 14,149 | |
Platinum Underwriters Holdings, Ltd. | | | 206 | | | | 7,027 | |
ProAssurance Corp. | | | 216 | | | | 17,241 | |
Susquehanna Bancshares, Inc. | | | 1,207 | | | | 10,115 | |
West Coast Bancorp(a) | | | 446 | | | | 6,958 | |
| | | | | | | | |
| | | | | | | 192,026 | |
| | | | | | | | |
| | |
Health Care (4.6%) | | | | | | | | |
Hanger Orthopedic Group, Inc.(a) | | | 510 | | | | 9,532 | |
ICU Medical, Inc.(a) | | | 225 | | | | 10,125 | |
Teleflex, Inc. | | | 138 | | | | 8,458 | |
| | | | | | | | |
| | | | | | | 28,115 | |
| | | | | | | | |
| | |
Industrials (24.6%) | | | | | | | | |
ACCO Brands Corp.(a) | | | 1,783 | | | | 17,206 | |
Actuant Corp., Class A | | | 406 | | | | 9,212 | |
Belden, Inc. | | | 205 | | | | 6,822 | |
The Brink’s Co. | | | 191 | | | | 5,134 | |
Cubic Corp. | | | 167 | | | | 7,280 | |
ESCO Technologies, Inc. | | | 234 | | | | 6,735 | |
Fortune Brands Home & Security, Inc.(a) | | | 535 | | | | 9,111 | |
Greenbrier Cos., Inc.(a) | | | 303 | | | | 7,357 | |
Hexcel Corp.(a) | | | 563 | | | | 13,630 | |
| | | | |
See Notes to Financial Statements. | | | | |
Semi-Annual Report | December 31, 2011 | | | 9 | |
| | |
| | Schedule of Investments |
| Cortina Small Cap Value Fund | | December 31, 2011 (Unaudited) |
| | | | | | | | |
| | | Shares | | | Value | |
Industrials (continued) | | | | | | | | |
Insperity, Inc. | | | 262 | | | $ | 6,642 | |
Knoll, Inc. | | | 421 | | | | 6,252 | |
MasTec, Inc.(a) | | | 503 | | | | 8,737 | |
RailAmerica, Inc.(a) | | | 729 | | | | 10,855 | |
RSC Holdings, Inc.(a) | | | 600 | | | | 11,100 | |
Rush Enterprises, Inc., Class A(a) | | | 441 | | | | 9,226 | |
TrueBlue, Inc.(a) | | | 605 | | | | 8,397 | |
Wabash National Corp.(a) | | | 760 | | | | 5,958 | |
| | | | | | | | |
| | | | | | | 149,654 | |
| | | | | | | | |
| | |
Information Technology (11.2%) | | | | | | | | |
Compuware Corp.(a) | | | 720 | | | | 5,990 | |
Deltek, Inc.(a) | | | 736 | | | | 7,227 | |
Harmonic, Inc.(a) | | | 2,122 | | | | 10,695 | |
Logitech International SA(a) | | | 1,097 | | | | 8,535 | |
PMC - Sierra, Inc.(a) | | | 1,879 | | | | 10,353 | |
Sierra Wireless, Inc.(a) | | | 1,133 | | | | 7,948 | |
Spansion, Inc., Class A(a) | | | 528 | | | | 4,372 | |
Super Micro Computer, Inc.(a) | | | 845 | | | | 13,250 | |
| | | | | | | | |
| | | | | | | 68,370 | |
| | | | | | | | |
Materials (2.1%) | | | | | | | | |
Graphic Packaging Holdings, Inc.(a) | | | 2,940 | | | | 12,524 | |
| | | | | | | | |
Utilities (3.7%) | | | | | | | | |
Allete, Inc. | | | 334 | | | | 14,022 | |
El Paso Electric Co. | | | 244 | | | | 8,452 | |
| | | | | | | | |
| | | | | | | 22,474 | |
| | | | | | | | |
| | |
TOTAL COMMON STOCKS
(COST $525,119) | | | | | | | 598,858 | |
| | | | | | | | |
| | |
SHORT TERM INVESTMENT (3.8%) | | | | | | | | |
HighMark Diversified Money Market Fund, 7 Day Yield 0.020% | | | 23,443 | | | | 23,443 | |
| | | | | | | | |
| | |
TOTAL SHORT TERM INVESTMENT
(COST $23,443) | | | | | | | 23,443 | |
| | | | | | | | |
| | |
TOTAL INVESTMENTS (102.3%)
(COST $548,562) | | | | | | | 622,301 | |
| | | | | | | | |
| | |
TOTAL LIABILITIES IN EXCESS OF OTHER ASSETS (2.3%) | | | | | | | (14,091) | |
| | | | | | | | |
| | |
NET ASSETS 100.0% | | | | | | $ | 608,210 | |
| | | | | | | | |
| (a) | Non Income Producing Security. |
Common Abbreviations:
NV - Naamloze Vennootschap is the Dutch term for a public limited liability corporation.
SA - Generally designates corporations in various countries, mostly those employing the civil law.
| | |
| See Notes to Financial Statements. | | |
10 | | 1-855-612-3936 | www.cortinafunds.com |
| | |
| | Statements of Assets and Liabilities |
| | December 31, 2011 (Unaudited) |
| | | | | | | | |
| | | Cortina Small Cap
Growth Fund | | | Cortina Small Cap
Value Fund | |
| | | | |
ASSETS: | | | | | | | | |
Investments, at value (Cost - see below) | | $ | 917,265 | | | $ | 622,301 | |
Receivable due from adviser | | | 16,398 | | | | 14,284 | |
Dividends and interest receivable | | | 172 | | | | 224 | |
Deferred offering cost | | | 5,939 | | | | 3,820 | |
Prepaid expenses and other assets | | | 480 | | | | 480 | |
| | | | |
Total Assets | | | 940,254 | | | | 641,109 | |
| | | | |
| | |
LIABILITIES: | | | | | | | | |
Payable for organization cost | | | 3,802 | | | | 4,354 | |
Payable for fund accounting and administration fees | | | 9,465 | | | | 6,332 | |
Payable for audit and legal fees | | | 10,114 | | | | 11,011 | |
Payable for printing fees | | | 151 | | | | 363 | |
Payable for director fees | | | 1,255 | | | | 1,255 | |
Other accrued liabilities and expenses | | | 9,291 | | | | 9,584 | |
| | | | |
Total Liabilities | | | 34,078 | | | | 32,899 | |
| | | | |
Net Assets | | $ | 906,176 | | | $ | 608,210 | |
| | | | |
| | |
NET ASSETS CONSISTS OF: | | | | | | | | |
Paid-in capital | | $ | 809,444 | | | $ | 535,696 | |
Accumulated net investment loss | | | (2,508) | | | | (472) | |
Accumulated net realized loss on investments | | | (5,020) | | | | (753) | |
Net unrealized appreciation in value of investments | | | 104,260 | | | | 73,739 | |
| | | | |
Net Assets | | $ | 906,176 | | | $ | 608,210 | |
| | | | |
| | |
Cost of Investments | | $ | 813,005 | | | $ | 548,562 | |
| | |
PRICING OF SHARES: | | | | | | | | |
Net Assets | | $ | 906,176 | | | $ | 608,210 | |
Shares Outstanding | | | 81,713 | | | | 56,553 | |
Net Asset Value, offering and redemption price per share | | $ | 11.09 | | | $ | 10.75 | |
| | | | |
| See Notes to Financial Statements. | | | | |
Semi-Annual Report | December 31, 2011 | | | 11 | |
| | |
| | Statements of Operations |
| | For the Period September 30, 2011 (Inception) to December 31, 2011 (Unaudited) |
| | | | | | | | |
| | | Cortina Small Cap
Growth Fund | | | Cortina Small Cap
Value Fund | |
| | | | |
INVESTMENT INCOME: | | | | | | | | |
Dividends | | $ | 417 | | | $ | 1,769 | |
Interest | | | 5 | | | | 5 | |
| | | | |
Total Investment Income | | | 422 | | | | 1,774 | |
| | | | |
| | |
EXPENSES: | | | | | | | | |
Advisory fees (Note 3) | | | 2,664 | | | | 2,042 | |
Transfer agent fees | | | 9,777 | | | | 9,777 | |
Fund accounting and administration fees and expenses | | | 25,672 | | | | 19,292 | |
Legal fees | | | 5,886 | | | | 6,427 | |
Printing fees | | | 1,155 | | | | 1,155 | |
Audit and tax preparation fees | | | 4,862 | | | | 5,047 | |
Custodian fees | | | 2,784 | | | | 2,784 | |
Insurance | | | 2,040 | | | | 2,040 | |
Director fee and expenses | | | 1,255 | | | | 1,255 | |
Offering costs | | | 7,343 | | | | 7,343 | |
Organization costs | | | 10,250 | | | | 10,250 | |
Other | | | 869 | | | | 869 | |
| | | | |
Total expenses before waivers/reimbursements | | | 74,557 | | | | 68,281 | |
Less fees waived/reimbursed by investment adviser (Note 3) | | | (71,627) | | | | (66,035) | |
| | | | |
Total Net Expenses | | | 2,930 | | | | 2,246 | |
| | | | |
Net Investment Loss | | | (2,508) | | | | (472) | |
| | | | |
| | |
REALIZED AND UNREALIZED GAIN/(LOSS) ON INVESTMENTS: | | | | | | | | |
Net realized gain on investments | | | 15,386 | | | | 29,777 | |
Net change in unrealized appreciation on investments | | | 104,260 | | | | 73,739 | |
| | | | |
Net realized and unrealized gain on investments | | | 119,646 | | | | 103,516 | |
| | | | |
Net increase in net assets resulting from operations | | $ | 117,138 | | | $ | 103,044 | |
| | | | |
| | |
See Notes to Financial Statements. | | |
12 | | 1-855-612-3936 | www.cortinafunds.com |
| | |
| | Statements of Changes in Net Assets |
| For the Period September 30, 2011 (Inception) to December 31, 2011 (Unaudited) |
| | | | | | | | |
| | | Cortina Small Cap
Growth Fund | | | Cortina Small Cap
Value Fund | |
| | | | |
| | |
OPERATIONS: | | | | | | | | |
Net investment loss | | $ | (2,508) | | | $ | (472) | |
Net realized gain on investments | | | 15,386 | | | | 29,777 | |
Net change in unrealized appreciation of investments | | | 104,260 | | | | 73,739 | |
| | | | |
Net increase in net assets resulting from operations | | | 117,138 | | | | 103,044 | |
| | | | |
| | |
DISTRIBUTIONS TO SHAREHOLDERS: | | | | | | | | |
From net realized gains on investments | | | (20,406) | | | | (30,530) | |
| | | | |
Total distributions | | | (20,406) | | | | (30,530) | |
| | | | |
| | |
CAPITAL SHARE TRANSACTIONS: | | | | | | | | |
Initial investment (Note 1) | | | 1,000,000 | | | | 1,000,000 | |
Proceeds from sale of shares | | | 689,038 | | | | 405,166 | |
Shares issued in reinvestment of distributions | | | 20,406 | | | | 30,530 | |
Cost of shares redeemed | | | (900,000) | | | | (900,000) | |
| | | | |
Net increase from capital shares transactions | | | 809,444 | | | | 535,696 | |
| | | | |
| | |
Net increase in net assets | | | 906,176 | | | | 608,210 | |
| | | | |
| | |
NET ASSETS: | | | | | | | | |
Beginning of period | | | 0 | | | | 0 | |
| | | | |
End of period | | $ | 906,176 | | | $ | 608,210 | |
| | | | |
Including accumulated net investment loss of: | | $ | (2,508) | | | $ | (472) | |
| | |
OTHER INFORMATION: | | | | | | | | |
Share Transactions: | | | | | | | | |
Initial investment (Note 1) | | | 100,000 | | | | 100,000 | |
Shares sold | | | 63,770 | | | | 37,870 | |
Shares issued in reinvestment of dividends | | | 1,819 | | | | 2,822 | |
Less shares redeemed | | | (83,876) | | | | (84,139) | |
| | | | |
Net increase in share transactions | | | 81,713 | | | | 56,553 | |
| | | | |
| | | | |
See Notes to Financial Statements. | | | | |
Semi-Annual Report | December 31, 2011 | | | 13 | |
| | |
| | Financial Highlights |
Cortina Small Cap Growth Fund | | For a share outstanding throughout the period presented. |
| | |
| | | For the Period September 30, 2011 (inception) to December 31, 2011 (Unaudited) |
NET ASSET VALUE, BEGINNING OF PERIOD | | $10.00 |
INCOME/(LOSS) FROM INVESTMENT OPERATIONS: | | |
Net Investment Loss(a) | | (0.03) |
Net realized and unrealized gain on investments | | 1.38 |
| | |
Total from Investment Operations | | 1.35 |
| | |
| |
DIVIDENDS AND DISTRIBUTIONS TO SHAREHOLDERS: | | |
From net realized gain on investments | | (0.26) |
| | |
Total Dividends and Distributions to Shareholders | | (0.26) |
| | |
| |
NET INCREASE IN NET ASSET VALUE | | 1.09 |
| | |
| |
NET ASSET VALUE, END OF PERIOD | | $11.09 |
| | |
| |
TOTAL RETURN(b)(c) | | 13.42% |
| |
RATIOS AND SUPPLEMENTAL DATA: | | |
Net assets, end of period (in 000s) | | $906 |
| |
RATIOS TO AVERAGE NET ASSETS: | | |
Operating expenses excluding waiver/reimbursement | | 27.99%(d) |
Operating expenses including waiver/reimbursement | | 1.10%(d) |
Net investment loss including waiver/reimbursement | | (0.94)%(d) |
| |
PORTFOLIO TURNOVER RATE | | 117% |
| (a) | Calculated using average shares throughout the period. |
| (b) | Total returns would have been lower had various fees and expenses not been waived and reimbursed during the period. |
| | |
| See Notes to Financial Statements. |
14 | | 1-855-612-3936 | www.cortinafunds.com |
| | |
| | Financial Highlights |
| Cortina Small Cap Value Fund | | For a share outstanding throughout the period presented. |
| | |
| | | For the Period
September 30, 2011 (inception) to December 31, 2011 (Unaudited) |
NET ASSET VALUE, BEGINNING OF PERIOD | | $10.00 |
INCOME/(LOSS) FROM INVESTMENT OPERATIONS: | | |
Net Investment Loss(a) | | (0.01) |
Net realized and unrealized gain on investments | | 1.33 |
| | |
Total from Investment Operations | | 1.32 |
| | |
| |
DIVIDENDS AND DISTRIBUTIONS TO SHAREHOLDERS: | | |
From net realized gain on investments | | (0.57) |
| | |
Total Dividends and Distributions to Shareholders | | (0.57) |
| | |
| |
NET INCREASE IN NET ASSET VALUE | | 0.75 |
| | |
| |
NET ASSET VALUE, END OF PERIOD | | $10.75 |
| | |
| |
TOTAL RETURN(b)(c) | | 13.15% |
| |
RATIOS AND SUPPLEMENTAL DATA: | | |
Net assets, end of period (in 000s) | | $608 |
| |
RATIOS TO AVERAGE NET ASSETS: | | |
Operating expenses excluding waiver/reimbursement | | 33.44%(d) |
Operating expenses including waiver/reimbursement | | 1.10%(d) |
Net investment loss including waiver/reimbursement | | (0.23)%(d) |
| |
PORTFOLIO TURNOVER RATE | | 139% |
| (a) | Calculated using average shares throughout the period. |
| (b) | Total returns would have been lower had various fees and expenses not been waived and reimbursed during the period. |
| | | | |
See Notes to Financial Statements. | | | | |
Semi-Annual Report | December 31, 2011 | | | 15 | |
| | |
| | Notes to Financial Statements |
| | December 31, 2011 (Unaudited) |
1. ORGANIZATION
Cortina Funds, Inc. (the “Corporation”), is an open-end management investment company registered under the Investment Company Act of 1940, as amended (the “1940 Act”). The Corporation was organized on June 30, 2004 as a Wisconsin corporation. The Corporation currently offers shares of common stock (“shares”) of the Cortina Small Cap Growth Fund and the Cortina Small Cap Value Fund (each a “Fund” and collectively, the “Funds”). The Cortina Small Cap Growth Fund is a diversified portfolio with an investment objective to seek growth of capital and the Cortina Small Cap Value Fund is a diversified portfolio with an investment objective to seek long-term capital appreciation. Shares of each Fund are designated as Institutional Shares with an indefinite number of shares authorized at $0.01 par value. The Articles of Incorporation, as amended and restated, permits the Board of Directors (the “Board”) to create additional funds and share classes. The institutional class is currently the only class offered.
As newly offered entities, the Funds have a limited operating history. The Funds did not have any operations before September 30, 2011, other than those relating to the sale and issuance of 200,000 common shares in the amount of 100,000 common shares in the Institutional Class for each Fund to Roth Capital Partners, an affiliate of Cortina Asset Management, LLC (“Adviser”).
2. SIGNIFICANT ACCOUNTING POLICIES
The following is a summary of significant accounting policies followed by the Funds. These policies are in conformity with U.S. generally accepted accounting principles (“GAAP”).
Use of Estimates — The preparation of financial statements in conformity with GAAP requires management to make estimates and assumptions that affect the amounts reported in the financial statements. Actual results could differ from those estimates.
Investment Valuation — Investment securities are valued at the last sale price at the close of the principal exchange on which they trade, except for securities listed on the National Association of Securities Dealers Automated Quotations (“NASDAQ”) exchange, which are valued at the NASDAQ official closing price. Unlisted securities or listed securities for which there were no sales during the day are valued at the closing bid price on such exchanges or over-the-counter markets. Investments for which market quotations are not readily available are valued at fair value as determined in good faith under consistently applied procedures approved by and under the general supervision of the Funds’ Board.
Investment Transactions — Investment security transactions are accounted for on trade date. Gains and losses on securities sold are determined on a specific identification basis.
Investment Income – Interest income is accrued and recorded on a daily basis including amortization of premiums, accretions of discounts and accretion of discounts and income earned from money market funds. Interest is not accrued on securities that are in default. Dividend income is recorded on the ex-dividend date.
Fair Value Measurements — A three-tier hierarchy has been established to classify fair value measurements for disclosure purposes. Inputs refer broadly to the assumptions that market participants would use in pricing the asset or liability, including assumptions about risk. Inputs may be observable or unobservable. Observable inputs are inputs that reflect the assumptions market participants would use in pricing the asset or liability that are developed based on market data obtained from sources independent of the reporting entity. Unobservable inputs are inputs that reflect the reporting entity’s own assumptions about the assumptions market participants would use in pricing the asset or liability that are developed based on the best information available. In accordance with the authoritative guidance on fair value measurements and disclosure under GAAP, the Funds disclose fair value of their investments in a hierarchy that prioritizes the inputs to valuation techniques used to measure the fair value.
Various inputs are used in determining the value of each Fund’s investments as of the reporting period end. The designated input levels are not necessarily an indication of the risk or liquidity associated with these investments. These inputs are categorized in the following hierarchy under applicable financial accounting standards:
| | | | |
Level 1 | | — | | Unadjusted quoted prices in active markets for identical, unrestricted assets or liabilities that the Funds have the ability to access at the measurement date; |
| | |
Level 2 | | — | | Quoted prices which are not active, quoted prices for similar assets or liabilities in active markets or inputs other than quoted prices that are observable (either directly or indirectly) for substantially the full term of the asset or liability; and |
| | |
Level 3 | | — | | Significant unobservable prices or inputs (including the Fund’s own assumptions in determining the fair value of investments) where there is little or no market activity for the asset or liability at the measurement date. |
| | |
16 | | 1-855-612-3936 | www.cortinafunds.com |
| | |
| | Notes to Financial Statements |
| | December 31, 2011 (Unaudited) |
The availability of observable inputs can vary from security to security and is affected by a wide variety of factors, including, for example, the type of security, whether the security is new and not yet established in the marketplace, the liquidity of markets, and other characteristics particular to the security. To the extent that valuation is based on models or inputs that are less observable or unobservable in the market, the determination of fair value requires more judgment. Accordingly, the degree of judgment exercised in determining fair value is greatest for instruments categorized in Level 3.
An investment level within the fair value hierarchy is based on the lowest level input, individually or in the aggregate, that is significant to fair value measurement. The valuation techniques used by the Funds to measure fair value during the period ended December 31, 2011 maximized the use of observable inputs and minimized the use of unobservable inputs.
The inputs or methodology used for valuing securities are not necessarily an indication of the risk or liquidity associated with investing in those securities. The following is a summary of the inputs used in valuing the Funds’ investments as of December 31, 2011:
Cortina Small Cap Growth Fund
| | | | | | | | | | | | | | | | |
| | | Valuation Inputs | | | | |
| Investments in Securities at Value* | | Level 1 | | | Level 2 | | | Level 3 | | | Total | |
Common Stocks | | $ | 904,934 | | | $ | – | | | $ | – | | | $ | 904,934 | |
Short Term Investment | | | 12,331 | | | | – | | | | – | | | | 12,331 | |
| | | | |
Total | | $ | 917,265 | | | $ | – | | | $ | – | | | $ | 917,265 | |
| | | | |
Cortina Small Cap Value Fund
| | | | | | | | | | | | | | | | |
| | | Valuation Inputs | | | | |
| Investments in Securities at Value* | | Level 1 | | | Level 2 | | | Level 3 | | | Total | |
Common Stocks | | $ | 598,858 | | | $ | – | | | $ | – | | | $ | 598,858 | |
Short Term Investment | | | 23,443 | | | | – | | | | – | | | | 23,443 | |
| | | | |
Total | | $ | 622,301 | | | $ | – | | | $ | – | | | $ | 622,301 | |
| | | | |
* See Schedule of Investments for sector classification.
For the period ended December 31, 2011, there have been no significant changes to the Funds’ fair value methodologies. Additionally, there were no transfers into or out of Levels 1 and 2 during the period ended December 31, 2011.
For the period ended December 31, 2011, the Funds did not have significant unobservable inputs (Level 3) used in determining fair value. Therefore, a reconciliation of assets in which significant unobservable inputs (Level 3) were used in determining fair value is not applicable.
Affiliated Companies — An affiliated company is a company that can have direct or indirect common ownership. The Funds do not hold any investments in affiliated companies as of December 31, 2011.
Offering Costs — Offering costs, including costs of printing initial prospectuses, legal and registration fees, are being amortized over twelve months from the inception date of the Funds. As of December 31, 2011, $5,939 of offering costs remain to be amortized for the Small Cap Growth Fund and $3,820 of offering costs remain to be amortized for the Small Cap Value Fund.
Expenses —The Funds bear expenses incurred specifically on each Funds respective behalf as well as a portion of general Corporation expenses, which may be allocated on the basis of relative net assets or the nature of the services performed relative to applicability to each Fund.
Distributions to Shareholders — Dividends from net investment income and distributions of net realized capital gains, if any, will be declared and paid at least annually. Income and capital gains distributions are determined in accordance with income tax regulations, which may differ from GAAP. Distributions to shareholders are recorded on the ex-dividend date.
Fees on Redemptions — The Funds will deduct a 2.00% redemption proceeds fee on Fund shares held 60 days or less. The redemption fee is not a fee to finance sales or sales promotion expenses, but is paid to the Funds to defray the costs of liquidating an investor and discouraging short-term trading of the Funds’ shares. No redemption fee will be imposed on redemptions initiated by the Funds.
| | | | |
Semi-Annual Report | December 31, 2011 | | | 17 | |
| | |
| | Notes to Financial Statements |
| | December 31, 2011 (Unaudited) |
Federal Income Taxes — No provision for income taxes is included in the accompanying financial statements, as the Funds intend to distribute to shareholders all taxable investment income and realized gains, and otherwise comply with Subchapter M of the Internal Revenue Code applicable to regulated investment companies.
3. TRANSACTIONS WITH AFFILIATES
Investment Advisory
The Adviser is subject to the general supervision of the Board, and is responsible for the overall management of the Funds’ business affairs. The Adviser invests the assets of the Funds based on the Funds’ investment objectives and policies. The Adviser is entitled to an investment advisory fee, computed daily and payable monthly of 1.00% of the average daily net assets for each Fund.
The Adviser has contractually agreed to waive fees with respect to each of the Funds so that the net annual operating expenses (excluding taxes, leverage, interest, brokerage commissions, dividends or interest expenses on short positions, acquired fund fees and expenses, and extraordinary expenses) of the Funds’ institutional shares will not exceed 1.10% of average daily net assets of each Fund. The Adviser may request a reimbursement from the Funds to recapture any reduced management fees or reimbursed Fund expenses within three years following the fee reduction or expense reimbursement, but only to the extent the Funds’ total annual fund operating expenses plus any requested reimbursement amount are less than the above limit at the time of the request. Any such reimbursement is subject to review by the Board. As of December 31, 2011, the Cortina Small Cap Growth Fund and the Cortina Small Cap Value Fund had receivables from the Adviser of $16,398 and $14,284, respectively.
Fund Accounting Fees and Expenses
ALPS Fund Services, Inc. (“ALPS” and the “Administrator”) provides administrative, fund accounting and other services to the Funds for a monthly administration fee based on the Fund’s average daily net assets at the following annual rates:
Year 1
Greater of $175,000 annual minimum in Year 1 or the following basis point fee schedule:
| | |
Average Daily Net Assets | | Basis Point Fee Rate |
Between $0-$500M | | 5.0 |
$500M-$1B | | 3.0 |
Above $1B | | 2.0 |
Year 2
Greater of $190,000 annual minimum in Year 2 or the following basis point fee schedule:
| | |
Average Daily Net Assets | | Basis Point Fee Rate |
| Between $0-$500M | | 5.0 |
| $500M-$1B | | 3.0 |
| Above $1B | | 2.0 |
The Administrator is also reimbursed by the Funds for certain out of pocket expenses.
Transfer Agent
ALPS serves as transfer, dividend paying and shareholder servicing agent for the Funds (“Transfer Agent”). ALPS is compensated based upon a $25,000 annual base fee per Fund, and annually $9 per direct open account and $7 per open account through NSCC. The Transfer Agent is also reimbursed by the Funds for certain out-of-pocket expenses.
Compliance Services
ALPS provides services that assist the Corporation’s Chief Compliance Officer in monitoring and testing the policies and procedures of the Corporation in conjunction with requirements under Rule 38a-1 under the 1940 Act. ALPS is compensated under the Administration Agreement.
Distributor
The Fund has entered into a Distribution Agreement with ALPS Distributors, Inc (“the Distributor”) to provide distribution services to the Funds. The Distributor serves as underwriter/distributor of shares of the Funds.
| | |
18 | | 1-855-612-3936 | www.cortinafunds.com |
| | |
| | Notes to Financial Statements |
| | December 31, 2011 (Unaudited) |
Certain Directors and Officers of the Funds are also officers of the Adviser, the Distributor or the Administrator.
4. PURCHASES AND SALES OF INVESTMENT SECURITIES
The aggregate cost of purchases and proceeds from sales of investment securities, excluding short-term securities, are shown below for the period ended December 31, 2011. Purchases and proceeds from sales of U.S. Government obligations are included in the totals of Purchases of Securities and Proceeds from Sales of Securities below and also broken out separately for your convenience:
| | | | | | | | |
| Fund Name | | Purchases | | | Sales | |
Cortina Small Cap Growth Fund | | $ | 1,897,527 | | | $ | 1,112,238 | |
Cortina Small Cap Value Fund | | | 1,514,558 | | | | 1,019,216 | |
There were no purchases of long-term U.S. Government Obligations for either Fund during the period ended December 31, 2011.
5. TAX BASIS INFORMATION
Distributions are determined in accordance with Federal income tax regulations, which differ from GAAP, and, therefore, may differ significantly in amount or character from net investment income and realized gains for financial reporting purposes. Financial reporting records are adjusted for permanent book/tax differences to reflect tax character but are not adjusted for temporary differences.
Income and long-term capital gain distributions are determined in accordance with federal income tax regulations, which may differ from GAAP. The amount and characteristics of tax basis distributions and composition of distributable earnings/(accumulated losses) are finalized at fiscal year end; accordingly, tax basis balances have not been determined as of December 31, 2011.
As of December 31, 2011, the aggregate cost of investments, gross unrealized appreciation/(depreciation) and net unrealized appreciation for Federal tax purposes was as follows:
| | | | | | | | | | | | | | | | |
| Fund | | Cost of Investments | | | Gross Unrealized Appreciation | | | Gross Unrealized (Depreciation) | | | Net Unrealized Appreciation | |
Cortina Small Cap Growth Fund | | $ | 840,152 | | | $ | 105,185 | | | $ | (28,072 | ) | | $ | 77,113 | |
Cortina Small Cap Value Fund | | $ | 563,463 | | | $ | 65,755 | | | $ | (6,917 | ) | | $ | 58,838 | |
The difference between book basis and tax basis net unrealized appreciation is attributable to the deferral of losses from wash sales.
6. COMMITMENTS AND CONTINGENCIES
Under the Corporation’s organizational documents, its Officers and Directors are indemnified against certain liabilities arising out of the performance of their duties to the Funds. In addition, in the normal course of business, the Corporation entered into contracts with its service providers, on behalf of the Funds, and others that provide for general indemnifications. The Funds’ maximum exposure under these arrangements is unknown, as this would involve future claims that may be made against the Funds. The Funds expect risk of loss to be remote.
7. NEW ACCOUNTING PRONOUNCEMENTS
In May 2011, the Financial Accounting Standards Board (“FASB”) issued Accounting Standards Update (“ASU”) No. 2011-04 “Amendments to Achieve Common Fair Value Measurement and Disclosure Requirements.” ASU No. 2011-04 amends FASB ASC Topic 820, Fair Value Measurements and Disclosures, to establish common requirements for measuring fair value and for disclosing information about fair value measurements in accordance with GAAP and International Financial Reporting Standards (“IFRS”). ASU No. 2011-04 is effective for fiscal years beginning after December 15, 2011, and for interim periods within those fiscal years. Management is currently evaluating the impact these amendments may have on the Funds’ financial statements.
8. SUBSEQUENT EVENTS
The Funds have evaluated the need for disclosures and/or adjustments resulting from subsequent events through the date the financial statements were issued. This evaluation did not result in any subsequent events that necessitated disclosures and/or adjustments.
| | | | |
Semi-Annual Report | December 31, 2011 | | | 19 | |
| | |
| | Additional Information |
| | December 31, 2011 (Unaudited) |
PROXY VOTING POLICIES AND VOTING RECORD
A description of the policies and procedures that the Funds use to vote proxies relating to portfolio securities is available without charge upon request by calling toll-free 1-855-612-3936, or on the Securities and Exchange Commission’s (“SEC”) website at http://www.sec.gov. Information regarding how the Funds voted proxies relating to portfolio securities during the most recent fiscal year ending June 30, 2012 will be available without charge upon request by calling toll-free 1-855-612-3936, or on the SEC’s website at http://www.sec.gov.
QUARTERLY PORTFOLIO HOLDINGS
The Corporation files a complete listing of portfolio holdings for the Funds with the SEC as of the first and third quarters of each fiscal year on Form N-Q. The filings are available upon request by calling 1-855-612-3936. Furthermore, you may obtain a copy of the filing on the SEC’s website at http://www.sec.gov. The Funds’ Forms N-Q may also be reviewed and copied at the SEC’s Public Reference Room in Washington, D.C., and information on the operation of the Public Reference Room may be obtained by calling 1-800-SEC-0330.
| | |
20 | | 1-855-612-3936 | www.cortinafunds.com |
| | |
| | Directors’ Consideration and Approval of Advisory Agreement |
| | December 31, 2011 (Unaudited) |
On August 8, 2011, the Directors met in person to discuss, among other things, the approval of the Investment Advisory Agreement (the “Advisory Agreement”) between the Corporation and Cortina Asset Management, LLC (the “Adviser”) with respect to the Cortina Small Cap Growth Fund and Cortina Small Cap Value Fund (the “Funds”) in accordance with Section 15(c) of the Investment Company Act of 1940, as amended (the “1940 Act”). The Directors received materials to assist them in considering the approval of the proposed Advisory Agreement, including a draft of the Advisory Agreement, a memorandum prepared by legal counsel discussing in detail the Directors’ fiduciary obligations and the factors they should assess in considering the approval of the Advisory Agreement, due diligence materials relating to the Adviser, including the Adviser’s Form ADV, information regarding key personnel and information relating to the Adviser’s and the Funds’ compliance programs and certifications regarding the Adviser’s and the Funds’ Code of Ethics.
Based on their evaluation of the information provided by the Adviser, in conjunction with the Funds’ other service providers, the Directors, by a unanimous vote (including a separate vote of the Directors who are not “interested persons,” as the term is defined in the 1940 Act (“Independent Directors”)), approved the Advisory Agreement for a two year period ending September 30, 2013.
Investment Advisory Fee Rate: The Directors reviewed and considered the contractual annual advisory fee to be paid by the Corporation, on behalf of the Funds, to the Adviser of 1.00% of each Fund’s daily average net assets, in light of the extent and quality of the advisory services to be provided by the Adviser to the Funds.
The Directors considered the information they received comparing the Funds’ contractual annual advisory fee to the fees charged by the Adviser to its separate accounts, noting that the fees were comparable. The Directors also noted that the Adviser had agreed to enter into an Expense Cap/Reimbursement Agreement under which the Adviser would cap each Fund’s total expense ratio at 1.10% through at least December 31, 2012.
Nature, Extent and Quality of the Services under the Advisory Agreement: The Directors received and considered information regarding the nature, extent and quality of services to be provided to the Funds under the Advisory Agreement. The Directors reviewed and considered the Adviser’s investment advisory personnel, its history as an asset manager, its performance and the amount of assets currently under management by the Adviser. The Directors also reviewed the research and decision-making processes utilized by the Adviser, including the methods adopted to seek to achieve compliance with the investment objectives, policies and restrictions of the Funds.
The Directors considered the background and experience of the Adviser’s management in connection with the Funds, including reviewing the qualifications, backgrounds and responsibilities of the management team primarily responsible for the day-to-day portfolio management of the Funds and the extent of the resources devoted to research and analysis of actual and potential investments.
Performance: The Directors noted that since the Funds had not yet begun operations, there was no fund performance to be reviewed or analyzed at this time. However, the Directors reviewed performance information with respect to comparable strategies managed by the Adviser for its separate accounts, noting in each case that the Adviser’s performance for its separate accounts was favorable compared to a broad based index.
The Adviser’s Profitability: The Directors considered the Funds’ cost structure, including the Expense Cap/Reimbursement Agreement, noting that the Adviser would likely need to subsidize the Funds until the Funds had garnered substantial assets. The Directors noted that they had received and reviewed financial data regarding the Adviser which indicated that the Adviser was in a position to subsidize the Funds. Thus the Directors were comfortable with the financial stability of the Adviser given that the Funds were unlikely to be profitable to the Adviser for a period of time.
Economies of Scale: The Directors considered whether economies of scale in the provision of services to the Funds will be passed along to the shareholders under the proposed agreements. The Directors noted that the Adviser would consider breakpoints if and when the assets in the Funds warranted such consideration.
Other Benefits to the Adviser: The Directors reviewed and considered any other benefits derived or to be derived by the Adviser from its relationship with the Funds, including soft dollar arrangements.
Based on the Directors’ deliberations and their evaluation of the information described above, the Directors, including all of the Independent Directors, concluded that the Adviser’s compensation for investment advisory services is consistent with the best interests of the Funds and their shareholders.
| | | | |
Semi-Annual Report | December 31, 2011 | | | 21 | |

Material must be accompanied or preceded by the prospectus.
The Cortina Funds are distributed by ALPS Distributors, Inc.
Item 2. Code of Ethics.
Not applicable to this report.
Item 3. Audit Committee Financial Expert.
Not applicable to this report.
Item 4. Principal Accountant Fees and Services.
Not applicable to this report.
Item 5. Audit Committee of Listed Registrants.
Not applicable to registrant.
Item 6. Investments.
The Schedule of Investments is included as part of the report to shareholders filed under Item 1 of this Form N-CSR.
Item 7. Disclosure of Proxy Voting Policies and Procedures for Closed-End Management Investment Companies.
Not applicable to registrant.
Item 8. Portfolio Managers of Closed-End Management Investment Companies.
Not applicable to registrant.
Item 9. Purchases of Equity Securities by Closed-End Management Investment Company and Affiliated Purchasers.
Not applicable to registrant.
Item 10. Submission of Matters to Vote of Security Holders.
Not applicable.
Item 11. Controls and Procedures.
| | (a) | The registrant’s principal executive officer and principal financial officer have concluded that the registrant’s disclosure controls and procedures (as defined in Rule 30a-3(c) under the Investment Company Act of 1940, as amended) are effective based on their evaluation of these controls and procedures as of a date within 90 days of the filing date of this report. |
| | (b) | There was no change in the registrant’s internal control over financial reporting (as defined in Rule 30a-3(d) under the Investment Company Act of 1940, as amended) during the second fiscal quarter of the period covered by this report that has materially affected, or is reasonably likely to materially affect, the registrant’s internal control over financial reporting. |
Item 12. Exhibits.
| | (a)(1) | Not applicable to this report. |
| | (a)(2) | The certifications required by Rule 30a-2(a) of the Investment Company Act of 1940, as amended, and Section 302 of the Sarbanes-Oxley Act of 2002 are attached hereto as Ex.99.Cert. |
| | (b) | A certification of the registrant’s principal executive officer and principal financial officer, as required by Rule 30a-2(b) under the Investment Company Act of 1940, as amended, is attached as Ex.99.906.Cert. |
SIGNATURES
Pursuant to the requirements of the Securities Exchange Act of 1934 and the Investment Company Act of 1940, the registrant has duly caused this report to be signed on its behalf by the undersigned, thereunto duly authorized.
| | |
| Cortina Funds, Inc. |
| |
| By: | | /s/ Ryan T. Davies |
| | Ryan T. Davies, President |
| | (Principal Executive Officer) |
| |
| Date: | | March 7, 2012 |
Pursuant to the requirements of the Securities Exchange Act of 1934 and the Investment Company Act of 1940, this report has been signed below by the following persons on behalf of the registrant and in the capacities and on the dates indicated.
| | |
| By: | | /s/ Terese Nielsen |
| | Terese Nielsen, Treasurer and |
| | Principal Accounting Officer |
| | (Principal Financial Officer) |
| |
| Date: | | March 7, 2012 |