UNITED STATES
SECURITIES AND EXCHANGE COMMISSION
Washington, D.C. 20549
FORM N-CSR
CERTIFIED SHAREHOLDER REPORT OF REGISTERED
MANAGEMENT INVESTMENT COMPANIES
Investment Company Act file number: 811-21580
CORTINA FUNDS, INC.
(Exact name of registrant as specified in charter)
825 N. Jefferson St., Suite 400, Milwaukee, WI 53202
(Address of principal executive offices) (Zip code)
(414) 225-7365
Registrant’s telephone number, including area code
Lori Hoch
825 N. Jefferson St., Suite 400
Milwaukee, WI 53202
(Name and address of agent for service)
Date of fiscal year end: June 30
Date of reporting period: July 1, 2013 - December 31, 2013
Item 1. Reports to Stockholders.
The following is a copy of the report to shareholders pursuant to Rule 30e-1 under the Investment Company Act of 1940 (17 CFR 270.30e-1).
2
TABLE OF CONTENTS
| | |

| | Shareholder Letter |
Cortina Small Cap Growth Fund | | December 31, 2013 (Unaudited) |
DEAR FELLOW SHAREHOLDERS:
December 31st marks the midway point of our 2014 fiscal year and we are pleased to report that the Cortina Small Cap Growth Fund is off to a solid start. Positive returns in each of the six months compounded to a very attractive return of more than 20%. Despite the strong absolute returns of the Fund, performance was modestly below that of its benchmark, the Russell 2000 Growth Index, which was up in five of the six months. When taken in combination with the second half of our 2013 fiscal year, our calendar year 2013 returns were strong both in absolute and relative terms.
While our process constructs portfolios from the bottom up with sector allocations being a byproduct of security selection, the Fund was fairly well positioned in the period. Our largest overweight sectors, Technology, Health Care and Energy, were all strong performers in the benchmark. Likewise, we were underweight the Consumer Discretionary and Financial Services sectors which, along with the tiny Utilities sector, were two of the three worst performing benchmark sectors. Partially offsetting these positive active weights were our meaningful underweights in the Materials & Processing and Producer Durables sectors, which were strong contributors to benchmark returns. Our relatively small exposure to these sectors is a reflection of the dearth of innovation and sustainable competitive advantages that we see in small companies in what are largely scale businesses. Importantly, while we were underweight, our security selection within these sectors was very strong.
Given our focus on security selection, the more pertinent discussion in relation to our performance is at the industry and security level. We were generally pleased with security selection in the period as the market was receptive to our style and rewarded high growth companies of all sizes. Furthermore, unlike the period in late 2012, there were fewer macro events to draw investors’ attention away from individual company fundamentals or lead investors to avoid smaller companies and those that do not pay dividends. Conversely, in addition to a handful of disappointing investments, which are likely to occur in most if not all six-month periods, certain market dynamics hampered relative performance. First, our lack of direct exposure to biotechnology and pharmaceutical companies continues to be a headwind for our strategy that shuns binary event risk and focuses on companies with approved products on the marketplace. We continue to have indirect exposure to these industries through software and life sciences companies that benefit from drug development and clinical trial spending. Second, after a very strong September quarter, we experienced weakness in two industries that heretofore had been standout performers for the Fund – namely Software as a Service (SAAS)/Cloud Computing companies and oil-focused domestic shale energy companies. The rapid appreciation and escalating valuations of many of these stocks led to profit taking, particularly in October and November. We were very active in trimming many of these positions, as well and have reallocated the proceeds into stocks where we see better risk/reward opportunities.
Outlook and Positioning
The current bull market has been both long (approaching five years) and powerful (the S&P 500 and Russell 2000 Index have appreciated 203% and 262%, respectively, off of their 2009 troughs through year end). When it should end is anyone’s guess, but the two bearish arguments that we hear most often revolve around recent strength in the market and concern over elevated valuations – both of these arguments are particularly loud when it comes to small caps. If historical precedent holds this time around, there is no reason to think that the bull market can’t continue. Past bull markets have been both longer and stronger on average. Furthermore, this particular bull market is coming off of a more severe bear market than most, implying that there is more healing to be done than is typical. The valuation argument has a little more merit as we are approaching the average price/earnings multiple at which past bull markets have stalled out. By no means should this be a call for panic, especially considering the broad range around the averages, but it merits consideration. For small caps, which have led the bull market by a wide margin, valuations relative to large caps are more stretched. In fact, the small cap P/E multiple is approaching the high end of its historical relative valuation premium. As mentioned above, high valuations towards the end of 2013 caught our eye in certain industries and were behind an aggressive round of profit taking in the Fund portfolio. Yet, consistent with our mandate we remain fully invested and consistent with our history as we continue to find interesting and underappreciated growth vehicles in which to invest. Broad-based multiple expansion may cease to be the tide that lifts all boats, but that reality should only help to make companies with outsized growth opportunities all the more dear. Each and every day our research firepower is aimed at discovering uniquely positioned companies with catalysts for sales and profit acceleration.
On a more bullish note, if there is one takeaway from 2013 it is that animal spirits are on their way back. While not yet pervasive, and not yet to a fever pitch, there are many signs emerging that the pendulum is swinging away from fear and presumably toward greed. Since 2009, investors’ attitudes towards equities have been varied. The boldest remained involved; however, for others it has taken some time for confidence to return. Net fund flows into equities did not gain meaningful traction until 2013, and there is still a long way to go before ameliorating the equity capital flight of the past half decade. Furthermore, the attractive returns investors have been able to earn in treasuries and corporate bonds are unlikely to continue as interest rates slowly move upwards. We suspect that 2014 could be the year that the fear of losing money in the stock market transitions to a fear of missing out on further market gains.
Investing involves risks, including loss of principal.
P/E Price to Earnings is a valuation ratio of a company’s current share price compared to its per-share earnings.
S&P 500® Index is the Standard & Poor’s composite index of 500 stocks, a widely recognized, unmanaged index of common stock prices.
| | |
Semi-Annual Report | December 31, 2013 | | 1 |
| | |
| | Portfolio Information |
Cortina Small Cap Growth Fund | | December 31, 2013 (Unaudited) |
Growth of $25,000 Investment (Unaudited)
For the period from September 30, 2011 (Inception) to December 31, 2013.
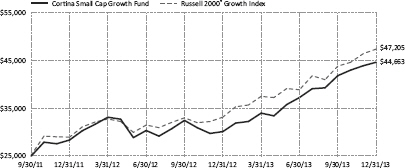
This graph assumes an initial $25,000 investment at September 30, 2011 (Inception Date). The Cortina Small Cap Growth Fund (the “Fund”) will deduct a 2.00% redemption proceeds fee on Fund shares held 60 days or less. This graph depicts the performance of the Fund versus the Russell 2000® Growth Index. It is important to note the Fund is a professionally managed mutual fund while the index is not available for investment and is unmanaged. The comparison is shown for illustrative purposes only.
This chart does not reflect the deduction of taxes that a shareholder would pay on Fund distributions or the redemption of Fund shares.
Performance Returns for the period ended December 31, 2013
| | | | | | | | | | | | | | | | | | | | | | | | | |
| | | 1 Month | | 6 Months | | 1 Year | | Since Inception* | | Gross Expense Ratio** |
Cortina Small Cap Growth Fund | | | | 1.64% | | | | | 19.85% | | | | | 48.25% | | | | | 29.39% | | | | | 3.86% | |
Russell 2000® Growth Index | | | | 2.05% | | | | | 22.02% | | | | | 43.30% | | | | | 32.61% | | | | | | |
| * | The Fund’s inception date is September 30, 2011. |
| ** | Cortina Asset Management, LLC (the “Adviser”) has contractually agreed to waive management fees and/or reimburse the Fund’s operating expenses in order to limit the Fund’s total annual fund operating expenses (excluding taxes, leverage, interest, brokerage commissions, dividends or interest expenses on short positions, acquired fund fees and expenses and extraordinary expenses) to 1.10% of average daily net assets of the Fund. The agreement will continue in effect at least through October 31, 2014, subject thereafter to annual re-approval of the agreement by the Fund’s Board of Directors. |
Past performance does not guarantee future results. The performance data quoted represents past performance and current returns may be lower or higher. Total return figures include change in share price, reinvestment of dividends and capital gains. The investment return and principal value will fluctuate so that an investor’s shares, when redeemed may be worth more or less than their original cost. To obtain performance information current to the most recent month end, call 1-855-612-3936.
Russell 2000® Growth Index measures the performance of the small-cap growth segment of the U.S. equity universe. It includes those Russell 2000 companies with higher price-to-value ratios and higher forecasted growth values. All indices are unmanaged. It is not possible to invest directly in an index.
Sector Allocations***
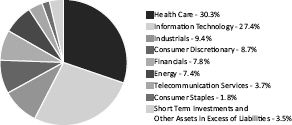
*** Percentages are based on net assets as of December 31, 2013. Holdings are subject to change.
| | |
2 | | 1-855-612-3936 | www.cortinafunds.com |
| | |
| | Shareholder Letter |
Cortina Small Cap Value Fund | | December 31, 2013 (Unaudited) |
DEAR FELLOW SHAREHOLDERS:
“Everything is amazing right now and nobody is happy.”
- Louis C.K.
2013 was a tough year for the country. The United States Congress managed, if one could so define “managed,” to accomplish little but shutting down the government and creating special dispensation for its staff to avoid the worst impacts of the Affordable Care Act (ACA). President Obama has been able to play plenty of golf because it has been exceptionally difficult for him to enact any policy without it being hung up by various cliques within the legislative branch. Foreign leaders have rightly looked at us and wondered why anyone would want to emulate our version of democracy.
Yet on a quantitative measure, the U.S. equity markets had one of their best years – ever – and current events indicate that optimism about the economy is at its highest level since 2007. In other words, every right-of-center political candidate could simply note that when government is at its least effective the economy and financial markets are at their most ebullient.
In 2013 the Cortina Small Value Fund performed very well, growing its worth by nearly half on an absolute basis and well ahead of its benchmark, the Russell 2000 Value Index. Performance was consistent with previous periods in that stock selection was the prime factor in the outperformance.
Yes, but...& Competitive Advantage
By most measures, and we measure by management commentary instead of talking-head commentary, demand is stable and accelerating, costs are well-controlled, and those with good products are doing well. On a macro basis, headline economic data has been decent, and while some good numbers are offset by a ho-hum figure here and there, the trends are moving in a healthy direction.
Yet most observers often strike the same pose when discussing the economy. The pose is one of smirking disbelief as each piece of good news is delivered with a wink and a smile indicating that even the bearer of good news does not quite believe its veracity. The nation seems to have morphed into a Prozac-needing entity that is much happier whining about how it isn’t quite good enough in this newfangled world and wouldn’t it better to talk about the sad things than admit that life is actually pretty good. Yes, the tablet in my hands can simultaneously read me Shakespeare, order my groceries, and navigate me from here to there efficiently, but...
Although we ourselves are not schooled in the immensely challenging yet immensely entertaining world of improvisational comedy, we do know one of the earliest rules taught at one of our local New York City institutions dedicated to the craft is that of “Yes, but...”
“Yes, but...” kills the story every time. When your fellow performer throws out a line and your response is “yes, but...” it invalidates the direction, kills the momentum and discredits the other performer. “Yes, and...” continues the story and takes one to places never anticipated.
Yes, the economy appears to be improving, but “health care reform has caused great uncertainty in corporate boardrooms” is fairly drab. Yes, the economy is improving, and “there is an ongoing effort throughout the nation to better manage the challenges of health care expenses” sounds somewhat upbeat. Yes, the economy is stable, but “there are questions about companies’ intention to commit to capital spending” is a bummer. Yes, the economy is improving, and “companies are considering increasing capital spending” sounds like the feel good movie of the summer.
“Yes, the company has developed the leading health care insurance exchange and will be a crucial part of the health care continuum” led us to one of our best investments of 2012-2013 when everyone else was saying, “Yes, nice insurance exchange, but nobody knows what the future will bring.”
Our competitive advantage may simply be saying, “Yes, the company is changing and we believe for the better,” while other investors are saying, “Yes, the company is changing but I am nervous because I can’t see the future completely clearly.”
Positioning & Process
In sum, the economy has remained decent and we believe the passage of time is driving us closer to accelerating growth. Yes, corporate profits are at all-time highs and the Federal Reserve is actively reducing its economic stimulus due to that strength. Yes, federal sequestration and local budget cuts have reduced general deficits and now those entities have the financial capability to once again begin addressing infrastructure investments. Yes, the market has risen dramatically and we continue to see opportunity ahead.
The portfolio is currently positioned in a similar fashion to the most recent update – a high weighting in Financials, a slight overweight in Industrials and a material one in Technology. The one notable change is a significant reduction in our Health Care exposure as several holdings in the segment
| | |
Semi-Annual Report | December 31, 2013 | | 3 |
| | |
| | Shareholder Letter |
Cortina Small Cap Value Fund | | December 31, 2013 (Unaudited) |
reached our targets and were thus sold. The turmoil of the ACA implementation has made investing in the sector more complicated, but much opportunity exists and we expect the weighting to increase in coming quarters.
Finally, for clarity and with seriousness, although ‘yes, and’ may be a legitimate advantage, we believe our true competitive advantage lays within our process. ‘We believe in Evolution’ is a true philosophy that focuses our research efforts on finding companies changing for the better. But philosophy is like policy; it doesn’t matter how good the intention is if the execution is poor. ‘We believe in process’ may be a better summation: New ideas are the full responsibility of the sponsoring analyst and are all subject to peer review; review the portfolio weekly as a team; revisit the assumptions and thesis behind each holding at the start of every quarter; sell investments with a broken thesis regardless of valuation.
We use this process to optimize the portfolio on a regular basis. Occasionally, we part with much beloved companies whose valuation is simply full, and occasionally we part with much researched firms whose narratives have played too long without delivering much return. It is far too easy to be lulled into complacency by low valuations and the familiarity of a well known story. Stay not in the comfort of familiar places when the best opportunities may reside elsewhere. We think about value as the worth of an investment, not the price of an equity. With that approach, we strive to allocate your hard-earned capital to deliver the best returns with the least risk we can find.
Investing involves risks, including loss of principal.
| | |
4 | | 1-855-612-3936 | www.cortinafunds.com |
| | |
| | Portfolio Information |
Cortina Small Cap Value Fund | | December 31, 2013 (Unaudited) |
Growth of $25,000 Investment (Unaudited)
For the period from September 30, 2011 (Inception) to December 31, 2013.
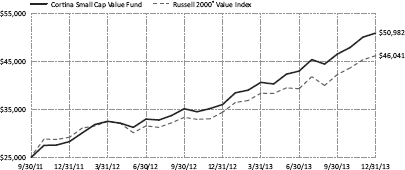
This graph assumes an initial $25,000 investment at September 30, 2011 (Inception Date). The Cortina Small Cap Value Fund (the “Fund”) will deduct a 2.00% redemption proceeds fee on Fund shares held 60 days or less. This graph depicts the performance of the Fund versus the Russell 2000® Value Index. It is important to note the Fund is a professionally managed mutual fund, while the index is not available for investment and is unmanaged. The comparison is shown for illustrative purposes only.
This chart does not reflect the deduction of taxes that a shareholder would pay on Fund distributions or the redemption of Fund shares.
Performance Returns for the period ended December 31, 2013
| | | | | | | | | | | | | | | | | | | | | | | | | |
| | 1 Month | | 6 Months | | 1 Year | | Since Inception* | | Gross Expense Ratio** |
Cortina Small Cap Value Fund | | | | 1.74% | | | | | 18.48% | | | | | 41.49% | | | | | 37.22% | | | | | 5.57% | |
Russell 2000® Value Index | | | | 1.88% | | | | | 17.60% | | | | | 34.52% | | | | | 31.15% | | | | | | |
| * | The Fund’s inception date is September 30, 2011. |
| ** | Cortina Asset Management, LLC (the “Adviser”) has contractually agreed to waive management fees and/or reimburse the Fund’s operating expenses in order to limit the Fund’s total annual fund operating expenses (excluding taxes, leverage, interest, brokerage commissions, dividends or interest expenses on short positions, acquired fund fees and expenses and extraordinary expenses) to 1.10% of average daily net assets of the Fund. The agreement will continue in effect at least through October 31, 2014, subject thereafter to annual re-approval of the agreement by the Fund’s Board of Directors. |
Past performance does not guarantee future results. The performance data quoted represents past performance and current returns may be lower or higher. Total return figures include change in share price, reinvestment of dividends and capital gains. The investment return and principal value will fluctuate so that an investor’s shares, when redeemed may be worth more or less than their original cost. To obtain performance information current to the most recent month end, call 1-855-612-3936.
Russell 2000® Value Index measures the performance of those Russell 2000 companies with lower price-to-book ratios and lower forecasted growth values. All indices are unmanaged. It is not possible to invest directly in an index.
Sector Allocations***
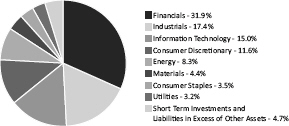
*** Percentages are based on net assets as of December 31, 2013. Holdings are subject to change.
| | |
Semi-Annual Report | December 31, 2013 | | 5 |
| | |
| | Disclosure of Fund Expenses |
| | December 31, 2013 (Unaudited) |
As a shareholder of the Fund(s), you incur ongoing costs, including management fees and other Fund expenses. This example is intended to help you understand your ongoing costs (in dollars) of investing in each Fund and to compare these costs with the ongoing costs of investing in other mutual funds. The example is based on an investment of $1,000 invested at the beginning of the period and held for the entire period, as indicated below.
Actual Expenses – The first line of the table below provides information about the actual account values and actual expenses. You may use the information in this line, together with the amount you invested, to estimate the expenses that you paid over the period. Simply divide your account value by $1,000 (for example, an $8,600 account value divided by $1,000 = 8.6) then multiply the result by the number in the first line under the heading entitled “Expenses Paid During Period” to estimate the expenses you paid on your account during this period.
Hypothetical Example for Comparison Purposes – The second line of the table below provides information about hypothetical account values and hypothetical expenses based on each Fund’s actual expense ratio and an assumed annual rate of return of 5% before expenses, which is not each Fund’s actual return. The hypothetical account values and expenses may not be used to estimate the actual ending account balance or expenses you paid for the period. You may use this information to compare the ongoing costs of investing in each Fund and other funds by comparing these 5% hypothetical examples with the 5% hypothetical examples that appear in the shareholder reports of other funds.
Please note that the expenses shown in the table are meant to highlight your ongoing costs only and do not reflect any direct costs, such as wire fees or low balance fees. Therefore, the second line of the table is useful in comparing ongoing costs and will not help you determine the relative total costs of owning different funds. In addition, if these direct costs were included, your costs would be higher.
| | | | | | | | | | | | | | | | | | | | |
| | | Beginning Account Value July 1, 2013 | | Ending Account Value December 31, 2013 | | Expenses Paid During Period(a) | | Net Expense Ratios |
Cortina Small Cap Growth Fund | | | | | | | | | | | | | | | | | | | | |
Actual Fund Return | | | $ | 1,000.00 | | | | $ | 1,198.50 | | | | $ | 6.10 | | | | | 1.10% | |
Hypothetical Fund Return (assuming a 5% return before expenses) | | | $ | 1,000.00 | | | | $ | 1,019.66 | | | | $ | 5.60 | | | | | 1.10% | |
Cortina Small Cap Value Fund | | | | | | | | | | | | | | | | | | | | |
Actual Fund Return | | | $ | 1,000.00 | | | | $ | 1,184.80 | | | | $ | 6.06 | | | | | 1.10% | |
Hypothetical Fund Return (assuming a 5% return before expenses) | | | $ | 1,000.00 | | | | $ | 1,019.66 | | | | $ | 5.60 | | | | | 1.10% | |
| (a) | Expenses are equal to the Fund’s annualized expense ratio multiplied by the average account value over the period, multiplied by the number |
| | of days in the most recent fiscal half year (184), divided by 365. |
| | |
6 | | 1-855-612-3936 | www.cortinafunds.com |
| | |
| | Schedule of Investments |
Cortina Small Cap Growth Fund | | December 31, 2013 (Unaudited) |
| | | | | | | | |
| | | Shares | | | Value | |
COMMON STOCKS (96.5%) | | | | | | | | |
Consumer Discretionary (8.7%) | | | | | | | | |
Black Diamond, Inc.(a) | | | 20,050 | | | $ | 267,267 | |
Chuy’s Holdings, Inc.(a) | | | 6,517 | | | | 234,742 | |
Five Below, Inc.(a) | | | 5,927 | | | | 256,046 | |
Gentherm, Inc.(a) | | | 9,792 | | | | 262,524 | |
Imax Corp.(a) | | | 10,907 | | | | 321,538 | |
Motorcar Parts of America, Inc.(a) | | | 10,786 | | | | 208,170 | |
Restoration Hardware Holdings, Inc.(a) | | | 3,488 | | | | 234,742 | |
Shutterfly, Inc.(a) | | | 7,980 | | | | 406,421 | |
Tumi Holdings, Inc.(a) | | | 15,634 | | | | 352,547 | |
Universal Electronics, Inc.(a) | | | 6,022 | | | | 229,499 | |
| | | | | | | | |
| | | | | | | 2,773,496 | |
| | | | | | | | |
Consumer Staples (1.8%) | | | | | | | | |
Annie’s, Inc.(a) | | | 6,194 | | | | 266,590 | |
Boulder Brands, Inc.(a) | | | 19,254 | | | | 305,368 | |
| | | | | | | | |
| | | | | | | 571,958 | |
| | | | | | | | |
Energy (7.4%) | | | | | | | | |
Carrizo Oil & Gas, Inc.(a) | | | 7,067 | | | | 316,390 | |
Evolution Petroleum Corp. | | | 19,896 | | | | 245,517 | |
Northern Oil & Gas, Inc.(a) | | | 24,014 | | | | 361,891 | |
Rex Energy Corp.(a) | | | 10,427 | | | | 205,516 | |
RigNet, Inc.(a) | | | 7,520 | | | | 360,434 | |
Sanchez Energy Corp.(a) | | | 11,186 | | | | 274,169 | |
Synergy Resources Corp.(a) | | | 35,721 | | | | 330,776 | |
Triangle Petroleum Corp.(a) | | | 30,792 | | | | 256,189 | |
| | | | | | | | |
| | | | | | | 2,350,882 | |
| | | | | | | | |
Financials (7.8%) | | | | | | | | |
The Bancorp, Inc.(a) | | | 15,946 | | | | 285,593 | |
BofI Holding, Inc.(a) | | | 4,148 | | | | 325,328 | |
eHealth, Inc.(a) | | | 6,752 | | | | 313,900 | |
EverBank Financial Corp. | | | 15,117 | | | | 277,246 | |
Greenhill & Co., Inc. | | | 6,121 | | | | 354,651 | |
Health Insurance Innovations, Inc., Class A(a) | | | 22,404 | | | | 226,504 | |
ICG Group, Inc.(a) | | | 16,540 | | | | 308,140 | |
Pinnacle Financial Partners, Inc. | | | 6,711 | | | | 218,309 | |
Tristate Capital Holdings, Inc.(a) | | | 13,621 | | | | 161,545 | |
| | | | | | | | |
| | | | | | | 2,471,216 | |
| | | | | | | | |
Health Care (30.3%) | | | | | | | | |
ABIOMED, Inc.(a) | | | 7,988 | | | | 213,599 | |
Align Technology, Inc.(a) | | | 5,600 | | | | 320,040 | |
AtriCure, Inc.(a) | | | 30,803 | | | | 575,400 | |
BioScrip, Inc.(a) | | | 31,390 | | | | 232,286 | |
BioTelemetry, Inc.(a) | | | 35,263 | | | | 279,988 | |
Cepheid, Inc.(a) | | | 5,912 | | | | 276,209 | |
Cerus Corp.(a) | | | 43,914 | | | | 283,245 | |
DexCom, Inc.(a) | | | 9,345 | | | | 330,907 | |
Endologix, Inc.(a) | | | 23,226 | | | | 405,062 | |
Fluidigm Corp.(a) | | | 12,110 | | | | 464,055 | |
HealthStream, Inc.(a) | | | 10,034 | | | | 328,814 | |
HeartWare International, Inc.(a) | | | 4,867 | | | | 457,303 | |
Icad, Inc.(a) | | | 22,852 | | | | 266,454 | |
Imris, Inc.(a) | | | 49,074 | | | | 78,028 | |
Insulet Corp.(a) | | | 6,139 | | | | 227,757 | |
Medidata Solutions, Inc.(a) | | | 5,318 | | | | 322,111 | |
NanoString Technologies, Inc.(a) | | | 5,974 | | | | 102,992 | |
Neogen Corp.(a) | | | 7,779 | | | | 355,500 | |
| | |
| See Notes to Financial Statements. | | |
Semi-Annual Report | December 31, 2013 | | 7 |
| | |
| | Schedule of Investments |
Cortina Small Cap Growth Fund | | December 31, 2013 (Unaudited) |
| | | | | | | | |
| | | Shares | | | Value | |
COMMON STOCKS (continued) | | | | | | | | |
Health Care (continued) | | | | | | | | |
NeoGenomics, Inc.(a) | | | 89,101 | | | $ | 322,546 | |
Novadaq Technologies, Inc.(a) | | | 16,724 | | | | 275,779 | |
NxStage Medical, Inc.(a) | | | 20,611 | | | | 206,110 | |
OraSure Technologies, Inc.(a) | | | 40,199 | | | | 252,852 | |
PhotoMedex, Inc.(a) | | | 16,757 | | | | 217,003 | |
Quidel Corp.(a) | | | 12,543 | | | | 387,453 | |
Spectranetics Corp.(a) | | | 25,019 | | | | 625,475 | |
Staar Surgical Co.(a) | | | 30,110 | | | | 487,481 | |
Streamline Health Solutions, Inc.(a) | | | 36,715 | | | | 256,271 | |
Synergetics USA, Inc.(a) | | | 59,992 | | | | 217,171 | |
TearLab Corp.(a) | | | 37,683 | | | | 351,959 | |
Uroplasty, Inc.(a) | | | 43,192 | | | | 117,914 | |
Vocera Communications, Inc.(a) | | | 25,194 | | | | 393,278 | |
| | | | | | | | |
| | | | | | | 9,631,042 | |
| | | | | | | | |
Industrials (9.4%) | | | | | | | | |
Aegean Marine Petroleum Network, Inc. | | | 32,296 | | | | 362,361 | |
Astronics Corp.(a) | | | 5,059 | | | | 258,009 | |
Chart Industries, Inc.(a) | | | 2,043 | | | | 195,392 | |
Graham Corp. | | | 6,099 | | | | 221,333 | |
Heritage Crystal Clean, Inc.(a) | | | 9,334 | | | | 191,254 | |
Manitex International, Inc.(a) | | | 24,286 | | | | 385,662 | |
Power Solutions International, Inc.(a) | | | 2,795 | | | | 209,904 | |
PowerSecure International, Inc.(a) | | | 13,764 | | | | 236,328 | |
Team, Inc.(a) | | | 7,544 | | | | 319,413 | |
Trex Co. Inc.(a) | | | 4,086 | | | | 324,960 | |
Wesco Aircraft Holdings, Inc.(a) | | | 12,598 | | | | 276,148 | |
| | | | | | | | |
| | | | | | | 2,980,764 | |
| | | | | | | | |
Information Technology (27.4%) | | | | | | | | |
Brightcove, Inc.(a) | | | 24,876 | | | | 351,747 | |
Clicksoftware Technologies, Ltd. | | | 39,403 | | | | 295,522 | |
Covisint Corp.(a) | | | 16,452 | | | | 206,472 | |
Envestnet, Inc.(a) | | | 7,372 | | | | 297,091 | |
Extreme Networks, Inc.(a) | | | 63,656 | | | | 445,592 | |
Gigamon, Inc.(a) | | | 11,626 | | | | 326,458 | |
Infoblox, Inc.(a) | | | 7,900 | | | | 260,858 | |
Inphi Corp.(a) | | | 30,227 | | | | 389,928 | |
Integrated Silicon Solution, Inc.(a) | | | 19,529 | | | | 236,106 | |
Interactive Intelligence Group, Inc.(a) | | | 4,749 | | | | 319,893 | |
Internap Network Services Corp.(a) | | | 47,244 | | | | 355,275 | |
InterXion Holding NV(a) | | | 18,290 | | | | 431,827 | |
Marchex, Inc. | | | 25,500 | | | | 220,575 | |
MaxLinear, Inc., Class A(a) | | | 34,811 | | | | 363,079 | |
Move, Inc.(a) | | | 17,615 | | | | 281,664 | |
Numerex Corp., Class A(a) | | | 24,084 | | | | 311,888 | |
Perficient, Inc.(a) | | | 16,830 | | | | 394,159 | |
Procera Networks, Inc.(a) | | | 24,532 | | | | 368,471 | |
Qlik Technologies, Inc.(a) | | | 7,009 | | | | 186,650 | |
RADWARE, Ltd.(a) | | | 21,682 | | | | 389,842 | |
Rally Software Development Corp.(a) | | | 12,982 | | | | 252,500 | |
SciQuest, Inc.(a) | | | 9,231 | | | | 262,899 | |
ShoreTel, Inc.(a) | | | 15,906 | | | | 147,608 | |
Stamps.com, Inc.(a) | | | 6,136 | | | | 258,326 | |
Synchronoss Technologies, Inc.(a) | | | 10,786 | | | | 335,121 | |
Tangoe, Inc.(a) | | | 21,227 | | | | 382,298 | |
Trulia, Inc.(a) | | | 2,835 | | | | 99,990 | |
| | |
| See Notes to Financial Statements. |
8 | | 1-855-612-3936 | www.cortinafunds.com |
| | |
| | Schedule of Investments |
Cortina Small Cap Growth Fund | | December 31, 2013 (Unaudited) |
| | | | | | | | |
| | | Shares | | | Value | |
COMMON STOCKS (continued) | | | | | | | | |
Information Technology (continued) | | | | | | | | |
WebMD Health Corp.(a) | | | 12,957 | | | $ | 511,801 | |
| | | | | | | | |
| | | | | | | 8,683,640 | |
| | | | | | | | |
Telecommunication Services (3.7%) | | | | | | | | |
8x8, Inc.(a) | | | 30,854 | | | | 313,477 | |
Cogent Communications Group, Inc. | | | 10,155 | | | | 410,363 | |
inContact, Inc.(a) | | | 56,216 | | | | 439,047 | |
| | | | | | | | |
| | | | | | | 1,162,887 | |
| | | | | | | | |
| | |
TOTAL COMMON STOCKS
(COST $24,118,619) | | | | | | | 30,625,885 | |
| | | | | | | | |
| | |
SHORT TERM INVESTMENT (3.3%) | | | | | | | | |
Daily Income Fund, 7 Day Yield 0.019% | | | 1,024,044 | | | | 1,024,044 | |
| | | | | | | | |
| | |
TOTAL SHORT TERM INVESTMENT
(COST $1,024,044) | | | | | | | 1,024,044 | |
| | | | | | | | |
| | |
TOTAL INVESTMENTS (99.8%)
(COST $25,142,663) | | | | | | | 31,649,929 | |
| | | | | | | | |
| | |
TOTAL ASSETS IN EXCESS OF OTHER LIABILITIES (0.2%) | | | | | | | 78,133 | |
| | | | | | | | |
| | |
NET ASSETS 100.0% | | | | | | $ | 31,728,062 | |
| | | | | | | | |
| (a) | Non Income Producing Security. |
Common Abbreviations:
Ltd. - Limited.
NV - Naamloze Vennootschap is the Dutch term for a public limited liability corporation.
| | |
| See Notes to Financial Statements. | | |
Semi-Annual Report | December 31, 2013 | | 9 |
| | |
| | Schedule of Investments |
Cortina Small Cap Value Fund | | December 31, 2013 (Unaudited) |
| | | | | | | | |
| | | Shares | | | Value | |
COMMON STOCKS (95.3%) | | | | | | | | |
Consumer Discretionary (11.6%) | | | | | | | | |
AFC Enterprises, Inc.(a) | | | 3,459 | | | $ | 133,171 | |
ANN, Inc.(a) | | | 11,107 | | | | 406,072 | |
DreamWorks Animation SKG, Inc., Class A(a) | | | 11,873 | | | | 421,492 | |
Helen of Troy, Ltd.(a) | | | 7,967 | | | | 394,446 | |
Life Time Fitness, Inc.(a) | | | 6,297 | | | | 295,959 | |
Stage Stores, Inc. | | | 20,667 | | | | 459,221 | |
Taylor Morrison Home Corp.(a) | | | 15,902 | | | | 357,000 | |
World Wrestling Entertainment, Inc. | | | 34,900 | | | | 578,642 | |
| | | | | | | | |
| | | | | | | 3,046,003 | |
| | | | | | | | |
Consumer Staples (3.5%) | | | | | | | | |
Darling International, Inc.(a) | | | 13,206 | | | | 275,741 | |
Elizabeth Arden, Inc.(a) | | | 9,514 | | | | 337,272 | |
Prestige Brands Holdings, Inc.(a) | | | 8,334 | | | | 298,357 | |
| | | | | | | | |
| | | | | | | 911,370 | |
| | | | | | | | |
Energy (8.3%) | | | | | | | | |
Comstock Resources, Inc. | | | 22,596 | | | | 413,281 | |
Geospace Technologies Corp.(a) | | | 3,524 | | | | 334,181 | |
Gulfport Energy Corp.(a) | | | 3,815 | | | | 240,917 | |
Helix Energy Solutions Group, Inc.(a) | | | 14,999 | | | | 347,677 | |
Matador Resources Co.(a) | | | 22,046 | | | | 410,938 | |
McDermott International, Inc.(a) | | | 47,340 | | | | 433,634 | |
| | | | | | | | |
| | | | | | | 2,180,628 | |
| | | | | | | | |
Financials (31.9%) | | | | | | | | |
Altisource Residential Corp., Class B | | | 16,684 | | | | 502,355 | |
The Bancorp, Inc.(a) | | | 21,019 | | | | 376,450 | |
BancorpSouth, Inc. | | | 21,111 | | | | 536,642 | |
Boston Private Financial Holdings, Inc. | | | 25,707 | | | | 324,422 | |
Capitol Federal Financial, Inc. | | | 19,533 | | | | 236,545 | |
CNO Financial Group, Inc. | | | 43,188 | | | | 763,996 | |
Columbia Banking System, Inc. | | | 13,558 | | | | 372,980 | |
DFC Global Corp.(a) | | | 29,277 | | | | 335,222 | |
eHealth, Inc.(a) | | | 4,887 | | | | 227,197 | |
Employers Holdings, Inc. | | | 13,436 | | | | 425,249 | |
JGWPT Holdings, Inc.(a) | | | 18,599 | | | | 323,437 | |
Maiden Holdings, Ltd. | | | 29,859 | | | | 326,359 | |
MB Financial, Inc. | | | 12,639 | | | | 405,585 | |
OFG Bancorp | | | 17,664 | | | | 306,294 | |
Oritani Financial Corp. | | | 17,388 | | | | 279,077 | |
PacWest Bancorp | | | 13,129 | | | | 554,306 | |
PennyMac Mortgage Investment Trust | | | 14,033 | | | | 322,198 | |
PHH Corp.(a) | | | 22,536 | | | | 548,751 | |
Platinum Underwriters Holdings, Ltd. | | | 7,338 | | | | 449,673 | |
ProAssurance Corp. | | | 5,883 | | | | 285,208 | |
Texas Capital Bancshares, Inc.(a) | | | 7,660 | | | | 476,452 | |
| | | | | | | | |
| | | | | | | 8,378,398 | |
| | | | | | | | |
Industrials (17.4%) | | | | | | | | |
Cubic Corp. | | | 8,028 | | | | 422,755 | |
EnerNOC, Inc.(a) | | | 22,459 | | | | 386,519 | |
Harsco Corp. | | | 15,060 | | | | 422,132 | |
Hyster-Yale Materials Handling, Inc. | | | 3,738 | | | | 348,232 | |
The Manitowoc Co., Inc. | | | 14,340 | | | | 334,409 | |
MasTec, Inc.(a) | | | 12,118 | | | | 396,501 | |
NCI Building Systems, Inc.(a) | | | 24,267 | | | | 425,643 | |
Performant Financial Corp.(a) | | | 23,700 | | | | 244,110 | |
Powell Industries, Inc. | | | 4,152 | | | | 278,142 | |
| | |
| See Notes to Financial Statements. |
10 | | 1-855-612-3936 | www.cortinafunds.com |
| | |
| | Schedule of Investments |
Cortina Small Cap Value Fund | | December 31, 2013 (Unaudited) |
| | | | | | | | |
| | | Shares | | | Value | |
COMMON STOCKS (continued) | | | | | | | | |
Industrials (continued) | | | | | | | | |
Raven Industries, Inc. | | | 9,973 | | | $ | 410,289 | |
TrueBlue, Inc.(a) | | | 19,472 | | | | 501,988 | |
Tutor Perini Corp.(a) | | | 14,769 | | | | 388,425 | |
| | | | | | | | |
| | | | | | | 4,559,145 | |
| | | | | | | | |
Information Technology (15.0%) | | | | | | | | |
Cardtronics, Inc.(a) | | | 4,397 | | | | 191,050 | |
Cognex Corp.(a) | | | 10,755 | | | | 410,626 | |
Coherent, Inc.(a) | | | 4,719 | | | | 351,046 | |
Digital River, Inc.(a) | | | 18,599 | | | | 344,082 | |
Global Eagle Entertainment, Inc.(a) | | | 20,606 | | | | 306,411 | |
Integrated Device Technology, Inc.(a) | | | 33,888 | | | | 345,319 | |
Intersil Corp. | | | 25,907 | | | | 297,153 | |
Move, Inc.(a) | | | 17,220 | | | | 275,348 | |
OSI Systems, Inc.(a) | | | 11,184 | | | | 593,982 | |
Sierra Wireless, Inc.(a) | | | 18,599 | | | | 449,538 | |
Super Micro Computer, Inc.(a) | | | 21,065 | | | | 361,475 | |
| | | | | | | | |
| | | | | | | 3,926,030 | |
| | | | | | | | |
Materials (4.4%) | | | | | | | | |
Ferro Corp.(a) | | | 23,685 | | | | 303,878 | |
Flotek Industries, Inc.(a) | | | 14,907 | | | | 299,183 | |
Graphic Packaging Holdings Co.(a) | | | 58,661 | | | | 563,146 | |
| | | | | | | | |
| | | | | | | 1,166,207 | |
| | | | | | | | |
Utilities (3.2%) | | | | | | | | |
ALLETE, Inc. | | | 8,058 | | | | 401,933 | |
Black Hills Corp. | | | 8,104 | | | | 425,541 | |
| | | | | | | | |
| | | | | | | 827,474 | |
| | | | | | | | |
| | |
TOTAL COMMON STOCKS
(COST $21,384,726) | | | | | | | 24,995,255 | |
| | | | | | | | |
| | |
SHORT TERM INVESTMENT (6.7%) | | | | | | | | |
Daily Income Fund, 7 Day Yield 0.019% | | | 1,742,244 | | | | 1,742,244 | |
| | | | | | | | |
| | |
TOTAL SHORT TERM INVESTMENT
(COST $1,742,244) | | | | | | | 1,742,244 | |
| | | | | | | | |
| | |
TOTAL INVESTMENTS (102.0%) (COST $23,126,970) | | | | | | | 26,737,499 | |
| | | | | | | | |
| | |
TOTAL LIABILITIES IN EXCESS OF OTHER ASSETS (-2.0%) | | | | | | | (512,044) | |
| | | | | | | | |
| | |
NET ASSETS 100.0% | | | | | | $ | 26,225,455 | |
| | | | | | | | |
| (a) | Non Income Producing Security. |
Common Abbreviations:
Ltd. - Limited.
| | |
| See Notes to Financial Statements. |
Semi-Annual Report | December 31, 2013 | | 11 |
| | |
| | Statements of Assets and Liabilities |
| | December 31, 2013 (Unaudited) |
| | | | | | | | |
| | | Cortina Small Cap Growth Fund | | | Cortina Small Cap Value Fund | |
| | | | |
ASSETS: | | | | | | | | |
Investments, at value (Cost - see below) | | $ | 31,649,929 | | | $ | 26,737,499 | |
Receivable for investments sold | | | 160,018 | | | | 217,224 | |
Receivable for fund shares subscribed | | | 18,299 | | | | 18,000 | |
Dividends receivable | | | 33 | | | | 7,968 | |
Prepaid expenses and other assets | | | 19,169 | | | | 19,151 | |
| | | | |
Total Assets | | | 31,847,448 | | | | 26,999,842 | |
| | | | |
| | |
LIABILITIES: | | | | | | | | |
Payable for investments purchased | | | 72,983 | | | | 751,643 | |
Payable for fund shares redeemed | | | 6,188 | | | | 193 | |
Payable for director fees | | | 459 | | | | 470 | |
Payable for advisory fees | | | 8,001 | | | | 1,758 | |
Payable for fund accounting and administration fees | | | 9,966 | | | | 7,931 | |
Payable for audit and legal fees | | | 12,721 | | | | 8,748 | |
Other accrued liabilities and expenses | | | 9,068 | | | | 3,644 | |
| | | | |
Total Liabilities | | | 119,386 | | | | 774,387 | |
| | | | |
Net Assets | | $ | 31,728,062 | | | $ | 26,225,455 | |
| | | | |
| | |
NET ASSETS CONSISTS OF: | | | | | | | | |
Paid-in capital | | $ | 24,831,614 | | | $ | 22,704,291 | |
Accumulated net investment loss | | | (199,566) | | | | (17,477) | |
Accumulated undistributed net realized gain/(loss) on investments | | | 588,748 | | | | (70,657) | |
Net unrealized appreciation on investments | | | 6,507,266 | | | | 3,609,298 | |
| | | | |
Net Assets | | $ | 31,728,062 | | | $ | 26,225,455 | |
| | | | |
| | |
Cost of Investments | | $ | 25,142,663 | | | $ | 23,126,970 | |
| | |
PRICING OF SHARES: | | | | | | | | |
Net Assets | | $ | 31,728,062 | | | $ | 26,225,455 | |
Shares Outstanding | | | 1,845,245 | | | | 1,436,150 | |
Net Asset Value, offering and redemption price per share | | $ | 17.19 | | | $ | 18.26 | |
| | |
| See Notes to Financial Statements. |
12 | | 1-855-612-3936 | www.cortinafunds.com |
| | |
| | Statements of Operations |
| | For the Six Months Ended December 31, 2013 (Unaudited) |
| | | | | | | | |
| | | Cortina Small Cap Growth Fund | | | Cortina Small Cap Value Fund | |
| | | | |
INVESTMENT INCOME: | | | | | | | | |
Dividends, (net of foreign withholding taxes of $163 and $78) | | $ | 12,054 | | | $ | 98,827 | |
| | | | |
Total Investment Income | | | 12,054 | | | | 98,827 | |
| | | | |
| | |
EXPENSES: | | | | | | | | |
Advisory fees (Note 3) | | | 127,596 | | | | 82,196 | |
Transfer agent fees | | | 19,424 | | | | 16,353 | |
Fund accounting and administration fees and expenses | | | 63,892 | | | | 37,867 | |
Legal fees | | | 10,488 | | | | 3,847 | |
Printing fees | | | 4,372 | | | | 2,530 | |
Registration fees | | | 12,274 | | | | 11,337 | |
Audit and tax preparation fees | | | 7,310 | | | | 7,310 | |
Custodian fees | | | 2,909 | | | | 1,559 | |
Insurance | | | 4,337 | | | | 4,338 | |
Director fee and expenses | | | 3,709 | | | | 3,720 | |
Other | | | 4,169 | | | | 2,657 | |
| | | | |
Total Expenses Before Waivers/Reimbursements | | | 260,480 | | | | 173,714 | |
Less fees waived/reimbursed by adviser (Note 3) | | | (120,121 | ) | | | (83,299 | ) |
| | | | |
Total Net Expenses | | | 140,359 | | | | 90,415 | |
| | | | |
Net Investment Income/(Loss) | | | (128,305 | ) | | | 8,412 | |
| | | | |
| | |
REALIZED AND UNREALIZED GAIN ON INVESTMENTS: | | | | | | | | |
Net realized gain on investments | | | 931,297 | | | | 57,104 | |
Net change in unrealized appreciation on investments | | | 3,638,527 | | | | 2,795,613 | |
| | | | |
Net Realized and Unrealized Gain on Investments | | | 4,569,824 | | | | 2,852,717 | |
| | | | |
Net Increase in Net Assets Resulting from Operations | | $ | 4,441,519 | | | $ | 2,861,129 | |
| | | | |
| | |
| See Notes to Financial Statements. | | |
Semi-Annual Report | December 31, 2013 | | 13 |
| | |
| | Statements of Changes in Net Assets |
| | |
| | | | | | | | | | | | | | | | |
| | | Cortina Small Cap Growth Fund | | | Cortina Small Cap Value Fund | |
| | | | |
| | | Six Months Ended December 31, 2013 (Unaudited) | | | Year Ended June 30, 2013 | | | Six Months Ended December 31, 2013 (Unaudited) | | | Year Ended June 30, 2013 | |
| |
| | | | |
OPERATIONS: | | | | | | | | | | | | | | | | |
Net investment income/(loss) | | $ | (128,305) | | | $ | (97,270) | | | $ | 8,412 | | | $ | 3,107 | |
Net realized gain/(loss) on investments | | | 931,297 | | | | (50,842) | | | | 57,104 | | | | 263,251 | |
Net change in unrealized appreciation of investments | | | 3,638,527 | | | | 2,731,439 | | | | 2,795,613 | | | | 609,341 | |
| | | | |
Net increase in net assets resulting from operations | | | 4,441,519 | | | | 2,583,327 | | | | 2,861,129 | | | | 875,699 | |
| | | | |
| | | | |
DISTRIBUTIONS TO SHAREHOLDERS: | | | | | | | | | | | | | | | | |
From net investment income | | | – | | | | – | | | | (14,778) | | | | (15,144) | |
From net realized gains on investments | | | (243,542) | | | | (68,752) | | | | (315,888) | | | | (113,367) | |
| | | | |
Total distributions | | | (243,542) | | | | (68,752) | | | | (330,666) | | | | (128,511) | |
| | | | |
| | | | |
CAPITAL SHARE TRANSACTIONS: | | | | | | | | | | | | | | | | |
Proceeds from sale of shares | | | 10,449,965 | | | | 15,302,028 | | | | 19,655,317 | | | | 1,751,217 | |
Shares issued in reinvestment of distributions | | | 241,504 | | | | 67,885 | | | | 314,553 | | | | 123,043 | |
Cost of shares redeemed | | | (1,406,589) | | | | (1,049,424) | | | | (618,453) | | | | (219,642) | |
Redemption fees | | | 329 | | | | – | | | | – | | | | – | |
| | | | |
Net increase from capital shares transactions | | | 9,285,209 | | | | 14,320,489 | | | | 19,351,417 | | | | 1,654,618 | |
| | | | |
| | | | |
Net increase in net assets | | | 13,483,186 | | | | 16,835,064 | | | | 21,881,880 | | | | 2,401,806 | |
| | | | |
| | | | |
NET ASSETS: | | | | | | | | | | | | | | | | |
Beginning of period | | | 18,244,876 | | | | 1,409,812 | | | | 4,343,575 | | | | 1,941,769 | |
| | | | |
End of period | | $ | 31,728,062 | | | $ | 18,244,876 | | | $ | 26,225,455 | | | $ | 4,343,575 | |
| | | | |
Including accumulated net investment loss of: | | $ | (199,566) | | | $ | (71,261) | | | $ | (17,477) | | | $ | (11,111) | |
| | | | |
OTHER INFORMATION: | | | | | | | | | | | | | | | | |
Share Transactions: | | | | | | | | | | | | | | | | |
Beginning shares | | | 1,261,863 | | | | 118,741 | | | | 278,108 | | | | 154,872 | |
Shares sold | | | 656,501 | | | | 1,218,364 | | | | 1,175,863 | | | | 128,860 | |
Shares issued in reinvestment of dividends | | | 14,654 | | | | 5,773 | | | | 17,802 | | | | 9,357 | |
Less shares redeemed | | | (87,773) | | | | (81,015) | | | | (35,623) | | | | (14,981) | |
| | | | |
Ending shares | | | 1,845,245 | | | | 1,261,863 | | | | 1,436,150 | | | | 278,108 | |
| | | | |
| | |
See Notes to Financial Statements. |
14 | | 1-855-612-3936 | www.cortinafunds.com |
| | |
| | Financial Highlights |
Cortina Small Cap Growth Fund | | For a share outstanding throughout the periods presented. |
| | | | | | |
| | | Six Months Ended December 31, 2013 (Unaudited) | | Year Ended
June 30, 2013 | | For the Period September 30, 2011 (Inception) to June 30, 2012 |
|
NET ASSET VALUE, BEGINNING OF PERIOD | | $14.46 | | $11.87 | | $10.00 |
INCOME/(LOSS) FROM INVESTMENT OPERATIONS: | | | | | | |
Net investment loss(a) | | (0.08) | | (0.13) | | (0.09) |
Net realized and unrealized gain on investments | | 2.94 | | 2.81 | | 2.22 |
| | |
Total from Investment Operations | | 2.86 | | 2.68 | | 2.13 |
| | |
| | | |
DIVIDENDS AND DISTRIBUTIONS TO SHAREHOLDERS: | | | | | | |
From net realized gains on investments | | (0.13) | | (0.09) | | (0.26) |
| | |
Total Dividends and Distributions to Shareholders | | (0.13) | | (0.09) | | (0.26) |
| | |
| | | |
Paid-in Capital from Redemption Fees | | 0.00(b) | | – | | 0.00(b) |
| | |
| | | |
NET INCREASE IN NET ASSET VALUE | | 2.73 | | 2.59 | | 1.87 |
| | |
| | | |
NET ASSET VALUE, END OF PERIOD | | $17.19 | | $14.46 | | $11.87 |
| | |
| | | |
TOTAL RETURN | | 19.85%(c) | | 22.79% | | 21.40%(c) |
| | | |
RATIOS AND SUPPLEMENTAL DATA: | | | | | | |
Net assets, end of period (in 000s) | | $31,728 | | $18,245 | | $1,410 |
| | | |
RATIOS TO AVERAGE NET ASSETS: | | | | | | |
Operating expenses excluding waiver/reimbursement | | 2.04%(d) | | 3.85% | | 21.70%(d) |
Operating expenses including waiver/reimbursement | | 1.10%(d) | | 1.10% | | 1.10%(d) |
Net investment loss including waiver/reimbursement | | (1.01)%(d) | | (1.00)% | | (0.99)%(d) |
| | | |
PORTFOLIO TURNOVER RATE | | 40% | | 73% | | 144% |
| (a) | Calculated using average shares throughout the period. |
| (b) | Less than $0.005 per share. |
| | | | |
See Notes to Financial Statements. | | | | |
Semi-Annual Report | December 31, 2013 | | | 15 | |
| | |
| | Financial Highlights |
Cortina Small Cap Value Fund | | For a share outstanding throughout the periods presented. |
| | | | | | |
| | | Six Months Ended
December 31, 2013
(Unaudited) | | Year Ended
June 30, 2013 | | For the Period
September 30, 2011
(Inception) to June 30, 2012 |
|
NET ASSET VALUE, BEGINNING OF PERIOD | | $15.62 | | $12.54 | | $10.00 |
INCOME/(LOSS) FROM INVESTMENT OPERATIONS: | | | | | | |
Net investment income/(loss)(a) | | 0.01 | | 0.01 | | (0.03) |
Net realized and unrealized gain on investments | | 2.87 | | 3.68 | | 3.14 |
| | |
Total from Investment Operations | | 2.88 | | 3.69 | | 3.11 |
| | |
| | | |
DIVIDENDS AND DISTRIBUTIONS TO SHAREHOLDERS: | | | | | | |
From net investment income | | (0.01) | | (0.07) | | – |
From net realized gains on investments | | (0.23) | | (0.54) | | (0.57) |
| | |
Total Dividends and Distributions to Shareholders | | (0.24) | | (0.61) | | (0.57) |
| | |
| | | |
Paid-in Capital from Redemption Fees | | – | | – | | 0.00(b) |
| | |
| | | |
NET INCREASE IN NET ASSET VALUE | | 2.64 | | 3.08 | | 2.54 |
| | |
| | | |
NET ASSET VALUE, END OF PERIOD | | $18.26 | | $15.62 | | $12.54 |
| | |
| | | |
TOTAL RETURN | | 18.48%(c) | | 30.41% | | 31.99%(c) |
| | | |
RATIOS AND SUPPLEMENTAL DATA: | | | | | | |
Net assets, end of period (in 000s) | | $26,225 | | $4,344 | | $1,942 |
| | | |
RATIOS TO AVERAGE NET ASSETS: | | | | | | |
Operating expenses excluding waiver/reimbursement | | 2.11%(d) | | 5.55% | | 22.37%(d) |
Operating expenses including waiver/reimbursement | | 1.10%(d) | | 1.10% | | 1.10%(d) |
Net investment income/(loss) including waiver/reimbursement | | 0.10%(d) | | 0.10% | | (0.32)%(d) |
| | | |
PORTFOLIO TURNOVER RATE | | 29% | | 81% | | 146% |
| (a) | Calculated using average shares throughout the period. |
| (b) | Less than $0.005 per share. |
| | |
See Notes to Financial Statements. |
16 | | 1-855-612-3936 | www.cortinafunds.com |
| | |
| | Notes to Financial Statements |
| | December 31, 2013 (Unaudited) |
1. ORGANIZATION
Cortina Funds, Inc. (the “Corporation”) is an open-end management investment company registered under the Investment Company Act of 1940, as amended (the “1940 Act”). The Corporation was organized on June 30, 2004 as a Wisconsin corporation. The Corporation currently offers shares of common stock (“shares”) of the Cortina Small Cap Growth Fund and the Cortina Small Cap Value Fund (each a “Fund” and collectively, the “Funds”). The Cortina Small Cap Growth Fund is a diversified portfolio with an investment objective to seek growth of capital, and the Cortina Small Cap Value Fund is a diversified portfolio with an investment objective to seek long-term capital appreciation. Shares of each Fund are designated as Institutional Shares with an indefinite number of shares authorized at $0.01 par value. The Articles of Incorporation, as amended and restated, permit the Board of Directors (the “Board”) to create additional funds and share classes. The Institutional Class is currently the only class offered.
2. SIGNIFICANT ACCOUNTING POLICIES
The following is a summary of significant accounting policies followed by the Funds. These policies are in conformity with U.S. generally accepted accounting principles (“GAAP”).
Use of Estimates — The accompanying financial statements were prepared in accordance with GAAP, which require the use of estimates and assumptions made by management. These may affect the reported amounts of assets and liabilities and disclosure of contingent asset and liabilities at the date of the financial statements and the reported amounts of increases and decreases in net assets from operations during the reporting period. Actual results could differ from those estimates.
Investment Valuation — Investment securities are valued at the last sale price at the close of the principal exchange on which they trade, except for securities listed on the National Association of Securities Dealers Automated Quotations (“NASDAQ”) exchange, which are valued at the NASDAQ official closing price. Unlisted securities or listed securities for which there were no sales during the day are valued at the closing bid price on such exchanges or over-the-counter markets. Investments for which market quotations are not readily available are valued at fair value as determined in good faith under consistently applied procedures approved by and under the general supervision of the Funds’ Board.
Investment Transactions — Investment security transactions are accounted for on trade date. Gains and losses on securities sold are determined on a specific identification basis.
Investment Income — Interest income is accrued and recorded on a daily basis including amortization of premiums, accretions of discounts and income earned from money market funds. Interest is not accrued on securities that are in default. Dividend income is recorded on the ex-dividend date.
Fair Value Measurements — A three-tier hierarchy has been established to classify fair value measurements for disclosure purposes. Inputs refer broadly to the assumptions that market participants would use in pricing the asset or liability, including assumptions about risk. Inputs may be observable or unobservable. Observable inputs are inputs that reflect the assumptions market participants would use in pricing the asset or liability that are developed based on market data obtained from sources independent of the reporting entity. Unobservable inputs are inputs that reflect the reporting entity’s own assumptions about the assumptions market participants would use in pricing the asset or liability that are developed based on the best information available. In accordance with the authoritative guidance on fair value measurements and disclosure under GAAP, the Funds disclose fair value of their investments in a hierarchy that prioritizes the inputs to valuation techniques used to measure the fair value.
Various inputs are used in determining the value of each Fund’s investments as of the reporting period end. The designated input levels are not necessarily an indication of the risk or liquidity associated with these investments. These inputs are categorized in the following hierarchy under applicable financial accounting standards:
| | |
| Level 1 — | | Unadjusted quoted prices in active markets for identical, unrestricted assets or liabilities that the Funds have the ability to access at the measurement date; |
| |
| Level 2 — | | Quoted prices which are not active, quoted prices for similar assets or liabilities in active markets or inputs other than quoted prices that are observable (either directly or indirectly) for substantially the full term of the asset or liability; and |
| |
| Level 3 — | | Significant unobservable prices or inputs (including the Fund’s own assumptions in determining the fair value of investments) where there is little or no market activity for the asset or liability at the measurement date. |
The availability of observable inputs can vary from security to security and is affected by a wide variety of factors, including, for example, the type of security, whether the security is new and not yet established in the marketplace, the liquidity of markets, and other characteristics particular to the security. To the extent that valuation is based on models or inputs that are less observable or unobservable in the market, the determination of
| | |
Semi-Annual Report | December 31, 2013 | | 17 |
| | |
| | Notes to Financial Statements |
| | December 31, 2013 (Unaudited) |
fair value requires more judgment. Accordingly, the degree of judgment exercised in determining fair value is greatest for instruments categorized in Level 3.
An investment level within the fair value hierarchy is based on the lowest level input, individually or in the aggregate, that is significant to fair value measurement. The valuation techniques used by the Funds to measure fair value during the six months ended December 31, 2013 maximized the use of observable inputs and minimized the use of unobservable inputs.
The inputs or methodology used for valuing securities are not necessarily an indication of the risk or liquidity associated with investing in those securities. The following is a summary of the inputs used in valuing the Funds’ investments as of December 31, 2013:
Cortina Small Cap Growth Fund
| | | | | | | | | | | | | | | | |
| | | Valuation Inputs | | | | |
| Investments in Securities at Value* | | Level 1 | | | Level 2 | | | Level 3 | | | Total | |
| |
Common Stocks | | $ | 30,625,885 | | | $ | – | | | $ | – | | | $ | 30,625,885 | |
Short Term Investment | | | 1,024,044 | | | | – | | | | – | | | | 1,024,044 | |
| | | | |
Total | | $ | 31,649,929 | | | $ | – | | | $ | – | | | $ | 31,649,929 | |
| | | | |
Cortina Small Cap Value Fund
| | | | | | | | | | | | | | | | |
| | | Valuation Inputs | | | | |
| Investments in Securities at Value* | | Level 1 | | | Level 2 | | | Level 3 | | | Total | |
| |
Common Stocks | | $ | 24,995,255 | | | $ | – | | | $ | – | | | $ | 24,995,255 | |
Short Term Investment | | | 1,742,244 | | | | – | | | | – | | | | 1,742,244 | |
| | | | |
Total | | $ | 26,737,499 | | | $ | – | | | $ | – | | | $ | 26,737,499 | |
| | | | |
| * | See Schedule of Investments for sector classification. |
For the six months ended December 31, 2013, there have been no significant changes to the Funds’ fair value methodologies. Additionally, there were no transfers into or out of Levels 1 and 2 during the six months ended December 31, 2013. It is the Funds’ policy to recognize transfers at the end of the reporting period.
For the six months ended December 31, 2013, the Funds did not have investments with significant unobservable inputs (Level 3) used in determining fair value.
Affiliated Companies — An affiliated company is a company that can have direct or indirect common ownership. The Funds do not hold any investments in affiliated companies as of December 31, 2013.
Expenses — The Funds bear expenses incurred specifically on each Fund’s respective behalf as well as a portion of general Corporation expenses, which may be allocated on the basis of relative net assets or the nature of the services performed relative to applicability to each Fund.
Distributions to Shareholders — Dividends from net investment income and distributions of net realized capital gains, if any, will be declared and paid at least annually. Income and capital gains distributions are determined in accordance with income tax regulations, which may differ from GAAP. Distributions to shareholders are recorded on the ex-dividend date.
Fees on Redemptions — The Funds will deduct a 2.00% redemption proceeds fee on Fund shares held 60 days or less. The redemption fee is not a fee to finance sales or sales promotion expenses, but is paid to the Funds to defray the costs of liquidating an investor and discouraging short-term trading of the Funds’ shares. No redemption fee will be imposed on redemptions initiated by the Funds.
Federal Income Taxes — As of and during the six months ended December 31, 2013, the Funds did not have a liability for any unrecognized tax benefits. The Funds file U.S. federal, state, and local tax returns as required. The Funds’ tax returns are subject to examination by the relevant tax authorities until expiration of the applicable statute of limitations which is generally three years after the filing of the tax return for federal purposes and four years for most state returns. Tax returns for open years have incorporated no uncertain tax positions that require a provision for income taxes. The Funds intend to distribute to shareholders all taxable investment income and realized gains, and otherwise comply with Subchapter M of the Internal Revenue Code of 1986, as amended, applicable to regulated investment companies.
| | |
18 | | 1-855-612-3936 | www.cortinafunds.com |
| | |
| | Notes to Financial Statements |
| | December 31, 2013 (Unaudited) |
3. ADVISORY FEES, FUND ACCOUNTING, ADMINISTRATION FEES, AND OTHER AGREEMENTS
Investment Advisory
The Adviser is subject to the general supervision of the Board and is responsible for the overall management of the Funds’ business affairs. The Adviser invests the assets of the Funds based on the Funds’ investment objectives and policies. The Adviser is entitled to an investment advisory fee, computed daily and payable monthly, of 1.00% of the average daily net assets for each Fund.
The Adviser has contractually agreed to waive fees with respect to each of the Funds so that the net annual operating expenses (excluding taxes, leverage, interest, brokerage commissions, dividends or interest expenses on short positions, acquired fund fees and expenses, and extraordinary expenses) of the Funds’ institutional shares will not exceed 1.10% of average daily net assets of each Fund. The Adviser may request a reimbursement from the Funds to recapture any reduced management fees or reimbursed Fund expenses within three years following the fee reduction or expense reimbursement, but only to the extent the Funds’ total annual fund operating expenses including offering costs, plus any requested reimbursement amount, including previously waived organizational costs, are less than the above limit at the time of the request. Any such reimbursement is subject to review by the Board.
As of December 31, 2013, reimbursements (including offering costs and the previously waived organizational costs) that may potentially be made by the Fund to the Adviser total $441,775 for the Cortina Small Cap Growth Fund and $303,359 for the Cortina Small Cap Value Fund expire as follows:
| | | | | | | | |
| Cortina Small Cap Growth Fund | | | | | | | |
|
September 19, 2014 | | | | $ | 10,250 | | | |
June 30, 2015 | | | | | 163,407 | | | |
June 30, 2016 | | | | | 268,118 | | | |
| | |
| | | | $ | 441,775 | | | |
| | | |
| Cortina Small Cap Value Fund | | | | | | | |
|
September 19, 2014 | | | | $ | 10,250 | | | |
June 30, 2015 | | | | | 152,715 | | | |
June 30, 2016 | | | | | 140,394 | | | |
| | |
| | | | $ | 303,359 | | | |
Fund Accounting Fees and Expenses
ALPS Fund Services, Inc. (“ALPS” or the “Administrator”) provides administrative, fund accounting and other services to the Funds for a monthly administration fee based on the Funds’ average daily net assets at the following annual rates.
Year 1
Greater of $175,000 annual minimum in Year 1 or the following basis point fee schedule:
| | | | | | |
Average Daily Net Assets | | | | Basis Point
Fee Rate | | |
|
Between $0-$500M | | | | 5.0 | | |
$500M-$1B | | | | 3.0 | | |
Above $1B | | | | 2.0 | | |
Year 2 and Forward
Greater of $190,000 annual minimum in Year 2 or the above basis point fee schedule.
The Administrator is also reimbursed by the Funds for certain out-of-pocket expenses.
Transfer Agent
ALPS serves as transfer, dividend paying and shareholder servicing agent for the Funds (the “Transfer Agent”).
Compliance Services
ALPS provides services that assist the Corporation’s Chief Compliance Officer in monitoring and testing the policies and procedures of the Corporation in conjunction with requirements under Rule 38a-1 under the 1940 Act. ALPS is compensated under the Administration Agreement.
| | |
Semi-Annual Report | December 31, 2013 | | 19 |
| | |
| | Notes to Financial Statements |
| | December 31, 2013 (Unaudited) |
Distributor
The Funds have entered into a Distribution Agreement with ALPS Distributors, Inc (“the Distributor”) to provide distribution services to the Funds. The Distributor serves as underwriter/distributor of shares of the Funds.
Certain Directors and Officers of the Funds are also officers of the Adviser.
4. PURCHASES AND SALES OF INVESTMENT SECURITIES
The aggregate cost of purchases and proceeds from sales of investment securities, excluding short-term securities, are shown below for the six months ended December 31, 2013. Purchases and proceeds from sales of U.S. Government obligations are included in the totals of Purchases of Securities and Proceeds from Sales of Securities below and also broken out separately for your convenience:
| | | | | | | | |
| Fund Name | | Purchases | | | Sales | |
Cortina Small Cap Growth Fund | | $ | 18,179,651 | | | $ | 9,692,598 | |
Cortina Small Cap Value Fund | | | 22,485,131 | | | | 4,482,063 | |
There were no purchases of long-term U. S. Government Obligations for either Fund during the six months ended December 31, 2013.
5. TAX BASIS INFORMATION
Income and long-term capital gain distributions are determined in accordance with Federal income tax regulations, which differ from GAAP, and, therefore, may differ significantly in amount or character from net investment income and realized gains for financial reporting purposes.
The tax character of distributions paid during the year ended June 30, 2013, were as follows:
| | | | | | | | |
| Fund | | Ordinary Income | | | Long-Term Capital Gain | |
Cortina Small Cap Growth Fund | | $ | 68,752 | | | $ | – | |
Cortina Small Cap Value Fund | | | 124,309 | | | | 4,202 | |
As of December 31, 2013, the aggregate cost of investments, gross unrealized appreciation/(depreciation) and net unrealized appreciation/(depreciation) for Federal tax purposes was as follows:
| | | | | | | | | | | | | | | | |
| Fund | | Cost of Investments for Income Tax Purposes | | | Gross Appreciation (excess of value over tax cost) | | | Gross Depreciation (excess of tax cost over value) | | | Net Unrealized Appreciation | |
Cortina Small Cap Growth Fund | | $ | 25,259,504 | | | $ | 7,274,644 | | | $ | (884,219 | ) | | $ | 6,390,425 | |
Cortina Small Cap Value Fund | | | 23,204,215 | | | | 3,823,757 | | | | (290,473 | ) | | | 3,533,284 | |
The difference between book basis and tax basis net unrealized appreciation is attributable to the deferral of losses from wash sales and passive foreign investment companies.
6. COMMITMENTS AND CONTINGENCIES
Under the Corporation’s organizational documents, its Officers and Directors are indemnified against certain liabilities arising out of the performance of their duties to the Funds. In addition, in the normal course of business, the Corporation entered into contracts with its service providers, on behalf of the Funds, and others that provide for general indemnifications. The Funds’ maximum exposure under these arrangements is unknown, as this would involve future claims that may be made against the Funds. The Funds expect risk of loss to be remote.
| | |
20 | | 1-855-612-3936 | www.cortinafunds.com |
| | |
| | Additional Information |
| | December 31, 2013 (Unaudited) |
1. PROXY VOTING POLICIES AND VOTING RECORD
A description of the policies and procedures that the Funds use to vote proxies relating to portfolio securities is available without charge upon request by calling toll-free 1-855-612-3936, or on the Securities and Exchange Commission’s (“SEC”) website at http://www.sec.gov. Information regarding how the Funds voted proxies relating to portfolio securities during the most recent fiscal year end June 30, 2013 is available without charge upon request by calling toll-free 1-855-612-3936, or on the SEC’s website at http://www.sec.gov.
2. QUARTERLY PORTFOLIO HOLDINGS
The Corporation files a complete listing of portfolio holdings for the Funds with the SEC as of the first and third quarters of each fiscal year on Form N-Q. The filings are available upon request by calling 1-855-612-3936. Furthermore, you may obtain a copy of the filing on the SEC’s website at http://www.sec.gov. The Funds’ Forms N-Q may also be reviewed and copied at the SEC’s Public Reference Room in Washington, D.C., and information on the operation of the Public Reference Room may be obtained by calling 1-800-SEC-0330.
| | |
Semi-Annual Report | December 31, 2013 | | 21 |

| | |
Material must be accompanied or preceded by the prospectus. The Cortina Funds are distributed by ALPS Distributors, Inc. | | |
Item 2. Code of Ethics.
Not applicable to this report.
Item 3. Audit Committee Financial Expert.
Not applicable to this report.
Item 4. Principal Accountant Fees and Services.
Not applicable to this report.
Item 5. Audit Committee of Listed Registrants.
Not applicable to registrant.
Item 6. Investments.
The Schedule of Investments is included as part of the report to shareholders filed under Item 1 of this
Form N-CSR.
Item 7. Disclosure of Proxy Voting Policies and Procedures for Closed-End Management Investment Companies.
Not applicable to registrant.
Item 8. Portfolio Managers of Closed-End Management Investment Companies.
Not applicable to registrant.
Item 9. Purchases of Equity Securities by Closed-End Management Investment Company and Affiliated Purchasers.
Not applicable to registrant.
Item 10. Submission of Matters to Vote of Security Holders.
Not applicable.
Item 11. Controls and Procedures.
3
| | | | |
| | (a) | | The registrant’s principal executive officer and principal financial officer have concluded that the registrant’s disclosure controls and procedures (as defined in Rule 30a-3(c) under the Investment Company Act of 1940, as amended) are effective based on their evaluation of these controls and procedures as of a date within 90 days of the filing date of this report. |
| | |
| | (b) | | There was no change in the registrant’s internal control over financial reporting (as defined in
Rule 30a-3(d) under the Investment Company Act of 1940, as amended) during the second fiscal quarter of the period covered by this report that has materially affected, or is reasonably likely to materially affect, the registrant’s internal control over financial reporting. |
|
Item 12. Exhibits. |
| | |
| | (a)(1) | | Not applicable to this report. |
| | |
| | (a)(2) | | The certifications required by Rule 30a-2(a) of the Investment Company Act of 1940, as amended, and Section 302 of the Sarbanes-Oxley Act of 2002 are attached hereto as Ex.99.Cert. |
| | |
| | (a)(3) | | Not applicable. |
| | |
| | (b) | | A certification of the registrant’s principal executive officer and principal financial officer, as required by Rule 30a-2(b) under the Investment Company Act of 1940, as amended, is attached as Ex.99.906.Cert. |
4
SIGNATURES
Pursuant to the requirements of the Securities Exchange Act of 1934 and the Investment Company Act of 1940, the registrant has duly caused this report to be signed on its behalf by the undersigned, thereunto duly authorized.
| | |
Cortina Funds, Inc. |
| |
By: | | /s/ Ryan T. Davies |
| | Ryan T. Davies, President |
| | (Principal Executive Officer) |
| |
Date: | | March 7, 2014 |
Pursuant to the requirements of the Securities Exchange Act of 1934 and the Investment Company Act of 1940, this report has been signed below by the following persons on behalf of the registrant and in the capacities and on the dates indicated.
| | |
By: | | /s/ Eric Conner |
| | Eric Conner, Treasurer and Principal Accounting Officer |
| | (Principal Financial Officer) |
| |
Date: | | March 7, 2014 |
5