| Cortina Small Cap Growth Fund | |
| Shareholder Letter | 1 |
| Portfolio Information | 3 |
| Cortina Small Cap Value Fund | |
| Shareholder Letter | 4 |
| Portfolio Information | 5 |
| Disclosure of Fund Expenses | 6 |
| Schedule of Investment | |
| Cortina Small Cap Growth Fund | 7 |
| Cortina Small Cap Value Fund | 10 |
| Statements of Assets and Liabilities | 12 |
| Statements of Operations | 13 |
| Statements of Changes in Net Assets | 14 |
| Financial Highlights | |
| Cortina Small Cap Growth Fund | 15 |
| Cortina Small Cap Value Fund - Institutional | 16 |
| Cortina Small Cap Value Fund - Investor | 17 |
| Notes to Financial Statements | 18 |
| Additional Information | 22 |
 | Shareholder Letter |
| Cortina Small Cap Growth Fund | December 31, 2016 (Unaudited) |
DEAR FELLOW SHAREHOLDERS:
For the Cortina Small Cap Growth Fund the first half of Fiscal 2017 has been a strong period. The market remained its positive direction and received a strong boost of stimulus from the U.S. Presidential Election which particularly favored small caps. The Fund has outperformed the Russell 2000 Growth Index, its principal benchmark, over the past three, six and twelve month periods. With a mandate to find companies committed to growth, prospects for the domestic economy which could become increasingly unleashed provides a very constructive backdrop for the Fund.
It is now difficult to imagine the investment landscape and environment prior to the election because since the surprise results of the second Tuesday in November it has been so front and center across the entire financial market. But in the early months of this fiscal six month period, the market was reacting positively to the Brexit vote. Signs of enthusiasm emerged as small cap stocks were drastically outperforming large caps and the growth style was becoming back en vogue. That was until the calendar turned to October and concerns over the prospects for U.S. economic growth, as well as upward pressure in interest rates, raised concerns and took stocks lower. Fears of the end of the multi-year slow and steady recovery in stocks were present.
Then the election occurred and Donald Trump was elected. Within hours of the vote, the fear of an unlikely outcome was ironically replaced with 'Hope and Change' optimism. It did not take long for the market to recognize the incoming President as pro-business, anti-regulation and committed to raising the average American's participation within the global economy. Trump's brand is of a can-do determination and with a legislative majority presumably prepared to facilitate changes in policy, it became easy to apply campaign rhetoric into brighter futures for many companies and industries.
From a sector perspective, a review of market performance over this six-month holding period, makes it easy to delineate who were the early winners and losers from the election. Energy companies benefit from a new administration interested in domestic production of oil & gas, Banks prosper alongside the prospect of higher interest rates, Industrials and Materials thrive as Trump-the-Builder promises large scale public infrastructure projects and the U.S. consumer should have more money to spend if domestic employment goes higher and personal tax rates go lower. Each of these sectors enjoyed double digit returns in our benchmark for the six months ended December 31. Information Technology was also a double digit return sector and it remains the Fund's largest sector both in absolute as well as relative to the Russell 2000 Growth Index benchmark.
On the contrary, those industries which are often classified as 'yield proxies' were the weakest performers during the period. Consumer Staples, Utilities and Telecom Services had been welcome places for investors to find yield in the form of dividends since low interest rates prevented the fixed income asset class from producing suitable income. The abrupt move in interest rates, and the associated decline in bond prices, however, diminished the relative attractiveness of the yield proxies. Finally some parts of the Health Care sector are languishing post-election. President Trump has vigorously challenged what he sees as aggressive drug pricing practices and has put the industry on high alert that government intervention is looming. Thankfully the Fund does not have exposure to clinical stage (pre-revenue) biotechnology stocks and has very little exposure to pharmaceuticals. So despite one of the Fund's largest sector exposures having one of the worst aggregate returns in the market, our preference for revenue-generating medical technology and life sciences companies made the Health Care sector the Fund's single largest contributor to return.
OUTLOOK & PORTFOLIO POSITIONING
From a positioning perspective, our favorite sectors have a familiar look to them. The Information Technology sector remains the Fund's largest sector exposure, both in absolute and relative to the benchmark. We think we are early to some under discovered gems as four of the five largest IT positions are underneath $1 billion in market cap at present. Broadly, the IT portion of the portfolio has significantly less exposure to software holdings versus years past. Trends we are aiming to exploit are the consumption of video in an over-the-top fashion as well as tools necessary to assemble, design, inspect and test semiconductors which are getting increasingly smaller and difficult to handle.
Following a very constructive calendar year for the Energy sector, the Fund continues to have a sizable overweight exposure. Commodity prices will always have a significant say in individual company/stock performance and prices for the most part respond to the supply-demand dynamics. The supply side of the equation was recently influenced by the production cut agreed to at the November Organization of the Petroleum Exporting Countries ("OPEC") meeting. The investments in the Fund not only enjoy a higher price deck but each has some company-specific initiatives to meaningfully expand their own internal production.
Health Care still remains a large position in the Fund. With the exact future of the Affordable Care Act in limbo, it is sure to be an exciting industry for quarters to come.
| Semi-Annual Report | December 31, 2016 | 1 |
| | Shareholder Letter |
| Cortina Small Cap Growth Fund | December 31, 2016 (Unaudited) |
Relative to its benchmark, the Fund's underweight position is greatest in Real Estate and Consumer Discretionary. It is common for us to have a bias against Real Estate, because we prefer companies who apply their cash flow to making their business better and real estate companies (REITs) are structurally required to distribute their taxable income as dividends. Consumer Discretionary has been a challenging place to invest with the tectonic shift in the retail landscape caused by e-commerce but we are enthused to have recently found a few new investments which are insulated from this new reality. Finally, the relative exposure to the Industrial sector is as low as it has been in some time since the aggressive move in the group following the election encouraged a healthy round of profit taking in an effort to limit the risk of any fiscal stimulus disappointment.
It is widely anticipated that the cards to be dealt to smaller, domestic companies (regulation, stimulus, protectionism, taxes) will be more beneficial relative to large corporations than at any time since the recession. And this should engender business confidence which should/could unleash those animal spirits previously held at bay. The latest results (December) from the National Federation of Independent Business (NFIB) survey jumped for the seventh consecutive month to 105.8, placing the survey at its highest level in twelve years. Interestingly, the survey asks what is "the single most important problem" that the participants are facing, and the two leading responses were taxes and government requirements both of which are likely easing. As a result, the likely direction of policy is on the whole constructive for the U.S. economy, bullish for equities and bearish for bonds.
Investing involves risks, including loss of principal.
Yield proxy: A term generally used to describe equities such as consumer staples and utilities with safe, predictable returns, but have higher yields than much of the bond market
| 2 | 1-855-612-3936 | www.cortinafunds.com |
| Portfolio Information |
| Cortina Small Cap Growth Fund | December 31, 2016 (Unaudited) |
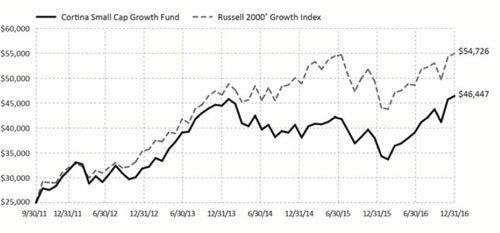
Growth of $25,000 Investment (Unaudited)
For the period from September 30, 2011 (Inception) to December 31, 2016.
This graph assumes an initial $25,000 investment at September 30, 2011 (Inception Date). The Cortina Small Cap Growth Fund (the "Fund") will deduct a 2.00% redemption proceeds fee on Fund shares held 60 days or less. This graph depicts the performance of the Fund versus the Russell 2000® Growth Index. It is important to note the Fund is a professionally managed mutual fund while the index is not available for investment and is unmanaged. The comparison is shown for illustrative purposes only.
This chart does not reflect the deduction of taxes that a shareholder would pay on Fund distributions or the redemption of Fund shares.
Performance Returns for the period ended December 31, 2016
| | 6 Months | 1 Year | 3 Years | 5 Years | Since Inception* | Gross Expense Ratio** |
| Cortina Small Cap Growth Fund | 18.84% | 22.26% | 1.31% | 10.37% | 12.52% | 1.54% |
Russell 2000® Growth Index | 13.12% | 11.32% | 5.05% | 13.74% | 16.09% | |
| * | The Fund's inception date is September 30, 2011. |
| ** | Cortina Asset Management, LLC (the "Adviser") has contractually agreed to waive management fees and/or reimburse the Fund's operating expenses in order to limit the Fund's total annual fund operating expenses (excluding taxes, leverage, interest, brokerage commissions, dividends or interest expenses on short positions, acquired fund fees and expenses and extraordinary expenses) to 1.10% of average daily net assets of the Fund. The agreement will continue in effect at least through October 31, 2017, subject thereafter to annual re-approval of the agreement by the Fund's Board of Directors. |
Past performance does not guarantee future results. The performance data quoted represents past performance and current returns may be lower or higher. Total return figures include change in share price, reinvestment of dividends and capital gains. The investment return and principal value will fluctuate so that an investor's shares, when redeemed may be worth more or less than their original cost. To obtain performance information current to the most recent month end, call 1-855-612-3936.
Russell 2000® Growth Index measures the performance of the small-cap growth segment of the U.S. equity universe. It includes those Russell 2000 companies with higher price-to-value ratios and higher forecasted growth values. All indices are unmanaged. It is not possible to invest directly in an index.
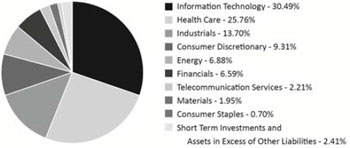
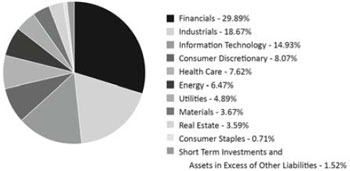
Sector Allocations***
*** Percentages are based on Net Assets as of December 31, 2016. Holdings are subject to change.
| Semi-Annual Report | December 31, 2016 | 3 |
| Shareholder Letter |
| Cortina Small Cap Value Fund | December 31, 2016 (Unaudited) |
DEAR FELLOW SHAREHOLDERS:
For the year, the Cortina Small Cap Value Strategy posted double-digit absolute gains but underperformed its benchmark, as did 90% of active small value managers, according to Jefferies. The majority of the underperformance occurred prior to the Brexit vote in June and we believe this is no coincidence. Since the November election and the Brexit vote the strategy has delivered returns far more consistent with years past. Previous monetary policies may have rendered active management irrelevant for a period but it appears that tide has turned.
In the United States, 2016 will be remembered as the year Donald Trump surprised everyone. For economic historians, 2016 should be remembered as the year this cycle of radical monetary policy ended. The Brexit vote effectively ended the post-2008 monetary experiment because it was the first, but not last, vote that showed how ineffective central banks have been in improving the lives of most voters. In our small-cap investing world, the rise of passive investing, the rise of computer-driven trading, the rise of implementing factor-based investing themes through Exchange-Traded Funds are all important but are simply gravel in front of the monetary steam roller. Perhaps the experiment is over for this cycle.
In reviewing the cumulative decisions that led to the underperformance through last summer, the overarching error made in our office was underestimating the power of global central banks to usurp United States Federal Reserve actions. We believe we analyzed the domestic economic picture of the past two years correctly: substandard economic growth would result in substandard earnings growth and earnings disappointments. Yet we underappreciated the $4 trillion picture frame surrounding global markets. That frame is weakening. Central banks globally are in a tightening cycle which may reverse much of the macro-headwind we and other active managers have faced.
As we stand today, we expect markets may begin to favor growth equities over value equities as the rate of change for economic growth slows and at the same time monetary stimulus likely declines. Valuation and prospective growth expectations for individual equites should matter again. We expect the coming quarters will be far more favorable to our strategy than recent ones.
Many professional investors, market observers, and pundits have decried Quantitative Easing ("QE"), complaining that it distorted the market. It most certainly did. Still, monetary policy is an ever-present market participant. Disown it at your own peril. If monetary tightening continues, expect significant implications for equity markets that favor active managers. Conversely, if economic data disappoints again, further QE could result in further severing of the links between fundamentals and equity prices.
OUTLOOK & PORTFOLIO POSITIONING
Our summary view is that the next few years have the potential to set the stage for a material acceleration in the economy and significant upside for equity markets. Deregulation, more intelligent tax policy, fiscal stimulus and a retreat by central bankers all bode well for economic activity. However, we believe that markets and investors are likely ahead of themselves as change takes time and it is more likely that any benefits from policy changes will develop in 2018 and beyond rather than in 2017. It will not be smooth.
Our biggest underweights remain REITs and Utilities, although recent weakness in several holdings have allowed us to add marginally to the sector, including one new water Utility. The portfolio also remains underweight Consumer companies as rising fuel prices, wage inflation and the continued and relentless attack by online competitors make it a very difficult sector to invest in today. Financials, after increasing to near-benchmark weighting early in 4Q, are slightly underweight after the reduction of several equity positions that increased dramatically after the election.
Our largest overweights remain Technology, where we continue to find underappreciated companies undergoing significant positive changes, and Industrials, where a multi-year industrial slowdown has resulted in a crop of radically improved companies that are well-positioned for the coming years. Health Care also remains a solid overweight and an area that we believe has significant hidden value that developed as capital rotated away from Growth and into Value as determined by benchmark labels versus specific company fundamentals.
With all of the change occurring across the economic and financial spectrum, this is a time of great excitement in the markets reminiscent of previous cycle shifts. The ability to find individual companies that are materially mispriced appears greater today than it has in some time.
Investing involves risks, including loss of principal.
Quantitative Easing: Generally defined as an unconventional monetary policy in which a central bank purchases government securities or other securities from the market in order to lower interest rates and increase the money supply.
| 4 | 1-855-612-3936 | www.cortinafunds.com |
| | Portfolio Information |
| Cortina Small Cap Value Fund | December 31, 2016 (Unaudited) |
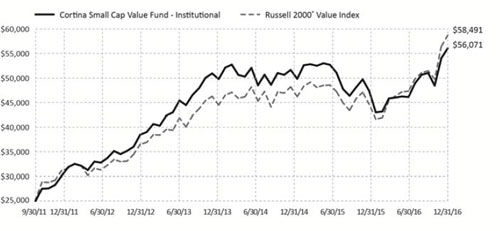
Growth of $25,000 Investment (Unaudited)
For the period from September 30, 2011 (Inception) to December 31, 2016.
This graph assumes an initial $25,000 investment at September 30, 2011 (Inception Date). The Cortina Small Cap Value Fund Institutional share class (the "Fund") will deduct a 2.00% redemption proceeds fee on Fund shares held 60 days or less. This graph depicts the performance of the Fund versus the Russell 2000® Value Index. It is important to note the Fund is a professionally managed mutual fund, while the index is not available for investment and is unmanaged. The comparison is shown for illustrative purposes only. Performance will vary from class to class based on differences in class-specific expenses.
This chart does not reflect the deduction of taxes that a shareholder would pay on Fund distributions or the redemption of Fund shares.
Performance Returns for the period ended December 31, 2016
| | 6 Months | 1 Year | 3 Years* | 5 Years* | Since Inception* | Gross Expense Ratio** |
| Cortina Small Cap Value Fund - Institutional | 21.50% | 18.36% | 3.22% | 14.67% | 16.63% | 1.51% |
| Cortina Small Cap Value Fund - Investor | 21.37% | 18.07% | 2.97% | 14.38% | 16.34% | 1.76% |
Russell 2000® Value Index | 24.19% | 31.74% | 8.31% | 15.07% | 17.57%*** | |
| * | The Fund's Institutional shares inception date is September 30, 2011, Investor shares inception date is April 30, 2014. The performance shown for Investor shares for periods pre-dating the commencement of operations of that class reflects the performance of the Fund's Institutional shares, the initial share class, calculated using the fees and expenses of Investor shares. If Investor shares of the Fund had been available during periods prior to April 30, 2014, the performance shown may have been different. |
| ** | Cortina Asset Management, LLC (the "Adviser") has contractually agreed to waive management fees and/or reimburse the Fund's operating expenses in order to limit the Fund's total annual fund operating expenses (excluding taxes, leverage, interest, brokerage commissions, dividends or interest expenses on short positions, acquired fund fees and expenses, and extraordinary expenses) to 1.10% and 1.35% of average daily net assets of the Fund's Institutional and Investor Class shares, respectively. The agreement will continue in effect at least through October 31, 2017, subject thereafter to annual re-approval of the agreement by the Fund's Board of Directors. |
| *** | Represents the period from September 30, 2011 (date of original public offering of the Institutional shares) through December 31, 2016. |
Past performance does not guarantee future results. The performance data quoted represents past performance and current returns may be lower or higher. Total return figures include change in share price, reinvestment of dividends and capital gains. The investment return and principal value will fluctuate so that an investor's shares, when redeemed may be worth more or less than their original cost. To obtain performance information current to the most recent month end, call 1-855-612-3936.
Russell 2000® Value Index measures the performance of those Russell 2000 companies with lower price-to-book ratios and lower forecasted growth values. All indices are unmanaged. It is not possible to invest directly in an index.
Sector Allocations****
| **** | Percentages are based on Net Assets as of December 31, 2016. Holdings are subject to change. |
| Semi-Annual Report | December 31, 2016 | 5 |
| | Disclosure of Fund Expenses |
| December 31, 2016 (Unaudited) |
As a shareholder of the Fund(s), you incur ongoing costs, including management fees and other Fund expenses. This example is intended to help you understand your ongoing costs (in dollars) of investing in each Fund and to compare these costs with the ongoing costs of investing in other mutual funds. The example is based on an investment of $1,000 invested at the beginning of the period and held for the entire period, as indicated below.
Actual Expenses – The first line of the table below provides information about the actual account values and actual expenses. You may use the information in this line, together with the amount you invested, to estimate the expenses that you paid over the period. Simply divide your account value by $1,000 (for example, an $8,600 account value divided by $1,000 = 8.6) then multiply the result by the number in the first line under the heading entitled "Expenses Paid During Period" to estimate the expenses you paid on your account during this period.
Hypothetical Example for Comparison Purposes – The second line of the table below provides information about hypothetical account values and hypothetical expenses based on each Fund's actual expense ratio and an assumed annual rate of return of 5% before expenses, which is not each Fund's actual return. The hypothetical account values and expenses may not be used to estimate the actual ending account balance or expenses you paid for the period. You may use this information to compare the ongoing costs of investing in each Fund and other funds by comparing these 5% hypothetical examples with the 5% hypothetical examples that appear in the shareholder reports of other funds.
Please note that the expenses shown in the table are meant to highlight your ongoing costs only and do not reflect any direct costs, such as wire fees or low balance fees. Therefore, the second line of the table is useful in comparing ongoing costs and will not help you determine the relative total costs of owning different funds. In addition, if these direct costs were included, your costs would be higher.
| | Beginning Account Value July 1, 2016 | Ending Account Value December 31, 2016 | Expenses Paid During Period(a) | Net Expense Ratios(b) |
| Cortina Small Cap Growth Fund - Institutional | | | | |
| Actual Fund Return | $1,000.00 | $1,188.40 | $6.07 | 1.10% |
| Hypothetical Fund Return (assuming a 5% return before expenses) | $1,000.00 | $1,019.66 | $5.60 | 1.10% |
| Cortina Small Cap Value Fund - Institutional | | | | |
| Actual Fund Return | $1,000.00 | $1,215.00 | $6.14 | 1.10% |
| Hypothetical Fund Return (assuming a 5% return before expenses) | $1,000.00 | $1,019.66 | $5.60 | 1.10% |
| Cortina Small Cap Value Fund - Investor | | | | |
| Actual Fund Return | $1,000.00 | $1,213.70 | $7.53 | 1.35% |
| Hypothetical Fund Return (assuming a 5% return before expenses) | $1,000.00 | $1,018.40 | $6.87 | 1.35% |
(a) | Expenses are equal to the Fund's annualized expense ratio multiplied by the average account value over the period, multiplied by the number of days in the most recent fiscal half year (184), divided by 365. |
(b) | Annualized, based on the Fund's most recent half-year expenses. |
| 6 | 1-855-612-3936 | www.cortinafunds.com |
| | Notes to Financial Statements |
| | December 31, 2016 (Unaudited) |
1. ORGANIZATION
Cortina Funds, Inc. (the "Corporation") is an open-end management investment company registered under the Investment Company Act of 1940, as amended (the "1940 Act"). The Corporation was organized on April 27, 2004 as a Wisconsin corporation. The Corporation currently offers shares of common stock ("shares") of the Cortina Small Cap Growth Fund and the Cortina Small Cap Value Fund (each a "Fund" and collectively, the "Funds").
The Cortina Small Cap Growth Fund, which commenced operations with the sale of Institutional Class Shares on September 30, 2011, is a diversified portfolio with an investment objective to seek growth of capital. The Cortina Small Cap Value Fund, which commenced operations with the sale of Institutional Class Shares on September 30, 2011 and the sale of Investor Class Shares on April 30, 2014, is a diversified portfolio with an investment objective to seek long-term capital appreciation.
Shares of each Fund are designated as Institutional Shares or Investor Shares with an indefinite number of shares authorized at $0.01 par value. The Articles of Incorporation, as amended and restated, permit the Corporation's Board of Directors (the "Board") to create additional funds and share classes.
2. SIGNIFICANT ACCOUNTING POLICIES
The following is a summary of significant accounting policies followed by the Funds. These policies are in conformity with U.S. generally accepted accounting principles ("GAAP"). The Funds are considered investment companies for financial reporting purposes under GAAP.
Use of Estimates — The accompanying financial statements were prepared in accordance with GAAP, which require the use of estimates and assumptions made by management. These may affect the reported amounts of assets and liabilities and disclosure of contingent assets and liabilities at the date of the financial statements and the reported amounts of increases and decreases in net assets from operations during the reporting period. Actual results could differ from those estimates.
Investment Valuation — Investment securities are valued at the last sale price at the close of the principal exchange on which they trade, except for securities listed on the NASDAQ Stock Market, Inc. ("NASDAQ") exchange, which are valued at the NASDAQ official closing price. Unlisted securities or listed securities for which there were no sales during the day are valued at the closing bid price on such exchanges or over-the-counter markets. Investments for which market quotations are not readily available are valued at fair value as determined in good faith under consistently applied procedures approved by and under the general supervision of the Funds' Board. Securities with maturities of sixty (60) days or less are valued at amortized cost as Level 1 or 2 within the hierarchy. Money market funds, representing short-term investments, are valued at their daily net asset value.
Investment Transactions — Investment security transactions are accounted for on trade date. Gains and losses on securities sold are determined on a specific identification basis.
Investment Income — Interest income is accrued and recorded on a daily basis including amortization of premiums, accretions of discounts and income earned from money market funds. Interest is not accrued on securities that are in default. Dividend income is recorded on the ex-dividend date. Withholding taxes on foreign dividends have been provided for in accordance with the Funds' understanding of the applicable country's tax rules and rates.
Fair Value Measurements — A three-tier hierarchy has been established to classify fair value measurements for disclosure purposes. Inputs refer broadly to the assumptions that market participants would use in pricing the asset or liability, including assumptions about risk. Inputs may be observable or unobservable. Observable inputs are inputs that reflect the assumptions market participants would use in pricing the asset or liability that are developed based on market data obtained from sources independent of the reporting entity. Unobservable inputs are inputs that reflect the reporting entity's own assumptions about the assumptions market participants would use in pricing the asset or liability that are developed based on the best information available. In accordance with the authoritative guidance on fair value measurements and disclosure under GAAP, the Funds disclose fair value of their investments in a hierarchy that prioritizes the inputs to valuation techniques used to measure the fair value.
| 18 | 1-855-612-3936 | www.cortinafunds.com |
| | Notes to Financial Statements |
| | December 31, 2016 (Unaudited) |
Various inputs are used in determining the value of each Fund's investments as of the reporting period end. The designated input levels are not necessarily an indication of the risk or liquidity associated with these investments. These inputs are categorized in the following hierarchy under applicable financial accounting standards:
| Level 1 — | Unadjusted quoted prices in active markets for identical, unrestricted assets or liabilities that the Funds have the ability to access at the measurement date; |
| Level 2 — | Quoted prices which are not active, quoted prices for similar assets or liabilities in active markets or inputs other than quoted prices that are observable (either directly or indirectly) for substantially the full term of the asset or liability; and |
| Level 3 — | Significant unobservable prices or inputs (including a Fund's own assumptions in determining the fair value of investments) where there is little or no market activity for the asset or liability at the measurement date. |
The availability of observable inputs can vary from security to security and is affected by a wide variety of factors, including, for example, the type of security, whether the security is new and not yet established in the marketplace, the liquidity of markets, and other characteristics particular to the security. To the extent that valuation is based on models or inputs that are less observable or unobservable in the market, the determination of fair value requires more judgment. Accordingly, the degree of judgment exercised in determining fair value is greatest for instruments categorized in Level 3.
An investment level within the fair value hierarchy is based on the lowest level input, individually or in the aggregate, that is significant to fair value measurement. The valuation techniques used by the Funds to measure fair value during the six months ended December 31, 2016 maximized the use of observable inputs and minimized the use of unobservable inputs.
The inputs or methodology used for valuing securities are not necessarily an indication of the risk or liquidity associated with investing in those securities. The following is a summary of the inputs used in valuing the Funds' investments as of December 31, 2016:
Cortina Small Cap Growth Fund
| | | Valuation Inputs | | | | |
| Investments in Securities at Value | | Level 1 | | | Level 2 | | | Level 3 | | | Total | |
| Common Stocks* | | $ | 31,387,656 | | | $ | – | | | $ | – | | | $ | 31,387,656 | |
| Total | | $ | 31,387,656 | | | $ | – | | | $ | – | | | $ | 31,387,656 | |
Cortina Small Cap Value Fund
| | | Valuation Inputs | | | | |
| Investments in Securities at Value | | Level 1 | | | Level 2 | | | Level 3 | | | Total | |
| Common Stocks* | | $ | 44,429,770 | | | $ | – | | | $ | – | | | $ | 44,429,770 | |
| Total | | $ | 44,429,770 | | | $ | – | | | $ | – | | | $ | 44,429,770 | |
| * | See Schedule of Investments for sector classification. |
For the six months ended December 31, 2016, there have been no significant changes to the Funds' fair value methodologies. Additionally, there were no transfers into or out of Levels 1 and 2 during the six months ended December 31, 2016. It is the Funds' policy to recognize transfers at the end of the reporting period.
For the six months ended December 31, 2016, the Funds did not have investments with significant unobservable inputs (Level 3) used in determining fair value.
Affiliated Companies — An affiliated company is a company that can have direct or indirect common ownership. The Funds did not hold any investments in affiliated companies as of and during the six months ended December 31, 2016.
Expenses — The Funds bear expenses incurred specifically on each Fund's respective behalf as well as a portion of general Corporation expenses, which may be allocated on the basis of relative net assets or the nature of the services performed relative to applicability to each Fund.
| Semi-Annual Report | December 31, 2016 | 19 |
| | Notes to Financial Statements |
| | December 31, 2016 (Unaudited) |
Expenses that are specific to a class of shares of the Funds are charged directly to the share class. The Funds' realized and unrealized gains and losses, net investment income, and expenses other than class specific expenses, are allocated daily to each class in proportion to its average daily net assets.
Distributions to Shareholders — Dividends from net investment income and distributions of net realized capital gains, if any, will be declared and paid at least annually. Income and capital gains distributions are determined in accordance with income tax regulations, which may differ from GAAP. Distributions to shareholders are recorded on the ex-dividend date.
Fees on Redemptions — The Funds will deduct a 2.00% redemption proceeds fee on Fund shares held 60 days or less. The redemption fee is not a fee to finance sales or sales promotion expenses, but is paid to the Funds to defray the costs of liquidating an investor and discouraging short-term trading of the Funds' shares. No redemption fee will be imposed on redemptions initiated by the Funds.
Federal Income Taxes — As of and during the six months ended December 31, 2016, the Funds did not have a liability for any unrecognized tax benefits. The Funds file U.S. federal, state, and local tax returns as required. The Funds' tax returns are subject to examination by the relevant tax authorities until expiration of the applicable statute of limitations which is generally three years after the filing of the tax return for federal purposes and four years for most state returns. Tax returns for open years have incorporated no uncertain tax positions that require a provision for income taxes. The Funds intend to distribute to shareholders all taxable investment income and realized gains, and otherwise comply with Subchapter M of the Internal Revenue Code of 1986, as amended, applicable to regulated investment companies.
3. ADVISORY FEES, FUND ACCOUNTING, ADMINISTRATION FEES, AND OTHER AGREEMENTS
Investment Advisor
Cortina Asset Management, LLC, is the Funds' investment adviser (the "Adviser"). The Adviser is subject to the general supervision of the Board and is responsible for the overall management of the Funds' business affairs. The Adviser invests the assets of the Funds based on the Funds' investment objectives and policies. The Adviser is entitled to an investment advisory fee, computed daily and payable monthly, of 1.00% of the average daily net assets for each Fund.
The Adviser has contractually agreed to waive fees with respect to each of the Funds so that the net annual operating expenses (excluding taxes, leverage, interest, brokerage commissions, dividends or interest expenses on short positions, acquired fund fees and expenses, and extraordinary expenses) of the Funds' shares will not exceed 1.10% and 1.35% of average daily net assets of each Fund's Institutional and Investor Class shares, respectively, through October 31, 2017. The Adviser may request a reimbursement from the Funds to recapture any reduced management fees or reimbursed Fund expenses within three years following the fee reduction or expense reimbursement, but only to the extent the Funds' total annual fund operating expenses including offering costs, plus any requested reimbursement amount, are less than the above limit at the time of the request. Any such reimbursement is subject to review by the Board.
As of December 31, 2016, reimbursements (including offering costs) that may potentially be made by the Fund to the Adviser total $582,615 for the Cortina Small Cap Growth Fund and $667,050 for the Cortina Small Cap Value Fund and expire as follows:
| Cortina Small Cap Growth Fund | | | |
| June 30, 2017 | | $ | 217,565 | |
| June 30, 2018 | | | 198,408 | |
| June 30, 2019 | | | 166,642 | |
| | | | 582,615 | |
| Cortina Small Cap Value Fund | | | | |
| June 30, 2017 | | $ | 194,315 | |
| June 30, 2018 | | | 222,111 | |
| June 30, 2019 | | | 250,624 | |
| | | | 667,050 | |
Fund Accounting Fees and Expenses
ALPS Fund Services, Inc. ("ALPS" or the "Administrator") provides administrative, fund accounting and other services to the Funds for a monthly administration fee based on the Funds' average daily net assets.
The Administrator is also reimbursed by the Funds for certain out-of-pocket expenses.
Transfer Agent
ALPS serves as transfer, dividend paying and shareholder servicing agent for the Funds (the "Transfer Agent").
| 20 | 1-855-612-3936 | www.cortinafunds.com |
| | Notes to Financial Statements |
| | December 31, 2016 (Unaudited) |
Compliance Services
ALPS provides services that assist the Corporation's Chief Compliance Officer in monitoring and testing the policies and procedures of the Corporation in conjunction with requirements under Rule 38a-1 under the 1940 Act. ALPS is compensated under the Administration Agreement.
Distributor
The Funds have entered into a Distribution Agreement with ALPS Distributors, Inc ("the Distributor") to provide distribution services to the Funds. The Distributor serves as underwriter/distributor of shares of the Funds.
Distribution Plan
The Small Cap Value Fund has adopted a Distribution Plan in accordance with Rule 12b-1 ("Distribution Plan") under the 1940 Act. The Distribution Plan provides that the Small Cap Value Fund may compensate or reimburse the Distributor for services rendered and expenses borne in connection with activities primarily intended to result in the sale of the Small Cap Value Fund's shares. Sales charges may be paid to broker-dealers, banks and any other financial intermediary eligible to receive such fees for sales of Investor Shares of the Small Cap Value Fund and for services provided to shareholders.
The Small Cap Value Fund charges 12b-1 fees for Investor Shares. Pursuant to the Distribution Plan, the Small Cap Value Fund may annually pay the Distributor up to 0.25% of the average daily net assets of the Small Cap Value Fund's Investor Shares. The expenses of the Distribution Plan are reflected in the Statements of Operations.
Certain Directors and Officers of the Funds are also officers of the Adviser.
4. PURCHASES AND SALES OF INVESTMENT SECURITIES
The aggregate cost of purchases and proceeds from sales of investment securities, excluding short-term securities, are shown below for the six months ended December 31, 2016.
| Fund Name | | Purchases | | | Sales | |
| Cortina Small Cap Growth Fund | | $ | 16,387,078 | | | $ | 24,774,125 | |
| Cortina Small Cap Value Fund | | | 24,890,261 | | | | 53,030,899 | |
There were no purchases or sales of long-term U.S. Government Obligations for either Fund during the six months ended December 31, 2016.
5. TAX BASIS INFORMATION
Income and long-term capital gain distributions are determined in accordance with Federal income tax regulations, which differ from GAAP, and, therefore, may differ significantly in amount or character from net investment income and realized gains for financial reporting purposes.
As of December 31, 2016, the aggregate cost of investments, gross unrealized appreciation/(depreciation) and net unrealized appreciation/ (depreciation) for Federal tax purposes was as follows:
| Fund | | Cost of Investments for Income Tax Purposes | | | Gross Appreciation (excess of value over tax cost) | | | Gross Depreciation (excess of tax cost over value) | | | Net Unrealized Appreciation | |
| Cortina Small Cap Growth Fund | | $ | 23,483,487 | | | $ | 8,251,616 | | | $ | (347,447 | ) | | $ | 7,904,169 | |
| Cortina Small Cap Value Fund | | | 35,690,638 | | | | 9,296,680 | | | | (557,548 | ) | | | 8,739,132 | |
The difference between book basis and tax basis net unrealized appreciation is attributable to the deferral of losses from wash sales.
6. COMMITMENTS AND CONTINGENCIES
Under the Corporation's organizational documents, its Officers and Directors are indemnified against certain liabilities arising out of the performance of their duties to the Funds. In addition, in the normal course of business, the Corporation entered into contracts with its service providers, on behalf of the Funds, and others that provide for general indemnifications. The Funds' maximum exposure under these arrangements is unknown, as this would involve future claims that may be made against the Funds. The Funds expect risk of loss to be remote.
| Semi-Annual Report | December 31, 2016 | 21 |
| | Additional Information |
| | December 31, 2016 (Unaudited) |
1. PROXY VOTING POLICIES AND VOTING RECORD
A description of the policies and procedures that the Funds use to vote proxies relating to portfolio securities is available without charge upon request by calling toll-free 1-855-612-3936, or on the Securities and Exchange Commission's ("SEC") website at http://www.sec.gov. Information regarding how the Funds voted proxies relating to portfolio securities during the most recent fiscal year end June 30, 2016 is available without charge upon request by calling toll-free 1-855-612-3936, or on the SEC's website at http://www.sec.gov.
2. QUARTERLY PORTFOLIO HOLDINGS
The Corporation files a complete listing of portfolio holdings for the Funds with the SEC as of the first and third quarters of each fiscal year on Form N-Q. The filings are available upon request by calling 1-855-612-3936. Furthermore, you may obtain a copy of the filing on the SEC's website at http://www.sec.gov. The Funds' Forms N-Q may also be reviewed and copied at the SEC's Public Reference Room in Washington, D.C., and information on the operation of the Public Reference Room may be obtained by calling 1-800-SEC-0330.
| 22 | 1-855-612-3936 | www.cortinafunds.com |
This page intentionally left blank.
Material must be accompanied or preceded by the prospectus.
The Cortina Funds are distributed by ALPS Distributors, Inc.