UNITED STATES
SECURITIES AND EXCHANGE COMMISSION
Washington, D.C. 20549
FORM N-CSR
CERTIFIED SHAREHOLDER REPORT OF REGISTERED
MANAGEMENT INVESTMENT COMPANIES
Investment Company Act file number: 811-21580
CORTINA FUNDS, INC.
(Exact name of registrant as specified in charter)
825 N. Jefferson St., Suite 400, Milwaukee, WI 53202
(Address of principal executive offices) (Zip code)
(414) 225-7365
Registrant’s telephone number, including area code
Lori Hoch
825 N. Jefferson St., Suite 400
Milwaukee, WI 53202
(Name and address of agent for service)
Date of fiscal year end:June 30
Date of reporting period:July 1, 2017 - December 31, 2018
Item 1. Reports to Stockholders.
The following is a copy of the report to shareholders pursuant to Rule 30e-1 under the Investment Company Act of 1940 (17 CFR 270.30e-1).
Beginning on January 1, 2021, as permitted by regulations adopted by the Securities and Exchange Commission, paper copies of the Fund shareholder reports will no longer be sent by mail, unless you specifically request paper copies of the reports from a Fund or from your financial intermediary (such as a broker-dealer or bank). Instead, the reports will be made available on the Funds' website (www.cortinafunds.com), and you will be notified by mail each time a report is posted and provided with a website link to access the report.
Beginning on January 1, 2019, you may elect to receive all future reports in paper free of charge. If you invest through a financial intermediary, you can contact your financial intermediary to request that you continue to receive paper copies of your shareholder reports. If you invest directly with a Fund, you can call the Fund toll free at 1-855-612-3936. Your election to receive reports in paper will apply to all funds held in your account if you invest through your financial intermediary or all funds held with the fund complex if you invest directly with a Fund.
If you already elected to receive shareholder reports electronically, you will not be affected by this change and you need not take any action. You may elect to receive shareholder reports and other communications from a Fund electronically anytime by contacting your financial intermediary (such as a broker-dealer or bank) or, if you invest directly with a Fund, by enrolling at www.cortinafunds.com.
TABLE OF CONTENTS
| Cortina Small Cap Growth Fund | |
| Shareholder Letter | 1 |
| Portfolio Information | 3 |
| Cortina Small Cap Value Fund | |
| Shareholder Letter | 4 |
| Portfolio Information | 5 |
| Disclosure of Fund Expenses | 6 |
| Schedule of Investments | |
| Cortina Small Cap Growth Fund | 7 |
| Cortina Small Cap Value Fund | 10 |
| Statements of Assets and Liabilities | 12 |
| Statements of Operations | 13 |
| Statements of Changes in Net Assets | 14 |
| Financial Highlights | |
| Cortina Small Cap Growth Fund | 16 |
| Cortina Small Cap Value Fund - Institutional | 17 |
| Cortina Small Cap Value Fund - Investor | 18 |
| Notes to Financial Statements | 19 |
| Additional Information | 24 |
 | Shareholder Letter |
| Cortina Small Cap Growth Fund | December 31, 2018 (Unaudited) |
DEAR FELLOW SHAREHOLDERS:
The first half of Fiscal 2019 witnessed a return of volatility, with all major indices falling for the six month period ending December 31, 2018. Small caps were hit the hardest and over this time period the Russell 2000 Growth Index fell -17.33%. The Fund sustained losses as well, though held up better than our benchmark index falling just -14.99%. We are pleased to start the fiscal year with positive relative performance though the victory is bittersweet. Just four months ago, the Fund had generated calendar year-to-date returns of 33.78% through the end of August before ceding all but a 4.02% full calendar year return. While this was significantly better than the -9.31% full year loss of the Russell 2000 Growth Index, as shareholders we much preferred the large gains.
The reasons for the severe sell-off have been well reported and unfortunately are numerous. The lowlights include trade tensions with many of our strongest trading partners, an all-out trade war with China, continued tightening of monetary policy by the Federal Reserve Board and a midterm election that changed the balance of power in Washington. The latter has thus far yielded the longest government shutdown in American history. All this at a time when synchronized global economic growth was faltering and in a stock market that heretofore had been long on valuation and short on volatility.
As an investment team, we became somewhat cautious of the momentum that had taken over much of the small cap growth market in the summer of 2018. Being grounded in fundamentals and valuations we methodically pared and eliminated holdings as valuations became untenable. This was especially the case within the Health Care and Technology sectors where our holdings were up 41.18% and 25.24% respectively for the first half of Calendar 2018. As many of our holdings within these sectors reached such lofty valuations that they could only be described as momentum stocks we proactively shifted assets into other ideas that had yet to be discovered by the momentum crowd.
An additional factor that aided the Fund’s relative performance is our continued and heightened focus on strong balance sheets. As interest rates have risen, companies with low debt levels shined as the prospect of refinancing at higher rates pressured more highly leveraged companies. Similarly, with the 2 Year Treasury Yield exceeding the S&P 500 Dividend Yield for the first time since the Great Recession, investors seeking current income had an alternative to equities. Dividends thus became less important and stocks without dividends significantly outperformed their counterparts. Consistent with our mantra of being early investors to innovative growth companies, we shun companies that fund their nascent growth with debt and we do not seek mature, dividend-paying companies.
OUTLOOK AND POSITIONING
While the global economic and political headlines can easily stoke concern there are plenty of positives. We remain enthused with the prospect of investing in undiscovered, innovative companies and the turmoil of the past six months has yielded more attractive valuations. As of September 30th, our allocation to the technology sector was as low as it had been since June of 2015. Over the past three months, however, we have increased our exposure by nearly 300 basis points as we’ve seized on valuation opportunities. Technology is now, once again, our largest overweight relative to the Russell 2000 Growth benchmark. Within the Health Care sector, which accounts for nearly 31% of Fund assets making it our largest absolute weight, we have also proactively added to holdings on weakness and initiated new positions at opportunistic prices. The Health Care and Technology sectors are both rife with innovation and we welcome such opportunities to invest while others run.
One other area that we believe could be interesting as 2019 unfolds is the Industrials sector where the Fund was underexposed throughout 2018. As one of the most cyclical sectors, Industrials materially underperformed in Calendar 2018 as economic concerns rattled the market. Looking forward, however, the potential for an improvement in the economic outlook and sentiment in the Industrials sector to turn more optimistic is there. Growth surprised to the upside throughout much of 2018 and a very real scenario exists for a repeat in 2019. For starters, fiscal and regulatory policy in the US are still very much stimulative. In fact, fiscal stimulus in 2019 is greater than it was in 2018 as a percent of Gross Domestic Product (GDP). In addition, the international economic readings are so soft that stimulus is likely especially in China where Beijing is working aggressively to stem the damage from the trade war. As well, populist demands in Europe, best illustrated by the “Yellow Vest Movement” in France, should instigate stimulative measures on that continent. That leaves domestic monetary and trade policy as two of the bigger wildcards. Very recent commentary by Federal Reserve officials suggest that the central bank will act pragmatically and flexibly regarding rate policy in 2019 which has assuaged financial market tensions. As for trade, the very near term is impossible to predict. As the year progresses, however, we find it difficult to envision a scenario where six or twelve months from now the trade environment isn’t better than it is today.
We believe our positioning with respect to style and factors remains steadfastly consistent with our long term strategy of being early investors in innovative growth companies. Our portfolio holdings have higher projected top and bottom line growth rates, on average, than the benchmark at large. Our weighted average market cap is lower than that of the benchmark and balance sheets are stronger. For this, we pay a modest valuation premium on near term earnings.
Dividend yield is a dividend expressed as a percentage of a current share price.
| Semi-Annual Report | December 31, 2018 | 1 |
| | Shareholder Letter |
| Cortina Small Cap Growth Fund | December 31, 2018 (Unaudited) |
U.S. Treasury yield is the return on investment, expressed as a percentage, on the U.S. government’s debt obligations. These debt obligations can be for varying lengths of time.
Basis Point refers to a common unit of measure for interest rates and other percentages in finance. One basis point is equal to 1/100th of 1%, or 0.01%, or 0.0001, and is used to denote the percentage change in a financial instrument.
Yellow Vests Movement, also called the Yellow Jacket Movement, is a grassroots political movement for economic justice taking place in Europe.
Cortina Funds are subject to risks, including loss of principal.
| 2 | 1-855-612-3936 | www.cortinafunds.com |
| | Portfolio Information |
| Cortina Small Cap Growth Fund | December 31, 2018 (Unaudited) |
Growth of $25,000 Investment (Unaudited)
For the period from September 30, 2011 (Inception) to December 31, 2018.
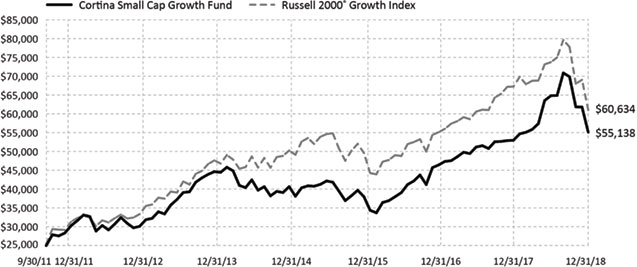
This graph assumes an initial $25,000 investment at September 30, 2011 (Inception Date). The Cortina Small Cap Growth Fund (the “Fund”) will deduct a 2.00% redemption proceeds fee on Fund shares held 60 days or less. This graph depicts the performance of the Fund versus the Russell 2000® Growth Index. It is important to note the Fund is a professionally managed mutual fund while the index is not available for investment and is unmanaged. The comparison is shown for illustrative purposes only.
This chart does not reflect the deduction of taxes that a shareholder would pay on Fund distributions or the redemption of Fund shares.
Performance Returns for the period ended December 31, 2018
| | 6 Months | 1 Year | 3 Years | 5 Years | Since Inception* | Gross
Expense Ratio** |
| Cortina Small Cap Growth Fund | -14.99% | 4.02% | 13.22% | 4.30% | 11.52% | 1.81% |
| Russell 2000® Growth Index | -17.33% | -9.31% | 7.24% | 5.13% | 12.99% | |
| * | The Fund’s inception date is September 30, 2011. |
| ** | Cortina Asset Management, LLC (the “Adviser”) has contractually agreed to waive management fees and/or reimburse the Fund’s operating expenses in order to limit the Fund’s total annual fund operating expenses (excluding taxes, leverage, interest, brokerage commissions, dividends or interest expenses on short positions, acquired fund fees and expenses and extraordinary expenses) to 1.10% of average daily net assets of the Fund. The agreement will continue in effect at least through October 31, 2019, subject thereafter to annual re-approval of the agreement by the Fund’s Board of Directors. The current expense ratio for the Fund can be located in the Financial Highlights contained within this shareholder report. |
Past performance does not guarantee future results. The performance data quoted represents past performance and current returns may be lower or higher. Total return figures include change in share price, reinvestment of dividends and capital gains. The investment return and principal value will fluctuate so that an investor’s shares, when redeemed may be worth more or less than their original cost. To obtain performance information current to the most recent month end, call 1-855-612-3936.
Russell 2000®Growth Index measures the performance of the small-cap growth segment of the U.S. equity universe. It includes those Russell 2000 companies with higher price-to-value ratios and higher forecasted growth values. All indices are unmanaged. It is not possible to invest directly in an index.
Sector Allocations***
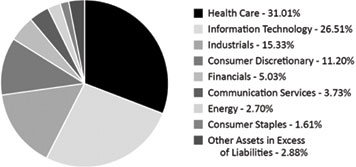
| *** | Percentages are based on Net Assets as of December 31, 2018. Holdings are subject to change. |
| Semi-Annual Report | December 31, 2018 | 3 |
| | Shareholder Letter |
| Cortina Small Cap Value Fund | December 31, 2018 (Unaudited) |
DEAR FELLOW SHAREHOLDERS:
For the six months ended December 31, 2018, the Cortina Small Cap Value Fund outperformed its benchmark, the Russell 2000 Value Index. Despite the optimism about the economy early in 2018, as reflected in general public commentary and equity prices, most of the evidence showed a waning momentum in the global economy. Markets ultimately caught up to these measures with a marked decline in worldwide equity markets that reached their nadir in late December.
We continue to believe timing the market is a fool’s game, but one can be just as much a fool by ignoring certain indicators of trouble – which was abundant in housing data and a discernable peak in business activity. While not positioned for a recession, the Fund has been defensively biased, which paid off in 2H18 with outperformance as the defensives outperformed. Allocations to Utilities, Real Estate, and Consumer Staples were beneficial to overall performance.
Health Care remained a difficult sector to navigate as companies we believe to be high quality we also believe to be overvalued, while those that appear undervalued continue to disappoint investors; we generally see an increasing cyclicality to the sector as consumer responsibility for health costs increases. The most material black mark on 2H18 performance for the portfolio was Financials, specifically selection in one company. The bank, which we believe to be one of the most rapidly and high quality growing franchises in the nation, announced an investment year in order to transition away from fee-based income towards a more enduring loan income stream. We see the current earnings pressure as temporary and its current valuation as a significant opportunity for capital appreciation over the next twelve-to-twenty-four months.
Industrials were our primary focus for new capital. We focused on specific companies as market declines presented multiple opportunities. We added two new building products companies and increased our position in one existing holding in the sector. Although it seems counter-intuitive to add that exposure while simultaneously expecting a slowdown in overall economic activity, in reviewing past market patterns, many cyclical companies reach their lowest levels coincident with market bottoms. Building products companies we have added, on the other hand, often reach their cyclical lows prior to the overall equity markets as their fundamentals often lead both up and down. In fact, one of our new holdings bottomed in 2007 so that despite the financial crisis of 2008, it was up on the year when the overall equity markets were down significantly.
As shown by our overweight to Utilities and Real Estate Investment Trusts (REITs), we believe it is still early to get excited about many cyclicals despite the market’s rapid rebound in the opening of 2019. Construction equipment, trucks, transportation companies…not yet in our view. Recall the Russell 2000 Index jumped about 4% in the first three weeks of 2018 only to drop about 8% by mid-February and reach new lows by year end. Key concerns include the following:
| ● | It takes several quarters for monetary tightening to work its way through the economy, and the multiple rate increases have not, in our opinion, fully been digested by the economy. |
| ● | Quantitative tightening is ongoing. Many former star investors have complained that recent poor performance has been caused by the aggressive monetary creation by central banks. Clients have shown little sympathy and many are shutting down, but that does not necessarily mark the investors as wrong. Equity markets dropped precipitously after Federal Reserve Chairman Powell’s remarks in December that the Fed’s balance sheet would continue contracting. There is a correlation between money supply and equity prices. |
| ● | International growth remains lackluster. China’s growth in particular appears weaker than it has in some time, partly due to its economy’s greater scale and partly due to the impacts of trade battles – but the country has a solid pattern of reaccelerating. |
Value investing is episodic; one must be ready to act and allocate capital forcefully when opportunity presents itself. We expected late 2018 to be one of those episodes based upon our macro-data work thus we went into the declines with an above average cash balance and an overweight to more conservative sectors. We have executed on that plan and have increased exposure to cyclicals we believe now reflect a slowdown in the economy. Since summer 2018, exposure to Consumer Discretionary, Health Care, and Financials have been reduced while Industrials, Utilities, and REITs are larger. Energy remains intriguing, but we still see elevated risk that overall slowing in global economic trends has not been fully recognized in petroleum prices.
In coming months our expectation is that the market will remain unsettled in ways that will present solid companies at valuations not seen in some time. Concurrently, we expect the slowing economy to begin to impact the funding of many previously rapidly growing new companies and over-leveraged operators generally. Free cash flow, solid balance sheets, and access to capital will become the coin of the realm, all of which should favor Value equities after an extended period of Growth companies leading the indexes. We anticipate working down cash balances to new and existing ideas throughout the spring.
Cortina Funds are subject to risks, including loss of principal.
| 4 | 1-855-612-3936 | www.cortinafunds.com |
| | Portfolio Information |
| Cortina Small Cap Value Fund | December 31, 2018 (Unaudited) |
Growth of $25,000 Investment (Unaudited)
For the period from September 30, 2011 (Inception) to December 31, 2018.
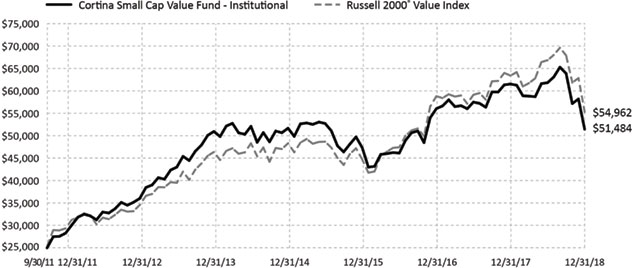
This graph assumes an initial $25,000 investment at September 30, 2011 (Inception Date). The Cortina Small Cap Value Fund Institutional share class (the “Fund”) will deduct a 2.00% redemption proceeds fee on Fund shares held 60 days or less. This graph depicts the performance of the Fund versus the Russell 2000® Value Index. It is important to note the Fund is a professionally managed mutual fund, while the index is not available for investment and is unmanaged. The comparison is shown for illustrative purposes only. Performance will vary from class to class based on differences in class-specific expenses.
This chart does not reflect the deduction of taxes that a shareholder would pay on Fund distributions or the redemption of Fund shares.
Performance Returns for the period ended December 31, 2018
| | 6 Months | 1 Year | 3 Years | 5 Years* | Since Inception* | Gross
Expense Ratio** |
| Cortina Small Cap Value Fund - Institutional | -16.78% | -16.37% | 2.81% | 0.20% | 10.47% | 1.75% |
| Cortina Small Cap Value Fund - Investor | -16.86% | -16.57% | 2.57% | -0.05% | 10.20% | 2.00% |
| Russell 2000® Value Index | -17.36% | -12.86% | 7.37% | 3.61% | 11.47%*** | |
| * | The Fund’s Institutional shares inception date is September 30, 2011, Investor shares inception date is April 30, 2014. The performance shown for Investor shares for periods pre-dating the commencement of operations of that class reflects the performance of the Fund’s Institutional shares, the initial share class, calculated using the fees and expenses of Investor shares. If Investor shares of the Fund had been available during periods prior to April 30, 2014, the performance shown may have been different. |
| ** | Cortina Asset Management, LLC (the “Adviser”) has contractually agreed to waive management fees and/or reimburse the Fund’s operating expenses in order to limit the Fund’s total annual fund operating expenses (excluding taxes, leverage, interest, brokerage commissions, dividends or interest expenses on short positions, acquired fund fees and expenses, and extraordinary expenses) to 1.10% and 1.35% of average daily net assets of the Fund’s Institutional and Investor Class shares, respectively. The agreement will continue in effect at least through October 31, 2019, subject thereafter to annual re-approval of the agreement by the Fund’s Board of Directors. The current expense ratio for the Fund can be located in the Financial Highlights contained within this shareholder report. |
| *** | Represents the period from September 30, 2011 (date of original public offering of the Institutional shares) through December 31, 2018. |
Past performance does not guarantee future results. The performance data quoted represents past performance and current returns may be lower or higher. Total return figures include change in share price, reinvestment of dividends and capital gains. The investment return and principal value will fluctuate so that an investor’s shares, when redeemed may be worth more or less than their original cost. To obtain performance information current to the most recent month end, call 1-855-612-3936.
Russell 2000®Value Index measures the performance of those Russell 2000 companies with lower price-to-book ratios and lower forecasted growth values. All indices are unmanaged. It is not possible to invest directly in an index.
Sector Allocations****
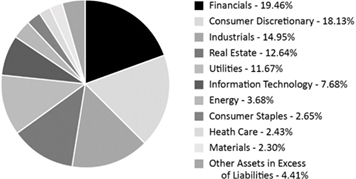
| **** | Percentages are based on Net Assets as of December 31, 2018. Holdings are subject to change. |
| Semi-Annual Report | December 31, 2018 | 5 |
| | Disclosure of Fund Expenses |
December 31, 2018 (Unaudited)
As a shareholder of the Fund(s), you incur ongoing costs, including management fees and other Fund expenses. This example is intended to help you understand your ongoing costs (in dollars) of investing in each Fund and to compare these costs with the ongoing costs of investing in other mutual funds. The example is based on an investment of $1,000 invested at the beginning of the period and held for the entire period, as indicated below.
Actual Expenses– The first line of the table below provides information about the actual account values and actual expenses. You may use the information in this line, together with the amount you invested, to estimate the expenses that you paid over the period. Simply divide your account value by $1,000 (for example, an $8,600 account value divided by $1,000 = 8.6) then multiply the result by the number in the first line under the heading entitled “Expenses Paid During Period” to estimate the expenses you paid on your account during this period.
Hypothetical Example for Comparison Purposes– The second line of the table below provides information about hypothetical account values and hypothetical expenses based on each Fund’s actual expense ratio and an assumed annual rate of return of 5% before expenses, which is not each Fund’s actual return. The hypothetical account values and expenses may not be used to estimate the actual ending account balance or expenses you paid for the period. You may use this information to compare the ongoing costs of investing in each Fund and other funds by comparing these 5% hypothetical examples with the 5% hypothetical examples that appear in the shareholder reports of other funds.
Please note that the expenses shown in the table are meant to highlight your ongoing costs only and do not reflect any direct costs, such as wire fees or low balance fees. Therefore, the second line of the table is useful in comparing ongoing costs and will not help you determine the relative total costs of owning different funds. In addition, if these direct costs were included, your costs would be higher.
| | Beginning
Account Value
July 1, 2018 | Ending
Account Value
December 31, 2018 | Expenses Paid During Period(a) | Net
Expense
Ratios(b) |
| Cortina Small Cap Growth Fund - Institutional | | | | |
| Actual Fund Return | $1,000.00 | $850.10 | $5.13 | 1.10% |
| Hypothetical Fund Return (assuming a 5% return before expenses) | $1,000.00 | $1,019.66 | $5.60 | 1.10% |
| Cortina Small Cap Value Fund - Institutional | | | | |
| Actual Fund Return | $1,000.00 | $832.20 | $5.08 | 1.10% |
| Hypothetical Fund Return (assuming a 5% return before expenses) | $1,000.00 | $1,019.66 | $5.60 | 1.10% |
| Cortina Small Cap Value Fund - Investor | | | | |
| Actual Fund Return | $1,000.00 | $831.40 | $6.23 | 1.35% |
| Hypothetical Fund Return (assuming a 5% return before expenses) | $1,000.00 | $1,018.40 | $6.87 | 1.35% |
| (a) | Expenses are equal to the Fund’s annualized expense ratio multiplied by the average account value over the period, multiplied by the number of days in the most recent fiscal half year (181), divided by 365. |
| (b) | Annualized, based on the Fund’s most recent half-year expenses. |
| 6 | 1-855-612-3936 | www.cortinafunds.com |
| Schedule of Investments |
| Cortina Small Cap Growth Fund | December 31, 2018 (Unaudited) |
| | | Shares | | Value |
| COMMON STOCKS (97.12%) | | | | | | | | |
| Communication Services (3.73%) | | | | | | | | |
| Boingo Wireless, Inc.(a) | | | 8,981 | | | $ | 184,739 | |
| Glu Mobile, Inc.(a) | | | 38,353 | | | | 309,509 | |
| Rosetta Stone, Inc.(a) | | | 11,151 | | | | 182,876 | |
| TechTarget, Inc.(a) | | | 10,727 | | | | 130,977 | |
| | | | | | | | 808,101 | |
| Consumer Discretionary (11.20%) | | | | | | | | |
| Cavco Industries, Inc.(a) | | | 1,125 | | | | 146,677 | |
| Chegg, Inc.(a) | | | 9,819 | | | | 279,056 | |
| Chuy’s Holdings, Inc.(a) | | | 7,990 | | | | 141,743 | |
| Cooper-Standard Holdings, Inc.(a) | | | 2,494 | | | | 154,927 | |
| Duluth Holdings, Inc., Class B(a) | | | 8,126 | | | | 205,019 | |
| Five Below, Inc.(a) | | | 2,200 | | | | 225,104 | |
| MarineMax, Inc.(a) | | | 13,231 | | | | 242,260 | |
| Noodles & Co.(a) | | | 16,315 | | | | 114,042 | |
| Ollie’s Bargain Outlet Holdings, Inc.(a) | | | 2,249 | | | | 149,581 | |
| PlayAGS, Inc.(a) | | | 11,114 | | | | 255,622 | |
| Skyline Champion Corp. | | | 17,677 | | | | 259,675 | |
| Wingstop, Inc. | | | 3,971 | | | | 254,898 | |
| | | | | | | | 2,428,604 | |
| Consumer Staples (1.61%) | | | | | | | | |
| Freshpet, Inc.(a) | | | 5,167 | | | | 166,171 | |
| Limoneira Co. | | | 9,426 | | | | 184,278 | |
| | | | | | | | 350,449 | |
| Energy (2.70%) | | | | | | | | |
| Centennial Resource Development, Inc., Class A(a) | | | 9,920 | | | | 109,319 | |
| Mammoth Energy Services, Inc. | | | 7,543 | | | | 135,623 | |
| Matador Resources Co.(a) | | | 7,242 | | | | 112,468 | |
| Profire Energy, Inc.(a) | | | 52,856 | | | | 76,641 | |
| ProPetro Holding Corp.(a) | | | 12,255 | | | | 150,982 | |
| | | | | | | | 585,033 | |
| Financials (5.03%) | | | | | | | | |
| Allegiance Bancshares, Inc.(a) | | | 3,335 | | | | 107,954 | |
| Green Dot Corp., Class A(a) | | | 3,597 | | | | 286,034 | |
| Independent Bank Group, Inc. | | | 4,282 | | | | 195,987 | |
| Pinnacle Financial Partners, Inc. | | | 4,252 | | | | 196,017 | |
| Seacoast Banking Corp. of Florida(a) | | | 9,364 | | | | 243,651 | |
| Sterling Bancorp, Inc. | | | 8,967 | | | | 62,321 | |
| | | | | | | | 1,091,964 | |
| Health Care (31.01%)(b) | | | | | | | | |
| Amphastar Pharmaceuticals, Inc.(a) | | | 12,860 | | | | 255,914 | |
| Apyx Medical Corp.(a) | | | 30,381 | | | | 196,869 | |
| AtriCure, Inc.(a) | | | 11,474 | | | | 351,104 | |
| BioDelivery Sciences International, Inc.(a) | | | 73,482 | | | | 271,883 | |
| BioTelemetry, Inc.(a) | | | 5,762 | | | | 344,107 | |
| Cardiovascular Systems, Inc.(a) | | | 9,359 | | | | 266,638 | |
| CareDx, Inc.(a) | | | 8,359 | | | | 210,145 | |
| Castlight Health, Inc., Class B(a) | | | 96,312 | | | | 208,997 | |
| Chembio Diagnostics, Inc.(a) | | | 33,170 | | | | 187,742 | |
| Codexis, Inc.(a) | | | 9,651 | | | | 161,172 | |
| Collegium Pharmaceutical, Inc.(a) | | | 18,019 | | | | 309,386 | |
| Cutera, Inc.(a) | | | 10,240 | | | | 174,285 | |
| Evolent Health, Inc., Class A(a) | | | 16,223 | | | | 323,649 | |
| Glaukos Corp.(a) | | | 4,348 | | | | 244,227 | |
| HealthEquity, Inc.(a) | | | 2,913 | | | | 173,761 | |
See Notes to Financial Statements.
| Semi-Annual Report | December 31, 2018 | 7 |
| Schedule of Investments |
| Cortina Small Cap Growth Fund | December 31, 2018 (Unaudited) |
| | | Shares | | Value |
| COMMON STOCKS (continued) | | | | | | | | |
| Health Care (continued) | | | | | | | | |
| Intersect ENT, Inc.(a) | | | 4,618 | | | $ | 130,135 | |
| IntriCon Corp.(a) | | | 7,789 | | | | 205,474 | |
| Ligand Pharmaceuticals, Inc.(a) | | | 1,572 | | | | 213,320 | |
| Neogen Corp.(a) | | | 3,251 | | | | 185,307 | |
| NeoGenomics, Inc.(a) | | | 12,095 | | | | 152,518 | |
| Neuronetics, Inc.(a) | | | 12,348 | | | | 238,934 | |
| Novocure, Ltd.(a) | | | 4,908 | | | | 164,320 | |
| Nuvectra Corp.(a) | | | 11,208 | | | | 183,139 | |
| Oxford Immunotec Global PLC(a) | | | 22,354 | | | | 285,684 | |
| Pacira Pharmaceuticals, Inc.(a) | | | 7,242 | | | | 311,551 | |
| STAAR Surgical Co.(a) | | | 5,325 | | | | 169,921 | |
| Tactile Systems Technology, Inc.(a) | | | 3,928 | | | | 178,920 | |
| Veracyte, Inc.(a) | | | 25,928 | | | | 326,174 | |
| Vocera Communications, Inc.(a) | | | 7,575 | | | | 298,076 | |
| | | | | | | | 6,723,352 | |
| Industrials (15.33%) | | | | | | | | |
| AAR Corp. | | | 5,387 | | | | 201,150 | |
| Air Transport Services Group, Inc.(a) | | | 11,155 | | | | 254,445 | |
| Axon Enterprise, Inc.(a) | | | 2,681 | | | | 117,294 | |
| Chart Industries, Inc.(a) | | | 5,155 | | | | 335,230 | |
| Dycom Industries, Inc.(a) | | | 3,120 | | | | 168,605 | |
| Forward Air Corp. | | | 3,019 | | | | 165,592 | |
| Kornit Digital, Ltd.(a) | | | 11,337 | | | | 212,229 | |
| Kratos Defense & Security Solutions, Inc.(a) | | | 15,819 | | | | 222,890 | |
| Manitex International, Inc.(a) | | | 22,575 | | | | 128,226 | |
| Meritor, Inc.(a) | | | 14,082 | | | | 238,127 | |
| Saia, Inc.(a) | | | 4,187 | | | | 233,718 | |
| Spartan Motors, Inc. | | | 20,294 | | | | 146,726 | |
| Spirit Airlines, Inc.(a) | | | 5,684 | | | | 329,217 | |
| TPI Composites, Inc.(a) | | | 12,446 | | | | 305,923 | |
| Werner Enterprises, Inc. | | | 8,969 | | | | 264,944 | |
| | | | | | | | 3,324,316 | |
| Information Technology (26.51%)(b) | | | | | | | | |
| Advanced Energy Industries, Inc.(a) | | | 5,792 | | | | 248,651 | |
| Altair Engineering, Inc., Class A(a) | | | 7,983 | | | | 220,171 | |
| Amber Road, Inc.(a) | | | 20,294 | | | | 167,020 | |
| Appian Corp.(a) | | | 7,640 | | | | 204,064 | |
| Aquantia Corp.(a) | | | 19,040 | | | | 166,981 | |
| Benefitfocus, Inc.(a) | | | 7,166 | | | | 327,630 | |
| Bottomline Technologies DE, Inc.(a) | | | 2,691 | | | | 129,168 | |
| Cray, Inc.(a) | | | 12,784 | | | | 276,007 | |
| Envestnet, Inc.(a) | | | 3,101 | | | | 152,538 | |
| FARO Technologies, Inc.(a) | | | 5,421 | | | | 220,309 | |
| Five9, Inc.(a) | | | 8,238 | | | | 360,165 | |
| FormFactor, Inc.(a) | | | 21,521 | | | | 303,231 | |
| Inphi Corp.(a) | | | 7,154 | | | | 230,001 | |
| LivePerson, Inc.(a) | | | 13,737 | | | | 259,080 | |
| Materialise NV, ADR(a) | | | 14,324 | | | | 286,910 | |
| Mellanox Technologies, Ltd.(a) | | | 3,201 | | | | 295,708 | |
| Mimecast, Ltd.(a) | | | 4,535 | | | | 152,512 | |
| Model N, Inc.(a) | | | 14,450 | | | | 191,173 | |
| Photronics, Inc.(a) | | | 27,525 | | | | 266,442 | |
| Pluralsight, Inc., Class A(a) | | | 6,684 | | | | 157,408 | |
| Quantenna Communications, Inc.(a) | | | 16,870 | | | | 242,085 | |
| Rapid7, Inc.(a) | | | 7,067 | | | | 220,208 | |
| Rudolph Technologies, Inc.(a) | | | 7,573 | | | | 155,019 | |
See Notes to Financial Statements.
| 8 | 1-855-612-3936 | www.cortinafunds.com |
| Schedule of Investments |
| Cortina Small Cap Growth Fund | December 31, 2018 (Unaudited) |
| | | Shares | | Value |
| COMMON STOCKS (continued) | | | | | | | | |
| Information Technology (continued) | | | | | | | | |
| SailPoint Technologies Holding, Inc.(a) | | | 6,737 | | | $ | 158,252 | |
| Silicon Motion Technology Corp., ADR | | | 5,082 | | | | 175,329 | |
| Tower Semiconductor, Ltd.(a) | | | 12,345 | | | | 181,965 | |
| | | | | | | | 5,748,027 | |
| | | | | | | | | |
| TOTAL COMMON STOCKS | | | | | | | | |
| (COST $18,832,319) | | | | | | | 21,059,846 | |
| | | | | | | | | |
| TOTAL INVESTMENTS (97.12%) | | | | | | | | |
| (COST $18,832,319) | | | | | | | 21,059,846 | |
| | | | | | | | | |
| OTHER ASSETS IN EXCESS OF LIABILITIES (2.88%) | | | | | | | 623,557 | |
| | | | | | | | | |
| NET ASSETS 100.00% | | | | | | $ | 21,683,403 | |
| (a) | Non Income Producing Security. |
| (b) | To the extent the Fund invests more heavily in particular sectors of the economy, its performance will be especially sensitive to developments that significantly affect those sectors. When sector categorization is broken down by industry, no industry exceeds the 25% maximum specified in the Statement of Additional Information. |
See Notes to Financial Statements.
| Semi-Annual Report | December 31, 2018 | 9 |
| Schedule of Investments |
| Cortina Small Cap Value Fund | December 31, 2018 (Unaudited) |
| | | Shares | | Value |
| COMMON STOCKS (95.59%) | | | | | | | | |
| Consumer Discretionary (18.13%) | | | | | | | | |
| Abercrombie & Fitch Co., Class A | | | 6,674 | | | $ | 133,814 | |
| Adtalem Global Education, Inc.(a) | | | 10,898 | | | | 515,693 | |
| Bojangles’, Inc.(a) | | | 20,209 | | | | 324,961 | |
| Buckle, Inc. | | | 16,292 | | | | 315,087 | |
| Caleres, Inc. | | | 10,524 | | | | 292,883 | |
| Career Education Corp.(a) | | | 40,464 | | | | 462,099 | |
| Eldorado Resorts, Inc.(a) | | | 7,916 | | | | 286,638 | |
| Etsy, Inc.(a) | | | 1,576 | | | | 74,970 | |
| Helen of Troy, Ltd.(a) | | | 2,685 | | | | 352,218 | |
| Skyline Champion Corp. | | | 19,578 | | | | 287,601 | |
| Williams-Sonoma, Inc. | | | 7,820 | | | | 394,519 | |
| YETI Holdings, Inc.(a) | | | 18,335 | | | | 272,092 | |
| | | | | | | | 3,712,575 | |
| Consumer Staples (2.65%) | | | | | | | | |
| TreeHouse Foods, Inc.(a) | | | 10,681 | | | | 541,633 | |
| | | | | | | | | |
| Energy (3.68%) | | | | | | | | |
| Carrizo Oil & Gas, Inc.(a) | | | 11,689 | | | | 131,969 | |
| Eclipse Resources Corp.(a) | | | 144,020 | | | | 151,221 | |
| Matador Resources Co.(a) | | | 10,575 | | | | 164,230 | |
| Oil States International, Inc.(a) | | | 9,761 | | | | 139,387 | |
| Patterson-UTI Energy, Inc. | | | 16,149 | | | | 167,142 | |
| | | | | | | | 753,949 | |
| Financials (19.46%) | | | | | | | | |
| Bank OZK | | | 12,936 | | | | 295,329 | |
| CBTX, Inc. | | | 10,515 | | | | 309,141 | |
| Enterprise Financial Services Corp. | | | 10,214 | | | | 384,353 | |
| Live Oak Bancshares, Inc. | | | 33,041 | | | | 489,337 | |
| Meridian Bancorp, Inc. | | | 19,046 | | | | 272,739 | |
| Pinnacle Financial Partners, Inc. | | | 7,880 | | | | 363,268 | |
| Provident Financial Services, Inc. | | | 14,651 | | | | 353,529 | |
| TriState Capital Holdings, Inc.(a) | | | 21,977 | | | | 427,672 | |
| Waterstone Financial, Inc. | | | 21,283 | | | | 356,703 | |
| Western Alliance Bancorp(a) | | | 10,168 | | | | 401,534 | |
| Wintrust Financial Corp. | | | 4,955 | | | | 329,458 | |
| | | | | | | | 3,983,063 | |
| Health Care (2.43%) | | | | | | | | |
| Endologix, Inc.(a) | | | 49,453 | | | | 35,408 | |
| Pacira Pharmaceuticals, Inc.(a) | | | 3,397 | | | | 146,139 | |
| Prestige Consumer Healthcare, Inc.(a) | | | 10,251 | | | | 316,551 | |
| | | | | | | | 498,098 | |
| Industrials (14.95%) | | | | | | | | |
| American Woodmark Corp.(a) | | | 4,127 | | | | 229,791 | |
| Astronics Corp.(a) | | | 8,375 | | | | 255,019 | |
| Astronics Corp., Class B(a) | | | 1,040 | | | | 31,626 | |
| Atkore International Group, Inc.(a) | | | 12,613 | | | | 250,242 | |
| Beacon Roofing Supply, Inc.(a) | | | 11,560 | | | | 366,683 | |
| Federal Signal Corp. | | | 12,733 | | | | 253,387 | |
| Forward Air Corp. | | | 6,147 | | | | 337,163 | |
| Generac Holdings, Inc.(a) | | | 11,665 | | | | 579,751 | |
| Harsco Corp.(a) | | | 7,358 | | | | 146,130 | |
| Knoll, Inc. | | | 21,764 | | | | 358,671 | |
| Luxfer Holdings PLC | | | 14,332 | | | | 252,673 | |
| | | | | | | | 3,061,136 | |
See Notes to Financial Statements.
| 10 | 1-855-612-3936 | www.cortinafunds.com |
| Schedule of Investments |
| Cortina Small Cap Value Fund | December 31, 2018 (Unaudited) |
| | | Shares | | Value |
| COMMON STOCKS (continued) | | | | | | | | |
| Information Technology (7.68%) | | | | | | | | |
| ACI Worldwide, Inc.(a) | | | 14,665 | | | $ | 405,780 | |
| BlackBerry, Ltd.(a) | | | 27,966 | | | | 198,838 | |
| Ciena Corp.(a) | | | 10,256 | | | | 347,781 | |
| Dolby Laboratories, Inc., Class A | | | 6,008 | | | | 371,535 | |
| Teradata Corp.(a) | | | 6,494 | | | | 249,110 | |
| | | | | | | | 1,573,044 | |
| Materials (2.30%) | | | | | | | | |
| AdvanSix, Inc.(a) | | | 9,294 | | | | 226,216 | |
| Commercial Metals Co. | | | 15,270 | | | | 244,625 | |
| | | | | | | | 470,841 | |
| Real Estate (12.64%) | | | | | | | | |
| Americold Realty Trust, REIT | | | 25,494 | | | | 651,117 | |
| Brixmor Property Group, Inc., REIT | | | 21,468 | | | | 315,365 | |
| Essential Properties Realty Trust, Inc., REIT | | | 26,266 | | | | 363,522 | |
| Farmland Partners, Inc., REIT | | | 13,265 | | | | 60,223 | |
| Four Corners Property Trust, Inc., REIT | | | 19,176 | | | | 502,411 | |
| NexPoint Residential Trust, Inc., REIT | | | 7,081 | | | | 248,189 | |
| Taubman Centers, Inc., REIT | | | 4,312 | | | | 196,153 | |
| Washington Prime Group, Inc., REIT | | | 51,570 | | | | 250,630 | |
| | | | | | | | 2,587,610 | |
| Utilities (11.67%) | | | | | | | | |
| Avista Corp. | | | 8,740 | | | | 371,275 | |
| Black Hills Corp. | | | 6,401 | | | | 401,855 | |
| Chesapeake Utilities Corp. | | | 5,856 | | | | 476,093 | |
| Middlesex Water Co. | | | 5,287 | | | | 282,062 | |
| Portland General Electric Co. | | | 8,171 | | | | 374,640 | |
| SJW Group | | | 8,670 | | | | 482,225 | |
| | | | | | | | 2,388,150 | |
| | | | | | | | | |
| TOTAL COMMON STOCKS | | | | | | | | |
| (COST $19,079,354) | | | | | | | 19,570,099 | |
| | | | | | | | | |
| TOTAL INVESTMENTS (95.59%) | | | | | | | | |
| (COST $19,079,354) | | | | | | | 19,570,099 | |
| | | | | | | | | |
| OTHER ASSETS IN EXCESS OF LIABILITIES (4.41%) | | | | | | | 903,219 | |
| | | | | | | | | |
| NET ASSETS 100.00% | | | | | | $ | 20,473,318 | |
| (a) | Non Income Producing Security. |
See Notes to Financial Statements.
| Semi-Annual Report | December 31, 2018 | 11 |
| Statements of Assets and Liabilities |
December 31, 2018 (Unaudited)
| | | Cortina Small Cap
Growth Fund | | Cortina Small Cap
Value Fund |
| ASSETS: | | | | |
| Investments, at value (Cost - see below) | | $ | 21,059,846 | | | $ | 19,570,099 | |
| Cash | | | 1,601,009 | | | | 506,490 | |
| Receivable for investments sold | | | 21,324 | | | | 476,754 | |
| Receivable for fund shares subscribed | | | 1,000 | | | | 83,000 | |
| Dividends and interest receivable | | | 1,654 | | | | 20,389 | |
| Receivable due from adviser | | | 1,799 | | | | 1,155 | |
| Prepaid expenses and other assets | | | 17,517 | | | | 19,716 | |
| Total Assets | | | 22,704,149 | | | | 20,677,603 | |
| | | | | | | | | |
| LIABILITIES: | | | | | | | | |
| Payable for investments purchased | | | 959,841 | | | | 87,735 | |
| Payable for fund shares redeemed | | | 3,711 | | | | 53,991 | |
| Payable for director fees | | | 5,081 | | | | 5,081 | |
| Payable for fund accounting and administration fees | | | 23,385 | | | | 21,499 | |
| Payable for distribution and service fees | | | – | | | | 226 | |
| Payable for audit, tax and legal fees | | | 15,776 | | | | 17,785 | |
| Other accrued liabilities and expenses | | | 12,952 | | | | 17,968 | |
| Total Liabilities | | | 1,020,746 | | | | 204,285 | |
| Net Assets | | $ | 21,683,403 | | | $ | 20,473,318 | |
| | | | | | | | | |
| NET ASSETS CONSISTS OF: | | | | | | | | |
| Paid-in capital | | $ | 20,403,067 | | | $ | 20,822,953 | |
| Total distributable earnings | | | 1,280,336 | | | | (349,635 | ) |
| Net Assets | | $ | 21,683,403 | | | $ | 20,473,318 | |
| | | | | | | | | |
| Cost of Investments | | $ | 18,832,319 | | | $ | 19,079,354 | |
| | | | | | | | | |
| PRICING OF SHARES: | | | | | | | | |
| Institutional | | | | | | | | |
| Net Assets | | $ | 21,683,403 | | | $ | 20,015,265 | |
| Shares Outstanding ($0.01 par value, unlimited number of shares authorized) | | | 1,794,132 | | | | 1,370,759 | |
| Net Asset Value, offering and redemption price per share | | $ | 12.09 | | | $ | 14.60 | |
| Investor | | | | | | | | |
| Net Assets | | $ | – | | | $ | 458,053 | |
| Shares Outstanding ($0.01 par value, unlimited number of shares authorized) | | | – | | | | 31,721 | |
| Net Asset Value, offering and redemption price per share | | $ | – | | | $ | 14.44 | |
See Notes to Financial Statements.
| 12 | 1-855-612-3936 | www.cortinafunds.com |
| Statements of Operations |
For the Six Months Ended December 31, 2018 (Unaudited)
| | | Cortina Small Cap
Growth Fund | | Cortina Small Cap
Value Fund |
| INVESTMENT INCOME: | | | | | | | | |
| Dividends (net of foreign withholding taxes of $29 and $188, respectively) | | $ | 34,607 | | | $ | 195,357 | |
| Total Investment Income | | | 34,607 | | | | 195,357 | |
| | | | | | | | | |
| EXPENSES: | | | | | | | | |
| Advisory fees (Note 3) | | | 152,126 | | | | 141,421 | |
| Fund accounting and administration fees and expenses | | | 65,112 | | | | 59,538 | |
| Transfer agent fees | | | 19,609 | | | | 21,789 | |
| Distribution and service fees | | | | | | | | |
| Investor | | | – | | | | 787 | |
| Legal fees | | | 11,042 | | | | 10,787 | |
| Printing fees | | | 2,318 | | | | 2,991 | |
| Registration fees | | | 10,236 | | | | 15,936 | |
| Audit and tax fees | | | 7,957 | | | | 8,209 | |
| Custodian fees | | | 2,566 | | | | 2,913 | |
| Director fees and expenses | | | 10,081 | | | | 10,081 | |
| Other | | | 6,078 | | | | 8,234 | |
| Total Expenses Before Waivers | | | 287,125 | | | | 282,686 | |
| Less fees waived by Adviser (Note 3) | | | (120,136 | ) | | | (126,631 | ) |
| Total Net Expenses | | | 166,989 | | | | 156,055 | |
| Net Investment Income/(Loss) | | | (132,382 | ) | | | 39,302 | |
| | | | | | | | | |
| REALIZED AND UNREALIZED GAIN/(LOSS) ON INVESTMENTS: | | | | | | | | |
| Net realized gain on investments | | | 2,438,598 | | | | 690,903 | |
| Net change in unrealized depreciation on investments | | | (6,450,218 | ) | | | (5,283,100 | ) |
| Net Realized and Unrealized Loss on Investments | | | (4,011,620 | ) | | | (4,592,197 | ) |
| Net Decrease in Net Assets Resulting from Operations | | $ | (4,144,002 | ) | | $ | (4,552,895 | ) |
See Notes to Financial Statements.
| Semi-Annual Report | December 31, 2018 | 13 |
| Statements of Changes in Net Assets |
| | | Cortina Small Cap Growth Fund | | Cortina Small Cap Value Fund |
| | | Six Months Ended December 31, 2018 (Unaudited) | | Year Ended
June 30, 2018 | | Six Months Ended December 31, 2018 (Unaudited) | | Year Ended
June 30, 2018 |
| OPERATIONS: | | | | | | | | |
| Net investment income/(loss) | | $ | (132,382 | ) | | $ | (262,645 | ) | | $ | 39,302 | | | $ | (15,597 | ) |
| Net realized gain on investments | | | 2,438,598 | | | | 4,491,713 | | | | 690,903 | | | | 3,156,765 | |
| Net change in unrealized appreciation/ depreciation on investments | | | (6,450,218 | ) | | | 2,256,335 | | | | (5,283,100 | ) | | | (525,768 | ) |
| Net increase/(decrease) in net assets resulting from operations | | | (4,144,002 | ) | | | 6,485,403 | | | | (4,552,895 | ) | | | 2,615,400 | |
| | | | | | | | | | | | | | | | | |
| DISTRIBUTIONS TO SHAREHOLDERS: | | | | | | | | | | | | | | | | |
| Institutional | | | | | | | | | | | | | | | | |
| From distributable earnings | | | (6,403,463 | ) | | | (4,189,359 | ) | | | (3,211,595 | ) | | | (2,288,431 | ) |
| Investor | | | | | | | | | | | | | | | | |
| From distributable earnings | | | – | | | | – | | | | (78,337 | ) | | | (34,992 | ) |
| Total amount of distributions paid | | | (6,403,463 | ) | | | (4,189,359 | )(a) | | | (3,289,932 | ) | | | (2,323,423 | )(b) |
| | | | | | | | | | | | | | | | | |
| CAPITAL SHARE TRANSACTIONS: | | | | | | | | | | | | | | | | |
| Institutional | | | | | | | | | | | | | | | | |
| Proceeds from sale of shares | | | 3,561,634 | | | | 5,542,873 | | | | 1,196,535 | | | | 14,918,148 | |
| Shares issued in reinvestment of distributions | | | 6,308,429 | | | | 4,159,270 | | | | 3,174,085 | | | | 1,673,166 | |
| Cost of shares redeemed | | | (10,671,820 | ) | | | (4,980,273 | ) | | | (6,112,961 | ) | | | (28,948,315 | ) |
| Redemption fees | | | 876 | | | | – | | | | – | | | | 4 | |
| Total | | | (800,881 | ) | | | 4,721,870 | | | | (1,742,341 | ) | | | (12,356,997 | ) |
| Investor | | | | | | | | | | | | | | | | |
| Proceeds from sale of shares | | | – | | | | – | | | | 12,916 | | | | 37,009 | |
| Shares issued in reinvestment of distributions | | | – | | | | – | | | | 74,286 | | | | 30,671 | |
| Cost of shares redeemed | | | – | | | | – | | | | (107,485 | ) | | | (445,691 | ) |
| Total | | | – | | | | – | | | | (20,283 | ) | | | (378,011 | ) |
| Net increase/(decrease) from capital shares transactions | | | (800,881 | ) | | | 4,721,870 | | | | (1,762,624 | ) | | | (12,735,008 | ) |
| | | | | | | | | | | | | | | | | |
| Net increase/(decrease) in net assets | | | (11,348,346 | ) | | | 7,017,914 | | | | (9,605,451 | ) | | | (12,443,031 | ) |
| | | | | | | | | | | | | | | | | |
| NET ASSETS: | | | | | | | | | | | | | | | | |
| Beginning of period | | | 33,031,749 | | | | 26,013,835 | | | | 30,078,769 | | | | 42,521,800 | |
| End of period | | $ | 21,683,403 | | | $ | 33,031,749 | (c) | | $ | 20,473,318 | | | $ | 30,078,769 | (c) |
| | | | | | | | | | | | | | | | | |
| | | | | | | | | | | | | | | | | |
| OTHER INFORMATION: | | | | | | | | | | | | | | | | |
| Share Transactions: | | | | | | | | | | | | | | | | |
| Institutional | | | | | | | | | | | | | | | | |
| Beginning shares | | | 1,658,226 | | | | 1,390,728 | | | | 1,431,227 | | | | 2,057,765 | |
| Shares sold | | | 213,788 | | | | 280,309 | | | | 75,913 | | | | 741,753 | |
| Shares issued in reinvestment of dividends | | | 508,744 | | | | 260,769 | | | | 208,136 | | | | 83,868 | |
| Less shares redeemed | | | (586,626 | ) | | | (273,580 | ) | | | (344,517 | ) | | | (1,452,159 | ) |
| Ending shares | | | 1,794,132 | | | | 1,658,226 | | | | 1,370,759 | | | | 1,431,227 | |
| Investor | | | | | | | | | | | | | | | | |
| Beginning shares | | | – | | | | – | | | | 32,367 | | | | 51,411 | |
| Shares sold | | | – | | | | – | | | | 700 | | | | 1,820 | |
| Shares issued in reinvestment of dividends | | | – | | | | – | | | | 4,923 | | | | 1,549 | |
| Less shares redeemed | | | – | | | | – | | | | (6,269 | ) | | | (22,413 | ) |
| Ending shares | | | – | | | | – | | | | 31,721 | | | | 32,367 | |
| (a) | For the year ended June 30, 2018, total distributions from distributable earnings consisted of net investment income of $– and net realized gains of $4,189,359. |
| (b) | For the year ended June 30, 2018, total distributions from distributable earnings consisted of net investment income of $– and net realized gains of $2,323,423. |
| (c) | For the year ended June 30, 2018, net assets included accumulated net investment income of $–. |
See Notes to Financial Statements.
| 14 | 1-855-612-3936 | www.cortinafunds.com |
| Financial Highlights |
| Cortina Small Cap Growth Fund | For a share outstanding throughout the periods presented. |
| | | Six Months
Ended
December 31,
2018
(Unaudited) | | Year Ended
June 30, 2018 | | Year Ended
June 30, 2017 | | Year Ended
June 30, 2016 | | Year Ended
June 30, 2015 | | Year Ended
June 30, 2014 |
| NET ASSET VALUE, BEGINNING OF PERIOD | | $ | 19.92 | | | $ | 18.71 | | | $ | 14.28 | | | $ | 15.41 | | | $ | 16.35 | | | $ | 14.46 | |
| INCOME/(LOSS) FROM INVESTMENT OPERATIONS: | | | | | | | | | | | | | | | | | | | | | | | | |
| Net investment loss(a) | | | (0.08 | ) | | | (0.18 | ) | | | (0.16 | ) | | | (0.13 | ) | | | (0.14 | ) | | | (0.17 | ) |
| Net realized and unrealized gain/(loss) on investments | | | (2.78 | ) | | | 4.41 | | | | 4.59 | | | | (1.00 | ) | | | (0.02 | )(b) | | | 2.19 | |
| Total from Investment Operations | | | (2.86 | ) | | | 4.23 | | | | 4.43 | | | | (1.13 | ) | | | (0.16 | ) | | | 2.02 | |
| | | | | | | | | | | | | | | | | | | | | | | | | |
| DIVIDENDS AND DISTRIBUTIONS TO SHAREHOLDERS: | | | | | | | | | | | | | | | | | | | | | | | | |
| From net realized gains on investments | | | (4.97 | ) | | | (3.02 | ) | | | – | | | | – | | | | (0.78 | ) | | | (0.13 | ) |
| Total Dividends and Distributions to Shareholders | | | (4.97 | ) | | | (3.02 | ) | | | – | | | | – | | | | (0.78 | ) | | | (0.13 | ) |
| Paid-in Capital from Redemption Fees | | | 0.00 | (c) | | | – | | | | – | | | | – | | | | 0.00 | (c) | | | 0.00 | (c) |
| | | | | | | | | | | | | | | | | | | | | | | | | |
| NET INCREASE/(DECREASE) IN NET ASSET VALUE | | | (7.83 | ) | | | 1.21 | | | | 4.43 | | | | (1.13 | ) | | | (0.94 | ) | | | 1.89 | |
| | | | | | | | | | | | | | | | | | | | | | | | | |
| NET ASSET VALUE, END OF PERIOD | | $ | 12.09 | | | $ | 19.92 | | | $ | 18.71 | | | $ | 14.28 | | | $ | 15.41 | | | $ | 16.35 | |
| TOTAL RETURN | | | (14.99 | %)(d) | | | 26.72 | % | | | 30.95 | % | | | (7.33 | %) | | | (0.71 | %) | | | 13.99 | % |
| | | | | | | | | | | | | | | | | | | | | | | | | |
| RATIOS AND SUPPLEMENTAL DATA: | | | | | | | | | | | | | | | | | | | | | | | | |
| Net assets, end of period (in 000s) | | $ | 21,683 | | | $ | 33,032 | | | $ | 26,014 | | | $ | 34,821 | | | $ | 46,285 | | | $ | 31,657 | |
| | | | | | | | | | | | | | | | | | | | | | | | | |
| RATIOS TO AVERAGE NET ASSETS: | | | | | | | | | | | | | | | | | | | | | | | | |
| Operating expenses excluding waiver/reimbursement | | | 1.89 | %(e) | | | 1.81 | % | | | 1.76 | % | | | 1.54 | % | | | 1.57 | % | | | 1.86 | % |
| Operating expenses including waiver/reimbursement | | | 1.10 | %(e) | | | 1.10 | % | | | 1.10 | % | | | 1.10 | % | | | 1.10 | % | | | 1.10 | % |
| Net investment loss including waiver/reimbursement | | | (0.87 | )%(e) | | | (0.96 | )% | | | (0.98 | )% | | | (0.97 | )% | | | (0.94 | )% | | | (1.02 | )% |
| PORTFOLIO TURNOVER RATE | | | 46 | %(d) | | | 96 | % | | | 88 | % | | | 93 | % | | | 95 | % | | | 81 | % |
| (a) | Calculated using average shares throughout the period. |
| (b) | Realized and unrealized gains and losses per share in this caption are balancing amounts necessary to reconcile the change in net asset value per share for the period, and may not reconcile with the aggregate gains and losses in the Statements of Operations due to the share transactions for the period. |
| (c) | Less than $0.005 per share. |
See Notes to Financial Statements.
| Semi-Annual Report | December 31, 2018 | 15 |
| Financial Highlights |
| Cortina Small Cap Value Fund – Institutional | For a share outstanding throughout the periods presented. |
| | |
| | | Six
Months
Ended
December 31,
2018
(Unaudited) | | Year Ended
June 30, 2018 | | Year Ended
June 30, 2017 | | Year Ended
June 30, 2016 | | Year Ended
June 30, 2015 | | Year Ended
June 30, 2014 |
| NET ASSET VALUE, BEGINNING OF PERIOD | | $ | 20.56 | | | $ | 20.16 | | | $ | 16.20 | | | $ | 18.52 | | | $ | 18.67 | | | $ | 15.62 | |
| INCOME/(LOSS) FROM INVESTMENT OPERATIONS: | | | | | | | | | | | | | | | | | | | | | | | | |
| Net investment income/(loss)(a) | | | 0.03 | | | | (0.01 | ) | | | 0.01 | | | | 0.01 | | | | (0.02 | ) | | | (0.01 | ) |
| Net realized and unrealized gain/(loss) on investments | | | (3.37 | ) | | | 1.50 | | | | 3.98 | | | | (2.33 | ) | | | 0.24 | | | | 3.30 | |
| Total from Investment Operations | | | (3.34 | ) | | | 1.49 | | | | 3.99 | | | | (2.32 | ) | | | 0.22 | | | | 3.29 | |
| | | | | | | | | | | | | | | | | | | | | | | | | |
| DIVIDENDS AND DISTRIBUTIONS TO SHAREHOLDERS: | | | | | | | | | | | | | | | | | | | | | | | | |
| From net investment income | | | (0.01 | ) | | | – | | | | (0.03 | ) | | | – | | | | – | | | | (0.01 | ) |
| From net realized gains on investments | | | (2.61 | ) | | | (1.09 | ) | | | – | | | | – | | | | (0.37 | ) | | | (0.23 | ) |
| Total Dividends and Distributions to Shareholders | | | (2.62 | ) | | | (1.09 | ) | | | (0.03 | ) | | | – | | | | (0.37 | ) | | | (0.24 | ) |
| | | | | | | | | | | | | | | | | | | | | | | | | |
| Paid-in Capital from Redemption Fees | | | – | | | | 0.00 | (b) | | | 0.00 | (b) | | | 0.00 | (b) | | | 0.00 | (b) | | | – | |
| | | | | | | | | | | | | | | | | | | | | | | | | |
| NET INCREASE/(DECREASE) IN NET ASSET VALUE | | | (5.96 | ) | | | 0.40 | | | | 3.96 | | | | (2.32 | ) | | | (0.15 | ) | | | 3.05 | |
| | | | | | | | | | | | | | | | | | | | | | | | | |
| NET ASSET VALUE, END OF PERIOD | | $ | 14.60 | | | $ | 20.56 | | | $ | 20.16 | | | $ | 16.20 | | | $ | 18.52 | | | $ | 18.67 | |
| | | | | | | | | | | | | | | | | | | | | | | | | |
| TOTAL RETURN | | | (16.78 | %)(c) | | | 7.54 | % | | | 24.65 | % | | | (12.53 | %) | | | 1.21 | % | | | 21.14 | % |
| | | | | | | | | | | | | | | | | | | | | | | | | |
| RATIOS AND SUPPLEMENTAL DATA: | | | | | | | | | | | | | | | | | | | | | | | | |
| Net assets, end of period (in 000s) | | $ | 20,015 | | | $ | 29,419 | | | $ | 41,492 | | | $ | 64,552 | | | $ | 51,254 | | | $ | 34,842 | |
| | | | | | | | | | | | | | | | | | | | | | | | | |
| RATIOS TO AVERAGE NET ASSETS: | | | | | | | | | | | | | | | | | | | | | | | | |
| Operating expenses excluding waiver/reimbursement | | | 2.00 | %(d) | | | 1.75 | % | | | 1.72 | % | | | 1.50 | % | | | 1.63 | % | | | 1.92 | % |
| Operating expenses including waiver/reimbursement | | | 1.10 | %(d) | | | 1.10 | % | | | 1.10 | % | | | 1.10 | % | | | 1.10 | % | | | 1.10 | % |
| Net investment income/(loss) including waiver/reimbursement | | | 0.28 | %(d) | | | (0.03 | )% | | | 0.03 | % | | | 0.08 | % | | | (0.13 | )% | | | (0.09 | )% |
| | | | | | | | | | | | | | | | | | | | | | | | | |
| PORTFOLIO TURNOVER RATE | | | 34 | %(c) | | | 95 | % | | | 89 | % | | | 109 | % | | | 102 | % | | | 78 | % |
| (a) | Calculated using average shares throughout the period. |
| (b) | Less than $0.005 per share. |
See Notes to Financial Statements.
| 16 | 1-855-612-3936 | www.cortinafunds.com |
| | Financial Highlights |
| Cortina Small Cap Value Fund – Investor | For a share outstanding throughout the periods presented. |
| | | Six Months
Ended
December 31,
2018
(Unaudited) | | Year Ended
June 30, 2018 | | Year Ended
June 30, 2017 | | Year Ended
June 30, 2016 | | Year Ended
June 30, 2015 | | For the Period
April 30, 2014
(Inception) to
June 30, 2014 |
| NET ASSET VALUE, BEGINNING OF PERIOD | | $ | 20.37 | | | $ | 20.04 | | | $ | 16.11 | | | $ | 18.47 | | | $ | 18.67 | | | $ | 18.15 | |
| INCOME/(LOSS) FROM INVESTMENT OPERATIONS: | | | | | | | | | | | | | | | | | | | | | | | | |
| Net investment loss(a) | | | 0.00 | (b) | | | (0.06 | ) | | | (0.03 | )(c) | | | (0.02 | ) | | | (0.06 | ) | | | (0.01 | ) |
| Net realized and unrealized gain/(loss) on investments | | | (3.32 | ) | | | 1.48 | | | | 3.96 | | | | (2.34 | ) | | | 0.23 | | | | 0.53 | |
| Total from Investment Operations | | | (3.32 | ) | | | 1.42 | | | | 3.93 | | | | (2.36 | ) | | | 0.17 | | | | 0.52 | |
| | | | | | | | | | | | | | | | | | | | | | | | | |
| DIVIDENDS AND DISTRIBUTIONS TO SHAREHOLDERS: | | | | | | | | | | | | | | | | | | | | | | | | |
| From net investment income | | | – | | | | – | | | | (0.00 | )(b) | | | – | | | | – | | | | – | |
| From net realized gains on investments | | | (2.61 | ) | | | (1.09 | ) | | | – | | | | – | | | | (0.37 | ) | | | – | |
| Total Dividends and Distributions to Shareholders | | | (2.61 | ) | | | (1.09 | ) | | | (0.00 | )(b) | | | – | | | | (0.37 | ) | | | – | |
| | | | | | | | | | | | | | | | | | | | | | | | | |
| NET INCREASE/(DECREASE) IN NET ASSET VALUE | | | (5.93 | ) | | | 0.33 | | | | 3.93 | | | | (2.36 | ) | | | (0.20 | ) | | | 0.52 | |
| | | | | | | | | | | | | | | | | | | | | | | | | |
| NET ASSET VALUE, END OF PERIOD | | $ | 14.44 | | | $ | 20.37 | | | $ | 20.04 | | | $ | 16.11 | | | $ | 18.47 | | | $ | 18.67 | |
| | | | | | | | | | | | | | | | | | | | | | | | | |
| TOTAL RETURN | | | (16.86 | %)(d) | | | 7.23 | % | | | 24.41 | % | | | (12.78 | %) | | | 0.94 | % | | | 2.87 | %(d) |
| | | | | | | | | | | | | | | | | | | | | | | | | |
| RATIOS AND SUPPLEMENTAL DATA: | | | | | | | | | | | | | | | | | | | | | | | | |
| Net assets, end of period (in 000s) | | $ | 458 | | | $ | 659 | | | $ | 1,030 | | | $ | 524 | | | $ | 360 | | | $ | 103 | |
| | | | | | | | | | | | | | | | | | | | | | | | | |
| RATIOS TO AVERAGE NET ASSETS: | | | | | | | | | | | | | | | | | | | | | | | | |
| Operating expenses excluding waiver/reimbursement | | | 2.25 | %(e) | | | 2.01 | % | | | 2.00 | % | | | 1.75 | % | | | 1.86 | % | | | 2.14 | %(e) |
| Operating expenses including waiver/reimbursement | | | 1.35 | %(e) | | | 1.35 | % | | | 1.35 | % | | | 1.35 | % | | | 1.35 | % | | | 1.35 | %(e) |
| Net investment income/(loss) including waiver/reimbursement | | | 0.05 | %(e) | | | (0.28 | )% | | | (0.15 | )% | | | (0.13 | )% | | | (0.35 | )% | | | (0.20 | )%(e) |
| | | | | | | | | | | | | | | | | | | | | | | | | |
| PORTFOLIO TURNOVER RATE | | | 34 | %(d) | | | 95 | % | | | 89 | % | | | 109 | % | | | 102 | % | | | 78 | %(d)(f) |
| (a) | Calculated using average shares throughout the period. |
| (b) | Less than $0.005 per share. |
| (c) | The amount shown for a share outstanding throughout the period may not correlate with the Statements of Operations for the period due to the timing of sales and redemptions of Fund shares in relation to income earned and/or fluctuating market value of the investments of the Fund. |
| (f) | Portfolio turnover is calculated at the Fund level and represents the year ended June 30, 2014. |
See Notes to Financial Statements.
| Semi-Annual Report |December 31, 2018 | 17 |
| | Notes to Financial Statements |
| December 31, 2018 (Unaudited) |
| |
1. ORGANIZATION
Cortina Funds, Inc. (the “Corporation”) is an open-end management investment company registered under the Investment Company Act of 1940, as amended (the “1940 Act”). The Corporation was organized on April 27, 2004 as a Wisconsin corporation. The Corporation currently offers shares of common stock (“shares”) of the Cortina Small Cap Growth Fund and the Cortina Small Cap Value Fund (each a “Fund” and collectively, the “Funds”).
The Cortina Small Cap Growth Fund, which commenced operations with the sale of Institutional Class Shares on September 30, 2011, is a diversified portfolio with an investment objective to seek growth of capital. The Cortina Small Cap Value Fund, which commenced operations with the sale of Institutional Class Shares on September 30, 2011 and the sale of Investor Class Shares on April 30, 2014, is a diversified portfolio with an investment objective to seek long-term capital appreciation.
Shares of each Fund are designated as Institutional Shares or Investor Shares with an indefinite number of shares authorized at $0.01 par value. The Articles of Incorporation, as amended and restated, permit the Corporation’s Board of Directors (the “Board”) to create additional funds and share classes.
2. SIGNIFICANT ACCOUNTING POLICIES
The following is a summary of significant accounting policies followed by the Funds. These policies are in conformity with U.S. generally accepted accounting principles (“GAAP”). Each Fund is an investment company and accordingly follows the investment company accounting and reporting guidance of the Financial Accounting Standards Board (FASB) Accounting Standard Codification Topic 946Financial Services – Investment Companies.
Use of Estimates — The accompanying financial statements were prepared in accordance with GAAP, which require the use of estimates and assumptions made by management. These may affect the reported amounts of assets and liabilities and disclosure of contingent assets and liabilities at the date of the financial statements and the reported amounts of increases and decreases in net assets from operations during the reporting period. Actual results could differ from those estimates.
Investment Valuation — Investment securities are valued at the last sale price at the close of the principal exchange on which they trade, except for securities listed on the NASDAQ Stock Market, Inc. (“NASDAQ”) exchange, which are valued at the NASDAQ official closing price. Unlisted securities or listed securities for which there were no sales during the day are valued at the closing bid price on such exchanges or over-the-counter markets. Investments for which market quotations are not readily available are valued at fair value as determined in good faith under consistently applied procedures approved by and under the general supervision of the Funds’ Board. Securities with maturities of sixty (60) days or less are valued at amortized cost as Level 1 or 2 within the hierarchy.
Investment Transactions — Investment security transactions are accounted for on trade date. Gains and losses on securities sold are determined on a specific identification basis.
Investment Income — Interest income is accrued and recorded on a daily basis including amortization of premiums, accretions of discounts and income earned from money market funds. Interest is not accrued on securities that are in default. Dividend income is recorded on the exdividend date. Withholding taxes on foreign dividends have been provided for in accordance with the Funds’ understanding of the applicable country’s tax rules and rates.
Fair Value Measurements — A three-tier hierarchy has been established to classify fair value measurements for disclosure purposes. Inputs refer broadly to the assumptions that market participants would use in pricing the asset or liability, including assumptions about risk. Inputs may be observable or unobservable. Observable inputs are inputs that reflect the assumptions market participants would use in pricing the asset or liability that are developed based on market data obtained from sources independent of the reporting entity. Unobservable inputs are inputs that reflect the reporting entity’s own assumptions about the assumptions market participants would use in pricing the asset or liability that are developed based on the best information available. In accordance with the authoritative guidance on fair value measurements and disclosure under GAAP, the Funds disclose fair value of their investments in a hierarchy that prioritizes the inputs to valuation techniques used to measure the fair value.
Cash — Each Fund considers its investment in a FDIC insured interest bearing savings account to be cash. Each Fund maintains cash balances, which, at times may exceed federally insured limits. Each Fund maintains these balances with a high quality financial institution.
| 18 | 1-855-612-3936 | www.cortinafunds.com |
| | Notes to Financial Statements |
| December 31, 2018 (Unaudited) |
Various inputs are used in determining the value of each Fund’s investments as of the reporting period end. The designated input levels are not necessarily an indication of the risk or liquidity associated with these investments. These inputs are categorized in the following hierarchy under applicable financial accounting standards:
| Level 1 — | Unadjusted quoted prices in active markets for identical, unrestricted assets or liabilities that the Funds have the ability to access at the measurement date; |
| Level 2 — | Quoted prices which are not active, quoted prices for similar assets or liabilities in active markets or inputs other than quoted prices that are observable (either directly or indirectly) for substantially the full term of the asset or liability; and |
| Level 3 — | Significant unobservable prices or inputs (including a Fund’s own assumptions in determining the fair value of investments) where there is little or no market activity for the asset or liability at the measurement date. |
The availability of observable inputs can vary from security to security and is affected by a wide variety of factors, including, for example, the type of security, whether the security is new and not yet established in the marketplace, the liquidity of markets, and other characteristics particular to the security. To the extent that valuation is based on models or inputs that are less observable or unobservable in the market, the determination of fair value requires more judgment. Accordingly, the degree of judgment exercised in determining fair value is greatest for instruments categorized in Level 3.
An investment level within the fair value hierarchy is based on the lowest level input, individually or in the aggregate, that is significant to fair value measurement. The valuation techniques used by the Funds to measure fair value during the six months ended December 31, 2018 maximized the use of observable inputs and minimized the use of unobservable inputs.
The inputs or methodology used for valuing securities are not necessarily an indication of the risk or liquidity associated with investing in those securities. The following is a summary of the inputs used in valuing the Funds’ investments as of December 31, 2018:
Cortina Small Cap Growth Fund
| | | | Valuation Inputs | | | | | |
| Investments in Securities at Value | | | Level 1 | | | | Level 2 | | | | Level 3 | | | | Total | |
| Common Stocks* | | $ | 21,059,846 | | | $ | – | | | $ | – | | | $ | 21,059,846 | |
| Total | | $ | 21,059,846 | | | $ | – | | | $ | – | | | $ | 21,059,846 | |
Cortina Small Cap Value Fund
| | | | Valuation Inputs | | | | | |
| Investments in Securities at Value | | | Level 1 | | | | Level 2 | | | | Level 3 | | | | Total | |
| Common Stocks* | | $ | 19,570,099 | | | $ | – | | | $ | – | | | $ | 19,570,099 | |
| Total | | $ | 19,570,099 | | | $ | – | | | $ | – | | | $ | 19,570,099 | |
| * | See Schedule of Investments for sector classification. |
For the six months ended December 31, 2018, the Funds did not have investments with significant unobservable inputs (Level 3) used in determining fair value.
Affiliated Companies — An affiliated company is a company that can have direct or indirect common ownership. The Funds did not hold any investments in affiliated companies as of and during the six months ended December 31, 2018.
Expenses — The Funds bear expenses incurred specifically on each Fund’s respective behalf as well as a portion of general Corporation expenses, which may be allocated on the basis of relative net assets or the nature of the services performed relative to applicability to each Fund.
Expenses that are specific to a class of shares of the Funds are charged directly to the share class. The Funds’ realized and unrealized gains and losses, net investment income, and expenses other than class specific expenses, are allocated daily to each class in proportion to its average daily net assets.
Distributions to Shareholders — Dividends from net investment income and distributions of net realized capital gains, if any, will be declared and paid at least annually. Income and capital gains distributions are determined in accordance with income tax regulations, which may differ from GAAP. Distributions to shareholders are recorded on the ex-dividend date.
| Semi-Annual Report | December 31, 2018 | 19 |
| | Notes to Financial Statements |
| December 31, 2018 (Unaudited) |
Fees on Redemptions — The Funds will deduct a 2.00% redemption proceeds fee on Fund shares held 60 days or less. The redemption fee is not a fee to finance sales or sales promotion expenses, but is paid to the Funds to defray the costs of liquidating an investor and discouraging short-term trading of the Funds’ shares. No redemption fee will be imposed on redemptions initiated by the Funds.
Federal Income Taxes — As of and during the six months ended December 31, 2018, the Funds did not have a liability for any unrecognized tax benefits. The Funds file U.S. federal, state, and local tax returns as required. The Funds’ tax returns are subject to examination by the relevant tax authorities until expiration of the applicable statute of limitations which is generally three years after the filing of the tax return for federal purposes and four years for most state returns. Tax returns for open years have incorporated no uncertain tax positions that require a provision for income taxes. The Funds intend to distribute to shareholders all taxable investment income and realized gains, and otherwise comply with Subchapter M of the Internal Revenue Code of 1986, as amended, applicable to regulated investment companies.
3. ADVISORY FEES, FUND ACCOUNTING FEES, ADMINISTRATION FEES, AND OTHER AGREEMENTS
Investment Adviser
Cortina Asset Management, LLC, is the Funds’ investment adviser (the “Adviser”). The Adviser is subject to the general supervision of the Board and is responsible for the overall management of the Funds’ business affairs. The Adviser invests the assets of the Funds based on the Funds’ investment objectives and policies. The Adviser is entitled to an investment advisory fee, computed daily and payable monthly, of 1.00% of the average daily net assets for each Fund.
The Adviser has contractually agreed to waive fees with respect to each of the Funds so that the net annual operating expenses (excluding taxes, leverage, interest, brokerage commissions, dividends or interest expenses on short positions, acquired fund fees and expenses, and extraordinary expenses) of the Funds’ shares will not exceed 1.10% and 1.35% of average daily net assets of each Fund’s Institutional and with respect to the Cortina Small Cap Value Fund Investor Class shares, respectively, through October 31, 2019. The Adviser may request a reimbursement from the Funds to recapture any reduced management fees or reimbursed Fund expenses within three years following the fee reduction or expense reimbursement, but only to the extent the Funds’ total annual fund operating expenses including any requested reimbursement amount, are less than the above limit at the time of the request. Any such reimbursement is subject to review by the Board.
As of December 31, 2018, reimbursements that may potentially be made by the Funds to the Adviser total $557,884 for the Cortina Small Cap Growth Fund and $819,347 for the Cortina Small Cap Value Fund and expire as follows:
| Cortina Small Cap Growth Fund | | |
| June 30, 2019 | | $ | 166,642 | |
| June 30, 2020 | | | 197,268 | |
| June 30, 2021 | | | 193,974 | |
| | | $ | 557,884 | |
| Cortina Small Cap Value Fund | | |
| June 30, 2019 | | $ | 250,624 | |
| June 30, 2020 | | | 288,061 | |
| June 30, 2021 | | | 280,662 | |
| | | $ | 819,347 | |
Fund Accounting Fees and Expenses
ALPS Fund Services, Inc. (“ALPS” or the “Administrator”) provides administrative, fund accounting and other services to the Funds for a monthly administration fee based on the Funds’ average daily net assets under the Administration, Bookkeeping and Pricing Services Agreement (the “Administration Agreement”).
The Administrator is also reimbursed by the Funds for certain out-of-pocket expenses.
Transfer Agent
ALPS serves as transfer, dividend paying and shareholder servicing agent for the Funds (the “Transfer Agent”).
Compliance Services
ALPS provides services that assist the Corporation’s Chief Compliance Officer in monitoring and testing the policies and procedures of the Corporation in conjunction with requirements under Rule 38a-1 under the 1940 Act. ALPS is compensated under the Administration Agreement.
| 20 | 1-855-612-3936 | www.cortinafunds.com |
| | Notes to Financial Statements |
| December 31, 2018 (Unaudited) |
Distributor
The Funds have entered into a Distribution Agreement with ALPS Distributors, Inc. (the “Distributor”) to provide distribution services to the Funds. The Distributor serves as underwriter/distributor of shares of the Funds.
Distribution and Services Plan
The Small Cap Value Fund has adopted a Distribution and Services Plan in accordance with Rule 12b-1 (“Distribution Plan”) under the 1940 Act. The Distribution Plan provides that the Cortina Small Cap Value Fund may compensate or reimburse the Distributor for services rendered and expenses borne in connection with activities primarily intended to result in the sale of the Cortina Small Cap Value Fund’s shares. Sales charges may be paid to broker-dealers, banks and any other financial intermediary eligible to receive such fees for sales of Investor Shares of the Cortina Small Cap Value Fund and for services provided to shareholders.
The Cortina Small Cap Value Fund charges 12b-1 fees for Investor Shares. Pursuant to the Distribution Plan, the Cortina Small Cap Value Fund may annually pay the Distributor up to 0.25% of the average daily net assets of the Cortina Small Cap Value Fund’s Investor Shares. The expenses of the Distribution Plan are reflected in the Statements of Operations.
Certain Directors and Officers of the Funds are also officers of the Adviser.
4. PURCHASES AND SALES OF INVESTMENT SECURITIES
The aggregate cost of purchases and proceeds from sales of investment securities, excluding short-term securities, are shown below for the six months ended December 31, 2018.
| Fund Name | | Purchases | | Sales |
| Cortina Small Cap Growth Fund | | $ | 13,313,309 | | | $ | 20,098,371 | |
| Cortina Small Cap Value Fund | | | 9,042,403 | | | | 14,166,350 | |
There were no purchases or sales of long-term U.S. Government Obligations for either Fund during the six months ended December 31, 2018.
5. TAX BASIS INFORMATION
Income and long-term capital gain distributions are determined in accordance with Federal income tax regulations, which differ from GAAP, and, therefore, may differ significantly in amount or character from net investment income and realized gains for financial reporting purposes.
As of December 31, 2018, the aggregate cost of investments, gross unrealized appreciation/(depreciation) and net unrealized appreciation/(depreciation) for Federal tax purposes was as follows:
| Fund | | Cost of
Investments for
Income Tax
Purposes | | Gross
Appreciation
(excess of value
over tax cost) | | Gross Depreciation
(excess of tax cost over value) | | Net Unrealized
Appreciation/ (Depreciation) |
| Cortina Small Cap Growth Fund | | $ | 19,550,627 | | | $ | 3,893,707 | | | $ | (2,384,488 | ) | | $ | 1,509,219 | |
| Cortina Small Cap Value Fund | | | 19,509,835 | | | | 1,913,827 | | | | (1,853,563 | ) | | | 60,264 | |
The difference between book basis and tax basis net unrealized appreciation is attributable to the deferral of losses from wash sales.
6. COMMITMENTS AND CONTINGENCIES
Under the Corporation’s organizational documents, its Officers and Directors are indemnified against certain liabilities arising out of the performance of their duties to the Funds. In addition, in the normal course of business, the Corporation entered into contracts with its service providers, on behalf of the Funds, and others that provide for general indemnifications. The Funds’ maximum exposure under these arrangements is unknown, as this would involve future claims that may be made against the Funds. The Funds expect risk of loss to be remote.
7. SEC REGULATIONS
On October 4, 2018, the SEC amended Regulation S-X to require certain financial statement disclosure requirements to conform them to US Generally Accepted Accounting Principles for investment companies. Effective November 4, 2018, the Fund adopted disclosure requirement changes for Regulation S-X and these changes are reflected throughout this report. The Funds’ adoption of those amendments, effective with the financial statements prepared as of December 31, 2018, had no effect on the Funds’ net assets or results of operations.
| Semi-Annual Report |December 31, 2018 | 21 |
| Notes to Financial Statements |
| December 31, 2018 (Unaudited) |
8. RECENT ACCOUNTING PRONOUNCEMENT
In August 2018, the FASB issued ASU 2018-13, which changes the fair value measurement disclosure requirements of FASB ASC Topic 820, Fair Value Measurement. The update to Topic 820 includes new, eliminated, and modified disclosure requirements. ASU 2018-13 is effective for fiscal years beginning after December 15, 2019, including interim periods. Early adoption is permitted for any eliminated or modified disclosures. The Funds’ adoption of those amendments, effective with the financial statements prepared as of December 31, 2018, had no effect on the Funds’ net assets or results of operations.
9. SUBSEQUENT EVENTS
On February 5, 2019, the Board approved Plans of Liquidation for the Cortina Small Cap Growth Fund and the Cortina Small Cap Value Fund, upon the recommendation of the Adviser to liquidate the Funds. After considering a variety of factors, the Board concluded that it was in the best interests of each Fund and its shareholders that the Funds be closed to new investments effective at the close of business on February 5, 2019 and liquidated effective as of the close of business on March 22, 2019.
| 22 | 1-855-612-3936 | www.cortinafunds.com |
| | Additional Information |
December 31, 2018 (Unaudited)
1. PROXY VOTING POLICIES AND VOTING RECORD
A description of the policies and procedures that the Funds use to vote proxies relating to portfolio securities is available without charge upon request by calling toll-free 1-855-612-3936, or on the Securities and Exchange Commission’s (“SEC”) website at http://www.sec.gov. Information regarding how the Funds voted proxies relating to portfolio securities during the most recent fiscal year end June 30, 2018 is available without charge upon request by calling toll-free 1-855-612-3936, or on the SEC’s website at http://www.sec.gov.
2. QUARTERLY PORTFOLIO HOLDINGS
The Corporation files a complete listing of portfolio holdings for the Funds with the SEC as of the first and third quarters of each fiscal year on Form N-Q. The filings are available upon request by calling 1-855-612-3936. Furthermore, you may obtain a copy of the filing on the SEC’s website at http://www.sec.gov. The Funds’ Forms N-Q may also be reviewed and copied at the SEC’s Public Reference Room in Washington, D.C., and information on the operation of the Public Reference Room may be obtained by calling 1-800-SEC-0330.
| Semi-Annual Report |December 31, 2018 | 23 |

Material must be accompanied or preceded by the prospectus.
The Cortina Funds are distributed by ALPS Distributors, Inc.
Item 2. Code of Ethics.
Not applicable to this report.
Item 3. Audit Committee Financial Expert.
Not applicable to this report.
Item 4. Principal Accountant Fees and Services.
Not applicable to this report.
Item 5. Audit Committee of Listed Registrants.
Not applicable to registrant.
Item 6. Investments.
| (a) | The schedule of investments is included as part of the Reports to Stockholders filed under Item 1 of this report. |
| (b) | Not applicable to the registrant. |
Item 7. Disclosure of Proxy Voting Policies and Procedures for Closed-End Management Investment Companies.
Not applicable to registrant.
Item 8. Portfolio Managers of Closed-End Management Investment Companies.
Not applicable to registrant.
Item 9. Purchases of Equity Securities by Closed-End Management Investment Company and Affiliated Purchasers.
Not applicable to registrant.
Item 10. Submission of Matters to Vote of Security Holders.
Not applicable.
Item 11. Controls and Procedures.
| (a) | The registrant’s principal executive officer and principal financial officer have concluded that the registrant’s disclosure controls and procedures (as defined in Rule 30a-3(c) under the Investment Company Act of 1940, as amended) are effective based on their evaluation of these controls and procedures as of a date within 90 days of the filing date of this report. |
| (b) | There was no change in the registrant’s internal control over financial reporting (as defined in Rule 30a-3(d) under the Investment Company Act of 1940, as amended) during the second fiscal quarter of the period covered by this report that has materially affected, or is reasonably likely to materially affect, the registrant’s internal control over financial reporting. |
Item 12. Disclosure of Securities Lending Activities for Closed-End Management Investment Companies.
Not applicable.
Item 13. Exhibits.
| (a)(1) | Not applicable to this report. |
| (a)(2) | The certifications required by Rule 30a-2(a) of the Investment Company Act of 1940, as amended, and Section 302 of the Sarbanes-Oxley Act of 2002 are attached hereto as Ex.99.Cert. |
| (b) | A certification of the registrant's principal executive officer and principal financial officer, as required by Rule 30a-2(b) under the Investment Company Act of 1940, as amended, is attached as Ex.99.906.Cert. |
SIGNATURES
Pursuant to the requirements of the Securities Exchange Act of 1934 and the Investment Company Act of 1940, the registrant has duly caused this report to be signed on its behalf by the undersigned, thereunto duly authorized.
| | Cortina Funds, Inc. | |
| | | | |
| | By: | /s/ Jennifer Hanson | |
| | | Jennifer Hanson, President | |
| | | (Principal Executive Officer) | |
| | | | |
| | Date: | March 7, 2019 | |
Pursuant to the requirements of the Securities Exchange Act of 1934 and the Investment Company Act of 1940, this report has been signed below by the following persons on behalf of the registrant and in the capacities and on the dates indicated.
| | By: | /s/ Eric Conner | |
| | | Eric Conner, Treasurer and Principal Accounting Officer | |
| | | (Principal Financial Officer) | |
| | | | |
| | Date: | March 7, 2019 | |
4