UNITED STATES
SECURITIES AND EXCHANGE COMMISSION
Washington, D.C. 20549
FORM N-CSR
CERTIFIED SHAREHOLDER REPORT OF REGISTERED
MANAGEMENT INVESTMENT COMPANIES
Investment Company Act file number: 811-21580
CORTINA FUNDS, INC.
(Exact name of registrant as specified in charter)
825 N. Jefferson St., Suite 400, Milwaukee, WI 53202
(Address of principal executive offices) (Zip code)
(414) 225-7365
Registrant’s telephone number, including area code
Lori Hoch
825 N. Jefferson St., Suite 400
Milwaukee, WI 53202
(Name and address of agent for service)
Date of fiscal year end: June 30
Date of reporting period: July 1, 2017 - December 31, 2017
Item 1. Reports to Stockholders.
The following is a copy of the report to shareholders pursuant to Rule 30e-1 under the Investment Company Act of 1940 (17 CFR 270.30e-1).
TABLE OF CONTENTS
| Cortina Small Cap Growth Fund | |
| Shareholder Letter | 1 |
| Portfolio Information | 3 |
| Cortina Small Cap Value Fund | |
| Shareholder Letter | 4 |
| Portfolio Information | 6 |
| Disclosure of Fund Expenses | 7 |
| Schedule of Investments | |
| Cortina Small Cap Growth Fund | 8 |
| Cortina Small Cap Value Fund | 11 |
| Statements of Assets and Liabilities | 13 |
| Statements of Operations | 14 |
| Statements of Changes in Net Assets | 15 |
| Financial Highlights | |
| Cortina Small Cap Growth Fund | 16 |
| Cortina Small Cap Value Fund - Institutional | 17 |
| Cortina Small Cap Value Fund - Investor | 18 |
| Notes to Financial Statements | 19 |
| Additional Information | 24 |
 | Shareholder Letter |
| Cortina Small Cap Growth Fund | December 31, 2017 (Unaudited) |
DEAR FELLOW SHAREHOLDERS:
The first half of Fiscal 2018 was an eventful and prosperous six months for most equity investors. The eventful portion was dominated by politics (both domestic and global) and weather, while the prosperous portion was all about the continued steady climb of equities both large and small. For illustration, the S&P 500 returned 11.4% over the second half of calendar 2017 (i.e., the first half of the Fund’s Fiscal 2018 period) and did so without a single pullback of 5% or more. As teased in our July letter to shareholders, this made 2017 just the second calendar year of the past thirty that didn’t include a pullback of at least 5% at some point in the year. Small caps, defined here as the Russell 2000 Index, have now gone 700 days without a 10% correction which is also a rarity.
The rise has been driven in part by synchronized economic growth throughout the world. In yet another rarity, each of the ten largest economies in the world posted positive Gross Domestic Product (“GDP”) growth in the third quarter. This has led to generally strong earnings results and in turn rising stock prices. In addition, the current portion of the rally has been characterized in large part by momentum and a preference for higher market cap stocks. Whether its FAANG stocks within the large caps, or biotechnology stocks within the small caps, as a general rule strong performing stocks continued to perform well. This is in part driven by passive investing in general and Exchange-Traded Funds (“ETFs”) more specifically. As passive money flows into market cap weighted index funds and sector and industry ETFs the lion’s share of the dollars are invested in the larger holdings, thus feeding the momentum. This has been a relative performance headwind for our fund that prefers to be early to yet undiscovered companies, often with smaller market caps than the benchmark average.
Turning back to the eventful portion of the past six months, politics have dominated the headlines. We’ll focus our discussion on the policy side of things, though policy has certainly only occupied a portion of the political headlines. From a policy perspective, the White House officially pivoted away from healthcare reform in favor of tax reform in mid-August. Despite the seemingly universal disdain for Obamacare amongst House and Senate Republicans, when it came time to count the votes they simply couldn’t agree on what exactly it was they didn’t like and what the right model was. Tax reform, on the other hand, proved to be a less difficult though far from easy topic upon which to find common ground. The bill was officially signed into law on December 22nd, fueling further gains in equity markets.
Focusing more specifically on our portfolio, our return over the first half of the fiscal year was 3.56%. A nicely positive six month return but one that meaningfully lagged the 11.1% return of the Russell 2000 Growth Index. Approximately 5% of the 7% performance discrepancy can be attributed to the Health Care sector. There were several factors at play here. In the September quarter, hospital same-store revenue was negative for the first time in the 2000’s. Secularly, this is being driven at least in part by increased penetration of high deductible health plans and that trend is not likely to slow down any time soon. More acutely, Hurricanes Harvey and Irma (the weather portion of the eventful period) temporarily knocked out two of the largest health care markets in the country (Houston and Florida). Tactical investors fled to managed care stocks that benefit from lower utilization and clinical stage biotechnology stocks that are little impacted by facility traffic. Many of our healthcare holdings are tied to procedure volumes and therefore reported disappointing results, pointing at least a portion of the finger towards the hurricanes. In the small and microcap world disappointing results, often times without regard for the reason, are extrapolated and the stocks get punished. We used weakness as an opportunity to add to holdings and initiate new holdings in companies where we felt results were appropriately attributable to transient weather-related weakness. In others where we felt the weather was a convenient excuse for company-specific issues, we exited our positions.
Outside of Healthcare, the Industrials sector was the second largest contributor to underperformance. On the whole our Industrial holdings performed solidly, returning just under 10% on average, though they were dragged down by the poor performance of an airline holding as industry price competition intensified. We were also underweight the sector, which was the best performing sector in the index returning more than 17%. We also gave up modest ground in the Consumer Discretionary, Consumer Staples and Technology sectors. The Technology sector has been a strongly positive contributor for us over the years however returns stalled for the sector within both the benchmark and our portfolio during the first half of the fiscal year. It was the second worst performing sector in the benchmark and our largest overweight. Partially offsetting these areas, we experienced positive security selection within the Telecommunication Services, Financials and Energy sectors.
OUTLOOK & PORTFOLIO POSITIONING
Our positioning entering 2018 is not too dissimilar from prior quarters or years. We continue to profile smaller than the benchmark (and most of our peers) from a market cap perspective. The projected revenue and earnings growth rates of our holdings are well in excess of those of the benchmark. Our holdings have less leverage than the overall benchmark as measured by debt to equity ratios. This list goes on and is very consistent with both our investment philosophy and the long history of our strategy. Looking at sectors, we enter the year overweight the Technology, Energy and Telecom Services sectors in that order and underweight the remaining sectors with our most prominent underweights being the Consumer Discretionary, Real Estate, Consumer Staples and Materials sectors. This is more a function of our individual holdings than it is a top down view, though we are comfortable with where the relative weights reside.
Delving deeper into individual sectors, we’ll begin with the Energy sector as that was a particular pain point for the totality of calendar 2017. We remain convicted in our view that the oil market is tight and should further tighten as the year progresses. Continued synchronized global economic growth has the potential to make markets even tighter than we’d like. We also remain convicted that technological advancements and improved efficiencies have made domestic shale energy a cost competitive and necessary piece of global oil supply and that our holdings can earn attractive returns even at significantly lower oil prices. As for complacency, given the divergence in commodity prices and energy stock returns (oil prices have risen much more aggressively than stocks), we believe complacency in the energy markets could be the making of the proverbial coiled spring. While our convictions are high, our year-end overweight of roughly 250 basis points is a little less than half of what it was at this time last year reflecting our appreciation for the volatility of the sector as a whole and the directionally homogeneous returns of individual holdings.
| Semi-Annual Report | December 31, 2017 | 1 |
| Shareholder Letter |
| Cortina Small Cap Growth Fund | December 31, 2017 (Unaudited) |
The other large pain point in 2017 was the Health Care sector. We enter 2018 with a roughly neutral weighting relative to the benchmark. Here we are vigilant with regards to overall utilization and in particular utilization at high cost facilities, i.e. hospitals. While we remain unexposed to clinical stage biopharma companies, our overall health care portfolio is as diverse as we can recall with meaningful allocation to Equipment and Supplies, Providers and Services, Pharmaceuticals and commercial stage life sciences and diagnostics companies classified as Biotechnology. We are excited to introduce two new themes that are predominantly health care centric as we enter the New Year. The first, Self-Pay Medicine / Aesthetics draws on the aging population’s desire to maintain a youthful appearance through any means necessary. It is further influenced by our interactions with companies and physicians that have made it increasingly clear that doctors representing a variety of specialties are aggressively seeking new revenue sources in the wake of declining reimbursement rates from insurance companies and lower overall utilization trends. The other new theme, Combatting the Opioid Crisis, is just as it sounds. The Opioid Crisis has been designated a public health emergency that will require a wide variety of efforts to address, making it an ideal thematic candidate.
Finally, our largest overweight remains the Information Technology sector. Many of the underlying trends within the tech portion of our portfolio are the same: more bandwidth, IT security and the demand for more semiconductor chips which requires industry capacity expansion. One newer area is the increasing challenge businesses face in managing vast types of data, in a wide variety of applications used by disparate employees and other users. Here we are invested in a number of companies addressing various pain points.
Investing involves risks, including loss of principal.
FAANG – FAANG is an acronym for the five most popular tech stocks in the market, namely Facebook, Apple, Amazon, Netflix, and Alphabet's Google.
Basis Point – Basis Point refers to a common unit of measure for interest rates and other percentages in finance. One basis point is equal to 1/100th of 1%, or 0.01%, or 0.0001, and is used to denote the percentage change in a financial instrument.
| 2 | 1-855-612-3936 | www.cortinafunds.com |
| Portfolio Information |
| Cortina Small Cap Growth Fund | December 31, 2017 (Unaudited) |
Growth of $25,000 Investment (Unaudited)
For the period from September 30, 2011 (Inception) to December 31, 2017.
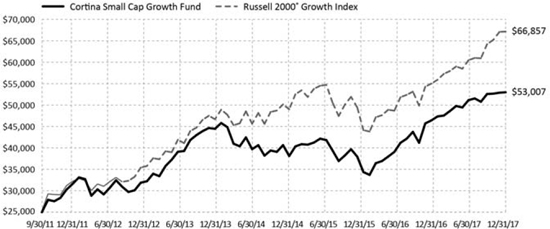
This graph assumes an initial $25,000 investment at September 30, 2011 (Inception Date). The Cortina Small Cap Growth Fund (the “Fund”) will deduct a 2.00% redemption proceeds fee on Fund shares held 60 days or less. This graph depicts the performance of the Fund versus the Russell 2000® Growth Index. It is important to note the Fund is a professionally managed mutual fund while the index is not available for investment and is unmanaged. The comparison is shown for illustrative purposes only.
This chart does not reflect the deduction of taxes that a shareholder would pay on Fund distributions or the redemption of Fund shares.
Performance Returns for the period ended December 31, 2017
| | 6 Months | 1 Year | 3 Years | 5 Years | Since Inception* | Gross Expense Ratio** |
| Cortina Small Cap Growth Fund | 3.56% | 14.12% | 9.23% | 11.96% | 12.77% | 1.76% |
| Russell 2000® Growth Index | 11.09% | 22.17% | 10.28% | 15.21% | 17.04% | |
| * | The Fund’s inception date is September 30, 2011. |
| ** | Cortina Asset Management, LLC (the “Adviser”) has contractually agreed to waive management fees and/or reimburse the Fund’s operating expenses in order to limit the Fund’s total annual fund operating expenses (excluding taxes, leverage, interest, brokerage commissions, dividends or interest expenses on short positions, acquired fund fees and expenses and extraordinary expenses) to 1.10% of average daily net assets of the Fund. The agreement will continue in effect at least through October 31, 2018, subject thereafter to annual re-approval of the agreement by the Fund's Board of Directors. The current expense ratio for the Fund can be located in the Financial Highlights contained within this shareholder report. |
Past performance does not guarantee future results. The performance data quoted represents past performance and current returns may be lower or higher. Total return figures include change in share price, reinvestment of dividends and capital gains. The investment return and principal value will fluctuate so that an investor's shares, when redeemed may be worth more or less than their original cost. To obtain performance information current to the most recent month end, call 1-855-612-3936.
Russell 2000® Growth Index measures the performance of the small-cap growth segment of the U.S. equity universe. It includes those Russell 2000 companies with higher price-to-value ratios and higher forecasted growth values. All indices are unmanaged. It is not possible to invest directly in an index.
S&P 500 – The S&P 500 Index is the Standard & Poor’s composite index of 500 stocks, a widely recognized, unmanaged index of common stock prices.
Sector Allocations***
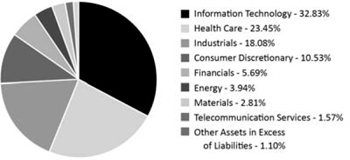
| *** | Percentages are based on Net Assets as of December 31, 2017. Holdings are subject to change. |
| Semi-Annual Report | December 31, 2017 | 3 |
| | Shareholder Letter |
| Cortina Small Cap Value Fund | December 31, 2017 (Unaudited) |
DEAR FELLOW SHAREHOLDERS:
For the year, the Cortina Small Cap Value Fund outperformed its benchmark, the Russell 2000 Value Index. On a larger map, while nearly every asset rose, the journey was all about large cap growth, overseas markets, plus Bitcoin and related developing currencies. Even commodities have begun to rebound as the global economy remains strong. We are pleased to have posted a return that exceeded the high single-digit return of the benchmark Russell 2000 Value and to have done so primarily through strong downside protection. Consumer Discretionary, Industrials, Health Care, and Technology were all positive offset by a slight Financials negative impact and the drag of our Energy exposure for much of the year that has more recently begun to redeem itself.
The second half of the year saw a large move up in the markets. Cyclicals overall did well, with Materials, Energy and Industrials all posting solid gains in the index, whereas the fund gained much of its outperformance from the Consumer and Technology sectors with strong stock selection along with a positive contribution from overall sector allocation.
The bias in the portfolio towards certain Consumer companies was intentional. As the economy has healed, we monitored the incremental improvement in wages coincident with the strong job market. This improvement gave us confidence to commit capital towards companies that benefit from that trend – yet we did not get sucked into the multi-year value-traps that much of the retail sector remains. Energy was the largest detractor from the annual performance. While we understand the reticence of investors to revisit the sector, the price of West Texas oil is up 40% from its summer lows and close to double its level of two years ago. We believe exposure to the sector is likely to be rewarding from here.
The end of the year played out much as we expected. The equity markets began the second half weakly but at the time we saw virtually nothing in the data to justify the market’s pessimism. It was our view that the markets and economy would remain strong thus our exposure to economically sensitive companies and industries was consistent. It was also our view that tax reform hopes were not priced in three months ago. Today tax reform is law and we believe is incorporated into the market’s general expectations. What we believe remains unincorporated into expectations, and still not part of the general public’s mood, is the strength of the economy. Economic reports of recent weeks and months are excellent and we expect will remain healthy for some time.
The Cortina Small Cap Value Fund began with the very simple premise that companies undergoing substantive change tend to be underappreciated by investors due to the anchoring of perception in the recent past. This is absolutely still true. There is no denying that the behavior of the market has changed with the expansion of computerized trading, but that is as it ever was. Just as Black-Scholes option pricing, spreadsheets, telephones, internet, day traders, $7.95 commissions, etc…have all upended previous orders, so too has abundant data. Quantitative and factor-investing are relatively new over the broad scope of history, but have been around for a while. What is different today is that they are available to everyone now, either to investors via retail and institutional offerings or to the buy-side via off-the-shelf products. What we believe is lost amongst the punditry calling for the end of humans is that nature abhors a high return. Certain high profile quantitative investors have attracted billions of dollars of investable capital due to high returns. And now it seems everyone is a quant. Billions are currently being spent on computers and programmers across Wall Street.
It was only three years ago that Michael Lewis published Flash Boys: A Wall Street Revolt about the billions spent on transmission speeds and how high frequency trading was stealing all the investing profits. The deeper lessons of economics rarely seem to be top of mind for those making grandiose forecasts. High returns are rarely sustainable and attract incremental capital which ultimately leads to diminishing returns on future investments. We expect the same result for quant- and factor-based investing over time. If everyone is adding capacity and ability, how likely is it that these similar strategies will continue to earn excess returns?
Kurt Vonnegut was one of the most famous and interesting writers of the twentieth century. Years ago he wrote that most stories have very similar structures, with a rise, a fall, and a rebound or some derivation of the same. “Somebody gets in trouble, gets out of it again. People love that story. They never get sick of it.”
The literary arc is duplicated in life, in countries, politics, business, and financial markets. Yet Wall Street, even in this advanced age, continues to adhere to the straight line assumption, which is just as well. Opportunity continues to present itself in the equities of companies improving for the better that have been cast aside by either the people or the computers.
Companies get in trouble, their stock prices decimated, and their fans desert them. Yet so long as the core remains intact, they often rebound and the patient and the adventurous earn the rewards. We believe the same applies to portfolio management. For the past two decades we have worked in this business of analyzing companies, studying markets, and creating and finding opportunities within the tumult. The industry has fundamentally changed in the last few years, but We Believe in Evolution is both an investment philosophy and a business practice. As we look into 2018, we will continue to execute on our mission of investing your capital in what we believe are the best risk-reward opportunities we can discover.
| 4 | 1-855-612-3936 | www.cortinafunds.com |
| Shareholder Letter |
| Cortina Small Cap Value Fund | December 31, 2017 (Unaudited) |
Investing involves risks, including loss of principal.
Black-Scholes – The Black-Scholes formula (also called Black-Scholes-Merton) was the first widely used model for option pricing. It's used to calculate the theoretical value of European-style options using current stock prices, expected dividends, the option's strike price, expected interest rates, time to expiration and expected volatility.
| Semi-Annual Report | December 31, 2017 | 5 |
| Portfolio Information |
| Cortina Small Cap Value Fund | December 31, 2017 (Unaudited) |
Growth of $25,000 Investment (Unaudited)
For the period from September 30, 2011 (Inception) to December 31, 2017.
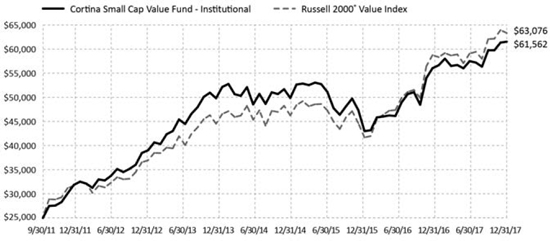
This graph assumes an initial $25,000 investment at September 30, 2011 (Inception Date). The Cortina Small Cap Value Fund Institutional share class (the “Fund”) will deduct a 2.00% redemption proceeds fee on Fund shares held 60 days or less. This graph depicts the performance of the Fund versus the Russell 2000® Value Index. It is important to note the Fund is a professionally managed mutual fund, while the index is not available for investment and is unmanaged. The comparison is shown for illustrative purposes only. Performance will vary from class to class based on differences in class-specific expenses.
This chart does not reflect the deduction of taxes that a shareholder would pay on Fund distributions or the redemption of Fund shares.
Performance Returns for the period ended December 31, 2017
| | 6 Months | 1 Year | 3 Years* | 5 Years* | Since Inception* | Gross Expense Ratio** |
| Cortina Small Cap Value Fund - Institutional | 7.02% | 9.79% | 5.99% | 11.31% | 15.50% | 1.72% |
| Cortina Small Cap Value Fund - Investor | 6.86% | 9.54% | 5.73% | 11.03% | 15.22% | 1.97% |
| Russell 2000® Value Index | 7.26% | 7.84% | 9.55% | 13.01% | 15.95%*** | |
| * | The Fund’s Institutional shares inception date is September 30, 2011, Investor shares inception date is April 30, 2014. The performance shown for Investor shares for periods pre-dating the commencement of operations of that class reflects the performance of the Fund’s Institutional shares, the initial share class, calculated using the fees and expenses of Investor shares. If Investor shares of the Fund had been available during periods prior to April 30, 2014, the performance shown may have been different. |
| ** | Cortina Asset Management, LLC (the ”Adviser”) has contractually agreed to waive management fees and/or reimburse the Fund’s operating expenses in order to limit the Fund’s total annual fund operating expenses (excluding taxes, leverage, interest, brokerage commissions, dividends or interest expenses on short positions, acquired fund fees and expenses, and extraordinary expenses) to 1.10% and 1.35% of average daily net assets of the Fund’s Institutional and Investor Class shares, respectively. The agreement will continue in effect at least through October 31, 2018, subject thereafter to annual re-approval of the agreement by the Fund’s Board of Directors. The current expense ratio for the Fund can be located in the Financial Highlights contained within this shareholder report. |
| *** | Represents the period from September 30, 2011 (date of original public offering of the Institutional shares) through December 31, 2017. |
Past performance does not guarantee future results. The performance data quoted represents past performance and current returns may be lower or higher. Total return figures include change in share price, reinvestment of dividends and capital gains. The investment return and principal value will fluctuate so that an investor's shares, when redeemed may be worth more or less than their original cost. To obtain performance information current to the most recent month end, call 1-855-612-3936.
Russell 2000® Value Index measures the performance of those Russell 2000 companies with lower price-to-book ratios and lower forecasted growth values. All indices are unmanaged. It is not possible to invest directly in an index.
S&P 500 – The S&P 500 Index is the Standard & Poor’s composite index of 500 stocks, a widely recognized, unmanaged index of common stock prices.
Sector Allocations****
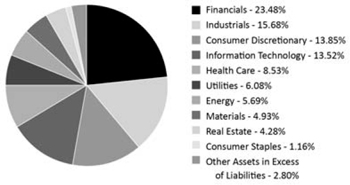
| **** | Percentages are based on Net Assets as of December 31, 2017. Holdings are subject to change. |
| 6 | 1-855-612-3936 | www.cortinafunds.com |
| | Disclosure of Fund Expenses |
| | December 31, 2017 (Unaudited) |
As a shareholder of the Fund(s), you incur ongoing costs, including management fees and other Fund expenses. This example is intended to help you understand your ongoing costs (in dollars) of investing in each Fund and to compare these costs with the ongoing costs of investing in other mutual funds. The example is based on an investment of $1,000 invested at the beginning of the period and held for the entire period, as indicated below.
Actual Expenses – The first line of the table below provides information about the actual account values and actual expenses. You may use the information in this line, together with the amount you invested, to estimate the expenses that you paid over the period. Simply divide your account value by $1,000 (for example, an $8,600 account value divided by $1,000 = 8.6) then multiply the result by the number in the first line under the heading entitled “Expenses Paid During Period” to estimate the expenses you paid on your account during this period.
Hypothetical Example for Comparison Purposes – The second line of the table below provides information about hypothetical account values and hypothetical expenses based on each Fund’s actual expense ratio and an assumed annual rate of return of 5% before expenses, which is not each Fund’s actual return. The hypothetical account values and expenses may not be used to estimate the actual ending account balance or expenses you paid for the period. You may use this information to compare the ongoing costs of investing in each Fund and other funds by comparing these 5% hypothetical examples with the 5% hypothetical examples that appear in the shareholder reports of other funds.
Please note that the expenses shown in the table are meant to highlight your ongoing costs only and do not reflect any direct costs, such as wire fees or low balance fees. Therefore, the second line of the table is useful in comparing ongoing costs and will not help you determine the relative total costs of owning different funds. In addition, if these direct costs were included, your costs would be higher.
| | Beginning Account Value July 1, 2017 | Ending Account Value December 31, 2017 | Expenses Paid During Period(a) | Net Expense Ratios(b) |
| Cortina Small Cap Growth Fund - Institutional | | | | |
| Actual Fund Return | $1,000.00 | $1,035.10 | $5.64 | 1.10% |
| Hypothetical Fund Return (assuming a 5% return before expenses) | $1,000.00 | $1,019.66 | $5.60 | 1.10% |
| Cortina Small Cap Value Fund - Institutional | | | | |
| Actual Fund Return | $1,000.00 | $1,070.20 | $5.74 | 1.10% |
| Hypothetical Fund Return (assuming a 5% return before expenses) | $1,000.00 | $1,019.66 | $5.60 | 1.10% |
| Cortina Small Cap Value Fund - Investor | | | | |
| Actual Fund Return | $1,000.00 | $1,068.00 | $7.04 | 1.35% |
| Hypothetical Fund Return (assuming a 5% return before expenses) | $1,000.00 | $1,018.40 | $6.87 | 1.35% |
| (a) | Expenses are equal to the Fund’s annualized expense ratio multiplied by the average account value over the period, multiplied by the number of days in the most recent fiscal half year (184), divided by 365. |
| (b) | Annualized, based on the Fund's most recent half-year expenses. |
| Semi-Annual Report | December 31, 2017 | 7 |
| Schedule of Investments |
| Cortina Small Cap Growth Fund | December 31, 2017 (Unaudited) |
| | Shares | | Value | |
| COMMON STOCKS (98.90%) | | | | | | |
| Consumer Discretionary (10.53%) | | | | | | |
| Cavco Industries, Inc.(a) | | 1,078 | | $ | 164,503 | |
| Chegg, Inc.(a) | | 14,124 | | | 230,504 | |
| Chuy's Holdings, Inc.(a) | | 7,128 | | | 199,940 | |
| Cooper-Standard Holding, Inc.(a) | | 2,118 | | | 259,455 | |
| Five Below, Inc.(a) | | 4,321 | | | 286,569 | |
| IMAX Corp.(a) | | 12,072 | | | 279,467 | |
| MarineMax, Inc.(a) | | 12,392 | | | 234,209 | |
| Ollie's Bargain Outlet Holdings, Inc.(a) | | 8,336 | | | 443,892 | |
| Red Robin Gourmet Burgers, Inc.(a) | | 2,387 | | | 134,627 | |
| Universal Electronics, Inc.(a) | | 4,974 | | | 235,021 | |
| Wingstop, Inc. | | 8,422 | | | 328,289 | |
| | | | | | 2,796,476 | |
| Energy (3.94%) | | | | | | |
| Abraxas Petroleum Corp.(a) | | 73,501 | | | 180,812 | |
| Mammoth Energy Services, Inc.(a) | | 12,485 | | | 245,080 | |
| Matador Resources Co.(a) | | 6,490 | | | 202,034 | |
| Ring Energy, Inc.(a) | | 14,700 | | | 204,330 | |
| SRC Energy, Inc.(a) | | 25,024 | | | 213,455 | |
| | | | | | 1,045,711 | |
| Financials (5.69%) | | | | | | |
| Financial Engines, Inc. | | 8,167 | | | 247,460 | |
| Green Dot Corp., Class A(a) | | 5,063 | | | 305,096 | |
| Independent Bank Group, Inc. | | 4,698 | | | 317,585 | |
| LendingTree, Inc.(a) | | 769 | | | 261,806 | |
| Pinnacle Financial Partners, Inc. | | 3,542 | | | 234,835 | |
| Sterling Bancorp Inc.(a) | | 11,480 | | | 145,796 | |
| | | | | | 1,512,578 | |
| Health Care (23.45%) | | | | | | |
| ANI Pharmaceuticals, Inc.(a) | | 3,503 | | | 225,768 | |
| AtriCure, Inc.(a) | | 15,470 | | | 282,173 | |
| AxoGen, Inc.(a) | | 12,268 | | | 347,184 | |
| BioTelemetry, Inc.(a) | | 12,683 | | | 379,222 | |
| Bovie Medical Corp.(a) | | 26,292 | | | 68,359 | |
| Cardiovascular Systems, Inc.(a) | | 9,960 | | | 235,952 | |
| Collegium Pharmaceutical Inc(a) | | 10,985 | | | 202,783 | |
| Cross Country Healthcare, Inc.(a) | | 15,801 | | | 201,621 | |
| Cutera, Inc.(a) | | 3,910 | | | 177,318 | |
| Diplomat Pharmacy, Inc.(a) | | 17,773 | | | 356,704 | |
| Evolent Health, Inc., Class A(a) | | 15,015 | | | 184,685 | |
| HealthEquity, Inc.(a) | | 4,038 | | | 188,413 | |
| K2M Group Holdings, Inc.(a) | | 20,477 | | | 368,586 | |
| Ligand Pharmaceuticals, Inc.(a) | | 1,304 | | | 178,557 | |
| Neogen Corp.(a) | | 3,122 | | | 256,660 | |
| NeoGenomics, Inc.(a) | | 25,220 | | | 223,449 | |
| Neos Therapeutics, Inc.(a) | | 26,021 | | | 265,414 | |
| Novocure, Ltd.(a) | | 16,750 | | | 338,350 | |
| OrthoPediatrics Corp.(a) | | 4,788 | | | 91,882 | |
| Oxford Immunotec Global PLC(a) | | 24,340 | | | 340,030 | |
| Pacira Pharmaceuticals, Inc.(a) | | 4,435 | | | 202,458 | |
| Repligen Corp.(a) | | 3,376 | | | 122,481 | |
| STAAR Surgical Co.(a) | | 16,713 | | | 259,052 | |
| Supernus Pharmaceuticals, Inc.(a) | | 6,039 | | | 240,654 | |
| Tactile Systems Technology, Inc.(a) | | 9,537 | | | 276,382 | |
See Notes to Financial Statements.
| 8 | 1-855-612-3936 | www.cortinafunds.com |
| Schedule of Investments |
| Cortina Small Cap Growth Fund | December 31, 2017 (Unaudited) |
| | Shares | | Value | |
| COMMON STOCKS (continued) | | | | | | |
| Health Care (continued) | | | | | | |
| Vanda Pharmaceuticals, Inc.(a) | | 14,037 | | $ | 213,362 | |
| | | | | | 6,227,499 | |
| Industrials (18.08%) | | | | | | |
| Air Transport Services Group, Inc.(a) | | 9,860 | | | 228,160 | |
| Albany International Corp., Class A | | 3,686 | | | 226,505 | |
| Astec Industries, Inc. | | 3,655 | | | 213,817 | |
| Atlas Air Worldwide Holdings, Inc.(a) | | 5,545 | | | 325,214 | |
| Axon Enterprise, Inc.(a) | | 12,924 | | | 342,486 | |
| Barnes Group, Inc. | | 3,826 | | | 242,071 | |
| BMC Stock Holdings, Inc.(a) | | 14,149 | | | 357,970 | |
| Commercial Vehicle Group, Inc.(a) | | 21,400 | | | 228,766 | |
| Daseke, Inc.(a) | | 13,713 | | | 195,959 | |
| Dycom Industries, Inc.(a) | | 2,727 | | | 303,870 | |
| Granite Construction, Inc. | | 5,114 | | | 324,381 | |
| Kforce, Inc. | | 4,442 | | | 112,161 | |
| Kratos Defense & Security Solutions, Inc.(a) | | 27,288 | | | 288,980 | |
| Manitex International, Inc.(a) | | 29,110 | | | 279,456 | |
| Saia, Inc.(a) | | 4,176 | | | 295,452 | |
| Spartan Motors, Inc. | | 13,766 | | | 216,815 | |
| Spirit Airlines, Inc.(a) | | 3,005 | | | 134,774 | |
| Titan International, Inc. | | 19,322 | | | 248,867 | |
| Westport Fuel Systems, Inc.(a) | | 62,354 | | | 234,451 | |
| | | | | | 4,800,155 | |
| Information Technology (32.83%)(b) | | | | | | |
| 2U, Inc.(a) | | 2,939 | | | 189,595 | |
| Amber Road, Inc.(a) | | 31,418 | | | 230,608 | |
| Blackhawk Network Holdings, Inc.(a) | | 8,914 | | | 317,784 | |
| Bottomline Technologies de, Inc.(a) | | 5,669 | | | 196,601 | |
| Box, Inc., Class A(a) | | 15,624 | | | 329,979 | |
| ChannelAdvisor Corp.(a) | | 22,856 | | | 205,704 | |
| Cloudera, Inc.(a) | | 17,942 | | | 296,402 | |
| Coherent, Inc.(a) | | 679 | | | 191,627 | |
| CommVault Systems, Inc.(a) | | 6,006 | | | 315,315 | |
| Cray, Inc.(a) | | 15,369 | | | 371,930 | |
| EMCORE Corp.(a) | | 17,107 | | | 110,340 | |
| Five9, Inc.(a) | | 8,295 | | | 206,380 | |
| FormFactor, Inc.(a) | | 19,241 | | | 301,122 | |
| Hortonworks, Inc.(a) | | 20,083 | | | 403,869 | |
| Infinera Corp.(a) | | 30,506 | | | 193,103 | |
| Inphi Corp.(a) | | 7,520 | | | 275,232 | |
| Internap Corp.(a) | | 12,325 | | | 193,626 | |
| Limelight Networks, Inc.(a) | | 95,972 | | | 423,237 | |
| LivePerson, Inc.(a) | | 25,550 | | | 293,825 | |
| MaxLinear, Inc., Class A(a) | | 12,841 | | | 339,259 | |
| Mellanox Technologies, Ltd.(a) | | 5,019 | | | 324,729 | |
| Mimecast, Ltd.(a) | | 7,391 | | | 211,900 | |
| Nanometrics, Inc.(a) | | 8,469 | | | 211,047 | |
| Photronics, Inc.(a) | | 17,219 | | | 146,792 | |
| Quantenna Communications, Inc.(a) | | 23,877 | | | 291,299 | |
| Rapid7, Inc.(a) | | 20,608 | | | 384,545 | |
| RingCentral, Inc., Class A(a) | | 4,987 | | | 241,371 | |
| Sailpoint Technologies Holding(a) | | 14,410 | | | 208,945 | |
| Silicon Motion Technology Corp., ADR | | 5,457 | | | 289,003 | |
| Truecar, Inc.(a) | | 18,756 | | | 210,067 | |
| Twilio, Inc., Class A(a) | | 6,916 | | | 163,218 | |
| USA Technologies, Inc.(a) | | 29,799 | | | 290,540 | |
See Notes to Financial Statements.
| Semi-Annual Report | December 31, 2017 | 9 |
| | Schedule of Investments |
| Cortina Small Cap Growth Fund | December 31, 2017 (Unaudited) |
| | Shares | | Value | |
| COMMON STOCKS (continued) | | | | | | |
| Information Technology (continued) | | | | | | |
| Varonis Systems, Inc.(a) | | 7,408 | | $ | 359,658 | |
| | | | | | 8,718,652 | |
| Materials (2.81%) | | | | | | |
| Codexis, Inc.(a) | | 37,331 | | | 311,714 | |
| LSB Industries, Inc.(a) | | 17,298 | | | 151,531 | |
| Summit Materials, Inc., Class A(a) | | 8,987 | | | 282,569 | |
| | | | | | 745,814 | |
| Telecommunication Services (1.57%) | | | | | | |
| Boingo Wireless, Inc.(a) | | 18,500 | | | 416,250 | |
| | | | | | | |
| TOTAL COMMON STOCKS | | | | | | |
| (COST $19,960,816) | | | | | 26,263,135 | |
| | | | | | | |
| TOTAL INVESTMENTS (98.90%) | | | | | | |
| (COST $19,960,816) | | | | | 26,263,135 | |
| | | | | | | |
| OTHER ASSETS IN EXCESS OF LIABILITIES (1.10%) | | | | | 291,727 | |
| | | | | | | |
| NET ASSETS 100.00% | | | | $ | 26,554,862 | |
| (a) | Non Income Producing Security. |
| (b) | To the extent the Fund invests more heavily in particular sectors of the economy, its performance will be especially sensitive to developments that significantly affect those sectors. When sector categorization is broken down by industry, no industry exceeds the 25% maximum specified in the Statement of Additional Information. |
See Notes to Financial Statements.
| 10 | 1-855-612-3936 | www.cortinafunds.com |
| Schedule of Investments |
| Cortina Small Cap Value Fund | December 31, 2017 (Unaudited) |
| | Shares | | Value | |
| COMMON STOCKS (97.20%) | | | | | | |
| Consumer Discretionary (13.85%) | | | | | | |
| Adtalem Global Education, Inc.(a) | | 10,360 | | $ | 435,638 | |
| Caleres, Inc. | | 18,684 | | | 625,540 | |
| Career Education Corp.(a) | | 36,863 | | | 445,305 | |
| Eldorado Resorts, Inc.(a) | | 20,464 | | | 678,382 | |
| G-III Apparel Group, Ltd.(a) | | 22,153 | | | 817,224 | |
| M/I Homes, Inc.(a) | | 21,522 | | | 740,357 | |
| New Home Co., Inc.(a) | | 23,728 | | | 297,312 | |
| Tenneco, Inc. | | 8,894 | | | 520,655 | |
| TRI Pointe Group, Inc.(a) | | 42,445 | | | 760,614 | |
| Winnebago Industries, Inc. | | 15,925 | | | 885,430 | |
| | | | | | 6,206,457 | |
| Consumer Staples (1.16%) | | | | | | |
| Andersons, Inc. | | 16,637 | | | 518,242 | |
| | | | | | | |
| Energy (5.69%) | | | | | | |
| Eclipse Resources Corp.(a) | | 183,028 | | | 439,267 | |
| Gulfport Energy Corp(a) | | 26,080 | | | 332,781 | |
| Matador Resources Co.(a) | | 18,886 | | | 587,921 | |
| Oil States International, Inc.(a) | | 21,651 | | | 612,723 | |
| Patterson-UTI Energy, Inc. | | 25,032 | | | 575,987 | |
| | | | | | 2,548,679 | |
| Financials (23.48%) | | | | | | |
| BancorpSouth, Inc. | | 20,567 | | | 646,832 | |
| Banner Corp. | | 14,441 | | | 795,988 | |
| Capitol Federal Financial, Inc. | | 38,918 | | | 521,890 | |
| Cbtx Inc | | 15,433 | | | 457,743 | |
| ConnectOne Bancorp, Inc. | | 32,101 | | | 826,601 | |
| Enterprise Financial Services Corp. | | 19,721 | | | 890,403 | |
| James River Group Holdings, Ltd. | | 17,733 | | | 709,497 | |
| Meridian Bancorp, Inc. | | 50,336 | | | 1,036,922 | |
| Pinnacle Financial Partners, Inc. | | 11,669 | | | 773,655 | |
| Provident Financial Services, Inc. | | 18,612 | | | 501,966 | |
| TriState Capital Holdings, Inc.(a) | | 33,984 | | | 781,632 | |
| Waterstone Financial, Inc. | | 38,200 | | | 651,310 | |
| Western Alliance Bancorp(a) | | 17,799 | | | 1,007,779 | |
| Wintrust Financial Corp. | | 11,211 | | | 923,450 | |
| | | | | | 10,525,668 | |
| Health Care (8.53%) | | | | | | |
| Allscripts Healthcare Solutions, Inc.(a) | | 63,279 | | | 920,710 | |
| Endologix, Inc.(a) | | 80,951 | | | 433,088 | |
| Magellan Health, Inc.(a) | | 11,408 | | | 1,101,442 | |
| Pacira Pharmaceuticals, Inc.(a) | | 17,920 | | | 818,048 | |
| Prestige Brands Holdings, Inc.(a) | | 12,446 | | | 552,727 | |
| | | | | | 3,826,015 | |
| Industrials (15.68%) | | | | | | |
| Astronics Corp.(a) | | 15,640 | | | 648,591 | |
| Atkore International Group, Inc.(a) | | 29,772 | | | 638,609 | |
| Forward Air Corp. | | 9,038 | | | 519,143 | |
| Generac Holdings, Inc.(a) | | 10,788 | | | 534,222 | |
| Harsco Corp.(a) | | 53,216 | | | 992,478 | |
| Knoll, Inc. | | 37,176 | | | 856,535 | |
| Kornit Digital, Ltd.(a) | | 49,030 | | | 791,835 | |
| REV Group, Inc. | | 24,615 | | | 800,726 | |
| Safe Bulkers, Inc.(a) | | 236,001 | | | 762,283 | |
See Notes to Financial Statements.
| Semi-Annual Report | December 31, 2017 | 11 |
| Schedule of Investments |
| Cortina Small Cap Value Fund | December 31, 2017 (Unaudited) |
| | Shares | | Value | |
| COMMON STOCKS (continued) | | | | | | |
| Industrials (continued) | | | | | | |
| Student Transportation, Inc. | | 78,799 | | $ | 483,826 | |
| | | | | | 7,028,248 | |
| Information Technology (13.52%) | | | | | | |
| ACI Worldwide, Inc.(a) | | 33,817 | | | 766,631 | |
| Ambarella, Inc.(a) | | 4,089 | | | 240,229 | |
| Barracuda Networks, Inc.(a) | | 16,301 | | | 448,278 | |
| Benchmark Electronics, Inc.(a) | | 23,126 | | | 672,967 | |
| BlackBerry, Ltd.(a) | | 74,935 | | | 837,024 | |
| Dolby Laboratories, Inc., Class A | | 9,689 | | | 600,718 | |
| Etsy, Inc.(a) | | 37,516 | | | 767,202 | |
| Teradata Corp.(a) | | 28,757 | | | 1,105,994 | |
| Travelport Worldwide, Ltd. | | 47,477 | | | 620,524 | |
| | | | | | 6,059,567 | |
| Materials (4.93%) | | | | | | |
| Cliffs Natural Resources, Inc.(a) | | 107,256 | | | 773,316 | |
| Commercial Metals Co. | | 31,342 | | | 668,211 | |
| Graphic Packaging Holding Co. | | 23,147 | | | 357,621 | |
| Owens-Illinois, Inc.(a) | | 18,505 | | | 410,256 | |
| | | | | | 2,209,404 | |
| Real Estate (4.28%) | | | | | | |
| Four Corners Property Trust, Inc., REIT | | 34,127 | | | 877,064 | |
| Gramercy Property Trust, Inc., REIT | | 13,655 | | | 364,042 | |
| Physicians Realty Trust, REIT | | 37,685 | | | 677,953 | |
| | | | | | 1,919,059 | |
| Utilities (6.08%) | | | | | | |
| Chesapeake Utilities Corp. | | 9,092 | | | 714,177 | |
| Connecticut Water Service, Inc. | | 5,101 | | | 292,848 | |
| Middlesex Water Co. | | 16,686 | | | 665,938 | |
| Ormat Technologies, Inc. | | 16,452 | | | 1,052,270 | |
| | | | | | 2,725,233 | |
| | | | | | | |
| TOTAL COMMON STOCKS | | | | | | |
| (COST $35,011,243) | | | | | 43,566,572 | |
| | | | | | | |
| TOTAL INVESTMENTS (97.20%) | | | | | | |
| (COST $35,011,243) | | | | | 43,566,572 | |
| | | | | | | |
| OTHER ASSETS IN EXCESS OF LIABILITIES (2.80%) | | | | | 1,254,879 | |
| | | | | | | |
| NET ASSETS 100.00% | | | | $ | 44,821,451 | |
| (a) | Non Income Producing Security. |
See Notes to Financial Statements.
| 12 | 1-855-612-3936 | www.cortinafunds.com |
| Statements of Assets and Liabilities |
December 31, 2017 (Unaudited)
| | Cortina Small Cap Growth Fund | | Cortina Small Cap Value Fund | |
| ASSETS: | | | | | | |
| Investments, at value (Cost - see below) | $ | 26,263,135 | | $ | 43,566,572 | |
| Cash | | 565,445 | | | 1,248,530 | |
| Receivable for investments sold | | 51,585 | | | – | |
| Receivable for fund shares subscribed | | – | | | 10,260 | |
| Dividends and interest receivable | | 2,222 | | | 33,871 | |
| Prepaid expenses and other assets | | 15,648 | | | 21,560 | |
| Total Assets | | 26,898,035 | | | 44,880,793 | |
| | | | | | | |
| LIABILITIES: | | | | | | |
| Payable for investments purchased | | 303,957 | | | – | |
| Payable for director fees | | 5,081 | | | 5,081 | |
| Payable for advisory fees | | 5,833 | | | 13,596 | |
| Payable for fund accounting and administration fees | | 10,909 | | | 14,710 | |
| Payable for distribution and service fees | | – | | | 144 | |
| Payable for audit and legal fees | | 11,269 | | | 13,797 | |
| Other accrued liabilities and expenses | | 6,124 | | | 12,014 | |
| Total Liabilities | | 343,173 | | | 59,342 | |
| Net Assets | $ | 26,554,862 | | $ | 44,821,451 | |
| | | | | | | |
| NET ASSETS CONSISTS OF: | | | | | | |
| Paid-in capital | $ | 20,303,892 | | $ | 36,954,754 | |
| Accumulated undistributed net investment income/(loss) | | (334,541 | ) | | 7,445 | |
| Accumulated net realized gain/(loss) on investments | | 283,192 | | | (696,077 | ) |
| Net unrealized appreciation on investments | | 6,302,319 | | | 8,555,329 | |
| Net Assets | $ | 26,554,862 | | $ | 44,821,451 | |
| | | | | | | |
| Cost of Investments | $ | 19,960,816 | | $ | 35,011,243 | |
| | | | | | | |
| PRICING OF SHARES: | | | | | | |
| Institutional | | | | | | |
| Net Assets | $ | 26,554,862 | | $ | 44,148,601 | |
| Shares Outstanding ($0.01 par value, unlimited number of shares authorized) | | 1,631,560 | | | 2,158,280 | |
| Net Asset Value, offering and redemption price per share | $ | 16.28 | | $ | 20.46 | |
| Investor | | | | | | |
| Net Assets | $ | – | | $ | 672,850 | |
| Shares Outstanding ($0.01 par value, unlimited number of shares authorized) | | – | | | 33,154 | |
| Net Asset Value, offering and redemption price per share | $ | – | | $ | 20.29 | |
See Notes to Financial Statements.
| Semi-Annual Report | December 31, 2017 | 13 |
| Statements of Operations |
For the Six Months Ended December 31, 2017 (Unaudited)
| | Cortina Small Cap Growth Fund | | Cortina Small Cap Value Fund | |
| INVESTMENT INCOME: | | | | | | |
| Dividends (net of foreign withholding taxes of $0 and $2,428, respectively) | $ | 11,936 | | $ | 250,804 | |
| Total Investment Income | | 11,936 | | | 250,804 | |
| | | | | | | |
| EXPENSES: | | | | | | |
| Advisory fees (Note 3) | | 131,588 | | | 220,285 | |
| Fund accounting and administration fees and expenses | | 46,805 | | | 73,972 | |
| Transfer agent fees | | 16,095 | | | 26,413 | |
| Distribution and service fees | | | | | | |
| Investor | | – | | | 973 | |
| Legal fees | | 8,514 | | | 14,091 | |
| Printing fees | | 615 | | | 4,389 | |
| Registration fees | | 10,278 | | | 16,703 | |
| Audit and tax fees | | 7,800 | | | 8,052 | |
| Custodian fees | | 2,560 | | | 2,901 | |
| Director fees and expenses | | 10,081 | | | 10,081 | |
| Other | | 6,395 | | | 8,585 | |
| Total Expenses Before Waivers | | 240,731 | | | 386,445 | |
| Less fees waived by Adviser (Note 3) | | (95,968 | ) | | (143,086 | ) |
| Total Net Expenses | | 144,763 | | | 243,359 | |
| Net Investment Income/(Loss) | | (132,827 | ) | | 7,445 | |
| | | | | | | |
| REALIZED AND UNREALIZED GAIN/(LOSS) ON INVESTMENTS: | | | | | | |
| Net realized gain on investments | | 1,160,490 | | | 725,744 | |
| Net change in unrealized appreciation/(depreciation) on investments | | (119,091 | ) | | 2,255,716 | |
| Net Realized and Unrealized Gain on Investments | | 1,041,399 | | | 2,981,460 | |
| Net Increase in Net Assets Resulting from Operations | $ | 908,572 | | $ | 2,988,905 | |
See Notes to Financial Statements.
| 14 | 1-855-612-3936 | www.cortinafunds.com |
| | Statements of Changes in Net Assets |
| | | Cortina Small Cap Growth Fund | | | Cortina Small Cap Value Fund | |
| | | Six Months Ended December 31, 2017 (Unaudited) | | | Year Ended June 30, 2017 | | | Six Months Ended December 31, 2017 (Unaudited) | | | Year Ended June 30, 2017 | |
| OPERATIONS: | | | | | | | | | | | | |
| Net investment income/(loss) | | $ | (132,827 | ) | | $ | (292,074 | ) | | $ | 7,445 | | | $ | 11,563 | |
| Net realized gain on investments | | | 1,160,490 | | | | 8,060,618 | | | | 725,744 | | | | 10,540,771 | |
| Net change in unrealized appreciation/(depreciation) on investments | | | (119,091 | ) | | | 855,736 | | | | 2,255,716 | | | | 744,058 | |
| Net increase in net assets resulting from operations | | | 908,572 | | | | 8,624,280 | | | | 2,988,905 | | | | 11,296,392 | |
| | | | | | | | | | | | | | | | | |
| DISTRIBUTIONS TO SHAREHOLDERS: | | | | | | | | | | | | | | | | |
| Institutional | | | | | | | | | | | | | | | | |
| From net investment income | | | (201,714 | ) | | | – | | | | – | | | | (76,127 | ) |
| From net realized gains on investments | | | (3,987,645 | ) | | | – | | | | (2,288,431 | ) | | | – | |
| Investor | | | | | | | | | | | | | | | | |
| From net investment income | | | – | | | | – | | | | – | | | | (79 | ) |
| From net realized gains on investments | | | – | | | | – | | | | (34,992 | ) | | | – | |
| Total distributions | | | (4,189,359 | ) | | | – | | | | (2,323,423 | ) | | | (76,206 | ) |
| | | | | | | | | | | | | | | | | |
| CAPITAL SHARE TRANSACTIONS: | | | | | | | | | | | | | | | | |
| Institutional | | | | | | | | | | | | | | | | |
| Proceeds from sale of shares | | | 848,560 | | | | 2,251,187 | | | | 3,723,178 | | | | 8,762,639 | |
| Shares issued in reinvestment of distributions | | | 4,159,270 | | | | – | | | | 1,673,166 | | | | 58,066 | |
| Cost of shares redeemed | | | (1,186,016 | ) | | | (19,682,697 | ) | | | (3,397,834 | ) | | | (42,973,360 | ) |
| Redemption fees | | | – | | | | – | | | | – | | | | 1,239 | |
| Total | | | 3,821,814 | | | | (17,431,510 | ) | | | 1,998,510 | | | | (34,151,416 | ) |
| Investor | | | | | | | | | | | | | | | | |
| Proceeds from sale of shares | | | – | | | | – | | | | 2,459 | | | | 585,238 | |
| Shares issued in reinvestment of distributions | | | – | | | | – | | | | 30,671 | | | | 76 | |
| Cost of shares redeemed | | | – | | | | – | | | | (397,471 | ) | | | (207,584 | ) |
| Total | | | – | | | | – | | | | (364,341 | ) | | | 377,730 | |
| Net increase/(decrease) from capital shares transactions | | | 3,821,814 | | | | (17,431,510 | ) | | | 1,634,169 | | | | (33,773,686 | ) |
| | | | | | | | | | | | | | | | | |
| Net increase/(decrease) in net assets | | | 541,027 | | | | (8,807,230 | ) | | | 2,299,651 | | | | (22,553,500 | ) |
| | | | | | | | | | | | | | | | | |
| NET ASSETS: | | | | | | | | | | | | | | | | |
| Beginning of period | | | 26,013,835 | | | | 34,821,065 | | | | 42,521,800 | | | | 65,075,300 | |
| End of period | | $ | 26,554,862 | | | $ | 26,013,835 | | | $ | 44,821,451 | | | $ | 42,521,800 | |
| Including accumulated net investment income/(loss) of: | | $ | (334,541 | ) | | $ | – | | | $ | 7,445 | | | $ | – | |
| | | | | | | | | | | | | | | | | |
| OTHER INFORMATION: | | | | | | | | | | | | | | | | |
| Share Transactions: | | | | | | | | | | | | | | | | |
| Institutional | | | | | | | | | | | | | | | | |
| Beginning shares | | | 1,390,728 | | | | 2,439,069 | | | | 2,057,765 | | | | 3,985,455 | |
| Shares sold | | | 44,917 | | | | 132,757 | | | | 183,416 | | | | 467,621 | |
| Shares issued in reinvestment of dividends | | | 260,769 | | | | – | | | | 83,868 | | | | 2,936 | |
| Less shares redeemed | | | (64,854 | ) | | | (1,181,098 | ) | | | (166,769 | ) | | | (2,398,247 | ) |
| Ending shares | | | 1,631,560 | | | | 1,390,728 | | | | 2,158,280 | | | | 2,057,765 | |
| Investor | | | | | | | | | | | | | | | | |
| Beginning shares | | | – | | | | – | | | | 51,411 | | | | 32,503 | |
| Shares sold | | | – | | | | – | | | | 120 | | | | 29,568 | |
| Shares issued in reinvestment of dividends | | | – | | | | – | | | | 1,549 | | | | 4 | |
| Less shares redeemed | | | – | | | | – | | | | (19,926 | ) | | | (10,664 | ) |
| Ending shares | | | – | | | | – | | | | 33,154 | | | | 51,411 | |
| See Notes to Financial Statements. | |
| Semi-Annual Report | December 31, 2017 | 15 |
| | Financial Highlights |
| Cortina Small Cap Growth Fund | For a share outstanding throughout the periods presented. |
| | | Six Months Ended December 31, 2017 (Unaudited) | | | Year Ended June 30, 2017 | | | Year Ended June 30, 2016 | | | Year Ended June 30, 2015 | | | Year Ended June 30, 2014 | | | Year Ended June 30, 2013 | |
| NET ASSET VALUE, BEGINNING OF PERIOD | | $ | 18.71 | | | $ | 14.28 | | | $ | 15.41 | | | $ | 16.35 | | | $ | 14.46 | | | $ | 11.87 | |
| INCOME/(LOSS) FROM INVESTMENT OPERATIONS: | | | | | | | | | | | | | |
| Net investment loss(a) | | | (0.09 | ) | | | (0.16 | ) | | | (0.13 | ) | | | (0.14 | ) | | | (0.17 | ) | | | (0.13 | ) |
| Net realized and unrealized gain/(loss) on investments | | | 0.69 | | | | 4.59 | | | | (1.00 | ) | | | (0.02 | )(b) | | | 2.19 | | | | 2.81 | |
| Total from Investment Operations | | | 0.60 | | | | 4.43 | | | | (1.13 | ) | | | (0.16 | ) | | | 2.02 | | | | 2.68 | |
| | | | | | | | | | | | | | | | | | | | | | | | | |
| DIVIDENDS AND DISTRIBUTIONS TO SHAREHOLDERS: | | | | | | | | | | | | | | | | | | | | | | | | |
| From net investment income | | | (0.15 | ) | | | – | | | | – | | | | – | | | | – | | | | – | |
| From net realized gains on investments | | | (2.88 | ) | | | – | | | | – | | | | (0.78 | ) | | | (0.13 | ) | | | (0.09 | ) |
| Total Dividends and Distributions to Shareholders | | | (3.03 | ) | | | – | | | | – | | | | (0.78 | ) | | | (0.13 | ) | | | (0.09 | ) |
| | | | | | | | | | | | | | | | | | | | | | | | | |
| Paid-in Capital from Redemption Fees | | | – | | | | – | | | | – | | | | 0.00 | (c) | | | 0.00 | (c) | | | – | |
| | | | | | | | | | | | | | | | | | | | | | | | | |
| NET INCREASE/(DECREASE) IN NET ASSET VALUE | | | (2.43 | ) | | | 4.43 | | | | (1.13 | ) | | | (0.94 | ) | | | 1.89 | | | | 2.59 | |
| | | | | | | | | | | | | | | | | | | | | | | | | |
| NET ASSET VALUE, END OF PERIOD | | $ | 16.28 | | | $ | 18.71 | | | $ | 14.28 | | | $ | 15.41 | | | $ | 16.35 | | | $ | 14.46 | |
| | | | | | | | | | | | | | | | | | | | | | | | | |
| TOTAL RETURN | | | 3.56 | %(d) | | | 30.95 | % | | | (7.33 | %) | | | (0.71 | %) | | | 13.99 | % | | | 22.79 | % |
| | | | | | | | | | | | | | | | | | | | | | | | | |
| RATIOS AND SUPPLEMENTAL DATA: | | | | | | | | | | | | | | | | | | | | | | | | |
| Net assets, end of period (in 000s) | | $ | 26,555 | | | $ | 26,014 | | | $ | 34,821 | | | $ | 46,285 | | | $ | 31,657 | | | $ | 18,245 | |
| | | | | | | | | | | | | | | | | | | | | | | | | |
| RATIOS TO AVERAGE NET ASSETS: | | | | | | | | | | | | | | | | | | | | | | | | |
| Operating expenses excluding waiver/reimbursement | | | 1.83 | %(e) | | | 1.76 | % | | | 1.54 | % | | | 1.57 | % | | | 1.86 | % | | | 3.85 | % |
| Operating expenses including waiver/reimbursement | | | 1.10 | %(e) | | | 1.10 | % | | | 1.10 | % | | | 1.10 | % | | | 1.10 | % | | | 1.10 | % |
| Net investment loss including waiver/reimbursement | | | (1.01 | )%(e) | | | (0.98 | )% | | | (0.97 | )% | | | (0.94 | )% | | | (1.02 | )% | | | (1.00 | )% |
| | | | | | | | | | | | | | | | | | | | | | | | | |
| PORTFOLIO TURNOVER RATE | | | 43 | %(d) | | | 88 | % | | | 93 | % | | | 95 | % | | | 81 | % | | | 73 | % |
| (a) | Calculated using average shares throughout the period. |
| (b) | Realized and unrealized gains and losses per share in this caption are balancing amounts necessary to reconcile the change in net asset value per share for the period, and may not reconcile with the aggregate gains and losses in the Statements of Operations due to the share transactions for the period. |
| (c) | Less than $0.005 per share. |
| See Notes to Financial Statements. | |
| 16 | 1-855-612-3936 | www.cortinafunds.com |
| | Financial Highlights |
| Cortina Small Cap Value Fund – Institutional | For a share outstanding throughout the periods presented. |
| | | Six Months Ended December 31, 2017 (Unaudited) | | | Year Ended June 30, 2017 | | | Year Ended June 30, 2016 | | | Year Ended June 30, 2015 | | | Year Ended June 30, 2014 | | | Year Ended June 30, 2013 | |
| NET ASSET VALUE, BEGINNING OF PERIOD | | $ | 20.16 | | | $ | 16.20 | | | $ | 18.52 | | | $ | 18.67 | | | $ | 15.62 | | | $ | 12.54 | |
| INCOME/(LOSS) FROM INVESTMENT OPERATIONS: | | | | | | | | | | | | | |
| Net investment income/(loss)(a) | | | 0.00 | (b) | | | 0.01 | | | | 0.01 | | | | (0.02 | ) | | | (0.01 | ) | | | 0.01 | |
| Net realized and unrealized gain/(loss) on investments | | | 1.39 | | | | 3.98 | | | | (2.33 | ) | | | 0.24 | | | | 3.30 | | | | 3.68 | |
| Total from Investment Operations | | | 1.39 | | | | 3.99 | | | | (2.32 | ) | | | 0.22 | | | | 3.29 | | | | 3.69 | |
| | | | | | | | | | | | | | | | | | | | | | | | | |
| DIVIDENDS AND DISTRIBUTIONS TO SHAREHOLDERS: | | | | | | | | | | | | | | | | | | | | | | | | |
| From net investment income | | | – | | | | (0.03 | ) | | | – | | | | – | | | | (0.01 | ) | | | (0.07 | ) |
| From net realized gains on investments | | | (1.09 | ) | | | – | | | | – | | | | (0.37 | ) | | | (0.23 | ) | | | (0.54 | ) |
| Total Dividends and Distributions to Shareholders | | | (1.09 | ) | | | (0.03 | ) | | | – | | | | (0.37 | ) | | | (0.24 | ) | | | (0.61 | ) |
| | | | | | | | | | | | | | | | | | | | | | | | | |
| Paid-in Capital from Redemption Fees | | | – | | | | 0.00 | (b) | | | 0.00 | (b) | | | 0.00 | (b) | | | – | | | | – | |
| | | | | | | | | | | | | | | | | | | | | | | | | |
| NET INCREASE/(DECREASE) IN NET ASSET VALUE | | | 0.30 | | | | 3.96 | | | | (2.32 | ) | | | (0.15 | ) | | | 3.05 | | | | 3.08 | |
| | | | | | | | | | | | | | | | | | | | | | | | | |
| NET ASSET VALUE, END OF PERIOD | | $ | 20.46 | | | $ | 20.16 | | | $ | 16.20 | | | $ | 18.52 | | | $ | 18.67 | | | $ | 15.62 | |
| | | | | | | | | | | | | | | | | | | | | | | | | |
| TOTAL RETURN | | | 7.02 | %(c) | | | 24.65 | % | | | (12.53 | %) | | | 1.21 | % | | | 21.14 | % | | | 30.41 | % |
| | | | | | | | | | | | | | | | | | | | | | | | | |
| RATIOS AND SUPPLEMENTAL DATA: | | | | | | | | | | | | | | | | | | | | | | | | |
| Net assets, end of period (in 000s) | | $ | 44,149 | | | $ | 41,492 | | | $ | 64,552 | | | $ | 51,254 | | | $ | 34,842 | | | $ | 4,344 | |
| | | | | | | | | | | | | | | | | | | | | | | | | |
| RATIOS TO AVERAGE NET ASSETS: | | | | | | | | | | | | | | | | | | | | | | | | |
| Operating expenses excluding waiver/reimbursement | | | 1.75 | %(d) | | | 1.72 | % | | | 1.50 | % | | | 1.63 | % | | | 1.92 | % | | | 5.55 | % |
| Operating expenses including waiver/reimbursement | | | 1.10 | %(d) | | | 1.10 | % | | | 1.10 | % | | | 1.10 | % | | | 1.10 | % | | | 1.10 | % |
| Net investment income/(loss) including waiver/reimbursement | | | 0.04 | %(d) | | | 0.03 | % | | | 0.08 | % | | | (0.13 | )% | | | (0.09 | )% | | | 0.10 | % |
| | | | | | | | | | | | | | | | | | | | | | | | | |
| PORTFOLIO TURNOVER RATE | | | 35 | %(c) | | | 89 | % | | | 109 | % | | | 102 | % | | | 78 | % | | | 81 | % |
| (a) | Calculated using average shares throughout the period. |
| (b) | Less than $0.005 per share. |
| See Notes to Financial Statements. | |
| Semi-Annual Report | December 31, 2017 | 17 |
| | Financial Highlights |
| Cortina Small Cap Value Fund – Investor | For a share outstanding throughout the periods presented. |
| | | Six Months Ended December 31, 2017 (Unaudited) | | | Year Ended June 30, 2017 | | | Year Ended June 30, 2016 | | | Year Ended June 30, 2015 | | | For the Period April 30, 2014 (Inception) to June 30, 2014 | |
| NET ASSET VALUE, BEGINNING OF PERIOD | | $ | 20.04 | | | $ | 16.11 | | | $ | 18.47 | | | $ | 18.67 | | | $ | 18.15 | |
| INCOME/(LOSS) FROM INVESTMENT OPERATIONS: | | | | | | | | | | | | | |
| Net investment loss(a) | | | (0.02 | )(b) | | | (0.03 | )(b) | | | (0.02 | ) | | | (0.06 | ) | | | (0.01 | ) |
| Net realized and unrealized gain/(loss) on investments | | | 1.36 | | | | 3.96 | | | | (2.34 | ) | | | 0.23 | | | | 0.53 | |
| Total from Investment Operations | | | 1.34 | | | | 3.93 | | | | (2.36 | ) | | | 0.17 | | | | 0.52 | |
| | | | | | | | | | | | | | | | | | | | | |
| DIVIDENDS AND DISTRIBUTIONS TO SHAREHOLDERS: | | | | | | | | | | | | | | | | | | | | |
| From net investment income | | | – | | | | (0.00 | )(c) | | | – | | | | – | | | | – | |
| From net realized gains on investments | | | (1.09 | ) | | | – | | | | – | | | | (0.37 | ) | | | – | |
| Total Dividends and Distributions to Shareholders | | | (1.09 | ) | | | (0.00 | )(c) | | | – | | | | (0.37 | ) | | | – | |
| | | | | | | | | | | | | | | | | | | | | |
| Paid-in Capital from Redemption Fees | | | – | | | | – | | | | – | | | | – | | | | – | |
| | | | | | | | | | | | | | | | | | | | | |
| NET INCREASE/(DECREASE) IN NET ASSET VALUE | | | 0.25 | | | | 3.93 | | | | (2.36 | ) | | | (0.20 | ) | | | 0.52 | |
| | | | | | | | | | | | | | | | | | | | | |
| NET ASSET VALUE, END OF PERIOD | | $ | 20.29 | | | $ | 20.04 | | | $ | 16.11 | | | $ | 18.47 | | | $ | 18.67 | |
| | | | | | | | | | | | | | | | | | | | | |
| TOTAL RETURN | | | 6.86 | %(d) | | | 24.41 | % | | | (12.78 | %) | | | 0.94 | % | | | 2.87 | %(d) |
| | | | | | | | | | | | | | | | | | | | | |
| RATIOS AND SUPPLEMENTAL DATA: | | | | | | | | | | | | | | | | | | | | |
| Net assets, end of period (in 000s) | | $ | 673 | | | $ | 1,030 | | | $ | 524 | | | $ | 360 | | | $ | 103 | |
| | | | | | | | | | | | | | | | | | | | | |
| RATIOS TO AVERAGE NET ASSETS: | | | | | | | | | | | | | | | | | | | | |
| Operating expenses excluding waiver/reimbursement | | | 2.00 | %(e) | | | 2.00 | % | | | 1.75 | % | | | 1.86 | % | | | 2.14 | %(e) |
| Operating expenses including waiver/reimbursement | | | 1.35 | %(e) | | | 1.35 | % | | | 1.35 | % | | | 1.35 | % | | | 1.35 | %(e) |
| Net investment loss including waiver/reimbursement | | | (0.22 | )%(e) | | | (0.15 | )% | | | (0.13 | )% | | | (0.35 | )% | | | (0.20 | )%(e) |
| | | | | | | | | | | | | | | | | | | | | |
| PORTFOLIO TURNOVER RATE | | | 35 | %(d) | | | 89 | % | | | 109 | % | | | 102 | % | | | 78 | %(d)(f) |
| (a) | Calculated using average shares throughout the period. |
| (b) | The amount shown for a share outstanding throughout the period may not correlate with the Statement of Operations for the period due to the timing of sales and redemptions of Fund shares in relation to income earned and/or fluctuating market value of the investments of the Fund. |
| (c) | Less than $0.005 per share. |
| (f) | Portfolio turnover is calculated at the Fund level and represents the year ended June 30, 2014. |
| See Notes to Financial Statements. | |
| 18 | 1-855-612-3936 | www.cortinafunds.com |
| Notes to Financial Statements |
December 31, 2017 (Unaudited)
1. ORGANIZATION
Cortina Funds, Inc. (the “Corporation”) is an open-end management investment company registered under the Investment Company Act of 1940, as amended (the “1940 Act”). The Corporation was organized on April 27, 2004 as a Wisconsin corporation. The Corporation currently offers shares of common stock (“shares”) of the Cortina Small Cap Growth Fund and the Cortina Small Cap Value Fund (each a “Fund” and collectively, the “Funds”).
The Cortina Small Cap Growth Fund, which commenced operations with the sale of Institutional Class Shares on September 30, 2011, is a diversified portfolio with an investment objective to seek growth of capital. The Cortina Small Cap Value Fund, which commenced operations with the sale of Institutional Class Shares on September 30, 2011 and the sale of Investor Class Shares on April 30, 2014, is a diversified portfolio with an investment objective to seek long-term capital appreciation.
Shares of each Fund are designated as Institutional Shares or Investor Shares with an indefinite number of shares authorized at $0.01 par value. The Articles of Incorporation, as amended and restated, permit the Corporation’s Board of Directors (the “Board”) to create additional funds and share classes.
2. SIGNIFICANT ACCOUNTING POLICIES
The following is a summary of significant accounting policies followed by the Funds. These policies are in conformity with U.S. generally accepted accounting principles (“GAAP”). The Funds are considered investment companies for financial reporting purposes under GAAP.
Use of Estimates — The accompanying financial statements were prepared in accordance with GAAP, which require the use of estimates and assumptions made by management. These may affect the reported amounts of assets and liabilities and disclosure of contingent assets and liabilities at the date of the financial statements and the reported amounts of increases and decreases in net assets from operations during the reporting period. Actual results could differ from those estimates.
Investment Valuation — Investment securities are valued at the last sale price at the close of the principal exchange on which they trade, except for securities listed on the NASDAQ Stock Market, Inc. (“NASDAQ”) exchange, which are valued at the NASDAQ official closing price. Unlisted securities or listed securities for which there were no sales during the day are valued at the closing bid price on such exchanges or over-the-counter markets. Investments for which market quotations are not readily available are valued at fair value as determined in good faith under consistently applied procedures approved by and under the general supervision of the Funds’ Board. Securities with maturities of sixty (60) days or less are valued at amortized cost as Level 1 or 2 within the hierarchy.
Investment Transactions — Investment security transactions are accounted for on trade date. Gains and losses on securities sold are determined on a specific identification basis.
Investment Income — Interest income is accrued and recorded on a daily basis including amortization of premiums, accretions of discounts and income earned from money market funds. Interest is not accrued on securities that are in default. Dividend income is recorded on the ex-dividend date. Withholding taxes on foreign dividends have been provided for in accordance with the Funds’ understanding of the applicable country’s tax rules and rates.
Fair Value Measurements — A three-tier hierarchy has been established to classify fair value measurements for disclosure purposes. Inputs refer broadly to the assumptions that market participants would use in pricing the asset or liability, including assumptions about risk. Inputs may be observable or unobservable. Observable inputs are inputs that reflect the assumptions market participants would use in pricing the asset or liability that are developed based on market data obtained from sources independent of the reporting entity. Unobservable inputs are inputs that reflect the reporting entity’s own assumptions about the assumptions market participants would use in pricing the asset or liability that are developed based on the best information available. In accordance with the authoritative guidance on fair value measurements and disclosure under GAAP, the Funds disclose fair value of their investments in a hierarchy that prioritizes the inputs to valuation techniques used to measure the fair value.
Cash — The Fund considers its investment in a FDIC insured interest bearing savings account to be cash. The Fund maintains cash balances, which, at times may exceed federally insured limits. The Fund maintains these balances with a high quality financial institution.
| Semi-Annual Report | December 31, 2017 | 19 |
| Notes to Financial Statements |
December 31, 2017 (Unaudited)
Various inputs are used in determining the value of each Fund’s investments as of the reporting period end. The designated input levels are not necessarily an indication of the risk or liquidity associated with these investments. These inputs are categorized in the following hierarchy under applicable financial accounting standards:
| Level 1 — | Unadjusted quoted prices in active markets for identical, unrestricted assets or liabilities that the Funds have the ability to access at the measurement date; |
| | |
| Level 2 — | Quoted prices which are not active, quoted prices for similar assets or liabilities in active markets or inputs other than quoted prices that are observable (either directly or indirectly) for substantially the full term of the asset or liability; and |
| | |
| Level 3 — | Significant unobservable prices or inputs (including a Fund’s own assumptions in determining the fair value of investments) where there is little or no market activity for the asset or liability at the measurement date. |
The availability of observable inputs can vary from security to security and is affected by a wide variety of factors, including, for example, the type of security, whether the security is new and not yet established in the marketplace, the liquidity of markets, and other characteristics particular to the security. To the extent that valuation is based on models or inputs that are less observable or unobservable in the market, the determination of fair value requires more judgment. Accordingly, the degree of judgment exercised in determining fair value is greatest for instruments categorized in Level 3.
An investment level within the fair value hierarchy is based on the lowest level input, individually or in the aggregate, that is significant to fair value measurement. The valuation techniques used by the Funds to measure fair value during the six months ended December 31, 2017 maximized the use of observable inputs and minimized the use of unobservable inputs.
The inputs or methodology used for valuing securities are not necessarily an indication of the risk or liquidity associated with investing in those securities. The following is a summary of the inputs used in valuing the Funds’ investments as of December 31, 2017:
Cortina Small Cap Growth Fund
| | | Valuation Inputs | | | | |
| Investments in Securities at Value | | Level 1 | | | Level 2 | | | Level 3 | | | Total | |
| Common Stocks* | | $ | 26,263,135 | | | $ | – | | | $ | – | | | $ | 26,263,135 | |
| Total | | $ | 26,263,135 | | | $ | – | | | $ | – | | | $ | 26,263,135 | |
Cortina Small Cap Value Fund
| | | Valuation Inputs | | | | |
| Investments in Securities at Value | | Level 1 | | | Level 2 | | | Level 3 | | | Total | |
| Common Stocks* | | $ | 43,566,572 | | | $ | – | | | $ | – | | | $ | 43,566,572 | |
| Total | | $ | 43,566,572 | | | $ | – | | | $ | – | | | $ | 43,566,572 | |
| * | See Schedule of Investments for sector classification. |
For the six months ended December 31, 2017, there have been no significant changes to the Funds’ fair value methodologies. Additionally, there were no transfers into or out of Levels 1 and 2 during the six months ended December 31, 2017. It is the Funds’ policy to recognize transfers at the end of the reporting period.
For the six months ended December 31, 2017, the Funds did not have investments with significant unobservable inputs (Level 3) used in determining fair value.
Affiliated Companies — An affiliated company is a company that can have direct or indirect common ownership. The Funds did not hold any investments in affiliated companies as of and during the six months ended December 31, 2017.
Expenses — The Funds bear expenses incurred specifically on each Fund’s respective behalf as well as a portion of general Corporation expenses, which may be allocated on the basis of relative net assets or the nature of the services performed relative to applicability to each Fund.
| 20 | 1-855-612-3936 | www.cortinafunds.com |
| Notes to Financial Statements |
December 31, 2017 (Unaudited)
Expenses that are specific to a class of shares of the Funds are charged directly to the share class. The Funds’ realized and unrealized gains and losses, net investment income, and expenses other than class specific expenses, are allocated daily to each class in proportion to its average daily net assets.
Distributions to Shareholders — Dividends from net investment income and distributions of net realized capital gains, if any, will be declared and paid at least annually. Income and capital gains distributions are determined in accordance with income tax regulations, which may differ from GAAP. Distributions to shareholders are recorded on the ex-dividend date.
Fees on Redemptions — The Funds will deduct a 2.00% redemption proceeds fee on Fund shares held 60 days or less. The redemption fee is not a fee to finance sales or sales promotion expenses, but is paid to the Funds to defray the costs of liquidating an investor and discouraging short-term trading of the Funds’ shares. No redemption fee will be imposed on redemptions initiated by the Funds.
Federal Income Taxes — As of and during the six months ended December 31, 2017, the Funds did not have a liability for any unrecognized tax benefits. The Funds file U.S. federal, state, and local tax returns as required. The Funds’ tax returns are subject to examination by the relevant tax authorities until expiration of the applicable statute of limitations which is generally three years after the filing of the tax return for federal purposes and four years for most state returns. Tax returns for open years have incorporated no uncertain tax positions that require a provision for income taxes. The Funds intend to distribute to shareholders all taxable investment income and realized gains, and otherwise comply with Subchapter M of the Internal Revenue Code of 1986, as amended, applicable to regulated investment companies.
3. ADVISORY FEES, FUND ACCOUNTING FEES, ADMINISTRATION FEES, AND OTHER AGREEMENTS
Investment Adviser
Cortina Asset Management, LLC, is the Funds’ investment adviser (the “Adviser”). The Adviser is subject to the general supervision of the Board and is responsible for the overall management of the Funds’ business affairs. The Adviser invests the assets of the Funds based on the Funds’ investment objectives and policies. The Adviser is entitled to an investment advisory fee, computed daily and payable monthly, of 1.00% of the average daily net assets for each Fund.
The Adviser has contractually agreed to waive fees with respect to each of the Funds so that the net annual operating expenses (excluding taxes, leverage, interest, brokerage commissions, dividends or interest expenses on short positions, acquired fund fees and expenses, and extraordinary expenses) of the Funds’ shares will not exceed 1.10% and 1.35% of average daily net assets of each Fund’s Institutional and with respect to the Cortina Small Cap Value Fund Investor Class shares, respectively, through October 31, 2018. The Adviser may request a reimbursement from the Funds to recapture any reduced management fees or reimbursed Fund expenses within three years following the fee reduction or expense reimbursement, but only to the extent the Funds’ total annual fund operating expenses including any requested reimbursement amount, are less than the above limit at the time of the request. Any such reimbursement is subject to review by the Board.
As of December 31, 2017, reimbursements that may potentially be made by the Funds to the Adviser total $562,318 for the Cortina Small Cap Growth Fund and $760,796 for the Cortina Small Cap Value Fund and expire as follows:
| Cortina Small Cap Growth Fund | | | |
| June 30, 2018 | | $ | 198,408 | |
| June 30, 2019 | | | 166,642 | |
| June 30, 2020 | | | 197,268 | |
| | | $ | 562,318 | |
| Cortina Small Cap Value Fund | | | | |
| June 30, 2018 | | $ | 222,111 | |
| June 30, 2019 | | | 250,624 | |
| June 30, 2020 | | | 288,061 | |
| | | $ | 760,796 | |
Fund Accounting Fees and Expenses
ALPS Fund Services, Inc. (“ALPS” or the “Administrator”) provides administrative, fund accounting and other services to the Funds for a monthly administration fee based on the Funds’ average daily net assets.
The Administrator is also reimbursed by the Funds for certain out-of-pocket expenses.
Transfer Agent
ALPS serves as transfer, dividend paying and shareholder servicing agent for the Funds (the “Transfer Agent”).
| Semi-Annual Report | December 31, 2017 | 21 |
| Notes to Financial Statements |
December 31, 2017 (Unaudited)
Compliance Services
ALPS provides services that assist the Corporation’s Chief Compliance Officer in monitoring and testing the policies and procedures of the Corporation in conjunction with requirements under Rule 38a-1 under the 1940 Act. ALPS is compensated under the Administration Agreement.
Distributor
The Funds have entered into a Distribution Agreement with ALPS Distributors, Inc (“the Distributor”) to provide distribution services to the Funds. The Distributor serves as underwriter/distributor of shares of the Funds.
Distribution and Services Plan
The Small Cap Value Fund has adopted a Distribution and Services Plan in accordance with Rule 12b-1 (“Distribution Plan”) under the 1940 Act. The Distribution Plan provides that the Cortina Small Cap Value Fund may compensate or reimburse the Distributor for services rendered and expenses borne in connection with activities primarily intended to result in the sale of the Cortina Small Cap Value Fund’s shares. Sales charges may be paid to broker-dealers, banks and any other financial intermediary eligible to receive such fees for sales of Investor Shares of the Cortina Small Cap Value Fund and for services provided to shareholders.
The Cortina Small Cap Value Fund charges 12b-1 fees for Investor Shares. Pursuant to the Distribution Plan, the Cortina Small Cap Value Fund may annually pay the Distributor up to 0.25% of the average daily net assets of the Cortina Small Cap Value Fund’s Investor Shares. The expenses of the Distribution Plan are reflected in the Statements of Operations.
Certain Directors and Officers of the Funds are also officers of the Adviser.
4. PURCHASES AND SALES OF INVESTMENT SECURITIES
The aggregate cost of purchases and proceeds from sales of investment securities, excluding short-term securities, are shown below for the six months ended December 31, 2017.
| Fund Name | | Purchases | | | Sales | |
| Cortina Small Cap Growth Fund | | $ | 11,341,302 | | | $ | 11,111,943 | |
| Cortina Small Cap Value Fund | | | 15,160,776 | | | | 16,106,425 | |
There were no purchases or sales of long-term U.S. Government Obligations for either Fund during the six months ended December 31, 2017.
5. TAX BASIS INFORMATION
Income and long-term capital gain distributions are determined in accordance with Federal income tax regulations, which differ from GAAP, and, therefore, may differ significantly in amount or character from net investment income and realized gains for financial reporting purposes.
As of December 31, 2017, the aggregate cost of investments, gross unrealized appreciation/(depreciation) and net unrealized appreciation/(depreciation) for Federal tax purposes was as follows:
| Fund | | Cost of Investments for Income Tax Purposes | | | Gross Appreciation (excess of value over tax cost) | | | Gross Depreciation (excess of tax cost over value) | | | Net Unrealized Appreciation/(Depreciation) | |
| Cortina Small Cap Growth Fund | | $ | 20,289,486 | | | $ | 6,852,135 | | | $ | (878,486 | ) | | $ | 5,973,649 | |
| Cortina Small Cap Value Fund | | | 35,356,347 | | | | 8,764,318 | | | | (554,093 | ) | | | 8,210,225 | |
The difference between book basis and tax basis net unrealized appreciation is attributable to the deferral of losses from wash sales.
| 22 | 1-855-612-3936 | www.cortinafunds.com |
| Notes to Financial Statements |
December 31, 2017 (Unaudited)
6. COMMITMENTS AND CONTINGENCIES
Under the Corporation’s organizational documents, its Officers and Directors are indemnified against certain liabilities arising out of the performance of their duties to the Funds. In addition, in the normal course of business, the Corporation entered into contracts with its service providers, on behalf of the Funds, and others that provide for general indemnifications. The Funds’ maximum exposure under these arrangements is unknown, as this would involve future claims that may be made against the Funds. The Funds expect risk of loss to be remote.
7. SEC REGULATIONS
On October 13, 2016, the SEC amended Regulation S-X, which will require standardized, enhanced disclosure about derivatives in investment company financial statements, as well as other amendments. . Effective August 1, 2017, the Funds adopted disclosure requirement changes for Regulation S-X and these changes are reflected throughout this report. The Funds’ adoption of those amendments, effective with the financial statements prepared as of December 31, 2017, had no effect on the Funds’ net assets or results of operations.
| Semi-Annual Report | December 31, 2017 | 23 |
| Additional Information |
December 31, 2017 (Unaudited)
1. PROXY VOTING POLICIES AND VOTING RECORD
A description of the policies and procedures that the Funds use to vote proxies relating to portfolio securities is available without charge upon request by calling toll-free 1-855-612-3936, or on the Securities and Exchange Commission’s (“SEC”) website at http://www.sec.gov. Information regarding how the Funds voted proxies relating to portfolio securities during the most recent fiscal year end June 30, 2017 is available without charge upon request by calling toll-free 1-855-612-3936, or on the SEC’s website at http://www.sec.gov.
2. QUARTERLY PORTFOLIO HOLDINGS
The Corporation files a complete listing of portfolio holdings for the Funds with the SEC as of the first and third quarters of each fiscal year on Form N-Q. The filings are available upon request by calling 1-855-612-3936. Furthermore, you may obtain a copy of the filing on the SEC’s website at http://www.sec.gov. The Funds’ Forms N-Q may also be reviewed and copied at the SEC’s Public Reference Room in Washington, D.C., and information on the operation of the Public Reference Room may be obtained by calling 1-800-SEC-0330.
| 24 | 1-855-612-3936 | www.cortinafunds.com |

Material must be accompanied or preceded by the prospectus.
The Cortina Funds are distributed by ALPS Distributors, Inc.
Item 2. Code of Ethics.
Not applicable to this report.
Item 3. Audit Committee Financial Expert.
Not applicable to this report.
Item 4. Principal Accountant Fees and Services.
Not applicable to this report.
Item 5. Audit Committee of Listed Registrants.
Not applicable to registrant.
Item 6. Investments.
| (a) | The schedule of investments is included as part of the Reports to Stockholders filed under Item 1 of this report. |
| (b) | Not applicable to the registrant. |
Item 7. Disclosure of Proxy Voting Policies and Procedures for Closed-End Management Investment Companies.
Not applicable to registrant.
Item 8. Portfolio Managers of Closed-End Management Investment Companies.
Not applicable to registrant.
Item 9. Purchases of Equity Securities by Closed-End Management Investment Company and Affiliated Purchasers.
Not applicable to registrant.
Item 10. Submission of Matters to Vote of Security Holders.
Not applicable.
Item 11. Controls and Procedures.
| (a) | The registrant’s principal executive officer and principal financial officer have concluded that the registrant’s disclosure controls and procedures (as defined in Rule 30a-3(c) under the Investment Company Act of 1940, as amended) are effective based on their evaluation of these controls and procedures as of a date within 90 days of the filing date of this report. |
| (b) | There was no change in the registrant’s internal control over financial reporting (as defined in Rule 30a-3(d) under the Investment Company Act of 1940, as amended) during the second fiscal quarter of the period covered by this report that has materially affected, or is reasonably likely to materially affect, the registrant’s internal control over financial reporting. |
Item 12. Disclosure of Securities Lending Activities for Closed-End Management Investment Companies.
Not applicable.
Item 13. Exhibits.
| (a)(1) | Not applicable to this report. |
| (a)(2) | The certifications required by Rule 30a-2(a) of the Investment Company Act of 1940, as amended, and Section 302 of the Sarbanes-Oxley Act of 2002 are attached hereto as Ex.99.Cert. |
| (b) | A certification of the registrant’s principal executive officer and principal financial officer, as required by Rule 30a-2(b) under the Investment Company Act of 1940, as amended, is attached as Ex.99.906.Cert. |
SIGNATURES
Pursuant to the requirements of the Securities Exchange Act of 1934 and the Investment Company Act of 1940, the registrant has duly caused this report to be signed on its behalf by the undersigned, thereunto duly authorized.
| | Cortina Funds, Inc. | |
| | | | |
| | By: | /s/ Jennifer Hanson | |
| | | Jennifer Hanson, President | |
| | | (Principal Executive Officer) | |
| | | | |
| | Date: | March 7, 2018 | |
Pursuant to the requirements of the Securities Exchange Act of 1934 and the Investment Company Act of 1940, this report has been signed below by the following persons on behalf of the registrant and in the capacities and on the dates indicated.
| | By: | /s/ Eric Conner | |
| | | Eric Conner, Treasurer and Principal | |
| | | Accounting Officer | |
| | | (Principal Financial Officer) | |
| | | | |
| | Date: | March 7, 2018 | |
4