UNITED STATES
SECURITIES AND EXCHANGE COMMISSION
Washington, D.C. 20549
FORM N-CSR
CERTIFIED SHAREHOLDER REPORT OF REGISTERED
MANAGEMENT INVESTMENT COMPANIES
Investment Company Act file number: 811-21580
CORTINA FUNDS, INC.
(Exact name of registrant as specified in charter)
825 N. Jefferson St., Suite 400, Milwaukee, WI 53202
(Address of principal executive offices) (Zip code)
(414) 225-7365
Registrant’s telephone number, including area code
Lori Hoch
825 N. Jefferson St., Suite 400
Milwaukee, WI 53202
(Name and address of agent for service)
Date of fiscal year end: June 30
Date of reporting period: July 1, 2014 - December 31, 2014
Item 1. Reports to Stockholders.
The following is a copy of the report to shareholders pursuant to Rule 30e-1 under the Investment Company Act of 1940 (17 CFR 270.30e-1).
TABLE OF CONTENTS
| | |

| | Shareholder Letter |
Cortina Small Cap Growth Fund | | December 31, 2014 (Unaudited) |
DEAR FELLOW SHAREHOLDERS:
A choppy market which constituted the first half of the fiscal year proved to be a challenging one for the Cortina Small Cap Growth Fund. For the six months ending December 31, 2014, the fund meaningfully underperformed the Russell 2000 Growth benchmark. The fund return was in negative territory, while the benchmark delivered a positive return. Data suggests it was a very difficult year for active managers to navigate with the continued fall in interest rates throughout 2014, being a large surprise to many investment managers. The collapse in the 10-yr yield which began 2014 at 3.00% and ended the year at 2.17% created some irregular outcomes from a sector/industry perspective, particularly considering where we are in the business cycle. In addition, many of the historical relationships of which types of stocks tend to work in parallel have broken down.
Coming into calendar year 2014, small cap stocks in general were riding high, but many, including us, grew concerned with the valuations small caps were carrying relative to the rest of the market. As the calendar year progressed, extreme outperformance of large cap stocks (as measured by the Russell 1000 Value Index) helped to correct some of the valuation disparity, but it has not yet corrected to long-term historical levels. The investment style of the Cortina Small Cap Growth Fund has a decided bias toward smaller market cap companies, and this has been a substantial headwind. In this fiscal year’s first half, large caps exhibited a continued performance edge, but it was encouraging to see small caps rally late in the year. Very strong small cap performance may be a reflection of the solid revenue growth rates put up by small companies relative to large caps in the September 2014 quarter. This divergence could be the initial influence the stronger dollar is having on multinational companies which have a much larger presence in large cap indexes.
In this fiscal period, the Cortina Small Cap Growth Fund was most severely punished by its exposure to the Energy sector. As oil prices collapsed in the second half of the year, which was exacerbated by the Organization of the Petroleum Exporting Countries’ (OPEC) decision in November to not cut production targets, most of the fund’s Energy holdings suffered severe losses. An overweight position in the sector was principally to blame, but most of the exposure was in domestic Exploration & Production stocks which, in general, were the most punished. The investment style of the managers is to avoid making large macro calls such as guessing on the direction of commodity prices, and rather the goal is to find companies that are executing to targets from the bottom up. The abrupt, severe reversal in oil prices has, in the short term, rendered any company-specific success as irrelevant. And while the exposure to the Domestic Shale Energy theme had nowhere near the exposure in the fund this period than it has had in previous periods, several other fund holdings in non-Energy sectors such as Industrials were impacted by their association to the commodity or domestic drilling activity levels.
The largest sector exposure in the fund on both an absolute and relative basis is in the Health Care sector. In this sector, dynamic change is opening up doors of opportunity for many innovative small firms. On purely an absolute basis, this semiannual period for the Health Care portion of the fund was quite additive. However, on a relative basis, the sector was a sizable drag due to large underexposure to the Biotech and Pharmaceutical sectors. The biotech industry makes up nearly 10% of our benchmark, and this period’s performance of the Biotech group was spectacular. We do not actively invest in the single-product, early-stage companies which report nothing but clinical data because the binary risk stemming from trial outcomes is too great. Very low interest rates are influencing the discount rate investors are applying to uncertain biotech company earnings which will not appear for many, many years. Biotech stock performance along with valuation parameters and the incredible amount of capital-raising activity of late resembles TMT investing in the late 1990’s.
OUTLOOK
By many accounts, we believe, 2014 will be considered a correction year for the small cap market. Valuations were high, interest rates collapsed as did oil prices, and flows into actively-managed domestic stock funds turned decidedly negative in the second half of the year. The commitment your fund managers have to their disciplines – namely preferring high growth, smaller companies which have products in the market today – no doubt did not serve fundholders well. From an economic standpoint, however, the pendulum may be swinging toward domestic-centric growth companies as U.S. economic data is turning decidedly positive while many other economies across the globe are in retreat. The portfolio is positioned in companies that should be able to deliver strong results with this type of economic backdrop. The early reporting season for the December quarter financial results has been very light from an earnings disappointment perspective. Many of the newest fund positions are competitively-positioned companies that in the not-so-distant past carried valuations that the fund managers were not comfortable with, but after the volatility of the last several quarters, have reached levels that now interest us.
Investing involves risks, including loss of principal.
The Russell 1000® Index measures the performance of the large-cap segment of the U.S. equity universe. It is a subset of the Russell 3000® Index and includes approximately 1000 of the largest securities based on a combination of their market cap and current index membership.
| | |
Semi-Annual Report | December 31, 2014 | | 1 |
| | |
| | Portfolio Information |
Cortina Small Cap Growth Fund | | December 31, 2014 (Unaudited) |
Growth of $25,000 Investment (Unaudited)
For the period from September 30, 2011 (Inception) to December 31, 2014.
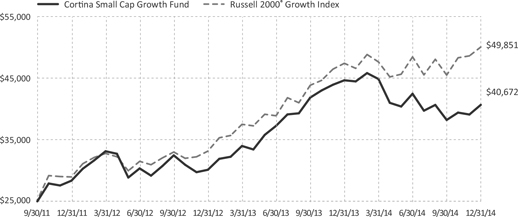
This graph assumes an initial $25,000 investment at September 30, 2011 (Inception Date). The Cortina Small Cap Growth Fund (the “Fund”) will deduct a 2.00% redemption proceeds fee on Fund shares held 60 days or less . This graph depicts the performance of the Fund versus the Russell 2000® Growth Index. It is important to note the Fund is a professionally managed mutual fund while the index is not available for investment and is unmanaged. The comparison is shown for illustrative purposes only.
This chart does not reflect the deduction of taxes that a shareholder would pay on Fund distributions or the redemption of Fund shares.
Performance Returns for the period ended December 31, 2014
| | | | | | | | | | |
| | | 6 Months | | 1 Year | | 3 Years | | Since Inception* | | Gross
Expense Ratio** |
Cortina Small Cap Growth Fund | | -4.26% | | -8.94% | | 12.78% | | 16.14% | | 1.88% |
Russell 2000® Growth Index | | 3.31% | | 5.60% | | 20.14% | | 23.64% | | |
| * | The Fund’s inception date is September 30, 2011. |
| ** | Cortina Asset Management, LLC (the “Adviser”) has contractually agreed to waive management fees and/or reimburse the Fund’s operating expenses in order to limit the Fund’s total annual fund operating expenses (excluding taxes, leverage, interest, brokerage commissions, dividends or interest expenses on short positions, acquired fund fees and expenses and extraordinary expenses) to 1.10% of average daily net assets of the Fund. The agreement will continue in effect at least through October 31, 2015, subject thereafter to annual re-approval of the agreement by the Fund’s Board of Directors. |
Past performance does not guarantee future results. The performance data quoted represents past performance and current returns may be lower or higher. Total return figures include change in share price, reinvestment of dividends and capital gains. The investment return and principal value will fluctuate so that an investor’s shares, when redeemed may be worth more or less than their original cost. To obtain performance information current to the most recent month end, call 1-855-612-3936.
Russell 2000® Growth Index measures the performance of the small-cap growth segment of the U.S. equity universe. It includes those Russell 2000 companies with higher price-to-value ratios and higher forecasted growth values. All indices are unmanaged. It is not possible to invest directly in an index.
Sector Allocations***
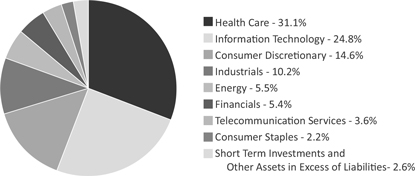
*** Percentages are based on Net Assets as of December 31, 2014. Holdings are subject to change.
| | |
2 | | 1-855-612-3936 | www.cortinafunds.com |
| | |
| | Shareholder Letter |
Cortina Small Cap Value Fund | | December 31, 2014 (Unaudited) |
DEAR FELLOW SHAREHOLDERS:
The Dog Finally Caught the Car
The close of 2014 was as volatile as the year was frustrating. The market, with big discrepancies of absolute and relative performance between equities dependent upon market cap, sectors, and yield, among other factors, confounded active managers as a whole. Maybe it is true that passive management has won the day, and active managers such as ourselves should sulk off the battlefield. And maybe not. Passive management does tend to do well later in cycles, and we believe we are approaching that stage. Seven years since the crisis, and eight years past the first indications of trouble, the aggressive Federal Reserve has accomplished something unexpected: victory. Gross Domestic Product (GDP) growth is solid and seemingly growing nicely, unemployment is below 6%, and consumers are spending more. Like the dog that caught the car, if we’ve caught escape velocity for the economy, now what? We think the volatility in the market reflects the brewing tension between the visible benefits of easy money and the likelihood of tightening monetary policy. Add in the deflation caused by the drop in the price of oil, and we have a tough situation, also known in technical terms as a pickle.
The Cortina Small Cap Value Fund posted an unremarkable, but inline with the benchmark, return for the 6 months ended December 31, 2014. Most sectors were positive contributors, but the dominant financial story of 2014 was the complete collapse of oil prices and related equities. This impacted the portfolio, but less so than the benchmark. The portfolio’s exposure to the sector was largely reduced by mid-year, thus the Energy portion of the portfolio, while negative, actually delivered a positive relative performance contribution. Industrials, many of which had some energy exposure, were also a negative contributor. The fund is now underweight both energy and industrials. Energy is clearly in the throes of a reset, while it is simply difficult to find industrial companies which do not have either large current exposure to energy or have not generated much of their recent incremental growth from US oil production.
Market Outlook and Positioning
The wise pessimist always sounds so reasonable and the giggly optimist so naive and fantastical when, in many cases, the pessimist is just cantankerous and the optimist is actually correct. To sum up, we see the likelihood of a material correction as elevated, but not necessarily imminent. The United States economy is doing remarkably well and although states such as Texas, Oklahoma, and North Dakota may suffer due to lower oil prices, most consumers should benefit from both extra cash and lower prices.
At the moment, we are quite cautious about the secondary effects of the oil price collapse, and the portfolio has reflected this for several months. As a result, we recently sold a position in a bank that we much like yet its primary business is in the state of Texas - a state we have some worries about - and we do not believe consensus recognizes the risks inherent within. Our Industrials weighting will likely remain low for the foreseeable future simply due to the immense impact that the oil boom had on the sector’s growth and our inability to find many companies without that exposure. Technology and Consumer companies are notably overweight. On a company specific basis, we recently initiated a position in a well-known and storied technology firm that emerged from bankruptcy over one year ago, has an exceptionally strong balance sheet, and, most importantly, is promising new products to be released this year. Despite our concerns about valuation in Utilities overall, we found one with well-above-average earnings growth coupled to a low payout ratio and reasonable valuation that, we believe, will result in well-above-average dividend and capital growth.
Into every market a bull is born, and even in down markets, some equities rise in value. We are seeking those companies that will do well in either up or down markets, and unlike unicorns, these have been proven to exist.
As always, we thank you for your trust in our ability to effectively manage your capital.
Investing involves risks, including loss of principal.
| | |
Semi-Annual Report | December 31, 2014 | | 3 |
| | |
| | Portfolio Information |
Cortina Small Cap Value Fund | | December 31, 2014 (Unaudited) |
Growth of $25,000 Investment (Unaudited)
For the period from September 30, 2011 (Inception) to December 31, 2014.
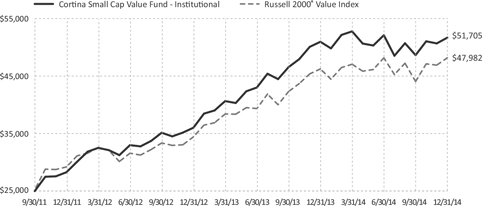
This graph assumes an initial $25,000 investment at September 30, 2011 (Inception Date). The Cortina Small Cap Value Fund Institutional share class (the “Fund”) will deduct a 2.00% redemption proceeds fee on Fund shares held 60 days or less. This graph depicts the performance of the Fund versus the Russell 2000® Value Index. It is important to note the Fund is a professionally managed mutual fund, while the index is not available for investment and is unmanaged. The comparison is shown for illustrative purposes only. Performance will vary from class to class based on differences in class-specific expenses.
This chart does not reflect the deduction of taxes that a shareholder would pay on Fund distributions or the redemption of Fund shares.
Performance Returns for the period ended December 31, 2014
| | | | | | | | | | |
| | 6 Months* | | 1 Year* | | 3 Years* | | Since
Inception* | | Gross
Expense Ratio** |
Cortina Small Cap Value Fund - Institutional | | -0.81% | | 1.42% | | 22.27% | | 25.04% | | 1.95% |
Cortina Small Cap Value Fund - Investor | | -0.97% | | 1.17% | | 21.97% | | 24.73% | | 2.17% |
Russell 2000® Value Index | | 0.01% | | 4.22% | | 18.29% | | 22.20%*** | | |
| * | The Fund’s Institutional shares inception date is September 30, 2011, Investor shares inception date is April 30, 2014. The performance shown for Investor shares for periods pre-dating the commencement of operations of that class reflects the performance of the Fund’s Institutional shares, the initial share class, calculated using the fees and expenses of Investor shares. If Investor shares of the Fund had been available during periods prior to April 30, 2014, the performance shown may have been different. |
| ** | Cortina Asset Management, LLC (the “Adviser”) has contractually agreed to waive management fees and/or reimburse the Fund’s operating expenses in order to limit the Fund’s total annual fund operating expenses (excluding 12b-1 fees, taxes, leverage, interest, brokerage commissions, dividends or interest expenses on short positions, acquired fund fees and expenses and extraordinary expenses) to 1.10% of average daily net assets of the Fund. The agreement will continue in effect at least through October 31, 2015, subject thereafter to annual re-approval of the agreement by the Fund’s Board of Directors. |
| *** | Represents the period from September 30, 2011 (date of original public offering of the Institutional shares) through December 31, 2014. |
Past performance does not guarantee future results. The performance data quoted represents past performance and current returns may be lower or higher. Total return figures include change in share price, reinvestment of dividends and capital gains. The investment return and principal value will fluctuate so that an investor’s shares, when redeemed may be worth more or less than their original cost. To obtain performance information current to the most recent month end, call 1-855-612-3936.
Russell 2000® Value Index measures the performance of those Russell 2000 companies with lower price-to-book ratios and lower forecasted growth values. All indices are unmanaged. It is not possible to invest directly in an index.
Sector Allocations****
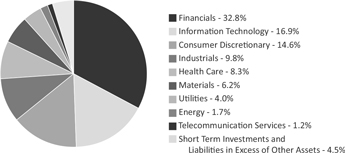
**** Percentages are based on Net Assets as of December 31, 2014. Holdings are subject to change.
| | |
4 | | 1-855-612-3936 | www.cortinafunds.com |
| | |
| | Disclosure of Fund Expenses |
| | December 31, 2014 (Unaudited) |
As a shareholder of the Fund(s), you incur ongoing costs, including management fees and other Fund expenses. This example is intended to help you understand your ongoing costs (in dollars) of investing in each Fund and to compare these costs with the ongoing costs of investing in other mutual funds. The example is based on an investment of $1,000 invested at the beginning of the period and held for the entire period, as indicated below.
Actual Expenses – The first line of the table below provides information about the actual account values and actual expenses. You may use the information in this line, together with the amount you invested, to estimate the expenses that you paid over the period. Simply divide your account value by $1,000 (for example, an $8,600 account value divided by $1,000 = 8.6) then multiply the result by the number in the first line under the heading entitled “Expenses Paid During Period” to estimate the expenses you paid on your account during this period.
Hypothetical Example for Comparison Purposes – The second line of the table below provides information about hypothetical account values and hypothetical expenses based on each Fund’s actual expense ratio and an assumed annual rate of return of 5% before expenses, which is not each Fund’s actual return. The hypothetical account values and expenses may not be used to estimate the actual ending account balance or expenses you paid for the period. You may use this information to compare the ongoing costs of investing in each Fund and other funds by comparing these 5% hypothetical examples with the 5% hypothetical examples that appear in the shareholder reports of other funds.
Please note that the expenses shown in the table are meant to highlight your ongoing costs only and do not reflect any direct costs, such as wire fees or low balance fees. Therefore, the second line of the table is useful in comparing ongoing costs and will not help you determine the relative total costs of owning different funds. In addition, if these direct costs were included, your costs would be higher.
| | | | | | | | | | | | | | | | | | | | | | | | | |
| | | Beginning
Account Value
July 1, 2014 | | Ending
Account Value
December 31, 2014 | | Expenses Paid
During Period(a) | | Net
Expense
Ratios(b) | | |
Cortina Small Cap Growth Fund - Institutional | | | | | | | | | | | | | | | | | | | |
Actual Fund Return | | | $ | 1,000.00 | | | | $ | 957. 40 | | | | $ | 5.43 | | | 1.10% | | |
Hypothetical Fund Return (assuming a 5% return before expenses) | | | $ | 1,000.00 | | | | $ | 1,019.66 | | | | $ | 5.60 | | | 1.10% | | |
Cortina Small Cap Value Fund - Institutional | | | | | | | | | | | | | | | | | | | |
Actual Fund Return | | | $ | 1,000.00 | | | | $ | 991. 40 | | | | $ | 5.52 | | | 1.10% | | |
Hypothetical Fund Return (assuming a 5% return before expenses) | | | $ | 1,000.00 | | | | $ | 1,019.66 | | | | $ | 5.60 | | | 1.10% | | |
Cortina Small Cap Value Fund - Investor | | | | | | | | | | | | | | | | | | | |
Actual Fund Return | | | $ | 1,000.00 | | | | $ | 990. 30 | | | | $ | 6.77 | | | 1.35% | | |
Hypothetical Fund Return (assuming a 5% return before expenses) | | | $ | 1,000.00 | | | | $ | 1,018.40 | | | | $ | 6.87 | | | 1.35% | | |
| (a) | Expenses are equal to the Fund’s annualized expense ratio multiplied by the average account value over the period, multiplied by the number of days in the most recent fiscal half year (184), divided by 365. |
| (b) | Annualized, based on the Fund’s most recent half-year expenses. |
| | |
Semi-Annual Report | December 31, 2014 | | 5 |
| | |
| | Schedule of Investments |
Cortina Small Cap Growth Fund | | December 31, 2014 (Unaudited) |
| | | | | | | | |
| | | Shares | | | Value | |
COMMON STOCKS (97.4%) | | | | | | | | |
Consumer Discretionary (14.6%) | | | | | | | | |
Fiesta Restaurant Group, Inc.(a) | | | 8,193 | | | $ | 498,135 | |
Five Below, Inc.(a) | | | 15,122 | | | | 617,431 | |
Gentherm, Inc.(a) | | | 5,571 | | | | 204,010 | |
IMAX Corp.(a) | | | 11,064 | | | | 341,878 | |
Kona Grill, Inc.(a) | | | 17,368 | | | | 401,027 | |
Malibu Boats, Inc., Class A(a) | | | 14,870 | | | | 286,545 | |
Motorcar Parts of America, Inc.(a) | | | 18,666 | | | | 580,326 | |
Nautilus, Inc.(a) | | | 30,862 | | | | 468,485 | |
Noodles & Co.(a) | | | 14,244 | | | | 375,329 | |
Performance Sports Group, Ltd.(a) | | | 16,112 | | | | 289,855 | |
Restoration Hardware Holdings, Inc.(a) | | | 4,791 | | | | 459,984 | |
Shutterfly, Inc.(a) | | | 8,412 | | | | 350,738 | |
Tumi Holdings, Inc.(a) | | | 20,517 | | | | 486,869 | |
Universal Electronics, Inc.(a) | | | 6,338 | | | | 412,160 | |
| | | | | | | | |
| | | | | | | 5,772,772 | |
| | | | | | | | |
Consumer Staples (2.2%) | | | | | | | | |
Boulder Brands, Inc.(a) | | | 53,569 | | | | 592,473 | |
Craft Brew Alliance, Inc.(a) | | | 20,676 | | | | 275,818 | |
| | | | | | | | |
| | | | | | | 868,291 | |
| | | | | | | | |
Energy (5.5%) | | | | | | | | |
Aegean Marine Petroleum Network, Inc. | | | 32,130 | | | | 450,463 | |
Carrizo Oil & Gas, Inc.(a) | | | 5,956 | | | | 247,770 | |
Evolution Petroleum Corp. | | | 27,284 | | | | 202,720 | |
Penn Virginia Corp.(a) | | | 29,456 | | | | 196,766 | |
Profire Energy, Inc.(a) | | | 66,981 | | | | 152,717 | |
Rex Energy Corp.(a) | | | 29,096 | | | | 148,390 | |
RigNet, Inc.(a) | | | 11,733 | | | | 481,405 | |
Sanchez Energy Corp.(a) | | | 15,418 | | | | 143,233 | |
Triangle Petroleum Corp.(a) | | | 36,784 | | | | 175,827 | |
| | | | | | | | |
| | | | | | | 2,199,291 | |
| | | | | | | | |
Financials (5.4%) | | | | | | | | |
BofI Holding, Inc.(a) | | | 4,679 | | | | 364,073 | |
eHealth, Inc.(a) | | | 13,970 | | | | 348,132 | |
EverBank Financial Corp. | | | 20,470 | | | | 390,158 | |
Health Insurance Innovations, Inc., Class A(a) | | | 36,222 | | | | 259,349 | |
Pinnacle Financial Partners, Inc. | | | 9,205 | | | | 363,966 | |
Tree.com, Inc.(a) | | | 5,228 | | | | 252,722 | |
TriState Capital Holdings, Inc.(a) | | | 17,004 | | | | 174,121 | |
| | | | | | | | |
| | | | | | | 2,152,521 | |
| | | | | | | | |
Health Care (31.1%) | | | | | | | | |
ABIOMED, Inc.(a) | | | 10,884 | | | | 414,245 | |
Adeptus Health, Inc., Class A(a) | | | 7,743 | | | | 289,588 | |
Air Methods Corp.(a) | | | 6,025 | | | | 265,281 | |
AtriCure, Inc.(a) | | | 41,288 | | | | 824,109 | |
BioTelemetry, Inc.(a) | | | 59,122 | | | | 592,994 | |
Cepheid(a) | | | 6,231 | | | | 337,346 | |
Cerus Corp.(a) | | | 51,512 | | | | 321,435 | |
Depomed, Inc.(a) | | | 18,440 | | | | 297,068 | |
Endologix, Inc.(a) | | | 30,108 | | | | 460,351 | |
HealthStream, Inc.(a) | | | 15,727 | | | | 463,632 | |
HeartWare International, Inc.(a) | | | 4,727 | | | | 347,104 | |
HMS Holdings Corp.(a) | | | 13,828 | | | | 292,324 | |
Icad, Inc.(a) | | | 42,222 | | | | 387,176 | |
Imprivata, Inc.(a) | | | 15,302 | | | | 198,926 | |
InspireMD, Inc.(a) | | | 90,529 | | | | 70,386 | |
| | |
| See Notes to Financial Statements. |
6 | | 1-855-612-3936 | www.cortinafunds.com |
| | |
| | Schedule of Investments |
Cortina Small Cap Growth Fund | | December 31, 2014 (Unaudited) |
| | | | | | | | |
| | | Shares | | | Value | |
COMMON STOCKS (continued) | | | | | | | | |
Health Care (continued) | | | | | | | | |
MiMedx Group, Inc.(a) | | | 36,814 | | | $ | 424,465 | |
NanoString Technologies, Inc.(a) | | | 31,817 | | | | 443,211 | |
Neogen Corp.(a) | | | 8,669 | | | | 429,896 | |
NeoGenomics, Inc.(a) | | | 120,897 | | | | 504,141 | |
NxStage Medical, Inc.(a) | | | 38,365 | | | | 687,884 | |
OraSure Technologies, Inc.(a) | | | 47,527 | | | | 481,924 | |
Oxford Immunotec Global PLC(a) | | | 21,979 | | | | 299,354 | |
Pernix Therapeutics Holdings, Inc.(a) | | | 36,398 | | | | 341,777 | |
Quidel Corp.(a) | | | 13,507 | | | | 390,622 | |
The Spectranetics Corp.(a) | | | 14,295 | | | | 494,321 | |
STAAR Surgical Co.(a) | | | 43,811 | | | | 399,118 | |
Streamline Health Solutions, Inc.(a) | | | 50,453 | | | | 218,462 | |
Synergetics USA, Inc.(a) | | | 82,481 | | | | 358,792 | |
Tandem Diabetes Care, Inc.(a) | | | 14,205 | | | | 180,404 | |
TearLab Corp.(a) | | | 72,016 | | | | 190,842 | |
Trinity Biotech PLC, Sponsored ADR | | | 25,634 | | | | 448,851 | |
Uroplasty, Inc.(a) | | | 29,161 | | | | 60,072 | |
Vocera Communications, Inc.(a) | | | 39,205 | | | | 408,516 | |
| | | | | | | | |
| | | | | | | 12,324,617 | |
| | | | | | | | |
Industrials (10.2%) | | | | | | | | |
The Advisory Board Co.(a) | | | 4,731 | | | | 231,724 | |
Controladora Vuela Cia de Aviacion SAB de CV, ADR(a) | | | 37,941 | | | | 342,228 | |
Forward Air Corp. | | | 6,801 | | | | 342,566 | |
Franklin Covey Co.(a) | | | 13,588 | | | | 263,064 | |
Heritage Crystal Clean, Inc.(a) | | | 19,009 | | | | 234,381 | |
Insteel Industries, Inc. | | | 19,133 | | | | 451,156 | |
Manitex International, Inc.(a) | | | 27,091 | | | | 344,327 | |
On Assignment, Inc.(a) | | | 7,516 | | | | 249,456 | |
Quality Distribution, Inc.(a) | | | 25,998 | | | | 276,619 | |
Saia, Inc.(a) | | | 7,418 | | | | 410,660 | |
Team, Inc.(a) | | | 12,076 | | | | 488,595 | |
Trex Co., Inc.(a) | | | 10,002 | | | | 425,885 | |
| | | | | | | | |
| | | | | | | 4,060,661 | |
| | | | | | | | |
Information Technology (24.8%) | | | | | | | | |
Actua Corp.(a) | | | 15,765 | | | | 291,179 | |
BroadSoft, Inc.(a) | | | 7,859 | | | | 228,068 | |
Clicksoftware Technologies, Ltd.(a) | | | 52,973 | | | | 380,346 | |
Everyday Health, Inc.(a) | | | 36,870 | | | | 543,832 | |
Extreme Networks, Inc.(a) | | | 117,563 | | | | 414,997 | |
FleetMatics Group PLC(a) | | | 5,854 | | | | 207,758 | |
Imperva, Inc.(a) | | | 10,143 | | | | 501,368 | |
Infoblox, Inc.(a) | | | 21,824 | | | | 441,063 | |
Inphi Corp.(a) | | | 36,612 | | | | 676,590 | |
Integrated Silicon Solution, Inc. | | | 25,051 | | | | 415,095 | |
Internap Corp.(a) | | | 72,248 | | | | 575,094 | |
InterXion Holding NV(a) | | | 11,690 | | | | 319,605 | |
Kofax, Ltd.(a) | | | 43,027 | | | | 302,480 | |
Marchex, Inc., Class B | | | 61,359 | | | | 281,638 | |
Mavenir Systems, Inc.(a) | | | 25,471 | | | | 345,387 | |
Numerex Corp., Class A(a) | | | 27,348 | | | | 302,469 | |
Planet Payment, Inc.(a) | | | 132,579 | | | | 275,764 | |
Procera Networks, Inc.(a) | | | 38,425 | | | | 276,276 | |
PROS Holdings, Inc.(a) | | | 17,094 | | | | 469,743 | |
Qlik Technologies, Inc.(a) | | | 6,612 | | | | 204,245 | |
RADWARE, Ltd.(a) | | | 27,331 | | | | 601,829 | |
| | |
| See Notes to Financial Statements. | | |
Semi-Annual Report | December 31, 2014 | | 7 |
| | |
| | Schedule of Investments |
Cortina Small Cap Growth Fund | | December 31, 2014 (Unaudited) |
| | | | | | | | |
| | | Shares | | | Value | |
COMMON STOCKS (continued) | | | | | | | | |
Information Technology (continued) | | | | | | | | |
Rubicon Technology, Inc.(a) | | | 39,308 | | | $ | 179,638 | |
ShoreTel, Inc.(a) | | | 53,740 | | | | 394,989 | |
TechTarget, Inc.(a) | | | 27,845 | | | | 316,598 | |
Varonis Systems, Inc.(a) | | | 11,917 | | | | 391,235 | |
WebMD Health Corp.(a) | | | 12,298 | | | | 486,386 | |
| | | | | | | | |
| | | | | | | 9,823,672 | |
| | | | | | | | |
Telecommunication Services (3.6%) | | | | | | | | |
8x8, Inc.(a) | | | 42,445 | | | | 388,796 | |
inContact, Inc.(a) | | | 66,943 | | | | 588,429 | |
RingCentral, Inc., Class A(a) | | | 30,138 | | | | 449,659 | |
| | | | | | | | |
| | | | | | | 1,426,884 | |
| | | | | | | | |
| | |
TOTAL COMMON STOCKS
(COST $35,062,675) | | | | | | | 38,628,709 | |
| | | | | | | | |
| | |
SHORT TERM INVESTMENT (0.6%) | | | | | | | | |
Daily Income Fund - Money Market Portfolio Fiduciary Class Shares, 7 Day Yield 0.010% | | | 244,624 | | | | 244,624 | |
| | | | | | | | |
| | |
TOTAL SHORT TERM INVESTMENT
(COST $244,624) | | | | | | | 244,624 | |
| | | | | | | | |
| | |
TOTAL INVESTMENTS (98.0%)
(COST $35,307,299) | | | | | | | 38,873,333 | |
| | | | | | | | |
| | |
TOTAL ASSETS IN EXCESS OF OTHER LIABILITIES (2.0%) | | | | | | | 779,496 | |
| | | | | | | | |
| | |
NET ASSETS 100.0% | | | | | | $ | 39,652,829 | |
| | | | | | | | |
| (a) | Non Income Producing Security. |
Common Abbreviations:
ADR - American Depositary Receipt.
Ltd. - Limited.
NV - Naamloze Vennootschap is the Dutch term for a public limited liability corporation.
PLC - Public Limited Company.
SAB de CV - A variable rate company.
| | |
| See Notes to Financial Statements. |
8 | | 1-855-612-3936 | www.cortinafunds.com |
| | |
| | Schedule of Investments |
Cortina Small Cap Value Fund | | December 31, 2014 (Unaudited) |
| | | | | | | | |
| | | Shares | | | Value | |
COMMON STOCKS (95.5%) | | | | | | | | |
Consumer Discretionary (14.6%) | | | | | | | | |
ANN, Inc.(a) | | | 11,060 | | | $ | 403,469 | |
Bloomin’ Brands, Inc.(a) | | | 32,362 | | | | 801,283 | |
ClubCorp Holdings, Inc. | | | 37,168 | | | | 666,422 | |
Denny’s Corp.(a) | | | 76,163 | | | | 785,241 | |
Helen of Troy, Ltd.(a) | | | 18,903 | | | | 1,229,829 | |
Orbitz Worldwide, Inc.(a) | | | 81,321 | | | | 669,272 | |
Performance Sports Group, Ltd.(a) | | | 38,673 | | | | 695,727 | |
Vera Bradley, Inc.(a) | | | 14,240 | | | | 290,211 | |
Zumiez, Inc.(a) | | | 15,128 | | | | 584,395 | |
| | | | | | | | |
| | | | | | | 6,125,849 | |
| | | | | | | | |
Energy (1.7%) | | | | | | | | |
Helix Energy Solutions Group, Inc.(a) | | | 14,834 | | | | 321,898 | |
Seventy Seven Energy, Inc.(a) | | | 77,009 | | | | 416,619 | |
| | | | | | | | |
| | | | | | | 738,517 | |
| | | | | | | | |
Financials (32.8%) | | | | | | | | |
The Bancorp, Inc.(a) | | | 48,579 | | | | 529,025 | |
Boston Private Financial Holdings, Inc. | | | 40,893 | | | | 550,829 | |
Capitol Federal Financial, Inc. | | | 38,859 | | | | 496,618 | |
CNO Financial Group, Inc. | | | 41,208 | | | | 709,602 | |
ConnectOne Bancorp, Inc. | | | 31,288 | | | | 594,472 | |
Encore Capital Group, Inc.(a) | | | 10,988 | | | | 487,867 | |
Gramercy Property Trust, Inc., REIT | | | 117,508 | | | | 810,805 | |
Hannon Armstrong Sustainable Infrastructure Capital, Inc., REIT | | | 41,559 | | | | 591,385 | |
Kennedy-Wilson Holdings, Inc. | | | 29,289 | | | | 741,012 | |
Maiden Holdings, Ltd. | | | 47,877 | | | | 612,347 | |
MB Financial, Inc. | | | 19,340 | | | | 635,513 | |
Meridian Bancorp, Inc.(a) | | | 45,327 | | | | 508,569 | |
National General Holdings Corp. | | | 42,598 | | | | 792,749 | |
OFG Bancorp | | | 33,136 | | | | 551,714 | |
PacWest Bancorp | | | 20,880 | | | | 949,205 | |
PennyMac Mortgage Investment Trust, REIT | | | 27,792 | | | | 586,133 | |
PHH Corp.(a) | | | 24,103 | | | | 577,508 | |
Square 1 Financial, Inc., Class A(a) | | | 27,892 | | | | 688,932 | |
State National Cos, Inc. | | | 36,432 | | | | 436,455 | |
Texas Capital Bancshares, Inc.(a) | | | 10,143 | | | | 551,069 | |
United Financial Bancorp, Inc. | | | 52,433 | | | | 752,938 | |
Waterstone Financial, Inc. | | | 46,881 | | | | 616,485 | |
| | | | | | | | |
| | | | | | | 13,771,232 | |
| | | | | | | | |
Health Care (8.3%) | | | | | | | | |
AngioDynamics, Inc.(a) | | | 37,469 | | | | 712,285 | |
Impax Laboratories, Inc.(a) | | | 10,966 | | | | 347,403 | |
IPC The Hospitalist Co., Inc(a) | | | 14,569 | | | | 668,571 | |
Magellan Health, Inc.(a) | | | 10,293 | | | | 617,889 | |
Phibro Animal Health Corp., Class A | | | 14,725 | | | | 464,574 | |
Prestige Brands Holdings, Inc.(a) | | | 19,283 | | | | 669,506 | |
| | | | | | | | |
| | | | | | | 3,480,228 | |
| | | | | | | | |
Industrials (9.8%) | | | | | | | | |
Celadon Group, Inc. | | | 24,433 | | | | 554,385 | |
Cubic Corp. | | | 11,955 | | | | 629,311 | |
FTI Consulting, Inc.(a) | | | 21,238 | | | | 820,424 | |
NCI Building Systems, Inc.(a) | | | 33,136 | | | | 613,679 | |
Tetra Tech, Inc. | | | 20,393 | | | | 544,493 | |
Titan International, Inc. | | | 47,226 | | | | 502,012 | |
Tutor Perini Corp.(a) | | | 18,774 | | | | 451,890 | |
| | | | | | | | |
| | | | | | | 4,116,194 | |
| | | | | | | | |
| | |
| See Notes to Financial Statements. | | |
Semi-Annual Report | December 31, 2014 | | 9 |
| | |
| | Schedule of Investments |
Cortina Small Cap Value Fund | | December 31, 2014 (Unaudited) |
| | | | | | | | |
| | | Shares | | | Value | |
COMMON STOCKS (continued) | | | | | | | | |
Information Technology (16.9%) | | | | | | | | |
ACI Worldwide, Inc.(a) | | | 43,565 | | | $ | 878,706 | |
Advanced Energy Industries, Inc.(a) | | | 29,454 | | | | 698,060 | |
Avid Technology, Inc.(a) | | | 34,009 | | | | 483,268 | |
CalAmp Corp.(a) | | | 26,073 | | | | 477,136 | |
Eastman Kodak Co.(a) | | | 14,695 | | | | 319,028 | |
EnerNOC, Inc.(a) | | | 32,376 | | | | 500,209 | |
ExlService Holdings, Inc.(a) | | | 16,711 | | | | 479,773 | |
Integrated Device Technology, Inc.(a) | | | 34,855 | | | | 683,158 | |
Itron, Inc.(a) | | | 14,483 | | | | 612,486 | |
Newport Corp.(a) | | | 25,572 | | | | 488,681 | |
Semtech Corp.(a) | | | 24,819 | | | | 684,260 | |
Tower Semiconductor, Ltd.(a) | | | 59,832 | | | | 797,560 | |
| | | | | | | | |
| | | | | | | 7,102,325 | |
| | | | | | | | |
Materials (6.2%) | | | | | | | | |
Ferro Corp.(a) | | | 42,032 | | | | 544,735 | |
Graphic Packaging Holdings Co.(a) | | | 76,199 | | | | 1,037,830 | |
Myers Industries, Inc. | | | 32,491 | | | | 571,842 | |
TimkenSteel Corp. | | | 12,070 | | | | 446,952 | |
| | | | | | | | |
| | | | | | | 2,601,359 | |
| | | | | | | | |
Telecommunication Services (1.2%) | | | | | | | | |
Cincinnati Bell, Inc.(a) | | | 161,259 | | | | 514,416 | |
| | | | | | | | |
| | |
Utilities (4.0%) | | | | | | | | |
ALLETE, Inc. | | | 8,689 | | | | 479,111 | |
Black Hills Corp. | | | 11,840 | | | | 627,994 | |
Chesapeake Utilities Corp. | | | 12,012 | | | | 596,516 | |
| | | | | | | | |
| | | | | | | 1,703,621 | |
| | | | | | | | |
| | |
TOTAL COMMON STOCKS
(COST $36,868,909) | | | | | | | 40,153,741 | |
| | | | | | | | |
| | |
SHORT TERM INVESTMENT (5.0%) | | | | | | | | |
Daily Income Fund-Money Market Portfolio Fiduciary Class Shares, 7 Day Yield 0.010% | | | 2,098,962 | | | | 2,098,962 | |
| | | | | | | | |
TOTAL SHORT TERM INVESTMENT
(COST $2,098,962) | | | | | | | 2,098,962 | |
| | | | | | | | |
| | |
TOTAL INVESTMENTS (100.5%)
(COST $38,967,871) | | | | | | | 42,252,703 | |
| | | | | | | | |
| | |
TOTAL LIABILITIES IN EXCESS OF OTHER ASSETS (-0.5%) | | | | | | | (227,686 | ) |
| | | | | | | | |
| | |
NET ASSETS 100.0% | | | | | | $ | 42,025,017 | |
| | | | | | | | |
| (a) | Non Income Producing Security. |
Common Abbreviations:
Ltd. - Limited.
REIT - Real Estate Investment Trust.
| | |
| See Notes to Financial Statements. |
10 | | 1-855-612-3936 | www.cortinafunds.com |
| | |

| | Statements of Assets and Liabilities |
| | December 31, 2014 (Unaudited) |
| | | | | | | | |
| | | Cortina Small Cap
Growth Fund | | | Cortina Small Cap
Value Fund | |
| | | | |
ASSETS: | | | | | | | | |
Investments, at value (Cost - see below) | | $ | 38,873,333 | | | $ | 42,252,703 | |
Receivable for investments sold | | | 935,617 | | | | 60,291 | |
Receivable for fund shares subscribed | | | 41,605 | | | | 39,135 | |
Dividends receivable | | | 6 | | | | 58,594 | |
Prepaid expenses and other assets | | | 17,801 | | | | 24,789 | |
| | | | |
Total Assets | | | 39,868,362 | | | | 42,435,512 | |
| | | | |
| | |
LIABILITIES: | | | | | | | | |
Payable for investments purchased | | | 111,188 | | | | 373,608 | |
Payable for fund shares redeemed | | | 67,253 | | | | – | |
Payable for director fees | | | 596 | | | | 596 | |
Payable for advisory fees | | | 14,320 | | | | 14,951 | |
Payable for fund accounting and administration fees | | | 8,571 | | | | 8,979 | |
Payable for distribution and service fees | | | – | | | | 56 | |
Payable for audit and legal fees | | | 5,524 | | | | 5,361 | |
Other accrued liabilities and expenses | | | 8,081 | | | | 6,944 | |
| | | | |
Total Liabilities | | | 215,533 | | | | 410,495 | |
| | | | |
Net Assets | | $ | 39,652,829 | | | $ | 42,025,017 | |
| | | | |
| | |
NET ASSETS CONSISTS OF: | | | | | | | | |
Paid-in capital | | $ | 37,549,078 | | | $ | 38,943,768 | |
Accumulated net investment loss | | | (175,453) | | | | (58,089) | |
Accumulated undistributed net realized loss on investments | | | (1,286,830) | | | | (145,494) | |
Net unrealized appreciation on investments | | | 3,566,034 | | | | 3,284,832 | |
| | | | |
Net Assets | | $ | 39,652,829 | | | $ | 42,025,017 | |
| | | | |
| | |
Cost of Investments | | $ | 35,307,299 | | | $ | 38,967,871 | |
| | |
PRICING OF SHARES: | | | | | | | | |
Institutional | | | | | | | | |
Net Assets | | $ | 39,652,829 | | | $ | 41,754,527 | |
Shares Outstanding ($ 0.01 par value, unlimited number of shares authorized) | | | 2,668,783 | | | | 2,301,345 | |
Net Asset Value, offering and redemption price per share | | $ | 14.86 | | | $ | 18.14 | |
Investor | | | | | | | | |
Net Assets | | | – | | | | 270,490 | |
Shares Outstanding ($ 0.01 par value, unlimited number of shares authorized) | | | – | | | | 14,928 | |
Net Asset Value, offering and redemption price per share | | | – | | | | 18.12 | |
| | |
| See Notes to Financial Statements. | | |
Semi-Annual Report | December 31, 2014 | | 11 |
| | |
| | Statements of Operations |
| | For the Six Months Ended December 31, 2014 (Unaudited) |
| | | | | | | | |
| | | Cortina Small Cap
Growth Fund | | | Cortina Small Cap
Value Fund | |
| | | | |
INVESTMENT INCOME: | | | | | | | | |
Dividends, (net of foreign withholding taxes of $– and $392) | | $ | 16,434 | | | $ | 219,159 | |
| | | | |
Total Investment Income | | | 16,434 | | | | 219,159 | |
| | | | |
| | |
EXPENSES: | | | | | | | | |
Advisory fees (Note 3) | | | 174,443 | | | | 186,872 | |
Transfer agent fees | | | 17,531 | | | | 19,792 | |
Fund accounting and administration fees and expenses | | | 52,376 | | | | 54,659 | |
Distribution and service fees | | | | | | | | |
Investor | | | – | | | | 184 | |
Legal fees | | | 8,418 | | | | 9,070 | |
Printing fees | | | 2,891 | | | | 3,595 | |
Registration fees | | | 12,372 | | | | 19,808 | |
Audit and tax preparation fees | | | 7,310 | | | | 7,310 | |
Custodian fees | | | 2,692 | | | | 2,749 | |
Insurance | | | 4,241 | | | | 4,206 | |
Director fee and expenses | | | 5,096 | | | | 5,096 | |
Other | | | 3,542 | | | | 3,668 | |
| | | | |
Total Expenses Before Waivers | | | 290,912 | | | | 317,009 | |
Less fees waived by Adviser (Note 3) | | | (99,025 | ) | | | (111,264 | ) |
| | | | |
Total Net Expenses | | | 191,887 | | | | 205,745 | |
| | | | |
Net Investment Income/(Loss) | | | (175,453 | ) | | | 13,414 | |
| | | | |
| | |
REALIZED AND UNREALIZED GAIN/(LOSS) ON INVESTMENTS: | | | | | | | | |
Net realized gain/(loss) on investments | | | (835,260 | ) | | | 875,061 | |
Net change in unrealized depreciation on investments | | | (202,726 | ) | | | (1,049,978 | ) |
| | | | |
Net Realized and Unrealized Loss on Investments | | | (1,037,986 | ) | | | (174,917 | ) |
| | | | |
Net Decrease in Net Assets Resulting from Operations | | $ | (1,213,439 | ) | | $ | (161,503 | ) |
| | | | |
| | |
| See Notes to Financial Statements. |
12 | | 1-855-612-3936 | www.cortinafunds.com |
| | |
| | Statements of Changes in Net Assets |
| | |
| | | | | | | | | | | | | | | | |
| | | Cortina Small Cap Growth Fund | | | Cortina Small Cap Value Fund | |
| | | | |
| | | Six Months Ended
December 31, 2014
(Unaudited) | | | Year Ended
June 30, 2014 | | | Six Months Ended
December 31, 2014
(Unaudited) | | | Year Ended
June 30, 2014 | |
| |
| | | | |
OPERATIONS: | | | | | | | | | | | | | | | | |
Net investment income/(loss) | | $ | (175,453) | | | $ | (294,323) | | | $ | 13,414 | | | $ | (20,837) | |
Net realized gain/(loss) on investments | | | (835,260) | | | | 2,089,748 | | | | 875,061 | | | | (95,500) | |
Net change in unrealized appreciation/(depreciation) of investments | | | (202,726) | | | | 900,021 | | | | (1,049,978) | | | | 3,521,125 | |
| | | | |
Net increase/(decrease) in net assets resulting from operations | | | (1,213,439) | | | | 2,695,446 | | | | (161,503) | | | | 3,404,788 | |
| | | | |
| | | | |
DISTRIBUTIONS TO SHAREHOLDERS: | | | | | | | | | | | | | | | | |
Institutional | | | | | | | | | | | | | | | | |
From net investment income | | | – | | | | – | | | | – | | | | (14,778) | |
From net realized gains on investments | | | (1,833,184) | | | | (243,543) | | | | (816,791) | | | | (315,887) | |
Investor | | | | | | | | | | | | | | | | |
From net realized gains on investments | | | – | | | | – | | | | (5,280) | | | | – | |
| | | | |
Total distributions | | | (1,833,184) | | | | (243,543) | | | | (822,071) | | | | (330,665) | |
| | | | |
| | | | |
CAPITAL SHARE TRANSACTIONS: | | | | | | | | | | | | | | | | |
Institutional | | | | | | | | | | | | | | | | |
Proceeds from sale of shares | | | 13,032,263 | | | | 18,446,886 | | | | 8,614,116 | | | | 30,499,453 | |
Shares issued in reinvestment of distributions | | | 1,817,180 | | | | 241,505 | | | | 786,261 | | | | 314,553 | |
Cost of shares redeemed | | | (3,807,497) | | | | (7,728,013) | | | | (1,504,309) | | | | (3,386,811) | |
Redemption fees | | | 19 | | | | 330 | | | | 20 | | | | – | |
| | | | |
Total | | | 11,041,965 | | | | 10,960,708 | | | | 7,896,088 | | | | 27,427,195 | |
| | | | |
Investor | | | | | | | | | | | | | | | | |
Proceeds from sale of shares | | | – | | | | – | | | | 162,330 | | | | 100,000 | |
Shares issued in reinvestment of distributions | | | – | | | | – | | | | 5,280 | | | | – | |
| | | | |
Total | | | – | | | | – | | | | 167,610 | | | | 100,000 | |
| | | | |
Net increase from capital shares transactions | | | 11,041,965 | | | | 10,960,708 | | | | 8,063,698 | | | | 27,527,195 | |
| | | | |
| | | | |
Net increase in net assets | | | 7,995,342 | | | | 13,412,611 | | | | 7,080,124 | | | | 30,601,318 | |
| | | | |
| | | | |
NET ASSETS: | | | | | | | | | | | | | | | | |
Beginning of period | | | 31,657,487 | | | | 18,244,876 | | | | 34,944,893 | | | | 4,343,575 | |
| | | | |
End of period | | $ | 39,652,829 | | | $ | 31,657,487 | | | $ | 42,025,017 | | | $ | 34,944,893 | |
| | | | |
Including accumulated net investment loss of: | | $ | (175,453) | | | $ | – | | | $ | (58,089) | | | $ | (71,503) | |
| | | | |
OTHER INFORMATION: | | | | | | | | | | | | | | | | |
Share Transactions: | | | | | | | | | | | | | | | | |
Institutional | | | | | | | | | | | | | | | | |
Beginning shares | | | 1,936,011 | | | | 1,261,863 | | | | 1,865,870 | | | | 278,108 | |
Shares sold | | | 860,045 | | | | 1,128,073 | | | | 476,112 | | | | 1,757,108 | |
Shares issued in reinvestment of dividends | | | 124,464 | | | | 14,654 | | | | 43,633 | | | | 17,802 | |
Less shares redeemed | | | (251,738) | | | | (468,579) | | | | (84,270) | | | | (187,148) | |
| | | | |
Ending shares | | | 2,668,782 | | | | 1,936,011 | | | | 2,301,345 | | | | 1,865,870 | |
| | | | |
Investor | | | | | | | | | | | | | | | | |
Beginning shares | | | – | | | | – | | | | 5,510 | | | | – | |
Shares sold | | | – | | | | – | | | | 9,125 | | | | 5,510 | |
Shares issued in reinvestment of dividends | | | – | | | | – | | | | 293 | | | | – | |
| | | | |
Ending shares | | | – | | | | – | | | | 14,928 | | | | 5,510 | |
| | | | |
| | |
| See Notes to Financial Statements. | | |
Semi-Annual Report | December 31, 2014 | | 13 |
| | |
| | Financial Highlights |
Cortina Small Cap Growth Fund | | For a share outstanding throughout the periods presented. |
| | | | | | | | |
| | | Six Months Ended
December 31, 2014
(Unaudited) | | Year Ended
June 30, 2014 | | Year Ended
June 30, 2013 | | For the Period
September 30, 2011
(Inception) to
June 30, 2012 |
|
NET ASSET VALUE, BEGINNING OF PERIOD | | $16.35 | | $14.46 | | $11.87 | | $10.00 |
INCOME/(LOSS) FROM INVESTMENT OPERATIONS: | | | | | | | | |
Net investment loss(a) | | (0.08) | | (0.17) | | (0.13) | | (0.09) |
Net realized and unrealized gain/(loss) on investments | | (0.63) | | 2.19 | | 2.81 | | 2.22 |
| | |
Total from Investment Operations | | (0.71) | | 2.02 | | 2.68 | | 2.13 |
| | |
| | | | |
DIVIDENDS AND DISTRIBUTIONS TO SHAREHOLDERS: | | | | | | | | |
From net realized gains on investments | | (0.78) | | (0.13) | | (0.09) | | (0.26) |
| | |
Total Dividends and Distributions to Shareholders | | (0.78) | | (0.13) | | (0.09) | | (0.26) |
| | |
| | | | |
Paid-in Capital from Redemption Fees | | 0.00(b) | | 0.00(b) | | – | | 0.00(b) |
| | |
| | | | |
NET INCREASE/(DECREASE) IN NET ASSET VALUE | | (1.49) | | 1.89 | | 2.59 | | 1.87 |
| | |
| | | | |
NET ASSET VALUE, END OF PERIOD | | $14.86 | | $16.35 | | $14.46 | | $11.87 |
| | |
| | | | |
TOTAL RETURN | | (4.26%)(c) | | 13.99% | | 22.79% | | 21.40%(c) |
| | | | |
RATIOS AND SUPPLEMENTAL DATA: | | | | | | | | |
Net assets, end of period (in 000s) | | $39,653 | | $31,657 | | $18,245 | | $1,410 |
| | | | |
RATIOS TO AVERAGE NET ASSETS: | | | | | | | | |
Operating expenses excluding waiver/reimbursement | | 1.67%(d) | | 1.86% | | 3.85% | | 21.70%(d) |
Operating expenses including waiver/reimbursement | | 1.10%(d) | | 1.10% | | 1.10% | | 1.10%(d) |
Net investment loss including waiver/reimbursement | | (1.01)%(d) | | (1.02)% | | (1.00)% | | (0.99)%(d) |
| | | | |
PORTFOLIO TURNOVER RATE | | 35% | | 81% | | 73% | | 144% |
| (a) | Calculated using average shares throughout the period. |
| (b) | Less than $0.005 per share. |
| | |
See Notes to Financial Statements. |
14 | | 1-855-612-3936 | www.cortinafunds.com |
| | |
| | Financial Highlights |
Cortina Small Cap Value Fund – Institutional | | For a share outstanding throughout the periods presented. |
| | | | | | | | |
| | | Six Months Ended
December 31, 2014
(Unaudited) | | Year Ended
June 30, 2014 | | Year Ended
June 30, 2013 | | For the Period
September 30, 2011
(Inception) to
June 30, 2012 |
|
NET ASSET VALUE, BEGINNING OF PERIOD | | $18.67 | | $15.62 | | $12.54 | | $10.00 |
INCOME/(LOSS) FROM INVESTMENT OPERATIONS: | | | | | | | | |
Net investment income/(loss)(a) | | 0.01 | | (0.01) | | 0.01 | | (0.03) |
Net realized and unrealized gain/(loss) on investments | | (0.17) | | 3.30 | | 3.68 | | 3.14 |
| | |
Total from Investment Operations | | (0.16) | | 3.29 | | 3.69 | | 3.11 |
| | |
| | | | |
DIVIDENDS AND DISTRIBUTIONS TO SHAREHOLDERS: | | | | | | | | |
From net investment income | | – | | (0.01) | | (0.07) | | – |
From net realized gains on investments | | (0.37) | | (0.23) | | (0.54) | | (0.57) |
| | |
Total Dividends and Distributions to Shareholders | | (0.37) | | (0.24) | | (0.61) | | (0.57) |
| | |
| | | | |
Paid-in Capital from Redemption Fees | | 0.00(b) | | – | | – | | 0.00(b) |
| | |
| | | | |
NET INCREASE/(DECREASE) IN NET ASSET VALUE | | (0.53) | | 3.05 | | 3.08 | | 2.54 |
| | |
| | | | |
NET ASSET VALUE, END OF PERIOD | | $18.14 | | $18.67 | | $15.62 | | $12.54 |
| | |
| | | | |
TOTAL RETURN | | (0.86%)(c)(d) | | 21.14% | | 30.41% | | 31.99%(c) |
| | | | |
RATIOS AND SUPPLEMENTAL DATA: | | | | | | | | |
Net assets, end of period (in 000s) | | $41,755 | | $34,842 | | $4,344 | | $1,942 |
| | | | |
RATIOS TO AVERAGE NET ASSETS: | | | | | | | | |
Operating expenses excluding waiver/reimbursement | | 1.70%(e) | | 1.92% | | 5.55% | | 22.37%(e) |
Operating expenses including waiver/reimbursement | | 1.10%(e) | | 1.10% | | 1.10% | | 1.10%(e) |
Net investment income/(loss) including waiver/reimbursement | | 0.07%(e) | | (0.09)% | | 0.10% | | (0.32)%(e) |
| | | | |
PORTFOLIO TURNOVER RATE | | 48% | | 78% | | 81% | | 146% |
| (a) | Calculated using average shares throughout the period. |
| (b) | Less than $0.005 per share. |
| (d) | Performance difference between Manager Discussion & Analysis and Financial Highlights is due to financial reporting adjustments. |
| | | | |
See Notes to Financial Statements. | | | | |
Semi-Annual Report | December 31, 2014 | | | 15 | |
| | |
| | Financial Highlights |
Cortina Small Cap Value Fund – Investor | | For a share outstanding throughout the periods presented. |
| | | | |
| | | Six Months Ended
December 31, 2014
(Unaudited) | | For the Period
April 30, 2014
(Inception) to
June 30, 2014 |
|
NET ASSET VALUE, BEGINNING OF PERIOD | | $18.67 | | $18.15 |
INCOME/(LOSS) FROM INVESTMENT OPERATIONS: | | | | |
Net investment loss(a) | | (0.01) | | (0.01) |
Net realized and unrealized gain/(loss) on investments | | (0.17) | | 0.53 |
| | |
Total from Investment Operations | | (0.18) | | 0.52 |
| | |
| | |
DIVIDENDS AND DISTRIBUTIONS TO SHAREHOLDERS: | | | | |
From net realized gains on investments | | (0.37) | | – |
| | |
Total Dividends and Distributions to Shareholders | | (0.37) | | – |
| | |
| | |
Paid-in Capital from Redemption Fees | | – | | – |
| | |
| | |
NET INCREASE/(DECREASE) IN NET ASSET VALUE | | (0.55) | | 0.52 |
| | |
| | |
NET ASSET VALUE, END OF PERIOD | | $18.12 | | $18.67 |
| | |
| | |
TOTAL RETURN | | (0.97%)(b) | | 2.87%(b) |
| | |
RATIOS AND SUPPLEMENTAL DATA: | | | | |
Net assets, end of period (in 000s) | | $270 | | $103 |
| | |
RATIOS TO AVERAGE NET ASSETS: | | | | |
Operating expenses excluding waiver/reimbursement | | 1.95%(c) | | 2.14%(c) |
Operating expenses including waiver/reimbursement | | 1.35%(c) | | 1.35%(c) |
Net investment loss including waiver/reimbursement | | (0.09)%(c) | | (0.20)%(c) |
| | |
PORTFOLIO TURNOVER RATE | | 48% | | 78%(d) |
| (a) | Calculated using average shares throughout the period. |
| (d) | Portfolio turnover is calculated at the Fund level and represents the year ended June 30, 2014. |
| | |
See Notes to Financial Statements. |
16 | | 1-855-612-3936 | www.cortinafunds.com |
| | |
| | Notes to Financial Statements |
| | December 31, 2014 (Unaudited) |
1. ORGANIZATION
Cortina Funds, Inc. (the “Corporation”) is an open-end management investment company registered under the Investment Company Act of 1940, as amended (the “1940 Act”). The Corporation was organized on December 31, 2004 as a Wisconsin corporation. The Corporation currently offers shares of common stock (“shares”) of the Cortina Small Cap Growth Fund and the Cortina Small Cap Value Fund (each a “Fund” and collectively, the “Funds”).
The Cortina Small Cap Growth Fund, which commenced operations with the sale of Institutional Class Shares on September 30, 2011, is a diversified portfolio with an investment objective to seek growth of capital. The Cortina Small Cap Value Fund, which commenced operations with the sale of Institutional Class Shares on September 30, 2011 and the sale of Investor Class Shares on April 30, 2014, is a diversified portfolio with an investment objective to seek long-term capital appreciation.
Shares of each Fund are designated as Institutional Shares or Investor Shares with an indefinite number of shares authorized at $0.01 par value. The Articles of Incorporation, as amended and restated, permit the Corporation’s Board of Directors (the “Board”) to create additional funds and share classes.
2. SIGNIFICANT ACCOUNTING POLICIES
The following is a summary of significant accounting policies followed by the Funds. These policies are in conformity with U.S. generally accepted accounting principles (“GAAP”). The Funds are considered investment companies for financial reporting purposes under GAAP.
Use of Estimates — The accompanying financial statements were prepared in accordance with GAAP, which require the use of estimates and assumptions made by management. These may affect the reported amounts of assets and liabilities and disclosure of contingent assets and liabilities at the date of the financial statements and the reported amounts of increases and decreases in net assets from operations during the reporting period. Actual results could differ from those estimates.
Investment Valuation — Investment securities are valued at the last sale price at the close of the principal exchange on which they trade, except for securities listed on the National Association of Securities Dealers Automated Quotations (“NASDAQ”) exchange, which are valued at the NASDAQ official closing price. Unlisted securities or listed securities for which there were no sales during the day are valued at the closing bid price on such exchanges or over-the-counter markets. Investments for which market quotations are not readily available are valued at fair value as determined in good faith under consistently applied procedures approved by and under the general supervision of the Funds’ Board.
Investment Transactions — Investment security transactions are accounted for on trade date. Gains and losses on securities sold are determined on a specific identification basis.
Investment Income — Interest income is accrued and recorded on a daily basis including amortization of premiums, accretions of discounts and income earned from money market funds. Interest is not accrued on securities that are in default. Dividend income is recorded on the ex-dividend date. Withholding taxes on foreign dividends have been provided for in accordance with a Fund’s understanding of the applicable country’s tax rules and rates.
Fair Value Measurements — A three-tier hierarchy has been established to classify fair value measurements for disclosure purposes. Inputs refer broadly to the assumptions that market participants would use in pricing the asset or liability, including assumptions about risk. Inputs may be observable or unobservable. Observable inputs are inputs that reflect the assumptions market participants would use in pricing the asset or liability that are developed based on market data obtained from sources independent of the reporting entity. Unobservable inputs are inputs that reflect the reporting entity’s own assumptions about the assumptions market participants would use in pricing the asset or liability that are developed based on the best information available. In accordance with the authoritative guidance on fair value measurements and disclosure under GAAP, the Funds disclose fair value of their investments in a hierarchy that prioritizes the inputs to valuation techniques used to measure the fair value.
Various inputs are used in determining the value of each Funds’ investments as of the reporting period end. The designated input levels are not necessarily an indication of the risk or liquidity associated with these investments. These inputs are categorized in the following hierarchy under applicable financial accounting standards:
| | |
| Level 1 — | | Unadjusted quoted prices in active markets for identical, unrestricted assets or liabilities that the Funds have the ability to access at the measurement date; |
| |
| Level 2 — | | Quoted prices which are not active, quoted prices for similar assets or liabilities in active markets or inputs other than quoted prices that are observable (either directly or indirectly) for substantially the full term of the asset or liability; and |
| | |
Semi-Annual Report | December 31, 2014 | | 17 |
| | |
| | Notes to Financial Statements |
| | December 31, 2014 (Unaudited) |
| | |
| |
| Level 3 — | | Significant unobservable prices or inputs (including a Fund’s own assumptions in determining the fair value of investments) where there is little or no market activity for the asset or liability at the measurement date. |
The availability of observable inputs can vary from security to security and is affected by a wide variety of factors, including, for example, the type of security, whether the security is new and not yet established in the marketplace, the liquidity of markets, and other characteristics particular to the security. To the extent that valuation is based on models or inputs that are less observable or unobservable in the market, the determination of fair value requires more judgment. Accordingly, the degree of judgment exercised in determining fair value is greatest for instruments categorized in Level 3.
An investment level within the fair value hierarchy is based on the lowest level input, individually or in the aggregate, that is significant to fair value measurement. The valuation techniques used by the Funds to measure fair value during the period ended December 31, 2014 maximized the use of observable inputs and minimized the use of unobservable inputs.
The inputs or methodology used for valuing securities are not necessarily an indication of the risk or liquidity associated with investing in those securities. The following is a summary of the inputs used in valuing the Funds’ investments as of December 31, 2014:
Cortina Small Cap Growth Fund
| | | | | | | | | | | | | | | | |
| | | Valuation Inputs | | | | |
| Investments in Securities at Value* | | Level 1 | | | Level 2 | | | Level 3 | | | Total | |
| |
Common Stocks | | $ | 38,628,709 | | | $ | – | | | $ | – | | | $ | 38,628,709 | |
Short Term Investment | | | 244,624 | | | | – | | | | – | | | | 244,624 | |
| | | | |
Total | | $ | 38,873,333 | | | $ | – | | | $ | – | | | $ | 38,873,333 | |
| | | | |
Cortina Small Cap Value Fund
| | | | | | | | | | | | | | | | |
| | | Valuation Inputs | | | | |
| Investments in Securities at Value* | | Level 1 | | | Level 2 | | | Level 3 | | | Total | |
| |
Common Stocks | | $ | 40,153,741 | | | $ | – | | | $ | – | | | $ | 40,153,741 | |
Short Term Investment | | | 2,098,962 | | | | – | | | | – | | | | 2,098,962 | |
| | | | |
Total | | $ | 42,252,703 | | | $ | – | | | $ | – | | | $ | 42,252,703 | |
| | | | |
| * | See Schedule of Investments for sector classification. |
For the six months ended December 31, 2014, there have been no significant changes to the Funds’ fair value methodologies. Additionally, there were no transfers into or out of Levels 1 and 2 during the six months ended December 31, 2014. It is the Funds’ policy to recognize transfers at the end of the reporting period.
For the six months ended December 31, 2014, the Funds did not have investments with significant unobservable inputs (Level 3) used in determining fair value.
Affiliated Companies — An affiliated company is a company that can have direct or indirect common ownership. The Funds do not hold any investments in affiliated companies as of and during the six months ended December 31, 2014.
Expenses — The Funds bear expenses incurred specifically on each Fund’s respective behalf as well as a portion of general Corporation expenses, which may be allocated on the basis of relative net assets or the nature of the services performed relative to applicability to each Fund.
Expenses that are specific to a class of shares of the Funds are charged directly to the share class. The Funds’ realized and unrealized gains and losses, net investment income, and expenses other than class specific expenses, are allocated daily to each class in proportion to its average daily net assets.
Distributions to Shareholders — Dividends from net investment income and distributions of net realized capital gains, if any, will be declared and paid at least annually. Income and capital gains distributions are determined in accordance with income tax regulations, which may differ from GAAP. Distributions to shareholders are recorded on the ex-dividend date.
Fees on Redemptions — The Funds will deduct a 2.00% redemption proceeds fee on Fund shares held 60 days or less. The redemption fee is not a fee to finance sales or sales promotion expenses, but is paid to the Funds to defray the costs of liquidating an investor and discouraging short-term trading of the Funds’ shares. No redemption fee will be imposed on redemptions initiated by the Funds.
| | |
18 | | 1-855-612-3936 | www.cortinafunds.com |
| | |
| | Notes to Financial Statements |
| | December 31, 2014 (Unaudited) |
Federal Income Taxes — As of and during the six months ended December 31, 2014, the Funds did not have a liability for any unrecognized tax benefits. The Funds file U.S. federal, state, and local tax returns as required. The Funds’ tax returns are subject to examination by the relevant tax authorities until expiration of the applicable statute of limitations which is generally three years after the filing of the tax return for federal purposes and four years for most state returns. Tax returns for open years have incorporated no uncertain tax positions that require a provision for income taxes. The Funds intend to distribute to shareholders all taxable investment income and realized gains, and otherwise comply with Subchapter M of the Internal Revenue Code of 1986, as amended, applicable to regulated investment companies.
3. ADVISORY FEES, FUND ACCOUNTING, ADMINISTRATION FEES, AND OTHER AGREEMENTS
Investment Advisor
The Adviser is subject to the general supervision of the Board and is responsible for the overall management of the Funds’ business affairs. The Adviser invests the assets of the Funds based on the Funds’ investment objectives and policies. The Adviser is entitled to an investment advisory fee, computed daily and payable monthly, of 1.00% of the average daily net assets for each Fund.
The Adviser has contractually agreed to waive fees with respect to each of the Funds so that the net annual operating expenses (excluding 12b-1 fee, taxes, leverage, interest, brokerage commissions, dividends or interest expenses on short positions, acquired fund fees and expenses, and extraordinary expenses) of the Funds’ shares will not exceed 1.10% of average daily net assets of each Fund. The Adviser may request a reimbursement from the Funds to recapture any reduced management fees or reimbursed Fund expenses within three years following the fee reduction or expense reimbursement, but only to the extent the Funds’ total annual fund operating expenses including offering costs, plus any requested reimbursement amount, including previously waived organizational costs, are less than the above limit at the time of the request. Any such reimbursement is subject to review by the Board.
As of December 31, 2014, reimbursements (including offering costs and the previously waived organizational costs) that may potentially be made by the Fund to the Adviser total $649,090 for the Cortina Small Cap Growth Fund and $487,424 for the Cortina Small Cap Value Fund expire as follows:
| | | | | | | | |
| Cortina Small Cap Growth Fund | | | | | | | |
|
June 30, 2015 | | | | | 163,407 | | | |
June 30, 2016 | | | | | 268,118 | | | |
June 30, 2017 | | | | | 217,565 | | | |
| | |
| | | | $ | 649,090 | | | |
| | | |
| Cortina Small Cap Value Fund | | | | | | | |
|
June 30, 2015 | | | | | 152,715 | | | |
June 30, 2016 | | | | | 140,394 | | | |
June 30, 2017 | | | | | 194,315 | | | |
| | |
| | | | $ | 487,424 | | | |
Fund Accounting Fees and Expenses
ALPS Fund Services, Inc. (“ALPS” or the “Administrator”) provides administrative, fund accounting and other services to the Funds for a monthly administration fee based on the Funds’ average daily net assets at the following annual rates.
| | | | | | |
Average Daily
Net Assets | | | | Basis Point
Fee Rate | | |
|
Between $0-$500M | | | | 5.0 | | |
$500M-$1B | | | | 3.0 | | |
Above $1B | | | | 2.0 | | |
Annual Fee
Greater of $200,320 annual minimum or the above basis point fee schedule.
The Administrator is also reimbursed by the Funds for certain out-of-pocket expenses.
Transfer Agent
ALPS serves as transfer, dividend paying and shareholder servicing agent for the Funds (the “Transfer Agent”).
| | |
Semi-Annual Report | December 31, 2014 | | 19 |
| | |
| | Notes to Financial Statements |
| | December 31, 2014 (Unaudited) |
Compliance Services
ALPS provides services that assist the Corporation’s Chief Compliance Officer in monitoring and testing the policies and procedures of the Corporation in conjunction with requirements under Rule 38a-1 under the 1940 Act. ALPS is compensated under the Administration Agreement.
Distributor
The Funds have entered into a Distribution Agreement with ALPS Distributors, Inc (“the Distributor”) to provide distribution services to the Funds. The Distributor serves as underwriter/distributor of shares of the Funds.
Distribution Plan
The Small Cap Value Fund has adopted a Distribution Plan in accordance with Rule 12b-1 (“Distribution Plan”) under the 1940 Act. The Distribution Plan provides that the Fund may compensate or reimburse the Distributor for services rendered and expenses borne in connection with activities primarily intended to result in the sale of the Fund’s shares. Sales charges may be paid to broker-dealers, banks and any other financial intermediary eligible to receive such fees for sales of Investor Shares of the Fund and for services provided to shareholders.
The Fund charges 12b-1 fees for Investor Shares. Pursuant to the Distribution Plan, the Fund may annually pay the Distributor up to 0.25% of the average daily net assets of the Fund’s Investor Shares. The expenses of the Distribution Plan are reflected in the Statements of Operations.
Certain Directors and Officers of the Funds are also officers of the Adviser.
4. PURCHASES AND SALES OF INVESTMENT SECURITIES
The aggregate cost of purchases and proceeds from sales of investment securities, excluding short-term securities, are shown below for the six months ended December 31, 2014. Purchases and proceeds from sales of U.S. Government obligations are included in the totals of Purchases of Securities and Proceeds from Sales of Securities below and also broken out separately for your convenience:
| | | | | | | | |
| Fund Name | | Purchases | | | Sales | |
Cortina Small Cap Growth Fund | | $ | 18,454,386 | | | $ | 12,198,626 | |
Cortina Small Cap Value Fund | | | 23,323,004 | | | | 16,931,492 | |
There were no purchases of long-term U.S. Government Obligations for either Fund during the six months ended December 31, 2014.
5. TAX BASIS INFORMATION
Income and long-term capital gain distributions are determined in accordance with Federal income tax regulations, which differ from GAAP, and, therefore, may differ significantly in amount or character from net investment income and realized gains for financial reporting purposes.
The tax character of distributions paid during the year ended June 30, 2014, were as follows:
| | | | | | | | |
| Fund | | Ordinary Income | | | Long-Term Capital Gain | |
Cortina Small Cap Growth Fund | | $ | 115,436 | | | $ | 128,107 | |
Cortina Small Cap Value Fund | | | 159,525 | | | | 171,140 | |
As of December 31, 2014, the aggregate cost of investments, gross unrealized appreciation/(depreciation) and net unrealized appreciation/(depreciation) for Federal tax purposes was as follows:
| | | | | | | | | | | | | | | | |
| Fund | | Cost of Investments
for Income Tax
Purposes | | | Gross Appreciation
(excess of value
over tax cost) | | | Gross Depreciation
(excess of tax cost
over value) | | | Net Unrealized
Appreciation | |
Cortina Small Cap Growth Fund | | $ | 36,185,531 | | | $ | 5,944,016 | | | $ | (3,256,214 | ) | | $ | 2,687,802 | |
Cortina Small Cap Value Fund | | | 39,082,509 | | | | 4,320,564 | | | | (1,150,370 | ) | | | 3,170,194 | |
The difference between book basis and tax basis net unrealized appreciation is attributable to the deferral of losses from wash sales and passive foreign investment companies.
| | |
20 | | 1-855-612-3936 | www.cortinafunds.com |
| | |
| | Notes to Financial Statements |
| | December 31, 2014 (Unaudited) |
The Cortina Small Cap Value Fund elects to defer to the year ending June 30, 2015, capital losses recognized during the period November 1, 2013 through June 30, 2014 in the amount of $460,967.
6. COMMITMENTS AND CONTINGENCIES
Under the Corporation’s organizational documents, its Officers and Directors are indemnified against certain liabilities arising out of the performance of their duties to the Funds. In addition, in the normal course of business, the Corporation entered into contracts with its service providers, on behalf of the Funds, and others that provide for general indemnifications. The Funds’ maximum exposure under these arrangements is unknown, as this would involve future claims that may be made against the Funds. The Funds expect risk of loss to be remote.
| | |
Semi-Annual Report | December 31, 2014 | | 21 |
| | |
| | Additional Information |
| | December 31, 2014 (Unaudited) |
1. PROXY VOTING POLICIES AND VOTING RECORD
A description of the policies and procedures that the Funds use to vote proxies relating to portfolio securities is available without charge upon request by calling toll-free 1-855-612-3936, or on the Securities and Exchange Commission’s (“SEC”) website at http://www.sec.gov. Information regarding how the Funds voted proxies relating to portfolio securities during the most recent fiscal year end June 30, 2014 is available without charge upon request by calling toll-free 1-855-612-3936, or on the SEC’s website at http://www.sec.gov.
2. QUARTERLY PORTFOLIO HOLDINGS
The Corporation files a complete listing of portfolio holdings for the Funds with the SEC as of the first and third quarters of each fiscal year on Form N-Q. The filings are available upon request by calling 1-855-612-3936. Furthermore, you may obtain a copy of the filing on the SEC’s website at http://www.sec.gov. The Funds’ Forms N-Q may also be reviewed and copied at the SEC’s Public Reference Room in Washington, D.C., and information on the operation of the Public Reference Room may be obtained by calling 1-800-SEC-0330.
| | |
22 | | 1-855-612-3936 | www.cortinafunds.com |
This page intentionally left blank.

| | |
Material must be accompanied or preceded by the prospectus. The Cortina Funds are distributed by ALPS Distributors, Inc. | | |
Item 2. Code of Ethics.
Not applicable to this report.
Item 3. Audit Committee Financial Expert.
Not applicable to this report.
Item 4. Principal Accountant Fees and Services.
Not applicable to this report.
Item 5. Audit Committee of Listed Registrants.
Not applicable to registrant.
Item 6. Investments.
The Schedule of Investments is included as part of the report to shareholders filed under Item 1 of this
Form N-CSR.
Item 7. Disclosure of Proxy Voting Policies and Procedures for Closed-End Management Investment Companies.
Not applicable to registrant.
Item 8. Portfolio Managers of Closed-End Management Investment Companies.
Not applicable to registrant.
Item 9. Purchases of Equity Securities by Closed-End Management Investment Company and Affiliated Purchasers.
Not applicable to registrant.
Item 10. Submission of Matters to Vote of Security Holders.
Not applicable.
Item 11. Controls and Procedures.
| | (a) | The registrant’s principal executive officer and principal financial officer have concluded that the registrant’s disclosure controls and procedures (as defined in |
| | Rule 30a-3(c) under the Investment Company Act of 1940, as amended) are effective based on their evaluation of these controls and procedures as of a date within 90 days of the filing date of this report. |
| | (b) | There was no change in the registrant’s internal control over financial reporting (as defined in Rule 30a-3(d) under the Investment Company Act of 1940, as amended) during the second fiscal quarter of the period covered by this report that has materially affected, or is reasonably likely to materially affect, the registrant’s internal control over financial reporting. |
Item 12. Exhibits.
| | (a)(1) | Not applicable to this report. |
| | (a)(2) | The certifications required by Rule 30a-2(a) of the Investment Company Act of 1940, as amended, and Section 302 of the Sarbanes-Oxley Act of 2002 are attached hereto as Ex.99.Cert. |
| | (b) | A certification of the registrant’s principal executive officer and principal financial officer, as required by Rule 30a-2(b) under the Investment Company Act of 1940, as amended, is attached as Ex.99.906.Cert. |
SIGNATURES
Pursuant to the requirements of the Securities Exchange Act of 1934 and the Investment Company Act of 1940, the registrant has duly caused this report to be signed on its behalf by the undersigned, thereunto duly authorized.
| | | | |
| Cortina Funds, Inc. | | |
| | |
| By: | | /s/ Ryan T. Davies | | |
| | Ryan T. Davies, President |
| | (Principal Executive Officer) |
| |
| Date: | | March 6, 2015 |
Pursuant to the requirements of the Securities Exchange Act of 1934 and the Investment Company Act of 1940, this report has been signed below by the following persons on behalf of the registrant and in the capacities and on the dates indicated.
| | |
| |
| By: | | /s/ Eric Conner |
| | Eric Conner, Treasurer and Principal Accounting Officer |
| | (Principal Financial Officer) |
| |
| Date: | | March 6, 2015 |