UNITED STATES
SECURITIES AND EXCHANGE COMMISSION
Washington, D.C. 20549
FORM N-CSR
CERTIFIED SHAREHOLDER REPORT OF REGISTERED
MANAGEMENT INVESTMENT COMPANIES
Investment Company Act file number: 811-21580
CORTINA FUNDS, INC.
(Exact name of registrant as specified in charter)
825 N. Jefferson St., Suite 400, Milwaukee, WI 53202
(Address of principal executive offices) (Zip code)
(414) 397-1629
Registrant’s telephone number, including area code
Lori Hoch
825 N. Jefferson St., Suite 400
Milwaukee, WI 53202
(Name and address of agent for service)
Date of fiscal year end: June 30
Date of reporting period: July 1, 2012 - December 31, 2012
Item 1. Reports to Stockholders.
The following is a copy of the report to shareholders pursuant to Rule 30e-1 under the Investment Company Act of 1940 (17 CFR 270.30e-1).
TABLE OF CONTENTS
| | |

| | Shareholder Letter |
| |
Cortina Small Cap Growth Fund | | December 31, 2012 (Unaudited) |
DEAR FELLOW SHAREHOLDERS:
The six months ending December 31, 2012 marked another volatile period for equity markets and, in particular, small cap growth stocks. While the aggregate benchmark performance was solid for the period, the swings in between were both violent and unpredictable. An analysis of intraday highs and lows shows that the Russell 2000 Growth Index fell nearly 7.5% in the early weeks of the six-month period. That was followed by a 13.5% rally, a subsequent 12.3% decline and then a more than 10% return to close out the first half of our fiscal year. In the end, the Russell 2000 Growth Index returned 5.30% while the Cortina Small Cap Growth Fund lagged meaningfully with a slight negative return.
The moodiness of the market can be traced in large part to a series of macro events and public policy decisions (or rhetoric pertaining to policy). To recap just a few, the public assurance by ECP President Mario Draghi that his organization was committed to sustaining liquidity in Europe and the U.S. Federal Reserve’s reload on monetary stimulus through another quantitative easing program known as QE3 are largely responsible for the August/September rally. Uncertainty heading into and immediately following the U.S. political elections were at center stage for the subsequent decline. Remarkably, the final positive push into year-end occurred despite the hand wringing and political posturing surrounding the looming fiscal cliff.
These periods of macro-driven “risk-on/risk-off” trading are often difficult periods for our strategy that is rooted in investing in individual companies based on their company-specific fundamentals. In addition, there were several style headwinds that our strategy faced in the fourth calendar quarter when our underperformance occurred. Generally speaking, value stocks outperformed growth stocks, micro caps significantly underperformed small and mid cap stocks, stocks of rapidly growing companies underperformed those of slower growth companies, and companies were rewarded for paying dividends. While this perspective helps to explain some of the difficulties our strategy faced, we ultimately must own up to the lackluster results and recognize that challenging headwinds should not necessarily lead to underperformance…especially of the magnitude that we experienced.
From a sector standpoint, the largest contributor to our poor relative performance was the Consumer Discretionary sector where our holdings reported a disproportionate amount of disappointing results. Within this sector, four of the five biggest detractors from performance were eliminated from the portfolio, as we deemed their issues to be more structural than transitory. In two cases, competitive concerns led us to question the long-term profitability prospects of the companies in question. The second biggest contributor to negative returns was the Health Care sector. While our Health Care holdings modestly outperformed those of the benchmark, it was the worst performing sector in the benchmark and our overweight position proved costly. The difficulties faced in this sector were more macro/politically driven than company specific and we continue to hold all but three of our ten worst performing Health Care holdings over the six-month period. The Technology and Producer Durables (aka Industrials) sectors were also meaningful contributors to our underperformance. In these sectors, our holdings posted positive returns, but failed to keep pace with the robust sector returns in the benchmark.
In summary, our performance was not up to task in the first half of our fiscal year. Our style was out of favor, we did not have enough exposure to the best sectors and, most damaging of all, we had several company-specific disappointments. We are humbled by periods such as these, but remain steadfast in our commitment to fundamental research and our strategy of investing in high quality, high growth small cap companies.
Investing involves risks, including loss of principal.
| | |
Semi-Annual Report | December 31, 2012 | | 1 |
| | |
| | Portfolio Information |
| |
Cortina Small Cap Growth Fund | | December 31, 2012 (Unaudited) |
Growth of $25,000 Investment (Unaudited)
For the period from September 30, 2011 (Inception) to December 31, 2012.
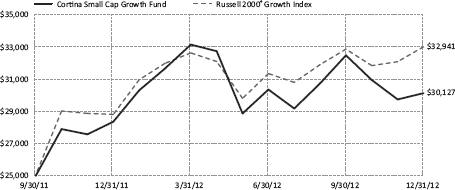
This graph assumes an initial $25,000 investment at September 30, 2011 (Inception Date). The Cortina Small Cap Growth Fund (the “Fund”) will deduct a 2.00% redemption proceeds fee on Fund shares held 60 days or less. This graph depicts the performance of the Fund versus the Russell 2000® Growth Index. It is important to note the Fund is a professionally managed mutual fund while the index is not available for investment and is unmanaged. The comparison is shown for illustrative purposes only.
This chart does not reflect the deduction of taxes that a shareholder would pay on Fund distributions or the redemption of Fund shares.
Performance Returns for the period ended December 31, 2012
| | | | | | | | | | |
| | | 1 Month | | 6 Months | | 1 Year | | Since Inception* | | Gross Expense
Ratio** |
Cortina Small Cap Growth Fund | | 1.3% | | -0.7% | | 6.3% | | 16.1% | | 21.73% |
Russell 2000® Growth Index | | 2.9% | | 5.3% | | 14.6% | | 24.7% | | |
| * | The Fund’s inception date is September 30, 2011. |
| ** | Cortina Asset Management, LLC (the “Adviser”) has contractually agreed to waive management fees and/or reimburse the Fund’s operating expenses in order to limit the Fund’s total annual fund operating expenses (excluding taxes, leverage, interest, brokerage commissions, dividends or interest expenses on short positions, acquired fund fees and expenses and extraordinary expenses) to 1.10% of average daily net assets of the Fund. The agreement will continue in effect at least through October 31, 2013, subject thereafter to annual re-approval of the agreement by the Fund’s Board of Directors. |
Past performance does not guarantee future results. The performance data quoted represents past performance and current returns may be lower or higher. Total return figures include change in share price, reinvestment of dividends and capital gains. The investment return and principal value will fluctuate so that an investor’s shares, when redeemed may be worth more or less than their original cost. To obtain performance information current to the most recent month end, call 1-855-612-3936.
Russell 2000® Growth Index measures the performance of the small-cap growth segment of the U.S. equity universe. It includes those Russell 2000 companies with higher price-to-value ratios and higher forecasted growth values. All indices are unmanaged. It is not possible to invest directly in an index.
Sector Allocations***
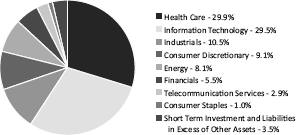
*** Percentages are based on net assets as of December 31, 2012. Holdings are subject to change.
| | |
2 | | 1-855-612-3936 | www.cortinafunds.com |
| | |
| | Shareholder Letter |
| |
Cortina Small Cap Value Fund | | December 31, 2012 (Unaudited) |
DEAR FELLOW SHAREHOLDERS:
The Cortina Small Cap Value Strategy performed well, earning solid returns well in excess of its benchmark, the Russell 2000 Value, for the six months ending December 31, 2012. For the calendar year, stock selection overwhelmingly drove the outperformance, with particular strength in Financial Services, Producer Durables and Health Care. The strategy had multiple investments pay off handsomely. Cash and Utilities were barely measureable drags, and while there were several mistaken investments our risk control processes minimized the impact. Performance was not a case of a few well-placed wagers, it was the product of disciplined capital allocation.
Half Life, Half Lies, and Half Values
Market experts often state, with great self-regard, that “this time it’s different” are the four most expensive words ever spoken. They are probably referring to their television appearance per diems. Televised experts are frequently more expert in cliché than in capital allocation, political pundits included. True investors should know the most expensive words of investing are “reversion to the mean.” Failure to recognize change is a common trap.
In the bright white lights of history and business, ideas, facts and, indeed, companies have similar lifetimes. The highest return on a new fact, theory, or business is at its beginning because its accuracy, relevance, and novelty decline at a pace that is surprisingly mathematical in real life and practice. Samuel Arbesman recently wrote in The Half Life of Facts: Why Everything We Know Has an Expiration Date (Penguin, 2012), that decline can be thought of as a half-life; a term generally reserved for the discussion of radioactive elements.
In the very big picture, the slow fall of Communism is a real example. The Cold War was a real experience for those who are over 35 years of age today. Experts may disagree with the peak of Communism, at least as it was shown in its demonstration project of the Soviet Union, but it could be argued that it peaked mid 20th century. Roughly one-half of the world allied itself with the Soviets, and one-half with the United States. Mid-century school children were raised in the belief that war was inevitable, and the other side was terrifically powerful. But internal half-life decay was already well underway for the Soviets. Its economy was weak, and the deterioration began methodically eating away at Communism’s mass. Its influence shrank, retreating from Central America, retreating from Afghanistan, retreating from Eastern Europe. Suddenly the Berlin Wall was gone and, poof, the entire empire appears to have never existed. The idea, once taken as fact, was no more. Communism, and its patron Russia, despite regaining some influence, has never reverted to its mean power of the past century.
In our hamlet of the world, the concept that equities have half lives well illuminates the challenge of investing on valuation alone. Lower valuation companies frequently appear inexpensive based upon their own past, but the future decline of a company often only manifests itself gradually. Firms previously recognized as leaders slowly lose their competitive edge, then flail about trying to reverse that trend and their decline accelerates. Investors’ view of the company goes from seeing a once great icon having a tough day, to a now average company with the potential to regain greatness, to a terrible company whose prime has past, to an uninvestable disaster. Nokia’s great competitive advantage a decade ago was its software. Poof. The struggling company now uses Microsoft software on its phones; itself a former leader humbled. The ghost of Ozymandias reappears. Let us not forget, Long-Term Capital Management had two Nobel winners gracing its pedigreed founders, but famously collapsed when the half-life of its reversion to the mean strategy played out.
The warning for investors is that while it is true certain companies can undergo a tough time and rebound, it is exceedingly rare. The assumption of reversion to the mean presumes, naively, that a company which once earned a 15% operating margin can do so again should it fall short during some period of time. Perhaps. More likely, however, is that company will not. In fact, that company is gone. Its dominance or its advantage is gone and, like many declining companies, its stock chart probably resembles a sliding board. Underperformance slowly then all at once: a value trap.
Therefore, evolution may be the wrong term for us to use. Alchemy might be better. When we buy a stake in a company, we are not buying the struggling company. We are buying a different company emerging from the previous. Each company we invest in is actually a start up, but in a different phase than what is commonly associated with the term. It is an important distinction, because simply assuming things will return to what they once were is a perilous strategy. In fact, each time it is different, and not recognizing that key distinction is the genus of many a turn into the wrong venture.
Whether it is evolution or alchemy, two recurring themes in our successful investments have been earnings and cash flow. First, companies who have changed and are on the cusp of growing earnings, typically after several quarters or years of stagnation, are often our best investments. Consensus estimates are usually both too low and too careless to capture the true value of internal improvements. Second, companies with high free cash flow that, either because of balance sheet repair or slowing capital needs, suddenly have prospects to either invest for the future or return capital to shareholders are fertile fields. Whether it is high leverage or high growth spending restraining free cash flow, crossing the inflection point from cash according to its needs to cash according to its wants can create significant opportunity for managements and shareholders.
| | |
Semi-Annual Report | December 31, 2012 | | 3 |
| | |
| | Shareholder Letter |
| |
Cortina Small Cap Value Fund | | December 31, 2012 (Unaudited) |
It is with these observations that we find investing in Growth at a Reasonable Price, marketed as GARP, such a treacherous path. It presumes all growth is good, enduring, and a bargain to be exploited when found. We much prefer to think of ourselves as investors in the school of A Reasonable Price with Growth, or ARPG for short. We are much more interested in the positive change that drives growth in an ignored company than in the negative change that creates a lower price in a well known one. ARPG may lack the mellifluous quality that GARP shows in marketing literature but it does resemble an acronym the military would use. We much prefer aligning ourselves with an organization known for its process and discipline than a term livening up spiral bound handouts remembered for making things appear better than they are.
Our Outlook
In this age of shrunken leadership, cynicism has taken hard root in the country. One year ago, the market’s worst fears were a slowing economy, the re-election of a business-unfriendly President and falling off the fiscal cliff. All three were realized in part or whole, proving the cynics correct. Yet cynics squirreling away their capital in seemingly safe investments paid the opportunity cost in foregone gains as the market rose healthily. Optimism does have its rewards and we retain ours.
Following last year’s strong performance is a tough act, but the process used to generate last year’s returns is not different from the process we will employ for next year’s returns. We have found values in new areas. We are less overweight Industrials than we once were and more overweight Technology. Financials remain an important sector, but less appealing than a year ago, while Energy has some unique situations. Consumer Discretionary remains a slight underweight, but we have sold some winning investments within the sector to focus on others with greater potential.
Although we may have opinions on the economy, we do not have a particular view on it. Stuck in the mud is about as precise a view as one can have these days given the complexity and stubborn qualities of both the problems and the actors defining the age. Adam Smith may have praised the virtues of many individuals acting in their own self-interest, but he had not witnessed the avariciousness of the United States Congress. The best solution is to shut off the news screen and focus on finding companies that are discovering their own means and paths to better days. It is a process we know well and will continue to employ in allocating your hard-earned capital.
Investing involves risks, including loss of principal.
| | |
4 | | 1-855-612-3936 | www.cortinafunds.com |
| | |
| | Portfolio Information |
| |
Cortina Small Cap Value Fund | | December 31, 2012 (Unaudited) |
Growth of $25,000 Investment (Unaudited)
For the period from September 30, 2011 (Inception) to December 31, 2012.
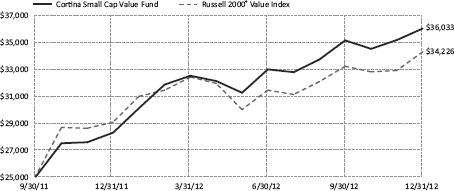
This graph assumes an initial $25,000 investment at September 30, 2011 (Inception Date). The Cortina Small Cap Value Fund (the “Fund”) will deduct a 2.00% redemption proceeds fee on Fund shares held 60 days or less. This graph depicts the performance of the Fund versus the Russell 2000® Value Index. It is important to note the Fund is a professionally managed mutual fund, while the index is not available for investment and is unmanaged. The comparison is shown for illustrative purposes only.
This chart does not reflect the deduction of taxes that a shareholder would pay on Fund distributions or the redemption of Fund shares.
Performance Returns for the period ended December 31, 2012
| | | | | | | | | | |
| | | 1 Month | | 6 Months | | 1 Year | | Since Inception* | | Gross Expense
Ratio** |
Cortina Small Cap Value Fund | | 2.4% | | 9.2% | | 27.4% | | 33.9% | | 22.42% |
Russell 2000® Value Index | | 4.2% | | 9.1% | | 18.1% | | 28.5% | | |
| * | The Fund’s inception date is September 30, 2011. |
| ** | Cortina Asset Management, LLC (the “Adviser”) has contractually agreed to waive management fees and/or reimburse the Fund’s operating expenses in order to limit the Fund’s total annual fund operating expenses (excluding taxes, leverage, interest, brokerage commissions, dividends or interest expenses on short positions, acquired fund fees and expenses and extraordinary expenses) to 1.10% of average daily net assets of the Fund. The agreement will continue in effect at least through October 31, 2013, subject thereafter to annual re-approval of the agreement by the Fund’s Board of Directors. |
Past performance does not guarantee future results. The performance data quoted represents past performance and current returns may be lower or higher. Total return figures include change in share price, reinvestment of dividends and capital gains. The investment return and principal value will fluctuate so that an investor’s shares, when redeemed may be worth more or less than their original cost. To obtain performance information current to the most recent month end, call 1-855-612-3936.
Russell 2000® Value Index measures the performance of those Russell 2000 companies with lower price-to-book ratios and lower forecasted growth values. All indices are unmanaged. It is not possible to invest directly in an index.
Sector Allocations***
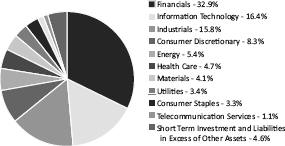
*** Percentages are based on net assets as of December 31, 2012. Holdings are subject to change.
| | |
Semi-Annual Report | December 31, 2012 | | 5 |
| | |
| | Disclosure of Fund Expenses |
| |
| | December 31, 2012 (Unaudited) |
As a shareholder of the Fund(s), you incur transaction costs and ongoing costs, including management fees and other Fund expenses. This example is intended to help you understand your ongoing costs (in dollars) of investing in each Fund and to compare these costs with the ongoing costs of investing in other mutual funds. The example is based on an investment of $1,000 invested at the beginning of the period and held for the entire period, as indicated below.
Actual Expenses –The first line of the table below provides information about the actual account values and actual expenses. You may use the information in this line, together with the amount you invested, to estimate the expenses that you paid over the period. Simply divide your account value by $1,000 (for example, an $8,600 account value divided by $1,000 = 8.6) then multiply the result by the number in the first line under the heading entitled “Expenses Paid During Period” to estimate the expenses you paid on your account during this period.
Hypothetical Example for Comparison Purposes – The second line of the table below provides information about hypothetical account values and hypothetical expenses based on each Fund’s actual expense ratio and an assumed annual rate of return of 5% before expenses, which is not each Fund’s actual return. The hypothetical account values and expenses may not be used to estimate the actual ending account balance or expenses you paid for the period. You may use this information to compare the ongoing costs of investing in each Fund and other funds by comparing these 5% hypothetical examples with the 5% hypothetical examples that appear in the shareholder reports of other funds.
Please note that the expenses shown in the table are meant to highlight your ongoing costs only and do not reflect any direct costs, such as wire fees or low balance fees. Therefore, the second line of the table is useful in comparing ongoing costs and will not help you determine the relative total costs of owning different funds. In addition, if these direct costs were included, your costs would be higher.
| | | | | | | | | | | | | | | | | | | | |
| | | Beginning
Account Value
July 1, 2012 | | Ending
Account Value
December 31, 2012 | | Expenses Paid
During Period(a) | | Net
Expense
Ratios |
Cortina Small Cap Growth Fund | | | | | | | | | | | | | | | | | | | | |
Actual Fund Return | | | $ | 1,000.00 | | | | $ | 992. 60 | | | | $ | 5.52 | | | | | 1.10 | % |
Hypothetical Fund Return (assuming a 5% return before expenses) | | | $ | 1,000.00 | | | | $ | 1,019.66 | | | | $ | 5.60 | | | | | 1.10 | % |
Cortina Small Cap Value Fund | | | | | | | | | | | | | | | | | | | | |
Actual Fund Return | | | $ | 1,000.00 | | | | $ | 1,092.00 | | | | $ | 5.80 | | | | | 1.10 | % |
Hypothetical Fund Return (assuming a 5% return before expenses) | | | $ | 1,000.00 | | | | $ | 1,019.66 | | | | $ | 5.60 | | | | | 1.10 | % |
| (a) | Expenses are equal to the Fund’s annualized expense ratio multiplied by the average account value over the period, multiplied by the number of days in the most recent fiscal half year (184), divided by 365. |
| | |
6 | | 1-855-612-3936 | www.cortinafunds.com |
| | |
| | Schedule of Investments |
| |
Cortina Small Cap Growth Fund | | December 31, 2012 (Unaudited) |
| | | | | | | | |
| | | Shares | | | Value | |
| |
COMMON STOCKS (96.5%) | | | | | | | | |
Consumer Discretionary (9.1%) | | | | | | | | |
Black Diamond, Inc.(a) | | | 9,084 | | | $ | 74,489 | |
Chuy’s Holdings, Inc.(a) | | | 2,884 | | | | 64,429 | |
Francesca’s Holdings Corp.(a) | | | 2,649 | | | | 68,768 | |
Fuel Systems Solutions, Inc.(a) | | | 4,045 | | | | 59,462 | |
Gentherm, Inc.(a) | | | 7,119 | | | | 94,683 | |
Ignite Restaurant Group, Inc.(a) | | | 4,725 | | | | 61,425 | |
Morgans Hotel Group Co.(a) | | | 11,361 | | | | 62,940 | |
Restoration Hardware Holdings, Inc.(a) | | | 2,058 | | | | 69,416 | |
Shutterfly, Inc.(a) | | | 4,120 | | | | 123,064 | |
Steven Madden, Ltd.(a) | | | 3,535 | | | | 149,424 | |
| | | | | | | | |
| | | | | | | 828,100 | |
| | | | | | | | |
Consumer Staples (1.0%) | | | | | | | | |
The Fresh Market, Inc.(a) | | | 1,862 | | | | 89,544 | |
| | | | | | | | |
Energy (8.1%) | | | | | | | | |
Carrizo Oil & Gas, Inc.(a) | | | 3,243 | | | | 67,844 | |
ION Geophysical Corp.(a) | | | 15,205 | | | | 98,984 | |
Northern Oil & Gas, Inc.(a) | | | 6,371 | | | | 107,160 | |
Rex Energy Corp.(a) | | | 8,088 | | | | 105,306 | |
Sanchez Energy Corp.(a) | | | 5,803 | | | | 104,454 | |
Synergy Resources Corp.(a) | | | 20,711 | | | | 111,632 | |
Triangle Petroleum Corp.(a) | | | 24,242 | | | | 145,210 | |
| | | | | | | | |
| | | | | | | 740,590 | |
| | | | | | | | |
Financials (5.5%) | | | | | | | | |
BofI Holding, Inc.(a) | | | 3,642 | | | | 101,503 | |
EverBank Financial Corp. | | | 3,010 | | | | 44,879 | |
Greenhill & Co., Inc. | | | 1,707 | | | | 88,747 | |
ICG Group, Inc.(a) | | | 7,477 | | | | 85,462 | |
Pinnacle Financial Partners, Inc.(a) | | | 5,391 | | | | 101,566 | |
Texas Capital Bancshares, Inc.(a) | | | 1,799 | | | | 80,631 | |
| | | | | | | | |
| | | | | | | 502,788 | |
| | | | | | | | |
Health Care (29.9%) | | | | | | | | |
Accuray, Inc.(a) | | | 19,672 | | | | 126,491 | |
Align Technology, Inc.(a) | | | 4,165 | | | | 115,579 | |
Cepheid, Inc.(a) | | | 2,974 | | | | 100,551 | |
Cerus Corp.(a) | | | 28,474 | | | | 89,978 | |
Conceptus, Inc.(a) | | | 5,733 | | | | 120,450 | |
DexCom, Inc.(a) | | | 8,213 | | | | 111,779 | |
Endologix, Inc.(a) | | | 8,706 | | | | 123,973 | |
Fluidigm Corp.(a) | | | 7,265 | | | | 103,962 | |
Greenway Medical Technologies(a) | | | 5,833 | | | | 89,595 | |
HealthStream, Inc.(a) | | | 4,570 | | | | 111,097 | |
Insulet Corp.(a) | | | 4,653 | | | | 98,737 | |
Medidata Solutions, Inc.(a) | | | 5,117 | | | | 200,535 | |
Myriad Genetics, Inc.(a) | | | 3,865 | | | | 105,321 | |
Nanosphere, Inc.(a) | | | 33,431 | | | | 96,281 | |
Neogen Corp.(a) | | | 2,535 | | | | 114,886 | |
NeoGenomics, Inc.(a) | | | 15,531 | | | | 38,517 | |
Novadaq Technologies, Inc.(a) | | | 8,157 | | | | 72,434 | |
OraSure Technologies, Inc.(a) | | | 14,370 | | | | 103,177 | |
PhotoMedex, Inc.(a) | | | 7,141 | | | | 103,616 | |
Quidel Corp.(a) | | | 7,902 | | | | 147,530 | |
Soltra Medical, Inc.(a) | | | 39,281 | | | | 104,880 | |
Spectranetics Corp.(a) | | | 4,672 | | | | 69,005 | |
Staar Surgical Co.(a) | | | 15,791 | | | | 96,325 | |
See Notes to Financial Statements.
| | |
Semi-Annual Report | December 31, 2012 | | 7 |
| | |
| | Schedule of Investments |
| |
Cortina Small Cap Growth Fund | | December 31, 2012 (Unaudited) |
| | | | | | | | |
| | | Shares | | | Value | |
| |
COMMON STOCKS (continued) | | | | | | | | |
Health Care (continued) | | | | | | | | |
Synergetics USA, Inc.(a) | | | 17,641 | | | $ | 84,677 | |
TearLab Corp.(a) | | | 17,907 | | | | 73,419 | |
Uroplasty, Inc.(a) | | | 18,407 | | | | 59,455 | |
Vocera Communications, Inc.(a) | | | 2,912 | | | | 73,091 | |
| | | | | | | | |
| | | | | | | 2,735,341 | |
| | | | | | | | |
Industrials (10.5%) | | | | | | | | |
Astronics Corp.(a) | | | 2,798 | | | | 64,018 | |
Chart Industries, Inc.(a) | | | 1,285 | | | | 85,671 | |
Echo Global Logistics, Inc.(a) | | | 6,363 | | | | 114,343 | |
Flow International Corp.(a) | | | 27,455 | | | | 96,093 | |
Heritage Crystal Clean, Inc.(a) | | | 4,736 | | | | 71,087 | |
Manitex International, Inc.(a) | | | 7,865 | | | | 56,156 | |
Primoris Services Corp. | | | 7,766 | | | | 116,801 | |
Rush Enterprises, Inc., Class A(a) | | | 3,711 | | | | 76,706 | |
Team, Inc.(a) | | | 1,769 | | | | 67,293 | |
Titan Machinery, Inc.(a) | | | 4,483 | | | | 110,730 | |
Westport Innovations, Inc.(a) | | | 3,667 | | | | 97,946 | |
| | | | | | | | |
| | | | | | | 956,844 | |
| | | | | | | | |
Information Technology (29.5%) | | | | | | | | |
Allot Communications, Ltd.(a) | | | 2,929 | | | | 52,195 | |
Aruba Networks, Inc.(a) | | | 4,032 | | | | 83,664 | |
Brightcove, Inc.(a) | | | 7,627 | | | | 68,948 | |
CommVault Systems, Inc.(a) | | | 1,982 | | | | 138,165 | |
Computer Task Group, Inc.(a) | | | 5,527 | | | | 100,757 | |
E2open, Inc.(a) | | | 5,806 | | | | 82,213 | |
Envestnet, Inc.(a) | | | 7,532 | | | | 105,071 | |
ExactTarget, Inc.(a) | | | 4,555 | | | | 91,100 | |
FARO Technologies, Inc.(a) | | | 2,080 | | | | 74,214 | |
Guidewire Software, Inc.(a) | | | 4,007 | | | | 119,088 | |
Imperva, Inc.(a) | | | 3,262 | | | | 102,851 | |
Infoblox, Inc.(a) | | | 3,571 | | | | 64,171 | |
Inphi Corp.(a) | | | 9,789 | | | | 93,779 | |
Interactive Intelligence Group, Inc.(a) | | | 3,079 | | | | 103,270 | |
InterXion Holding NV(a) | | | 3,182 | | | | 75,604 | |
LivePerson, Inc.(a) | | | 5,616 | | | | 73,794 | |
LogMeIn, Inc.(a) | | | 3,387 | | | | 75,903 | |
MaxLinear, Inc., Class A(a) | | | 13,764 | | | | 69,095 | |
Monolithic Power Systems, Inc. | | | 4,526 | | | | 100,839 | |
Procera Networks, Inc.(a) | | | 5,238 | | | | 97,165 | |
Proofpoint, Inc.(a) | | | 8,465 | | | | 104,204 | |
QLIK Technologies, Inc.(a) | | | 2,906 | | | | 63,118 | |
Qualys, Inc.(a) | | | 3,696 | | | | 54,664 | |
RADWARE, Ltd.(a) | | | 2,362 | | | | 77,946 | |
Sapient Corp.(a) | | | 8,331 | | | | 87,975 | |
Semtech Corp.(a) | | | 3,335 | | | | 96,548 | |
ShoreTel, Inc.(a) | | | 19,948 | | | | 84,580 | |
SPS Commerce, Inc.(a) | | | 1,429 | | | | 53,259 | |
Stamps.com, Inc.(a) | | | 2,380 | | | | 59,976 | |
Synchronoss Technologies, Inc.(a) | | | 4,742 | | | | 100,009 | |
Tangoe, Inc.(a) | | | 7,235 | | | | 85,880 | |
TechTarget, Inc.(a) | | | 9,430 | | | | 52,337 | |
| | | | | | | | |
| | | | | | | 2,692,382 | |
| | | | | | | | |
Telecommunication Services (2.9%) | | | | | | | | |
8x8, Inc.(a) | | | 10,534 | | | | 77,846 | |
Cogent Communications Group, Inc. | | | 2,909 | | | | 65,860 | |
See Notes to Financial Statements.
| | |
8 | | 1-855-612-3936 | www.cortinafunds.com |
| | |
| | Schedule of Investments |
| |
Cortina Small Cap Growth Fund | | December 31, 2012 (Unaudited) |
| | | | | | | | |
| | | Shares | | | Value | |
| |
COMMON STOCKS (continued) | | | | | | | | |
Telecommunication Services (continued) | | | | | | | | |
inContact, Inc.(a) | | | 23,217 | | | $ | 120,264 | |
| | | | | | | | |
| | | | | | | 263,970 | |
| | | | | | | | |
| | |
TOTAL COMMON STOCKS
(COST $8,812,331) | | | | | | | 8,809,559 | |
| | | | | | | | |
| | |
SHORT TERM INVESTMENT (3.7%) | | | | | | | | |
HighMark Diversified Money Market Fund, Fiduciary Class, 7 Day Yield 0.019% | | | 338,971 | | | | 338,971 | |
| | | | | | | | |
| | |
TOTAL SHORT TERM INVESTMENT
(COST $338,971) | | | | | | | 338,971 | |
| | | | | | | | |
| | |
TOTAL INVESTMENTS (100.2%)
(COST $9,151,302) | | | | | | | 9,148,530 | |
| | | | | | | | |
| | |
TOTAL LIABILITIES IN EXCESS OF OTHER ASSETS (-0.2%) | | | | | | | (20,898 | ) |
| | | | | | | | |
| | |
NET ASSETS 100.0% | | | | | | $ | 9,127,632 | |
| | | | | | | | |
| (a) | Non Income Producing Security. |
Common Abbreviations:
Ltd. - Limited.
NV - Naamloze Vennootschap is the Dutch term for a public limited liability corporation.
See Notes to Financial Statements.
| | |
Semi-Annual Report | December 31, 2012 | | 9 |
| | |
| | Schedule of Investments |
| |
Cortina Small Cap Value Fund | | December 31, 2012 (Unaudited) |
| | | | | | | | |
| | | Shares | | | Value | |
| |
COMMON STOCKS (95.4%) | | | | | | | | |
Consumer Discretionary (8.3%) | | | | | | | | |
AFC Enterprises, Inc.(a) | | | 1,171 | | | $ | 30,598 | |
ANN, Inc.(a) | | | 1,156 | | | | 39,119 | |
Denny’s Corp.(a) | | | 9,085 | | | | 44,335 | |
DreamWorks Animation SKG, Inc., Class A(a) | | | 3,402 | | | | 56,371 | |
Regis Corp. | | | 4,032 | | | | 68,222 | |
| | | | | | | | |
| | | | | | | 238,645 | |
| | | | | | | | |
Consumer Staples (3.3%) | | | | | | | | |
Darling International, Inc.(a) | | | 2,834 | | | | 45,457 | |
Prestige Brands Holdings, Inc.(a) | | | 1,787 | | | | 35,794 | |
Rite Aid Corp.(a) | | | 11,183 | | | | 15,209 | |
| | | | | | | | |
| | | | | | | 96,460 | |
| | | | | | | | |
Energy (5.4%) | | | | | | | | |
Arch Coal, Inc. | | | 4,124 | | | | 30,188 | |
Cloud Peak Energy, Inc.(a) | | | 1,055 | | | | 20,393 | |
Gulfport Energy Corp.(a) | | | 1,089 | | | | 41,622 | |
Helix Energy Solutions Group, Inc.(a) | | | 2,149 | | | | 44,355 | |
Matador Resources Co.(a) | | | 2,511 | | | | 20,590 | |
| | | | | | | | |
| | | | | | | 157,148 | |
| | | | | | | | |
Financials (31.4%) | | | | | | | | |
Altisource Asset Management Corp.(a) | | | 36 | | | | 2,985 | |
Altisource Portfolio Solutions SA(a) | | | 357 | | | | 30,936 | |
Altisource Residential Corp., Class B(a) | | | 118 | | | | 1,869 | |
Amtrust Financial Services, Inc. | | | 1,859 | | | | 53,335 | |
Boston Private Financial Holdings, Inc. | | | 5,739 | | | | 51,708 | |
Capitol Federal Financial, Inc. | | | 2,277 | | | | 26,618 | |
CNO Financial Group, Inc. | | | 7,571 | | | | 70,637 | |
Columbia Banking System, Inc. | | | 391 | | | | 7,015 | |
eHealth, Inc.(a) | | | 2,511 | | | | 69,002 | |
Employers Holdings, Inc. | | | 2,103 | | | | 43,280 | |
Green Dot Corp., Class A(a) | | | 2,190 | | | | 26,718 | |
Maiden Holdings, Ltd. | | | 4,672 | | | | 42,936 | |
MB Financial, Inc. | | | 2,209 | | | | 43,628 | |
Northwest Bancshares, Inc. | | | 3,448 | | | | 41,859 | |
Ocwen Financial Corp.(a) | | | 1,589 | | | | 54,963 | |
Oriental Financial Group, Inc. | | | 2,764 | | | | 36,899 | |
Oritani Financial Corp. | | | 3,354 | | | | 51,383 | |
PHH Corp.(a) | | | 3,136 | | | | 71,344 | |
Platinum Underwriters Holdings, Ltd. | | | 1,395 | | | | 64,170 | |
ProAssurance Corp. | | | 1,632 | | | | 68,854 | |
West Coast Bancorp | | | 2,084 | | | | 46,161 | |
| | | | | | | | |
| | | | | | | 906,300 | |
| | | | | | | | |
Health Care (4.7%) | | | | | | | | |
ICU Medical, Inc.(a) | | | 756 | | | | 46,063 | |
Teleflex, Inc. | | | 522 | | | | 37,224 | |
Tenet Healthcare Corp.(a) | | | 1,581 | | | | 51,335 | |
| | | | | | | | |
| | | | | | | 134,622 | |
| | | | | | | | |
Industrials (15.8%) | | | | | | | | |
Actuant Corp., Class A | | | 1,234 | | | | 34,441 | |
Cubic Corp. | | | 1,120 | | | | 53,726 | |
Fortune Brands Home & Security, Inc.(a) | | | 966 | | | | 28,227 | |
The Manitowoc Co., Inc. | | | 2,448 | | | | 38,385 | |
MasTec, Inc.(a) | | | 3,047 | | | | 75,962 | |
Orbital Sciences Corp.(a) | | | 2,994 | | | | 41,227 | |
Powell Industries, Inc.(a) | | | 1,229 | | | | 51,040 | |
See Notes to Financial Statements.
| | |
10 | | 1-855-612-3936 | www.cortinafunds.com |
| | |
| | Schedule of Investments |
| |
Cortina Small Cap Value Fund | | December 31, 2012 (Unaudited) |
| | | | | | | | |
| | | Shares | | | Value | |
| |
COMMON STOCKS (continued) | | | | | | | | |
Industrials (continued) | | | | | | | | |
Tennant Co. | | | 1,190 | | | $ | 52,300 | |
TrueBlue, Inc.(a) | | | 3,361 | | | | 52,936 | |
Tutor Perini Corp.(a) | | | 2,080 | | | | 28,496 | |
| | | | | | | | |
| | | | | | | 456,740 | |
| | | | | | | | |
Information Technology (16.4%) | | | | | | | | |
Accelrys, Inc.(a) | | | 4,691 | | | | 42,454 | |
Cardtronics, Inc.(a) | | | 1,223 | | | | 29,034 | |
Coherent, Inc. | | | 739 | | | | 37,408 | |
Compuware Corp.(a) | | | 3,390 | | | | 36,849 | |
comScore, Inc.(a) | | | 2,574 | | | | 35,470 | |
ExlService Holdings, Inc.(a) | | | 1,060 | | | | 28,090 | |
Harmonic, Inc.(a) | | | 8,885 | | | | 45,047 | |
Logitech International SA | | | 6,239 | | | | 47,042 | |
M/A-COM Technology Solutions Holdings, Inc.(a) | | | 3,088 | | | | 46,227 | |
Sierra Wireless, Inc.(a) | | | 6,403 | | | | 50,840 | |
Super Micro Computer, Inc.(a) | | | 4,365 | | | | 44,523 | |
Ultratech, Inc.(a) | | | 811 | | | | 30,250 | |
| | | | | | | | |
| | | | | | | 473,234 | |
| | | | | | | | |
Materials (4.1%) | | | | | | | | |
Flotek Industries, Inc.(a) | | | 3,221 | | | | 39,296 | |
Graphic Packaging Holdings Co.(a) | | | 12,200 | | | | 78,812 | |
| | | | | | | | |
| | | | | | | 118,108 | |
| | | | | | | | |
Real Estate Investment Trust (REIT) (1.5%) | | | | | | | | |
American Realty Capital Trust, Inc. | | | 3,653 | | | | 42,192 | |
| | | | | | | | |
Telecommunication Services (1.1%) | | | | | | | | |
Towerstream Corp.(a) | | | 9,790 | | | | 31,817 | |
| | | | | | | | |
Utilities (3.4%) | | | | | | | | |
ALLETE, Inc. | | | 1,260 | | | | 51,635 | |
Black Hills Corp. | | | 1,268 | | | | 46,079 | |
| | | | | | | | |
| | | | | | | 97,714 | |
| | | | | | | | |
| | |
TOTAL COMMON STOCKS
(COST $2,393,590) | | | | | | | 2,752,980 | |
| | | | | | | | |
| | |
SHORT TERM INVESTMENT (5.7%) | | | | | | | | |
HighMark Diversified Money Market Fund, Fiduciary Class, 7 Day Yield 0.019% | | | 164,816 | | | | 164,816 | |
| | | | | | | | |
| | |
TOTAL SHORT TERM INVESTMENT
(COST $164,816) | | | | | | | 164,816 | |
| | | | | | | | |
| | |
TOTAL INVESTMENTS (101.1%)
(COST $2,558,406) | | | | | | | 2,917,796 | |
| | | | | | | | |
| | |
TOTAL LIABILITIES IN EXCESS OF OTHER ASSETS (-1.1%) | | | | | | | (31,995 | ) |
| | | | | | | | |
| | |
NET ASSETS 100.0% | | | | | | $ | 2,885,801 | |
| | | | | | | | |
| (a) | Non Income Producing Security. |
See Notes to Financial Statements.
| | |
Semi-Annual Report | December 31, 2012 | | 11 |
| | |
| | Schedule of Investments |
| |
Cortina Small Cap Value Fund | | December 31, 2012 (Unaudited) |
Common Abbreviations:
Ltd. - Limited.
REIT - Real Estate Investment Trust.
SA - Generally designates corporations in various countries, mostly those employing the civil law.
See Notes to Financial Statements.
| | |
12 | | 1-855-612-3936 | www.cortinafunds.com |
| | |
| | Statements of Assets and Liabilities |
| |
| | December 31, 2012 (Unaudited) |
| | | | | | | | |
| | | Cortina Small Cap Growth Fund | | | Cortina Small Cap Value Fund | |
| | | | |
ASSETS: | | | | | | | | |
Investments, at value (Cost - see below) | | $ | 9,148,530 | | | $ | 2,917,796 | |
Receivable for investments sold | | | 20,945 | | | | 51,602 | |
Dividends and interest receivable | | | 5 | | | | 150 | |
Receivable due from adviser | | | 16,479 | | | | 6,681 | |
Receivable for fund shares subscribed | | | 20,060 | | | | 0 | |
Prepaid expenses and other assets | | | 22,255 | | | | 9,515 | |
| | | | |
Total Assets | | | 9,228,274 | | | | 2,985,744 | |
| | | | |
| | |
LIABILITIES: | | | | | | | | |
Payable for investments purchased | | | 82,093 | | | | 83,072 | |
Payable for fund shares redeemed | | | 182 | | | | 213 | |
Payable for fund accounting and administration fees | | | 12,265 | | | | 4,295 | |
Payable for audit and legal fees | | | 2,987 | | | | 6,852 | |
Payable for director fees | | | 327 | | | | 271 | |
Other accrued liabilities and expenses | | | 2,788 | | | | 5,240 | |
| | | | |
Total Liabilities | | | 100,642 | | | | 99,943 | |
| | | | |
Net Assets | | $ | 9,127,632 | | | $ | 2,885,801 | |
| | | | |
| | |
NET ASSETS CONSISTS OF: | | | | | | | | |
Paid-in capital | | $ | 9,316,826 | | | $ | 2,531,308 | |
Accumulated net investment loss | | | (26,008) | | | | (4,581) | |
Accumulated undistributed net realized loss on investments | | | (160,414) | | | | (316) | |
Net unrealized appreciation/(depreciation) on investments | | | (2,772) | | | | 359,390 | |
| | | | |
Net Assets | | $ | 9,127,632 | | | $ | 2,885,801 | |
| | | | |
| | |
Cost of Investments | | $ | 9,151,302 | | | $ | 2,558,406 | |
| | |
PRICING OF SHARES: | | | | | | | | |
Net Assets | | $ | 9,127,632 | | | $ | 2,885,801 | |
Shares Outstanding | | | 780,638 | | | | 220,564 | |
Net Asset Value, offering and redemption price per share | | $ | 11.69 | | | $ | 13.08 | |
See Notes to Financial Statements.
| | |
Semi-Annual Report | December 31, 2012 | | 13 |
| | |
| | Statements of Operations |
| |
| | For the Six Months Ended December 31, 2012 (Unaudited) |
| | | | | | | | |
| | | Cortina Small Cap
Growth Fund | | | Cortina Small Cap Value Fund | |
| | | | |
INVESTMENT INCOME: | | | | | | | | |
Dividends, (net of foreign withholding taxes of $0 and $16) | | $ | 6,736 | | | $ | 24,734 | |
| | | | |
Total Investment Income | | | 6,736 | | | | 24,734 | |
| | | | |
| | |
EXPENSES: | | | | | | | | |
Advisory fees (Note 3) | | | 29,768 | | | | 12,883 | |
Transfer agent fees | | | 16,056 | | | | 13,534 | |
Fund accounting and administration fees and expenses | | | 59,981 | | | | 33,489 | |
Legal fees | | | 3,832 | | | | 2,594 | |
Printing fees | | | 3,424 | | | | 2,113 | |
Registration fees | | | 12,317 | | | | 6,145 | |
Audit and tax preparation fees | | | 7,310 | | | | 7,310 | |
Custodian fees | | | 2,047 | | | | 1,320 | |
Insurance | | | 4,341 | | | | 4,341 | |
Director fee and expenses | | | 2,577 | | | | 2,521 | |
Offering costs | | | 7,534 | | | | 7,263 | |
Other | | | 2,901 | | | | 2,479 | |
| | | | |
Total Expenses Before Waivers/Reimbursements | | | 152,088 | | | | 95,992 | |
Less fees waived/reimbursed by adviser (Note 3) | | | (119,344) | | | | (81,821) | |
| | | | |
Total Net Expenses | | | 32,744 | | | | 14,171 | |
| | | | |
Net Investment Income/(Loss) | | | (26,008) | | | | 10,563 | |
| | | | |
| | |
REALIZED AND UNREALIZED GAIN/(LOSS) ON INVESTMENTS: | | | | | | | | |
Net realized gain/(loss) on investments | | | (137,080) | | | | 74,808 | |
Net change in unrealized appreciation/(depreciation) on investments | | | (140,072) | | | | 155,046 | |
| | | | |
Net Realized and Unrealized Gain/(Loss) on Investments | | | (277,152) | | | | 229,854 | |
| | | | |
Net Increase/(Decrease) in Net Assets Resulting from Operations | | $ | (303,160) | | | $ | 240,417 | |
| | | | |
See Notes to Financial Statements.
| | |
14 | | 1-855-612-3936 | www.cortinafunds.com |
| | |
| | Statements of Changes in Net Assets |
| |
| | | | | | | | | | | | | | | | |
| | | Cortina Small Cap Growth Fund | | | Cortina Small Cap Value Fund | |
| | | | |
| | | Six Months Ended December 31, 2012 (Unaudited) | | | For the Period September 30, 2011 (Inception) to June 30, 2012 | | | Six Months Ended December 31, 2012 (Unaudited) | | | For the Period September 30, 2011 (Inception) to June 30, 2012 | |
| |
| | | | |
OPERATIONS: | | | | | | | | | | | | | | | | |
Net investment income/(loss) | | $ | (26,008) | | | $ | (7,878) | | | $ | 10,563 | | | $ | (2,304) | |
Net realized gain/(loss) on investments | | | (137,080) | | | | 72,431 | | | | 74,808 | | | | 69,894 | |
Net change in unrealized appreciation/(depreciation) of investments | | | (140,072) | | | | 137,300 | | | | 155,046 | | | | 204,344 | |
| | | | |
Net increase/(decrease) in net assets resulting from operations | | | (303,160) | | | | 201,853 | | | | 240,417 | | | | 271,934 | |
| | | | |
| | | | |
DISTRIBUTIONS TO SHAREHOLDERS: | | | | | | | | | | | | | | | | |
From net investment income | | | – | | | | – | | | | (15,144) | | | | – | |
From net realized gains on investments | | | (68,752) | | | | (20,406) | | | | (113,367) | | | | (30,530) | |
| | | | |
Total distributions | | | (68,752) | | | | (20,406) | | | | (128,511) | | | | (30,530) | |
| | | | |
| | | | |
CAPITAL SHARE TRANSACTIONS: | | | | | | | | | | | | | | | | |
Proceeds from sale of shares | | | 8,115,884 | | | | 1,108,101 | | | | 710,762 | | | | 1,569,937 | |
Shares issued in reinvestment of distributions | | | 67,885 | | | | 20,406 | | | | 123,043 | | | | 30,530 | |
Cost of shares redeemed | | | (94,037) | | | | (900,145) | | | | (1,679) | | | | (900,104) | |
Redemption fees | | | – | | | | 3 | | | | – | | | | 2 | |
| | | | |
Net increase from capital shares transactions | | | 8,089,732 | | | | 228,365 | | | | 832,126 | | | | 700,365 | |
| | | | |
| | | | |
Net increase in net assets | | | 7,717,820 | | | | 409,812 | | | | 944,032 | | | | 941,769 | |
| | | | |
| | | | |
NET ASSETS: | | | | | | | | | | | | | | | | |
Beginning of period | | | 1,409,812 | | | | 1,000,000 | | | | 1,941,769 | | | | 1,000,000 | |
| | | | |
End of period | | $ | 9,127,632 | | | $ | 1,409,812 | | | $ | 2,885,801 | | | $ | 1,941,769 | |
| | | | |
Including accumulated net investment loss of: | | $ | (26,008) | | | $ | – | | | $ | (4,581) | | | $ | – | |
| | | | |
OTHER INFORMATION: | | | | | | | | | | | | | | | | |
Share Transactions: | | | | | | | | | | | | | | | | |
Beginning shares | | | 118,741 | | | | 100,000 | | | | 154,872 | | | | 100,000 | |
Shares sold | | | 664,069 | | | | 100,810 | | | | 56,463 | | | | 136,198 | |
Shares issued in reinvestment of dividends | | | 5,773 | | | | 1,819 | | | | 9,357 | | | | 2,822 | |
Less shares redeemed | | | (7,945) | | | | (83,888) | | | | (128) | | | | (84,148) | |
| | | | |
Ending shares | | | 780,638 | | | | 118,741 | | | | 220,564 | | | | 154,872 | |
| | | | |
See Notes to Financial Statements.
| | |
Semi-Annual Report | December 31, 2012 | | 15 |
| | |
| | Financial Highlights |
| |
Cortina Small Cap Growth Fund | | For a share outstanding throughout the periods presented. |
| | | | |
| | | Six Months Ended December 31, 2012 (Unaudited) | | For the Period September 30, 2011 (Inception) to June 30, 2012 |
|
NET ASSET VALUE, BEGINNING OF PERIOD | | $11.87 | | $10.00 |
INCOME/(LOSS) FROM INVESTMENT OPERATIONS: | | | | |
Net investment loss(a) | | (0.05) | | (0.09) |
Net realized and unrealized gain/(loss) on investments | | (0.04) | | 2.22 |
| | |
Total from Investment Operations | | (0.09) | | 2.13 |
| | |
| | |
DIVIDENDS AND DISTRIBUTIONS TO SHAREHOLDERS: | | | | |
From net realized gain on investments | | (0.09) | | (0.26) |
| | |
Total Dividends and Distributions to Shareholders | | (0.09) | | (0.26) |
| | |
| | |
Paid-in Capital from Redemption Fees | | – | | 0.00(b) |
| | |
| | |
NET INCREASE/(DECREASE) IN NET ASSET VALUE | | (0.18) | | 1.87 |
| | |
| | |
NET ASSET VALUE, END OF PERIOD | | $11.69 | | $11.87 |
| | |
| | |
TOTAL RETURN(c) | | (0.74%) | | 21.40% |
| | |
RATIOS AND SUPPLEMENTAL DATA: | | | | |
Net assets, end of period (in 000s) | | $9,128 | | $1,410 |
| | |
RATIOS TO AVERAGE NET ASSETS: | | | | |
Operating expenses excluding waiver/reimbursement | | 5.11%(d) | | 21.70%(d) |
Operating expenses including waiver/reimbursement | | 1.10%(d) | | 1.10%(d) |
Net investment loss including waiver/reimbursement | | (0.87)%(d) | | (0.99)%(d) |
| | |
PORTFOLIO TURNOVER RATE(c) | | 29% | | 144% |
| (a) | Calculated using average shares throughout the period. |
| (b) | Less than $0.005 per share. |
See Notes to Financial Statements.
| | |
16 | | 1-855-612-3936 | www.cortinafunds.com |
| | |
| | Financial Highlights |
| |
Cortina Small Cap Value Fund | | For a share outstanding throughout the periods presented. |
| | | | |
| | | Six Months Ended December 31, 2012 (Unaudited) | | For the Period September 30, 2011 (Inception) to June 30, 2012 |
|
NET ASSET VALUE, BEGINNING OF PERIOD | | $12.54 | | $10.00 |
INCOME/(LOSS) FROM INVESTMENT OPERATIONS: | | | | |
Net investment income/(loss)(a) | | 0.05 | | (0.03) |
Net realized and unrealized gain on investments | | 1.10 | | 3.14 |
| | |
Total from Investment Operations | | 1.15 | | 3.11 |
| | |
| | |
DIVIDENDS AND DISTRIBUTIONS TO SHAREHOLDERS: | | | | |
From net investment income | | (0.07) | | – |
From net realized gain on investments | | (0.54) | | (0.57) |
| | |
Total Dividends and Distributions to Shareholders | | (0.61) | | (0.57) |
| | |
| | |
Paid-in Capital from Redemption Fees | | – | | 0.00(b) |
| | |
| | |
NET INCREASE IN NET ASSET VALUE | | 0.54 | | 2.54 |
| | |
| | |
NET ASSET VALUE, END OF PERIOD | | $13.08 | | $12.54 |
| | |
| | |
TOTAL RETURN(c) | | 9.20% | | 31.99% |
| | |
RATIOS AND SUPPLEMENTAL DATA: | | | | |
Net assets, end of period (in 000s) | | $2,886 | | $1,942 |
| | |
RATIOS TO AVERAGE NET ASSETS: | | | | |
Operating expenses excluding waiver/reimbursement | | 7.45%(d) | | 22.37%(d) |
Operating expenses including waiver/reimbursement | | 1.10%(d) | | 1.10%(d) |
Net investment income/(loss) including waiver/reimbursement | | 0.82%(d) | | (0.32)%(d) |
| | |
PORTFOLIO TURNOVER RATE(c) | | 39% | | 146% |
| (a) | Calculated using average shares throughout the period. |
| (b) | Less than $0.005 per share. |
See Notes to Financial Statements.
| | |
Semi-Annual Report | December 31, 2012 | | 17 |
| | |
| | Notes to Financial Statements |
| |
| | December 31, 2012 (Unaudited) |
1. ORGANIZATION
Cortina Funds, Inc. (the “Corporation”), is an open-end management investment company registered under the Investment Company Act of 1940, as amended (the “1940 Act”). The Corporation was organized on June 30, 2004 as a Wisconsin corporation. The Corporation currently offers shares of common stock (“shares”) of the Cortina Small Cap Growth Fund and the Cortina Small Cap Value Fund (each a “Fund” and collectively, the “Funds”). The Cortina Small Cap Growth Fund is a diversified portfolio with an investment objective to seek growth of capital, and the Cortina Small Cap Value Fund is a diversified portfolio with an investment objective to seek long-term capital appreciation. Shares of each Fund are designated as Institutional Shares with an indefinite number of shares authorized at $0.01 par value. The Articles of Incorporation, as amended and restated, permits the Board of Directors (the “Board”) to create additional funds and share classes. The Institutional Class is currently the only class offered.
2. SIGNIFICANT ACCOUNTING POLICIES
The following is a summary of significant accounting policies followed by the Funds. These policies are in conformity with U.S. generally accepted accounting principles (“GAAP”).
Use of Estimates — The accompanying financial statements were prepared in accordance with GAAP, which require the use of estimates and assumptions made by management. These may affect the reported amounts of assets and liabilities and disclosure of contingent asset and liabilities at the date of the financial statements and the reported amounts of increases and decreases in net assets from operations during the reporting period. Actual results could differ from those estimates.
Investment Valuation — Investment securities are valued at the last sale price at the close of the principal exchange on which they trade, except for securities listed on the National Association of Securities Dealers Automated Quotations (“NASDAQ”) exchange, which are valued at the NASDAQ official closing price. Unlisted securities or listed securities for which there were no sales during the day are valued at the closing bid price on such exchanges or over-the-counter markets. Investments for which market quotations are not readily available are valued at fair value as determined in good faith under consistently applied procedures approved by and under the general supervision of the Funds’ Board.
Investment Transactions — Investment security transactions are accounted for on trade date. Gains and losses on securities sold are determined on a specific identification basis.
Investment Income — Interest income is accrued and recorded on a daily basis including amortization of premiums, accretions of discounts and income earned from money market funds. Interest is not accrued on securities that are in default. Dividend income is recorded on the ex-dividend date.
Fair Value Measurements — A three-tier hierarchy has been established to classify fair value measurements for disclosure purposes. Inputs refer broadly to the assumptions that market participants would use in pricing the asset or liability, including assumptions about risk. Inputs may be observable or unobservable. Observable inputs are inputs that reflect the assumptions market participants would use in pricing the asset or liability that are developed based on market data obtained from sources independent of the reporting entity. Unobservable inputs are inputs that reflect the reporting entity’s own assumptions about the assumptions market participants would use in pricing the asset or liability that are developed based on the best information available. In accordance with the authoritative guidance on fair value measurements and disclosure under GAAP, the Funds disclose fair value of their investments in a hierarchy that prioritizes the inputs to valuation techniques used to measure the fair value.
Various inputs are used in determining the value of each Fund’s investments as of the reporting period end. The designated input levels are not necessarily an indication of the risk or liquidity associated with these investments. These inputs are categorized in the following hierarchy under applicable financial accounting standards:
| | | | |
Level 1 | | — | | Unadjusted quoted prices in active markets for identical, unrestricted assets or liabilities that the Funds have the ability to access at the measurement date; |
| | |
Level 2 | | — | | Quoted prices which are not active, quoted prices for similar assets or liabilities in active markets or inputs other than quoted prices that are observable (either directly or indirectly) for substantially the full term of the asset or liability; and |
| | |
Level 3 | | — | | Significant unobservable prices or inputs (including the Fund’s own assumptions in determining the fair value of investments) where there is little or no market activity for the asset or liability at the measurement date. |
The availability of observable inputs can vary from security to security and is affected by a wide variety of factors, including, for example, the type of security, whether the security is new and not yet established in the marketplace, the liquidity of markets, and other characteristics particular to the security. To the extent that valuation is based on models or inputs that are less observable or unobservable in the market, the determination of
| | |
18 | | 1-855-612-3936 | www.cortinafunds.com |
| | |
| | Notes to Financial Statements |
| |
| | December 31, 2012 (Unaudited) |
fair value requires more judgment. Accordingly, the degree of judgment exercised in determining fair value is greatest for instruments categorized in Level 3.
An investment level within the fair value hierarchy is based on the lowest level input, individually or in the aggregate, that is significant to fair value measurement. The valuation techniques used by the Funds to measure fair value during the six months ended December 31, 2012 maximized the use of observable inputs and minimized the use of unobservable inputs.
The inputs or methodology used for valuing securities are not necessarily an indication of the risk or liquidity associated with investing in those securities. The following is a summary of the inputs used in valuing the Funds’ investments as of December 31, 2012:
Cortina Small Cap Growth Fund
| | | | | | | | | | | | | | | | |
| | | Valuation Inputs | | | | |
| | | | | | | | |
| Investments in Securities at Value* | | Level 1 | | | Level 2 | | | Level 3 | | | Total | |
| |
Common Stocks | | $ | 8,809,559 | | | $ | – | | | $ | – | | | $ | 8,809,559 | |
Short Term Investment | | | 338,971 | | | | – | | | | – | | | | 338,971 | |
| | | | |
Total | | $ | 9,148,530 | | | $ | – | | | $ | – | | | $ | 9,148,530 | |
| | | | |
Cortina Small Cap Value Fund
| | | | | | | | | | | | | | | | |
| | | Valuation Inputs | | | | |
| | | | | | | | |
| Investments in Securities at Value* | | Level 1 | | | Level 2 | | | Level 3 | | | Total | |
| |
Common Stocks | | $ | 2,752,980 | | | $ | – | | | $ | – | | | $ | 2,752,980 | |
Short Term Investment | | | 164,816 | | | | – | | | | – | | | | 164,816 | |
| | | | |
Total | | $ | 2,917,796 | | | $ | – | | | $ | – | | | $ | 2,917,796 | |
| | | | |
* See Schedule of Investments for sector classification.
For the six months ended December 31, 2012, there have been no significant changes to the Funds’ fair value methodologies. Additionally, there were no transfers into or out of Levels 1 and 2 during the period ended December 31, 2012. It is the Funds’ policy to recognize transfers at the end of the reporting period.
For six months ended December 31, 2012, the Funds did not have significant unobservable inputs (Level 3) used in determining fair value. Therefore, a reconciliation of assets in which significant unobservable inputs (Level 3) were used in determining fair value is not applicable.
Affiliated Companies — An affiliated company is a company that can have direct or indirect common ownership. The Funds do not hold any investments in affiliated companies as of December 31, 2012.
Offering Costs — Offering costs, including costs of printing initial prospectuses, legal and registration fees, are being amortized over twelve months from the inception date of the Funds. The offering costs are fully amortized as of December 31, 2012.
Expenses — The Funds bear expenses incurred specifically on each Fund’s respective behalf as well as a portion of general Corporation expenses, which may be allocated on the basis of relative net assets or the nature of the services performed relative to applicability to each Fund.
Distributions to Shareholders — Dividends from net investment income and distributions of net realized capital gains, if any, will be declared and paid at least annually. Income and capital gains distributions are determined in accordance with income tax regulations, which may differ from GAAP. Distributions to shareholders are recorded on the ex-dividend date.
Fees on Redemptions — The Funds will deduct a 2.00% redemption proceeds fee on Fund shares held 60 days or less. The redemption fee is not a fee to finance sales or sales promotion expenses, but is paid to the Funds to defray the costs of liquidating an investor and discouraging short-term trading of the Funds’ shares. No redemption fee will be imposed on redemptions initiated by the Funds.
Federal Income Taxes — No provision for income taxes is included in the accompanying financial statements, as the Funds intend to distribute to shareholders all taxable investment income and realized gains, and otherwise comply with Subchapter M of the Internal Revenue Code applicable to regulated investment companies.
| | |
Semi-Annual Report | December 31, 2012 | | 19 |
| | |
| | Notes to Financial Statements |
| |
| | December 31, 2012 (Unaudited) |
3. ADVISORY FEES, FUND ACCOUNTING, ADMINISTRATION FEES, AND OTHER AGREEMENTS
Investment Advisory
The Adviser is subject to the general supervision of the Board and is responsible for the overall management of the Funds’ business affairs. The Adviser invests the assets of the Funds based on the Funds’ investment objectives and policies. The Adviser is entitled to an investment advisory fee, computed daily and payable monthly, of 1.00% of the average daily net assets for each Fund.
The Adviser has contractually agreed to waive fees with respect to each of the Funds so that the net annual operating expenses (excluding taxes, leverage, interest, brokerage commissions, dividends or interest expenses on short positions, acquired fund fees and expenses, and extraordinary expenses) of the Funds’ institutional shares will not exceed 1.10% of average daily net assets of each Fund. The Adviser may request a reimbursement from the Funds to recapture any reduced management fees or reimbursed Fund expenses within three years following the fee reduction or expense reimbursement, but only to the extent the Funds’ total annual fund operating expenses including offering costs, plus any requested reimbursement amount, including previously waived organizational costs, are less than the above limit at the time of the request. Any such reimbursement is subject to review by the Board. As of December 31, 2012, the Cortina Small Cap Growth Fund and the Cortina Small Cap Value Fund had receivables from the Adviser of $16,479 and $6,681, respectively.
As of December 31, 2012, reimbursements (including offering costs and the previously waived organizational costs) that may potentially be made by the Fund to the Adviser total $293,001 for the Cortina Small Cap Growth Fund and $244,786 for the Cortina Small Cap Value Fund, which expires as follows:
| | | | | | |
| | | Cortina Small Cap Growth Fund | | | |
| | September 19, 2014 | | $ | 10,250 | |
| | June 30, 2015 | | | 163,407 | |
| | June 30, 2016 | | | 119,344 | |
| | | | $ | 293,001 | |
| | |
| | | Cortina Small Cap Value Fund | | | |
| | September 19, 2014 | | $ | 10,250 | |
| | June 30, 2015 | | | 152,715 | |
| | June 30, 2016 | | | 81,821 | |
| | | | $ | 244,786 | |
Fund Accounting Fees and Expenses
ALPS Fund Services, Inc. (“ALPS” or the “Administrator”) provides administrative, fund accounting and other services to the Funds for a monthly administration fee based on the Fund’s average daily net assets at the following annual rates.
Year 1
Greater of $175,000 annual minimum in Year 1 or the following basis point fee schedule:
| | | | |
Average Daily Net Assets | | Basis Point
Fee Rate | | |
Between $0-$500M | | 5.0 | | |
$500M-$1B | | 3.0 | | |
Above $1B | | 2.0 | | |
Year 2
Greater of $190,000 annual minimum in Year 2 or the above basis point fee schedule.
The Administrator is also reimbursed by the Funds for certain out of pocket expenses.
Transfer Agent
ALPS serves as transfer, dividend paying and shareholder servicing agent for the Funds (the “Transfer Agent”).
Compliance Services
ALPS provides services that assist the Corporation’s Chief Compliance Officer in monitoring and testing the policies and procedures of the Corporation in conjunction with requirements under Rule 38a-1 under the 1940 Act. ALPS is compensated under the Administration Agreement.
| | |
20 | | 1-855-612-3936 | www.cortinafunds.com |
| | |
| | Notes to Financial Statements |
| |
| | December 31, 2012 (Unaudited) |
Distributor
The Funds have entered into a Distribution Agreement with ALPS Distributors, Inc (“the Distributor”) to provide distribution services to the Funds. The Distributor serves as underwriter/distributor of shares of the Funds.
Certain Directors and Officers of the Funds are also officers of the Adviser.
4. PURCHASES AND SALES OF INVESTMENT SECURITIES
The aggregate cost of purchases and proceeds from sales of investment securities, excluding short-term securities, are shown below for the six months ended December 31, 2012. Purchases and proceeds from sales of U.S. Government obligations are included in the totals of Purchases of Securities and Proceeds from Sales of Securities below and also broken out separately for your convenience:
| | | | | | | | |
| Fund Name | | Purchases | | | Sales | |
Cortina Small Cap Growth Fund | | $ | 9,362,036 | | | $ | 1,661,050 | |
Cortina Small Cap Value Fund | | $ | 1,605,942 | | | $ | 953,368 | |
There were no purchases of long-term U.S. Government Obligations for either Fund during the six months ended December 31, 2012.
5. TAX BASIS INFORMATION
Distributions are determined in accordance with Federal income tax regulations, which differ from GAAP, and, therefore, may differ significantly in amount or character from net investment income and realized gains for financial reporting purposes. Financial reporting records are adjusted for permanent book/tax differences to reflect tax character but are not adjusted for temporary differences.
The Funds follow ASC 740, “Income Taxes” (“ASC 740”), which requires that the financial statements effects of a tax position taken or expected to be taken in a tax return be recognized in the financial statements when it is more likely than not, based on the technical merits, that the position will be sustained upon examination. Management has concluded that the Funds have taken no uncertain tax positions that require adjustments to the financial statements to comply with the provisions of ASC 740. The Funds recognize interest and penalties, if any, related to unrecognized tax benefits on uncertain tax positions as income tax expense in the statement of operations. During the six months ended December 31, 2012, the Funds did not incur any interest or penalties. The Funds file income tax returns in the U.S. Federal jurisdiction and the state of Wisconsin. The statute of limitations on the Funds’ federal and Wisconsin tax returns remains open for the fiscal period ended June 30, 2012. To the best of the Funds’ knowledge, no income tax returns are currently under examination. The Funds are subject to examination by U.S. taxing authorities for the tax periods since the commencement of operations. During the six months ended December 31, 2012, neither Fund recorded a liability of any uncertain tax positions in the accompanying financial statements.
Income and long-term capital gain distributions are determined in accordance with Federal income tax regulations, which differ from GAAP, and, therefore, may differ significantly in amount or character from net investment income and realized gains for financial reporting purposes. The amounts and characteristics of tax basis distributions and composition of distributable earnings/(accumulated losses) are finalized at fiscal year end: accordingly, tax basis balances have not been determined as of December 31, 2012.
The tax character of distributions paid during the period ended June 30, 2012, were as follows:
| | | | |
| | | Distributions from |
| Fund | | For the period ended | | Ordinary Income |
Cortina Small Cap Growth Fund | | 6/30/2012 | | $ 20,406 |
Cortina Small Cap Value Fund | | 6/30/2012 | | $ 30,530 |
As of December 31, 2012, the aggregate cost of investments, gross unrealized appreciation/(depreciation) and net unrealized appreciation/ (depreciation) for Federal tax purposes was as follows:
| | | | | | | | | | | | | | | | |
| Fund | | Cost of
Investments | | | Gross Unrealized
Appreciation
(excess of value
over tax cost) | | | Gross Unrealized
(Depreciation)
(excess of tax
cost over value) | | | Net
Unrealized
Appreciation/ (Depreciation) | |
Cortina Small Cap Growth Fund | | $ | 9,175,031 | | | $ | 533,133 | | | $ | (559,634) | | | $ | (26,501) | |
Cortina Small Cap Value Fund | | $ | 2,573,144 | | | $ | 400,023 | | | $ | (55,371) | | | $ | 344,652 | |
The difference between book basis and tax basis net unrealized appreciation is attributable to the deferral of losses from wash sales.
| | |
Semi-Annual Report | December 31, 2012 | | 21 |
| | |
| | Notes to Financial Statements |
| |
| | December 31, 2012 (Unaudited) |
6. COMMITMENTS AND CONTINGENCIES
Under the Corporation’s organizational documents, its Officers and Directors are indemnified against certain liabilities arising out of the performance of their duties to the Funds. In addition, in the normal course of business, the Corporation entered into contracts with its service providers, on behalf of the Funds, and others that provide for general indemnifications. The Funds’ maximum exposure under these arrangements is unknown, as this would involve future claims that may be made against the Funds. The Funds expect risk of loss to be remote.
| | |
22 | | 1-855-612-3936 | www.cortinafunds.com |
| | |
| | Additional Information |
| |
| | December 31, 2012 (Unaudited) |
1. PROXY VOTING POLICIES AND VOTING RECORD
A description of the policies and procedures that the Funds use to vote proxies relating to portfolio securities is available without charge upon request by calling toll-free 1-855-612-3936, or on the Securities and Exchange Commission’s (“SEC”) website at http://www.sec.gov. Information regarding how the Funds voted proxies relating to portfolio securities during the most recent fiscal year ending June 30, 2012 is available without charge upon request by calling toll-free 1-855-612-3936, or on the SEC’s website at http://www.sec.gov.
2. QUARTERLY PORTFOLIO HOLDINGS
The Corporation files a complete listing of portfolio holdings for the Funds with the SEC as of the first and third quarters of each fiscal year on Form N-Q. The filings are available upon request by calling 1-855-612-3936. Furthermore, you may obtain a copy of the filing on the SEC’s website at http://www.sec.gov. The Funds’ Forms N-Q may also be reviewed and copied at the SEC’s Public Reference Room in Washington, D.C., and information on the operation of the Public Reference Room may be obtained by calling 1-800-SEC-0330.
| | |
Semi-Annual Report | December 31, 2012 | | 23 |
This page intentionally left blank.

Material must be accompanied or preceded by the prospectus.
The Cortina Funds are distributed by ALPS Distributors, Inc.
Item 2. Code of Ethics.
Not applicable to this report.
Item 3. Audit Committee Financial Expert.
Not applicable to this report.
Item 4. Principal Accountant Fees and Services.
Not applicable to this report.
Item 5. Audit Committee of Listed Registrants.
Not applicable to registrant.
Item 6. Investments.
The Schedule of Investments is included as part of the report to shareholders filed under Item 1 of this Form N-CSR.
Item 7. Disclosure of Proxy Voting Policies and Procedures for Closed-End Management Investment Companies.
Not applicable to registrant.
Item 8. Portfolio Managers of Closed-End Management Investment Companies.
Not applicable to registrant.
Item 9. Purchases of Equity Securities by Closed-End Management Investment Company and Affiliated Purchasers.
Not applicable to registrant.
Item 10. Submission of Matters to Vote of Security Holders.
Not applicable.
Item 11. Controls and Procedures.
| | (a) | The registrant’s principal executive officer and principal financial officer have concluded that the registrant’s disclosure controls and procedures (as defined in Rule 30a-3(c) under the Investment Company Act of 1940, as amended) are effective based on their evaluation of these controls and procedures as of a date within 90 days of the filing date of this report. |
| | (b) | There was no change in the registrant’s internal control over financial reporting (as defined in Rule 30a-3(d) under the Investment Company Act of 1940, as amended) during the second fiscal quarter of the period covered by this report that has materially affected, or is reasonably likely to materially affect, the registrant’s internal control over financial reporting. | |
Item 12. Exhibits.
| | (a)(1) | Not applicable to this report. |
| | (a)(2) | The certifications required by Rule 30a-2(a) of the Investment Company Act of 1940, as amended, and Section 302 of the Sarbanes-Oxley Act of 2002 are attached hereto as Ex.99.Cert. |
| | (b) | A certification of the registrant’s principal executive officer and principal financial officer, as required by Rule 30a-2(b) under the Investment Company Act of 1940, as amended, is attached as Ex.99.906.Cert. |
SIGNATURES
Pursuant to the requirements of the Securities Exchange Act of 1934 and the Investment Company Act of 1940, the registrant has duly caused this report to be signed on its behalf by the undersigned, thereunto duly authorized.
| | |
Cortina Funds, Inc. |
| |
By: | | /s/ Ryan T. Davies |
| | Ryan T. Davies, President |
| | (Principal Executive Officer) |
| |
Date: | | March 6, 2013 |
Pursuant to the requirements of the Securities Exchange Act of 1934 and the Investment Company Act of 1940, this report has been signed below by the following persons on behalf of the registrant and in the capacities and on the dates indicated.
| | |
By: | | /s/ Terese Nielsen |
| | Terese Nielsen, Treasurer and Principal Accounting Officer (Principal Financial Officer) |
| |
Date: | | March 6, 2013 |