UNITED STATES
SECURITIES AND EXCHANGE COMMISSION
Washington, D.C. 20549
FORM N-CSR
CERTIFIED SHAREHOLDER REPORT OF REGISTERED
MANAGEMENT INVESTMENT COMPANIES
Investment Company Act file number: 811-21580
CORTINA FUNDS, INC.
(Exact name of registrant as specified in charter)
825 N. Jefferson St., Suite 400, Milwaukee, WI 53202
(Address of principal executive offices) (Zip code)
(414) 397-1629
Registrant’s telephone number, including area code
Lori Hoch
825 N. Jefferson St., Suite 400
Milwaukee, WI 53202
(Name and address of agent for service)
Date of fiscal year end: June 30
Date of reporting period: September 30, 2011 – June 30, 2012
| Item 1. | Reports to Stockholders. |
| | |

| | Shareholder Letter |
Cortina Small Cap Growth Fund | | June 30, 2012 (Unaudited) |
DEAR FELLOW SHAREHOLDERS:
June 30th marks the end of the first fiscal year for the Cortina Small Cap Growth Fund and the nine-month mark since the Fund’s inception in September of 2011. In hindsight, that marked a very opportune time to launch an equity mutual fund, particularly in the small cap growth arena. Even after a difficult June quarter, the Russell 2000® Growth Index returned over 25% for the nine-month period. The Cortina Small Cap Growth Fund got off to an excellent start from an absolute and relative return standpoint in its first six months of existence before stumbling in the June quarter as our style of growth investing came under pressure and a handful of holdings were severely punished after reporting disappointing Q1 earnings. Despite the recent weakness, the Fund finished its first fiscal year up nearly 21%.
The biggest contributor to the Fund’s strong absolute returns was the Technology sector. The Fund has had thematic exposure to a number of very powerful trends that recently became a focal point for investors. These high-growth trends include: companies embracing new marketing avenues to reach their current and potential customers, including mobile platforms and social media; software normally sold in a packaged license now being hosted centrally and offered to the client on a subscription basis; and the pervasiveness of smartphones and how it is changing the landscape for communications, commerce and entertainment. Old line technology companies who are flush with cash but behind the innovation curve have been aggressively acquiring smaller companies, including several public companies, at premium prices. As a result, this sector was a strong contributor to relative performance.
The Health Care sector was the second biggest contributor to absolute performance, though a slight detractor from relative performance. The Fund’s best returns within the Health Care sector came from medical technology companies –an area where innovation is rampant and our thematic process has helped to identify companies very early in their growth phase. We currently have three themes that have led to ideas within the med tech industry – Point-of-Care Diagnostics, Healthy Living/Anti-Aging (aka the Vanity Theme) and Minimally Invasive Health Care, which contains Zoll Medical, the largest single contributor to positive returns. Among Zoll’s many products is the LifeVest, a wearable defibrillator that is worn by patients who are at risk for a cardiac event but not eligible for an implantable defibrillator. Zoll was acquired by a Japanese conglomerate in March. The Fund lost ground to the benchmark due to our lack of exposure to biotech and pharmaceutical companies – two of the better performing industries within the index. While there are several potentially exciting products, many of the small cap biotech and pharmaceutical stocks come with extreme binary risk related to clinical trial outcomes. As a general rule, in an effort to preserve client capital, we avoid companies whose viability is closely tied to a single event.
Countering the strong returns in the Technology and Health Care sectors, the Fund generated negative absolute returns in the Consumer Discretionary sector, leading to overall portfolio underperformance relative to the Russell 2000® Growth Index. Weakness was a combination of poor fundamental performance at a handful of companies and multiple compression on high-growth consumer companies. Many of the better performing consumer stocks within the index were lower growth companies that do not meet our investment criteria.
The outlook for the stock market going forward will most likely take its cues from the direction of the global economy, which is currently unclear. Because of its structural fiscal challenges, and enhanced by the political complexity of operating within the European Union, the European economy is poor and appears to be worsening. Further east, China’s economy has been slowing, although it always merits pointing out that its economy is still forecast to grow over 7%. This leaves the United States economy as the least controversial of the major regions. Our economy has been in slow growth mode and there is not much visible that suggests there is a dramatic acceleration on the horizon. Yet a bias toward domestic companies has emerged and those sectors that have higher domestic revenue exposure (Health Care, Telecom and Utilities) have been performing better than those with high foreign sales (Technology, Energy and Materials). In addition, microcap stocks have done better than the larger companies of late, which is a trend that is in synch with our investment strategy. Finally, in markets where the macroeconomy cannot apply a robust overall tailwind, individual companies with company-specific growth drivers may stand out and shine brighter.
Investing involves risks, including loss of principal.
| | |
Annual Report | June 30, 2012 | | 1 |
| | |
| | Portfolio Information |
Cortina Small Cap Growth Fund | | June 30, 2012 (Unaudited) |
Growth of $10,000 Investment (Unaudited)
For the period from September 30, 2011 (Inception) to June 30, 2012.
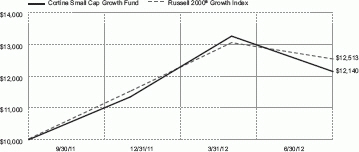
This graph assumes an initial $10,000 investment at September 30, 2011 (Inception Date). The Cortina Small Cap Growth Fund (the “Fund”) will deduct a 2.00% redemption proceeds fee on Fund shares held 60 days or less. This graph depicts the performance of the Fund versus the Russell 2000® Growth Index. It is important to note the Fund is a professionally managed mutual fund while the index is not available for investment and is unmanaged. The comparison is shown for illustrative purposes only.
This chart does not reflect the deduction of taxes that a shareholder would pay on Fund distributions or the redemption of Fund shares.
The Fund is new and has limited operating history. Funds that emphasize investments in smaller companies generally experience greater price volatility.
Performance Returns for the period ended June 30, 2012
| | | | | | | | |
| | | 1 Month | | 6 Months | | Since Inception* | | Gross Expense Ratio** |
Cortina Small Cap Growth Fund | | 5.14% | | 7.03% | | 21.40% | | 3.09% |
Russell 2000® Growth Index | | 5.16% | | 8.82% | | 25.13% | | |
| * | The Fund’s inception date is September 30, 2011. |
| ** | Cortina Asset Management, LLC (“Adviser”) has contractually agreed to waive management fees and/or reimburse the Fund’s operating expenses in order to limit the Fund’s total annual fund operating expenses to 1.10% of average daily net assets of the Fund. The agreement will continue in effect at least through December 31, 2012, subject thereafter to annual re-approval of the agreement by the Fund’s Board of Directors. |
Past performance does not guarantee future results. The performance data quoted represents past performance and current returns may be lower or higher. Total return figures include change in share price, reinvestment of dividends and capital gains. The investment return and principal value will fluctuate so that an investor’s shares, when redeemed may be worth more or less than their original cost. To obtain performance information current to the most recent month end, call 1-855-612-3936.
Russell 2000® Growth Index measures the performance of the small-cap growth segment of the U.S. equity universe. It includes those Russell 2000® companies with higher price-to-value ratios and higher forecasted growth values. All indices are unmanaged. It is not possible to invest directly in an index.
Sector Allocations***

| *** | Percentages are based on net assets as of June 30, 2012. Holdings are subject to change. |
| | |
2 | | 1-855-612-3936 | www.cortinafunds.com |
| | |
| | Shareholder Letter |
Cortina Small Cap Value Fund | | June 30, 2012 (Unaudited) |
DEAR FELLOW SHAREHOLDERS:
We are pleased to report the Cortina Small Cap Value Fund has delivered healthy returns both year-to-date and since inception. The Fund has outperformed its benchmark, the Russell 2000® Value Index, in both periods, and the outperformance was driven entirely by stock selection, as sector allocation was a slight negative. We view the performance as a solid affirmation that our philosophy of focusing on companies that are changing for the better, while adhering to a rigorous analytical framework, is an effective means of generating superior investment returns.
“Hope is the last thing a person does before they are defeated.”
-Henry Rollins
Reality often conquers hope, thus taking gains and minimizing losses is crucial in these times. Political, economic and financial turbulence remain significant factors to be wary of, and the direct result on our portfolio is that turnover remains higher than we would prefer. As a general statement, today feels much like July of 12 months ago: Economic uncertainty reigns, European leaders are still incapable of repairing the problems in their region, and U.S. policymakers produce little but pandering speeches. Everybody wishes for better, but nobody is actually delivering better. Hope is repeatedly extinguished.
One thing politicians succeed in is muddying the waters, but in this case it may benefit our overweight in Producer Durables (Industrials). This June, Congress passed its transportation funding bill. Hidden in the document is a change to pension accounting, which allows companies to use a discount rate based on an average interest rate over the last twenty-five years rather than the prior two years. The pernicious influence of the Federal Reserve’s low rates created a situation where many pensions are, on an accounting basis, dramatically underfunded. This change will result in a significant lowering of required pension contributions, which benefits companies but lowers tax deductions thus padding government revenues. A policy meant to improve pensions’ health that results in companies contributing less to pensions and paying more taxes may be perverse, but it is a change we believe the market has underappreciated. The critical point is that while we may not necessarily agree with government policies, rather than stand on high and complain, we are finding companies where consensus expectations for free cash flow are dramatically understated, which may create investment opportunities.
Since inception, the largest contributors to performance have been Financial Services and Producer Durables, while Technology and Energy have been the notable laggards. We have benefitted from several takeovers, but only one was in the top five contributors, an equipment rental company. In Financial Services, we were early to recognize the significant changes in the mortgage servicing industry, with several holdings in the category generating solid returns. We also benefitted from the newly defensive nature of small banks that are attractively valued and, unlike many companies, have virtually no overseas exposure where growth is slowing the most rapidly. Our exposure to Industrials, notably several transportation companies, was an important contributor to performance, as was our underweight in Energy.
Our outperformance year-to-date was driven by strong stock selection in every sector with the exception of Energy. Selection within Consumer Discretionary, Financials and Technology were particularly notable, and while Energy was a negative contributor on an absolute basis, our underweight position relative to the benchmark resulted in a de minimus impact to the overall portfolio.
Today our largest overweight remains Producer Durables and, if one adjusts for our minimal exposure to REITs (Real Estate Investment Trusts) (one position), we are slightly overweight Financials. In a first since inception, we are now overweight Health Care. We had prepared for volatility around the Supreme Court decision, and took advantage of it by adding new positions in the sector. Now, with the Supreme Court ruling behind us, we expect further changes to create more opportunities in Health Care. Energy has been our largest underweight, but with many companies’ equities down 50% or more in the sector, we have been actively seeking new positions in the sector, and that weighting may rise if we can find companies undergoing the qualitative change we require.
Overall, we have no expectation that our political leaders will act responsibly in the near future, which is a sad commentary, and remain very careful in government-dependent sectors, such as Defense, Health Care and Infrastructure. On a happier note, we were delighted to learn the Kardashians signed a new three-year, $40 million dollar contract to continue broadcasting their lives to us. At least the country has its priorities straight.
As always, we continue to seek new investment opportunities while protecting your hard-earned capital, and thank you for your interest.
Investing involves risks, including loss of principal.
| | |
Annual Report | June 30, 2012 | | 3 |
| | |
| | Portfolio Information |
Cortina Small Cap Value Fund | | June 30, 2012 (Unaudited) |
Growth of $10,000 Investment (Unaudited)
For the period from September 30, 2011 (Inception) to June 30, 2012.
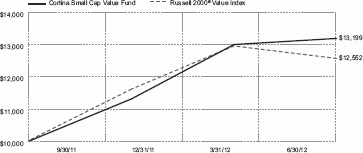
This graph assumes an initial $10,000 investment at September 30, 2011 (Inception Date). The Cortina Small Cap Value Fund (the “Fund”) will deduct a 2.00% redemption proceeds fee on Fund shares held 60 days or less. This graph depicts the performance of the Fund versus the Russell 2000® Value Index. It is important to note the Fund is a professionally managed mutual fund, while the index is not available for investment and is unmanaged. The comparison is shown for illustrative purposes only.
This chart does not reflect the deduction of taxes that a shareholder would pay on Fund distributions or the redemption of Fund shares.
The Fund is new and has limited operating history. Funds that emphasize investments in smaller companies generally experience greater price volatility.
Performance Returns for the period ended June 30, 2012
| | | | | | | | |
| | | 1 Month | | 6 Months | | Since Inception* | | Gross Expense Ratio** |
Cortina Small Cap Value Fund | | 5.56% | | 16.65% | | 31.99% | | 3.09% |
Russell 2000® Value Index | | 4.82% | | 8.23% | | 25.52% | | |
| * | The Fund’s inception date is September 30, 2011. |
| ** | Cortina Asset Management, LLC (“Adviser”) has contractually agreed to waive management fees and/or reimburse the Fund’s operating expenses in order to limit the Fund’s total annual fund operating expenses to 1.10% of average daily net assets of the Fund. The agreement will continue in effect at least through December 31, 2012, subject thereafter to annual re-approval of the agreement by the Fund’s Board of Directors. |
Past performance does not guarantee future results. The performance data quoted represents past performance and current returns may be lower or higher. Total return figures include change in share price, reinvestment of dividends and capital gains. The investment return and principal value will fluctuate so that an investor’s shares, when redeemed may be worth more or less than their original cost. To obtain performance information current to the most recent month end, call 1-855-612-3936.
Russell 2000® Value Index measures the performance of those Russell 2000® companies with lower price-to-book ratios and lower forecasted growth values. All indices are unmanaged. It is not possible to invest directly in an index.
Sector Allocations***
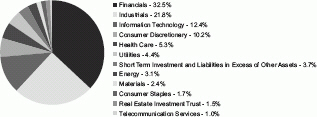
| *** | Percentages are based on net assets as of June 30, 2012. Holdings are subject to change. |
| | |
4 | | 1-855-612-3936 | www.cortinafunds.com |
| | |
| | Disclosure of Fund Expenses |
| | | June 30, 2012 (Unaudited) |
As a shareholder of the Fund(s), you incur ongoing costs, including management fees and other Fund expenses. This example is intended to help you understand your ongoing costs (in dollars) of investing in each Fund and to compare these costs with the ongoing costs of investing in other mutual funds. The example is based on an investment of $1,000 invested at the beginning of the period and held for the entire period, as indicated below.
Actual Expenses – The first line of the table below provides information about the actual account values and actual expenses. You may use the information in this line, together with the amount you invested, to estimate the expenses that you paid over the period. Simply divide your account value by $1,000 (for example, an $8,600 account value divided by $1,000 = 8.6) then multiply the result by the number in the first line under the heading entitled “Expenses Paid During Period” to estimate the expenses you paid on your account during this period.
Hypothetical Example for Comparison Purposes – The second line of the table below provides information about hypothetical account values and hypothetical expenses based on each Fund’s actual expense ratio and an assumed annual rate of return of 5% before expenses, which is not each Fund’s actual return. The hypothetical account values and expenses may not be used to estimate the actual ending account balance or expenses you paid for the period. You may use this information to compare the ongoing costs of investing in each Fund and other funds by comparing these 5% hypothetical examples with the 5% hypothetical examples that appear in the shareholder reports of other funds.
Please note that the expenses shown in the table are meant to highlight your ongoing costs only and do not reflect any direct costs, such as wire fees or low balance fees. Therefore, the second line of the table is useful in comparing ongoing costs and will not help you determine the relative total costs of owning different funds. In addition, if these direct costs were included, your costs would be higher.
| | | | | | | | | | | | | | | | |
| | | Beginning | | | Ending | | | | | | Net | |
| | | Account Value | | | Account Value | | | Expenses Paid | | | Expense | |
| | | January 1, 2012 | | | June 30, 2012 | | | During Period(a) | | | Ratios | |
Cortina Small Cap Growth Fund | | | | | | | | | | | | | | | | |
Actual Fund Return | | $ | 1,000.00 | | | $ | 1,070.30 | | | $ | 5.66 | | | | 1.10 | % |
Hypothetical Fund Return (assuming a 5% return before expenses) | | $ | 1,000.00 | | | $ | 1,019.39 | | | $ | 5.52 | | | | 1.10 | % |
Cortina Small Cap Value Fund | | | | | | | | | | | | | | | | |
Actual Fund Return | | $ | 1,000.00 | | | $ | 1,166.50 | | | $ | 5.93 | | | | 1.10 | % |
Hypothetical Fund Return (assuming a 5% return before expenses) | | $ | 1,000.00 | | | $ | 1,019.39 | | | $ | 5.52 | | | | 1.10 | % |
| (a) | Expenses are equal to the Fund’s annualized expense ratio multiplied by the average account value over the period, multiplied by the number of days in the most recent fiscal half year (182), divided by 366. |
| | |
Annual Report | June 30, 2012 | | 5 |
| | |
| | Schedule of Investments |
Cortina Small Cap Growth Fund | | June 30, 2012 |
| | | | | | | | |
| | | Shares | | | Value | |
COMMON STOCKS (98.3%) | | | | | | | | |
Consumer Discretionary (12.8%) | | | | | | | | |
Amerigon, Inc.(a) | | | 1,106 | | | $ | 12,708 | |
Black Diamond, Inc.(a) | | | 909 | | | | 8,590 | |
CafePress, Inc.(a) | | | 799 | | | | 11,889 | |
Crocs, Inc.(a) | | | 1,034 | | | | 16,699 | |
Envestnet, Inc.(a) | | | 907 | | | | 10,884 | |
Francesca’s Holdings Corp.(a) | | | 528 | | | | 14,261 | |
Fuel Systems Solutions, Inc.(a) | | | 628 | | | | 10,481 | |
hhgregg, Inc.(a) | | | 1,334 | | | | 15,087 | |
Ignite Restaurant Group, Inc.(a) | | | 569 | | | | 10,305 | |
Morgans Hotel Group Co.(a) | | | 1,764 | | | | 8,291 | |
Shutterfly, Inc.(a) | | | 556 | | | | 17,064 | |
Skullcandy, Inc.(a) | | | 1,214 | | | | 17,178 | |
Steven Madden, Ltd.(a) | | | 549 | | | | 17,431 | |
Teavana Holdings, Inc.(a) | | | 577 | | | | 7,807 | |
Tilly’s, Inc., Class A(a) | | | 140 | | | | 2,247 | |
| | | | | | | | |
| | | | | | | 180,922 | |
| | | | | | | | |
Consumer Staples (1.3%) | | | | | | | | |
The Fresh Market, Inc.(a) | | | 340 | | | | 18,234 | |
| | | | | | | | |
| | |
Energy (6.3%) | | | | | | | | |
Carrizo Oil & Gas, Inc.(a) | | | 504 | | | | 11,849 | |
Northern Oil & Gas, Inc.(a) | | | 989 | | | | 15,765 | |
Rex Energy Corp.(a) | | | 1,397 | | | | 15,660 | |
Sanchez Energy Corp.(a) | | | 613 | | | | 12,750 | |
Synergy Resources Corp.(a) | | | 3,607 | | | | 11,110 | |
Triangle Petroleum Corp.(a) | | | 3,765 | | | | 21,009 | |
| | | | | | | | |
| | | | | | | 88,143 | |
| | | | | | | | |
Financials (3.5%) | | | | | | | | |
BofI Holding, Inc.(a) | | | 413 | | | | 8,161 | |
Greenhill & Co., Inc. | | | 311 | | | | 11,087 | |
Pinnacle Financial Partners, Inc.(a) | | | 837 | | | | 16,330 | |
Texas Capital Bancshares, Inc.(a) | | | 324 | | | | 13,086 | |
| | | | | | | | |
| | | | | | | 48,664 | |
| | | | | | | | |
Health Care (28.9%) | | | | | | | | |
ABIOMED, Inc.(a) | | | 634 | | | | 14,468 | |
Accuray, Inc.(a) | | | 3,100 | | | | 21,204 | |
Align Technology, Inc.(a) | | | 614 | | | | 20,544 | |
AtriCure, Inc.(a) | | | 1,445 | | | | 13,886 | |
Cepheid, Inc.(a) | | | 334 | | | | 14,947 | |
Cerus Corp.(a) | | | 4,422 | | | | 14,681 | |
Conceptus, Inc.(a) | | | 890 | | | | 17,640 | |
DexCom, Inc.(a) | | | 1,276 | | | | 16,537 | |
Endologix, Inc.(a) | | | 1,352 | | | | 20,875 | |
Fluidigm Corp.(a) | | | 1,055 | | | | 15,867 | |
HealthStream, Inc.(a) | | | 673 | | | | 17,498 | |
Insulet Corp.(a) | | | 843 | | | | 18,015 | |
Luminex Corp.(a) | | | 665 | | | | 16,286 | |
Medidata Solutions, Inc.(a) | | | 895 | | | | 29,240 | |
Myriad Genetics, Inc.(a) | | | 600 | | | | 14,262 | |
Novadaq Technologies, Inc.(a) | | | 1,568 | | | | 10,459 | |
OraSure Technologies, Inc.(a) | | | 1,643 | | | | 18,467 | |
PhotoMedex, Inc.(a) | | | 1,109 | | | | 13,474 | |
Quidel Corp.(a) | | | 1,139 | | | | 17,860 | |
Soltra Medical, Inc.(a) | | | 6,101 | | | | 17,876 | |
Staar Surgical Co.(a) | | | 1,867 | | | | 14,507 | |
See Notes to Financial Statements.
| | |
6 | | 1-855-612-3936 | www.cortinafunds.com |
| | |
| | Schedule of Investments |
Cortina Small Cap Growth Fund | | June 30, 2012 |
| | | | | | | | |
| | | Shares | | | Value | |
COMMON STOCKS (continued) | | | | | | | | |
Health Care (continued) | | | | | | | | |
Synergetics USA, Inc.(a) | | | 2,740 | | | $ | 12,220 | |
TearLab Corp.(a) | | | 2,781 | | | | 8,871 | |
Uroplasty, Inc.(a) | | | 2,859 | | | | 13,123 | |
Volcano Corp.(a) | | | 533 | | | | 15,270 | |
| | | | | | | | |
| | | | | | | 408,077 | |
| | | | | | | | |
Industrials (10.8%) | | | | | | | | |
AO Smith Corp. | | | 280 | | | | 13,689 | |
Astronics Corp.(a) | | | 267 | | | | 7,540 | |
Chart Industries, Inc.(a) | | | 200 | | | | 13,752 | |
Dynamic Materials Corp. | | | 696 | | | | 12,062 | |
Flow International Corp.(a) | | | 4,264 | | | | 13,432 | |
Heritage Crystal Clean, Inc.(a) | | | 736 | | | | 12,034 | |
Manitex International, Inc.(a) | | | 952 | | | | 7,997 | |
Mistras Group, Inc.(a) | | | 588 | | | | 15,453 | |
Primoris Services Corp. | | | 1,206 | | | | 14,472 | |
Rush Enterprises, Inc., Class A(a) | | | 670 | | | | 10,954 | |
Titan Machinery, Inc.(a) | | | 450 | | | | 13,666 | |
Westport Innovations, Inc.(a) | | | 456 | | | | 16,758 | |
| | | | | | | | |
| | | | | | | 151,809 | |
| | | | | | | | |
Information Technology (33.5%) | | | | | | | | |
Allot Communications, Ltd.(a) | | | 356 | | | | 9,918 | |
Aruba Networks, Inc.(a) | | | 708 | | | | 10,656 | |
Boingo Wireless, Inc.(a) | | | 1,476 | | | | 17,151 | |
Brightcove, Inc.(a) | | | 813 | | | | 12,398 | |
BroadSoft, Inc.(a) | | | 658 | | | | 19,056 | |
CommVault Systems, Inc.(a) | | | 416 | | | | 20,621 | |
Computer Task Group, Inc.(a) | | | 858 | | | | 12,862 | |
Echo Global Logistics, Inc.(a) | | | 1,052 | | | | 20,051 | |
ExactTarget, Inc.(a) | | | 593 | | | | 12,963 | |
FARO Technologies, Inc.(a) | | | 259 | | | | 10,899 | |
FSI International, Inc.(a) | | | 3,826 | | | | 13,735 | |
Greenway Medical Technologies(a) | | | 1,203 | | | | 19,621 | |
Guidewire Software, Inc.(a) | | | 388 | | | | 10,911 | |
Imperva, Inc.(a) | | | 342 | | | | 9,857 | |
Infoblox, Inc.(a) | | | 284 | | | | 6,512 | |
Interactive Intelligence Group, Inc.(a) | | | 478 | | | | 13,484 | |
Kenexa Corp.(a) | | | 607 | | | | 17,621 | |
LivePerson, Inc.(a) | | | 766 | | | | 14,600 | |
LogMeIn, Inc.(a) | | | 385 | | | | 11,750 | |
MaxLinear, Inc., Class A(a) | | | 1,723 | | | | 8,546 | |
Monolithic Power Systems, Inc.(a) | | | 283 | | | | 5,623 | |
Netgear, Inc.(a) | | | 363 | | | | 12,527 | |
Procera Networks, Inc.(a) | | | 994 | | | | 24,164 | |
Proofpoint, Inc.(a) | | | 816 | | | | 13,831 | |
QLIK Technologies, Inc.(a) | | | 451 | | | | 9,976 | |
RADWARE Ltd.(a) | | | 343 | | | | 13,134 | |
Responsys, Inc.(a) | | | 1,203 | | | | 14,580 | |
Rudolph Technologies, Inc.(a) | | | 670 | | | | 5,842 | |
Sapient Corp. | | | 1,129 | | | | 11,369 | |
Semtech Corp.(a) | | | 518 | | | | 12,598 | |
SPS Commerce, Inc.(a) | | | 222 | | | | 6,744 | |
Stamps.com, Inc.(a) | | | 539 | | | | 13,297 | |
Synacor, Inc.(a) | | | 570 | | | | 7,809 | |
Synchronoss Technologies, Inc.(a) | | | 736 | | | | 13,594 | |
TechTarget, Inc.(a) | | | 1,797 | | | | 9,057 | |
See Notes to Financial Statements.
| | |
Annual Report | June 30, 2012 | | 7 |
| | |
| | Schedule of Investments |
Cortina Small Cap Growth Fund | | June 30, 2012 |
| | | | | | | | |
| | | Shares | | | Value | |
COMMON STOCKS (continued) | | | | | | | | |
Information Technology (continued) | | | | | | | | |
Vocera Communications, Inc.(a) | | | 452 | | | $ | 12,109 | |
Volterra Semiconductor Corp.(a) | | | 577 | | | | 13,531 | |
| | | | | | | | |
| | | | | | | 472,997 | |
| | | | | | | | |
Telecommunication Services (1.2%) | | | | | | | | |
inContact, Inc.(a) | | | 3,369 | | | | 16,879 | |
| | | | | | | | |
| | |
TOTAL COMMON STOCKS
(COST $1,248,425) | | | | | | | 1,385,725 | |
| | | | | | | | |
| | |
SHORT TERM INVESTMENT (3.4%) | | | | | | | | |
HighMark Diversified Money Market Fund, Fiduciary Class, 7 Day Yield 0.020% | | | 48,409 | | | | 48,409 | |
| | | | | | | | |
| | |
TOTAL SHORT TERM INVESTMENT
(COST $48,409) | | | | | | | 48,409 | |
| | | | | | | | |
| | |
TOTAL INVESTMENTS (101.7%)
(COST $1,296,834) | | | | | | | 1,434,134 | |
| | | | | | | | |
| | |
TOTAL LIABILITIES IN EXCESS OF OTHER ASSETS (-1.7%) | | | | | | | (24,322 | ) |
| | | | | | | | |
| | |
NET ASSETS 100.0% | | | | | | $ | 1,409,812 | |
| | | | | | | | |
| (a) | Non Income Producing Security. |
Common Abbreviations:
Ltd. - Limited.
| | |
8 | | 1-855-612-3936 | www.cortinafunds.com |
| | |
| | Schedule of Investments |
Cortina Small Cap Value Fund | | June 30, 2012 |
| | | | | | | | |
| | | Shares | | | Value | |
COMMON STOCKS (96.3%) | | | | | | | | |
Consumer Discretionary (10.2%) | | | | | | | | |
AFC Enterprises, Inc.(a) | | | 1,224 | | | $ | 28,323 | |
Cabela’s, Inc.(a) | | | 996 | | | | 37,659 | |
Denny’s Corp.(a) | | | 6,562 | | | | 29,135 | |
DreamWorks Animation SKG, Inc., Class A(a) | | | 1,455 | | | | 27,732 | |
Express, Inc.(a) | | | 1,505 | | | | 27,346 | |
Maidenform Brands, Inc.(a) | | | 678 | | | | 13,506 | |
Regis Corp. | | | 1,908 | | | | 34,268 | |
| | | | | | | | |
| | | | | | | 197,969 | |
| | | | | | | | |
Consumer Staples (1.7%) | | | | | | | | |
Darling International, Inc.(a) | | | 2,047 | | | | 33,755 | |
| | | | | | | | |
| | |
Energy (3.1%) | | | | | | | | |
Matador Resources Co.(a) | | | 1,814 | | | | 19,483 | |
Northern Oil & Gas, Inc.(a) | | | 1,228 | | | | 19,574 | |
TETRA Technologies, Inc.(a) | | | 2,917 | | | | 20,798 | |
| | | | | | | | |
| | | | | | | 59,855 | |
| | | | | | | | |
Financials (32.5%) | | | | | | | | |
Altisource Portfolio Solutions SA(a) | | | 503 | | | | 36,835 | |
Amtrust Financial Services, Inc. | | | 1,125 | | | | 33,424 | |
BBCN Bancorp, Inc.(a) | | | 1,769 | | | | 19,264 | |
Boston Private Financial Holdings, Inc. | | | 4,664 | | | | 41,650 | |
Capitol Federal Financial, Inc. | | | 1,644 | | | | 19,531 | |
CNO Financial Group, Inc. | | | 5,467 | | | | 42,643 | |
eHealth, Inc.(a) | | | 1,326 | | | | 21,362 | |
Kennedy-Wilson Holdings, Inc. | | | 2,833 | | | | 39,690 | |
Maiden Holdings, Ltd. | | | 3,374 | | | | 29,286 | |
MB Financial, Inc. | | | 1,821 | | | | 39,224 | |
Nationstar Mortgage Holdings, Inc.(a) | | | 737 | | | | 15,860 | |
Northwest Bancshares, Inc. | | | 2,490 | | | | 29,158 | |
Ocwen Financial Corp.(a) | | | 1,864 | | | | 35,006 | |
Oritani Financial Corp. | | | 2,422 | | | | 34,853 | |
PHH Corp.(a) | | | 2,051 | | | | 35,851 | |
Platinum Underwriters Holdings, Ltd. | | | 819 | | | | 31,204 | |
ProAssurance Corp. | | | 589 | | | | 52,474 | |
Susquehanna Bancshares, Inc. | | | 4,241 | | | | 43,682 | |
West Coast Bancorp(a) | | | 1,505 | | | | 29,573 | |
| | | | | | | | |
| | | | | | | 630,570 | |
| | | | | | | | |
Health Care (5.3%) | | | | | | | | |
Hanger, Inc.(a) | | | 1,139 | | | | 29,204 | |
ICU Medical, Inc.(a) | | | 546 | | | | 29,145 | |
Teleflex, Inc. | | | 377 | | | | 22,963 | |
Tenet Healthcare Corp.(a) | | | 4,079 | | | | 21,374 | |
| | | | | | | | |
| | | | | | | 102,686 | |
| | | | | | | | |
Industrials (21.8%) | | | | | | | | |
ACCO Brands Corp.(a) | | | 4,125 | | | | 42,653 | |
Actuant Corp., Class A | | | 891 | | | | 24,200 | |
Con-way, Inc. | | | 864 | | | | 31,199 | |
Cubic Corp. | | | 689 | | | | 33,127 | |
ESCO Technologies, Inc. | | | 734 | | | | 26,747 | |
Fortune Brands Home & Security, Inc.(a) | | | 1,176 | | | | 26,190 | |
Greenbrier Cos., Inc.(a) | | | 1,483 | | | | 26,071 | |
The Manitowoc Co., Inc. | | | 1,821 | | | | 21,306 | |
MasTec, Inc.(a) | | | 1,787 | | | | 26,876 | |
Orbital Sciences Corp.(a) | | | 1,515 | | | | 19,574 | |
See Notes to Financial Statements.
| | |
Annual Report | June 30, 2012 | | 9 |
| | |
| | Schedule of Investments |
Cortina Small Cap Value Fund | | June 30, 2012 |
| | | | | | | | |
| | | Shares | | | Value | |
COMMON STOCKS (continued) | | | | | | | | |
Industrials (continued) | | | | | | | | |
Powell Industries, Inc.(a) | | | 887 | | | $ | 33,138 | |
RailAmerica, Inc.(a) | | | 1,367 | | | | 33,081 | |
Rush Enterprises, Inc., Class A(a) | | | 1,499 | | | | 24,509 | |
Tennant Co. | | | 671 | | | | 26,806 | |
TrueBlue, Inc.(a) | | | 1,880 | | | | 29,102 | |
| | | | | | | | |
| | | | | | | 424,579 | |
| | | | | | | | |
Information Technology (12.4%) | | | | | | | | |
Compuware Corp.(a) | | | 2,586 | | | | 24,024 | |
Deltek, Inc.(a) | | | 3,388 | | | | 39,267 | |
ExlService Holdings, Inc.(a) | | | 1,226 | | | | 30,209 | |
Harmonic, Inc.(a) | | | 5,782 | | | | 24,631 | |
Logitech International SA(a) | | | 4,320 | | | | 46,094 | |
Sierra Wireless, Inc.(a) | | | 4,066 | | | | 36,716 | |
Super Micro Computer, Inc.(a) | | | 2,501 | | | | 39,666 | |
| | | | | | | | |
| | | | | | | 240,607 | |
| | | | | | | | |
Materials (2.4%) | | | | | | | | |
Graphic Packaging Holdings Co.(a) | | | 8,464 | | | | 46,552 | |
| | | | | | | | |
| | |
Real Estate Investment Trust (REIT) (1.5%) | | | | | | | | |
American Realty Capital Trust, Inc. | | | 2,638 | | | | 28,807 | |
| | | | | | | | |
| | |
Telecommunication Services (1.0%) | | | | | | | | |
Towerstream Corp.(a) | | | 4,825 | | | | 20,024 | |
| | | | | | | | |
| | |
Utilities (4.4%) | | | | | | | | |
ALLETE, Inc. | | | 910 | | | | 38,038 | |
Black Hills Corp. | | | 780 | | | | 25,093 | |
El Paso Electric Co. | | | 664 | | | | 22,018 | |
| | | | | | | | |
| | | | | | | 85,149 | |
| | | | | | | | |
| | |
TOTAL COMMON STOCKS
(COST $1,666,209) | | | | | | | 1,870,553 | |
| | | | | | | | |
| | |
SHORT TERM INVESTMENT (4.3%) | | | | | | | | |
HighMark Diversified Money Market Fund, Fiduciary Class, 7 Day Yield 0.020% | | | 82,992 | | | | 82,992 | |
| | | | | | | | |
| | |
TOTAL SHORT TERM INVESTMENT
(COST $82,992) | | | | | | | 82,992 | |
| | | | | | | | |
| | |
TOTAL INVESTMENTS (100.6%)
(COST $1,749,201) | | | | | | | 1,953,545 | |
| | | | | | | | |
| | |
TOTAL LIABILITIES IN EXCESS OF OTHER ASSETS (-0.6%) | | | | | | | (11,776) | |
| | | | | | | | |
| | |
NET ASSETS 100.0% | | | | | | $ | 1,941,769 | |
| | | | | | | | |
| (a) | Non Income Producing Security. |
Common Abbreviations:
Ltd. - Limited.
REIT - Real Estate Investment Trust.
SA - Generally designates corporations in various countries, mostly those employing the civil law.
See Notes to Financial Statements.
| | |
10 | | 1-855-612-3936 | www.cortinafunds.com |
| | |
| | Statements of Assets and Liabilities |
| | | June 30, 2012 |
| | | | | | | | |
| | | Cortina Small Cap
Growth Fund | | | Cortina Small Cap
Value Fund | |
| | | | |
ASSETS: | | | | | | | | |
Investments, at value (Cost - see below) | | $ | 1,434,134 | | | $ | 1,953,545 | |
Receivable for investments sold | | | 17,923 | | | | 55,729 | |
Dividends and interest receivable | | | 63 | | | | 669 | |
Receivable due from adviser | | | 15,488 | | | | 18,233 | |
Deferred offering cost | | | 7,534 | | | | 7,263 | |
Prepaid expenses and other assets | | | 2,263 | | | | 2,007 | |
| | | | |
Total Assets | | | 1,477,405 | | | | 2,037,446 | |
| | | | |
| | |
LIABILITIES: | | | | | | | | |
Payable for investments purchased | | | 37,073 | | | | 63,774 | |
Payable for fund shares redeemed | | | 88 | | | | 94 | |
Other accrued liabilities and expenses | | | 30,432 | | | | 31,809 | |
| | | | |
Total Liabilities | | | 67,593 | | | | 95,677 | |
| | | | |
Net Assets | | $ | 1,409,812 | | | $ | 1,941,769 | |
| | | | |
| | |
NET ASSETS CONSISTS OF: | | | | | | | | |
Paid-in capital | | $ | 1,227,094 | | | $ | 1,699,182 | |
Accumulated undistributed net realized gain on investments | | | 45,418 | | | | 38,243 | |
Net unrealized appreciation on investments | | | 137,300 | | | | 204,344 | |
| | | | |
Net Assets | | $ | 1,409,812 | | | $ | 1,941,769 | |
| | | | |
| | |
Cost of Investments | | $ | 1,296,834 | | | $ | 1,749,201 | |
| | |
PRICING OF SHARES: | | | | | | | | |
Net Assets | | $ | 1,409,812 | | | $ | 1,941,769 | |
Shares Outstanding | | | 118,741 | | | | 154,872 | |
Net Asset Value, offering and redemption price per share | | $ | 11.87 | | | $ | 12.54 | |
See Notes to Financial Statements.
| | |
Annual Report | June 30, 2012 | | 11 |
| | |
| | Statements of Operations |
| | | For the Period September 30, 2011 (Inception) to June 30, 2012 |
| | | | | | | | |
| | | Cortina Small Cap
Growth Fund | | | Cortina Small Cap
Value Fund | |
| | | | |
INVESTMENT INCOME: | | | | | | | | |
Dividends | | $ | 840 | | | $ | 5,582 | |
Interest | | | 8 | | | | 12 | |
| | | | |
Total Investment Income | | | 848 | | | | 5,594 | |
| | | | |
| | |
EXPENSES: | | | | | | | | |
Advisory fees (Note 3) | | | 7,933 | | | | 7,180 | |
Transfer agent fees | | | 25,278 | | | | 25,956 | |
Fund accounting and administration fees and expenses | | | 74,696 | | | | 64,612 | |
Legal fees | | | 6,102 | | | | 5,514 | |
Printing fees | | | 3,343 | | | | 3,326 | |
Registration fees | | | 344 | | | | 599 | |
Audit and tax preparation fees | | | 14,500 | | | | 14,500 | |
Custodian fees | | | 3,052 | | | | 2,823 | |
Insurance | | | 6,740 | | | | 6,740 | |
Director fee and expenses | | | 4,000 | | | | 4,000 | |
Offering costs | | | 22,439 | | | | 21,632 | |
Other | | | 3,706 | | | | 3,731 | |
| | | | |
Total Expenses Before Waivers/Reimbursements | | | 172,133 | | | | 160,613 | |
Less fees waived/reimbursed by adviser (Note 3) | | | (163,407) | | | | (152,715) | |
| | | | |
Total Net Expenses | | | 8,726 | | | | 7,898 | |
| | | | |
Net Investment Loss | | | (7,878) | | | | (2,304) | |
| | | | |
| | |
REALIZED AND UNREALIZED GAIN ON INVESTMENTS: | | | | | | | | |
Net realized gain on investments | | | 72,431 | | | | 69,894 | |
Net change in unrealized appreciation on investments | | | 137,300 | | | | 204,344 | |
| | | | |
Net Realized and Unrealized Gain on Investments | | | 209,731 | | | | 274,238 | |
| | | | |
Net Increase in Net Assets Resulting from Operations | | $ | 201,853 | | | $ | 271,934 | |
| | | | |
See Notes to Financial Statements.
| | |
12 | | 1-855-612-3936 | www.cortinafunds.com |
| | |
| | Statements of Changes in Net Assets |
| | | For the Period September 30, 2011 (Inception) to June 30, 2012 |
| | | | | | | | |
| | | Cortina Small Cap
Growth Fund | | | Cortina Small Cap
Value Fund | |
| | | | |
OPERATIONS: | | | | | | | | |
Net investment loss | | $ | (7,878) | | | $ | (2,304) | |
Net realized gain on investments | | | 72,431 | | | | 69,894 | |
Net change in unrealized appreciation of investments | | | 137,300 | | | | 204,344 | |
| | | | |
Net increase in net assets resulting from operations | | | 201,853 | | | | 271,934 | |
| | | | |
| | |
DISTRIBUTIONS TO SHAREHOLDERS: | | | | | | | | |
From net realized gains on investments | | | (20,406) | | | | (30,530) | |
| | | | |
Total distributions | | | (20,406) | | | | (30,530) | |
| | | | |
| | |
CAPITAL SHARE TRANSACTIONS: | | | | | | | | |
Proceeds from sale of shares | | | 1,108,101 | | | | 1,569,937 | |
Shares issued in reinvestment of distributions | | | 20,406 | | | | 30,530 | |
Cost of shares redeemed | | | (900,145) | | | | (900,104) | |
Redemption fees | | | 3 | | | | 2 | |
| | | | |
Net increase from capital shares transactions | | | 228,365 | | | | 700,365 | |
| | | | |
| | |
Net increase in net assets | | | 409,812 | | | | 941,769 | |
| | | | |
| | |
NET ASSETS: | | | | | | | | |
Beginning of period | | | 1,000,000 | | | | 1,000,000 | |
| | | | |
End of period | | $ | 1,409,812 | | | $ | 1,941,769 | |
| | | | |
Including accumulated undistributed net investment income of: | | $ | – | | | $ | – | |
| | |
OTHER INFORMATION: | | | | | | | | |
Share Transactions: | | | | | | | | |
Beginning shares | | | 100,000 | | | | 100,000 | |
Shares sold | | | 100,810 | | | | 136,198 | |
Shares issued in reinvestment of dividends | | | 1,819 | | | | 2,822 | |
Less shares redeemed | | | (83,888) | | | | (84,148) | |
| | | | |
Net increase in share transactions | | | 118,741 | | | | 154,872 | |
| | | | |
See Notes to Financial Statements.
| | |
Annual Report | June 30, 2012 | | 13 |
| | |
| | Financial Highlights |
Cortina Small Cap Growth Fund | | For a share outstanding throughout the period presented. |
| | |
| | | For the Period
September 30, 2011
(Inception) to
June 30, 2012 |
NET ASSET VALUE, BEGINNING OF PERIOD | | $10.00 |
INCOME/(LOSS) FROM INVESTMENT OPERATIONS: | | |
Net investment loss(a) | | (0.09) |
Net realized and unrealized gain on investments | | 2.22 |
| | |
Total from Investment Operations | | 2.13 |
| | |
| |
DIVIDENDS AND DISTRIBUTIONS TO SHAREHOLDERS: | | |
From net realized gain on investments | | (0.26) |
| | |
Total Dividends and Distributions to Shareholders | | (0.26) |
| | |
| |
Paid-in Capital from Redemption Fees | | 0.00(b) |
| | |
| |
NET INCREASE IN NET ASSET VALUE | | 1.87 |
| | |
| |
NET ASSET VALUE, END OF PERIOD | | $11.87 |
| | |
| |
TOTAL RETURN(c) | | 21.40% |
| |
RATIOS AND SUPPLEMENTAL DATA: | | |
Net assets, end of period (in 000s) | | $1,410 |
| |
RATIOS TO AVERAGE NET ASSETS: | | |
Operating expenses excluding waiver/reimbursement | | 21.70%(d) |
Operating expenses including waiver/reimbursement | | 1.10%(d) |
Net investment loss including waiver/reimbursement | | (0.99)%(d) |
| |
PORTFOLIO TURNOVER RATE | | 144% |
| (a) | Calculated using average shares throughout the period. |
| (b) | Less than $0.005 per share. |
See Notes to Financial Statements.
| | |
14 | | 1-855-612-3936 | www.cortinafunds.com |
| | |
| | Financial Highlights |
Cortina Small Cap Value Fund | | For a share outstanding throughout the period presented. |
| | |
| | | For the Period
September 30, 2011
(Inception) to
June 30, 2012 |
NET ASSET VALUE, BEGINNING OF PERIOD | | $10.00 |
INCOME/(LOSS) FROM INVESTMENT OPERATIONS: | | |
Net investment loss(a) | | (0.03) |
Net realized and unrealized gain on investments | | 3.14 |
| | |
Total from Investment Operations | | 3.11 |
| | |
| |
DIVIDENDS AND DISTRIBUTIONS TO SHAREHOLDERS: | | |
From net realized gain on investments | | (0.57) |
| | |
Total Dividends and Distributions to Shareholders | | (0.57) |
| | |
| |
Paid-in Capital from Redemption Fees | | 0.00(b) |
| | |
| |
NET INCREASE IN NET ASSET VALUE | | 2.54 |
| | |
| |
NET ASSET VALUE, END OF PERIOD | | $12.54 |
| | |
| |
TOTAL RETURN(c) | | 31.99% |
| |
RATIOS AND SUPPLEMENTAL DATA: | | |
Net assets, end of period (in 000s) | | $1,942 |
| |
RATIOS TO AVERAGE NET ASSETS: | | |
Operating expenses excluding waiver/reimbursement | | 22.37%(d) |
Operating expenses including waiver/reimbursement | | 1.10%(d) |
Net investment loss including waiver/reimbursement | | (0.32)%(d) |
| |
PORTFOLIO TURNOVER RATE | | 146% |
| (a) | Calculated using average shares throughout the period. |
| (b) | Less than $0.005 per share. |
See Notes to Financial Statements.
| | |
Annual Report | June 30, 2012 | | 15 |
| | |
| | Notes to Financial Statements |
| | | June 30, 2012 |
1. ORGANIZATION
Cortina Funds, Inc. (the “Corporation”), is an open-end management investment company registered under the Investment Company Act of 1940, as amended (the “1940 Act”). The Corporation was organized on June 30, 2004 as a Wisconsin corporation. The Corporation currently offers shares of common stock (“shares”) of the Cortina Small Cap Growth Fund and the Cortina Small Cap Value Fund (each a “Fund” and collectively, the “Funds”). The Cortina Small Cap Growth Fund is a diversified portfolio with an investment objective to seek growth of capital and the Cortina Small Cap Value Fund is a diversified portfolio with an investment objective to seek long-term capital appreciation. Shares of each Fund are designated as Institutional Shares with an indefinite number of shares authorized at $0.01 par value. The Articles of Incorporation, as amended and restated, permits the Board of Directors (the “Board”) to create additional funds and share classes. The Institutional Class is currently the only class offered.
2. SIGNIFICANT ACCOUNTING POLICIES
The following is a summary of significant accounting policies followed by the Funds. These policies are in conformity with U.S. generally accepted accounting principles (“GAAP”).
Use of Estimates — The accompanying financial statements were prepared in accordance with GAAP, which require the use of estimates and assumptions made by management. These may affect the reported amounts of assets and liabilities and disclosure of contingent asset and liabilities at the date of the financial statements and the reported amounts of increases and decreases in net assets from operations during the reporting period. Actual results could differ from those estimates.
Investment Valuation — Investment securities are valued at the last sale price at the close of the principal exchange on which they trade, except for securities listed on the National Association of Securities Dealers Automated Quotations (“NASDAQ”) exchange, which are valued at the NASDAQ official closing price. Unlisted securities or listed securities for which there were no sales during the day are valued at the closing bid price on such exchanges or over-the-counter markets. Investments for which market quotations are not readily available are valued at fair value as determined in good faith under consistently applied procedures approved by and under the general supervision of the Funds’ Board.
Investment Transactions — Investment security transactions are accounted for on trade date. Gains and losses on securities sold are determined on a specific identification basis.
Investment Income — Interest income is accrued and recorded on a daily basis including amortization of premiums, accretions of discounts and income earned from money market funds. Interest is not accrued on securities that are in default. Dividend income is recorded on the ex-dividend date.
Fair Value Measurements — A three-tier hierarchy has been established to classify fair value measurements for disclosure purposes. Inputs refer broadly to the assumptions that market participants would use in pricing the asset or liability, including assumptions about risk. Inputs may be observable or unobservable. Observable inputs are inputs that reflect the assumptions market participants would use in pricing the asset or liability that are developed based on market data obtained from sources independent of the reporting entity. Unobservable inputs are inputs that reflect the reporting entity’s own assumptions about the assumptions market participants would use in pricing the asset or liability that are developed based on the best information available. In accordance with the authoritative guidance on fair value measurements and disclosure under GAAP, the Funds disclose fair value of their investments in a hierarchy that prioritizes the inputs to valuation techniques used to measure the fair value.
Various inputs are used in determining the value of each Fund’s investments as of the reporting period end. The designated input levels are not necessarily an indication of the risk or liquidity associated with these investments. These inputs are categorized in the following hierarchy under applicable financial accounting standards:
| | | | |
Level 1 | | – | | Unadjusted quoted prices in active markets for identical, unrestricted assets or liabilities that the Funds have the ability to access at the measurement date; |
| | |
Level 2 | | – | | Quoted prices which are not active, quoted prices for similar assets or liabilities in active markets or inputs other than quoted prices that are observable (either directly or indirectly) for substantially the full term of the asset or liability; and |
| | |
Level 3 | | – | | Significant unobservable prices or inputs (including the Fund’s own assumptions in determining the fair value of investments) where there is little or no market activity for the asset or liability at the measurement date. |
The availability of observable inputs can vary from security to security and is affected by a wide variety of factors, including, for example, the type of security, whether the security is new and not yet established in the marketplace, the liquidity of markets, and other characteristics particular to
| | |
16 | | 1-855-612-3936 | www.cortinafunds.com |
| | |
| | Notes to Financial Statements |
| | | June 30, 2012 |
the security. To the extent that valuation is based on models or inputs that are less observable or unobservable in the market, the determination of fair value requires more judgment. Accordingly, the degree of judgment exercised in determining fair value is greatest for instruments categorized in Level 3.
An investment level within the fair value hierarchy is based on the lowest level input, individually or in the aggregate, that is significant to fair value measurement. The valuation techniques used by the Funds to measure fair value during the period ended June 30, 2012 maximized the use of observable inputs and minimized the use of unobservable inputs.
The inputs or methodology used for valuing securities are not necessarily an indication of the risk or liquidity associated with investing in those securities. The following is a summary of the inputs used in valuing the Funds’ investments as of June 30, 2012:
Cortina Small Cap Growth Fund
| | | | | | | | | | | | | | | | |
| | | Valuation Inputs | | | | |
| | | | | | | | |
| Investments in Securities at Value* | | Level 1 | | | Level 2 | | | Level 3 | | | Total | |
Common Stocks | | $ | 1,385,725 | | | $ | – | | | $ | – | | | $ | 1,385,725 | |
Short Term Investment | | | 48,409 | | | | – | | | | – | | | | 48,409 | |
| | | | |
Total | | $ | 1,434,134 | | | $ | – | | | $ | – | | | $ | 1,434,134 | |
| | | | |
Cortina Small Cap Value Fund
| | | | | | | | | | | | | | | | |
| | | Valuation Inputs | | | | |
| | | | | | | | |
| Investments in Securities at Value* | | Level 1 | | | Level 2 | | | Level 3 | | | Total | |
Common Stocks | | $ | 1,870,553 | | | $ | – | | | $ | – | | | $ | 1,870,553 | |
Short Term Investment | | | 82,992 | | | | – | | | | – | | | | 82,992 | |
| | | | |
Total | | $ | 1,953,545 | | | $ | – | | | $ | – | | | $ | 1,953,545 | |
| | | | |
* See Schedule of Investments for sector classification.
For the period September 30, 2011, inception, through June 30, 2012, there have been no significant changes to the Funds’ fair value methodologies. Additionally, there were no transfers into or out of Levels 1 and 2 during the period ended June 30, 2012. It is the Funds’ policy to recognize transfers at the end of the reporting period.
For period ended June 30, 2012, the Funds did not have significant unobservable inputs (Level 3) used in determining fair value. Therefore, a reconciliation of assets in which significant unobservable inputs (Level 3) were used in determining fair value is not applicable.
Affiliated Companies — An affiliated company is a company that can have direct or indirect common ownership. The Funds do not hold any investments in affiliated companies as of June 30, 2012.
Offering Costs — Offering costs, including costs of printing initial prospectuses, legal and registration fees, are being amortized over twelve months from the inception date of the Funds. As of June 30, 2012, $7,534 of offering costs remain to be amortized for the Cortina Small Cap Growth Fund and $7,263 of offering costs remain to be amortized for the Cortina Small Cap Value Fund.
Expenses — The Funds bear expenses incurred specifically on each Fund’s respective behalf as well as a portion of general Corporation expenses, which may be allocated on the basis of relative net assets or the nature of the services performed relative to applicability to each Fund.
Distributions to Shareholders — Dividends from net investment income and distributions of net realized capital gains, if any, will be declared and paid at least annually. Income and capital gains distributions are determined in accordance with income tax regulations, which may differ from GAAP. Distributions to shareholders are recorded on the ex-dividend date.
Fees on Redemptions — The Funds will deduct a 2.00% redemption proceeds fee on Fund shares held 60 days or less. The redemption fee is not a fee to finance sales or sales promotion expenses, but is paid to the Funds to defray the costs of liquidating an investor and discouraging short-term trading of the Funds’ shares. No redemption fee will be imposed on redemptions initiated by the Funds.
Federal Income Taxes — No provision for income taxes is included in the accompanying financial statements, as the Funds intend to distribute to shareholders all taxable investment income and realized gains, and otherwise comply with Subchapter M of the Internal Revenue Code applicable to regulated investment companies.
| | |
Annual Report | June 30, 2012 | | 17 |
| | |
| | Notes to Financial Statements |
| | | June 30, 2012 |
3. ADVISORY FEES, FUND ACCOUNTING, ADMINISTRATION FEES, AND OTHER AGREEMENTS
Investment Advisory
The Adviser is subject to the general supervision of the Board, and is responsible for the overall management of the Funds’ business affairs. The Adviser invests the assets of the Funds based on the Funds’ investment objectives and policies. The Adviser is entitled to an investment advisory fee, computed daily and payable monthly of 1.00% of the average daily net assets for each Fund.
The Adviser has contractually agreed to waive fees with respect to each of the Funds so that the net annual operating expenses (excluding taxes, leverage, interest, brokerage commissions, dividends or interest expenses on short positions, acquired fund fees and expenses, and extraordinary expenses) of the Funds’ institutional shares will not exceed 1.10% of average daily net assets of each Fund. The Adviser may request a reimbursement from the Funds to recapture any reduced management fees or reimbursed Fund expenses within three years following the fee reduction or expense reimbursement, but only to the extent the Funds’ total annual fund operating expenses including offering costs, plus any requested reimbursement amount, including previously waived organizational costs, are less than the above limit at the time of the request. Any such reimbursement is subject to review by the Board. As of June 30, 2012, the Cortina Small Cap Growth Fund and the Cortina Small Cap Value Fund had receivables from the Adviser of $15,488 and $18,233, respectively.
As of June 30, 2012, reimbursements (including offering costs and the previously waived organizational costs) that may potentially be made by the Fund to the Adviser total $173,657 for the Cortina Small Cap Growth Fund and $162,965 for the Cortina Small Cap Value Fund, which expires as follows:
| | | | | | |
| | | Cortina Small Cap Growth Fund | | | |
| | September 19, 2014 | | $ | 10,250 | |
| | June 30, 2015 | | | 163,407 | |
| | | | | | |
| | | | $ | 173,657 | |
| | |
| | | Cortina Small Cap Value Fund | | | |
| | September 19, 2014 | | $ | 10,250 | |
| | June 30, 2015 | | | 152,715 | |
| | | | | | |
| | | | $ | 162,965 | |
Fund Accounting Fees and Expenses
ALPS Fund Services, Inc. (“ALPS” and the “Administrator”) provides administrative, fund accounting and other services to the Funds for a monthly administration fee based on the Fund’s average daily net assets at the following annual rates.
Year 1
Greater of $175,000 annual minimum in Year 1 or the following basis point fee schedule:
| | | | | | | | |
| | | Average Daily Net Assets | | | | Basis Point
Fee Rate | | |
| | Between $0-$500M | | | | 5.0 | | |
| | $500M-$1B | | | | 3.0 | | |
| | Above $1B | | | | 2.0 | | |
Year 2
Greater of $190,000 annual minimum in Year 2 or the above basis point fee schedule.
The Administrator is also reimbursed by the Funds for certain out of pocket expenses.
Transfer Agent
ALPS serves as transfer, dividend paying and shareholder servicing agent for the Funds (“Transfer Agent”).
Compliance Services
ALPS provides services that assist the Corporation’s Chief Compliance Officer in monitoring and testing the policies and procedures of the Corporation in conjunction with requirements under Rule 38a-1 under the 1940 Act. ALPS is compensated under the Administration Agreement.
| | |
18 | | 1-855-612-3936 | www.cortinafunds.com |
| | |
| | Notes to Financial Statements |
| | | June 30, 2012 |
Distributor
The Fund has entered into a Distribution Agreement with ALPS Distributors, Inc (“the Distributor”) to provide distribution services to the Funds. The Distributor serves as underwriter/distributor of shares of the Funds.
Certain Directors and Officers of the Funds are also officers of the Adviser.
4. PURCHASES AND SALES OF INVESTMENT SECURITIES
The aggregate cost of purchases and proceeds from sales of investment securities, excluding short-term securities, are shown below for the period ended June 30, 2012. Purchases and proceeds from sales of U.S. Government obligations are included in the totals of Purchases of Securities and Proceeds from Sales of Securities below and also broken out separately for your convenience:
| | | | | | | | |
| Fund Name | | Purchases | | | Sales | |
Cortina Small Cap Growth Fund | | $ | 2,660,823 | | | $ | 1,484,830 | |
Cortina Small Cap Value Fund | | $ | 3,001,458 | | | $ | 1,404,991 | |
There were no purchases of long-term U.S. Government Obligations for either Fund during the period ended June 30, 2012.
5. TAX BASIS INFORMATION
Distributions are determined in accordance with Federal income tax regulations, which differ from GAAP, and, therefore, may differ significantly in amount or character from net investment income and realized gains for financial reporting purposes. Financial reporting records are adjusted for permanent book/tax differences to reflect tax character but are not adjusted for temporary differences.
The Funds follow ASC 740, “Income Taxes” (“ASC 740”), which requires that the financial statements effects of a tax position taken or expected to be taken in a tax return be recognized in the financial statements when it is more likely than not, based on the technical merits, that the position will be sustained upon examination. Management has concluded that the Funds have taken no uncertain tax positions that require adjustments to the financial statements to comply with the provisions of ASC 740. The Funds recognize interest and penalties, if any, related to unrecognized tax benefits on uncertain tax positions as income tax expense in the statement of operations. During the period September 30, 2011, inception, through June 30, 2012, the Funds did not incur any interest or penalties. The Funds file income tax returns in the U.S. Federal jurisdiction and the state of Wisconsin. The statute of limitations on the Funds’ federal and Wisconsin tax returns remains open for the period ended June 30, 2012. To the best of the Funds’ knowledge, no income tax returns are currently under examination. The Funds are subject to examination by U.S. taxing authorities for the tax periods since the commencement of operations.
For the period ended June 30, 2012 the following reclassifications, which had no impact on results of operations or net assets, were recorded to reflect tax character:
| | | | | | | | |
| Fund | | Paid-in Capital | | | Accumulated Net
Investment Income | | Accumulated Net Realized
(Loss) on Investments |
Cortina Small Cap Growth Fund | | $ | (1,271 | ) | | $ 7,878 | | $ (6,607) |
Cortina Small Cap Value Fund | | $ | (1,183 | ) | | $ 2,304 | | $ (1,121) |
Distributions were characterized for tax purposes as follows:
| | | | | | |
| | | Distributions from | |
| Fund | | For the period ended | | Ordinary Income | |
Cortina Small Cap Growth Fund | | 6/30/2012 | | $ | 20,406 | |
Cortina Small Cap Value Fund | | 6/30/2012 | | $ | 30,530 | |
As of June 30, 2012, the aggregate cost of investments, gross unrealized appreciation/(depreciation) and net unrealized appreciation for Federal tax purposes was as follows:
| | | | | | | | | | | | | | | | |
| Fund | | Cost of
Investments | | | Gross Unrealized
Appreciation (excess of
value over tax cost) | | | Gross Unrealized
(Depreciation) (excess of
tax cost over value) | | | Net
Unrealized
Appreciation | |
Cortina Small Cap Growth Fund | | $ | 1,320,165 | | | $ | 177,547 | | | $ | (63,578 | ) | | $ | 113,969 | |
Cortina Small Cap Value Fund | | $ | 1,762,480 | | | $ | 211,379 | | | $ | (20,314 | ) | | $ | 191,065 | |
| | |
Annual Report | June 30, 2012 | | 19 |
| | |
| | Notes to Financial Statements |
| | | June 30, 2012 |
At June 30, 2012, components of distributable earnings were as follows:
| | | | | | | | |
| | | Cortina Small Cap Growth Fund | | Cortina Small Cap Value Fund |
Undistributed ordinary income | | | $ 68,749 | | | | | $ 51,522 |
Net unrealized appreciation on investments | | | 113,969 | | | | | 191,065 |
Total distributable earnings | | | $ 182,718 | | | | | $ 242,587 |
The difference between book basis and tax basis net unrealized appreciation is attributable to the deferral of losses from wash sales.
6. COMMITMENTS AND CONTINGENCIES
Under the Corporation’s organizational documents, its Officers and Directors are indemnified against certain liabilities arising out of the performance of their duties to the Funds. In addition, in the normal course of business, the Corporation entered into contracts with its service providers, on behalf of the Funds, and others that provide for general indemnifications. The Funds’ maximum exposure under these arrangements is unknown, as this would involve future claims that may be made against the Funds. The Funds expect risk of loss to be remote.
7. NEW ACCOUNTING PRONOUNCEMENTS
In May 2011, the Financial Accounting Standards Board (“FASB”) issued Accounting Standards Update (“ASU”) No. 2011-04 “Amendments to Achieve Common Fair Value Measurement and Disclosure Requirements.” ASU No. 2011-04 amends FASB ASC Topic 820, Fair Value Measurements and Disclosures, to establish common requirements for measuring fair value and for disclosing information about fair value measurements in accordance with GAAP and International Financial Reporting Standards (“IFRS”). ASU No. 2011-04 is effective for fiscal years beginning after December 15, 2011, and for interim periods within those fiscal years. Management has adopted these provisions for the period ended June 30, 2012.
In December 2011, FASB issued an ASU to enhance disclosures requiring improved information about financial instruments and derivative instruments that are subject to offsetting (“netting”) on the Statements of Assets and Liabilities. This information will enable users of the entity’s financial statements to evaluate the effect or potential effect of netting arrangements on the entity’s financial position. The ASU is effective prospectively during interim or annual periods beginning on or after January 1, 2013. At this time, management is evaluating the implications of these changes on the financial statements.
| | |
20 | | 1-855-612-3936 | www.cortinafunds.com |
| | |
| | Report of Independent Registered Public Accounting Firm |
| | | June 30, 2012 |
To the Shareholders and Board of Directors
Cortina Funds, Inc.
We have audited the accompanying statements of assets and liabilities, including the schedules of investments, of Cortina Funds, Inc. comprising the Cortina Small Cap Growth Fund and Cortina Small Cap Value Fund (the “Funds”), as of June 30, 2012, and the related statements of operations and changes in net assets, and the financial highlights for the period September 30, 2011 (inception), through June 30, 2012. These financial statements and financial highlights are the responsibility of Fund management. Our responsibility is to express an opinion on these financial statements and financial highlights based on our audit.
We conducted our audit in accordance with the standards of the Public Company Accounting Oversight Board (United States). Those standards require that we plan and perform the audit to obtain reasonable assurance about whether the financial statements are free of material misstatement. An audit includes examining, on a test basis, evidence supporting the amounts and disclosures in the financial statements. Our procedures included confirmation of cash as of June 30, 2012, by correspondence with the custodian and brokers or by other appropriate auditing procedures where replies from brokers were not received. An audit also includes assessing the accounting principles used and significant estimates made by management, as well as evaluating the overall financial statement presentation. We believe that our audit provides a reasonable basis for our opinion.
In our opinion, the financial statements referred to above presents fairly, in all material respects, the financial position of each of the funds constituting Cortina Funds, Inc., as of June 30, 2012, the results of their operations, changes in its net assets, and the financial highlights for the period September 30, 2011 (inception), through June 30, 2012, in conformity with accounting principles generally accepted in the United States of America.
Cohen Fund Audit Services, Ltd.
Westlake, Ohio
August 24, 2012
| | |
Annual Report | June 30, 2012 | | 21 |
| | |
| | Additional Information |
| | | June 30, 2012 (Unaudited) |
1. PROXY VOTING POLICIES AND VOTING RECORD
A description of the policies and procedures that the Funds use to vote proxies relating to portfolio securities is available without charge upon request by calling toll-free 1-855-612-3936, or on the Securities and Exchange Commission’s (“SEC”) website at http://www.sec.gov. Information regarding how the Funds voted proxies relating to portfolio securities during the most recent fiscal year ending June 30, 2012 will be available without charge upon request by calling toll-free 1-855-612-3936, or on the SEC’s website at http://www.sec.gov.
2. QUARTERLY PORTFOLIO HOLDINGS
The Corporation files a complete listing of portfolio holdings for the Funds with the SEC as of the first and third quarters of each fiscal year on Form N-Q. The filings are available upon request by calling 1-855-612-3936. Furthermore, you may obtain a copy of the filing on the SEC’s website at http://www.sec.gov. The Funds’ Forms N-Q may also be reviewed and copied at the SEC’s Public Reference Room in Washington, D.C., and information on the operation of the Public Reference Room may be obtained by calling 1-800-SEC-0330.
3. TAX INFORMATION
Certain tax information is required to be provided to shareholders based upon each Fund’s income and distributions for the year ended June 30, 2012. The Funds designate the following as percentages of taxable ordinary income distributions, up to maximum amount allowable, for the calendar year ended December 31, 2011:
| | | | |
| Fund | | Dividends Received
Deduction Percentage | | Qualified Dividend
Income Percentage |
Cortina Small Cap Growth Fund | | 1.82% | | 1.56% |
Cortina Small Cap Value Fund | | 4.22% | | 2.84% |
In early 2012, if applicable, shareholders of record received this information for the distributions paid to them by the Funds during the calendar year 2011 via Form 1099. The Funds will notify shareholders in early 2013 of amounts paid to them by the Funds, if any, during the calendar year 2012.
| | |
22 | | 1-855-612-3936 | www.cortinafunds.com |
| | |
| | Board of Directors and Officers |
| | | June 30, 2012 (Unaudited) |
Overall responsibility for management of the Funds rests with the Board of Directors (the “Directors”). The Directors serve during the lifetime of the Corporation and until its termination, or until death, resignation, retirement or removal. The Directors, in turn, elect the officers of the Funds to actively supervise the day-to-day operations. The officers have been elected for an annual term. The following are the Directors and executive officers of the Funds:
| | | | | | | | | | |
Independent Directors | | | | | | |
| Name and Age | | Position(s) Held
with the Funds | | Length of Time Served | | Principal Occupation(s) During Past 5 Years | | Number of Funds in Fund Complex Overseen by Director | | Other
Directorships
Held by Director |
| | | | | | | | | | |
Mark J. Giese, 41 | | Independent
Director | | Since
Inception | | President, Riverwood Business Consulting, LLC, a business and management firm (December 2009-present); Chief Financial Officer, Datatrac Corporation, a financial research firm (January 2009-December 2009); Vice President, Nicholas Company, Inc., an investment management firm (June 1994- January 2009); Vice President, Nicholas Fund, Inc .,Nicholas II, Inc., Nicholas Limited Edition, Inc. and Nicholas Equity Income Fund, Inc., each a registered investment company (June 1994- January 2009); Senior Vice President, Nicholas Family of Funds, Inc., a registered investment company (June 1994- January 2009) | | 2 | | None |
| | | | | | | | | | |
John T. Murphy, 48 | | Independent
Director | | Since
Inception | | President and Founding Partner, Morris Midwest, LLC, a machine tool distributor (2006-present); President and Partner, Technical Equipment Sales Co., a machine tool distributor (2003-2006) | | 2 | | None |
| | | | | | | | | | |
Interested Director | | | | | | | | |
| | | | | | | | | | |
Ryan T. Davies, 38* | | Chairman,
President and
Interested Director | | Since
Inception | | Senior Equity Analyst, Cortina Asset Management, LLC (2004- present) | | 2 | | None |
| | | | | | | | | | |
Officers | | | | | | | | |
| | | | | | | | | | |
Terese Nielsen, 48 | | Treasurer and
Principal
Accounting Officer | | Since
February
2012 | | Director of Operations, Cortina Asset Management, LLC (July 2011-present); Assistant Vice President and Systems Project Leader, M&I Investment Management Corp. (April 2008-July 2011) Officer and Wealth Management Senior Business Analyst, M&I Investment Management Corp. (August 2004-April 2008) |
| | | | | | | | | | |
Lori K. Hoch, 41 | | Secretary and
Chief
Compliance Officer | | Since
Inception | | Principal and Chief Operating Officer and Chief Compliance Officer, Cortina Asset Management, LLC (2004-present) |
| | | | | | | | | | |
Kathleen A. Daley, 38 | | Anti-Money
Laundering
Compliance Officer | | Since
Inception | | Compliance Officer, Cortina Asset Management, LLC (2004-present) | | |
| * | Mr. Davies is considered an “interested director” of Cortina as defined under the 1940 Act by virtue of his position with the Adviser. |
The business address of the officers and directors affiliated with the Adviser is 825 North Jefferson Street, Suite 400, Milwaukee, Wisconsin 53202. The address for each Independent Director is c/o Cortina Funds, 825 North Jefferson Street, Suite 400, Milwaukee, Wisconsin 53202.
Additional information about members of the Board of Directors and Officers is available in the Statement of Additional Information (SAI). To obtain a free copy of the SAI, please call 1-855-612-3936.
| | |
Annual Report | June 30, 2012 | | 23 |
This page intentionally left blank.
This page intentionally left blank.

Material must be accompanied or preceded by the prospectus.
The Cortina Funds are distributed by ALPS Distributors, Inc.
(a) The Registrant, as of the end of the period covered by this report, has adopted a code of ethics that applies to the Registrant’s principal executive officer, principal financial officer, principal accounting officer or controller or any persons performing similar functions on behalf of the Registrant.
| | (c) | During the period covered by this report, no amendments to the provisions of the code of ethics adopted in Item 2(a) above were made. |
| | (d) | During the period covered by this report, no implicit or explicit waivers to the provisions of the code of ethics adopted in Item 2(a) above were granted. |
| | (f) | The Registrant’s Code of Ethics is attached as an Exhibit hereto. |
| Item 3. | Audit Committee Financial Expert. |
The Board of Trustees of the Registrant has determined that the Registrant has at least one Audit Committee Financial Expert serving on its audit committee. The Registrant’s Audit Committee Financial Expert is Mr. John F. Murphy, Independent Trustee and Audit Committee Chair.
| Item 4. | Principal Accountant Fees and Services. |
| | (a) | Audit Fees: For the Registrant’s fiscal year ended June 30, 2012, the aggregate fees billed for professional services rendered by the principal accountant for the audit of the Registrant’s annual financial statements were $24,000. |
| | (b) | Audit-Related Fees: For the Registrant’s fiscal year ended June 30, 2012, the aggregate fees billed for assurance and related services rendered by the principal accountant for the audit of the Registrant’s financial statements were $0. |
| | (c) | Tax Fees: For the Registrant’s fiscal year ended June 30, 2012, the aggregate fees billed for professional services rendered by the principal accountant for tax compliance, tax advice and tax planning were $5,000. The fiscal year 2012 tax fees were for services for review of the dividend calculation, excise tax preparation and federal tax return preparation. |
| | (d) | All Other Fees: For the Registrant’s fiscal year ended June 30, 2102, $2,500 fees were billed to Registrant by the principal accountant for services other than the services reported in paragraphs (a) through (c) of this Item. These fees related to the initial seed audit of the Registrant. |
| | (e)(1) | Audit Committee Pre-Approval Policies and Procedures: All services to be performed by the Registrant’s principal accountant must be pre-approved by the Registrant’s audit committee. |
| | (e)(2) | No services described in paragraphs (b) through (d) of this Item were approved by the Registrant’s audit committee pursuant to paragraph (c)(7)(i)(C) of Rule 2-01 of Regulation S-X. |
| | (g) | No non-audit fees were billed by the Registrant’s principal accountant for services rendered to the Registrant’s investment adviser. |
| Item 5. | Audit Committee of Listed Registrants. |
The Registrant has an Audit Committee consisting of its Independent Trustees Messrs. John F. Murphy and Mark Giese.
| | (a) | Schedule of Investments is included as part of the Reports to Stockholders filed under Item 1 of this Form N-CSR. |
| Item 7. | Disclosure of Proxy Voting Policies and Procedures for Closed-End Management Investment Companies. |
Not dapplicable to Registrant.
| Item 8. | Portfolio Managers of Closed-End Management Investment Companies. |
Not applicable to Registrant.
| Item 9. | Purchases of Equity Securities by Closed-End Management Investment Company and Affiliated Purchasers. |
Not applicable to Registrant.
| Item 10. | Submission of Matters to a Vote of Security Holders. |
The Registrant has not adopted procedures by which shareholders may recommend nominees to the Registrant’s Board of Trustees.
| Item 11. | Controls and Procedures. |
| | (a) | The Registrant’s principal executive officer and principal financial officer have concluded that the Registrant’s disclosure controls and procedures (as defined in Rule 30a-3(c) under the Investment Company Act of 1940, as amended) are effective based on their evaluation of these controls and procedures as of a date within 90 days of the filing date of this report. |
| | (b) | There was no change in the Registrant’s internal control over financial reporting (as defined in Rule 30a-3(d) under the Investment Company Act of 1940, as amended) during the fiscal period covered by this report that has materially affected, or is reasonably likely to materially affect, the Registrant’s internal control over financial reporting. |
| | (a)(1) | Registrant’s Code of Ethics for Senior Financial Officers, which is the subject of the disclosure required by Item 2 of Form N-CSR, is attached hereto as Exhibit 12.a.1. |
| | (a)(2) | The certifications required by Rule 30a-2(a) of the Investment Company Act of 1940, as amended, and Section 302 of the Sarbanes-Oxley Act of 2002 are attached hereto as Exhibit 99.Cert. |
| | (b) | The certifications by the Registrant’s principal executive officer and principal financial officer, as required by Rule 30a-2(b) of the Investment Company Act of 1940, as amended, and Section 906 of the Sarbanes-Oxley Act of 2002 are attached hereto as Exhibit 99.906Cert. |
SIGNATURES
Pursuant to the requirements of the Securities Exchange Act of 1934 and the Investment Company Act of 1940, the registrant has duly caused this report to be signed on its behalf by the undersigned, thereunto duly authorized.
| | |
| Cortina Funds, Inc. |
| |
| By: | | /s/ Ryan T. Davies |
| | Ryan T. Davies, President |
| | (Principal Executive Officer) |
| | |
| Date: | | September 4, 2012 |
Pursuant to the requirements of the Securities Exchange Act of 1934 and the Investment Company Act of 1940, this report has been signed below by the following persons on behalf of the registrant and in the capacities and on the dates indicated.
| | |
| |
| By: | | /s/ Terese Nielsen |
| | Terese Nielsen, Treasurer and Principal Accounting Officer (Principal Financial Officer) |
| | |
| Date: | | September 4, 2012 |