UNITED STATES
SECURITIES AND EXCHANGE COMMISSION
Washington, D.C. 20549
FORM N-CSR
CERTIFIED SHAREHOLDER REPORT OF REGISTERED
MANAGEMENT INVESTMENT COMPANIES
Investment Company Act file number: 811-21580
(Exact name of registrant as specified in charter)
| 825 N. Jefferson St., Suite 400, Milwaukee, WI 53202 | |
(Address of principal executive offices) (Zip code)
Registrant’s telephone number, including area code
Lori Hoch
825 N. Jefferson St., Suite 400
(Name and address of agent for service)
Date of fiscal year end: June 30
Date of reporting period: July 1, 2014 - June 30, 2015
Item 1. Reports to Stockholders.
TABLE OF CONTENTS
| Cortina Small Cap Growth Fund | |
| Shareholder Letter | 1 |
| Portfolio Information | 3 |
| Cortina Small Cap Value Fund | |
| Shareholder Letter | 4 |
| Portfolio Information | 5 |
| Disclosure of Fund Expenses | 6 |
| Schedule of Investments | |
| Cortina Small Cap Growth Fund | 7 |
| Cortina Small Cap Value Fund | 10 |
| Statements of Assets and Liabilities | 12 |
| Statements of Operations | 13 |
| Statements of Changes in Net Assets | 14 |
| Financial Highlights | |
| Cortina Small Cap Growth Fund | 15 |
| Cortina Small Cap Value Fund - Institutional | 16 |
| Cortina Small Cap Value Fund - Investor | 17 |
| Notes to Financial Statements | 18 |
| Report of Independent Registered Public Accounting Firm | 23 |
| Additional Information | 24 |
| Board of Directors and Officers | 27 |
 | Shareholder Letter |
| Cortina Small Cap Growth Fund | June 30, 2015 (Unaudited) |
DEAR FELLOW SHAREHOLDERS:
A streak of four consecutive quarters with disappointing absolute performance and frustrating relative performance for the Cortina Small Cap Growth Fund came to an end as the Fund outperformed it’s benchmark index in the calendar second quarter of 2015. Since the end of January, we have seen a calming of the stylistic headwinds which had plagued the strategy, the Russell 2000® Growth, for the better part of a year. While not all of the headwinds have faded into memory, several have. The most crucial issue we have been dealing with is the bias against smaller capitalization stocks which has all but disappeared over the past 5 months. We have always skewed smaller than the typical small cap fund in spite of occasional periods where this style proves to be incredibly out of synch with the market at large. Over a full performance cycle, however, low market capitalization is a risk we are comfortable taking and we are pleased to see that it is no longer the penalty that it was for the majority of 2014 and first month of 2015.
While macro issues such as Greece, Puerto Rico, ISIS and China remain, market returns seem to suggest that the sudden popularity of portfolio repositioning into large and liquid U.S. equities has on-the-margin, subsided. In fact, looking at the return within the Russell 2000 Growth Index reveals that the smallest market cap quintile led the way in the June quarter, however it still comes in last on a year-to-date basis. Health Care remains very strong with Biotechs continuing to lead the way, returning more than 30% in the index year to date. Financials have also performed well of late, leading the index from a sector standpoint in the June quarter. Bond yields are moving upward causing the yield curve to steepen, which works to the benefit of banks and brokerage firms alike. While it has historically been difficult to find Financial companies (especially banks) that meet our growth desires, our Financial weighting has been on the rise thanks to our Banks that Don’t Look Like Banks and Consumerization of Healthcare themes that have each led us to uniquely positioned high growth financial companies. Another phenomenon that is helping out smaller equities is what appears to us as a pick-up in mergers and acquisitions (M&A) activity in small companies. It was frustrating to watch large, low-growth companies become cherished by acquirers for the last several years while there was little appetite for small company M&A. Thus far in 2015, however, small caps are increasingly targeted and our Fund has been a beneficiary of this increase in takeover activity.
Looking deeper into the Fund’s performance, the Technology sector was our strongest contributor to performance over the past six months. This sector was a thorn in our side for much of calendar 2014 when sector strength was driven by the semiconductor industry, which we generally observe as growing at a much slower pace than other technology industries including software and networking where the bulk of our technology holdings can be found. The market’s interest in semis was driven by M&A activity, where acquirers could exploit cheap capital and cost synergies to create financial accretion out of seemingly-dull companies. Lately, however, the bloom has come off the semiconductor rose. According to Credit Suisse, semi stocks across the market cap spectrum have slipped 12% off recent peaks as fears of a broad-based reduction to earnings and a quieting of M&A noise have occurred. The most exciting avenues of growth for chip companies have been in cyclical end markets such as industrial and automotive, and global macro concerns are causing a slowdown in demand.
The Industrial sector has also been a positive contributor to our performance. We are slightly underweight, but security selection has been strong, driving positive returns while the sector has been a slight negative contributor to the index over the past six months. Causing market veterans uneasiness as they look out to the future is the weak performance of the Transportation industry which began back at its peak close on December 29 and is down 11.5% for the first six months of the year. Historically, the transports can serve as a leading indicator for the market at large. The slowdown in spending on energy/mining-related projects as well as deteriorating economic growth in countries such as China and Brazil has created challenges for many industrial firms. We suspect plenty of firms and investors underappreciated how much energy exposure they really have. As always, we will try to use cyclical weakness as a time to invest in companies that are secular growers.
Offsetting relative strength in Technology and Industrials, the Health Care sector was a cause of sizable negative attribution. Above we reminded our readers of the strength of Biotech shares, an industry that we have historically avoided due to the unpredictable nature of clinical trials. Health Care remains our largest sector exposure, however, and a market backdrop that is more discerning to the specific fundamentals of small companies should give our investments an opportunity to shine. Health Care stocks are well represented in the top ten contributors for the past six months and many investments we have had incubating in the portfolio are really starting to hit their stride.
OUTLOOK AND POSITIONING
We enter Fiscal 2016 with more than 80% of our clients’ capital invested in the Health Care, Technology, Consumer Discretionary and Industrials sectors, which largely mimics the combined weight in the benchmark. Below the sector level, however, we are positioned quite differently than the benchmark. Biotech stocks now make up more than 12% of the benchmark while companies classified as biotechs are less than 2% of our portfolio and we do not own any clinical stage (pre-revenue) biotechnology companies. Our healthcare investments continue to be dominated by medical devices and life sciences companies and increasingly healthcare services companies. This is an interesting development since much like the financial stocks discussed above, healthcare services companies have traditionally not met our targeted level of growth. This is no longer the case as the rapidly changing regulatory and reimbursement environments (along with technological innovation) are spawning higher-growth service models that did not exist a few years ago. Our Consumerization of Healthcare theme has successfully led us to some of these opportunities.
| | |
| Annual Report | June 30, 2015 | 1 |
| Shareholder Letter |
| Cortina Small Cap Growth Fund | June 30, 2015 (Unaudited) |
We remain positively inclined to the Information Technology sector but security selection could be critical. The sector has been caught up in some very powerful trends such as cloud computing and network security. As a result, some of these stocks have performed marvelously but are now sitting at valuations where there is little room for error. We have found that when certain subsegments within technology get narrow, opportunities often open up in other subsegments given the ultimate interrelatedness of software, hardware, semiconductors, telecom equipment and services to the ultimate demand trends (ie high speed bandwidth, data analytics or mobility). One area we have been coming back to is the underlying telecom media which is necessary to deliver content over both internet and wireless connections.
Overall we feel we are entering fiscal 2016 in a more constructive environment for our strategy. Microcap stocks are no longer considered toxic, and growth is becoming an increasingly desirable investment characteristic biotechnology stocks are showing some early signs of weakness. Should these trends continue, it would likely bode well for our strategy.
Thank you for your continued investment and interest in the Cortina Small Cap Growth Fund.
| | |
| 2 | 1-855-612-3936 | www.cortinafunds.com |
| Portfolio Information |
| Cortina Small Cap Growth Fund | June 30, 2015 (Unaudited) |
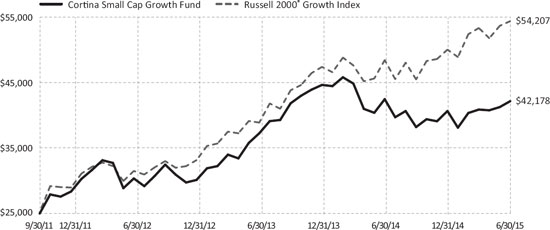
Growth of $25,000 Investment (Unaudited)
For the period from September 30, 2011 (Inception) to June 30, 2015.
This graph assumes an initial $25,000 investment at September 30, 2011 (Inception Date). The Cortina Small Cap Growth Fund (the “Fund”) will deduct a 2.00% redemption proceeds fee on Fund shares held 60 days or less . This graph depicts the performance of the Fund versus the Russell 2000® Growth Index. It is important to note the Fund is a professionally managed mutual fund while the index is not available for investment and is unmanaged. The comparison is shown for illustrative purposes only.
This chart does not reflect the deduction of taxes that a shareholder would pay on Fund distributions or the redemption of Fund shares.
Performance Returns for the period ended June 30, 2015
| | 6 Months | 1 Year | 3 Years | Since Inception* | Gross
Expense Ratio** |
| Cortina Small Cap Growth Fund | 3.70% | -0.71% | 11.59% | 14.96% | 1.88% |
Russell 2000® Growth Index | 8.74% | 12.34% | 20.11% | 22.92% | |
| * | The Fund’s inception date is September 30, 2011. |
| ** | Cortina Asset Management, LLC (the “Adviser”) has contractually agreed to waive management fees and/or reimburse the Fund’s operating expenses in order to limit the Fund’s total annual fund operating expenses (excluding taxes, leverage, interest, brokerage commissions, dividends or interest expenses on short positions, acquired fund fees and expenses and extraordinary expenses) to 1.10% of average daily net assets of the Fund. The agreement will continue in effect at least through October 31, 2015, subject thereafter to annual re-approval of the agreement by the Fund’s Board of Directors. |
Past performance does not guarantee future results. The performance data quoted represents past performance and current returns may be lower or higher. Total return figures include change in share price, reinvestment of dividends and capital gains. The investment return and principal value will fluctuate so that an investor’s shares, when redeemed may be worth more or less than their original cost. To obtain performance information current to the most recent month end, call 1-855-612-3936.
Russell 2000® Growth Index measures the performance of the small-cap growth segment of the U.S. equity universe. It includes those Russell 2000 companies with higher price-to-value ratios and higher forecasted growth values. All indices are unmanaged. It is not possible to invest directly in an index.
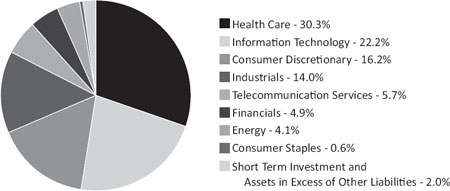
Sector Allocations***
| *** | Percentages are based on Net Assets as of June 30, 2015. Holdings are subject to change. |
| | |
| Annual Report | June 30, 2015 | 3 |
| Shareholder Letter |
| Cortina Small Cap Value Fund | June 30, 2015 (Unaudited) |
DEAR FELLOW SHAREHOLDERS:
The first half of calendar 2015 appears to have been the fairly ponderous opening act to a more interesting second half. For the period, the benchmark Russell 2000 Value Index was virtually unchanged with a positive return measured in basis points (1/100th of one percentage point) versus percentage points. The Cortina Small Cap Value Fund performed well by outpacing the index. Stock selection drove the majority of the performance with strong contributions within the Consumer, Technology, Financial, and Health Care sectors.
The last several quarters have contained their share of excitement for certain specific companies, yet the dominant themes have been macro in nature: the drop in oil prices and subsequent wipe out of North American energy equities; shifting expectations around the Federal Reserve’s Interest Rate Policies; and the domestic and global implications of a stronger U.S. dollar.
Two important themes have developed within the portfolio. First, we are pursuing a balanced approach to the financial sector, the largest segment of both the portfolio and the benchmark. Taking a definitive view on which way rates are trending has become perilous as the number and importance of global inputs is greater than ever and prone to quick reversals. Therefore, we are long certain banks that we believe will do well in a rising rate environment, yet we are also long certain Real Estate Investment Trusts (REIT) that we believe will do well even in a falling rate environment. Each position has its own unique characteristics. In fact, in the face of the MSCI US REIT Index that delivered a total return of negative 6.2% YTD through June 30, one of the strategy’s best returns this year is a REIT whose total return was greater than 50% YTD through June 30. At some point, this balance will likely become weighted one way or another, as it has in the past, but the data does not comport to a solid investable conclusion.
Second, the strategy is underweight commodity-related themes. Energy, Industrials, and Agriculture in particular are underrepresented in the portfolio. The portfolio contains one energy company as of this writing, no agriculture names, and an aversion to industrials that serve those sectors. There are good companies to be found, and in fact we have a growing list of potential candidates, but in our view the commodity and energy cycles have more downside risk than near-term opportunity - although agriculture may be nearing a turn. Still, for even the companies we like and hope to own, we see a consensus expectation for earnings that are unlikely to be achieved. Conversely, those in which we feel strongly about, forward earnings trade at valuations that are far from compelling.
In our view, the US economy is doing well, and in some regards very well. It is not altogether wrong that investors bid up equities in the anticipation of greater earnings yet to come. That is the point of the entire endeavor. Still, as investors attempt to maintain some semblance of discipline, we are at a bit of a loss to reconcile the learnings in books, history, and experience that valuations eventually always matter with an environment in which even esteemed value managers note that flexibility in these judgments is now necessary. Never mind that many industrials and transportation equities keep dropping daily, a phenomenon that often indicates trouble to come. It is somewhat reminiscent of the final scene in Monty Python’s Life of Brian where the crucified men break into song, “always look on the bright side of life.” Certain segments of the market are anticipating a marked slowdown in the economy, and those signs should not be dismissed lightly, yet the optimistic bias seems to win out. In our view, today, risk control feels like the right focus over speculative returns.
Finally, in a bit of wishful thinking, it would be nice to see growth surrender its leadership and let value have a turn. Over the past several years, the performance of the growth constituents within the small cap indices has well outpaced that of the value constituents. This is partially explainable by the weak performance of the value-heavy interest rate sensitive Utilities and REIT sectors in 2015 and the stellar gains posted by, often unprofitable, biotech companies in growth indices. But it is more than that. Industrials, Materials, and Energy, many of which fall into the value category, have been weak and not unfairly so. Growth is, at a minimum, slowing for many of those sectors and, certainly in the case of Energy, declining. Thus, our notable overweights remain Consumer Discretionary, Health Care, and Technology, and we remain underweight Energy, Industrials, and Financials. Absent a material correction in equity prices or a marked acceleration in economic fundamentals, we do not anticipate significant changes to these weightings in the near-term.
The MSCI US REIT Index- is a free float-adjusted market capitalization index that is comprised of equity REITs.
| | |
| 4 | 1-855-612-3936 | www.cortinafunds.com |
| Portfolio Information |
| Cortina Small Cap Value Fund | June 30, 2015 (Unaudited) |
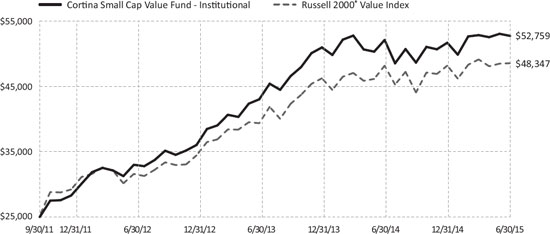
Growth of $25,000 Investment (Unaudited)
For the period from September 30, 2011 (Inception) to June 30, 2015.
This graph assumes an initial $25,000 investment at September 30, 2011 (Inception Date). The Cortina Small Cap Value Fund Institutional share class (the “Fund”) will deduct a 2.00% redemption proceeds fee on Fund shares held 60 days or less. This graph depicts the performance of the Fund versus the Russell 2000® Value Index. It is important to note the Fund is a professionally managed mutual fund, while the index is not available for investment and is unmanaged. The comparison is shown for illustrative purposes only. Performance will vary from class to class based on differences in class-specific expenses.
This chart does not reflect the deduction of taxes that a shareholder would pay on Fund distributions or the redemption of Fund shares.
Performance Returns for the period ended June 30, 2015
| | 6 Months | 1 Year | 3 Years* | Since Inception* | Gross
Expense Ratio** |
| Cortina Small Cap Value Fund - Institutional | 2.04% | 1.21% | 16.93% | 22.03% | 1.95% |
| Cortina Small Cap Value Fund - Investor | 1.93% | 0.94% | 16.65% | 21.74% | 2.17% |
| Russell 2000® Value Index | 0.76% | 0.78% | 15.50% | 19.23%*** | |
| * | The Fund’s Institutional shares inception date is September 30, 2011, Investor shares inception date is April 30, 2014. The performance shown for Investor shares for periods pre-dating the commencement of operations of that class reflects the performance of the Fund’s Institutional shares, the initial share class, calculated using the fees and expenses of Investor shares. If Investor shares of the Fund had been available during periods prior to April 30, 2014, the performance shown may have been different. |
| ** | Cortina Asset Management, LLC (the “Adviser”) has contractually agreed to waive management fees and/or reimburse the Fund’s operating expenses in order to limit the Fund’s total annual fund operating expenses (excluding 12b-1 fees, taxes, leverage, interest, brokerage commissions, dividends or interest expenses on short positions, acquired fund fees and expenses and extraordinary expenses) to 1.10% of average daily net assets of the Fund. The agreement will continue in effect at least through October 31, 2015, subject thereafter to annual re-approval of the agreement by the Fund’s Board
of Directors. |
| *** | Represents the period from September 30, 2011 (date of original public offering of the Institutional shares) through June 30, 2015. |
Past performance does not guarantee future results. The performance data quoted represents past performance and current returns may be lower or higher. Total return figures include change in share price, reinvestment of dividends and capital gains. The investment return and principal value will fluctuate so that an investor’s shares, when redeemed may be worth more or less than their original cost. To obtain performance information current to the most recent month end, call 1-855-612-3936.
Russell 2000® Value Index measures the performance of those Russell 2000 companies with lower price-to-book ratios and lower forecasted growth values. All indices are unmanaged. It is not possible to invest directly in an index.
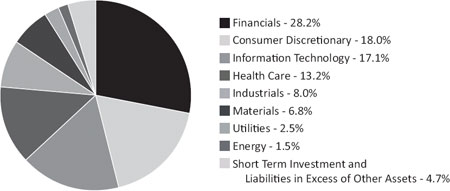
Sector Allocations****
| **** | Percentages are based on Net Assets as of June 30, 2015. Holdings are subject to change. |
| | |
| Annual Report | June 30, 2015 | 5 |
| Disclosure of Fund Expenses |
| June 30, 2015 (Unaudited) |
As a shareholder of the Fund(s), you incur ongoing costs, including management fees and other Fund expenses. This example is intended to help you understand your ongoing costs (in dollars) of investing in each Fund and to compare these costs with the ongoing costs of investing in other mutual funds. The example is based on an investment of $1,000 invested at the beginning of the period and held for the entire period, as indicated below.
Actual Expenses – The first line of the table below provides information about the actual account values and actual expenses. You may use the information in this line, together with the amount you invested, to estimate the expenses that you paid over the period. Simply divide your account value by $1,000 (for example, an $8,600 account value divided by $1,000 = 8.6) then multiply the result by the number in the first line under the heading entitled “Expenses Paid During Period” to estimate the expenses you paid on your account during this period.
Hypothetical Example for Comparison Purposes – The second line of the table below provides information about hypothetical account values and hypothetical expenses based on each Fund’s actual expense ratio and an assumed annual rate of return of 5% before expenses, which is not each Fund’s actual return. The hypothetical account values and expenses may not be used to estimate the actual ending account balance or expenses you paid for the period. You may use this information to compare the ongoing costs of investing in each Fund and other funds by comparing these 5% hypothetical examples with the 5% hypothetical examples that appear in the shareholder reports of other funds.
Please note that the expenses shown in the table are meant to highlight your ongoing costs only and do not reflect any direct costs, such as wire fees or low balance fees. Therefore, the second line of the table is useful in comparing ongoing costs and will not help you determine the relative total costs of owning different funds. In addition, if these direct costs were included, your costs would be higher.
| | | Beginning | | | Ending | | | | | | Net | |
| | | Account Value | | | Account Value | | | Expenses Paid | | | Expense | |
| | | January 1, 2015 | | | June 30, 2015 | | | During Period(a) | | | Ratios(b) | |
| Cortina Small Cap Growth Fund ‐ Institutional | | | | | | | | | | | | |
| Actual Fund Return | | $ | 1,000.00 | | | $ | 1,037.00 | | | $ | 5.56 | | | | 1.10 | % |
| Hypothetical Fund Return (assuming a 5% return before expenses) | | $ | 1,000.00 | | | $ | 1,019.34 | | | $ | 5.51 | | | | 1.10 | % |
| Cortina Small Cap Value Fund ‐ Institutional | | | | | | | | | | | | | | | | |
| Actual Fund Return | | $ | 1,000.00 | | | $ | 1,020.90 | | | $ | 5.51 | | | | 1.10 | % |
| Hypothetical Fund Return (assuming a 5% return before expenses) | | $ | 1,000.00 | | | $ | 1,019.34 | | | $ | 5.51 | | | | 1.10 | % |
| Cortina Small Cap Value Fund ‐ Investor | | | | | | | | | | | | | | | | |
| Actual Fund Return | | $ | 1,000.00 | | | $ | 1,019.30 | | | $ | 6.76 | | | | 1.35 | % |
| Hypothetical Fund Return (assuming a 5% return before expenses) | | $ | 1,000.00 | | | $ | 1,018.10 | | | $ | 6.76 | | | | 1.35 | % |
(a) | Expenses are equal to the Fund’s annualized expense ratio multiplied by the average account value over the period, multiplied by the number of days in the most recent fiscal half year (181), divided by 365. |
(b) | Annualized, based on the Fund’s most recent half-year expenses. |
| | |
| 6 | 1-855-612-3936 | www.cortinafunds.com |
| Schedule of Investments |
| Cortina Small Cap Growth Fund | June 30, 2015 |
| | | Shares | | | Value | |
| COMMON STOCKS (98.0%) | | | | | | |
| Consumer Discretionary (16.2%) | | | | | | |
Build-A-Bear Workshop, Inc.(a) | | | 23,240 | | | $ | 371,608 | |
Dave & Buster’s Entertainment, Inc.(a) | | | 10,670 | | | | 385,080 | |
Fiesta Restaurant Group, Inc.(a) | | | 9,219 | | | | 460,950 | |
Five Below, Inc.(a) | | | 14,532 | | | | 574,450 | |
Gentherm, Inc.(a) | | | 4,990 | | | | 274,001 | |
IMAX Corp.(a) | | | 15,434 | | | | 621,527 | |
| Kirkland’s, Inc. | | | 20,381 | | | | 568,018 | |
Kona Grill, Inc.(a) | | | 21,316 | | | | 413,743 | |
LifeLock, Inc.(a) | | | 30,492 | | | | 500,069 | |
Malibu Boats, Inc., Class A(a) | | | 17,792 | | | | 357,441 | |
Motorcar Parts of America, Inc.(a) | | | 17,507 | | | | 526,786 | |
Nautilus, Inc.(a) | | | 28,037 | | | | 603,076 | |
Performance Sports Group, Ltd.(a) | | | 25,766 | | | | 463,788 | |
Restoration Hardware Holdings, Inc.(a) | | | 5,391 | | | | 526,323 | |
Tumi Holdings, Inc.(a) | | | 23,086 | | | | 473,725 | |
Universal Electronics, Inc.(a) | | | 8,052 | | | | 401,312 | |
| | | | | | | | 7,521,897 | |
| Consumer Staples (0.6%) | | | | | | | | |
Craft Brew Alliance, Inc.(a) | | | 23,264 | | | | 257,300 | |
| | | | | | | | | |
| Energy (4.1%) | | | | | | | | |
| Aegean Marine Petroleum Network, Inc. | | | 30,863 | | | | 381,467 | |
Carrizo Oil & Gas, Inc.(a) | | | 5,121 | | | | 252,158 | |
| Evolution Petroleum Corp. | | | 10,172 | | | | 67,034 | |
RigNet, Inc.(a) | | | 11,152 | | | | 340,917 | |
Ring Energy, Inc.(a) | | | 16,215 | | | | 181,446 | |
Sanchez Energy Corp.(a) | | | 32,748 | | | | 320,930 | |
Synergy Resources Corp.(a) | | | 29,701 | | | | 339,482 | |
| | | | | | | | 1,883,434 | |
| Financials (4.9%) | | | | | | | | |
BofI Holding, Inc.(a) | | | 5,039 | | | | 532,673 | |
| EverBank Financial Corp. | | | 25,308 | | | | 497,302 | |
Health Insurance Innovations, Inc., Class A(a) | | | 40,757 | | | | 202,562 | |
LendingTree, Inc.(a) | | | 6,201 | | | | 487,461 | |
| Pinnacle Financial Partners, Inc. | | | 10,357 | | | | 563,110 | |
| | | | | | | | 2,283,108 | |
| Health Care (30.3%) | | | | | | | | |
AAC Holdings, Inc.(a) | | | 8,327 | | | | 362,724 | |
ABIOMED, Inc.(a) | | | 6,051 | | | | 397,732 | |
Adeptus Health, Inc., Class A(a) | | | 6,186 | | | | 587,608 | |
AtriCure, Inc.(a) | | | 46,456 | | | | 1,144,676 | |
BioTelemetry, Inc.(a) | | | 66,523 | | | | 627,312 | |
Cepheid(a) | | | 7,011 | | | | 428,723 | |
Cerus Corp.(a) | | | 76,745 | | | | 398,306 | |
Depomed, Inc.(a) | | | 19,817 | | | | 425,273 | |
Endologix, Inc.(a) | | | 28,886 | | | | 443,111 | |
HealthEquity, Inc.(a) | | | 19,928 | | | | 638,692 | |
HealthStream, Inc.(a) | | | 15,694 | | | | 477,411 | |
HeartWare International, Inc.(a) | | | 6,287 | | | | 457,002 | |
HMS Holdings Corp.(a) | | | 19,590 | | | | 336,360 | |
Imprivata, Inc.(a) | | | 35,072 | | | | 573,778 | |
K2M Group Holdings, Inc.(a) | | | 22,353 | | | | 536,919 | |
Ligand Pharmaceuticals, Inc.(a) | | | 3,896 | | | | 393,106 | |
NanoString Technologies, Inc.(a) | | | 42,873 | | | | 661,102 | |
Neogen Corp.(a) | | | 7,025 | | | | 333,266 | |
| See Notes to Financial Statements. | |
| Annual Report | June 30, 2015 | 7 |
| Schedule of Investments |
| Cortina Small Cap Growth Fund | June 30, 2015 |
| | | Shares | | | Value | |
| COMMON STOCKS (continued) | | | | | | |
| Health Care (continued) | | | | | | |
NeoGenomics, Inc.(a) | | | 136,031 | | | $ | 735,928 | |
NxStage Medical, Inc.(a) | | | 46,913 | | | | 670,152 | |
OraSure Technologies, Inc.(a) | | | 42,020 | | | | 226,488 | |
Oxford Immunotec Global PLC(a) | | | 34,074 | | | | 471,925 | |
Pernix Therapeutics Holdings, Inc.(a) | | | 44,555 | | | | 263,766 | |
Quidel Corp.(a) | | | 16,557 | | | | 379,983 | |
The Spectranetics Corp.(a) | | | 21,798 | | | | 501,572 | |
Streamline Health Solutions, Inc.(a) | | | 56,769 | | | | 158,953 | |
Synergetics USA, Inc.(a) | | | 21,031 | | | | 98,846 | |
TearLab Corp.(a) | | | 81,031 | | | | 163,683 | |
Teladoc, Inc.(a) | | | 257 | | | | 4,883 | |
| Trinity Biotech PLC, Sponsored ADR | | | 28,843 | | | | 520,905 | |
Vocera Communications, Inc.(a) | | | 52,705 | | | | 603,472 | |
| | | | | | | | 14,023,657 | |
| Industrials (14.0%) | | | | | | | | |
The Advisory Board Co.(a) | | | 9,542 | | | | 521,661 | |
| Allegiant Travel Co. | | | 2,517 | | | | 447,724 | |
| Barnes Group, Inc. | | | 12,401 | | | | 483,515 | |
| Celadon Group, Inc. | | | 12,671 | | | | 262,036 | |
Controladora Vuela Cia de Aviacion SAB de CV, ADR(a) | | | 44,088 | | | | 526,411 | |
| Forward Air Corp. | | | 8,356 | | | | 436,684 | |
Franklin Covey Co.(a) | | | 15,289 | | | | 310,214 | |
Heritage Crystal Clean, Inc.(a) | | | 18,708 | | | | 275,007 | |
Hub Group, Inc., Class A(a) | | | 9,706 | | | | 391,540 | |
| Insteel Industries, Inc. | | | 21,528 | | | | 402,574 | |
On Assignment, Inc.(a) | | | 11,591 | | | | 455,294 | |
Power Solutions International, Inc.(a) | | | 4,730 | | | | 255,515 | |
TASER International, Inc.(a) | | | 15,786 | | | | 525,832 | |
Team, Inc.(a) | | | 14,416 | | | | 580,244 | |
Trex Co., Inc.(a) | | | 8,602 | | | | 425,197 | |
USA Truck, Inc.(a) | | | 8,069 | | | | 171,305 | |
| | | | | | | | 6,470,753 | |
| Information Technology (22.2%) | | | | | | | | |
Actua Corp.(a) | | | 16,962 | | | | 241,878 | |
BroadSoft, Inc.(a) | | | 14,388 | | | | 497,393 | |
CommVault Systems, Inc.(a) | | | 5,884 | | | | 249,540 | |
Everyday Health, Inc.(a) | | | 38,592 | | | | 493,206 | |
Fleetmatics Group PLC(a) | | | 12,440 | | | | 582,565 | |
Imperva, Inc.(a) | | | 11,543 | | | | 781,461 | |
Infoblox, Inc.(a) | | | 25,844 | | | | 677,371 | |
Inphi Corp.(a) | | | 28,939 | | | | 661,546 | |
Internap Corp.(a) | | | 57,107 | | | | 528,240 | |
Intralinks Holdings, Inc.(a) | | | 38,688 | | | | 460,774 | |
M/A-COM Technology Solutions Holdings, Inc.(a) | | | 13,457 | | | | 514,730 | |
| Marchex, Inc., Class B | | | 87,241 | | | | 431,843 | |
Marketo, Inc.(a) | | | 12,232 | | | | 343,230 | |
Orbotech, Ltd.(a) | | | 12,560 | | | | 261,248 | |
Planet Payment, Inc.(a) | | | 149,174 | | | | 361,001 | |
PMC-Sierra, Inc.(a) | | | 45,839 | | | | 392,382 | |
Q2 Holdings, Inc.(a) | | | 19,802 | | | | 559,406 | |
Qlik Technologies, Inc.(a) | | | 11,070 | | | | 387,007 | |
RADWARE, Ltd.(a) | | | 25,988 | | | | 576,934 | |
ShoreTel, Inc.(a) | | | 71,706 | | | | 486,167 | |
SPS Commerce, Inc.(a) | | | 4,421 | | | | 290,902 | |
TechTarget, Inc.(a) | | | 36,707 | | | | 327,794 | |
| See Notes to Financial Statements. | |
| 8 | 1-855-612-3936 | www.cortinafunds.com |
| Schedule of Investments |
| Cortina Small Cap Growth Fund | June 30, 2015 |
| | | Shares | | | Value | |
| COMMON STOCKS (continued) | | | | | | |
| Information Technology (continued) | | | | | | |
Varonis Systems, Inc.(a) | | | 8,336 | | | $ | 184,142 | |
| | | | | | | | 10,290,760 | |
| Telecommunication Services (5.7%) | | | | | | | | |
8x8, Inc.(a) | | | 56,923 | | | | 510,030 | |
Boingo Wireless, Inc.(a) | | | 54,681 | | | | 451,665 | |
| Cogent Communications Holdings, Inc. | | | 13,987 | | | | 473,320 | |
inContact, Inc.(a) | | | 57,179 | | | | 564,357 | |
RingCentral, Inc., Class A(a) | | | 33,910 | | | | 626,996 | |
| | | | | | | | 2,626,368 | |
| | | | | | | | | |
TOTAL COMMON STOCKS
(COST $37,596,620) | | | | | | | 45,357,277 | |
| | | | | | | | | |
| SHORT TERM INVESTMENT (1.6%) | | | | | | | | |
| Daily Income Fund ‐ Money Market Portfolio Fiduciary Class Shares, 7 Day Yield 0.010% | | | 753,383 | | | | 753,383 | |
| | | | | | | | | |
TOTAL SHORT TERM INVESTMENT
(COST $753,383) | | | | | | | 753,383 | |
| | | | | | | | | |
TOTAL INVESTMENTS (99.6%)
(COST $38,350,003) | | | | | | | 46,110,660 | |
| | | | | | | | | |
| TOTAL ASSETS IN EXCESS OF OTHER LIABILITIES (0.4%) | | | | | | | 174,279 | |
| | | | | | | | | |
| NET ASSETS 100.0% | | | | | | $ | 46,284,939 | |
(a) | Non Income Producing Security. |
Common Abbreviations:
ADR -American Depositary Receipt.
Ltd. - Limited.
PLC - Public Limited Company.
SAB de CV - A variable rate company.
| See Notes to Financial Statements. | |
| Annual Report | June 30, 2015 | 9 |
| | Schedule of Investments |
| Cortina Small Cap Value Fund | June 30, 2015 |
| | | Shares | | | Value | |
| COMMON STOCKS (95.3%) | | | | | | |
| Consumer Discretionary (18.0%) | | | | | | |
| Bloomin’ Brands, Inc. | | | 48,094 | | | $ | 1,026,807 | |
| ClubCorp Holdings, Inc. | | | 57,120 | | | | 1,364,026 | |
| Cooper Tire & Rubber Co. | | | 7,289 | | | | 246,587 | |
Cooper‐Standard Holding, Inc.(a) | | | 14,321 | | | | 880,312 | |
Fox Factory Holding Corp.(a) | | | 30,730 | | | | 494,138 | |
Helen of Troy, Ltd.(a) | | | 19,427 | | | | 1,893,938 | |
Houghton Mifflin Harcourt Co.(a) | | | 29,751 | | | | 749,725 | |
Performance Sports Group, Ltd.(a) | | | 63,902 | | | | 1,150,236 | |
| SeaWorld Entertainment, Inc. | | | 37,985 | | | | 700,443 | |
Tile Shop Holdings, Inc.(a) | | | 56,845 | | | | 806,631 | |
| | | | | | | | 9,312,843 | |
| Energy (1.5%) | | | | | | | | |
C&J Energy Services, Ltd.(a) | | | 57,386 | | | | 757,495 | |
| | | | | | | | | |
| Financials (28.2%) | | | | | | | | |
The Bancorp, Inc.(a) | | | 81,498 | | | | 756,301 | |
| Boston Private Financial Holdings, Inc. | | | 50,028 | | | | 670,876 | |
| Capitol Federal Financial, Inc. | | | 46,865 | | | | 564,255 | |
| ConnectOne Bancorp, Inc. | | | 37,736 | | | | 812,456 | |
| Gramercy Property Trust, Inc., REIT | | | 29,175 | | | | 681,820 | |
| Hannon Armstrong Sustainable Infrastructure Capital, Inc., REIT | | | 50,123 | | | | 1,004,966 | |
iStar Financial, Inc., REIT(a) | | | 48,567 | | | | 646,912 | |
| Kennedy‐Wilson Holdings, Inc. | | | 35,321 | | | | 868,543 | |
| Maiden Holdings, Ltd. | | | 57,739 | | | | 911,121 | |
| MB Financial, Inc. | | | 23,321 | | | | 803,175 | |
Meridian Bancorp, Inc.(a) | | | 65,664 | | | | 880,554 | |
| National General Holdings Corp. | | | 58,117 | | | | 1,210,577 | |
| PacWest Bancorp | | | 20,501 | | | | 958,627 | |
PHH Corp.(a) | | | 18,817 | | | | 489,807 | |
| State National Cos, Inc. | | | 67,702 | | | | 733,213 | |
Texas Capital Bancshares, Inc.(a) | | | 16,908 | | | | 1,052,354 | |
Virtu Financial, Inc., Class A(a) | | | 32,957 | | | | 773,830 | |
| Waterstone Financial, Inc. | | | 56,544 | | | | 746,381 | |
| | | | | | | | 14,565,768 | |
| Health Care (13.2%) | | | | | | | | |
Allscripts Healthcare Solutions, Inc.(a) | | | 60,223 | | | | 823,851 | |
AngioDynamics, Inc.(a) | | | 50,991 | | | | 836,252 | |
Halyard Health, Inc.(a) | | | 14,957 | | | | 605,758 | |
Healthways, Inc.(a) | | | 55,564 | | | | 665,657 | |
IPC Healthcare, Inc.(a) | | | 10,307 | | | | 570,905 | |
Magellan Health, Inc.(a) | | | 14,742 | | | | 1,032,972 | |
MedAssets, Inc.(a) | | | 35,475 | | | | 782,578 | |
| Phibro Animal Health Corp., Class A | | | 19,607 | | | | 763,497 | |
Prestige Brands Holdings, Inc.(a) | | | 15,636 | | | | 723,009 | |
| | | | | | | | 6,804,479 | |
| Industrials (8.0%) | | | | | | | | |
Beacon Roofing Supply, Inc.(a) | | | 23,252 | | | | 772,431 | |
| Celadon Group, Inc. | | | 23,759 | | | | 491,336 | |
| Federal Signal Corp. | | | 39,653 | | | | 591,226 | |
FTI Consulting, Inc.(a) | | | 17,519 | | | | 722,484 | |
Hawaiian Holdings, Inc.(a) | | | 36,653 | | | | 870,509 | |
Tutor Perini Corp.(a) | | | 31,401 | | | | 677,634 | |
| | | | | | | | 4,125,620 | |
| Information Technology (17.1%) | | | | | | | | |
ACI Worldwide, Inc.(a) | | | 47,819 | | | | 1,174,913 | |
| See Notes to Financial Statements. | |
| 10 | 1-855-612-3936 | www.cortinafunds.com |
| | Schedule of Investments |
| Cortina Small Cap Value Fund | June 30, 2015 |
| | | Shares | | | Value | |
| COMMON STOCKS (continued) | | | | | | |
| Information Technology (continued) | | | | | | |
Advanced Energy Industries, Inc.(a) | | | 35,518 | | | $ | 976,390 | |
Avid Technology, Inc.(a) | | | 58,934 | | | | 786,180 | |
Canadian Solar, Inc.(a) | | | 20,656 | | | | 590,762 | |
Eastman Kodak Co.(a) | | | 36,395 | | | | 611,436 | |
| Ebix, Inc. | | | 28,814 | | | | 939,624 | |
ExlService Holdings, Inc.(a) | | | 20,157 | | | | 697,029 | |
FARO Technologies, Inc.(a) | | | 14,570 | | | | 680,419 | |
Itron, Inc.(a) | | | 7,298 | | | | 251,343 | |
Ixia(a) | | | 55,831 | | | | 694,538 | |
Newport Corp.(a) | | | 35,493 | | | | 672,947 | |
Tower Semiconductor, Ltd.(a) | | | 47,501 | | | | 733,415 | |
| | | | | | | | 8,808,996 | |
| Materials (6.8%) | | | | | | | | |
| Carpenter Technology Corp. | | | 18,679 | | | | 722,504 | |
Ferro Corp.(a) | | | 50,690 | | | | 850,578 | |
| Graphic Packaging Holdings Co. | | | 36,464 | | | | 507,943 | |
| Myers Industries, Inc. | | | 42,885 | | | | 814,815 | |
| TimkenSteel Corp. | | | 23,183 | | | | 625,709 | |
| | | | | | | | 3,521,549 | |
| Utilities (2.5%) | | | | | | | | |
| Black Hills Corp. | | | 11,527 | | | | 503,154 | |
| Chesapeake Utilities Corp. | | | 14,484 | | | | 779,963 | |
| | | | | | | | 1,283,117 | |
| | | | | | | | | |
| TOTAL COMMON STOCKS (COST $44,474,767) | | | | | | | 49,179,867 | |
| | | | | | | | | |
| SHORT TERM INVESTMENT (5.8%) | | | | | | | | |
| Daily Income Fund‐Money Market Portfolio Fiduciary Class Shares, 7 Day Yield 0.010% | | | 2,994,714 | | | | 2,994,714 | |
| | | | | | | | | |
| TOTAL SHORT TERM INVESTMENT (COST $2,994,714) | | | | | | | 2,994,714 | |
| | | | | | | | | |
| TOTAL INVESTMENTS (101.1%) (COST $47,469,481) | | | | | | | 52,174,581 | |
| | | | | | | | | |
| TOTAL LIABILITIES IN EXCESS OF OTHER ASSETS (‐1.1%) | | | | | | | (560,699 | ) |
| | | | | | | | | |
| NET ASSETS 100.0% | | | | | | $ | 51,613,882 | |
(a) | Non Income Producing Security. |
Common Abbreviations:
Ltd. - Limited.
REIT - Real Estate Investment Trust.
| See Notes to Financial Statements. | |
| Annual Report | June 30, 2015 | 11 |
| Statements of Assets and Liabilities |
| June 30, 2015 |
| | | Cortina Small Cap | | | Cortina Small Cap | |
| | | Growth Fund | | | Value Fund | |
| ASSETS: | | | | | | |
| Investments, at value (Cost ‐ see below) | | $ | 46,110,660 | | | $ | 52,174,581 | |
| Receivable for investments sold | | | 388,612 | | | | – | |
| Receivable for fund shares subscribed | | | 52,419 | | | | 20,842 | |
| Dividends receivable | | | 6,918 | | | | 52,207 | |
| Prepaid expenses and other assets | | | 4,920 | | | | 10,563 | |
| Total Assets | | | 46,563,529 | | | | 52,258,193 | |
| | | | | | | | | |
| LIABILITIES: | | | | | | | | |
| Payable for investments purchased | | | 117,958 | | | | 576,778 | |
| Payable for fund shares redeemed | | | 97,846 | | | | 3,453 | |
| Payable for director fees | | | 500 | | | | 500 | |
| Payable for advisory fees | | | 23,462 | | | | 23,617 | |
| Payable for fund accounting and administration fees | | | 10,521 | | | | 10,166 | |
| Payable for distribution and service fees | | | – | | | | 76 | |
| Payable for audit and legal fees | | | 17,755 | | | | 17,933 | |
| Other accrued liabilities and expenses | | | 10,548 | | | | 11,788 | |
| Total Liabilities | | | 278,590 | | | | 644,311 | |
| Net Assets | | $ | 46,284,939 | | | $ | 51,613,882 | |
| | | | | | | | | |
| NET ASSETS CONSISTS OF: | | | | | | | | |
| Paid‐in capital | | $ | 42,067,511 | | | $ | 47,531,086 | |
| Accumulated net investment loss | | | (213,193 | ) | | | (18,072 | ) |
| Accumulated undistributed net realized loss on investments | | | (3,330,036 | ) | | | (604,232 | ) |
| Net unrealized appreciation on investments | | | 7,760,657 | | | | 4,705,100 | |
| Net Assets | | $ | 46,284,939 | | | $ | 51,613,882 | |
| | | | | | | | | |
| Cost of Investments | | $ | 38,350,003 | | | $ | 47,469,481 | |
| | | | | | | | | |
| PRICING OF SHARES: | | | | | | | | |
| Institutional | | | | | | | | |
| Net Assets | | $ | 46,284,939 | | | $ | 51,253,511 | |
| Shares Outstanding ($0.01 par value, unlimited number of shares authorized) | | | 3,003,898 | | | | 2,768,059 | |
| Net Asset Value, offering and redemption price per share | | $ | 15.41 | | | $ | 18.52 | |
| Investor | | | | | | | | |
| Net Assets | | $ | – | | | $ | 360,371 | |
| Shares Outstanding ($0.01 par value, unlimited number of shares authorized) | | | – | | | | 19,513 | |
| Net Asset Value, offering and redemption price per share | | $ | – | | | $ | 18.47 | |
| See Notes to Financial Statements. | |
| 12 | 1-855-612-3936 | www.cortinafunds.com |
| Statements of Operations |
| For the Year Ended June 30, 2015 |
| | | Cortina Small Cap | | | Cortina Small Cap | |
| | | Growth Fund | | | Value Fund | |
| | | | | | | |
| INVESTMENT INCOME: | | | | | | |
| Dividends (net of foreign withholding taxes of $– and $1,234, respectively) | | $ | 67,821 | | | $ | 410,279 | |
| Total Investment Income | | | 67,821 | | | | 410,279 | |
| | | | | | | | | |
| EXPENSES: | | | | | | | | |
| Advisory fees (Note 3) | | | 419,048 | | | | 422,612 | |
| Transfer agent fees | | | 35,580 | | | | 40,379 | |
| Fund accounting and administration fees and expenses | | | 107,418 | | | | 106,557 | |
| Distribution and service fees | | | | | | | | |
| Investor | | | – | | | | 589 | |
| Legal fees | | | 19,896 | | | | 20,692 | |
| Printing fees | | | 6,603 | | | | 10,967 | |
| Registration fees | | | 24,969 | | | | 39,772 | |
| Audit and tax fees | | | 14,500 | | | | 14,500 | |
| Custodian fees | | | 6,517 | | | | 5,968 | |
| Insurance | | | 8,584 | | | | 8,444 | |
| Director fees and expenses | | | 10,000 | | | | 10,000 | |
| Other | | | 6,245 | | | | 7,092 | |
| Total Expenses Before Waivers | | | 659,360 | | | | 687,572 | |
| Less fees waived by Adviser (Note 3) | | | (198,408 | ) | | | (222,111 | ) |
| Total Net Expenses | | | 460,952 | | | | 465,461 | |
| Net Investment Loss | | | (393,131 | ) | | | (55,182 | ) |
| | | | | | | | | |
| REALIZED AND UNREALIZED GAIN/(LOSS) ON INVESTMENTS: | | | | | | | | |
| Net realized gain/(loss) on investments | | | (2,878,481 | ) | | | 487,186 | |
| Net change in unrealized appreciation on investments | | | 3,991,897 | | | | 370,290 | |
| Net Realized and Unrealized Gain on Investments | | | 1,113,416 | | | | 857,476 | |
| Net Increase in Net Assets Resulting from Operations | | $ | 720,285 | | | $ | 802,294 | |
| See Notes to Financial Statements. | |
| Annual Report | June 30, 2015 | 13 |
| Statements of Changes in Net Assets |
| | | Cortina Small Cap Growth Fund | | | Cortina Small Cap Value Fund | |
| | | Year Ended | | | Year Ended | | | Year Ended | | | Year Ended | |
| | | June 30, 2015 | | | June 30, 2014 | | | June 30, 2015 | | | June 30, 2014 | |
| | | | | | | | | | | | | |
| OPERATIONS: | | | | | | | | | | | | |
| Net investment loss | | $ | (393,131 | ) | | $ | (294,323 | ) | | $ | (55,182 | ) | | $ | (20,837 | ) |
| Net realized gain/(loss) on investments | | | (2,878,481 | ) | | | 2,089,748 | | | | 487,186 | | | | (95,500 | ) |
| Net change in unrealized appreciation on investments | | | 3,991,897 | | | | 900,021 | | | | 370,290 | | | | 3,521,125 | |
| Net increase in net assets resulting from operations | | | 720,285 | | | | 2,695,446 | | | | 802,294 | | | | 3,404,788 | |
| | | | | | | | | | | | | | | | | |
| DISTRIBUTIONS TO SHAREHOLDERS: | | | | | | | | | | | | | | | | |
| Institutional | | | | | | | | | | | | | | | | |
| From net investment income | | | – | | | | – | | | | – | | | | (14,778 | ) |
| From net realized gains on investments | | | (1,833,184 | ) | | | (243,543 | ) | | | (816,791 | ) | | | (315,887 | ) |
| Investor | | | | | | | | | | | | | | | | |
| From net realized gains on investments | | | – | | | | – | | | | (5,280 | ) | | | – | |
| Total distributions | | | (1,833,184 | ) | | | (243,543 | ) | | | (822,071 | ) | | | (330,665 | ) |
| | | | | | | | | | | | | | | | | |
| CAPITAL SHARE TRANSACTIONS: | | | | | | | | | | | | | | | | |
| Institutional | | | | | | | | | | | | | | | | |
| Proceeds from sale of shares | | | 29,015,536 | | | | 18,446,886 | | | | 18,510,674 | | | | 30,499,453 | |
| Shares issued in reinvestment of distributions | | | 1,817,180 | | | | 241,505 | | | | 786,261 | | | | 314,553 | |
| Cost of shares redeemed | | | (15,092,422 | ) | | | (7,728,013 | ) | | | (2,859,262 | ) | | | (3,386,811 | ) |
| Redemption fees | | | 57 | | | | 330 | | | | 19 | | | | – | |
| Total | | | 15,740,351 | | | | 10,960,708 | | | | 16,437,692 | | | | 27,427,195 | |
| Investor | | | | | | | | | | | | | | | | |
| Proceeds from sale of shares | | | – | | | | – | | | | 276,871 | | | | 100,000 | |
| Shares issued in reinvestment of distributions | | | – | | | | – | | | | 5,280 | | | | – | |
| Cost of shares redeemed | | | – | | | | – | | | | (31,077 | ) | | | – | |
| Total | | | – | | | | – | | | | 251,074 | | | | 100,000 | |
| Net increase from capital shares transactions | | | 15,740,351 | | | | 10,960,708 | | | | 16,688,766 | | | | 27,527,195 | |
| | | | | | | | | | | | | | | | | |
| Net increase in net assets | | | 14,627,452 | | | | 13,412,611 | | | | 16,668,989 | | | | 30,601,318 | |
| | | | | | | | | | | | | | | | | |
| NET ASSETS: | | | | | | | | | | | | | | | | |
| Beginning of year | | | 31,657,487 | | | | 18,244,876 | | | | 34,944,893 | | | | 4,343,575 | |
| End of year | | $ | 46,284,939 | | | $ | 31,657,487 | | | $ | 51,613,882 | | | $ | 34,944,893 | |
| Including accumulated net investment loss of: | | $ | (213,193 | ) | | $ | – | | | $ | (18,072 | ) | | $ | (71,503 | ) |
| | | | | | | | | | | | | | | | | |
| OTHER INFORMATION: | | | | | | | | | | | | | | | | |
| Share Transactions: | | | | | | | | | | | | | | | | |
| Institutional | | | | | | | | | | | | | | | | |
| Beginning shares | | | 1,936,011 | | | | 1,261,863 | | | | 1,865,870 | | | | 278,108 | |
| Shares sold | | | 1,942,260 | | | | 1,128,073 | | | | 1,016,113 | | | | 1,757,108 | |
| Shares issued in reinvestment of dividends | | | 124,465 | | | | 14,654 | | | | 43,632 | | | | 17,802 | |
| Less shares redeemed | | | (998,838 | ) | | | (468,579 | ) | | | (157,556 | ) | | | (187,148 | ) |
| Ending shares | | | 3,003,898 | | | | 1,936,011 | | | | 2,768,059 | | | | 1,865,870 | |
| Investor | | | | | | | | | | | | | | | | |
| Beginning shares | | | – | | | | – | | | | 5,510 | | | | – | |
| Shares sold | | | – | | | | – | | | | 15,384 | | | | 5,510 | |
| Shares issued in reinvestment of dividends | | | – | | | | – | | | | 293 | | | | – | |
| Less shares redeemed | | | – | | | | – | | | | (1,674 | ) | | | – | |
| Ending shares | | | – | | | | – | | | | 19,513 | | | | 5,510 | |
| See Notes to Financial Statements. | |
| 14 | 1-855-612-3936 | www.cortinafunds.com |
| Financial Highlights |
| Cortina Small Cap Growth Fund | For a share outstanding throughout the periods presented. |
| | | | | | | | | | | | For the Period September 30, 2011 (Inception) to June 30, 2012 | |
| NET ASSET VALUE, BEGINNING OF PERIOD | | $ | 16.35 | | | $ | 14.46 | | | $ | 11.87 | | | $ | 10.00 | |
| INCOME/(LOSS) FROM INVESTMENT OPERATIONS: | | | | | | | | | | | | | | | | |
Net investment loss(a) | | | (0.14 | ) | | | (0.17 | ) | | | (0.13 | ) | | | (0.09 | ) |
| Net realized and unrealized gain/(loss) on investments | | | (0.02 | )(b) | | | 2.19 | | | | 2.81 | | | | 2.22 | |
| Total from Investment Operations | | | (0.16 | ) | | | 2.02 | | | | 2.68 | | | | 2.13 | |
| | | | | | | | | | | | | | | | | |
| DIVIDENDS AND DISTRIBUTIONS TO SHAREHOLDERS: | | | | | | | | | | | | | | | | |
| From net realized gains on investments | | | (0.78 | ) | | | (0.13 | ) | | | (0.09 | ) | | | (0.26 | ) |
| Total Dividends and Distributions to Shareholders | | | (0.78 | ) | | | (0.13 | ) | | | (0.09 | ) | | | (0.26 | ) |
| | | | | | | | | | | | | | | | | |
| Paid‐in Capital from Redemption Fees | | | 0.00 | (c) | | | 0.00 | (c) | | | – | | | | 0.00 | (c) |
| | | | | | | | | | | | | | | | | |
| NET INCREASE/(DECREASE) IN NET ASSET VALUE | | | (0.94 | ) | | | 1.89 | | | | 2.59 | | | | 1.87 | |
| | | | | | | | | | | | | | | | | |
| NET ASSET VALUE, END OF PERIOD | | $ | 15.41 | | | $ | 16.35 | | | $ | 14.46 | | | $ | 11.87 | |
| | | | | | | | | | | | | | | | | |
| TOTAL RETURN | | | (0.71 | %) | | | 13.99 | % | | | 22.79 | % | | | 21.40 | %(d) |
| | | | | | | | | | | | | | | | | |
| RATIOS AND SUPPLEMENTAL DATA: | | | | | | | | | | | | | | | | |
| Net assets, end of period (in 000s) | | $ | 46,285 | | | $ | 31,657 | | | $ | 18,245 | | | $ | 1,410 | |
| | | | | | | | | | | | | | | | | |
| RATIOS TO AVERAGE NET ASSETS: | | | | | | | | | | | | | | | | |
| Operating expenses excluding waiver/reimbursement | | | 1.57 | % | | | 1.86 | % | | | 3.85 | % | | | 21.70 | %(e) |
| Operating expenses including waiver/reimbursement | | | 1.10 | % | | | 1.10 | % | | | 1.10 | % | | | 1.10 | %(e) |
| Net investment loss including waiver/reimbursement | | | (0.94 | )% | | | (1.02 | )% | | | (1.00 | )% | | | (0.99 | )%(e) |
| | | | | | | | | | | | | | | | | |
| PORTFOLIO TURNOVER RATE | | | 95 | % | | | 81 | % | | | 73 | % | | | 144 | % |
(a) | Calculated using average shares throughout the period. |
(b) | Realized and unrealized gains and losses per share in this caption are balancing amounts necessary to reconcile the change in net asset value per share for the period, and may not reconcile with the aggregate gains and losses in the Statements of Operations due to the share transactions for the period. |
(c) | Less than $0.005 per share. |
(d) | Not Annualized. |
(e) | Annualized. |
| See Notes to Financial Statements. | |
| Annual Report | June 30, 2015 | 15 |
| Financial Highlights |
| Cortina Small Cap Value Fund – Institutional | For a share outstanding throughout the periods presented. |
| | | | | | | | | | | | For the Period September 30, 2011 (Inception) to June 30, 2012 | |
| NET ASSET VALUE, BEGINNING OF PERIOD | | $ | 18.67 | | | $ | 15.62 | | | $ | 12.54 | | | $ | 10.00 | |
| INCOME/(LOSS) FROM INVESTMENT OPERATIONS: | | | | | | | | | | | | | | | | |
Net investment income/(loss)(a) | | | (0.02 | ) | | | (0.01 | ) | | | 0.01 | | | | (0.03 | ) |
| Net realized and unrealized gain on investments | | | 0.24 | | | | 3.30 | | | | 3.68 | | | | 3.14 | |
| Total from Investment Operations | | | 0.22 | | | | 3.29 | | | | 3.69 | | | | 3.11 | |
| | | | | | | | | | | | | | | | | |
| DIVIDENDS AND DISTRIBUTIONS TO SHAREHOLDERS: | | | | | | | | | | | | | | | | |
| From net investment income | | | – | | | | (0.01 | ) | | | (0.07 | ) | | | – | |
| From net realized gains on investments | | | (0.37 | ) | | | (0.23 | ) | | | (0.54 | ) | | | (0.57 | ) |
| Total Dividends and Distributions to Shareholders | | | (0.37 | ) | | | (0.24 | ) | | | (0.61 | ) | | | (0.57 | ) |
| | | | | | | | | | | | | | | | | |
| Paid‐in Capital from Redemption Fees | | | 0.00 | (b) | | | – | | | | – | | | | 0.00 | (b) |
| | | | | | | | | | | | | | | | | |
| NET INCREASE/(DECREASE) IN NET ASSET VALUE | | | (0.15 | ) | | | 3.05 | | | | 3.08 | | | | 2.54 | |
| | | | | | | | | | | | | | | | | |
| NET ASSET VALUE, END OF PERIOD | | $ | 18.52 | | | $ | 18.67 | | | $ | 15.62 | | | $ | 12.54 | |
| | | | | | | | | | | | | | | | | |
| TOTAL RETURN | | | 1.21 | % | | | 21.14 | % | | | 30.41 | % | | | 31.99 | %(c) |
| | | | | | | | | | | | | | | | | |
| RATIOS AND SUPPLEMENTAL DATA: | | | | | | | | | | | | | | | | |
| Net assets, end of period (in 000s) | | $ | 51,254 | | | $ | 34,842 | | | $ | 4,344 | | | $ | 1,942 | |
| | | | | | | | | | | | | | | | | |
| RATIOS TO AVERAGE NET ASSETS: | | | | | | | | | | | | | | | | |
| Operating expenses excluding waiver/reimbursement | | | 1.63 | % | | | 1.92 | % | | | 5.55 | % | | | 22.37 | %(d) |
| Operating expenses including waiver/reimbursement | | | 1.10 | % | | | 1.10 | % | | | 1.10 | % | | | 1.10 | %(d) |
| Net investment income/(loss) including waiver/reimbursement | | | (0.13 | )% | | | (0.09 | )% | | | 0.10 | % | | | (0.32 | )%(d) |
| | | | | | | | | | | | | | | | | |
| PORTFOLIO TURNOVER RATE | | | 102 | % | | | 78 | % | | | 81 | % | | | 146 | % |
(a) | Calculated using average shares throughout the period. |
(b) | Less than $0.005 per share. |
(c) | Not Annualized. |
(d) | Annualized. |
| See Notes to Financial Statements. | |
| 16 | 1-855-612-3936 | www.cortinafunds.com |
| Financial Highlights |
| Cortina Small Cap Value Fund – Investor | For a share outstanding throughout the periods presented. |
| | | | | | For the Period | |
| | | | | | April 30, 2014 | |
| | | Year Ended | | | (Inception) to | |
| | | June 30, 2015 | | | June 30, 2014 | |
| NET ASSET VALUE, BEGINNING OF PERIOD | | $ | 18.67 | | | $ | 18.15 | |
| INCOME/(LOSS) FROM INVESTMENT OPERATIONS: | | | | | | | | |
Net investment loss(a) | | | (0.06 | ) | | | (0.01 | ) |
| Net realized and unrealized gain on investments | | | 0.23 | | | | 0.53 | |
| Total from Investment Operations | | | 0.17 | | | | 0.52 | |
| | | | | | | | | |
| DIVIDENDS AND DISTRIBUTIONS TO SHAREHOLDERS: | | | | | | | | |
| From net realized gains on investments | | | (0.37 | ) | | | – | |
| Total Dividends and Distributions to Shareholders | | | (0.37 | ) | | | – | |
| | | | | | | | | |
| Paid‐in Capital from Redemption Fees | | | – | | | | – | |
| | | | | | | | | |
| NET INCREASE/(DECREASE) IN NET ASSET VALUE | | | (0.20 | ) | | | 0.52 | |
| | | | | | | | | |
| NET ASSET VALUE, END OF PERIOD | | $ | 18.47 | | | $ | 18.67 | |
| | | | | | | | | |
| TOTAL RETURN | | | 0.94 | % | | | 2.87 | %(b) |
| | | | | | | | | |
| RATIOS AND SUPPLEMENTAL DATA: | | | | | | | | |
| Net assets, end of period (in 000s) | | $ | 360 | | | $ | 103 | |
| | | | | | | | | |
| RATIOS TO AVERAGE NET ASSETS: | | | | | | | | |
| Operating expenses excluding waiver/reimbursement | | | 1.86 | % | | | 2.14 | %(c) |
| Operating expenses including waiver/reimbursement | | | 1.35 | % | | | 1.35 | %(c) |
| Net investment loss including waiver/reimbursement | | | (0.35 | )% | | | (0.20 | )%(c) |
| | | | | | | | | |
| PORTFOLIO TURNOVER RATE | | | 102 | % | | | 78 | %(d) |
(a) | Calculated using average shares throughout the period. |
(b) | Not Annualized. |
(c) | Annualized. |
(d) | Portfolio turnover is calculated at the Fund level and represents the year ended June 30, 2014. |
| See Notes to Financial Statements. | |
| Annual Report | June 30, 2015 | 17 |
| Notes to Financial Statements |
| June 30, 2015 |
1. ORGANIZATION
Cortina Funds, Inc. (the “Corporation”) is an open-end management investment company registered under the Investment Company Act of 1940, as amended (the “1940 Act”). The Corporation was organized on April 27, 2004 as a Wisconsin corporation. The Corporation currently offers shares of common stock (“shares”) of the Cortina Small Cap Growth Fund and the Cortina Small Cap Value Fund (each a “Fund” and collectively, the “Funds”).
The Cortina Small Cap Growth Fund, which commenced operations with the sale of Institutional Class Shares on September 30, 2011, is a diversified portfolio with an investment objective to seek growth of capital. The Cortina Small Cap Value Fund, which commenced operations with the sale of Institutional Class Shares on September 30, 2011 and the sale of Investor Class Shares on April 30, 2014, is a diversified portfolio with an investment objective to seek long-term capital appreciation.
Shares of each Fund are designated as Institutional Shares or Investor Shares with an indefinite number of shares authorized at $0.01 par value. The Articles of Incorporation, as amended and restated, permit the Corporation’s Board of Directors (the “Board”) to create additional funds and share classes.
2. SIGNIFICANT ACCOUNTING POLICIES
The following is a summary of significant accounting policies followed by the Funds. These policies are in conformity with U.S. generally accepted accounting principles (“GAAP”). The Funds are considered investment companies for financial reporting purposes under GAAP.
Use of Estimates — The accompanying financial statements were prepared in accordance with GAAP, which require the use of estimates and assumptions made by management. These may affect the reported amounts of assets and liabilities and disclosure of contingent assets and liabilities at the date of the financial statements and the reported amounts of increases and decreases in net assets from operations during the reporting period. Actual results could differ from those estimates.
Investment Valuation — Investment securities are valued at the last sale price at the close of the principal exchange on which they trade, except for securities listed on the NASDAQ Stock Market, Inc. (“NASDAQ”) exchange, which are valued at the NASDAQ official closing price. Unlisted securities or listed securities for which there were no sales during the day are valued at the closing bid price on such exchanges or over-the-counter markets. Investments for which market quotations are not readily available are valued at fair value as determined in good faith under consistently applied procedures approved by and under the general supervision of the Funds’ Board. Securities with maturities of sixty (60) days or less are valued at amortized cost as Level 1 or 2 within the hierarchy. Money market funds, representing short-term investments, are valued at their daily net asset value.
Investment Transactions — Investment security transactions are accounted for on trade date. Gains and losses on securities sold are determined on a specific identification basis.
Investment Income — Interest income is accrued and recorded on a daily basis including amortization of premiums, accretions of discounts and income earned from money market funds. Interest is not accrued on securities that are in default. Dividend income is recorded on the ex-dividend date. Withholding taxes on foreign dividends have been provided for in accordance with the Funds’ understanding of the applicable country’s tax rules and rates.
Fair Value Measurements — A three-tier hierarchy has been established to classify fair value measurements for disclosure purposes. Inputs refer broadly to the assumptions that market participants would use in pricing the asset or liability, including assumptions about risk. Inputs may be observable or unobservable. Observable inputs are inputs that reflect the assumptions market participants would use in pricing the asset or liability that are developed based on market data obtained from sources independent of the reporting entity. Unobservable inputs are inputs that reflect the reporting entity’s own assumptions about the assumptions market participants would use in pricing the asset or liability that are developed based on the best information available. In accordance with the authoritative guidance on fair value measurements and disclosure under GAAP, the Funds disclose fair value of their investments in a hierarchy that prioritizes the inputs to valuation techniques used to measure the fair value.
Various inputs are used in determining the value of each Fund’s investments as of the reporting period end. The designated input levels are not necessarily an indication of the risk or liquidity associated with these investments. These inputs are categorized in the following hierarchy under applicable financial accounting standards:
| | | |
| Level 1 | – | Unadjusted quoted prices in active markets for identical, unrestricted assets or liabilities that the Funds have the ability to access at the measurement date; |
| | | |
| Level 2 | – | Quoted prices which are not active, quoted prices for similar assets or liabilities in active markets or inputs other than quoted prices that are observable (either directly or indirectly) for substantially the full term of the asset or liability; and |
| | |
| 18 | 1-855-612-3936 | www.cortinafunds.com |
| Notes to Financial Statements |
| June 30, 2015 |
| Level 3 | – | Significant unobservable prices or inputs (including a Fund’s own assumptions in determining the fair value of investments) where there is little or no market activity for the asset or liability at the measurement date. |
The availability of observable inputs can vary from security to security and is affected by a wide variety of factors, including, for example, the type of security, whether the security is new and not yet established in the marketplace, the liquidity of markets, and other characteristics particular to the security. To the extent that valuation is based on models or inputs that are less observable or unobservable in the market, the determination of fair value requires more judgment. Accordingly, the degree of judgment exercised in determining fair value is greatest for instruments categorized in Level 3.
An investment level within the fair value hierarchy is based on the lowest level input, individually or in the aggregate, that is significant to fair value measurement. The valuation techniques used by the Funds to measure fair value during the year ended June 30, 2015 maximized the use of observable inputs and minimized the use of unobservable inputs.
The inputs or methodology used for valuing securities are not necessarily an indication of the risk or liquidity associated with investing in those securities. The following is a summary of the inputs used in valuing the Funds’ investments as of June 30, 2015:
| Cortina Small Cap Growth Fund | | | | | |
| | | Valuation Inputs | | | | |
| Investments in Securities at Value | | Level 1 | | | Level 2 | | | Level 3 | | | Total | |
| Common Stocks | | | | | | | | | | | | |
| Health Care | | $ | 14,018,774 | | | $ | 4,883 | | | $ | – | | | $ | 14,023,657 | |
| Other* | | | 31,333,620 | | | | – | | | | – | | | | 31,333,620 | |
| Short Term Investment | | | 753,383 | | | | – | | | | – | | | | 753,383 | |
| Total | | $ | 46,105,777 | | | $ | 4,883 | | | $ | – | | | $ | 46,110,660 | |
| Cortina Small Cap Value Fund | | | | | | | | | | | | | | | | |
| | | Valuation Inputs | | | | | |
| Investments in Securities at Value | | Level 1 | | | Level 2 | | | Level 3 | | | Total | |
| Common Stocks* | | $ | 49,179,867 | | | $ | – | | | $ | – | | | $ | 49,179,867 | |
| Short Term Investment | | | 2,994,714 | | | | – | | | | – | | | | 2,994,714 | |
| Total | | $ | 52,174,581 | | | $ | – | | | $ | – | | | $ | 52,174,581 | |
| * | See Schedule of Investments for sector classification. |
For the year ended June 30, 2015, there have been no significant changes to the Funds’ fair value methodologies. Additionally, there were no transfers into or out of Levels 1 and 2 during the year ended June 30, 2015. It is the Funds’ policy to recognize transfers at the end of the reporting period.
For the year ended June 30, 2015, the Funds did not have investments with significant unobservable inputs (Level 3) used in determining fair value.
Affiliated Companies — An affiliated company is a company that can have direct or indirect common ownership. The Funds did not hold any investments in affiliated companies as of and during the year ended June 30, 2015.
Expenses — The Funds bear expenses incurred specifically on each Fund’s respective behalf as well as a portion of general Corporation expenses, which may be allocated on the basis of relative net assets or the nature of the services performed relative to applicability to each Fund.
Expenses that are specific to a class of shares of the Funds are charged directly to the share class. The Funds’ realized and unrealized gains and losses, net investment income, and expenses other than class specific expenses, are allocated daily to each class in proportion to its average daily net assets.
Distributions to Shareholders — Dividends from net investment income and distributions of net realized capital gains, if any, will be declared and paid at least annually. Income and capital gains distributions are determined in accordance with income tax regulations, which may differ from GAAP. Distributions to shareholders are recorded on the ex-dividend date.
| | |
| Annual Report | June 30, 2015 | 19 |
| Notes to Financial Statements |
| June 30, 2015 |
Fees on Redemptions — The Funds will deduct a 2.00% redemption proceeds fee on Fund shares held 60 days or less. The redemption fee is not a fee to finance sales or sales promotion expenses, but is paid to the Funds to defray the costs of liquidating an investor and discouraging short-term trading of the Funds’ shares. No redemption fee will be imposed on redemptions initiated by the Funds.
Federal Income Taxes — As of and during the year ended June 30, 2015, the Funds did not have a liability for any unrecognized tax benefits. The Funds file U.S. federal, state, and local tax returns as required. The Funds’ tax returns are subject to examination by the relevant tax authorities until expiration of the applicable statute of limitations which is generally three years after the filing of the tax return for federal purposes and four years for most state returns. Tax returns for open years have incorporated no uncertain tax positions that require a provision for income taxes. The Funds intend to distribute to shareholders all taxable investment income and realized gains, and otherwise comply with Subchapter M of the Internal Revenue Code of 1986, as amended, applicable to regulated investment companies.
| 3. | ADVISORY FEES, FUND ACCOUNTING, ADMINISTRATION FEES, AND OTHER AGREEMENTS |
Investment Advisor
Cortina Asset Management, LLC, is the Funds’ investment adviser (the “Adviser”). The Adviser is subject to the general supervision of the Board and is responsible for the overall management of the Funds’ business affairs. The Adviser invests the assets of the Funds based on the Funds’ investment objectives and policies. The Adviser is entitled to an investment advisory fee, computed daily and payable monthly, of 1.00% of the average daily net assets for each Fund.
The Adviser has contractually agreed to waive fees with respect to each of the Funds so that the net annual operating expenses (excluding 12b-1 fee, taxes, leverage, interest, brokerage commissions, dividends or interest expenses on short positions, acquired fund fees and expenses, and extraordinary expenses) of the Funds’ shares will not exceed 1.10% of average daily net assets of each Fund. The Adviser may request a reimbursement from the Funds to recapture any reduced management fees or reimbursed Fund expenses within three years following the fee reduction or expense reimbursement, but only to the extent the Funds’ total annual fund operating expenses including offering costs, plus any requested reimbursement amount, are less than the above limit at the time of the request. Any such reimbursement is subject to review by the Board.
As of June 30, 2015, reimbursements (including offering costs) that may potentially be made by the Fund to the Adviser total $684,091 for the Cortina Small Cap Growth Fund and $556,820 for the Cortina Small Cap Value Fund and expire as follows:
| Cortina Small Cap Growth Fund | | |
| June 30, 2016 | | | 268,118 |
| June 30, 2017 | | | 217,565 |
| June 30, 2018 | | $ | 198,408 |
| | | | 684,091 |
| Cortina Small Cap Value Fund | | | |
| June 30, 2016 | | | 140,394 |
| June 30, 2017 | | | 194,315 |
| June 30, 2018 | | $ | 222,111 |
| | | | 556,820 |
Fund Accounting Fees and Expenses
ALPS Fund Services, Inc. (“ALPS” or the “Administrator”) provides administrative, fund accounting and other services to the Funds for a monthly administration fee based on the Funds’ average daily net assets.
The Administrator is also reimbursed by the Funds for certain out-of-pocket expenses.
Transfer Agent
ALPS serves as transfer, dividend paying and shareholder servicing agent for the Funds (the “Transfer Agent”).
Compliance Services
ALPS provides services that assist the Corporation’s Chief Compliance Officer in monitoring and testing the policies and procedures of the Corporation in conjunction with requirements under Rule 38a-1 under the 1940 Act. ALPS is compensated under the Administration Agreement.
Distributor
The Funds have entered into a Distribution Agreement with ALPS Distributors, Inc (“the Distributor”) to provide distribution services to the Funds. The Distributor serves as underwriter/distributor of shares of the Funds.
| | |
| 20 | 1-855-612-3936 | www.cortinafunds.com |
| Notes to Financial Statements |
| June 30, 2015 |
Distribution Plan
The Small Cap Value Fund has adopted a Distribution Plan in accordance with Rule 12b-1 (“Distribution Plan”) under the 1940 Act. The Distribution Plan provides that the Small Cap Value Fund may compensate or reimburse the Distributor for services rendered and expenses borne in connection with activities primarily intended to result in the sale of the Small Cap Value Fund’s shares. Sales charges may be paid to broker-dealers, banks and any other financial intermediary eligible to receive such fees for sales of Investor Shares of the Small Cap Value Fund and for services provided to shareholders.
The Small Cap Value Fund charges 12b-1 fees for Investor Shares. Pursuant to the Distribution Plan, the Small Cap Value Fund may annually pay the Distributor up to 0.25% of the average daily net assets of the Small Cap Value Fund’s Investor Shares. The expenses of the Distribution Plan are reflected in the Statements of Operations.
Certain Directors and Officers of the Funds are also officers of the Adviser.
| 4. | PURCHASES AND SALES OF INVESTMENT SECURITIES |
The aggregate cost of purchases and proceeds from sales of investment securities, excluding short-term securities, are shown below for the year ended June 30, 2015. Purchases and proceeds from sales of U.S. Government obligations are included in the totals of Purchases of Securities and Proceeds from Sales of Securities below and also broken out separately for your convenience:
| Fund Name | | Purchases | | | Sales | |
| Cortina Small Cap Growth Fund | | $ | 49,411,511 | | | $ | 38,562,152 | |
| Cortina Small Cap Value Fund | | | 55,701,039 | | | | 41,228,332 | |
There were no purchases of long-term U.S. Government Obligations for either Fund during the year ended June 30, 2015.
For the year ended June 30, 2015 the following reclassifications, which had no impact on results of operations or net assets, were primarily attributed to differences in the treatment of passive foreign investment companies and the treatment of net investment loss. These were recorded to reflect tax character as follows:
| | | | | | Accumulated Net | | | Accumulated Net Realized | |
| Fund | | Paid-in Capital | | | Investment Income | | | Gain/(Loss) on Investments | |
| Cortina Small Cap Growth Fund* | | $ | (179,953 | ) | | $ | 179,938 | | | $ | 15 | |
| Cortina Small Cap Value Fund* | | | (37,750 | ) | | | 108,613 | | | | (70,863 | ) |
| * | Includes Net Operating Loss (NOL) offset to Paid In Capital (PIC) for Cortina Small Cap Growth Fund and Cortina Small Cap Value Fund in the amount of $179,938 and $37,749. |
Income and long-term capital gain distributions are determined in accordance with Federal income tax regulations, which differ from GAAP, and, therefore, may differ significantly in amount or character from net investment income and realized gains for financial reporting purposes.
The tax character of distributions paid during the year ended June 30, 2015, were as follows:
| Fund | | Ordinary Income | | | Long-Term
Capital Gain | |
| Cortina Small Cap Growth Fund | | $ | 218,066 | | | $ | 1,615,118 | |
| Cortina Small Cap Value Fund | | | – | | | | 822,071 | |
The tax character of distributions paid during the period ended June 30, 2014, were as follows:
| Fund | | Ordinary Income | | | Long-Term
Capital Gain | |
| Cortina Small Cap Growth Fund | | $ | 115,436 | | | $ | 128,107 | |
| Cortina Small Cap Value Fund | | | 159,525 | | | | 171,140 | |
| | |
| Annual Report | June 30, 2015 | 21 |
| Notes to Financial Statements |
| | June 30, 2015 |
As of June 30, 2015, the aggregate cost of investments, gross unrealized appreciation/(depreciation) and net unrealized appreciation/(depreciation) for Federal tax purposes was as follows:
| | | | | | | | | | | | | |
| Fund | | Cost of Investments
for Income Tax
Purposes | | Gross Appreciation
(excess of value
over tax cost) | | Gross Depreciation
(excess of tax cost
over value) | | Net Unrealized
Appreciation | |
| Cortina Small Cap Growth Fund | | $ | 39,335,271 | | | $ | 9,180,669 | | | $ | (2,405,280 | ) | | $ | 6,775,389 | |
| Cortina Small Cap Value Fund | | | 47,577,150 | | | | 6,177,433 | | | | (1,580,002 | ) | | | 4,597,431 | |
The difference between book basis and tax basis net unrealized appreciation is attributable to the deferral of losses from wash sales and passive foreign investment companies.
At June 30, 2015, components of distributable earnings were as follows:
| | | | | | | | | | | | | |
| Fund | | Accumulated Capital
Losses | | Unrealized Appreciation | | Other Cumulative Effect
of Timing Differences | | Total Distributable
Earnings | |
| Cortina Small Cap Growth Fund | | $ | (2,344,768 | ) | | $ | 6,775,389 | | | $ | (213,193 | ) | | $ | 4,217,428 | |
| Cortina Small Cap Value Fund | | | (497,202 | ) | | | 4,597,431 | | | | (17,433 | ) | | | 4,082,796 | |
The Cortina Small Cap Growth Fund and the Cortina Small Cap Value Fund elected to defer to the year ending June 30, 2016, capital losses recognized during the period November 1, 2014 through June 30, 2015 in the amount of $2,024,567 and $497,202, respectively. The Cortina Small Cap Growth Fund and the Cortina Small Cap Value Fund elected to treat late year ordinary losses of $213,193 and $17,433, respectively, as having been incurred in the following fiscal year June 30, 2016.
At June 30, 2015, the following Funds had capital loss carryforwards which will reduce each Fund’s taxable income arising from future net realized gain on investments, if any, to the extent permitted by the Internal Revenue Code (the “Code” and thus will reduce the amount of distributions to shareholders which would otherwise be necessary to relieve the Funds of any liability for federal income tax. Pursuant to the Code, such capital loss carry-forwards will accumulate as follows:
| | | | | | | | |
| Fund | | | | Total | |
| Cortina Small Cap Growth Fund | | $ | 320,201 | | $ | 320,201 | |
| Cortina Small Cap Value Fund | | | – | | | – | |
6. COMMITMENTS AND CONTINGENCIES |
Under the Corporation’s organizational documents, its Officers and Directors are indemnified against certain liabilities arising out of the performance of their duties to the Funds. In addition, in the normal course of business, the Corporation entered into contracts with its service providers, on behalf of the Funds, and others that provide for general indemnifications. The Funds’ maximum exposure under these arrangements is unknown, as this would involve future claims that may be made against the Funds. The Funds expect risk of loss to be remote.
| | |
| 22 | 1-855-612-3936 | www.cortinafunds.com |
| Report of Independent Registered
Public Accounting Firm |
| |
To the Shareholders and Board of Directors of
Cortina Funds, Inc.
We have audited the accompanying statements of assets and liabilities, including the schedules of investments, of Cortina Funds, Inc., comprising Cortina Small Cap Growth Fund and Cortina Small Cap Value Fund (the “Funds”), as of June 30, 2015, and the related statements of operations for the year then ended, the statements of changes in net assets for each of the two years in the period then ended, and the financial highlights for each of the four periods in the period then ended. These financial statements and financial highlights are the responsibility of the Funds’ management. Our responsibility is to express an opinion on these financial statements and financial highlights based on our audits.
We conducted our audits in accordance with the standards of the Public Company Accounting Oversight Board (United States). Those standards require that we plan and perform the audit to obtain reasonable assurance about whether the financial statements and financial highlights are free of material misstatement. An audit includes examining, on a test basis, evidence supporting the amounts and disclosures in the financial statements. Our procedures included confirmation of securities owned as of June 30, 2015, by correspondence with the custodian and brokers, or by other appropriate auditing procedures where replies from brokers were not received. An audit also includes assessing the accounting principles used and significant estimates made by management, as well as evaluating the overall financial statement presentation. We believe that our audits provide a reasonable basis for our opinion.
In our opinion, the financial statements and financial highlights referred to above present fairly, in all material respects, the financial position of each of the Funds constituting Cortina Funds, Inc. as of June 30, 2015, the results of their operations for the year then ended, the changes in their net assets for the two years in the period then ended, and the financial highlights for each of the four periods in the period then ended, in conformity with accounting principles generally accepted in the United States of America.
COHEN FUND AUDIT SERVICES, LTD.
Cleveland, Ohio
August 26, 2015
| | |
| Annual Report | June 30, 2015 | 23 |
| Additional Information |
| | June 30, 2015 (Unaudited) |
1. PROXY VOTING POLICIES AND VOTING RECORD |
A description of the policies and procedures that the Funds use to vote proxies relating to portfolio securities is available without charge upon request by calling toll-free 1-855-612-3936, or on the Securities and Exchange Commission’s (“SEC”) website at http://www.sec.gov. Information regarding how the Funds voted proxies relating to portfolio securities during the most recent fiscal year end June 30, 2015 is available without charge upon request by calling toll-free 1-855-612-3936, or on the SEC’s website at http://www.sec.gov.
2. QUARTERLY PORTFOLIO HOLDINGS |
The Corporation files a complete listing of portfolio holdings for the Funds with the SEC as of the first and third quarters of each fiscal year on Form N-Q. The filings are available upon request by calling 1-855-612-3936. Furthermore, you may obtain a copy of the filing on the SEC’s website at http://www.sec.gov. The Funds’ Forms N-Q may also be reviewed and copied at the SEC’s Public Reference Room in Washington, D.C., and information on the operation of the Public Reference Room may be obtained by calling 1-800-SEC-0330.
Pursuant to Section 852(b)(3) of the Internal Revenue Code, Cortina Small Cap Growth Fund and Cortina Small Cap Value Fund designate $1,615,118 and $822,071 respectively as a long-term capital gain distribution.
Certain tax information is required to be provided to shareholders based upon each Fund’s income and distributions for the year ended June 30, 2015. The Funds designate the following as percentages of taxable ordinary income distributions, up to maximum amount allowable, for the calendar year ended December 31, 2014:
| | | | | | | | |
| Fund | | Dividends Received
Deduction Percentage | | Qualified Dividend
Income Percentage | |
| Cortina Small Cap Growth Fund | | | 0.00 | % | | | 0.00 | % | |
| Cortina Small Cap Value Fund | | | 88.98 | % | | | 92.93 | % | |
In early 2015, if applicable, shareholders of record received this information for the distributions paid to them by the Funds during the calendar year 2014 via Form 1099. The Funds will notify shareholders in early 2016 of amounts paid to them by the Funds, if any, during the calendar year 2015.
| 4. DIRECTORS’ CONSIDERATION AND APPROVAL OF ADVISORY AGREEMENT |
On May 11, 2015 (the “Meeting”), the Board of Directors (the “Board”) met in person to consider, among other things, the annual renewal of the Investment Advisory Agreement (the “Advisory Agreement”) between the Corporation and the Adviser with respect to the Cortina Small Cap Growth Fund and Cortina Small Cap Value Fund (the “Funds”) in accordance with Section 15(c) of the Investment Company Act of 1940, as amended (the “1940 Act”). The Board reviewed and discussed various information that had been provided prior to the Meeting and at the Meeting, including the Advisory Agreement, memoranda prepared by Trust counsel discussing the Board’s fiduciary obligations and the factors the Board should assess in considering the renewal of the Advisory Agreement, information in response to the request from the Board, including the Independent Directors, from the Adviser (including the Adviser’s Form ADV and balance sheet), a profitability analysis with respect to the Funds, comparative information about the Funds’ performance for periods ended March 31, 2015, management fees and expense ratios, and other pertinent information. The Board also discussed relevant case law.
The Board also took into account information reviewed periodically throughout the year that was relevant to its consideration of the Advisory Agreement, including performance, management fee and other expense information and discussions with the Funds’ portfolio managers. Based on its evaluation of this information, the Board, including a majority of the Independent Directors, approved the continuation of the Investment Advisory Agreement for an additional one-year period.
In considering the Advisory Agreement and reaching its conclusions, the Board reviewed and analyzed various factors that it determined were relevant, including the factors below. In deciding to approve the Advisory Agreement for each Fund, the Board did not identify any single factor as determinative but considered all factors together.
Nature, Extent and Quality of the Services Provided to the Funds: The Board analyzed the nature, extent and quality of the services provided by the Adviser to the Funds. The Board reviewed and considered the Adviser’s significant role in establishing the Funds and the construction of their investment objectives, principal strategies, investment limitations and fee structures. The Board noted the Adviser’s commitment to the Funds, and the experience, credentials and continuity of the portfolio management teams employed to manage the Funds’ investments. The Board further noted that the Adviser has over $2 billion of assets under discretionary management and that the Funds provide an opportunity for smaller institutional and retail accounts to receive the same professional advice from the Adviser that it offers to its larger institutional clients. The Board also noted that the provision of investment advisory services to the Funds requires more effort than it does for separately managed accounts due to daily sales and redemption activity and additional regulatory and compliance requirements.
| | |
| 24 | 1-855-612-3936 | www.cortinafunds.com |
| Additional Information |
| | June 30, 2015 (Unaudited) |
The Board considered other services that the Adviser provided for the Funds in its capacity as their investment advisor, such as making some of its key personnel available to serve as officers of the Funds, selecting broker-dealers for execution of portfolio transactions, ensuring adherence to the Funds’ investment policies and restrictions, compliance, risk management services, valuation and overseeing the Funds’ other service providers. The Board also considered that the Adviser has not experienced any significant legal, compliance or regulatory difficulties since the Funds were launched. The Board concluded that the nature, extent and quality of the services provided by the Adviser to the Funds were appropriate and that each Fund was likely to continue to benefit from services provided under the Advisory Agreement.
Investment Performance of the Adviser and the Funds: In considering the investment performance of each of the Funds, the Board reviewed the Funds’ performance information as of March 31, 2015 in comparison to various benchmark indices and certain peer funds selected by the Adviser.
The Board noted that for the period ended March 31, 2015, the performance of the Cortina Small Cap Value Fund for the two-year, three-year and since inception periods ended March 31, 2015, the Institutional and Investor classes had outperformed the Russell 2000 Value Index, but had underperformed for the one-year period. The Board noted that the Adviser’s Small Cap Value composite had also outperformed the Russell 2000 Value Index over the same time periods as the Fund and underperformed the Index over the one-year time period.
The Board noted that for the period ended March 31, 2015, the Small Cap Growth Fund had lagged the Russell 2000 Growth Index. The Board noted that the Adviser’s Small Cap Growth composite had also underperformed the Russell 2000 Growth Index over the same time periods. The Board considered the effect of the market environment and the Adviser’s quarterly commentary and discussions of the reasons for the Fund’s underperformance.
The Board also considered the Adviser’s quarterly portfolio reviews explaining the Funds’ performance, the Adviser’s consistent and disciplined investment decision process and the investment strategies it employs for the Funds. After considering all of the information, the Board concluded that, although past performance is not a guarantee of future results, each Fund and its shareholders were likely to benefit from the continued management by the Adviser.
Costs of Services Provided and Profits Realized by the Adviser: The Board examined the fee and expense information for the Funds, including a comparison of such information to other similarly situated mutual funds as provided by the Adviser from the Morningstar database. The Board noted that each Fund’s advisory fee was comparable to the average and median for all mutual funds in its peer group. The Board also reviewed and considered management fees charged by the Adviser to other investment advisory clients and found that the investment management fee paid by the Funds was identical to what the Adviser charges on the first $25 million of a separately managed account. The Board recognized the extent of the significant additional services provided to each Fund that the Adviser did not provide to its other clients, such as certain administrative services, oversight of the Fund’s other service providers, regulatory compliance and various other services.
The Board also examined the total expense ratio of each Fund relative to the Peer Funds based on the Morningstar data provided by the Adviser. The Board noted that the Small Cap Value Fund’s Institutional and Investor classes’ total expense ratio after fee waivers and expense reimbursements by the Adviser of 1.10% and 1.35%, respectively, pursuant to the Adviser’s expense cap agreement was less than the median and the average compared to the Peer Funds. The Board noted that the Small Cap Growth Fund’s total expense ratio after fee waivers and expense reimbursements by the Adviser of 1.10% was slightly above the median and the average compared to the Peer Funds. The Board further noted that if the Small Cap Value Fund had included acquired fund fees and expenses in the analysis, the Fund’s total expense ratio was still below both the average and the median for the Peer Funds and the Small Cap Growth Fund was slightly above its Peer Funds.
The Board noted that given the size of the Funds, the Adviser continued to waive all fees and reimburse significant expenses for the Funds. Accordingly, the Funds were not currently profitable to the Adviser. The Board reviewed and considered the general financial condition of the Adviser and determined it to be sound. The Board also reviewed information regarding revenue sharing payments, noting that any payments by the Adviser to third-party platforms were made from the Adviser’s profits associated with its overall advisory business. In light of all of the information that it received and considered, the Board concluded that the management fee and total expense ratio of each Fund were reasonable.
Economies of Scale and Fee Levels Reflecting Those Economies: The Board noted that the Funds’ advisory fee structure does not contain any breakpoint reductions as the Funds grow in size. However, the Board recognized that the Adviser has been waiving fees and, until October 2013, was also reimbursing expenses for the Funds since their inception. The Board also considered the Adviser’s verbal representation that it would consider evaluating advisory fee breakpoints in the future.
| | |
| Annual Report | June 30, 2015 | 25 |
| | Additional Information |
| | June 30, 2015 (Unaudited) |
The Directors concluded that the current fee structure of each Fund was reasonable and that breakpoint reductions may be considered in the future depending on Fund asset levels.
Benefits Derived From the Relationship with the Funds: The Board noted that the Adviser derives ancillary benefits from its association with the Funds, in the form of research products and services received from unaffiliated broker dealers who execute portfolio trades for the Funds. However, the Board determined such products and services have been used for legitimate purposes relating to the Funds by providing assistance in the investment decision‐making process. The Board concluded that the other benefits realized by the Adviser from its relationship with the Funds were appropriate. Based on its evaluation of the above factors, as well as other factors relevant to their consideration of the Advisory Agreement, the Directors, including all of the Independent Directors, concluded that the continuation of the Advisory Agreement was in the best interest of each Fund and its shareholders.
| 26 | 1-855-612-3936 | www.cortinafunds.com |
| | Board of Directors and Officers |
| | June 30, 2015 (Unaudited) |
Overall responsibility for management of the Funds rests with the Board of Directors (the “Directors”). The Directors serve during the lifetime of the Corporation and until its termination, or until death, resignation, retirement or removal. The Directors, in turn, elect the officers of the Funds to actively supervise the day‐to‐day operations. The officers have been elected for an annual term. The following are the Directors and executive officers of the Funds:
| Independent Directors |
| Name and Age | Position(s)
Held with
the Funds | Length of Time
Served | Principal Occupation(s)
During Past 5 Years | Number of Funds
in Fund Complex
Overseen by
Director | Other Directorships
Held by Director |
Mark J.
Giese, 44 | Independent
Director | Since
Inception | President, Riverwood Business Consulting, LLC, a business and management firm (December 2009‐present); Chief Financial Officer, Datatrac Corporation, a financial research firm (January 2009‐December 2009); Vice President, Nicholas Company, Inc., an investment management firm (June 1994‐January 2009); Vice President, Nicholas Fund, Inc., Nicholas II, Inc., Nicholas Limited Edition, Inc. and Nicholas Equity Income Fund, Inc., each a registered investment company (June 1994‐ January 2009); Senior Vice President, Nicholas Family of Funds, Inc., a registered investment company (June 1994‐ January 2009) | 2 | None |
John T.
Murphy, 51 | Independent
Director | Since
Inception | President and Founding Partner, Morris Midwest, LLC, a machine tool distributor (2006‐present); President and Partner, Technical Equipment Sales Co., a machine tool distributor (2003‐2006) | 2 | None |
| Interested Director |
Ryan T.
Davies, 41* | Chairman, President and Interested Director | Since
Inception | Senior Equity Analyst, Cortina Asset Management, LLC (2004‐present) | 3 | None |
| Officers |
Eric
Conner, 30 | Treasurer and Principal Accounting Officer | Since
November
2013 | Business and Operations Analyst, Cortina Asset Management, LLC (2012‐present); Portfolio Finance Analyst, Stark Investments (2011‐2012); Senior Corporate Accountant, Stark Investments (2008‐2011) |
Lori K.
Hoch, 44 | Secretary, Anti‐Money Laundering Officer and Chief Compliance Officer | Since
Inception | Principal and Chief Operating Officer and Chief Compliance Officer, Cortina Asset Management, LLC (2004‐present) |
| * | Mr. Davies is considered an “interested director” of Cortina as defined under the 1940 Act by virtue of his position with the Adviser. The business address of the officers and directors affiliated with the Adviser is 825 North Jefferson Street, Suite 400, Milwaukee, Wisconsin 53202. The address for each Independent Director is c/o Cortina Funds, 825 North Jefferson Street, Suite 400, Milwaukee, Wisconsin 53202. |
Additional information about members of the Board of Directors and Officers is available in the Statement of Additional Information (SAI). To obtain a free copy of the SAI, please call 1‐855‐612‐3936.
| | |
| Annual Report | June 30, 2015 | 27 |
Material must be accompanied or preceded by the prospectus.
The Cortina Funds are distributed by ALPS Distributors, Inc.
Item 2. Code of Ethics.
| (a) | The Registrant, as of the end of the period covered by this report, has adopted a code of ethics that applies to the Registrant’s principal executive officer, principal financial officer, principal accounting officer or controller or any persons performing similar functions on behalf of the Registrant. |
| (c) | During the period covered by this report, no amendments to the provisions of the code of ethics adopted in paragraph (a) of this Item were made. |
| (d) | During the period covered by this report, no implicit or explicit waivers to the provisions of the code of ethics adopted in paragraph (a) of this Item were granted. |
| (f) | A copy of the Registrant’s Code of Ethics is filed as an exhibit hereto. The Registrant undertakes to provide a copy of the Code of Ethics to any person, without charge, upon written request to the Registrant at its address at 825 N. Jefferson St., Suite 400, Milwaukee, WI 53202. |
Item 3. Audit Committee Financial Expert.
The Board of Directors of the Registrant has determined that the Registrant has at least one Audit Committee Financial Expert serving on its audit committee. The Registrant’s Audit Committee Financial Expert is Mr. John F. Murphy, Independent Trustee and Audit Committee Chair.
Item 4. Principal Accountant Fees and Services.
| (a) | Audit Fees: For the Registrant’s fiscal years ended June 30, 2015 and June 30, 2014, the aggregate fees billed for professional services rendered by the principal accountant for the audit of the Registrant’s annual financial statements or services that are normally provided by the accountant in connection with statutory or regulatory filings or engagements were $24,500 and $24,600, respectively. |
| (b) | Audit-Related Fees: For the Registrant’s fiscal years ended June 30, 2015 and June 30, 2014, the aggregate fees billed for assurance and related services by the principal accountant that are reasonably related to the performance of the audit of the Registrant’s financial statements and are not reported under paragraph (a) of this Item were $0 and $0, respectively. |
| (c) | Tax Fees: For the Registrant’s fiscal years ended June 30, 2015 and June 30, 2014, the aggregate fees billed for professional services rendered by the principal accountant for tax compliance, tax advice and tax planning were $5,000 and $5,000, respectively. The fiscal year 2015 and 2014 tax fees were for services for review of the dividend calculation, excise tax preparation and federal tax return preparation. |
| (d) | All Other Fees: For the Registrant’s fiscal years ended June 30, 2015 and June 30, 2014, the aggregate fees billed for products and services provided by the principal accountant, other than the services reported in paragraphs (a) through (c) of this Item, were $0 and $0, respectively. |
| (e)(1) | Audit Committee Pre-Approval Policies and Procedures: All services to be performed by the Registrant’s principal accountant must be pre-approved by the Registrant’s audit committee. |
| (e)(2) | No services described in paragraphs (b) through (d) of this Item were approved by the Registrant’s audit committee pursuant to paragraph (c)(7)(i)(C) of Rule 2-01 of Regulation S-X. |
| (g) | No non-audit fees were billed by the Registrant’s principal accountant for services rendered to the Registrant’s investment adviser. |
Item 5. Audit Committee of Listed Registrants.
Not applicable to Registrant.
Item 6. Investments.
| (a) | Schedule of Investments is included as part of the Reports to Stockholders filed under Item 1 of this Form N-CSR. |
Item 7. Disclosure of Proxy Voting Policies and Procedures for Closed-End Management Investment Companies.
Not applicable to the Registrant.
Item 8. Portfolio Managers of Closed-End Management Investment Companies.
Not applicable to the Registrant.
Item 9. Purchases of Equity Securities by Closed-End Management Investment Company and Affiliated Purchasers.
Not applicable to the Registrant.
Item 10. Submission of Matters to a Vote of Security Holders.
The Registrant has not adopted procedures by which shareholders may recommend nominees to the Registrant’s Board of Directors.
Item 11. Controls and Procedures.
| (a) | The Registrant’s principal executive officer and principal financial officer have concluded that the Registrant’s disclosure controls and procedures (as defined in Rule 30a-3(c) under the Investment Company Act of 1940, as amended) are effective based on their evaluation of these controls and procedures as of a date within 90 days of the filing date of this report. |
| (b) | There was no change in the Registrant’s internal control over financial reporting (as defined in Rule 30a-3(d) under the Investment Company Act of 1940, as amended) during the second fiscal quarter covered by this report that has materially affected, or is reasonably likely to materially affect, the Registrant’s internal control over financial reporting. |
Item 12. Exhibits.
| (a)(1) | The Registrant’s Code of Ethics for Principal Executive Officer, Principal Financial Officer and Principal Accounting Officer, which is the subject of the disclosure required by Item 2 of Form N-CSR, was filed as Exhibit 12.a.1 to the Registrant’s Certified Shareholder Report of Registered Management Investment Companies on Form N-CSR, File No. 811-21580, on September 6, 2012. |
| (a)(2) | The certifications required by Rule 30a-2(a) of the Investment Company Act of 1940, as amended, and Section 302 of the Sarbanes-Oxley Act of 2002 are attached hereto as Exhibit 99.Cert. |
| (b) | The certifications by the Registrant’s principal executive officer and principal financial officer, as required by Rule 30a-2(b) of the Investment Company Act of 1940, as amended, and Section 906 of the Sarbanes-Oxley Act of 2002 are attached hereto as Exhibit 99.906Cert. |
SIGNATURES
Pursuant to the requirements of the Securities Exchange Act of 1934 and the Investment Company Act of 1940, the registrant has duly caused this report to be signed on its behalf by the undersigned, thereunto duly authorized.
| | Cortina Funds, Inc. | |
| | | | |
| | By: | /s/ Ryan T. Davies | |
| | | Ryan T. Davies, President |
| | | (Principal Executive Officer) | |
| | | | |
| | Date: | September 4, 2015 | |
Pursuant to the requirements of the Securities Exchange Act of 1934 and the Investment Company Act of 1940, this report has been signed below by the following persons on behalf of the registrant and in the capacities and on the dates indicated.
| | | | |
| | By: | /s/ Eric Conner | |
| | | Eric Conner, Treasurer and Principal Accounting Officer |
| | | (Principal Financial Officer) | |
| | | | |
| | Date: | September 4, 2015 | |
5