UNITED STATES
SECURITIES AND EXCHANGE COMMISSION
Washington, D.C. 20549
FORM N-CSR
CERTIFIED SHAREHOLDER REPORT OF REGISTERED
MANAGEMENT INVESTMENT COMPANIES
Investment Company Act file number: 811-21580
CORTINA FUNDS, INC.
(Exact name of registrant as specified in charter)
825 N. Jefferson St., Suite 400, Milwaukee, WI 53202
(Address of principal executive offices) (Zip code)
(414) 225-7365
Registrant’s telephone number, including area code
Lori Hoch
825 N. Jefferson St., Suite 400
Milwaukee, WI 53202
(Name and address of agent for service)
Date of fiscal year end: June 30
Date of reporting period: July 1, 2017 - June 30, 2018
Item 1. Reports to Stockholders.

TABLE OF CONTENTS
| Cortina Small Cap Growth Fund | |
| Shareholder Letter | 1 |
| Portfolio Information | 3 |
| Cortina Small Cap Value Fund | |
| Shareholder Letter | 4 |
| Portfolio Information | 6 |
| Disclosure of Fund Expenses | 7 |
| Schedule of Investments | |
| Cortina Small Cap Growth Fund | 8 |
| Cortina Small Cap Value Fund | 11 |
| Statements of Assets and Liabilities | 13 |
| Statements of Operations | 14 |
| Statements of Changes in Net Assets | 15 |
| Financial Highlights | |
| Cortina Small Cap Growth Fund | 16 |
| Cortina Small Cap Value Fund - Institutional | 17 |
| Cortina Small Cap Value Fund - Investor | 18 |
| Notes to Financial Statements | 19 |
| Report of Independent Registered Public Accounting Firm | 24 |
| Additional Information | 25 |
| Board of Directors and Officers | 28 |
 | Shareholder Letter |
| Cortina Small Cap Growth Fund | June 30, 2018 (Unaudited) |
DEAR FELLOW SHAREHOLDERS:
The Cortina Small Cap Growth Fund had a stellar second half of fiscal 2018 leading to our third fiscal year in a row of positive performance versus the Russell 2000 Growth Index. Over the past six months, the Fund returned 22.36% compared to the benchmark return of just 9.70%. Second half performance was strong enough to overcome a lagging first half of the fiscal year (i.e. July through December of 2017). There were many contributors to the Fund’s strong absolute and relative performance including stylistic tailwinds and sector allocation but positive security selection was the biggest factor.
The past six months have been a much different market environment than was experienced in the preceding calendar year. The euphoria of tax cuts and the implications they would have on economic growth and earnings per share drove strong returns to start the year. That was quickly followed by tariff threats which sparked the first 5% pullback in the S&P 500 since 2016. Normalized levels of volatility returning to equity markets was a welcome development for active managers such as ourselves. A healthy amount of volatility provides opportunity to more effectively trade around core positions and add high quality growth names off our watch list as they hit our desired entry points.
Trade war fears also helped spark a market preference for small caps over large caps as small companies are more domestically focused and in theory less exposed to trade wars. Further fueling the preference for small caps over large caps was the belief that smaller companies would disproportionately benefit from domestic tax cuts. This provided the first stylistic tailwind for our Fund, with small caps meaningfully outperforming large caps. In fact, the Russell 2000 Small Cap Index returned 7.66% compared to just a 2.65% return for the S&P 500. Our Fund tends to skew smaller than the benchmark which provided an added benefit for us.
Rising interest rates also contributed to market volatility and we believe provided a second tailwind to our investment style. Following three rate hikes in 2017, the Federal Open Market Committee again raised the Fed Funds Rate in both March and June of this year. Rates, while still historically low, have now reached a point where investors seeking current income can achieve that in bonds with the 2 Year U.S. Treasury Yield exceeding the S&P 500 Dividend Yield for the first time since the Great Recession. Dividends became less important and stocks without dividends significantly outperformed their counterparts. In addition, companies with low debt levels shined as the prospect of refinancing at higher rates pressured more highly leveled companies. Consistent with our mantra of being early investors to innovative growth companies, we shun companies who fund nascent growth with debt and we do not seek mature, dividend-paying companies.
From a sector standpoint, the two best performing sectors within the index were the Technology (up 17.86%) and Health Care (up 17.06%) sectors in the first half of 2018. These two sectors were our two most heavily weighted sectors and averaged a combined 57% of Fund assets on average over the last six months versus 50% of the Russell 2000 Growth Index. Fund returns of 24.04% and 41.18% within the Technology and Health Care sectors respectively, however, were much more impactful than our sector allocations. We also had strong security selection in all but the Materials and Telecom Services sectors which were negligibly negative. We attribute a portion of the strong security selection to the stylistic tailwinds discussed above. We also attribute a large portion to very strong sales and earnings results. Based on our calculations, 82% of our holdings reported better than expected fourth quarter 2017 revenue estimates and 79% exceeded earnings estimates. First quarter 2018 results were nearly as good with 80% and 74% of holdings exceeding sales and earnings estimates respectively.
OUTLOOK AND POSITIONING
For the first time in ten quarters, the Information Technology sector does not start the quarter as the Fund’s largest absolute weight. Technology’s influence on businesses across the economy has been the single greatest driver of innovation and efficiency for some time and our enthusiasm for discovering technology companies has not waned. We have been, however, in the process of methodically reducing our aggregate exposure to emerging risks within the sector. The first is valuations which have reached lofty levels reminiscent of 2013. Along the same lines, the group is reaching extreme popularity with investors as it is difficult to find an institutional investor who is not already overweight the sector. While not the current focus of trade rhetoric and tariffs, technology companies sell to the industries that are at the center of it and are vulnerable to purchase delays stemming from uncertainty. Finally, some tech companies, namely those in the semiconductor and semiconductor food chain, rely heavily on sales to Chinese customers. China consumes roughly 60% of the world’s semiconductors. As China is the sparring partner in the most contentious trade negotiations, hardball between the two nations could cause domestic company sales to get caught in the crossfire.
With the Information Technology sector no longer our largest sector, the Health Care sector has taken the helm. Here too, some valuations are rich following tremendous returns and we have been proactively trimming and eliminating holdings that we feel are vulnerable. To that end, we reduced exposure to or completely eliminated more than a third of our Health Care holdings in the June quarter and initiated six new positions where we felt the risk reward was more attractive. We continue to have a large absolute and relative weight in the sector, however, as sector fundamentals remain strong and innovation abounds.
We expect overall market volatility to persist in the ensuing months. Trade is likely to continue to dominate business headlines and that could continue to benefit small caps. How trade policy ultimately shakes out remains unknowable, but two things are certain: 1) the Trump Administration is looking to make definitive gains in terms with trading partners across the globe; and 2) negotiations with trade partners will occur in the clear eye of the public. Investors will have to numb (if they have not already done so) to the news / Tweet of the day regarding policy proposals, threats and ultimatums and focus on actual policy. This may become even harder to do was we approach the midterm election season. The stakes are always high entering midterms and this year is no different as Republican control of the House is vulnerable and control of the Senate is not guaranteed. Markets often retreat heading into midterms and we would not be entirely surprised to see that happen this year.
| Annual Report | June 30, 2018 | 1 |
| Shareholder Letter |
| Cortina Small Cap Growth Fund | June 30, 2018 (Unaudited) |
Looking beyond the immediate future, our outlook remains bright. U.S. economic growth, small business optimism, consumer confidence and other metrics continue to impress. While valuations are extended in certain pockets of the market, stocks remain attractive versus bonds and overall valuations are far from the bubble levels in March of 2000. Should trade and election uncertainty lead to further volatility, we will eagerly seek to identify and try to take advantage of dislocations in the market.
Dividend yield is a dividend expressed as a percentage of a current share price.
U.S. Treasury yield is the return on investment, expressed as a percentage, on the U.S. government’s debt obligations. These debt obligations can be for varying lengths of time.
Cortina Funds are subject to risks, including loss of principal.
Investing in small or micro cap funds will be more volatile and loss of principal could be greater than investing in large cap or more diversified funds.
S&P 500 – The S&P 500 Index is the Standard & Poor’s composite index of 500 stocks, a widely recognized, unmanaged index of common stock prices.
| 2 | 1-855-612-3936 | www.cortinafunds.com |
| Portfolio Information |
| Cortina Small Cap Growth Fund | June 30, 2018 (Unaudited) |
Growth of $25,000 Investment (Unaudited)
For the period from September 30, 2011 (Inception) to June 30, 2018.
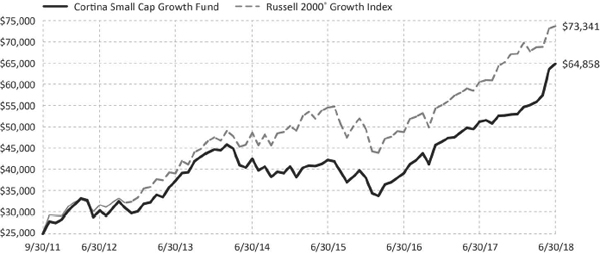
This graph assumes an initial $25,000 investment at September 30, 2011 (Inception Date). The Cortina Small Cap Growth Fund (the “Fund”) will deduct a 2.00% redemption proceeds fee on Fund shares held 60 days or less. This graph depicts the performance of the Fund versus the Russell 2000® Growth Index. It is important to note the Fund is a professionally managed mutual fund while the index is not available for investment and is unmanaged. The comparison is shown for illustrative purposes only.
This chart does not reflect the deduction of taxes that a shareholder would pay on Fund distributions or the redemption of Fund shares.
Performance Returns for the period ended June 30, 2018
| | 6 Months | 1 Year | 3 Years | 5 Years | Since Inception* | Gross
Expense Ratio** |
| Cortina Small Cap Growth Fund | 22.36% | 26.72% | 15.42% | 11.72% | 15.17% | 1.76% |
| Russell 2000® Growth Index | 9.70% | 21.86% | 10.60% | 13.65% | 17.28% | |
| * | The Fund’s inception date is September 30, 2011. |
| ** | Cortina Asset Management, LLC (the “Adviser”) has contractually agreed to waive management fees and/or reimburse the Fund’s operating expenses in order to limit the Fund’s total annual fund operating expenses (excluding taxes, leverage, interest, brokerage commissions, dividends or interest expenses on short positions, acquired fund fees and expenses and extraordinary expenses) to 1.10% of average daily net assets of the Fund. The agreement will continue in effect at least through October 31, 2018, subject thereafter to annual re-approval of the agreement by the Fund’s Board of Directors. The current expense ratio for the Fund can be located in the Financial Highlights contained within this shareholder report. |
Past performance does not guarantee future results. The performance data quoted represents past performance and current returns may be lower or higher. Total return figures include change in share price, reinvestment of dividends and capital gains. The investment return and principal value will fluctuate so that an investor’s shares, when redeemed may be worth more or less than their original cost. To obtain performance information current to the most recent month end, call 1-855-612-3936.
Russell 2000® Growth Index measures the performance of the small-cap growth segment of the U.S. equity universe. It includes those Russell 2000 companies with higher price-to-value ratios and higher forecasted growth values. All indices are unmanaged. It is not possible to invest directly in an index.
Sector Allocations***
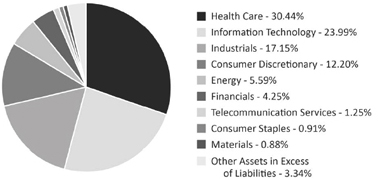
| *** | Percentages are based on Net Assets as of June 30, 2018. Holdings are subject to change. |
| Annual Report | June 30, 2018 | 3 |
| Shareholder Letter |
| Cortina Small Cap Value Fund | June 30, 2018 (Unaudited) |
DEAR FELLOW SHAREHOLDERS:
Over the past twelve months the Cortina Small Cap Value Fund rose nearly 8% versus the Russell 2000 Value’s 13.10% gain. Equity markets have posted solid returns as positive economic momentum has continued. Much of the Fund’s lag in the last twelve months occurred in calendar 2018, and mostly in the quarter ended June. Value equities continue to struggle to gain investors’ attention in an environment of rapid technological enablement of new business ideas, regardless of their long-term viability.
Allocation across sectors was positive, but equity selection was negative. By a wide margin, health care was the biggest negative for the Fund, entirely due to selection. Specific weakness in two pharmaceutical companies has been a material drag on performance yet both companies remain in the Fund as progress continues on their development of new products, one of which is an opioid substitute that has gained expanded FDA-approvals and is growing at a double-digit rate, and while the market has been slow to give it credit, recent results are encouraging. Simultaneously, biotech, a sub-sector the Fund has no exposure to, posted amongst the best returns of any sub-sector in the market including a single-security sub-sector (beverages). The Fund’s lack of exposure to biotech cost nearly 100 basis points of relative performance. Biotech companies may have wonderful futures, but considering the lack of profitability, high risk outcomes, and incompatibility with any valuation discipline, it is difficult to make a case for investment that includes any margin of safety.
Energy and Materials were also drags on performance, while Consumer Discretionary, Consumer Staples, Information Technology, and Real Estate were all positive contributors to relative performance.
As 2018 has progressed, economic data has exhibited some indications of topping out, which has led to a reduction in our cyclical exposure. Conversely, an early 2018 rise in interest rates created opportunities in REITs and Utilities. Given the Fund’s relatively defensive posture, some degree of underperformance makes sense, and we remain comfortable with our positioning. It is probably indicative of an important financial market juncture that, according to Jefferies Financial Group, nearly 90% of small cap value managers underperformed the benchmark in the most recent quarter. As we look at the numbers, valuation was the most striking contributor. Within the benchmark, the top valuation quintile (expensive) outperformed the bottom valuation quintile (inexpensive) by 770 basis points. Non-earners, of which the Fund holds only three expected to post net income losses this year, contributed the highest absolute performance and nearly 200 basis points of the index’s return. On a factor basis, Value was at the bottom. Within the Fund the same dynamic occurred, with the top quintile of valuation outperforming the bottom. At the same time, many of the Fund companies that reported solid earnings were fairly ignored by the market. Which is to say price was a more important factor versus results. This hurts the Fund which earns its best returns in equities where we find consensus estimates too low.
We strive to be both intelligent investors and fiduciaries simultaneously, but the concepts at times seem to conflict as to which is more prudent, the avoidance of a speculative loss versus the absence of an irrational gain. In the present environment, we do have two views that guide our current positioning:
| ● | First, we expect adherents to a strictly low-valuation-based investment strategy will continue to underperform because low cost does not necessarily equate with high value. Low valuation is often an appropriate reflection of elevated risk, not opportunity. It is a particularly flawed strategy today as it assumes the past is worth something. |
Reversion to the mean, historical valuation levels, peak and trough margins are all less and less relevant by the day. In the 1950s, the average lifespan of a company in the S&P 500 was sixty years. Today it is less than twenty; maybe two business cycles with shorter lifespans likely in years to come. The massive disruption occurring in the economy is understated. As a vast generalization, many so-called Value Stocks today are correctly expected to shuffle off this mortal coil and are priced as such, and some of the loss makers that did well this quarter may quickly reverse when realistic outlooks reassert themselves.
| ● | Second, chasing growth without discipline remains high risk. New champions are expected to live forever and also priced as such until proven otherwise. As we suspected last quarter, a negative view on Netflix has been woefully wrong; the stock has risen another 20% since a prominent analyst said its valuation was extreme in March. Rapidly growing Netflix trading at 9x revenues is possibly just as an appropriate valuation as the rapidly shrinking GE trading at 1x revenues is. However, when the straight line of growth on an expensive equity breaks, downside is often savage and immediate and a 9x revenue multiple can decline precipitously. Thus value managers chasing momentum might be correct for a period, but it is with far greater peril when not. The sugar high of a few months riding a hot stock does not make up for the rapid crash. |
| 4 | 1-855-612-3936 | www.cortinafunds.com |
| Shareholder Letter |
| Cortina Small Cap Value Fund | June 30, 2018 (Unaudited) |
In our process, valuation is a tool for risk control, not an invitation to make a purchase. Value investing should be thought of as investing in companies that create value versus those that are priced at low multiples. We investigate dozens of companies before buying one, and we retain our belief in evolution: change for the better creates value. And evolution takes time to both occur and be recognized. Functionally, when we make an initial investment in an equity it is with two basic beliefs:
| ● | Company earnings / outcomes will be above then current expectations |
| ● | The valuation of the security is low enough that if we are wrong or early our downside should be limited |
The largest overweight in the Fund is currently Consumer Discretionary, followed by modest overweights in Health Care and Consumer Staples. Financials are the largest underweight, followed by Energy and modest underweights in Real Estate and Technology. Our view remains that economic momentum appears to have peaked, and while at a healthy level we expect the next indications to be towards less robust growth. As interest rates spiked early in 2018, we took advantage of weakness in REITs to increase our weighting to the sector. We added very selectively to existing Industrials positions but remain generally pessimistic towards more cyclical companies even as their nominal valuations continue to decline and believe other areas offer greater potential.
In sum, we see growing opportunities for value capture as crowded positions are extrapolating yesterday’s trends when it is clear that much of what we take for granted is under grave threat, from companies to politics to foreign relations. Risks today are quite elevated but so are opportunities.
Peak-to-trough – The stage of the business or market cycle from the end of a period of growth (peak) into declining activity and contraction until it hits its ultimate cyclical bottom (trough).
Margin refers to the difference between revenue and expenses, where businesses typically track their gross profit margins, operating margins and net profit margins.
Cortina Funds are subject to risks, including loss of principal.
Investing in small or micro cap funds will be more volatile and loss of principal could be greater than investing in large cap or more diversified funds.
S&P 500 – The S&P 500 Index is the Standard & Poor’s composite index of 500 stocks, a widely recognized, unmanaged index of common stock prices.
Basis Point – Basis Point refers to a common unit of measure for interest rates and other percentages in finance. One basis point is equal to 1/100th of 1%, or 0.01%, or 0.0001, and is used to denote the percentage change in a financial instrument.
| Annual Report | June 30, 2018 | 5 |
| | Portfolio Information |
| Cortina Small Cap Value Fund | June 30, 2018 (Unaudited) |
Growth of $25,000 Investment (Unaudited)
For the period from September 30, 2011 (Inception) to June 30, 2018.
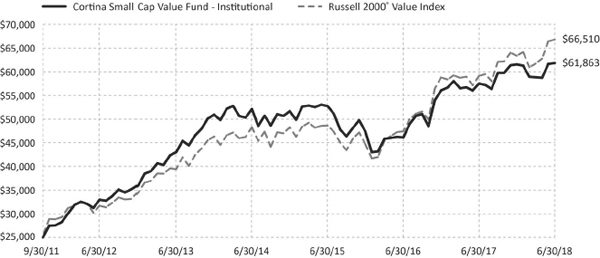
This graph assumes an initial $25,000 investment at September 30, 2011 (Inception Date). The Cortina Small Cap Value Fund Institutional share class (the “Fund”) will deduct a 2.00% redemption proceeds fee on Fund shares held 60 days or less. This graph depicts the performance of the Fund versus the Russell 2000® Value Index. It is important to note the Fund is a professionally managed mutual fund, while the index is not available for investment and is unmanaged. The comparison is shown for illustrative purposes only. Performance will vary from class to class based on differences in class-specific expenses.
This chart does not reflect the deduction of taxes that a shareholder would pay on Fund distributions or the redemption of Fund shares.
Performance Returns for the period ended June 30, 2018
| | 6 Months | 1 Year | 3 Years | 5 Years* | Since Inception* | Gross Expense Ratio** |
| Cortina Small Cap Value Fund - Institutional | 0.49% | 7.54% | 5.45% | 7.53% | 14.36% | 1.72% |
| Cortina Small Cap Value Fund - Investor | 0.34% | 7.23% | 5.18% | 7.26% | 14.08% | 1.97% |
| Russell 2000® Value Index | 5.44% | 13.10% | 11.22% | 11.18% | 15.60%*** | |
| * | The Fund’s Institutional shares inception date is September 30, 2011, Investor shares inception date is April 30, 2014. The performance shown for Investor shares for periods pre-dating the commencement of operations of that class reflects the performance of the Fund’s Institutional shares, the initial share class, calculated using the fees and expenses of Investor shares. If Investor shares of the Fund had been available during periods prior to April 30, 2014, the performance shown may have been different. |
| ** | Cortina Asset Management, LLC (the “Adviser”) has contractually agreed to waive management fees and/or reimburse the Fund’s operating expenses in order to limit the Fund’s total annual fund operating expenses (excluding taxes, leverage, interest, brokerage commissions, dividends or interest expenses on short positions, acquired fund fees and expenses, and extraordinary expenses) to 1.10% and 1.35% of average daily net assets of the Fund’s Institutional and Investor Class shares, respectively. The agreement will continue in effect at least through October 31, 2018, subject thereafter to annual re-approval of the agreement by the Fund’s Board of Directors. The current expense ratio for the Fund can be located in the Financial Highlights contained within this shareholder report. |
| *** | Represents the period from September 30, 2011 (date of original public offering of the Institutional shares) through June 30, 2018. |
Past performance does not guarantee future results. The performance data quoted represents past performance and current returns may be lower or higher. Total return figures include change in share price, reinvestment of dividends and capital gains. The investment return and principal value will fluctuate so that an investor’s shares, when redeemed may be worth more or less than their original cost. To obtain performance information current to the most recent month end, call 1-855-612-3936.
Russell 2000® Value Index measures the performance of those Russell 2000 companies with lower price-to-book ratios and lower forecasted growth values. All indices are unmanaged. It is not possible to invest directly in an index.
Sector Allocations****

| **** | Percentages are based on Net Assets as of June 30, 2018. Holdings are subject to change. |
| 6 | 1-855-612-3936 | www.cortinafunds.com |
| | Disclosure of Fund Expenses |
June 30, 2018 (Unaudited)
As a shareholder of the Fund(s), you incur ongoing costs, including management fees and other Fund expenses. This example is intended to help you understand your ongoing costs (in dollars) of investing in each Fund and to compare these costs with the ongoing costs of investing in other mutual funds. The example is based on an investment of $1,000 invested at the beginning of the period and held for the entire period, as indicated below.
Actual Expenses – The first line of the table below provides information about the actual account values and actual expenses. You may use the information in this line, together with the amount you invested, to estimate the expenses that you paid over the period. Simply divide your account value by $1,000 (for example, an $8,600 account value divided by $1,000 = 8.6) then multiply the result by the number in the first line under the heading entitled “Expenses Paid During Period” to estimate the expenses you paid on your account during this period.
Hypothetical Example for Comparison Purposes – The second line of the table below provides information about hypothetical account values and hypothetical expenses based on each Fund’s actual expense ratio and an assumed annual rate of return of 5% before expenses, which is not each Fund’s actual return. The hypothetical account values and expenses may not be used to estimate the actual ending account balance or expenses you paid for the period. You may use this information to compare the ongoing costs of investing in each Fund and other funds by comparing these 5% hypothetical examples with the 5% hypothetical examples that appear in the shareholder reports of other funds.
Please note that the expenses shown in the table are meant to highlight your ongoing costs only and do not reflect any direct costs, such as wire fees or low balance fees. Therefore, the second line of the table is useful in comparing ongoing costs and will not help you determine the relative total costs of owning different funds. In addition, if these direct costs were included, your costs would be higher.
| | Beginning
Account Value
January 1, 2018 | Ending
Account Value
June 30, 2018 | Expenses Paid
During Period(a) | Net
Expense
Ratios(b) |
| Cortina Small Cap Growth Fund - Institutional | | | | |
| Actual Fund Return | $1,000.00 | $1,223.60 | $6.06 | 1.10% |
| Hypothetical Fund Return (assuming a 5% return before expenses) | $1,000.00 | $1,019.34 | $5.51 | 1.10% |
| Cortina Small Cap Value Fund - Institutional | | | | |
| Actual Fund Return | $1,000.00 | $1,004.90 | $5.47 | 1.10% |
| Hypothetical Fund Return (assuming a 5% return before expenses) | $1,000.00 | $1,019.34 | $5.51 | 1.10% |
| Cortina Small Cap Value Fund - Investor | | | | |
| Actual Fund Return | $1,000.00 | $1,003.90 | $6.71 | 1.35% |
| Hypothetical Fund Return (assuming a 5% return before expenses) | $1,000.00 | $1,018.10 | $6.76 | 1.35% |
| (a) | Expenses are equal to the Fund’s annualized expense ratio multiplied by the average account value over the period, multiplied by the number of days in the most recent fiscal half year (181), divided by 365. |
| (b) | Annualized, based on the Fund’s most recent half-year expenses. |
| Annual Report | June 30, 2018 | 7 |
| | Schedule of Investments |
| Cortina Small Cap Growth Fund | June 30, 2018 |
| | | Shares | | | Value | |
| COMMON STOCKS (96.66%) | | | | | | | | |
| Consumer Discretionary (12.20%) | | | | | | | | |
| Camping World Holdings, Inc., Class A | | | 11,624 | | | $ | 290,368 | |
| Cavco Industries, Inc.(a) | | | 1,931 | | | | 400,972 | |
| Chegg, Inc.(a) | | | 14,270 | | | | 396,563 | |
| Chuy’s Holdings, Inc.(a) | | | 10,334 | | | | 317,254 | |
| Cooper-Standard Holding, Inc.(a) | | | 3,070 | | | | 401,157 | |
| Duluth Holdings, Inc., Class B(a) | | | 4,301 | | | | 102,321 | |
| Five Below, Inc.(a) | | | 3,380 | | | | 330,260 | |
| IMAX Corp.(a) | | | 9,471 | | | | 209,783 | |
| Installed Building Products, Inc.(a) | | | 4,045 | | | | 228,745 | |
| MarineMax, Inc.(a) | | | 14,553 | | | | 275,779 | |
| Ollie’s Bargain Outlet Holdings, Inc.(a) | | | 6,731 | | | | 487,997 | |
| Skyline Champion Corp. | | | 6,326 | | | | 221,663 | |
| Wingstop, Inc. | | | 7,043 | | | | 367,081 | |
| | | | | | | | 4,029,943 | |
| Consumer Staples (0.91%) | | | | | | | | |
| Limoneira Co. | | | 12,192 | | | | 300,045 | |
| | | | | | | | | |
| Energy (5.59%) | | | | | | | | |
| Abraxas Petroleum Corp.(a) | | | 99,260 | | | | 286,861 | |
| Extraction Oil & Gas, Inc.(a) | | | 16,206 | | | | 238,066 | |
| Mammoth Energy Services, Inc.(a) | | | 7,825 | | | | 265,737 | |
| Matador Resources Co.(a) | | | 9,366 | | | | 281,448 | |
| Penn Virginia Corp(a) | | | 4,781 | | | | 405,859 | |
| Profire Energy, Inc.(a) | | | 35,867 | | | | 121,231 | |
| ProPetro Holding Corp.(a) | | | 15,851 | | | | 248,544 | |
| | | | | | | | 1,847,746 | |
| Financials (4.25%) | | | | | | | | |
| Green Dot Corp., Class A(a) | | | 5,116 | | | | 375,463 | |
| Independent Bank Group, Inc. | | | 3,983 | | | | 266,065 | |
| Pinnacle Financial Partners, Inc. | | | 3,611 | | | | 221,535 | |
| Seacoast Banking Corp. of Florida(a) | | | 12,220 | | | | 385,908 | |
| Sterling Bancorp, Inc. | | | 11,598 | | | | 154,949 | |
| | | | | | | | 1,403,920 | |
| Health Care (30.44%)(b) | | | | | | | | |
| Amphastar Pharmaceuticals, Inc.(a) | | | 16,634 | | | | 253,835 | |
| ANI Pharmaceuticals, Inc.(a) | | | 3,539 | | | | 236,405 | |
| Apollo Endosurgery, Inc.(a) | | | 18,493 | | | | 129,081 | |
| AtriCure, Inc.(a) | | | 17,668 | | | | 477,919 | |
| BioDelivery Sciences International, Inc.(a) | | | 82,863 | | | | 244,446 | |
| BioTelemetry, Inc.(a) | | | 8,273 | | | | 372,285 | |
| Bovie Medical Corp.(a) | | | 28,552 | | | | 124,201 | |
| Cardiovascular Systems, Inc.(a) | | | 12,106 | | | | 391,508 | |
| Castlight Health, Inc., Class B(a) | | | 89,591 | | | | 380,762 | |
| Chembio Diagnostics, Inc.(a) | | | 28,242 | | | | 313,486 | |
| Codexis, Inc.(a) | | | 17,158 | | | | 247,075 | |
| Collegium Pharmaceutical, Inc.(a) | | | 15,880 | | | | 378,738 | |
| Cutera, Inc.(a) | | | 11,453 | | | | 461,556 | |
| Diplomat Pharmacy, Inc.(a) | | | 15,704 | | | | 401,394 | |
| Evolent Health, Inc., Class A(a) | | | 19,114 | | | | 402,350 | |
| Glaukos Corp.(a) | | | 7,752 | | | | 315,041 | |
| HealthEquity, Inc.(a) | | | 3,428 | | | | 257,443 | |
| K2M Group Holdings, Inc.(a) | | | 14,877 | | | | 334,733 | |
| Ligand Pharmaceuticals, Inc.(a) | | | 1,495 | | | | 309,719 | |
| Neogen Corp.(a) | | | 4,205 | | | | 337,199 | |
| NeoGenomics, Inc.(a) | | | 30,722 | | | | 402,766 | |
See Notes to Financial Statements.
| 8 | 1-855-612-3936 | www.cortinafunds.com |
| | Schedule of Investments |
| Cortina Small Cap Growth Fund | June 30, 2018 |
| | | Shares | | | Value | |
| COMMON STOCKS (continued) | | | | | | | | |
| Health Care (continued) | | | | | | | | |
| Neuronetics, Inc.(a) | | | 10,432 | | | $ | 277,596 | |
| Nevro Corp.(a) | | | 3,132 | | | | 250,090 | |
| Novocure, Ltd.(a) | | | 13,034 | | | | 407,964 | |
| OrthoPediatrics Corp.(a) | | | 6,717 | | | | 178,941 | |
| Oxford Immunotec Global PLC(a) | | | 21,790 | | | | 280,873 | |
| Pacira Pharmaceuticals, Inc.(a) | | | 10,806 | | | | 346,332 | |
| Repligen Corp.(a) | | | 5,569 | | | | 261,966 | |
| Sientra, Inc.(a) | | | 14,473 | | | | 282,368 | |
| STAAR Surgical Co.(a) | | | 8,663 | | | | 268,553 | |
| Tactile Systems Technology, Inc.(a) | | | 8,315 | | | | 432,380 | |
| Tandem Diabetes Care, Inc.(a) | | | 13,500 | | | | 297,270 | |
| | | | | | | | 10,056,275 | |
| Industrials (17.15%) | | | | | | | | |
| AAR Corp. | | | 5,665 | | | | 263,366 | |
| Air Transport Services Group, Inc.(a) | | | 16,878 | | | | 381,274 | |
| Astec Industries, Inc. | | | 6,628 | | | | 396,355 | |
| Atlas Air Worldwide Holdings, Inc.(a) | | | 4,878 | | | | 349,753 | |
| Axon Enterprise, Inc.(a) | | | 6,745 | | | | 426,149 | |
| Chart Industries, Inc.(a) | | | 6,138 | | | | 378,592 | |
| Dycom Industries, Inc.(a) | | | 3,062 | | | | 289,390 | |
| Granite Construction, Inc. | | | 4,420 | | | | 246,017 | |
| Kratos Defense & Security Solutions, Inc.(a) | | | 24,202 | | | | 278,565 | |
| Manitex International, Inc.(a) | | | 25,034 | | | | 312,424 | |
| Meritor, Inc.(a) | | | 11,709 | | | | 240,854 | |
| Saia, Inc.(a) | | | 4,219 | | | | 341,106 | |
| Spartan Motors, Inc. | | | 22,593 | | | | 341,154 | |
| Spirit Airlines, Inc.(a) | | | 7,549 | | | | 274,406 | |
| Titan International, Inc. | | | 18,705 | | | | 200,705 | |
| TPI Composites, Inc.(a) | | | 13,689 | | | | 400,266 | |
| Werner Enterprises, Inc. | | | 8,884 | | | | 333,594 | |
| Westport Fuel Systems, Inc.(a) | | | 83,576 | | | | 211,447 | |
| | | | | | | | 5,665,417 | |
| Information Technology (23.99%) | | | | | | | | |
| 2U, Inc.(a) | | | 2,414 | | | | 201,714 | |
| Amber Road, Inc.(a) | | | 24,031 | | | | 226,132 | |
| Appian Corp.(a) | | | 6,456 | | | | 233,449 | |
| Asure Software, Inc.(a) | | | 13,779 | | | | 219,775 | |
| Blackline, Inc.(a) | | | 3,565 | | | | 154,828 | |
| Bottomline Technologies de, Inc.(a) | | | 5,817 | | | | 289,861 | |
| Box, Inc., Class A(a) | | | 12,718 | | | | 317,823 | |
| ChannelAdvisor Corp.(a) | | | 9,877 | | | | 138,772 | |
| Cray, Inc.(a) | | | 16,684 | | | | 410,426 | |
| Envestnet, Inc.(a) | | | 3,006 | | | | 165,180 | |
| FARO Technologies, Inc.(a) | | | 4,506 | | | | 244,901 | |
| Five9, Inc.(a) | | | 7,805 | | | | 269,819 | |
| FormFactor, Inc.(a) | | | 19,177 | | | | 255,054 | |
| Inphi Corp.(a) | | | 7,597 | | | | 247,738 | |
| Internap Corp.(a) | | | 15,223 | | | | 158,624 | |
| Limelight Networks, Inc.(a) | | | 71,593 | | | | 320,021 | |
| LivePerson, Inc.(a) | | | 23,786 | | | | 501,884 | |
| Mellanox Technologies, Ltd.(a) | | | 4,627 | | | | 390,056 | |
| Mimecast, Ltd.(a) | | | 6,339 | | | | 261,230 | |
| Model N, Inc.(a) | | | 13,632 | | | | 253,555 | |
| Photronics, Inc.(a) | | | 28,036 | | | | 223,587 | |
| Quantenna Communications, Inc.(a) | | | 23,613 | | | | 366,946 | |
| Rapid7, Inc.(a) | | | 10,555 | | | | 297,862 | |
See Notes to Financial Statements.
| Annual Report | June 30, 2018 | 9 |
| Schedule of Investments |
| Cortina Small Cap Growth Fund | June 30, 2018 |
| | | Shares | | | Value | |
| COMMON STOCKS (continued) | | | | | | | | |
| Information Technology (continued) | | | | | | | | |
| RingCentral, Inc., Class A(a) | | | 3,320 | | | $ | 233,562 | |
| Sailpoint Technologies Holding(a) | | | 12,206 | | | | 299,535 | |
| Silicon Motion Technology Corp., ADR | | | 4,955 | | | | 262,070 | |
| Twilio, Inc., Class A(a) | | | 4,730 | | | | 264,975 | |
| USA Technologies, Inc.(a) | | | 27,499 | | | | 384,986 | |
| Varonis Systems, Inc.(a) | | | 4,418 | | | | 329,141 | |
| | | | | | | | 7,923,506 | |
| Materials (0.88%) | | | | | | | | |
| Summit Materials, Inc., Class A(a) | | | 11,049 | | | | 290,036 | |
| | | | | | | | | |
| Telecommunication Services (1.25%) | | | | | | | | |
| Boingo Wireless, Inc.(a) | | | 18,204 | | | | 411,228 | |
| | | | | | | | | |
| TOTAL COMMON STOCKS | | | | | | | | |
| (COST $23,250,371) | | | | | | | 31,928,116 | |
| | | | | | | | | |
| TOTAL INVESTMENTS (96.66%) | | | | | | | | |
| (COST $23,250,371) | | | | | | | 31,928,116 | |
| | | | | | | | | |
| OTHER ASSETS IN EXCESS OF LIABILITIES (3.34%) | | | | | | | 1,103,633 | |
| | | | | | | | | |
| NET ASSETS 100.00% | | | | | | $ | 33,031,749 | |
| (a) | Non Income Producing Security. |
| (b) | To the extent the Fund invests more heavily in particular sectors of the economy, its performance will be especially sensitive to developments that significantly affect those sectors. When sector categorization is broken down by industry, no industry exceeds the 25% maximum specified in the Statement of Additional Information. |
See Notes to Financial Statements.
| 10 | 1-855-612-3936 | www.cortinafunds.com |
| Schedule of Investments |
| Cortina Small Cap Value Fund | June 30, 2018 |
| | | Shares | | | Value | |
| COMMON STOCKS (97.39%) | | | | | | | | |
| Consumer Discretionary (18.76%) | | | | | | | | |
| Abercrombie & Fitch Co., Class A | | | 20,698 | | | $ | 506,687 | |
| Adtalem Global Education, Inc.(a) | | | 13,455 | | | | 647,186 | |
| Bojangles’, Inc.(a) | | | 30,463 | | | | 438,667 | |
| Buckle, Inc. | | | 17,689 | | | | 475,834 | |
| Caleres, Inc. | | | 12,649 | | | | 434,999 | |
| Career Education Corp.(a) | | | 37,445 | | | | 605,486 | |
| Eldorado Resorts, Inc.(a) | | | 13,739 | | | | 537,195 | |
| Express, Inc.(a) | | | 43,789 | | | | 400,669 | |
| M/I Homes, Inc.(a) | | | 9,421 | | | | 249,468 | |
| New Home Co., Inc.(a) | | | 15,889 | | | | 158,413 | |
| Tailored Brands, Inc. | | | 13,086 | | | | 333,955 | |
| TRI Pointe Group, Inc.(a) | | | 13,863 | | | | 226,799 | |
| Williams-Sonoma, Inc. | | | 10,211 | | | | 626,751 | |
| | | | | | | | 5,642,109 | |
| Consumer Staples (4.23%) | | | | | | | | |
| Andersons, Inc. | | | 12,519 | | | | 428,150 | |
| TreeHouse Foods, Inc.(a) | | | 16,087 | | | | 844,728 | |
| | | | | | | | 1,272,878 | |
| Energy (5.23%) | | | | | | | | |
| Carrizo Oil & Gas, Inc.(a) | | | 17,159 | | | | 477,878 | |
| Eclipse Resources Corp.(a) | | | 67,022 | | | | 107,235 | |
| Matador Resources Co.(a) | | | 12,711 | | | | 381,966 | |
| Oil States International, Inc.(a) | | | 11,735 | | | | 376,693 | |
| Patterson-UTI Energy, Inc. | | | 12,762 | | | | 229,716 | |
| | | | | | | | 1,573,488 | |
| Financials (22.85%) | | | | | | | | |
| BancorpSouth, Inc. | | | 16,137 | | | | 531,714 | |
| Capitol Federal Financial, Inc. | | | 22,787 | | | | 299,877 | |
| CBTX, Inc. | | | 12,638 | | | | 417,686 | |
| ConnectOne Bancorp, Inc. | | | 12,182 | | | | 303,332 | |
| Enterprise Financial Services Corp. | | | 10,555 | | | | 569,442 | |
| James River Group Holdings, Ltd. | | | 7,789 | | | | 306,030 | |
| Live Oak Bancshares, Inc. | | | 24,294 | | | | 744,611 | |
| Meridian Bancorp, Inc. | | | 28,070 | | | | 537,540 | |
| Pinnacle Financial Partners, Inc. | | | 9,466 | | | | 580,739 | |
| Provident Financial Services, Inc. | | | 15,929 | | | | 438,525 | |
| TriState Capital Holdings, Inc.(a) | | | 24,119 | | | | 629,506 | |
| Waterstone Financial, Inc. | | | 25,575 | | | | 436,054 | |
| Western Alliance Bancorp(a) | | | 9,900 | | | | 560,439 | |
| Wintrust Financial Corp. | | | 5,955 | | | | 518,383 | |
| | | | | | | | 6,873,878 | |
| Health Care (6.49%) | | | | | | | | |
| Allscripts Healthcare Solutions, Inc.(a) | | | 41,159 | | | | 493,908 | |
| Endologix, Inc.(a) | | | 59,430 | | | | 336,374 | |
| Invacare Corp. | | | 20,997 | | | | 390,544 | |
| Pacira Pharmaceuticals, Inc.(a) | | | 15,703 | | | | 503,281 | |
| Prestige Brands Holdings, Inc.(a) | | | 5,901 | | | | 226,481 | |
| | | | | | | | 1,950,588 | |
| Industrials (11.83%) | | | | | | | | |
| Astronics Corp.(a) | | | 10,476 | | | | 376,822 | |
| Atkore International Group, Inc.(a) | | | 35,312 | | | | 733,430 | |
| Forward Air Corp. | | | 6,711 | | | | 396,486 | |
| Generac Holdings, Inc.(a) | | | 12,327 | | | | 637,676 | |
| Harsco Corp.(a) | | | 23,368 | | | | 516,433 | |
See Notes to Financial Statements.
| Annual Report | June 30, 2018 | 11 |
| Schedule of Investments |
| Cortina Small Cap Value Fund | June 30, 2018 |
| | | Shares | | | Value | |
| COMMON STOCKS (continued) | | | | | | | | |
| Industrials (continued) | | | | | | | | |
| Knoll, Inc. | | | 24,181 | | | $ | 503,207 | |
| REV Group, Inc. | | | 13,460 | | | | 228,954 | |
| Safe Bulkers, Inc.(a) | | | 48,463 | | | | 164,774 | |
| | | | | | | | 3,557,782 | |
| Information Technology (9.20%) | | | | | | | | |
| ACI Worldwide, Inc.(a) | | | 24,237 | | | | 597,927 | |
| Ambarella, Inc.(a) | | | 5,069 | | | | 195,714 | |
| BlackBerry, Ltd.(a) | | | 30,937 | | | | 298,542 | |
| Dolby Laboratories, Inc., Class A | | | 7,219 | | | | 445,340 | |
| Etsy, Inc.(a) | | | 13,614 | | | | 574,375 | |
| Teradata Corp.(a) | | | 16,341 | | | | 656,091 | |
| | | | | | | | 2,767,989 | |
| Materials (4.36%) | | | | | | | | |
| AdvanSix, Inc.(a) | | | 12,559 | | | | 460,036 | |
| Commercial Metals Co. | | | 18,768 | | | | 396,192 | |
| Graphic Packaging Holding Co. | | | 31,417 | | | | 455,861 | |
| | | | | | | | 1,312,089 | |
| Real Estate (9.53%) | | | | | | | | |
| Americold Realty Trust, REIT | | | 30,638 | | | | 674,649 | |
| Brixmor Property Group, Inc., REIT | | | 23,774 | | | | 414,381 | |
| Essential Properties Realty Trust, Inc., REIT(a) | | | 31,569 | | | | 427,444 | |
| Four Corners Property Trust, Inc., REIT | | | 23,046 | | | | 567,623 | |
| Physicians Realty Trust, REIT | | | 9,596 | | | | 152,960 | |
| Taubman Centers, Inc., REIT | | | 2,467 | | | | 144,961 | |
| Washington Prime Group, Inc., REIT | | | 59,690 | | | | 484,086 | |
| | | | | | | | 2,866,104 | |
| Utilities (4.91%) | | | | | | | | |
| Chesapeake Utilities Corp. | | | 7,033 | | | | 562,288 | |
| Connecticut Water Service, Inc. | | | 2,630 | | | | 171,791 | |
| Middlesex Water Co. | | | 8,139 | | | | 343,222 | |
| Portland General Electric Co. | | | 9,330 | | | | 398,951 | |
| | | | | | | | 1,476,252 | |
| | | | | | | | | |
| TOTAL COMMON STOCKS | | | | | | | | |
| (COST $23,519,312) | | | | | | | 29,293,157 | |
| | | | | | | | | |
| TOTAL INVESTMENTS (97.39%) | | | | | | | | |
| (COST $23,519,312) | | | | | | | 29,293,157 | |
| | | | | | | | | |
| OTHER ASSETS IN EXCESS OF LIABILITIES (2.61%) | | | | | | | 785,612 | |
| | | | | | | | | |
| NET ASSETS 100.00% | | | | | | $ | 30,078,769 | |
| (a) | Non Income Producing Security. |
See Notes to Financial Statements.
| 12 | 1-855-612-3936 | www.cortinafunds.com |
| Statements of Assets and Liabilities |
June 30, 2018
| | | Cortina Small Cap Growth Fund | | | Cortina Small Cap Value Fund | |
| ASSETS: | | | | | | |
| Investments, at value (Cost - see below) | | $ | 31,928,116 | | | $ | 29,293,157 | |
| Cash | | | 1,278,731 | | | | 1,054,902 | |
| Receivable for investments sold | | | 284,223 | | | | – | |
| Receivable for fund shares subscribed | | | 39,025 | | | | – | |
| Dividends and interest receivable | | | 1,848 | | | | 34,551 | |
| Prepaid expenses and other assets | | | 3,689 | | | | 9,137 | |
| Total Assets | | | 33,535,632 | | | | 30,391,747 | |
| | | | | | | | | |
| LIABILITIES: | | | | | | | | |
| Payable for investments purchased | | | 428,829 | | | | 216,616 | |
| Payable for fund shares redeemed | | | – | | | | 13,558 | |
| Payable for director fees | | | 5,000 | | | | 5,000 | |
| Payable for advisory fees | | | 16,535 | | | | 11,861 | |
| Payable for fund accounting and administration fees | | | 22,734 | | | | 23,001 | |
| Payable for distribution and service fees | | | – | | | | 274 | |
| Payable for audit, tax and legal fees | | | 20,213 | | | | 23,717 | |
| Other accrued liabilities and expenses | | | 10,572 | | | | 18,951 | |
| Total Liabilities | | | 503,883 | | | | 312,978 | |
| Net Assets | | $ | 33,031,749 | | | $ | 30,078,769 | |
| | | | | | | | | |
| NET ASSETS CONSISTS OF: | | | | | | | | |
| Paid-in capital | | $ | 21,203,948 | | | $ | 22,585,577 | |
| Accumulated net realized gain on investments | | | 3,150,056 | | | | 1,719,347 | |
| Net unrealized appreciation on investments | | | 8,677,745 | | | | 5,773,845 | |
| Net Assets | | $ | 33,031,749 | | | $ | 30,078,769 | |
| | | | | | | | | |
| Cost of Investments | | $ | 23,250,371 | | | $ | 23,519,312 | |
| | | | | | | | | |
| PRICING OF SHARES: | | | | | | | | |
| Institutional | | | | | | | | |
| Net Assets | | $ | 33,031,749 | | | $ | 29,419,485 | |
| Shares Outstanding ($0.01 par value, unlimited number of shares authorized) | | | 1,658,226 | | | | 1,431,227 | |
| Net Asset Value, offering and redemption price per share | | $ | 19.92 | | | $ | 20.56 | |
| Investor | | | | | | | | |
| Net Assets | | $ | – | | | $ | 659,284 | |
| Shares Outstanding ($0.01 par value, unlimited number of shares authorized) | | | – | | | | 32,367 | |
| Net Asset Value, offering and redemption price per share | | $ | – | | | $ | 20.37 | |
See Notes to Financial Statements.
| Annual Report | June 30, 2018 | 13 |
| Statements of Operations |
For the Year Ended June 30, 2018
| | | Cortina Small Cap Growth Fund | | | Cortina Small Cap Value Fund | |
| INVESTMENT INCOME: | | | | | | | | |
| Dividends (net of foreign withholding taxes of $24 and $3,332, respectively) | | $ | 36,778 | | | $ | 458,053 | |
| Total Investment Income | | | 36,778 | | | | 458,053 | |
| | | | | | | | | |
| EXPENSES: | | | | | | | | |
| Advisory fees (Note 3) | | | 272,011 | | | | 429,311 | |
| Fund accounting and administration fees and expenses | | | 97,079 | | | | 144,118 | |
| Transfer agent fees | | | 32,361 | | | | 51,578 | |
| Distribution and service fees | | | | | | | | |
| Investor | | | – | | | | 1,780 | |
| Legal fees | | | 15,449 | | | | 25,959 | |
| Printing fees | | | 1,179 | | | | 7,728 | |
| Registration fees | | | 22,937 | | | | 34,593 | |
| Audit and tax fees | | | 15,775 | | | | 16,275 | |
| Custodian fees | | | 4,853 | | | | 6,005 | |
| Director fees and expenses | | | 20,000 | | | | 20,000 | |
| Other | | | 11,753 | | | | 16,965 | |
| Total Expenses Before Waivers | | | 493,397 | | | | 754,312 | |
| Less fees waived by Adviser (Note 3) | | | (193,974 | ) | | | (280,662 | ) |
| Total Net Expenses | | | 299,423 | | | | 473,650 | |
| Net Investment Loss | | | (262,645 | ) | | | (15,597 | ) |
| | | | | | | | | |
| REALIZED AND UNREALIZED GAIN/(LOSS) ON INVESTMENTS: | | | | | | | | |
| Net realized gain on investments | | | 4,491,713 | | | | 3,156,765 | |
| Net change in unrealized appreciation/depreciation on investments | | | 2,256,335 | | | | (525,768 | ) |
| Net Realized and Unrealized Gain on Investments | | | 6,748,048 | | | | 2,630,997 | |
| Net Increase in Net Assets Resulting from Operations | | $ | 6,485,403 | | | $ | 2,615,400 | |
See Notes to Financial Statements.
| 14 | 1-855-612-3936 | www.cortinafunds.com |
| Statements of Changes in Net Assets |
| | | Cortina Small Cap Growth Fund | | | Cortina Small Cap Value Fund | |
| | | Year Ended
June 30, 2018 | | | Year Ended
June 30, 2017 | | | Year Ended
June 30, 2018 | | | Year Ended
June 30, 2017 | |
| OPERATIONS: | | | | | | | | | | | | | | | | |
| Net investment income/(loss) | | $ | (262,645 | ) | | $ | (292,074 | ) | | $ | (15,597 | ) | | $ | 11,563 | |
| Net realized gain on investments | | | 4,491,713 | | | | 8,060,618 | | | | 3,156,765 | | | | 10,540,771 | |
| Net change in unrealized appreciation/ depreciation on investments | | | 2,256,335 | | | | 855,736 | | | | (525,768 | ) | | | 744,058 | |
| Net increase in net assets resulting from operations | | | 6,485,403 | | | | 8,624,280 | | | | 2,615,400 | | | | 11,296,392 | |
| | | | | | | | | | | | | | | | | |
| DISTRIBUTIONS TO SHAREHOLDERS: | | | | | | | | | | | | | | | | |
| Institutional | | | | | | | | | | | | | | | | |
| From net investment income | | | – | | | | – | | | | – | | | | (76,127 | ) |
| From net realized gains on investments | | | (4,189,359 | ) | | | – | | | | (2,288,431 | ) | | | – | |
| Investor | | | | | | | | | | | | | | | | |
| From net investment income | | | – | | | | – | | | | – | | | | (79 | ) |
| From net realized gains on investments | | | – | | | | – | | | | (34,992 | ) | | | – | |
| Total distributions | | | (4,189,359 | ) | | | – | | | | (2,323,423 | ) | | | (76,206 | ) |
| | | | | | | | | | | | | | | | | |
| CAPITAL SHARE TRANSACTIONS: | | | | | | | | | | | | | | | | |
| Institutional | | | | | | | | | | | | | | | | |
| Proceeds from sale of shares | | | 5,542,873 | | | | 2,251,187 | | | | 14,918,148 | | | | 8,762,639 | |
| Shares issued in reinvestment of distributions | | | 4,159,270 | | | | – | | | | 1,673,166 | | | | 58,066 | |
| Cost of shares redeemed | | | (4,980,273 | ) | | | (19,682,697 | ) | | | (28,948,315 | ) | | | (42,973,360 | ) |
| Redemption fees | | | – | | | | – | | | | 4 | | | | 1,239 | |
| Total | | | 4,721,870 | | | | (17,431,510 | ) | | | (12,356,997 | ) | | | (34,151,416 | ) |
| Investor | | | | | | | | | | | | | | | | |
| Proceeds from sale of shares | | | – | | | | – | | | | 37,009 | | | | 585,238 | |
| Shares issued in reinvestment of distributions | | | – | | | | – | | | | 30,671 | | | | 76 | |
| Cost of shares redeemed | | | – | | | | – | | | | (445,691 | ) | | | (207,584 | ) |
| Total | | | – | | | | – | | | | (378,011 | ) | | | 377,730 | |
| Net increase/(decrease) from capital shares transactions | | | 4,721,870 | | | | (17,431,510 | ) | | | (12,735,008 | ) | | | (33,773,686 | ) |
| | | | | | | | | | | | | | | | | |
| Net increase/(decrease) in net assets | | | 7,017,914 | | | | (8,807,230 | ) | | | (12,443,031 | ) | | | (22,553,500 | ) |
| | | | | | | | | | | | | | | | | |
| NET ASSETS: | | | | | | | | | | | | | | | | |
| Beginning of year | | | 26,013,835 | | | | 34,821,065 | | | | 42,521,800 | | | | 65,075,300 | |
| End of year | | $ | 33,031,749 | | | $ | 26,013,835 | | | $ | 30,078,769 | | | $ | 42,521,800 | |
| Including accumulated net investment income of: | | $ | – | | | $ | – | | | $ | – | | | $ | – | |
| | | | | | | | | | | | | | | | | |
| OTHER INFORMATION: | | | | | | | | | | | | | | | | |
| Share Transactions: | | | | | | | | | | | | | | | | |
| Institutional | | | | | | | | | | | | | | | | |
| Beginning shares | | | 1,390,728 | | | | 2,439,069 | | | | 2,057,765 | | | | 3,985,455 | |
| Shares sold | | | 280,309 | | | | 132,757 | | | | 741,753 | | | | 467,621 | |
| Shares issued in reinvestment of dividends | | | 260,769 | | | | – | | | | 83,868 | | | | 2,936 | |
| Less shares redeemed | | | (273,580 | ) | | | (1,181,098 | ) | | | (1,452,159 | ) | | | (2,398,247 | ) |
| Ending shares | | | 1,658,226 | | | | 1,390,728 | | | | 1,431,227 | | | | 2,057,765 | |
| Investor | | | | | | | | | | | | | | | | |
| Beginning shares | | | – | | | | – | | | | 51,411 | | | | 32,503 | |
| Shares sold | | | – | | | | – | | | | 1,820 | | | | 29,568 | |
| Shares issued in reinvestment of dividends | | | – | | | | – | | | | 1,549 | | | | 4 | |
| Less shares redeemed | | | – | | | | – | | | | (22,413 | ) | | | (10,664 | ) |
| Ending shares | | | – | | | | – | | | | 32,367 | | | | 51,411 | |
See Notes to Financial Statements.
| Annual Report | June 30, 2018 | 15 |
| Financial Highlights |
| Cortina Small Cap Growth Fund | For a share outstanding throughout the periods presented. |
| | | Year Ended June 30, 2018 | | | Year Ended June 30, 2017 | | | Year Ended June 30, 2016 | | | Year Ended June 30, 2015 | | | Year Ended June 30, 2014 | |
| NET ASSET VALUE, BEGINNING OF PERIOD | | $ | 18.71 | | | $ | 14.28 | | | $ | 15.41 | | | $ | 16.35 | | | $ | 14.46 | |
| INCOME/(LOSS) FROM INVESTMENT OPERATIONS: | | | | | | | | | | | | | | | | | | | | |
| Net investment loss(a) | | | (0.18 | ) | | | (0.16 | ) | | | (0.13 | ) | | | (0.14 | ) | | | (0.17 | ) |
| Net realized and unrealized gain/(loss) on investments | | | 4.41 | | | | 4.59 | | | | (1.00 | ) | | | (0.02 | )(b) | | | 2.19 | |
| Total from Investment Operations | | | 4.23 | | | | 4.43 | | | | (1.13 | ) | | | (0.16 | ) | | | 2.02 | |
| | | | | | | | | | | | | | | | | | | | | |
| DIVIDENDS AND DISTRIBUTIONS TO SHAREHOLDERS: | | | | | | | | | | | | | | | | | | | | |
| From net realized gains on investments | | | (3.02 | ) | | | – | | | | – | | | | (0.78 | ) | | | (0.13 | ) |
| Total Dividends and Distributions to Shareholders | | | (3.02 | ) | | | – | | | | – | | | | (0.78 | ) | | | (0.13 | ) |
| | | | | | | | | | | | | | | | | | | | | |
| Paid-in Capital from Redemption Fees | | | – | | | | – | | | | – | | | | 0.00 | (c) | | | 0.00 | (c) |
| | | | | | | | | | | | | | | | | | | | | |
| NET INCREASE/(DECREASE) IN NET ASSET VALUE | | | 1.21 | | | | 4.43 | | | | (1.13 | ) | | | (0.94 | ) | | | 1.89 | |
| | | | | | | | | | | | | | | | | | | | | |
| NET ASSET VALUE, END OF PERIOD | | $ | 19.92 | | | $ | 18.71 | | | $ | 14.28 | | | $ | 15.41 | | | $ | 16.35 | |
| | | | | | | | | | | | | | | | | | | | | |
| TOTAL RETURN | | | 26.72 | % | | | 30.95 | % | | | (7.33 | %) | | | (0.71 | %) | | | 13.99 | % |
| | | | | | | | | | | | | | | | | | | | | |
| RATIOS AND SUPPLEMENTAL DATA: | | | | | | | | | | | | | | | | | | | | |
| Net assets, end of period (in 000s) | | $ | 33,032 | | | $ | 26,014 | | | $ | 34,821 | | | $ | 46,285 | | | $ | 31,657 | |
| | | | | | | | | | | | | | | | | | | | | |
| RATIOS TO AVERAGE NET ASSETS: | | | | | | | | | | | | | | | | | | | | |
| Operating expenses excluding waiver/reimbursement | | | 1.81 | % | | | 1.76 | % | | | 1.54 | % | | | 1.57 | % | | | 1.86 | % |
| Operating expenses including waiver/reimbursement | | | 1.10 | % | | | 1.10 | % | | | 1.10 | % | | | 1.10 | % | | | 1.10 | % |
| Net investment loss including waiver/reimbursement | | | (0.96 | )% | | | (0.98 | )% | | | (0.97 | )% | | | (0.94 | )% | | | (1.02 | )% |
| | | | | | | | | | | | | | | | | | | | | |
| PORTFOLIO TURNOVER RATE | | | 96 | % | | | 88 | % | | | 93 | % | | | 95 | % | | | 81 | % |
| (a) | Calculated using average shares throughout the period. |
| (b) | Realized and unrealized gains and losses per share in this caption are balancing amounts necessary to reconcile the change in net asset value per share for the period, and may not reconcile with the aggregate gains and losses in the Statements of Operations due to the share transactions for the period. |
| (c) | Less than $0.005 per share. |
See Notes to Financial Statements.
| 16 | 1-855-612-3936 | www.cortinafunds.com |
| Financial Highlights |
| Cortina Small Cap Value Fund – Institutional | For a share outstanding throughout the periods presented. |
| | | Year Ended June 30, 2018 | | | Year Ended June 30, 2017 | | | Year Ended June 30, 2016 | | | Year Ended June 30, 2015 | | | Year Ended June 30, 2014 | |
| NET ASSET VALUE, BEGINNING OF PERIOD | | $ | 20.16 | | | $ | 16.20 | | | $ | 18.52 | | | $ | 18.67 | | | $ | 15.62 | |
| INCOME/(LOSS) FROM INVESTMENT OPERATIONS: | | | | | | | | | | | | | | | | | | | | |
| Net investment income/(loss)(a) | | | (0.01 | ) | | | 0.01 | | | | 0.01 | | | | (0.02 | ) | | | (0.01 | ) |
| Net realized and unrealized gain/(loss) on investments | | | 1.50 | | | | 3.98 | | | | (2.33 | ) | | | 0.24 | | | | 3.30 | |
| Total from Investment Operations | | | 1.49 | | | | 3.99 | | | | (2.32 | ) | | | 0.22 | | | | 3.29 | |
| | | | | | | | | | | | | | | | | | | | | |
| DIVIDENDS AND DISTRIBUTIONS TO SHAREHOLDERS: | | | | | | | | | | | | | | | | | | | | |
| From net investment income | | | – | | | | (0.03 | ) | | | – | | | | – | | | | (0.01 | ) |
| From net realized gains on investments | | | (1.09 | ) | | | – | | | | – | | | | (0.37 | ) | | | (0.23 | ) |
| Total Dividends and Distributions to Shareholders | | | (1.09 | ) | | | (0.03 | ) | | | – | | | | (0.37 | ) | | | (0.24 | ) |
| | | | | | | | | | | | | | | | | | | | | |
| Paid-in Capital from Redemption Fees | | | 0.00 | (b) | | | 0.00 | (b) | | | 0.00 | (b) | | | 0.00 | (b) | | | – | |
| | | | | | | | | | | | | | | | | | | | | |
| NET INCREASE/(DECREASE) IN NET ASSET VALUE | | | 0.40 | | | | 3.96 | | | | (2.32 | ) | | | (0.15 | ) | | | 3.05 | |
| | | | | | | | | | | | | | | | | | | | | |
| NET ASSET VALUE, END OF PERIOD | | $ | 20.56 | | | $ | 20.16 | | | $ | 16.20 | | | $ | 18.52 | | | $ | 18.67 | |
| | | | | | | | | | | | | | | | | | | | | |
| TOTAL RETURN | | | 7.54 | % | | | 24.65 | % | | | (12.53 | %) | | | 1.21 | % | | | 21.14 | % |
| | | | | | | | | | | | | | | | | | | | | |
| RATIOS AND SUPPLEMENTAL DATA: | | | | | | | | | | | | | | | | | | | | |
| Net assets, end of period (in 000s) | | $ | 29,419 | | | $ | 41,492 | | | $ | 64,552 | | | $ | 51,254 | | | $ | 34,842 | |
| | | | | | | | | | | | | | | | | | | | | |
| RATIOS TO AVERAGE NET ASSETS: | | | | | | | | | | | | | | | | | | | | |
| Operating expenses excluding waiver/reimbursement | | | 1.75 | % | | | 1.72 | % | | | 1.50 | % | | | 1.63 | % | | | 1.92 | % |
| Operating expenses including waiver/reimbursement | | | 1.10 | % | | | 1.10 | % | | | 1.10 | % | | | 1.10 | % | | | 1.10 | % |
| Net investment income/(loss) including waiver/reimbursement | | | (0.03 | )% | | | 0.03 | % | | | 0.08 | % | | | (0.13 | )% | | | (0.09 | )% |
| | | | | | | | | | | | | | | | | | | | | |
| PORTFOLIO TURNOVER RATE | | | 95 | % | | | 89 | % | | | 109 | % | | | 102 | % | | | 78 | % |
| (a) | Calculated using average shares throughout the period. |
| (b) | Less than $0.005 per share. |
See Notes to Financial Statements.
| Annual Report | June 30, 2018 | 17 |
| Financial Highlights |
| Cortina Small Cap Value Fund – Investor | For a share outstanding throughout the periods presented. |
| | | Year Ended June 30, 2018 | | | Year Ended June 30, 2017 | | | Year Ended June 30, 2016 | | | Year Ended June 30, 2015 | | | For the Period April 30, 2014 (Inception) to June 30, 2014 | |
| NET ASSET VALUE, BEGINNING OF PERIOD | | $ | 20.04 | | | $ | 16.11 | | | $ | 18.47 | | | $ | 18.67 | | | $ | 18.15 | |
| INCOME/(LOSS) FROM INVESTMENT OPERATIONS: | | | | | | | | | | | | | | | | | | | | |
| Net investment loss(a) | | | (0.06 | ) | | | (0.03 | )(b) | | | (0.02 | ) | | | (0.06 | ) | | | (0.01 | ) |
| Net realized and unrealized gain/(loss) on investments | | | 1.48 | | | | 3.96 | | | | (2.34 | ) | | | 0.23 | | | | 0.53 | |
| Total from Investment Operations | | | 1.42 | | | | 3.93 | | | | (2.36 | ) | | | 0.17 | | | | 0.52 | |
| | | | | | | | | | | | | | | | | | | | | |
| DIVIDENDS AND DISTRIBUTIONS TO SHAREHOLDERS: | | | | | | | | | | | | | | | | | | | | |
| From net investment income | | | – | | | | (0.00 | )(c) | | | – | | | | – | | | | – | |
| From net realized gains on investments | | | (1.09 | ) | | | – | | | | – | | | | (0.37 | ) | | | – | |
| Total Dividends and Distributions to Shareholders | | | (1.09 | ) | | | (0.00 | )(c) | | | – | | | | (0.37 | ) | | | – | |
| | | | | | | | | | | | | | | | | | | | | |
| NET INCREASE/(DECREASE) IN NET ASSET VALUE | | | 0.33 | | | | 3.93 | | | | (2.36 | ) | | | (0.20 | ) | | | 0.52 | |
| | | | | | | | | | | | | | | | | | | | | |
| NET ASSET VALUE, END OF PERIOD | | $ | 20.37 | | | $ | 20.04 | | | $ | 16.11 | | | $ | 18.47 | | | $ | 18.67 | |
| | | | | | | | | | | | | | | | | | | | | |
| TOTAL RETURN | | | 7.23 | % | | | 24.41 | % | | | (12.78 | %) | | | 0.94 | % | | | 2.87 | %(d) |
| | | | | | | | | | | | | | | | | | | | | |
| RATIOS AND SUPPLEMENTAL DATA: | | | | | | | | | | | | | | | | | | | | |
| Net assets, end of period (in 000s) | | $ | 659 | | | $ | 1,030 | | | $ | 524 | | | $ | 360 | | | $ | 103 | |
| | | | | | | | | | | | | | | | | | | | | |
| RATIOS TO AVERAGE NET ASSETS: | | | | | | | | | | | | | | | | | | | | |
| Operating expenses excluding waiver/reimbursement | | | 2.01 | % | | | 2.00 | % | | | 1.75 | % | | | 1.86 | % | | | 2.14 | %(e) |
| Operating expenses including waiver/reimbursement | | | 1.35 | % | | | 1.35 | % | | | 1.35 | % | | | 1.35 | % | | | 1.35 | %(e) |
| Net investment loss including waiver/reimbursement | | | (0.28 | )% | | | (0.15 | )% | | | (0.13 | )% | | | (0.35 | )% | | | (0.20 | )%(e) |
| | | | | | | | | | | | | | | | | | | | | |
| PORTFOLIO TURNOVER RATE | | | 95 | % | | | 89 | % | | | 109 | % | | | 102 | % | | | 78 | %(f) |
| (a) | Calculated using average shares throughout the period. |
| (b) | The amount shown for a share outstanding throughout the period may not correlate with the Statements of Operations for the period due to the timing of sales and redemptions of Fund shares in relation to income earned and/or fluctuating market value of the investments of the Fund. |
| (c) | Less than $0.005 per share. |
| (f) | Portfolio turnover is calculated at the Fund level and represents the year ended June 30, 2014. |
See Notes to Financial Statements.
| 18 | 1-855-612-3936 | www.cortinafunds.com |
| Notes to Financial Statements |
June 30, 2018
1. ORGANIZATION
Cortina Funds, Inc. (the “Corporation”) is an open-end management investment company registered under the Investment Company Act of 1940, as amended (the “1940 Act”). The Corporation was organized on April 27, 2004 as a Wisconsin corporation. The Corporation currently offers shares of common stock (“shares”) of the Cortina Small Cap Growth Fund and the Cortina Small Cap Value Fund (each a “Fund” and collectively, the “Funds”).
The Cortina Small Cap Growth Fund, which commenced operations with the sale of Institutional Class Shares on September 30, 2011, is a diversified portfolio with an investment objective to seek growth of capital. The Cortina Small Cap Value Fund, which commenced operations with the sale of Institutional Class Shares on September 30, 2011 and the sale of Investor Class Shares on April 30, 2014, is a diversified portfolio with an investment objective to seek long-term capital appreciation.
Shares of each Fund are designated as Institutional Shares or Investor Shares with an indefinite number of shares authorized at $0.01 par value. The Articles of Incorporation, as amended and restated, permit the Corporation’s Board of Directors (the “Board”) to create additional funds and share classes.
2. SIGNIFICANT ACCOUNTING POLICIES
The following is a summary of significant accounting policies followed by the Funds. These policies are in conformity with U.S. generally accepted accounting principles (“GAAP”). Each Fund is an investment company and accordingly follows the investment company accounting and reporting guidance of the Financial Accounting Standards Board (FASB) Accounting Standard Codification Topic 946 Financial Services – Investment Companies.
Use of Estimates — The accompanying financial statements were prepared in accordance with GAAP, which require the use of estimates and assumptions made by management. These may affect the reported amounts of assets and liabilities and disclosure of contingent assets and liabilities at the date of the financial statements and the reported amounts of increases and decreases in net assets from operations during the reporting period. Actual results could differ from those estimates.
Investment Valuation — Investment securities are valued at the last sale price at the close of the principal exchange on which they trade, except for securities listed on the NASDAQ Stock Market, Inc. (“NASDAQ”) exchange, which are valued at the NASDAQ official closing price. Unlisted securities or listed securities for which there were no sales during the day are valued at the closing bid price on such exchanges or over-the-counter markets. Investments for which market quotations are not readily available are valued at fair value as determined in good faith under consistently applied procedures approved by and under the general supervision of the Funds’ Board. Securities with maturities of sixty (60) days or less are valued at amortized cost as Level 1 or 2 within the hierarchy.
Investment Transactions — Investment security transactions are accounted for on trade date. Gains and losses on securities sold are determined on a specific identification basis.
Investment Income — Interest income is accrued and recorded on a daily basis including amortization of premiums, accretions of discounts and income earned from money market funds. Interest is not accrued on securities that are in default. Dividend income is recorded on the exdividend date. Withholding taxes on foreign dividends have been provided for in accordance with the Funds’ understanding of the applicable country’s tax rules and rates.
Fair Value Measurements — A three-tier hierarchy has been established to classify fair value measurements for disclosure purposes. Inputs refer broadly to the assumptions that market participants would use in pricing the asset or liability, including assumptions about risk. Inputs may be observable or unobservable. Observable inputs are inputs that reflect the assumptions market participants would use in pricing the asset or liability that are developed based on market data obtained from sources independent of the reporting entity. Unobservable inputs are inputs that reflect the reporting entity’s own assumptions about the assumptions market participants would use in pricing the asset or liability that are developed based on the best information available. In accordance with the authoritative guidance on fair value measurements and disclosure under GAAP, the Funds disclose fair value of their investments in a hierarchy that prioritizes the inputs to valuation techniques used to measure the fair value.
Cash — Each Fund considers its investment in a FDIC insured interest bearing savings account to be cash. Each Fund maintains cash balances, which, at times may exceed federally insured limits. Each Fund maintains these balances with a high quality financial institution.
| Annual Report | June 30, 2018 | 19 |
| Notes to Financial Statements |
June 30, 2018
Various inputs are used in determining the value of each Fund’s investments as of the reporting period end. The designated input levels are not necessarily an indication of the risk or liquidity associated with these investments. These inputs are categorized in the following hierarchy under applicable financial accounting standards:
| Level 1 — | Unadjusted quoted prices in active markets for identical, unrestricted assets or liabilities that the Funds have the ability to access at the measurement date; |
| Level 2 — | Quoted prices which are not active, quoted prices for similar assets or liabilities in active markets or inputs other than quoted prices that are observable (either directly or indirectly) for substantially the full term of the asset or liability; and |
| Level 3 — | Significant unobservable prices or inputs (including a Fund’s own assumptions in determining the fair value of investments) where there is little or no market activity for the asset or liability at the measurement date. |
The availability of observable inputs can vary from security to security and is affected by a wide variety of factors, including, for example, the type of security, whether the security is new and not yet established in the marketplace, the liquidity of markets, and other characteristics particular to the security. To the extent that valuation is based on models or inputs that are less observable or unobservable in the market, the determination of fair value requires more judgment. Accordingly, the degree of judgment exercised in determining fair value is greatest for instruments categorized in Level 3.
An investment level within the fair value hierarchy is based on the lowest level input, individually or in the aggregate, that is significant to fair value measurement. The valuation techniques used by the Funds to measure fair value during the year ended June 30, 2018 maximized the use of observable inputs and minimized the use of unobservable inputs.
The inputs or methodology used for valuing securities are not necessarily an indication of the risk or liquidity associated with investing in those securities. The following is a summary of the inputs used in valuing the Funds’ investments as of June 30, 2018:
Cortina Small Cap Growth Fund
| | | Valuation Inputs | | | | | |
| Investments in Securities at Value | | Level 1 | | | Level 2 | | | Level 3 | | | Total | |
| Common Stocks* | | $ | 31,928,116 | | | $ | – | | | $ | – | | | $ | 31,928,116 | |
| Total | | $ | 31,928,116 | | | $ | – | | | $ | – | | | $ | 31,928,116 | |
Cortina Small Cap Value Fund
| | | Valuation Inputs | | | | | |
| Investments in Securities at Value | | Level 1 | | | Level 2 | | | Level 3 | | | Total | |
| Common Stocks* | | $ | 29,293,157 | | | $ | – | | | $ | – | | | $ | 29,293,157 | |
| Total | | $ | 29,293,157 | | | $ | – | | | $ | – | | | $ | 29,293,157 | |
| * | See Schedule of Investments for sector classification. |
For the year ended June 30, 2018, there have been no significant changes to the Funds’ fair value methodologies. Additionally, there were no transfers into or out of Levels 1 and 2 during the year ended June 30, 2018. It is the Funds’ policy to recognize transfers at the end of the reporting period.
For the year ended June 30, 2018, the Funds did not have investments with significant unobservable inputs (Level 3) used in determining fair value.
Affiliated Companies — An affiliated company is a company that can have direct or indirect common ownership. The Funds did not hold any investments in affiliated companies as of and during the year ended June 30, 2018.
Expenses — The Funds bear expenses incurred specifically on each Fund’s respective behalf as well as a portion of general Corporation expenses, which may be allocated on the basis of relative net assets or the nature of the services performed relative to applicability to each Fund.
Expenses that are specific to a class of shares of the Funds are charged directly to the share class. The Funds’ realized and unrealized gains and losses, net investment income, and expenses other than class specific expenses, are allocated daily to each class in proportion to its average daily net assets.
| 20 | 1-855-612-3936 | www.cortinafunds.com |
| Notes to Financial Statements |
June 30, 2018
Distributions to Shareholders — Dividends from net investment income and distributions of net realized capital gains, if any, will be declared and paid at least annually. Income and capital gains distributions are determined in accordance with income tax regulations, which may differ from GAAP. Distributions to shareholders are recorded on the ex-dividend date.
Fees on Redemptions — The Funds will deduct a 2.00% redemption proceeds fee on Fund shares held 60 days or less. The redemption fee is not a fee to finance sales or sales promotion expenses, but is paid to the Funds to defray the costs of liquidating an investor and discouraging short-term trading of the Funds’ shares. No redemption fee will be imposed on redemptions initiated by the Funds.
Federal Income Taxes — As of and during the year ended June 30, 2018, the Funds did not have a liability for any unrecognized tax benefits. The Funds file U.S. federal, state, and local tax returns as required. The Funds’ tax returns are subject to examination by the relevant tax authorities until expiration of the applicable statute of limitations which is generally three years after the filing of the tax return for federal purposes and four years for most state returns. Tax returns for open years have incorporated no uncertain tax positions that require a provision for income taxes. The Funds intend to distribute to shareholders all taxable investment income and realized gains, and otherwise comply with Subchapter M of the Internal Revenue Code of 1986, as amended, applicable to regulated investment companies.
3. ADVISORY FEES, FUND ACCOUNTING FEES, ADMINISTRATION FEES, AND OTHER AGREEMENTS
Investment Adviser
Cortina Asset Management, LLC, is the Funds’ investment adviser (the “Adviser”). The Adviser is subject to the general supervision of the Board and is responsible for the overall management of the Funds’ business affairs. The Adviser invests the assets of the Funds based on the Funds’ investment objectives and policies. The Adviser is entitled to an investment advisory fee, computed daily and payable monthly, of 1.00% of the average daily net assets for each Fund.
The Adviser has contractually agreed to waive fees with respect to each of the Funds so that the net annual operating expenses (excluding taxes, leverage, interest, brokerage commissions, dividends or interest expenses on short positions, acquired fund fees and expenses, and extraordinary expenses) of the Funds’ shares will not exceed 1.10% and 1.35% of average daily net assets of each Fund’s Institutional and with respect to the Cortina Small Cap Value Fund Investor Class shares, respectively, through October 31, 2018. The Adviser may request a reimbursement from the Funds to recapture any reduced management fees or reimbursed Fund expenses within three years following the fee reduction or expense reimbursement, but only to the extent the Funds’ total annual fund operating expenses including any requested reimbursement amount, are less than the above limit at the time of the request. Any such reimbursement is subject to review by the Board.
As of June 30, 2018, reimbursements that may potentially be made by the Funds to the Adviser total $557,884 for the Cortina Small Cap Growth Fund and $819,347 for the Cortina Small Cap Value Fund and expire as follows:
| Cortina Small Cap Growth Fund | | | |
| June 30, 2019 | | $ | 166,642 | |
| June 30, 2020 | | | 197,268 | |
| June 30, 2021 | | | 193,974 | |
| | | $ | 557,884 | |
| Cortina Small Cap Value Fund | | | | |
| June 30, 2019 | | $ | 250,624 | |
| June 30, 2020 | | | 288,061 | |
| June 30, 2021 | | | 280,662 | |
| | | $ | 819,347 | |
Fund Accounting Fees and Expenses
ALPS Fund Services, Inc. (“ALPS” or the “Administrator”) provides administrative, fund accounting and other services to the Funds for a monthly administration fee based on the Funds’ average daily net assets under the Administration, Bookkeeping and Pricing Services Agreement (the “Administration Agreement”).
The Administrator is also reimbursed by the Funds for certain out-of-pocket expenses.
Transfer Agent
ALPS serves as transfer, dividend paying and shareholder servicing agent for the Funds (the “Transfer Agent”).
Compliance Services
ALPS provides services that assist the Corporation’s Chief Compliance Officer in monitoring and testing the policies and procedures of the Corporation in conjunction with requirements under Rule 38a-1 under the 1940 Act. ALPS is compensated under the Administration Agreement.
| Annual Report | June 30, 2018 | 21 |
| Notes to Financial Statements |
June 30, 2018
Distributor
The Funds have entered into a Distribution Agreement with ALPS Distributors, Inc. (the “Distributor”) to provide distribution services to the Funds. The Distributor serves as underwriter/distributor of shares of the Funds.
Distribution and Services Plan
The Small Cap Value Fund has adopted a Distribution and Services Plan in accordance with Rule 12b-1 (“Distribution Plan”) under the 1940 Act. The Distribution Plan provides that the Cortina Small Cap Value Fund may compensate or reimburse the Distributor for services rendered and expenses borne in connection with activities primarily intended to result in the sale of the Cortina Small Cap Value Fund’s shares. Sales charges may be paid to broker-dealers, banks and any other financial intermediary eligible to receive such fees for sales of Investor Shares of the Cortina Small Cap Value Fund and for services provided to shareholders.
The Cortina Small Cap Value Fund charges 12b-1 fees for Investor Shares. Pursuant to the Distribution Plan, the Cortina Small Cap Value Fund may annually pay the Distributor up to 0.25% of the average daily net assets of the Cortina Small Cap Value Fund’s Investor Shares. The expenses of the Distribution Plan are reflected in the Statements of Operations.
Certain Directors and Officers of the Funds are also officers of the Adviser.
4. PURCHASES AND SALES OF INVESTMENT SECURITIES
The aggregate cost of purchases and proceeds from sales of investment securities, excluding short-term securities, are shown below for the year ended June 30, 2018.
| Fund Name | | Purchases | | | Sales | |
| Cortina Small Cap Growth Fund | | $ | 25,805,752 | | | $ | 25,593,082 | |
| Cortina Small Cap Value Fund | | | 39,466,355 | | | | 54,274,615 | |
There were no purchases or sales of long-term U.S. Government Obligations for either Fund during the year ended June 30, 2018.
5. TAX BASIS INFORMATION
For the year ended June 30, 2018 the following reclassifications, which had no impact on results of operations or net assets, were primarily attributed to treatment of net investment losses. These were recorded to reflect tax character as follows:
| Fund | | Paid-in Capital | | | Accumulated Net Investment Income/(Loss) | | | Accumulated Net Realized Gain/(Loss) on Investments | |
| Cortina Small Cap Growth Fund | | $ | – | | | $ | 262,645 | | | $ | (262,645 | ) |
| Cortina Small Cap Value Fund | | | – | | | | 15,597 | | | | (15,597 | ) |
Income and long-term capital gain distributions are determined in accordance with Federal income tax regulations, which differ from GAAP, and, therefore, may differ significantly in amount or character from net investment income and realized gains for financial reporting purposes.
The tax character of distributions paid during the year ended June 30, 2018, were as follows:
| Fund | | Ordinary Income | | | Long-Term
Capital Gain | |
| Cortina Small Cap Growth Fund | | $ | 806,305 | | | $ | 3,383,054 | |
| Cortina Small Cap Value Fund | | | 89,347 | | | | 2,234,076 | |
| 22 | 1-855-612-3936 | www.cortinafunds.com |
| Notes to Financial Statements |
June 30, 2018
The tax character of distributions paid during the year ended June 30, 2017, were as follows:
| Fund | | Ordinary Income | | | Long-Term
Capital Gains | |
| Cortina Small Cap Growth Fund | | $ | – | | | $ | – | |
| Cortina Small Cap Value Fund | | | 42,823 | | | | 33,383 | |
As of June 30, 2018, the aggregate cost of investments, gross unrealized appreciation/(depreciation) and net unrealized appreciation/(depreciation) for Federal tax purposes was as follows:
| Fund | | Cost of Investments for Income Tax Purposes | | | Gross
Appreciation (excess of value over tax cost) | | | Gross Depreciation (excess of tax cost over value) | | | Net Unrealized Appreciation/(Depreciation) | |
| Cortina Small Cap Growth Fund | | $ | 23,466,711 | | | $ | 9,255,012 | | | $ | (793,607 | ) | | $ | 8,461,405 | |
| Cortina Small Cap Value Fund | | | 23,988,769 | | | | 5,561,453 | | | | (257,065 | ) | | | 5,304,388 | |
The difference between book basis and tax basis net unrealized appreciation is attributable to the deferral of losses from wash sales.
At June 30, 2018, components of distributable earnings were as follows:
| Fund | | Accumulated
Undistributed Net Realized Gain/(Loss) on Investments | | | Unrealized Appreciation/ (Depreciation) on Investments | | | Other Cumulative Effect of Timing Differences | | | Total Distributable
Earnings | |
| Cortina Small Cap Growth Fund | | $ | 3,366,396 | | | $ | 8,461,405 | | | $ | – | | | $ | 11,827,801 | |
| Cortina Small Cap Value Fund | | | 2,188,804 | | | | 5,304,388 | | | | – | | | | 7,493,192 | |
6. COMMITMENTS AND CONTINGENCIES
Under the Corporation’s organizational documents, its Officers and Directors are indemnified against certain liabilities arising out of the performance of their duties to the Funds. In addition, in the normal course of business, the Corporation entered into contracts with its service providers, on behalf of the Funds, and others that provide for general indemnifications. The Funds’ maximum exposure under these arrangements is unknown, as this would involve future claims that may be made against the Funds. The Funds expect risk of loss to be remote.
7. SEC REGULATIONS
On October 13, 2016, the SEC amended Regulation S-X, which required standardized, enhanced disclosure about derivatives in investment company financial statements, as well as other amendments. Effective August 1, 2017, the Funds adopted disclosure requirement changes for Regulation S-X and these changes are reflected throughout this report. The Funds’ adoption of those amendments, effective with the financial statements prepared as of June 30, 2018, had no effect on the Funds’ net assets or results of operations.
| Annual Report | June 30, 2018 | 23 |
| Report of Independent Registered
Public Accounting Firm |
June 30, 2018
To the Shareholders and Board of Directors of
Cortina Funds, Inc.
Opinion on the Financial Statements
We have audited the accompanying statements of assets and liabilities, including the schedules of investments, of Cortina Funds, Inc., comprising the Cortina Small Cap Growth Fund and the Cortina Small Cap Value Fund (the “Funds”), as of June 30, 2018, and the related statements of operations for the year then ended, the statements of changes in net assets for each of the two years in the period then ended, including the related notes, and the financial highlights for each of the periods presented in the period then ended (collectively referred to as the “financial statements”). In our opinion, the financial statements present fairly, in all material respects, the financial position of the each of the Funds as of June 30, 2018, the results of their operations for the year then ended, the changes in their net assets for each of the two years in the period then ended, and the financial highlights for each of the periods presented in the period then ended, in conformity with accounting principles generally accepted in the United States of America.
Basis for Opinion
These financial statements are the responsibility of the Funds’ management. Our responsibility is to express an opinion on the Funds’ financial statements based on our audits. We are a public accounting firm registered with the Public Company Accounting Oversight Board (United States) (“PCAOB”) and are required to be independent with respect to the Funds in accordance with the U.S. federal securities laws and the applicable rules and regulations of the Securities and Exchange Commission and the PCAOB.
We conducted our audits in accordance with the standards of the PCAOB. Those standards require that we plan and perform the audit to obtain reasonable assurance about whether the financial statements are free of material misstatement, whether due to error or fraud.
Our audits include performing procedures to assess the risks of material misstatement of the financial statements, whether due to error or fraud, and performing procedures that respond to those risks. Such procedures include examining, on a test basis, evidence regarding the amounts and disclosures in the financial statements and confirmation of securities owned as of June 30, 2018, by correspondence with the custodian and brokers or by other appropriate auditing procedures where replies from brokers or counterparties were not received. Our audits also included evaluating the accounting principles used and significant estimates made by management, as well as evaluating the overall presentation of the financial statements. We believe that our audits provide a reasonable basis for our opinion.
We have served as the Funds’ auditor since 2011.
COHEN & COMPANY, LTD.
Milwaukee, Wisconsin
August 24, 2018
| 24 | 1-855-612-3936 | www.cortinafunds.com |
| Additional Information |
June 30, 2018 (Unaudited)
1. PROXY VOTING POLICIES AND VOTING RECORD
A description of the policies and procedures that the Funds use to vote proxies relating to portfolio securities is available without charge upon request by calling toll-free 1-855-612-3936, or on the Securities and Exchange Commission’s (“SEC”) website at http://www.sec.gov. Information regarding how the Funds voted proxies relating to portfolio securities during the most recent fiscal year end June 30, 2018 is available without charge upon request by calling toll-free 1-855-612-3936, or on the SEC’s website at http://www.sec.gov.
2. QUARTERLY PORTFOLIO HOLDINGS
The Corporation files a complete listing of portfolio holdings for the Funds with the SEC as of the first and third quarters of each fiscal year on Form N-Q. The filings are available upon request by calling 1-855-612-3936. Furthermore, you may obtain a copy of the filing on the SEC’s website at http://www.sec.gov. The Funds’ Forms N-Q may also be reviewed and copied at the SEC’s Public Reference Room in Washington, D.C., and information on the operation of the Public Reference Room may be obtained by calling 1-800-SEC-0330.
3. TAX INFORMATION
Certain tax information is required to be provided to shareholders based upon each Fund’s income and distributions for the year ended June 30, 2018. The Funds designate the following as percentages of taxable ordinary income distributions, up to maximum amount allowable, for the calendar year ended December 31, 2017:
| Fund | Dividends Received Deduction Percentage | Qualified Dividend Income Percentage |
| Cortina Small Cap Growth Fund | 1.62% | 1.60% |
| Cortina Small Cap Value Fund | 100% | 100% |
In early 2018, if applicable, shareholders of record received this information for the distributions paid to them by the Funds during the calendar year 2017 via Form 1099. The Funds will notify shareholders in early 2019 of amounts paid to them by the Funds, if any, during the calendar year 2018.
Pursuant to Section 852(b)(3) of the Internal Revenue Code, Cortina Small Cap Growth Fund designated $3,383,054 and Cortina Small Cap Value Fund designated $2,234,076 as long-term capital gain dividends.
4. DIRECTORS’ CONSIDERATION AND APPROVAL OF ADVISORY AGREEMENT
On May 7, 2018 (the “Meeting”), the Board of Directors (the “Board”) met in person to consider, among other things, the annual renewal of the Investment Advisory Agreement (the “Advisory Agreement”) between the Cortina Funds, Inc. (the “Corporation”) and the Adviser with respect to the Cortina Small Cap Growth Fund and Cortina Small Cap Value Fund (the “Funds”) in accordance with Section 15(c) of the Investment Company Act of 1940, as amended (the “1940 Act”). The Board reviewed and discussed various information that had been provided prior to the Meeting, including the Investment Advisory Agreement, information provided by the Adviser in response to the request from the Board, including the Adviser’s Form ADV, financial information for the years ending 2016 and 2017, comparative information about the Funds’ performance for periods ended December 31, 2017 and March 31, 2018, management fees and expense ratios, financial intermediary arrangements and other pertinent information.
The Board also took into account information reviewed periodically throughout the year that was relevant to its consideration of the Investment Advisory Agreement, including performance, management fee and other expense information and discussions with the Funds’ portfolio managers. Based on its evaluation of this information, the Board, including a majority of the Independent Directors, approved the continuation of the Investment Advisory Agreement for an additional one-year period.
In considering the Advisory Agreement and reaching its conclusions, the Board reviewed and analyzed various factors that it determined were relevant, including the factors below. In deciding to approve the Advisory Agreement for each Fund, the Board did not identify any single factor as determinative but considered all factors together.
Nature, Extent and Quality of Services Provided to the Funds: The Board analyzed the nature, extent and quality of the services provided by the Adviser to the Funds. The Board reviewed and considered the Adviser’s significant role in establishing the Funds and the construction of their investment objectives, principal strategies, investment limitations and fee structures. The Board noted the Adviser’s commitment to the Funds, and the experience, credentials and portfolio management teams employed to manage the Funds’ investments. The Board further noted that the Adviser had approximately $2.3 billion of assets under discretionary management and that the Funds may provide an opportunity for smaller institutional and retail accounts to receive the same professional advice from the Adviser that it offers to its larger institutional clients. The Board also noted that the provision of investment advisory services to the Funds requires more effort than it does for separately managed accounts due to daily sales and redemption activity and additional regulatory and compliance requirements.
| Annual Report | June 30, 2018 | 25 |
| Additional Information |
June 30, 2018 (Unaudited)
The Board considered other services that the Adviser provides for the Funds in its capacity as their investment adviser, such as making some of its key personnel available to serve as officers of the Funds, selecting broker-dealers for execution of portfolio transactions, ensuring adherence to the Funds’ investment policies and restrictions, monitoring compliance and portfolio valuation and overseeing the Funds’ other service providers. The Board also considered that the Adviser has not experienced any significant legal, compliance or regulatory difficulties since the Funds were launched. The Board concluded that the nature, extent and quality of the services provided by the Adviser to the Funds were appropriate and that each Fund was likely to continue to benefit from services provided under the Advisory Agreement.
Investment Performance of the Adviser and the Funds: In considering the investment performance of each of the Funds, the Board reviewed the Funds’ performance information as of March 31, 2018 for various periods back to the inception date of the Funds (09/30/2011) in comparison to certain peer funds selected by the Adviser (the “Peer Funds”). The Board also reviewed performance information as of December 31, 2017 against various benchmark indices. The Board noted that for periods ended December 31, 2017, the Small Cap Growth Fund and the Adviser’s Small Cap Growth composite had outperformed the Russell 2000 Growth Index for the two-year period but lagged the Index for the one-year, three-year, five-year and since inception periods. The Board considered the effect of the market environment and the Adviser’s quarterly commentary and discussions of the reasons for the Fund’s outperformance for the two-year period and underperformance for the other periods. With respect to the Small Cap Value Fund, the Board noted that each share class of the Fund had outperformed the Russell 2000 Value Index for the one-year period ended December 31, 2017, underperformed the Index for the two-year, three-year and five-year periods ended December 31, 2017 and slightly underperformed the Index for the since inception period ended December 31, 2017. The Board noted that the Adviser’s Small Cap Value composite had exceeded the Index for the one-year period ended December 31, 2017, lagged the Index for the two-year, three-year and five-year periods, and slightly exceed the Index for the since inception period ended December 31, 2017. The Board considered the effect of the market environment and the Adviser’s quarterly commentary and discussions of the reasons for the Fund’s performance.
The Board also reviewed performance information for each Fund for the periods ended March 31, 2018, noting that the Small Cap Value Fund’s Institutional Class and Investor Class performance lagged the Peer median and Peer average for the one-year, three-year and five-year period. The Small Cap Growth Fund’s performance against its Peers for the period ended March 31, 2018 showed outperformance for the three-year period while lagging for the one-year and five-year periods.
The Board also considered the Adviser’s quarterly portfolio reviews explaining the Funds’ performance, the Adviser’s consistent and disciplined investment decision process and the investment strategies it employs for the Funds. After considering all of the information, the Board concluded that, although past performance is not a guarantee of future results, each Fund and its shareholders were likely to benefit from the continued management by the Adviser.
Costs of Services Provided and Profits Realized by the Adviser: The Board examined the fee and expense information for the Funds, including a comparison of such information to the Peer Funds using information provided by the Adviser from the Morningstar database. The Board noted that each Fund’s advisory fee was above the average and median in relation to the Peer Funds. The Board also reviewed and considered management fees charged by the Adviser to other investment advisory clients and found that the investment management fee paid by the Funds was identical to what the Adviser charges on the first $25 million of a separately managed account, unless otherwise negotiated. The Board recognized the extent of the significant additional services provided to each Fund that the Adviser did not provide to its other clients, such as certain administrative services, oversight of the Fund’s other service providers, regulatory compliance and various other services.
The Board also examined the total expense ratio of each Fund relative to the Peer Funds based on the Morningstar data provided by the Adviser. The Board noted that the Small Cap Growth Fund’s total expense ratio after fee waivers and expense reimbursements by the Adviser of 1.10% was greater than the median and the average compared to the Peer Funds. The Board noted that the Small Cap Value Fund’s Institutional class’ total expense ratio of 1.10% and the Investor Class’ total expense ratio of 1.36% after fee waivers and expense reimbursements by the Adviser pursuant to the Adviser’s expense cap agreement were less than the Peer Funds’ median and average.
The Board noted that given the size of the Funds, the Adviser continued to waive fees. While the Funds were slightly profitable to the Adviser, the Board noted that the Adviser’s profitability analysis did not include any allocation of direct or indirect expenses associated with the Adviser’s management of the Funds. The Independent Directors reviewed and considered the general financial condition of the Adviser and determined it to be sound. The Board also reviewed information regarding revenue sharing payments, noting that any payments by the Adviser to third-party platforms were made from the Adviser’s reasonable profits associated with its overall advisory business. In light of all of the information that it received and considered, the Board concluded that the management fee and total expense ratio of each Fund were reasonable.
Economies of Scale and Fee Levels Reflecting Those Economies: The Board noted that the Funds’ advisory fee structure does not contain any breakpoint reductions as the Funds grow in size. However, the Board recognized that the Adviser has been waiving fees since each Fund’s inception. The Board also considered the Adviser’s verbal representation that it would consider evaluating advisory fee breakpoints in the future.
| 26 | 1-855-612-3936 | www.cortinafunds.com |
| Additional Information |
June 30, 2018 (Unaudited)
The Board concluded that the current fee structure of each Fund was reasonable and that breakpoint reductions may be considered in the future depending on Fund asset levels.
Benefits Derived from the Relationship with the Funds: The Board noted that the Adviser derives ancillary benefits from its association with the Funds in the form of research products and services received from unaffiliated broker dealers who execute portfolio trades for the Funds. However, the Board determined such products and services have been used for legitimate purposes relating to the Funds by providing assistance in the investment decision-making process. The Board concluded that the other benefits realized by the Adviser from its relationship with the Funds were appropriate.
Based on its evaluation of the above factors, as well as other factors relevant to their consideration of the Advisory Agreement, the Board, including all of the Independent Directors, concluded that continuation of the Advisory Agreement was in the best interest of each Fund and its shareholders.
| Annual Report | June 30, 2018 | 27 |
| Board of Directors and Officers |
June 30, 2018
Overall responsibility for management of the Funds rests with the Board of Directors (the “Directors”). The Directors serve during the lifetime of the Corporation until its termination, or until death, resignation, retirement or removal. The Directors, in turn, elect the officers of the Funds to actively supervise the day-to-day operations. The officers have been elected for an annual term. The following are the Directors and executive officers of the Funds:
Independent Directors
| Name and Age | Position(s)
Held with
the Funds | Length of Time
Served | Principal Occupation(s)
During Past 5 Years | Number of Funds
in Fund Complex
Overseen by
Director | Other Directorships
Held by Director |
Mark J. Giese,
47 | Independent Director | Since Inception | President, Riverwood Business Consulting, LLC, a business and management firm (December 2009-present); Chief Financial Officer, Datatrac Corporation, a financial research firm (January 2009-December 2009); Vice President, Nicholas Company, Inc., an investment management firm (June 1994-January 2009); Vice President, Nicholas Fund, Inc., Nicholas II, Inc., Nicholas Limited Edition, Inc. and Nicholas Equity Income Fund, Inc., each a registered investment company (June 1994-January 2009); Senior Vice President, Nicholas Family of Funds, Inc., a registered investment company (June 1994-January 2009) | 2 | None |
John T. Murphy,
54 | Independent Director | Since Inception | President, Technical Equipment Sales Co. (October 2016-present); Vice President, Morris Group, Inc., a machine tool distributor (October 2014-September 2016); President and Founding Partner, Morris Midwest, LLC, a machine tool distributor (May 2006-September 2014) | 2 | None |
| Interested Director | | | | |
| Jennifer L. Hanson, 46* | Chairman, President and Interested Director | Since February 2018 | Senior Equity Analyst, Cortina Asset Management, LLC (2004-present) | 2 | None |
| Officers | | | | | |
Eric Conner,
33 | Treasurer and Principal Accounting Officer | Since November 2013 | Business and Operations Analyst, Cortina Asset Management, LLC (2012-present); Portfolio Finance Analyst, Stark Investments (2011-2012); Senior Corporate Accountant, Stark Investments (2008-2011) |
Lori K. Hoch,
47 | Secretary, Chief Compliance Officer and Anti-Money Laundering Compliance Officer | Since Inception | Principal and Chief Operating Officer and Chief Compliance Officer, Cortina Asset Management, LLC (2004-present) |
| * | Ms. Hanson is considered an “interested person” of Cortina as defined under the 1940 Act by virtue of her position with the Adviser. |
The business address of the officers and directors affiliated with the Adviser is 825 North Jefferson Street, Suite 400, Milwaukee, Wisconsin 53202. The address for each Independent Director is c/o Cortina Funds, 825 North Jefferson Street, Suite 400, Milwaukee, Wisconsin 53202.
Additional information about members of the Board of Directors and Officers is available in the Statement of Additional Information (SAI). To obtain a free copy of the SAI, please call 1-855-612-3936.
| 28 | 1-855-612-3936 | www.cortinafunds.com |

Material must be accompanied or preceded by the prospectus.
The Cortina Funds are distributed by ALPS Distributors, Inc.
Item 2. Code of Ethics.
| (a) | The Registrant, as of the end of the period covered by this report, has adopted a code of ethics that applies to the Registrant’s principal executive officer, principal financial officer, principal accounting officer or controller or any persons performing similar functions on behalf of the Registrant. |
| (c) | During the period covered by this report, no amendments to the provisions of the code of ethics adopted in paragraph (a) of this Item were made. |
| (d) | During the period covered by this report, no implicit or explicit waivers to the provisions of the code of ethics adopted in paragraph (a) of this Item were granted. |
| (f) | A copy of the Registrant’s Code of Ethics is filed as an exhibit hereto. The Registrant undertakes to provide a copy of the Code of Ethics to any person, without charge, upon written request to the Registrant at its address at 825 N. Jefferson St., Suite 400, Milwaukee, WI 53202. |
Item 3. Audit Committee Financial Expert.
The Board of Directors of the Registrant has determined that the Registrant has at least one Audit Committee Financial Expert serving on its audit committee. The Registrant’s Audit Committee Financial Expert is Mr. John F. Murphy, Independent Trustee and Audit Committee Chair.
Item 4. Principal Accountant Fees and Services.
| (a) | Audit Fees: For the Registrant’s fiscal years ended June 30, 2018 and June 30, 2017, the aggregate fees billed for professional services rendered by the principal accountant for the audit of the Registrant’s annual financial statements or services that are normally provided by the accountant in connection with statutory or regulatory filings or engagements were $26,000 and $25,500, respectively. |
| (b) | Audit-Related Fees: For the Registrant’s fiscal years ended June 30, 2018 and June 30, 2017, the aggregate fees billed for assurance and related services by the principal accountant that are reasonably related to the performance of the audit of the Registrant’s financial statements and are not reported under paragraph (a) of this Item were $0 and $0, respectively. |
| (c) | Tax Fees: For the Registrant’s fiscal years ended June 30, 2018 and June 30, 2017, the aggregate fees billed for professional services rendered by the principal accountant for tax compliance, tax advice and tax planning were $6,000 and $5,000, respectively. The fiscal year 2018 and 2017 tax fees were for services for review of the dividend calculation, excise tax preparation and federal tax return preparation. |
| (d) | All Other Fees: For the Registrant’s fiscal years ended June 30, 2018 and June 30, 2017, the aggregate fees billed for products and services provided by the principal accountant, other than the services reported in paragraphs (a) through (c) of this Item, were $0 and $0, respectively. |
| (e)(1) | Audit Committee Pre-Approval Policies and Procedures: All services to be performed by the Registrant’s principal accountant must be pre-approved by the Registrant’s audit committee. |
| (e)(2) | No services described in paragraphs (b) through (d) of this Item were approved by the Registrant’s audit committee pursuant to paragraph (c)(7)(i)(C) of Rule 2-01 of Regulation S-X. |
| (g) | No non-audit fees were billed by the Registrant’s principal accountant for services rendered to the Registrant’s investment adviser. |
Item 5. Audit Committee of Listed Registrants.
Not applicable to Registrant.
Item 6. Investments.
| (a) | Schedule of Investments is included as part of the Reports to Stockholders filed under Item 1 of this Form N-CSR. |
Item 7. Disclosure of Proxy Voting Policies and Procedures for Closed-End Management Investment Companies.
Not applicable to the Registrant.
Item 8. Portfolio Managers of Closed-End Management Investment Companies.
Not applicable to the Registrant.
Item 9. Purchases of Equity Securities by Closed-End Management Investment Company and Affiliated Purchasers.
Not applicable to the Registrant.
Item 10. Submission of Matters to a Vote of Security Holders.
The Registrant has not adopted procedures by which shareholders may recommend nominees to the Registrant’s Board of Directors.
Item 11. Controls and Procedures.
| (a) | The Registrant’s principal executive officer and principal financial officer have concluded that the Registrant’s disclosure controls and procedures (as defined in Rule 30a-3(c) under the Investment Company Act of 1940, as amended) are effective based on their evaluation of these controls and procedures as of a date within 90 days of the filing date of this report. |
| (b) | There was no change in the Registrant’s internal control over financial reporting (as defined in Rule 30a-3(d) under the Investment Company Act of 1940, as amended) during the second fiscal quarter covered by this report that has materially affected, or is reasonably likely to materially affect, the Registrant’s internal control over financial reporting. |
Item 12. Disclosure of Securities Lending Activities for Closed-End Management Investment Companies.
Not applicable.
Item 13. Exhibits.
| (a)(1) | Not applicable to this report. |
| (a)(2) | The certifications required by Rule 30a-2(a) of the Investment Company Act of 1940, as amended, and Section 302 of the Sarbanes-Oxley Act of 2002 are attached hereto as Ex.99.Cert. |
| (b) | A certification of the registrant’s principal executive officer and principal financial officer, as required by Rule 30a-2(b) under the Investment Company Act of 1940, as amended, is attached as Ex.99.906.Cert. |
SIGNATURES
Pursuant to the requirements of the Securities Exchange Act of 1934 and the Investment Company Act of 1940, the registrant has duly caused this report to be signed on its behalf by the undersigned, thereunto duly authorized.
| | Cortina Funds, Inc. | |
| | | | |
| | By: | /s/ Jennifer Hanson | |
| | | Jennifer Hanson, President | |
| | | (Principal Executive Officer) | |
| | | | |
| | Date: | September 5, 2018 | |
Pursuant to the requirements of the Securities Exchange Act of 1934 and the Investment Company Act of 1940, this report has been signed below by the following persons on behalf of the registrant and in the capacities and on the dates indicated.
| | By: | /s/ Eric Conner | |
| | | Eric Conner, Treasurer and Principal Accounting Officer | |
| | | (Principal Financial Officer) | |
| | | | |
| | Date: | September 5, 2018 | |
5