Washington, D.C. 20549
825 N. Jefferson St., Suite 400
Item 1. Reports to Stockholders.
TABLE OF CONTENTS
| Cortina Small Cap Growth Fund | |
| Shareholder Letter | 1 |
| Portfolio Information | 3 |
| Cortina Small Cap Value Fund | |
| Shareholder Letter | 4 |
| Portfolio Information | 6 |
| Disclosure of Fund Expenses | 7 |
| Schedule of Investments | |
| Cortina Small Cap Growth Fund | 8 |
| Cortina Small Cap Value Fund | 11 |
| Statements of Assets and Liabilities | 13 |
| Statements of Operations | 14 |
| Statements of Changes in Net Assets | 15 |
| Financial Highlights | |
| Cortina Small Cap Growth Fund | 16 |
| Cortina Small Cap Value Fund - Institutional | 17 |
| Cortina Small Cap Value Fund - Investor | 18 |
| Notes to Financial Statements | 19 |
| Report of Independent Registered Public Accounting Firm | 25 |
| Additional Information | 26 |
| Board of Directors and Officers | 29 |
| Cortina Small Cap Growth Fund | June 30, 2017 (Unaudited) |
DEAR FELLOW SHAREHOLDERS:
Fiscal 2017 was another successful period for the Cortina Small Cap Growth Fund. Similar to fiscal 2016, the Fund outperformed both the Russell 2000 Growth benchmark index over the past three, six and twelve month periods. Unlike fiscal 2016, outperformance was defined as “making more” than the index as opposed to “losing less” than the index, making this a constructive period from both an absolute and relative
return standpoint.
The past six months have been a period of almost unprecedented calm on the surface of equity markets. The large cap S&P 500 index has yet to fall more than 3% from its highs thus far in 2017. Should that continue, it would be only the second time in thirty years that it didn’t pull back at least 5% at some point in the year. Volatility has been similarly muted in small caps. While the overall market has steadily grinded higher, sector and industry leadership has transitioned from month to month and quarter to quarter. Over the past six months, our portfolio has been on the right side of some sectors and industries, and the wrong side of others, but our overall security selection led to the slight outperformance. The same can be said for the fiscal year as a whole, though the outperformance was much more meaningful.
Starting with the good, we have been consistently overweight in the Technology sector in both prior periods and for the entire fiscal year. While it hasn’t been the best performing sector, it has steadily outperformed the benchmark as a whole, and our Technology stocks have steadily outperformed those in the benchmark. This has been driven by a combination of idiosyncratic ideas, as well as a preference for internet, software and semiconductor holdings while eschewing to a large degree the more commoditized hardware companies.
Our Health Care holdings have been our largest source of positive contribution, returning 51% for the full fiscal year and 21% over the past six months. It should be noted that the 21% calendar year-to-date return trailed the Health Care sector return of 24% in the Russell 2000 Growth benchmark. This was in large part due to our relatively slight exposure to the biotechnology industry which was up over 33%. While we continue to avoid clinical stage biotechnology companies, we have initiated a new investment theme we’re terming The Biotech REVENUE-tion. Contained within this theme are fully-funded businesses with vibrant revenue growth and importantly highly diversified value drivers. In addition to product sales tied to the manufacturing of biotherapeutics and pharmaceuticals, some holdings within the theme stand to earn milestone payments and royalties on the sales of other companies’ drugs without having to fund and assume the development risk. We have also become more active in investing in commercial stage pharmaceutical companies. This is a newer initiative for us, and it is being done on the heels of more than two years of underperformance for the industry. We believe past abuses of monopolistic pricing power and opaque reimbursement practices have resulted in a more disciplined industry that is focused on the creation of value through innovation, as opposed to the extraction of value through manipulation of the system.
Financials have also been a bright spot for the Fund over the past six and twelve month periods. While it is a small sector in the index, we have been consistently overweight, and our holdings have collectively performed well. Conversely, the Energy sector has been a meaningful detractor to Fund performance. While our exposure in the first half of the fiscal year was a positive, we maintained our positioning throughout the past six months and have paid a heavy price for it. Within the benchmark, the Energy sector has fallen 32%, and our holdings have fallen approximately 36% on average. To make matters worse, we have had an average sector weight of 5.4% versus just 1.2% for the benchmark.
OUTLOOK & PORTFOLIO POSITIONING
Predictions of stock market performance into the second half of the year are, at present, quite difficult. (Thankfully, short-term market calls are not a part of our investment process.) Most economic indicators reflect strength and growth, and as mentioned above, earnings estimates are set at what appears an achievable level. Frankly, the market and the economy are in our eyes currently healthy. Via policy, the Federal Reserve (Fed) is casually working on interest rates, having performed two increases to the Fed Funds rate this year following last December’s raise, in spite of very little evidence of inflation. More subtly, rhetoric out of a number of central banks including the Fed is increasingly hawkish, and yet the market climbs. Global rates are on the rise so the Fed may feel some pressure to keep interest rates in check as to prevent significant discrepancies in currencies. However, the market is not complying as the dollar is starting to fall relative to other currencies, particularly the Euro. This could help the U.S. exporters which may explain the recent strength in industrial stocks (as well as a turn up in fixed business investment). The strengthening Euro, in particular, may also be a byproduct of a stronger European economy, one year removed from the Brexit vote and now several years removed from discussions of austerity, populist demonstrations, bailouts and widespread concern over the downfall of the European Union. Could the election of Emmanuel Macron by the French suggest the citizens are interested in a stronger, more unified Europe with a brighter economic future? Should the global investment spotlight move to international markets, it is customary to expect global multinationals to exhibit more sales momentum than their domestic counterparts.
Of course, steady economic and corporate fundamentals have to be balanced against current market valuation. Today’s trading values cannot be described as cheap although valuations are not in extreme territories. In fact, it seems as if market participants and pundits alike are comfortable with these levels which basically have remained consistent for several years now. The forward earnings multiple of the S&P 500 has been pacing between 15-16 times since 2014. On its surface, this would suggest that the current valuation of 17 times is lofty, but not excessively so. Despite
| Annual Report | June 30, 2017 | 1 |
| Cortina Small Cap Growth Fund | June 30, 2017 (Unaudited) |
the stock market not being inexpensive, one prescription for the market going higher has to do with a rotation within it. While not classically narrow, without a doubt the market has been fueled by the strong performance of a number of bellwether technology stocks, including Amazon, Apple, Google and Facebook. The potential for the market to broaden is there, and it just might come from the Financials sector on the back of a more constructive interest rate environment and curve. In addition, Energy stocks have been such laggards the last six months that a bottoming there would also help the market broaden. What might be the biggest risk to valuation levels is a dramatic move in inflation expectations, which at present appears to be a low-probability event.
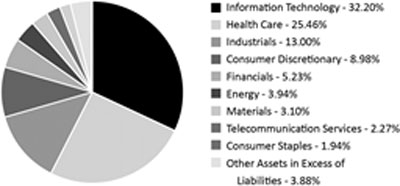
At present, overweight sectors include Technology, Energy, Health Care and Telecom Services. Our exposure to Industrials is underweight, and the level of underweight got slightly larger after the rebalance of the Russell indices. Consumer Discretionary is also sizably underweight. It should be noted that behind this allocation there is no commentary on the health of the consumer, rather due to the extreme disruption Amazon is having in that part of the economy, it is difficult to find companies with durable competitive positions and still-interesting valuations. We are slightly underexposed to Materials and Financials and have no positions in the Real Estate or Utility sectors. Finally, while the Strategy’s weighted average market cap is higher than in years past at $1.4 billion, it remains significantly smaller than the Russell 2000 Growth Index.
Investing involves risks, including loss of principal.
| 2 | 1-855-612-3936 | www.cortinafunds.com |
| Cortina Small Cap Growth Fund | June 30, 2017 (Unaudited) |
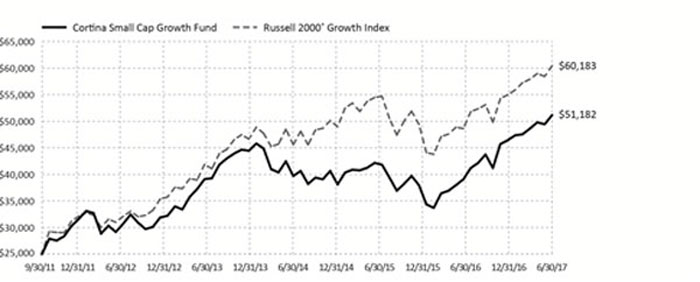
Growth of $25,000 Investment (Unaudited)
For the period from September 30, 2011 (Inception) to June 30, 2017.
This graph assumes an initial $25,000 investment at September 30, 2011 (Inception Date). The Cortina Small Cap Growth Fund (the “Fund”) will deduct a 2.00% redemption proceeds fee on Fund shares held 60 days or less. This graph depicts the performance of the Fund versus the Russell 2000® Growth Index. It is important to note the Fund is a professionally managed mutual fund while the index is not available for investment and is unmanaged. The comparison is shown for illustrative purposes only.
This chart does not reflect the deduction of taxes that a shareholder would pay on Fund distributions or the redemption of Fund shares.
Performance Returns for the period ended June 30, 2017
| | 6 Months | 1 Year | 3 Years | 5 Years | Since Inception* | Gross
Expense Ratio** |
| Cortina Small Cap Growth Fund | 10.19% | 30.95% | 6.41% | 11.02% | 13.27% | 1.54% |
Russell 2000® Growth Index | 9.97% | 24.40% | 7.64% | 13.98% | 16.51% | |
| * | The Fund’s inception date is September 30, 2011. |
| ** | Cortina Asset Management, LLC (the “Adviser”) has contractually agreed to waive management fees and/or reimburse the Fund’s operating expenses in order to limit the Fund’s total annual fund operating expenses (excluding taxes, leverage, interest, brokerage commissions, dividends or interest expenses on short positions, acquired fund fees and expenses and extraordinary expenses) to 1.10% of average daily net assets of the Fund. The agreement will continue in effect at least through October 31, 2017, subject thereafter to annual re-approval of the agreement by the Fund's Board of Directors. The current expense ratio for the Fund can be located in the Financial Highlights contained within this shareholder report. |
Past performance does not guarantee future results. The performance data quoted represents past performance and current returns may be lower or higher. Total return figures include change in share price, reinvestment of dividends and capital gains. The investment return and principal value will fluctuate so that an investor's shares, when redeemed may be worth more or less than their original cost. To obtain performance information current to the most recent month end, call 1-855-612-3936.
Russell 2000® Growth Index measures the performance of the small-cap growth segment of the U.S. equity universe. It includes those Russell 2000 companies with higher price-to-value ratios and higher forecasted growth values. All indices are unmanaged. It is not possible to invest directly in an index.
S&P 500 – The S&P 500 Index is the Standard & Poor’s composite index of 500 stocks, a widely recognized, unmanaged index of common stock prices.
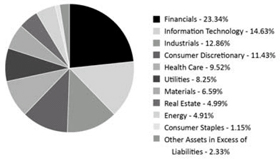
Sector Allocations***
| *** | Percentages are based on Net Assets as of June 30, 2017. Holdings are subject to change. |
| Annual Report | June 30, 2017 | 3 |
Cortina Small Cap Value Fund | June 30, 2017 (Unaudited) |
DEAR FELLOW SHAREHOLDERS:
The last twelve months have seen a solid return to positive results for the Cortina Small Cap Value Fund with a double-digit gain that slightly trailed the benchmark Russell 2000 Value Index. Rising equity markets occur for many reasons, but amidst the record highs for equity indexes, the volatility last year, and the seeming victory of the robots in the investing world, it is worth stepping back and looking at the big picture.
Sector allocation was the key contributor, particularly with the strategy's long-time overweight towards technology, which was the best performing sector in the index, and the portfolio's consistent underweight towards real estate, a sector that dramatically underperformed the benchmark. Selection was positive across most sectors, with the notable exception of Financials due to the explosive jump in that sector post-election that took many unremarkable companies to remarkable heights. The financials move was tied to excitement around rising interest rates, yet the critical 10-year Treasury yield peaked in March of 2017; as rate normalization euphoria faded, so has the relative performance of many of those companies since that point. Selection was positive in Consumer Discretionary, Energy, and Health Care. In particular, one long-term Health Care holding dramatically restructured its business to powerful effect, and in Consumer Discretionary and Industrials, the portfolio benefitted from strong rebounds in new and long-term holdings from the sell-off in early 2016. Utilities also benefitted the relative performance. The underweight towards the sector, which underperformed the Index was beneficial, as was selection where one of the portfolio's largest holdings, a non-traditional utility, posted strong absolute gains.
Across the style options, the equity class that has performed the best in recent years would probably surprise most people. The answer: all of them. Through June 30, 2017, the Russell 2000 Growth Index beat the Russell 2000 Value Index by approximately 9 percentage points. Yet on a one, three, and five year basis, the Russell 2000 Value, Core, and Growth returns are virtually identical to each other, and over a five year basis, all are close to the S&P 500’s return. This confluence reflects an economy that has been unable to forcefully assert itself one way or another and appears trapped in a steady but slow growth band.
“…the American response to economic adversity was to seek to restore comfort more than dynamism…”
Tyler Cowen, The Complacent Class, New York, St. Martin’s Press, 2017
Economist Tyler Cowen’s recent book, The Complacent Class, highlights the decline of risk-taking and that many perceptions about our nation are misplaced. Start-ups are declining, job movement is low, and while we read about the risk-takers, conformity is rising which may explain our current malaise – and the economic doldrums. We meet with strong firms with inclinations to invest more, but hesitate due to fear of failure or activist pressures for cash payouts. Weak firms continue to make mistakes, but access to capital beyond what previous cycles would allow enables leniency and lessens the need for hard decisions.
We believe this stasis is nearing its end. While for the moment the economy appears unlikely to lurch up or down, monetary policy is changing. Interest rates are increasing, quantitative easing is ending, and it may be surprisingly inflationary. If previous monetary tightenings were taking away the punch bowl, this one will be more akin to slowly draining the kitchen sink. We will find some shocks, but these will be cleansed and life moves on. Today the economy is on a positive trajectory, but at such a shallow slope it feels like a decline; early optimism about the new administration's economic policies is fading as reality (and investigations) set in; and the markets for Value equities are again stuck in a range that reflects an indeterminate near-term outlook.
We view this inert environment as short-lived as Federal Reserve tightening into a slow economy is a process that ultimately cuts the weakest players down. The political situation at the federal level is unhelpful and may depress activity on the margins, but we view this as a topic that gets more attention from investors than deserved. We expect a more definitive trend from the economy and markets later this year.
Many new businesses are addressing legitimate market needs and commercial opportunities, but are only currently viable because of an unusual subsidization from a surplus of investable capital. Monetary tightening could reverse that trend. This is not to say an epochal crash is coming, but it is to say that patience has its limits and all investment cycles come to an end when the returns fail to materialize.
Underappreciated in our view is that with a tightening bias at the Fed, this subsidized value destruction is probably nearing the end of its cycle. Unconventional monetary policy has enabled many commercial and financial enterprises undeservedly long lives that will soon end. Quantitative easing (QE) pushed an abundance of capital into the world, some of which found its way into funding new business ventures of varying success. In an older economy that was more commodity-based, QE may have resulted in massive inflation. Today QE may enable technological deflation. The perversity of unintended consequences is that a tighter monetary policy today could lead to inflation as irrational competitors are bankrupted. In a period of easy money, it is forgotten that eventually all firms must earn a return or their capital will dry up.
Just as investors chased the new titans of industry in both public and private markets, they also chase the newest products, be they passive indexation or products that seemingly assemble the best investment characteristics with the promise of low volatility. If a certain percentage of
| 4 | 1-855-612-3936 | www.cortinafunds.com |
Cortina Small Cap Value Fund | June 30, 2017 (Unaudited) |
new businesses are enabled by low-cost capital, a certain percentage of investment products probably are too. When the economy begins to take a more definitive trend, a development we expect in the next few quarters, the winners and losers will become more pronounced, the dispersion of returns will increase, and percentage points of absolute risk and return will begin to matter more than basis points of cost.
Today there is complacency to risks that are in some cases obvious. Capital markets will recognize that the financialization of volatility measures, such as the VIX index, have created artificial faith in downside protection. They are not so generous that investors can earn above average, or even average, returns with low volatility in perpetuity. That is fake news.
OUTLOOK & PORTFOLIO POSITIONING
Our broad view is for a stable economy punctuated by a few interesting moments. First, the economy should remain much the same with little acceleration or deceleration in trend for the very near-term. Second, the political environment will degrade, perhaps substantially, to the point that a US default, hopefully unlikely, will again be on the table as debt ceiling negotiations approach. Third, investment capital will become scarcer for developing companies and that will both dampen some growth at the same time it rescues able operators from improperly subsidized competitors. While the market as a whole may appear fairly benign, we expect some specific and narrow areas to post some very exciting divergences as we approach year-end.
The portfolio is positioned accordingly. Health Care and Technology remain overweights due to the more appealing growth trajectories and generally healthy cash flows and balance sheets. Financials, specifically banks, remain underweighted, but with the recent decline in most bank equities we are selectively adding to our exposure. Industrials are roughly evenly-weighted versus the benchmark, but with the unique attribute that many of our industrial companies are closer to growth companies than value companies; in many cases we see far more value in growing companies than in shrinking cheap ones. Energy, Utilities, and Materials are all close to evenly-weighted. Consumer Discretionary is becoming more interesting, with a few more names and now a very slight overweight versus underweight in previous reports. Real Estate Investment Trusts (REITs) remain an important part of the portfolio and the benchmark, but remain underweight as many appear both expensive on a valuation basis and vulnerable on a fundamental basis given industry trends.
We are hoping for a quiet summer, but we expect this hushed market to begin delivering a stronger message later this year as tightening monetary policy domestically and overseas begins to impact capital markets and the economy.
Investing involves risks, including loss of principal.
Quantitative Easing: Generally defined as an unconventional monetary policy in which a central bank purchases government securities or other securities from the market in order to lower interest rates and increase the money supply.
REIT – A real estate investment trust (REIT) is a company that owns, and in most cases operates, income-producing real estate.
VIX – The VIX Index is a measure of the implied volatility of S&P 500 Index options, calculated and published by the Chicago Board Options Exchange.
| Annual Report | June 30, 2017 | 5 |
Cortina Small Cap Value Fund | June 30, 2017 (Unaudited) |
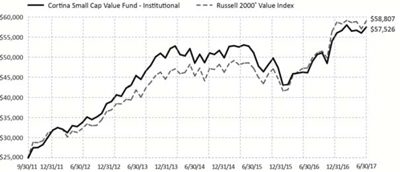
Growth of $25,000 Investment (Unaudited)
For the period from September 30, 2011 (Inception) to June 30, 2017.
This graph assumes an initial $25,000 investment at September 30, 2011 (Inception Date). The Cortina Small Cap Value Fund Institutional share class (the “Fund”) will deduct a 2.00% redemption proceeds fee on Fund shares held 60 days or less. This graph depicts the performance of the Fund versus the Russell 2000® Value Index. It is important to note the Fund is a professionally managed mutual fund, while the index is not available for investment and is unmanaged. The comparison is shown for illustrative purposes only. Performance will vary from class to class based on differences in class-specific expenses.
This chart does not reflect the deduction of taxes that a shareholder would pay on Fund distributions or the redemption of Fund shares.
Performance Returns for the period ended June 30, 2017
| | 6 Months | 1 Year | 3 Years* | 5 Years* | Since Inception* | Gross Expense Ratio** |
| Cortina Small Cap Value Fund - Institutional | 2.60% | 24.65% | 3.34% | 11.76% | 15.59% | 1.51% |
| Cortina Small Cap Value Fund - Investor | 2.51% | 24.41% | 3.08% | 11.49% | 15.32% | 1.76% |
Russell 2000® Value Index | 0.54% | 24.86% | 7.02% | 13.39% | 16.04%*** | |
| * | The Fund’s Institutional shares inception date is September 30, 2011, Investor shares inception date is April 30, 2014. The performance shown for Investor shares for periods pre-dating the commencement of operations of that class reflects the performance of the Fund’s Institutional shares, the initial share class, calculated using the fees and expenses of Investor shares. If Investor shares of the Fund had been available during periods prior to April 30, 2014, the performance shown may have been different. |
| ** | Cortina Asset Management, LLC (the ”Adviser”) has contractually agreed to waive management fees and/or reimburse the Fund’s operating expenses in order to limit the Fund’s total annual fund operating expenses (excluding taxes, leverage, interest, brokerage commissions, dividends or interest expenses on short positions, acquired fund fees and expenses, and extraordinary expenses) to 1.10% and 1.35% of average daily net assets of the Fund’s Institutional and Investor Class shares, respectively. The agreement will continue in effect at least through October 31, 2017, subject thereafter to annual re-approval of the agreement by the Fund’s Board of Directors. The current expense ratio for the Fund can be located in the Financial Highlights contained within this shareholder report. |
| *** | Represents the period from September 30, 2011 (date of original public offering of the Institutional shares) through June 30, 2017. |
Past performance does not guarantee future results. The performance data quoted represents past performance and current returns may be lower or higher. Total return figures include change in share price, reinvestment of dividends and capital gains. The investment return and principal value will fluctuate so that an investor's shares, when redeemed may be worth more or less than their original cost. To obtain performance information current to the most recent month end, call 1-855-612-3936.
Russell 2000® Value Index measures the performance of those Russell 2000 companies with lower price-to-book ratios and lower forecasted growth values. All indices are unmanaged. It is not possible to invest directly in an index.
S&P 500 – The S&P 500 Index is the Standard & Poor’s composite index of 500 stocks, a widely recognized, unmanaged index of common stock prices.
Sector Allocations****
| **** | Percentages are based on Net Assets as of June 30, 2017. Holdings are subject to change. |
| 6 | 1-855-612-3936 | www.cortinafunds.com |
| Disclosure of Fund Expenses |
| June 30, 2017 (Unaudited) |
As a shareholder of the Fund(s), you incur ongoing costs, including management fees and other Fund expenses. This example is intended to help you understand your ongoing costs (in dollars) of investing in each Fund and to compare these costs with the ongoing costs of investing in other mutual funds. The example is based on an investment of $1,000 invested at the beginning of the period and held for the entire period, as indicated below.
Actual Expenses – The first line of the table below provides information about the actual account values and actual expenses. You may use the information in this line, together with the amount you invested, to estimate the expenses that you paid over the period. Simply divide your account value by $1,000 (for example, an $8,600 account value divided by $1,000 = 8.6) then multiply the result by the number in the first line under the heading entitled “Expenses Paid During Period” to estimate the expenses you paid on your account during this period.
Hypothetical Example for Comparison Purposes – The second line of the table below provides information about hypothetical account values and hypothetical expenses based on each Fund’s actual expense ratio and an assumed annual rate of return of 5% before expenses, which is not each Fund’s actual return. The hypothetical account values and expenses may not be used to estimate the actual ending account balance or expenses you paid for the period. You may use this information to compare the ongoing costs of investing in each Fund and other funds by comparing these 5% hypothetical examples with the 5% hypothetical examples that appear in the shareholder reports of other funds.
Please note that the expenses shown in the table are meant to highlight your ongoing costs only and do not reflect any direct costs, such as wire fees or low balance fees. Therefore, the second line of the table is useful in comparing ongoing costs and will not help you determine the relative total costs of owning different funds. In addition, if these direct costs were included, your costs would be higher.
| | Beginning Account Value January 1, 2017 | Ending Account Value June 30, 2017 | Expenses Paid During Period(a) | Net Expense Ratios(b) |
| Cortina Small Cap Growth Fund ‐ Institutional | | | | |
| Actual Fund Return | $1,000.00 | $1,102.50 | $5.73 | 1.10% |
| Hypothetical Fund Return (assuming a 5% return before expenses) | $1,000.00 | $1,019.34 | $5.51 | 1.10% |
| Cortina Small Cap Value Fund ‐ Institutional | | | | |
| Actual Fund Return | $1,000.00 | $1,026.00 | $5.53 | 1.10% |
| Hypothetical Fund Return (assuming a 5% return before expenses) | $1,000.00 | $1,019.34 | $5.51 | 1.10% |
| Cortina Small Cap Value Fund ‐ Investor | | | | |
| Actual Fund Return | $1,000.00 | $1,025.10 | $6.78 | 1.35% |
| Hypothetical Fund Return (assuming a 5% return before expenses) | $1,000.00 | $1,018.10 | $6.76 | 1.35% |
(a) | Expenses are equal to the Fund’s annualized expense ratio multiplied by the average account value over the period, multiplied by the number of days in the most recent fiscal half year (181), divided by 365. |
(b) | Annualized, based on the Fund's most recent half-year expenses. |
| Annual Report | June 30, 2017 | 7 |
Cortina Small Cap Growth Fund | June 30, 2017 |
| | | Shares | | | Value | |
| COMMON STOCKS (96.12%) | | | | | | |
| Consumer Discretionary (8.98%) | | | | | | |
Duluth Holdings, Inc., Class B(a) | | | 10,294 | | | $ | 187,454 | |
Five Below, Inc.(a) | | | 6,607 | | | | 326,188 | |
IMAX Corp.(a) | | | 12,354 | | | | 271,788 | |
Malibu Boats, Inc., Class A(a) | | | 7,389 | | | | 191,153 | |
MarineMax, Inc.(a) | | | 12,608 | | | | 246,486 | |
Ollie's Bargain Outlet Holdings, Inc.(a) | | | 8,481 | | | | 361,291 | |
| Tile Shop Holdings, Inc. | | | 11,620 | | | | 239,953 | |
Universal Electronics, Inc.(a) | | | 3,667 | | | | 245,139 | |
| Wingstop, Inc. | | | 8,569 | | | | 264,782 | |
| | | | | | | | 2,334,234 | |
| Consumer Staples (1.94%) | | | | | | | | |
elf Beauty, Inc.(a) | | | 8,759 | | | | 238,333 | |
Primo Water Corp.(a) | | | 20,999 | | | | 266,687 | |
| | | | | | | | 505,020 | |
| Energy (3.94%) | | | | | | | | |
Abraxas Petroleum Corp.(a) | | | 81,559 | | | | 132,125 | |
Contango Oil & Gas Co.(a) | | | 11,901 | | | | 79,023 | |
Lonestar Resources US, Inc., Class A(a) | | | 24,189 | | | | 104,013 | |
Mammoth Energy Services, Inc.(a) | | | 9,576 | | | | 178,114 | |
Matador Resources Co.(a) | | | 7,047 | | | | 150,594 | |
Ring Energy, Inc.(a) | | | 19,303 | | | | 250,939 | |
SRC Energy, Inc.(a) | | | 19,399 | | | | 130,555 | |
| | | | | | | | 1,025,363 | |
| Financials (5.23%) | | | | | | | | |
| Financial Engines, Inc. | | | 7,722 | | | | 282,625 | |
Green Dot Corp., Class A(a) | | | 5,057 | | | | 194,846 | |
Health Insurance Innovations, Inc., Class A(a) | | | 10,775 | | | | 253,212 | |
| Independent Bank Group, Inc. | | | 3,543 | | | | 210,809 | |
LendingTree, Inc.(a) | | | 1,349 | | | | 232,298 | |
| Pinnacle Financial Partners, Inc. | | | 2,980 | | | | 187,144 | |
| | | | | | | | 1,360,934 | |
Health Care (25.46%)(b) | | | | | | | | |
AtriCure, Inc.(a) | | | 7,885 | | | | 191,211 | |
AxoGen, Inc.(a) | | | 17,766 | | | | 297,581 | |
BioTelemetry, Inc.(a) | | | 11,528 | | | | 385,612 | |
Bovie Medical Corp.(a) | | | 33,796 | | | | 83,476 | |
Cardiovascular Systems, Inc.(a) | | | 8,708 | | | | 280,659 | |
Cross Country Healthcare, Inc.(a) | | | 16,077 | | | | 207,554 | |
Diplomat Pharmacy, Inc.(a) | | | 8,963 | | | | 132,652 | |
Eagle Pharmaceuticals, Inc.(a) | | | 2,420 | | | | 190,914 | |
Entellus Medical, Inc.(a) | | | 13,265 | | | | 219,668 | |
Evolent Health, Inc., Class A(a) | | | 10,292 | | | | 260,902 | |
HealthEquity, Inc.(a) | | | 4,109 | | | | 204,752 | |
HealthStream, Inc.(a) | | | 5,097 | | | | 134,153 | |
Heska Corp.(a) | | | 2,543 | | | | 259,564 | |
HMS Holdings Corp.(a) | | | 14,080 | | | | 260,480 | |
K2M Group Holdings, Inc.(a) | | | 20,834 | | | | 507,516 | |
Ligand Pharmaceuticals, Inc.(a) | | | 2,371 | | | | 287,839 | |
Neogen Corp.(a) | | | 3,176 | | | | 219,493 | |
NeoGenomics, Inc.(a) | | | 37,561 | | | | 336,547 | |
NxStage Medical, Inc.(a) | | | 11,227 | | | | 281,461 | |
Oxford Immunotec Global PLC(a) | | | 18,058 | | | | 303,736 | |
Pacira Pharmaceuticals, Inc.(a) | | | 4,864 | | | | 232,013 | |
Repligen Corp.(a) | | | 6,031 | | | | 249,925 | |
See Notes to Financial Statements.
| 8 | 1-855-612-3936 | www.cortinafunds.com |
 | Schedule of Investments |
| Cortina Small Cap Growth Fund | June 30, 2017 |
| | | Shares | | | Value | |
| COMMON STOCKS (continued) | | | | | | |
| Health Care (continued) | | | | | | |
STAAR Surgical Co.(a) | | | 20,860 | | | $ | 225,288 | |
Teladoc, Inc.(a) | | | 5,769 | | | | 200,184 | |
Teligent, Inc.(a) | | | 22,546 | | | | 206,296 | |
Vanda Pharmaceuticals, Inc.(a) | | | 1,439 | | | | 23,456 | |
Veracyte, Inc.(a) | | | 26,891 | | | | 224,002 | |
Vocera Communications, Inc.(a) | | | 8,182 | | | | 216,168 | |
| | | | | | | | 6,623,102 | |
| Industrials (13.00%) | | | | | | | | |
Air Transport Services Group, Inc.(a) | | | 13,944 | | | | 303,700 | |
| Albany International Corp., Class A | | | 4,699 | | | | 250,927 | |
Axon Enterprise, Inc.(a) | | | 7,758 | | | | 195,036 | |
| Barnes Group, Inc. | | | 1,831 | | | | 107,168 | |
BMC Stock Holdings, Inc.(a) | | | 14,972 | | | | 327,138 | |
Covenant Transportation Group, Inc., Class A(a) | | | 12,819 | | | | 224,717 | |
Dycom Industries, Inc.(a) | | | 3,649 | | | | 326,658 | |
| Granite Construction, Inc. | | | 4,683 | | | | 225,908 | |
Kornit Digital, Ltd.(a) | | | 9,802 | | | | 189,669 | |
Kratos Defense & Security Solutions, Inc.(a) | | | 22,840 | | | | 271,111 | |
Manitex International, Inc.(a) | | | 23,696 | | | | 165,398 | |
Saia, Inc.(a) | | | 4,249 | | | | 217,974 | |
Spirit Airlines, Inc.(a) | | | 7,178 | | | | 370,744 | |
| Titan International, Inc. | | | 17,113 | | | | 205,527 | |
| | | | | | | | 3,381,675 | |
Information Technology (32.20%)(b) | | | | | | | | |
2U, Inc.(a) | | | 1,908 | | | | 89,523 | |
Amber Road, Inc.(a) | | | 26,560 | | | | 227,619 | |
Blackhawk Network Holdings, Inc.(a) | | | 7,080 | | | | 308,688 | |
Box, Inc., Class A(a) | | | 17,805 | | | | 324,763 | |
Brightcove, Inc.(a) | | | 30,404 | | | | 188,505 | |
BroadSoft, Inc.(a) | | | 5,571 | | | | 239,832 | |
CEVA, Inc.(a) | | | 3,964 | | | | 180,164 | |
ChannelAdvisor Corp.(a) | | | 18,293 | | | | 211,284 | |
Cirrus Logic, Inc.(a) | | | 3,548 | | | | 222,531 | |
Coherent, Inc.(a) | | | 1,384 | | | | 311,386 | |
CommVault Systems, Inc.(a) | | | 4,936 | | | | 278,637 | |
Cray, Inc.(a) | | | 13,399 | | | | 246,542 | |
| EMCORE Corp. | | | 22,785 | | | | 242,660 | |
Five9, Inc.(a) | | | 15,796 | | | | 339,930 | |
FormFactor, Inc.(a) | | | 24,397 | | | | 302,523 | |
Gogo, Inc.(a) | | | 13,723 | | | | 158,226 | |
Hortonworks, Inc.(a) | | | 11,629 | | | | 149,781 | |
Infinera Corp.(a) | | | 31,038 | | | | 331,175 | |
Inphi Corp.(a) | | | 6,337 | | | | 217,359 | |
Limelight Networks, Inc.(a) | | | 118,833 | | | | 343,427 | |
LivePerson, Inc.(a) | | | 7,708 | | | | 84,788 | |
MaxLinear, Inc., Class A(a) | | | 12,650 | | | | 352,808 | |
Mellanox Technologies, Ltd.(a) | | | 6,425 | | | | 278,202 | |
Mimecast, Ltd.(a) | | | 10,464 | | | | 280,226 | |
Nanometrics, Inc.(a) | | | 10,275 | | | | 259,855 | |
Oclaro, Inc.(a) | | | 18,647 | | | | 174,163 | |
Photronics, Inc.(a) | | | 24,234 | | | | 227,800 | |
Planet Payment, Inc.(a) | | | 49,383 | | | | 162,964 | |
Quantenna Communications, Inc.(a) | | | 12,981 | | | | 246,639 | |
RingCentral, Inc., Class A(a) | | | 7,600 | | | | 277,780 | |
ShoreTel, Inc.(a) | | | 33,827 | | | | 196,197 | |
Telenav, Inc.(a) | | | 18,350 | | | | 148,635 | |
| See Notes to Financial Statements. | |
| Annual Report | June 30, 2017 | 9 |
| | Schedule of Investments |
| Cortina Small Cap Growth Fund | June 30, 2017 |
| | Shares | | | Value | |
| COMMON STOCKS (continued) | | | | | | |
| Information Technology (continued) | | | | | | |
Truecar, Inc.(a) | | | 12,664 | | | $ | 252,394 | |
USA Technologies, Inc.(a) | | | 37,868 | | | | 196,914 | |
Varonis Systems, Inc.(a) | | | 8,652 | | | | 321,854 | |
| | | | | | | | 8,375,774 | |
| Materials (3.10%) | | | | | | | | |
Codexis, Inc.(a) | | | 47,728 | | | | 260,118 | |
LSB Industries, Inc.(a) | | | 24,730 | | | | 255,461 | |
Summit Materials, Inc., Class A(a) | | | 10,092 | | | | 291,356 | |
| | | | | | | | 806,935 | |
| Telecommunication Services (2.27%) | | | | | | | | |
Boingo Wireless, Inc.(a) | | | 22,539 | | | | 337,183 | |
ORBCOMM, Inc.(a) | | | 22,429 | | | | 253,448 | |
| | | | | | | | 590,631 | |
| | | | | | | | | |
| TOTAL COMMON STOCKS (COST $18,582,258) | | | | | | | 25,003,668 | |
| | | | | | | | | |
| TOTAL INVESTMENTS (96.12%)(COST $18,582,258) | | | | | | | 25,003,668 | |
| | | | | | | | | |
| OTHER ASSETS IN EXCESS OF LIABILITIES (3.88%) | | | | | | | 1,010,167 | |
| | | | | | | | | |
| NET ASSETS 100.00% | | | | | | $ | 26,013,835 | |
(a) | Non Income Producing Security. |
(b) | To the extent the Fund invests more heavily in particular sectors of the economy, its performance will be especially sensitive to developments that significantly affect those sectors. When sector categorization is broken down by industry, no industry exceeds the 25% maximum specified in the Statement of Additional Information. |
| See Notes to Financial Statements. | |
| 10 | 1-855-612-3936 | www.cortinafunds.com |
| Schedule of Investments |
| Cortina Small Cap Value Fund | June 30, 2017 |
| | | Shares | | | Value | |
| COMMON STOCKS (97.67%) | | | | | | |
| Consumer Discretionary (11.43%) | | | | | | |
| Caleres, Inc. | | | 20,906 | | | $ | 580,769 | |
Eldorado Resorts, Inc.(a) | | | 36,262 | | | | 725,240 | |
Etsy, Inc.(a) | | | 21,819 | | | | 327,285 | |
Fox Factory Holding Corp.(a) | | | 15,169 | | | | 540,016 | |
Horizon Global Corp.(a) | | | 33,192 | | | | 476,637 | |
M/I Homes, Inc.(a) | | | 11,212 | | | | 320,103 | |
Red Robin Gourmet Burgers, Inc.(a) | | | 9,665 | | | | 630,641 | |
TRI Pointe Group, Inc.(a) | | | 33,174 | | | | 437,565 | |
| Winnebago Industries, Inc. | | | 23,514 | | | | 822,990 | |
| | | | | | | | 4,861,246 | |
| Consumer Staples (1.15%) | | | | | | | | |
| Andersons, Inc. | | | 14,272 | | | | 487,389 | |
| | | | | | | | | |
| Energy (4.91%) | | | | | | | | |
Eclipse Resources Corp.(a) | | | 183,291 | | | | 524,212 | |
Forum Energy Technologies, Inc.(a) | | | 21,741 | | | | 339,160 | |
Matador Resources Co.(a) | | | 19,164 | | | | 409,535 | |
Oil States International, Inc.(a) | | | 15,145 | | | | 411,187 | |
| Patterson‐UTI Energy, Inc. | | | 20,087 | | | | 405,556 | |
| | | | | | | | 2,089,650 | |
| Financials (23.34%) | | | | | | | | |
| BancorpSouth, Inc. | | | 29,149 | | | | 889,044 | |
| Banner Corp. | | | 14,654 | | | | 828,098 | |
| Capitol Federal Financial, Inc. | | | 39,491 | | | | 561,167 | |
| ConnectOne Bancorp, Inc. | | | 32,587 | | | | 734,837 | |
| Enterprise Financial Services Corp. | | | 20,012 | | | | 816,490 | |
| James River Group Holdings, Ltd. | | | 12,639 | | | | 502,147 | |
| MB Financial, Inc. | | | 17,381 | | | | 765,459 | |
| Meridian Bancorp, Inc. | | | 51,077 | | | | 863,201 | |
| Pinnacle Financial Partners, Inc. | | | 11,848 | | | | 744,035 | |
| ProAssurance Corp. | | | 8,332 | | | | 506,586 | |
TriState Capital Holdings, Inc.(a) | | | 19,771 | | | | 498,229 | |
| Waterstone Financial, Inc. | | | 36,816 | | | | 693,982 | |
Western Alliance Bancorp(a) | | | 13,238 | | | | 651,310 | |
| Wintrust Financial Corp. | | | 11,376 | | | | 869,581 | |
| | | | | | | | 9,924,166 | |
| Health Care (9.52%) | | | | | | | | |
Allscripts Healthcare Solutions, Inc.(a) | | | 81,584 | | | | 1,041,012 | |
Endologix, Inc.(a) | | | 84,316 | | | | 409,776 | |
Magellan Health, Inc.(a) | | | 11,576 | | | | 843,890 | |
| Owens & Minor, Inc. | | | 17,833 | | | | 574,044 | |
Pacira Pharmaceuticals, Inc.(a) | | | 12,338 | | | | 588,523 | |
Prestige Brands Holdings, Inc.(a) | | | 11,171 | | | | 589,940 | |
| | | | | | | | 4,047,185 | |
| Industrials (12.86%) | | | | | | | | |
Atkore International Group, Inc.(a) | | | 22,344 | | | | 503,857 | |
| AZZ, Inc. | | | 10,921 | | | | 609,392 | |
| Forward Air Corp. | | | 9,171 | | | | 488,631 | |
Generac Holdings, Inc.(a) | | | 16,549 | | | | 597,915 | |
Harsco Corp.(a) | | | 34,835 | | | | 560,844 | |
| Knoll, Inc. | | | 26,602 | | | | 533,370 | |
NCI Building Systems, Inc.(a) | | | 20,607 | | | | 344,137 | |
| REV Group, Inc. | | | 18,637 | | | | 515,872 | |
SPX Corp.(a) | | | 23,740 | | | | 597,298 | |
| See Notes to Financial Statements. | |
| Annual Report | June 30, 2017 | 11 |
| | Schedule of Investments |
| Cortina Small Cap Value Fund | June 30, 2017 |
| | | Shares | | | Value | |
| COMMON STOCKS (continued) | | | | | | |
| Industrials (continued) | | | | | | |
| Student Transportation, Inc. | | | 79,959 | | | $ | 485,351 | |
| Wabash National Corp. | | | 10,552 | | | | 231,933 | |
| | | | | | | | 5,468,600 | |
| Information Technology (14.63%) | | | | | | | | |
Ambarella, Inc.(a) | | | 12,668 | | | | 615,031 | |
Barracuda Networks, Inc.(a) | | | 23,433 | | | | 540,365 | |
Benchmark Electronics, Inc.(a) | | | 18,322 | | | | 591,801 | |
BlackBerry, Ltd.(a) | | | 65,671 | | | | 656,053 | |
| Dolby Laboratories, Inc., Class A | | | 9,837 | | | | 481,619 | |
FARO Technologies, Inc.(a) | | | 16,177 | | | | 611,491 | |
OSI Systems, Inc.(a) | | | 9,119 | | | | 685,293 | |
Stratasys, Ltd.(a) | | | 22,315 | | | | 520,163 | |
Teradata Corp.(a) | | | 32,968 | | | | 972,226 | |
| Travelport Worldwide, Ltd. | | | 39,722 | | | | 546,575 | |
| | | | | | | | 6,220,617 | |
| Materials (6.59%) | | | | | | | | |
Cliffs Natural Resources, Inc.(a) | | | 86,227 | | | | 596,691 | |
| Commercial Metals Co. | | | 28,289 | | | | 549,655 | |
| Graphic Packaging Holding Co. | | | 50,201 | | | | 691,770 | |
Owens‐Illinois, Inc.(a) | | | 40,325 | | | | 964,574 | |
| | | | | | | | 2,802,690 | |
| Real Estate (4.99%) | | | | | | | | |
| Four Corners Property Trust, Inc., REIT | | | 31,801 | | | | 798,523 | |
| Gramercy Property Trust, Inc., REIT | | | 24,078 | | | | 715,358 | |
| Physicians Realty Trust, REIT | | | 30,150 | | | | 607,221 | |
| | | | | | | | 2,121,102 | |
| Utilities (8.25%) | | | | | | | | |
| Black Hills Corp. | | | 8,740 | | | | 589,688 | |
| Chesapeake Utilities Corp. | | | 9,226 | | | | 691,489 | |
| Middlesex Water Co. | | | 15,450 | | | | 611,820 | |
| Ormat Technologies, Inc. | | | 16,791 | | | | 985,296 | |
| PNM Resources, Inc. | | | 16,466 | | | | 629,824 | |
| | | | | | | | 3,508,117 | |
| | | | | | | | | |
| TOTAL COMMON STOCKS (COST $35,231,149) | | | | | | | 41,530,762 | |
| | | | | | | | | |
| | | | | | | | | |
| TOTAL INVESTMENTS (97.67%) (COST $35,231,149) | | | | | | | 41,530,762 | |
| | | | | | | | | |
| OTHER ASSETS IN EXCESS OF LIABILITIES (2.33%) | | | | | | | 991,038 | |
| | | | | | | | | |
| NET ASSETS 100.00% | | | | | | $ | 42,521,800 | |
(a) | Non Income Producing Security. |
| See Notes to Financial Statements. | |
| 12 | 1-855-612-3936 | www.cortinafunds.com |
| Statements of Assets and Liabilities |
| | | Cortina Small Cap Growth Fund | | | Cortina Small Cap Value Fund | |
| ASSETS: | | | | | | |
| Investments, at value (Cost ‐ see below) | | $ | 25,003,668 | | | $ | 41,530,762 | |
| Cash | | | 896,409 | | | | 1,064,656 | |
| Receivable for investments sold | | | 559,662 | | | | 1,329,657 | |
| Receivable for fund shares subscribed | | | – | | | | 2,316 | |
| Dividends and interest receivable | | | 2,131 | | | | 47,540 | |
| Prepaid expenses and other assets | | | 3,424 | | | | 8,707 | |
| Total Assets | | | 26,465,294 | | | | 43,983,638 | |
| | | | | | | | | |
| LIABILITIES: | | | | | | | | |
| Payable for investments purchased | | | 390,170 | | | | 1,370,158 | |
| Payable for director fees | | | 5,000 | | | | 5,000 | |
| Payable for advisory fees | | | 9,973 | | | | 21,839 | |
| Payable for fund accounting and administration fees | | | 17,951 | | | | 25,999 | |
| Payable for distribution and service fees | | | – | | | | 458 | |
| Payable for audit and legal fees | | | 18,293 | | | | 20,921 | |
| Other accrued liabilities and expenses | | | 10,072 | | | | 17,463 | |
| Total Liabilities | | | 451,459 | | | | 1,461,838 | |
| Net Assets | | $ | 26,013,835 | | | $ | 42,521,800 | |
| | | | | | | | | |
| NET ASSETS CONSISTS OF: | | | | | | | | |
| Paid‐in capital | | $ | 16,482,078 | | | $ | 35,320,585 | |
| Accumulated net realized gain on investments | | | 3,110,347 | | | | 901,602 | |
| Net unrealized appreciation on investments | | | 6,421,410 | | | | 6,299,613 | |
| Net Assets | | $ | 26,013,835 | | | $ | 42,521,800 | |
| | | | | | | | | |
| Cost of Investments | | $ | 18,582,258 | | | $ | 35,231,149 | |
| | | | | | | | | |
| PRICING OF SHARES: | | | | | | | | |
| Institutional | | | | | | | | |
| Net Assets | | $ | 26,013,835 | | | $ | 41,491,636 | |
| Shares Outstanding ($0.01 par value, unlimited number of shares authorized) | | | 1,390,728 | | | | 2,057,765 | |
| Net Asset Value, offering and redemption price per share | | $ | 18.71 | | | $ | 20.16 | |
| Investor | | | | | | | | |
| Net Assets | | $ | – | | | $ | 1,030,164 | |
| Shares Outstanding ($0.01 par value, unlimited number of shares authorized) | | | – | | | | 51,411 | |
| Net Asset Value, offering and redemption price per share | | $ | – | | | $ | 20.04 | |
| See Notes to Financial Statements. |
| Annual Report | June 30, 2017 | 13 |
| For the Year Ended June 30, 2017 |
| |
| | | Cortina Small Cap Growth Fund | | | Cortina Small Cap Value Fund | |
| INVESTMENT INCOME: | | | | | | |
| Dividends (net of foreign withholding taxes of $0 and $1,432, respectively) | | $ | 36,159 | | | $ | 525,342 | |
| Total Investment Income | | | 36,159 | | | | 525,342 | |
| | | | | | | | | |
| EXPENSES: | | | | | | | | |
| Advisory fees (Note 3) | | | 298,637 | | | | 465,884 | |
| Fund accounting and administration fees and expenses | | | 94,149 | | | | 139,836 | |
| Transfer agent fees | | | 31,148 | | | | 52,322 | |
| Distribution and service fees | | | | | | | | |
| Investor | | | – | | | | 1,986 | |
| Legal fees | | | 18,619 | | | | 30,437 | |
| Printing fees | | | 1,182 | | | | 8,712 | |
| Registration fees | | | 28,342 | | | | 43,742 | |
| Audit and tax fees | | | 15,025 | | | | 15,525 | |
| Custodian fees | | | 5,471 | | | | 6,458 | |
| Director fees and expenses | | | 20,000 | | | | 20,000 | |
| Other | | | 12,928 | | | | 16,938 | |
| Total Expenses Before Waivers | | | 525,501 | | | | 801,840 | |
| Less fees waived by Adviser (Note 3) | | | (197,268 | ) | | | (288,061 | ) |
| Total Net Expenses | | | 328,233 | | | | 513,779 | |
| Net Investment Income/(Loss) | | | (292,074 | ) | | | 11,563 | |
| | | | | | | | | |
| REALIZED AND UNREALIZED GAIN/(LOSS) ON INVESTMENTS: | | | | | | | | |
| Net realized gain on investments | | | 8,060,618 | | | | 10,540,771 | |
| Net change in unrealized appreciation on investments | | | 855,736 | | | | 744,058 | |
| Net Realized and Unrealized Gain on Investments | | | 8,916,354 | | | | 11,284,829 | |
| Net Increase in Net Assets Resulting from Operations | | $ | 8,624,280 | | | $ | 11,296,392 | |
| See Notes to Financial Statements. | |
| 14 | 1-855-612-3936 | www.cortinafunds.com |
| Statements of Changes in Net Assets |
| | | Cortina Small Cap Growth Fund | | | Cortina Small Cap Value Fund | |
| | | Year Ended June 30, 2017 | | | Year Ended June 30, 2016 | | | Year Ended June 30, 2017 | | | Year Ended June 30, 2016 | |
| OPERATIONS: | | | | | | | | | | | | |
| Net investment income/(loss) | | $ | (292,074 | ) | | $ | (365,663 | ) | | $ | 11,563 | | | $ | 48,572 | |
| Net realized gain/(loss) on investments | | | 8,060,618 | | | | (1,159,675 | ) | | | 10,540,771 | | | | (9,000,915 | ) |
| Net change in unrealized appreciation/(depreciation) on investments | | | 855,736 | | | | (2,194,983 | ) | | | 744,058 | | | | 850,455 | |
| Net increase/(decrease) in net assets resulting from operations | | | 8,624,280 | | | | (3,720,321 | ) | | | 11,296,392 | | | | (8,101,888 | ) |
| | | | | | | | | | | | | | | | | |
| DISTRIBUTIONS TO SHAREHOLDERS: | | | | | | | | | | | | | | | | |
| Institutional | | | | | | | | | | | | | | | | |
| From net investment income | | | – | | | | – | | | | (76,127 | ) | | | – | |
| Investor | | | | | | | | | | | | | | | | |
| From net investment income | | | – | | | | – | | | | (79 | ) | | | – | |
| Total distributions | | | – | | | | – | | | | (76,206 | ) | | | – | |
| | | | | | | | | | | | | | | | | |
| CAPITAL SHARE TRANSACTIONS: | | | | | | | | | | | | | | | | |
| Institutional | | | | | | | | | | | | | | | | |
| Proceeds from sale of shares | | | 2,251,187 | | | | 2,334,148 | | | | 8,762,639 | | | | 45,242,703 | |
| Shares issued in reinvestment of distributions | | | – | | | | – | | | | 58,066 | | | | – | |
| Cost of shares redeemed | | | (19,682,697 | ) | | | (10,077,701 | ) | | | (42,973,360 | ) | | | (23,874,783 | ) |
| Redemption fees | | | – | | | | – | | | | 1,239 | | | | 561 | |
| Total | | | (17,431,510 | ) | | | (7,743,553 | ) | | | (34,151,416 | ) | | | 21,368,481 | |
| Investor | | | | | | | | | | | | | | | | |
| Proceeds from sale of shares | | | – | | | | – | | | | 585,238 | | | | 274,972 | |
| Shares issued in reinvestment of distributions | | | – | | | | – | | | | 76 | | | | – | |
| Cost of shares redeemed | | | – | | | | – | | | | (207,584 | ) | | | (80,147 | ) |
| Total | | | – | | | | – | | | | 377,730 | | | | 194,825 | |
| Net increase/(decrease) from capital shares transactions | | | (17,431,510 | ) | | | (7,743,553 | ) | | | (33,773,686 | ) | | | 21,563,306 | |
| | | | | | | | | | | | | | | | | |
| Net increase/(decrease) in net assets | | | (8,807,230 | ) | | | (11,463,874 | ) | | | (22,553,500 | ) | | | 13,461,418 | |
| | | | | | | | | | | | | | | | | |
| NET ASSETS: | | | | | | | | | | | | | | | | |
| Beginning of year | | | 34,821,065 | | | | 46,284,939 | | | | 65,075,300 | | | | 51,613,882 | |
| End of year | | $ | 26,013,835 | | | $ | 34,821,065 | | | $ | 42,521,800 | | | $ | 65,075,300 | |
| Including accumulated net investment income/(loss) of: | | $ | – | | | $ | (168,486 | ) | | $ | – | | | $ | 31,260 | |
| | | | | | | | | | | | | | | | | |
| OTHER INFORMATION: | | | | | | | | | | | | | | | | |
| Share Transactions: | | | | | | | | | | | | | | | | |
| Institutional | | | | | | | | | | | | | | | | |
| Beginning shares | | | 2,439,069 | | | | 3,003,898 | | | | 3,985,455 | | | | 2,768,059 | |
| Shares sold | | | 132,757 | | | | 170,048 | | | | 467,621 | | | | 2,708,555 | |
| Shares issued in reinvestment of dividends | | | – | | | | – | | | | 2,936 | | | | – | |
| Less shares redeemed | | | (1,181,098 | ) | | | (734,877 | ) | | | (2,398,247 | ) | | | (1,491,159 | ) |
| Ending shares | | | 1,390,728 | | | | 2,439,069 | | | | 2,057,765 | | | | 3,985,455 | |
| Investor | | | | | | | | | | | | | | | | |
| Beginning shares | | | – | | | | – | | | | 32,503 | | | | 19,513 | |
| Shares sold | | | – | | | | – | | | | 29,568 | | | | 18,003 | |
| Shares issued in reinvestment of dividends | | | – | | | | – | | | | 4 | | | | – | |
| Less shares redeemed | | | – | | | | – | | | | (10,664 | ) | | | (5,013 | ) |
| Ending shares | | | – | | | | – | | | | 51,411 | | | | 32,503 | |
| See Notes to Financial Statements. | |
| Annual Report | June 30, 2017 | 15 |
| | Financial Highlights |
| Cortina Small Cap Growth Fund | For a share outstanding throughout the periods presented. |
| | | Year Ended June 30, 2017 | | | Year Ended June 30, 2016 | | | Year Ended June 30, 2015 | | | Year Ended June 30, 2014 | | | Year Ended June 30, 2013 | |
| NET ASSET VALUE, BEGINNING OF PERIOD | | $ | 14.28 | | | $ | 15.41 | | | $ | 16.35 | | | $ | 14.46 | | | $ | 11.87 | |
| INCOME/(LOSS) FROM INVESTMENT OPERATIONS: | | | | | | | | | | | | | | | | | | | | |
Net investment loss(a) | | | (0.16 | ) | | | (0.13 | ) | | | (0.14 | ) | | | (0.17 | ) | | | (0.13 | ) |
| Net realized and unrealized gain/(loss) on investments | | | 4.59 | | | | (1.00 | ) | | | (0.02 | )(b) | | | 2.19 | | | | 2.81 | |
| Total from Investment Operations | | | 4.43 | | | | (1.13 | ) | | | (0.16 | ) | | | 2.02 | | | | 2.68 | |
| | | | | | | | | | | | | | | | | | | | | |
| DIVIDENDS AND DISTRIBUTIONS TO SHAREHOLDERS: | | | | |
| From net realized gains on investments | | | – | | | | – | | | | (0.78 | ) | | | (0.13 | ) | | | (0.09 | ) |
| Total Dividends and Distributions to Shareholders | | | – | | | | – | | | | (0.78 | ) | | | (0.13 | ) | | | (0.09 | ) |
| Paid‐in Capital from Redemption Fees | | | – | | | | – | | | | 0.00 | (c) | | | 0.00 | (c) | | | – | |
| | | | | | | | | | | | | | | | | | | | | |
| NET INCREASE/(DECREASE) IN NET ASSET VALUE | | | 4.43 | | | | (1.13 | ) | | | (0.94 | ) | | | 1.89 | | | | 2.59 | |
| | | | | | | | | | | | | | | | | | | | | |
| NET ASSET VALUE, END OF PERIOD | | $ | 18.71 | | | $ | 14.28 | | | $ | 15.41 | | | $ | 16.35 | | | $ | 14.46 | |
| | | | | | | | | | | | | | | | | | | | | |
| TOTAL RETURN | | | 30.95 | % | | | (7.33 | %) | | | (0.71 | %) | | | 13.99 | % | | | 22.79 | % |
| | | | | | | | | | | | | | | | | | | | | |
| RATIOS AND SUPPLEMENTAL DATA: | | | | | | | | | | | | | | | | | | | | |
| Net assets, end of period (in 000s) | | $ | 26,014 | | | $ | 34,821 | | | $ | 46,285 | | | $ | 31,657 | | | $ | 18,245 | |
| | | | | | | | | | | | | | | | | | | | | |
| RATIOS TO AVERAGE NET ASSETS: | | | | | | | | | | | | | | | | | | | | |
| Operating expenses excluding waiver/reimbursement | | | 1.76 | % | | | 1.54 | % | | | 1.57 | % | | | 1.86 | % | | | 3.85 | % |
| Operating expenses including waiver/reimbursement | | | 1.10 | % | | | 1.10 | % | | | 1.10 | % | | | 1.10 | % | | | 1.10 | % |
| Net investment loss including waiver/reimbursement | | | (0.98 | )% | | | (0.97 | )% | | | (0.94 | )% | | | (1.02 | )% | | | (1.00 | )% |
| | | | | | | | | | | | | | | | | | | | | |
| PORTFOLIO TURNOVER RATE | | | 88 | % | | | 93 | % | | | 95 | % | | | 81 | % | | | 73 | % |
(a) | Calculated using average shares throughout the period. |
(b) | Realized and unrealized gains and losses per share in this caption are balancing amounts necessary to reconcile the change in net asset value per share for the period, and may not reconcile with the aggregate gains and losses in the Statements of Operations due to the share transactions for the period. |
(c) | Less than $0.005 per share. |
| See Notes to Financial Statements. | |
| 16 | 1-855-612-3936 | www.cortinafunds.com |
| | Financial Highlights |
| Cortina Small Cap Value Fund – Institutional | For a share outstanding throughout the periods presented. |
| | | Year Ended June 30, 2017 | | | Year Ended June 30, 2016 | | | Year Ended June 30, 2015 | | | Year Ended June 30, 2014 | | | Year Ended June 30, 2013 | |
| NET ASSET VALUE, BEGINNING OF PERIOD | | $ | 16.20 | | | $ | 18.52 | | | $ | 18.67 | | | $ | 15.62 | | | $ | 12.54 | |
| INCOME/(LOSS) FROM INVESTMENT OPERATIONS: | | | | | | | | | | | | | | | | | | | | |
Net investment income/(loss)(a) | | | 0.01 | | | | 0.01 | | | | (0.02 | ) | | | (0.01 | ) | | | 0.01 | |
| Net realized and unrealized gain/(loss) on investments | | | 3.98 | | | | (2.33 | ) | | | 0.24 | | | | 3.30 | | | | 3.68 | |
| Total from Investment Operations | | | 3.99 | | | | (2.32 | ) | | | 0.22 | | | | 3.29 | | | | 3.69 | |
| | | | | | | | | | | | | | | | | | | | | |
| DIVIDENDS AND DISTRIBUTIONS TO SHAREHOLDERS: | | | | | | | | | | | | | | | |
| From net investment income | | | (0.03 | ) | | | – | | | | – | | | | (0.01 | ) | | | (0.07 | ) |
| From net realized gains on investments | | | – | | | | – | | | | (0.37 | ) | | | (0.23 | ) | | | (0.54 | ) |
| Total Dividends and Distributions to Shareholders | | | (0.03 | ) | | | – | | | | (0.37 | ) | | | (0.24 | ) | | | (0.61 | ) |
| | | | | | | | | | | | | | | | | | | | | |
| Paid‐in Capital from Redemption Fees | | | 0.00 | (b) | | | 0.00 | (b) | | | 0.00 | (b) | | | – | | | | – | |
| | | | | | | | | | | | | | | | | | | | | |
| NET INCREASE/(DECREASE) IN NET ASSET VALUE | | | 3.96 | | | | (2.32 | ) | | | (0.15 | ) | | | 3.05 | | | | 3.08 | |
| | | | | | | | | | | | | | | | | | | | | |
| NET ASSET VALUE, END OF PERIOD | | $ | 20.16 | | | $ | 16.20 | | | $ | 18.52 | | | $ | 18.67 | | | $ | 15.62 | |
| | | | | | | | | | | | | | | | | | | | | |
| TOTAL RETURN | | | 24.65 | % | | | (12.53 | %) | | | 1.21 | % | | | 21.14 | % | | | 30.41 | % |
| | | | | | | | | | | | | | | | | | | | | |
| RATIOS AND SUPPLEMENTAL DATA: | | | | | | | | | | | | | | | | | | | | |
| Net assets, end of period (in 000s) | | $ | 41,492 | | | $ | 64,552 | | | $ | 51,254 | | | $ | 34,842 | | | $ | 4,344 | |
| | | | | | | | | | | | | | | | | | | | | |
| RATIOS TO AVERAGE NET ASSETS: | | | | | | | | | | | | | | | | | | | | |
| Operating expenses excluding waiver/reimbursement | | | 1.72 | % | | | 1.50 | % | | | 1.63 | % | | | 1.92 | % | | | 5.55 | % |
| Operating expenses including waiver/reimbursement | | | 1.10 | % | | | 1.10 | % | | | 1.10 | % | | | 1.10 | % | | | 1.10 | % |
| Net investment income/(loss) including waiver/reimbursement | | | 0.03 | % | | | 0.08 | % | | | (0.13 | )% | | | (0.09 | )% | | | 0.10 | % |
| | | | | | | | | | | | | | | | | | | | | |
| PORTFOLIO TURNOVER RATE | | | 89 | % | | | 109 | % | | | 102 | % | | | 78 | % | | | 81 | % |
(a) | Calculated using average shares throughout the period. |
(b) | Less than $0.005 per share. |
| See Notes to Financial Statements. | |
| Annual Report | June 30, 2017 | 17 |
| | Financial Highlights |
| Cortina Small Cap Value Fund – Investor | For a share outstanding throughout the periods presented. |
| | | Year Ended June 30, 2017 | | | Year Ended June 30, 2016 | | | Year Ended June 30, 2015 | | | For the Period April 30, 2014 (Inception) to June 30, 2014 | |
| NET ASSET VALUE, BEGINNING OF PERIOD | | $ | 16.11 | | | $ | 18.47 | | | $ | 18.67 | | | $ | 18.15 | |
| INCOME/(LOSS) FROM INVESTMENT OPERATIONS: | | | | | | | | | | | | | | | | |
Net investment loss(a) | | | (0.03 | )(b) | | | (0.02 | ) | | | (0.06 | ) | | | (0.01 | ) |
| Net realized and unrealized gain/(loss) on investments | | | 3.96 | | | | (2.34 | ) | | | 0.23 | | | | 0.53 | |
| Total from Investment Operations | | | 3.93 | | | | (2.36 | ) | | | 0.17 | | | | 0.52 | |
| | | | | | | | | | | | | | | | | |
| DIVIDENDS AND DISTRIBUTIONS TO SHAREHOLDERS: | | | | | | | | | | | | | | | | |
| From net investment income | | | (0.00 | )(c) | | | – | | | | – | | | | – | |
| From net realized gains on investments | | | – | | | | – | | | | (0.37 | ) | | | – | |
| Total Dividends and Distributions to Shareholders | | | (0.00 | )(c) | | | – | | | | (0.37 | ) | | | – | |
| | | | | | | | | | | | | | | | | |
| Paid-in Capital from Redemption Fees | | | – | | | | – | | | | – | | | | – | |
| | | | | | | | | | | | | | | | | |
| NET INCREASE/(DECREASE) IN NET ASSET VALUE | | | 3.93 | | | | (2.36 | ) | | | (0.20 | ) | | | 0.52 | |
| | | | | | | | | | | | | | | | | |
| NET ASSET VALUE, END OF PERIOD | | $ | 20.04 | | | $ | 16.11 | | | $ | 18.47 | | | $ | 18.67 | |
| | | | | | | | | | | | | | | | | |
| TOTAL RETURN | | | 24.41 | % | | | (12.78 | %) | | | 0.94 | % | | | 2.87 | %(d) |
| | | | �� | | | | | | | | | | | | | |
| RATIOS AND SUPPLEMENTAL DATA: | | | | | | | | | | | | | | | | |
| Net assets, end of period (in 000s) | | $ | 1,030 | | | $ | 524 | | | $ | 360 | | | $ | 103 | |
| | | | | | | | | | | | | | | | | |
| RATIOS TO AVERAGE NET ASSETS: | | | | | | | | | | | | | | | | |
| Operating expenses excluding waiver/reimbursement | | | 2.00 | % | | | 1.75 | % | | | 1.86 | % | | | 2.14 | %(e) |
| Operating expenses including waiver/reimbursement | | | 1.35 | % | | | 1.35 | % | | | 1.35 | % | | | 1.35 | %(e) |
| Net investment loss including waiver/reimbursement | | | (0.15 | )% | | | (0.13 | )% | | | (0.35 | )% | | | (0.20 | )%(e) |
| | | | | | | | | | | | | | | | | |
| PORTFOLIO TURNOVER RATE | | | 89 | % | | | 109 | % | | | 102 | % | | | 78 | %(f) |
(a) | Calculated using average shares throughout the period. |
(b) | The amount shown for a share outstanding throughout the period may not correlate with the Statement of Operations for the period due to the timing of sales and redemptions of Fund shares in relation to income earned and/or fluctuating market value of the investments of the Fund. |
(c) | Less than $0.005 per share. |
(f) | Portfolio turnover is calculated at the Fund level and represents the year ended June 30, 2014. |
| See Notes to Financial Statements. | |
| 18 | 1-855-612-3936 | www.cortinafunds.com |
| | Notes to Financial Statements |
June 30, 2017
1. ORGANIZATION
Cortina Funds, Inc. (the “Corporation”) is an open‐end management investment company registered under the Investment Company Act of 1940, as amended (the “1940 Act”). The Corporation was organized on April 27, 2004 as a Wisconsin corporation. The Corporation currently offers shares of common stock (“shares”) of the Cortina Small Cap Growth Fund and the Cortina Small Cap Value Fund (each a “Fund” and collectively, the “Funds”).
The Cortina Small Cap Growth Fund, which commenced operations with the sale of Institutional Class Shares on September 30, 2011, is a diversified portfolio with an investment objective to seek growth of capital. The Cortina Small Cap Value Fund, which commenced operations with the sale of Institutional Class Shares on September 30, 2011 and the sale of Investor Class Shares on April 30, 2014, is a diversified portfolio with an investment objective to seek long‐term capital appreciation.
Shares of each Fund are designated as Institutional Shares or Investor Shares with an indefinite number of shares authorized at $0.01 par value. The Articles of Incorporation, as amended and restated, permit the Corporation’s Board of Directors (the “Board”) to create additional funds and share classes.
2. SIGNIFICANT ACCOUNTING POLICIES
The following is a summary of significant accounting policies followed by the Funds. These policies are in conformity with U.S. generally accepted accounting principles (“GAAP”). The Funds are considered investment companies for financial reporting purposes under GAAP.
Use of Estimates — The accompanying financial statements were prepared in accordance with GAAP, which require the use of estimates and assumptions made by management. These may affect the reported amounts of assets and liabilities and disclosure of contingent assets and liabilities at the date of the financial statements and the reported amounts of increases and decreases in net assets from operations during the reporting period. Actual results could differ from those estimates.
Investment Valuation — Investment securities are valued at the last sale price at the close of the principal exchange on which they trade, except for securities listed on the NASDAQ Stock Market, Inc. (“NASDAQ”) exchange, which are valued at the NASDAQ official closing price. Unlisted securities or listed securities for which there were no sales during the day are valued at the closing bid price on such exchanges or over‐the‐counter markets. Investments for which market quotations are not readily available are valued at fair value as determined in good faith under consistently applied procedures approved by and under the general supervision of the Funds’ Board. Securities with maturities of sixty (60) days or less are valued at amortized cost as Level 1 or 2 within the hierarchy.
Investment Transactions — Investment security transactions are accounted for on trade date. Gains and losses on securities sold are determined on a specific identification basis.
Investment Income — Interest income is accrued and recorded on a daily basis including amortization of premiums, accretions of discounts and income earned from money market funds. Interest is not accrued on securities that are in default. Dividend income is recorded on the ex‐dividend date. Withholding taxes on foreign dividends have been provided for in accordance with the Funds’ understanding of the applicable country’s tax rules and rates.
Fair Value Measurements — A three‐tier hierarchy has been established to classify fair value measurements for disclosure purposes. Inputs refer broadly to the assumptions that market participants would use in pricing the asset or liability, including assumptions about risk. Inputs may be observable or unobservable. Observable inputs are inputs that reflect the assumptions market participants would use in pricing the asset or liability that are developed based on market data obtained from sources independent of the reporting entity. Unobservable inputs are inputs that reflect the reporting entity’s own assumptions about the assumptions market participants would use in pricing the asset or liability that are developed based on the best information available. In accordance with the authoritative guidance on fair value measurements and disclosure under GAAP, the Funds disclose fair value of their investments in a hierarchy that prioritizes the inputs to valuation techniques used to measure the fair value.
Cash — The Fund considers its investment in a FDIC insured interest bearing savings account to be cash. The Fund maintains cash balances, which, at times may exceed federally insured limits. The Fund maintains these balances with a high quality financial institution.
| Annual Report | June 30, 2017 | 19 |
| | Notes to Financial Statements |
June 30, 2017
Various inputs are used in determining the value of each Fund’s investments as of the reporting period end. The designated input levels are not necessarily an indication of the risk or liquidity associated with these investments. These inputs are categorized in the following hierarchy under applicable financial accounting standards:
| Level 1 | | — | | Unadjusted quoted prices in active markets for identical, unrestricted assets or liabilities that the Funds have the ability to access at the measurement date; |
| | | |
| Level 2 | | — | | Quoted prices which are not active, quoted prices for similar assets or liabilities in active markets or inputs other than quoted prices that are observable (either directly or indirectly) for substantially the full term of the asset or liability; and |
| | | |
| Level 3 | | — | | Significant unobservable prices or inputs (including a Fund’s own assumptions in determining the fair value of investments) where there is little or no market activity for the asset or liability at the measurement date. |
The availability of observable inputs can vary from security to security and is affected by a wide variety of factors, including, for example, the type of security, whether the security is new and not yet established in the marketplace, the liquidity of markets, and other characteristics particular to the security. To the extent that valuation is based on models or inputs that are less observable or unobservable in the market, the determination of fair value requires more judgment. Accordingly, the degree of judgment exercised in determining fair value is greatest for instruments categorized in Level 3.
An investment level within the fair value hierarchy is based on the lowest level input, individually or in the aggregate, that is significant to fair value measurement. The valuation techniques used by the Funds to measure fair value during the year ended June 30, 2017 maximized the use of observable inputs and minimized the use of unobservable inputs.
The inputs or methodology used for valuing securities are not necessarily an indication of the risk or liquidity associated with investing in those securities. The following is a summary of the inputs used in valuing the Funds’ investments as of June 30, 2017:
Cortina Small Cap Growth Fund
| | | Valuation Inputs | | | |
| Investments in Securities at Value | | Level 1 | | Level 2 | | Level 3 | | Total | |
| Common Stocks* | | $ | 25,003,668 | | $ | – | | $ | – | | $ | 25,003,668 | |
| Total | | $ | 25,003,668 | | $ | – | | $ | – | | $ | 25,003,668 | |
Cortina Small Cap Value Fund
| | | Valuation Inputs | | | |
| Investments in Securities at Value | | Level 1 | | Level 2 | | Level 3 | | Total | |
| Common Stocks* | | $ | 41,530,762 | | $ | – | | $ | – | | $ | 41,530,762 | |
| Total | | $ | 41,530,762 | | $ | – | | $ | – | | $ | 41,530,762 | |
| * | See Schedule of Investments for sector classification. |
For the year ended June 30, 2017, there have been no significant changes to the Funds’ fair value methodologies. Additionally, there were no transfers into or out of Levels 1 and 2 during the year ended June 30, 2017. It is the Funds’ policy to recognize transfers at the end of the reporting period.
For the year ended June 30, 2017, the Funds did not have investments with significant unobservable inputs (Level 3) used in determining fair value.
Affiliated Companies — An affiliated company is a company that can have direct or indirect common ownership. The Funds did not hold any investments in affiliated companies as of and during the year ended June 30, 2017.
Expenses — The Funds bear expenses incurred specifically on each Fund’s respective behalf as well as a portion of general Corporation expenses, which may be allocated on the basis of relative net assets or the nature of the services performed relative to applicability to each Fund.
Expenses that are specific to a class of shares of the Funds are charged directly to the share class. The Funds’ realized and unrealized gains and losses, net investment income, and expenses other than class specific expenses, are allocated daily to each class in proportion to its average daily net assets.
| 20 | 1-855-612-3936 | www.cortinafunds.com |
| | Notes to Financial Statements |
June 30, 2017
Distributions to Shareholders — Dividends from net investment income and distributions of net realized capital gains, if any, will be declared and paid at least annually. Income and capital gains distributions are determined in accordance with income tax regulations, which may differ from GAAP. Distributions to shareholders are recorded on the ex‐dividend date.
Fees on Redemptions — The Funds will deduct a 2.00% redemption proceeds fee on Fund shares held 60 days or less. The redemption fee is not a fee to finance sales or sales promotion expenses, but is paid to the Funds to defray the costs of liquidating an investor and discouraging short‐term trading of the Funds’ shares. No redemption fee will be imposed on redemptions initiated by the Funds.
Federal Income Taxes — As of and during the year ended June 30, 2017, the Funds did not have a liability for any unrecognized tax benefits. The Funds file U.S. federal, state, and local tax returns as required. The Funds’ tax returns are subject to examination by the relevant tax authorities until expiration of the applicable statute of limitations which is generally three years after the filing of the tax return for federal purposes and four years for most state returns. Tax returns for open years have incorporated no uncertain tax positions that require a provision for income taxes. The Funds intend to distribute to shareholders all taxable investment income and realized gains, and otherwise comply with Subchapter M of the Internal Revenue Code of 1986, as amended, applicable to regulated investment companies.
3. ADVISORY FEES, FUND ACCOUNTING FEES, ADMINISTRATION FEES, AND OTHER AGREEMENTS
Investment Adviser
Cortina Asset Management, LLC, is the Funds’ investment adviser (the “Adviser”). The Adviser is subject to the general supervision of the Board and is responsible for the overall management of the Funds’ business affairs. The Adviser invests the assets of the Funds based on the Funds’ investment objectives and policies. The Adviser is entitled to an investment advisory fee, computed daily and payable monthly, of 1.00% of the average daily net assets for each Fund.
The Adviser has contractually agreed to waive fees with respect to each of the Funds so that the net annual operating expenses (excluding taxes, leverage, interest, brokerage commissions, dividends or interest expenses on short positions, acquired fund fees and expenses, and extraordinary expenses) of the Funds’ shares will not exceed 1.10% and 1.35% of average daily net assets of each Fund’s Institutional and with respect to the Cortina Small Cap Value Fund Investor Class shares, respectively, through October 31, 2017. The Adviser may request a reimbursement from the Funds to recapture any reduced management fees or reimbursed Fund expenses within three years following the fee reduction or expense reimbursement, but only to the extent the Funds’ total annual fund operating expenses including any requested reimbursement amount, are less than the above limit at the time of the request. Any such reimbursement is subject to review by the Board.
As of June 30, 2017, reimbursements that may potentially be made by the Funds to the Adviser total $562,318 for the Cortina Small Cap Growth Fund and $760,796 for the Cortina Small Cap Value Fund and expire as follows:
| Cortina Small Cap Growth Fund | | | |
| June 30, 2018 | | $ | 198,408 | |
| June 30, 2019 | | | 166,642 | |
| June 30, 2020 | | | 197,268 | |
| | | $ | 562,318 | |
| | | | | |
| Cortina Small Cap Value Fund | | | | |
| June 30, 2018 | | $ | 222,111 | |
| June 30, 2019 | | | 250,624 | |
| June 30, 2020 | | | 288,061 | |
| | | $ | 760,796 | |
Fund Accounting Fees and Expenses
ALPS Fund Services, Inc. (“ALPS” or the “Administrator”) provides administrative, fund accounting and other services to the Funds for a monthly administration fee based on the Funds’ average daily net assets.
The Administrator is also reimbursed by the Funds for certain out‐of‐pocket expenses.
Transfer Agent
ALPS serves as transfer, dividend paying and shareholder servicing agent for the Funds (the “Transfer Agent”).
| Annual Report | June 30, 2017 | 21 |
| | Notes to Financial Statements |
June 30, 2017
Compliance Services
ALPS provides services that assist the Corporation’s Chief Compliance Officer in monitoring and testing the policies and procedures of the Corporation in conjunction with requirements under Rule 38a‐1 under the 1940 Act. ALPS is compensated under the Administration Agreement.
Distributor
The Funds have entered into a Distribution Agreement with ALPS Distributors, Inc (“the Distributor”) to provide distribution services to the Funds. The Distributor serves as underwriter/distributor of shares of the Funds.
Distribution and Services Plan
The Small Cap Value Fund has adopted a Distribution and Services Plan in accordance with Rule 12b‐1 (“Distribution Plan”) under the 1940 Act. The Distribution Plan provides that the Cortina Small Cap Value Fund may compensate or reimburse the Distributor for services rendered and expenses borne in connection with activities primarily intended to result in the sale of the Cortina Small Cap Value Fund’s shares. Sales charges may be paid to broker‐dealers, banks and any other financial intermediary eligible to receive such fees for sales of Investor Shares of the Cortina Small Cap Value Fund and for services provided to shareholders.
The Cortina Small Cap Value Fund charges 12b‐1 fees for Investor Shares. Pursuant to the Distribution Plan, the Cortina Small Cap Value Fund may annually pay the Distributor up to 0.25% of the average daily net assets of the Cortina Small Cap Value Fund’s Investor Shares. The expenses of the Distribution Plan are reflected in the Statements of Operations.
Certain Directors and Officers of the Funds are also officers of the Adviser.
4. PURCHASES AND SALES OF INVESTMENT SECURITIES
The aggregate cost of purchases and proceeds from sales of investment securities, excluding short‐term securities, are shown below for the year ended June 30, 2017.
| Fund Name | | Purchases | | | Sales | |
| Cortina Small Cap Growth Fund | | $ | 25,557,366 | | | $ | 42,881,826 | |
| Cortina Small Cap Value Fund | | | 40,804,795 | | | | 72,909,313 | |
There were no purchases or sales of long‐term U.S. Government Obligations for either Fund during the year ended June 30, 2017.
5. TAX BASIS INFORMATION
For the year ended June 30, 2017 the following reclassifications, which had no impact on results of operations or net assets, were primarily attributed to differences in treatment of net investment loss and distribution redesignations. These were recorded to reflect tax character as follows:
| Fund | | Paid-in Capital | | Accumulated Net
Investment Income/(Loss) | | Accumulated Net Realized
Gain/(Loss) on Investments | |
| Cortina Small Cap Growth Fund | | $ | – | | $ | 460,560 | | $ | (460,560 | ) |
| Cortina Small Cap Value Fund | | | – | | | 33,383 | | | (33,383 | ) |
| 22 | 1-855-612-3936 | www.cortinafunds.com |
| | Notes to Financial Statements |
Income and long‐term capital gain distributions are determined in accordance with Federal income tax regulations, which differ from GAAP, and, therefore, may differ significantly in amount or character from net investment income and realized gains for financial reporting purposes.
The tax character of distributions paid during the year ended June 30, 2017, were as follows:
| Fund | | Ordinary Income | | Long-Term Capital Gain | |
| Cortina Small Cap Growth Fund | $ | – | | $ | – | |
| Cortina Small Cap Value Fund | | | 42,823 | | | 33,383 | |
The tax character of distributions paid during the year ended June 30, 2016, were as follows:
| Fund | | Ordinary Income | | | Long-Term Capital Gain | |
| Cortina Small Cap Growth Fund | | $ | – | | | $ | – | |
| Cortina Small Cap Value Fund | | | – | | | | – | |
As of June 30, 2017, the aggregate cost of investments, gross unrealized appreciation/(depreciation) and net unrealized appreciation/(depreciation) for Federal tax purposes was as follows:
| Fund | | Cost of Investments for Income Tax Purposes | | | Gross Appreciation (excess of value over tax cost) | | | Gross Depreciation (excess of tax cost over value) | | | Net Unrealized Appreciation/(Depreciation) | |
| Cortina Small Cap Growth Fund | | $ | 18,956,794 | | | $ | 6,724,334 | | | $ | (677,460 | ) | | $ | 6,046,874 | |
| Cortina Small Cap Value Fund | | | 35,665,945 | | | | 6,463,394 | | | | (598,577 | ) | | | 5,864,817 | |
The difference between book basis and tax basis net unrealized appreciation is attributable to the deferral of losses from wash sales.
At June 30, 2017, components of distributable earnings were as follows:
| Fund | | Accumulated Net Investment Income/(Loss) | | | Accumulated Undistributed Net Realized Gain/(Loss) on Investments | | | Unrealized Appreciation/ (Depreciation) on Investments | | | Other Cumulative Effect of Timing Differences | | | Total Distributable Earnings | |
| Cortina Small Cap Growth Fund | | $ | 784,743 | | | $ | 2,700,140 | | | $ | 6,046,874 | | | $ | – | | | $ | 9,531,757 | |
| Cortina Small Cap Value Fund | | | – | | | | 1,336,398 | | | | 5,864,817 | | | | – | | | | 7,201,215 | |
Capital loss carryovers used during the period ended June 30, 2017 were $1,982,197 and $2,376,223 for the Cortina Small Cap Growth Fund and the Cortina Small Cap Value Fund, respectively.
| 6. | COMMITMENTS AND CONTINGENCIES |
Under the Corporation’s organizational documents, its Officers and Directors are indemnified against certain liabilities arising out of the performance of their duties to the Funds. In addition, in the normal course of business, the Corporation entered into contracts with its service providers, on behalf of the Funds, and others that provide for general indemnifications. The Funds’ maximum exposure under these arrangements is unknown, as this would involve future claims that may be made against the Funds. The Funds expect risk of loss to be remote.
| Annual Report | June 30, 2017 | 23 |
| | Notes to Financial Statements |
On October 13, 2016, the SEC amended Regulation S‐X, which will require standardized, enhanced disclosure about derivatives in investment company financial statements, as well as other amendments. The compliance date for the amendments to Regulation S‐X is August 1, 2017.
Management is currently evaluating the impact to the financial statements and disclosures.
| 24 | 1-855-612-3936 | www.cortinafunds.com |
| | Report of Independent Registered Public Accounting Firm |
To the Shareholders and Board of Directors of
Cortina Funds, Inc.
We have audited the accompanying statements of assets and liabilities, including the schedules of investments, of Cortina Funds, Inc., comprising the Cortina Small Cap Growth Fund and the Cortina Small Cap Value Fund (the “Funds”), as of June 30, 2017, and the related statements of operations for the year then ended, the statements of changes in net assets for each of the two years in the period then ended, and the financial highlights for each of the periods presented in the period then ended. These financial statements and financial highlights are the responsibility of the Funds’ management. Our responsibility is to express an opinion on these financial statements and financial highlights based on our audits.
We conducted our audits in accordance with the standards of the Public Company Accounting Oversight Board (United States). Those standards require that we plan and perform the audit to obtain reasonable assurance about whether the financial statements and financial highlights are free of material misstatement. An audit includes examining, on a test basis, evidence supporting the amounts and disclosures in the financial statements. Our procedures included confirmation of securities owned as of June 30, 2017, by correspondence with the custodian and brokers, or by other appropriate auditing procedures where replies from brokers were not received. An audit also includes assessing the accounting principles used and significant estimates made by management, as well as evaluating the overall financial statement presentation. We believe that our audits provide a reasonable basis for our opinion.
In our opinion, the financial statements and financial highlights referred to above present fairly, in all material respects, the financial position of each of the Funds constituting Cortina Funds, Inc. as of June 30, 2017, the results of their operations for the year then ended, the changes in their net assets for each of the two years in the period then ended, and the financial highlights for each of the periods presented in the period then ended, in conformity with accounting principles generally accepted in the United States of America.
COHEN & COMPANY, LTD.
Cleveland, Ohio
August 24, 2017
| Annual Report | June 30, 2017 | 25 |
| | Additional Information |
June 30, 2017 (Unaudited)
1. PROXY VOTING POLICIES AND VOTING RECORD
A description of the policies and procedures that the Funds use to vote proxies relating to portfolio securities is available without charge upon request by calling toll‐free 1‐855‐612‐3936, or on the Securities and Exchange Commission’s (“SEC”) website at http://www.sec.gov. Information regarding how the Funds voted proxies relating to portfolio securities during the most recent fiscal year end June 30, 2017 is available without charge upon request by calling toll‐free 1‐855‐612‐3936, or on the SEC’s website at http://www.sec.gov.
2. QUARTERLY PORTFOLIO HOLDINGS
The Corporation files a complete listing of portfolio holdings for the Funds with the SEC as of the first and third quarters of each fiscal year on Form N‐Q. The filings are available upon request by calling 1‐855‐612‐3936. Furthermore, you may obtain a copy of the filing on the SEC’s website at http://www.sec.gov. The Funds’ Forms N‐Q may also be reviewed and copied at the SEC’s Public Reference Room in Washington, D.C., and information on the operation of the Public Reference Room may be obtained by calling 1‐800‐SEC‐0330.
3. TAX INFORMATION
Certain tax information is required to be provided to shareholders based upon each Fund’s income and distributions for the year ended June 30, 2017. The Funds designate the following as percentages of taxable ordinary income distributions, up to the maximum amount allowable, for the calendar year ended December 31, 2016:
| Fund | Dividends Received Deduction Percentage | Qualified Dividend Income |
| Cortina Small Cap Growth Fund | 0.00% | 0.00% |
| Cortina Small Cap Value Fund | 100% | 100% |
In early 2017, if applicable, shareholders of record received this information for the distributions paid to them by the Funds during the calendar year 2016 via Form 1099. The Funds will notify shareholders in early 2018 of amounts paid to them by the Funds, if any, during the calendar year 2017.
Pursuant to Section 852(b)(3) of the Internal Revenue Code, Cortina Small Cap Value Fund designated $33,383 as long‐term capital gain dividends.
4. DIRECTORS’ CONSIDERATION AND APPROVAL OF ADVISORY AGREEMENT
On May 8, 2017 (the “Meeting”), the Board of Directors (the “Board”) met in person to consider, among other things, the annual renewal of the Investment Advisory Agreement (the “Advisory Agreement”) between the Cortina Funds, Inc. (the “Corporation”) and the Adviser with respect to the Cortina Small Cap Growth Fund and Cortina Small Cap Value Fund (the “Funds”) in accordance with Section 15(c) of the Investment Company Act of 1940, as amended (the “1940 Act”). The Board reviewed and discussed various information that had been provided prior to the Meeting, including the Investment Advisory Agreement, information provided by the Adviser in response to the request from the Board, including the Adviser’s Form ADV, financial information for the years ending 2015 and 2016, noting that the 2016 financial statements had been reviewed by WIPFLI, a profitability analysis with respect to the Funds, comparative information about the Funds’ performance for periods ended December 31, 2016 and March 31, 2017, management fees and expense ratios, financial intermediary arrangements and other pertinent information.
The Board also took into account information reviewed periodically throughout the year that was relevant to its consideration of the Investment Advisory Agreement, including performance, management fee and other expense information and discussions with the Funds’ portfolio managers. Based on its evaluation of this information, the Board, including a majority of the Independent Directors, approved the continuation of the Investment Advisory Agreement for an additional one‐year period.
In considering the Advisory Agreement and reaching its conclusions, the Board reviewed and analyzed various factors that it determined were relevant, including the factors below. In deciding to approve the Advisory Agreement for each Fund, the Board did not identify any single factor as determinative but considered all factors together.
Nature, Extent and Quality of Services Provided to the Funds: The Board analyzed the nature, extent and quality of the services provided by the Adviser to the Funds. The Board reviewed and considered the Adviser’s significant role in establishing the Funds and the construction of their investment objectives, principal strategies, investment limitations and fee structures. The Board noted the Adviser’s commitment to the Funds, and the experience, credentials and continuity of the portfolio management teams employed to manage the Funds’ investments. The Board further noted that the Adviser had approximately $2 billion of assets under discretionary management and that the Funds provide an opportunity for smaller institutional and retail accounts to receive the same professional advice from the Adviser that it offers to its larger institutional clients. The Board also noted that the provision of investment advisory services to the Funds requires more effort than it does for separately managed accounts due to daily sales and redemption activity and additional regulatory and compliance requirements.
| 26 | 1-855-612-3936 | www.cortinafunds.com |
| | Additional Information |
June 30, 2017 (Unaudited)
The Board considered other services that the Adviser provides for the Funds in its capacity as their investment adviser, such as making some of its key personnel available to serve as officers of the Funds, selecting broker‐dealers for execution of portfolio transactions, ensuring adherence to the Funds’ investment policies and restrictions, monitoring compliance and portfolio valuation and overseeing the Funds’ other service providers. The Board also considered that the Adviser has not experienced any significant legal, compliance or regulatory difficulties since the Funds were launched. The Board concluded that the nature, extent and quality of the services provided by the Adviser to the Funds were appropriate and that each Fund was likely to continue to benefit from services provided under the Investment Advisory Agreement.
Investment Performance of the Adviser and the Funds: In considering the investment performance of each of the Funds, the Board reviewed the Funds’ performance information as of March 31, 2017 for various periods back to the inception date of the Funds (09/30/2011) in comparison to various benchmark indices and certain peer funds selected by the Adviser (the “Peer Funds”). The Board also reviewed performance information as of December 31, 2016. The Board noted that for periods ended December 31, 2016, the Small Cap Growth Fund and the Adviser’s Small Cap Growth composite had outperformed the Russell 2000 Growth Index for the one‐year period but lagged the Index for the three‐year, five‐year and since inception periods. The Board considered the effect of the market environment and the Adviser’s quarterly commentary and discussions of the reasons for the Fund’s outperformance for the one‐year period and underperformance for the other periods. With respect to the Small Cap Value Fund, the Board noted that for the one‐year, three‐year, five‐year and since inception periods ended December 31, 2016 the Fund’s Institutional and Investor classes had underperformed the Russell 2000 Value Index. The Board noted that the Adviser’s Small Cap Value composite had lagged the Index for the one‐year and three‐year periods, but slightly exceeded the Index for the five‐year and since inception periods ended December 31, 2016. The Board considered the effect of the market environment and the Adviser’s quarterly commentary and discussions of the reasons for the Fund’s underperformance and the action being taken by the Adviser to address underperformance.
The Board also reviewed performance information for each Fund for the period ended March 31, 2017, noting that the Small Cap Value Fund’s Institutional Class and Investor Class performance exceeded the Peer median and Peer average for both the one‐year and the five‐year periods while lagging for the three‐year period. The Small Cap Growth Fund’s performance against its Peers for the period ended March 31, 2017 showed significant outperformance for the one‐year period while lagging for the three‐year and five‐year periods.
The Board also reviewed each Fund’s performance for the period ended March 31, 2017 compared to their relevant Russell index, noting that the Small Cap Growth Fund significantly outperformed the Russell 2000 Growth Index for the one‐year period ended March 31, 2017 while lagging the Index for the three‐year, five‐year and since inception time periods; the Small Cap Value Fund’s Institutional and Investor Class shares’ performance lagged the Russell 2000 Value Index for each time period presented other than the quarter ended March 31, 2017.
The Board also considered the Adviser’s quarterly portfolio reviews explaining the Funds’ performance, the Adviser’s consistent and disciplined investment decision process and the investment strategies it employs for the Funds. After considering all of the information, the Board concluded that, although past performance is not a guarantee of future results, each Fund and its shareholders were likely to benefit from the continued management by the Adviser.
Costs of Services Provided and Profits Realized by the Adviser: The Board examined the fee and expense information for the Funds, including a comparison of such information to the Peer Funds using information provided by the Adviser from the Morningstar database. The Board noted that each Fund’s advisory fee was above the average and median in relation to the Peer Funds. The Board also reviewed and considered management fees charged by the Adviser to other investment advisory clients and found that the investment management fee paid by the Funds was identical to what the Adviser charges on the first $25 million of a separately managed account, unless otherwise negotiated. The Board recognized the extent of the significant additional services provided to each Fund that the Adviser did not provide to its other clients, such as certain administrative services, oversight of the Fund’s other service providers, regulatory compliance and various other services.
The Board also examined the total expense ratio of each Fund relative to the Peer Funds based on the Morningstar data provided by the Adviser. The Board noted that the Small Cap Growth Fund’s total expense ratio after fee waivers and expense reimbursements by the Adviser of 1.10% was greater than the median and the average compared to the Peer Funds. The Board noted that the Small Cap Value Fund’s Institutional class’ total expense ratio of 1.11% and the Investor Class’ total expense ratio of 1.36% after fee waivers and expense reimbursements by the Adviser pursuant to the Adviser’s expense cap agreement were less than the Peer Funds’ median and average.
The Board also reviewed information provided by the Adviser regarding each Fund’s Morningstar category averages, noting that the Small Cap Growth Fund’s net expense ratio of 1.10% was below the Morningstar Small Growth category average of 1.30% and that the Small Cap Value Fund’s Institutional class’ net expense ratio of 1.11% was below both the Morningstar Small Blend category of 1.22% and the Small Value category average of 1.31%.
The Board noted that given the size of the Funds, the Adviser continued to waive fees. While the Funds were profitable to the Adviser, the Board noted that the Adviser’s profitability analysis did not include any allocation of direct or indirect expenses associated with the Adviser’s management of the Funds. The Board reviewed and considered the general financial condition of the Adviser and determined it to be sound. The Board also
| Annual Report | June 30, 2017 | 27 |
| | Additional Information |
June 30, 2017 (Unaudited)
reviewed information regarding revenue sharing payments, noting that any payments by the Adviser to third‐party platforms were made from the Adviser’s reasonable profits associated with its overall advisory business. In light of all of the information that it received and considered, the Board concluded that the management fee and total expense ratio of each Fund were reasonable.
Economies of Scale and Fee Levels Reflecting Those Economies: The Board noted that the Funds’ advisory fee structure does not contain any breakpoint reductions as the Funds grow in size. However, the Board recognized that the Adviser has been waiving fees since each Fund’s inception. The Board also considered the Adviser’s verbal representation that it would consider evaluating advisory fee breakpoints in the future.
The Directors concluded that the current fee structure of each Fund was reasonable and that breakpoint reductions may be considered in the future depending on Fund asset levels.
Benefits Derived from the Relationship with the Funds: The Board noted that the Adviser derives ancillary benefits from its association with the Funds in the form of research products and services received from unaffiliated broker dealers who execute portfolio trades for the Funds. However, the Board determined such products and services have been used for legitimate purposes relating to the Funds by providing assistance in the investment decision‐making process. The Board concluded that the other benefits realized by the Adviser from its relationship with the Funds were appropriate.
Based on its evaluation of the above factors, as well as other factors relevant to their consideration of the Advisory Agreement, the Directors, including all of the Independent Directors, concluded that continuation of the Advisory Agreement was in the best interest of each Fund and its shareholders.
| 28 | 1-855-612-3936 | www.cortinafunds.com |
| | Board of Directors and Officers |
Overall responsibility for management of the Funds rests with the Board of Directors (the “Directors”). The Directors serve during the lifetime of the Corporation and until its termination, or until death, resignation, retirement or removal. The Directors, in turn, elect the officers of the Funds to actively supervise the day‐to‐day operations. The officers have been elected for an annual term. The following are the Directors and executive officers of the Funds:
| Independent Directors | | | | |
| Name and Age | Position(s) Held with the Funds | Length of Time Served | Principal Occupation(s) During Past 5 Years | Number of Funds in Fund Complex Overseen by Director | Other Directorships Held by Director |
| Mark J. Giese, 45 | Independent Director | Since Inception | President, Riverwood Business Consulting, LLC, a business and management firm (December 2009‐present); Chief Financial Officer, Datatrac Corporation, a financial research firm (January 2009‐December 2009); Vice President, Nicholas Company, Inc., an investment management firm (June 1994‐January 2009); Vice President, Nicholas Fund, Inc., Nicholas II, Inc., Nicholas Limited Edition, Inc. and Nicholas Equity Income Fund, Inc., each a registered investment company (June 1994‐ January 2009); Senior Vice President, Nicholas Family of Funds, Inc., a registered investment company (June 1994‐ January 2009) | 2 | None |
| John T. Murphy, 53 | Independent Director | Since Inception | President, Technical Equipment Sales Co. (October 2016‐ present); Vice President, Morris Group, Inc., a machine tool distributor (October 2014‐September 2016); President and Founding Partner, Morris Midwest, LLC, a machine tool distributor (May 2006‐September 2014) | 2 | None |
| Interested Director | | | | |
| Ryan T. Davies, 43* | Chairman, President and Interested Director | Since Inception | Senior Equity Analyst, Cortina Asset Management, LLC (2004‐present) | 3 | None |
| Officers | | | | | |
| Eric Conner, 32 | Treasurer and Principal Accounting Officer | Since November 2013 | Business and Operations Analyst, Cortina Asset Management, LLC (2012‐present); Portfolio Finance Analyst, Stark Investments (2011‐2012); Senior Corporate Accountant, Stark Investments (2008‐2011) |
| Lori K. Hoch, 46 | Secretary, Anti‐Money Laundering Officer and Chief Compliance Officer | Since Inception | Principal and Chief Operating Officer and Chief Compliance Officer, Cortina Asset Management, LLC (2004‐present) |
| * | Mr. Davies is considered an “interested director” of Cortina as defined under the 1940 Act by virtue of his position with the Adviser. |
The business address of the officers and directors affiliated with the Adviser is 825 North Jefferson Street, Suite 400, Milwaukee, Wisconsin 53202. The address for each Independent Director is c/o Cortina Funds, 825 North Jefferson Street, Suite 400, Milwaukee, Wisconsin 53202.
Additional information about members of the Board of Directors and Officers is available in the Statement of Additional Information (SAI). To obtain a free copy of the SAI, please call 1‐855‐612‐3936.
| Annual Report | June 30, 2017 | 29 |
Material must be accompanied or preceded by the prospectus.
The Cortina Funds are distributed by ALPS Distributors, Inc.
Item 2. Code of Ethics.
Item 3. Audit Committee Financial Expert.
The Board of Directors of the Registrant has determined that the Registrant has at least one Audit Committee Financial Expert serving on its audit committee. The Registrant’s Audit Committee Financial Expert is Mr. John F. Murphy, Independent Trustee and Audit Committee Chair.
Item 4. Principal Accountant Fees and Services.
Item 5. Audit Committee of Listed Registrants.
Not applicable to Registrant.
Item 6. Investments.
Item 7. Disclosure of Proxy Voting Policies and Procedures for Closed-End Management Investment Companies.
Not applicable to the Registrant.
Item 8. Portfolio Managers of Closed-End Management Investment Companies.
Not applicable to the Registrant.
Item 9. Purchases of Equity Securities by Closed-End Management Investment Company and Affiliated Purchasers.
Not applicable to the Registrant.
Item 10. Submission of Matters to a Vote of Security Holders.
The Registrant has not adopted procedures by which shareholders may recommend nominees to the Registrant’s Board of Directors.
Item 11. Controls and Procedures.
Item 12. Exhibits.
Pursuant to the requirements of the Securities Exchange Act of 1934 and the Investment Company Act of 1940, the registrant has duly caused this report to be signed on its behalf by the undersigned, thereunto duly authorized.
Pursuant to the requirements of the Securities Exchange Act of 1934 and the Investment Company Act of 1940, this report has been signed below by the following persons on behalf of the registrant and in the capacities and on the dates indicated.