UNITED STATES
SECURITIES AND EXCHANGE COMMISSION
Washington, D.C. 20549
FORM N-CSR
CERTIFIED SHAREHOLDER REPORT OF REGISTERED
MANAGEMENT INVESTMENT COMPANIES
Investment Company Act file number: 811-21580
CORTINA FUNDS, INC.
(Exact name of registrant as specified in charter)
825 N. Jefferson St., Suite 400, Milwaukee, WI 53202
(Address of principal executive offices) (Zip code)
(414) 225-7365
Registrant’s telephone number, including area code
Lori Hoch
825 N. Jefferson St., Suite 400
Milwaukee, WI 53202
(Name and address of agent for service)
Date of fiscal year end: June 30
Date of reporting period: July 1, 2013 - June 30, 2014
Item 1. Reports to Stockholders.
ANNUAL REPORT | June 30, 2014 CORTINA SMALL CAP GROWTH FUND CORTINA SMALL CAP VALUE FUND CORTINA FUNDS
TABLE OF CONTENTS
| | |

| | Shareholder Letter |
Cortina Small Cap Growth Fund | | June 30, 2014 (Unaudited) |
DEAR FELLOW SHAREHOLDERS:
The Cortina Small Cap Growth Fund had a difficult finish to its fiscal year. For the six months ending June 30, 2014, the Fund meaningfully underperformed the Russell 2000 Growth Index and was down in absolute terms. For the full fiscal year, the Fund reported solid positive returns though trailed the benchmark significantly. Simplistic attribution analysis indicates that security selection within the Technology and Healthcare sectors was our primary detractor while security selection within the Consumer Discretionary sector was the sole bright spot. To better put the disappointing performance in context, however, it is helpful to consider how the fiscal year unfolded.
As we approached the end of 2013, we began to recognize that certain areas of the small cap market were being afforded valuations that were less and less grounded in economics and were increasingly based on momentum and market adoration. Indeed, we highlighted in our semi-annual letter that these rising valuations were behind an aggressive round of profit taking in the Fund portfolio. That profit taking continued into the New Year when the small cap market began to show some initial signs of weakness. By the end of the March quarter, the portfolio looked quite a bit different than the way it looked at the beginning of the fiscal year. Over that nine month period, we exited 37 holdings representing approximately 1/3 of portfolio assets and initiated 43 new positions. Being nimble in a volatile market that was becoming increasingly valuation aware proved to our advantage as we slightly outperformed in the March quarter and were only modestly behind for the nine months. The positions we exited included many stocks that had heretofore been standout performers and had appreciated to valuations that were unrealistic in our minds. The new positions were by and large less expensive companies that met our quality growth investment criteria. Given our aggregate performance to date and the fact that we had outperformed in the down months of January and March, we felt well positioned to withstand any further rotational headwinds.
While the small cap market showed initial signs of weakness in January, a full blown rotation away from small cap growth in favor of large cap value began in earnest in early March. From March 4th through May 15th, large cap value stocks (as measured by the Russell 1000 Value Index) were up roughly 1.4% whereas small cap growth stocks (as measured by the Russell 2000 Growth Index) were down approximately 12.4%! Our efforts to insulate the portfolio proved futile and we gave up significant ground during this period. Two things were at play.
First, companies were reporting and/or pre-announcing March quarter earnings during the heart of the rotation. While sales and revenue “misses” are not uncommon, especially in dynamic small cap growth companies, we experienced a higher number of sales and earnings disappointments among fund holdings than is typical. Many of these disappointments can be at least partially attributed to the severe weather that gripped large parts of the nation but because they occurred during a market rotation away from small cap growth the stock price impact was severe. In fact, there was a three-week period during the rotation (April 17th – May 8th) that contained many of these disappointments and accounted for more than half of the Fund’s underperformance over the entire fiscal year.
The second factor that rendered our positioning efforts less effective was that valuation methodology turned out to be as important, or more so, than valuation level. Growth companies, and in particular small cap growth companies, are not yet in the profit maximization phase of their lifecycles. The management teams of these companies are actively foregoing short-term profit maximization in favor of reinvesting in the business for optimum revenue growth. Given the focus on revenue growth, it makes little sense to value these companies on their current earnings even if they are profitable. Instead, we value these companies on an enterprise value to sales ratio. As of the end of the March quarter, we were valuing approximately 40% of fund holdings on a revenue basis as opposed to an earnings basis which is consistent with the strategy’s history. This 40% of holdings accounted for nearly 90% of our adverse performance in the June quarter.
Consider the following example. In the fall of 2013, we began to reduce our exposure to a life sciences company that had experienced significant appreciation (Company A). Around the same time, we initiated a new position in another life sciences company (Company B). Each company had similarly priced products and a similar customer base. While neither company was profitable, we believed they each had sufficient cash holdings to fund operations to profitability. These stocks both performed very well through the middle of March. Along the way we completely exited our position in Company A and continued to build a position in Company B. When the Russell 2000 Growth Index peaked on March 4th, Company A was valued at 11.6x 2014 and 9.0x 2015 sales estimates and Company B was valued at 6.2x 2014 and 4.0x 2015 sales estimates. Company B was afforded a significantly lower valuation despite significantly higher estimated organic growth. Company A’s stock price went on to fall 47% and Company B’s stock fell 39% to their respective lows despite Company A issuing disappointing guidance and Company B affirming its previous guidance. The dominant factor impacting stock performance was the fact that both companies valuations were based on revenue multiples. We remain enthused about the prospects of Company B and used the weakness as an opportunity to increase our position size.
Outlook
We are eager to see how July quarter earnings come in but for a variety of reasons, trepidation is present. First of all, as mentioned above, the first quarter profit picture was not a rosy one. A strong earnings season would validate the notion that Q1 weakness was merely a weather-induced blip as opposed to a sign of a stalling economy. On the other hand, a disappointing Q2 earnings season is likely to be viewed as confirmation that the stubbornly slow growth economy has taken a pronounced turn for the worse. Quarterly earnings results should help clear the picture and our focus
| | |
| | | |
Annual Report | June 30, 2014 | | 1 |
| | |
| | Shareholder Letter |
Cortina Small Cap Growth Fund | | June 30, 2014 (Unaudited) |
will be on the cadence of results as companies progressed through the quarter given that disruptive weather patterns continued into April. Regardless of how the earnings season turns out, it is our belief that the burden of proof may be particularly high for stocks that have returned to or are approaching double digit sales multiples. Our belief is that the burden of proof should be much lower for stocks with more grounded valuations. Recent results notwithstanding we believe that the work we’ve done to position the portfolio in stocks with more grounded valuations will ultimately prove beneficial and we remain optimistic.
Investing involves risks, including loss of principal.
The Russell 1000 Index measures the performance of the large-cap segment of the U.S. equity universe. It is a subset of the Russell 3000® Index and includes approximately 1000 of the largest securities based on a combination of their market cap and current index membership.
| | |
| | | |
2 | | 1-855-612-3936 | www.cortinafunds.com |
| | |
| | Portfolio Information |
Cortina Small Cap Growth Fund | | June 30, 2014 (Unaudited) |
Growth of $25,000 Investment (Unaudited)
For the period from September 30, 2011 (Inception) to June 30, 2014.
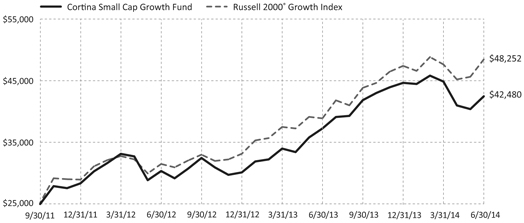
This graph assumes an initial $25,000 investment at September 30, 2011 (Inception Date). The Cortina Small Cap Growth Fund (the “Fund”) will deduct a 2.00% redemption proceeds fee on Fund shares held 60 days or less. This graph depicts the performance of the Fund versus the Russell 2000® Growth Index. It is important to note the Fund is a professionally managed mutual fund while the index is not available for investment and is unmanaged. The comparison is shown for illustrative purposes only.
This chart does not reflect the deduction of taxes that a shareholder would pay on Fund distributions or the redemption of Fund shares.
Performance Returns for the period ended June 30, 2014
| | | | | | | | | | |
| | | 1 Month | | 6 Months | | 1 Year | | Since Inception* | | Gross
Expense Ratio** |
Cortina Small Cap Growth Fund | | 5.14% | | -4.89% | | 13.99% | | 21.26% | | 3.86% |
Russell 2000® Growth Index | | 6.20% | | 2.22% | | 24.73% | | 27.00% | | |
| * | The Fund’s inception date is September 30, 2011. |
| ** | Cortina Asset Management, LLC (the “Adviser”) has contractually agreed to waive management fees and/or reimburse the Fund’s operating expenses in order to limit the Fund’s total annual fund operating expenses (excluding taxes, leverage, interest, brokerage commissions, dividends or interest expenses on short positions, acquired fund fees and expenses and extraordinary expenses) to 1.10% of average daily net assets of the Fund. The agreement will continue in effect at least through October 31, 2015, subject thereafter to annual re-approval of the agreement by the Fund’s Board of Directors. |
Past performance does not guarantee future results. The performance data quoted represents past performance and current returns may be lower or higher. Total return figures include change in share price, reinvestment of dividends and capital gains. The investment return and principal value will fluctuate so that an investor’s shares, when redeemed may be worth more or less than their original cost. To obtain performance information current to the most recent month end, call 1-855-612-3936.
Russell 2000® Growth Index measures the performance of the small-cap growth segment of the U.S. equity universe. It includes those Russell 2000 companies with higher price-to-value ratios and higher forecasted growth values. All indices are unmanaged. It is not possible to invest directly in an index.
Sector Allocations***
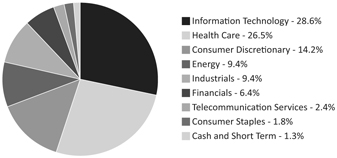
*** Percentages are based on Total Portfolio as of June 30, 2014. Holdings are subject to change.
| | |
| | | |
Annual Report | June 30, 2014 | | 3 |
| | |
| | Shareholder Letter |
| Cortina Small Cap Value Fund | | June 30, 2014 (Unaudited) |
DEAR FELLOW SHAREHOLDERS:
With the close of trading on June 30, 2014, the Cortina Small Cap Value has posted returns modestly below its benchmark, the Russell 2000 Value Index for the past six months. In addition to several company specific disappointments, the strategy’s high weighting in banks, which do better in a rising rate environment, and underweighting in Real Estate Investment Trusts (REITs) and utilities, which do well in a falling rate environment, created a material drag on returns as a rally in U.S. Treasuries lowered the benchmark 10-year yield by about half a percentage point in the first half of the year.
As active managers we focus generally on one thing: finding companies changing for the better. Our philosophy and process are unchanged, but as participants in financial markets, when shifts in interest rates impact our portfolio, questions should be asked. In this case, is the market shift reflecting a change in the prospects for the underlying economy that will show up in company results, and thus equity prices, six months from now? Or is it just an aberration driven by fewer Treasuries available to trade? What we do know is that in evaluating our peers’ results, some of the best performing managers in the period up to March 31, 2014, did very poorly in 2Q14, and vice-versa. Our performance reflected a similar pattern. There is information within this shift that we continue to sift through as we evaluate our current opportunity set.
Based upon recent commentary from the Federal Reserve, the Fed is looking to become less involved in the markets and will let normalization occur. Bond buying is now expected to end in October of 2014. Perhaps rates will even go up soon after that. Janet Yellen herself is a labor economist and, one might surmise, is less than pleased with lackluster wage growth while hard assets owned by the already wealthy have appreciated mightily, furthering the wealth gap. An increase in rates may impinge upon asset valuation expansion yet, if measured in pace, may do so without slowing the employment trends thus serving two ends.
Our general view is that the economy is in decent shape but there are some riptides developing. Social media companies may be overvalued and get media attention, but the recently disappointing consumer companies are of a greater concern. Gas prices are elevated and individuals must pay more for health care, on average. Home prices in aggregate may seem reasonable, but in many key markets, younger buyers are simply priced out.
Based upon the current portfolio, The Cortina Small Cap Value Fund is, on the whole, positioned to benefit from rising rates. The portfolio is underweight utilities and underweight traditional REITs, two groups whose performance has a very high correlation to rate moves almost regardless of fundamentals. Unless the strategy moves into those sectors in size, further declines in rates may pressure our relative performance. We remain overweight in Industrials and Technology and have been increasing our exposure to Health Care. Consumer Discretionary is a lighter weight, as we have sold some recent holdings, yet at the same time, we are adding new ones. It is one of the few areas within the market that has an abundance of disliked yet rapidly evolving companies that may make their way into the portfolio.
Considering the massive amount of change within the economy and the volatility of economic data year-to-date, we expect second quarter earnings reports to contain some surprises: hopefully for the better in companies we own, and hopefully for the worse in companies we do not. As we sort through the coming weeks’ earnings reports, we expect multiple opportunities to invest your hard-earned capital in attractive investments.
We thank you for your interest and continued investment in the Cortina Small Cap Value Strategy.
Investing involves risks, including loss of principal.
| | |
| | | |
4 | | 1-855-612-3936 | www.cortinafunds.com |
| | |
| | Portfolio Information |
| Cortina Small Cap Value Fund | | June 30, 2014 (Unaudited) |
Growth of $25,000 Investment (Unaudited)
For the period from September 30, 2011 (Inception) to June 30, 2014.
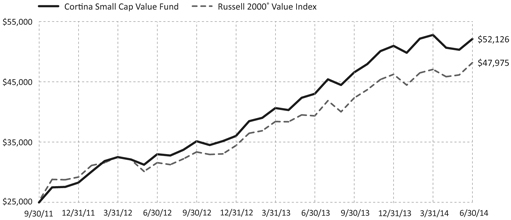
This graph assumes an initial $25,000 investment at September 30, 2011 (Inception Date). The Cortina Small Cap Value Fund (the “Fund”) will deduct a 2.00% redemption proceeds fee on Fund shares held 60 days or less. This graph depicts the performance of the Fund versus the Russell 2000® Value Index. It is important to note the Fund is a professionally managed mutual fund, while the index is not available for investment and is unmanaged. The comparison is shown for illustrative purposes only.
This chart does not reflect the deduction of taxes that a shareholder would pay on Fund distributions or the redemption of Fund shares.
Performance Returns for the period ended June 30, 2014
| | | | | | | | | | |
| | | 1 Month | | 6 Months* | | 1 Year* | | Since Inception* | | Gross
Expense Ratio** |
Cortina Small Cap Value Fund - Institutional | | 3.55% | | 2.25% | | 21.14% | | 30.62% | | 5.57% |
Cortina Small Cap Value Fund - Investor | | 3.55% | | 2.16% | | 20.89% | | 30.32% | | 5.82% |
Russell 2000® Value Index | | 4.42% | | 4.20% | | 22.54% | | 26.74%*** | | |
| * | The Fund’s Institutional shares inception date is September 30, 2011, Investor shares inception date is April 30, 2014. The performance shown for Investor shares for periods pre-dating the commencement of operations of that class reflects the performance of the Fund’s Institutional shares, the initial share class, calculated using the fees and expenses of Investor shares. If Investor shares of the Fund had been available during periods prior to April 30, 2014, the performance shown may have been different. |
| ** | Cortina Asset Management, LLC (the “Adviser”) has contractually agreed to waive management fees and/or reimburse the Fund’s operating expenses in order to limit the Fund’s total annual fund operating expenses (excluding 12b-1 fees, taxes, leverage, interest, brokerage commissions, dividends or interest expenses on short positions, acquired fund fees and expenses and extraordinary expenses) to 1.10% of average daily net assets of the Fund. The agreement will continue in effect at least through October 31, 2015, subject thereafter to annual re-approval of the agreement by the Fund’s Board of Directors. |
| *** | Represents the period from September 30, 2011 (date of original public offering of the Institutional shares) through June 30, 2014. |
Past performance does not guarantee future results. The performance data quoted represents past performance and current returns may be lower or higher. Total return figures include change in share price, reinvestment of dividends and capital gains. The investment return and principal value will fluctuate so that an investor’s shares, when redeemed may be worth more or less than their original cost. To obtain performance information current to the most recent month end, call 1-855-612-3936.
Russell 2000® Value Index measures the performance of those Russell 2000 companies with lower price-to-book ratios and lower forecasted growth values. All indices are unmanaged. It is not possible to invest directly in an index.
Sector Allocations****
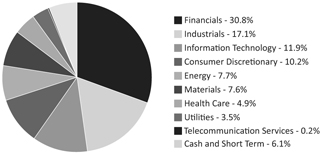
**** Percentages are based on Total Portfolio as of June 30, 2014. Holdings are subject to change.
| | |
| | | |
Annual Report | June 30, 2014 | | 5 |
| | |
| | Disclosure of Fund Expenses |
| | June 30, 2014 (Unaudited) |
As a shareholder of the Fund(s), you incur ongoing costs, including management fees and other Fund expenses. This example is intended to help you understand your ongoing costs (in dollars) of investing in each Fund and to compare these costs with the ongoing costs of investing in other mutual funds. The example is based on an investment of $1,000 invested at the beginning of the period and held for the entire period, as indicated below.
Actual Expenses – The first line of the table below provides information about the actual account values and actual expenses. You may use the information in this line, together with the amount you invested, to estimate the expenses that you paid over the period. Simply divide your account value by $1,000 (for example, an $8,600 account value divided by $1,000 = 8.6) then multiply the result by the number in the first line under the heading entitled “Expenses Paid During Period” to estimate the expenses you paid on your account during this period.
Hypothetical Example for Comparison Purposes – The second line of the table below provides information about hypothetical account values and hypothetical expenses based on each Fund’s actual expense ratio and an assumed annual rate of return of 5% before expenses, which is not each Fund’s actual return. The hypothetical account values and expenses may not be used to estimate the actual ending account balance or expenses you paid for the period. You may use this information to compare the ongoing costs of investing in each Fund and other funds by comparing these 5% hypothetical examples with the 5% hypothetical examples that appear in the shareholder reports of other funds.
Please note that the expenses shown in the table are meant to highlight your ongoing costs only and do not reflect any direct costs, such as wire fees or low balance fees. Therefore, the second line of the table is useful in comparing ongoing costs and will not help you determine the relative total costs of owning different funds. In addition, if these direct costs were included, your costs would be higher.
| | | | | | | | | | | | | | | | |
| | | Beginning Account Value January 1, 2014 | | | Ending Account Value June 30, 2014 | | | Expenses Paid During Period(a) | | | Net Expense Ratios(b) | | |
Cortina Small Cap Growth Fund - Institutional | | | | | | | | | | | | | | | | |
Actual Fund Return | | $ | 1,000.00 | | | $ | 951.10 | | | $ | 5.32 | | | 1.10% | | |
Hypothetical Fund Return (assuming a 5% return before expenses) | | $ | 1,000.00 | | | $ | 1,019.34 | | | $ | 5.51 | | | 1.10% | | |
Cortina Small Cap Value Fund - Institutional | | | | | | | | | | | | | | | | |
Actual Fund Return | | $ | 1,000.00 | | | $ | 1,022.50 | | | $ | 5.52 | | | 1.10% | | |
Hypothetical Fund Return (assuming a 5% return before expenses) | | $ | 1,000.00 | | | $ | 1,019.34 | | | $ | 5.51 | | | 1.10% | | |
Cortina Small Cap Value Fund - Investor(c) | | | | | | | | | | | | | | | | |
Actual Fund Return | | $ | 1,000.00 | | | $ | 1,028.70 | | | $ | 2.29 | | | 1.35% | | |
Hypothetical Fund Return (assuming a 5% return before expenses) | | $ | 1,000.00 | | | $ | 1,018.10 | | | $ | 6.76 | | | 1.35% | | |
| (a) | Expenses are equal to the Fund’s annualized expense ratio multiplied by the average account value over the period, multiplied by the number of days in the most recent fiscal half year (181), divided by 365. |
| (b) | Annualized, based on the Fund’s most recent half-year expenses. |
| (c) | The actual expenses paid during the period are based on the inception of operations on April 30, 2014. |
| | |
| | | |
6 | | 1-855-612-3936 | www.cortinafunds.com |
| | |
| | Schedule of Investments |
Cortina Small Cap Growth Fund | | June 30, 2014 |
| | | | | | | | |
| | | Shares | | | Value | |
COMMON STOCKS (105.5%) | | | | | | | | |
Consumer Discretionary (15.2%) | | | | | | | | |
Chuy’s Holdings, Inc.(a) | | | 7,316 | | | $ | 265,571 | |
EW Scripps Co., Class A(a) | | | 12,473 | | | | 263,929 | |
Fiesta Restaurant Group, Inc.(a) | | | 10,783 | | | | 500,439 | |
Five Below, Inc.(a) | | | 10,393 | | | | 414,785 | |
Gentherm, Inc.(a) | | | 5,077 | | | | 225,673 | |
Imax Corp.(a) | | | 12,231 | | | | 348,339 | |
Kona Grill, Inc.(a) | | | 11,746 | | | | 227,990 | |
Motorcar Parts of America, Inc.(a) | | | 20,271 | | | | 493,599 | |
Nautilus, Inc.(a) | | | 32,117 | | | | 356,177 | |
Noodles & Co.(a) | | | 8,462 | | | | 291,008 | |
Restoration Hardware Holdings, Inc.(a) | | | 3,908 | | | | 363,639 | |
Shutterfly, Inc.(a) | | | 8,959 | | | | 385,774 | |
Tumi Holdings, Inc.(a) | | | 16,725 | | | | 336,674 | |
Universal Electronics, Inc.(a) | | | 6,735 | | | | 329,207 | |
| | | | | | | | |
| | | | | | | 4,802,804 | |
| | | | | | | | |
Consumer Staples (1.9%) | | | | | | | | |
Boulder Brands, Inc.(a) | | | 31,644 | | | | 448,712 | |
Craft Brew Alliance, Inc.(a) | | | 13,991 | | | | 154,740 | |
| | | | | | | | |
| | | | | | | 603,452 | |
| | | | | | | | |
Energy (10.1%) | | | | | | | | |
American Eagle Energy Corp.(a) | | | 42,283 | | | | 253,275 | |
Carrizo Oil & Gas, Inc.(a) | | | 5,683 | | | | 393,605 | |
Evolution Petroleum Corp. | | | 22,258 | | | | 243,725 | |
Matador Resources Co.(a) | | | 10,152 | | | | 297,251 | |
Penn Virginia Corp.(a) | | | 21,446 | | | | 363,510 | |
Profire Energy, Inc.(a) | | | 31,828 | | | | 143,544 | |
Rex Energy Corp.(a) | | | 19,250 | | | | 340,917 | |
RigNet, Inc.(a) | | | 8,156 | | | | 438,956 | |
Sanchez Energy Corp.(a) | | | 11,249 | | | | 422,850 | |
Triangle Petroleum Corp.(a) | | | 24,816 | | | | 291,588 | |
| | | | | | | | |
| | | | | | | 3,189,221 | |
| | | | | | | | |
Financials (6.8%) | | | | | | | | |
BofI Holding, Inc.(a) | | | 2,989 | | | | 219,602 | |
eHealth, Inc.(a) | | | 6,703 | | | | 254,513 | |
EverBank Financial Corp. | | | 19,115 | | | | 385,358 | |
Health Insurance Innovations, Inc., Class A(a) | | | 25,127 | | | | 309,565 | |
ICG Group, Inc.(a) | | | 13,062 | | | | 272,735 | |
Pinnacle Financial Partners, Inc. | | | 7,511 | | | | 296,534 | |
Regional Management Corp.(a) | | | 12,339 | | | | 190,884 | |
Tristate Capital Holdings, Inc.(a) | | | 15,286 | | | | 215,991 | |
| | | | | | | | |
| | | | | | | 2,145,182 | |
| | | | | | | | |
Health Care (28.3%) | | | | | | | | |
ABIOMED, Inc.(a) | | | 11,470 | | | | 288,356 | |
AtriCure, Inc.(a) | | | 34,540 | | | | 634,845 | |
BioTelemetry, Inc.(a) | | | 48,197 | | | | 345,572 | |
Cepheid(a) | | | 6,633 | | | | 317,986 | |
Cerus Corp.(a) | | | 45,792 | | | | 190,037 | |
Endologix, Inc.(a) | | | 31,871 | | | | 484,758 | |
HealthStream, Inc.(a) | | | 13,968 | | | | 339,422 | |
HeartWare International, Inc.(a) | | | 3,853 | | | | 340,990 | |
Icad, Inc.(a) | | | 34,420 | | | | 220,632 | |
InspireMD, Inc.(a) | | | 82,102 | | | | 242,201 | |
MiMedx Group, Inc.(a) | | | 27,912 | | | | 197,896 | |
NanoString Technologies, Inc.(a) | | | 19,705 | | | | 294,590 | |
Neogen Corp.(a) | | | 8,731 | | | | 353,344 | |
| | |
See Notes to Financial Statements. | | |
Annual Report | June 30, 2014 | | 7 |
| | |
| | Schedule of Investments |
Cortina Small Cap Growth Fund | | June 30, 2014 |
| | | | | | | | |
| | | Shares | | | Value | |
COMMON STOCKS (continued) | | | | | | | | |
Health Care (continued) | | | | | | | | |
NeoGenomics, Inc.(a) | | | 99,908 | | | $ | 331,695 | |
NxStage Medical, Inc.(a) | | | 35,084 | | | | 504,157 | |
OraSure Technologies, Inc.(a) | | | 57,425 | | | | 494,429 | |
Oxford Immunotec Global PLC(a) | | | 14,694 | | | | 247,300 | |
Quidel Corp.(a) | | | 10,958 | | | | 242,281 | |
The Spectranetics Corp.(a) | | | 22,987 | | | | 525,943 | |
STAAR Surgical Co.(a) | | | 30,822 | | | | 517,810 | |
Streamline Health Solutions, Inc.(a) | | | 41,160 | | | | 197,568 | |
Synergetics USA, Inc.(a) | | | 67,289 | | | | 208,596 | |
Tandem Diabetes Care, Inc.(a) | | | 14,733 | | | | 239,559 | |
TearLab Corp.(a) | | | 58,697 | | | | 285,854 | |
Trinity Biotech PLC, Sponsored ADR | | | 14,993 | | | | 345,289 | |
Uroplasty, Inc.(a) | | | 62,652 | | | | 167,907 | |
Vocera Communications, Inc.(a) | | | 31,960 | | | | 421,872 | |
| | | | | | | | |
| | | | | | | 8,980,889 | |
| | | | | | | | |
Industrials (10.0%) | | | | | | | | |
Aegean Marine Petroleum Network, Inc. | | | 32,289 | | | | 325,796 | |
Franklin Covey Co.(a) | | | 7,817 | | | | 157,356 | |
Heritage Crystal Clean, Inc.(a) | | | 11,897 | | | | 233,538 | |
Insteel Industries, Inc. | | | 15,597 | | | | 306,481 | |
Manitex International, Inc.(a) | | | 25,851 | | | | 419,820 | |
Marten Transport, Ltd. | | | 5,700 | | | | 127,395 | |
Quality Distribution, Inc.(a) | | | 22,165 | | | | 329,372 | |
Roadrunner Transportation Systems, Inc.(a) | | | 10,175 | | | | 285,918 | |
Team, Inc.(a) | | | 7,060 | | | | 289,601 | |
Trex Co., Inc.(a) | | | 10,890 | | | | 313,850 | |
Wesco Aircraft Holdings, Inc.(a) | | | 9,567 | | | | 190,957 | |
Westport Innovations, Inc.(a) | | | 11,153 | | | | 200,977 | |
| | | | | | | | |
| | | | | | | 3,181,061 | |
| | | | | | | | |
Information Technology (30.6%) | | | | | | | | |
Amber Road, Inc.(a) | | | 8,657 | | | | 139,637 | |
Brightcove, Inc.(a) | | | 31,834 | | | | 335,530 | |
Clicksoftware Technologies, Ltd. | | | 41,271 | | | | 333,057 | |
EnerNOC, Inc.(a) | | | 15,137 | | | | 286,846 | |
Envestnet, Inc.(a) | | | 7,139 | | | | 349,240 | |
Everyday Health, Inc.(a) | | | 14,102 | | | | 260,605 | |
Extreme Networks, Inc.(a) | | | 85,657 | | | | 380,317 | |
Imperva, Inc.(a) | | | 9,356 | | | | 244,940 | |
Infoblox, Inc.(a) | | | 15,783 | | | | 207,546 | |
Inphi Corp.(a) | | | 30,850 | | | | 452,878 | |
Integrated Silicon Solution, Inc. | | | 26,932 | | | | 397,786 | |
Interactive Intelligence Group, Inc.(a) | | | 4,623 | | | | 259,489 | |
Internap Network Services Corp.(a) | | | 52,987 | | | | 373,558 | |
InterXion Holding NV(a) | | | 18,433 | | | | 504,696 | |
Marchex, Inc., Class B | | | 33,779 | | | | 406,024 | |
MaxLinear, Inc., Class A(a) | | | 41,123 | | | | 414,109 | |
Maxwell Technologies, Inc.(a) | | | 14,399 | | | | 217,857 | |
Move, Inc.(a) | | | 19,756 | | | | 292,191 | |
Numerex Corp., Class A(a) | | | 29,666 | | | | 340,862 | |
Perficient, Inc.(a) | | | 17,760 | | | | 345,787 | |
Planet Payment, Inc.(a) | | | 112,260 | | | | 318,818 | |
Procera Networks, Inc.(a) | | | 31,403 | | | | 316,856 | |
PROS Holdings, Inc.(a) | | | 10,140 | | | | 268,102 | |
Q2 Holdings, Inc.(a) | | | 11,596 | | | | 165,359 | |
Qlik Technologies, Inc.(a) | | | 11,345 | | | | 256,624 | |
| | |
See Notes to Financial Statements. | | |
8 | | 1-855-612-3936 | www.cortinafunds.com |
| | |
| | Schedule of Investments |
Cortina Small Cap Growth Fund | | June 30, 2014 |
| | | | | | | | |
| | | Shares | | | Value | |
COMMON STOCKS (continued) | | | | | | | | |
Information Technology (continued) | | | | | | | | |
RADWARE, Ltd.(a) | | | 19,761 | | | $ | 333,368 | |
Rubicon Technology, Inc.(a) | | | 33,798 | | | | 295,732 | |
SciQuest, Inc.(a) | | | 14,037 | | | | 248,315 | |
ShoreTel, Inc.(a) | | | 43,801 | | | | 285,583 | |
WebMD Health Corp.(a) | | | 9,522 | | | | 459,913 | |
Xoom Corp.(a) | | | 7,369 | | | | 194,247 | |
| | | | | | | | |
| | | | | | | 9,685,872 | |
| | | | | | | | |
Telecommunication Services (2.6%) | | | | | | | | |
8x8, Inc.(a) | | | 29,569 | | | | 238,918 | |
inContact, Inc.(a) | | | 63,497 | | | | 583,537 | |
| | | | | | | | |
| | | | | | | 822,455 | |
| | | | | | | | |
| | |
TOTAL COMMON STOCKS | | | | | | | | |
(COST $29,642,176) | | | | | | | 33,410,936 | |
| | | | | | | | |
| | |
SHORT TERM INVESTMENT (1.4%) | | | | | | | | |
Daily Income Fund - Money Market Portfolio Fiduciary Class Shares, 7 Day Yield 0.010% | | | 424,678 | | | | 424,678 | |
| | | | | | | | |
| | |
TOTAL SHORT TERM INVESTMENT | | | | | | | | |
(COST $424,678) | | | | | | | 424,678 | |
| | | | | | | | |
| | |
TOTAL INVESTMENTS (106.9%) | | | | | | | | |
(COST $30,066,854) | | | | | | | 33,835,614 | |
| | | | | | | | |
| | |
TOTAL LIABILITIES IN EXCESS OF OTHER ASSETS (-6.9%) | | | | | | | (2,178,127) | |
| | | | | | | | |
| | |
NET ASSETS 100.0% | | | | | | $ | 31,657,487 | |
| | | | | | | | |
| (a) | Non Income Producing Security. |
Common Abbreviations:
ADR -American Depositary Receipt
Ltd. - Limited.
NV - Naamloze Vennootschap is the Dutch term for a public limited liability corporation.
PLC - Public Limited Company.
| | |
See Notes to Financial Statements. | | |
Annual Report | June 30, 2014 | | 9 |
| | |
| | Schedule of Investments |
Cortina Small Cap Value Fund | | June 30, 2014 |
| | | | | | | | |
| | | Shares | | | Value | |
COMMON STOCKS (97.1%) | | | | | | | | |
Consumer Discretionary (10.5%) | | | | | | | | |
ANN, Inc.(a) | | | 11,533 | | | $ | 474,468 | |
ClubCorp Holdings, Inc. | | | 28,240 | | | | 523,570 | |
DreamWorks Animation SKG, Inc., Class A(a) | | | 15,909 | | | | 370,043 | |
Helen of Troy, Ltd.(a) | | | 13,210 | | | | 800,922 | |
Performance Sports Group, Ltd.(a) | | | 10,662 | | | | 182,853 | |
Taylor Morrison Home Corp., Class A(a) | | | 29,078 | | | | 651,929 | |
Vera Bradley, Inc.(a) | | | 22,882 | | | | 500,429 | |
Zumiez, Inc.(a) | | | 6,094 | | | | 168,134 | |
| | | | | | | | |
| | | | | | | 3,672,348 | |
| | | | | | | | |
| | |
Energy (7.9%) | | | | | | | | |
Comstock Resources, Inc. | | | 27,749 | | | | 800,281 | |
Helix Energy Solutions Group, Inc.(a) | | | 23,578 | | | | 620,337 | |
Matador Resources Co.(a) | | | 26,952 | | | | 789,155 | |
McDermott International, Inc.(a) | | | 68,749 | | | | 556,179 | |
| | | | | | | | |
| | | | | | | 2,765,952 | |
| | | | | | | | |
| | |
Financials (31.9%) | | | | | | | | |
BancorpSouth, Inc. | | | 26,154 | | | | 642,604 | |
Boston Private Financial Holdings, Inc. | | | 34,395 | | | | 462,269 | |
Capitol Federal Financial, Inc. | | | 26,134 | | | | 317,789 | |
Center Bancorp, Inc. | | | 23,394 | | | | 449,867 | |
CNO Financial Group, Inc. | | | 37,769 | | | | 672,288 | |
Columbia Banking System, Inc. | | | 18,159 | | | | 477,763 | |
Gramercy Property Trust, Inc., REIT | | | 98,850 | | | | 598,043 | |
Hannon Armstrong Sustainable Infrastructure Capital, Inc., REIT | | | 34,816 | | | | 499,261 | |
Kennedy-Wilson Holdings, Inc. | | | 24,641 | | | | 660,872 | |
Maiden Holdings, Ltd. | | | 50,059 | | | | 605,213 | |
MB Financial, Inc. | | | 20,347 | | | | 550,386 | |
National General Holdings Corp. | | | 35,827 | | | | 623,390 | |
OFG Bancorp | | | 30,428 | | | | 560,180 | |
PacWest Bancorp | | | 17,566 | | | | 758,324 | |
PennyMac Mortgage Investment Trust, REIT | | | 23,373 | | | | 512,804 | |
PHH Corp.(a) | | | 10,879 | | | | 249,999 | |
Platinum Underwriters Holdings, Ltd. | | | 7,832 | | | | 507,905 | |
Square 1 Financial, Inc., Class A(a) | | | 23,455 | | | | 445,880 | |
Texas Capital Bancshares, Inc.(a) | | | 10,654 | | | | 574,783 | |
United Financial Bancorp, Inc. | | | 38,873 | | | | 526,729 | |
Waterstone Financial, Inc. | | | 39,446 | | | | 450,079 | |
| | | | | | | | |
| | | | | | | 11,146,428 | |
| | | | | | | | |
| | |
Health Care (5.1%) | | | | | | | | |
Auxilium Pharmaceuticals, Inc.(a) | | | 18,527 | | | | 371,651 | |
Impax Laboratories, Inc.(a) | | | 15,603 | | | | 467,934 | |
IPC The Hospitalist Co., Inc(a) | | | 10,081 | | | | 445,782 | |
Prestige Brands Holdings, Inc.(a) | | | 14,192 | | | | 480,967 | |
| | | | | | | | |
| | | | | | | 1,766,334 | |
| | | | | | | | |
| | |
Industrials (17.6%) | | | | | | | | |
Celadon Group, Inc. | | | 15,848 | | | | 337,879 | |
Cubic Corp. | | | 10,756 | | | | 478,750 | |
FTI Consulting, Inc.(a) | | | 11,600 | | | | 438,712 | |
Furmanite Corp.(a) | | | 37,457 | | | | 436,000 | |
GenCorp, Inc.(a) | | | 24,273 | | | | 463,614 | |
Hyster-Yale Materials Handling, Inc. | | | 4,990 | | | | 441,815 | |
The Manitowoc Co., Inc. | | | 17,504 | | | | 575,182 | |
MasTec, Inc.(a) | | | 9,092 | | | | 280,215 | |
NCI Building Systems, Inc.(a) | | | 34,088 | | | | 662,330 | |
Powell Industries, Inc. | | | 6,953 | | | | 454,587 | |
| | |
See Notes to Financial Statements. | | |
10 | | 1-855-612-3936 | www.cortinafunds.com |
| | |
| | Schedule of Investments |
Cortina Small Cap Value Fund | | June 30, 2014 |
| | | | | | | | |
| | | Shares | | | Value | |
COMMON STOCKS (continued) | | | | | | | | |
Industrials (continued) | | | | | | | | |
Raven Industries, Inc. | | | 12,924 | | | $ | 428,301 | |
TrueBlue, Inc.(a) | | | 26,072 | | | | 718,805 | |
Tutor Perini Corp.(a) | | | 14,253 | | | | 452,390 | |
| | | | | | | | |
| | | | | | | 6,168,580 | |
| | | | | | | | |
Information Technology (12.4%) | | | | | | | | |
Advanced Energy Industries, Inc.(a) | | | 11,451 | | | | 220,432 | |
Digital River, Inc.(a) | | | 38,055 | | | | 587,189 | |
EnerNOC, Inc.(a) | | | 21,778 | | | | 412,693 | |
Integrated Device Technology, Inc.(a) | | | 40,264 | | | | 622,481 | |
Intersil Corp., Class A | | | 38,833 | | | | 580,553 | |
OSI Systems, Inc.(a) | | | 8,466 | | | | 565,106 | |
Semtech Corp.(a) | | | 10,280 | | | | 268,822 | |
Super Micro Computer, Inc.(a) | | | 26,379 | | | | 666,597 | |
Tower Semiconductor, Ltd.(a) | | | 44,906 | | | | 407,746 | |
| | | | | | | | |
| | | | | | | 4,331,619 | |
| | | | | | | | |
| | |
Materials (7.8%) | | | | | | | | |
Ferro Corp.(a) | | | 35,356 | | | | 444,071 | |
Flotek Industries, Inc.(a) | | | 14,253 | | | | 458,376 | |
Graphic Packaging Holdings Co.(a) | | | 78,524 | | | | 918,731 | |
Myers Industries, Inc. | | | 23,128 | | | | 464,642 | |
Platform Specialty Products Corp.(a) | | | 16,052 | | | | 449,938 | |
| | | | | | | | |
| | | | | | | 2,735,758 | |
| | | | | | | | |
| | |
Telecommunication Services (0.3%) | | | | | | | | |
Cincinnati Bell, Inc.(a) | | | 22,887 | | | | 89,946 | |
| | | | | | | | |
| | |
Utilities (3.6%) | | | | | | | | |
ALLETE, Inc. | | | 10,777 | | | | 553,399 | |
Black Hills Corp. | | | 11,513 | | | | 706,783 | |
| | | | | | | | |
| | | | | | | 1,260,182 | |
| | | | | | | | |
| | |
TOTAL COMMON STOCKS
(COST $29,602,337) | | | | | | | 33,937,147 | |
| | | | | | | | |
| | |
SHORT TERM INVESTMENT (6.4%) | | | | | | | | |
Daily Income Fund- Money Market Portfolio Fiduciary Class Shares, 7 Day Yield 0.010% | | | 2,246,906 | | | | 2,246,906 | |
| | | | | | | | |
| | |
TOTAL SHORT TERM INVESTMENT
(COST $2,246,906) | | | | | | | 2,246,906 | |
| | | | | | | | |
| | |
TOTAL INVESTMENTS (103.5%)
(COST $31,849,243) | | | | | | | 36,184,053 | |
| | | | | | | | |
| | |
TOTAL LIABILITIES IN EXCESS OF OTHER ASSETS (-3.5%) | | | | | | | (1,239,160) | |
| | | | | | | | |
| | |
NET ASSETS 100.0% | | | | | | $ | 34,944,893 | |
| | | | | | | | |
| (a) | Non Income Producing Security. |
Common Abbreviations:
Ltd. - Limited.
REIT - Real Estate Investment Trust
| | |
See Notes to Financial Statements. | | |
Annual Report | June 30, 2014 | | 11 |
| | |
| | Statements of Assets and Liabilities |
| | June 30, 2014 |
| | | | | | | | |
| | | Cortina Small Cap | | | Cortina Small Cap | |
| | | Growth Fund | | | Value Fund | |
| | | | |
ASSETS: | | | | | | | | |
Investments, at value (Cost - see below) | | $ | 33,835,614 | | | $ | 36,184,053 | |
Receivable for investments sold | | | 138,378 | | | | 356,339 | |
Receivable for fund shares subscribed | | | 30,621 | | | | 23,403 | |
Dividends receivable | | | 3,274 | | | | 27,264 | |
Prepaid expenses and other assets | | | 15,151 | | | | 25,389 | |
| | | | |
Total Assets | | | 34,023,038 | | | | 36,616,448 | |
| | | | |
| | |
LIABILITIES: | | | | | | | | |
Payable for investments purchased | | | 162,530 | | | | 711,428 | |
Payable for fund shares redeemed | | | 2,153,571 | | | | 915,667 | |
Payable for director fees | | | 500 | | | | 500 | |
Payable for advisory fees | | | 11,953 | | | | 5,360 | |
Payable for fund accounting and administration fees | | | 9,025 | | | | 9,159 | |
Payable for distribution and service fees | | | – | | | | 21 | |
Payable for audit and legal fees | | | 20,997 | | | | 21,353 | |
Other accrued liabilities and expenses | | | 6,975 | | | | 8,067 | |
| | | | |
Total Liabilities | | | 2,365,551 | | | | 1,671,555 | |
| | | | |
Net Assets | | $ | 31,657,487 | | | $ | 34,944,893 | |
| | | | |
| | |
NET ASSETS CONSISTS OF: | | | | | | | | |
Paid-in capital | | $ | 26,507,113 | | | $ | 30,880,070 | |
Accumulated net investment loss | | | – | | | | (71,503) | |
Accumulated undistributed net realized gain/(loss) on investments | | | 1,381,614 | | | | (198,484) | |
Net unrealized appreciation on investments | | | 3,768,760 | | | | 4,334,810 | |
| | | | |
Net Assets | | $ | 31,657,487 | | | $ | 34,944,893 | |
| | | | |
| | |
Cost of Investments | | $ | 30,066,854 | | | $ | 31,849,243 | |
| | |
PRICING OF SHARES: | | | | | | | | |
Institutional | | | | | | | | |
Net Assets | | $ | 31,657,487 | | | $ | 34,842,011 | |
Shares Outstanding ($0.01 par value, unlimited number of shares authorized) | | | 1,936,011 | | | | 1,865,870 | |
Net Asset Value, offering and redemption price per share | | $ | 16.35 | | | $ | 18.67 | |
Investor | | | | | | | | |
Net Assets | | | – | | | | 102,882 | |
Shares Outstanding ($0.01 par value, unlimited number of shares authorized) | | | – | | | | 5,510 | |
Net Asset Value, offering and redemption price per share | | | – | | | | 18.67 | |
| | |
See Notes to Financial Statements. | | |
12 | | 1-855-612-3936 | www.cortinafunds.com |
| | |
| | Statements of Operations |
| | For the Year Ended June 30, 2014 |
| | | | | | | | |
| | | Cortina Small Cap | | | Cortina Small Cap | |
| | | Growth Fund | | | Value Fund | |
| | | | |
INVESTMENT INCOME: | | | | | | | | |
Dividends, (net of foreign withholding taxes of $163 and $387) | | $ | 22,484 | | | $ | 239,961 | |
| | | | |
Total Investment Income | | | 22,484 | | | | 239,961 | |
| | | | |
| | |
EXPENSES: | | | | | | | | |
Advisory fees (Note 3) | | | 288,004 | | | | 237,053 | |
Transfer agent fees | | | 33,682 | | | | 37,514 | |
Fund accounting and administration fees and expenses | | | 117,003 | | | | 87,578 | |
Distribution and service fees | | | | | | | | |
Investor | | | – | | | | 41 | |
Legal fees | | | 16,998 | | | | 13,717 | |
Printing fees | | | 7,436 | | | | 6,997 | |
Registration fees | | | 26,579 | | | | 28,747 | |
Audit and tax preparation fees | | | 14,500 | | | | 15,100 | |
Custodian fees | | | 5,344 | | | | 4,617 | |
Insurance | | | 8,422 | | | | 8,422 | |
Director fee and expenses | | | 8,750 | | | | 8,750 | |
Other | | | 7,654 | | | | 6,577 | |
| | | | |
Total Expenses Before Waivers/Reimbursements | | | 534,372 | | | | 455,113 | |
Less fees waived/reimbursed by Adviser (Note 3) | | | (217,565) | | | | (194,315) | |
| | | | |
Total Net Expenses | | | 316,807 | | | | 260,798 | |
| | | | |
Net Investment Loss | | | (294,323) | | | | (20,837) | |
| | | | |
| | |
REALIZED AND UNREALIZED GAIN ON INVESTMENTS: | | | | | | | | |
Net realized gain/(loss) on investments | | | 2,089,748 | | | | (95,500) | |
Net change in unrealized appreciation on investments | | | 900,021 | | | | 3,521,125 | |
| | | | |
Net Realized and Unrealized Gain on Investments | | | 2,989,769 | | | | 3,425,625 | |
| | | | |
Net Increase in Net Assets Resulting from Operations | | $ | 2,695,446 | | | $ | 3,404,788 | |
| | | | |
| | |
See Notes to Financial Statements. | | |
Annual Report | June 30, 2014 | | 13 |
| | |
| | Statements of Changes in Net Assets |
| | | | | | | | | | | | | | | | |
| | | Cortina Small Cap Growth Fund | | | Cortina Small Cap Value Fund | |
| | | | |
| | | Year Ended June 30, 2014 | | | Year Ended June 30, 2013 | | | Year Ended June 30, 2014 | | | Year Ended June 30, 2013 | |
| |
| | | | |
OPERATIONS: | | | | | | | | | | | | | | | | |
Net investment income/(loss) | | $ | (294,323) | | | $ | (97,270) | | | $ | (20,837) | | | $ | 3,107 | |
Net realized gain/(loss) on investments | | | 2,089,748 | | | | (50,842) | | | | (95,500) | | | | 263,251 | |
Net change in unrealized appreciation of investments | | | 900,021 | | | | 2,731,439 | | | | 3,521,125 | | | | 609,341 | |
| | | | |
Net increase in net assets resulting from operations | | | 2,695,446 | | | | 2,583,327 | | | | 3,404,788 | | | | 875,699 | |
| | | | |
| | | | |
DISTRIBUTIONS TO SHAREHOLDERS: | | | | | | | | | | | | | | | | |
| | | | |
Institutional | | | | | | | | | | | | | | | | |
From net investment income | | | – | | | | – | | | | (14,778) | | | | (15,144) | |
From net realized gains on investments | | | (243,543) | | | | (68,752) | | | | (315,887) | | | | (113,367) | |
| | | | |
Total distributions | | | (243,543) | | | | (68,752) | | | | (330,665) | | | | (128,511) | |
| | | | |
| | | | |
CAPITAL SHARE TRANSACTIONS: | | | | | | | | | | | | | | | | |
Institutional | | | | | | | | | | | | | | | | |
Proceeds from sale of shares | | | 18,446,886 | | | | 15,302,028 | | | | 30,499,453 | | | | 1,751,217 | |
Shares issued in reinvestment of distributions | | | 241,505 | | | | 67,885 | | | | 314,553 | | | | 123,043 | |
Cost of shares redeemed | | | (7,728,013) | | | | (1,049,424) | | | | (3,386,811) | | | | (219,642) | |
Redemption fees | | | 330 | | | | – | | | | – | | | | – | |
| | | | |
Total | | | 10,960,708 | | | | 14,320,489 | | | | 27,427,195 | | | | 1,654,618 | |
| | | | |
Investor | | | | | | | | | | | | | | | | |
Proceeds from sale of shares | | | – | | | | – | | | | 100,000 | | | | – | |
| | | | |
Total | | | – | | | | – | | | | 100,000 | | | | – | |
| | | | |
Net increase from capital shares transactions | | | 10,960,708 | | | | 14,320,489 | | | | 27,527,195 | | | | 1,654,618 | |
| | | | |
| | | | |
Net increase in net assets | | | 13,412,611 | | | | 16,835,064 | | | | 30,601,318 | | | | 2,401,806 | |
| | | | |
| | | | |
NET ASSETS: | | | | | | | | | | | | | | | | |
Beginning of year | | | 18,244,876 | | | | 1,409,812 | | | | 4,343,575 | | | | 1,941,769 | |
| | | | |
End of year | | $ | 31,657,487 | | | $ | 18,244,876 | | | $ | 34,944,893 | | | $ | 4,343,575 | |
| | | | |
Including accumulated net investment loss of: | | $ | – | | | $ | (71,261) | | | $ | (71,503) | | | $ | (11,111) | |
| | | | |
OTHER INFORMATION: | | | | | | | | | | | | | | | | |
Share Transactions: | | | | | | | | | | | | | | | | |
Institutional | | | | | | | | | | | | | | | | |
Beginning shares | | | 1,261,863 | | | | 118,741 | | | | 278,108 | | | | 154,872 | |
Shares sold | | | 1,128,073 | | | | 1,218,364 | | | | 1,757,108 | | | | 128,860 | |
Shares issued in reinvestment of dividends | | | 14,654 | | | | 5,773 | | | | 17,802 | | | | 9,357 | |
Less shares redeemed | | | (468,579) | | | | (81,015) | | | | (187,148) | | | | (14,981) | |
| | | | |
Ending shares | | | 1,936,011 | | | | 1,261,863 | | | | 1,865,870 | | | | 278,108 | |
| | | | |
Investor | | | | | | | | | | | | | | | | |
Shares sold | | | – | | | | – | | | | 5,510 | | | | – | |
| | | | |
Ending shares | | | – | | | | – | | | | 5,510 | | | | – | |
| | | | |
| | |
See Notes to Financial Statements. | | |
14 | | 1-855-612-3936 | www.cortinafunds.com |
| | |
| | Financial Highlights |
Cortina Small Cap Growth Fund | | For a share outstanding throughout the periods presented. |
| | | | | | |
| | | Year Ended
June 30, 2014 | | Year Ended
June 30, 2013 | | For the Period September 30, 2011
(Inception) to June 30, 2012 |
|
NET ASSET VALUE, BEGINNING OF PERIOD | | $14.46 | | $11.87 | | $10.00 |
INCOME/(LOSS) FROM INVESTMENT OPERATIONS: | | | | | | |
Net investment loss(a) | | (0.17) | | (0.13) | | (0.09) |
Net realized and unrealized gain on investments | | 2.19 | | 2.81 | | 2.22 |
| | |
Total from Investment Operations | | 2.02 | | 2.68 | | 2.13 |
| | |
| | | |
DIVIDENDS AND DISTRIBUTIONS TO SHAREHOLDERS: | | | | | | |
From net realized gains on investments | | (0.13) | | (0.09) | | (0.26) |
| | |
Total Dividends and Distributions to Shareholders | | (0.13) | | (0.09) | | (0.26) |
| | |
| | | |
Paid-in Capital from Redemption Fees | | 0.00(b) | | – | | 0.00(b) |
| | |
| | | |
NET INCREASE IN NET ASSET VALUE | | 1.89 | | 2.59 | | 1.87 |
| | |
| | | |
NET ASSET VALUE, END OF PERIOD | | $16.35 | | $14.46 | | $11.87 |
| | |
| | | |
TOTAL RETURN | | 13.99% | | 22.79% | | 21.40%(c) |
| | | |
RATIOS AND SUPPLEMENTAL DATA: | | | | | | |
Net assets, end of period (in 000s) | | $31,657 | | $18,245 | | $1,410 |
| | | |
RATIOS TO AVERAGE NET ASSETS: | | | | | | |
Operating expenses excluding waiver/reimbursement | | 1.86% | | 3.85% | | 21.70%(d) |
Operating expenses including waiver/reimbursement | | 1.10% | | 1.10% | | 1.10%(d) |
Net investment loss including waiver/reimbursement | | (1.02)% | | (1.00)% | | (0.99)%(d) |
| | | |
PORTFOLIO TURNOVER RATE | | 81% | | 73% | | 144% |
| (a) | Calculated using average shares throughout the period. |
| (b) | Less than $0.005 per share. |
| | |
See Notes to Financial Statements. | | |
Annual Report | June 30, 2014 | | 15 |
| | |
| | Financial Highlights |
Cortina Small Cap Value Fund – Institutional | | For a share outstanding throughout the periods presented. |
| | | | | | |
| | | Year Ended
June 30, 2014 | | Year Ended
June 30, 2013 | | For the Period
September 30, 2011
(Inception) to June 30, 2012 |
NET ASSET VALUE, BEGINNING OF PERIOD | | $15.62 | | $12.54 | | $10.00 |
INCOME/(LOSS) FROM INVESTMENT OPERATIONS: | | | | | | |
Net investment income/(loss)(a) | | (0.01) | | 0.01 | | (0.03) |
Net realized and unrealized gain on investments | | 3.30 | | 3.68 | | 3.14 |
| | |
Total from Investment Operations | | 3.29 | | 3.69 | | 3.11 |
| | |
| | | |
DIVIDENDS AND DISTRIBUTIONS TO SHAREHOLDERS: | | | | | | |
From net investment income | �� | (0.01) | | (0.07) | | – |
From net realized gains on investments | | (0.23) | | (0.54) | | (0.57) |
| | |
Total Dividends and Distributions to Shareholders | | (0.24) | | (0.61) | | (0.57) |
| | |
| | | |
Paid-in Capital from Redemption Fees | | – | | – | | 0.00(b) |
| | |
| | | |
NET INCREASE IN NET ASSET VALUE | | 3.05 | | 3.08 | | 2.54 |
| | |
| | | |
NET ASSET VALUE, END OF PERIOD | | $18.67 | | $15.62 | | $12.54 |
| | |
| | | |
TOTAL RETURN | | 21.14% | | 30.41% | | 31.99%(c) |
| | | |
RATIOS AND SUPPLEMENTAL DATA: | | | | | | |
Net assets, end of period (in 000s) | | $34,842 | | $4,344 | | $1,942 |
| | | |
RATIOS TO AVERAGE NET ASSETS: | | | | | | |
Operating expenses excluding waiver/reimbursement | | 1.92% | | 5.55% | | 22.37%(d) |
Operating expenses including waiver/reimbursement | | 1.10% | | 1.10% | | 1.10%(d) |
Net investment income/(loss) including waiver/reimbursement | | (0.09)% | | 0.10% | | (0.32)%(d) |
| | | |
PORTFOLIO TURNOVER RATE | | 78% | | 81% | | 146% |
| (a) | Calculated using average shares throughout the period. |
| (b) | Less than $0.005 per share. |
| | |
See Notes to Financial Statements. | | |
16 | | 1-855-612-3936 | www.cortinafunds.com |
| | |
| | Financial Highlights |
Cortina Small Cap Value Fund – Investor | | For a share outstanding throughout the period presented. |
| | |
| | | For the Period April 30, 2014 (Inception) to June 30, 2014 |
NET ASSET VALUE, BEGINNING OF PERIOD | | $18.15 |
INCOME/(LOSS) FROM INVESTMENT OPERATIONS: | | |
Net investment loss(a) | | (0.01) |
Net realized and unrealized gain on investments | | 0.53 |
| | |
Total from Investment Operations | | 0.52 |
| | |
| |
NET INCREASE IN NET ASSET VALUE | | 0.52 |
| | |
| |
NET ASSET VALUE, END OF PERIOD | | $18.67 |
| | |
| |
TOTAL RETURN | | 2.87%(b) |
| |
RATIOS AND SUPPLEMENTAL DATA: | | |
Net assets, end of period (in 000s) | | $103 |
| |
RATIOS TO AVERAGE NET ASSETS: | | |
Operating expenses excluding waiver/reimbursement | | 2.14%(c) |
Operating expenses including waiver/reimbursement | | 1.35%(c) |
Net investment loss including waiver/reimbursement | | (0.20)%(c) |
| |
PORTFOLIO TURNOVER RATE | | 78%(d) |
| (a) | Calculated using average shares throughout the period. |
| (d) | Portfolio turnover is calculated at the Fund level and represents the year ended June 30, 2014. |
| | |
See Notes to Financial Statements. | | |
Annual Report | June 30, 2014 | | 17 |
| | |
| | Notes to Financial Statements |
| | June 30, 2014 |
1. ORGANIZATION
Cortina Funds, Inc. (the “Corporation”) is an open-end management investment company registered under the Investment Company Act of 1940, as amended (the “1940 Act”). The Corporation was organized on June 30, 2004 as a Wisconsin corporation. The Corporation currently offers shares of common stock (“shares”) of the Cortina Small Cap Growth Fund and the Cortina Small Cap Value Fund (each a “Fund” and collectively, the “Funds”).
The Cortina Small Cap Growth Fund, which commenced operations with the sale of Institutional Class Shares on September 30, 2011, is a diversified portfolio with an investment objective to seek growth of capital. The Cortina Small Cap Value Fund, which commenced operations with the sale of Institutional Class Shares on September 30, 2011 and the sale of Investor Class Shares on April 30, 2014, is a diversified portfolio with an investment objective to seek long-term capital appreciation.
Shares of each Fund are designated as Institutional Shares or Investor Shares with an indefinite number of shares authorized at $0.01 par value. The Articles of Incorporation, as amended and restated, permit the Corporation’s Board of Directors (the “Board”) to create additional funds and share classes.
2. SIGNIFICANT ACCOUNTING POLICIES
The following is a summary of significant accounting policies followed by the Funds. These policies are in conformity with U.S. generally accepted accounting principles (“GAAP”).
Use of Estimates — The accompanying financial statements were prepared in accordance with GAAP, which require the use of estimates and assumptions made by management. These may affect the reported amounts of assets and liabilities and disclosure of contingent assets and liabilities at the date of the financial statements and the reported amounts of increases and decreases in net assets from operations during the reporting period. Actual results could differ from those estimates.
Investment Valuation — Investment securities are valued at the last sale price at the close of the principal exchange on which they trade, except for securities listed on the National Association of Securities Dealers Automated Quotations (“NASDAQ”) exchange, which are valued at the NASDAQ official closing price. Unlisted securities or listed securities for which there were no sales during the day are valued at the closing bid price on such exchanges or over-the-counter markets. Investments for which market quotations are not readily available are valued at fair value as determined in good faith under consistently applied procedures approved by and under the general supervision of the Funds’ Board.
Investment Transactions — Investment security transactions are accounted for on trade date. Gains and losses on securities sold are determined on a specific identification basis.
Investment Income — Interest income is accrued and recorded on a daily basis including amortization of premiums, accretions of discounts and income earned from money market funds. Interest is not accrued on securities that are in default. Dividend income is recorded on the ex-dividend date. Withholding taxes on foreign dividends have been provided for in accordance with a Fund’s understanding of the applicable country’s tax rules and rates.
Fair Value Measurements — A three-tier hierarchy has been established to classify fair value measurements for disclosure purposes. Inputs refer broadly to the assumptions that market participants would use in pricing the asset or liability, including assumptions about risk. Inputs may be observable or unobservable. Observable inputs are inputs that reflect the assumptions market participants would use in pricing the asset or liability that are developed based on market data obtained from sources independent of the reporting entity. Unobservable inputs are inputs that reflect the reporting entity’s own assumptions about the assumptions market participants would use in pricing the asset or liability that are developed based on the best information available. In accordance with the authoritative guidance on fair value measurements and disclosure under GAAP, the Funds disclose fair value of their investments in a hierarchy that prioritizes the inputs to valuation techniques used to measure the fair value.
Various inputs are used in determining the value of each Funds’ investments as of the reporting period end. The designated input levels are not necessarily an indication of the risk or liquidity associated with these investments. These inputs are categorized in the following hierarchy under applicable financial accounting standards:
| | | | | | |
Level 1 | | — | | Unadjusted quoted prices in active markets for identical, unrestricted assets or liabilities that the Funds have the ability to access at the measurement date; |
| | |
Level 2 | | — | | Quoted prices which are not active, quoted prices for similar assets or liabilities in active markets or inputs other than quoted prices that are observable (either directly or indirectly) for substantially the full term of the asset or liability; and |
| | |
| | | |
18 | | 1-855-612-3936 | www.cortinafunds.com |
| | |
| | Notes to Financial Statements |
| | June 30, 2014 |
| | | | |
Level 3 | | — | | Significant unobservable prices or inputs (including a Fund’s own assumptions in determining the fair value of investments) where there is little or no market activity for the asset or liability at the measurement date. |
The availability of observable inputs can vary from security to security and is affected by a wide variety of factors, including, for example, the type of security, whether the security is new and not yet established in the marketplace, the liquidity of markets, and other characteristics particular to the security. To the extent that valuation is based on models or inputs that are less observable or unobservable in the market, the determination of fair value requires more judgment. Accordingly, the degree of judgment exercised in determining fair value is greatest for instruments categorized in Level 3.
An investment level within the fair value hierarchy is based on the lowest level input, individually or in the aggregate, that is significant to fair value measurement. The valuation techniques used by the Funds to measure fair value during the year ended June 30, 2014 maximized the use of observable inputs and minimized the use of unobservable inputs.
The inputs or methodology used for valuing securities are not necessarily an indication of the risk or liquidity associated with investing in those securities. The following is a summary of the inputs used in valuing the Funds’ investments as of June 30, 2014:
Cortina Small Cap Growth Fund
| | | | | | | | | | | | | | | | |
| | | Valuation Inputs | | | | |
| Investments in Securities at Value* | | Level 1 | | | Level 2 | | | Level 3 | | | Total | |
Common Stocks | | $ | 33,410,936 | | | $ | – | | | $ | – | | | $ | 33,410,936 | |
Short Term Investment | | | 424,678 | | | | – | | | | – | | | | 424,678 | |
| | | | |
Total | | $ | 33,835,614 | | | $ | – | | | $ | – | | | $ | 33,835,614 | |
| | | | |
Cortina Small Cap Value Fund
| | | | | | | | | | | | | | | | |
| | | Valuation Inputs | | | | |
| Investments in Securities at Value* | | Level 1 | | | Level 2 | | | Level 3 | | | Total | |
Common Stocks | | $ | 33,937,147 | | | $ | – | | | $ | – | | | $ | 33,937,147 | |
Short Term Investment | | | 2,246,906 | | | | – | | | | – | | | | 2,246,906 | |
| | | | |
Total | | $ | 36,184,053 | | | $ | – | | | $ | – | | | $ | 36,184,053 | |
| | | | |
| * | See Schedule of Investments for sector classification. |
For the fiscal year ended June 30, 2014, there have been no significant changes to the Funds’ fair value methodologies. Additionally, there were no transfers into or out of Levels 1 and 2 during the fiscal year ended June 30, 2014. It is the Funds’ policy to recognize transfers at the end of the reporting period.
For the fiscal year ended June 30, 2014, the Funds did not have investments with significant unobservable inputs (Level 3) used in determining fair value.
Affiliated Companies — An affiliated company is a company that can have direct or indirect common ownership. The Funds do not hold any investments in affiliated companies as of and during the year ended June 30, 2014.
Expenses — The Funds bear expenses incurred specifically on each Fund’s respective behalf as well as a portion of general Corporation expenses, which may be allocated on the basis of relative net assets or the nature of the services performed relative to applicability to each Fund.
Expenses that are specific to a class of shares of the Funds are charged directly to the share class. The Funds’ realized and unrealized gains and losses, net investment income, and expenses other than class specific expenses, are allocated daily to each class in proportion to its average daily net assets.
Distributions to Shareholders — Dividends from net investment income and distributions of net realized capital gains, if any, will be declared and paid at least annually. Income and capital gains distributions are determined in accordance with income tax regulations, which may differ from GAAP. Distributions to shareholders are recorded on the ex-dividend date.
Fees on Redemptions — The Funds will deduct a 2.00% redemption proceeds fee on Fund shares held 60 days or less. The redemption fee is not a fee to finance sales or sales promotion expenses, but is paid to the Funds to defray the costs of liquidating an investor and discouraging short-term trading of the Funds’ shares. No redemption fee will be imposed on redemptions initiated by the Funds.
| | |
| | | |
Annual Report | June 30, 2014 | | 19 |
| | |
| | Notes to Financial Statements |
| | June 30, 2014 |
Federal Income Taxes — As of and during the fiscal year ended June 30, 2014, the Funds did not have a liability for any unrecognized tax benefits. The Funds file U.S. federal, state, and local tax returns as required. The Funds’ tax returns are subject to examination by the relevant tax authorities until expiration of the applicable statute of limitations which is generally three years after the filing of the tax return for federal purposes and four years for most state returns. Tax returns for open years have incorporated no uncertain tax positions that require a provision for income taxes. The Funds intend to distribute to shareholders all taxable investment income and realized gains, and otherwise comply with Subchapter M of the Internal Revenue Code of 1986, as amended, applicable to regulated investment companies.
3. ADVISORY FEES, FUND ACCOUNTING, ADMINISTRATION FEES, AND OTHER AGREEMENTS
Investment Advisor
The Adviser is subject to the general supervision of the Board and is responsible for the overall management of the Funds’ business affairs. The Adviser invests the assets of the Funds based on the Funds’ investment objectives and policies. The Adviser is entitled to an investment advisory fee, computed daily and payable monthly, of 1.00% of the average daily net assets for each Fund.
The Adviser has contractually agreed to waive fees with respect to each of the Funds so that the net annual operating expenses (excluding 12b-1 fee, taxes, leverage, interest, brokerage commissions, dividends or interest expenses on short positions, acquired fund fees and expenses, and extraordinary expenses) of the Funds’ shares will not exceed 1.10% of average daily net assets of each Fund. The Adviser may request a reimbursement from the Funds to recapture any reduced management fees or reimbursed Fund expenses within three years following the fee reduction or expense reimbursement, but only to the extent the Funds’ total annual fund operating expenses including offering costs, plus any requested reimbursement amount, including previously waived organizational costs, are less than the above limit at the time of the request. Any such reimbursement is subject to review by the Board.
As of June 30, 2014, reimbursements (including offering costs and the previously waived organizational costs) that may potentially be made by the Fund to the Adviser total $659,340 for the Cortina Small Cap Growth Fund and $497,674 for the Cortina Small Cap Value Fund expire as follows:
| | | | | | | | |
| | | Cortina Small Cap Growth Fund | | | | | |
| | September 19, 2014 | | | | $ | 10,250 | |
| | June 30, 2015 | | | | | 163,407 | |
| | June 30, 2016 | | | | | 268,118 | |
| | June 30, 2017 | | | | | 217,565 | |
| | | | | | $ | 659,340 | |
| | | |
| | | Cortina Small Cap Value Fund | | | | | |
| | September 19, 2014 | | | | $ | 10,250 | |
| | June 30, 2015 | | | | | 152,715 | |
| | June 30, 2016 | | | | | 140,394 | |
| | June 30, 2017 | | | | | 194,315 | |
| | | | | | $ | 497,674 | |
Fund Accounting Fees and Expenses
ALPS Fund Services, Inc. (“ALPS” or the “Administrator”) provides administrative, fund accounting and other services to the Funds for a monthly administration fee based on the Funds’ average daily net assets at the following annual rates.
| | | | | | |
| | | Average Daily | | | | Basis Point |
| | | Net Assets | | | | Fee Rate |
| | Between $0-$500M | | | | 5.0 |
| | $500M-$1B | | | | 3.0 |
| | Above $1B | | | | 2.0 |
Annual Fee
Greater of $200,320 annual minimum or the above basis point fee schedule. Prior to April 1, 2014 the minimum fee was $190,000.
The Administrator is also reimbursed by the Funds for certain out-of-pocket expenses.
| | |
| | | |
20 | | 1-855-612-3936 | www.cortinafunds.com |
| | |
| | Notes to Financial Statements |
| | June 30, 2014 |
Transfer Agent
ALPS serves as transfer, dividend paying and shareholder servicing agent for the Funds (the “Transfer Agent”).
Compliance Services
ALPS provides services that assist the Corporation’s Chief Compliance Officer in monitoring and testing the policies and procedures of the Corporation in conjunction with requirements under Rule 38a-1 under the 1940 Act. ALPS is compensated under the Administration Agreement.
Distributor
The Funds have entered into a Distribution Agreement with ALPS Distributors, Inc (“the Distributor”) to provide distribution services to the Funds. The Distributor serves as underwriter/distributor of shares of the Funds.
Distribution Plan
The Small Cap Value Fund has adopted a Distribution Plan in accordance with Rule 12b-1 (“Distribution Plan”) under the 1940 Act. The Distribution Plan provides that the Fund may compensate or reimburse the Distributor for services rendered and expenses borne in connection with activities primarily intended to result in the sale of the Fund’s shares. Sales charges may be paid to broker-dealers, banks and any other financial intermediary eligible to receive such fees for sales of Investor Shares of the Fund and for services provided to shareholders.
The Fund charges 12b-1 fees for Investor Shares. Pursuant to the Distribution Plan, the Fund may annually pay the Distributor up to 0.25% of the average daily net assets of the Fund’s Investor Shares. The expenses of the Distribution Plan are reflected in the Statements of Operations.
Certain Directors and Officers of the Funds are also officers of the Adviser.
4. PURCHASES AND SALES OF INVESTMENT SECURITIES
The aggregate cost of purchases and proceeds from sales of investment securities, excluding short-term securities, are shown below for the fiscal year ended June 30, 2014. Purchases and proceeds from sales of U.S. Government obligations are included in the totals of Purchases of Securities and Proceeds from Sales of Securities below and also broken out separately for your convenience:
| | | | | | | | |
| Fund Name | | Purchases | | | Sales | |
Cortina Small Cap Growth Fund | | $ | 35,523,068 | | | $ | 22,665,219 | |
Cortina Small Cap Value Fund | | | 43,667,267 | | | | 17,272,461 | |
There were no purchases of long-term U.S. Government Obligations for either Fund during the fiscal year ended June 30, 2014.
5. TAX BASIS INFORMATION
For the year ended June 30, 2014 the following reclassifications, which had no impact on results of operations or net assets, were recorded to reflect tax character:
| | | | | | | | | | | | |
| Fund | | Paid-in Capital | | | Accumulated Net Investment Income/(Loss) | | | Accumulated Net Realized Gain/(Loss) on Investments | |
Cortina Small Cap Growth Fund | | $ | – | | | $ | 365,584 | | | $ | (365,584) | |
Cortina Small Cap Value Fund | | | 1 | | | | (24,777) | | | | 24,776 | |
Income and long-term capital gain distributions are determined in accordance with Federal income tax regulations, which differ from GAAP, and, therefore, may differ significantly in amount or character from net investment income and realized gains for financial reporting purposes.
The tax character of distributions paid during the year ended June 30, 2014, were as follows:
| | | | | | | | |
| Fund | | Ordinary Income | | | Long-Term Capital Gain | |
Cortina Small Cap Growth Fund | | $ | 115,436 | | | $ | 128,107 | |
Cortina Small Cap Value Fund | | | 159,525 | | | | 171,140 | |
| | |
| | | |
Annual Report | June 30, 2014 | | 21 |
| | |
| | Notes to Financial Statements |
| | June 30, 2014 |
The tax character of distributions paid during the period ended June 30, 2013, were as follows:
| | | | | | | | |
| Fund | | Ordinary Income | | | Long-Term Capital Gain | |
Cortina Small Cap Growth Fund | | $ | 68,752 | | | $ | – | |
Cortina Small Cap Value Fund | | | 124,309 | | | | 4,202 | |
As of June 30, 2014, the aggregate cost of investments, gross unrealized appreciation/(depreciation) and net unrealized appreciation/(depreciation) for Federal tax purposes was as follows:
| | | | | | | | | | | | | | | | |
| Fund | | Cost of Investments
for Income Tax
Purposes | | | Gross Appreciation
(excess of value
over tax cost) | | | Gross Depreciation
(excess of tax cost
over value) | | | Net Unrealized
Appreciation | |
Cortina Small Cap Growth Fund | | $ | 30,518,409 | | | $ | 5,338,479 | | | $ | (2,021,274) | | | $ | 3,317,205 | |
Cortina Small Cap Value Fund | | | 32,065,396 | | | | 4,818,688 | | | | (700,031) | | | | 4,118,657 | |
The difference between book basis and tax basis net unrealized appreciation is attributable to the deferral of losses from wash sales and passive foreign investment companies.
At June 30, 2014, components of distributable earnings were as follows:
| | | | | | | | | | | | | | | | | | | | |
| Fund | | Undistributed
Ordinary Income | | | Accumulated
Capital Gains | | | Unrealized
Appreciation | | | Other Cumulative
Effect of Timing
Differences | | | Total Distributable
Earnings | |
Cortina Small Cap Growth Fund | | $ | 218,066 | | | $ | 1,615,103 | | | $ | 3,317,205 | | | $ | – | | | $ | 5,150,374 | |
Cortina Small Cap Value Fund | | | – | | | | 407,133 | | | | 4,118,657 | | | | (460,967 | ) | | | 4,064,823 | |
The Cortina Small Cap Value Fund elects to defer to the year ending June 30, 2015, capital losses recognized during the period November 1, 2013 through June 30, 2014 in the amount of $460,967.
6. COMMITMENTS AND CONTINGENCIES
Under the Corporation’s organizational documents, its Officers and Directors are indemnified against certain liabilities arising out of the performance of their duties to the Funds. In addition, in the normal course of business, the Corporation entered into contracts with its service providers, on behalf of the Funds, and others that provide for general indemnifications. The Funds’ maximum exposure under these arrangements is unknown, as this would involve future claims that may be made against the Funds. The Funds expect risk of loss to be remote.
7. NEW ACCOUNTING PRONOUNCEMENTS
In June 2013, the FASB issued ASU 2013-08, Amendments to the Scope, Measurement and Disclosure Requirements (“ASU 2013-08”), modifying Accounting Standards Codification (“ASC”) 946. The modifications were a result of a joint effort by the FASB and the International Accounting Standards Board to develop a consistent approach for determining whether an entity is an investment company for which fair value of investments is the most relevant measurement. ASU 2013-08 requires reporting entities to disclose that it is an investment company and is applying the guidance as set forth in ASC 946, to disclose any changes in, and the reasons for, its status as an investment company and to disclose information related to whether it has provided or is contractually required to provide financial support to any of its investees. The effective date of ASU 2013-08 is for interim and annual periods beginning after December 15, 2013. At this time, management is evaluating the implications of this requirement and the impact it will have to the financial statement amounts and footnote disclosures, if any.
| | |
| | | |
22 | | 1-855-612-3936 | www.cortinafunds.com |
| | |
| | Report of Independent Registered Public Accounting Firm |
To the Shareholders and Board of Directors of
Cortina Funds, Inc.
We have audited the accompanying statements of assets and liabilities, including the schedules of investments, of Cortina Funds, Inc., comprising Cortina Small Cap Growth Fund and Cortina Small Cap Value Fund (the “Funds”), as of June 30, 2014, and the related statements of operations for the year then ended, the statements of changes in net assets for each of the two years in the period then ended, and the financial highlights for each of the three periods in the period then ended. These financial statements and financial highlights are the responsibility of the Funds’ management. Our responsibility is to express an opinion on these financial statements and financial highlights based on our audits.
We conducted our audits in accordance with the standards of the Public Company Accounting Oversight Board (United States). Those standards require that we plan and perform the audit to obtain reasonable assurance about whether the financial statements and financial highlights are free of material misstatement. An audit includes examining, on a test basis, evidence supporting the amounts and disclosures in the financial statements. Our procedures included confirmation of securities owned as of June 30, 2014, by correspondence with the custodian and brokers, or by other appropriate auditing procedures where replies from brokers were not received. An audit also includes assessing the accounting principles used and significant estimates made by management, as well as evaluating the overall financial statement presentation. We believe that our audits provide a reasonable basis for our opinion.
In our opinion, the financial statements and financial highlights referred to above present fairly, in all material respects, the financial position of each of the Funds constituting Cortina Funds, Inc. as of June 30, 2014, the results of their operations for the year then ended, the changes in their net assets for the two years in the period then ended, and the financial highlights for each of the three periods in the period then ended, in conformity with accounting principles generally accepted in the United States of America.
COHEN FUND AUDIT SERVICES, LTD.
Cleveland, Ohio
August 22, 2014
| | |
| | | |
Annual Report | June 30, 2014 | | 23 |
| | |
| | Additional Information |
| | June 30, 2014 (Unaudited) |
1. PROXY VOTING POLICIES AND VOTING RECORD
A description of the policies and procedures that the Funds use to vote proxies relating to portfolio securities is available without charge upon request by calling toll-free 1-855-612-3936, or on the Securities and Exchange Commission’s (“SEC”) website at http://www.sec.gov. Information regarding how the Funds voted proxies relating to portfolio securities during the most recent fiscal year end June 30, 2014 is available without charge upon request by calling toll-free 1-855-612-3936, or on the SEC’s website at http://www.sec.gov.
2. QUARTERLY PORTFOLIO HOLDINGS
The Corporation files a complete listing of portfolio holdings for the Funds with the SEC as of the first and third quarters of each fiscal year on Form N-Q. The filings are available upon request by calling 1-855-612-3936. Furthermore, you may obtain a copy of the filing on the SEC’s website at http://www.sec.gov. The Funds’ Forms N-Q may also be reviewed and copied at the SEC’s Public Reference Room in Washington, D.C., and information on the operation of the Public Reference Room may be obtained by calling 1-800-SEC-0330.
3. TAX INFORMATION
Pursuant to Section 852(b)(3) of the Internal Revenue Code, Cortina Small Cap Growth Fund and Cortina Small Cap Value Fund designate $128,107 and $171,140 respectively as a long-term capital gain distribution.
Certain tax information is required to be provided to shareholders based upon each Fund’s income and distributions for the year ended June 30, 2014. The Funds designate the following as percentages of taxable ordinary income distributions, up to maximum amount allowable, for the calendar year ended December 31, 2013:
| | | | |
| Fund | | Dividends Received Deduction Percentage | | Qualified Dividend Income Percentage |
Cortina Small Cap Growth Fund | | 5.30% | | 5.93% |
Cortina Small Cap Value Fund | | 48.72% | | 45.29% |
In early 2014, if applicable, shareholders of record received this information for the distributions paid to them by the Funds during the calendar year 2013 via Form 1099. The Funds will notify shareholders in early 2015 of amounts paid to them by the Funds, if any, during the calendar year 2014.
4. DIRECTORS’ CONSIDERATION AND APPROVAL OF ADVISORY AGREEMENT
On May 12, 2014 (the “Meeting”), the Directors met in person to consider, among other things, the annual renewal of the Investment Advisory Agreement (the “Advisory Agreement”) between the Corporation and the Adviser with respect to the Cortina Small Cap Growth Fund and Cortina Small Cap Value Fund (the “Funds”) in accordance with Section 15(c) of the Investment Company Act of 1940, as amended (the “1940 Act”). In addition, the Independent Directors met in executive session with the Corporation’s counsel to review and discuss the 15(c) materials. The Board reviewed and discussed various information that had been provided prior to the Meeting and at the Meeting, including the Advisory Agreement, memoranda prepared by the Corporation’s counsel discussing the Board’s fiduciary obligations and the factors the Board should assess in considering the renewal of the Advisory Agreement, information in response to the request from the Board, including the Independent Directors, from the Adviser (including the Adviser’s Form ADV and balance sheet), a profitability analysis with respect to the Funds, comparative information about the Funds’ performance for periods ended December 31, 2013 and March 31, 2014, management fees and expense ratios, and other pertinent information. The Board also discussed relevant case law.
The Board also took into account information reviewed periodically throughout the year that was relevant to its consideration of the Advisory Agreement, including performance, management fee and other expense information and discussions with the Funds’ portfolio managers. Based on its evaluation of this information, the Board, including a majority of the Independent Directors, approved the continuation of the Investment Advisory Agreement for an additional one-year period.
In considering the Advisory Agreement and reaching its conclusions, the Board reviewed and analyzed various factors that it determined were relevant, including the factors below. In deciding to approve the Advisory Agreement for each Fund, the Board did not identify any single factor as determinative but considered all factors together.
Nature, Extent and Quality of the Services Provided to the Funds: The Board analyzed the nature, extent and quality of the services provided by the Adviser to the Funds. The Board reviewed and considered the Adviser’s significant role in establishing the Funds and the construction of their investment objectives, principal strategies, investment limitations and fee structures. The Board noted the Adviser’s commitment to the Funds, and the experience, credentials and continuity of the portfolio management teams employed to manage the Funds’ investments. The Board further noted that the Adviser has over $2.75 billion of assets under discretionary management and that the Funds provide
| | |
| | | |
24 | | 1-855-612-3936 | www.cortinafunds.com |
| | |
| | Additional Information |
| | June 30, 2014 (Unaudited) |
an opportunity for smaller institutional and retail accounts to receive the same professional advice from the Adviser that it offers to its larger institutional clients. The Board also noted that the provision of investment advisory services to the Funds requires more effort than it does for separately managed accounts due to daily sales and redemption activity and additional regulatory and compliance requirements.
The Board considered other services that the Adviser provided for the Funds in its capacity as their investment advisor, such as making some of its key personnel available to serve as officers of the Funds, selecting broker-dealers for execution of portfolio transactions, ensuring adherence to the Funds’ investment policies and restrictions, compliance, risk management services, valuation and overseeing the Funds’ other service providers. The Board also considered that the Adviser has not experienced any significant legal, compliance or regulatory difficulties since the Funds were launched. The Board concluded that the nature, extent and quality of the services provided by the Adviser to the Funds were appropriate and that each Fund was likely to continue to benefit from services provided under the Advisory Agreement.
Investment Performance of the Adviser and the Funds: In considering the investment performance of each of the Funds, the Board reviewed the Funds’ performance information as of March 31, 2014 for various periods back to the inception date of the Funds (09/30/2011) in comparison to various benchmark indices and certain peer funds selected by the Adviser (the “Peer Funds”). The Board also reviewed performance information as of December 31, 2013. The Board noted that for the two-year, and since inception periods ended March 31, 2014, the Small Cap Growth Fund had lagged the Russell 2000 Growth Index but for the one-year period the Small Cap Growth Fund exceeded the performance of the Russell 2000 Growth Index. The Board noted that the Adviser’s Small Cap Growth Composite had outperformed the Russell 2000 Growth Index for the three, five, seven, and since inception periods ended March 31, 2014. The Board considered the effect of the market environment and the Adviser’s quarterly commentary and discussion of the reasons for the Fund’s underperformance in the relevant periods. With respect to the Small Cap Value Fund, the Board noted that for the one-year, two-year, and since inception periods ended March 31, 2014, the Fund had outperformed the Russell 2000 Value Index, for some periods significantly so. The Board noted that the Adviser’s Small Cap Value Composite had also outperformed the Russell 2000 Value for the one-year and since inceptions periods ended March 31, 2014.
The Board also considered the Adviser’s quarterly portfolio reviews explaining the Funds’ performance, the Adviser’s consistent and disciplined investment decision process and the investment strategies it employs for the Funds. After considering all of the information, the Board concluded that, although past performance is not a guarantee of future results, each Fund and its shareholders were likely to benefit from the continued management by the Adviser.
Costs of Services Provided and Profits Realized by the Adviser: The Board examined the fee and expense information for the Funds, including a comparison of such information to the peer Funds as provided by the Adviser from eVestment. The Board noted that each Fund’s advisory fee was comparable to the average and median for all mutual funds in its peer group. The Board also reviewed and considered management fees charged by the Adviser to other investment advisory clients and found that the investment management fee paid by the Funds was identical to what the Adviser charges on the first $25 million of a separately managed account unless otherwise negotiated. The Board recognized the extent of the significant additional services provided to each Fund that the Adviser did not provide to its other clients, such as certain administrative services, oversight of the Fund’s other service providers, regulatory compliance and various other services.
The Board also examined the total expense ratio of each Fund relative to the peer Funds in its respective eVestment category. The Board noted that each Fund’s total expense ratio after fee waivers and expense reimbursements by the Adviser of 1.10% pursuant to the Adviser’s expense cap agreement was below the median in each Fund’s category; and below the average in each Fund’s category. The Board further noted that if each Fund had included acquired fund fees and expenses in the analysis, each Fund’s total expense ratio was still in line with or lower than both the average and the median for Funds in the respective category.
The Board noted that given the size of the Funds, the Adviser continued to waive fees and reimburse significant expenses for the Funds. Accordingly, the Funds were only marginally profitable to the Adviser. The Board reviewed and considered the general financial condition of the Adviser and determined it to be sound. The Board also reviewed information regarding revenue sharing payments, noting that any payments by the Adviser to third-party platforms were made from the Adviser’s profits associated with its overall advisory business. In light of all of the information that it received and considered, the Board concluded that the management fee and total expense ratio of each Fund were reasonable.
Economies of Scale and Fee Levels Reflecting Those Economies: The Board noted that the Funds’ advisory fee structure does not contain any breakpoint reductions as the Funds grow in size. However, the Board recognized that the Adviser has been waiving fees and until October 2013 was also reimbursing expenses for the Funds since their inception. The Board also considered the Adviser’s verbal representation that it would consider evaluating advisory fee breakpoints in the future.
The Directors concluded that the current fee structure of each Fund was reasonable and that breakpoint reductions may be considered in the future depending on Fund asset levels.
| | |
| | | |
Annual Report | June 30, 2014 | | 25 |
| | |
| | Additional Information |
| | June 30, 2014 (Unaudited) |
Benefits Derived From the Relationship with the Funds: The Board noted that the Adviser derives ancillary benefits from its association with the Funds, in the form of research products and services received from unaffiliated broker dealers who execute portfolio trades for the Funds. However, the Board determined such products and services have been used for legitimate purposes relating to the Funds by providing assistance in the investment decision-making process. The Board concluded that the other benefits realized by the Adviser from its relationship with the Funds were appropriate. Based on its evaluation of the above factors, as well as other factors relevant to their consideration of the Advisory Agreement, the Directors, including all of the Independent Directors, concluded that the continuation of the Advisory Agreement was in the best interest of each Fund and its shareholders.
| | |
| | | |
26 | | 1-855-612-3936 | www.cortinafunds.com |
| | |
| | Board of Directors and Officers |
| | June 30, 2014 (Unaudited) |
Overall responsibility for management of the Funds rests with the Board of Directors (the “Directors”). The Directors serve during the lifetime of the Corporation and until its termination, or until death, resignation, retirement or removal. The Directors, in turn, elect the officers of the Funds to actively supervise the day-to-day operations. The officers have been elected for an annual term. The following are the Directors and executive officers of the Funds:
Independent Directors
| | | | | | | | | | |
| Name and Age | | Position(s)
Held with the Funds | | Length of Time
Served | | Principal Occupation(s) During Past 5 Years | | Number of Funds
in Fund Complex
Overseen by
Director | | Other Directorships
Held by Director |
| Mark J. Giese, 43 | | Independent Director | | Since Inception | | President, Riverwood Business Consulting, LLC, a business and management firm (December 2009-present); Chief Financial Officer, Datatrac Corporation, a financial research firm (January 2009-December 2009); Vice President, Nicholas Company, Inc., an investment management firm (June 1994-January 2009); Vice President, Nicholas Fund, Inc., Nicholas II, Inc., Nicholas Limited Edition, Inc. and Nicholas Equity Income Fund, Inc., each a registered investment company (June 1994-January 2009); Senior Vice President, Nicholas Family of Funds, Inc., a registered investment company (June 1994-January 2009) | | 2 | | None |
| | | | | |
| John T. Murphy, 50 | | Independent Director | | Since Inception | | President and Founding Partner, Morris Midwest, LLC, a machine tool distributor (2006-present); President and Partner, Technical Equipment Sales Co., a machine tool distributor (2003-2006) | | 2 | | None |
| | | | |
Interested Director | | | | | | | | |
| | | | | |
| Ryan T. Davies, 40* | | Chairman, President and Interested Director | | Since Inception | | Senior Equity Analyst, Cortina Asset Management, LLC (2004-present) | | 2 | | None |
| | | | | |
Officers | | | | | | | | | | |
| | | |
| Eric Conner, 29 | | Treasurer and Principal Accounting Officer | | Since November 2013 | | Business and Operations Analyst, Cortina Asset Management, LLC (2012-present); Portfolio Finance Analyst, Stark Investments (2011-2012); Senior Corporate Accountant, Stark Investments (2008-2011) |
| | | |
| Lori K. Hoch, 43 | | Secretary, Anti-Money Laundering Officer and Chief Compliance Officer | | Since Inception | | Principal and Chief Operating Officer and Chief Compliance Officer, Cortina Asset Management, LLC (2004-present) |
| * | Mr. Davies is considered an “interested director” of Cortina as defined under the 1940 Act by virtue of his position with the Adviser. |
The business address of the officers and directors affiliated with the Adviser is 825 North Jefferson Street, Suite 400, Milwaukee, Wisconsin 53202. The address for each Independent Director is c/o Cortina Funds, 825 North Jefferson Street, Suite 400, Milwaukee, Wisconsin 53202.
Additional information about members of the Board of Directors and Officers is available in the Statement of Additional Information (SAI). To obtain a free copy of the SAI, please call 1-855-612-3936.
| | |
| | | |
Annual Report | June 30, 2014 | | 27 |

Material must be accompanied or preceded by the prospectus.
The Cortina Funds are distributed by ALPS Distributors, Inc.
Item 2. Code of Ethics.
| | (a) | The Registrant, as of the end of the period covered by this report, has adopted a code of ethics that applies to the Registrant’s principal executive officer, principal financial officer, principal accounting officer or controller or any persons performing similar functions on behalf of the Registrant. |
| | (c) | During the period covered by this report, no amendments to the provisions of the code of ethics adopted in paragraph (a) of this Item were made. |
| | (d) | During the period covered by this report, no implicit or explicit waivers to the provisions of the code of ethics adopted in paragraph (a) of this Item were granted. |
| | (f) | A copy of the Registrant’s Code of Ethics is filed as an exhibit hereto. The Registrant undertakes to provide a copy of the Code of Ethics to any person, without charge, upon written request to the Registrant at its address at 825 N. Jefferson St., Suite 400, Milwaukee, WI 53202. |
Item 3. Audit Committee Financial Expert.
The Board of Directors of the Registrant has determined that the Registrant has at least one Audit Committee Financial Expert serving on its audit committee. The Registrant’s Audit Committee Financial Expert is Mr. John F. Murphy, Independent Trustee and Audit Committee Chair.
Item 4. Principal Accountant Fees and Services.
| | (a) | Audit Fees: For the Registrant’s fiscal years ended June 30, 2014 and June 30, 2013, the aggregate fees billed for professional services rendered by the principal accountant for the audit of the Registrant’s annual financial statements or services that are normally provided by the accountant in connection with statutory or regulatory filings or engagements were $24,600 and $24,000, respectively. |
| | (b) | Audit-Related Fees: For the Registrant’s fiscal years ended June 30, 2014 and June 30, 2013, the aggregate fees billed for assurance and related services by the principal accountant that are reasonably related to the performance of the audit of |
1
| | the Registrant’s financial statements and are not reported under paragraph (a) of this Item were $0 and $0, respectively. |
| | (c) | Tax Fees: For the Registrant’s fiscal years ended June 30, 2014 and June 30, 2013, the aggregate fees billed for professional services rendered by the principal accountant for tax compliance, tax advice and tax planning were $5,000 and $5,000, respectively. The fiscal year 2014 and 2013 tax fees were for services for review of the dividend calculation, excise tax preparation and federal tax return preparation. |
| | (d) | All Other Fees: For the Registrant’s fiscal years ended June 30, 2014 and June 30, 2013, the aggregate fees billed for products and services provided by the principal accountant, other than the services reported in paragraphs (a) through (c) of this Item, were $0 and $0, respectively. |
| | (e)(1) | Audit Committee Pre-Approval Policies and Procedures: All services to be performed by the Registrant’s principal accountant must be pre-approved by the Registrant’s audit committee. |
| | (e)(2) | No services described in paragraphs (b) through (d) of this Item were approved by the Registrant’s audit committee pursuant to paragraph (c)(7)(i)(C) of Rule 2-01 of Regulation S-X. |
| | (g) | No non-audit fees were billed by the Registrant’s principal accountant for services rendered to the Registrant’s investment adviser. |
Item 5. Audit Committee of Listed Registrants.
Not applicable to Registrant.
Item 6. Investments.
| | (a) | Schedule of Investments is included as part of the Reports to Stockholders filed under Item 1 of this Form N-CSR. |
| Item 7. | Disclosure of Proxy Voting Policies and Procedures for Closed-End Management Investment Companies. |
Not applicable to the Registrant.
Item 8. Portfolio Managers of Closed-End Management Investment Companies.
2
Not applicable to the Registrant.
| Item 9. | Purchases of Equity Securities by Closed-End Management Investment Company and Affiliated Purchasers. |
Not applicable to the Registrant.
Item 10. Submission of Matters to a Vote of Security Holders.
The Registrant has not adopted procedures by which shareholders may recommend nominees to the Registrant’s Board of Directors.
Item 11. Controls and Procedures.
| | (a) | The Registrant’s principal executive officer and principal financial officer have concluded that the Registrant’s disclosure controls and procedures (as defined in Rule 30a-3(c) under the Investment Company Act of 1940, as amended) are effective based on their evaluation of these controls and procedures as of a date within 90 days of the filing date of this report. |
| | (b) | There was no change in the Registrant’s internal control over financial reporting (as defined in Rule 30a-3(d) under the Investment Company Act of 1940, as amended) during the second fiscal quarter covered by this report that has materially affected, or is reasonably likely to materially affect, the Registrant’s internal control over financial reporting. |
Item 12. Exhibits.
| | (a)(1) | The Registrant’s Code of Ethics for Principal Executive Officer, Principal Financial Officer and Principal Accounting Officer, which is the subject of the disclosure required by Item 2 of Form N-CSR, was filed as Exhibit 12.a.1 to the Registrant’s Certified Shareholder Report of Registered Management Investment Companies on Form N-CSR, File No. 811-21580, on September 6, 2012. |
| | (a)(2) | The certifications required by Rule 30a-2(a) of the Investment Company Act of 1940, as amended, and Section 302 of the Sarbanes-Oxley Act of 2002 are attached hereto as Exhibit 99.Cert. |
| | (b) | The certifications by the Registrant’s principal executive officer and principal financial officer, as required by Rule 30a-2(b) of the Investment Company Act of 1940, as amended, and Section 906 of the Sarbanes-Oxley Act of 2002 are attached hereto as Exhibit 99.906Cert. |
3
SIGNATURES
Pursuant to the requirements of the Securities Exchange Act of 1934 and the Investment Company Act of 1940, the registrant has duly caused this report to be signed on its behalf by the undersigned, thereunto duly authorized.
| | | | |
| | Cortina Funds, Inc. |
| | |
| | By: | | /s/ Ryan T. Davies |
| | | | Ryan T. Davies, President |
| | | | (Principal Executive Officer) |
| | |
| | Date: | | September 8, 2014 |
Pursuant to the requirements of the Securities Exchange Act of 1934 and the Investment Company Act of 1940, this report has been signed below by the following persons on behalf of the registrant and in the capacities and on the dates indicated.
| | | | |
| | By: | | /s/ Eric Conner |
| | | | Eric Conner, Treasurer and Principal Accounting Officer (Principal Financial Officer) |
| | |
| | Date: | | September 8, 2014 |
4