UNITED STATES
SECURITIES AND EXCHANGE COMMISSION
Washington, D.C. 20549
FORM N-CSR
CERTIFIED SHAREHOLDER REPORT OF REGISTERED
MANAGEMENT INVESTMENT COMPANIES
Investment Company Act file number: 811-21580
CORTINA FUNDS, INC.
(Exact name of registrant as specified in charter)
825 N. Jefferson St., Suite 400, Milwaukee, WI 53202
(Address of principal executive offices) (Zip code)
(414) 225-7365
Registrant’s telephone number, including area code
Lori Hoch
825 N. Jefferson St., Suite 400
Milwaukee, WI 53202
(Name and address of agent for service)
Date of fiscal year end: June 30
Date of reporting period: July 1, 2012 - June 30, 2013
| Item 1. | Reports to Stockholders. |
TABLE OF CONTENTS
| | |
 | | Shareholder Letter |
| Cortina Small Cap Growth Fund | | June 30, 2013 (Unaudited) |
DEAR FELLOW SHAREHOLDERS:
The Cortina Small Cap Growth Fund enjoyed a strong finish to our fiscal year after a difficult beginning. For the six months ending June 30, 2013, the Fund significantly outperformed the Russell 2000 Growth Index. Taken in combination with the disappointing start, the Fund finished the fiscal year modestly ahead of its benchmark. The recent outperformance over the six month period was driven almost entirely by security selection. In fact, the holdings outperformed the benchmark constituents in all but two sectors (Consumer Staples and Materials & Processing), which combined represented less than 3% of Fund assets. The Technology and Consumer Discretionary sectors were standouts from a relative performance standpoint.
Consistent Process in an Inconsistent World
The volatility of our Fund returns over the past 12 months could mislead one into thinking dramatic changes were made in the management of the portfolio that led to a turnaround in performance. In reality, nothing can be further from the truth. Since the Fund’s inception, and indeed over the strategy’s much longer life, a very consistent process has been employed that is designed to opportunistically take advantage of market inefficiencies that are likely to persist for a very long time. The crux of the philosophy is to be early investors in innovative growth companies. The inefficiencies that are targeted are both emotional and structural.
From an emotional perspective, we target the general market’s reluctance to associate small market capitalization with high quality. Investors with multiple small cap mutual fund holdings will very likely read other managers’ letters that point to a “low quality rally” as the reason for underperforming in the first half of the 2013 calendar year. Likewise, large cap managers may use the same scapegoat for explaining the outperformance of small caps versus large caps. While it is true that investing in microcaps has been a bit of a tailwind for us recently, the stocks that have led the way have done so on positive company-specific developments. Three holdings were the subject of strategic acquisitions. Our two biggest contributors to positive performance continue to take market share from much larger competitors. Our third largest contributor has grown its installed base of diagnostic systems from 321 a year ago to close to 900 as of the end of the first quarter and remains less than 5% penetrated into its target market. It is hard to link the positive performance of these and other stocks in the portfolio with a “low quality rally.”
The structural inefficiency that we target is apathy towards small and microcap stocks by both institutional investors and large brokerage firms for purely economic reasons. For the brokerage firms, smaller companies often do not generate enough trading commissions (or investment banking fees) to justify the time and expense of writing research on them. For institutional investors, it is difficult, if not impossible, to invest multi-billion-dollar asset pools in small and microcap companies. For that reason, many small cap mutual funds restrict microcaps to a small portion of overall fund assets or exclude them altogether. As managers of the Cortina Small Cap Growth Fund, our preference is to restrict the amount of money we manage as opposed to the types of companies in which we invest. Another trend amongst investment managers that leads to inefficiencies in small cap stocks is an overreliance on technology (i.e., quantitative screening) to identify investment ideas and, in extreme cases, to populate portfolios. It is our belief that while quantitative screening may be an efficient tool for narrowing the investment universe it is ineffective in the small cap world. Rather, our process is to remove ourselves from our computer screens and identify and research potential investment ideas by meeting with companies. Over the past 12 months, the Cortina research staff has held more than 1,350 unique meetings with close to 900 different companies. We met a small diagnostics company 15 months ago which was covered by only two small regional brokerage firms. Today, with an installed base more than triple what it was when we initially met management, there are six firms following the company and it is likely showing up on quantitative screens indicating others will start to discover this investment.
True and lasting inefficiencies are not captured a nickel at a time in linear fashion. They are exploited over market cycles through the disciplined execution of a consistent philosophy and process. In the short term, and even over six- to twelve-month periods, the market’s desire to own or avoid an asset class can be more powerful than individual company fundamentals. This can lead to volatile performance of a consistent investment approach. Those overarching market dynamics create opportunities for us to reallocate capital among both existing portfolio holdings and new ideas alike. Investing in future growth is also an inexact science and is prone to misjudgment. We are not immune to this and the number of mistakes on our part can fluctuate from quarter to quarter. One mistake we have successfully avoided is the mistake of straying from our philosophy and process. It is this consistency that has carried us through difficult periods like the fourth calendar quarter of 2012 and has led us to rewarding periods such as that of the past six months.
Outlook and Positioning
We are very aware of the macro environment and have heard plenty of bull cases and bear cases for the economy and the stock market. Each argument is very convincing in a vacuum, as they tend to focus on one or two of the myriad issues facing investors. We pay enough attention to the macro data to help us understand the risks and opportunities that face the companies we invest in, but we try to avoid letting the macro picture sway portfolio construction. As small cap growth investors, we seek companies possessing something special and unique that allows them to control their own destiny. We continue to find companies that we believe fit this description and have yet to be discovered or properly appreciated by the broader market. From a sector standpoint, many of those ideas are being found in the Technology and Health Care sectors, which represent our two largest weights both in absolute terms and relative to the benchmark. These two sectors are constant sources of innovation and the changes facing the health care world today are demanding new and better approaches more than ever before. We have also added new holdings in the Consumer Discretionary sector, which is currently our third largest weight in the portfolio, though we remain underweight that sector relative to the benchmark.
Investing involves risks, including loss of principal.
| | |
| Annual Report | June 30, 2013 | | 1 |
| | |
| | Portfolio Information |
| Cortina Small Cap Growth Fund | | June 30, 2013 (Unaudited) |
Growth of $25,000 Investment (Unaudited)
For the period from September 30, 2011 (Inception) to June 30, 2013.
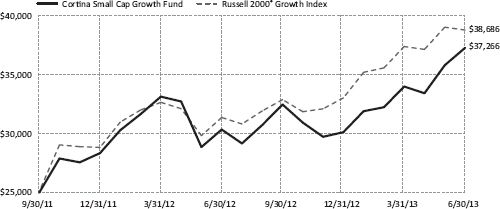
This graph assumes an initial $25,000 investment at September 30, 2011 (Inception Date). The Cortina Small Cap Growth Fund (the “Fund”) will deduct a 2.00% redemption proceeds fee on Fund shares held 60 days or less. This graph depicts the performance of the Fund versus the Russell 2000® Growth Index. It is important to note the Fund is a professionally managed mutual fund while the index is not available for investment and is unmanaged. The comparison is shown for illustrative purposes only.
This chart does not reflect the deduction of taxes that a shareholder would pay on Fund distributions or the redemption of Fund shares.
Performance Returns for the period ended June 30, 2013
| | | | | | | | | | | | | | | | | | | | |
| | | 1 Month | | | 6 Months | | | 1 Year | | | Since Inception* | | | Gross Expense
Ratio** | |
Cortina Small Cap Growth Fund | | | 4.10 | % | | | 23.70 | % | | | 22.79 | % | | | 25.61 | % | | | 3.85 | % |
Russell 2000® Growth Index | | | -0.62 | % | | | 17.44 | % | | | 23.67 | % | | | 28.37 | % | | | | |
| * | The Fund’s inception date is September 30, 2011. |
| ** | Cortina Asset Management, LLC (the “Adviser”) has contractually agreed to waive management fees and/or reimburse the Fund’s operating expenses in order to limit the Fund’s total annual fund operating expenses (excluding taxes, leverage, interest, brokerage commissions, dividends or interest expenses on short positions, acquired fund fees and expenses and extraordinary expenses) to 1.10% of average daily net assets of the Fund. The agreement will continue in effect at least through October 31, 2014, subject thereafter to annual re-approval of the agreement by the Fund’s Board of Directors. |
Past performance does not guarantee future results. The performance data quoted represents past performance and current returns may be lower or higher. Total return figures include change in share price, reinvestment of dividends and capital gains. The investment return and principal value will fluctuate so that an investor’s shares, when redeemed may be worth more or less than their original cost. To obtain performance information current to the most recent month end, call 1-855-612-3936.
Russell 2000® Growth Index measures the performance of the small-cap growth segment of the U.S. equity universe. It includes those Russell 2000 companies with higher price-to-value ratios and higher forecasted growth values. All indices are unmanaged. It is not possible to invest directly in an index.
Sector Allocations***
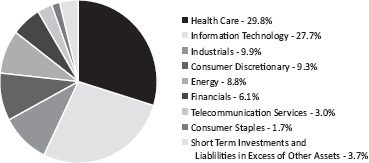
*** Percentages are based on net assets as of June 30, 2013. Holdings are subject to change.
| | |
| 2 | | 1-855-612-3936 | www.cortinafunds.com |
| | |
| | Shareholder Letter |
| Cortina Small Cap Value Fund | | June 30, 2013 (Unaudited) |
DEAR FELLOW SHAREHOLDERS:
For the first six months ending June 30, 2013, the Cortina Small Cap Value Fund delivered another strong showing in the reporting period, outpacing its benchmark. Stock selection again provided the entirety of outperformance. Every quarter since inception has shown the same pattern: the performance of individual companies trumps the clutter of geopolitical and economic news.
Most everyone has an opinion, often well informed, of the state of the economy and the direction of the markets, yet those opinions are often of marginal utility when it comes to actually investing capital. We think the problem is not that investors pay too much attention to the macro-focused news, it is that the pattern recognition is often flawed or incomplete, such as the predictions of a global monetary collapse that have not come to pass. Consensus has too long focused upon whether we are repeating the 1930s. We are not. A better analogy today may be 1848. In that year, near the end of the Industrial Revolution which changed the world then as the internet is now, many European countries underwent revolutions staged by the middle class protesting wages, food inflation and concentration of wealth. The leadership changes in many European countries over the past several years and the Arab Spring are much the same. However, after all the Sturm und Drang1 of the 1848 revolutions, shortly thereafter little had changed, which is the current outcome in Europe and the likely one in the Arab World.
Strangely enough, 1848 also saw the beginnings of the Gold Rush in California. Similar to last year’s gold rush, it too ended in dashed hopes of riches to be found in a shiny metal. Ignoring the talking heads who forecasted a new gold era was perhaps the best investment strategy of last year.
Broad predictions about the future, even when largely correct, are hard to correctly invest behind. This makes the current shift in interest rates very challenging for many. Our economy has been near absolute zero interest rates for a long period and it has had a profound impact on fixed income instruments, from bonds to dividend-paying equities as any yield was viewed as investable. Whether a massive rotation is about to unfold or not, absolute zero is ending, the domestic economy is warming, and traditional relationships are reasserting themselves to the surprise of those who only have a five-year memory.
A normalization of the yield curve may have outsized effects upon traditionally higher-yielding sectors, such as Real Estate Investment Trusts (REITs), Utilities, certain Consumer Staples, and Health Care companies. In particular, Financials are very susceptible to interest rate changes. If the sector had a high school year book page, it would be named “most likely to infuriate the casual observer.” It is a very broad sector subject to the influence of macro factors such as interest rates and loan demand, but a cursory discussion by talking heads is not enough. For example, even though REITs’ 4-5% yields appeared attractive relative to the 2% yield investors could earn on a 10 year Treasury, we do not believe the prospective absolute returns were attractive enough to warrant committing capital to the sector. Moreover, in a rising rate environment, we would expect REITs to suffer disproportionate absolute losses relative to other equity sectors. This indeed occurred. The recent uptick in rates has caused a meaningful pullback in the sector and our very underweight position to it materially added to our performance relative to the benchmark. However, while we still believe the sector to be overvalued, the shakeout has created several specific opportunities for us to take positions in REITs we have to date only looked at from afar. Make no mistake, we believe much of the sector remains expensive, but certain companies are evolving for the better and offer attractive upside with the risk-reward balance we require.
Portfolio Summary
In the most recent period, Financials and Technology sectors were the most important contributors while Consumer companies were a mild negative. Materials, Energy and Utilities were the worst performers in the benchmark for the first six months of 2013, but the portfolio is underweight each of those sectors which further added to relative performance. Thankfully, companies that change for the better often continue to change even more, resulting in positive returns for shareholders that compound beyond our original forecasts. It is the best of worlds for us when that occurs, and several significant holdings have, through wise acquisitions or successful new products, demonstrated evidence supporting higher price targets than our initial expectations. As a result, turnover declined to levels near 50% by mid-year 2013.
The portfolio remains overweight Technology and underweight Energy. Financials remain by far the largest segment of both the benchmark and portfolio. Our concerns about REITs notwithstanding, the recent panic in the sector has enabled us to very selectively add several REITs, the very group we have long shunned. We are now underweight Health Care after eliminating one company that put itself up for sale and taking profits on another. In addition, although we remain overweight Industrials, it is by a smaller margin than at any point in the past two years as it is difficult to find compelling stories coupled to reasonable valuations.
Despite the significant rise in the market, we continue to find value across the spectrum of industries, with the exception of highly commodity-dependent companies. Materials companies may have attractive headline valuations, but are unlikely to make it into our portfolio. Most do not meet the test of being a good business with a large degree of control over their own destinies.
| 1 | A German term often used to describe storm and stress. |
| | |
| Annual Report | June 30, 2013 | | 3 |
| | |
| | Shareholder Letter |
| Cortina Small Cap Value Fund | | June 30, 2013 (Unaudited) |
The last several years have seen much concern about the global economy and the health of the financial system. The concerns may be valid, but fear is not an investment strategy. Gold may still be shiny, but it declined, in dollar terms, by 22% in the 18 months ending June 30, 2013, while the S&P 500 increased by 28%. The remarkable 50 percentage point spread in returns of the well publicized doomsayers versus the boring long-only investors, such as ourselves, may be a reminder of the inverse correlation between a professional investor’s returns and his or her speaking engagements. In our view, there are many remarkable companies with great futures trading at reasonable valuations, and we continue to monitor the best ones to invest in when appropriate and take care to invest your hard-earned capital wisely.
Investing involves risks, including loss of principal.
| | |
| 4 | | 1-855-612-3936 | www.cortinafunds.com |
| | |
| | Portfolio Information |
| Cortina Small Cap Value Fund | | June 30, 2013 (Unaudited) |
Growth of $25,000 Investment (Unaudited)
For the period from September 30, 2011 (Inception) to June 30, 2013.
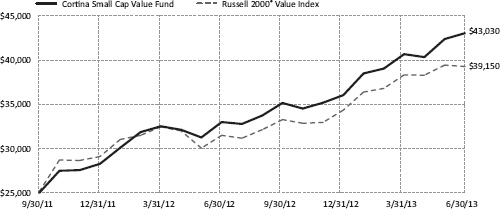
This graph assumes an initial $25,000 investment at September 30, 2011 (Inception Date). The Cortina Small Cap Value Fund (the “Fund”) will deduct a 2.00% redemption proceeds fee on Fund shares held 60 days or less. This graph depicts the performance of the Fund versus the Russell 2000® Value Index. It is important to note the Fund is a professionally managed mutual fund, while the index is not available for investment and is unmanaged. The comparison is shown for illustrative purposes only.
This chart does not reflect the deduction of taxes that a shareholder would pay on Fund distributions or the redemption of Fund shares.
Performance Returns for the period ended June 30, 2013
| | | | | | | | | | | | | | | | | | | | |
| | | 1 Month | | | 6 Months | | | 1 Year | | | Since
Inception* | | | Gross Expense
Ratio** | |
Cortina Small Cap Value Fund | | | 1.56 | % | | | 19.42 | % | | | 30.41 | % | | | 36.37 | % | | | 5.55 | % |
Russell 2000® Value Index | | | -0.41 | % | | | 14.39 | % | | | 24.77 | % | | | 29.25 | % | | | | |
| * | The Fund’s inception date is September 30, 2011. |
| ** | Cortina Asset Management, LLC (the “Adviser”) has contractually agreed to waive management fees and/or reimburse the Fund’s operating expenses in order to limit the Fund’s total annual fund operating expenses (excluding taxes, leverage, interest, brokerage commissions, dividends or interest expenses on short positions, acquired fund fees and expenses and extraordinary expenses) to 1.10% of average daily net assets of the Fund. The agreement will continue in effect at least through October 31, 2014, subject thereafter to annual re-approval of the agreement by the Fund’s Board of Directors. |
Past performance does not guarantee future results. The performance data quoted represents past performance and current returns may be lower or higher. Total return figures include change in share price, reinvestment of dividends and capital gains. The investment return and principal value will fluctuate so that an investor’s shares, when redeemed may be worth more or less than their original cost. To obtain performance information current to the most recent month end, call 1-855-612-3936.
Russell 2000® Value Index measures the performance of those Russell 2000 companies with lower price-to-book ratios and lower forecasted growth values. All indices are unmanaged. It is not possible to invest directly in an index.
Sector Allocations***
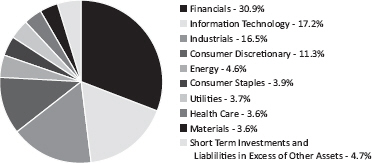
*** Percentages are based on net assets as of June 30, 2013. Holdings are subject to change.
| | |
| Annual Report | June 30, 2013 | | 5 |
| | |
| | Disclosure of Fund Expenses |
| | | June 30, 2013 (Unaudited) |
As a shareholder of the Fund(s), you incur ongoing costs, including management fees and other Fund expenses. This example is intended to help you understand your ongoing costs (in dollars) of investing in each Fund and to compare these costs with the ongoing costs of investing in other mutual funds. The example is based on an investment of $1,000 invested at the beginning of the period and held for the entire period, as indicated below.
Actual Expenses – The first line of the table below provides information about the actual account values and actual expenses. You may use the information in this line, together with the amount you invested, to estimate the expenses that you paid over the period. Simply divide your account value by $1,000 (for example, an $8,600 account value divided by $1,000 = 8.6) then multiply the result by the number in the first line under the heading entitled “Expenses Paid During Period” to estimate the expenses you paid on your account during this period.
Hypothetical Example for Comparison Purposes – The second line of the table below provides information about hypothetical account values and hypothetical expenses based on each Fund’s actual expense ratio and an assumed annual rate of return of 5% before expenses, which is not each Fund’s actual return. The hypothetical account values and expenses may not be used to estimate the actual ending account balance or expenses you paid for the period. You may use this information to compare the ongoing costs of investing in each Fund and other funds by comparing these 5% hypothetical examples with the 5% hypothetical examples that appear in the shareholder reports of other funds.
Please note that the expenses shown in the table are meant to highlight your ongoing costs only and do not reflect any direct costs, such as wire fees or low balance fees. Therefore, the second line of the table is useful in comparing ongoing costs and will not help you determine the relative total costs of owning different funds. In addition, if these direct costs were included, your costs would be higher.
| | | | | | | | | | | | | | | | |
| | | Beginning
Account Value
January 1, 2013 | | | Ending
Account Value
June 30, 2013 | | | Expenses Paid
During Period(a) | | | Net
Expense
Ratios | |
Cortina Small Cap Growth Fund | | | | | | | | | | | | | | | | |
Actual Fund Return | | $ | 1,000.00 | | | $ | 1,237.00 | | | $ | 6.10 | | | | 1.10 | % |
Hypothetical Fund Return (assuming a 5% return before expenses) | | $ | 1,000.00 | | | $ | 1,019.34 | | | $ | 5.51 | | | | 1.10 | % |
Cortina Small Cap Value Fund | | | | | | | | | | | | | | | | |
Actual Fund Return | | $ | 1,000.00 | | | $ | 1,194.20 | | | $ | 5.98 | | | | 1.10 | % |
Hypothetical Fund Return (assuming a 5% return before expenses) | | $ | 1,000.00 | | | $ | 1,019.34 | | | $ | 5.51 | | | | 1.10 | % |
| (a) | Expenses are equal to the Fund’s annualized expense ratio multiplied by the average account value over the period, multiplied by the number of days in the most recent fiscal half year (181), divided by 365. |
| | |
| 6 | | 1-855-612-3936 | www.cortinafunds.com |
| | |
| | Schedule of Investments |
| Cortina Small Cap Growth Fund | | June 30, 2013 |
| | | | | | | | |
| | | Shares | | | Value | |
COMMON STOCKS (96.3%) | | | | | | | | |
Consumer Discretionary (9.3%) | | | | | | | | |
Black Diamond, Inc.(a) | | | 17,161 | | | $ | 161,313 | |
Chuy’s Holdings, Inc.(a) | | | 4,500 | | | | 172,530 | |
Five Below, Inc.(a) | | | 4,093 | | | | 150,459 | |
Francesca’s Holdings Corp.(a) | | | 5,475 | | | | 152,150 | |
Gentherm, Inc.(a) | | | 7,735 | | | | 143,639 | |
Restoration Hardware Holdings, Inc.(a) | | | 2,677 | | | | 200,775 | |
Shutterfly, Inc.(a) | | | 5,693 | | | | 317,613 | |
Steven Madden, Ltd.(a) | | | 4,171 | | | | 201,793 | |
Tumi Holdings, Inc.(a) | | | 8,167 | | | | 196,008 | |
| | | | | | | | |
| | | | | | | 1,696,280 | |
| | | | | | | | |
Consumer Staples (1.7%) | | | | | | | | |
Annie’s, Inc.(a) | | | 3,178 | | | | 135,828 | |
The Fresh Market, Inc.(a) | | | 3,517 | | | | 174,865 | |
| | | | | | | | |
| | | | | | | 310,693 | |
| | | | | | | | |
Energy (8.8%) | | | | | | | | |
Carrizo Oil & Gas, Inc.(a) | | | 7,797 | | | | 220,889 | |
ION Geophysical Corp.(a) | | | 24,634 | | | | 148,297 | |
Northern Oil & Gas, Inc.(a) | | | 10,321 | | | | 137,682 | |
Rex Energy Corp.(a) | | | 13,104 | | | | 230,368 | |
RigNet, Inc.(a) | | | 4,128 | | | | 105,181 | |
Sanchez Energy Corp.(a) | | | 9,402 | | | | 215,870 | |
Synergy Resources Corp.(a) | | | 37,475 | | | | 274,317 | |
Triangle Petroleum Corp.(a) | | | 39,275 | | | | 275,318 | |
| | | | | | | | |
| | | | | | | 1,607,922 | |
| | | | | | | | |
Financials (6.1%) | | | | | | | | |
The Bancorp, Inc.(a) | | | 11,003 | | | | 164,935 | |
BofI Holding, Inc.(a) | | | 4,419 | | | | 202,479 | |
eHealth, Inc.(a) | | | 5,986 | | | | 136,002 | |
EverBank Financial Corp. | | | 7,313 | | | | 121,103 | |
Health Insurance Innovations, Inc., Class A(a) | | | 5,611 | | | | 59,028 | |
ICG Group, Inc.(a) | | | 16,979 | | | | 193,561 | |
Pinnacle Financial Partners, Inc.(a) | | | 5,323 | | | | 136,854 | |
Tristate Capital Holdings, Inc.(a) | | | 7,655 | | | | 105,256 | |
| | | | | | | | |
| | | | | | | 1,119,218 | |
| | | | | | | | |
Health Care (29.8%) | | | | | | | | |
Align Technology, Inc.(a) | | | 6,748 | | | | 249,946 | |
AtriCure, Inc.(a) | | | 24,603 | | | | 233,728 | |
BioScrip, Inc.(a) | | | 13,078 | | | | 215,787 | |
Cepheid, Inc.(a) | | | 4,082 | | | | 140,502 | |
Cerus Corp.(a) | | | 41,038 | | | | 181,388 | |
DexCom, Inc.(a) | | | 8,073 | | | | 181,239 | |
Endologix, Inc.(a) | | | 16,037 | | | | 212,971 | |
Fluidigm Corp.(a) | | | 11,770 | | | | 205,504 | |
HealthStream, Inc.(a) | | | 9,357 | | | | 236,919 | |
HeartWare International, Inc.(a) | | | 1,887 | | | | 179,473 | |
Imris, Inc.(a) | | | 33,884 | | | | 93,520 | |
Insulet Corp.(a) | | | 6,148 | | | | 193,109 | |
LipoScience, Inc.(a) | | | 11,451 | | | | 80,042 | |
Medidata Solutions, Inc.(a) | | | 4,307 | | | | 333,577 | |
Myriad Genetics, Inc.(a) | | | 5,371 | | | | 144,319 | |
Neogen Corp.(a) | | | 4,107 | | | | 228,185 | |
NeoGenomics, Inc.(a) | | | 38,835 | | | | 154,563 | |
Novadaq Technologies, Inc.(a) | | | 11,547 | | | | 155,423 | |
NxStage Medical, Inc.(a) | | | 14,231 | | | | 203,219 | |
See Notes to Financial Statements.
| | |
| Annual Report | June 30, 2013 | | 7 |
| | |
| | Schedule of Investments |
| Cortina Small Cap Growth Fund | | June 30, 2013 |
| | | | | | | | |
| | | Shares | | | Value | |
COMMON STOCKS (continued) | | | | | | | | |
Health Care (continued) | | | | | | | | |
OraSure Technologies, Inc.(a) | | | 23,282 | | | $ | 90,334 | |
PhotoMedex, Inc.(a) | | | 11,570 | | | | 184,426 | |
Quidel Corp.(a) | | | 10,195 | | | | 260,278 | |
Sequenom, Inc.(a) | | | 42,127 | | | | 177,355 | |
Solta Medical, Inc.(a) | | | 63,641 | | | | 145,101 | |
Spectranetics Corp.(a) | | | 13,396 | | | | 250,237 | |
Staar Surgical Co.(a) | | | 20,790 | | | | 211,019 | |
Streamline Health Solutions, Inc.(a) | | | 18,412 | | | | 120,967 | |
Synergetics USA, Inc.(a) | | | 21,415 | | | | 84,375 | |
TearLab Corp.(a) | | | 21,301 | | | | 226,217 | |
Uroplasty, Inc.(a) | | | 29,822 | | | | 61,732 | |
| | | | | | | | |
| | | | | | | 5,435,455 | |
| | | | | | | | |
Industrials (9.9%) | | | | | | | | |
Aegean Marine Petroleum Network, Inc. | | | 17,067 | | | | 158,040 | |
Astronics Corp.(a) | | | 4,396 | | | | 179,664 | |
Chart Industries, Inc.(a) | | | 1,717 | | | | 161,553 | |
Echo Global Logistics, Inc.(a) | | | 10,309 | | | | 200,922 | |
Graham Corp. | | | 3,087 | | | | 92,703 | |
Heritage Crystal Clean, Inc.(a) | | | 4,155 | | | | 60,705 | |
Manitex International, Inc.(a) | | | 13,679 | | | | 149,785 | |
Power Solutions International, Inc.(a) | | | 3,001 | | | | 100,804 | |
Rush Enterprises, Inc., Class A(a) | | | 5,166 | | | | 127,858 | |
Team, Inc.(a) | | | 4,720 | | | | 178,652 | |
Wesco Aircraft Holdings, Inc.(a) | | | 10,889 | | | | 202,209 | |
Westport Innovations, Inc.(a) | | | 5,482 | | | | 183,811 | |
| | | | | | | | |
| | | | | | | 1,796,706 | |
| | | | | | | | |
Information Technology (27.7%) | | | | | | | | |
Brightcove, Inc.(a) | | | 20,445 | | | | 179,098 | |
Ciena Corp.(a) | | | 5,698 | | | | 110,655 | |
CommVault Systems, Inc.(a) | | | 2,598 | | | | 197,162 | |
Computer Task Group, Inc.(a) | | | 6,085 | | | | 139,772 | |
Envestnet, Inc.(a) | | | 6,846 | | | | 168,412 | |
Imperva, Inc.(a) | | | 4,429 | | | | 199,482 | |
Infoblox, Inc.(a) | | | 8,225 | | | | 240,664 | |
Inphi Corp.(a) | | | 19,833 | | | | 218,163 | |
Integrated Silicon Solution, Inc.(a) | | | 11,838 | | | | 129,745 | |
Interactive Intelligence Group, Inc.(a) | | | 4,184 | | | | 215,894 | |
Internap Network Services Corp.(a) | | | 21,687 | | | | 179,352 | |
InterXion Holding NV(a) | | | 5,880 | | | | 153,644 | |
Market Leader, Inc.(a) | | | 12,613 | | | | 134,959 | |
MaxLinear, Inc., Class A(a) | | | 26,624 | | | | 186,368 | |
Numerex Corp., Class A(a) | | | 14,143 | | | | 157,836 | |
Procera Networks, Inc.(a) | | | 12,018 | | | | 165,007 | |
Proofpoint, Inc.(a) | | | 10,367 | | | | 251,192 | |
QLIK Technologies, Inc.(a) | | | 5,624 | | | | 158,991 | |
Qualys, Inc.(a) | | | 10,392 | | | | 167,519 | |
RADWARE, Ltd.(a) | | | 8,931 | | | | 123,159 | |
Rally Software Development Corp.(a) | | | 4,799 | | | | 119,111 | |
Rubicon Technology, Inc.(a) | | | 16,933 | | | | 135,633 | |
SciQuest, Inc.(a) | | | 5,867 | | | | 146,968 | |
Semtech Corp.(a) | | | 5,404 | | �� | | 189,302 | |
Sonus Networks, Inc.(a) | | | 36,411 | | | | 109,597 | |
SPS Commerce, Inc.(a) | | | 1,821 | | | | 100,155 | |
Stamps.com, Inc.(a) | | | 5,411 | | | | 213,139 | |
See Notes to Financial Statements.
| | |
| 8 | | 1-855-612-3936 | www.cortinafunds.com |
| | |
| | Schedule of Investments |
| Cortina Small Cap Growth Fund | | June 30, 2013 |
| | | | | | | | |
| | | Shares | | | Value | |
COMMON STOCKS (continued) | | | | | | | | |
Information Technology (continued) | | | | | | | | |
support.com, Inc.(a) | | | 14,767 | | | $ | 67,485 | |
Synchronoss Technologies, Inc.(a) | | | 8,488 | | | | 262,025 | |
Tangoe, Inc.(a) | | | 14,692 | | | | 226,698 | |
| | | | | | | | |
| | | | | | | 5,047,187 | |
| | | | | | | | |
Telecommunication Services (3.0%) | | | | | | | | |
8x8, Inc.(a) | | | 20,825 | | | | 171,598 | |
Cogent Communications Group, Inc. | | | 5,300 | | | | 149,195 | |
inContact, Inc.(a) | | | 28,559 | | | | 234,755 | |
| | | | | | | | |
| | | | | | | 555,548 | |
| | | | | | | | |
TOTAL COMMON STOCKS
(COST $14,700,270) | | | | | | | 17,569,009 | |
| | | | | | | | |
SHORT TERM INVESTMENTS (2.8%) | | | | | | | | |
HighMark Diversified Money Market Fund, Fiduciary Class, 7 Day Yield 0.019% | | | 511,399 | | | | 511,399 | |
| | | | | | | | |
TOTAL SHORT TERM INVESTMENTS
(COST $511,399) | | | | | | | 511,399 | |
| | | | | | | | |
TOTAL INVESTMENTS (99.1%)
(COST $15,211,669) | | | | | | | 18,080,408 | |
| | | | | | | | |
TOTAL ASSETS IN EXCESS OF OTHER LIABILITIES (0.9%) | | | | | | | 164,468 | |
| | | | | | | | |
NET ASSETS 100.0% | | | | | | $ | 18,244,876 | |
| | | | | | | | |
| (a) | Non Income Producing Security. |
Common Abbreviations:
Ltd. - Limited.
NV - Naamloze Vennootschap is the Dutch term for a public limited liability corporation.
See Notes to Financial Statements.
| | |
| Annual Report | June 30, 2013 | | 9 |
| | |
| | Schedule of Investments |
| Cortina Small Cap Value Fund | | June 30, 2013 |
| | | | | | | | |
| | | Shares | | | Value | |
COMMON STOCKS (95.3%) | | | | | | | | |
Consumer Discretionary (11.3%) | | | | | | | | |
AFC Enterprises, Inc.(a) | | | 1,176 | | | $ | 42,266 | |
ANN, Inc.(a) | | | 1,837 | | | | 60,988 | |
DreamWorks Animation SKG, Inc., Class A(a) | | | 3,099 | | | | 79,520 | |
Helen of Troy, Ltd.(a) | | | 1,405 | | | | 53,910 | |
Life Time Fitness, Inc.(a) | | | 938 | | | | 47,003 | |
Regis Corp. | | | 3,836 | | | | 62,987 | |
Stage Stores, Inc. | | | 3,282 | | | | 77,127 | |
World Wrestling Entertainment, Inc. | | | 6,521 | | | | 67,232 | |
| | | | | | | | |
| | | | | | | 491,033 | |
| | | | | | | | |
Consumer Staples (3.9%) | | | | | | | | |
Darling International, Inc.(a) | | | 2,828 | | | | 52,770 | |
Elizabeth Arden, Inc.(a) | | | 1,359 | | | | 61,250 | |
Prestige Brands Holdings, Inc.(a) | | | 1,941 | | | | 56,561 | |
| | | | | | | | |
| | | | | | | 170,581 | |
| | | | | | | | |
Energy (4.6%) | | | | | | | | |
Gulfport Energy Corp.(a) | | | 1,197 | | | | 56,343 | |
Helix Energy Solutions Group, Inc.(a) | | | 3,224 | | | | 74,281 | |
Matador Resources Co.(a) | | | 5,841 | | | | 69,975 | |
| | | | | | | | |
| | | | | | | 200,599 | |
| | | | | | | | |
Financials (30.9%) | | | | | | | | |
Altisource Residential Corp., Class B(a) | | | 3,563 | | | | 59,466 | |
Amtrust Financial Services, Inc. | | | 1,600 | | | | 57,120 | |
The Bancorp, Inc.(a) | | | 5,591 | | | | 83,809 | |
BancorpSouth, Inc. | | | 4,184 | | | | 74,057 | |
Boston Private Financial Holdings, Inc. | | | 5,094 | | | | 54,200 | |
Capitol Federal Financial, Inc. | | | 3,873 | | | | 47,018 | |
CNO Financial Group, Inc. | | | 9,592 | | | | 124,312 | |
Colony Financial, Inc. | | | 3,160 | | | | 62,852 | |
Columbia Banking System, Inc. | | | 1,898 | | | | 45,191 | |
eHealth, Inc.(a) | | | 2,617 | | | | 59,458 | |
Employers Holdings, Inc. | | | 2,663 | | | | 65,110 | |
Maiden Holdings, Ltd. | | | 5,917 | | | | 66,389 | |
MB Financial, Inc. | | | 2,022 | | | | 54,190 | |
Ocwen Financial Corp.(a) | | | 704 | | | | 29,019 | |
OFG Bancorp | | | 4,351 | | | | 78,797 | |
Oritani Financial Corp. | | | 4,247 | | | | 66,593 | |
PennyMac Mortgage Investment Trust | | | 2,279 | | | | 47,973 | |
PHH Corp.(a) | | | 2,462 | | | | 50,176 | |
Platinum Underwriters Holdings, Ltd. | | | 1,453 | | | | 83,141 | |
ProAssurance Corp. | | | 1,676 | | | | 87,420 | |
Texas Capital Bancshares, Inc.(a) | | | 1,057 | | | | 46,889 | |
| | | | | | | | |
| | | | | | | 1,343,180 | |
| | | | | | | | |
Health Care (3.6%) | | | | | | | | |
Allscripts Healthcare Solutions, Inc.(a) | | | 3,099 | | | | 40,101 | |
Teleflex, Inc. | | | 661 | | | | 51,221 | |
Tenet Healthcare Corp.(a) | | | 1,435 | | | | 66,154 | |
| | | | | | | | |
| | | | | | | 157,476 | |
| | | | | | | | |
Industrials (16.5%) | | | | | | | | |
Cubic Corp. | | | 1,591 | | | | 76,527 | |
Hyster-Yale Materials Handling, Inc. | | | 497 | | | | 31,207 | |
The Manitowoc Co., Inc. | | | 2,843 | | | | 50,918 | |
MasTec, Inc.(a) | | | 3,419 | | | | 112,485 | |
NCI Building Systems, Inc.(a) | | | 3,062 | | | | 46,818 | |
Orbital Sciences Corp.(a) | | | 3,282 | | | | 57,008 | |
See Notes to Financial Statements.
| | |
| 10 | | 1-855-612-3936 | www.cortinafunds.com |
| | |
| | Schedule of Investments |
| Cortina Small Cap Value Fund | | June 30, 2013 |
| | | | | | | | |
| | | Shares | | | Value | |
COMMON STOCKS (continued) | | | | | | | | |
Industrials (continued) | | | | | | | | |
Performant Financial Corp.(a) | | | 5,747 | | | $ | 66,608 | |
Powell Industries, Inc.(a) | | | 1,460 | | | | 75,409 | |
Raven Industries, Inc. | | | 1,819 | | | | 54,534 | |
TrueBlue, Inc.(a) | | | 3,861 | | | | 81,274 | |
Tutor Perini Corp.(a) | | | 3,492 | | | | 63,170 | |
| | | | | | | | |
| | | | | | | 715,958 | |
| | | | | | | | |
Information Technology (17.2%) | | | | | | | | |
Accelrys, Inc.(a) | | | 7,142 | | | | 59,993 | |
Cardtronics, Inc.(a) | | | 1,898 | | | | 52,385 | |
Cognex Corp. | | | 1,185 | | | | 53,586 | |
Coherent, Inc. | | | 935 | | | | 51,490 | |
comScore, Inc.(a) | | | 3,830 | | | | 93,414 | |
Liquidity Services, Inc.(a) | | | 2,090 | | | | 72,460 | |
M/A-COM Technology Solutions Holdings, Inc.(a) | | | 4,324 | | | | 63,130 | |
Move, Inc.(a) | | | 5,162 | | | | 66,177 | |
OSI Systems, Inc.(a) | | | 1,103 | | | | 71,055 | |
Sierra Wireless, Inc.(a) | | | 4,196 | | | | 53,709 | |
Super Micro Computer, Inc.(a) | | | 5,530 | | | | 58,839 | |
Ultratech, Inc.(a) | | | 1,344 | | | | 49,352 | |
| | | | | | | | |
| | | | | | | 745,590 | |
| | | | | | | | |
Materials (3.6%) | | | | | | | | |
Flotek Industries, Inc.(a) | | | 4,080 | | | | 73,195 | |
Graphic Packaging Holdings Co.(a) | | | 10,847 | | | | 83,956 | |
| | | | | | | | |
| | | | | | | 157,151 | |
| | | | | | | | |
Utilities (3.7%) | | | | | | | | |
ALLETE, Inc. | | | 1,597 | | | | 79,610 | |
Black Hills Corp. | | | 1,606 | | | | 78,293 | |
| | | | | | | | |
| | | | | | | 157,903 | |
| | | | | | | | |
TOTAL COMMON STOCKS
(COST $3,325,786) | | | | | | | 4,139,471 | |
| | | | | | | | |
SHORT TERM INVESTMENTS (5.1%) | | | | | | | | |
HighMark Diversified Money Market Fund, Fiduciary Class, 7 Day Yield 0.019% | | | 220,089 | | | | 220,089 | |
| | | | | | | | |
TOTAL SHORT TERM INVESTMENTS
(COST $220,089) | | | | | | | 220,089 | |
| | | | | | | | |
TOTAL INVESTMENTS (100.4%)
(COST $3,545,875) | | | | | | | 4,359,560 | |
| | | | | | | | |
TOTAL LIABILITIES IN EXCESS OF OTHER ASSETS (-0.4%) | | | | | | | (15,985 | ) |
| | | | | | | | |
NET ASSETS 100.0% | | | | | | $ | 4,343,575 | |
| | | | | | | | |
| (a) | Non Income Producing Security. |
Common Abbreviations:
Ltd. - Limited.
See Notes to Financial Statements.
| | |
| Annual Report | June 30, 2013 | | 11 |
| | |
| | Statements of Assets and Liabilities |
| | | June 30, 2013 |
| | | | | | | | |
| | | Cortina Small Cap
Growth Fund | | | Cortina Small Cap
Value Fund | |
ASSETS: | | | | | | | | |
Investments, at value (Cost - see below) | | $ | 18,080,408 | | | $ | 4,359,560 | |
Cash | | | 21,153 | | | | 50,000 | |
Receivable for investments sold | | | 283,395 | | | | 23,727 | |
Receivable for fund shares subscribed | | | 8,400 | | | | 500 | |
Dividends receivable | | | 328 | | | | 2,647 | |
Receivable due from adviser | | | 12,176 | | | | 5,978 | |
Prepaid expenses and other assets | | | 6,689 | | | | 4,886 | |
| | | | | | | | |
Total Assets | | | 18,412,549 | | | | 4,447,298 | |
| | | | | | | | |
LIABILITIES: | | | | | | | | |
Payable for investments purchased | | | 120,437 | | | | 79,111 | |
Payable for fund shares redeemed | | | 1,761 | | | | 260 | |
Payable for director fees | | | 250 | | | | 250 | |
Payable for fund accounting and administration fees | | | 13,152 | | | | 3,609 | |
Payable for audit and legal fees | | | 23,982 | | | | 16,993 | |
Other accrued liabilities and expenses | | | 8,091 | | | | 3,500 | |
| | | | | | | | |
Total Liabilities | | | 167,673 | | | | 103,723 | |
| | | | | | | | |
Net Assets | | $ | 18,244,876 | | | $ | 4,343,575 | |
| | | | | | | | |
NET ASSETS CONSISTS OF: | | | | | | | | |
Paid-in capital | | $ | 15,546,405 | | | $ | 3,352,874 | |
Accumulated net investment loss | | | (71,261 | ) | | | (11,111 | ) |
Accumulated undistributed net realized gain/(loss) on investments | | | (99,007 | ) | | | 188,127 | |
Net unrealized appreciation on investments | | | 2,868,739 | | | | 813,685 | |
| | | | | | | | |
Net Assets | | $ | 18,244,876 | | | $ | 4,343,575 | |
| | | | | | | | |
Cost of Investments | | $ | 15,211,669 | | | $ | 3,545,875 | |
| | |
PRICING OF SHARES: | | | | | | | | |
Net Assets | | $ | 18,244,876 | | | $ | 4,343,575 | |
Shares Outstanding | | | 1,261,863 | | | | 278,108 | |
Net Asset Value, offering and redemption price per share | | $ | 14.46 | | | $ | 15.62 | |
See Notes to Financial Statements.
| | |
| 12 | | 1-855-612-3936 | www.cortinafunds.com |
| | |
| | Statements of Operations |
| | | For the Year Ended June 30, 2013 |
| | | | | | | | |
| | | Cortina Small Cap
Growth Fund | | | Cortina Small Cap
Value Fund | |
INVESTMENT INCOME: | | | | | | | | |
Dividends, (net of foreign withholding taxes of $0 and $67) | | $ | 10,094 | | | $ | 37,840 | |
| | | | | | | | |
Total Investment Income | | | 10,094 | | | | 37,840 | |
| | | | | | | | |
EXPENSES: | | | | | | | | |
Advisory fees (Note 3) | | | 97,605 | | | | 31,576 | |
Transfer agent fees | | | 40,038 | | | | 26,999 | |
Fund accounting and administration fees and expenses | | | 135,339 | | | | 55,590 | |
Legal fees | | | 20,550 | | | | 6,439 | |
Printing fees | | | 8,328 | | | | 2,793 | |
Registration fees | | | 25,802 | | | | 8,695 | |
Audit and tax preparation fees | | | 14,500 | | | | 14,500 | |
Custodian fees | | | 4,797 | | | | 2,989 | |
Insurance | | | 8,731 | | | | 8,731 | |
Director fee and expenses | | | 5,000 | | | | 5,000 | |
Offering costs | | | 7,534 | | | | 7,263 | |
Other | | | 7,258 | | | | 4,552 | |
| | | | | | | | |
Total Expenses Before Waivers/Reimbursements | | | 375,482 | | | | 175,127 | |
Less fees waived/reimbursed by adviser (Note 3) | | | (268,118 | ) | | | (140,394 | ) |
| | | | | | | | |
Total Net Expenses | | | 107,364 | | | | 34,733 | |
| | | | | | | | |
Net Investment Income/(Loss) | | | (97,270 | ) | | | 3,107 | |
| | | | | | | | |
REALIZED AND UNREALIZED GAIN/(LOSS) ON INVESTMENTS: | | | | | | | | |
Net realized gain/(loss) on investments | | | (50,842 | ) | | | 263,251 | |
Net change in unrealized appreciation on investments | | | 2,731,439 | | | | 609,341 | |
| | | | | | | | |
Net Realized and Unrealized Gain on Investments | | | 2,680,597 | | | | 872,592 | |
| | | | | | | | |
Net Increase in Net Assets Resulting from Operations | | $ | 2,583,327 | | | $ | 875,699 | |
| | | | | | | | |
See Notes to Financial Statements.
| | |
| Annual Report | June 30, 2013 | | 13 |
| | |
| | Statements of Changes in Net Assets |
| | | |
| | | | | | | | | | | | | | | | |
| | | Cortina Small Cap Growth Fund | | | Cortina Small Cap Value Fund | |
| | | Year Ended
June 30, 2013 | | | For the Period
September 30, 2011
(Inception) to
June 30, 2012 | | | Year Ended
June 30, 2013 | | | For the Period
September 30, 2011
(Inception) to
June 30, 2012 | |
OPERATIONS: | | | | | | | | | | | | | | | | |
Net investment income/(loss) | | $ | (97,270 | ) | | $ | (7,878 | ) | | $ | 3,107 | | | $ | (2,304 | ) |
Net realized gain/(loss) on investments | | | (50,842 | ) | | | 72,431 | | | | 263,251 | | | | 69,894 | |
Net change in unrealized appreciation of investments | | | 2,731,439 | | | | 137,300 | | | | 609,341 | | | | 204,344 | |
| | | | | | | | | | | | | | | | |
Net increase in net assets resulting from operations | | | 2,583,327 | | | | 201,853 | | | | 875,699 | | | | 271,934 | |
| | | | | | | | | | | | | | | | |
DISTRIBUTIONS TO SHAREHOLDERS: | | | | | | | | | | | | | | | | |
From net investment income | | | — | | | | — | | | | (15,144 | ) | | | — | |
From net realized gains on investments | | | (68,752 | ) | | | (20,406 | ) | | | (113,367 | ) | | | (30,530 | ) |
| | | | | | | | | | | | | | | | |
Total distributions | | | (68,752 | ) | | | (20,406 | ) | | | (128,511 | ) | | | (30,530 | ) |
| | | | | | | | | | | | | | | | |
CAPITAL SHARE TRANSACTIONS: | | | | | | | | | | | | | | | | |
Proceeds from sale of shares | | | 15,302,028 | | | | 1,108,101 | | | | 1,751,217 | | | | 1,569,937 | |
Shares issued in reinvestment of distributions | | | 67,885 | | | | 20,406 | | | | 123,043 | | | | 30,530 | |
Cost of shares redeemed | | | (1,049,424 | ) | | | (900,145 | ) | | | (219,642 | ) | | | (900,104 | ) |
Redemption fees | | | — | | | | 3 | | | | — | | | | 2 | |
| | | | | | | | | | | | | | | | |
Net increase from capital shares transactions | | | 14,320,489 | | | | 228,365 | | | | 1,654,618 | | | | 700,365 | |
| | | | | | | | | | | | | | | | |
Net increase in net assets | | | 16,835,064 | | | | 409,812 | | | | 2,401,806 | | | | 941,769 | |
| | | | | | | | | | | | | | | | |
NET ASSETS: | | | | | | | | | | | | | | | | |
Beginning of period | | | 1,409,812 | | | | 1,000,000 | | | | 1,941,769 | | | | 1,000,000 | |
| | | | | | | | | | | | | | | | |
End of period | | $ | 18,244,876 | | | $ | 1,409,812 | | | $ | 4,343,575 | | | $ | 1,941,769 | |
| | | | | | | | | | | | | | | | |
Including accumulated net investment income/(loss) of: | | $ | (71,261 | ) | | $ | — | | | $ | (11,111 | ) | | $ | — | |
| | | | |
OTHER INFORMATION: | | | | | | | | | | | | | | | | |
Share Transactions: | | | | | | | | | | | | | | | | |
Beginning shares | | | 118,741 | | | | 100,000 | | | | 154,872 | | | | 100,000 | |
Shares sold | | | 1,218,364 | | | | 100,810 | | | | 128,860 | | | | 136,198 | |
Shares issued in reinvestment of dividends | | | 5,773 | | | | 1,819 | | | | 9,357 | | | | 2,822 | |
Less shares redeemed | | | (81,015 | ) | | | (83,888 | ) | | | (14,981 | ) | | | (84,148 | ) |
| | | | | | | | | | | | | | | | |
Ending shares | | | 1,261,863 | | | | 118,741 | | | | 278,108 | | | | 154,872 | |
| | | | | | | | | | | | | | | | |
See Notes to Financial Statements.
| | |
| 14 | | 1-855-612-3936 | www.cortinafunds.com |
| | |
| | Financial Highlights |
| Cortina Small Cap Growth Fund | | For a share outstanding throughout the periods presented. |
| | | | | | | | |
| | | Year Ended
June 30, 2013 | | | For the Period
September 30, 2011
(Inception) to
June 30, 2012 | |
NET ASSET VALUE, BEGINNING OF PERIOD | | $ | 11.87 | | | $ | 10.00 | |
INCOME/(LOSS) FROM INVESTMENT OPERATIONS: | | | | | | | | |
Net investment loss(a) | | | (0.13 | ) | | | (0.09 | ) |
Net realized and unrealized gain on investments | | | 2.81 | | | | 2.22 | |
| | | | | | | | |
Total from Investment Operations | | | 2.68 | | | | 2.13 | |
| | | | | | | | |
DIVIDENDS AND DISTRIBUTIONS TO SHAREHOLDERS: | | | | | | | | |
From net realized gains on investments | | | (0.09 | ) | | | (0.26 | ) |
| | | | | | | | |
Total Dividends and Distributions to Shareholders | | | (0.09 | ) | | | (0.26 | ) |
| | | | | | | | |
Paid-in Capital from Redemption Fees | | | — | | | | 0.00 | (b) |
| | | | | | | | |
NET INCREASE IN NET ASSET VALUE | | | 2.59 | | | | 1.87 | |
| | | | | | | | |
NET ASSET VALUE, END OF PERIOD | | $ | 14.46 | | | $ | 11.87 | |
| | | | | | | | |
TOTAL RETURN | | | 22.79 | % | | | 21.40 | %(c) |
| | |
RATIOS AND SUPPLEMENTAL DATA: | | | | | | | | |
Net assets, end of period (in 000s) | | $ | 18,245 | | | $ | 1,410 | |
| | |
RATIOS TO AVERAGE NET ASSETS: | | | | | | | | |
Operating expenses excluding waiver/reimbursement | | | 3.85 | % | | | 21.70 | %(d) |
Operating expenses including waiver/reimbursement | | | 1.10 | % | | | 1.10 | %(d) |
Net investment loss including waiver/reimbursement | | | (1.00 | )% | | | (0.99 | )%(d) |
| | |
PORTFOLIO TURNOVER RATE | | | 73 | % | | | 144 | % |
| (a) | Calculated using average shares throughout the period. |
| (b) | Less than $0.005 per share. |
See Notes to Financial Statements.
| | |
| Annual Report | June 30, 2013 | | 15 |
| | |
| | Financial Highlights |
| Cortina Small Cap Value Fund | | For a share outstanding throughout the periods presented. |
| | | | | | | | |
| | | Year Ended
June 30, 2013 | | | For the Period
September 30, 2011
(Inception) to
June 30, 2012 | |
NET ASSET VALUE, BEGINNING OF PERIOD | | $ | 12.54 | | | $ | 10.00 | |
INCOME/(LOSS) FROM INVESTMENT OPERATIONS: | | | | | | | | |
Net investment income/(loss)(a) | | | 0.01 | | | | (0.03 | ) |
Net realized and unrealized gain on investments | | | 3.68 | | | | 3.14 | |
| | | | | | | | |
Total from Investment Operations | | | 3.69 | | | | 3.11 | |
| | | | | | | | |
DIVIDENDS AND DISTRIBUTIONS TO SHAREHOLDERS: | | | | | | | | |
From net investment income | | | (0.07 | ) | | | — | |
From net realized gains on investments | | | (0.54 | ) | | | (0.57 | ) |
| | | | | | | | |
Total Dividends and Distributions to Shareholders | | | (0.61 | ) | | | (0.57 | ) |
| | | | | | | | |
Paid-in Capital from Redemption Fees | | | — | | | | 0.00 | (b) |
| | | | | | | | |
NET INCREASE IN NET ASSET VALUE | | | 3.08 | | | | 2.54 | |
| | | | | | | | |
NET ASSET VALUE, END OF PERIOD | | $ | 15.62 | | | $ | 12.54 | |
| | | | | | | | |
TOTAL RETURN | | | 30.41 | % | | | 31.99 | %(c) |
| | |
RATIOS AND SUPPLEMENTAL DATA: | | | | | | | | |
Net assets, end of period (in 000s) | | $ | 4,344 | | | $ | 1,942 | |
| | |
RATIOS TO AVERAGE NET ASSETS: | | | | | | | | |
Operating expenses excluding waiver/reimbursement | | | 5.55 | % | | | 22.37 | %(d) |
Operating expenses including waiver/reimbursement | | | 1.10 | % | | | 1.10 | %(d) |
Net investment income/(loss) including waiver/reimbursement | | | 0.10 | % | | | (0.32 | )%(d) |
| | |
PORTFOLIO TURNOVER RATE | | | 81 | % | | | 146 | % |
| (a) | Calculated using average shares throughout the period. |
| (b) | Less than $0.005 per share. |
See Notes to Financial Statements.
| | |
| 16 | | 1-855-612-3936 | www.cortinafunds.com |
| | |
| | Notes to Financial Statements |
| | | June 30, 2013 |
1. ORGANIZATION
Cortina Funds, Inc. (the “Corporation”) is an open-end management investment company registered under the Investment Company Act of 1940, as amended (the “1940 Act”). The Corporation was organized on June 30, 2004 as a Wisconsin corporation. The Corporation currently offers shares of common stock (“shares”) of the Cortina Small Cap Growth Fund and the Cortina Small Cap Value Fund (each a “Fund” and collectively, the “Funds”). The Cortina Small Cap Growth Fund is a diversified portfolio with an investment objective to seek growth of capital, and the Cortina Small Cap Value Fund is a diversified portfolio with an investment objective to seek long-term capital appreciation. Shares of each Fund are designated as Institutional Shares with an indefinite number of shares authorized at $0.01 par value. The Articles of Incorporation, as amended and restated, permit the Board of Directors (the “Board”) to create additional funds and share classes. The Institutional Class is currently the only class offered.
2. SIGNIFICANT ACCOUNTING POLICIES
The following is a summary of significant accounting policies followed by the Funds. These policies are in conformity with U.S. generally accepted accounting principles (“GAAP”).
Use of Estimates — The accompanying financial statements were prepared in accordance with GAAP, which require the use of estimates and assumptions made by management. These may affect the reported amounts of assets and liabilities and disclosure of contingent asset and liabilities at the date of the financial statements and the reported amounts of increases and decreases in net assets from operations during the reporting period. Actual results could differ from those estimates.
Investment Valuation — Investment securities are valued at the last sale price at the close of the principal exchange on which they trade, except for securities listed on the National Association of Securities Dealers Automated Quotations (“NASDAQ”) exchange, which are valued at the NASDAQ official closing price. Unlisted securities or listed securities for which there were no sales during the day are valued at the closing bid price on such exchanges or over-the-counter markets. Investments for which market quotations are not readily available are valued at fair value as determined in good faith under consistently applied procedures approved by and under the general supervision of the Funds’ Board.
Investment Transactions — Investment security transactions are accounted for on trade date. Gains and losses on securities sold are determined on a specific identification basis.
Investment Income — Interest income is accrued and recorded on a daily basis including amortization of premiums, accretions of discounts and income earned from money market funds. Interest is not accrued on securities that are in default. Dividend income is recorded on the ex-dividend date.
Fair Value Measurements — A three-tier hierarchy has been established to classify fair value measurements for disclosure purposes. Inputs refer broadly to the assumptions that market participants would use in pricing the asset or liability, including assumptions about risk. Inputs may be observable or unobservable. Observable inputs are inputs that reflect the assumptions market participants would use in pricing the asset or liability that are developed based on market data obtained from sources independent of the reporting entity. Unobservable inputs are inputs that reflect the reporting entity’s own assumptions about the assumptions market participants would use in pricing the asset or liability that are developed based on the best information available. In accordance with the authoritative guidance on fair value measurements and disclosure under GAAP, the Funds disclose fair value of their investments in a hierarchy that prioritizes the inputs to valuation techniques used to measure the fair value.
Various inputs are used in determining the value of each Fund’s investments as of the reporting period end. The designated input levels are not necessarily an indication of the risk or liquidity associated with these investments. These inputs are categorized in the following hierarchy under applicable financial accounting standards:
| | | | |
| Level 1 | | — | | Unadjusted quoted prices in active markets for identical, unrestricted assets or liabilities that the Funds have the ability to access at the measurement date; |
| | |
| Level 2 | | — | | Quoted prices which are not active, quoted prices for similar assets or liabilities in active markets or inputs other than quoted prices that are observable (either directly or indirectly) for substantially the full term of the asset or liability; and |
| | |
| Level 3 | | — | | Significant unobservable prices or inputs (including the Fund’s own assumptions in determining the fair value of investments) where there is little or no market activity for the asset or liability at the measurement date. |
The availability of observable inputs can vary from security to security and is affected by a wide variety of factors, including, for example, the type of security, whether the security is new and not yet established in the marketplace, the liquidity of markets, and other characteristics particular to the security. To the extent that valuation is based on models or inputs that are less observable or unobservable in the market, the determination of
| | |
| Annual Report | June 30, 2013 | | 17 |
| | |
| | Notes to Financial Statements |
| | | June 30, 2013 |
fair value requires more judgment. Accordingly, the degree of judgment exercised in determining fair value is greatest for instruments categorized in Level 3.
An investment level within the fair value hierarchy is based on the lowest level input, individually or in the aggregate, that is significant to fair value measurement. The valuation techniques used by the Funds to measure fair value during the year ended June 30, 2013 maximized the use of observable inputs and minimized the use of unobservable inputs.
The inputs or methodology used for valuing securities are not necessarily an indication of the risk or liquidity associated with investing in those securities. The following is a summary of the inputs used in valuing the Funds’ investments as of June 30, 2013:
| | | | | | | | | | | | | | | | |
Cortina Small Cap Growth Fund | | | | | | | | | | | | | | | | |
| | |
| | | Valuation Inputs | | | | |
Investments in Securities at Value* | | Level 1 | | | Level 2 | | | Level 3 | | | Total | |
Common Stocks | | $ | 17,569,009 | | | $ | — | | | $ | — | | | $ | 17,569,009 | |
Short Term Investment | | | 511,399 | | | | — | | | | — | | | | 511,399 | |
| | | | | | | | | | | | | | | | |
Total | | $ | 18,080,408 | | | $ | — | | | $ | — | | | $ | 18,080,408 | |
| | | | | | | | | | | | | | | | |
Cortina Small Cap Value Fund | | | | | | | | | | | | | | | | |
| | |
| | | Valuation Inputs | | | | |
Investments in Securities at Value* | | Level 1 | | | Level 2 | | | Level 3 | | | Total | |
Common Stocks | | $ | 4,139,471 | | | $ | — | | | $ | — | | | $ | 4,139,471 | |
Short Term Investment | | | 220,089 | | | | — | | | | — | | | | 220,089 | |
| | | | | | | | | | | | | | | | |
Total | | $ | 4,359,560 | | | $ | — | | | $ | — | | | $ | 4,359,560 | |
| | | | | | | | | | | | | | | | |
| * | See Schedule of Investments for sector classification. |
For the year ended June 30, 2013, there have been no significant changes to the Funds’ fair value methodologies. Additionally, there were no transfers into or out of Levels 1 and 2 during the year ended June 30, 2013. It is the Funds’ policy to recognize transfers at the end of the reporting period.
For year ended June 30, 2013, the Funds did not have investments with significant unobservable inputs (Level 3) used in determining fair value.
Affiliated Companies — An affiliated company is a company that can have direct or indirect common ownership. The Funds do not hold any investments in affiliated companies as of June 30, 2013.
Offering Costs — Offering costs, including costs of printing initial prospectuses, legal and registration fees, were amortized over twelve months from the inception date of the Funds. The offering costs are fully amortized as of June 30, 2013.
Expenses — The Funds bear expenses incurred specifically on each Fund’s respective behalf as well as a portion of general Corporation expenses, which may be allocated on the basis of relative net assets or the nature of the services performed relative to applicability to each Fund.
Distributions to Shareholders — Dividends from net investment income and distributions of net realized capital gains, if any, will be declared and paid at least annually. Income and capital gains distributions are determined in accordance with income tax regulations, which may differ from GAAP. Distributions to shareholders are recorded on the ex-dividend date.
Fees on Redemptions — The Funds will deduct a 2.00% redemption proceeds fee on Fund shares held 60 days or less. The redemption fee is not a fee to finance sales or sales promotion expenses, but is paid to the Funds to defray the costs of liquidating an investor and discouraging short-term trading of the Funds’ shares. No redemption fee will be imposed on redemptions initiated by the Funds.
Federal Income Taxes — As of and during the year ended June 30, 2013, the Funds did not have a liability for any unrecognized tax benefits. The Funds file U.S. federal, state, and local tax returns as required. The Funds’ tax returns are subject to examination by the relevant tax authorities until expiration of the applicable statute of limitations which is generally three years after the filing of the tax return for federal purposes and four years for most state returns. Tax returns for open years have incorporated no uncertain tax positions that require a provision for income taxes. The Funds intend to distribute to shareholders all taxable investment income and realized gains, and otherwise comply with Subchapter M of the Internal Revenue Code of 1986, as amended, applicable to regulated investment companies.
| | |
| 18 | | 1-855-612-3936 | www.cortinafunds.com |
| | |
| | Notes to Financial Statements |
| | | June 30, 2013 |
3. ADVISORY FEES, FUND ACCOUNTING, ADMINISTRATION FEES, AND OTHER AGREEMENTS
Investment Advisory
The Adviser is subject to the general supervision of the Board and is responsible for the overall management of the Funds’ business affairs. The Adviser invests the assets of the Funds based on the Funds’ investment objectives and policies. The Adviser is entitled to an investment advisory fee, computed daily and payable monthly, of 1.00% of the average daily net assets for each Fund.
The Adviser has contractually agreed to waive fees with respect to each of the Funds so that the net annual operating expenses (excluding taxes, leverage, interest, brokerage commissions, dividends or interest expenses on short positions, acquired fund fees and expenses, and extraordinary expenses) of the Funds’ institutional shares will not exceed 1.10% of average daily net assets of each Fund. The Adviser may request a reimbursement from the Funds to recapture any reduced management fees or reimbursed Fund expenses within three years following the fee reduction or expense reimbursement, but only to the extent the Funds’ total annual fund operating expenses including offering costs, plus any requested reimbursement amount, including previously waived organizational costs, are less than the above limit at the time of the request. Any such reimbursement is subject to review by the Board.
As of June 30, 2013, reimbursements (including offering costs and the previously waived organizational costs) that may potentially be made by the Fund to the Adviser total $441,775 for the Cortina Small Cap Growth Fund and $303,359 for the Cortina Small Cap Value Fund expire as follows:
| | | | |
Cortina Small Cap Growth Fund | | | |
September 19, 2014 | | $ | 10,250 | |
June 30, 2015 | | | 163,407 | |
June 30, 2016 | | | 268,118 | |
| | | | |
| | $ | 441,775 | |
| |
Cortina Small Cap Value Fund | | | |
September 19, 2014 | | $ | 10,250 | |
June 30, 2015 | | | 152,715 | |
June 30, 2016 | | | 140,394 | |
| | | | |
| | $ | 303,359 | |
Fund Accounting Fees and Expenses
ALPS Fund Services, Inc. (“ALPS” or the “Administrator”) provides administrative, fund accounting and other services to the Funds for a monthly administration fee based on the Funds’ average daily net assets at the following annual rates.
Year 1
Greater of $175,000 annual minimum in Year 1 or the following basis point fee schedule:
| | | | |
Average Daily Net Assets | | Basis Point
Fee Rate | |
Between $0-$500M | | | 5.0 | |
$500M-$1B | | | 3.0 | |
Above $1B | | | 2.0 | |
Year 2
Greater of $190,000 annual minimum in Year 2 or the above basis point fee schedule.
The Administrator is also reimbursed by the Funds for certain out-of-pocket expenses.
Transfer Agent
ALPS serves as transfer, dividend paying and shareholder servicing agent for the Funds (the “Transfer Agent”).
Compliance Services
ALPS provides services that assist the Corporation’s Chief Compliance Officer in monitoring and testing the policies and procedures of the Corporation in conjunction with requirements under Rule 38a-1 under the 1940 Act. ALPS is compensated under the Administration Agreement.
| | |
| Annual Report | June 30, 2013 | | 19 |
| | |
| | Notes to Financial Statements |
| | | June 30, 2013 |
Distributor
The Funds have entered into a Distribution Agreement with ALPS Distributors, Inc (“the Distributor”) to provide distribution services to the Funds. The Distributor serves as underwriter/distributor of shares of the Funds.
Certain Directors and Officers of the Funds are also officers of the Adviser.
4. PURCHASES AND SALES OF INVESTMENT SECURITIES
The aggregate cost of purchases and proceeds from sales of investment securities, excluding short-term securities, are shown below for the year ended June 30, 2013. Purchases and proceeds from sales of U.S. Government obligations are included in the totals of Purchases of Securities and Proceeds from Sales of Securities below and also broken out separately for your convenience:
| | | | | | | | |
Fund Name | | Purchases | | | Sales | |
Cortina Small Cap Growth Fund | | $ | 20,527,465 | | | $ | 7,024,778 | |
Cortina Small Cap Value Fund | | | 3,847,208 | | | | 2,449,651 | |
There were no purchases of long-term U.S. Government Obligations for either Fund during the year ended June 30, 2013.
5. TAX BASIS INFORMATION
For the year ended June 30, 2013 the following reclassifications, which had no impact on results of operations or net assets, were recorded to reflect tax character:
| | | | | | | | | | | | |
Fund | | Paid-in Capital | | | Accumulated Net
Investment Income | | | Accumulated Net Realized
(Loss) on Investments | |
Cortina Small Cap Growth Fund | | $ | (1,178 | ) | | $ | 26,009 | | | $ | (24,831 | ) |
Cortina Small Cap Value Fund | | | (926 | ) | | | 926 | | | | — | |
Income and long-term capital gain distributions are determined in accordance with Federal income tax regulations, which differ from GAAP, and, therefore, may differ significantly in amount or character from net investment income and realized gains for financial reporting purposes.
The tax character of distributions paid during the year ended June 30, 2013, were as follows:
| | | | | | | | |
Fund | | Ordinary Income | | | Long-Term Capital Gain | |
Cortina Small Cap Growth Fund | | $ | 68,752 | | | $ | — | |
Cortina Small Cap Value Fund | | | 124,309 | | | | 4,202 | |
The tax character of distributions paid during the period ended June 30, 2012, were as follows:
| | | | |
Fund | | Ordinary Income | |
Cortina Small Cap Growth Fund | | $ | 20,406 | |
Cortina Small Cap Value Fund | | | 30,530 | |
As of June 30, 2013, the aggregate cost of investments, gross unrealized appreciation/(depreciation) and net unrealized appreciation/(depreciation) for Federal tax purposes was as follows:
| | | | | | | | | | | | | | | | |
Fund | | Cost of Investments
for Income Tax
Purposes | | | Gross Appreciation
(excess of value
over tax cost) | | | Gross Depreciation
(excess of tax cost
over value) | | | Net Unrealized
Appreciation | |
Cortina Small Cap Growth Fund | | $ | 15,293,124 | | | $ | 3,308,424 | | | $ | (521,140 | ) | | $ | 2,787,284 | |
Cortina Small Cap Value Fund | | | 3,594,035 | | | | 812,547 | | | | (47,022 | ) | | | 765,525 | |
The difference between book basis and tax basis net unrealized appreciation is attributable to the deferral of losses from wash sales and passive foreign investment companies.
| | |
| 20 | | 1-855-612-3936 | www.cortinafunds.com |
| | |
| | Notes to Financial Statements |
| | | June 30, 2013 |
At June 30, 2013, components of distributable earnings were as follows:
| | | | | | | | | | | | | | | | | | | | |
Fund | | Undistributed
Ordinary Income | | | Accumulated
Capital
Gains/(Losses) | | | Unrealized
Appreciation | | | Other Cumulative
Effect of Timing
Differences | | | Total Distributable
Earnings | |
Cortina Small Cap Growth Fund | | $ | — | | | $ | (17,552 | ) | | $ | 2,787,284 | | | $ | (71,261 | ) | | $ | 2,698,471 | |
Cortina Small Cap Value Fund | | | 132,141 | | | | 93,035 | | | | 765,525 | | | | — | | | | 990,701 | |
The Cortina Small Cap Growth Fund elects to defer to the year ending June 30, 2014, capital losses recognized during the period November 1, 2012 through June 30, 2013 in the amount of $35,871. The Cortina Small Cap Growth Fund elects to defer to the year ending June 30, 2014, late year ordinary losses in the amount of $71,261.
6. COMMITMENTS AND CONTINGENCIES
Under the Corporation’s organizational documents, its Officers and Directors are indemnified against certain liabilities arising out of the performance of their duties to the Funds. In addition, in the normal course of business, the Corporation entered into contracts with its service providers, on behalf of the Funds, and others that provide for general indemnifications. The Funds’ maximum exposure under these arrangements is unknown, as this would involve future claims that may be made against the Funds. The Funds expect risk of loss to be remote.
| | |
| Annual Report | June 30, 2013 | | 21 |
| | |
| | Report of Independent Registered Public Accounting Firm |
| | | |
To the Shareholders and Board of Directors
Cortina Funds, Inc.
We have audited the accompanying statements of assets and liabilities, including the schedules of investments, of Cortina Funds, Inc. comprising Cortina Small Cap Growth Fund and Cortina Small Cap Value Fund (the “Funds”) as of June 30, 2013, and the related statements of operations for the year then ended, and the statements of changes in net assets and the financial highlights for each of the two periods in the period then ended. These financial statements and financial highlights are the responsibility of the Funds’ management. Our responsibility is to express an opinion on these financial statements and financial highlights based on our audits.
We conducted our audits in accordance with the standards of the Public Company Accounting Oversight Board (United States). Those standards require that we plan and perform the audit to obtain reasonable assurance about whether the financial statements and financial highlights are free of material misstatement. An audit includes examining, on a test basis, evidence supporting the amounts and disclosures in the financial statements. Our procedures included confirmation of securities owned as of June 30, 2013, by correspondence with the custodian and brokers, or by other appropriate auditing procedures where replies from brokers were not received. An audit also includes assessing the accounting principles used and significant estimates made by management, as well as evaluating the overall financial statement presentation. We believe that our audits provide a reasonable basis for our opinion.
In our opinion, the financial statements and financial highlights referred to above present fairly, in all material respects, the financial position of each of the Funds constituting Cortina Funds, Inc. as of June 30, 2013, the results of their operations for the year then ended, and the changes in their net assets and the financial highlights for each of the two periods in the period then ended, in conformity with accounting principles generally accepted in the United States of America.
COHEN FUND AUDIT SERVICES, LTD.
Cleveland, Ohio
August 22, 2013
| | |
| 22 | | 1-855-612-3936 | www.cortinafunds.com |
| | |
| | Additional Information |
| | | June 30, 2013 (Unaudited) |
1. PROXY VOTING POLICIES AND VOTING RECORD
A description of the policies and procedures that the Funds use to vote proxies relating to portfolio securities is available without charge upon request by calling toll-free 1-855-612-3936, or on the Securities and Exchange Commission’s (“SEC”) website at http://www.sec.gov. Information regarding how the Funds voted proxies relating to portfolio securities during the most recent fiscal year ending June 30, 2012 is available without charge upon request by calling toll-free 1-855-612-3936, or on the SEC’s website at http://www.sec.gov.
2. QUARTERLY PORTFOLIO HOLDINGS
The Corporation files a complete listing of portfolio holdings for the Funds with the SEC as of the first and third quarters of each fiscal year on Form N-Q. The filings are available upon request by calling 1-855-612-3936. Furthermore, you may obtain a copy of the filing on the SEC’s website at http://www.sec.gov. The Funds’ Forms N-Q may also be reviewed and copied at the SEC’s Public Reference Room in Washington, D.C., and information on the operation of the Public Reference Room may be obtained by calling 1-800-SEC-0330.
3. TAX INFORMATION
Pursuant to Section 852(b)(3) of the Internal Revenue Code, Cortina Small Cap Value Fund designates $4,202 as a long-term capital gain distribution.
Certain tax information is required to be provided to shareholders based upon each Fund’s income and distributions for the year ended June 30, 2013. The Funds designate the following as percentages of taxable ordinary income distributions, up to maximum amount allowable, for the calendar year ended December 31, 2012:
| | | | | | | | |
Fund | | Dividends Received
Deduction Percentage | | | Qualified Dividend
Income Percentage | |
Cortina Small Cap Growth Fund | | | 10.04 | % | | | 9.57 | % |
Cortina Small Cap Value Fund | | | 15.96 | % | | | 20.03 | % |
In early 2013, if applicable, shareholders of record received this information for the distributions paid to them by the Funds during the calendar year 2012 via Form 1099. The Funds will notify shareholders in early 2014 of amounts paid to them by the Funds, if any, during the calendar year 2013.
4. DIRECTORS’ CONSIDERATION AND APPROVAL OF ADVISORY AGREEMENT
On May 13, 2013 (the “Meeting”), the Directors met in person to consider, among other things, the annual renewal of the Investment Advisory Agreement (the “Advisory Agreement”) between the Corporation and the Adviser with respect to the Cortina Small Cap Growth Fund and Cortina Small Cap Value Fund (the “Funds”) in accordance with Section 15(c) of the Investment Company Act of 1940, as amended (the “1940 Act”). The Board reviewed and discussed various information that had been provided prior to the Meeting and at the Meeting, including the Advisory Agreement, memoranda prepared by Trust counsel discussing the Board’s fiduciary obligations and the factors the Board should assess in considering the renewal of the Advisory Agreement, information in response to the request from the Board, including the Independent Directors, from the Adviser (including the Adviser’s Form ADV and balance sheet), a profitability analysis with respect to the Funds, comparative information about the Funds’ performance for periods ended December 31, 2012 and March 31, 2013, management fees and expense ratios, and other pertinent information. The Board also discussed relevant case law.
The Board also took into account information reviewed periodically throughout the year that was relevant to its consideration of the Advisory Agreement, including performance, management fee and other expense information and discussions with the Funds’ portfolio managers. Based on its evaluation of this information, the Board, including a majority of the Independent Directors, approved the continuation of the Investment Advisory Agreement for an additional one-year period.
In considering the Advisory Agreement and reaching its conclusions, the Board reviewed and analyzed various factors that it determined were relevant, including the factors below. In deciding to approve the Advisory Agreement for each Fund, the Board did not identify any single factor as determinative but considered all factors together.
Nature, Extent and Quality of the Services Provided to the Funds: The Board analyzed the nature, extent and quality of the services provided by the Adviser to the Funds. The Board reviewed and considered the Adviser’s significant role in establishing the Funds and the construction of their investment objectives, principal strategies, investment limitations and fee structures. The Board noted the Adviser’s commitment to the Funds, and the experience, credentials and continuity of the portfolio management teams employed to manage the Funds’ investments. The Board further noted that the Adviser has over $2 billion of assets under discretionary management and that the Funds provide an opportunity for smaller institutional and retail accounts to receive the same professional advice from the Adviser that it offers to its larger institutional clients. The Board also noted that the provision of investment advisory services to the Funds requires more effort than it does for separately managed accounts due to daily sales and redemption activity and additional regulatory and compliance requirements.
| | |
| Annual Report | June 30, 2013 | | 23 |
| | |
| | Additional Information |
| | | June 30, 2013 (Unaudited) |
The Board considered other services that the Adviser provided for the Funds in its capacity as their investment advisor, such as making some of its key personnel available to serve as officers of the Funds, selecting broker-dealers for execution of portfolio transactions, ensuring adherence to the Funds’ investment policies and restrictions, compliance, risk management services, valuation and overseeing the Funds’ other service providers. The Board also considered that the Adviser has not experienced any significant legal, compliance or regulatory difficulties since the Funds were launched. The Board concluded that the nature, extent and quality of the services provided by the Adviser to the Funds were appropriate and that each Fund was likely to continue to benefit from services provided under the Advisory Agreement.
Investment Performance of the Adviser and the Funds: In considering the investment performance of each of the Funds, the Board reviewed the Funds’ performance information as of December 31, 2012 and March 31, 2013 in comparison to various benchmark indices and certain peer funds selected by the Adviser. The Board noted that for the one-year and since inception periods ended December 31, 2012 and March 31, 2013, the Small Cap Growth Fund had lagged the Russell 2000 Growth Index. However, the Board noted that the Adviser’s Small Cap Growth Composite had outperformed the Russell 2000 Growth Index for the three, five, seven and since inception periods ended March 31, 2013. The Board considered the effect of the challenging market environment and the Adviser’s quarterly commentary and discussion of the reasons for the Fund’s underperformance. With respect to the Small Cap Value Fund, the Board noted that for the one-year and since inception periods ended December 31, 2012 and March 31, 2013, the Fund had significantly outperformed the Russell 2000 Value Index.
The Board also considered the Adviser’s quarterly portfolio reviews explaining the Funds’ performance, the Adviser’s consistent and disciplined investment decision process and the investment strategies it employs for the Funds. After considering all of the information, the Board concluded that, although past performance is not a guarantee of future results, each Fund and its shareholders were likely to benefit from the continued management by the Adviser.
Costs of Services Provided and Profits Realized by the Adviser: The Board examined the fee and expense information for the Funds, including a comparison of such information to other similarly situated mutual funds as provided by the Adviser from eVestment. The Board noted that each Fund’s advisory fee was comparable to the average and median for all mutual funds in its peer group. The Board also reviewed and considered management fees charged by the Adviser to other investment advisory clients and found that the investment management fee paid by the Funds was identical to what the Adviser charges on the first $25 million of a separately managed account. The Board recognized the extent of the significant additional services provided to each Fund that the Adviser did not provide to its other clients, such as certain administrative services, oversight of the Fund’s other service providers, regulatory compliance and various other services.
The Board also examined the total expense ratio of each Fund relative to all other mutual funds in its respective eVestment category. The Board noted that each Fund’s total expense ratio after fee waivers and expense reimbursements by the Adviser of 1.10% pursuant to the Adviser’s expense cap agreement was in line with the median in each Fund’s category; below the average with respect to the Small Cap Growth Fund and in line with the average for the Small Cap Value Fund. The Board further noted that if each Fund had included acquired fund fees and expenses in the analysis, each Fund’s total expense ratio was still in line with both the average and the median for Funds in the respective category.
The Board noted that given the size of the Funds, the Adviser continued to waive all fees and reimburse significant expenses for the Funds. Accordingly, the Funds were not currently profitable to the Adviser. The Board reviewed and considered the general financial condition of the Adviser and determined it to be sound. The Board also reviewed information regarding revenue sharing payments, noting that any payments by the Adviser to third-party platforms were made from the Adviser’s profits associated with its overall advisory business. In light of all of the information that it received and considered, the Board concluded that the management fee and total expense ratio of each Fund were reasonable.
Economies of Scale and Fee Levels Reflecting Those Economies: The Board noted that the Funds’ advisory fee structure does not contain any breakpoint reductions as the Funds grow in size. However, the Board recognized that the Adviser has been waiving fees and reimbursing expenses for the Funds since their inception. The Board also recognized that the advisory fee rates paid by the Funds were identical to those charged by the Adviser to its separately managed account clients on the first $25 million and comparable to the advisory fee levels paid by other peer mutual funds. The Board also considered the Adviser’s verbal representation that it would consider evaluating advisory fee breakpoints in the future.
The Directors concluded that the current fee structure of each Fund was reasonable and that breakpoint reductions may be considered in the future depending on Fund asset levels.
Benefits Derived From the Relationship with the Funds: The Board noted that the Adviser derives ancillary benefits from its association with the Funds, in the form of research products and services received from unaffiliated broker dealers who execute portfolio trades for the Funds. However, the Board determined such products and services have been used for legitimate purposes relating to the Funds by providing assistance in the investment decision-making process. The Board concluded that the other benefits realized by the Adviser from its relationship with the Funds were appropriate. Based on its evaluation of the above factors, as well as other factors relevant to their consideration of the Advisory Agreement, the Directors, including all of the Independent Directors, concluded that the continuation of the Advisory Agreement was in the best interest of each Fund and its shareholders.
| | |
| 24 | | 1-855-612-3936 | www.cortinafunds.com |
| | |
| | Board of Directors and Officers |
| | | June 30, 2013 (Unaudited) |
Overall responsibility for management of the Funds rests with the Board of Directors (the “Directors”). The Directors serve during the lifetime of the Corporation and until its termination, or until death, resignation, retirement or removal. The Directors, in turn, elect the officers of the Funds to actively supervise the day-to-day operations. The officers have been elected for an annual term. The following are the Directors and executive officers of the Funds:
Independent Directors
| | | | | | | | | | |
Name and Age | | Position(s) Held with the Funds | | Length of
Time Served | | Principal Occupation(s) During Past 5 Years | | Number of Funds in
Fund Complex
Overseen by Director | | Other
Directorships
Held by Director |
| Mark J. Giese, 42 | | Independent Director | | Since Inception | | President, Riverwood Business Consulting, LLC, a business and management firm (December 2009-present); Chief Financial Officer, Datatrac Corporation, a financial research firm (January 2009-December 2009); Vice President, Nicholas Company, Inc., an investment management firm (June 1994-January 2009); Vice President, Nicholas Fund, Inc., Nicholas II, Inc., Nicholas Limited Edition, Inc. and Nicholas Equity Income Fund, Inc., each a registered investment company (June 1994-January 2009); Senior Vice President, Nicholas Family of Funds, Inc., a registered investment company (June 1994-January 2009) | | 2 | | None |
| | | | | |
| John T. Murphy, 49 | | Independent Director | | Since Inception | | President and Founding Partner, Morris Midwest, LLC, a machine tool distributor (2006-present); President and Partner, Technical Equipment Sales Co., a machine tool distributor (2003-2006) | | 2 | | None |
| | | |
Interested Director | | | | | | |
| | | | | |
| Ryan T. Davies, 39* | | Chairman, President and Interested Director | | Since Inception | | Senior Equity Analyst, Cortina Asset Management, LLC (2004-present) | | 2 | | None |
| | | |
Officers | | | | | | |
| | | |
| Terese Nielsen, 49 | | Treasurer and Principal Accounting Officer | | Since February 2012 | | Director of Operations, Cortina Asset Management, LLC (July 2011-present); Assistant Vice President and Systems Project Leader, M&I Investment Management Corp. (April 2008-July 2011) Officer and Wealth Management Senior Business Analyst, M&I Investment Management Corp. (August 2004-April 2008) |
| | | |
| Lori K. Hoch, 42 | | Secretary and Chief Compliance Officer | | Since Inception | | Principal and Chief Operating Officer and Chief Compliance Officer, Cortina Asset Management, LLC (2004-present) |
| | | |
| Kathleen A. Daley, 39 | | Anti-Money Laundering Compliance Officer | | Since Inception | | Compliance Officer, Cortina Asset Management, LLC (2004-present) |
| * | Mr. Davies is considered an “interested director” of Cortina as defined under the 1940 Act by virtue of his position with the Adviser. |
| | The business address of the officers and directors affiliated with the Adviser is 825 North Jefferson Street, Suite 400, Milwaukee, Wisconsin 53202. The address for each Independent Director is c/o Cortina Funds, 825 North Jefferson Street, Suite 400, Milwaukee, Wisconsin 53202. |
Additional information about members of the Board of Directors and Officers is available in the Statement of Additional Information (SAI). To obtain a free copy of the SAI, please call 1-855-612-3936.
| | |
| Annual Report | June 30, 2013 | | 25 |

Material must be accompanied or preceded by the prospectus.
The Cortina Funds are distributed by ALPS Distributors, Inc.
| | (a) | The Registrant, as of the end of the period covered by this report, has adopted a code of ethics that applies to the Registrant’s principal executive officer, principal financial officer, principal accounting officer or controller or any persons performing similar functions on behalf of the Registrant. |
| | (c) | During the period covered by this report, no amendments to the provisions of the code of ethics adopted in paragraph (a) of this Item were made. |
| | (d) | During the period covered by this report, no implicit or explicit waivers to the provisions of the code of ethics adopted in paragraph (a) of this Item were granted. |
| | (f) | A copy of the Registrant’s Code of Ethics is filed as an exhibit hereto. The Registrant undertakes to provide a copy of the Code of Ethics to any person, without charge, upon written request to the Registrant at its address at 825 N. Jefferson St., Suite 400, Milwaukee, WI 53202. |
| Item 3. | Audit Committee Financial Expert. |
The Board of Directors of the Registrant has determined that the Registrant has at least one Audit Committee Financial Expert serving on its audit committee. The Registrant’s Audit Committee Financial Expert is Mr. John F. Murphy, Independent Trustee and Audit Committee Chair.
| Item 4. | Principal Accountant Fees and Services. |
| | (a) | Audit Fees: For the Registrant’s fiscal years ended June 30, 2012 and June 30, 2013, the aggregate fees billed for professional services rendered by the principal accountant for the audit of the Registrant’s annual financial statements or services that are normally provided by the accountant in connection with statutory or regulatory filings or engagements were $24,000 and $24,000, respectively. |
| | (b) | Audit-Related Fees: For the Registrant’s fiscal years ended June 30, 2012 and June 30, 2013, the aggregate fees billed for assurance and related services by the principal accountant that are reasonably related to the performance of the audit of |
| | the Registrant’s financial statements and are not reported under paragraph (a) of this Item were $0 and $0, respectively. |
| | (c) | Tax Fees: For the Registrant’s fiscal years ended June 30, 2012 and June 30, 2013, the aggregate fees billed for professional services rendered by the principal accountant for tax compliance, tax advice and tax planning were $5,000 and $5,000, respectively. The fiscal year 2012 and 2013 tax fees were for services for review of the dividend calculation, excise tax preparation and federal tax return preparation. |
| | (d) | All Other Fees: For the Registrant’s fiscal years ended June 30, 2012 and June 30, 2013, the aggregate fees billed for products and services provided by the principal accountant, other than the services reported in paragraphs (a) through (c) of this Item, were $2,500 and $0, respectively. The fiscal year 2012 fees related to the initial seed audit of the Registrant. |
| | (e)(1) | Audit Committee Pre-Approval Policies and Procedures: All services to be performed by the Registrant’s principal accountant must be pre-approved by the Registrant’s audit committee. |
| | (e)(2) | No services described in paragraphs (b) through (d) of this Item were approved by the Registrant’s audit committee pursuant to paragraph (c)(7)(i)(C) of Rule 2-01 of Regulation S-X. |
| | (g) | No non-audit fees were billed by the Registrant’s principal accountant for services rendered to the Registrant’s investment adviser. |
| Item 5. | Audit Committee of Listed Registrants. |
The Registrant has an Audit Committee consisting of its Independent Trustees Messrs. John F. Murphy and Mark Giese.
| | (a) | Schedule of Investments is included as part of the Reports to Stockholders filed under Item 1 of this Form N-CSR. |
| Item 7. | Disclosure of Proxy Voting Policies and Procedures for Closed-End Management Investment Companies. |
Not applicable to the Registrant.
| Item 8. | Portfolio Managers of Closed-End Management Investment Companies. |
Not applicable to the Registrant.
| Item 9. | Purchases of Equity Securities by Closed-End Management Investment Company and Affiliated Purchasers. |
Not applicable to the Registrant.
| Item 10. | Submission of Matters to a Vote of Security Holders. |
The Registrant has not adopted procedures by which shareholders may recommend nominees to the Registrant’s Board of Directors.
| Item 11. | Controls and Procedures. |
| | (a) | The Registrant’s principal executive officer and principal financial officer have concluded that the Registrant’s disclosure controls and procedures (as defined in Rule 30a-3(c) under the Investment Company Act of 1940, as amended) are effective based on their evaluation of these controls and procedures as of a date within 90 days of the filing date of this report. |
| | (b) | There was no change in the Registrant’s internal control over financial reporting (as defined in Rule 30a-3(d) under the Investment Company Act of 1940, as amended) during the second fiscal quarter covered by this report that has materially affected, or is reasonably likely to materially affect, the Registrant’s internal control over financial reporting. |
| | (a)(1) | The Registrant’s Code of Ethics for Principal Executive Officer, Principal Financial Officer and Principal Accounting Officer, which is the subject of the disclosure required by Item 2 of Form N-CSR, was filed as Exhibit 12.a.1 to the Registrant’s Certified Shareholder Report of Registered Management Investment Companies on Form N-CSR, File No. 811-21580, on September 6, 2012. |
| | (a)(2) | The certifications required by Rule 30a-2(a) of the Investment Company Act of 1940, as amended, and Section 302 of the Sarbanes-Oxley Act of 2002 are attached hereto as Exhibit 99.Cert. |
| | (b) | The certifications by the Registrant’s principal executive officer and principal financial officer, as required by Rule 30a-2(b) of the Investment Company Act of 1940, as amended, and Section 906 of the Sarbanes-Oxley Act of 2002 are attached hereto as Exhibit 99.906Cert. | |
SIGNATURES
Pursuant to the requirements of the Securities Exchange Act of 1934 and the Investment Company Act of 1940, the registrant has duly caused this report to be signed on its behalf by the undersigned, thereunto duly authorized.
| | |
| Cortina Funds, Inc. |
| |
| By: | | /s/ Ryan T. Davies |
| | Ryan T. Davies, President |
| | (Principal Executive Officer) |
| |
| Date: | | September 4, 2013 |
Pursuant to the requirements of the Securities Exchange Act of 1934 and the Investment Company Act of 1940, this report has been signed below by the following persons on behalf of the registrant and in the capacities and on the dates indicated.
| | |
| By: | | /s/ Terese Nielsen |
| | Terese Nielsen, Treasurer and Principal Accounting Officer (Principal Financial Officer) |
| |
| Date: | | September 4, 2013 |