UNITED STATES
SECURITIES AND EXCHANGE COMMISSION
Washington, D.C. 20549
FORM N-CSR
CERTIFIED SHAREHOLDER REPORT OF REGISTERED
MANAGEMENT INVESTMENT COMPANIES
Investment Company Act file number 811-21624
Allianz Variable Insurance Products Fund of Funds Trust
(Exact name of registrant as specified in charter)
5701 Golden Hills Drive, Minneapolis, MN 55416-1297
(Address of principal executive offices) (Zip code)
Citi Fund Services Ohio, Inc., 4400 Easton Commons, Suite 200, Columbus, OH 43219-8000
(Name and address of agent for service)
Registrant’s telephone number, including area code: 800-624-0197
Date of fiscal year end: December 31
Date of reporting period: December 31, 2017
| Item 1. | Reports to Stockholders. |
AZL® Balanced Index Strategy Fund
Annual Report
December 31, 2017

Management Discussion and Analysis
Page 1
Expense Examples and Portfolio Composition
Page 3
Schedule of Portfolio Investments
Page 4
Statement of Assets and Liabilities
Page 5
Page 5
Statements of Changes in Net Assets
Page 6
Page 7
Notes to the Financial Statements
Page 8
Report of Independent Registered Public Accounting Firm
Page 12
Other Federal Income Tax Information
Page 13
Page 14
Approval of Investment Advisory Agreement
Page 15
Information about the Board of Trustees and Officers
Page 17
This report is submitted for the general information of the shareholder of the Fund. The report is not authorized for distribution to prospective investors in the Fund unless preceded or accompanied by an effective prospectus, which contains details concerning the sales charges and other pertinent information.
AZL® Balanced Index Strategy Fund Review (Unaudited)
Allianz Investment Management LLC
serves as the Manager for the AZL®
Balanced Index Strategy Fund.
What factors affected the Fund’s performance during the year ended December 31, 2017?
For the year ended December 31, 2017, the AZL® Balanced Index Strategy Fund (the “Fund”) had a total return of 11.50%. That compared to a 21.83%, 3.54% and 12.42% total return for its benchmarks, the S&P 500 Index1, the Bloomberg Barclays U.S. Aggregate Bond Index1, and the Balanced Composite Index1, respectively.
The Fund is a fund of funds that pursues broad diversification across four equity sub-portfolios and one fixed-income sub-portfolio. The four equity sub-portfolios pursue passive strategies that aim to achieve, before fees, returns similar to the S&P 500 Index, the S&P 400 Index2, the S&P 600 Index3 and the MSCI EAFE Index4, which represents shares of large companies in developed foreign markets. The fixed-income sub-portfolio is an enhanced bond index strategy that seeks to achieve a return that exceeds that of the Bloomberg Barclays Capital U.S. Aggregate Bond Index. Generally, the Fund allocates 40% to 60% of its assets to the underlying equity index funds and between 40% and 60% to the underlying bond index fund.*
Global economic expansion led major stock indexes to new all-time highs during the 12-month period under review. The S&P 500 Index gained 21.83% during the period, supported by a positive economic environment marked by solid jobs growth, low unemployment, increased business investment, strong consumer confidence and a low-volatility environment. Mid- and small-cap stocks also performed well during the period: The S&P MidCap 400 Index generated a 16.24% return and the SmallCap 600 Index returned 13.23%. Growth stocks were also heavily favored during the year and significantly outperformed value stocks.
International developed markets, as measured by the MSCI EAFE Index, fared even better than U.S. equities, posting a 25.62% return for the year. Emerging markets equities, as measured by the MSCI Emerging Markets Equity Index5, posted a return of 37.75%. The strong return ended years of underperformance versus domestic and international developed markets.
The U.S. bond market was generally positive, as the market rewarded investors who took on interest rate and spread risk. The Bloomberg Barclays U.S. Aggregate Bond Index gained 3.54%. Bond investors generally tolerated risk in their quest for more attractive yields. Credit spreads on corporate bonds ended the year tighter than when the year began, with high-yield bond spreads tightening markedly. Meanwhile, the yield curve flattened sharply, as three rate hikes by the Federal Reserve sent short-term yields higher, while investor demand for attractive yield pushed long-term yields lower.
The Fund, which invests in both U.S. and international markets, underperformed its composite benchmark in 2017. The underperformance was primarily driven by the Fund’s strategic allocation to U.S. mid- and small-cap equities during a period when U.S. large-cap equities outperformed their smaller counterparts. The Fund’s overweight allocation to international equities, on the other hand, supported relative returns as they outperformed their U.S. counterparts.*
Within the Fund’s fixed income holdings, an overweight allocation to 30-year bonds added to relative results. That benefit, however, was more than offset by an underweight allocation to corporate bonds, which outperformed. As a result, the Fund modestly lagged its fixed income benchmark during the period.*
Past performance does not guarantee future results.
| * | The Fund’s portfolio composition is subject to change. There is no guarantee that any sectors mentioned will continue to perform well or that securities in such sectors will be held by the Fund in the future. The information contained in this commentary is for informational purposes only and should not be construed as a recommendation to purchase or sell securities in the sector mentioned. The Fund’s holdings and weightings are as of December 31, 2017. |
| 1 | For a complete description of the Fund’s performance benchmarks please refer to page 2 of this report. |
| 2 | The Standard & Poor’s MidCap 400 Index (“S&P 400”) is the most widely used index for mid-sized companies. The S&P 400 covers 7% of the U.S. equities market, and is part of a series of S&P U.S. indices that can be used as building blocks for portfolio composition. |
| 3 | The Standard & Poor’s SmallCap 600 Index (“S&P 600”) covers approximately 3% of the domestic equities market. Measuring the small-cap segment of the market that is typically renowned for poor trading liquidity and financial instability, the index is designed to be an efficient portfolio of companies that meet specific inclusion criteria to ensure that they are investable and financially viable. |
| 4 | The Morgan Stanley Capital International, Europe, Australasia and Far East (“MSCI EAFE”) Index is a free float-adjusted market capitalization-weighted index that is designed to measure the equity market performance of developed markets, excluding the U.S. & Canada. |
| 5 | The MSCI Emerging Markets Index (“MSCI EM”) is a free float-adjusted market capitalization index that is designed to measure equity performance of emerging markets. |
| Investors cannot invest directly in an index. |
1
AZL® Balanced Index Strategy Fund Review (Unaudited)
Fund Objective
The Fund’s investment objective is to seek long-term capital appreciation with preservation of capital as an important consideration. This objective may be changed by the Trustees of the Fund without shareholder approval. The Fund seeks to achieve its objective by investing in a combination of Index Strategy Underlying Funds that represent different classes in the Fund’s asset allocation.
Investment Concerns
The Fund invests in underlying funds, so its investment performance is directly related to the performance of those underlying funds. Before investing, investors should assess the risks associated with and types of investments made by each of the underlying funds in which the Fund invests.
International investing may involve risk of capital loss from unfavorable fluctuations in currency values, from differences in generally accepted accounting principles or from economic or political instability in other nations.
Small- to mid-capitalization companies typically have a higher risk of failure and historically have experienced a greater degree of volatility.
Bonds offer a relatively stable level of income, although bond prices will fluctuate, providing the potential for principal gain or loss.
The performance of the Fund is expected to be lower than that of the Indices because of Fund fees and expenses. Securities in which the Fund will invest may involve substantial risk and may be subject to sudden severe price declines.
For a complete description of these and other risks associated with investing in a mutual Fund, please refer to the Fund’s prospectus.
Growth of $10,000 Investment
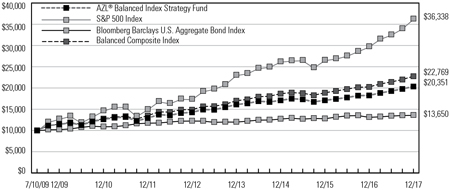
The chart above represents a comparison of a hypothetical investment in the Fund versus a similar investment in the Fund’s benchmark as well as the two component indices of the Fund’s benchmark, and represents the reinvestment of dividends and capital gains in the Fund.
Average Annual Total Returns as of December 31, 2017
| 1 Year | 3 Year | 5 Year | Since Inception (7/10/09) | |||||||||||||
AZL® Balanced Index Strategy Fund | 11.50 | % | 5.98 | % | 7.36 | % | 8.74 | % | ||||||||
S&P 500 Index | 21.83 | % | 11.41 | % | 15.79 | % | 16.44 | % | ||||||||
Bloomberg Barclays U.S. Aggregate Bond Index | 3.54 | % | 2.24 | % | 2.10 | % | 3.74 | % | ||||||||
Balanced Composite Index | 12.42 | % | 6.84 | % | 8.87 | % | 10.19 | % | ||||||||
Past performance does not guarantee future results. The performance data quoted represents past performance and current returns may be lower or higher. The investment return and principal value will fluctuate so that an investor’s shares, when redeemed may be worth more or less than the original cost. To obtain performance information current to the most recent month end, please visit www.Allianzlife.com.
Expense Ratio | Gross | |||
AZL® Balanced Index Strategy Fund | 0.70 | % | ||
The above expense ratio is based on the current Fund prospectus dated May 1, 2017. The Manager and the Fund have entered into a written contract limiting operating expenses, excluding certain expenses (such as interest expense and acquired fund fees and expenses), to 0.20% through April 30, 2019. Additional information pertaining to the December 31, 2017 expense ratios can be found in the financial highlights.
Acquired fund fees and expenses are incurred indirectly by the Fund through the valuation of the Fund’s investments in the Permitted Underlying Funds. Accordingly, acquired fund fees and expenses affect the Fund’s total returns. Because these fees and expenses are not included in the Fund’s financial highlights, the Fund’s total annual fund operating expenses, as shown in the current prospectus, do not correlate to the ratios of expenses to average net assets shown in the financial highlights table. Without acquired fund fees and expenses the Fund’s gross expense ratio would be 0.08%.
The total return of the Fund does not reflect the effect of any insurance charges, the annual maintenance fee or the deduction of taxes that a shareholder would pay on Fund distributions or the redemption of Fund shares. Such charges, fees and tax payments would reduce the performance quoted.
The Fund’s performance is measured against the Standard & Poor’s 500 Index (“S&P 500”), the Bloomberg Barclays U.S. Aggregate Bond Index and the Balanced Composite Index (“Composite”). The S&P 500 is representative of 500 selected common stocks, most of which are listed on the New York Stock Exchange, and is a measure of the U.S. Stock market as a whole. The Bloomberg Barclays U.S. Aggregate Bond Index is a market value-weighted performance benchmark for investment-grade fixed-rate debt issues, including government, corporate, asset-backed, and mortgage-backed securities, with maturities of at least one year. The Composite is a blended index comprised of (50%) S&P 500 and (50%) Bloomberg Barclays U.S. Aggregate Bond Index. These indexes are unmanaged and do not reflect the deduction of fees associated with a mutual fund, such as investment management and fund accounting fees. The Fund’s performance reflects the deduction of fees for services provided to the Fund. Investors cannot invest directly in an index.
2
AZL Balanced Index Strategy Fund
(Unaudited)
As a shareholder of the AZL Balanced Index Strategy Fund (the “Fund”), you incur ongoing costs, including management fees, distribution fees, and other Fund expenses. These examples are intended to help you understand your ongoing costs (in dollars) of investing in the Fund and to compare these costs with the ongoing costs of investing in other mutual funds. Please note that the expenses shown in each table do not reflect expenses that apply to the subaccount or the insurance contract. If the expenses that apply to the subaccount of the insurance contract were included, your costs would have been higher.
These examples are based on an investment of $1,000 invested at the beginning of the period and held for the periods presented below.
The Actual Expense table below provides information about actual account values and actual expenses. You may use the information below, together with the amount you invested, to estimate the expenses that you paid over the period. Simply divide your account value by $1,000 (for example, an $8,600 account value divided by $1,000 = 8.6), then multiply the result by the number in the table under the heading entitled “Expenses Paid During Period” to estimate the expenses you paid on your account during this period.
| Beginning Account Value 7/1/17 | Ending Account Value 12/31/17 | Expenses Paid During Period 7/1/17 - 12/31/17* | Annualized Expense Ratio During Period 7/1/17 - 12/31/17 | |||||||||||||||||
AZL Balanced Index Strategy Fund | $ | 1,000.00 | $ | 1,055.40 | $ | 0.36 | 0.07 | % | ||||||||||||
The Hypothetical Expense table below provides information about hypothetical account values and hypothetical expenses based on the Fund’s actual expense ratio and an assumed rate of return of 5% per year before expenses, which is not the Fund’s actual return. The hypothetical account values and expenses may not be used to estimate the actual ending account balance or expenses you paid for the period. You may use this information to compare this 5% hypothetical example with the 5% hypothetical examples that appear in the shareholder reports of other funds.
| Beginning Account Value 7/1/17 | Ending Account Value 12/31/17 | Expenses Paid During Period 7/1/17 - 12/31/17* | Annualized Expense Ratio During Period 7/1/17 - 12/31/17 | |||||||||||||||||
AZL Balanced Index Strategy Fund | $ | 1,000.00 | $ | 1,024.85 | $ | 0.36 | 0.07 | % | ||||||||||||
| * | Expenses are equal to the average account value over the period, multiplied by the Fund’s annualized expense ratio, multiplied by 184/365 (to reflect the one half year period). |
Portfolio Composition
(Unaudited)
| Investments | Percent of Net Assets | ||||
Fixed Income | 50.0 | ||||
Domestic Equities | 37.4 | ||||
International Equities | 12.6 | ||||
|
| ||||
Total Investment Securities | 100.0 | ||||
Net other assets (liabilities) | — | ^ | |||
|
| ||||
Net Assets | 100.0 | % | |||
|
| ||||
| ^ | Represents less than 0.05%. |
3
AZL Balanced Index Strategy Fund
Schedule of Portfolio Investments
December 31, 2017
| Shares | Fair Value | |||||||
| Affiliated Investment Companies (100.0%): | ||||||||
| 20,603,877 | AZL Enhanced Bond Index Fund | $ | 224,376,218 | |||||
| 3,257,089 | AZL International Index Fund, Class 2 | 56,347,640 | ||||||
| 1,435,238 | AZL Mid Cap Index Fund, Class 2 | 33,670,676 | ||||||
| 7,202,763 | AZL S&P 500 Index Fund, Class 2 | 116,180,562 | ||||||
| 1,209,750 | AZL Small Cap Stock Index Fund, Class 2 | 18,001,081 | ||||||
|
| |||||||
Total Affiliated Investment Companies (Cost $347,535,745) | 448,576,177 | |||||||
|
| |||||||
Total Investment Securities (Cost $347,535,745)(a) — 100.0% | 448,576,177 | |||||||
Net other assets (liabilities) — 0.0% | (194,687 | ) | ||||||
|
| |||||||
Net Assets — 100.0% | $ | 448,381,490 | ||||||
|
| |||||||
Percentages indicated are based on net assets as of December 31, 2017.
| (a) | See Federal Tax Information listed in the Notes to the Financial Statements. |
See accompanying notes to the financial statements.
4
AZL Balanced Index Strategy Fund
Statement of Assets and Liabilities
December 31, 2017
Assets: | |||||
Investments in affiliates, at cost | $ | 347,535,745 | |||
|
| ||||
Investments in affiliates, at value | $ | 448,576,177 | |||
Interest and dividends receivable | 76 | ||||
Receivable for affiliated investments sold | 37,505 | ||||
Prepaid expenses | 2,588 | ||||
|
| ||||
Total Assets | 448,616,346 | ||||
|
| ||||
Liabilities: | |||||
Cash overdraft | 37,505 | ||||
Payable for capital shares redeemed | 159,621 | ||||
Manager fees payable | 18,980 | ||||
Administration fees payable | 3,595 | ||||
Custodian fees payable | 338 | ||||
Administrative and compliance services fees payable | 1,036 | ||||
Transfer agent fees payable | 692 | ||||
Trustee fees payable | 667 | ||||
Other accrued liabilities | 12,422 | ||||
|
| ||||
Total Liabilities | 234,856 | ||||
|
| ||||
Net Assets | $ | 448,381,490 | |||
|
| ||||
Net Assets Consist of: | |||||
Capital | $ | 329,596,530 | |||
Accumulated net investment income/(loss) | 3,957,705 | ||||
Accumulated net realized gains/(losses) from investment transactions | 13,786,823 | ||||
Net unrealized appreciation/(depreciation) on investments | 101,040,432 | ||||
|
| ||||
Net Assets | $ | 448,381,490 | |||
|
| ||||
Shares of beneficial interest (unlimited number of shares authorized, no par value) | 27,442,299 | ||||
Net Asset Value (offering and redemption price per share) | $ | 16.34 | |||
|
|
For the Year Ended December 31, 2017
Investment Income: | |||||
Dividends from affiliates | $ | 3,794,852 | |||
Interest | 89 | ||||
Dividends | 305 | ||||
Other income | 892 | ||||
|
| ||||
Total Investment Income | 3,796,138 | ||||
|
| ||||
Expenses: | |||||
Manager fees | 221,184 | ||||
Administration fees | 49,261 | ||||
Custodian fees | 1,994 | ||||
Administrative and compliance services fees | 5,318 | ||||
Transfer agent fees | 4,898 | ||||
Trustee fees | 18,934 | ||||
Professional fees | 19,247 | ||||
Shareholder reports | 10,783 | ||||
Other expenses | 5,499 | ||||
|
| ||||
Total expenses | 337,118 | ||||
|
| ||||
Net Investment Income/(Loss) | 3,459,020 | ||||
|
| ||||
Realized and Unrealized Gains/(Losses) on Investments: | |||||
Net realized gains/(losses) on securities transactions from affiliates | 7,671,621 | ||||
Net realized gains distributions from affiliated underlying funds | 8,566,271 | ||||
Change in net unrealized appreciation/depreciation on affiliated transactions | 28,523,288 | ||||
|
| ||||
Net Realized/Unrealized Gains/(Losses) on Investments | 44,761,180 | ||||
|
| ||||
Change in Net Assets Resulting From Operations | $ | 48,220,200 | |||
|
|
See accompanying notes to the financial statements.
5
AZL Balanced Index Strategy Fund
Statements of Changes in Net Assets
| For the Year Ended December 31, 2017 | For the Year Ended December 31, 2016 | |||||||||
Change In Net Assets: | ||||||||||
Operations: | ||||||||||
Net investment income/(loss) | $ | 3,459,020 | $ | 8,019,060 | ||||||
Net realized gains/(losses) on investment transactions | 16,237,892 | 21,738,224 | ||||||||
Change in unrealized appreciation/depreciation on investments | 28,523,288 | (1,251,752 | ) | |||||||
|
|
|
| |||||||
Change in net assets resulting from operations | 48,220,200 | 28,505,532 | ||||||||
|
|
|
| |||||||
Distributions to Shareholders: | ||||||||||
From net investment income | (9,832,388 | ) | (11,827,600 | ) | ||||||
From net realized gains | (20,732,059 | ) | (7,976,603 | ) | ||||||
|
|
|
| |||||||
Change in net assets resulting from distributions to shareholders | (30,564,447 | ) | (19,804,203 | ) | ||||||
|
|
|
| |||||||
Capital Transactions: | ||||||||||
Proceeds from shares issued | 15,459,952 | 30,164,569 | ||||||||
Proceeds from dividends reinvested | 30,564,447 | 19,804,203 | ||||||||
Value of shares redeemed | (53,598,790 | ) | (52,905,698 | ) | ||||||
|
|
|
| |||||||
Change in net assets resulting from capital transactions | (7,574,391 | ) | (2,936,926 | ) | ||||||
|
|
|
| |||||||
Change in net assets | 10,081,362 | 5,764,403 | ||||||||
Net Assets: | ||||||||||
Beginning of period | 438,300,128 | 432,535,725 | ||||||||
|
|
|
| |||||||
End of period | $ | 448,381,490 | $ | 438,300,128 | ||||||
|
|
|
| |||||||
Accumulated net investment income/(loss) | $ | 3,957,705 | $ | 9,832,388 | ||||||
|
|
|
| |||||||
Share Transactions: | ||||||||||
Shares issued | 950,921 | 1,926,476 | ||||||||
Dividends reinvested | 1,932,013 | 1,277,690 | ||||||||
Shares redeemed | (3,277,297 | ) | (3,384,739 | ) | ||||||
|
|
|
| |||||||
Change in shares | (394,363 | ) | (180,573 | ) | ||||||
|
|
|
| |||||||
See accompanying notes to the financial statements.
6
AZL Balanced Index Strategy Fund
(Selected data for a share of beneficial interest outstanding throughout the periods indicated)
| Year Ended December 31, | |||||||||||||||||||||||||
| 2017 | 2016 | 2015 | 2014 | 2013 | |||||||||||||||||||||
Net Asset Value, Beginning of Period | $ | 15.75 | $ | 15.44 | $ | 15.91 | $ | 15.40 | $ | 13.91 | |||||||||||||||
|
|
|
|
|
|
|
|
|
| ||||||||||||||||
Investment Activities: | |||||||||||||||||||||||||
Net Investment Income/(Loss) | 0.15 | 0.30 | 0.34 | 0.16 | 0.15 | ||||||||||||||||||||
Net Realized and Unrealized Gains/(Losses) on Investments | 1.62 | 0.73 | (0.34 | ) | 0.78 | 1.63 | |||||||||||||||||||
|
|
|
|
|
|
|
|
|
| ||||||||||||||||
Total from Investment Activities | 1.77 | 1.03 | — | (a) | 0.94 | 1.78 | |||||||||||||||||||
|
|
|
|
|
|
|
|
|
| ||||||||||||||||
Dividends to Shareholders From: | |||||||||||||||||||||||||
Net Investment Income | (0.38 | ) | (0.43 | ) | (0.17 | ) | (0.23 | ) | (0.25 | ) | |||||||||||||||
Net Realized Gains | (0.80 | ) | (0.29 | ) | (0.30 | ) | (0.20 | ) | (0.04 | ) | |||||||||||||||
|
|
|
|
|
|
|
|
|
| ||||||||||||||||
Total Dividends | (1.18 | ) | (0.72 | ) | (0.47 | ) | (0.43 | ) | (0.29 | ) | |||||||||||||||
|
|
|
|
|
|
|
|
|
| ||||||||||||||||
Net Asset Value, End of Period | $ | 16.34 | $ | 15.75 | $ | 15.44 | $ | 15.91 | $ | 15.40 | |||||||||||||||
|
|
|
|
|
|
|
|
|
| ||||||||||||||||
Total Return(b) | 11.50 | % | 6.75 | % | 0.01 | % | 6.11 | % | 12.93 | % | |||||||||||||||
Ratios to Average Net Assets/Supplemental Data: | |||||||||||||||||||||||||
Net Assets, End of Period (000’s) | $ | 448,381 | $ | 438,300 | $ | 432,536 | $ | 438,651 | $ | 413,982 | |||||||||||||||
Net Investment Income/(Loss) | 0.78 | % | 1.83 | % | 2.14 | % | 1.02 | % | 1.10 | % | |||||||||||||||
Expenses Before Reductions*(c) | 0.08 | % | 0.08 | % | 0.08 | % | 0.08 | % | 0.08 | % | |||||||||||||||
Expenses Net of Reductions* | 0.08 | % | 0.08 | % | 0.08 | % | 0.08 | % | 0.08 | % | |||||||||||||||
Portfolio Turnover Rate | 6 | % | 12 | % | 11 | % | 9 | % | 8 | % | |||||||||||||||
| * | The expense ratios exclude the impact of fees/expenses paid by each underlying fund. |
| (a) | Represents less than $0.005. |
| (b) | The returns include reinvested dividends and fund level expenses, but exclude insurance contract charges. If these charges were included, the returns would have been lower. |
| (c) | Excludes fee reductions. If such fee reductions had not occurred, the ratios would have been as indicated. |
See accompanying notes to the financial statements.
7
AZL Balanced Index Strategy Fund
Notes to the Financial Statements
December 31, 2017
1. Organization
The Allianz Variable Insurance Products Fund of Funds Trust (the “Trust”) was organized as a Delaware statutory trust on June 16, 2004. The Trust is a diversified open-end management investment company registered under the Investment Company Act of 1940, as amended, (the “1940 Act”) and thus is determined to be an investment company for accounting purposes. The Trust consists of 12 separate investment portfolios (collectively, the “Funds”), of which one is included in this report, the AZL Balanced Index Strategy Fund (the “Fund”), and 11 are presented in separate reports.
The Fund is a “fund of funds,” which means that the Fund invests primarily in other mutual funds. Underlying Funds invest in stock, bonds, and other securities and reflect varying amounts of potential investment risk and reward. The Underlying Funds record their investments at fair value. Periodically, the Fund will adjust its asset allocation as it seeks to achieve its investment objective.
The Trust is authorized to issue an unlimited number of shares of the Fund without par value. Shares of the Fund are available through the variable annuity contracts offered through the separate accounts of participating insurance companies. Currently, the Fund only offers its shares to separate accounts of Allianz Life Insurance Company of North America and Allianz Life Insurance Company of New York, affiliates of the Trust and the Manager, as defined below.
Under the Trust’s organizational documents, its officers and trustees are indemnified against certain liabilities arising out of the performance of their duties to the Fund. In addition, in the normal course of business, the Fund may enter into contracts with its vendors and others that provide for general indemnifications. The Fund’s maximum exposure under these arrangements is unknown, as this would involve future claims that may be made against the Fund. However, based on experience, the Fund expects that risk of loss to be remote.
2. Significant Accounting Policies
The following is a summary of significant accounting policies followed by the Fund in the preparation of its financial statements. The policies conform with U.S. generally accepted accounting principles (“U.S. GAAP”). The preparation of financial statements requires management to make certain estimates and assumptions that affect the reported amounts of assets and liabilities and disclosure of contingent assets and liabilities at the date of the financial statements and the reported amounts of increases and decreases in net assets from operations during the reporting period. Actual results could differ from those estimates.
Security Valuation
The Fund records its investments at fair value. Fair value is defined as the price that would be received to sell an asset or paid to transfer a liability in an orderly transaction between willing market participants at the measurement date. The valuation techniques used to determine fair value are further described in Note 4 below.
Investment Transactions and Investment Income
Investment transactions are accounted for on trade date. Net realized gains and losses on investments sold and on foreign currency transactions are recorded on the basis of identified cost. Interest income is recorded on the accrual basis and includes, where applicable, the amortization of premiums or accretion of discounts.
Dividends to Shareholders
Dividends to shareholders are recorded on the ex-dividend date. The Fund distributes its dividends from net investment income and net realized capital gains, if any, on an annual basis. The amount of dividends from net investment income and from net realized gains is determined in accordance with federal income tax regulations, which may differ from U.S. GAAP. These “book/tax” differences are either temporary or permanent in nature. To the extent these differences are permanent in nature (e.g., miscellaneous adjustments on return of capital), such amounts are reclassified within the composition of net assets based on their federal tax-basis treatment; temporary differences (e.g., wash sales) do not require reclassification. Dividends to shareholders that exceed net investment income and net realized gains for tax purposes are reported as distributions of capital.
Expense Allocation
Expenses directly attributable to the Fund are charged directly to the Fund, while expenses attributable to more than one Fund are allocated among the respective Funds based upon relative net assets or some other reasonable method. Expenses which are attributable to more than one Trust are allocated across the Allianz Variable Insurance Products and Allianz Variable Insurance Products Fund of Funds Trusts based upon relative net assets or another reasonable basis. Allianz Investment Management LLC (the “Manager”), serves as the investment manager for the Trust and the Allianz Variable Insurance Products Trust.
3. Fees and Transactions with Affiliates and Other Parties
The Manager provides investment advisory and management services for the Fund. The Manager has contractually agreed to waive fees and reimburse the Fund to limit the annual expenses, excluding interest expense (e.g., cash overdraft fees), taxes, brokerage commissions, acquired fund fees and expenses, other expenditures that are capitalized in accordance with U.S. GAAP and other extraordinary expenses not incurred in the ordinary course of the Fund’s business, based on the daily net assets of the Fund, through April 30, 2019. Expenses incurred for investment advisory and management services are reflected on the Statement of Operations as “Manager fees.”
For the year ended December 31, 2017, the annual rate paid to the Manager and the annual expense limit were as follows:
| Annual Rate | Annual Expense Limit | |||||||||
AZL Balanced Index Strategy Fund | 0.05 | % | 0.20 | % | ||||||
8
AZL Balanced Index Strategy Fund
Notes to the Financial Statements
December 31, 2017
Any amounts contractually waived or reimbursed by the Manager in a particular fiscal year will be subject to repayment by the Fund to the Manager to the extent that from time to time through the next three fiscal years the repayment will not cause the Fund’s expenses to exceed the lesser of the stated limit at the time of the waiver or the current stated limit. Any amounts recouped by the Manager during the year are reflected on the Statement of Operations as “Recoupment of prior expenses reimbursed by the Manager.” At December 31, 2017, there were no remaining contractual reimbursements that are subject to repayment by the Fund in subsequent years.
In addition, the Manager may voluntarily waive or reimburse additional fees in order to maintain more competitive expense ratios. Any voluntary waivers or reimbursements are not subject to repayment in subsequent years. Information on the total amount waived/reimbursed by the Manager or repaid to the Manager by the Fund during the period can be found on the Statement of Operations. During the year ended December 31, 2017, there were no voluntary waivers.
The Manager or an affiliate of the Manager serves as the investment adviser of certain underlying funds in which the Fund invests. At December 31, 2017, these underlying funds are noted as Affiliated Investment Companies in the Fund’s Schedule of Portfolio Investments. Additional information, including financial statements, about these Funds is available at www.allianzlife.com. The Manager or an affiliate of the Manager is paid a separate fee from the underlying funds for such services. A summary of the Fund’s investments in affiliated investment companies for the year ended December 31, 2017 is as follows:
| Fair Value 12/31/16 | Purchases at Cost | Proceeds from Sales | Net Realized Gains/(Losses) | Net Change in Unrealized Depreciation | Fair Value 12/31/17 | Shares as of 12/31/2017 | Dividend Income | Net realized gains distributions from affiliated underlying funds | |||||||||||||||||||||||||||||||||||||
AZL Enhanced Bond Index Fund | $ | 213,693,435 | $ | 14,780,957 | $ | (8,627,045 | ) | $ | (194,755 | ) | $ | 4,723,626 | $ | 224,376,218 | 20,603,877 | $ | 2,004,674 | $ | 7,756 | ||||||||||||||||||||||||||
AZL International Index Fund, Class 2 | 55,595,556 | 1,032,506 | (11,783,972 | ) | 583,970 | 10,919,580 | 56,347,640 | 3,257,089 | 486,883 | 424,660 | |||||||||||||||||||||||||||||||||||
AZL Mid Cap Index Fund, Class 2 | 34,709,583 | 2,046,063 | (6,188,478 | ) | 849,441 | 2,254,067 | 33,670,676 | 1,435,238 | 156,942 | 1,719,565 | |||||||||||||||||||||||||||||||||||
AZL S&P 500 Index Fund, Class 2 | 114,983,267 | 7,080,363 | (22,092,462 | ) | 5,900,089 | 10,309,305 | 116,180,562 | 7,202,763 | 1,057,348 | 5,178,657 | |||||||||||||||||||||||||||||||||||
AZL Small Cap Stock Index Fund, Class 2 | 19,410,475 | 1,349,949 | (3,608,929 | ) | 532,876 | 316,710 | 18,001,081 | 1,209,750 | 89,005 | 1,235,633 | |||||||||||||||||||||||||||||||||||
|
|
|
|
|
|
|
|
|
|
|
|
|
|
|
|
|
| ||||||||||||||||||||||||||||
| $ | 438,392,316 | $ | 26,289,838 | $ | (52,300,886 | ) | $ | 7,671,621 | $ | 28,523,288 | $ | 448,576,177 | 33,708,717 | $ | 3,794,852 | $ | 8,566,271 | ||||||||||||||||||||||||||||
|
|
|
|
|
|
|
|
|
|
|
|
|
|
|
|
|
| ||||||||||||||||||||||||||||
Pursuant to separate agreements between the Funds and the Manager, the Manager provides a Chief Compliance Officer (“CCO”) and certain compliance oversight and regulatory filing services to the Trust. Under these agreements the Manager is entitled to an amount equal to a portion of the compensation and certain other expenses related to the individuals performing the CCO and compliance oversight services, as well as $100 per hour for time incurred in connection with the preparation and filing of certain documents with the Securities and Exchange Commission (“SEC” or the “Commission”). The fees are paid to the Manager on a quarterly basis. The total expenses incurred by the Fund for these services are reflected on the Statement of Operations as “Administrative and compliance services fees.”
Citi Fund Services Ohio, Inc. (“Citi” or the “Administrator”), a wholly owned subsidiary of Citigroup, Inc., with which an officer of the Trust is affiliated, serves as the Trust’s administrator and fund accountant, and assists the Trust in all aspects of its administration and operation. The Administrator is entitled to a fee, accrued daily and paid monthly. The Administrator is entitled to an annual fee for each additional class of shares of any Fund, certain annual fees in supporting fair values services, and a Trust-wide annual fee for providing infrastructure and support in implementing the written policies and procedures comprising the Fund’s compliance program. The Administrator is also reimbursed for certain expenses incurred. The total expenses incurred by the Fund for these services are reflected on the Statement of Operations as “Administration fees.”
FIS Investor Services LLC (“FIS”) serves as the Fund’s transfer agent. Under the Transfer Agent Agreement, the Trust pays FIS a fee for its services and reimburses FIS for all of their reasonable out-of-pocket expenses incurred in providing these services.
The Bank of New York Mellon (“BNY Mellon” or the “Custodian”) serves as the Trust’s custodian and securities lending agent. For these services as custodian, the Funds pay BNY Mellon a fee based on a percentage of assets held on behalf of the Funds, plus certain out-of-pocket charges.
Allianz Life Financial Services, LLC (“ALFS”), an affiliate of the Manager, serves as distributor of the Fund. ALFS receives an annual Trust-wide annual fee of $7,500, paid by the Manager from its profits and not by the Trust, for recordkeeping and reporting services.
In addition, certain legal fees and expenses are paid to a law firm, Dorsey & Whitney LLP, of which the Secretary of the Fund is Senior Counsel. During the year ended December 31, 2017, $4,541 was paid from the Fund relating to these fees and expenses.
Certain Officers and Trustees of the Trust are affiliated with the Manager or the Administrator. Such Officers (except for the Trust’s CCO as noted above) and Trustees receive no compensation from the Trust for serving in their respective roles. For their service to the Trust and to the Allianz Variable Insurance Products Trust, each non-interested Trustee receives a $170,000 annual Board retainer, the Lead Director receives an additional $42,500 annually and the Chair of the Nominating and Corporate Governance Committee receives an additional $25,500 annually. In addition, the Trustees are reimbursed for certain expenses associated with attending Board meetings. Compensation to the Trustees is allocated between the Trust and the Allianz Variable Insurance Products Trust in proportion to the assets under management of each trust. During the year ended December 31, 2017, actual Trustee compensation was $1,116,333 in total for both trusts.
4. Investment Valuation Summary
The valuation techniques employed by the Fund, as described below, maximize the use of observable inputs and minimize the use of unobservable inputs in determining fair value. The inputs used for valuing the Fund’s investments are summarized in the three broad levels listed below:
| ● | Level 1 — quoted prices in active markets for identical assets |
| ● | Level 2 — other significant observable inputs (including quoted prices for similar securities, interest rates, prepayments speeds, credit risk, etc.) |
| ● | Level 3 — significant unobservable inputs (including the Fund’s own assumptions in determining the fair value of investments) |
9
AZL Balanced Index Strategy Fund
Notes to the Financial Statements
December 31, 2017
Changes in valuation techniques may result in transfers in or out of an assigned level within the disclosure hierarchy. The Fund determines transfers between fair value hierarchy levels at the reporting period end. The inputs or methodology used for valuing investments is not necessarily an indication of the risk associated with investing in those investments.
Investments in other investment companies are valued at their published net asset value (“NAV”). Security prices are generally provided by an independent third party pricing service approved by the Trust’s Board of Trustees (the “Board” or “Trustees”) as of the close of the New York Stock Exchange (“NYSE”) (generally 4:00 pm Eastern Time). The investments utilizing Level 1 valuations represent investments in open-end investment companies. Futures contracts are valued at the last sales price as of the close of the primary exchange and are typically categorized as Level 1 in the fair value hierarchy.
For the year ended December 31, 2017, there were no Level 3 investments for which significant unobservable inputs were used to determine fair value. There were no significant transfers between Levels 1 and 2 as of December 31, 2017, based on levels assigned to securities on December 31, 2016.
The following is a summary of the valuation inputs used as of December 31, 2017 in valuing the Fund’s investments based upon the three levels defined above:
| Investment Securities: | Level 1 | Level 2 | Level 3 | Total | ||||||||||||||||
Affiliated Investment Companies | $ | 448,576,177 | $ | — | $ | — | $ | 448,576,177 | ||||||||||||
|
|
|
|
|
|
|
| |||||||||||||
Total Investment Securities | $ | 448,576,177 | $ | — | $ | — | $ | 448,576,177 | ||||||||||||
|
|
|
|
|
|
|
| |||||||||||||
5. Security Purchases and Sales
For the year ended December 31, 2017, cost of purchases and proceeds from sales of securities (excluding securities maturing less than one year from acquisition) were as follows:
| Purchases | Sales | |||||||||
AZL Balanced Index Strategy Fund | $ | 26,289,838 | $ | 52,300,886 | ||||||
6. Investment Risks
Derivatives Risk: The Fund may invest directly or through affiliated or unaffiliated mutual funds or unregistered investment pools in derivative instruments such as futures, options, and options on futures. A derivative is a financial contract whose value depends on, or is derived from, the value of an underlying asset, reference rate, or risk. Use of derivative instruments involves risks different from, or possibly greater than, the risks associated with investing directly in securities and other traditional investments. Derivatives are subject to a number of other risks, such as liquidity risk, interest rate risk, market risk, credit risk, and selection risk. Derivatives also involve the risk of mispricing or improper valuation and the risk that changes in the value may not correlate perfectly with the underlying asset, rate, or index. Using derivatives may result in losses, possibly in excess of the principal amount invested. Also, suitable derivative transactions may not be available in all circumstances. The other party to a derivatives contract could default.
Fund of Funds Risk: The Fund, as a shareholder of the underlying funds, indirectly bears its proportionate share of any investment management fees and other expenses of the underlying funds. Further due to the fees and expenses paid by the Fund, as well as small variations in the Fund’s actual allocations to the underlying funds and any futures and cash held in the Fund’s portfolio, the performance and income distributions of the Fund will not be the same as the performance and income distributions of the underlying funds.
7. Federal Tax Information
It is the policy of the Fund to continue to qualify as a regulated investment company by complying with the provisions available to certain investment companies, as defined under Subchapter M of the Internal Revenue Code, and to make distributions of net investment income and net realized gains sufficient to relieve it from all, or substantially all, federal income taxes. Accordingly, no provisions for federal income taxes are required in the financial statements.
Management of the Fund has reviewed tax positions taken in tax years that remain subject to examination by all major tax jurisdictions, including federal (i.e., the last four tax year ends and the interim tax period since then, as applicable). Management believes that there is no tax liability resulting from unrecognized tax benefits related to uncertain tax positions taken.
Cost of securities, including derivatives and short positions as applicable, for federal income tax purposes at December 31, 2017 is $349,174,566. The gross unrealized appreciation/(depreciation) on a tax basis is as follows:
Unrealized appreciation | $ | 99,401,611 | ||
Unrealized (depreciation) | — | |||
|
| |||
Net unrealized appreciation/(depreciation) | $ | 99,401,611 | ||
|
|
The tax character of dividends paid to shareholders during the year ended December 31, 2017 were as follows:
| Ordinary Income | Net Long-Term | Total Distributions(a) | |||||||||||||
AZL Balanced Index Strategy Fund | $ | 9,834,481 | $ | 20,729,966 | $ | 30,564,447 | |||||||||
| (a) | Total distributions paid may differ from the Statements of Changes in Net Assets because dividends are recognized when actually paid for tax purposes. |
10
AZL Balanced Index Strategy Fund
Notes to the Financial Statements
December 31, 2017
The tax character of dividends paid to shareholders during the year ended December 31, 2016 were as follows:
| Ordinary Income | Net Long-Term | Total Distributions(a) | |||||||||||||
AZL Balanced Index Strategy Fund | $ | 11,827,600 | $ | 7,976,603 | $ | 19,804,203 | |||||||||
| (a) | Total distributions paid may differ from the Statements of Changes in Net Assets because dividends are recognized when actually paid for tax purposes. |
At December 31, 2017, the components of accumulated earnings on a tax basis were as follows:
| Undistributed Ordinary Income | Undistributed Long-Term Capital Gains | Accumulated Capital and Other Losses | Unrealized Appreciation/ Depreciation(a) | Total Accumulated Earnings/ (Deficit) | |||||||||||||||||||||
AZL Balanced Index Strategy Fund | $ | 3,957,704 | $ | 15,425,645 | $ | — | $ | 99,401,611 | $ | 118,784,960 | |||||||||||||||
| (a) | The difference between book-basis and tax-basis unrealized appreciation/depreciation is attributable primarily to tax deferral of losses on wash sales. |
8. Ownership and Principal Holders
The beneficial ownership, either directly or indirectly, of more than 25% of the voting securities of a fund creates presumptions of control of the fund, under section 2 (a)(9) of the 1940 Act. As of December 31, 2017, the Fund had an individual shareholder account which is affiliated with the Investment Adviser representing ownership in excess of 90% of the Fund.
9. Investment Company Reporting Modernization
In October 2016, the SEC released its Final Rule on Investment Company Reporting Modernization (the “Rules”). The Rules which introduce two new regulatory reporting forms for investment companies — Form N-PORT and Form N-CEN — also contain amendments to Regulation S-X which require standardized, enhanced disclosures about derivatives in investment company financial statements, as well as other amendments. The amendments to Regulation S-X became effective for filings made with the SEC after August 1, 2017. The compliance date for form N-PORT and Form N-CEN will vary based on the reporting entity’s size and, in the case of the Fund, is expected to be April 30, 2019. The Fund’s adoption of these amendments, as applicable for the financial statements prepared as of December 31, 2017, had no effect on the Fund’s net assets or results of operations.
10. Subsequent Events
Management of the Fund has evaluated the need for additional disclosures or adjustments resulting from events through the date the financial statements were issued. Based on this evaluation, there were no subsequent events to report that would have material impact on the Fund’s financial statements.
11
REPORT OF INDEPENDENT REGISTERED PUBLIC ACCOUNTING FIRM
To the Shareholders and Board of Trustees of
Allianz Variable Insurance Products Fund of Funds Trust:
Opinion on the Financial Statements
We have audited the accompanying statement of assets and liabilities of AZL Balanced Index Strategy Fund (the “Fund”) of the Allianz Variable Insurance Products Fund of Funds Trust, including the schedule of portfolio investments, as of December 31, 2017, and the related statement of operations for the year then ended, the statements of changes in net assets for each of the years in the two-year period then ended, and the related notes (collectively, the “financial statements”) and the financial highlights for each of the years in the five-year period then ended. In our opinion, the financial statements present fairly, in all material respects, the financial position of the Fund as of December 31, 2017, the results of its operations for the year then ended, the changes in its net assets for each of the years in the two-year period then ended and the financial highlights for each of the years in the five-year period then ended, in conformity with U.S. generally accepted accounting principles.
Basis for Opinion
These financial statements and financial highlights are the responsibility of the Fund’s management. Our responsibility is to express an opinion on these financial statements and financial highlights based on our audits. We are a public accounting firm registered with the Public Company Accounting Oversight Board (United States) (“PCAOB”) and are required to be independent with respect to the Fund in accordance with the U.S. federal securities laws and the applicable rules and regulations of the Securities and Exchange Commission and the PCAOB.
We conducted our audits in accordance with the standards of the PCAOB. Those standards require that we plan and perform the audit to obtain reasonable assurance about whether the financial statements and financial highlights are free of material misstatement, whether due to error or fraud. Our audits included performing procedures to assess the risks of material misstatement of the financial statements and financial highlights, whether due to error or fraud, and performing procedures that respond to those risks. Such procedures included examining, on a test basis, evidence regarding the amounts and disclosures in the financial statements and financial highlights. Such procedures also included confirmation of securities owned as of December 31, 2017, by correspondence with the transfer agents of the underlying funds. Our audits also included evaluating the accounting principles used and significant estimates made by management, as well as evaluating the overall presentation of the financial statements and financial highlights. We believe that our audits provide a reasonable basis for our opinion.
/s/ KPMG LLP
We have served as the auditor of one or more Allianz Variable Insurance Products investment companies since 1999.
Columbus, Ohio
February 23, 2018
12
Other Federal Income Tax Information (Unaudited)
For the year ended December 31, 2017, 24.97% of the total ordinary income dividends paid by the Fund qualify for the corporate dividends received deduction available to corporate shareholders.
During the year ended December 31, 2017, the Fund declared net short-term capital gain distributions of $2,091.
During the year ended December 31, 2017, the Fund declared net long-term capital gain distributions of $20,729,966.
13
A description of the policies and procedures that the Fund uses to determine how to vote proxies relating to portfolio securities is available, without charge, upon request, by visiting the Securities and Exchange Commission’s (“Commission”) website at www.sec.gov, or by calling 800-624-0197.
Information regarding how the Fund voted proxies relating to portfolio securities during the most recent 12-month period ended June 30th is available (i) without charge, upon request, by calling 800-624-0197; (ii) on the Allianz Variable Insurance Products Fund of Funds Trust’s website at https://www.allianzlife.com; and (iii) on the Commission’s website at http://www.sec.gov.
The Fund files complete Schedules of Portfolio Holdings with the Commission for the first and third quarters of each fiscal year on Form N-Q. Schedules of Portfolio Holdings for the Fund in this report are available without charge on the Commission’s website at http://www.sec.gov, or may be reviewed and copied at the Commission’s Public Reference Room in Washington, D.C. Information on the operation of the Public Reference Room may be obtained by calling 800-SEC-0330.
14
Approval of Investment Advisory and Subadvisory Agreements (Unaudited)
Subject to the general supervision of the Board of Trustees (the “Board”) and in accordance with the investment objectives and restrictions of each separate series (together, the “Funds”) of the Allianz Variable Insurance Products Fund of Funds Trust (the “Trust”), investment advisory services are provided to the Funds by Allianz Investment Management LLC (the “Manager”). As used in this section, “Fund” refers to any of the Funds. The Manager manages each Fund pursuant to an investment management agreement (the “Management Agreement”) with the Trust in respect of each such Fund. The Management Agreement provides that the Manager, subject to the supervision and approval of the Board, is responsible for the management of each Fund. For management services, each Fund pays the Manager an investment advisory fee based upon each Fund’s average daily net assets. The Manager has contractually agreed to limit the expenses of each Fund by reimbursing the Fund if and when total Fund operating expenses exceed certain amounts until at least May 1, 2019 (the “Expense Limitation Agreement”).
In reviewing the services provided by the Manager and the terms of the Management Agreement, the Board receives and reviews information related to the Manager’s experience and expertise in the variable insurance marketplace. Currently, the Funds are offered only through variable annuities and variable life insurance policies, and not in the retail fund market. In addition, the Board receives information regarding the Manager’s expertise with regard to portfolio diversification and asset allocation requirements within variable insurance products issued by Allianz Life Insurance Company of North America (“Allianz Life”) and its subsidiary, Allianz Life Insurance Company of New York (“Allianz of New York”). Currently, the Funds are offered only through Allianz Life and Allianz of New York variable products.
As required by the Investment Company Act of 1940 (the “1940 Act”), the Board has reviewed and approved the Management Agreement with the Manager. The Board’s decision to approve this contract reflects the exercise of its business judgment on whether to approve new arrangements and continue the existing arrangements. During its review of the contract, the Board considered many factors, among the most material of which are: the Fund’s investment objectives and long-term performance; the Manager’s management philosophy, personnel, processes and investment performance, including its compliance history and the adequacy of its compliance processes; the preferences and expectations of Fund shareholders (and underlying contract owners) and their relative sophistication; the continuing state of competition in the mutual fund industry; and comparable fees in the mutual fund industry.
The Board also considered the compensation and benefits received by the Manager. This includes fees received for services provided to a Fund by employees of the Manager or of affiliates of the Manager and research services received by the Manager from brokers that execute Fund trades, as well as advisory fees. The Board considered the fact that: (1) the Manager and the Trust are parties to an Administrative Services Agreement and a Compliance Services Agreement, under which the Manager is compensated by the Trust for performing certain administrative and compliance services including providing an employee of the Manager or one of its affiliates to act as the Trust’s Chief Compliance Officer; and (2) Allianz Life Financial Services, LLC, an affiliated person of the Manager, is a registered securities broker-dealer and received (along with its affiliated persons) payments made by the underlying funds pursuant to Rule 12b-1.
The Board is aware that various courts have interpreted provisions of the 1940 Act and have indicated in their decisions that the following factors may be relevant to an adviser’s compensation: the nature and quality of the services provided by the adviser, including the performance of the fund; the adviser’s cost of providing the services; the extent to which the adviser may realize “economies of scale” as the fund grows larger; any indirect benefits that may accrue to the adviser and its affiliates as a result of the adviser’s relationship with the fund; performance and expenses of comparable funds; the profitability of acting as adviser to the fund; and the extent to which the independent Board members, who are not “interested persons” of a fund as defined by the 1940 Act, are fully informed about all facts bearing on the adviser’s services and fees. The Board is aware of these factors and takes them into account in its review of the Management Agreement for the Funds.
The Board considered and weighed these circumstances in light of its experience in governing the Trust, and is assisted in its deliberations by the advice of independent legal counsel to the independent Trustees. In this regard, the Board requests and receives a significant amount of information about the Funds and the Manager. Some of this information is provided at each regular meeting of the Board; additional information is provided in connection with the particular meeting or meetings at which the Board’s formal review of an advisory contract occurs. In between regularly scheduled meetings, the Board may receive information on particular matters as the need arises. Thus, the Board’s evaluation of the Management Agreement is informed by reports covering such matters as: the Manager’s investment philosophy, personnel and processes, and the Fund’s investment performance (in absolute terms as well as in relationship to its benchmark). In connection with comparing the performance of each Fund versus its benchmark, the Board receives reports on the extent to which the Fund’s performance may be attributed to various applicable factors, such as asset class allocation decisions and volatility management strategies, the performance of the underlying funds, rebalancing decisions, and the impact of cash positions and Fund fees and expenses. The Board also receives reports on the Funds’ expenses (including the advisory fee itself and the overall expense structure of the Funds, both in absolute terms and relative to similar and/or competing funds, with due regard for the Expense Limitation Agreement and additional voluntary expense limitations); the nature and extent of the advisory and other services provided to the Fund by the Manager and its affiliates; compliance and audit reports concerning the Funds and the companies that service them; and relevant developments in the mutual fund industry and how the Funds and/or the Manager are responding to them.
The Board also receives financial information about the Manager, including reports on the compensation and benefits the Manager derives from its relationships with the Funds. These reports cover not only the fees under the Management Agreement, but also fees, if any, received for providing other services to the Funds. The reports also discuss any indirect or “fall out” benefits the Manager or its affiliates may derive from its relationship with the Funds.
The Management Agreement was most recently considered at Board meetings held in the fall of 2017. Information relevant to the approval of the Management Agreement was considered at a telephonic Board meeting on October 18, 2017, and at an “in person” Board meeting held October 23, 2017. The Management Agreement was approved at the Board meeting of October 23, 2017. At such meeting the Board also approved the Expense Limitation Agreement between the Manager and the Trust for the period ending April 30, 2019. In connection with such meetings, the Trustees requested and evaluated extensive materials from the Manager, including performance and expense information for other investment companies with similar investment objectives derived from data compiled by an independent third party provider and other sources believed to be reliable by the Manager. Prior to voting, the Trustees reviewed the proposed approval/continuance of the Agreement with management and with experienced counsel who are independent of the Manager and received a memorandum from such counsel discussing the legal standards for their consideration of the proposed approvals/continuances. The independent Trustees also discussed the proposed approvals/continuances in a private session with such counsel at which no representatives of the Manager were present. In reaching their determinations relating to the approval and/or continuance of the Agreement, in respect of each Fund, the Board considered all factors it believed relevant. The Board based its decision to approve the Management Agreement on the totality of the circumstances and relevant factors, and with a view to past and future long-term considerations. Not all of the factors and considerations discussed above and below are necessarily relevant to every Fund, and the Board did not assign relative weights to factors discussed herein or deem any one or group of them to be controlling in and of themselves.
An SEC rule requires that shareholder reports include a discussion of certain factors relating to the selection of the investment adviser and the approval of the advisory fee. The “factors” enumerated by the SEC are set forth below in italics, as well as the Board’s conclusions regarding such factors:
(1) The nature, extent and quality of services provided by the Manager. The Trustees noted that the Manager, subject to the control of the Board, administers each Fund’s business and other affairs. The Trustees noted that the Manager also provides the Trust and each Fund with such administrative and other services (exclusive of, and in addition to, any such services provided by any others retained by the Trust on behalf of the Funds) and executive and other personnel as are necessary for the operation of the Trust and the Funds. Except for the Trust’s Chief Compliance Officer and certain compliance staff, the Manager pays all of the compensation of Trustees and officers of the Trust who are employees of the Manager or its affiliates.
15
The Board considered the scope and quality of services provided by the Manager and noted that the scope of such services provided had expanded as a result of recent regulatory and other developments. The Board noted that, for example, the Manager is responsible for maintaining and monitoring its own compliance program, and this compliance program has been continuously refined and enhanced in light of new regulatory requirements. The Board considered the capabilities and resources which the Manager has dedicated to performing services on behalf of the Trust and its Funds. The quality of administrative and other services, including the Manager’s role in coordinating the activities of the Trust’s other service providers, also were considered. The Board concluded that, overall, they were satisfied with the nature, extent and quality of services provided (and expected to be provided) to the Trust and to each of the Funds under the Management Agreement.
(2) The investment performance of the Funds and the Manager. In connection with every in-person quarterly Board meeting and the fall 2017 contract review process, Trustees received extensive information on the performance results of each Fund. This included, for example, performance information on absolute total return, performance versus the appropriate benchmark(s), the contribution to performance of the Manager’s asset class allocation decisions and volatility management strategies, the performance of the underlying funds, and the impact on performance of rebalancing decisions, cash and Fund fees. This included Lipper performance information on the Funds for the previous quarter, year-to-date, and previous one-, three- and five-year periods, to the extent the Funds were in existence for such periods. (For Funds which have been in existence for less than five years, the Board received performance information on shorter time periods to the extent available.) For example, in connection with the Board meeting held October 23, 2017, the Manager reported that for the five Funds for which performance information for the five year period ended June 30, 2017 was available, two were in the top 40%, two were in the middle 20%, and one was in the bottom 40%. None of these Funds was in the bottom 40% for the three- or one-year periods. The Manager reported that for the three-year period ended June 30, 2017, for the six Funds for which three year performance information was available, four Funds were in the top 40% and two Funds were in the middle 20%. For the eight Funds for which one-year performance information was available, for the one-year period ended June 30, 2017, four Funds were in the top 40%, two Funds were in the middle 20%, and two Funds were in the bottom 40%.
At the Board meeting held October 23, 2017, the Manager also reported upon the performance of the MVP Funds compared to custom managed-volatility peer groups. For the seven Funds for which three-year performance information was available, for the three-year period ended June 30, 2017, five Funds were in the top 40%, one Fund was in the middle 20%, and one was in the bottom 40%. For the eight Funds for which one year performance was available, for the one-year period ended June 30, 2017, four Funds were in the top 40% and four Funds were in the middle 20%. All six Funds for which five-year performance information was available were in the top 40%.
At the Board meeting held October 23, 2017, the Trustees determined that the investment performance of the Funds was acceptable.
(3) The costs of services to be provided and profits to be realized by the Manager and its affiliates from the relationship with the Funds. The Board considered that the Manager receives an advisory fee from each of the Funds. The Manager reported that for the three MVP Fusion Dynamic Funds the advisory fee paid put these Funds in the 44th percentile of the customized peer group. The Manager reported that for three MVP Index Strategy Funds the advisory fee paid put them in the 27th percentile of the customized peer group, and for the two non-MVP Index Strategy Funds, as well as the AZL DFA Multi-Strategy Fund, the advisory fee paid put them in the 13th percentile of the customized peer group. The Manager reported that for the AZL MVP BlackRock Global Strategy Plus, AZL MVP DFA Multi-Strategy, AZL MVP Pyramis Multi-Strategy, and AZL MVP T. Rowe Price Capital Appreciation Plus Funds, the advisory fee paid was in the 9th percentile. (A lower percentile reflects lower fund fees and is better for fund shareholders.) Trustees were provided with information on the total expense ratios of the Funds and other funds in the customized peer groups, and the Manager reported upon the challenges in making peer group comparisons for the Funds.
The Manager provided information concerning the profitability of the Manager’s investment advisory activities for the period from 2014 through June 30, 2017. The Board recognized that it is difficult to make comparisons of profitability from investment company advisory agreements because comparative information is not generally publicly available and is affected by numerous factors, including the structure of the particular adviser, the types of funds it manages, its business mix, numerous assumptions regarding allocation of expenses and the adviser’s capital structure and cost of capital. In considering profitability information, the Board considered the possible effect of certain fall-out benefits to the Manager and its affiliates. The Board focused on profitability of the Manager’s relationships with the Funds before taxes and distribution expenses. The Board recognized that the Manager should earn a reasonable level of profits for the services it provides to each Fund.
The Board also considered that Wilshire Funds Management (“Wilshire”) serves as a consultant to the Manager in preparing statistical and other factual information for use in the creation and maintenance of the asset allocation models for the Fusion Funds (the AZL MVP Fusion Dynamic Conservative, Balanced, and Moderate Funds), pursuant to an agreement between the Manager and Wilshire. Wilshire serves as a consultant to the Manager with respect to selecting the Fusion Funds’ underlying funds and the asset allocations among the underlying funds. The Manager, not any Fund, pays a consultant fee to Wilshire.
Based upon the information provided, the Board concluded that the Funds’ advisory fees and expense ratios are not unreasonable, and determined that there was no evidence that the Manager’s level of profitability from its relationship with the Funds was excessive.
(4) and (5) The extent to which economies of scale would be realized as the Funds grow, and whether fee levels reflect these economies of scale. The Board noted that the advisory fee schedules for the Funds do not contain breakpoints that reduce the fee rate on assets above specified levels. The Board recognized that breakpoints may be an appropriate way for the Manager to share its economies of scale, if any, with Funds that have substantial assets. The Board found there was no uniform methodology for establishing breakpoints that give effect to Fund-specific services provided by the Manager. The Board noted that in the fund industry as a whole, as well as among funds similar to the Funds, there is no uniformity or pattern in the fees and asset levels at which breakpoints (if any) apply. Depending on the age, size, and other characteristics of a particular fund and its manager’s cost structure, different conclusions can be drawn as to whether there are economies of scale to be realized at any particular level of assets, notwithstanding the intuitive conclusion that such economies exist, or will be realized at some level of total assets. Moreover, because different managers have different cost structures and service models, it is difficult to draw meaningful conclusions from the breakpoints that may have been adopted by other funds. The Board also noted that the advisory agreements for many funds do not have breakpoints at all, or if breakpoints exist, they may be at asset levels significantly greater than those of the individual Funds. The Board also noted that the total assets in all of the Funds, as of June 30, 2017, were approximately $10.8 billion and that the largest Fund, the AZL MVP Growth Index Strategy Fund, had assets of approximately $2.4 billion.
The Board noted that the Manager has agreed to temporarily limit Fund expenses under the Expense Limitation Agreement, which has the effect of reducing expenses as would the implementation of advisory fee breakpoints. The Manager has committed to continue to consider the continuation of expense limits and/or advisory fee breakpoints as the Funds grow larger. The Board receives quarterly reports on the level of Fund assets. The Board expects to continue to consider: (a) the extent to which economies of scale have been realized, and (b) whether the advisory fee should be modified, either in connection with the next renewal of the Agreements or by modifying the Expense Limitation Agreement, to reflect such economies of scale, if any.
Having taken these factors into account, the Board concluded that the absence of breakpoints in the Funds’ advisory fee rate schedules was acceptable under each Fund’s circumstances.
16
Information about the Board of Trustees and Officers (Unaudited)
The Trust is managed by the Trustees in accordance with the laws of the state of Delaware governing business trusts. There are currently eight Trustees, one of whom is an “interested person” of the Trust within the meaning of that term under the 1940 Act. The Trustees and Officers of the Trust, and their addresses, ages, positions held with the Trust, terms of office with the Trust and length of time served, principal occupation(s) during the past five years, the number of portfolios in the Trust they oversee, and other directorships held during the past five years are as follows:
Non-Interested Trustees(1)
| Name, Address, and Year of Birth | Positions Held with Allianz VIP and VIP FOF Trust | Term of Office(2)/Length of Time Served | Principal Occupation(s) During Past 5 Years | Number of Portfolios Overseen for Allianz VIP and VIP FOF Trust | Other AZL Fund Complex | |||||
| Peter R. Burnim (1947) 5701 Golden Hills Drive Minneapolis, MN 55416 | Trustee | Since 2/07 | Consultant/Chair, various companies: Chairman, Emrys Analytics and subsidiaries, July 2015 to present; Chairman, Argus Investment Strategies Fund Ltd., February 2013 to 2017; Managing Director, iQ Venture Advisors, LLC, 2005 to present; Chairman, Northstar Group Holdings Ltd. Bermuda, 2011 to present; Chairman Sterling Bank & Trust (Bahamas) Ltd., 2016 to present, and Expert Witness, Massachusetts Department of Revenue, 2011 to 2016. | 35 | Argus Group Holdings and Subsidiaries; Northstar Group Holdings; Sterling Trust (Cayman) Ltd.; Sterling Bank & Trust Limited (Bahamas); Emrys Analytics; EGB Insurance. | |||||
| Peggy L. Ettestad (1957) 5701 Golden Hills Drive Minneapolis, MN 55416 | Lead Independent Trustee | Since 10/14 (Trustee since 2/07) | Managing Director, Red Canoe Management Consulting LLC, 2008 to present | 35 | Luther College | |||||
| Tamara Lynn Fagely (1958) 5701 Golden Hills Drive Minneapolis, MN 55416 | Trustee | Since 12/17 | Retired; Chief Operations Officer, Hartford Funds, March 2012 to December 2013 | 35 | Diamond Hill Funds (13 funds) | |||||
| Richard H. Forde (1953) 5701 Golden Hills Drive Minneapolis, MN 55416 | Trustee | Since 12/17 | Member of the Board and Chairman of the Finance and Investment Committee, Connecticut Water Service, Inc., October 2013 to present; Senior Vice President and Chief Investment Officer, CIGNA, 2004 to 2012 | 35 | Connecticut Water Service, Inc. | |||||
| Claire R. Leonardi (1955) 5701 Golden Hills Drive Minneapolis, MN 55416 | Trustee | Since 2/04 | Chief Executive Officer, Health eSense Inc., 2015 to Present; CEO, Connecticut Innovations, Inc., 2012 to 2015; General Partner, Fairview Capital, L.P., 1994 to 2012 | 35 | reSet Social Enterprise Investment Fund | |||||
| Dickson W. Lewis (1948) 5701 Golden Hills Drive Minneapolis, MN 55416 | Trustee | Since 2/04 | Retired; Vice President/General Manager, Yearbooks & Canada-Lifetouch National School Studios, 2006 to 2014; Vice President/General Manager of Jostens, Inc., 2002 to 2006; Senior Vice President of Fortis Group, 1997 to 2002 | 35 | None | |||||
| Arthur C. Reeds, III (1944) 5701 Golden Hills Drive Minneapolis, MN 55416 | Trustee | Since 10/99 | Retired; Senior Investment Officer, Hartford Foundation for Public Giving, 2000 to 2003; Chairman, Chief Executive and President of Conning Corp., 1999 to 2000 | 35 | Connecticut Water Service, Inc. |
Interested Trustees(3)
| Name, Address, and Year of Birth | Positions Held with Allianz VIP and VIP FOF Trust | Term of Office(2)/Length of Time Served | Principal Occupation(s) During Past 5 Years | Number of Portfolios Overseen for Allianz VIP and VIP FOF Trust | Other AZL Fund Complex | |||||
Brian Muench (1970) 5701 Golden Hills Drive | Trustee | Since 6/11 | President, Allianz Investment Management LLC, November 2010 to present; Vice President, Allianz Life, April 2011 to present | 35 | None |
17
Officers
| Name, Address, and Age | Positions Held with Allianz VIP and VIP FOF Trust | Term of Office(2)/Length of Time Served | Principal Occupation(s) During Past 5 Years | |||
Brian Muench (1970) 5701 Golden Hills Drive | President | Since 11/10 | President, Allianz Investment Management LLC, November 2010 to present; Vice President, Allianz Life, April 2011 to present. | |||
| Michael Radmer (1945) Dorsey & Whitney LLP, Suite 1500 50 South Sixth Street Minneapolis, MN 55402-1498 | Secretary | Since 02/02 | Senior Counsel (previously, Partner), Dorsey and Whitney LLP since 1976. | |||
| Bashir C. Asad (1963) Citi Fund Services Ohio, Inc. 4400 Easton Commons, Suite 200 Columbus, OH 43219 | Treasurer, Principal Accounting Officer and Principal Financial Officer | Since 06/16 | Senior Vice President, Citi Fund Services Ohio, Inc. | |||
| Chris R. Pheiffer (1968) 5701 Golden Hills Drive Minneapolis, MN 55416 | Chief Compliance Officer(4) and Anti-MoneyLaundering Compliance Officer | Since 02/14 | Chief Compliance Officer of the VIP Trust and the FOF Trust, February 2014 to present; Deputy Chief Compliance Officer of the VIP Trust and the FOF Trust and Compliance Director, Allianz Life, February 2007 to February 2014. |
| (1) | Member of the Audit Committee. |
| (2) | Indefinite. |
| (3) | Is an “interested person”, as defined by the 1940 Act, due to employment by Allianz. |
| (4) | The Manager and the Trust are parties to a Chief Compliance Officer Agreement under which the Manager is compensated by the Trust for providing an employee of the Manager or one of its affiliates to act as the Trust’s Chief Compliance Officer. The Chief Compliance Officer and Anti-Money Laundering Compliance Officer is not considered a corporate officer or executive employee of the Trust. |
18
The Allianz VIP Fund of Funds are distributed by Allianz Life Financial Services, LLC. These Funds are not FDIC Insured. | ANNRPT1217 2/18 |
AZL® DFA Multi-Strategy Fund
Annual Report
December 31, 2017
Table of Contents
Management Discussion and Analysis
Page 1
Expense Examples and Portfolio Composition
Page 3
Schedule of Portfolio Investments
Page 4
Statement of Assets and Liabilities
Page 5
Page 5
Statements of Changes in Net Assets
Page 6
Page 7
Notes to the Financial Statements
Page 8
Report of Independent Registered Public Accounting Firm
Page 12
Other Federal Income Tax Information
Page 13
Page 14
Approval of Investment Advisory Agreement
Page 15
Information about the Board of Trustees and Officers
Page 17
This report is submitted for the general information of the shareholder of the Fund. The report is not authorized for distribution to prospective investors in the Fund unless preceded or accompanied by an effective prospectus, which contains details concerning the sales charges and other pertinent information.
AZL® DFA Multi-Strategy Fund Review (Unaudited)
Allianz Investment Management LLC
serves as the Manager for the AZL®
DFA Multi-Strategy Fund.
What factors affected the Fund’s performance during the year ended December 31, 2017?
For the year ended December 31, 2017, the AZL® DFA Multi-Strategy Fund (the “Fund”) returned 12.69%. That compared to a 21.83%, 3.54% and 14.26% total return for its benchmarks, the S&P 500 Index1, the Bloomberg Barclays U.S. Aggregate Bond Index1, and the Multi-Strategy Composite Index1, respectively.
The Fund is a fund of funds that pursues broad diversification across four equity sub-portfolios and one fixed-income sub-portfolio. The five underlying portfolios are managed by Dimensional Fund Advisors. Generally, the Fund allocates 50% to 70% of its assets to the underlying equity funds and between 30% and 50% to the underlying fixed-income fund.*
Global economic expansion led major stock indexes to new all-time highs during the 12-month period under review. The S&P 500 Index gained 21.83% during the period, supported by a positive economic environment marked by solid jobs growth, low unemployment, increased business investment, strong consumer confidence and a low-volatility environment. Mid- and small-cap stocks also performed well during the period: The S&P MidCap 400 Index2 generated a 16.24% return and the SmallCap 600 Index3 returned 13.23%. Growth stocks were also heavily favored during the year and significantly outperformed value stocks.
International developed markets, as measured by the MSCI EAFE Index4, fared even better, and posted a 25.62% return for the period. Emerging markets equities, as measured by the MSCI Emerging Markets Equity Index5, posted an impressive return of 37.75% and thereby ended years of underperformance versus domestic and developed international markets.
The U.S. bond market was generally positive, as the market rewarded investors who took on interest rate and spread risk. The Bloomberg Barclays U.S. Aggregate Bond Index gained 3.54%. Bond investors generally tolerated risk in their quest for more attractive yields. Credit spreads on corporate bonds ended the year tighter than when the year began, with high-yield bond spreads tightening markedly. Meanwhile, the yield curve flattened sharply, as three rate hikes by the Federal Reserve sent short-term yields higher, while investor demand for attractive yield pushed long-term yields lower.
The Fund underperformed its composite benchmark during the period. Its domestic equity holdings were negatively impacted by a bias toward value stocks, which generally underperformed growth stocks. The Fund’s greater-
than-benchmark exposure to small- and mid-cap stocks also detracted from relative results, as those stocks underperformed their large-cap counterparts. The Fund’s exposure to developed and emerging market international equities contributed to returns relative to the composite benchmark, which has no non-U.S. equity exposure.*
Within its fixed-income portfolio, the Fund’s duration exposure was shorter than that of the Bloomberg Barclays U.S. Aggregate Bond Index. That positioning detracted from relative returns as the yield curve flattened during the year. The Fund’s high-credit-quality portfolio also negatively affected performance as spreads tightened during the year, leading to outperformance among lower-rated bonds.*
Past performance does not guarantee future results.
| * | The Fund’s portfolio composition is subject to change. There is no guarantee that any sectors mentioned will continue to perform well or that securities in such sectors will be held by the Fund in the future. The information contained in this commentary is for informational purposes only and should not be construed as a recommendation to purchase or sell securities in the sector mentioned. The Fund’s holdings and weightings are as of December 31, 2017. |
| 1 | For a complete description of the Fund’s performance benchmarks please refer to page 2 of this report. |
| 2 | The Standard & Poor’s MidCap 400 Index (“S&P 400”) is the most widely used index for mid-sized companies. The S&P 400 covers 7% of the U.S. equities market, and is part of a series of S&P U.S. indices that can be used as building blocks for portfolio composition. |
| 3 | The Standard & Poor’s SmallCap 600 Index (“S&P 600”) covers approximately 3% of the domestic equities market. Measuring the small-cap segment of the market that is typically renowned for poor trading liquidity and financial instability, the index is designed to be an efficient portfolio of companies that meet specific inclusion criteria to ensure that they are investable and financially viable. |
| 4 | The Morgan Stanley Capital International, Europe, Australasia and Far East (“MSCI EAFE”) Index is a free float-adjusted market capitalization-weighted index that is designed to measure the equity market performance of developed markets, excluding the U.S. & Canada. |
| 5 | The MSCI Emerging Markets Index (“MSCI EM”) is a free float-adjusted market capitalization index that is designed to measure equity performance of emerging markets. |
| Investors cannot invest directly in an index. |
1
AZL® DFA Multi-Strategy Fund Review (Unaudited)
Fund Objective
The Fund’s investment objective is to seek long-term capital appreciation. This objective may be changed by the Trustees of the Fund without shareholder approval. The Fund seeks to achieve its objective by investing in a combination of DFA Underlying Funds that represent different classes in the Fund’s asset allocation.
Investment Concerns
The Fund invests in underlying funds, so its investment performance is directly related to the performance of those underlying funds. Before investing, investors should assess the risks associated with and types of investments made by of the underlying fund in which the Fund invests.
Emerging market investing may be subject to additional economic, political, liquidity, and currency risks not associated with more developed countries.
International investing may involve risk of capital loss from unfavorable fluctuations in currency values, from differences in generally accepted accounting principles or from economic or political instability in other nations.
Value-based investments are subject to the risk that the broad market may not recognize their intrinsic value.
Small- to mid-capitalization companies typically have a higher risk of failure and historically have experienced a greater degree of volatility.
Debt securities held by the Fund may decline in value due to rising interest rates. Interest rates in the U.S. are at, or near, historic lows, which may increase the Fund’s exposure to risks related to rising rates.
For a complete description of these and other risks associated with investing in a mutual Fund, please refer to the Fund’s prospectus.
Growth of $10,000 Investment
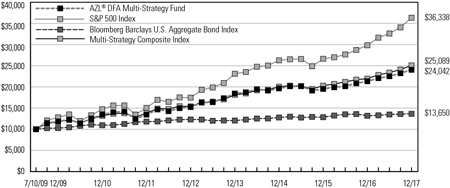
The chart above represents a comparison of a hypothetical investment in the Fund versus a similar investment in the Fund’s benchmark, as well as the two component indices of the Fund’s benchmark, and represents the reinvestment of dividends and capital gains in the Fund.
Average Annual Total Returns as of December 31, 2017
| 1 Year | 3 Year | 5 Year | Since Inception (7/10/09) | |||||||||||||
AZL® DFA Multi-Strategy Fund | 12.69 | % | 6.96 | % | 9.56 | % | 10.90 | % | ||||||||
S&P 500 Index | 21.83 | % | 11.41 | % | 15.79 | % | 16.44 | % | ||||||||
Bloomberg Barclays U.S. Aggregate Bond Index | 3.54 | % | 2.24 | % | 2.10 | % | 3.74 | % | ||||||||
Multi-Strategy Composite Index | 14.26 | % | 7.76 | % | 10.25 | % | 11.46 | % | ||||||||
Past performance does not guarantee future results. The performance data quoted represents past performance and current returns may be lower or higher. The investment return and principal value will fluctuate so that an investor’s shares, when redeemed may be worth more or less than the original cost. To obtain performance information current to the most recent month end, please visit www.Allianzlife.com.
Expense Ratio | Gross | |||
AZL® DFA Multi-Strategy Fund | 0.97 | % | ||
The above expense ratio is based on the current Fund prospectus dated May 1, 2017. The Manager and the Fund have entered into a written contract limiting operating expenses, excluding certain expenses (such as interest expense and acquired fund fees and expenses), to 0.20% through April 30, 2019. Additional information pertaining to the December 31, 2017 expense ratios can be found in the financial highlights.
Acquired fund fees and expenses are incurred indirectly by the Fund through the valuation of the Fund’s investments in the Permitted Underlying Funds. Accordingly, acquired fees and expenses affect the Fund’s total returns. Because these fees and expenses are not included in the Fund’s financial highlights, the Fund’s total annual fund operating expenses, as shown in the current prospectus, do not correlate to the ratios of expenses to average net assets shown in the financial highlights table. Without acquired fund fees and expenses the Fund’s gross expense ratio would be 0.07%.
The total return of the Fund does not reflect the effect of any insurance charges, the annual maintenance fee or the deduction of taxes that a shareholder would pay on Fund distributions or the redemption of Fund shares. Such charges, fees and tax payments would reduce the performance quoted.
The Fund’s performance is measured against the Standard & Poor’s 500 Index (“S&P 500”), the Bloomberg Barclays U.S. Aggregate Bond Index and the Multi-Strategy Composite Index (“Composite”). The S&P 500 is representative of 500 selected common stocks, most of which are listed on the New York Stock Exchange, and is a measure of the U.S. Stock market as a whole. The Bloomberg Barclays U.S. Aggregate Bond Index is a market value-weighted performance benchmark for investment-grade fixed-rate debt issues, including government, corporate, asset-backed, and mortgage-backed securities, with maturities of at least one year. The Composite is a blended index comprised of (60%) S&P 500 and (40%) Bloomberg Barclays U.S. Aggregate Bond Index. These indexes are unmanaged and do not reflect the deduction of fees associated with a mutual fund, such as investment management and fund accounting fees. The Fund’s performance reflects the deduction of fees for services provided to the Fund. Investors cannot invest directly in an index.
2
AZL DFA Multi-Strategy Fund
(Unaudited)
As a shareholder of the AZL DFA Multi-Strategy Fund (the “Fund”), you incur ongoing costs, including management fees, distribution fees, and other Fund expenses. These examples are intended to help you understand your ongoing costs (in dollars) of investing in the Fund and to compare these costs with the ongoing costs of investing in other mutual funds. Please note that the expenses shown in each table do not reflect expenses that apply to the subaccount or the insurance contract. If the expenses that apply to the subaccount of the insurance contract were included, your costs would have been higher.
These examples are based on an investment of $1,000 invested at the beginning of the period and held for the periods presented below.
The Actual Expense table below provides information about actual account values and actual expenses. You may use the information below, together with the amount you invested, to estimate the expenses that you paid over the period. Simply divide your account value by $1,000 (for example, an $8,600 account value divided by $1,000 = 8.6), then multiply the result by the number in the table under the heading entitled “Expenses Paid During Period” to estimate the expenses you paid on your account during this period.
| Beginning Account Value 7/1/17 | Ending Account Value 12/31/17 | Expenses Paid During Period 7/1/17 - 12/31/17* | Annualized Expense Ratio During Period 7/1/17 - 12/31/17 | |||||||||||||||||
AZL DFA Multi-Strategy Fund | $ | 1,000.00 | $ | 1,068.00 | $ | 0.31 | 0.06 | % | ||||||||||||
The Hypothetical Expense table below provides information about hypothetical account values and hypothetical expenses based on the Fund’s actual expense ratio and an assumed rate of return of 5% per year before expenses, which is not the Fund’s actual return. The hypothetical account values and expenses may not be used to estimate the actual ending account balance or expenses you paid for the period. You may use this information to compare this 5% hypothetical example with the 5% hypothetical examples that appear in the shareholder reports of other funds.
| Beginning Account Value 7/1/17 | Ending Account Value 12/31/17 | Expenses Paid During Period 7/1/17 - 12/31/17* | Annualized Expense Ratio During Period 7/1/17 - 12/31/17 | |||||||||||||||||
AZL DFA Multi-Strategy Fund | $ | 1,000.00 | $ | 1,024.90 | $ | 0.31 | 0.06 | % | ||||||||||||
| * | Expenses are equal to the average account value over the period, multiplied by the Fund’s annualized expense ratio, multiplied by 184/365 (to reflect the one half year period). |
Portfolio Composition
(Unaudited)
| Investments | Percent of Net Assets | ||||
Domestic Equities | 48.3 | ||||
Fixed Income | 39.4 | ||||
International Equities | 12.4 | ||||
|
| ||||
Total Investment Securities | 100.1 | ||||
Net other assets (liabilities) | (0.1 | ) | |||
|
| ||||
Net Assets | 100.0 | % | |||
|
| ||||
3
AZL DFA Multi-Strategy Fund
Schedule of Portfolio Investments
December 31, 2017
| Shares | Fair Value | |||||||
| Affiliated Investment Companies (100.1%): | ||||||||
| 5,627,452 | AZL DFA Emerging Markets Core Equity Fund | $ | 63,140,016 | |||||
| 47,292,061 | AZL DFA Five-Year Global Fixed Income Fund | 472,920,612 | ||||||
| 7,609,217 | AZL DFA International Core Equity Fund | 87,201,630 | ||||||
| 35,988,260 | AZL DFA U.S. Core Equity Fund | 459,210,202 | ||||||
| 9,875,596 | AZL DFA U.S. Small Cap Fund | 122,556,147 | ||||||
|
| |||||||
Total Affiliated Investment Companies (Cost $1,063,540,017) | 1,205,028,607 | |||||||
|
| |||||||
Total Investment Securities (Cost $1,063,540,017)(a) — 100.1% | 1,205,028,607 | |||||||
Net other assets (liabilities) — (0.1)% | (832,096 | ) | ||||||
|
| |||||||
Net Assets — 100.0% | $ | 1,204,196,511 | ||||||
|
| |||||||
Percentages indicated are based on net assets as of December 31, 2017.
| (a) | See Federal Tax Information listed in the Notes to the Financial Statements |
See accompanying notes to the financial statements.
4
AZL DFA Multi-Strategy Fund
Statement of Assets and Liabilities
December 31, 2017
Assets: | |||||
Investments in affiliates, at cost | $ | 1,063,540,017 | |||
|
| ||||
Investments in affiliates, at value | $ | 1,205,028,607 | |||
Receivable for affiliated investments sold | 431,698 | ||||
Prepaid expenses | 6,938 | ||||
|
| ||||
Total Assets | 1,205,467,243 | ||||
|
| ||||
Liabilities: | |||||
Cash overdraft | 431,698 | ||||
Payable for capital shares redeemed | 746,620 | ||||
Manager fees payable | 51,207 | ||||
Administration fees payable | 3,977 | ||||
Custodian fees payable | 502 | ||||
Administrative and compliance services fees payable | 2,730 | ||||
Transfer agent fees payable | 755 | ||||
Trustee fees payable | 1,759 | ||||
Other accrued liabilities | 31,484 | ||||
|
| ||||
Total Liabilities | 1,270,732 | ||||
|
| ||||
Net Assets | $ | 1,204,196,511 | |||
|
| ||||
Net Assets Consist of: | |||||
Capital | $ | 1,034,088,872 | |||
Accumulated net investment income/(loss) | 13,032,239 | ||||
Accumulated net realized gains/(losses) from investment transactions | 15,586,810 | ||||
Net unrealized appreciation/(depreciation) on investments | 141,488,590 | ||||
|
| ||||
Net Assets | $ | 1,204,196,511 | |||
|
| ||||
Shares of beneficial interest (unlimited number of shares authorized, no par value) | 84,855,744 | ||||
Net Asset Value (offering and redemption price per share) | $ | 14.19 | |||
|
|
For the Year Ended December 31, 2017
Investment Income: | |||||
Dividends from affiliates | $ | 13,086,689 | |||
Interest | 65 | ||||
Dividends | 108 | ||||
Other income | 2,420 | ||||
|
| ||||
Total Investment Income | 13,089,282 | ||||
|
| ||||
Expenses: | |||||
Manager fees | 601,525 | ||||
Administration fees | 53,867 | ||||
Custodian fees | 2,583 | ||||
Administrative and compliance services fees | 14,308 | ||||
Transfer agent fees | 5,496 | ||||
Trustee fees | 51,029 | ||||
Professional fees | 51,702 | ||||
Shareholder reports | 26,713 | ||||
Other expenses | 15,427 | ||||
|
| ||||
Total expenses | 822,650 | ||||
|
| ||||
Net Investment Income/(Loss) | 12,266,632 | ||||
|
| ||||
Realized and Unrealized Gains/(Losses) on Investments: | |||||
Net realized gains/(losses) on securities transactions from affiliates | 17,323,076 | ||||
Net realized gains distributions from affiliated underlying funds | 2,820,829 | ||||
Change in net unrealized appreciation/depreciation on affiliated transactions | 110,992,500 | ||||
|
| ||||
Net Realized/Unrealized Gains/(Losses) on Investments | 131,136,405 | ||||
|
| ||||
Change in Net Assets Resulting From Operations | $ | 143,403,037 | |||
|
|
See accompanying notes to the financial statements.
5
AZL DFA Multi-Strategy Fund
Statements of Changes in Net Assets
| For the Year Ended December 31, 2017 | For the Year Ended December 31, 2016 | |||||||||
Change In Net Assets: | ||||||||||
Operations: | ||||||||||
Net investment income/(loss) | $ | 12,266,632 | $ | 8,978,919 | ||||||
Net realized gains/(losses) on investment transactions | 20,143,905 | (3,461,098 | ) | |||||||
Change in unrealized appreciation/depreciation on investments | 110,992,500 | 99,815,406 | ||||||||
|
|
|
| |||||||
Change in net assets resulting from operations | 143,403,037 | 105,333,227 | ||||||||
|
|
|
| |||||||
Distributions to Shareholders: | ||||||||||
From net investment income | (9,184,174 | ) | — | |||||||
From net realized gains | — | (423,638,534 | ) | |||||||
|
|
|
| |||||||
Change in net assets resulting from distributions to shareholders | (9,184,174 | ) | (423,638,534 | ) | ||||||
|
|
|
| |||||||
Capital Transactions: | ||||||||||
Proceeds from shares issued | 11,253,458 | 15,533,641 | ||||||||
Proceeds from dividends reinvested | 9,184,174 | 423,638,534 | ||||||||
Value of shares redeemed | (144,629,334 | ) | (184,491,032 | ) | ||||||
|
|
|
| |||||||
Change in net assets resulting from capital transactions | (124,191,702 | ) | 254,681,143 | |||||||
|
|
|
| |||||||
Change in net assets | 10,027,161 | (63,624,164 | ) | |||||||
Net Assets: | ||||||||||
Beginning of period | 1,194,169,350 | 1,257,793,514 | ||||||||
|
|
|
| |||||||
End of period | $ | 1,204,196,511 | $ | 1,194,169,350 | ||||||
|
|
|
| |||||||
Accumulated net investment income/(loss) | $ | 13,032,239 | $ | 9,184,122 | ||||||
|
|
|
| |||||||
Share Transactions: | ||||||||||
Shares issued | 845,577 | 995,074 | ||||||||
Dividends reinvested | 674,811 | 34,696,030 | ||||||||
Shares redeemed | (10,743,935 | ) | (11,189,344 | ) | ||||||
|
|
|
| |||||||
Change in shares | (9,223,547 | ) | 24,501,760 | |||||||
|
|
|
| |||||||
See accompanying notes to the financial statements.
6
AZL DFA Multi-Strategy Fund
(Selected data for a share of beneficial interest outstanding throughout the periods indicated)
| Year Ended December 31, | |||||||||||||||||||||||||
| 2017 | 2016 | 2015 | 2014 | 2013 | |||||||||||||||||||||
Net Asset Value, Beginning of Period | $ | 12.69 | $ | 18.08 | $ | 18.71 | $ | 17.86 | $ | 14.96 | |||||||||||||||
|
|
|
|
|
|
|
|
|
| ||||||||||||||||
Investment Activities: | |||||||||||||||||||||||||
Net Investment Income/(Loss) | 0.15 | 0.10 | 0.01 | 0.20 | 0.16 | ||||||||||||||||||||
Net Realized and Unrealized Gains/(Losses) on Investments | 1.46 | 1.32 | (0.14 | ) | 0.96 | 2.97 | |||||||||||||||||||
|
|
|
|
|
|
|
|
|
| ||||||||||||||||
Total from Investment Activities | 1.61 | 1.42 | (0.13 | ) | 1.16 | 3.13 | |||||||||||||||||||
|
|
|
|
|
|
|
|
|
| ||||||||||||||||
Dividends to Shareholders From: | |||||||||||||||||||||||||
Net Investment Income | (0.11 | ) | — | (0.24 | ) | (0.22 | ) | (0.20 | ) | ||||||||||||||||
Net Realized Gains | — | (6.81 | ) | (0.26 | ) | (0.09 | ) | (0.03 | ) | ||||||||||||||||
|
|
|
|
|
|
|
|
|
| ||||||||||||||||
Total Dividends | (0.11 | ) | (6.81 | ) | (0.50 | ) | (0.31 | ) | (0.23 | ) | |||||||||||||||
|
|
|
|
|
|
|
|
|
| ||||||||||||||||
Net Asset Value, End of Period | $ | 14.19 | $ | 12.69 | $ | 18.08 | $ | 18.71 | $ | 17.86 | |||||||||||||||
|
|
|
|
|
|
|
|
|
| ||||||||||||||||
Total Return(a) | 12.69 | % | 9.32 | % | (0.67 | )% | 6.53 | % | 21.07 | % | |||||||||||||||
Ratios to Average Net Assets/Supplemental Data: | |||||||||||||||||||||||||
Net Assets, End of Period (000’s) | $ | 1,204,197 | $ | 1,194,169 | $ | 1,257,794 | $ | 1,439,548 | $ | 1,347,836 | |||||||||||||||
Net Investment Income/(Loss) | 1.02 | % | 0.75 | % | (0.07 | )% | 1.09 | % | 1.20 | % | |||||||||||||||
Expenses Before Reductions*(b) | 0.07 | % | 0.07 | % | 0.07 | % | 0.07 | % | 0.07 | % | |||||||||||||||
Expenses Net of Reductions* | 0.07 | % | 0.07 | % | 0.07 | % | 0.07 | % | 0.07 | % | |||||||||||||||
Portfolio Turnover Rate | 2 | % | 2 | % | 114 | %(c) | 7 | % | 3 | % | |||||||||||||||
| * | The expense ratios exclude the impact of fees/expenses paid by each underlying fund. |
| (a) | The returns include reinvested dividends and fund level expenses, but exclude insurance contract charges. If these charges were included, the returns would have been lower. |
| (b) | Excludes fee reductions. If such fee reductions had not occurred, the ratios would have been as indicated. |
| (c) | Effective April 27, 2015, the investment strategy of the Fund changed. Costs of purchases and proceeds from sales of portfolio securities associated with the changes in investment strategy contributed to higher portfolio turnover rate for the period ended December 31, 2015 as compared to prior years. |
See accompanying notes to the financial statements.
7
AZL DFA Multi-Strategy Fund
Notes to the Financial Statements
December 31, 2017
1. Organization
The Allianz Variable Insurance Products Fund of Funds Trust (the “Trust”) was organized as a Delaware statutory trust on June 16, 2004. The Trust is a diversified open-end management investment company registered under the Investment Company Act of 1940, as amended, (the “1940 Act”) and thus is determined to be an investment company for accounting purposes. The Trust consists of 12 separate investment portfolios (collectively, the “Funds”), of which one is included in this report, the AZL DFA Multi-Strategy Fund (the “Fund”), and 11 are presented in separate reports.
The Fund is a “fund of funds,” which means that the Fund invests primarily in other mutual funds. Underlying Funds invest in stock, bonds, and other securities and reflect varying amounts of potential investment risk and reward. The Underlying Funds record their investments at fair value. Periodically, the Fund will adjust its asset allocation as it seeks to achieve its investment objective.
The Trust is authorized to issue an unlimited number of shares of the Fund without par value. Shares of the Fund are available through the variable annuity contracts offered through the separate accounts of participating insurance companies. Currently, the Fund only offers its shares to separate accounts of Allianz Life Insurance Company of North America and Allianz Life Insurance Company of New York, affiliates of the Trust and the Manager, as defined below.
Under the Trust’s organizational documents, its officers and trustees are indemnified against certain liabilities arising out of the performance of their duties to the Fund. In addition, in the normal course of business, the Fund may enter into contracts with its vendors and others that provide for general indemnifications. The Fund’s maximum exposure under these arrangements is unknown, as this would involve future claims that may be made against the Fund. However, based on experience, the Fund expects that risk of loss to be remote.
2. Significant Accounting Policies
The following is a summary of significant accounting policies followed by the Fund in the preparation of its financial statements. The policies conform with U.S. generally accepted accounting principles (“U.S. GAAP”). The preparation of financial statements requires management to make certain estimates and assumptions that affect the reported amounts of assets and liabilities and disclosure of contingent assets and liabilities at the date of the financial statements and the reported amounts of increases and decreases in net assets from operations during the reporting period. Actual results could differ from those estimates.
Security Valuation
The Fund records its investments at fair value. Fair value is defined as the price that would be received to sell an asset or paid to transfer a liability in an orderly transaction between willing market participants at the measurement date. The valuation techniques used to determine fair value are further described in Note 4 below.
Investment Transactions and Investment Income
Investment transactions are accounted for on trade date. Net realized gains and losses on investments sold and on foreign currency transactions are recorded on the basis of identified cost. Interest income is recorded on the accrual basis and includes, where applicable, the amortization of premiums or accretion of discounts.
Dividends to Shareholders
Dividends to shareholders are recorded on the ex-dividend date. The Fund distributes its dividends from net investment income and net realized capital gains, if any, on an annual basis. The amount of dividends from net investment income and from net realized gains is determined in accordance with federal income tax regulations, which may differ from U.S. GAAP. These “book/tax” differences are either temporary or permanent in nature. To the extent these differences are permanent in nature (e.g., miscellaneous adjustments on return of capital), such amounts are reclassified within the composition of net assets based on their federal tax-basis treatment; temporary differences (e.g., wash sales) do not require reclassification. Dividends to shareholders that exceed net investment income and net realized gains for tax purposes are reported as distributions of capital.
Expense Allocation
Expenses directly attributable to the Fund are charged directly to the Fund, while expenses attributable to more than one Fund are allocated among the respective Funds based upon relative net assets or some other reasonable method. Expenses which are attributable to more than one Trust are allocated across the Allianz Variable Insurance Products and Allianz Variable Insurance Products Fund of Funds Trusts based upon relative net assets or another reasonable basis. Allianz Investment Management LLC (the “Manager”), serves as the investment manager for the Trust and the Allianz Variable Insurance Products Trust.
3. Fees and Transactions with Affiliates and Other Parties
The Manager provides investment advisory and management services for the Fund. The Manager has contractually agreed to waive fees and reimburse the Fund to limit the annual expenses, excluding interest expense (e.g., cash overdraft fees), taxes, brokerage commissions, acquired fund fees and expenses, other expenditures that are capitalized in accordance with U.S. GAAP and other extraordinary expenses not incurred in the ordinary course of the Fund’s business, based on the daily net assets of the Fund, through April 30, 2019. Expenses incurred for investment advisory and management services are reflected on the Statement of Operations as “Manager fees.”
For the year ended December 31, 2017, the annual rate paid to the Manager and the annual expense limit were as follows:
| Annual Rate | Annual Expense Limit | |||||||||
AZL DFA Multi-Strategy Fund | 0.05 | % | 0.20 | % | ||||||
8
AZL DFA Multi-Strategy Fund
Notes to the Financial Statements
December 31, 2017
Any amounts contractually waived or reimbursed by the Manager in a particular fiscal year will be subject to repayment by the Fund to the Manager to the extent that from time to time through the next three fiscal years the repayment will not cause the Fund’s expenses to exceed the lesser of the stated limit at the time of the waiver or the current stated limit. Any amounts recouped by the Manager during the year are reflected on the Statement of Operations as “Recoupment of prior expenses reimbursed by the Manager.” At December 31, 2017, there were no remaining contractual reimbursements that are subject to repayment by the Fund in subsequent years.
In addition, the Manager may voluntarily waive or reimburse additional fees in order to maintain more competitive expense ratios. Any voluntary waivers or reimbursements are not subject to repayment in subsequent years. Information on the total amount waived/reimbursed by the Manager or repaid to the Manager by the Fund during the period can be found on the Statement of Operations. During the year ended December 31, 2017, there were no voluntary waivers.
The Manager or an affiliate of the Manager serves as the investment adviser of certain underlying funds in which the Fund invests. At December 31, 2017, these underlying funds are noted as Affiliated Investment Companies in the Fund’s Schedule of Portfolio Investments. Additional information, including financial statements, about these Funds is available at www.allianzlife.com. The Manager or an affiliate of the Manager is paid a separate fee from the underlying funds for such services. A summary of the Fund’s investments in affiliated investment companies for the year ended December 31, 2017 is as follows:
| Fair Value 12/31/16 | Purchases at Cost | Proceeds from Sales | Net Realized Gains/(Losses) | Net Change in Unrealized Appreciation/ Depreciation | Fair Value 12/31/17 | Shares as of 12/31/2017 | Dividend Income | Net realized gains distributions from affiliated underlying funds | |||||||||||||||||||||||||||||||||||||
AZL DFA Emerging Markets Core Equity Fund | $ | 55,318,276 | $ | 633,064 | $ | (10,290,736 | ) | $ | 182,092 | $ | 17,297,320 | $ | 63,140,016 | 5,627,452 | $ | 633,063 | $ | 17,611 | |||||||||||||||||||||||||||
AZL DFA Five-Year Global Fixed Income Fund | 462,407,497 | 14,968,787 | (6,378,417 | ) | 48,932 | 1,873,813 | 472,920,612 | 47,292,061 | 5,413,689 | — | |||||||||||||||||||||||||||||||||||
AZL DFA International Core Equity Fund | 82,866,140 | 1,103,436 | (15,613,200 | ) | 718,953 | 18,126,301 | 87,201,630 | 7,609,217 | 1,103,435 | — | |||||||||||||||||||||||||||||||||||
AZL DFA U.S. Core Equity Fund | 462,734,052 | 6,216,076 | (89,543,454 | ) | 13,307,124 | 66,496,404 | 459,210,202 | 35,988,260 | 5,248,892 | 967,187 | |||||||||||||||||||||||||||||||||||
AZL DFA U.S. Small Cap Fund | 130,564,710 | 2,523,641 | (20,796,841 | ) | 3,065,975 | 7,198,662 | 122,556,147 | 9,875,596 | 687,610 | 1,836,031 | |||||||||||||||||||||||||||||||||||
|
|
|
|
|
|
|
|
|
|
|
|
|
|
|
|
|
| ||||||||||||||||||||||||||||
| $ | 1,193,890,675 | $ | 25,445,004 | $ | (142,622,648 | ) | $ | 17,323,076 | $ | 110,992,500 | $ | 1,205,028,607 | 106,392,586 | $ | 13,086,689 | $ | 2,820,829 | ||||||||||||||||||||||||||||
|
|
|
|
|
|
|
|
|
|
|
|
|
|
|
|
|
| ||||||||||||||||||||||||||||
Pursuant to separate agreements between the Funds and the Manager, the Manager provides a Chief Compliance Officer (“CCO”) and certain compliance oversight and regulatory filing services to the Trust. Under these agreements the Manager is entitled to an amount equal to a portion of the compensation and certain other expenses related to the individuals performing the CCO and compliance oversight services, as well as $100 per hour for time incurred in connection with the preparation and filing of certain documents with the Securities and Exchange Commission (“SEC” or the “Commission”). The fees are paid to the Manager on a quarterly basis. The total expenses incurred by the Fund for these services are reflected on the Statement of Operations as “Administrative and compliance services fees.”
Citi Fund Services Ohio, Inc. (“Citi” or the “Administrator”), a wholly owned subsidiary of Citigroup, Inc., with which an officer of the Trust is affiliated, serves as the Trust’s administrator and fund accountant, and assists the Trust in all aspects of its administration and operation. The Administrator is entitled to a fee, accrued daily and paid monthly. The Administrator is entitled to an annual fee for each additional class of shares of any Fund, certain annual fees in supporting fair values services, and a Trust-wide annual fee for providing infrastructure and support in implementing the written policies and procedures comprising the Fund’s compliance program. The Administrator is also reimbursed for certain expenses incurred. The total expenses incurred by the Fund for these services are reflected on the Statement of Operations as “Administration fees.”
FIS Investor Services LLC (“FIS”) serves as the Fund’s transfer agent. Under the Transfer Agent Agreement, the Trust pays FIS a fee for its services and reimburses FIS for all of their reasonable out-of-pocket expenses incurred in providing these services.
The Bank of New York Mellon (“BNY Mellon” or the “Custodian”) serves as the Trust’s custodian and securities lending agent. For these services as custodian, the Funds pay BNY Mellon a fee based on a percentage of assets held on behalf of the Funds, plus certain out-of-pocket charges.
Allianz Life Financial Services, LLC (“ALFS”), an affiliate of the Manager, serves as distributor of the Fund. ALFS receives an annual Trust-wide annual fee of $7,500, paid by the Manager from its profits and not by the Trust, for recordkeeping and reporting services.
In addition, certain legal fees and expenses are paid to a law firm, Dorsey & Whitney LLP, of which the Secretary of the Fund is Senior Counsel. During the year ended December 31, 2017, $12,381 was paid from the Fund relating to these fees and expenses.
Certain Officers and Trustees of the Trust are affiliated with the Manager or the Administrator. Such Officers (except for the Trust’s CCO as noted above) and Trustees receive no compensation from the Trust for serving in their respective roles. For their service to the Trust and to the Allianz Variable Insurance Products Trust, each non-interested Trustee receives a $170,000 annual Board retainer, the Lead Director receives an additional $42,500 annually and the Chair of the Nominating and Corporate Governance Committee receives an additional $25,000 annually. In addition, the Trustees are reimbursed for certain expenses associated with attending Board meetings. Compensation to the Trustees is allocated between the Trust and the Allianz Variable Insurance Products Fund of Funds Trust in proportion to the assets under management of each trust. During the year ended December 31, 2017, actual Trustee compensation was $1,116,333 in total for both trusts.
4. Investment Valuation Summary
The valuation techniques employed by the Fund, as described below, maximize the use of observable inputs and minimize the use of unobservable inputs in determining fair value. The inputs used for valuing the Fund’s investments are summarized in the three broad levels listed below:
| ● | Level 1 — quoted prices in active markets for identical assets |
| ● | Level 2 — other significant observable inputs (including quoted prices for similar securities, interest rates, prepayments speeds, credit risk, etc.) |
| ● | Level 3 — significant unobservable inputs (including the Fund’s own assumptions in determining the fair value of investments) |
9
AZL DFA Multi-Strategy Fund
Notes to the Financial Statements
December 31, 2017
Changes in valuation techniques may result in transfers in or out of an assigned level within the disclosure hierarchy. The Fund determines transfers between fair value hierarchy levels at the reporting period end. The inputs or methodology used for valuing investments is not necessarily an indication of the risk associated with investing in those investments.
Investments in other investment companies are valued at their published net asset value (“NAV”). Security prices are generally provided by an independent third party pricing service approved by the Trust’s Board of Trustees (the “Board” or “Trustees”) as of the close of the New York Stock Exchange (“NYSE”) (generally 4:00 pm Eastern Time). The investments utilizing Level 1 valuations represent investments in open-end investment companies. Futures contracts are valued at the last sales price as of the close of the primary exchange and are typically categorized as Level 1 in the fair value hierarchy.
For the year ended December 31, 2017, there were no Level 3 investments for which significant unobservable inputs were used to determine fair value. There were no significant transfers between Levels 1 and 2 as of December 31, 2017, based on levels assigned to securities on December 31, 2016.
The following is a summary of the valuation inputs used as of December 31, 2017 in valuing the Fund’s investments based upon the three levels defined above:
| Investment Securities: | Level 1 | Level 2 | Level 3 | Total | ||||||||||||||||
Affiliated Investment Companies | $ | 1,205,028,607 | $ | — | $ | — | $ | 1,205,028,607 | ||||||||||||
|
|
|
|
|
|
|
| |||||||||||||
Total Investment Securities | $ | 1,205,028,607 | $ | — | $ | — | $ | 1,205,028,607 | ||||||||||||
|
|
|
|
|
|
|
| |||||||||||||
5. Security Purchases and Sales
For the year ended December 31, 2017, cost of purchases and proceeds from sales of securities (excluding securities maturing less than one year from acquisition) were as follows:
| Purchases | Sales | |||||||||
AZL DFA Multi-Strategy Fund | $ | 25,445,004 | $ | 142,622,648 | ||||||
6. Investment Risks
Derivatives Risk: The Fund may invest directly or through affiliated or unaffiliated mutual funds or unregistered investment pools in derivative instruments such as futures, options, and options on futures. A derivative is a financial contract whose value depends on, or is derived from, the value of an underlying asset, reference rate, or risk. Use of derivative instruments involves risks different from, or possibly greater than, the risks associated with investing directly in securities and other traditional investments. Derivatives are subject to a number of other risks, such as liquidity risk, interest rate risk, market risk, credit risk, and selection risk. Derivatives also involve the risk of mispricing or improper valuation and the risk that changes in the value may not correlate perfectly with the underlying asset, rate, or index. Using derivatives may result in losses, possibly in excess of the principal amount invested. Also, suitable derivative transactions may not be available in all circumstances. The other party to a derivatives contract could default.
Fund of Funds Risk: The Fund, as a shareholder of the underlying funds, indirectly bears its proportionate share of any investment management fees and other expenses of the underlying funds. Further due to the fees and expenses paid by the Fund, as well as small variations in the Fund’s actual allocations to the underlying funds and any futures and cash held in the Fund’s portfolio, the performance and income distributions of the Fund will not be the same as the performance and income distributions of the underlying funds.
7. Federal Tax Information
It is the policy of the Fund to continue to qualify as a regulated investment company by complying with the provisions available to certain investment companies, as defined under Subchapter M of the Internal Revenue Code, and to make distributions of net investment income and net realized gains sufficient to relieve it from all, or substantially all, federal income taxes. Accordingly, no provisions for federal income taxes are required in the financial statements.
Management of the Fund has reviewed tax positions taken in tax years that remain subject to examination by all major tax jurisdictions, including federal (i.e., the last four tax year ends and the interim tax period since then, as applicable). Management believes that there is no tax liability resulting from unrecognized tax benefits related to uncertain tax positions taken.
Cost of securities, including derivatives and short positions as applicable, for federal income tax purposes at December 31, 2017 is $1,063,908,341. The gross unrealized appreciation/(depreciation) on a tax basis is as follows:
Unrealized appreciation | $ | 141,186,814 | ||
Unrealized (depreciation) | (66,548 | ) | ||
|
| |||
Net unrealized appreciation/(depreciation) | $ | 141,120,266 | ||
|
|
CLCFs subject to expiration are applied as short-term capital loss regardless of whether the originating capital loss was short-term or long-term. CLCFs that are not subject to expiration must be utilized before those that are subject to expiration. The Board does not intend to authorize a distribution of any realized gain for the Fund until any applicable CLCF has been offset or expires.
During the year ended December 31, 2017, the Fund utilized $3,423,112 in CLCFs to offset capital gains.
The tax character of dividends paid to shareholders during the year ended December 31, 2017 were as follows:
| Ordinary Income | Net Long-Term | Total Distributions(a) | |||||||||||||
AZL DFA Multi-Strategy Fund | $ | 9,184,174 | $ | — | $ | 9,184,174 | |||||||||
| (a) | Total distributions paid may differ from the Statements of Changes in Net Assets because dividends are recognized when actually paid for tax purposes. |
10
AZL DFA Multi-Strategy Fund
Notes to the Financial Statements
December 31, 2017
The tax character of dividends paid to shareholders during the year ended December 31, 2016 were as follows:
| Ordinary Income | Net Capital Gains | Total Distributions(a) | |||||||||||||
AZL DFA Multi-Strategy Fund | $ | 2,499,782 | $ | 421,138,752 | $ | 423,638,534 | |||||||||
| (a) | Total distributions paid may differ from the Statements of Changes in Net Assets because dividends are recognized when actually paid for tax purposes. |
At December 31, 2017, the components of accumulated earnings on a tax basis were as follows:
| Undistributed Ordinary Income | Undistributed Long-Term Capital Gains | Accumulated Capital and Other Losses | Unrealized Appreciation/ Depreciation(a) | Total Accumulated Earnings/ (Deficit) | |||||||||||||||||||||
AZL DFA Multi-Strategy Fund | $ | 13,032,239 | $ | 15,955,134 | $ | — | $ | 141,120,266 | $ | 170,107,639 | |||||||||||||||
| (a) | The difference between book-basis and tax-basis unrealized appreciation/depreciation is attributable primarily to tax deferral of losses on wash sales. |
8. Ownership and Principal Holders
The beneficial ownership, either directly or indirectly, of more than 25% of the voting securities of a fund creates presumptions of control of the fund, under section 2 (a)(9) of the 1940 Act. As of December 31, 2017, the Fund had an individual shareholder account which is affiliated with the Investment Adviser representing ownership in excess of 90% of the Fund. As of December 31, 2017, the fund had a controlling interest (in excess of 50%) in the AZL DFA Emerging Markets Core Equity Fund, the AZL DFA Five-Year Global Fixed Income Fund, AZL DFA U.S. Core Equity Fund, and the AZL DFA U.S. Small Cap Fund, which are affiliated with the Investment Adviser.
9. Investment Company Reporting Modernization
In October 2016, the SEC released its Final Rule on Investment Company Reporting Modernization (the “Rules”). The Rules which introduce two new regulatory reporting forms for investment companies — Form N-PORT and Form N-CEN — also contain amendments to Regulation S-X which require standardized, enhanced disclosures about derivatives in investment company financial statements, as well as other amendments. The amendments to Regulation S-X became effective for filings made with the SEC after August 1, 2017. The compliance date for form N-PORT and Form N-CEN will vary based on the reporting entity’s size and, in the case of the Fund, is expected to be April 30, 2019. The Fund’s adoption of these amendments, as applicable for the financial statements prepared as of December 31, 2017, had no effect on the Fund’s net assets or results of operations.
10. Subsequent Events
Management of the Fund has evaluated the need for additional disclosures or adjustments resulting from events through the date the financial statements were issued. Based on this evaluation, there were no subsequent events to report that would have material impact on the Fund’s financial statements.
11
REPORT OF INDEPENDENT REGISTERED PUBLIC ACCOUNTING FIRM
To the Shareholders and Board of Trustees of
Allianz Variable Insurance Products Fund of Funds Trust:
Opinion on the Financial Statements
We have audited the accompanying statement of assets and liabilities of AZL DFA Multi-Strategy Fund (the “Fund”) of the Allianz Variable Insurance Products Fund of Funds Trust, including the schedule of portfolio investments, as of December 31, 2017, and the related statement of operations for the year then ended, the statements of changes in net assets for each of the years in the two-year period then ended, and the related notes (collectively, the “financial statements”) and the financial highlights for each of the years in the five-year period then ended. In our opinion, the financial statements present fairly, in all material respects, the financial position of the Fund as of December 31, 2017, the results of its operations for the year then ended, the changes in its net assets for each of the years in the two-year period then ended and the financial highlights for each of the years in the five-year period then ended, in conformity with U.S. generally accepted accounting principles.
Basis for Opinion
These financial statements and financial highlights are the responsibility of the Fund’s management. Our responsibility is to express an opinion on these financial statements and financial highlights based on our audits. We are a public accounting firm registered with the Public Company Accounting Oversight Board (United States) (“PCAOB”) and are required to be independent with respect to the Fund in accordance with the U.S. federal securities laws and the applicable rules and regulations of the Securities and Exchange Commission and the PCAOB.
We conducted our audits in accordance with the standards of the PCAOB. Those standards require that we plan and perform the audit to obtain reasonable assurance about whether the financial statements and financial highlights are free of material misstatement, whether due to error or fraud. Our audits included performing procedures to assess the risks of material misstatement of the financial statements and financial highlights, whether due to error or fraud, and performing procedures that respond to those risks. Such procedures included examining, on a test basis, evidence regarding the amounts and disclosures in the financial statements and financial highlights. Such procedures also included confirmation of securities owned as of December 31, 2017, by correspondence with the transfer agents of the underlying funds. Our audits also included evaluating the accounting principles used and significant estimates made by management, as well as evaluating the overall presentation of the financial statements and financial highlights. We believe that our audits provide a reasonable basis for our opinion.
/s/ KPMG LLP
We have served as the auditor of one or more Allianz Variable Insurance Products investment companies since 1999.
Columbus, Ohio
February 23, 2018
12
Other Federal Income Tax Information (Unaudited)
For the year ended December 31, 2017, 53.72% of the total ordinary income dividends paid by the Fund qualify for the corporate dividends received deduction available to corporate shareholders.
13
A description of the policies and procedures that the Fund uses to determine how to vote proxies relating to portfolio securities is available, without charge, upon request, by visiting the Securities and Exchange Commission’s (“Commission”) website at www.sec.gov, or by calling 800-624-0197.
Information regarding how the Fund voted proxies relating to portfolio securities during the most recent 12-month period ended June 30th is available (i) without charge, upon request, by calling 800-624-0197; (ii) on the Allianz Variable Insurance Products Fund of Funds Trust’s website at https://www.allianzlife.com; and (iii) on the Commission’s website at http://www.sec.gov.
The Fund files complete Schedules of Portfolio Holdings with the Commission for the first and third quarters of each fiscal year on Form N-Q. Schedules of Portfolio Holdings for the Fund in this report are available without charge on the Commission’s website at http://www.sec.gov, or may be reviewed and copied at the Commission’s Public Reference Room in Washington, D.C. Information on the operation of the Public Reference Room may be obtained by calling 800-SEC-0330.
14
Approval of Investment Advisory Agreement (Unaudited)
Subject to the general supervision of the Board of Trustees (the “Board”) and in accordance with the investment objectives and restrictions of each separate series (together, the “Funds”) of the Allianz Variable Insurance Products Fund of Funds Trust (the “Trust”), investment advisory services are provided to the Funds by Allianz Investment Management LLC (the “Manager”). As used in this section, “Fund” refers to any of the Funds. The Manager manages each Fund pursuant to an investment management agreement (the “Management Agreement”) with the Trust in respect of each such Fund. The Management Agreement provides that the Manager, subject to the supervision and approval of the Board, is responsible for the management of each Fund. For management services, each Fund pays the Manager an investment advisory fee based upon each Fund’s average daily net assets. The Manager has contractually agreed to limit the expenses of each Fund by reimbursing the Fund if and when total Fund operating expenses exceed certain amounts until at least May 1, 2019 (the “Expense Limitation Agreement”).
In reviewing the services provided by the Manager and the terms of the Management Agreement, the Board receives and reviews information related to the Manager’s experience and expertise in the variable insurance marketplace. Currently, the Funds are offered only through variable annuities and variable life insurance policies, and not in the retail fund market. In addition, the Board receives information regarding the Manager’s expertise with regard to portfolio diversification and asset allocation requirements within variable insurance products issued by Allianz Life Insurance Company of North America (“Allianz Life”) and its subsidiary, Allianz Life Insurance Company of New York (“Allianz of New York”). Currently, the Funds are offered only through Allianz Life and Allianz of New York variable products.
As required by the Investment Company Act of 1940 (the “1940 Act”), the Board has reviewed and approved the Management Agreement with the Manager. The Board’s decision to approve this contract reflects the exercise of its business judgment on whether to approve new arrangements and continue the existing arrangements. During its review of the contract, the Board considered many factors, among the most material of which are: the Fund’s investment objectives and long-term performance; the Manager’s management philosophy, personnel, processes and investment performance, including its compliance history and the adequacy of its compliance processes; the preferences and expectations of Fund shareholders (and underlying contract owners) and their relative sophistication; the continuing state of competition in the mutual fund industry; and comparable fees in the mutual fund industry.
The Board also considered the compensation and benefits received by the Manager. This includes fees received for services provided to a Fund by employees of the Manager or of affiliates of the Manager and research services received by the Manager from brokers that execute Fund trades, as well as advisory fees. The Board considered the fact that: (1) the Manager and the Trust are parties to an Administrative Services Agreement and a Compliance Services Agreement, under which the Manager is compensated by the Trust for performing certain administrative and compliance services including providing an employee of the Manager or one of its affiliates to act as the Trust’s Chief Compliance Officer; and (2) Allianz Life Financial Services, LLC, an affiliated person of the Manager, is a registered securities broker-dealer and received (along with its affiliated persons) payments made by the underlying funds pursuant to Rule 12b-1.
The Board is aware that various courts have interpreted provisions of the 1940 Act and have indicated in their decisions that the following factors may be relevant to an adviser’s compensation: the nature and quality of the services provided by the adviser, including the performance of the fund; the adviser’s cost of providing the services; the extent to which the adviser may realize “economies of scale” as the fund grows larger; any indirect benefits that may accrue to the adviser and its affiliates as a result of the adviser’s relationship with the fund; performance and expenses of comparable funds; the profitability of acting as adviser to the fund; and the extent to which the independent Board members, who are not “interested persons” of a fund as defined by the 1940 Act, are fully informed about all facts bearing on the adviser’s services and fees. The Board is aware of these factors and takes them into account in its review of the Management Agreement for the Funds.
The Board considered and weighed these circumstances in light of its experience in governing the Trust, and is assisted in its deliberations by the advice of independent legal counsel to the independent Trustees. In this regard, the Board requests and receives a significant amount of information about the Funds and the Manager. Some of this information is provided at each regular meeting of the Board; additional information is provided in connection with the particular meeting or meetings at which the Board’s formal review of an advisory contract occurs. In between regularly scheduled meetings, the Board may receive information on particular matters as the need arises. Thus, the Board’s evaluation of the Management Agreement is informed by reports covering such matters as: the Manager’s investment philosophy, personnel and processes, and the Fund’s investment performance (in absolute terms as well as in relationship to its benchmark). In connection with comparing the performance of each Fund versus its benchmark, the Board receives reports on the extent to which the Fund’s performance may be attributed to various applicable factors, such as asset class allocation decisions and volatility management strategies, the performance of the underlying funds, rebalancing decisions, and the impact of cash positions and Fund fees and expenses. The Board also receives reports on the Funds’ expenses (including the advisory fee itself and the overall expense structure of the Funds, both in absolute terms and relative to similar and/or competing funds, with due regard for the Expense Limitation Agreement and additional voluntary expense limitations); the nature and extent of the advisory and other services provided to the Fund by the Manager and its affiliates; compliance and audit reports concerning the Funds and the companies that service them; and relevant developments in the mutual fund industry and how the Funds and/or the Manager are responding to them.
The Board also receives financial information about the Manager, including reports on the compensation and benefits the Manager derives from its relationships with the Funds. These reports cover not only the fees under the Management Agreement, but also fees, if any, received for providing other services to the Funds. The reports also discuss any indirect or “fall out” benefits the Manager or its affiliates may derive from its relationship with the Funds.
The Management Agreement was most recently considered at Board meetings held in the fall of 2017. Information relevant to the approval of the Management Agreement was considered at a telephonic Board meeting on October 18, 2017, and at an “in person” Board meeting held October 23, 2017. The Management Agreement was approved at the Board meeting of October 23, 2017. At such meeting the Board also approved the Expense Limitation Agreement between the Manager and the Trust for the period ending April 30, 2019. In connection with such meetings, the Trustees requested and evaluated extensive materials from the Manager, including performance and expense information for other investment companies with similar investment objectives derived from data compiled by an independent third party provider and other sources believed to be reliable by the Manager. Prior to voting, the Trustees reviewed the proposed approval/continuance of the Agreement with management and with experienced counsel who are independent of the Manager and received a memorandum from such counsel discussing the legal standards for their consideration of the proposed approvals/continuances. The independent Trustees also discussed the proposed approvals/continuances in a private session with such counsel at which no representatives of the Manager were present. In reaching their determinations relating to the approval and/or continuance of the Agreement, in respect of each Fund, the Board considered all factors it believed relevant. The Board based its decision to approve the Management Agreement on the totality of the circumstances and relevant factors, and with a view to past and future long-term considerations. Not all of the factors and considerations discussed above and below are necessarily relevant to every Fund, and the Board did not assign relative weights to factors discussed herein or deem any one or group of them to be controlling in and of themselves.
An SEC rule requires that shareholder reports include a discussion of certain factors relating to the selection of the investment adviser and the approval of the advisory fee. The “factors” enumerated by the SEC are set forth below in italics, as well as the Board’s conclusions regarding such factors:
(1) The nature, extent and quality of services provided by the Manager. The Trustees noted that the Manager, subject to the control of the Board, administers each Fund’s business and other affairs. The Trustees noted that the Manager also provides the Trust and each Fund with such administrative and other services (exclusive of, and in addition to, any such services provided by any others retained by the Trust on behalf of the Funds) and executive and other personnel as are necessary for the operation of the Trust and the Funds. Except for the Trust’s Chief Compliance Officer and certain compliance staff, the Manager pays all of the compensation of Trustees and officers of the Trust who are employees of the Manager or its affiliates.
15
The Board considered the scope and quality of services provided by the Manager and noted that the scope of such services provided had expanded as a result of recent regulatory and other developments. The Board noted that, for example, the Manager is responsible for maintaining and monitoring its own compliance program, and this compliance program has been continuously refined and enhanced in light of new regulatory requirements. The Board considered the capabilities and resources which the Manager has dedicated to performing services on behalf of the Trust and its Funds. The quality of administrative and other services, including the Manager’s role in coordinating the activities of the Trust’s other service providers, also were considered. The Board concluded that, overall, they were satisfied with the nature, extent and quality of services provided (and expected to be provided) to the Trust and to each of the Funds under the Management Agreement.
(2) The investment performance of the Funds and the Manager. In connection with every in-person quarterly Board meeting and the fall 2017 contract review process, Trustees received extensive information on the performance results of each Fund. This included, for example, performance information on absolute total return, performance versus the appropriate benchmark(s), the contribution to performance of the Manager’s asset class allocation decisions and volatility management strategies, the performance of the underlying funds, and the impact on performance of rebalancing decisions, cash and Fund fees. This included Lipper performance information on the Funds for the previous quarter, year-to-date, and previous one-, three- and five-year periods, to the extent the Funds were in existence for such periods. (For Funds which have been in existence for less than five years, the Board received performance information on shorter time periods to the extent available.) For example, in connection with the Board meeting held October 23, 2017, the Manager reported that for the five Funds for which performance information for the five year period ended June 30, 2017 was available, two were in the top 40%, two were in the middle 20%, and one was in the bottom 40%. None of these Funds was in the bottom 40% for the three- or one-year periods. The Manager reported that for the three-year period ended June 30, 2017, for the six Funds for which three year performance information was available, four Funds were in the top 40% and two Funds were in the middle 20%. For the eight Funds for which one-year performance information was available, for the one-year period ended June 30, 2017, four Funds were in the top 40%, two Funds were in the middle 20%, and two Funds were in the bottom 40%.
At the Board meeting held October 23, 2017, the Manager also reported upon the performance of the MVP Funds compared to custom managed-volatility peer groups. For the seven Funds for which three-year performance information was available, for the three-year period ended June 30, 2017, five Funds were in the top 40%, one Fund was in the middle 20%, and one was in the bottom 40%. For the eight Funds for which one year performance was available, for the one-year period ended June 30, 2017, four Funds were in the top 40% and four Funds were in the middle 20%. All six Funds for which five-year performance information was available were in the top 40%.
At the Board meeting held October 23, 2017, the Trustees determined that the investment performance of the Funds was acceptable.
(3) The costs of services to be provided and profits to be realized by the Manager and its affiliates from the relationship with the Funds. The Board considered that the Manager receives an advisory fee from each of the Funds. The Manager reported that for the three MVP Fusion Dynamic Funds the advisory fee paid put these Funds in the 44th percentile of the customized peer group. The Manager reported that for three MVP Index Strategy Funds the advisory fee paid put them in the 27th percentile of the customized peer group, and for the two non-MVP Index Strategy Funds, as well as the AZL DFA Multi-Strategy Fund, the advisory fee paid put them in the 13th percentile of the customized peer group. The Manager reported that for the AZL MVP BlackRock Global Strategy Plus, AZL MVP DFA Multi-Strategy, AZL MVP Pyramis Multi-Strategy, and AZL MVP T. Rowe Price Capital Appreciation Plus Funds, the advisory fee paid was in the 9th percentile. (A lower percentile reflects lower fund fees and is better for fund shareholders.) Trustees were provided with information on the total expense ratios of the Funds and other funds in the customized peer groups, and the Manager reported upon the challenges in making peer group comparisons for the Funds.
The Manager provided information concerning the profitability of the Manager’s investment advisory activities for the period from 2014 through June 30, 2017. The Board recognized that it is difficult to make comparisons of profitability from investment company advisory agreements because comparative information is not generally publicly available and is affected by numerous factors, including the structure of the particular adviser, the types of funds it manages, its business mix, numerous assumptions regarding allocation of expenses and the adviser’s capital structure and cost of capital. In considering profitability information, the Board considered the possible effect of certain fall-out benefits to the Manager and its affiliates. The Board focused on profitability of the Manager’s relationships with the Funds before taxes and distribution expenses. The Board recognized that the Manager should earn a reasonable level of profits for the services it provides to each Fund.
The Board also considered that Wilshire Funds Management (“Wilshire”) serves as a consultant to the Manager in preparing statistical and other factual information for use in the creation and maintenance of the asset allocation models for the Fusion Funds (the AZL MVP Fusion Dynamic Conservative, Balanced, and Moderate Funds), pursuant to an agreement between the Manager and Wilshire. Wilshire serves as a consultant to the Manager with respect to selecting the Fusion Funds’ underlying funds and the asset allocations among the underlying funds. The Manager, not any Fund, pays a consultant fee to Wilshire.
Based upon the information provided, the Board concluded that the Funds’ advisory fees and expense ratios are not unreasonable, and determined that there was no evidence that the Manager’s level of profitability from its relationship with the Funds was excessive.
(4) and (5) The extent to which economies of scale would be realized as the Funds grow, and whether fee levels reflect these economies of scale. The Board noted that the advisory fee schedules for the Funds do not contain breakpoints that reduce the fee rate on assets above specified levels. The Board recognized that breakpoints may be an appropriate way for the Manager to share its economies of scale, if any, with Funds that have substantial assets. The Board found there was no uniform methodology for establishing breakpoints that give effect to Fund-specific services provided by the Manager. The Board noted that in the fund industry as a whole, as well as among funds similar to the Funds, there is no uniformity or pattern in the fees and asset levels at which breakpoints (if any) apply. Depending on the age, size, and other characteristics of a particular fund and its manager’s cost structure, different conclusions can be drawn as to whether there are economies of scale to be realized at any particular level of assets, notwithstanding the intuitive conclusion that such economies exist, or will be realized at some level of total assets. Moreover, because different managers have different cost structures and service models, it is difficult to draw meaningful conclusions from the breakpoints that may have been adopted by other funds. The Board also noted that the advisory agreements for many funds do not have breakpoints at all, or if breakpoints exist, they may be at asset levels significantly greater than those of the individual Funds. The Board also noted that the total assets in all of the Funds, as of June 30, 2017, were approximately $10.8 billion and that the largest Fund, the AZL MVP Growth Index Strategy Fund, had assets of approximately $2.4 billion.
The Board noted that the Manager has agreed to temporarily limit Fund expenses under the Expense Limitation Agreement, which has the effect of reducing expenses as would the implementation of advisory fee breakpoints. The Manager has committed to continue to consider the continuation of expense limits and/or advisory fee breakpoints as the Funds grow larger. The Board receives quarterly reports on the level of Fund assets. The Board expects to continue to consider: (a) the extent to which economies of scale have been realized, and (b) whether the advisory fee should be modified, either in connection with the next renewal of the Agreements or by modifying the Expense Limitation Agreement, to reflect such economies of scale, if any.
Having taken these factors into account, the Board concluded that the absence of breakpoints in the Funds’ advisory fee rate schedules was acceptable under each Fund’s circumstances.
16
Information about the Board of Trustees and Officers (Unaudited)
The Trust is managed by the Trustees in accordance with the laws of the state of Delaware governing business trusts. There are currently eight Trustees, one of whom is an “interested person” of the Trust within the meaning of that term under the 1940 Act. The Trustees and Officers of the Trust, and their addresses, ages, positions held with the Trust, terms of office with the Trust and length of time served, principal occupation(s) during the past five years, the number of portfolios in the Trust they oversee, and other directorships held during the past five years are as follows:
Non-Interested Trustees(1)
| Name, Address, and Year of Birth | Positions Held with Allianz VIP and VIP FOF Trust | Term of Office(2)/Length of Time Served | Principal Occupation(s) During Past 5 Years | Number of Portfolios Overseen for Allianz VIP and VIP FOF Trust | Other AZL Fund Complex | |||||
| Peter R. Burnim (1947) 5701 Golden Hills Drive Minneapolis, MN 55416 | Trustee | Since 2/07 | Consultant/Chair, various companies: Chairman, Emrys Analytics and subsidiaries, July 2015 to present; Chairman, Argus Investment Strategies Fund Ltd., February 2013 to 2017; Managing Director, iQ Venture Advisors, LLC, 2005 to present; Chairman, Northstar Group Holdings Ltd. Bermuda, 2011 to present; Chairman Sterling Bank & Trust (Bahamas) Ltd., 2016 to present, and Expert Witness, Massachusetts Department of Revenue, 2011 to 2016. | 35 | Argus Group Holdings and Subsidiaries; Northstar Group Holdings; Sterling Trust (Cayman) Ltd.; Sterling Bank & Trust Limited (Bahamas); Emrys Analytics; EGB Insurance. | |||||
| Peggy L. Ettestad (1957) 5701 Golden Hills Drive Minneapolis, MN 55416 | Lead Independent Trustee | Since 10/14 (Trustee since 2/07) | Managing Director, Red Canoe Management Consulting LLC, 2008 to present | 35 | Luther College | |||||
| Tamara Lynn Fagely (1958) 5701 Golden Hills Drive Minneapolis, MN 55416 | Trustee | Since 12/17 | Retired; Chief Operations Officer, Hartford Funds, March 2012 to December 2013 | 35 | Diamond Hill Funds (13 funds) | |||||
| Richard H. Forde (1953) 5701 Golden Hills Drive Minneapolis, MN 55416 | Trustee | Since 12/17 | Member of the Board and Chairman of the Finance and Investment Committee, Connecticut Water Service, Inc., October 2013 to present; Senior Vice President and Chief Investment Officer, CIGNA, 2004 to 2012 | 35 | Connecticut Water Service, Inc. | |||||
| Claire R. Leonardi (1955) 5701 Golden Hills Drive Minneapolis, MN 55416 | Trustee | Since 2/04 | Chief Executive Officer, Health eSense Inc., 2015 to Present; CEO, Connecticut Innovations, Inc., 2012 to 2015; General Partner, Fairview Capital, L.P., 1994 to 2012 | 35 | reSet Social Enterprise Investment Fund | |||||
| Dickson W. Lewis (1948) 5701 Golden Hills Drive Minneapolis, MN 55416 | Trustee | Since 2/04 | Retired; Vice President/General Manager, Yearbooks & Canada-Lifetouch National School Studios, 2006 to 2014; Vice President/General Manager of Jostens, Inc., 2002 to 2006; Senior Vice President of Fortis Group, 1997 to 2002 | 35 | None | |||||
| Arthur C. Reeds, III (1944) 5701 Golden Hills Drive Minneapolis, MN 55416 | Trustee | Since 10/99 | Retired; Senior Investment Officer, Hartford Foundation for Public Giving, 2000 to 2003; Chairman, Chief Executive and President of Conning Corp., 1999 to 2000 | 35 | Connecticut Water Service, Inc. |
Interested Trustees(3)
| Name, Address, and Year of Birth | Positions Held with Allianz VIP and VIP FOF Trust | Term of Office(2)/Length of Time Served | Principal Occupation(s) During Past 5 Years | Number of Portfolios Overseen for Allianz VIP and VIP FOF Trust | Other AZL Fund Complex | |||||
Brian Muench (1970) 5701 Golden Hills Drive | Trustee | Since 6/11 | President, Allianz Investment Management LLC, November 2010 to present; Vice President, Allianz Life, April 2011 to present | 35 | None |
17
Officers
| Name, Address, and Age | Positions Held with Allianz VIP and VIP FOF Trust | Term of Office(2)/Length of Time Served | Principal Occupation(s) During Past 5 Years | |||
Brian Muench (1970) 5701 Golden Hills Drive | President | Since 11/10 | President, Allianz Investment Management LLC, November 2010 to present; Vice President, Allianz Life, April 2011 to present. | |||
| Michael Radmer (1945) Dorsey & Whitney LLP, Suite 1500 50 South Sixth Street Minneapolis, MN 55402-1498 | Secretary | Since 02/02 | Senior Counsel (previously, Partner), Dorsey and Whitney LLP since 1976. | |||
| Bashir C. Asad (1963) Citi Fund Services Ohio, Inc . 4400 Easton Commons, Suite 200 Columbus, OH 43219 | Treasurer, Principal Accounting Officer and Principal Financial Officer | Since 06/16 | Senior Vice President, Citi Fund Services Ohio, Inc. | |||
| Chris R. Pheiffer (1968) 5701 Golden Hills Drive Minneapolis, MN 55416 | Chief Compliance Officer(4) and Anti-MoneyLaundering Compliance Officer | Since 02/14 | Chief Compliance Officer of the VIP Trust and the FOF Trust, February 2014 to present; Deputy Chief Compliance Officer of the VIP Trust and the FOF Trust and Compliance Director, Allianz Life, February 2007 to February 2014. |
| (1) | Member of the Audit Committee. |
| (2) | Indefinite. |
| (3) | Is an “interested person”, as defined by the 1940 Act, due to employment by Allianz. |
| (4) | The Manager and the Trust are parties to a Chief Compliance Officer Agreement under which the Manager is compensated by the Trust for providing an employee of the Manager or one of its affiliates to act as the Trust’s Chief Compliance Officer. The Chief Compliance Officer and Anti-Money Laundering Compliance Officer is not considered a corporate officer or executive employee of the Trust. |
18
The Allianz VIP Fund of Funds are distributed by Allianz Life Financial Services, LLC. These Funds are not FDIC Insured. | ANNRPT1217 2/18 |
AZL® MVP Balanced Index Strategy Fund
Annual Report
December 31, 2017
Table of Contents
Management Discussion and Analysis
Page 1
Expense Examples and Portfolio Composition
Page 3
Schedule of Portfolio Investments
Page 4
Statement of Assets and Liabilities
Page 5
Page 5
Statements of Changes in Net Assets
Page 6
Page 7
Notes to the Financial Statements
Page 8
Report of Independent Registered Public Accounting Firm
Page 13
Other Federal Income Tax Information
Page 14
Page 15
Approval of Investment Advisory Agreement
Page 16
Information about the Board of Trustees and Officers
Page 18
This report is submitted for the general information of the shareholder of the Fund. The report is not authorized for distribution to prospective investors in the Fund unless preceded or accompanied by an effective prospectus, which contains details concerning the sales charges and other pertinent information.
AZL® MVP Balanced Index Strategy Fund Review (Unaudited)
Allianz Investment Management LLC
serves as the Manager for the AZL®
MVP Balanced Index Strategy Fund.
What factors affected the Fund’s performance during the year ended December 31, 2017?
For the year ended December 31, 2017, the AZL® MVP Balanced Index Strategy Fund (the “Fund”) returned 11.40%. That compared to a 21.83%, 3.54% and a 12.42% total return for its benchmarks, the S&P 500 Index1, the Bloomberg Barclays U.S. Aggregate Bond Index1, and the Balanced Composite Index1, respectively.
The Fund is a fund of funds that pursues broad diversification across four equity sub-portfolios and one fixed-income sub-portfolio. The four equity sub-portfolios pursue passive strategies that aim to achieve, before fees, returns similar to the S&P 500 Index, the S&P 400 Index2, the S&P 600 Index3, and the MSCI EAFE Index4, which represents shares of large companies in developed foreign markets. The fixed-income sub-portfolio is an enhanced bond index strategy that seeks to achieve a return that exceeds that of the Bloomberg Barclays Capital U.S. Aggregate Bond Index. Generally, the Fund allocates 40% to 60% of its assets to the underlying equity index funds and between 40% and 60% to the underlying bond index fund. The Fund also employs the MVP (Managed Volatility Portfolio) risk management process, which is intended to adjust the risk of the portfolio based on quantitative indicators of market risk, such as the current level of fund and market volatility.*
Global economic expansion led major stock indexes to new all-time highs during the 12-month period under review. The S&P 500 Index gained 21.83% during the period, supported by a positive economic environment marked by solid jobs growth, low unemployment, increased business investment, strong consumer confidence and a low-volatility environment. Mid- and small-cap stocks also performed well during the period: The S&P MidCap 400 Index generated a 16.24% return and the SmallCap 600 Index returned 13.23%. Growth stocks were also heavily favored during the year and significantly outperformed value stocks.
International developed markets, as measured by the MSCI EAFE Index, fared even better than U.S. equities, posting a 25.62% return for the year. Emerging markets equities, as measured by the MSCI Emerging Markets Equity Index5, posted a return of 37.75%. The strong return ended years of underperformance versus domestic and international developed markets.
The U.S. bond market was generally positive, as the market rewarded investors who took on interest rate and spread risk. The Bloomberg Barclays U.S. Aggregate Bond Index gained 3.54%. Bond investors generally tolerated risk in their quest for more attractive yields. Credit spreads on corporate bonds ended the year tighter than when the year began, with high-yield bond spreads tightening markedly. Meanwhile, the yield curve flattened sharply, as three rate hikes by the Federal Reserve sent short-term yields higher, while investor demand for attractive yield pushed long-term yields lower.
The Fund, which invests in both U.S. and international markets, underperformed its composite benchmark in 2017. The underperformance was primarily driven by the Fund’s
strategic allocation to U.S. mid- and small-cap equities during a period when U.S. large-cap equities outperformed their smaller counterparts. The Fund’s overweight allocation to international equities, on the other hand, supported relative returns as they outperformed their U.S. counterparts.*
Within the Fund’s fixed income holdings, an overweight allocation to 30-year bonds added to relative results. That benefit, however, was more than offset by an underweight allocation to corporate bonds, which outperformed. As a result, the Fund modestly lagged its fixed income benchmark during the period.*
The MVP risk management process, which includes the use of derivatives, worked as intended during the period under review. Given that the period was marked by low volatility, the MVP maintained a neutral equity allocation for the year relative to its target.*
Past performance does not guarantee future results.
| * | The Fund’s portfolio composition is subject to change. There is no guarantee that any sectors mentioned will continue to perform well or that securities in such sectors will be held by the Fund in the future. The information contained in this commentary is for informational purposes only and should not be construed as a recommendation to purchase or sell securities in the sector mentioned. The Fund’s holdings and weightings are as of December 31, 2017. |
| 1 | For a complete description of the Fund’s performance benchmarks please refer to page 2 of this report. |
| 2 | The Standard & Poor’s MidCap 400 Index (“S&P 400”) is the most widely used index for mid-sized companies. The S&P 400 covers 7% of the U.S. equities market, and is part of a series of S&P U.S. indices that can be used as building blocks for portfolio composition. |
| 3 | The Standard & Poor’s SmallCap 600 Index (“S&P 600”) covers approximately 3% of the domestic equities market. Measuring the small-cap segment of the market that is typically renowned for poor trading liquidity and financial instability, the index is designed to be an efficient portfolio of companies that meet specific inclusion criteria to ensure that they are investable and financially viable. |
| 4 | The Morgan Stanley Capital International, Europe, Australasia and Far East (“MSCI EAFE”) Index is a free float-adjusted market capitalization-weighted index that is designed to measure the equity market performance of developed markets, excluding the U.S. & Canada. |
| 5 | The MSCI Emerging Markets Index (“MSCI EM”) is a free float-adjusted market capitalization index that is designed to measure equity performance of emerging markets. |
| Investors cannot invest directly in an index. |
1
AZL® MVP Balanced Index Strategy Fund Review (Unaudited)
Fund Objective
The Fund’s investment objective is to seek long-term capital appreciation with preservation of capital as an important consideration. This objective may be changed by the Trustees of the Fund without shareholder approval. The Fund seeks to achieve its objective by investing in a combination of Index Strategy Underlying Funds that represent different classes in the Fund’s asset allocation.
Investment Concerns
The Fund invests in underlying funds, so its investment performance is directly related to the performance of those underlying funds. Before investing, investors should assess the risks associated with and types of investments made by each of the underlying funds in which the Fund invests.
International investing may involve risk of capital loss from unfavorable fluctuations in currency values, from differences in generally accepted accounting principles or from economic or political instability in other nations.
Small- to mid-capitalization companies typically have a higher risk of failure and historically have experienced a greater degree of volatility.
Bonds offer a relatively stable level of income, although bond prices will fluctuate, providing the potential for principal gain or loss.
The performance of the Fund is expected to be lower than that of the Indices because of Fund fees and expenses. Securities in which the Fund will invest may involve substantial risk and may be subject to sudden severe price declines.
Investing in derivatives instruments involves risks that may be different from or greater than the risk associated with investing directly in securities or other traditional instruments.
For a complete description of these and other risks associated with investing in a mutual Fund, please refer to the Fund’s prospectus.
Growth of $10,000 Investment
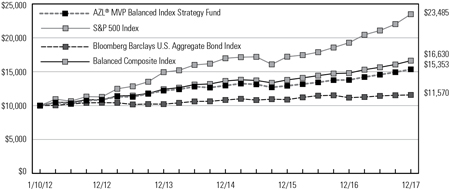
The chart above represents a comparison of a hypothetical investment in the Fund versus a similar investment in the Fund’s benchmark, as well as the two component indices of the Fund’s benchmark, and represents the reinvestment of dividends and capital gains in the Fund.
Average Annual Total Returns as of December 31, 2017
| 1 Year | 3 Year | 5 Year | Since Inception (1/10/12) | |||||||||||||
AZL® MVP Balanced Index Strategy Fund | 11.40 | % | 5.82 | % | 7.19 | % | 7.44 | % | ||||||||
S&P 500 Index | 21.83 | % | 11.41 | % | 15.79 | % | 15.36 | % | ||||||||
Bloomberg Barclays U.S. Aggregate Bond Index | 3.54 | % | 2.24 | % | 2.10 | % | 2.47 | % | ||||||||
Balanced Composite Index | 12.42 | % | 6.84 | % | 8.87 | % | 8.89 | % | ||||||||
Past performance does not guarantee future results. The performance data quoted represents past performance and current returns may be lower or higher. The investment return and principal value will fluctuate so that an investor’s shares, when redeemed may be worth more or less than the original cost. To obtain performance information current to the most recent month end, please visit www.Allianzlife.com.
Expense Ratio | Gross | |||
AZL® MVP Balanced Index Strategy Fund | 0.73 | % | ||
The above expense ratio is based on the current Fund prospectus dated May 1, 2017. The Manager and the Fund have entered into a written contract limiting operating expenses, excluding certain expenses (such as interest expense and acquired fund fees and expenses), to 0.20% through April 30, 2019. Additional information pertaining to the December 31, 2017 expense ratios can be found in the financial highlights.
Acquired fund fees and expenses are incurred indirectly by the Fund through the valuation of the Fund’s investments in the Permitted Underlying Funds. Accordingly, acquired fees and expenses affect the Fund’s total returns. Because these fees and expenses are not included in the Fund’s financial highlights, the Fund’s total annual fund operating expenses, as shown in the current prospectus, do not correlate to the ratios of expenses to average net assets shown in the financial highlights table. Without acquired fund fees and expenses the Fund’s gross expense ratio would be 0.14%.
The total return of the Fund does not reflect the effect of any insurance charges, the annual maintenance fee or the deduction of taxes that a shareholder would pay on Fund distributions or the redemption of Fund shares. Such charges, fees and tax payments would reduce the performance quoted.
The Fund’s performance is measured against the Standard & Poor’s 500 Index (“S&P 500”), the Bloomberg Barclays U.S. Aggregate Bond Index and the Balanced Composite Index (“Composite”). The S&P 500 is representative of 500 selected common stocks, most of which are listed on the New York Stock Exchange, and is a measure of the U.S. Stock market as a whole. The Bloomberg Barclays U.S. Aggregate Bond Index is a market value-weighted performance benchmark for investment-grade fixed-rate debt issues, including government, corporate, asset-backed, and mortgage-backed securities, with maturities of at least one year. The Composite is a blended index comprised of (50%) S&P 500 and (50%) Bloomberg Barclays U.S. Aggregate Bond Index. These indexes are unmanaged and do not reflect the deduction of fees associated with a mutual fund, such as investment management and fund accounting fees. The Fund’s performance reflects the deduction of fees for services provided to the Fund. Investors cannot invest directly in an index.
2
AZL MVP Balanced Index Strategy Fund
(Unaudited)
As a shareholder of the AZL MVP Balanced Index Strategy Fund (the “Fund”), you incur ongoing costs, including management fees, distribution fees, and other Fund expenses. These examples are intended to help you understand your ongoing costs (in dollars) of investing in the Fund and to compare these costs with the ongoing costs of investing in other mutual funds. Please note that the expenses shown in each table do not reflect expenses that apply to the subaccount or the insurance contract. If the expenses that apply to the subaccount of the insurance contract were included, your costs would have been higher.
These examples are based on an investment of $1,000 invested at the beginning of the period and held for the periods presented below.
The Actual Expense table below provides information about actual account values and actual expenses. You may use the information below, together with the amount you invested, to estimate the expenses that you paid over the period. Simply divide your account value by $1,000 (for example, an $8,600 account value divided by $1,000 = 8.6), then multiply the result by the number in the table under the heading entitled “Expenses Paid During Period” to estimate the expenses you paid on your account during this period.
| Beginning Account Value 7/1/17 | Ending Account Value 12/31/17 | Expenses Paid During Period 7/1/17 - 12/31/17* | Annualized Expense Ratio During Period 7/1/17 - 12/31/17 | |||||||||||||||||
AZL MVP Balanced Index Strategy Fund | $ | 1,000.00 | $ | 1,054.40 | $ | 0.62 | 0.12 | % | ||||||||||||
The Hypothetical Expense table below provides information about hypothetical account values and hypothetical expenses based on the Fund’s actual expense ratio and an assumed rate of return of 5% per year before expenses, which is not the Fund’s actual return. The hypothetical account values and expenses may not be used to estimate the actual ending account balance or expenses you paid for the period. You may use this information to compare this 5% hypothetical example with the 5% hypothetical examples that appear in the shareholder reports of other funds.
| Beginning Account Value 7/1/17 | Ending Account Value 12/31/17 | Expenses Paid During Period 7/1/17 - 12/31/17* | Annualized Expense Ratio During Period 7/1/17 - 12/31/17 | |||||||||||||||||
AZL MVP Balanced Index Strategy Fund | $ | 1,000.00 | $ | 1,024.60 | $ | 0.61 | 0.12 | % | ||||||||||||
| * | Expenses are equal to the average account value over the period, multiplied by the Fund’s annualized expense ratio, multiplied by 184/365 (to reflect the one half year period). |
Portfolio Composition
(Unaudited)
| Investments | Percent of Net Assets | ||||
Fixed Income | 47.5 | ||||
Domestic Equities | 35.0 | ||||
International Equities | 12.6 | ||||
|
| ||||
Total Investment Securities | 95.1 | ||||
Net other assets (liabilities) | 4.9 | ||||
|
| ||||
Net Assets | 100.0 | % | |||
|
| ||||
3
AZL MVP Balanced Index Strategy Fund
Schedule of Portfolio Investments
December 31, 2017
| Shares | Fair Value | |||||||
| Affiliated Investment Companies (95.1%): | ||||||||
| 14,056,214 | AZL Enhanced Bond Index Fund | $ | 153,072,168 | |||||
| 2,341,672 | AZL International Index Fund, Class 2 | 40,510,932 | ||||||
| 1,031,765 | AZL Mid Cap Index Fund, Class 2 | 24,205,200 | ||||||
| 4,689,232 | AZL S&P 500 Index Fund, Class 2 | 75,637,309 | ||||||
| 869,643 | AZL Small Cap Stock Index Fund, Class 2 | 12,940,281 | ||||||
|
| |||||||
Total Affiliated Investment Companies (Cost $270,824,187) | 306,365,890 | |||||||
|
| |||||||
Total Investment Securities (Cost $270,824,187)(a) — 95.1% | 306,365,890 | |||||||
Net other assets (liabilities) — 4.9% | 15,864,740 | |||||||
|
| |||||||
Net Assets — 100.0% | $ | 322,230,630 | ||||||
|
| |||||||
Percentages indicated are based on net assets as of December 31, 2017.
| (a) | See Federal Tax Information listed in the Notes to the Financial Statements. |
Futures Contracts
Cash of $16,105,607 has been segregated to cover margin requirements for the following open contracts as of December 31, 2017:
Long Futures
| Description | Expiration Date | Number of Contracts | Notional Amount | Unrealized Appreciation/ (Depreciation) | ||||||||||||
S&P 500 Index E-Mini March Futures (U.S. Dollar) | 3/19/18 | 59 | $ | 7,894,200 | $ | 130,019 | ||||||||||
U.S. Treasury 10-Year Note March Futures (U.S. Dollar) | 3/21/18 | 65 | 8,063,047 | (43,191 | ) | |||||||||||
|
| |||||||||||||||
| $ | 86,828 | |||||||||||||||
|
| |||||||||||||||
See accompanying notes to the financial statements.
4
AZL MVP Balanced Index Strategy Fund
Statement of Assets and Liabilities
December 31, 2017
Assets: | |||||
Investments in affiliates, at cost | $ | 270,824,187 | |||
|
| ||||
Investments in affiliates, at value | $ | 306,365,890 | |||
Segregated cash for collateral | 16,105,607 | ||||
Interest and dividends receivable | 14,880 | ||||
Receivable for capital shares issued | 37,337 | ||||
Receivable for affiliated investments sold | 191,127 | ||||
Prepaid expenses | 1,869 | ||||
|
| ||||
Total Assets | 322,716,710 | ||||
|
| ||||
Liabilities: | |||||
Cash overdraft | 191,127 | ||||
Payable for capital shares redeemed | 252,058 | ||||
Manager fees payable | 27,264 | ||||
Administration fees payable | 3,575 | ||||
Custodian fees payable | 569 | ||||
Administrative and compliance services fees payable | 756 | ||||
Transfer agent fees payable | 689 | ||||
Trustee fees payable | 487 | ||||
Other accrued liabilities | 9,555 | ||||
|
| ||||
Total Liabilities | 486,080 | ||||
|
| ||||
Net Assets | $ | 322,230,630 | |||
|
| ||||
Net Assets Consist of: | |||||
Capital | $ | 279,091,576 | |||
Accumulated net investment income/(loss) | 2,615,699 | ||||
Accumulated net realized gains/(losses) from investment transactions | 4,894,824 | ||||
Net unrealized appreciation/(depreciation) on investments | 35,628,531 | ||||
|
| ||||
Net Assets | $ | 322,230,630 | |||
|
| ||||
Shares of beneficial interest (unlimited number of shares authorized, no par value) | 24,084,573 | ||||
Net Asset Value (offering and redemption price per share) | $ | 13.38 | |||
|
|
For the Year Ended December 31, 2017
Investment Income: | |||||
Dividends from affiliates | $ | 2,553,675 | |||
Interest | 140,005 | ||||
Dividends | 348 | ||||
Other income | 798 | ||||
|
| ||||
Total Investment Income | 2,694,826 | ||||
|
| ||||
Expenses: | |||||
Manager fees | 316,561 | ||||
Administration fees | 48,500 | ||||
Custodian fees | 3,111 | ||||
Administrative and compliance services fees | 3,815 | ||||
Transfer agent fees | 4,797 | ||||
Trustee fees | 13,466 | ||||
Professional fees | 13,832 | ||||
Shareholder reports | 8,707 | ||||
Other expenses | 3,708 | ||||
|
| ||||
Total expenses | 416,497 | ||||
|
| ||||
Net Investment Income/(Loss) | 2,278,329 | ||||
|
| ||||
Realized and Unrealized Gains/(Losses) on Investments: | |||||
Net realized gains/(losses) on securities transactions from affiliates | 490,929 | ||||
Net realized gains distributions from affiliated underlying funds | 5,728,617 | ||||
Net realized gains/(losses) on futures contracts | 1,426,333 | ||||
Change in net unrealized appreciation/depreciation on affiliated transactions | 24,106,496 | ||||
Change in net unrealized appreciation/depreciation on futures contracts | 118,289 | ||||
|
| ||||
Net Realized/Unrealized Gains/(Losses) on Investments | 31,870,664 | ||||
|
| ||||
Change in Net Assets Resulting From Operations | $ | 34,148,993 | |||
|
|
See accompanying notes to the financial statements.
5
AZL MVP Balanced Index Strategy Fund
Statements of Changes in Net Assets
| For the Year Ended December 31, 2017 | For the Year Ended December 31, 2016 | |||||||||
Change In Net Assets: | ||||||||||
Operations: | ||||||||||
Net investment income/(loss) | $ | 2,278,329 | $ | 4,764,749 | ||||||
Net realized gains/(losses) on investment transactions | 7,645,879 | 11,249,453 | ||||||||
Change in unrealized appreciation/depreciation on investments | 24,224,785 | 2,043,805 | ||||||||
|
|
|
| |||||||
Change in net assets resulting from operations | 34,148,993 | 18,058,007 | ||||||||
|
|
|
| |||||||
Distributions to Shareholders: | ||||||||||
From net investment income | (5,886,420 | ) | (6,185,785 | ) | ||||||
From net realized gains | (11,984,093 | ) | (2,024,582 | ) | ||||||
|
|
|
| |||||||
Change in net assets resulting from distributions to shareholders | (17,870,513 | ) | (8,210,367 | ) | ||||||
|
|
|
| |||||||
Capital Transactions: | ||||||||||
Proceeds from shares issued | 21,993,018 | 75,326,220 | ||||||||
Proceeds from dividends reinvested | 17,870,513 | 8,210,367 | ||||||||
Value of shares redeemed | (46,656,347 | ) | (35,768,163 | ) | ||||||
|
|
|
| |||||||
Change in net assets resulting from capital transactions | (6,792,816 | ) | 47,768,424 | |||||||
|
|
|
| |||||||
Change in net assets | 9,485,664 | 57,616,064 | ||||||||
Net Assets: | ||||||||||
Beginning of period | 312,744,966 | 255,128,902 | ||||||||
|
|
|
| |||||||
End of period | $ | 322,230,630 | $ | 312,744,966 | ||||||
|
|
|
| |||||||
Accumulated net investment income/(loss) | $ | 2,615,699 | $ | 5,886,408 | ||||||
|
|
|
| |||||||
Share Transactions: | ||||||||||
Shares issued | 1,662,006 | 6,087,629 | ||||||||
Dividends reinvested | 1,378,898 | 654,213 | ||||||||
Shares redeemed | (3,503,941 | ) | (2,934,307 | ) | ||||||
|
|
|
| |||||||
Change in shares | (463,037 | ) | 3,807,535 | |||||||
|
|
|
| |||||||
See accompanying notes to the financial statements.
6
AZL MVP Balanced Index Strategy Fund
(Selected data for a share of beneficial interest outstanding throughout the periods indicated)
| Year Ended December 31, | |||||||||||||||||||||||||
| 2017 | 2016 | 2015 | 2014 | 2013 | |||||||||||||||||||||
Net Asset Value, Beginning of Period | $ | 12.74 | $ | 12.30 | $ | 12.56 | $ | 12.03 | $ | 10.69 | |||||||||||||||
|
|
|
|
|
|
|
|
|
| ||||||||||||||||
Investment Activities: | |||||||||||||||||||||||||
Net Investment Income/(Loss) | 0.11 | 0.17 | 0.22 | 0.08 | 0.10 | ||||||||||||||||||||
Net Realized and Unrealized Gains/(Losses) on Investments | 1.32 | 0.64 | (0.25 | ) | 0.65 | 1.24 | |||||||||||||||||||
|
|
|
|
|
|
|
|
|
| ||||||||||||||||
Total from Investment Activities | 1.43 | 0.81 | (0.03 | ) | 0.73 | 1.34 | |||||||||||||||||||
|
|
|
|
|
|
|
|
|
| ||||||||||||||||
Dividends to Shareholders From: | |||||||||||||||||||||||||
Net Investment Income | (0.26 | ) | (0.28 | ) | (0.10 | ) | (0.12 | ) | — | ||||||||||||||||
Net Realized Gains | (0.53 | ) | (0.09 | ) | (0.13 | ) | (0.08 | ) | — | (a) | |||||||||||||||
|
|
|
|
|
|
|
|
|
| ||||||||||||||||
Total Dividends | (0.79 | ) | (0.37 | ) | (0.23 | ) | (0.20 | ) | — | (a) | |||||||||||||||
|
|
|
|
|
|
|
|
|
| ||||||||||||||||
Net Asset Value, End of Period | $ | 13.38 | $ | 12.74 | $ | 12.30 | $ | 12.56 | $ | 12.03 | |||||||||||||||
|
|
|
|
|
|
|
|
|
| ||||||||||||||||
Total Return(b) | 11.40 | % | 6.61 | % | (0.22 | )% | 6.09 | % | 12.56 | % | |||||||||||||||
Ratios to Average Net Assets/Supplemental Data: | |||||||||||||||||||||||||
Net Assets, End of Period (000’s) | $ | 322,231 | $ | 312,745 | $ | 255,129 | $ | 208,618 | $ | 155,547 | |||||||||||||||
Net Investment Income/(Loss) | 0.72 | % | 1.69 | % | 2.08 | % | 0.97 | % | 1.09 | % | |||||||||||||||
Expenses Before Reductions*(c) | 0.13 | % | 0.14 | % | 0.14 | % | 0.15 | % | 0.17 | % | |||||||||||||||
Expenses Net of Reductions* | 0.13 | % | 0.14 | % | 0.14 | % | 0.15 | % | 0.17 | % | |||||||||||||||
Portfolio Turnover Rate | 9 | % | 11 | % | 5 | % | 6 | % | 4 | % | |||||||||||||||
| * | The expense ratios exclude the impact of fees/expenses paid by each underlying fund. |
| (a) | Represents less than $0.005. |
| (b) | The returns include reinvested dividends and fund level expenses, but exclude insurance contract charges. If these charges were included, the returns would have been lower. |
| (c) | Excludes fee reductions. If such fee reductions had not occurred, the ratios would have been as indicated. |
See accompanying notes to the financial statements.
7
AZL MVP Balanced Index Strategy Fund
Notes to the Financial Statements
December 31, 2017
1. Organization
The Allianz Variable Insurance Products Fund of Funds Trust (the “Trust”) was organized as a Delaware statutory trust on June 16, 2004. The Trust is a diversified open-end management investment company registered under the Investment Company Act of 1940, as amended, (the “1940 Act”) and thus is determined to be an investment company for accounting purposes. The Trust consists of 12 separate investment portfolios (collectively, the “Funds”), of which one is included in this report, the AZL MVP Balanced Index Strategy Fund (the “Fund”), and 11 are presented in separate reports.
The Fund is a “fund of funds,” which means that the Fund invests primarily in other mutual funds. Underlying Funds invest in stock, bonds, and other securities and reflect varying amounts of potential investment risk and reward. The Underlying Funds record their investments at fair value. Periodically, the Fund will adjust its asset allocation as it seeks to achieve its investment objective.
The Trust is authorized to issue an unlimited number of shares of the Fund without par value. Shares of the Fund are available through the variable annuity contracts offered through the separate accounts of participating insurance companies. Currently, the Fund only offers its shares to separate accounts of Allianz Life Insurance Company of North America and Allianz Life Insurance Company of New York, affiliates of the Trust and the Manager, as defined below.
Under the Trust’s organizational documents, its officers and trustees are indemnified against certain liabilities arising out of the performance of their duties to the Fund. In addition, in the normal course of business, the Fund may enter into contracts with its vendors and others that provide for general indemnifications. The Fund’s maximum exposure under these arrangements is unknown, as this would involve future claims that may be made against the Fund. However, based on experience, the Fund expects that risk of loss to be remote.
2. Significant Accounting Policies
The following is a summary of significant accounting policies followed by the Fund in the preparation of its financial statements. The policies conform with U.S. generally accepted accounting principles (“U.S. GAAP”). The preparation of financial statements requires management to make certain estimates and assumptions that affect the reported amounts of assets and liabilities and disclosure of contingent assets and liabilities at the date of the financial statements and the reported amounts of increases and decreases in net assets from operations during the reporting period. Actual results could differ from those estimates.
Security Valuation
The Fund records its investments at fair value. Fair value is defined as the price that would be received to sell an asset or paid to transfer a liability in an orderly transaction between willing market participants at the measurement date. The valuation techniques used to determine fair value are further described in Note 4 below.
Investment Transactions and Investment Income
Investment transactions are accounted for on trade date. Net realized gains and losses on investments sold and on foreign currency transactions are recorded on the basis of identified cost. Interest income is recorded on the accrual basis and includes, where applicable, the amortization of premiums or accretion of discounts.
Dividends to Shareholders
Dividends to shareholders are recorded on the ex-dividend date. The Fund distributes its dividends from net investment income and net realized capital gains, if any, on an annual basis. The amount of dividends from net investment income and from net realized gains is determined in accordance with federal income tax regulations, which may differ from U.S. GAAP. These “book/tax” differences are either temporary or permanent in nature. To the extent these differences are permanent in nature (e.g., miscellaneous adjustments on return of capital), such amounts are reclassified within the composition of net assets based on their federal tax-basis treatment; temporary differences (e.g., wash sales and differing treatment on certain investments) do not require reclassification. Dividends to shareholders that exceed net investment income and net realized gains for tax purposes are reported as distributions of capital.
Expense Allocation
Expenses directly attributable to the Fund are charged directly to the Fund, while expenses attributable to more than one Fund are allocated among the respective Funds based upon relative net assets or some other reasonable method. Expenses which are attributable to more than one Trust are allocated across the Allianz Variable Insurance Products and Allianz Variable Insurance Products Fund of Funds Trusts based upon relative net assets or another reasonable basis. Allianz Investment Management LLC (the “Manager”), serves as the investment manager for the Trust and the Allianz Variable Insurance Products Trust.
Derivative Instruments
All open derivative positions at period end are reflected on the Fund’s Schedule of Portfolio Investments. The following is a description of the derivative instruments utilized by the Fund, including the primary underlying risk exposures related to each instrument type. The Fund’s allocation to the MVP (Managed Volatility Portfolio) risk management process may include (a) derivatives such as index futures, other futures contracts, options, and other similar securities and (b) cash, money market equivalents, short-term debt instruments, money market funds, and short-term debt funds to satisfy all applicable margin requirements and to provide additional portfolio liquidity to satisfy large redemptions and any margin calls. Due to the leverage provided by derivatives, the notional value of the Fund’s derivative positions could exceed 20% of the Fund’s value. The Fund may also use futures to gain equity exposure and may hold cash as a buffer in the event of market shocks.
8
AZL MVP Balanced Index Strategy Fund
Notes to the Financial Statements
December 31, 2017
Futures Contracts
During the year ended December 31, 2017, the Fund invested in futures contracts to reduce volatility and limit the need to decrease or increase allocations to underlying funds. Futures contracts are valued based upon their quoted daily settlement prices. Upon entering into a futures contract, the Fund is required to segregate liquid assets in accordance with the initial margin requirements of the broker or exchange. Futures contracts are marked to market daily and a payable or receivable for the change in value (“variation margin”) is recorded by the Fund. Gains or losses are recognized but not considered realized until the contracts expire or are closed. Futures contracts involve, to varying degrees, elements of market risk (generally equity price risk related to stock futures, interest rate risk related to bond futures, and foreign currency risk related to currency futures) and exposure to loss in excess of the variation margin disclosed in the Statement of Assets and Liabilities. The primary risks associated with the use of futures contracts are the imperfect correlation between the change in fair value of the underlying securities and the prices of futures contracts, the possibility of an illiquid market, and the inability of the counterparty to meet the terms of the contract. For the year ended December 31, 2017, the monthly average notional amount for long contracts was $15.8 million. Realized gains and losses are reported as “Net realized gains/(losses) on futures contracts” on the Statement of Operations.
Summary of Derivative Instruments
The following is a summary of the fair values of derivative instruments on the Fund’s Statement of Assets and Liabilities, categorized by risk exposure, as of December 31, 2017:
Asset Derivative | Liability Derivative | |||||||||||
| Primary Risk Exposure | Statement of Assets and Liabilities Location | Total Fair Value* | Statement of Assets and Liabilities Location | Total Fair Value* | ||||||||
Equity Risk | ||||||||||||
| Equity Contracts | Receivable for variation margin on futures contracts | $ | 130,019 | Payable for variation margin on futures contracts | $ | — | ||||||
Interest Rate Risk | ||||||||||||
| Interest Rate Contracts | — | 43,191 | ||||||||||
| * | For futures contracts, the amounts represent the cumulative appreciation/depreciation of these futures contracts as reported in the Schedule of Portfolio Investments. Only current day’s variation margin is reported within the Statement of Assets and Liabilities as variation margin on futures contracts. |
The following is a summary of the effect of derivative instruments on the Statement of Operations, categorized by risk exposure, for the year ended December 31, 2017:
| Primary Risk Exposure | Location of Gains/(Losses) on Derivatives Recognized | Realized Gains/(Losses) on Derivatives Recognized | Change in Net Unrealized Appreciation/Depreciation on Derivatives Recognized | |||||||
Equity Risk | ||||||||||
| Equity Contracts | Net Realized gains/(losses) on futures contracts/Change in net unrealized appreciation/depreciation on futures contracts | $ | 1,357,732 | $115,713 | ||||||
Interest Rate Risk | ||||||||||
| Interest Rate Contracts | 68,601 | 2,576 | ||||||||
3. Fees and Transactions with Affiliates and Other Parties
The Manager provides investment advisory and management services for the Fund. The Manager has contractually agreed to waive fees and reimburse the Fund to limit the annual expenses, excluding interest expense (e.g., cash overdraft fees), taxes, brokerage commissions, acquired fund fees and expenses, other expenditures that are capitalized in accordance with U.S. GAAP and other extraordinary expenses not incurred in the ordinary course of the Fund’s business, based on the daily net assets of the Fund, through April 30, 2019. Expenses incurred for investment advisory and management services are reflected on the Statement of Operations as “Manager fees.”
For the year ended December 31, 2017, the annual rate paid to the Manager and the annual expense limit were as follows:
| Annual Rate | Annual Expense Limit | |||||||||
AZL MVP Balanced Index Strategy Fund | 0.10 | % | 0.20 | % | ||||||
Any amounts contractually waived or reimbursed by the Manager in a particular fiscal year will be subject to repayment by the Fund to the Manager to the extent that from time to time through the next three fiscal years the repayment will not cause the Fund’s expenses to exceed the lesser of the stated limit at the time of the waiver or the current stated limit. Any amounts recouped by the Manager during the year are reflected on the Statement of Operations as “Recoupment of prior expenses reimbursed by the Manager.” At December 31, 2017, there were no remaining contractual reimbursements that are subject to repayment by the Fund in subsequent years.
In addition, the Manager may voluntarily waive or reimburse additional fees in order to maintain more competitive expense ratios. Any voluntary waivers or reimbursements are not subject to repayment in subsequent years. Information on the total amount waived/reimbursed by the Manager or repaid to the Manager by the Fund during the period can be found on the Statement of Operations. During the year ended December 31, 2017, there were no voluntary waivers.
9
AZL MVP Balanced Index Strategy Fund
Notes to the Financial Statements
December 31, 2017
The Manager or an affiliate of the Manager serves as the investment adviser of certain underlying funds in which the Fund invests. At December 31, 2017, these underlying funds are noted as Affiliated Investment Companies in the Fund’s Schedule of Portfolio Investments. Additional information, including financial statements, about these Funds is available at www.allianzlife.com. The Manager or an affiliate of the Manager is paid a separate fee from the underlying funds for such services. A summary of the Fund’s investments in affiliated investment companies for the year ended December 31, 2017 is as follows:
| Fair Value 12/31/16 | Purchases at Cost | Proceeds from Sales | Net Realized | Net Change in Unrealized Appreciation/ Depreciation | Fair Value 12/31/17 | Shares as of 12/31/2017 | Dividend Income | Net realized | |||||||||||||||||||||||||||||||||||||
AZL Enhanced Bond Index Fund | $ | 148,190,890 | $ | 15,550,088 | $ | (13,794,387 | ) | $ | (498,581 | ) | $ | 3,624,158 | $ | 153,072,168 | 14,056,214 | $ | 1,355,994 | $ | — | ||||||||||||||||||||||||||
AZL International Index Fund, Class 2 | 38,458,535 | 1,581,296 | (7,732,771 | ) | (13,988 | ) | 8,217,860 | 40,510,932 | 2,341,672 | 343,007 | 299,170 | ||||||||||||||||||||||||||||||||||
AZL Mid Cap Index Fund, Class 2 | 24,341,674 | 2,351,030 | (4,695,448 | ) | 14,792 | 2,193,152 | 24,205,200 | 1,031,765 | 111,711 | 1,223,984 | |||||||||||||||||||||||||||||||||||
AZL S&P 500 Index Fund, Class 2 | 72,271,689 | 5,539,824 | (12,617,249 | ) | 1,006,595 | 9,436,450 | 75,637,309 | 4,689,232 | 679,902 | 3,330,011 | |||||||||||||||||||||||||||||||||||
AZL Small Cap Stock Index Fund, Class 2 | 13,851,238 | 1,550,747 | (3,078,691 | ) | (17,889 | ) | 634,876 | 12,940,281 | 869,643 | 63,061 | 875,452 | ||||||||||||||||||||||||||||||||||
|
|
|
|
|
|
|
|
|
|
|
|
|
|
|
|
|
| ||||||||||||||||||||||||||||
| $ | 297,114,026 | $ | 26,572,985 | $ | (41,918,546 | ) | $ | 490,929 | $ | 24,106,496 | $ | 306,365,890 | 22,988,526 | $ | 2,553,675 | $ | 5,728,617 | ||||||||||||||||||||||||||||
|
|
|
|
|
|
|
|
|
|
|
|
|
|
|
|
|
| ||||||||||||||||||||||||||||
Pursuant to separate agreements between the Funds and the Manager, the Manager provides a Chief Compliance Officer (“CCO”) and certain compliance oversight and regulatory filing services to the Trust. Under these agreements the Manager is entitled to an amount equal to a portion of the compensation and certain other expenses related to the individuals performing the CCO and compliance oversight services, as well as $100 per hour for time incurred in connection with the preparation and filing of certain documents with the Securities and Exchange Commission (“SEC” or the “Commission”). The fees are paid to the Manager on a quarterly basis. The total expenses incurred by the Fund for these services are reflected on the Statement of Operations as “Administrative and compliance services fees.”
Citi Fund Services Ohio, Inc. (“Citi” or the “Administrator”), a wholly owned subsidiary of Citigroup, Inc., with which an officer of the Trust is affiliated, serves as the Trust’s administrator and fund accountant, and assists the Trust in all aspects of its administration and operation. The Administrator is entitled to a fee, accrued daily and paid monthly. The Administrator is entitled to an annual fee for each additional class of shares of any Fund, certain annual fees in supporting fair values services, and a Trust-wide annual fee for providing infrastructure and support in implementing the written policies and procedures comprising the Fund’s compliance program. The Administrator is also reimbursed for certain expenses incurred. The total expenses incurred by the Fund for these services are reflected on the Statement of Operations as “Administration fees.”
FIS Investor Services LLC (“FIS”) serves as the Fund’s transfer agent. Under the Transfer Agent Agreement, the Trust pays FIS a fee for its services and reimburses FIS for all of their reasonable out-of-pocket expenses incurred in providing these services.
The Bank of New York Mellon (“BNY Mellon” or the “Custodian”) serves as the Trust’s custodian and securities lending agent. For these services as custodian, the Funds pay BNY Mellon a fee based on a percentage of assets held on behalf of the Funds, plus certain out-of-pocket charges.
Allianz Life Financial Services, LLC (“ALFS”), an affiliate of the Manager, serves as distributor of the Fund. ALFS receives an annual Trust-wide annual fee of $7,500, paid by the Manager from its profits and not by the Trust, for recordkeeping and reporting services.
In addition, certain legal fees and expenses are paid to a law firm, Dorsey & Whitney LLP, of which the Secretary of the Fund is Senior Counsel. During the year ended December 31, 2017, $3,235 was paid from the Fund relating to these fees and expenses.
Certain Officers and Trustees of the Trust are affiliated with the Manager or the Administrator. Such Officers (except for the Trust’s CCO as noted above) and Trustees receive no compensation from the Trust for serving in their respective roles. For their service to the Trust and to the Allianz Variable Insurance Products Trust, each non-interested Trustee receives a $170,000 annual Board retainer, the Lead Director receives an additional $42,500 annually and the Chair of the Nominating and Corporate Governance Committee receives an additional $25,500 annually. In addition, the Trustees are reimbursed for certain expenses associated with attending Board meetings. Compensation to the Trustees is allocated between the Trust and the Allianz Variable Insurance Products Trust in proportion to the assets under management of each trust. During the year ended December 31, 2017, actual Trustee compensation was $1,116,333 in total for both trusts.
4. Investment Valuation Summary
The valuation techniques employed by the Fund, as described below, maximize the use of observable inputs and minimize the use of unobservable inputs in determining fair value. The inputs used for valuing the Fund’s investments are summarized in the three broad levels listed below:
| ● | Level 1 — quoted prices in active markets for identical assets |
| ● | Level 2 — other significant observable inputs (including quoted prices for similar securities, interest rates, prepayments speeds, credit risk, etc.) |
| ● | Level 3 — significant unobservable inputs (including the Fund’s own assumptions in determining the fair value of investments) |
Changes in valuation techniques may result in transfers in or out of an assigned level within the disclosure hierarchy. The Fund determines transfers between fair value hierarchy levels at the reporting period end. The inputs or methodology used for valuing investments is not necessarily an indication of the risk associated with investing in those investments.
Investments in other investment companies are valued at their published net asset value (“NAV”). Security prices are generally provided by an independent third party pricing service approved by the Trust’s Board of Trustees (the “Board” or “Trustees”) as of the close of the New York Stock Exchange (“NYSE”) (generally 4:00 pm Eastern Time). The investments utilizing Level 1 valuations represent investments in open-end investment companies. Futures contracts are valued at the last sales price as of the close of the primary exchange and are typically categorized as Level 1 in the fair value hierarchy.
For the year ended December 31, 2017, there were no Level 3 investments for which significant unobservable inputs were used to determine fair value. There were no significant transfers between Levels 1 and 2 as of December 31, 2017, based on levels assigned to securities on December 31, 2016.
10
AZL MVP Balanced Index Strategy Fund
Notes to the Financial Statements
December 31, 2017
The following is a summary of the valuation inputs used as of December 31, 2017 in valuing the Fund’s investments based upon the three levels defined above:
| Investment Securities: | Level 1 | Level 2 | Level 3 | Total | ||||||||||||||||
Affiliated Investment Companies | $ | 306,365,890 | $ | — | $ | — | $ | 306,365,890 | ||||||||||||
|
|
|
|
|
|
|
| |||||||||||||
Total Investment Securities | 306,365,890 | — | — | 306,365,890 | ||||||||||||||||
|
|
|
|
|
|
|
| |||||||||||||
Other Financial Instruments:* | ||||||||||||||||||||
Futures Contracts | 86,828 | — | — | 86,828 | ||||||||||||||||
|
|
|
|
|
|
|
| |||||||||||||
Total Investments | $ | 306,452,718 | $ | — | $ | — | $ | 306,452,718 | ||||||||||||
|
|
|
|
|
|
|
| |||||||||||||
| * | Other Financial Instruments would include any derivative instruments, such as futures contracts. These investments are generally presented in the financial statements at variation margin. |
5. Security Purchases and Sales
For the year ended December 31, 2017, cost of purchases and proceeds from sales of securities (excluding securities maturing less than one year from acquisition) were as follows:
| Purchases | Sales | |||||||||
AZL MVP Balanced Index Strategy Fund | $ | 26,572,985 | $ | 41,918,546 | ||||||
6. Investment Risks
Derivatives Risk: The Fund may invest directly or through affiliated or unaffiliated mutual funds or unregistered investment pools in derivative instruments such as futures, options, and options on futures. A derivative is a financial contract whose value depends on, or is derived from, the value of an underlying asset, reference rate, or risk. Use of derivative instruments involves risks different from, or possibly greater than, the risks associated with investing directly in securities and other traditional investments. Derivatives are subject to a number of other risks, such as liquidity risk, interest rate risk, market risk, credit risk, and selection risk. Derivatives also involve the risk of mispricing or improper valuation and the risk that changes in the value may not correlate perfectly with the underlying asset, rate, or index. Using derivatives may result in losses, possibly in excess of the principal amount invested. Also, suitable derivative transactions may not be available in all circumstances. The other party to a derivatives contract could default.
Fund of Funds Risk: The Fund, as a shareholder of the underlying funds, indirectly bears its proportionate share of any investment management fees and other expenses of the underlying funds. Further due to the fees and expenses paid by the Fund, as well as small variations in the Fund’s actual allocations to the underlying funds and any futures and cash held in the Fund’s portfolio, the performance and income distributions of the Fund will not be the same as the performance and income distributions of the underlying funds.
7. Federal Tax Information
It is the policy of the Fund to continue to qualify as a regulated investment company by complying with the provisions available to certain investment companies, as defined under Subchapter M of the Internal Revenue Code, and to make distributions of net investment income and net realized gains sufficient to relieve it from all, or substantially all, federal income taxes. Accordingly, no provisions for federal income taxes are required in the financial statements.
Management of the Fund has reviewed tax positions taken in tax years that remain subject to examination by all major tax jurisdictions, including federal (i.e., the last four tax year ends and the interim tax period since then, as applicable). Management believes that there is no tax liability resulting from unrecognized tax benefits related to uncertain tax positions taken.
Cost of securities, including derivatives and short positions as applicable, for federal income tax purposes at December 31, 2017 is $273,470,856. The gross unrealized appreciation/(depreciation) on a tax basis is as follows:
Unrealized appreciation | $ | 33,400,919 | ||
Unrealized (depreciation) | (505,885 | ) | ||
|
| |||
Net unrealized appreciation/(depreciation) | $ | 32,895,034 | ||
|
|
The tax character of dividends paid to shareholders during the year ended December 31, 2017 were as follows:
| Ordinary Income | Net Long-Term | Total Distributions(a) | |||||||||||||
AZL MVP Balanced Index Strategy Fund | $ | 6,083,704 | $ | 11,786,809 | $ | 17,870,513 | |||||||||
| (a) | Total distributions paid may differ from the Statements of Changes in Net Assets because dividends are recognized when actually paid for tax purposes. |
The tax character of dividends paid to shareholders during the year ended December 31, 2016 were as follows:
| Ordinary Income | Net Long-Term | Total Distributions(a) | |||||||||||||
AZL MVP Balanced Index Strategy Fund | $ | 6,185,785 | $ | 2,024,582 | $ | 8,210,367 | |||||||||
| (a) | Total distributions paid may differ from the Statements of Changes in Net Assets because dividends are recognized when actually paid for tax purposes. |
11
AZL MVP Balanced Index Strategy Fund
Notes to the Financial Statements
December 31, 2017
At December 31, 2017, the components of accumulated earnings on a tax basis were as follows:
| Undistributed Ordinary Income | Undistributed Long-Term Capital Gains | Accumulated Capital and Other Losses | Unrealized Appreciation/ Depreciation(a) | Total (Deficit) | |||||||||||||||||||||
AZL MVP Balanced Index Strategy Fund | $ | 3,233,531 | $ | 7,042,296 | $ | — | $ | 32,895,034 | $ | 43,170,861 | |||||||||||||||
| (a) | The difference between book-basis and tax-basis unrealized appreciation/depreciation is attributable primarily to tax deferral of losses on wash sales and straddles. |
8. Ownership and Principal Holders
The beneficial ownership, either directly or indirectly, of more than 25% of the voting securities of a fund creates presumptions of control of the fund, under section 2 (a)(9) of the 1940 Act. As of December 31, 2017, the Fund had an individual shareholder account which is affiliated with the Investment Adviser representing ownership in excess of 85% of the Fund.
9. Investment Company Reporting Modernization
In October 2016, the SEC released its Final Rule on Investment Company Reporting Modernization (the “Rules”). The Rules which introduce two new regulatory reporting forms for investment companies — Form N-PORT and Form N-CEN — also contain amendments to Regulation S-X which require standardized, enhanced disclosures about derivatives in investment company financial statements, as well as other amendments. The amendments to Regulation S-X became effective for filings made with the SEC after August 1, 2017. The compliance date for form N-PORT and Form N-CEN will vary based on the reporting entity’s size and, in the case of the Fund, is expected to be April 30, 2019. The Fund’s adoption of these amendments, as applicable for the financial statements prepared as of December 31, 2017, had no effect on the Fund’s net assets or results of operations.
10. Subsequent Events
Management of the Fund has evaluated the need for additional disclosures or adjustments resulting from events through the date the financial statements were issued. Based on this evaluation, there were no subsequent events to report that would have material impact on the Fund’s financial statements.
12
REPORT OF INDEPENDENT REGISTERED PUBLIC ACCOUNTING FIRM
To the Shareholders and Board of Trustees of
Allianz Variable Insurance Products Fund of Funds Trust:
Opinion on the Financial Statements
We have audited the accompanying statement of assets and liabilities of AZL MVP Balanced Index Strategy Fund (the “Fund”) of the Allianz Variable Insurance Products Fund of Funds Trust, including the schedule of portfolio investments, as of December 31, 2017, and the related statement of operations for the year then ended, the statements of changes in net assets for each of the years in the two-year period then ended, and the related notes (collectively, the “financial statements”) and the financial highlights for each of the years in the five-year period then ended. In our opinion, the financial statements present fairly, in all material respects, the financial position of the Fund as of December 31, 2017, the results of its operations for the year then ended, the changes in its net assets for each of the years in the two-year period then ended, and the financial highlights for each of the years in the five-year period then ended, in conformity with U.S. generally accepted accounting principles.
Basis for Opinion
These financial statements and financial highlights are the responsibility of the Fund’s management. Our responsibility is to express an opinion on these financial statements and financial highlights based on our audits. We are a public accounting firm registered with the Public Company Accounting Oversight Board (United States) (“PCAOB”) and are required to be independent with respect to the Fund in accordance with the U.S. federal securities laws and the applicable rules and regulations of the Securities and Exchange Commission and the PCAOB.
We conducted our audits in accordance with the standards of the PCAOB. Those standards require that we plan and perform the audit to obtain reasonable assurance about whether the financial statements and financial highlights are free of material misstatement, whether due to error or fraud. Our audits included performing procedures to assess the risks of material misstatement of the financial statements and financial highlights, whether due to error or fraud, and performing procedures that respond to those risks. Such procedures included examining, on a test basis, evidence regarding the amounts and disclosures in the financial statements and financial highlights. Such procedures also included confirmation of securities owned as of December 31, 2017, by correspondence with brokers and transfer agents of the underlying funds. Our audits also included evaluating the accounting principles used and significant estimates made by management, as well as evaluating the overall presentation of the financial statements and financial highlights. We believe that our audits provide a reasonable basis for our opinion.
/s/ KPMG LLP
We have served as the auditor of one or more Allianz Variable Insurance Products investment companies since 1999.
Columbus, Ohio
February 23, 2018
13
Other Federal Income Tax Information (Unaudited)
For the year ended December 31, 2017, 23.90% of the total ordinary income dividends paid by the Fund qualify for the corporate dividends received deduction available to corporate shareholders.
During the year ended December 31, 2017, the Fund declared net short-term capital gain distributions of $197,284.
During the year ended December 31, 2017, the Fund declared net long-term capital gain distributions of $11,786,810.
14
A description of the policies and procedures that the Fund uses to determine how to vote proxies relating to portfolio securities is available, without charge, upon request, by visiting the Securities and Exchange Commission’s (“Commission”) website at www.sec.gov, or by calling 800-624-0197.
Information regarding how the Fund voted proxies relating to portfolio securities during the most recent 12-month period ended June 30th is available (i) without charge, upon request, by calling 800-624-0197; (ii) on the Allianz Variable Insurance Products Trust’s website at https://www.allianzlife.com; and (iii) on the Commission’s website at http://www.sec.gov.
The Fund files complete Schedules of Portfolio Holdings with the Commission for the first and third quarters of each fiscal year on Form N-Q. Schedules of Portfolio Holdings for the Fund in this report are available without charge on the Commission’s website at http://www.sec.gov, or may be reviewed and copied at the Commission’s Public Reference Room in Washington, D.C. Information on the operation of the Public Reference Room may be obtained by calling 800-SEC-0330.
15
Approval of Investment Advisory Agreement (Unaudited)
Subject to the general supervision of the Board of Trustees (the “Board”) and in accordance with the investment objectives and restrictions of each separate series (together, the “Funds”) of the Allianz Variable Insurance Products Fund of Funds Trust (the “Trust”), investment advisory services are provided to the Funds by Allianz Investment Management LLC (the “Manager”). As used in this section, “Fund” refers to any of the Funds. The Manager manages each Fund pursuant to an investment management agreement (the “Management Agreement”) with the Trust in respect of each such Fund. The Management Agreement provides that the Manager, subject to the supervision and approval of the Board, is responsible for the management of each Fund. For management services, each Fund pays the Manager an investment advisory fee based upon each Fund’s average daily net assets. The Manager has contractually agreed to limit the expenses of each Fund by reimbursing the Fund if and when total Fund operating expenses exceed certain amounts until at least May 1, 2019 (the “Expense Limitation Agreement”).
In reviewing the services provided by the Manager and the terms of the Management Agreement, the Board receives and reviews information related to the Manager’s experience and expertise in the variable insurance marketplace. Currently, the Funds are offered only through variable annuities and variable life insurance policies, and not in the retail fund market. In addition, the Board receives information regarding the Manager’s expertise with regard to portfolio diversification and asset allocation requirements within variable insurance products issued by Allianz Life Insurance Company of North America (“Allianz Life”) and its subsidiary, Allianz Life Insurance Company of New York (“Allianz of New York”). Currently, the Funds are offered only through Allianz Life and Allianz of New York variable products.
As required by the Investment Company Act of 1940 (the “1940 Act”), the Board has reviewed and approved the Management Agreement with the Manager. The Board’s decision to approve this contract reflects the exercise of its business judgment on whether to approve new arrangements and continue the existing arrangements. During its review of the contract, the Board considered many factors, among the most material of which are: the Fund’s investment objectives and long-term performance; the Manager’s management philosophy, personnel, processes and investment performance, including its compliance history and the adequacy of its compliance processes; the preferences and expectations of Fund shareholders (and underlying contract owners) and their relative sophistication; the continuing state of competition in the mutual fund industry; and comparable fees in the mutual fund industry.
The Board also considered the compensation and benefits received by the Manager. This includes fees received for services provided to a Fund by employees of the Manager or of affiliates of the Manager and research services received by the Manager from brokers that execute Fund trades, as well as advisory fees. The Board considered the fact that: (1) the Manager and the Trust are parties to an Administrative Services Agreement and a Compliance Services Agreement, under which the Manager is compensated by the Trust for performing certain administrative and compliance services including providing an employee of the Manager or one of its affiliates to act as the Trust’s Chief Compliance Officer; and (2) Allianz Life Financial Services, LLC, an affiliated person of the Manager, is a registered securities broker-dealer and received (along with its affiliated persons) payments made by the underlying funds pursuant to Rule 12b-1.
The Board is aware that various courts have interpreted provisions of the 1940 Act and have indicated in their decisions that the following factors may be relevant to an adviser’s compensation: the nature and quality of the services provided by the adviser, including the performance of the fund; the adviser’s cost of providing the services; the extent to which the adviser may realize “economies of scale” as the fund grows larger; any indirect benefits that may accrue to the adviser and its affiliates as a result of the adviser’s relationship with the fund; performance and expenses of comparable funds; the profitability of acting as adviser to the fund; and the extent to which the independent Board members, who are not “interested persons” of a fund as defined by the 1940 Act, are fully informed about all facts bearing on the adviser’s services and fees. The Board is aware of these factors and takes them into account in its review of the Management Agreement for the Funds.
The Board considered and weighed these circumstances in light of its experience in governing the Trust, and is assisted in its deliberations by the advice of independent legal counsel to the independent Trustees. In this regard, the Board requests and receives a significant amount of information about the Funds and the Manager. Some of this information is provided at each regular meeting of the Board; additional information is provided in connection with the particular meeting or meetings at which the Board’s formal review of an advisory contract occurs. In between regularly scheduled meetings, the Board may receive information on particular matters as the need arises. Thus, the Board’s evaluation of the Management Agreement is informed by reports covering such matters as: the Manager’s investment philosophy, personnel and processes, and the Fund’s investment performance (in absolute terms as well as in relationship to its benchmark). In connection with comparing the performance of each Fund versus its benchmark, the Board receives reports on the extent to which the Fund’s performance may be attributed to various applicable factors, such as asset class allocation decisions and volatility management strategies, the performance of the underlying funds, rebalancing decisions, and the impact of cash positions and Fund fees and expenses. The Board also receives reports on the Funds’ expenses (including the advisory fee itself and the overall expense structure of the Funds, both in absolute terms and relative to similar and/or competing funds, with due regard for the Expense Limitation Agreement and additional voluntary expense limitations); the nature and extent of the advisory and other services provided to the Fund by the Manager and its affiliates; compliance and audit reports concerning the Funds and the companies that service them; and relevant developments in the mutual fund industry and how the Funds and/or the Manager are responding to them.
The Board also receives financial information about the Manager, including reports on the compensation and benefits the Manager derives from its relationships with the Funds. These reports cover not only the fees under the Management Agreement, but also fees, if any, received for providing other services to the Funds. The reports also discuss any indirect or “fall out” benefits the Manager or its affiliates may derive from its relationship with the Funds.
The Management Agreement was most recently considered at Board meetings held in the fall of 2017. Information relevant to the approval of the Management Agreement was considered at a telephonic Board meeting on October 18, 2017, and at an “in person” Board meeting held October 23, 2017. The Management Agreement was approved at the Board meeting of October 23, 2017. At such meeting the Board also approved the Expense Limitation Agreement between the Manager and the Trust for the period ending April 30, 2019. In connection with such meetings, the Trustees requested and evaluated extensive materials from the Manager, including performance and expense information for other investment companies with similar investment objectives derived from data compiled by an independent third party provider and other sources believed to be reliable by the Manager. Prior to voting, the Trustees reviewed the proposed approval/continuance of the Agreement with management and with experienced counsel who are independent of the Manager and received a memorandum from such counsel discussing the legal standards for their consideration of the proposed approvals/continuances. The independent Trustees also discussed the proposed approvals/continuances in a private session with such counsel at which no representatives of the Manager were present. In reaching their determinations relating to the approval and/or continuance of the Agreement, in respect of each Fund, the Board considered all factors it believed relevant. The Board based its decision to approve the Management Agreement on the totality of the circumstances and relevant factors, and with a view to past and future long-term considerations. Not all of the factors and considerations discussed above and below are necessarily relevant to every Fund, and the Board did not assign relative weights to factors discussed herein or deem any one or group of them to be controlling in and of themselves.
An SEC rule requires that shareholder reports include a discussion of certain factors relating to the selection of the investment adviser and the approval of the advisory fee. The “factors” enumerated by the SEC are set forth below in italics, as well as the Board’s conclusions regarding such factors:
(1) The nature, extent and quality of services provided by the Manager. The Trustees noted that the Manager, subject to the control of the Board, administers each Fund’s business and other affairs. The Trustees noted that the Manager also provides the Trust and each Fund with such administrative and other services (exclusive of, and in addition to, any such services provided by any others retained by the Trust on behalf of the Funds) and executive and other personnel as are necessary for the operation of the Trust and the Funds. Except for the Trust’s Chief Compliance Officer and certain compliance staff, the Manager pays all of the compensation of Trustees and officers of the Trust who are employees of the Manager or its affiliates.
16
The Board considered the scope and quality of services provided by the Manager and noted that the scope of such services provided had expanded as a result of recent regulatory and other developments. The Board noted that, for example, the Manager is responsible for maintaining and monitoring its own compliance program, and this compliance program has been continuously refined and enhanced in light of new regulatory requirements. The Board considered the capabilities and resources which the Manager has dedicated to performing services on behalf of the Trust and its Funds. The quality of administrative and other services, including the Manager’s role in coordinating the activities of the Trust’s other service providers, also were considered. The Board concluded that, overall, they were satisfied with the nature, extent and quality of services provided (and expected to be provided) to the Trust and to each of the Funds under the Management Agreement.
(2) The investment performance of the Funds and the Manager. In connection with every in-person quarterly Board meeting and the fall 2017 contract review process, Trustees received extensive information on the performance results of each Fund. This included, for example, performance information on absolute total return, performance versus the appropriate benchmark(s), the contribution to performance of the Manager’s asset class allocation decisions and volatility management strategies, the performance of the underlying funds, and the impact on performance of rebalancing decisions, cash and Fund fees. This included Lipper performance information on the Funds for the previous quarter, year-to-date, and previous one-, three- and five-year periods, to the extent the Funds were in existence for such periods. (For Funds which have been in existence for less than five years, the Board received performance information on shorter time periods to the extent available.) For example, in connection with the Board meeting held October 23, 2017, the Manager reported that for the five Funds for which performance information for the five year period ended June 30, 2017 was available, two were in the top 40%, two were in the middle 20%, and one was in the bottom 40%. None of these Funds was in the bottom 40% for the three- or one-year periods. The Manager reported that for the three-year period ended June 30, 2017, for the six Funds for which three year performance information was available, four Funds were in the top 40% and two Funds were in the middle 20%. For the eight Funds for which one-year performance information was available, for the one-year period ended June 30, 2017, four Funds were in the top 40%, two Funds were in the middle 20%, and two Funds were in the bottom 40%.
At the Board meeting held October 23, 2017, the Manager also reported upon the performance of the MVP Funds compared to custom managed-volatility peer groups. For the seven Funds for which three-year performance information was available, for the three-year period ended June 30, 2017, five Funds were in the top 40%, one Fund was in the middle 20%, and one was in the bottom 40%. For the eight Funds for which one year performance was available, for the one-year period ended June 30, 2017, four Funds were in the top 40% and four Funds were in the middle 20%. All six Funds for which five-year performance information was available were in the top 40%.
At the Board meeting held October 23, 2017, the Trustees determined that the investment performance of the Funds was acceptable.
(3) The costs of services to be provided and profits to be realized by the Manager and its affiliates from the relationship with the Funds. The Board considered that the Manager receives an advisory fee from each of the Funds. The Manager reported that for the three MVP Fusion Dynamic Funds the advisory fee paid put these Funds in the 44th percentile of the customized peer group. The Manager reported that for three MVP Index Strategy Funds the advisory fee paid put them in the 27th percentile of the customized peer group, and for the two non-MVP Index Strategy Funds, as well as the AZL DFA Multi-Strategy Fund, the advisory fee paid put them in the 13th percentile of the customized peer group. The Manager reported that for the AZL MVP BlackRock Global Strategy Plus, AZL MVP DFA Multi-Strategy, AZL MVP Pyramis Multi-Strategy, and AZL MVP T. Rowe Price Capital Appreciation Plus Funds, the advisory fee paid was in the 9th percentile. (A lower percentile reflects lower fund fees and is better for fund shareholders.) Trustees were provided with information on the total expense ratios of the Funds and other funds in the customized peer groups, and the Manager reported upon the challenges in making peer group comparisons for the Funds.
The Manager provided information concerning the profitability of the Manager’s investment advisory activities for the period from 2014 through June 30, 2017. The Board recognized that it is difficult to make comparisons of profitability from investment company advisory agreements because comparative information is not generally publicly available and is affected by numerous factors, including the structure of the particular adviser, the types of funds it manages, its business mix, numerous assumptions regarding allocation of expenses and the adviser’s capital structure and cost of capital. In considering profitability information, the Board considered the possible effect of certain fall-out benefits to the Manager and its affiliates. The Board focused on profitability of the Manager’s relationships with the Funds before taxes and distribution expenses. The Board recognized that the Manager should earn a reasonable level of profits for the services it provides to each Fund.
The Board also considered that Wilshire Funds Management (“Wilshire”) serves as a consultant to the Manager in preparing statistical and other factual information for use in the creation and maintenance of the asset allocation models for the Fusion Funds (the AZL MVP Fusion Dynamic Conservative, Balanced, and Moderate Funds), pursuant to an agreement between the Manager and Wilshire. Wilshire serves as a consultant to the Manager with respect to selecting the Fusion Funds’ underlying funds and the asset allocations among the underlying funds. The Manager, not any Fund, pays a consultant fee to Wilshire.
Based upon the information provided, the Board concluded that the Funds’ advisory fees and expense ratios are not unreasonable, and determined that there was no evidence that the Manager’s level of profitability from its relationship with the Funds was excessive.
(4) and (5) The extent to which economies of scale would be realized as the Funds grow, and whether fee levels reflect these economies of scale. The Board noted that the advisory fee schedules for the Funds do not contain breakpoints that reduce the fee rate on assets above specified levels. The Board recognized that breakpoints may be an appropriate way for the Manager to share its economies of scale, if any, with Funds that have substantial assets. The Board found there was no uniform methodology for establishing breakpoints that give effect to Fund-specific services provided by the Manager. The Board noted that in the fund industry as a whole, as well as among funds similar to the Funds, there is no uniformity or pattern in the fees and asset levels at which breakpoints (if any) apply. Depending on the age, size, and other characteristics of a particular fund and its manager’s cost structure, different conclusions can be drawn as to whether there are economies of scale to be realized at any particular level of assets, notwithstanding the intuitive conclusion that such economies exist, or will be realized at some level of total assets. Moreover, because different managers have different cost structures and service models, it is difficult to draw meaningful conclusions from the breakpoints that may have been adopted by other funds. The Board also noted that the advisory agreements for many funds do not have breakpoints at all, or if breakpoints exist, they may be at asset levels significantly greater than those of the individual Funds. The Board also noted that the total assets in all of the Funds, as of June 30, 2017, were approximately $10.8 billion and that the largest Fund, the AZL MVP Growth Index Strategy Fund, had assets of approximately $2.4 billion.
The Board noted that the Manager has agreed to temporarily limit Fund expenses under the Expense Limitation Agreement, which has the effect of reducing expenses as would the implementation of advisory fee breakpoints. The Manager has committed to continue to consider the continuation of expense limits and/or advisory fee breakpoints as the Funds grow larger. The Board receives quarterly reports on the level of Fund assets. The Board expects to continue to consider: (a) the extent to which economies of scale have been realized, and (b) whether the advisory fee should be modified, either in connection with the next renewal of the Agreements or by modifying the Expense Limitation Agreement, to reflect such economies of scale, if any.
Having taken these factors into account, the Board concluded that the absence of breakpoints in the Funds’ advisory fee rate schedules was acceptable under each Fund’s circumstances.
17
Information about the Board of Trustees and Officers (Unaudited)
The Trust is managed by the Trustees in accordance with the laws of the state of Delaware governing business trusts. There are currently eight Trustees, one of whom is an “interested person” of the Trust within the meaning of that term under the 1940 Act. The Trustees and Officers of the Trust, and their addresses, ages, positions held with the Trust, terms of office with the Trust and length of time served, principal occupation(s) during the past five years, the number of portfolios in the Trust they oversee, and other directorships held during the past five years are as follows:
Non-Interested Trustees(1)
| Name, Address, and Year of Birth | Positions Held with Allianz VIP and VIP FOF Trust | Term of Office(2)/Length of Time Served | Principal Occupation(s) During Past 5 Years | Number of Portfolios Overseen for Allianz VIP and VIP FOF Trust | Other AZL Fund Complex | |||||
| Peter R. Burnim (1947) 5701 Golden Hills Drive Minneapolis, MN 55416 | Trustee | Since 2/07 | Consultant/Chair, various companies: Chairman, Emrys Analytics and subsidiaries, July 2015 to present; Chairman, Argus Investment Strategies Fund Ltd., February 2013 to 2017; Managing Director, iQ Venture Advisors, LLC, 2005 to present; Chairman, Northstar Group Holdings Ltd. Bermuda, 2011 to present; Chairman Sterling Bank & Trust (Bahamas) Ltd., 2016 to present, and Expert Witness, Massachusetts Department of Revenue, 2011 to 2016. | 35 | Argus Group Holdings and Subsidiaries; Northstar Group Holdings; Sterling Trust (Cayman) Ltd.; Sterling Bank & Trust Limited (Bahamas); Emrys Analytics; EGB Insurance. | |||||
| Peggy L. Ettestad (1957) 5701 Golden Hills Drive Minneapolis, MN 55416 | Lead Independent Trustee | Since 10/14 (Trustee since 2/07) | Managing Director, Red Canoe Management Consulting LLC, 2008 to present | 35 | Luther College | |||||
| Tamara Lynn Fagely (1958) 5701 Golden Hills Drive Minneapolis, MN 55416 | Trustee | Since 12/17 | Retired; Chief Operations Officer, Hartford Funds, March 2012 to December 2013 | 35 | Diamond Hill Funds (13 funds) | |||||
| Richard H. Forde (1953) 5701 Golden Hills Drive Minneapolis, MN 55416 | Trustee | Since 12/17 | Member of the Board and Chairman of the Finance and Investment Committee, Connecticut Water Service, Inc., October 2013 to present; Senior Vice President and Chief Investment Officer, CIGNA, 2004 to 2012 | 35 | Connecticut Water Service, Inc. | |||||
| Claire R. Leonardi (1955) 5701 Golden Hills Drive Minneapolis, MN 55416 | Trustee | Since 2/04 | Chief Executive Officer, Health eSense Inc., 2015 to Present; CEO, Connecticut Innovations, Inc., 2012 to 2015; General Partner, Fairview Capital, L.P., 1994 to 2012 | 35 | reSet Social Enterprise Investment Fund | |||||
| Dickson W. Lewis (1948) 5701 Golden Hills Drive Minneapolis, MN 55416 | Trustee | Since 2/04 | Retired; Vice President/General Manager, Yearbooks & Canada-Lifetouch National School Studios, 2006 to 2014; Vice President/General Manager of Jostens, Inc., 2002 to 2006; Senior Vice President of Fortis Group, 1997 to 2002 | 35 | None | |||||
| Arthur C. Reeds, III (1944) 5701 Golden Hills Drive Minneapolis, MN 55416 | Trustee | Since 10/99 | Retired; Senior Investment Officer, Hartford Foundation for Public Giving, 2000 to 2003; Chairman, Chief Executive and President of Conning Corp., 1999 to 2000 | 35 | Connecticut Water Service, Inc. |
Interested Trustees(3)
| Name, Address, and Year of Birth | Positions Held with Allianz VIP and VIP FOF Trust | Term of Office(2)/Length of Time Served | Principal Occupation(s) During Past 5 Years | Number of Portfolios Overseen for Allianz VIP and VIP FOF Trust | Other AZL Fund Complex | |||||
Brian Muench (1970) 5701 Golden Hills Drive | Trustee | Since 6/11 | President, Allianz Investment Management LLC, November 2010 to present; Vice President, Allianz Life, April 2011 to present | 35 | None |
18
Officers
| Name, Address, and Age | Positions Held with Allianz VIP and VIP FOF Trust | Term of Office(2)/Length of Time Served | Principal Occupation(s) During Past 5 Years | |||
Brian Muench (1970) 5701 Golden Hills Drive | President | Since 11/10 | President, Allianz Investment Management LLC, November 2010 to present; Vice President, Allianz Life, April 2011 to present. | |||
| Michael Radmer (1945) Dorsey & Whitney LLP, Suite 1500 50 South Sixth Street Minneapolis, MN 55402-1498 | Secretary | Since 02/02 | Senior Counsel (previously, Partner), Dorsey and Whitney LLP since 1976. | |||
| Bashir C. Asad (1963) Citi Fund Services Ohio, Inc. 4400 Easton Commons, Suite 200 Columbus, OH 43219 | Treasurer, Principal Accounting Officer and Principal Financial Officer | Since 06/16 | Senior Vice President, Citi Fund Services Ohio, Inc. | |||
| Chris R. Pheiffer (1968) 5701 Golden Hills Drive Minneapolis, MN 55416 | Chief Compliance Officer(4) and Anti-MoneyLaundering Compliance Officer | Since 02/14 | Chief Compliance Officer of the VIP Trust and the FOF Trust, February 2014 to present; Deputy Chief Compliance Officer of the VIP Trust and the FOF Trust and Compliance Director, Allianz Life, February 2007 to February 2014. |
| (1) | Member of the Audit Committee. |
| (2) | Indefinite. |
| (3) | Is an “interested person”, as defined by the 1940 Act, due to employment by Allianz. |
| (4) | The Manager and the Trust are parties to a Chief Compliance Officer Agreement under which the Manager is compensated by the Trust for providing an employee of the Manager or one of its affiliates to act as the Trust’s Chief Compliance Officer. The Chief Compliance Officer and Anti-Money Laundering Compliance Officer is not considered a corporate officer or executive employee of the Trust. |
19
The Allianz VIP Fund of Funds are distributed by Allianz Life Financial Services, LLC. These Funds are not FDIC Insured. | ANNRPT1217 2/18 |
AZL® MVP BlackRock Global Strategy Plus Fund
Annual Report
December 31, 2017

Management Discussion and Analysis
Page 1
Consolidated Expense Examples and Portfolio Composition
Page 3
Consolidated Schedule of Portfolio Investments
Page 4
Consolidated Statement of Assets and Liabilities
Page 21
Consolidated Statement of Operations
Page 21
Consolidated Statements of Changes in Net Assets
Page 22
Consolidated Financial Highlights
Page 23
Notes to the Consolidated Financial Statements
Page 24
Report of Independent Registered Public Accounting Firm
Page 37
Other Federal Income Tax Information
Page 38
Page 39
Approval of Investment Advisory Agreement
Page 40
Information about the Board of Trustees and Officers
Page 42
This report is submitted for the general information of the shareholder of the Fund. The report is not authorized for distribution to prospective investors in the Fund unless preceded or accompanied by an effective prospectus, which contains details concerning the sales charges and other pertinent information.
AZL® MVP BlackRock Global Strategy Plus Fund Review (Unaudited)
Allianz Investment Management LLC serves as the Manager for the AZL® MVP BlackRock Global Strategy Plus Fund.
|
What factors affected the Fund’s performance for the year ended December 31, 2017?
For the year ended December 31, 2017, the AZL® MVP BlackRock Global Strategy Plus Fund (the “Fund”) returned 11.54%. That compared to a 24.09%, 21.83%, 26.57%, 0.72%, 10.33% and a 13.81% total return for its benchmarks, the FTSE World Index1, the S&P 500 Index1, the FTSE World ex U.S. Index1, the ICE BofA Merrill Lynch 5-Year U.S. Treasury Bond Index1, the Citigroup Non-USD World Government Bond Index1, and the Reference Benchmark1, respectively.
The Fund is a fund of funds that invests primarily in a combination of three underlying mutual funds (the “Underlying Funds”), which are managed by the Manager. The Fund is designed to provide a diversified portfolio consisting of Underlying Funds in equity and fixed income asset classes, combined with the MVP (Managed Volatility Portfolio) risk management process intended to adjust the risk of the portfolio based on quantitative indicators of market risk, such as the current level of fund and market volatility.*
U.S. equity markets generated robust returns for the year, but generally underperformed international equities for the 12-month period. The S&P 500 Index gained 21.83%, while the FTSE World Ex US Index posted a stronger advance of 26.57%. Gains among European and Japanese stocks came amid positive corporate earnings reports and accommodative monetary policies from the Bank of Japan and European Central Bank. In the U.S., stocks were driven higher amid expectations of lower tax rates and higher growth rates—an environment that favored growth-oriented stocks.
Positive corporate earnings reports, healthy global economic growth and mild interest rates allowed investors to see past geopolitical tensions, most notably from a hostile North Korea.
In fixed income markets, investors began the year with an appetite for risk, which drove up prices on risk assets, particularly corporate and high-yield bonds. Demand was strong enough to absorb record levels of issuance, leading to narrowing credit spreads. Positive economic data and accommodative policy from most central banks—aside from the well-telegraphed interest rate increases from the Federal Reserve—made for modest but steady returns. Rising short-term rates and strong demand that pushed down yields on long-term bonds led to a dramatic flattening of the yield curve in the fourth quarter, following passage of the tax reform bill in the U.S.
The Fund underperformed its reference benchmark for the 12-month period. The Fund’s active component, AZL BlackRock Global Allocation Fund, underperformed the passive components, which are composed of AZL MSCI Global Equity Index Fund and AZL Enhanced Bond Index Fund.*
Within the Fund’s equities holdings, a higher-than-benchmark exposure to Japanese stocks dragged on relative performance as that country’s equities underperformed international markets.*
From a sector perspective, a below-benchmark exposure to information technology stocks dragged on relative results, as that sector outperformed for the period. Stock selection in the industrials sector also detracted. In addition, the Fund’s currency management strategy—particularly an above-benchmark exposure to the U.S. dollar and an underweight position in the euro—detracted from relative performance.*
The Fund’s relative performance benefited from an above-benchmark exposure to India, which was one of the top-performing markets for the period. Stock selection within the consumer discretionary and utilities sectors also benefited relative results. Stock selection among energy and telecommunications stocks also added.*
The Fund’s underweight position in fixed income contributed to relative results during a period in which stocks strongly outperformed bonds. Exposure to credit, particularly investment grade corporate bonds, added to results as credit spreads tightened.*
The MVP risk management process, which includes the use of derivatives, worked as intended during the period under review. Given that the period was marked by low volatility, the MVP process maintained a neutral equity allocation for the year relative to its target. The MVP process detracted slightly from relative results due to mismatches between the hedging instruments used and the target equity and fixed income exposure.*
Past performance does not guarantee future results.
| * | The Fund’s portfolio composition is subject to change. There is no guarantee that any sectors mentioned will continue to perform well or that securities in such sectors will be held by the Fund in the future. The information contained in this commentary is for informational purposes only and should not be construed as a recommendation to purchase or sell securities in the sector mentioned. The Fund’s holdings and weightings are as of December 31, 2017. |
| 1 | For a complete description of the Fund’s performance benchmarks please refer to page 2 of this report. |
1
AZL® MVP BlackRock Global Strategy Plus Fund Review (Unaudited)
Fund Objective
The Fund’s investment objective is to seek high total investment return. This objective may be changed by the Trustees of the Fund without shareholder approval. The Fund seeks to achieve its objective by investing primarily a combination of Underlying Funds, which are managed by the manager, combined with the MVP risk management process.
Investment Concerns
The Fund invests in underlying funds, so its investment performance is directly related to the performance of those underlying funds. Before investing, investors should assess the risks associated with and types of investments made by each of the underlying funds in which the Fund invests.
Returns on growth stocks may not move in tandem with returns on other categories of stocks or the market as a whole. Growth stocks may be susceptible to rapid price savings or to adverse developments in certain sectors of the market.
Emerging market investing may be subject to additional economic, political, liquidity, and currency risks not associated with more developed countries.
International investing may involve risk of capital loss from unfavorable fluctuations in currency values, from differences in generally accepted accounting principles or from economic or political instability in other nations.
Small- to mid-capitalization companies typically have a higher risk of failure and historically have experienced a greater degree of volatility.
Mortgage-backed investments involve risk of loss due to prepayments and, like any bond, due to default. Because of the sensitivity of mortgage-related securities to changes in interest rates, the Fund’s performance may be more volatile than if it did not hold these securities.
Debt securities held by the Fund may decline in value due to rising interest rates. Interest rates in the U.S. are at, or near, historic lows, which may increase the Fund’s exposure to risks related to rising rates.
Investing in derivatives instruments involves risks that may be different from or greater than the risk associated with investing directly in securities or other traditional instruments.
For a complete description of these and other risks associated with investing in a mutual Fund, please refer to the Fund’s prospectus. |
Growth of $10,000 Investment
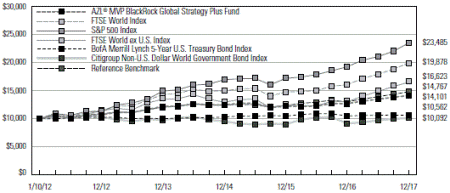
The chart above represents a comparison of a hypothetical investment in the Fund versus a similar investment in the Fund’s benchmark as well as the four component indices of the Fund’s benchmark, and represents the reinvestment of dividends and capital gains in the Fund.
Average Annual Total Returns as of December 31, 2017
| Since | ||||||||||||||||
| 1 | 3 | 5 | Inception | |||||||||||||
| Year | Year | Year | (1/10/12) | |||||||||||||
AZL® MVP BlackRock Global Strategy Plus Fund | 11.54 | % | 4.33 | % | 5.73 | % | 5.92 | % | ||||||||
FTSE World Index | 24.09 | % | 9.96 | % | 11.67 | % | 12.19 | % | ||||||||
S&P 500 Index | 21.83 | % | 11.41 | % | 15.79 | % | 15.36 | % | ||||||||
FTSE World ex U.S. Index | 26.57 | % | 8.34 | % | 7.52 | % | 8.88 | % | ||||||||
ICE BofA Merrill Lynch 5-Year U.S. Treasury Bond Index | 0.72 | % | 0.92 | % | 0.64 | % | 0.92 | % | ||||||||
Citigroup Non-U.S. Dollar World Government Bond Index | 10.33 | % | 1.99 | % | -0.29 | % | 0.15 | % | ||||||||
Reference Benchmark | 13.81 | % | 5.88 | % | 6.39 | % | 6.74 | % | ||||||||
Past performance does not guarantee future results. The performance data quoted represents past performance and current returns may be lower or higher. The investment return and principal value will fluctuate so that an investor’s shares, when redeemed may be worth more or less than the original cost. To obtain performance information current to the most recent month end, please visit www.Allianzlife.com.
Expense Ratio | Gross | |||
AZL® MVP BlackRock Global Strategy Plus Fund | 1.09 | % | ||
The above expense ratio is based on the current Fund prospectus dated May 1, 2017. The Manager and the Fund have entered into a written contract limiting operating expenses, excluding certain expenses (such as interest expenses, acquired fund fees and expenses and consolidated expenses) to 0.15% through April 30, 2019. Additional information pertaining to the December 31, 2017 expense ratios can be found in the financial highlights.
Acquired fund fees and expenses are incurred indirectly by the Fund through the valuation of the Fund’s investments in the other investment companies. Accordingly, acquired fund fees and expenses affect the Fund’s total returns. Because these fees and expenses are not included in the Fund’s financial highlights, the Fund’s total annual fund operating expenses, as shown in the current prospectus, do not correlate to the ratios of expenses to average net assets shown in the financial highlights table. Without acquired fund fees and expenses the Fund’s gross expense ratio would be 0.77%. The total return of the Fund does not reflect the effect of any insurance charges, the annual maintenance fee or the deduction of taxes that a shareholder would pay on Fund distributions or the redemption of Fund shares. Such charges, fees and tax payments would reduce the performance quoted.
The Fund’s performance is measured against the FTSE World Index, which is a market-capitalization weighted index representing the performance of the large- and mid-capitalization stocks from the FTSE Global Equity Index Series and covers 90-95% of the investable market capitalization. The S&P 500 is representative of 500 selected common stocks, most of which, are listed on the New York Stock Exchange, and is a measure of the U.S. Stock market as a whole. The FTSE World ex U.S. Index is part of a range of indexes designed to help U.S. investors benchmark their international investments. The index is comprised of (84%) large- and (16%) mid-cap stocks providing coverage of Developed and Emerging Markets (46 countries) excluding the U.S. The index is derived from the FTSE Global Equity Index Series, which covers 98% of the world’s investable market capitalization. The ICE BofA Merrill Lynch 5-Year U.S. Treasury Bond Index is designed to track the total return of the current coupon 5-Year U.S. Treasury bond. The Citigroup Non-U.S. Dollar World Government Bond Index is a market capitalization-weighted index that tracks 10 government bond indices, excluding the U.S. The Reference Benchmark is comprised of (30%) S&P 500; (20%) FTSE World ex U.S. Index; (30%) ICE BofA Merrill Lynch 5-Year U.S. Treasury Bond; and (20%) Citigroup Non-U.S. Dollar World Government Bond Index. These indexes are unmanaged and do not reflect the deduction of fees associated with a mutual fund, such as investment management and fund accounting fees. The Fund’s performance reflects the deduction of fees for services provided to the Fund. Investors cannot invest directly in an index.
2
AZL MVP BlackRock Global Strategy Plus Fund
Expense Examples
(Unaudited)
As a shareholder of the AZL MVP BlackRock Global Strategy Plus Fund (the “Fund”), you incur ongoing costs, including management fees, distribution fees, and other Fund expenses. These examples are intended to help you understand your ongoing costs (in dollars) of investing in the Fund and to compare these costs with the ongoing costs of investing in other mutual funds. Please note that the expenses shown in each table do not reflect expenses that apply to the subaccount or the insurance contract. If the expenses that apply to the subaccount of the insurance contract were included, your costs would have been higher.
These examples are based on an investment of $1,000 invested at the beginning of the period and held for the periods presented below.
The Actual Expense table below provides information about actual account values and actual expenses. You may use the information below, together with the amount you invested, to estimate the expenses that you paid over the period. Simply divide your account value by $1,000 (for example, an $8,600 account value divided by $1,000 = 8.6), then multiply the result by the number in the table under the heading entitled “Expenses Paid During Period” to estimate the expenses you paid on your account during this period.
| Beginning Account Value 7/1/17 | Ending Account Value 12/31/17 | Expenses Paid During Period 7/1/17 - 12/31/17* | Annualized Expense Ratio During Period 7/1/17 - 12/31/17 | |||||||||||||||||
AZL MVP BlackRock Global Strategy Plus Fund | $ | 1,000.00 | $ | 1,048.80 | $ | 3.51 | 0.68 | % | ||||||||||||
The Hypothetical Expense table below provides information about hypothetical account values and hypothetical expenses based on the Fund’s actual expense ratio and an assumed rate of return of 5% per year before expenses, which is not the Fund’s actual return. The hypothetical account values and expenses may not be used to estimate the actual ending account balance or expenses you paid for the period. You may use this information to compare this 5% hypothetical example with the 5% hypothetical examples that appear in the shareholder reports of other funds.
| Beginning Account Value 7/1/17 | Ending Account Value 12/31/17 | Expenses Paid During Period 7/1/17 - 12/31/17* | Annualized Expense Ratio During Period 7/1/17 - 12/31/17 | |||||||||||||||||
AZL MVP BlackRock Global Strategy Plus Fund | $ | 1,000.00 | $ | 1,021.78 | $ | 3.47 | 0.68 | % | ||||||||||||
| * | Expenses are equal to the average account value over the period, multiplied by the Fund’s annualized expense ratio, multiplied by 184/365 (to reflect the one half year period). |
Consolidated Portfolio Composition
(Unaudited)
| Investments | Percent of Net Assets | ||||
Affiliated Investment Companies | 45.0 | % | |||
Common Stocks | 28.0 | ||||
U.S. Treasury Obligations | 10.9 | ||||
Foreign Bonds | 4.1 | ||||
Securities Held as Collateral for Securities on Loan | 2.1 | ||||
Exchange Traded Funds | 1.9 | ||||
Yankee Dollars | 1.3 | ||||
Corporate Bonds | 1.2 | ||||
Money Markets | 1.1 | ||||
Convertible Preferred Stocks | 0.5 | ||||
Preferred Stocks | 0.4 | ||||
Bank Loans | 0.2 | ||||
Options | 0.1 | ||||
Convertible Bonds | 0.2 | ||||
Collateralized Mortgage Obligations | 0.1 | ||||
Private Placements | — | ^ | |||
Warrants | — | ^ | |||
|
| ||||
Total Investment Securities | 97.0 | ||||
Net other assets (liabilities) | 3.0 | ||||
|
| ||||
Net Assets | 100.0 | % | |||
|
| ||||
| ^ | Represents less than 0.05% |
| Investments* | Percent of Net Assets | ||||
United States | 77.8 | % | |||
Japan | 4.7 | ||||
United Kingdom | 1.9 | ||||
France | 1.4 | ||||
Germany | 1.3 | ||||
Australia | 1.1 | ||||
Brazil | 0.9 | ||||
Netherlands | 0.9 | ||||
Switzerland | 0.7 | ||||
India | 0.7 | ||||
All other countries | 5.7 | ||||
|
| ||||
Total Investment Securities | 97.1 | ||||
Net other assets (liabilities) | 2.9 | ||||
|
| ||||
Net Assets | 100.0 | % | |||
|
| ||||
| * | The portfolio composition percent of net assets by country does not include geographical information of the investments of the Affiliated Investment Companies held by the Fund. |
3
AZL MVP BlackRock Global Strategy Plus Fund
Consolidated Schedule of Portfolio Investments
December 31, 2017
| Shares | Fair Value | |||||||
| Common Stocks (28.0%): | ||||||||
| Aerospace & Defense (0.4%): | ||||||||
| 73,962 | BAE Systems plc(a) | $ | 568,752 | |||||
| 358 | Boeing Co. (The)(a) | 105,577 | ||||||
| 452 | Dassault Aviation SA(a) | 702,591 | ||||||
| 310 | General Dynamics Corp.(a) | 63,070 | ||||||
| 72,578 | Meggitt plc(a) | 469,854 | ||||||
| 264 | Northrop Grumman Corp.(a) | 81,024 | ||||||
| 300 | Raytheon Co.(a) | 56,355 | ||||||
| 9,619 | Safran SA(a) | 988,995 | ||||||
| 19 | Thales SA(a) | 2,044 | ||||||
| 15 | United Technologies Corp.(a) | 1,914 | ||||||
|
| |||||||
| 3,040,176 | ||||||||
|
| |||||||
| Air Freight & Logistics (0.0%): | ||||||||
| 243 | Deutsche Post AG(a) | 11,542 | ||||||
|
| |||||||
| Airlines (0.5%): | ||||||||
| 34,660 | Azul SA, ADR*^(a) | 825,947 | ||||||
| 705 | Delta Air Lines, Inc.(a) | 39,480 | ||||||
| 41,000 | Japan Airlines Co., Ltd.(a) | 1,604,541 | ||||||
| 27,856 | United Continental Holdings, Inc.*(a) | 1,877,494 | ||||||
|
| |||||||
| 4,347,462 | ||||||||
|
| |||||||
| Auto Components (0.9%): | ||||||||
| 9,300 | Aisin Sieki Co., Ltd.(a) | 522,627 | ||||||
| 34,100 | Bridgestone Corp.(a) | 1,586,066 | ||||||
| 51,683 | Cheng Shin Rubber Industry Co., Ltd.(a) | 91,198 | ||||||
| 4,229 | Compagnie Generale des Establissements Michelin SCA, Class B(a) | 605,706 | ||||||
| 22,200 | Denso Corp.(a) | 1,333,023 | ||||||
| 2,400 | Exedy Corp.(a) | 74,266 | ||||||
| 754 | Goodyear Tire & Rubber Co.^(a) | 24,362 | ||||||
| 5,000 | Koito Manufacturing Co., Ltd.(a) | 351,632 | ||||||
| 315 | Lear Corp.(a) | 55,648 | ||||||
| 191 | Magna International(a) | 10,827 | ||||||
| 2,400 | Stanley Electric Co., Ltd.(a) | 97,489 | ||||||
| 30,600 | Sumitomo Electric Industries, Ltd.(a) | 516,421 | ||||||
| 25,200 | Toyota Industries Corp.(a) | 1,620,031 | ||||||
|
| |||||||
| 6,889,296 | ||||||||
|
| |||||||
| Automobiles (0.4%): | ||||||||
| 140,000 | Brilliance China Automotive Holdings, Ltd.(a) | 371,968 | ||||||
| 2,000 | Dongfeng Motor Corp., Series H(a) | 2,421 | ||||||
| 236 | Ford Motor Co.(a) | 2,948 | ||||||
| 18,600 | Fuji Heavy Industries, Ltd.(a) | 588,970 | ||||||
| 72 | General Motors Co.(a) | 2,951 | ||||||
| 2,633 | Hero MotoCorp, Ltd.(a) | 156,101 | ||||||
| 4,355 | Maruti Suzuki India, Ltd.(a) | 662,876 | ||||||
| 600 | Mazda Motor Corp.(a) | 8,052 | ||||||
| 37,100 | Suzuki Motor Corp.(a) | 2,149,121 | ||||||
| 87 | Tata Motors, Ltd.*(a) | 585 | ||||||
| 500 | Tata Motors, Ltd., Class A*(a) | 1,898 | ||||||
|
| |||||||
| 3,947,891 | ||||||||
|
| |||||||
| Banks (2.2%): | ||||||||
| 29,662 | ABN AMRO Group NV(a) | 954,351 | ||||||
| 15,000 | Agricultural Bank of China, Ltd.(a) | 6,981 | ||||||
| Shares | Fair Value | |||||||
| Common Stocks, continued | ||||||||
| Banks, continued | ||||||||
| 576 | Banco do Brasil SA(a) | $ | 5,527 | |||||
| 147,147 | Bank of America Corp.(a) | 4,343,780 | ||||||
| 12,000 | Bank of China, Ltd.(a) | 5,889 | ||||||
| 3,000 | Bank of Communications Co., Ltd., Class H(a) | 2,224 | ||||||
| 4 | Bank of Montreal(a) | 320 | ||||||
| 112 | Bank of Nova Scotia(a) | 7,229 | ||||||
| 253 | Barclays Africa Group, Ltd.(a) | 3,734 | ||||||
| 2,027 | Barclays plc(a) | 5,526 | ||||||
| 90 | BNP Paribas SA(a) | 6,711 | ||||||
| 12,000 | China Construction Bank(a) | 11,038 | ||||||
| 32,208 | Citigroup, Inc.(a) | 2,396,597 | ||||||
| 6 | Credicorp, Ltd.(a) | 1,245 | ||||||
| 1,049 | Criteria Caixacorp SA(a) | 4,879 | ||||||
| 197 | Danske Bank A/S(a) | 7,660 | ||||||
| 201 | DnB NOR ASA(a) | 3,718 | ||||||
| 1,502 | Fifth Third Bancorp^(a) | 45,571 | ||||||
| 144 | Grupo Financiero Banorte SAB de C.V.(a) | 791 | ||||||
| 95 | Hana Financial Holdings Group, Inc.(a) | 4,421 | ||||||
| 217,505 | HSBC Holdings plc(a) | 2,242,711 | ||||||
| 8,000 | Industrial & Commercial Bank of China(a) | 6,416 | ||||||
| 75,541 | ING Groep NV(a) | 1,389,844 | ||||||
| 13,874 | JPMorgan Chase & Co.(a) | 1,483,686 | ||||||
| 47,849 | Kotak Mahindra Bank, Ltd.(a) | 756,786 | ||||||
| 14,698 | Lloyds Banking Group plc(a) | 13,456 | ||||||
| 600 | Mitsubishi UFJ Financial Group, Inc.(a) | 4,403 | ||||||
| 122 | National Australia Bank, Ltd.(a) | 2,806 | ||||||
| 260 | Nordea Bank AB(a) | 3,148 | ||||||
| 700 | Resona Holdings, Inc.(a) | 4,184 | ||||||
| 128 | Royal Bank of Canada(a) | 10,454 | ||||||
| 325 | Skandinaviska Enskilda Banken AB, Class A(a) | 3,809 | ||||||
| 98 | Societe Generale(a) | 5,052 | ||||||
| 96,283 | State Bank of India(a) | 466,486 | ||||||
| 41,300 | Sumitomo Mitsui Financial Group, Inc.(a) | 1,783,984 | ||||||
| 10,333 | SunTrust Banks, Inc.(a) | 667,408 | ||||||
| 14 | Swedbank AB, Class A(a) | 337 | ||||||
| 46 | Toronto-Dominion Bank (The)(a) | 2,696 | ||||||
| 26 | Wells Fargo & Co.(a) | 1,577 | ||||||
| 142 | Woori Bank(a) | 2,088 | ||||||
| 48,846 | Yes Bank, Ltd.(a) | 240,792 | ||||||
|
| |||||||
| 16,910,315 | ||||||||
|
| |||||||
| Beverages (0.2%): | ||||||||
| 15,072 | Anheuser-Busch InBev NV(a) | 1,680,968 | ||||||
| 10 | Brown-Forman Corp., Class B^(a) | 687 | ||||||
| 3 | Carlsberg A/S, Class B(a) | 359 | ||||||
| 267 | Coca-Cola Co. (The)(a) | 12,250 | ||||||
| 361 | Constellation Brands, Inc., Class C(a) | 82,514 | ||||||
| 44 | Diageo plc(a) | 1,610 | ||||||
| 100 | Kirin Holdings Co., Ltd.(a) | 2,516 | ||||||
| 1,526 | PepsiCo, Inc.(a) | 182,997 | ||||||
|
| |||||||
| 1,963,901 | ||||||||
|
| |||||||
Continued
4
AZL MVP BlackRock Global Strategy Plus Fund
Consolidated Schedule of Portfolio Investments
December 31, 2017
| Shares | Fair Value | |||||||
| Common Stocks, continued | ||||||||
| Biotechnology (0.3%): | ||||||||
| 822 | AbbVie, Inc.(a) | $ | 79,496 | |||||
| 551 | Amgen, Inc.(a) | 95,819 | ||||||
| 597 | Biogen Idec, Inc.*(a) | 190,186 | ||||||
| 112 | Celgene Corp.*(a) | 11,688 | ||||||
| 24,464 | Gilead Sciences, Inc.(a) | 1,752,601 | ||||||
| 4,128 | Tesaro, Inc.*^(a) | 342,087 | ||||||
|
| |||||||
| 2,471,877 | ||||||||
|
| |||||||
| Building Products (0.3%): | ||||||||
| 100 | Asahi Glass Co., Ltd.(a) | 4,326 | ||||||
| 10,975 | Compagnie de Saint-Gobain SA(a) | 603,943 | ||||||
| 4,700 | Daikin Industries, Ltd.(a) | 556,518 | ||||||
| 10,737 | Fortune Brands Home & Security, Inc.(a) | 734,840 | ||||||
| 1,923 | Masco Corp.(a) | 84,497 | ||||||
| 5,000 | Nichias Corp.(a) | 66,562 | ||||||
|
| |||||||
| 2,050,686 | ||||||||
|
| |||||||
| Capital Markets (1.0%): | ||||||||
| 314 | Ameriprise Financial, Inc.(a) | 53,214 | ||||||
| 852 | Bank of New York Mellon Corp. (The)(a) | 45,889 | ||||||
| 28,770 | Charles Schwab Corp. (The)(a) | 1,477,914 | ||||||
| 32 | Franklin Resources, Inc.(a) | 1,387 | ||||||
| 5,497 | Goldman Sachs Group, Inc. (The)(a) | 1,400,416 | ||||||
| 100 | Hong Kong Exchanges & Clearing, Ltd.(a) | 3,055 | ||||||
| 38 | Moody’s Corp.(a) | 5,609 | ||||||
| 53,674 | Morgan Stanley(a) | 2,816,274 | ||||||
| 54 | Northern Trust Corp.(a) | 5,394 | ||||||
| 337 | State Street Corp.(a) | 32,895 | ||||||
| 244 | Thomson Reuters Corp.(a) | 10,637 | ||||||
| 127,367 | UBS Group AG(a) | 2,340,869 | ||||||
|
| |||||||
| 8,193,553 | ||||||||
|
| |||||||
| Chemicals (1.6%): | ||||||||
| 32 | Agrium, Inc.(a) | 3,681 | ||||||
| 15,239 | Air Products & Chemicals, Inc.(a) | 2,500,415 | ||||||
| 52,500 | Asahi Kasei Corp.(a) | 676,397 | ||||||
| 25,722 | Axalta Coating Systems, Ltd.*(a) | 832,364 | ||||||
| 95 | BASF SE(a) | 10,425 | ||||||
| 15,400 | Daicel Chemical Industries, Ltd.(a) | 175,274 | ||||||
| 46,106 | DowDuPont, Inc.(a) | 3,283,670 | ||||||
| 14,744 | Evonik Industries AG(a) | 553,077 | ||||||
| 32,000 | Formosa Chemicals & Fibre Corp.(a) | 110,715 | ||||||
| 34,000 | Formosa Plastics Corp.(a) | 112,677 | ||||||
| 15,600 | Hitachi Chemical Co., Ltd.(a) | 400,877 | ||||||
| 767 | Huntsman Corp.(a) | 25,533 | ||||||
| 5,200 | Kuraray Co., Ltd.(a) | 98,162 | ||||||
| 554 | LG Chem, Ltd.(a) | 209,384 | ||||||
| 6 | Lotte Chemical Corp.(a) | 2,058 | ||||||
| 79 | Lyondellbasell Industries NV(a) | 8,715 | ||||||
| 123 | Monsanto Co.(a) | 14,364 | ||||||
| 43,000 | Nan Ya Plastics Corp.(a) | 112,539 | ||||||
| 8,100 | Nitto Denko Corp.(a) | 720,061 | ||||||
| 22 | Praxair, Inc.(a) | 3,403 | ||||||
| 70,800 | PTT Global Chemical Public Co., Ltd.(a) | 184,517 | ||||||
| Shares | Fair Value | |||||||
| Common Stocks, continued | ||||||||
| Chemicals, continued | ||||||||
| 18,400 | Shin-Etsu Chemical Co., Ltd.(a) | $ | 1,866,466 | |||||
| 5,000 | Toagosei Co., Ltd.(a) | 63,426 | ||||||
| 56,600 | Toray Industries, Inc.(a) | 533,937 | ||||||
| 14,400 | Ube Industries, Ltd.(a) | 423,877 | ||||||
|
| |||||||
| 12,926,014 | ||||||||
|
| |||||||
| Commercial Services & Supplies (0.0%): | ||||||||
| 27 | Republic Services, Inc., Class A(a) | 1,825 | ||||||
| 57 | Waste Management, Inc.(a) | 4,920 | ||||||
|
| |||||||
| 6,745 | ||||||||
|
| |||||||
| Communications Equipment (0.3%): | ||||||||
| 132 | Cisco Systems, Inc.(a) | 5,056 | ||||||
| 33,036 | CommScope Holding Co., Inc.*^(a) | 1,249,752 | ||||||
| 18 | Motorola Solutions, Inc.^(a) | 1,626 | ||||||
| 214,598 | Nokia OYJ(a) | 1,002,229 | ||||||
|
| |||||||
| 2,258,663 | ||||||||
|
| |||||||
| Construction & Engineering (0.2%): | ||||||||
| 4,100 | ComSys Holdings Corp.(a) | 118,703 | ||||||
| 12,500 | Kinden Corp.(a) | 203,504 | ||||||
| 2,000 | Kyudenko Corp.(a) | 96,419 | ||||||
| 5,000 | Maeda Road Construction Co., Ltd.(a) | 114,647 | ||||||
| 5,000 | Nippo Corp.(a) | 116,843 | ||||||
| 4,600 | Okumura Corp.(a) | 189,292 | ||||||
| 22,000 | Toda Corp.(a) | 176,361 | ||||||
| 6,430 | Vinci SA(a) | 655,953 | ||||||
|
| |||||||
| 1,671,722 | ||||||||
|
| |||||||
| Construction Materials (0.0%): | ||||||||
| 16,108 | Cemex SAB de C.V.*(a) | 12,053 | ||||||
| 11,000 | Siam Cement PCL(a) | 165,180 | ||||||
|
| |||||||
| 177,233 | ||||||||
|
| |||||||
| Consumer Finance (0.0%): | ||||||||
| 1,079 | Ally Financial, Inc.(a) | 31,464 | ||||||
| 89 | American Express Co.(a) | 8,839 | ||||||
| 562 | Capital One Financial Corp.(a) | 55,964 | ||||||
| 731 | Discover Financial Services(a) | 56,228 | ||||||
|
| |||||||
| 152,495 | ||||||||
|
| |||||||
| Containers & Packaging (0.1%): | ||||||||
| 94 | Amcor, Ltd.(a) | 1,129 | ||||||
| 776 | Crown Holdings, Inc.*(a) | 43,650 | ||||||
| 1,075 | International Paper Co.(a) | 62,286 | ||||||
| 673 | Packaging Corp. of America(a) | 81,130 | ||||||
| 11,291 | WestRock Co.(a) | 713,704 | ||||||
|
| |||||||
| 901,899 | ||||||||
|
| |||||||
| Distributors (0.0%): | ||||||||
| 3,400 | Canon Marketing Japan, Inc.(a) | 91,785 | ||||||
|
| |||||||
| Diversified Consumer Services (0.0%): | ||||||||
| 90 | New Oriental Education & Technology Group, Inc., ADR(a) | 8,460 | ||||||
|
| |||||||
| Diversified Financial Services (0.0%): | ||||||||
| 365 | AMP, Ltd.(a) | 1,474 | ||||||
| 897 | Berkshire Hathaway, Inc., Class B*(a) | 177,803 | ||||||
Continued
5
AZL MVP BlackRock Global Strategy Plus Fund
Consolidated Schedule of Portfolio Investments
December 31, 2017
| Shares | Fair Value | |||||||
| Common Stocks, continued | ||||||||
| Diversified Financial Services, continued | ||||||||
| 79,000 | Fubon Financial Holdings Co., Ltd.(a) | $ | 134,444 | |||||
| 346 | Rmb Holdings, Ltd.(a) | 2,210 | ||||||
|
| |||||||
| 315,931 | ||||||||
|
| |||||||
| Diversified Telecommunication Services (0.8%): | ||||||||
| 189 | AT&T, Inc.(a) | 7,348 | ||||||
| 51,559 | Cellnex Telecom SAU(a) | 1,319,467 | ||||||
| 4,000 | China Telecom Corp., Ltd., Class H(a) | 1,903 | ||||||
| 200,000 | Chunghwa Telecom Co., Ltd.(a) | 712,379 | ||||||
| 34,000 | Deutsche Telekom AG, Registered Shares(a) | 602,903 | ||||||
| 12,293 | El Towers SpA(a) | 788,422 | ||||||
| 80,000 | HKT Trust & HKT, Ltd.(a) | 102,022 | ||||||
| 2,900 | Nippon Telegraph & Telephone Corp.(a) | 136,479 | ||||||
| 66,100 | Singapore Telecommunications, Ltd.(a) | 176,476 | ||||||
| 1,156,044 | Telecom Italia SpA*(a) | 997,849 | ||||||
| 29,641 | Telecom Italia RSP(a) | 21,169 | ||||||
| 506 | Telefonica SA(a) | 4,926 | ||||||
| 104 | Telenor ASA(a) | 2,228 | ||||||
| 408 | Telstra Corp., Ltd.(a) | 1,155 | ||||||
| 22,669 | Verizon Communications, Inc.(a) | 1,199,870 | ||||||
|
| |||||||
| 6,074,596 | ||||||||
|
| |||||||
| Electric Utilities (0.3%): | ||||||||
| 7,397 | CEZ(a) | 172,618 | ||||||
| 14,500 | CK Infrastructure Holdings, Ltd.(a) | 124,481 | ||||||
| 15,000 | CLP Holdings, Ltd.(a) | 153,504 | ||||||
| 170,709 | Enel SpA(a) | 1,049,152 | ||||||
| 13 | FirstEnergy Corp.(a) | 398 | ||||||
| 13,000 | Hongkong Electric Holdings, Ltd.(a) | 109,714 | ||||||
| 13,251 | NextEra Energy, Inc.(a) | 2,069,674 | ||||||
| 103 | PG&E Corp.(a) | 4,617 | ||||||
| 1,755 | PGE SA*(a) | 6,076 | ||||||
| 297 | Scottish & Southern Energy plc(a) | 5,290 | ||||||
|
| |||||||
| 3,695,524 | ||||||||
|
| |||||||
| Electrical Equipment (0.2%): | ||||||||
| 154 | ABB, Ltd.(a) | 4,119 | ||||||
| 134 | Eaton Corp. plc(a) | 10,587 | ||||||
| 24 | Emerson Electric Co.(a) | 1,673 | ||||||
| 16,000 | GS Yuasa Corp.(a) | 79,705 | ||||||
| 3,000 | Mabuchi Motor Co., Ltd.(a) | 161,971 | ||||||
| 93,600 | Mitsubishi Electric Corp.(a) | 1,555,442 | ||||||
| 274 | Rockwell Automation, Inc.(a) | 53,799 | ||||||
|
| |||||||
| 1,867,296 | ||||||||
|
| |||||||
| Electronic Equipment, Instruments & Components (0.1%): | ||||||||
| 120 | Corning, Inc.(a) | 3,839 | ||||||
| 2,000 | Hitachi, Ltd.(a) | 15,560 | ||||||
| 40,400 | Hon Hai Precision Industry Co., Ltd.(a) | 128,729 | ||||||
| 7,000 | Innolux Corp.(a) | 2,912 | ||||||
| 5,000 | Japan Aviation Electronics Industry, Ltd.(a) | 84,666 | ||||||
| 300 | Keyence Corp.(a) | 167,532 | ||||||
| 60 | LG Display Co., Ltd.(a) | 1,676 | ||||||
| 6,500 | Murata Manufacturing Co., Ltd.(a) | 868,870 | ||||||
|
| |||||||
| 1,273,784 | ||||||||
|
| |||||||
| Shares | Fair Value | |||||||
| Common Stocks, continued | ||||||||
| Energy Equipment & Services (0.1%): | ||||||||
| 84 | Halliburton Co.(a) | $ | 4,105 | |||||
| 595 | Helmerich & Payne, Inc.(a) | 38,461 | ||||||
| 9,259 | Schlumberger, Ltd.(a) | 623,964 | ||||||
|
| |||||||
| 666,530 | ||||||||
|
| |||||||
| Equity Real Estate Investment Trusts (0.1%): | ||||||||
| 621 | American Tower Corp.(a) | 88,598 | ||||||
| 142 | Equity Residential Property Trust(a) | 9,055 | ||||||
| 195 | HCP, Inc.(a) | 5,086 | ||||||
| 18,500 | Link REIT (The)(a) | 171,437 | ||||||
| 834 | Stockland Trust Group(a) | 2,917 | ||||||
| 2,585 | Unibail-Rodamco SE(a) | 651,150 | ||||||
| 49 | Vornado Realty Trust(a) | 3,831 | ||||||
| 148 | Weyerhaeuser Co.(a) | 5,218 | ||||||
|
| |||||||
| 937,292 | ||||||||
|
| |||||||
| Food & Staples Retailing (0.2%): | ||||||||
| 35 | Costco Wholesale Corp.(a) | 6,514 | ||||||
| 18,136 | CVS Health Corp.(a) | 1,314,861 | ||||||
| 2,850 | Jeronimo Martins SGPS SA(a) | 55,341 | ||||||
| 12 | Koninklijke Ahold Delhaize NV(a) | 263 | ||||||
| 1,400 | Seven & I Holdings Co., Ltd.(a) | 58,156 | ||||||
| 7 | Sysco Corp.(a) | 425 | ||||||
| 149 | Walgreens Boots Alliance, Inc.(a) | 10,820 | ||||||
| 115 | Wal-Mart Stores, Inc.(a) | 11,356 | ||||||
| 69 | Wesfarmers, Ltd.(a) | 2,389 | ||||||
| 334 | Woolworths, Ltd.(a) | 7,108 | ||||||
|
| |||||||
| 1,467,233 | ||||||||
|
| |||||||
| Food Products (0.7%): | ||||||||
| 46,600 | Ajinomoto Co., Inc.(a) | 878,272 | ||||||
| 94 | Associated British Foods plc(a) | 3,573 | ||||||
| 350 | ConAgra Foods, Inc.(a) | 13,185 | ||||||
| 38,863 | Danone SA(a) | 3,257,781 | ||||||
| 1,173 | JBS SA(a) | 3,470 | ||||||
| 3,023 | Mondelez International, Inc., Class A(a) | 129,383 | ||||||
| 32,090 | Nestle SA, Registered Shares(a) | 2,758,271 | ||||||
| 137 | Tiger Brands, Ltd.(a) | 5,109 | ||||||
| 522 | Tyson Foods, Inc., Class A(a) | 42,319 | ||||||
| 85,000 | Uni-President Enterprises Corp.(a) | 188,458 | ||||||
| 125,000 | Want Want China Holdings, Ltd.(a) | 104,587 | ||||||
| 6,500 | WH Group, Ltd.(a) | 7,327 | ||||||
| 900 | Wilmar International, Ltd.(a) | 2,075 | ||||||
|
| |||||||
| 7,393,810 | ||||||||
|
| |||||||
| Gas Utilities (0.2%): | ||||||||
| 327 | GAIL India, Ltd.(a) | 2,553 | ||||||
| 12,748 | Gas Natural SDG SA(a) | 294,102 | ||||||
| 59,500 | Tokyo Gas Co., Ltd.(a) | 1,358,957 | ||||||
|
| |||||||
| 1,655,612 | ||||||||
|
| |||||||
| Health Care Equipment & Supplies (0.3%): | ||||||||
| 3,159 | Baxter International, Inc.(a) | 204,198 | ||||||
| 152 | Boston Scientific Corp.*(a) | 3,768 | ||||||
| 18,000 | HOYA Corp.(a) | 899,542 | ||||||
Continued
6
AZL MVP BlackRock Global Strategy Plus Fund
Consolidated Schedule of Portfolio Investments
December 31, 2017
| Shares | Fair Value | |||||||
| Common Stocks, continued | ||||||||
| Health Care Equipment & Supplies, continued | ||||||||
| 1,508 | Medtronic plc(a) | $ | 121,771 | |||||
| 100 | Olympus Co., Ltd.(a) | 3,829 | ||||||
| 826 | Stryker Corp.(a) | 127,898 | ||||||
| 12,748 | Zimmer Holdings, Inc.(a) | 1,538,301 | ||||||
|
| |||||||
| 2,899,307 | ||||||||
|
| |||||||
| Health Care Providers & Services (0.9%): | ||||||||
| 18,144 | Acadia Healthcare Co., Inc.*^(a) | 592,039 | ||||||
| 521 | Aetna, Inc.(a) | 93,983 | ||||||
| 4,100 | Alfresa Holdings Corp.(a) | 96,242 | ||||||
| 5,524 | Anthem, Inc.(a) | 1,242,955 | ||||||
| 217 | Express Scripts Holding Co.*(a) | 16,197 | ||||||
| 24,733 | HCA Holdings, Inc.*(a) | 2,172,547 | ||||||
| 187 | McKesson Corp.(a) | 29,163 | ||||||
| 4,700 | Medipal Holdings Corp.(a) | 92,055 | ||||||
| 39,737 | NMC Health plc(a) | 1,547,343 | ||||||
| 606,122 | PT Siloam International Hospital Tbk*(a) | 427,596 | ||||||
| 2,100 | Suzuken Co., Ltd.(a) | 86,421 | ||||||
| 31,311 | Tenet Healthcare Corp.*^(a) | 474,675 | ||||||
| 979 | UnitedHealth Group, Inc.(a) | 215,830 | ||||||
|
| |||||||
| 7,087,046 | ||||||||
|
| |||||||
| Hotels, Restaurants & Leisure (0.2%): | ||||||||
| 225 | Carnival Corp., Class A(a) | 14,933 | ||||||
| 18 | Compass Group plc(a) | 389 | ||||||
| 10,200 | Genting Singapore plc(a) | 9,970 | ||||||
| 60 | Hilton Worldwide Holdings, Inc.(a) | 4,792 | ||||||
| 215 | Las Vegas Sands Corp.(a) | 14,940 | ||||||
| 589 | McDonald’s Corp.(a) | 101,379 | ||||||
| 28,573 | MGM Resorts International(a) | 954,052 | ||||||
| 322 | Royal Caribbean Cruises, Ltd.(a) | 38,408 | ||||||
| 5,226 | Sodexo SA(a) | 701,588 | ||||||
| 662 | Wyndham Worldwide Corp.(a) | 76,706 | ||||||
| 400 | Wynn Resorts, Ltd.(a) | 67,436 | ||||||
| 70 | Yum China Holdings, Inc.(a) | 2,801 | ||||||
|
| |||||||
| 1,987,394 | ||||||||
|
| |||||||
| Household Durables (0.3%): | ||||||||
| 2,800 | Alpine Electronics, Inc.(a) | 58,007 | ||||||
| 11,076 | Berkeley Group Holdings plc (The)(a) | 627,071 | ||||||
| 1,485 | Coway Co., Ltd.(a) | 135,315 | ||||||
| 5,268 | Mohawk Industries, Inc.*(a) | 1,453,441 | ||||||
| 400 | Panasonic Corp.(a) | 5,859 | ||||||
| 200 | Sony Corp.(a) | 8,985 | ||||||
|
| |||||||
| 2,288,678 | ||||||||
|
| |||||||
| Household Products (0.0%): | ||||||||
| 1,498 | Colgate-Palmolive Co.(a) | 113,024 | ||||||
| 227 | Hindustan Unilever, Ltd.(a) | 4,856 | ||||||
| 38 | Kimberly-Clark Corp.(a) | 4,585 | ||||||
| 256 | Procter & Gamble Co. (The)(a) | 23,521 | ||||||
| 31 | Reckitt Benckiser Group plc(a) | 2,895 | ||||||
| 200 | Unicharm Corp.(a) | 5,200 | ||||||
|
| |||||||
| 154,081 | ||||||||
|
| |||||||
| Shares | Fair Value | |||||||
| Common Stocks, continued | ||||||||
| Independent Power & Renewable Electricity Producers (0.1%): | ||||||||
| 4,000 | China Resources Power Holdings Co.(a) | $ | 7,448 | |||||
| 14,067 | NextEra Energy Partners LP^(a) | 606,429 | ||||||
| 10,679 | Vistra Energy Corp.*^(a) | 195,639 | ||||||
|
| |||||||
| 809,516 | ||||||||
|
| |||||||
| Industrial Conglomerates (0.7%): | ||||||||
| 240 | 3M Co., Class C(a) | 56,489 | ||||||
| 93,186 | General Electric Co.(a) | 1,626,096 | ||||||
| 2,000 | Jardine Matheson Holdings, Ltd.(a) | 121,429 | ||||||
| 75,244 | Koninklijke Philips Electronics NV(a) | 2,846,238 | ||||||
| 3,708 | Siemens AG, Registered Shares(a) | 514,418 | ||||||
| 29,751 | Smiths Group plc(a) | 595,059 | ||||||
| 4,000 | Toshiba Corp.*^(a) | 11,245 | ||||||
|
| |||||||
| 5,770,974 | ||||||||
|
| |||||||
| Insurance (0.7%): | ||||||||
| 10,427 | Allstate Corp. (The)(a) | 1,091,811 | ||||||
| 51 | American International Group, Inc.(a) | 3,039 | ||||||
| 78 | Aon plc(a) | 10,452 | ||||||
| 278 | Aviva plc(a) | 1,900 | ||||||
| 33,007 | AXA SA(a) | 978,156 | ||||||
| 75,000 | Cathay Financial Holding Co., Ltd.(a) | 134,516 | ||||||
| 6,959 | Chubb, Ltd.(a) | 1,016,919 | ||||||
| 2,275 | Hartford Financial Services Group, Inc. (The)(a) | 128,037 | ||||||
| 1,727 | Legal & General Group plc(a) | 6,356 | ||||||
| 10,324 | Marsh & McLennan Cos., Inc.(a) | 840,270 | ||||||
| 24,886 | MetLife, Inc.(a) | 1,258,236 | ||||||
| 2 | Muenchener Rueckversicherungs-Gesellschaft AG(a) | 434 | ||||||
| 12 | Progressive Corp. (The)(a) | 676 | ||||||
| 502 | Prudential Financial, Inc.(a) | 57,720 | ||||||
| 53 | Prudential plc(a) | 1,362 | ||||||
| 364 | Reinsurance Group of America, Inc.(a) | 56,759 | ||||||
| 4,671 | SBI Life Insurance Co., Ltd.*(a) | 50,955 | ||||||
| 15 | Swiss Re AG(a) | 1,404 | ||||||
| 19,500 | Tokio Marine Holdings, Inc.(a) | 890,126 | ||||||
| 1,202 | Travelers Cos., Inc. (The)(a) | 163,039 | ||||||
| 35 | Zurich Insurance Group AG(a) | 10,647 | ||||||
|
| |||||||
| 6,702,814 | ||||||||
|
| |||||||
| Internet & Direct Marketing Retail (0.6%): | ||||||||
| 3,625 | Amazon.com, Inc.*(a) | 4,239,328 | ||||||
| 149 | Expedia, Inc.(a) | 17,846 | ||||||
| 7 | Priceline Group, Inc. (The)*(a) | 12,164 | ||||||
| 200 | Rakuten, Inc.(a) | 1,829 | ||||||
| 16,758 | TripAdvisor, Inc.*^(a) | 577,481 | ||||||
|
| |||||||
| 4,848,648 | ||||||||
|
| |||||||
| Internet Software & Services (1.3%): | ||||||||
| 4,334 | Alibaba Group Holding, Ltd., ADR*^(a) | 747,311 | ||||||
| 24 | Alphabet, Inc., Class A*(a) | 25,282 | ||||||
| 4,113 | Alphabet, Inc., Class C*(a) | 4,303,844 | ||||||
| 55,564 | Cloudera, Inc.*^(a) | 917,917 | ||||||
| 95,700 | Dropbox, Inc.*(a)(b)(c) | 1,358,940 | ||||||
| 295 | eBay, Inc.*(a) | 11,133 | ||||||
| 15,296 | Facebook, Inc., Class A*(a) | 2,699,132 | ||||||
| 5,547 | Lookout, Inc.*(a)(b)(c) | 1,165 | ||||||
Continued
7
AZL MVP BlackRock Global Strategy Plus Fund
Consolidated Schedule of Portfolio Investments
December 31, 2017
| Shares | Fair Value | |||||||
| Common Stocks, continued | ||||||||
| Internet Software & Services, continued | ||||||||
| 100 | Tencent Holdings, Ltd.(a) | $ | 5,170 | |||||
| 660 | VeriSign, Inc.*^(a) | 75,530 | ||||||
|
| |||||||
| 10,145,424 | ||||||||
|
| |||||||
| IT Services (0.8%): | ||||||||
| 514 | Accenture plc, Class C(a) | 78,689 | ||||||
| 151 | Alliance Data Systems Corp.(a) | 38,275 | ||||||
| 12 | Amadeus IT Holding SA(a) | 864 | ||||||
| 1,070 | Amdocs, Ltd.(a) | 70,064 | ||||||
| 17 | Automatic Data Processing, Inc.(a) | 1,992 | ||||||
| 46 | Cognizant Technology Solutions Corp., Class A(a) | 3,267 | ||||||
| 59 | DXC Technology Co.(a) | 5,599 | ||||||
| 9,393 | FleetCor Technologies, Inc.*(a) | 1,807,496 | ||||||
| 2,000 | Fujitsu, Ltd.(a) | 14,178 | ||||||
| 6,615 | Global Payments, Inc.(a) | 663,088 | ||||||
| 198 | HCL Technologies, Ltd.(a) | 2,763 | ||||||
| 85,114 | Infosys, Ltd.(a) | 1,387,963 | ||||||
| 7,635 | International Business Machines Corp.(a) | 1,171,362 | ||||||
| 5,504 | MasterCard, Inc., Class A(a) | 833,085 | ||||||
| 332 | Tech Mahindra, Ltd.(a) | 2,619 | ||||||
| 7,110 | Visa, Inc., Class A(a) | 810,682 | ||||||
|
| |||||||
| 6,891,986 | ||||||||
|
| |||||||
| Life Sciences Tools & Services (0.0%): | ||||||||
| 54 | Agilent Technologies, Inc.(a) | 3,616 | ||||||
| 14 | Illumina, Inc.*(a) | 3,059 | ||||||
| 13 | IQVIA Holdings, Inc.*(a) | 1,273 | ||||||
| 718 | Thermo Fisher Scientific, Inc.(a) | 136,334 | ||||||
|
| |||||||
| 144,282 | ||||||||
|
| |||||||
| Machinery (0.5%): | ||||||||
| 255 | Caterpillar, Inc.(a) | 40,183 | ||||||
| 209 | Cummins, Inc.(a) | 36,918 | ||||||
| 20,258 | Doosan Bobcat, Inc.(a) | 677,651 | ||||||
| 10,308 | GEA Group AG(a) | 494,199 | ||||||
| 7,200 | Hino Motors, Ltd.(a) | 93,411 | ||||||
| 333 | Illinois Tool Works, Inc.(a) | 55,561 | ||||||
| 85 | Ingersoll-Rand plc(a) | 7,581 | ||||||
| 28,100 | Komatsu, Ltd.(a) | 1,018,014 | ||||||
| 29,500 | Kubota Corp.(a) | 577,737 | ||||||
| 125 | PACCAR, Inc.(a) | 8,885 | ||||||
| 165 | Sandvik AB(a) | 2,885 | ||||||
| 33,134 | SKF AB, Class B(a) | 735,011 | ||||||
| 452 | Volvo AB, Class B(a) | 8,413 | ||||||
| 334 | WABCO Holdings, Inc.*(a) | 47,929 | ||||||
|
| |||||||
| 3,804,378 | ||||||||
|
| |||||||
| Marine (0.0%): | ||||||||
| 1 | A.P. Moeller — Maersk A/S, Class A(a) | 1,667 | ||||||
| 3 | A.P. Moeller — Maersk A/S, Class B(a) | 5,229 | ||||||
|
| |||||||
| 6,896 | ||||||||
|
| |||||||
| Media (1.1%): | ||||||||
| 4,341 | Charter Communications, Inc., Class A*(a) | 1,458,402 | ||||||
| 97,369 | Comcast Corp., Class A(a) | 3,899,628 | ||||||
| Shares | Fair Value | |||||||
| Common Stocks, continued | ||||||||
| Media, continued | ||||||||
| 8,573 | DISH Network Corp., Class A*(a) | $ | 409,361 | |||||
| 15,329 | I-Cable Communications, Ltd.*(a) | 451 | ||||||
| 2,623 | Liberty Broadband Corp., Class A*(a) | 223,086 | ||||||
| 8,271 | Liberty Broadband Corp., Class C*(a) | 704,358 | ||||||
| 11,226 | Liberty Global plc, Class A*^(a) | 402,340 | ||||||
| 64 | Liberty Global plc, Series C*(a) | 2,166 | ||||||
| 9,407 | Liberty SiriusXM Group, Class A*(a) | 373,082 | ||||||
| 15,764 | Liberty SiriusXM Group, Class C*(a) | 625,200 | ||||||
| 9,400 | Nippon Television Holdings, Inc.(a) | 161,064 | ||||||
| 84,407 | RAI Way SpA(a) | 515,220 | ||||||
| 72 | Time Warner, Inc.(a) | 6,586 | ||||||
| 3,100 | Toho Co., Ltd.(a) | 107,390 | ||||||
| 6,800 | TV Asahi Holdings Corp.(a) | 136,519 | ||||||
| 48 | Vivendi Universal SA(a) | 1,291 | ||||||
| 54,080 | Zon Multimedia Servicos de Telecommunicacoes e Multimedia SGPS SA(a) | 355,537 | ||||||
|
| |||||||
| 9,381,681 | ||||||||
|
| |||||||
| Metals & Mining (0.0%): | ||||||||
| 35 | Anglo American plc(a) | 731 | ||||||
| 128 | Barrick Gold Corp.(a) | 1,852 | ||||||
| 280 | BHP Billiton, Ltd.(a) | 6,444 | ||||||
| 1,900 | DOWA Mining Co.(a) | 77,607 | ||||||
| 569 | Eregli Demir ve Celik Fabrikalari T.A.S.(a) | 1,503 | ||||||
| 72,391 | Platinum Group Metals, Ltd.*(a) | 22,007 | ||||||
| 11,061 | Platinum Group Metals, Ltd.*(a) | 3,344 | ||||||
| 533 | POSCO(a) | 165,520 | ||||||
| 103 | Rio Tinto plc(a) | 5,435 | ||||||
| 94 | Rio Tinto, Ltd.(a) | 5,546 | ||||||
| 249 | Teck Cominco, Ltd., Class B(a) | 6,512 | ||||||
| 14,200 | Tokyo Steel Manufacturing Co., Ltd.(a) | 127,463 | ||||||
| 326 | Vale SA(a) | 3,958 | ||||||
| 550 | Vedanta, Ltd.(a) | 2,835 | ||||||
| 2,900 | Yamato Kogyo Co., Ltd.(a) | 84,067 | ||||||
|
| |||||||
| 514,824 | ||||||||
|
| |||||||
| Multiline Retail (0.1%): | ||||||||
| 437 | Kohl’s Corp.^(a) | 23,699 | ||||||
| 12,784 | Target Corp.(a) | 834,156 | ||||||
|
| |||||||
| 857,855 | ||||||||
|
| |||||||
| Multi-Utilities (0.3%): | ||||||||
| 73 | AGL Energy, Ltd.(a) | 1,385 | ||||||
| 809 | CenterPoint Energy, Inc.(a) | 22,943 | ||||||
| 1,789 | Centrica plc(a) | 3,312 | ||||||
| 2,096 | Dominion Energy, Inc.(a) | 169,902 | ||||||
| 803 | E.ON AG(a) | 8,706 | ||||||
| 44 | Engie Group(a) | 756 | ||||||
| 61,469 | Innogy Se(a) | 2,395,177 | ||||||
| 3,630 | National Grid plc(a) | 42,633 | ||||||
| 6,944 | Sempra Energy(a) | 742,452 | ||||||
|
| |||||||
| 3,387,266 | ||||||||
|
| |||||||
Continued
8
AZL MVP BlackRock Global Strategy Plus Fund
Consolidated Schedule of Portfolio Investments
December 31, 2017
| Shares | Fair Value | |||||||
| Common Stocks, continued | ||||||||
| Oil, Gas & Consumable Fuels (2.1%): | ||||||||
| 34,776 | Anadarko Petroleum Corp.(a) | $ | 1,865,385 | |||||
| 33,191 | BP plc, ADR(a) | 1,395,018 | ||||||
| 53,501 | BP plc(a) | 377,244 | ||||||
| 337 | Chevron Corp.(a) | 42,189 | ||||||
| 7,000 | CNOOC, Ltd.(a) | 10,064 | ||||||
| 25,479 | Coal India, Ltd.(a) | 104,979 | ||||||
| 107 | ConocoPhillips Co.(a) | 5,873 | ||||||
| 134,367 | EnCana Corp.(a) | 1,791,113 | ||||||
| 9,739 | EQT Corp.(a) | 554,344 | ||||||
| 344 | Exxon Mobil Corp.(a) | 28,772 | ||||||
| 23,000 | Formosa Petrochemical Corp.(a) | 89,170 | ||||||
| 415 | Hindustan Petroleum Corp., Ltd.(a) | 2,721 | ||||||
| 323 | Indian Oil Corp., Ltd.(a) | 1,966 | ||||||
| 208 | Kinder Morgan, Inc.(a) | 3,759 | ||||||
| 19,519 | Marathon Petroleum Corp.(a) | 1,287,864 | ||||||
| 37,305 | Oil & Natural Gas Corp., Ltd.(a) | 114,059 | ||||||
| 49 | ONEOK, Inc.(a) | 2,619 | ||||||
| 354 | Petroleo Brasileiro SA*(a) | 1,719 | ||||||
| 587 | Phillips 66(a) | 59,375 | ||||||
| 9,688 | Pioneer Natural Resources Co.(a) | 1,674,571 | ||||||
| 43 | Polski Koncern Naftowy Orlen SA(a) | 1,306 | ||||||
| 1,205 | Polskie Gornictwo Naftowe i Gazownictwo SA(a) | 2,175 | ||||||
| 127,411 | Reliance Industries, Ltd.(a) | 1,838,318 | ||||||
| 53 | Repsol SA(a) | 937 | ||||||
| 70 | Royal Dutch Shell plc, Class A(a) | 2,343 | ||||||
| 24,408 | Royal Dutch Shell plc, Class A, ADR(a) | 1,628,258 | ||||||
| 38,168 | Royal Dutch Shell plc, Class A(a) | 1,272,706 | ||||||
| 429 | Royal Dutch Shell plc, Class B(a) | 14,466 | ||||||
| 31 | SK Energy Co., Ltd.(a) | 5,904 | ||||||
| 14,967 | Snam SpA(a) | 73,273 | ||||||
| 6 | Suncor Energy, Inc.(a) | 220 | ||||||
| 32,300 | Thai Oil Public Co., Ltd.(a) | 102,614 | ||||||
| 650 | Total SA, ADR(a) | 35,932 | ||||||
| 17,028 | Total SA(a) | 939,410 | ||||||
| 233 | Tupras-Turkiye Petrol Rafine(a) | 7,472 | ||||||
| 1,337 | Valero Energy Corp.(a) | 122,884 | ||||||
| 94,613 | Williams Cos., Inc. (The)(a) | 2,884,749 | ||||||
|
| |||||||
| 18,345,771 | ||||||||
|
| |||||||
| Personal Products (0.2%): | ||||||||
| 1,344 | Amorepacific Corp.(a) | 381,775 | ||||||
| 19,407 | Edgewell Personal Care Co.*^(a) | 1,152,582 | ||||||
| 100 | Kao Corp.(a) | 6,765 | ||||||
| 180 | LG Household & Health Care, Ltd.(a) | 199,582 | ||||||
| 162 | Unilever NV(a) | 9,101 | ||||||
|
| |||||||
| 1,749,805 | ||||||||
|
| |||||||
| Pharmaceuticals (1.0%): | ||||||||
| 8 | Allergan plc(a) | 1,309 | ||||||
| 71,200 | Astellas Pharma, Inc.(a) | 904,439 | ||||||
| 20,048 | Bayer AG, Registered Shares(a) | 2,493,165 | ||||||
| 23 | Bristol-Myers Squibb Co.(a) | 1,409 | ||||||
| 64,215 | GlaxoSmithKline plc(a) | 1,135,608 | ||||||
| 2,439 | Gw Pharmaceuticals, ADR*(a) | 321,972 | ||||||
| Shares | Fair Value | |||||||
| Common Stocks, continued | ||||||||
| Pharmaceuticals, continued | ||||||||
| 1,315 | Johnson & Johnson Co.(a) | $ | 183,732 | |||||
| 89 | Merck & Co., Inc.(a) | 5,008 | ||||||
| 100 | Mitsubishi Tanabe Pharma Corp.(a) | 2,062 | ||||||
| 101 | Novartis AG, Registered Shares(a) | 8,541 | ||||||
| 2,100 | Otsuka Holdings Co., Ltd.(a) | 91,977 | ||||||
| 78,571 | Pfizer, Inc.(a) | 2,845,842 | ||||||
| 69 | Roche Holding AG(a) | 17,457 | ||||||
| 12,986 | Sanofi-Aventis SA(a) | 1,118,004 | ||||||
| 200 | Shionogi & Co., Ltd.(a) | 10,815 | ||||||
| 10 | UCB SA(a) | 792 | ||||||
|
| |||||||
| 9,142,132 | ||||||||
|
| |||||||
| Professional Services (0.1%): | ||||||||
| 29 | Experian plc(a) | 637 | ||||||
| 290 | Manpower, Inc.(a) | 36,572 | ||||||
| 8,345 | Randstad Holding NV(a) | 511,953 | ||||||
| 3 | SGS SA, Registered Shares(a) | 7,822 | ||||||
|
| |||||||
| 556,984 | ||||||||
|
| |||||||
| Real Estate Management & Development (0.7%): | ||||||||
| 301,000 | CapitaLand, Ltd.(a) | 793,226 | ||||||
| 30,000 | Hang Lung Properties, Ltd.(a) | 73,213 | ||||||
| 600 | Hongkong Land Holdings, Ltd.(a) | 4,219 | ||||||
| 1,000 | Longfor Properties Co., Ltd.(a) | 2,506 | ||||||
| 56,000 | Sino Land Co., Ltd.(a) | 99,149 | ||||||
| 112,666 | Sun Hung Kai Properties, Ltd.(a) | 1,876,832 | ||||||
| 12,000 | Swire Pacific, Ltd., Class A(a) | 111,073 | ||||||
| 600 | Swire Properties, Ltd.(a) | 1,935 | ||||||
| 42,143 | The St. Joe Co.*^(a) | 760,681 | ||||||
| 14,611 | Vonovia SE(a) | 723,158 | ||||||
| 19,000 | Wharf Holdings, Ltd. (The)(a) | 65,703 | ||||||
| 20,000 | Wharf Real Estate Investment Co., Ltd.*(a) | 133,118 | ||||||
|
| |||||||
| 4,644,813 | ||||||||
|
| |||||||
| Road & Rail (0.7%): | ||||||||
| 78 | Canadian National Railway Co.(a) | 6,433 | ||||||
| 66,400 | ComfortDelGro Corp., Ltd.(a) | 98,217 | ||||||
| 32 | CSX Corp.(a) | 1,760 | ||||||
| 20,600 | East Japan Railway Co.(a) | 2,008,583 | ||||||
| 12,483 | Kansas City Southern(a) | 1,313,461 | ||||||
| 100 | Kintetsu Corp.(a) | 3,825 | ||||||
| 12,000 | Kyushu Railway Co.(a) | 371,344 | ||||||
| 21 | Norfolk Southern Corp.(a) | 3,043 | ||||||
| 5,300 | Seino Holdings Co., Ltd.(a) | 83,945 | ||||||
| 28 | Union Pacific Corp.(a) | 3,755 | ||||||
| 7,900 | West Japan Railway Co.(a) | 576,407 | ||||||
|
| |||||||
| 4,470,773 | ||||||||
|
| |||||||
| Semiconductors & Semiconductor Equipment (0.6%): | ||||||||
| 259 | Applied Materials, Inc.(a) | 13,240 | ||||||
| 2 | Broadcom, Ltd.(a) | 514 | ||||||
| 1,690 | Intel Corp.(a) | 78,010 | ||||||
| 554 | KLA-Tencor Corp.(a) | 58,209 | ||||||
| 45 | Lam Research Corp.(a) | 8,283 | ||||||
| 164 | Micron Technology, Inc.*(a) | 6,744 | ||||||
Continued
9
AZL MVP BlackRock Global Strategy Plus Fund
Consolidated Schedule of Portfolio Investments
December 31, 2017
| Shares | Fair Value | |||||||
| Common Stocks, continued | ||||||||
| Semiconductors & Semiconductor Equipment, continued | ||||||||
| 7 | NVIDIA Corp.(a) | $ | 1,355 | |||||
| 53,731 | QUALCOMM, Inc.(a) | 3,439,858 | ||||||
| 28,800 | Renesas Electronics Corp.*(a) | 333,410 | ||||||
| 11,600 | ROHM Co., Ltd.(a) | 1,278,124 | ||||||
| 73 | SK Hynix, Inc.(a) | 5,155 | ||||||
| 17,000 | Taiwan Semiconductor Manufacturing Co., Ltd.(a) | 130,666 | ||||||
| 134 | Texas Instruments, Inc.(a) | 13,995 | ||||||
|
| |||||||
| 5,367,563 | ||||||||
|
| |||||||
| Software (1.6%): | ||||||||
| 10,014 | Activision Blizzard, Inc.(a) | 634,086 | ||||||
| 547 | Adobe Systems, Inc.*(a) | 95,856 | ||||||
| 8 | Autodesk, Inc.*(a) | 839 | ||||||
| 335 | CA, Inc.(a) | 11,149 | ||||||
| 107 | Check Point Software Technologies, Ltd.*^(a) | 11,087 | ||||||
| 101 | Dell Technologies, Inc., Class V*(a) | 8,209 | ||||||
| 6,063 | Electronic Arts, Inc.*(a) | 636,979 | ||||||
| 584 | Intuit, Inc.(a) | 92,144 | ||||||
| 86,582 | Microsoft Corp.(a) | 7,406,224 | ||||||
| 308 | Oracle Corp.(a) | 14,562 | ||||||
| 111 | SAP AG(a) | 12,445 | ||||||
| 39,037 | Snap, Inc., Class A*^(a) | 570,331 | ||||||
| 33 | Symantec Corp.^(a) | 926 | ||||||
| 68,532 | Uber Technologies, Inc.*(a)(b)(c) | 2,259,500 | ||||||
| 5,380 | VMware, Inc., Class A*^(a) | 674,222 | ||||||
|
| |||||||
| 12,428,559 | ||||||||
|
| |||||||
| Specialty Retail (0.4%): | ||||||||
| 621 | Home Depot, Inc. (The)(a) | 117,698 | ||||||
| 1,660 | Hotel Shilla Co., Ltd.(a) | 131,425 | ||||||
| 2,231 | Lowe’s Cos., Inc.(a) | 207,349 | ||||||
| 7,865 | O’Reilly Automotive, Inc.*^(a) | 1,891,847 | ||||||
| 323 | Ross Stores, Inc.(a) | 25,921 | ||||||
| 700 | Shimamura Co., Ltd.(a) | 77,004 | ||||||
| 8,454 | TJX Cos., Inc. (The)(a) | 646,393 | ||||||
| 11,753 | Williams-Sonoma, Inc.^(a) | 607,630 | ||||||
|
| |||||||
| 3,705,267 | ||||||||
|
| |||||||
| Technology Hardware, Storage & Peripherals (0.8%): | ||||||||
| 32,737 | Apple, Inc.(a) | 5,540,082 | ||||||
| 430 | Hewlett Packard Enterprise Co.(a) | 6,175 | ||||||
| 659 | HP, Inc.(a) | 13,846 | ||||||
| 4,000 | Pegatron Corp.(a) | 9,670 | ||||||
| 45,476 | Pure Storage, Inc., Class A*^(a) | 721,249 | ||||||
| 9 | Samsung Electronics Co., Ltd.(a) | 21,385 | ||||||
| 517 | Western Digital Corp.(a) | 41,117 | ||||||
|
| |||||||
| 6,353,524 | ||||||||
|
| |||||||
| Textiles, Apparel & Luxury Goods (0.1%): | ||||||||
| 16 | Adidas AG(a) | 3,194 | ||||||
| 12,670 | Luxottica Group SpA(a) | 776,341 | ||||||
| 4 | LVMH Moet Hennessy Louis Vuitton SA(a) | 1,175 | ||||||
| 239 | PVH Corp.(a) | 32,793 | ||||||
| 78 | Swatch Group AG (The), Registered Shares(a) | 5,963 | ||||||
|
| |||||||
| 819,466 | ||||||||
|
| |||||||
| Shares | Fair Value | |||||||
| Common Stocks, continued | ||||||||
| Thrifts & Mortgage Finance (0.0%): | ||||||||
| 7,983 | Housing Development Finance Corp., Ltd.(a) | $ | 213,678 | |||||
|
| |||||||
| Tobacco (0.1%): | ||||||||
| 174 | Imperial Tobacco Group plc, Class A(a) | 7,434 | ||||||
| 100 | Japan Tobacco, Inc.(a) | 3,221 | ||||||
| 5,110 | KT&G Corp.(a) | 551,488 | ||||||
| 135 | Philip Morris International, Inc.(a) | 14,263 | ||||||
|
| |||||||
| 576,406 | ||||||||
|
| |||||||
| Trading Companies & Distributors (0.0%): | ||||||||
| 700 | Marubeni Corp.(a) | 5,084 | ||||||
| 433 | United Rentals, Inc.*(a) | 74,437 | ||||||
|
| |||||||
| 79,521 | ||||||||
|
| |||||||
| Transportation Infrastructure (0.0%): | ||||||||
| 65 | Aena SA(a) | 13,157 | ||||||
| 46 | Atlantia SpA(a) | 1,451 | ||||||
| 3,800 | Kamigumi Co., Ltd.(a) | 83,999 | ||||||
|
| |||||||
| 98,607 | ||||||||
|
| |||||||
| Wireless Telecommunication Services (0.6%): | ||||||||
| 33,500 | Advanced Information Service plc(a) | 196,365 | ||||||
| 1,000 | China Mobile, Ltd.(a) | 10,123 | ||||||
| 111,000 | Far EasTone Telecommunications Co., Ltd.(a) | 274,200 | ||||||
| 85,100 | Intouch Holdings Public Co., Ltd.(a) | 146,765 | ||||||
| 5,500 | KDDI Corp.(a) | 136,954 | ||||||
| 26 | MTN Group, Ltd.(a) | 288 | ||||||
| 646 | SK Telecom Co., Ltd.(a) | 161,196 | ||||||
| 99,000 | Taiwan Mobile Co., Ltd.(a) | 357,659 | ||||||
| 20,129 | Vodafone Group plc, ADR^(a) | 642,115 | ||||||
| 750,920 | Vodafone Group plc(a) | 2,371,754 | ||||||
|
| |||||||
| 4,297,419 | ||||||||
|
| |||||||
Total Common Stocks (Cost $186,122,892) | 233,902,661 | |||||||
|
| |||||||
| Preferred Stocks (0.4%): | ||||||||
| Banks (0.1%): | ||||||||
| 240 | Banco Bradesco SA, 0.51%(a) | 2,450 | ||||||
| 14,150 | Citigroup Capital XIII, Series A, 3.49%^(a) | 388,842 | ||||||
| 318 | Itau Unibanco Holding SA, Preferred Shares, Series S, 0.42%(a) | 4,083 | ||||||
| 84,000 | USB Capital IX, 3.50%(US0003M+102bps)(a) | 76,020 | ||||||
|
| |||||||
| 471,395 | ||||||||
|
| |||||||
| Consumer Finance (0.1%): | ||||||||
| 16,151 | GMAC Capital Trust I, Series 2, 1.54%^(a) | 419,118 | ||||||
|
| |||||||
| Health Care Providers & Services (0.1%): | ||||||||
| 16,042 | Anthem, Inc., 4.82%^(a) | 898,353 | ||||||
| 143,925 | Grand Rounds, Inc., Series C*(a)(b)(c) | 410,186 | ||||||
|
| |||||||
| 1,308,539 | ||||||||
|
| |||||||
| Internet Software & Services (0.1%): | ||||||||
| 63,925 | Lookout, Inc., Preffered Shares, Series F*(a)(b)(c) | 596,420 | ||||||
|
| |||||||
| Software (0.0%): | ||||||||
| 116,157 | Palantir Technologies, Inc., Series I*(a)(b)(c) | 658,610 | ||||||
|
| |||||||
| Technology Hardware, Storage & Peripherals (0.0%): | ||||||||
| 4 | Samsung Electronics Co., Ltd., 1.34%(a) | 7,799 | ||||||
|
| |||||||
Total Preferred Stocks (Cost $3,360,442) | 3,461,881 | |||||||
|
| |||||||
Continued
10
AZL MVP BlackRock Global Strategy Plus Fund
Consolidated Schedule of Portfolio Investments
December 31, 2017
| Contracts, Shares, Notional Amount or Principal Amount | Fair Value | |||||||
| Warrant (0.0%): | ||||||||
| Paper & Forest Products (0.0%): | ||||||||
| 157,250 | TFS Corp., Ltd.(a) | $ | 11 | |||||
|
| |||||||
Total Warrant (Cost $—) | 11 | |||||||
|
| |||||||
| Convertible Preferred Stocks (0.5%): | ||||||||
| Banks (0.0%): | ||||||||
| 125 | Wells Fargo & Co., Series L, Class A, 7.5%(a) | 163,749 | ||||||
|
| |||||||
| Equity Real Estate Investment Trusts (0.1%): | ||||||||
| 526 | Crown Castle International Corp., Series A, 8.68%^(a) | 593,749 | ||||||
| 6,022 | Welltower, Inc., Series I, 6.50%^(a) | 360,537 | ||||||
|
| |||||||
| 954,286 | ||||||||
|
| |||||||
| Internet Software & Services (0.1%): | ||||||||
| 144,482 | Domo, Inc., Series E*(a)(b)(c) | 905,902 | ||||||
|
| |||||||
| Multi-Utilities (0.1%): | ||||||||
| 12,830 | Dominion Resources, Inc., Series A, 6.75%^(a) | 662,798 | ||||||
|
| |||||||
| Wireless Telecommunication Services (0.2%): | ||||||||
| 6,269 | Mandatory Exchange Trust, 5.75%(a)(d) | 1,220,950 | ||||||
|
| |||||||
Total Convertible Preferred Stocks (Cost $3,430,141) | 3,907,685 | |||||||
|
| |||||||
| Private Placements (0.0%): | ||||||||
| Household Durables (0.0%): | ||||||||
| $ | 3,065,000 | AliphCom, Inc., 12.00%, 4/1/20(a)(b)(c) | 12,567 | |||||
| 23,389 | Jawbone, 0.00%*(a)(b)(c) | 31,893 | ||||||
|
| |||||||
| 44,460 | ||||||||
|
| |||||||
| Oil, Gas & Consumable Fuels (0.0%): | ||||||||
| 268,000 | Aliphcom, 12.00%, 4/1/20(a)(b)(c) | 1,099 | ||||||
|
| |||||||
Total Private Placements (Cost $3,333,000) | 45,559 | |||||||
|
| |||||||
| Convertible Bonds (0.2%): | ||||||||
| Food Products (0.0%): | ||||||||
| 400,000 | REI Agro, Ltd., Registered Shares, 5.50%, 11/13/14(a)(b)(c)(e) | — | ||||||
|
| |||||||
| Oil, Gas & Consumable Fuels (0.1%): | ||||||||
| 631,620 | Dana Gas Sukuk, Ltd., 7.00%, 10/31/18(a)(b) | 517,928 | ||||||
|
| |||||||
| Pharmaceuticals (0.1%): | ||||||||
| 600,000 | Bayer Capital Corp. BV, 5.63%, 11/22/19+(a)(d) | 808,943 | ||||||
|
| |||||||
| Real Estate Management & Development (0.0%): | ||||||||
| 250,000 | CapitaLand, Ltd., 1.95%, 10/17/23+(a)(d) | 188,374 | ||||||
|
| |||||||
Total Convertible Bonds (Cost $1,851,930) | 1,515,245 | |||||||
|
| |||||||
| Bank Loans (0.2%): | ||||||||
| Capital Markets (0.1%): | ||||||||
| 101,695 | Sheridan Production Partners, 4.98%, 12/2/20(a) | 87,796 | ||||||
| 37,937 | Sheridan Production Partners, 4.98%, 12/16/20(a)(f) | 32,752 | ||||||
| 730,890 | Sheridan Production Partners, 4.98%, 12/16/20(a)(f) | 631,000 | ||||||
|
| |||||||
| 751,548 | ||||||||
|
| |||||||
| Energy Equipment & Services (0.0%): | ||||||||
| 371,737 | Seadrill, Ltd., 4.69%, 2/21/21(a) | 299,248 | ||||||
|
| |||||||
| Hotels, Restaurants & Leisure (0.1%): | ||||||||
| 522,684 | Hilton Worldwide Finance LLC, 3.55%, 10/25/23(a) | 525,099 | ||||||
|
| |||||||
| Contracts, Shares, Notional Amount or Principal Amount | Fair Value | |||||||
| Bank Loans, continued | ||||||||
| Oil, Gas & Consumable Fuels (0.0%): | ||||||||
| $ | 254,386 | Fieldwood Energy LLC, 8.69%, 9/30/20(a) | $ | 81,614 | ||||
| 111,961 | Fieldwood Holdings LLC, 8.82%, 8/31/20(a) | 100,765 | ||||||
|
| |||||||
| 182,379 | ||||||||
|
| |||||||
Total Bank Loans (Cost $2,021,409) | 1,758,274 | |||||||
|
| |||||||
| Collateralized Mortgage Obligations (0.1%): | ||||||||
| 459,000 | Logistics UK, Class F, Series 2015-1A, 1.21%, 8/20/25(a)(b)(g) | 617,841 | ||||||
|
| |||||||
Total Collateralized Mortgage Obligations (Cost $691,605) | 617,841 | |||||||
|
| |||||||
| Corporate Bonds (1.2%): | ||||||||
| Banks (0.3%): | ||||||||
| 348,000 | Bank of America Corp., 3.30%, 1/11/23, MTN(a) | 356,003 | ||||||
| 162,000 | Bank of America Corp., 4.00%, 1/22/25, MTN(a) | 168,539 | ||||||
| 312,000 | Citigroup, Inc., 2.70%, 3/30/21(a) | 312,948 | ||||||
| 149,000 | Citigroup, Inc., 2.90%, 12/8/21, Callable 11/8/21 @ 100(a) | 149,981 | ||||||
| 373,000 | Citigroup, Inc., Series O, 5.87% (US0003M + 406 bps), 12/29/49, Callable 3/27/20 @ 100(a) | 386,987 | ||||||
| 137,000 | JPMorgan Chase & Co., 4.35%, 8/15/21(a) | 145,304 | ||||||
| 351,000 | JPMorgan Chase & Co., 2.36% (US0003M + 100 bps), 1/15/23, Callable 1/15/22 @ 100(a) | 355,723 | ||||||
| 85,000 | Santander Holdings USA, 3.70%, 3/28/22, Callable 2/28/22 @ 100(a)(d) | 86,023 | ||||||
|
| |||||||
| 1,961,508 | ||||||||
|
| |||||||
| Capital Markets (0.1%): | ||||||||
| 323,000 | Goldman Sachs Group, Inc. (The), Series M, 5.38% (US0003M + 392 bps), 12/31/49, Callable 5/10/20 @ 100(a) | 332,690 | ||||||
| 228,000 | Morgan Stanley, Series H, 5.45% (US0003M + 361 bps), 7/29/49, Callable 7/15/19 @ 100(a) | 234,042 | ||||||
|
| |||||||
| 566,732 | ||||||||
|
| |||||||
| Chemicals (0.0%): | ||||||||
| 115,000 | Sherwin-Williams, 2.75%, 6/1/22, Callable 5/1/22 @ 100(a) | 114,554 | ||||||
|
| |||||||
| Communications Equipment (0.0%): | ||||||||
| 53,000 | Hughes Satellite Systems Corp., 7.63%, 6/15/21(a) | 58,565 | ||||||
|
| |||||||
| Consumer Finance (0.1%): | ||||||||
| 191,000 | Ally Financial, Inc., 3.50%, 1/27/19(a) | 191,955 | ||||||
| 200,000 | American Express Co., Series C, 4.90% (US0003M + 329 bps), 12/29/49, Callable 3/15/20 @ 100^(a) | 204,000 | ||||||
| 125,000 | General Motors Financial Co., Inc., 3.45%, 4/10/22, Callable 2/10/22 @ 100(a) | 126,666 | ||||||
| 87,000 | Synchrony Financial, 3.75%, 8/15/21, Callable 6/15/21 @ 100(a) | 89,211 | ||||||
|
| |||||||
| 611,832 | ||||||||
|
| |||||||
| Diversified Telecommunication Services (0.5%): | ||||||||
| 475,000 | AT&T, Inc., 3.00%, 6/30/22, Callable 4/30/22 @ 100(a) | 475,844 | ||||||
| 465,000 | AT&T, Inc., 2.85%, 2/14/23, Callable 1/14/23 @ 100(a) | 466,844 | ||||||
Continued
11
AZL MVP BlackRock Global Strategy Plus Fund
Consolidated Schedule of Portfolio Investments
December 31, 2017
| Contracts, Shares, Notional Amount or Principal Amount | Fair Value | |||||||
| Corporate Bonds, continued | ||||||||
| Diversified Telecommunication Services, continued | ||||||||
| $ | 75,000 | AT&T, Inc., 4.45%, 4/1/24, Callable 1/1/24 @ 100(a) | $ | 79,336 | ||||
| 831,000 | AT&T, Inc., 3.40%, 8/14/24, Callable 6/14/24 @ 100^(a) | 835,267 | ||||||
| 1,506,000 | Verizon Communications, 3.13%, 3/16/22(a) | 1,526,941 | ||||||
| 149,000 | Verizon Communications, Inc., 2.63%, 8/15/26 | 140,341 | ||||||
|
| |||||||
| 3,524,573 | ||||||||
|
| |||||||
| Health Care Equipment & Supplies (0.1%): | ||||||||
| 135,000 | Becton Dickinson & Co., 3.36%, 6/6/24, Callable 4/6/24 @ 100(a) | 135,377 | ||||||
| 306,000 | Becton, Dickinson & Co., 3.13%, 11/8/21(a) | 308,581 | ||||||
| 245,000 | Becton, Dickinson & Co., 2.89%, 6/6/22, Callable 5/6/22 @ 100(a) | 243,467 | ||||||
|
| |||||||
| 687,425 | ||||||||
|
| |||||||
| Industrial Conglomerates (0.0%): | ||||||||
| 318,000 | General Electric Co., Series D, 5.00% (US0003M + 333 bps), 12/31/49, Callable 1/21/21 @ 100(a) | 327,731 | ||||||
|
| |||||||
| Insurance (0.0%): | ||||||||
| 173,000 | Prudential Financial, Inc., 5.87% (US0003M + 418 bps), 9/15/42, Callable 9/15/22 @ 100(a) | 189,003 | ||||||
| 115,000 | Prudential Financial, Inc., 5.63% (US0003M + 392 bps), 6/15/43, Callable 6/15/23 @ 100^(a) | 124,545 | ||||||
|
| |||||||
| 313,548 | ||||||||
|
| |||||||
| Internet Software & Services (0.0%): | ||||||||
| 159,000 | eBay, Inc., 2.75%, 1/30/23, Callable 12/30/22 @ 100(a) | 157,451 | ||||||
|
| |||||||
| Media (0.0%): | ||||||||
| 200,000 | NBCUniversal Enterprise, Inc., 5.25%, 12/31/99, Callable 3/19/21 @ 100(a)(d) | 212,500 | ||||||
|
| |||||||
| Oil, Gas & Consumable Fuels (0.0%): | ||||||||
| 151,147 | Fieldwood Energy LLC, 8.82%, 9/30/20(a) | 103,788 | ||||||
|
| |||||||
| Personal Products (0.0%): | ||||||||
| 171,000 | Edgewell Personal Care Co., 4.70%, 5/19/21(a) | 176,558 | ||||||
| 149,000 | Edgewell Personal Care Co., 4.70%, 5/24/22(a) | 152,725 | ||||||
|
| |||||||
| 329,283 | ||||||||
|
| |||||||
| Pharmaceuticals (0.0%): | ||||||||
| 149,000 | Forest Laboratories, Inc., 5.00%, 12/15/21, Callable 9/16/21 @ 100(a)(d) | 159,352 | ||||||
|
| |||||||
| Software (0.0%): | ||||||||
| 80,000 | Activision Blizzard, Inc., 2.30%, 9/15/21, Callable 8/15/21 @ 100(a) | 78,950 | ||||||
|
| |||||||
| Technology Hardware, Storage & Peripherals (0.1%): | ||||||||
| 531,000 | Apple, Inc., 3.35%, 2/9/27, Callable 11/9/26 @ 100(a) | 543,942 | ||||||
| 510,000 | Apple, Inc., 3.20%, 5/11/27, Callable 2/11/27 @ 100(a) | 516,477 | ||||||
|
| |||||||
| 1,060,419 | ||||||||
|
| |||||||
Total Corporate Bonds (Cost $10,170,606) | 10,268,211 | |||||||
|
| |||||||
| Contracts, Shares, Notional Amount or Principal Amount | Fair Value | |||||||
| Foreign Bonds (4.1%): | ||||||||
| Banks (0.1%): | ||||||||
| $ | 330,000 | Lloyds TSB Bank plc, Series E, 13.00%(GUKG5+1,340bps), 1/29/49, Callable 1/21/29 @ 126+(a) | $ | 834,577 | ||||
|
| |||||||
| Sovereign Bond (4.0%): | ||||||||
| 1,888,000 | Australian Government, Series 124, 5.75%, 5/15/21+(a)(d) | 1,642,203 | ||||||
| 2,111,000 | Australian Government, Series 133, 5.50%, 4/21/23+(a)(d) | 1,900,923 | ||||||
| 4,986,000 | Australian Government, Series 137, 2.75%, 4/21/24+(a)(d) | 3,952,969 | ||||||
| 1,269,000 | Australian Government, 3.00%, 3/21/47+(a)(d) | 923,680 | ||||||
| 1,145,000 | Brazil Nota do Tesouro Nacional, Series NTNB, 6.00%, 8/15/22+(a)(h) | 1,127,464 | ||||||
| 6,911,000 | Brazil Nota do Tesouro Nacional, Series NTNF, 10.00%, 1/1/23+(a)(h) | 2,109,357 | ||||||
| 4,930,000 | Brazil Nota do Tesouro Nacional, Series NTNF, 0.15%, 1/1/27+(a)(h) | 1,466,084 | ||||||
| 1,778,707 | Bundesrepub. Deutshland, 0.29%, 8/15/26+(a)(d) | 2,081,595 | ||||||
| 4,001,000 | Canadian Government, 0.50%, 8/1/18+(a) | 3,168,105 | ||||||
| 1,018,000 | Canadian Government, 0.75%, 3/1/21+(a) | 784,536 | ||||||
| 532,000 | Italy Buoni Poliennali Del Tesoro, 1.85%, 5/15/24+(a) | 660,358 | ||||||
| 218,500,000 | Japan Treasury Discount Bill, Series 362, 0.10%, 3/15/18+(a) | 1,940,395 | ||||||
| 273,450,000 | Japan Treasury Discount Bill, Series 369, 0.10%, 10/15/18+(a) | 2,431,899 | ||||||
| 29,209,300 | Mexican Bonos Desarr, 8.50%, 12/13/18+(a)(i) | 1,496,333 | ||||||
| 3,672,000 | Poland Government Bond, Series 0725, 3.25%, 7/25/25+(a) | 1,064,128 | ||||||
| 3,695,000 | Poland Government Bond, Series 0726, 2.50%, 7/25/26+(a) | 1,004,320 | ||||||
| 12,214,000 | Poland Government Bond, 2.50%, 7/25/27+(a) | 3,283,897 | ||||||
| 217,000 | Republic of Argentina, 3.88%, 1/15/22+(a)(d) | 274,011 | ||||||
| 410,000 | Republic of Argentina, 3.38%, 1/15/23+(a) | 501,607 | ||||||
| 28,603,100 | United Mexican States, 6.50%, 6/9/22+(a)(i) | 1,392,733 | ||||||
|
| |||||||
| 33,206,597 | ||||||||
|
| |||||||
Total Foreign Bonds (Cost $32,986,675) | 34,041,174 | |||||||
|
| |||||||
| Yankee Dollars (1.3%): | ||||||||
| Banks (0.1%): | ||||||||
| 273,000 | Export-Import Bank of Korea, 2.63%, 12/30/20(a) | 270,589 | ||||||
| 614,000 | HSBC Holdings plc, 6.38% (USISDA05 + 371 bps), 12/29/49, Callable 9/17/24 @ 100(a) | 653,910 | ||||||
|
| |||||||
| 924,499 | ||||||||
|
| |||||||
| Capital Markets (0.0%): | ||||||||
| 207,000 | UBS Group AG, 4.13%, 9/24/25(a)(d) | 217,237 | ||||||
|
| |||||||
| Diversified Telecommunication Services (0.1%): | ||||||||
| 260,000 | Intelsat Jackson Holdings SA, 7.50%, 4/1/21, Callable 2/5/18 @ 102.5(a) | 236,600 | ||||||
| 89,000 | Intelsat Jackson Holdings SA, 8.00%, 2/15/24, Callable 2/15/19 @ 104^(a)(d) | 93,673 | ||||||
| 289,000 | Telecom Italia SpA, 5.30%, 5/30/24^(a)(d) | 308,508 | ||||||
|
| |||||||
| 638,781 | ||||||||
|
| |||||||
Continued
12
AZL MVP BlackRock Global Strategy Plus Fund
Consolidated Schedule of Portfolio Investments
December 31, 2017
| Contracts, Shares, Notional Amount or Principal Amount | Fair Value | |||||||
| Yankee Dollars, continued | ||||||||
| Food Products (0.0%): | ||||||||
| $ | 408,000 | Danone SA, 2.59%, 11/2/23, Callable 9/2/23 @ 100(a)(d) | $ | 397,884 | ||||
|
| |||||||
| Industrial Conglomerates (0.0%): | ||||||||
| 200,000 | Odebrecht Finance, Ltd., 4.38%, 4/25/25(a)(d) | 59,000 | ||||||
|
| |||||||
| Oil, Gas & Consumable Fuels (0.2%): | ||||||||
| 288,000 | Petrobras Global Finance, 6.13%, 1/17/22(a) | 305,640 | ||||||
| 340,000 | Petrobras Global Finance, 7.38%, 1/17/27^(a) | 374,340 | ||||||
| 339,000 | Petroleos Mexicanos, 5.19% (US0003M + 365 bps), 3/11/22^(a)(d) | 372,220 | ||||||
| 754,000 | Petroleos Mexicanos, 4.63%, 9/21/23(a) | 775,677 | ||||||
|
| |||||||
| 1,827,877 | ||||||||
|
| |||||||
| Paper & Forest Products (0.1%): | ||||||||
| 1,018,000 | TFS Corp., Ltd., 8.75%, 8/1/23, Callable 8/1/19 @ 106.56(a)(b) | 712,600 | ||||||
|
| |||||||
| Pharmaceuticals (0.0%): | ||||||||
| 300,000 | Actavis Funding SCS, 3.45%, 3/15/22, Callable 1/15/22 @ 100(a) | 304,816 | ||||||
|
| |||||||
| Road & Rail (0.0%): | ||||||||
| 527,380 | Inversiones Alsacia SA, 8.00%, 12/31/18, Callable 1/22/18 @ 100(a)(b)(e) | 13,185 | ||||||
|
| |||||||
| Sovereign Bond (0.8%): | ||||||||
| 1,071,000 | Federal Republic of Brazil, 4.63%, 1/13/28, Callable 10/13/27 @ 100^(a) | 1,075,820 | ||||||
| 747,000 | Federal Republic of Brazil, 5.00%, 1/27/45(a) | 696,204 | ||||||
| 206,000 | Federal Republic of Brazil, 5.63%, 2/21/47^(a) | 210,429 | ||||||
| 429,000 | Republic of Argentina, 6.88%, 4/22/21(a) | 467,181 | ||||||
| 780,000 | Republic of Argentina, 5.63%, 1/26/22^(a) | 822,900 | ||||||
| 729,000 | Republic of Argentina, 7.50%, 4/22/26^(a) | 825,336 | ||||||
| 527,000 | Republic of Argentina, 6.88%, 1/26/27^(a) | 575,748 | ||||||
| 874,000 | Republic of Hungary, 6.38%, 3/29/21(a) | 970,210 | ||||||
| 200,000 | Republic of Indonesia, 3.70%, 1/8/22(a)(d) | 205,553 | ||||||
| 144,000 | Republic of Poland, 5.00%, 3/23/22(a) | 157,680 | ||||||
|
| |||||||
| 6,007,061 | ||||||||
|
| |||||||
Total Yankee Dollars (Cost $11,673,197) | 11,102,940 | |||||||
|
| |||||||
| U.S. Treasury Obligations (10.9%): | ||||||||
| U.S. Treasury Bills (3.3%) | ||||||||
| 9,000,000 | 1.06%, 1/2/18(a)(j) | 9,000,000 | ||||||
| 14,000,000 | 0.57%, 1/4/18(a)(j) | 13,999,117 | ||||||
| 1,000,000 | 0.96%, 1/11/18(a)(j) | 999,706 | ||||||
| 3,000,000 | 1.10%, 1/18/18(a)(j) | 2,998,348 | ||||||
| Contracts, Shares, Notional Amount or Principal Amount | Fair Value | |||||||
| U.S. Treasury Obligations, continued | ||||||||
| U.S. Treasury Bills, continued | ||||||||
| $ | 1,000,000 | 1.19%, 2/1/18(a)(j) | $ | 998,945 | ||||
|
| |||||||
| 27,996,116 | ||||||||
|
| |||||||
| U.S. Treasury Notes (7.6%) | ||||||||
| 1,000,000 | 1.25%, 12/15/18(k) | 994,766 | ||||||
| 872,100 | 1.13%, 7/31/21(a) | 843,348 | ||||||
| 13,205,400 | 2.00%, 10/31/22(a) | 13,090,369 | ||||||
| 13,953,200 | 2.00%, 11/30/22(a) | 13,826,204 | ||||||
| 10,100,400 | 2.13%, 9/30/24(a) | 9,973,356 | ||||||
| 10,490,000 | 2.25%, 10/31/24(a) | 10,441,648 | ||||||
| 13,706,800 | 2.25%, 11/15/27(a) | 13,513,513 | ||||||
|
| |||||||
| 62,683,204 | ||||||||
|
| |||||||
Total U.S. Treasury Obligations (Cost $91,039,322) | 90,679,320 | |||||||
|
| |||||||
| Purchased Options (0.1%): | ||||||||
Total Purchased Options (Cost $815,159) | 1,171,821 | |||||||
|
| |||||||
| Purchased Currency Options (0.0%): | ||||||||
Total Purchased Options (Cost $297,701) | 411,269 | |||||||
|
| |||||||
| Purchased Swaptions (0.0%): | ||||||||
Total Purchased Swaptions (Cost $287,138) | 92,200 | |||||||
|
| |||||||
| Exchange Traded Funds (1.9%): | ||||||||
| 2,334 | ETFS Platinum Trust(k) | 206,489 | ||||||
| 2,764 | ETFS Physical Palladium Shares(k) | 280,684 | ||||||
| 61,700 | iShares Gold Trust(k) | 771,867 | ||||||
| 116,243 | SPDR Gold Trust(k) | 14,373,447 | ||||||
|
| |||||||
Total Exchange Traded Fund (Cost $15,147,927) | 15,632,487 | |||||||
|
| |||||||
| Securities Held as Collateral for Securities on Loan (2.1%): | ||||||||
| $ | 17,308,385 | AZL MVP BlackRock Global Strategy Plus Fund Securities Lending Collateral Account(l) | 17,308,385 | |||||
|
| |||||||
| | Total Securities Held as Collateral for Securities on Loan | 17,308,385 | ||||||
|
| |||||||
| Affiliated Investment Companies (45.0%): | ||||||||
| 20,988,279 | AZL Enhanced Bond Index Fund | 228,562,361 | ||||||
| 13,052,201 | AZL MSCI Global Equity Index Fund | 146,445,694 | ||||||
|
| |||||||
Total Affiliated Investment Company (Cost $345,414,602) | 375,008,055 | |||||||
|
| |||||||
| Unaffiliated Investment Company (1.1%): | ||||||||
| 8,839,261 | Dreyfus Treasury Prime Cash Management Fund, Institutional Shares, 1.11%(j)(k) | 8,839,261 | ||||||
|
| |||||||
Total Unaffiliated Investment Company (Cost $8,839,261) | 8,839,261 | |||||||
|
| |||||||
Total Investment Securities (Cost $734,791,392)(m)(l) — 97.0% | 809,764,280 | |||||||
Net other assets (liabilities) — 3.0% | 24,400,067 | |||||||
|
| |||||||
Net Assets — 100.0% | $ | 834,164,347 | ||||||
|
| |||||||
Percentages indicated are based on net assets as of December 31, 2017.
| ADR—American | Depositary Receipt |
| GUKG5—UK | Govt Bonds 5 Year Note Generic Bid Yield |
| MTN—Medium | Term Note |
| SPDR—Standard | & Poor’s Depository Receipts |
| US0003M—3 | Month US Dollar LIBOR |
| USISDA05—5 | Year ICE Swap Rate |
| * | Non-income producing security. |
| ^ | This security or a partial position of this security was on loan as of December 31, 2017. The total value of securities on loan as of December 31, 2017, was $16,727,800. |
Continued
13
AZL MVP BlackRock Global Strategy Plus Fund
Consolidated Schedule of Portfolio Investments
December 31, 2017
| + | The principal amount is disclosed in local currency and the fair value is disclosed in U.S. Dollars. |
| (a) | These securities are held by the AZL BlackRock Global Allocation Fund (the “VIP Subsidiary”). |
| (b) | Rule 144A, Section 4(2) or other security which is restricted to resale to institutional investors. The subadviser has deemed these securities to be illiquid based on procedures approved by the Board of Trustees. As of December 31, 2017, these securities represent 0.96% of the net assets of the fund. |
| (c) | Security was valued in good faith pursuant to procedures approved by the Board of Trustees as of December 31, 2017. The total of all such securities represent 0.75% of the net assets of the fund. |
| (d) | Rule 144A, Section 4(2) or other security which is restricted to resale to institutional investors. The subadviser has deemed these securities to be liquid based on procedures approved by the Board of Trustees. |
| (e) | Defaulted bond. |
| (f) | The subadviser has deemed these securities to be illiquid based on procedures approved by the Board of Trustees. As of December 31, 2017, these securities represent 0.08% of the net assets of the Fund. |
| (g) | The rate for certain asset-backed and mortgage-backed securities may vary based on factors relating to the pool of assets underlying the security. The rate presented is the rate in effect at December 31, 2017. |
| (h) | Principal amount is stated in 1,000 Brazilian Real Units. |
| (i) | Principal amount is stated in 100 Mexican Peso Units. |
| (j) | The rate represents the effective yield at December 31, 2017. |
| (k) | All or a portion of these securities are held by the AZL Cayman Global Allocation Fund I, Ltd. (the “Subsidiary”). |
| (l) | Purchased with cash collateral held from securities lending. The value of the collateral could include collateral held for securities that were sold on or before December 31, 2017. |
| (m) | See Federal Tax Information listed in the Notes to the Consolidated Financial Statements. |
The following represents the concentrations by country of risk (based on the domicile of the security issuer) relative to the total fair value of investments as of December 31, 2017: (Unaudited)
| Country* | Percentage | |||
Argentina | 0.5 | % | ||
Australia | 1.0 | % | ||
Belgium | 0.2 | % | ||
Bermuda | — | %^ | ||
Brazil | 1.0 | % | ||
Canada | 0.7 | % | ||
Cayman Islands | — | %^ | ||
Chile | — | %^ | ||
China | 0.1 | % | ||
Czech Republic | — | %^ | ||
Denmark | — | %^ | ||
European Community | 0.2 | % | ||
Finland | 0.1 | % | ||
France | 1.4 | % | ||
Germany | 1.4 | % | ||
Guernsey | — | %^ | ||
Hong Kong | 0.4 | % | ||
Hungary | 0.1 | % | ||
India | 0.7 | % | ||
Indonesia | 0.1 | % | ||
Ireland (Republic of) | — | %^ | ||
Israel | — | %^ | ||
Italy | 0.6 | % | ||
| Country | Percentage | |||
Japan | 4.8 | % | ||
Jersey | 0.1 | % | ||
Liberia | — | %^ | ||
Luxembourg | 0.1 | % | ||
Mexico | 0.6 | % | ||
Netherlands | 0.9 | % | ||
Norway | — | %^ | ||
Panama | — | %^ | ||
Poland | 0.7 | % | ||
Portugal | 0.1 | %^ | ||
Republic of Korea (South) | 0.3 | % | ||
Singapore | 0.1 | % | ||
South Africa | — | %^ | ||
Spain | 0.2 | % | ||
Sweden | 0.1 | % | ||
Switzerland | 0.8 | % | ||
Taiwan, Province Of China | 0.3 | % | ||
Thailand | 0.1 | % | ||
Turkey | — | %^ | ||
United Arab Emirates | 0.2 | % | ||
United Kingdom | 2.0 | % | ||
United States | 80.1 | % | ||
|
| |||
| 100.0 | % | |||
|
| |||
| ^ | Represents less than 0.05%. |
| * | The portfolio composition percent of net assets by country does not include geographical information of the investments of the Affiliated Investment Companies held by the Fund. |
Futures Contracts
Cash of $41,090,547 has been segregated to cover margin requirements for the following open contracts as of December 31, 2017:
Short Futures
| Description | Expiration Date | Number of Contracts | Notional Amount | Unrealized Appreciation/ (Depreciation) | ||||||||||||
DJ EURO STOXX 50 March Futures (Euro)(a) | 3/16/18 | 4 | (167,622 | ) | $ | 3,436 | ||||||||||
NASDAQ 100 E-Mini March Futures (U.S. Dollar)(a) | 3/16/18 | 24 | (3,076,200 | ) | (10,184 | ) | ||||||||||
Nikkei 225 Index March Futures (Japanese Yen)(a) | 3/8/18 | 4 | (402,982 | ) | (644 | ) | ||||||||||
S&P 500 Index E-Mini March Futures (U.S. Dollar)(a) | 3/16/18 | 12 | (1,605,600 | ) | (16,821 | ) | ||||||||||
|
| |||||||||||||||
| $ | (24,213 | ) | ||||||||||||||
|
| |||||||||||||||
Continued
14
AZL MVP BlackRock Global Strategy Plus Fund
Consolidated Schedule of Portfolio Investments
December 31, 2017
Long Futures
| Description | Expiration Date | Number of Contracts | Notional Amount | Unrealized Appreciation/ (Depreciation) | ||||||||||||
S&P 500 Index E-Mini March Futures (U.S. Dollar) | 3/19/18 | 154 | 20,605,200 | $ | 339,371 | |||||||||||
U.S. Treasury 10-Year Note March Futures (U.S. Dollar) | 3/20/18 | 168 | 20,839,875 | (113,337 | ) | |||||||||||
|
| |||||||||||||||
| 226,034 | ||||||||||||||||
|
| |||||||||||||||
Total Net Futures Contracts | $ | 201,821 | ||||||||||||||
|
| |||||||||||||||
Option Contracts(a)
At December 31, 2017, the Fund’s over-the-counter options purchased were as follows:
| Description | Counterparty | Put/ Call | Strike Price | Expiration Date | Contracts | Notional | Fair Value | |||||||||||||||||||
BP plc | UBS Warburg | Call | 40.00 USD | 1/18/19 | 33,891 | 1,355,640 | $ | 121,622 | ||||||||||||||||||
Chevron Corp. | UBS Warburg | Call | 125.00 USD | 1/18/19 | 10,746 | 1,343,250 | 90,411 | |||||||||||||||||||
Conocophilips | UBS Warburg | Call | 52.50 USD | 1/18/19 | 17,866 | 937,965 | 117,607 | |||||||||||||||||||
Euro Stoxx 50 Index | Deutsche Bank | Call | 3426.55 EUR | 9/21/18 | 106 | 363,214 | 21,106 | |||||||||||||||||||
Exxon Mobil Corp. | UBS Warburg | Call | 95.00 USD | 1/18/19 | 7,306 | 694,070 | 8,264 | |||||||||||||||||||
Franklin Resources, Inc. | Goldman Sachs | Call | 45.00 USD | 1/19/18 | 10,439 | 469,755 | 2,339 | |||||||||||||||||||
Occidental Petroleum Corp. | UBS Warburg | Call | 75.00 USD | 1/18/19 | 15,702 | 1,177,650 | 79,436 | |||||||||||||||||||
Royal Dutch Shell plc | UBS Warburg | Call | 60.00 USD | 1/18/19 | 19,345 | 1,160,700 | 147,293 | |||||||||||||||||||
S&P 500 Index | Deutsche Bank | Call | 2685.00 USD | 1/19/18 | 1,326 | 3,560,310 | 19,467 | |||||||||||||||||||
S&P 500 Index | BNP Paribas | Call | 2690.00 USD | 2/16/18 | 1,594 | 4,287,860 | 37,466 | |||||||||||||||||||
S&P 500 Index | UBS Warburg | Call | 2670.00 USD | 3/16/18 | 903 | 2,411,010 | 43,573 | |||||||||||||||||||
S&P 500 Index | Bank of America | Call | 2675.00 USD | 3/16/18 | 903 | 2,415,525 | 40,721 | |||||||||||||||||||
S&P 500 Index | Societe Generale | Call | 2675.00 USD | 3/29/18 | 637 | 1,703,975 | 32,790 | |||||||||||||||||||
S&P 500 Index | Morgan Stanley | Call | 2695.00 USD | 4/20/18 | 465 | 1,253,175 | 22,451 | |||||||||||||||||||
S&P 500 Index | Citigroup | Call | 2700.00 USD | 4/20/18 | 531 | 1,433,700 | 24,074 | |||||||||||||||||||
Schlumberger, Ltd. | UBS Warburg | Call | 90.00 USD | 1/18/19 | 10,576 | 951,840 | 7,654 | |||||||||||||||||||
SPDR Gold Shares(c) | Morgan Stanley | Call | 125.00 USD | 1/19/18 | 5,374 | 671,750 | 3,353 | |||||||||||||||||||
SPDR Gold Shares(c) | Morgan Stanley | Call | 126.00 USD | 1/19/18 | 5,375 | 677,250 | 2,134 | |||||||||||||||||||
SPDR Gold Shares(c) | Morgan Stanley | Call | 130.00 USD | 2/16/18 | 13,501 | 1,755,130 | 4,657 | |||||||||||||||||||
SPDR Gold Shares(c) | Morgan Stanley | Call | 127.00 USD | 3/16/18 | 13,457 | 1,709,039 | 16,171 | |||||||||||||||||||
Suncor Energy, Inc. | UBS Warburg | Call | 35.00 USD | 1/18/19 | 22,818 | 798,630 | 94,438 | |||||||||||||||||||
Synchrony Financial | Goldman Sachs | Call | 35.00 USD | 1/19/18 | 11,562 | 404,670 | 43,731 | |||||||||||||||||||
Tokyo Stock Exchange Price Index | Morgan Stanley | Call | 1785.00 JPY | 1/12/18 | 132,185 | 235,950,225 | 46,124 | |||||||||||||||||||
Tokyo Stock Exchange Price Index | Citigroup | Call | 1785.00 JPY | 2/09/18 | 95,294 | 170,099,790 | 45,849 | |||||||||||||||||||
Tokyo Stock Exchange Price Index | Morgan Stanley | Call | 1800.00 JPY | 3/09/18 | 105,769 | 190,384,200 | 52,186 | |||||||||||||||||||
Total SA | UBS Warburg | Call | 60.00 USD | 1/18/19 | 23,303 | 1,398,180 | 37,437 | |||||||||||||||||||
Travelers Companies, Inc. | Goldman Sachs | Call | 135.00 USD | 1/19/18 | 4,163 | 562,005 | 8,855 | |||||||||||||||||||
SPDR Gold Shares(c) | Morgan Stanley | Put | 117.00 USD | 1/19/18 | 10,749 | 1,257,633 | 612 | |||||||||||||||||||
|
| |||||||||||||||||||||||||
Total (Cost $815,159) | $ | 1,171,821 | ||||||||||||||||||||||||
|
| |||||||||||||||||||||||||
At December 31, 2017, the Funds’s over-the-counter options written were as follows:
| Description | Counterparty | Put/ Call | Strike Price | Expiration Date | Contracts | Notional | Fair Value | |||||||||||||||||||
FleetCor Technologies, Inc. | Barclays Bank | Call | 180.00 USD | 1/18/19 | 1,321 | 237,780 | $ | (39,108 | ) | |||||||||||||||||
Pioneer Natural Resources Co. | UBS Warburg | Call | 165.00 USD | 1/18/19 | 2,826 | 466,290 | (78,241 | ) | ||||||||||||||||||
SPDR Gold Shares(c) | Morgan Stanley | Call | 140.00 USD | 3/16/18 | 13,457 | 1,883,980 | (1,705 | ) | ||||||||||||||||||
Synchrony Financial | Bank of America | Call | 35.00 USD | 1/19/18 | 11,562 | 404,670 | (43,731 | ) | ||||||||||||||||||
United Continental Holdings, Inc. | Deutsche Bank | Call | 75.00 USD | 1/18/19 | 3,469 | 260,175 | (22,065 | ) | ||||||||||||||||||
BP plc | UBS Warburg | Put | 25.00 USD | 1/18/19 | 33,891 | 847,275 | (5,745 | ) | ||||||||||||||||||
Continued
15
AZL MVP BlackRock Global Strategy Plus Fund
Consolidated Schedule of Portfolio Investments
December 31, 2017
| Description | Counterparty | Put/ Call | Strike Price | Expiration Date | Contracts | Notional Amount(b) | Fair Value | |||||||||||||||||||
Chevron Corp. | UBS Warburg | Put | 80.00 USD | 1/18/19 | 10,746 | 859,680 | $ | (6,900 | ) | |||||||||||||||||
Conocophilips | UBS Warburg | Put | 35.00 USD | 1/18/19 | 17,866 | 625,310 | (7,615 | ) | ||||||||||||||||||
Euro Stoxx 50 Index | Deutsche Bank | Put | 2586.07 EUR | 9/21/18 | 106 | 274,123 | (2,563 | ) | ||||||||||||||||||
Exxon Mobil Corp. | UBS Warburg | Put | 60.00 USD | 1/18/19 | 7,306 | 438,360 | (4,292 | ) | ||||||||||||||||||
Occidental Petroleum Corp. | UBS Warburg | Put | 45.00 USD | 1/18/19 | 15,702 | 706,590 | (7,450 | ) | ||||||||||||||||||
Royal Dutch Shell plc | UBS Warburg | Put | 40.00 USD | 1/18/19 | 19,345 | 773,800 | (3,160 | ) | ||||||||||||||||||
S&P 500 Index | Deutsche Bank | Put | 2500.00 USD | 1/19/18 | 663 | 1,657,500 | (1,921 | ) | ||||||||||||||||||
S&P 500 Index | BNP Paribas | Put | 2450.00 USD | 2/16/18 | 797 | 1,952,650 | (4,405 | ) | ||||||||||||||||||
Schlumberger, Ltd. | UBS Warburg | Put | 60.00 USD | 1/18/19 | 10,576 | 634,560 | (35,493 | ) | ||||||||||||||||||
SPDR Gold Shares(c) | Morgan Stanley | Put | 120.00 USD | 1/19/18 | 10,749 | 1,289,880 | (1,885 | ) | ||||||||||||||||||
SPDR Gold Shares(c) | Morgan Stanley | Put | 115.00 USD | 2/16/18 | 9,491 | 1,091,465 | (1,007 | ) | ||||||||||||||||||
SPDR Gold Shares(c) | Morgan Stanley | Put | 115.00 USD | 3/16/18 | 5,666 | 651,590 | (1,176 | ) | ||||||||||||||||||
Suncor Energy, Inc. | UBS Warburg | Put | 25.00 USD | 1/18/19 | 22,818 | 570,450 | (11,005 | ) | ||||||||||||||||||
Tokyo Stock Exchange Price Index | Citigroup | Put | 1675.00 JPY | 2/09/18 | 95,294 | 159,617,450 | (3,897 | ) | ||||||||||||||||||
Tokyo Stock Exchange Price Index | Morgan Stanley | Put | 1650.00 JPY | 3/09/18 | 105,769 | 174,518,850 | (7,475 | ) | ||||||||||||||||||
Total SA | UBS Warburg | Put | 40.00 USD | 1/18/19 | 23,303 | 932,120 | (11,335 | ) | ||||||||||||||||||
|
| |||||||||||||||||||||||||
Total (Premiums $554,141) | $ | (302,174 | ) | |||||||||||||||||||||||
|
| |||||||||||||||||||||||||
At December 31, 2017, the Fund’s over-the-counter currency options purchased were as follows:
| Description | Counterparty | Put/ Call | Strike Price | Expiration Date | Notional Value | Fair Value | ||||||||||||||||
European Dollar Call Currency Option (EUR/USD) | UBS Warburg | Call | 1.20 EUR | 3/27/18 | 10,512,802 | $ | 220,129 | |||||||||||||||
European Dollar Call Currency Option (EUR/USD) | Barclays Bank | Call | 1.19 EUR | 5/18/18 | 53,161 | 180,046 | ||||||||||||||||
Japanese Yen Put Currency Option (JPY/USD) | BNP Paribas SA | Put | 111.75 JPY | 1/12/18 | 53,448 | 11,094 | ||||||||||||||||
|
| |||||||||||||||||||||
Total (Cost $297,701) | $ | 411,269 | ||||||||||||||||||||
|
| |||||||||||||||||||||
At December 31, 2017, the Fund’s over-the-counter currency options written were as follows:
| Description | Counterparty | Put/ Call | Strike Price | Expiration Date | Notional Value | Fair Value | ||||||||||||||||
Japanese Yen Call Currency Option (USD/JPY) | BNP Paribas SA | Call | 115.00 USD | 1/12/18 | (53,448 | ) | $ | (1,582 | ) | |||||||||||||
South African Rand Call Currency Option (USD/ZAR) | BNP Paribas SA | Call | 15.25 USD | 1/26/18 | (13,299 | ) | (594 | ) | ||||||||||||||
Japanese Yen Put Currency Option (USD/JPY) | BNP Paribas SA | Put | 108.00 USD | 1/12/18 | (53,448 | ) | (768 | ) | ||||||||||||||
|
| |||||||||||||||||||||
Total (Premiums $95,352) | $ | (2,944 | ) | |||||||||||||||||||
|
| |||||||||||||||||||||
At December 31, 2017, the Fund’s open over-the-counter interest rate swaptions purchased were as follows:
| Description and terms of payments to be received from another party | Description and terms of payments to be paid to another party | Expiration Date | Counterparty | Notional Amount (Local) | Value | Unrealized Appreciation/ (Depreciation) | ||||||||||||||||||
Fixed 2.46% Semi-annually | 3-Month U.S. Dollar Libor BBA Quarterly | 1/4/18 | Goldman Sachs | 538 | USD | $ | 2,849 | $ | (17,684 | ) | ||||||||||||||
Fixed 1.07% Semi-annually | 6-Month Japanese Yen LIBOR Rate BBA Semi-annually | 4/4/18 | Deutsche Bank | 1,006,980 | JPY | 3 | (21,144 | ) | ||||||||||||||||
Fixed 2.15% Semi-annually | 3-Month U.S. Dollar Libor BBA Quarterly | 4/24/18 | Goldman Sachs | 2,680 | USD | 73,242 | (111,125 | ) | ||||||||||||||||
Fixed 2.75% Quarterly | 3-Month US Dollar LIBOR BBA Quarterly | 5/2/18 | Goldman Sachs | 126 | USD | 16,106 | (44,985 | ) | ||||||||||||||||
|
|
|
| |||||||||||||||||||||
Total (Cost $287,138) | $ | 92,200 | $ | (194,938 | ) | |||||||||||||||||||
|
|
|
| |||||||||||||||||||||
Continued
16
AZL MVP BlackRock Global Strategy Plus Fund
Consolidated Schedule of Portfolio Investments
December 31, 2017
At December 31, 2017, the Fund’s open over-the-counter interest rate swaptions written were as follows:
Description and terms of payments to be received | Description and terms of payments to be paid to another party | Expiration Date | Counterparty | Notional Amount (Local) | Value | Unrealized Appreciation/ (Depreciation) | ||||||||||||||||||
Fixed 2.61% Semi-annually | 3-Month U.S. Dollar Libor BBA Quarterly | 1/4/18 | Goldman Sachs | (538 | ) | USD | $ | (102 | ) | $ | 3,486 | |||||||||||||
Fixed 2.4% Semi-annually | 3-Month U.S. Dollar Libor BBA Quarterly | 4/24/18 | Goldman Sachs | (1,340 | ) | USD | (43,195 | ) | 22,191 | |||||||||||||||
Fixed 1.9% Semi-annually | 3-Month U.S. Dollar Libor BBA Quarterly | 4/28/18 | Goldman Sachs | (2,680 | ) | USD | (17,988 | ) | 60,797 | |||||||||||||||
Fixed 2.50% Quarterly | 3-Month US Dollar LIBOR BBA Quarterly | 5/2/18 | Goldman Sachs | (575 | ) | USD | (12,174 | ) | 30,603 | |||||||||||||||
|
|
|
| |||||||||||||||||||||
Total (Premiums $190,536) | $ | (73,459 | ) | $ | 117,077 | |||||||||||||||||||
|
|
|
| |||||||||||||||||||||
Forward Currency Contracts(a)
At December 31, 2017, the Fund’s open forward currency contracts were as follows:
| Currency Purchased | Currency Sold | Counterparty | Settlement Date | Net Unrealized Appreciation/ (Depreciation) | ||||||||||||||||||||
Short Contracts: |
| |||||||||||||||||||||||
U.S. Dollar | 1,033,000 | Mexican Peso | 19,196,961 | UBS Warburg | 1/11/18 | $ | 58,560 | |||||||||||||||||
U.S. Dollar | 826,000 | Mexican Peso | 15,771,644 | Deutsche Bank | 1/18/18 | 26,515 | ||||||||||||||||||
U.S. Dollar | 2,423,339 | Australian Dollar | 3,095,000 | Goldman Sachs | 1/25/18 | 8,903 | ||||||||||||||||||
U.S. Dollar | 947,653 | New Zealand Dollar | 1,325,000 | JPMorgan Chase | 2/22/18 | 9,576 | ||||||||||||||||||
U.S. Dollar | 875,157 | European Euro | 738,000 | UBS Warburg | 2/26/18 | (13,170 | ) | |||||||||||||||||
U.S. Dollar | 383,809 | British Pound | 290,000 | UBS Warburg | 2/26/18 | (8,368 | ) | |||||||||||||||||
U.S. Dollar | 427,691 | Australian Dollar | 550,000 | Citigroup | 4/6/18 | (1,266 | ) | |||||||||||||||||
U.S. Dollar | 1,060,911 | Australian Dollar | 1,395,000 | Deutsche Bank | 4/13/18 | (27,067 | ) | |||||||||||||||||
|
| |||||||||||||||||||||||
| $ | 53,683 | |||||||||||||||||||||||
|
| |||||||||||||||||||||||
Long Contracts: |
| |||||||||||||||||||||||
British Pound | 789,000 | U.S. Dollar | 1,037,653 | JPMorgan Chase | 2/8/18 | $ | 28,792 | |||||||||||||||||
British Pound | 789,000 | U.S. Dollar | 1,037,890 | JPMorgan Chase | 2/16/18 | 28,798 | ||||||||||||||||||
British Pound | 787,000 | U.S. Dollar | 1,035,476 | JPMorgan Chase | 2/23/18 | 28,720 | ||||||||||||||||||
European Euro | 1,628,000 | U.S. Dollar | 1,922,017 | UBS Warburg | 3/15/18 | 39,725 | ||||||||||||||||||
European Euro | 876,000 | Polish Zloty | 3,713,101 | Deutsche Bank | 3/16/18 | (11,793 | ) | |||||||||||||||||
European Euro | 1,255,000 | U.S. Dollar | 1,485,976 | UBS Warburg | 3/16/18 | 26,401 | ||||||||||||||||||
European Euro | 1,633,000 | U.S. Dollar | 1,931,676 | UBS Warburg | 4/12/18 | 39,723 | ||||||||||||||||||
Japanese Yen | 6,817,986 | U.S. Dollar | 60,424 | BNP Paribas SA | 1/4/18 | 107 | ||||||||||||||||||
Japanese Yen | 7,345,532 | U.S. Dollar | 65,276 | Barclays Bank | 1/5/18 | (57 | ) | |||||||||||||||||
Japanese Yen | 115,725,000 | U.S. Dollar | 1,031,027 | Barclays Bank | 3/8/18 | (361 | ) | |||||||||||||||||
Japanese Yen | 138,290,000 | U.S. Dollar | 1,224,805 | Goldman Sachs | 3/15/18 | 7,398 | ||||||||||||||||||
New Zealand Dollar | 1,325,000 | U.S. Dollar | 913,091 | JPMorgan Chase | 2/22/18 | 24,986 | ||||||||||||||||||
Norwegian Krone | 6,648,000 | U.S. Dollar | 833,041 | Morgan Stanley | 1/26/18 | (22,358 | ) | |||||||||||||||||
Swedish Krona | 8,719,893 | European Euro | 882,000 | Deutsche Bank | 3/22/18 | 5,445 | ||||||||||||||||||
Swedish Krona | 8,722,980 | European Euro | 882,000 | BNP Paribas SA | 3/29/18 | 5,803 | ||||||||||||||||||
|
| |||||||||||||||||||||||
| $ | 201,329 | |||||||||||||||||||||||
|
| |||||||||||||||||||||||
Swap Agreements(a)
|
| |||||||||||||||||||||||||||||||
At December 31, 2017, the Fund’s open over-the-counter credit default swap agreements (buy protection) were as follows:(d)
|
| |||||||||||||||||||||||||||||||
| Description | Counterparty | Payment Frequency | Implied Credit Spread at December 31, 2017(e) | Expiration Date | Notional Amount(f) | Value | Upfront Premiums Paid/ (Received) | Unrealized Appreciation/ (Depreciation) | ||||||||||||||||||||||||
Airbus SE | Barclays Bank | Quarterly | 0.28 | % | 6/20/22 | 269,838 | EUR | $ | (10,491 | ) | $ | (9,250 | ) | $ | (1,241 | ) | ||||||||||||||||
Airbus SE | Barclays Bank | Quarterly | 0.28 | % | 6/20/22 | 134,950 | EUR | (5,247 | ) | (4,979 | ) | (268 | ) | |||||||||||||||||||
AKZO Nobel | Barclays Bank | Quarterly | 0.46 | % | 6/20/22 | 269,838 | EUR | (7,870 | ) | (6,389 | ) | (1,481 | ) | |||||||||||||||||||
BASF SE | Barclays Bank | Quarterly | 0.24 | % | 6/20/22 | 269,838 | EUR | (11,041 | ) | (9,973 | ) | (1,068 | ) | |||||||||||||||||||
Bayer AG | Barclays Bank | Quarterly | 0.33 | % | 6/20/22 | 269,838 | EUR | (9,712 | ) | (8,962 | ) | (750 | ) | |||||||||||||||||||
Continued
17
AZL MVP BlackRock Global Strategy Plus Fund
Consolidated Schedule of Portfolio Investments
December 31, 2017
Description | Counterparty | Payment Frequency | Implied Credit Spread at December 31, 2017(e) | Expiration Date | Notional Amount(f) | Value | Upfront Premiums Paid/ (Received) | Unrealized Appreciation/ (Depreciation) | ||||||||||||||||||||||||
BP Capital Markets | Barclays Bank | Quarterly | 0.40 | % | 6/20/22 | 269,838 | EUR | $ | (8,769 | ) | $ | (6,388 | ) | $ | (2,381 | ) | ||||||||||||||||
Royal Dutch Shell plc | Barclays Bank | Quarterly | 0.28 | % | 6/20/22 | 134,950 | EUR | (5,222 | ) | (4,465 | ) | (757 | ) | |||||||||||||||||||
Royal Dutch Shell plc | Barclays Bank | Quarterly | 0.28 | % | 6/20/22 | 269,838 | EUR | (10,442 | ) | (8,100 | ) | (2,342 | ) | |||||||||||||||||||
Saint-Gobain | Barclays Bank | Quarterly | 0.36 | % | 6/20/22 | 269,838 | EUR | (9,313 | ) | (7,814 | ) | (1,499 | ) | |||||||||||||||||||
Statoil ASA | Barclays Bank | Quarterly | 0.15 | % | 6/20/22 | 269,838 | EUR | (12,488 | ) | (10,118 | ) | (2,370 | ) | |||||||||||||||||||
Volkswagen | Barclays Bank | Quarterly | 0.47 | % | 6/20/22 | 269,838 | EUR | (7,737 | ) | (5,539 | ) | (2,198 | ) | |||||||||||||||||||
|
|
|
|
|
| |||||||||||||||||||||||||||
| $ | (98,332 | ) | $ | (81,977 | ) | $ | (16,355 | ) | ||||||||||||||||||||||||
|
|
|
|
|
| |||||||||||||||||||||||||||
At December 31, 2017, the Fund’s open centrally cleared credit default swap agreements (buy protection) were as follows:
| Description | Clearing Agent | Payment Frequency | Implied Credit Spread at December 31, 2017(e) | Expiration Date | Notional Amount(f) | Fixed Rate | Value | Premiums Paid/ (Received) | Unrealized Appreciation/ (Depreciation) | |||||||||||||||||||||||||
CDX North America High Yield Index Swap Agreement with Series 29 | Bank of America | Quarterly | 3.07 | % | 12/20/22 | $ | 759,099 | 5.00 | % | $ | (62,870 | ) | $ | (56,292 | ) | $ | (6,578 | ) | ||||||||||||||||
|
|
|
|
|
| |||||||||||||||||||||||||||||
| $ | (62,870 | ) | $ | (56,292 | ) | $ | (6,578 | ) | ||||||||||||||||||||||||||
|
|
|
|
|
| |||||||||||||||||||||||||||||
At December 31, 2017, the Fund’s open over-the-counter variance swap agreements were as follows:
| Reference Entity | Counterparty | Strike Price | Expiration Date | Notional Amount (Local) | Upfront Premiums Paid/ (Received) | Amount at Value | Unrealized Appreciation/ (Depreciation) | |||||||||||||||||||
5yr-30yr Constant Maturity Swap Capital | Goldman Sachs | $ | 0.31 | 11/6/18 | $ | 8,330,000 | $ | 25,546 | $ | 4,920 | $ | (20,626 | ) | |||||||||||||
|
|
|
| |||||||||||||||||||||||
Total (Premiums $25,546) | $ | 4,920 | $ | (20,626 | ) | |||||||||||||||||||||
|
|
|
| |||||||||||||||||||||||
At December 31, 2017, the Fund’s open over-the-counter currency swap agreements were as follows:
| Pay/ Receive Floating Rate | Fixed Rate | Expiration Date | Counterparty | Notional Amount | Value | Unrealized Appreciation/ (Depreciation) | ||||||||||||||||||||
Pay | 1.963% | 3/15/18 | Bank of America | 131,550,000 | JPY | $ | (8,454 | ) | $ | (8,454 | ) | |||||||||||||||
Pay | 1.838% | 3/15/18 | Bank of America | 86,950,000 | JPY | (224 | ) | (224 | ) | |||||||||||||||||
Pay | 2.012% | 10/15/18 | Bank of America | 273,450,000 | JPY | 209,101 | 209,101 | |||||||||||||||||||
|
|
|
| |||||||||||||||||||||||
| $ | 200,423 | $ | 200,423 | |||||||||||||||||||||||
|
|
|
| |||||||||||||||||||||||
At December 31, 2017, the Fund’s open centrally cleared interest rate swap agreements were as follows:
Description and terms of payments to be received from another party | Description and terms of payments to be paid to another party | Expiration Date | Clearing Agent | Notional Amount (Local) | Upfront Premiums Paid/ (Received) | Value | Unrealized Appreciation/ (Depreciation) | |||||||||||||||||||||
6-Month Euro Interbank Offer Rate (EURIBOR) Semi-annually | Fixed 0.415% Annually | 3/7/23 | Bank of America | 4,684,846 | EUR | $ | 59 | $ | (16,878 | ) | $ | (16,937 | ) | |||||||||||||||
Fixed 2.403% Semi-annually | 3-Month U.S. Dollar LIBOR BBA Quarterly | 3/7/23 | Bank of America | 5,293,612 | USD | 64 | 29,661 | 29,597 | ||||||||||||||||||||
Fixed 2.33% Semi-annually | 3-Month U.S. Dollar LIBOR BBA Quarterly | 6/14/23 | Bank of America | 5,698,956 | USD | 69 | 2,302 | 2,233 | ||||||||||||||||||||
6-Month Euro Interbank Offer Rate (EURIBOR) Semi-annually | Fixed 0.340% Annually | 6/14/23 | Bank of America | 4,569,918 | EUR | 65 | 23,835 | 23,770 | ||||||||||||||||||||
Continued
18
AZL MVP BlackRock Global Strategy Plus Fund
Consolidated Schedule of Portfolio Investments
December 31, 2017
Description and terms of payments to be received from another party | Description and terms of payments to be paid to another party | Expiration Date | Clearing Agent | Notional Amount (Local) | Upfront Premiums Paid/ (Received) | Value | Unrealized Appreciation/ (Depreciation) | |||||||||||||||||||||
6-Month Euro Interbank Offer Rate (EURIBOR) Semi-annually | Fixed 0.373% Annually | 8/15/26 | Bank of America | 1,778,707 | EUR | 28 | $ | 61,695 | $ | 61,667 | ||||||||||||||||||
|
|
|
| |||||||||||||||||||||||||
| $ | 100,615 | $ | 100,330 | |||||||||||||||||||||||||
|
|
|
| |||||||||||||||||||||||||
At December 31, 2017, the Fund’s open over-the-counter total return swap agreements were as follows:
| Pay/ Receive | Description | Expiration Date | Counterparty | Notional Amount (Local) | Unrealized Appreciation/ (Depreciation) | |||||||||||||||
Pay | EURO Stoxx 50 Index Dividends December Futures | 12/20/19 | BNP Paribas SA | 60,300 | EUR | $ | 19,651 | |||||||||||||
Pay | EURO Stoxx 50 Index Dividends December Futures | 12/20/19 | BNP Paribas SA | 131,430 | EUR | 41,642 | ||||||||||||||
Pay | EURO Stoxx 50 Index Dividends December Futures | 12/20/19 | BNP Paribas SA | 122,040 | EUR | 37,575 | ||||||||||||||
Pay | EURO Stoxx 50 Index Dividends December Futures | 12/20/19 | BNP Paribas SA | 92,430 | EUR | 27,101 | ||||||||||||||
Pay | EURO Stoxx 50 Index Dividends December Futures | 12/17/20 | BNP Paribas SA | 51,650 | EUR | 11,997 | ||||||||||||||
Pay | EURO Stoxx 50 Index Dividends December Futures | 12/18/20 | BNP Paribas SA | 106,900 | EUR | 23,634 | ||||||||||||||
Pay | EURO Stoxx 50 Index Dividends December Futures | 12/18/20 | BNP Paribas SA | 106,700 | EUR | 39,062 | ||||||||||||||
Pay | EURO Stoxx 50 Index Dividends December Futures | 12/18/20 | BNP Paribas SA | 28,920 | EUR | 10,869 | ||||||||||||||
Pay | EURO Stoxx 50 Index Dividends December Futures | 12/18/20 | BNP Paribas SA | 67,410 | EUR | 25,446 | ||||||||||||||
Pay | EURO Stoxx 50 Index Dividends December Futures | 12/18/20 | BNP Paribas SA | 28,800 | EUR | 11,013 | ||||||||||||||
Pay | EURO Stoxx 50 Index Dividends December Futures | 12/18/20 | BNP Paribas SA | 28,860 | EUR | 10,941 | ||||||||||||||
Pay | EURO Stoxx 50 Index Dividends December Futures | 12/18/20 | BNP Paribas SA | 29,100 | EUR | 10,653 | ||||||||||||||
Pay | EURO Stoxx 50 Index Dividends December Futures | 12/17/21 | BNP Paribas SA | 36,240 | EUR | 900 | ||||||||||||||
Pay | EURO Stoxx 50 Index Dividends December Futures | 12/17/21 | BNP Paribas SA | 56,450 | EUR | 6,238 | ||||||||||||||
Pay | EURO Stoxx 50 Index Dividends December Futures | 12/17/21 | BNP Paribas SA | 59,750 | EUR | 2,279 | ||||||||||||||
Pay | EURO Stoxx 50 Index Dividends December Futures | 12/17/21 | BNP Paribas SA | 53,400 | EUR | 9,898 | ||||||||||||||
Pay | EURO Stoxx 50 Index Dividends December Futures | 12/16/22 | BNP Paribas SA | 55,400 | EUR | 5,219 | ||||||||||||||
Pay | EURO Stoxx 50 Index Dividends December Futures | 12/16/22 | BNP Paribas SA | 126,500 | EUR | 5,939 | ||||||||||||||
Pay | EURO Stoxx 50 Index Dividends December Futures | 12/16/22 | BNP Paribas SA | 32,850 | EUR | 3,599 | ||||||||||||||
Pay | EURO Stoxx 50 Index Dividends December Futures | 12/21/22 | BNP Paribas SA | 54,450 | EUR | 6,358 | ||||||||||||||
Pay | EURO Stoxx 50 Index Dividends December Futures | 12/15/23 | BNP Paribas SA | 79,520 | EUR | 1,092 | ||||||||||||||
Pay | NIKKEI 225 Dividend Index E-Mini April Futures | 4/03/23 | JPMorgan Chase | 4,280,000 | JPY | 6,258 | ||||||||||||||
Pay | NIKKEI 225 Dividend Index E-Mini March Futures | 4/02/18 | BNP Paribas SA | 19,830,600 | JPY | 21,190 | ||||||||||||||
Pay | NIKKEI 225 Dividend Index E-Mini March Futures | 4/02/18 | BNP Paribas SA | 20,025,000 | JPY | 19,466 | ||||||||||||||
Pay | NIKKEI 225 Dividend Index E-Mini March Futures | 3/29/19 | BNP Paribas SA | 10,560,000 | JPY | 20,664 | ||||||||||||||
Pay | NIKKEI 225 Dividend Index E-Mini March Futures | 3/29/19 | BNP Paribas SA | 10,312,500 | JPY | 22,861 | ||||||||||||||
Pay | NIKKEI 225 Dividend Index E-Mini March Futures | 3/29/19 | BNP Paribas SA | 20,514,000 | JPY | 46,707 | ||||||||||||||
Pay | NIKKEI 225 Dividend Index E-Mini March Futures | 3/31/20 | BNP Paribas SA | 13,960,000 | JPY | 42,145 | ||||||||||||||
Pay | NIKKEI 225 Dividend Index E-Mini March Futures | 3/31/20 | BNP Paribas SA | 17,000,000 | JPY | 56,675 | ||||||||||||||
Pay | NIKKEI 225 Dividend Index E-Mini March Futures | 4/01/20 | BNP Paribas SA | 10,488,000 | JPY | 31,449 | ||||||||||||||
Pay | NIKKEI 225 Dividend Index E-Mini March Futures | 3/31/21 | BNP Paribas SA | 3,880,000 | JPY | 8,477 | ||||||||||||||
Pay | NIKKEI 225 Dividend Index E-Mini March Futures | 3/31/21 | BNP Paribas SA | 15,520,000 | JPY | 33,907 | ||||||||||||||
Pay | NIKKEI 225 Dividend Index E-Mini March Futures | 3/31/21 | BNP Paribas SA | 3,855,000 | JPY | 8,699 | ||||||||||||||
Pay | NIKKEI 225 Dividend Index E-Mini March Futures | 3/31/21 | BNP Paribas SA | 7,655,000 | JPY | 17,886 | ||||||||||||||
Pay | NIKKEI 225 Dividend Index E-Mini March Futures | 3/31/21 | BNP Paribas SA | 4,215,000 | JPY | 5,503 | ||||||||||||||
Pay | NIKKEI 225 Dividend Index E-Mini March Futures | 3/31/22 | BNP Paribas SA | 4,260,000 | JPY | 5,787 | ||||||||||||||
Pay | NIKKEI 225 Dividend Index E-Mini March Futures | 3/31/22 | BNP Paribas SA | 15,720,000 | JPY | 34,866 | ||||||||||||||
Pay | NIKKEI 225 Dividend Index E-Mini March Futures | 3/31/22 | BNP Paribas SA | 7,970,000 | JPY | 16,457 | ||||||||||||||
Pay | NIKKEI 225 Dividend Index E-Mini March Futures | 3/31/22 | BNP Paribas SA | 7,950,000 | JPY | 16,634 | ||||||||||||||
Pay | NIKKEI 225 Dividend Index E-Mini March Futures | 3/31/23 | BNP Paribas SA | 4,230,000 | JPY | 6,702 | ||||||||||||||
Pay | S&P 500 Index Dividends December Futures | 12/21/18 | BNP Paribas SA | 257,125 | USD | 30,525 | ||||||||||||||
Pay | S&P 500 Index Dividends December Futures | 12/18/20 | Goldman Sachs | 107,944 | USD | 23,006 | ||||||||||||||
Pay | S&P 500 Index Dividends December Futures | 12/17/21 | BNP Paribas SA | 133,513 | USD | 33,550 | ||||||||||||||
|
| |||||||||||||||||||
| $ | 820,520 | |||||||||||||||||||
|
| |||||||||||||||||||
Continued
19
AZL MVP BlackRock Global Strategy Plus Fund
Consolidated Schedule of Portfolio Investments
December 31, 2017
| (a) | These securities are held by the AZL BlackRock Global Allocation Fund (the “VIP Subsidiary”). |
| (b) | Notional value is expressed as the number of contracts multiplied by the strike price of the underlying asset. |
| (c) | All or a portion of these securities are held by the AZL Cayman Global Allocation Fund I, Ltd. (the “Subsidiary”). |
| (d) | When a credit event occurs as defined under the terms of the swap agreement, the Fund as a seller of credit protection will either (i) pay to the buyer of protection an amount equal to the par value of the defaulted reference entity and take delivery of the reference entity or (ii) pay a net amount equal to the par value of the defaulted reference entity less its recovery value. Alternatively, the Fund as a buyer of credit protection will either (i) receive from the seller of protection an amount equal to the par value of the defaulted reference entity and deliver the reference entity to the seller or (ii) receive a net amount of equal to the par value of the defaulted reference entity less its recovery value. |
| (e) | Implied credit spread, represented in absolute terms, utilized in determining the market value of the credit default swap agreements as of period end will serve as an indicator of the current status of the payment/performance risk and represent the likelihood or risk of default for the credit derivative. The implied credit spread of a referenced entity reflects the cost of buying/selling protection and may include upfront or daily payments required to be made to enter into the agreement. Generally, wider credit spreads represent a perceived deterioration of the referenced entity’s credit soundness and a greater likelihood or risk of default or other credit event occurring as defined under the terms of the swap agreement. |
| (f) | The notional amount represents the maximum potential amount the Fund could be required to make as a seller of credit protection if a credit event occurs, as defined under the terms of the swap agreement. |
See accompanying notes to the consolidated financial statements.
20
AZL MVP BlackRock Global Strategy Plus Fund
Consolidated Statement of Assets and Liabilities
December 31, 2017
Assets: | |||||
Investments in non-affiliates, at cost | $ | 389,376,790 | |||
Investments in affiliates, at cost | 345,414,602 | ||||
|
| ||||
Total Investment securities, at cost | $ | 734,791,392 | |||
|
| ||||
Investments in non-affiliates, at value* | $ | 434,756,225 | |||
Investments in affiliates, at value | 375,008,055 | ||||
|
| ||||
Total Investment securities, at value | $ | 809,764,280 | |||
Segregated cash for collateral | 42,065,547 | ||||
Interest and dividends receivable | 1,196,229 | ||||
Foreign currency, at value (cost $263,136) | 264,413 | ||||
Unrealized appreciation on forward currency contracts | 339,452 | ||||
Unrealized appreciation on swap agreements | 1,029,621 | ||||
Premiums paid on swaps | 25,546 | ||||
Receivable for investments sold | 600,983 | ||||
Receivable for capital shares issued | 89,172 | ||||
Receivable for variation margin on swap agreements | 17,779 | ||||
Receivable for variation margin on futures contracts | 37,272 | ||||
Reclaims receivable | 234,362 | ||||
Prepaid expenses | 7,240 | ||||
|
| ||||
Total Assets | 855,671,896 | ||||
|
| ||||
Liabilities: | |||||
Cash overdraft | 226,705 | ||||
Cash received as collateral for derivatives | 2,100,042 | ||||
Written options contracts (Proceeds received $840,029) | 378,577 | ||||
Unrealized depreciation on swap agreements | 45,659 | ||||
Premiums received on swaps | 81,977 | ||||
Unrealized depreciation on forward currency contracts | 84,440 | ||||
Payable for investments purchased | 414,559 | ||||
Payable for collateral received on loaned securities | 17,308,385 | ||||
Payable for capital shares redeemed | 159,701 | ||||
Payable for variation margin on swap agreements | 696 | ||||
Interest payable on securities sold short | 1,145 | ||||
Accrued foreign taxes | 45,834 | ||||
Manager fees payable | 338,738 | ||||
Administration fees payable | 15,935 | ||||
Distribution fees payable | 88,633 | ||||
Custodian fees payable | 17,228 | ||||
Administrative and compliance services fees payable | 6,201 | ||||
Transfer agent fees payable | 1,022 | ||||
Trustee fees payable | 1,497 | ||||
Other accrued liabilities | 190,575 | ||||
|
| ||||
Total Liabilities | 21,507,549 | ||||
|
| ||||
Net Assets | $ | 834,164,347 | |||
|
| ||||
Net Assets Consist of: | |||||
Capital | $ | 709,054,805 | |||
Accumulated net investment income/(loss) | (2,485,215 | ) | |||
Accumulated net realized gains/(losses) from investment transactions | 50,778,574 | ||||
Net unrealized appreciation/(depreciation) on investments | 76,816,183 | ||||
|
| ||||
Net Assets | $ | 834,164,347 | |||
|
| ||||
Shares of beneficial interest (unlimited number of shares authorized, no par value) | 66,271,296 | ||||
Net Asset Value (offering and redemption price per share) | $ | 12.59 | |||
|
|
| * | Includes securities on loan of $16,727,800. |
Consolidated Statement of Operations
For the Period Ended December 31, 2017
Investment Income: | |||||
Dividends from affiliates | $ | 4,890,399 | |||
Dividends | 5,638,999 | ||||
Interest | 3,465,021 | ||||
Income from securities lending | 160,809 | ||||
Other Income | 18,474 | ||||
Foreign withholding tax | (275,772 | ) | |||
|
| ||||
Total Investment Income | 13,897,930 | ||||
|
| ||||
Expenses: | |||||
Manager fees | 3,961,746 | ||||
Administration fees | 228,526 | ||||
Distribution fees — Class 2 | 1,043,261 | ||||
Custodian fees | 341,133 | ||||
Administrative and compliance services fees | 16,060 | ||||
Transfer agent fees | 11,770 | ||||
Trustee fees | 57,135 | ||||
Professional fees | 62,332 | ||||
Shareholder reports | 33,361 | ||||
Dividends on securities sold short | 45,326 | ||||
Recoupment of prior expenses reimbursed by the manager | 3,050 | ||||
Other expenses | 98,120 | ||||
|
| ||||
Total expenses | 5,901,820 | ||||
|
| ||||
Net Investment Income/(Loss) | 7,996,110 | ||||
|
| ||||
Realized and Unrealized Gains/(Losses) on Investments: | |||||
Net realized gains/(losses) on securities transactions and foreign currencies | 18,904,114 | ||||
Net realized gains/(losses) on affiliated transactions | 3,443,956 | ||||
Net realized gains/(losses) on futures contracts | 1,443,636 | ||||
Net realized gains/(losses) on written options contracts | 862,277 | ||||
Net realized gains/(losses) on securities transactions held short | (607,227 | ) | |||
Net realized gains/(losses) on swap agreements | (71,966 | ) | |||
Net realized gains/(losses) on forward currency contracts | 1,124,464 | ||||
Change in net unrealized appreciation/depreciation on investments and foreign currencies | 29,827,617 | ||||
Change in net unrealized appreciation/depreciation on affiliated transactions | 27,782,226 | ||||
Change in net unrealized appreciation/depreciation on futures contracts | 261,254 | ||||
Change in net unrealized appreciation/depreciation on written option contracts | 763,098 | ||||
Change in net unrealized appreciation/depreciation on securities transactions held short | 114,807 | ||||
Change in net unrealized appreciation/depreciation on swap agreements | 760,743 | ||||
Change in net unrealized appreciation/depreciation on forward currency contracts | (2,287,701 | ) | |||
Change in accrued foreign tax liability | (41,298 | ) | |||
|
| ||||
Net Realized/Unrealized Gains/(Losses) on Investments | 82,280,000 | ||||
|
| ||||
Change in Net Assets Resulting From Operations | $ | 90,276,110 | |||
|
|
See accompanying notes to the consolidated financial statements.
21
AZL MVP BlackRock Global Strategy Plus Fund
Consolidated Statements of Changes in Net Assets
For the Year Ended December 31, 2017 | For the Year Ended December 31, 2016 | |||||||||
Change In Net Assets: | ||||||||||
Operations: | ||||||||||
Net investment income/(loss) | $ | 7,996,110 | $ | 6,962,255 | ||||||
Net realized gains/(losses) on investment transactions | 25,099,254 | (4,625,667 | ) | |||||||
Change in unrealized appreciation/depreciation on investments | 57,180,746 | 24,523,262 | ||||||||
|
|
|
| |||||||
Change in net assets resulting from operations | 90,276,110 | 26,859,850 | ||||||||
|
|
|
| |||||||
Distributions to Shareholders: | ||||||||||
From net investment income | (3,178,036 | ) | (21,857,180 | ) | ||||||
From net realized gains | — | (29,417,164 | ) | |||||||
|
|
|
| |||||||
Change in net assets resulting from distributions to shareholders | (3,178,036 | ) | (51,274,344 | ) | ||||||
|
|
|
| |||||||
Capital Transactions: | ||||||||||
Proceeds from shares issued | 8,651,752 | 18,938,747 | ||||||||
Proceeds from dividends reinvested | 3,178,036 | 51,274,343 | ||||||||
Value of shares redeemed | (79,282,868 | ) | (61,642,093 | ) | ||||||
|
|
|
| |||||||
Change in net assets resulting from capital transactions | (67,453,080 | ) | 8,570,997 | |||||||
|
|
|
| |||||||
Change in net assets | 19,644,994 | (15,843,497 | ) | |||||||
Net Assets: | ||||||||||
Beginning of period | 814,519,353 | 830,362,850 | ||||||||
|
|
|
| |||||||
End of period | $ | 834,164,347 | $ | 814,519,353 | ||||||
|
|
|
| |||||||
Accumulated net investment income/(loss) | $ | (2,485,215 | ) | $ | (7,218,620 | ) | ||||
|
|
|
| |||||||
Share Transactions: | ||||||||||
Shares issued | 710,754 | 1,644,044 | ||||||||
Dividends reinvested | 258,587 | 4,565,836 | ||||||||
Shares redeemed | (6,584,146 | ) | (5,372,625 | ) | ||||||
|
|
|
| |||||||
Change in shares | (5,614,805 | ) | 837,255 | |||||||
|
|
|
| |||||||
See accompanying notes to the consolidated financial statements.
22
AZL MVP BlackRock Global Strategy Plus Fund
Consolidated Financial Highlights
(Selected data for a share of beneficial interest outstanding throughout the periods indicated)
| Year Ended December 31, | |||||||||||||||||||||||||
| 2017 | 2016 | 2015 | 2014 | 2013 | |||||||||||||||||||||
Net Asset Value, Beginning of Period | $ | 11.33 | $ | 11.69 | $ | 12.22 | $ | 12.02 | $ | 10.54 | |||||||||||||||
|
|
|
|
|
|
|
|
|
| ||||||||||||||||
Investment Activities: | |||||||||||||||||||||||||
Net Investment Income/(Loss) | 0.11 | 0.10 | 0.07 | 0.10 | 0.05 | ||||||||||||||||||||
Net Realized and Unrealized Gains/(Losses) on Investments | 1.20 | 0.27 | (0.26 | ) | 0.16 | 1.43 | |||||||||||||||||||
|
|
|
|
|
|
|
|
|
| ||||||||||||||||
Total from Investment Activities | 1.31 | 0.37 | (0.19 | ) | 0.26 | 1.48 | |||||||||||||||||||
|
|
|
|
|
|
|
|
|
| ||||||||||||||||
Dividends to Shareholders From: | |||||||||||||||||||||||||
Net Investment Income | (0.05 | ) | (0.31 | ) | (0.14 | ) | — | (a) | — | ||||||||||||||||
Net Realized Gains | — | (0.42 | ) | (0.20 | ) | (0.06 | ) | — | (a) | ||||||||||||||||
|
|
|
|
|
|
|
|
|
| ||||||||||||||||
Total Dividends | (0.05 | ) | (0.73 | ) | (0.34 | ) | (0.06 | ) | — | (a) | |||||||||||||||
|
|
|
|
|
|
|
|
|
| ||||||||||||||||
Net Asset Value, End of Period | $ | 12.59 | $ | 11.33 | $ | 11.69 | $ | 12.22 | $ | 12.02 | |||||||||||||||
|
|
|
|
|
|
|
|
|
| ||||||||||||||||
Total Return(b) | 11.54 | % | 3.34 | % | (1.57 | )% | 2.18 | % | 14.08 | % | |||||||||||||||
Ratios to Average Net Assets/Supplemental Data: | |||||||||||||||||||||||||
Net Assets, End of Period (000’s) | $ | 834,164 | $ | 814,519 | $ | 830,363 | $ | 818,435 | $ | 681,691 | |||||||||||||||
Net Investment Income/(Loss) | 0.97 | % | 0.85 | % | 0.67 | % | 0.96 | % | 0.55 | % | |||||||||||||||
Expenses Before Reductions*(c) | 0.71 | % | 1.11 | % | 1.18 | % | 1.18 | % | 1.21 | % | |||||||||||||||
Expenses Net of Reductions* | 0.71 | % | 1.11 | % | 1.18 | % | 1.18 | % | 1.21 | % | |||||||||||||||
Expenses Net of Reductions, Excluding Expenses Paid Indirectly* | 0.71 | % | 1.11 | % | 1.18 | % | 1.18 | %(d) | 1.21 | %(d) | |||||||||||||||
Portfolio Turnover Rate(e) | 40 | % | 91 | % | 64 | % | 61 | % | 40 | % | |||||||||||||||
| * | The expense ratios exclude the impact of fees/expenses paid by each underlying fund. |
| (a) | Represents less than $0.005. |
| (b) | The return includes reinvested dividends and fund level expenses, but excludes insurance contract charges. If these charges were included, the returns would have been lower. |
| (c) | Excludes fee reductions. If such fee reductions had not occurred, the ratios would have been as indicated. |
| (d) | Expenses net of reductions excludes expenses paid indirectly, pursuant to a “commission recapture” program, under which brokers remitted a portion of the brokerage commission which were used to pay certain Fund expenses. The Fund ceased participation in the program in June 2014. |
| (e) | Portfolio turnover rate can be volatile due to the amount and timing of purchases and sales of fund shares during the period. |
See accompanying notes to the consolidated financial statements.
23
AZL MVP BlackRock Global Strategy Plus Fund
Notes to the Consolidated Financial Statements
December 31, 2017
1. Organization
The Allianz Variable Insurance Products Fund of Funds Trust (the “Trust”) was organized as a Delaware statutory trust on June 16, 2004. The Trust is a diversified open-end management investment company registered under the Investment Company Act of 1940, as amended, (the “1940 Act”) and thus is determined to be an investment company for accounting purposes. The Trust consists of 12 separate investment portfolios (collectively, the “Funds”), of which one is included in this report, the AZL MVP BlackRock Global Strategy Plus Fund (the “Fund”), and 11 are presented in separate reports.
The Fund is a “fund of funds,” which means that the Fund invests primarily in other mutual funds. Underlying Funds invest in stock, bonds, and other securities and reflect varying amounts of potential investment risk and reward. The Underlying Funds record their investments at fair value. Periodically, the Fund will adjust its asset allocation as it seeks to achieve its investment objective.
The Trust is authorized to issue an unlimited number of shares of the Fund without par value. Shares of the Fund are available through the variable annuity contracts offered through the separate accounts of participating insurance companies. Currently, the Fund only offers its shares to separate accounts of Allianz Life Insurance Company of North America and Allianz Life Insurance Company of New York, affiliates of the Trust and the Manager, as defined below.
Under the Trust’s organizational documents, its officers and trustees are indemnified against certain liabilities arising out of the performance of their duties to the Fund. In addition, in the normal course of business, the Fund may enter into contracts with its vendors and others that provide for general indemnifications. The Fund’s maximum exposure under these arrangements is unknown, as this would involve future claims that may be made against the Fund. However, based on experience, the Fund expects that risk of loss to be remote.
2. Significant Accounting Policies
The following is a summary of significant accounting policies followed by the Fund in the preparation of its financial statements. The policies conform with U.S. generally accepted accounting principles (“U.S. GAAP”). The preparation of financial statements requires management to make certain estimates and assumptions that affect the reported amounts of assets and liabilities and disclosure of contingent assets and liabilities at the date of the financial statements and the reported amounts of increases and decreases in net assets from operations during the reporting period. Actual results could differ from those estimates.
Security Valuation
The Fund records its investments at fair value. Fair value is defined as the price that would be received to sell an asset or paid to transfer a liability in an orderly transaction between willing market participants at the measurement date. The valuation techniques used to determine fair value are further described in Note 4 below.
Investment Transactions and Investment Income
Investment transactions are accounted for on trade date. Net realized gains and losses on investments sold and on foreign currency transactions are recorded on the basis of identified cost. Interest income is recorded on the accrual basis and includes, where applicable, the amortization of premiums or accretion of discounts. Dividend income is recorded on the ex-dividend date except in the case of foreign securities, in which case dividends are recorded as soon as such information becomes available. Income received by the Fund from sources within foreign countries may be subject to withholding or similar taxes imposed by such countries. The Fund accrues such taxes, as applicable, based on their current interpretation of tax rules in the foreign markets in which they invest.
Consolidation of Subsidiaries
During the year ended December 31, 2017, the Fund primarily invested in shares of another mutual fund managed by the Manager, the AZL BlackRock Global Allocation Fund (the “VIP Subsidiary”), a wholly-owned and controlled subsidiary of the Fund. As of December 31, 2017, the Fund’s aggregate investment in the VIP Subsidiary was $417,665,987, representing 50.07% of the Fund’s net assets.
The VIP Subsidiary’s primary vehicle for gaining exposure to the commodities markets is through investment in the AZL Cayman Global Allocation Fund I, Ltd. (the “Cayman Subsidiary”), a wholly-owned and controlled subsidiary of the VIP Subsidiary formed in the Cayman Islands, which invests primarily in commodity-related instruments. The Subsidiaries’ financial statements, including its investments, and its operating results have been consolidated with those of the Fund which includes the consolidation of the Cayman Subsidiary. All intercompany transactions have been eliminated.
Real Estate Investment Trusts
The Fund may own shares of real estate investment trusts (“REITs”) which report information on the source of their distributions annually. Certain distributions received from REITs during the year, which are known to be a return of capital, are recorded as a reduction to the cost of the individual REIT.
Foreign Currency Translation and Withholding Taxes
The accounting records of the Fund are maintained in U.S. dollars. Foreign currency amounts are translated into U.S. dollars at the current rate of exchange to determine the fair value of investments, assets and liabilities. Purchases and sales of securities, and income and expenses are translated at the prevailing rate of exchange on the respective dates of such transactions. The Fund does not isolate that portion of the results of operations resulting from changes in foreign exchange rates on investments, or from other assets and liabilities, from fluctuations arising from changes in market prices of securities held. Such fluctuations are included in the net realized and unrealized gain or loss on investments and foreign currencies. Income received by the Fund from sources within foreign countries may be subject to withholding and other income or similar taxes imposed by such countries. The Funds accrue such taxes, as applicable, based on their current interpretation of tax rules in the foreign markets in which they invest.
Floating Rate Loans
The Fund may invest in floating rate loans, which usually take the form of loan participations and assignments. These loans are made by banks and other large financial institutions to various companies and are typically senior in the borrowing companies’ capital structure. Coupon rates are variable and are tied to a benchmark lending rate. Loans involve a risk
24
AZL MVP BlackRock Global Strategy Plus Fund
Notes to the Consolidated Financial Statements
December 31, 2017
of loss in case of default or insolvency of the financial intermediaries who are parties to the transactions. A Fund records an investment when the borrower withdraws money and records the interest as earned.
Dividends to Shareholders
Dividends to shareholders are recorded on the ex-dividend date. The Fund distributes its dividends from net investment income and net realized capital gains, if any, on an annual basis. The amount of dividends from net investment income and from net realized gains is determined in accordance with federal income tax regulations, which may differ from U.S. GAAP. These “book/tax” differences are either temporary or permanent in nature. To the extent these differences are permanent in nature (e.g., return of capital, net operating loss, reclassification of certain market discounts, gain/loss, paydowns, and distributions), such amounts are reclassified within the composition of net assets based on their federal tax-basis treatment; temporary differences (e.g., wash sales and differing treatment on certain investments) do not require reclassification. Dividends to shareholders that exceed net investment income and net realized gains for tax purposes are reported as distributions of capital.
Expense Allocation
Expenses directly attributable to the Fund are charged directly to the Fund, while expenses attributable to more than one Fund are allocated among the respective Funds based upon relative net assets or some other reasonable method. Expenses which are attributable to more than one Trust are allocated across the Allianz Variable Insurance Products and Allianz Variable Insurance Products Fund of Funds Trusts based upon relative net assets or another reasonable basis. Allianz Investment Management LLC (the “Manager”), serves as the investment manager for the Trust and the Allianz Variable Insurance Products Fund of Funds Trust.
Bank Loans
The Fund may invest in bank loans, which generally have interest rates which are reset periodically by reference to a base lending rate plus a premium. These base rates are primarily the London-Interbank Offered Rate and, secondarily, the prime rate offered by one or more major U.S. banks and the certificate of deposit rate or other base lending rates used by commercial lenders. Bank loans often require prepayments from excess cash flows or allow the borrower to repay at its election. The rate at which the borrower repays cannot be predicted with accuracy. Therefore, the anticipated or actual maturity may be considerably earlier than the stated maturity shown in the Consolidated Schedule of Portfolio of Investments.
Securities Lending
To generate additional income, the Fund may lend up to 33 1/3% of its assets pursuant to agreements requiring that the loan be continuously secured by any combination of cash, U.S. government or U.S. government agency securities, equal initially to at least 102% of the fair value plus accrued interest on the securities loaned (105% for foreign securities). The borrower of securities is at all times required to post collateral to the Fund in an amount equal to 100% of the fair value of the securities loaned based on the previous day’s fair value of the securities loaned, marked-to-market daily. Any collateral shortfalls are adjusted the next business day. The Fund bears all of the gains and losses on such investments. The Fund receives payments from borrowers equivalent to the dividends and interest that would have been earned on securities lent while simultaneously seeking to earn income on the investment of cash collateral received. In extremely low interest rate environments, the broker rebate fee may exceed the interest earned or the cash collateral which would result in a loss to the Fund. The investment of cash collateral deposited by the borrower is subject to inherent market risks such as interest rate risk, credit risk, liquidity risk, and other risks that are present in the market, and as such, the value of these investments may not be sufficient, when liquidated, to repay the borrower when the loaned security is returned. There may be risks of delay in recovery of the securities or even loss of rights in the collateral should the borrower of the securities fail financially. However, loans will be made only to borrowers, such as broker-dealers, banks or institutional borrowers of securities, deemed by the Manager to be of good standing and credit worthy and when in its judgment, the consideration which can be earned currently from such securities loans justifies the attendant risks. Loans are subject to termination by the Trust or the borrower at any time, and are, therefore, not considered to be illiquid investments. Securities on loan at December 31, 2017 are noted on the Fund’s Consolidated Schedule of Portfolio Investments. The average outstanding amount of securities on loan was $24 million for the year ended December 31, 2017.
Cash collateral received in connection with securities lending is invested in a collateral account on behalf of the Fund managed by the Dreyfus Corporation, an affiliate of the Custodian and Securities Lending Agent. The collateral account invests in short-term investments that have a remaining maturity of 397 days or less, in accordance with Rule 2a-7 under the 1940 Act. The Fund pays the Securities Lending Agent 9% of the gross revenues received from securities lending activities and keeps 91%. The Fund paid securities lending fees of $15,163 during the year ended December 31, 2017. These fees have been netted against “Income from securities lending” on the Consolidated Statement of Operations.
The fund had securities lending transactions of $17,308,385 accounted for as secured borrowings with cash collateral of overnight and continuous maturities as of December 31, 2017.
TBA Purchase and Sale Commitments
The Fund may enter into to-be-announced (TBA) purchase or sale commitments, pursuant to which it agrees to purchase or sell, respectively, mortgage-backed securities for a fixed unit price, with payment and delivery at a scheduled future date beyond the customary settlement period for such securities. With TBA transactions, the particular securities to be delivered are not identified at the trade date; however, delivered securities must meet specified terms, including issuer, rate, and mortgage term, and be within industry-accepted “good delivery” standards. The Fund may enter into TBA purchase transactions with the intention of taking possession of the underlying securities, may elect to extend the settlement by “rolling” the transaction, and/or may use TBAs to gain interim exposure to underlying securities. Until settlement, the Fund maintains liquid assets sufficient to settle its TBA commitments.
25
AZL MVP BlackRock Global Strategy Plus Fund
Notes to the Consolidated Financial Statements
December 31, 2017
To mitigate counterparty risk, the Fund has entered into agreements with TBA counterparties that provide for collateral and the right to offset amounts due to or from those counterparties under specified conditions. Subject to minimum transfer amounts, collateral requirements are determined and transfers made based on the net aggregate unrealized gain or loss on all TBA commitments with a particular counterparty. At any time, the Fund’s risk of loss from a particular counterparty related to its TBA commitments is the aggregate unrealized gain on appreciated TBAs in excess of unrealized loss on depreciated TBAs and collateral held, if any, by such counterparty. As of December 31, 2017, no collateral had been posted by the Fund to counterparties for TBAs.
Affiliated Securities Transactions
Pursuant to Rule 17a-7 under the 1940 Act (the “Rule”), the Fund may engage in securities transactions with affiliated investment companies and advisory accounts managed by the Manager and Subadviser. Any such purchase or sale transaction must be effected without a brokerage commission or other remuneration, except for customary transfer fees. The transaction must be effected at the current market price, which is either the security’s last sale price on an exchange or, if there are no transactions in the security that day, at the average of the highest bid and lowest asked price. For the year ended December 31, 2017, the Fund participated in the following cross-trade transactions:
| Purchases | Sales | Realized (Gain/Loss) | |||||||||||||
AZL MVP BlackRock Global Strategy Plus Fund | $ | 87,390 | $ | — | $ | — | |||||||||
Derivative Instruments
All open derivative positions at period end are reflected on the Fund’s Consolidated Schedule of Portfolio Investments. The following is a description of the derivative instruments utilized by the Fund, including the primary underlying risk exposures related to each instrument type.
Forward Currency Contracts
During the year ended December 31, 2017, the Fund entered into forward currency contracts as an economic hedge against either specific transactions or portfolio instruments or to obtain exposure to foreign currencies. In addition to the foreign currency risk related to the use of these contracts, the Fund could be exposed to risks if the counterparties to the contracts are unable to meet the terms of their contracts and from unanticipated movements in the value of a foreign currency relative to the U.S. dollar. In the event of default by the counterparty to the transaction, the Fund’s maximum amount of loss, as either the buyer or the seller, is the unrealized appreciation of the contract. The forward currency contracts are adjusted by the daily exchange rate of the underlying currency and any gains or losses are recorded for financial statement purposes as unrealized gains or losses until the contract settlement date. When the contract is closed, the Fund records a realized gain or loss equal to the difference between the value at the time it was opened and the value at the time it was closed. For the year ended December 31, 2017, the monthly average notional amount for long contracts was $10.4 million and the monthly average notional amount for short contracts was $15.7 million. Realized gains and losses are reported as “Net realized gains/(losses) on forward currency contracts” on the Consolidated Statement of Operations.
Futures Contracts
During the year ended December 31, 2017, the Fund used futures contracts to gain exposure to, or economically hedge against changes in the value of equity securities. Futures contracts are valued based upon their quoted daily settlement prices. Upon entering into a futures contract, the Fund is required to segregate liquid assets in accordance with the initial margin requirements of the broker or exchange. Futures contracts are marked to market daily and a payable or receivable for the change in value (“variation margin”) is recorded by the Fund. Gains or losses are recognized but not considered realized until the contracts expire or are closed. Futures contracts involve, to varying degrees, elements of market risk (generally equity price risk related to stock futures, interest rate risk related to bond futures, and foreign currency risk related to currency futures) and exposure to loss in excess of the variation margin disclosed in the Consolidated Statement of Assets and Liabilities. The primary risks associated with the use of futures contracts are the imperfect correlation between the change in fair value of the underlying securities and the prices of futures contracts, the possibility of an illiquid market, and the inability of the counterparty to meet the terms of the contract. For the year ended December 31, 2017, the monthly average notional amount for long contracts was $42.0 million and the monthly average notional amount for short contracts was $10.5 million. Realized gains and losses are reported as “Net realized gains/(losses) on futures contracts” on the Consolidated Statement of Operations.
Options Contracts
The Fund may purchase or write put and call options on a security or an index of securities. During the year ended December 31, 2017, the Fund purchased and wrote call and put options to increase or decrease its exposure to underlying instruments (including equity risk, interest rate risk and/or foreign currency exchange rate risk) and/or, in the case of options written, to generate gains from options premiums.
Purchased Options Contracts — The Fund pays a premium which is included in “Investments, at value” on the Consolidated Statement of Assets and Liabilities and marked to market to reflect the current value of the option. Premiums paid for purchasing options that expire are treated as realized losses. When a put option is exercised or closed, premiums paid for purchasing options are offset against proceeds to determine the realized gain/loss on the transaction. The Fund bears the risk of loss of the premium and change in value should the counterparty not perform under the contract.
26
AZL MVP BlackRock Global Strategy Plus Fund
Notes to the Consolidated Financial Statements
December 31, 2017
Written Options Contracts — The Fund receives a premium which is recorded as a liability and is subsequently adjusted to the current value of the options written. Premiums received from writing options that expire are treated as realized gains. Premiums received from writing options that are either exercised or closed are offset against the proceeds received or the amount paid on the transaction to determine realized gains or losses. The risk associated with writing an option is that the Fund bears the market risk of an unfavorable change in the price of an underlying asset and is required to buy or sell an underlying asset under the contractual terms of the option at a price different from the current value.
For the year ended December 31, 2017, the monthly average notional amount for written options contracts was $2.0 million. Realized gains and losses are reported as “Net realized gains/(losses) on options contracts” on the Consolidated Statement of Operations.
Swap Agreements
The Fund may invest in swap agreements. A swap is an agreement to exchange the return generated by one instrument for the return generated by another instrument. Swap agreements are privately negotiated in the over-the-counter (“OTC”) market and may be entered into as a bilateral contract (“OTC swaps”) or centrally cleared (“centrally cleared swaps”). The Fund may enter into swap agreements to manage its exposure to market, interest rate, foreign currencies and credit risk. The value of swap agreements are equal to the Fund’s obligations (or rights) under swap agreements, which will generally be equal to the net amounts to be paid or received under the agreements based upon the relative values of the positions held by each party to the agreements. In connection with these arrangements, securities may be identified as collateral in accordance with the terms of the swap agreements to provide assets of value and recourse in the event of default or bankruptcy by the counterparty.
Swaps are marked to market daily using pricing sources approved by the Trustees and the change in value, if any, is recorded as unrealized gain or loss. For OTC swaps, payments received or made at the beginning of the measurement period are recorded as realized gain or loss upon termination or maturity of the OTC swap. A liquidation payment received or made at the termination of the OTC swap is recorded as a realized gain or loss. Net periodic payments received or paid by the Fund are included as part of realized gains (losses). Upon entering a centrally cleared swap, the Fund is required to deposit initial margin with the broker in the form of cash or assets determined to be liquid (the amount is subject to the clearing organization that clears the trade). Daily changes in valuation of centrally cleared swaps, if any, are recorded as a receivable or payable, as applicable, for variation margin on centrally cleared swaps.
Swap agreements involve, to varying degrees, elements of market risk and exposure to loss. The primary risks associated with the use of swap agreements are imperfect correlation between movements in the notional amount and the price of the underlying instruments and the inability of counterparties or clearing house to perform. The counterparty risk for centrally cleared swap agreements is generally lower than for OTC swap agreements because generally a clearing organization becomes substituted for each counterparty to a centrally cleared swap agreement and, in effect, guarantees the parties’ performance under the contract as each party to a trade looks only to a clearing house for performance of financial obligations. However, there can be no assurance that the clearing house, or its members will satisfy its obligations to the Fund.
The notional amounts reflect the extent of the total investment exposure the Fund has under the swap agreement. The Fund bears the risk of loss of the amount expected to be received under a swap agreement (i.e., any unrealized appreciation) in the event of the default or bankruptcy of the swap agreement counterparty. The notional amount and related unrealized appreciation (depreciation) of each swap agreement at period end is disclosed in the swap tables in the Consolidated Schedule of Portfolio Investments. The Fund is a party to International Swap Dealers Association, Inc. Master Agreements (“ISDA Master Agreements”) with select counterparties that govern transactions, such as OTC swap contracts, entered into by the Fund, through the VIP Subsidiary or Cayman Subsidiary, and those counterparties. The ISDA Master Agreements maintain provisions for general obligations, representations, agreements, collateral and events of default or termination. Events of termination include conditions that may entitle counterparties to elect to terminate early and cause settlement of all outstanding OTC swap transactions under the applicable ISDA Master Agreement.
Interest rate swaps involve the exchange of commitments to pay and receive interest based on a notional amount and are subject to interest rate risk exposure. Interest rate swaps do not involve the delivery of securities, other underlying assets or principal. Accordingly, the risk of loss with respect to interest rate swaps is limited to the net amount of interest payments that a Fund is contractually obligated to make. If the other party to an interest rate swap defaults, a Fund’s risk of loss consists of the net amount of interest payments that the Fund is contractually entitled to receive. As of December 31, 2017, the Fund entered into OTC and centrally cleared interest rate swap agreements to gain or reduce exposure to interest rates or to manage duration, the yield curve or interest rate risk by economically hedging the value of the fixed rate bonds which may decrease when interest rates rise (interest rate risk). The monthly average gross notional amount for interest rate swaps was $27 million for the year ended December 31, 2017.
Currency swaps are interest rate swaps in which one party pays a stream of interest payments, either fixed or floating, in exchange for another party’s stream of interest payments, either fixed or floating, based on the notional amounts of two different currencies. The notional amounts are typically determined based on the spot exchange rates at the inception of the trade. Currency swaps may also involve an exchange of notional amounts at the start, during and/or at expiration of the contract, either at the current spot rate or another specified rate. The monthly average gross notional amount for currency swaps was $4.4 million for the year ended December 31, 2017.
Total return swap agreements involve commitments to pay interest in exchange for a market-linked return, both based on notional amounts. To the extent the total return of the security or index underlying the transaction exceeds or falls short of the offsetting interest rate obligation, the Fund will receive a payment from or make a payment to the counterparty. The monthly average gross notional amount for total return swaps was $4.9 million for the year ended December 31, 2017.
Credit default swap agreements may have as reference obligations one or more securities that are not currently held by the Fund. The protection “buyer” in a credit default contract is generally obligated to pay the protection “seller” an upfront, periodic, or daily stream of payments over the term of the contract provided that no credit event, such as a default, on a reference obligation has occurred. If a credit event occurs, the seller generally must pay the buyer the “par value” (full notional value) of the swap in exchange for an equal face amount of deliverable obligations of the reference entity described in the swap, or the seller may be required to deliver the related net cash amount, if the swap is cash settled. A Fund may be either the buyer or seller in the transaction. If the Fund is a buyer and no credit event occurs, the Fund may recover nothing if the swap is held through its termination date. However, if a credit event occurs, the buyer generally may elect to receive the full notional value of the swap in exchange for an equal face amount of deliverable obligations of the reference entity whose value may have significantly decreased. As a seller, a Fund generally receives an upfront payment or a fixed rate of income throughout the term of the swap provided that there is no credit event. As the seller, a Fund would effectively add leverage to its portfolio because, in addition to its total net assets, a Fund would be subject to investment exposure on the notional amount of the swap.
Credit default swap agreements involve greater risks than if a Fund had invested in the reference obligation directly since, in addition to general market risks, credit default swaps are subject to illiquidity risk, counterparty risk and credit risk. A Fund will enter into credit default swap agreements only with counterparties that meet certain standards of creditworthiness. A buyer generally also will lose its investment and recover nothing should no credit event occur and the swap is held to its termination date. If a credit event were to occur, the value of any deliverable obligation received by the seller, coupled with the upfront, periodic, or daily payments previously received, may be less than the full notional value it pays to the buyer, resulting in a loss of value to the seller. The Fund’s obligations under a credit default swap agreement will be accrued daily (offset against any amounts
27
AZL MVP BlackRock Global Strategy Plus Fund
Notes to the Consolidated Financial Statements
December 31, 2017
owed to the Fund). In connection with credit default swaps in which a Fund is the buyer, the Fund will segregate or “earmark” cash or assets determined to be liquid, or enter into certain offsetting positions, with a value at least equal to the Fund’s exposure (any accrued but unpaid net amounts owed by the Fund to any counterparty), on a marked-to-market basis. In connection with credit default swaps in which a Fund is the seller, the Fund will segregate or “earmark” cash or assets determined to be liquid, or enter into offsetting positions, with a value at least equal to the full notional amount of the swap (minus any amounts owed to the Fund). Such segregation or “earmarking” will ensure that the Fund has assets available to satisfy its obligations with respect to the transaction and will limit any potential leveraging of the Fund’s portfolio. Such segregation or “earmarking” will not limit the Fund’s exposure to loss.
As of December 31, 2017, the Fund entered into OTC and centrally cleared credit default swaps to manage its exposure to the market or certain sectors of the market, to reduce its risk exposure to defaults of corporate and/or sovereign issuers or to create exposure to corporate and/or sovereign issuers to which they are not otherwise exposed (credit risk). The monthly average gross notional amount for credit default swaps was $4.7 million for the year ended December 31, 2017.
Variance swaps involve the agreement of two parties to exchange cash flows based on the measured variance (or square of the volatility) of a specified underlying asset. One party agrees to exchange a “fixed rate” or strike price payment for the “floating rate” or realized price variance on the underlying asset with respect to the notional amount. At inception, the strike price is generally chosen such that the fair value of the swaps is zero. At the maturity date, a net cash flow is exchanged, where the payoff amount is equivalent to the difference between the realized price variance of the underlying asset and the strike price multiplied by the notional amount. As a receiver of the realized price variance, a Portfolio would receive the payoff amount when the realized price variance of the underlying asset is greater than the strike price and would owe the payoff amount when the variance is less than the strike price. As a payer of the realized price variance, a Portfolio would owe the payoff amount when the realized price variance of the underlying asset is greater than the strike price and would receive the payoff amount when the variance is less than the strike price. This type of swap is essentially a forward contract on the future realized price variance of the underlying asset. The monthly average gross notional amount for variance swaps was $1.4 million for the year ended December 31, 2017.
Summary of Derivative Instruments
The following is a summary of the fair values of derivative instruments on the Fund’s Consolidated Statement of Assets and Liabilities, categorized by risk exposure, as of December 31, 2017:
Asset Derivatives | Liability Derivatives | |||||||||||
| Primary Risk | Statement of Assets and Liabilities Location | Total Fair Value | Statement of Assets and Liabilities Location | Total Fair Value | ||||||||
Equity Risk | ||||||||||||
| Futures Contracts | Receivable for variation margin on futures contracts* | $ | 342,807 | Payable for variation margin on futures contracts* | $ | 27,649 | ||||||
| Option Contracts | Written options contracts | 302,174 | ||||||||||
Total Return Swap Agreements | Unrealized appreciation on swap agreements | 820,520 | Unrealized depreciation on swap agreements | — | ||||||||
Credit Risk | ||||||||||||
Centrally Cleared Credit Default Swap Agreements | Unrealized appreciation on swap agreements* | — | Unrealized depreciation on swap agreements* | 6,578 | ||||||||
Over-The-Counter Credit Default Swap Agreements | — | 16,355 | ||||||||||
Interest Rate Risk | ||||||||||||
| Futures Contracts | Receivable for variation margin on futures contracts* | — | Payable for variation margin on futures contracts* | 113,337 | ||||||||
Interest Rate Swap Agreements | Unrealized appreciation on swap agreements* | 117,267 | Unrealized depreciation on swap agreements* | 16,937 | ||||||||
| Swaption Contracts | Written options contracts | 73,459 | ||||||||||
| Variance Swap Agreements | Unrealized appreciation on swap agreements | — | Unrealized depreciation on swap agreements* | 20,626 | ||||||||
Foreign Exchange Risk | ||||||||||||
| Currency Swap Agreements | Unrealized appreciation on swap agreements | 209,101 | Unrealized depreciation on swap agreements | 8,678 | ||||||||
| Forward Currency Contracts | Unrealized appreciation on forward currency contracts | 339,452 | Unrealized depreciation on forward currency contracts | 84,440 | ||||||||
| Options Contracts | Written options contracts | 2,944 | ||||||||||
| * | Includes cumulative appreciation/depreciation of futures contracts and cumulative unrealized gain (loss) on these swap agreements as reported in the Consolidated Schedule of Portfolio Investments. Only current day’s variation margin for both futures contracts and these centrally cleared swap agreements are reported within the Consolidated Statement of Assets and Liabilities. |
28
AZL MVP BlackRock Global Strategy Plus Fund
Notes to the Consolidated Financial Statements
December 31, 2017
The following is a summary of the effect of derivative instruments on the Consolidated Statement of Operations, categorized by risk exposure, for the year ended December 31, 2017:
| Realized Gain/(Loss) on Derivatives Recognized as a Result from Operations | ||||||||||||||||||||
Net Realized Futures Contracts | Net Realized Gains/(Losses) on | Net Realized Written Option Contracts | Net Realized Gains/(Losses) on Forward Currency Contracts | |||||||||||||||||
Equity Risk | $ | 1,275,664 | $ | 100,141 | $ | 377,827 | $ | — | ||||||||||||
Credit Risk | — | 40,976 | — | — | ||||||||||||||||
Interest Rate Risk | 167,971 | (213,083 | ) | (142,167 | ) | — | ||||||||||||||
Foreign Exchange Rate Risk | — | — | 626,617 | 1,124,464 | ||||||||||||||||
| Change in Net Unrealized Appreciation/Depreciation on Derivatives Recognized as a Result from Operations | ||||||||||||||||||||
| Change in Net Unrealized Appreciation/Depreciation on Futures Contracts | Change in Net Unrealized Appreciation/Depreciation on Swap Agreements | Change in Net Unrealized Appreciation/Depreciation on Written Option Contracts | Change in Net Unrealized Appreciation/Depreciation on Forward Currency Contracts | |||||||||||||||||
Equity Risk | $ | 248,759 | $ | 544,522 | $ | 147,183 | $ | — | ||||||||||||
Credit Risk | — | (76,555 | ) | — | — | |||||||||||||||
Interest Rate Risk | 12,495 | 414,504 | 471,228 | — | ||||||||||||||||
Foreign Exchange Rate Risk | — | (121,728 | ) | 144,687 | (2,287,701 | ) | ||||||||||||||
The Fund is generally subject to master netting agreements that allow for amounts owed between the Fund and the counterparty to be netted. The party that has the larger payable pays the excess of the larger amount over the smaller amount to the other party. The master netting agreements do not apply to amounts owed to/from different counterparties. The amounts shown in the Consolidated Statement of Assets and Liabilities do not take into consideration the effects of legally enforceable master netting agreements. The table below presents the gross and net amounts of these assets and liabilities with any offsets to reflect the Fund’s ability to transact net amounts in accordance with the master netting agreements at December 31, 2017. For financial reporting purposes, the Fund does not offset derivative assets and derivative liabilities that are subject to master netting arrangements in the Consolidated Statement of Assets and Liabilities. This table also summarizes the fair values of derivative instruments on the Fund’s Consolidated Statement of Assets and Liabilities, categorized by risk exposure, as of December 31, 2017.
As of December 31, 2017, the Fund’s derivative assets and liabilities by type were as follows:
| Assets | Liabilities | |||||||||
Derivative Financial Instruments: | ||||||||||
Futures contracts | $ | 37,272 | $ | — | ||||||
Option contracts | — | 378,577 | ||||||||
Forward currency contracts | 339,452 | 84,440 | ||||||||
Swap agreements | 1,052,320 | 107,706 | ||||||||
|
|
|
| |||||||
Total derivative assets and liabilities in the Consolidated Statement of Assets and Liabilities | 1,429,044 | 570,723 | ||||||||
Derivatives not subject to a master netting agreement or similar agreement (“MNA”) | (55,051 | ) | (696 | ) | ||||||
|
|
|
| |||||||
Total assets and liabilities subject to a MNA | $ | 1,373,993 | $ | 570,027 | ||||||
|
|
|
| |||||||
The following table presents the Fund’s derivative assets by counterparty net of amounts available for offset under MNA and net of the related collateral received by the Fund as of December 31, 2017:
| Counterparty | Derivative Assets Subject to a MNA by Counterparty | Derivatives Available for Offset | Non-cash Collateral Received* | Cash Collateral Received* | Net Amount of Derivative Assets | ||||||||||||||||||||
Bank of America | $ | 209,101 | $ | (52,409 | ) | $ | — | $ | (197,413 | ) | $ | — | |||||||||||||
BNP Paribas SA | 797,166 | (7,349 | ) | — | (830,000 | ) | — | ||||||||||||||||||
Citigroup | — | — | — | (64,760 | ) | — | |||||||||||||||||||
Deutsche Bank | 31,960 | (31,960 | ) | — | (7,127 | )) | — | ||||||||||||||||||
Goldman Sachs | 44,227 | (44,227 | ) | — | (110,042 | ) | — | ||||||||||||||||||
JPMorgan Chase | 127,130 | — | — | (10,000 | ) | 117,130 | |||||||||||||||||||
Societe Generale | — | — | — | (30,000 | ) | — | |||||||||||||||||||
UBS Warburg | 164,409 | (164,409 | ) | — | — | — | |||||||||||||||||||
|
|
|
|
|
|
|
|
|
| ||||||||||||||||
Total | $ | 1,373,993 | $ | (300,354 | ) | $ | — | $ | (1,249,342 | ) | $ | 117,130 | |||||||||||||
|
|
|
|
|
|
|
|
|
| ||||||||||||||||
29
AZL MVP BlackRock Global Strategy Plus Fund
Notes to the Consolidated Financial Statements
December 31, 2017
The following table presents the Fund’s derivative liabilities by counterparty net of amounts available for offset under MNA and net of the related collateral received by the Fund as of December 31, 2017:
| Counterparty | Derivative Liabilities Subject to a MNA by Counterparty | Derivatives Available for Offset | Non-cash Collateral Pledged* | Cash Collateral Pledged* | Net Amount of Derivative Liabilities | ||||||||||||||||||||
Bank of America | $ | 52,409 | $ | (52,409 | ) | $ | — | $ | — | $ | — | ||||||||||||||
Barclays Bank | 137,858 | — | — | — | 137,858 | ||||||||||||||||||||
BNP Paribas SA | 7,349 | (7,349 | ) | — | — | — | |||||||||||||||||||
Citigroup | 5,163 | — | — | — | 5,163 | ||||||||||||||||||||
Deutsche Bank | 65,409 | (31,960 | ) | — | — | 33,449 | |||||||||||||||||||
Goldman Sachs | 73,459 | (44,227 | ) | — | — | 29,232 | |||||||||||||||||||
Morgan Stanley | 35,606 | — | — | — | 35,606 | ||||||||||||||||||||
UBS Warburg | 192,774 | (164,409 | ) | — | — | 28,365 | |||||||||||||||||||
|
|
|
|
|
|
|
|
|
| ||||||||||||||||
Total | $ | 570,027 | $ | (300,354 | ) | $ | — | $ | — | $ | 269,673 | ||||||||||||||
|
|
|
|
|
|
|
|
|
| ||||||||||||||||
| * | The actual collateral received or pledged may be in excess of the amounts shown in the table. The table only reflects collateral amounts up to the amount of the financial instrument disclosed on the Consolidated Statement of Assets and Liabilities. |
3. Fees and Transactions with Affiliates and Other Parties
The Manager provides investment advisory and management services for the Fund. The Manager has retained an independent money management organization (the “Subadviser”), to make investment decisions on behalf of the Fund. Pursuant to a subadvisory agreement with BlackRock Investment Management, LLC (“BlackRock Investment”), BlackRock Investment provides investment advisory services as the Subadviser for the Fund subject to the general supervision of the Trustees and the Manager. The Manager is entitled to a fee, computed daily and paid monthly, based on the average daily net assets of the Fund. Expenses incurred by the Fund for investment advisory and management services are reflected on the Consolidated Statement of Operations as “Manager fees.” For its services, the Subadviser is entitled to a fee payable by the Manager. The Manager has contractually agreed to waive fees and reimburse the Fund to limit the annual expenses, excluding interest expense (e.g., cash overdraft fees), taxes, brokerage commissions, acquired fund fees and expenses, other expenditures that are capitalized in accordance with U.S. GAAP and other extraordinary expenses not incurred in the ordinary course of the Fund’s business, based on the daily net assets of the Fund, through April 30, 2019.
For the year ended December 31, 2017, the annual rate paid to the Manager and the annual expense limit were as follows:
| Annual Rate | Annual Expense Limit | |||||||||
AZL MVP BlackRock Global Strategy Plus Fund | 0.10 | % | 0.15 | % | ||||||
AZL BlackRock Global Allocation Fund | 0.75 | % | 1.19 | % | ||||||
Any amounts contractually waived or reimbursed by the Manager in a particular fiscal year will be subject to repayment by the Fund to the Manager to the extent that from time to time through the next three fiscal years the repayment will not cause the Fund’s expenses to exceed the lesser of the stated limit at the time of the waiver or the current stated limit. Any amounts recouped by the Manager during the year are reflected on the Consolidated Statement of Operations as “Recoupment of prior expenses reimbursed by the Manager.” At December 31, 2017, there were no remaining contractual reimbursements that are subject to repayments by the Fund in subsequent years.
In addition, the Manager may voluntarily waive or reimburse additional fees in order to maintain more competitive expense ratios. Any voluntary waivers or reimbursements are not subject to repayment in subsequent years. Information on the total amount waived/reimbursed by the Manager or repaid to the Manager by the Fund during the year can be found on the Consolidated Statement of Operations. During the year ended December 31, 2017, there were no voluntary waivers.
The Manager or an affiliate of the Manager serves as the investment adviser of certain underlying funds in which the Fund invests. At December 31, 2017, these underlying funds are noted as Affiliated Investment Companies in the Fund’s Schedule of Portfolio Investments. Additional information, including financial statements, about these Funds is available at www.allianzlife.com. The Manager or an affiliate of the Manager is paid a separate fee from the underlying funds for such services. A summary of the Fund’s investments in affiliated investment companies for the year ended December 31, 2017 is as follows:
| Fair Value 12/31/2016 | Purchases at Cost | Proceeds from Sales | Net Realized Gains/(Losses) | Net Change in Unrealized Appreciation/ Depreciation | Fair Value 12/31/2017 | Shares as of 12/31/2017 | Dividend Income | |||||||||||||||||||||||||||||||||
AZL Enhanced Bond Index Fund | $ | 220,670,678 | $ | 7,652,344 | $ | (4,344,150 | ) | $ | (5,187 | ) | $ | 4,588,676 | $ | 228,562,361 | 20,988,279 | $ | 2,109,766 | |||||||||||||||||||||||
AZL MSCI Global Equity Index Fund | 144,706,339 | 2,780,633 | (27,683,969 | ) | 3,449,143 | 23,193,548 | 146,445,694 | 13,052,201 | 2,780,633 | |||||||||||||||||||||||||||||||
|
|
|
|
|
|
|
|
|
|
|
|
|
|
|
| |||||||||||||||||||||||||
| $ | 365,377,017 | $ | 10,432,977 | $ | (32,028,119 | ) | $ | 3,443,956 | $ | 27,782,224 | $ | 375,008,055 | 34,040,480 | $ | 4,890,399 | |||||||||||||||||||||||||
|
|
|
|
|
|
|
|
|
|
|
|
|
|
|
| |||||||||||||||||||||||||
Pursuant to separate agreements between the Funds and the Manager, the Manager provides a Chief Compliance Officer (“CCO”) and certain compliance oversight and regulatory filing services to the Trust. Under these agreements the Manager is entitled to an amount equal to a portion of the compensation and certain other expenses related to the individuals performing the CCO and compliance oversight services, as well as $100 per hour for time incurred in connection with the preparation and filing of certain documents with the Securities and Exchange Commission (“SEC” or the “Commission”). The fees are paid to the Manager on a quarterly basis. The total expenses incurred by the Fund for these services are reflected on the Consolidated Statement of Operations as “Administrative and compliance services fees.”
30
AZL MVP BlackRock Global Strategy Plus Fund
Notes to the Consolidated Financial Statements
December 31, 2017
Citi Fund Services Ohio, Inc. (“Citi” or the “Administrator”), a wholly owned subsidiary of Citigroup, Inc., with which an officer of the Trust is affiliated, serves as the Trust’s administrator and fund accountant, and assists the Trust in all aspects of its administration and operation. The Administrator is entitled to a Trust-wide asset-based fee, which is based on the following schedule: 0.05% of daily average net assets on the first $4 billion, 0.04% of daily average net assets on the next $2 billion, 0.02% of daily average net assets on the next $2 billion and 0.01% of daily average net assets over $8 billion. The overall Trust-wide fees are accrued daily and paid monthly and are subject to a minimum annual fee. The Administrator is entitled to an annual fee for each additional class of shares of any Fund, certain annual fees in supporting fair value services, and a Trust-wide annual fee for providing infrastructure and support in implementing the written policies and procedures comprising the Fund’s compliance program. The Administrator is also reimbursed for certain expenses incurred. The total expenses incurred by the Fund for these services are reflected on the Consolidated Statement of Operations as “Administration fees.”
FIS Investor Services LLC (“FIS”) serves as the Fund’s transfer agent. Under the Transfer Agent Agreement, the Trust pays FIS a fee for its services and reimburses FIS for all of their reasonable out-of-pocket expenses incurred in providing these services.
The Bank of New York Mellon (“BNY Mellon” or the “Custodian”) serves as the Trust’s custodian and securities lending agent. For these services as custodian, the Funds pay BNY Mellon a fee based on a percentage of assets held on behalf of the Funds, plus certain out-of-pocket charges.
Allianz Life Financial Services, LLC (“ALFS”), an affiliate of the Manager, serves as distributor of the Fund and receives 12b-1 fees directly from the Fund, plus a Trust-wide annual fee of $7,500, paid by the Manager from its profits and not by the Trust, for recordkeeping and reporting services.
In addition, certain legal fees and expenses are paid to a law firm, Dorsey & Whitney LLP, of which the Secretary of the Fund is Senior Counsel. During the year ended December 31, 2017, $8,542 was paid from the Fund relating to these fees and expenses.
Certain Officers and Trustees of the Trust are affiliated with the Manager or the Administrator. Such Officers (except for the Trust’s CCO as noted above) and Trustees receive no compensation from the Trust for serving in their respective roles. For their service to the Trust and to the Allianz Variable Insurance Products Fund of Funds Trust, each non-interested Trustee receives a $170,000 annual Board retainer, the Lead Director receives an additional $42,500 annually and the Chair of the Nominating and Corporate Governance Committee receives an additional $25,500 annually. In addition, the Trustees are reimbursed for certain expenses associated with attending Board meetings. Compensation to the Trustees is allocated between the Trust and the Allianz Variable Insurance Products Fund of Funds Trust in proportion to the assets under management of each trust. During the year ended December 31, 2017, actual Trustee compensation was $1,116,333 in total for both trusts
4. Investment Valuation Summary
The valuation techniques employed by the Fund, as described below, maximize the use of observable inputs and minimize the use of unobservable inputs in determining fair value. The inputs used for valuing the Fund’s investments are summarized in the three broad levels listed below:
| ● | Level 1 — quoted prices in active markets for identical assets |
| ● | Level 2 — other significant observable inputs (including quoted prices for similar securities, interest rates, prepayments speeds, credit risk, etc.) |
| ● | Level 3 — significant unobservable inputs (including the Fund’s own assumptions in determining the fair value of investments) |
Changes in valuation techniques may result in transfers in or out of an assigned level within the disclosure hierarchy. The Fund determines transfers between fair value hierarchy levels at the reporting period end. The inputs or methodology used for valuing investments is not necessarily an indication of the risk associated with investing in those investments.
Security prices are generally provided by an independent third party pricing service approved by the Trust’s Board of Trustees (the “Board” or “Trustees”) as of the close of the New York Stock Exchange (“NYSE”) (generally 4:00 pm Eastern Time). Equity securities are valued at the last quoted sale price or, if there is no sale, the last quoted bid price is used for long securities and the last quoted ask price is used for securities sold short. Securities listed on NASDAQ Stock Market, Inc. (“NASDAQ”) are valued at the official closing price as reported by NASDAQ. In each of these situations, valuations are typically categorized as a Level 1 in the fair value hierarchy. Investments in open-end investment companies are valued at their respective net asset value as reported by such companies and are typically categorized as Level 1 in the fair value hierarchy.
Debt and other fixed income securities are generally valued at an evaluated bid price provided by an independent pricing source approved by the Trustees. To value debt securities, pricing services may use various pricing techniques which take into account appropriate factors such as market activity, yield, quality, coupon rate, maturity, type of issue, trading characteristics, call features, credit ratings and other data, as well as broker quotes. Short term securities of sufficient credit quality with sixty days or less remaining until maturity may be valued at amortized cost, which approximates fair value. In each of these situations, valuations are typically categorized as Level 2 in the fair value hierarchy.
Futures contracts are valued at the last sales price as of the close of the primary exchange and are typically categorized as Level 1 in the fair value hierarchy.
Forward currency contracts are generally valued at the foreign currency exchange rate as of the close of the NYSE and are typically categorized as Level 2 in the fair value hierarchy.
Non exchange-traded derivatives, such as swaps and certain options, are generally valued by approved independent pricing services utilizing techniques which take into account factors such as yields, quality, maturity, type of issue, trading characteristics, call features, credit ratings and other data, as well as broker quotes and are typically categorized as Level 2 in the fair value hierarchy. The Fund generally values index options at the average of the closing bid and ask quotations on the principal exchange on which the option is traded and are typically categorized as Level 1 in the fair value hierarchy. For options where market quotations are not readily available, fair value procedures as described below may be applied.
Other assets and securities for which market quotations are not readily available, or are deemed unreliable are valued at fair value as determined in good faith by the Trustees or persons acting on the behalf of the Trustees. Fair value pricing may be used for significant events such as securities whose trading has been suspended, whose price has become stale or for which there is no currently available price at the close of the NYSE. Depending on the source and relative significance of valuation inputs, these instruments may be classified as Level 2 or Level 3 in the fair value hierarchy. The Fund utilizes a pricing service to assist in determining the fair value of securities when certain significant events occur that may affect the value of foreign securities.
In accordance with procedures adopted by the Trustees, fair value pricing may be used if events materially affecting the value of foreign securities occur between the time when the exchange on which they are traded closes and the time when the Fund’s net asset value is calculated. Management identifies possible fluctuation in international securities by monitoring the increase or decrease in the value of a designated benchmark index. In the event of an increase or decrease greater than predetermined levels, the Fund may use a systematic valuation model provided by an independent third party to fair value its international equity securities which are then typically categorized as Level 2 in the fair value hierarchy.
31
AZL MVP BlackRock Global Strategy Plus Fund
Notes to the Consolidated Financial Statements
December 31, 2017
There were no significant transfers between Levels 1 and 2 as of December 31, 2017, based on levels assigned to securities on December 31, 2016. The following is a summary of the valuation inputs used as of December 31, 2017 in valuing the Fund’s investments based upon the three levels defined above:
| Investment Securities: | Level 1 | Level 2 | Level 3 | Other^ | Total | ||||||||||||||||||||
Bank Loans | $ | — | $ | 1,758,274 | $ | — | $ | — | $ | 1,758,274 | |||||||||||||||
Collateralized Mortgage Obligations | — | 617,841 | — | — | 617,841 | ||||||||||||||||||||
Common Stocks | |||||||||||||||||||||||||
Aerospace & Defense | 307,940 | 2,732,236 | — | — | 3,040,176 | ||||||||||||||||||||
Air Freight & Logistics | — | 11,542 | — | — | 11,542 | ||||||||||||||||||||
Airlines | 2,742,921 | 1,604,541 | — | — | 4,347,462 | ||||||||||||||||||||
Auto Components | 90,837 | 6,798,459 | — | — | 6,889,296 | ||||||||||||||||||||
Automobiles | 5,899 | 3,941,992 | — | — | 3,947,891 | ||||||||||||||||||||
Banks | 8,966,881 | 7,943,434 | — | — | 16,910,315 | ||||||||||||||||||||
Beverages | 278,448 | 1,685,453 | — | — | 1,963,901 | ||||||||||||||||||||
Building Products | 819,337 | 1,231,349 | — | — | 2,050,686 | ||||||||||||||||||||
Capital Markets | 5,849,629 | 2,343,924 | — | — | 8,193,553 | ||||||||||||||||||||
Chemicals | 6,672,145 | 6,253,869 | — | — | 12,926,014 | ||||||||||||||||||||
Communications Equipment | 1,256,434 | 1,002,229 | — | — | 2,258,663 | ||||||||||||||||||||
Construction & Engineering | — | 1,671,722 | — | — | 1,671,722 | ||||||||||||||||||||
Construction Materials | 12,053 | 165,180 | — | — | 177,233 | ||||||||||||||||||||
Containers & Packaging | 900,770 | 1,129 | — | — | 901,899 | ||||||||||||||||||||
Distributors | — | 91,785 | — | — | 91,785 | ||||||||||||||||||||
Diversified Financial Services | 177,803 | 138,128 | — | — | 315,931 | ||||||||||||||||||||
Diversified Telecommunication Services | 1,207,218 | 4,867,378 | — | — | 6,074,596 | ||||||||||||||||||||
Electric Utilities | 2,074,689 | 1,620,835 | — | — | 3,695,524 | ||||||||||||||||||||
Electrical Equipment | 66,059 | 1,801,237 | — | — | 1,867,296 | ||||||||||||||||||||
Electronic Equipment, Instruments & Components | 3,839 | 1,269,945 | — | — | 1,273,784 | ||||||||||||||||||||
Equity Real Estate Investment Trusts | 111,788 | 825,504 | — | — | 937,292 | ||||||||||||||||||||
Food & Staples Retailing | 1,343,976 | 123,257 | — | — | 1,467,233 | ||||||||||||||||||||
Food Products | 188,357 | 7,205,453 | — | — | 7,393,810 | ||||||||||||||||||||
Gas Utilities | — | 1,655,612 | — | — | 1,655,612 | ||||||||||||||||||||
Health Care Equipment & Supplies | 1,995,936 | 903,371 | — | — | 2,899,307 | ||||||||||||||||||||
Health Care Providers & Services | 4,837,389 | 2,249,657 | — | — | 7,087,046 | ||||||||||||||||||||
Hotels, Restaurants & Leisure | 1,275,447 | 711,947 | — | — | 1,987,394 | ||||||||||||||||||||
Household Durables | 1,453,441 | 835,237 | — | — | 2,288,678 | ||||||||||||||||||||
Household Products | 141,130 | 12,951 | — | — | 154,081 | ||||||||||||||||||||
Independent Power & Renewable Electricity Producers | 802,068 | 7,448 | — | — | 809,516 | ||||||||||||||||||||
Industrial Conglomerates | 1,682,585 | 4,088,389 | — | — | 5,770,974 | ||||||||||||||||||||
Insurance | 4,626,958 | 2,075,856 | — | — | 6,702,814 | ||||||||||||||||||||
Internet & Direct Marketing Retail | 4,846,819 | 1,829 | — | — | 4,848,648 | ||||||||||||||||||||
Internet Software & Services | 8,780,149 | 5,170 | 1,360,105 | — | 10,145,424 | ||||||||||||||||||||
IT Services | 5,483,599 | 1,408,387 | — | — | 6,891,986 | ||||||||||||||||||||
Machinery | 197,057 | 3,607,321 | — | — | 3,804,378 | ||||||||||||||||||||
Marine | — | 6,896 | — | — | 6,896 | ||||||||||||||||||||
Media | 8,104,209 | 1,277,472 | — | — | 9,381,681 | ||||||||||||||||||||
Metals & Mining | 37,673 | 477,151 | — | — | 514,824 | ||||||||||||||||||||
Multi-Utilities | 935,297 | 2,451,969 | — | — | 3,387,266 | ||||||||||||||||||||
Oil, Gas & Consumable Fuels | 13,384,644 | 4,961,127 | — | — | 18,345,771 | ||||||||||||||||||||
Personal Products | 1,152,582 | 597,223 | — | — | 1,749,805 | ||||||||||||||||||||
Pharmaceuticals | 3,359,272 | 5,782,860 | — | — | 9,142,132 | ||||||||||||||||||||
Professional Services | 36,572 | 520,412 | — | — | 556,984 | ||||||||||||||||||||
Real Estate Management & Development | 893,799 | 3,751,014 | — | — | 4,644,813 | ||||||||||||||||||||
Road & Rail | 1,328,452 | 3,142,321 | — | — | 4,470,773 | ||||||||||||||||||||
Semiconductors & Semiconductor Equipment | 3,620,208 | 1,747,355 | — | — | 5,367,563 | ||||||||||||||||||||
Software | 10,156,614 | 12,445 | 2,259,500 | — | 12,428,559 | ||||||||||||||||||||
Specialty Retail | 3,496,838 | 208,429 | — | — | 3,705,267 | ||||||||||||||||||||
Technology Hardware, Storage & Peripherals | 6,322,469 | 31,055 | — | — | 6,353,524 | ||||||||||||||||||||
Textiles, Apparel & Luxury Goods | 32,793 | 786,673 | — | — | 819,466 | ||||||||||||||||||||
Thrifts & Mortgage Finance | — | 213,678 | — | — | 213,678 | ||||||||||||||||||||
Tobacco | 14,263 | 562,143 | — | — | 576,406 | ||||||||||||||||||||
Trading Companies & Distributors | 74,437 | 5,084 | — | — | 79,521 | ||||||||||||||||||||
Transportation Infrastructure | — | 98,607 | — | — | 98,607 | ||||||||||||||||||||
Wireless Telecommunication Services | 642,115 | 3,655,305 | — | — | 4,297,420 | ||||||||||||||||||||
Other Common Stocks+ | 4,308,243 | — | — | — | 4,308,243 | ||||||||||||||||||||
32
AZL MVP BlackRock Global Strategy Plus Fund
Notes to the Consolidated Financial Statements
December 31, 2017
| Investment Securities: | Level 1 | Level 2 | Level 3 | Other^ | Total | ||||||||||||||||||||
Convertible Bonds | $ | — | $ | 1,515,245 | $ | — | $ | — | $ | 1,515,245 | |||||||||||||||
Convertible Preferred Stocks | |||||||||||||||||||||||||
Equity Real Estate Investment Trusts | 360,537 | 593,749 | — | — | 954,286 | ||||||||||||||||||||
Internet Software & Services | — | — | 905,902 | — | 905,902 | ||||||||||||||||||||
Other Convertible Preferred Stocks+ | — | 2,047,497 | — | — | 2,047,497 | ||||||||||||||||||||
Corporate Bonds+ | — | 10,268,211 | — | — | 10,268,211 | ||||||||||||||||||||
Foreign Bonds+ | — | 34,041,174 | — | — | 34,041,174 | ||||||||||||||||||||
Preferred Stocks | |||||||||||||||||||||||||
Banks | 395,375 | 76,020 | — | — | 471,395 | ||||||||||||||||||||
Consumer Finance | 419,118 | — | — | — | 419,118 | ||||||||||||||||||||
Health Care Providers & Services | — | 898,353 | 410,186 | — | 1,308,539 | ||||||||||||||||||||
Internet Software & Services | — | — | 596,420 | — | 596,420 | ||||||||||||||||||||
Software | — | — | 658,610 | — | 658,610 | ||||||||||||||||||||
Technology Hardware, Storage & Peripherals | — | 7,799 | — | — | 7,799 | ||||||||||||||||||||
Private Placements | — | — | 45,559 | — | 45,559 | ||||||||||||||||||||
U.S. Treasury Obligations | — | 90,679,320 | — | — | 90,679,320 | ||||||||||||||||||||
Warrant | — | 11 | — | — | 11 | ||||||||||||||||||||
Yankee Dollars+ | — | 11,102,940 | — | — | 11,102,940 | ||||||||||||||||||||
Affiliated Investment Companies | 375,008,055 | — | — | — | 375,008,055 | ||||||||||||||||||||
Exchange Traded Fund | 15,632,487 | — | — | — | 15,632,487 | ||||||||||||||||||||
Securities Held as Collateral for Securities on Loan | — | — | — | 17,308,385 | 17,308,385 | ||||||||||||||||||||
Unaffiliated Investment Company | 8,839,261 | — | — | — | 8,839,261 | ||||||||||||||||||||
Purchased Options | — | 1,583,090 | — | — | 1,583,090 | ||||||||||||||||||||
Purchased Swaptions | — | 92,200 | — | — | 92,200 | ||||||||||||||||||||
|
|
|
|
|
|
|
|
|
| ||||||||||||||||
Total Investment Securities | 527,754,914 | 258,464,699 | 6,236,282 | 17,308,385 | 809,764,280 | ||||||||||||||||||||
|
|
|
|
|
|
|
|
|
| ||||||||||||||||
Other Financial Instruments:* | |||||||||||||||||||||||||
Futures Contracts | 201,821 | — | — | — | 201,821 | ||||||||||||||||||||
Written Options | — | (305,118 | ) | — | — | (305,118 | ) | ||||||||||||||||||
Written Swaptions | — | (73,459 | ) | — | — | (73,459 | ) | ||||||||||||||||||
Forward Currency Contracts | — | 255,012 | — | — | 255,012 | ||||||||||||||||||||
Over-the-Counter Credit Default Swaps | — | (16,355 | ) | — | — | (16,355 | ) | ||||||||||||||||||
Centrally Cleared Credit Default Swaps | — | (6,578 | ) | — | — | (6,578 | ) | ||||||||||||||||||
Over-the-Counter Variance Swaps | — | (20,626 | ) | — | — | (20,626 | ) | ||||||||||||||||||
Over-the-Counter Currency Swaps | — | 200,423 | — | — | 200,423 | ||||||||||||||||||||
Centrally Cleared Interest Rate Swaps | — | 100,330 | — | — | 100,330 | ||||||||||||||||||||
Total Return Swaps | — | 820,520 | — | — | 820,520 | ||||||||||||||||||||
|
|
|
|
|
|
|
|
|
| ||||||||||||||||
Total Investments | $ | 527,956,735 | $ | 259,418,848 | $ | 6,236,282 | $ | 17,308,385 | $ | 810,920,250 | |||||||||||||||
|
|
|
|
|
|
|
|
|
| ||||||||||||||||
| + | For detailed industry descriptions, see the accompanying Consolidated Schedule of Portfolio Investments. |
| * | Other Financial Instruments would include any derivative instruments, such as futures contracts, written options, forward currency contracts and swaps. These investments are generally recorded in the financial statements at the unrealized gain or loss on the investment except futures contracts and centrally cleared interest rate swaps which are presented at variation margin. |
| ^ | Investments categorized as Securities Held as Collateral for Securities on Loan in the Consolidated Schedule of Portfolio Investments, are measured at fair value using the NAV per share practical expedient. These investments are not classified within the fair value hierarchy, and are reflected as “Other” in the above table. Although there can be no assurance, in general, the fair value of investments measured using the NAV per share practical expedient represents the amount the owner of such investments might reasonably expect to receive in an orderly sale. |
A reconciliation of assets in which Level 3 inputs are used in determining fair value, along with additional quantitative disclosures, are presented when there are significant Level 3 investments at the end of the period.
5. Security Purchases and Sales
For the year ended December 31, 2017, cost of purchases and proceeds from sales of securities (excluding securities maturing less than one year from acquisition) were as follows:
| Purchases | Sales | |||||||||
AZL MVP BlackRock Global Strategy Plus Fund | $ | 466,038,704 | $ | 532,544,774 | ||||||
For the year ended December 31, 2017, purchases and sales of long-term U.S. government securities were as follows:
| Purchases | Sales | |||||||||
AZL MVP BlackRock Global Strategy Plus Fund | $ | 287,373,196 | $ | 253,077,097 | ||||||
33
AZL MVP BlackRock Global Strategy Plus Fund
Notes to the Consolidated Financial Statements
December 31, 2017
6. Restricted Securities
A restricted security is a security which has been purchased through a private offering and cannot be resold to the general public without prior registration under the Securities Act of 1933 (the “1933 Act”) or pursuant to the resale limitations provided by Rule 144A under the 1933 Act, or an exemption from the registration requirements of the 1933 Act. Whether a restricted security is illiquid is determined pursuant to guidelines established by the Trustees. Not all restricted securities are considered illiquid. The illiquid restricted securities held as of December 31, 2017 are identified below.
| Security | Acquisition Date(a) | Acquisition Cost | Shares or Principal Amount | Fair Value | Percentage of Net Assets | ||||||||||||||||||||
AliphCom, Inc., 12.00%, 4/1/20 | 4/27/15 | $ | 735,000 | $ | 3,065,000 | $ | 12,567 | 0.00 | % | ||||||||||||||||
Aliphcom, 12.00%, 4/1/20 | 11/11/15 | 268,000 | 268,000 | 1,099 | 0.00 | % | |||||||||||||||||||
Dana Gas Sukuk, Ltd., 7.00%, 10/31/18 | 5/8/13 | 650,390 | 631,620 | 517,928 | 0.06 | % | |||||||||||||||||||
Domo, Inc., Series E | 4/1/15 | 998,866 | 144,482 | 905,902 | 0.11 | % | |||||||||||||||||||
Dropbox, Inc. | 1/28/14 | 1,827,985 | 95,700 | 1,358,940 | 0.16 | % | |||||||||||||||||||
Grand Rounds, Inc., Series C | 3/31/15 | 399,608 | 143,925 | 410,186 | 0.05 | % | |||||||||||||||||||
Inversiones Alsacia SA, 8.00%, 12/31/18, Callable 1/22/18 @ 100.00 | 12/22/14 | 312,032 | 527,380 | 13,185 | 0.00 | % | |||||||||||||||||||
Jawbone | 1/24/2017 | — | 23,389 | 31,893 | 0.00 | % | |||||||||||||||||||
Logistics UK, Series 2015-1A, Class F, 1.21%, 8/20/25 | 8/3/15 | 440,732 | 459,000 | 617,841 | 0.07 | % | |||||||||||||||||||
Lookout, Inc. | 3/4/15 | 63,364 | 5,547 | 1,165 | 0.00 | % | |||||||||||||||||||
Lookout, Inc., Preffered Shares, Series F | 9/19/14 | 389,996 | 63,925 | 596,420 | 0.07 | % | |||||||||||||||||||
Palantir Technologies, Inc., Series I | 3/27/14 | 712,042 | 116,157 | 658,610 | 0.08 | % | |||||||||||||||||||
REI Agro, Ltd., Registered Shares, 5.50%, 11/13/14 | 2/7/12 | 300,000 | 400,000 | — | — | % | |||||||||||||||||||
TFS Corp., Ltd., 8.75%, 8/1/23, Callable 8/1/19 @ 106.56 | 7/20/16 | 2,106,000 | 1,018,000 | 712,600 | 0.09 | % | |||||||||||||||||||
Uber Technologies, Inc. | 3/21/14 | 1,063,120 | 68,532 | 2,259,500 | 0.27 | % | |||||||||||||||||||
| (a) | Acquisition date represents the initial purchase date of the security. |
7. Investment Risks
Bank Loan Risk: There are a number of risks associated with an investment in bank loans including credit risk, interest rate risk, liquidity risk and prepayment risk. Lack of an active trading market, restrictions on resale, irregular trading activity, wide bid/ask spreads and extended trade settlement periods may impair the Fund’s ability to sell bank loans within its desired time frame or at an acceptable price and its ability to accurately value existing and prospective investments. Extended trade settlement periods may result in cash not being immediately available to the Fund. As a result, the Fund may have to sell other investments or engage in borrowing transactions to raise cash to meet its obligations. The risk of holding bank loans is also directly tied to the risk of insolvency or bankruptcy of the issuing banks. These risks could cause the Fund to lose income or principal on a particular investment, which in turn could affect the Fund’s returns. The value of bank loans can be affected by and sensitive to changes in government regulation and to economic downturns in the United States and abroad. Bank loans generally are floating rate loans, which are subject to interest rate risk as the interest paid on the floating rate loans adjusts periodically based on changes in widely accepted reference rates.
Commodities-Related Investment Risk: Exposure to the commodities markets may subject the Fund to greater volatility than investments in traditional securities. The value of commodity-linked derivative investments may be affected by changes in overall market movements, commodity index volatility, changes in interest rates, or sectors affecting a particular industry or commodity, such as drought, floods, weather, embargoes, tariffs and international economic, political and regulatory developments. The U.S. Commodities Futures Trading Commission has proposed changes to certain of its rules governing investment in commodities by mutual funds, such as the Fund. In the event these changes are adopted, or if there are changes in the tax treatment of the Fund’s direct and indirect investments in commodities, the Fund may be unable to obtain exposure to commodity markets, or may be limited in the extent to which or manner in which it can obtain such exposure.
Derivatives Risk: The Fund may invest in derivatives as a principal strategy. A derivative is a financial contract whose value depends on, or is derived from, the value of an underlying asset, reference rate, or risk. Use of derivative instruments involves risks different from, or possibly greater than, the risks associated with investing directly in securities and other traditional investments. Derivatives are subject to a number of other risks, such as liquidity risk, interest rate risk, market risk, credit risk, and selection risk. Derivatives also involve the risk of mispricing or improper valuation and the risk that changes in the value may not correlate perfectly with the underlying asset, rate, or index. Using derivatives may result in losses, possibly in excess of the principal amount invested. Also, suitable derivative transactions may not be available in all circumstances. The counterparty to a derivatives contract could default. As required by applicable law, a Fund that invests in derivatives segregates cash or liquid securities, or both, to the extent that its obligations under the instrument are not covered through ownership of the underlying security, financial instrument, or currency.
Emerging Markets Risk: Emerging markets may have less developed trading markets and exchanges which may make it more difficult to sell securities at an acceptable price and their prices may be more volatile than securities of companies in more developed markets. Settlements of trades may be subject to greater delays so that the Fund may not receive the proceeds of a sale of a security on a timely basis. Emerging countries may also have less developed legal and accounting systems and investments may be subject to greater risks of government restrictions, nationalization, or confiscation.
Foreign Securities and Currencies Risk: Investments in securities of foreign issuers carry certain risks not ordinarily associated with investments in securities of domestic issuers. Such risks include future political and economic developments, and the possible imposition of exchange controls or other foreign governmental laws and restrictions. In addition, with respect to certain countries, there is the possibility of expropriation of assets, confiscatory taxation, political or social instability or diplomatic developments which could adversely affect investments in those securities.
34
AZL MVP BlackRock Global Strategy Plus Fund
Notes to the Consolidated Financial Statements
December 31, 2017
Security Quality Risk (also known as “High Yield Risk”): The Fund may invest in high yield, high risk debt securities and unrated securities of similar credit quality (commonly known as “junk bonds”) and may be subject to greater levels of credit and liquidity risk than funds that do not invest in such securities. These securities are considered predominately speculative with respect to the issuer’s continuing ability to make principal and interest payments. An economic downturn or period of rising interest rates could adversely affect the market for these securities and reduce the Fund’s ability to sell these securities (liquidity risk). If the issuer of a security is in default with respect to interest or principal payments, the Fund may lose the value of its entire investment.
8. Federal Tax Information
It is the policy of the Fund to continue to qualify as a regulated investment company by complying with the provisions available to certain investment companies, as defined under Subchapter M of the Internal Revenue Code, and to make distributions of net investment income and net realized gains sufficient to relieve it from all, or substantially all, federal income taxes. Accordingly, no provisions for federal income taxes are required in the financial statements.
Management of the Fund has reviewed tax positions taken in tax years that remain subject to examination by all major tax jurisdictions, including federal (i.e., the last four tax year ends and the interim tax period since then, as applicable). Management believes that there is no tax liability resulting from unrecognized tax benefits related to uncertain tax positions taken.
Cost of securities, including derivatives and short positions as applicable, for federal income tax purposes at December 31, 2017 is $738,503,613. The gross unrealized appreciation/(depreciation) on a tax basis is as follows:
Unrealized appreciation | $ | 83,178,118 | ||
Unrealized (depreciation) | (11,330,752 | ) | ||
|
| |||
Net unrealized appreciation/(depreciation) | $ | 71,847,366 | ||
|
|
Capital loss carry forwards (“CLCFs”) subject to expiration are applied as short-term capital loss regardless of whether the originating capital loss was short-term or long-term. CLCFs that are not subject to expiration must be utilized before those that are subject to expiration. The Board does not intend to authorize a distribution of any realized gain for the Fund until any applicable CLCF has been offset or expires.
During the year ended December 31, 2017, the Fund utilized $439,156 in CLCFs to offset capital gains.
The tax character of dividends paid to shareholders during the year ended December 31, 2017 were as follows:
| Ordinary Income | Net Long-Term | Total Distributions(a) | |||||||||||||
AZL MVP BlackRock Global Strategy Plus Fund | $ | 3,178,036 | $ | — | $ | 3,178,036 | |||||||||
| (a) | Total distributions paid may differ from the Consolidated Statements of Changes in Net Assets because dividends are recognized when actually paid for tax purposes. |
The tax character of dividends paid to shareholders during the year ended December 31, 2016 were as follows:
| Ordinary Income | Net Long-Term | Total Distributions(a) | |||||||||||||
AZL MVP BlackRock Global Strategy Plus Fund | $ | 21,857,180 | $ | 29,417,164 | $ | 51,274,344 | |||||||||
| (a) | Total distributions paid may differ from the Consolidated Statements of Changes in Net Assets because dividends are recognized when actually paid for tax purposes. |
At December 31, 2017, the components of accumulated earnings on a tax basis were as follows:
| Undistributed Ordinary Income | Undistributed Long-Term Capital Gains | Accumulated Capital and Other Losses | Unrealized Appreciation/ Depreciation(a) | Total Accumulated Earnings/(Deficit) | |||||||||||||||||||||
AZL MVP BlackRock Global Strategy Plus Fund | $ | 21,405,114 | $ | 32,289,849 | $ | — | $ | 71,694,659 | $ | 125,389,622 | |||||||||||||||
| (a) | The difference between book-basis and tax-basis unrealized appreciation/depreciation is attributable primarily to tax deferral of losses on wash sales and straddles. |
9. Ownership and Principal Holders
The beneficial ownership, either directly or indirectly, of more than 25% of the voting securities of a fund creates presumptions of control of the fund, under section 2 (a)(9) of the 1940 Act. As of December 31, 2017, the Fund had an individual shareholder account which is affiliated with the Investment Adviser representing ownership in excess of 85% of the Fund. As of December 31, 2017, the Fund had a controlling interest (in excess of 50%) in the AZL MSCI Global Equity Index Fund, which is affiliated with the Investment Adviser.
35
AZL MVP BlackRock Global Strategy Plus Fund
Notes to the Consolidated Financial Statements
December 31, 2017
10. Investment Company Reporting Modernization
In October 2016, the SEC released its Final Rule on Investment Company Reporting Modernization (the “Rules”). The Rules which introduce two new regulatory reporting forms for investment companies — Form N-PORT and Form N-CEN — also contain amendments to Regulation S-X which require standardized, enhanced disclosures about derivatives in investment company financial statements, as well as other amendments. The amendments to Regulation S-X became effective for filings made with the SEC after August 1, 2017. The compliance date for filing Form N-PORT and Form N-CEN will vary based on the reporting entity’s size and, in the case of the Fund, is expected to be April 30, 2019. The Fund’s adoption of these amendments, as applicable for the financial statements prepared as of December 31, 2017, had no effect on the Fund’s net assets or results of operations.
11. Subsequent Events
Management of the Fund has evaluated the need for additional disclosures or adjustments resulting from events through the date the financial statements were issued. Based on this evaluation, there were no subsequent events to report that would have material impact on the Fund’s financial statements.
36
REPORT OF INDEPENDENT REGISTERED PUBLIC ACCOUNTING FIRM
To the Shareholders and Board of Trustees of
Allianz Variable Insurance Products Fund of Funds Trust:
Opinion on the Consolidated Financial Statements
We have audited the accompanying consolidated statement of assets and liabilities of AZL MVP BlackRock Global Strategy Plus Fund and Subsidiaries (the “Fund”) of the Allianz Variable Insurance Products Fund of Funds Trust, including the consolidated schedule of portfolio investments, as of December 31, 2017, and the related consolidated statement of operations for the year then ended, the consolidated statements of changes in net assets for each of the years in the two-year period then ended, and the related notes (collectively, the “consolidated financial statements”) and the consolidated financial highlights for each of the years in the five-year period then ended. In our opinion, the consolidated financial statements present fairly, in all material respects, the financial position of the Fund as of December 31, 2017, the results of its operations for the year then ended, the changes in its net assets for each of the years in the two-year period then ended, and the consolidated financial highlights for each of the years in the five-year period then ended, in conformity with U.S. generally accepted accounting principles.
Basis for Opinion
These consolidated financial statements and consolidated financial highlights are the responsibility of the Fund’s management. Our responsibility is to express an opinion on these consolidated financial statements and consolidated financial highlights based on our audits. We are a public accounting firm registered with the Public Company Accounting Oversight Board (United States) (“PCAOB”) and are required to be independent with respect to the Fund in accordance with the U.S. federal securities laws and the applicable rules and regulations of the Securities and Exchange Commission and the PCAOB.
We conducted our audits in accordance with the standards of the PCAOB. Those standards require that we plan and perform the audit to obtain reasonable assurance about whether the consolidated financial statements and consolidated financial highlights are free of material misstatement, whether due to error or fraud. Our audits included performing procedures to assess the risks of material misstatement of the consolidated financial statements and consolidated financial highlights, whether due to error or fraud, and performing procedures that respond to those risks. Such procedures included examining, on a test basis, evidence regarding the amounts and disclosures in the consolidated financial statements and consolidated financial highlights. Such procedures also included confirmation of securities owned as of December 31, 2017, by correspondence with the custodian, transfer agents of the underlying funds, and brokers or by other appropriate auditing procedures. Our audits also included evaluating the accounting principles used and significant estimates made by management, as well as evaluating the overall presentation of the consolidated financial statements and consolidated financial highlights. We believe that our audits provide a reasonable basis for our opinion.
/s/ KPMG LLP
We have served as the auditor of one or more Allianz Variable Insurance Products investment companies since 1999.
Columbus, Ohio
February 23, 2018
37
Other Federal Income Tax Information (Unaudited)
For the year ended December 31, 2017, 100.00% of the total ordinary income dividends paid by the Fund qualify for the corporate dividends received deductions available to corporate shareholders.
38
A description of the policies and procedures that the Fund uses to determine how to vote proxies relating to portfolio securities is available, without charge, upon request, by visiting the Securities and Exchange Commission’s (‘‘Commission’’) website at www.sec.gov, or by calling 800-624-0197.
Information regarding how the Fund voted proxies relating to portfolio securities during the most recent 12-month period ended June 30th is available (i) without charge, upon request, by calling 800-624-0197; (ii) on the Allianz Variable Insurance Products Fund of Funds Trust’s website at https://www.allianzlife.com; and (iii) on the Commission’s website at http://www.sec.gov.
The Fund files complete Schedules of Portfolio Holdings with the Commission for the first and third quarters of each fiscal year on Form N-Q. Schedules of Portfolio Holdings for the Fund in this report are available without charge on the Commission’s website at http://www.sec.gov, or may be reviewed and copied at the Commission’s Public Reference Room in Washington, D.C. Information on the operation of the Public Reference Room may be obtained by calling 800-SEC-0330.
39
Approval of Investment Advisory Agreement — October 23, 2017 (Unaudited)
Subject to the general supervision of the Board of Trustees (the “Board”) and in accordance with the investment objectives and restrictions of each separate series (together, the “Funds”) of the Allianz Variable Insurance Products Fund of Funds Trust (the “Trust”), investment advisory services are provided to the Funds by Allianz Investment Management LLC (the “Manager”). As used in this section, “Fund” refers to any of the Funds. The Manager manages each Fund pursuant to an investment management agreement (the “Management Agreement”) with the Trust in respect of each such Fund. The Management Agreement provides that the Manager, subject to the supervision and approval of the Board, is responsible for the management of each Fund. For management services, each Fund pays the Manager an investment advisory fee based upon each Fund’s average daily net assets. The Manager has contractually agreed to limit the expenses of each Fund by reimbursing the Fund if and when total Fund operating expenses exceed certain amounts until at least May 1, 2019 (the “Expense Limitation Agreement”).
In reviewing the services provided by the Manager and the terms of the Management Agreement, the Board receives and reviews information related to the Manager’s experience and expertise in the variable insurance marketplace. Currently, the Funds are offered only through variable annuities and variable life insurance policies, and not in the retail fund market. In addition, the Board receives information regarding the Manager’s expertise with regard to portfolio diversification and asset allocation requirements within variable insurance products issued by Allianz Life Insurance Company of North America (“Allianz Life”) and its subsidiary, Allianz Life Insurance Company of New York (“Allianz of New York”). Currently, the Funds are offered only through Allianz Life and Allianz of New York variable products.
As required by the Investment Company Act of 1940 (the “1940 Act”), the Board has reviewed and approved the Management Agreement with the Manager. The Board’s decision to approve this contract reflects the exercise of its business judgment on whether to approve new arrangements and continue the existing arrangements. During its review of the contract, the Board considered many factors, among the most material of which are: the Fund’s investment objectives and long-term performance; the Manager’s management philosophy, personnel, processes and investment performance, including its compliance history and the adequacy of its compliance processes; the preferences and expectations of Fund shareholders (and underlying contract owners) and their relative sophistication; the continuing state of competition in the mutual fund industry; and comparable fees in the mutual fund industry.
The Board also considered the compensation and benefits received by the Manager. This includes fees received for services provided to a Fund by employees of the Manager or of affiliates of the Manager and research services received by the Manager from brokers that execute Fund trades, as well as advisory fees. The Board considered the fact that: (1) the Manager and the Trust are parties to an Administrative Services Agreement and a Compliance Services Agreement, under which the Manager is compensated by the Trust for performing certain administrative and compliance services including providing an employee of the Manager or one of its affiliates to act as the Trust’s Chief Compliance Officer; and (2) Allianz Life Financial Services, LLC, an affiliated person of the Manager, is a registered securities broker-dealer and received (along with its affiliated persons) payments made by the underlying funds pursuant to Rule 12b-1.
The Board is aware that various courts have interpreted provisions of the 1940 Act and have indicated in their decisions that the following factors may be relevant to an adviser’s compensation: the nature and quality of the services provided by the adviser, including the performance of the fund; the adviser’s cost of providing the services; the extent to which the adviser may realize “economies of scale” as the fund grows larger; any indirect benefits that may accrue to the adviser and its affiliates as a result of the adviser’s relationship with the fund; performance and expenses of comparable funds; the profitability of acting as adviser to the fund; and the extent to which the independent Board members, who are not “interested persons” of a fund as defined by the 1940 Act, are fully informed about all facts bearing on the adviser’s services and fees. The Board is aware of these factors and takes them into account in its review of the Management Agreement for the Funds.
The Board considered and weighed these circumstances in light of its experience in governing the Trust, and is assisted in its deliberations by the advice of independent legal counsel to the independent Trustees. In this regard, the Board requests and receives a significant amount of information about the Funds and the Manager. Some of this information is provided at each regular meeting of the Board; additional information is provided in connection with the particular meeting or meetings at which the Board’s formal review of an advisory contract occurs. In between regularly scheduled meetings, the Board may receive information on particular matters as the need arises. Thus, the Board’s evaluation of the Management Agreement is informed by reports covering such matters as: the Manager’s investment philosophy, personnel and processes, and the Fund’s investment performance (in absolute terms as well as in relationship to its benchmark). In connection with comparing the performance of each Fund versus its benchmark, the Board receives reports on the extent to which the Fund’s performance may be attributed to various applicable factors, such as asset class allocation decisions and volatility management strategies, the performance of the underlying funds, rebalancing decisions, and the impact of cash positions and Fund fees and expenses. The Board also receives reports on the Funds’ expenses (including the advisory fee itself and the overall expense structure of the Funds, both in absolute terms and relative to similar and/or competing funds, with due regard for the Expense Limitation Agreement and additional voluntary expense limitations); the nature and extent of the advisory and other services provided to the Fund by the Manager and its affiliates; compliance and audit reports concerning the Funds and the companies that service them; and relevant developments in the mutual fund industry and how the Funds and/or the Manager are responding to them.
The Board also receives financial information about the Manager, including reports on the compensation and benefits the Manager derives from its relationships with the Funds. These reports cover not only the fees under the Management Agreement, but also fees, if any, received for providing other services to the Funds. The reports also discuss any indirect or “fall out” benefits the Manager or its affiliates may derive from its relationship with the Funds.
The Management Agreement was most recently considered at Board meetings held in the fall of 2017. Information relevant to the approval of the Management Agreement was considered at a telephonic Board meeting on October 18, 2017, and at an “in person” Board meeting held October 23, 2017. The Management Agreement was approved at the Board meeting of October 23, 2017. At such meeting the Board also approved the Expense Limitation Agreement between the Manager and the Trust for the period ending April 30, 2019. In connection with such meetings, the Trustees requested and evaluated extensive materials from the Manager, including performance and expense information for other investment companies with similar investment objectives derived from data compiled by an independent third party provider and other sources believed to be reliable by the Manager. Prior to voting, the Trustees reviewed the proposed approval/continuance of the Agreement with management and with experienced counsel who are independent of the Manager and received a memorandum from such counsel discussing the legal standards for their consideration of the proposed approvals/continuances. The independent Trustees also discussed the proposed approvals/continuances in a private session with such counsel at which no representatives of the Manager were present. In reaching their determinations relating to the approval and/or continuance of the Agreement, in respect of each Fund, the Board considered all factors it believed relevant. The Board based its decision to approve the Management Agreement on the totality of the circumstances and relevant factors, and with a view to past and future long-term considerations. Not all of the factors and considerations discussed above and below are necessarily relevant to every Fund, and the Board did not assign relative weights to factors discussed herein or deem any one or group of them to be controlling in and of themselves.
An SEC rule requires that shareholder reports include a discussion of certain factors relating to the selection of the investment adviser and the approval of the advisory fee. The “factors” enumerated by the SEC are set forth below in italics, as well as the Board’s conclusions regarding such factors:
(1) The nature, extent and quality of services provided by the Manager. The Trustees noted that the Manager, subject to the control of the Board, administers each Fund’s business and other affairs. The Trustees noted that the Manager also provides the Trust and each Fund with such administrative and other services (exclusive of, and in addition to, any such services provided by any others retained by the Trust on behalf of the Funds) and executive and other personnel as are necessary for the operation of the Trust and the Funds. Except for the Trust’s Chief Compliance Officer and certain compliance staff, the Manager pays all of the compensation of Trustees and officers of the Trust who are employees of the Manager or its affiliates.
40
The Board considered the scope and quality of services provided by the Manager and noted that the scope of such services provided had expanded as a result of recent regulatory and other developments. The Board noted that, for example, the Manager is responsible for maintaining and monitoring its own compliance program, and this compliance program has been continuously refined and enhanced in light of new regulatory requirements. The Board considered the capabilities and resources which the Manager has dedicated to performing services on behalf of the Trust and its Funds. The quality of administrative and other services, including the Manager’s role in coordinating the activities of the Trust’s other service providers, also were considered. The Board concluded that, overall, they were satisfied with the nature, extent and quality of services provided (and expected to be provided) to the Trust and to each of the Funds under the Management Agreement.
(2) The investment performance of the Funds and the Manager. In connection with every in-person quarterly Board meeting and the fall 2017 contract review process, Trustees received extensive information on the performance results of each Fund. This included, for example, performance information on absolute total return, performance versus the appropriate benchmark(s), the contribution to performance of the Manager’s asset class allocation decisions and volatility management strategies, the performance of the underlying funds, and the impact on performance of rebalancing decisions, cash and Fund fees. This included Lipper performance information on the Funds for the previous quarter, year-to-date, and previous one-, three- and five-year periods, to the extent the Funds were in existence for such periods. (For Funds which have been in existence for less than five years, the Board received performance information on shorter time periods to the extent available.) For example, in connection with the Board meeting held October 23, 2017, the Manager reported that for the five Funds for which performance information for the five year period ended June 30, 2017 was available, two were in the top 40%, two were in the middle 20%, and one was in the bottom 40%. None of these Funds was in the bottom 40% for the three- or one-year periods. The Manager reported that for the three-year period ended June 30, 2017, for the six Funds for which three year performance information was available, four Funds were in the top 40% and two Funds were in the middle 20%. For the eight Funds for which one-year performance information was available, for the one-year period ended June 30, 2017, four Funds were in the top 40%, two Funds were in the middle 20%, and two Funds were in the bottom 40%.
At the Board meeting held October 23, 2017, the Manager also reported upon the performance of the MVP Funds compared to custom managed-volatility peer groups. For the seven Funds for which three-year performance information was available, for the three-year period ended June 30, 2017, five Funds were in the top 40%, one Fund was in the middle 20%, and one was in the bottom 40%. For the eight Funds for which one year performance was available, for the one-year period ended June 30, 2017, four Funds were in the top 40% and four Funds were in the middle 20%. All six Funds for which five-year performance information was available were in the top 40%.
At the Board meeting held October 23, 2017, the Trustees determined that the investment performance of the Funds was acceptable.
(3) The costs of services to be provided and profits to be realized by the Manager and its affiliates from the relationship with the Funds. The Board considered that the Manager receives an advisory fee from each of the Funds. The Manager reported that for the three MVP Fusion Dynamic Funds the advisory fee paid put these Funds in the 44th percentile of the customized peer group. The Manager reported that for three MVP Index Strategy Funds the advisory fee paid put them in the 27th percentile of the customized peer group, and for the two non-MVP Index Strategy Funds, as well as the AZL DFA Multi-Strategy Fund, the advisory fee paid put them in the 13th percentile of the customized peer group. The Manager reported that for the AZL MVP BlackRock Global Strategy Plus, AZL MVP DFA Multi-Strategy, AZL MVP Pyramis Multi-Strategy, and AZL MVP T. Rowe Price Capital Appreciation Plus Funds, the advisory fee paid was in the 9th percentile. (A lower percentile reflects lower fund fees and is better for fund shareholders.) Trustees were provided with information on the total expense ratios of the Funds and other funds in the customized peer groups, and the Manager reported upon the challenges in making peer group comparisons for the Funds.
The Manager provided information concerning the profitability of the Manager’s investment advisory activities for the period from 2014 through June 30, 2017. The Board recognized that it is difficult to make comparisons of profitability from investment company advisory agreements because comparative information is not generally publicly available and is affected by numerous factors, including the structure of the particular adviser, the types of funds it manages, its business mix, numerous assumptions regarding allocation of expenses and the adviser’s capital structure and cost of capital. In considering profitability information, the Board considered the possible effect of certain fall-out benefits to the Manager and its affiliates. The Board focused on profitability of the Manager’s relationships with the Funds before taxes and distribution expenses. The Board recognized that the Manager should earn a reasonable level of profits for the services it provides to each Fund.
The Board also considered that Wilshire Funds Management (“Wilshire”) serves as a consultant to the Manager in preparing statistical and other factual information for use in the creation and maintenance of the asset allocation models for the Fusion Funds (the AZL MVP Fusion Dynamic Conservative, Balanced, and Moderate Funds), pursuant to an agreement between the Manager and Wilshire. Wilshire serves as a consultant to the Manager with respect to selecting the Fusion Funds’ underlying funds and the asset allocations among the underlying funds. The Manager, not any Fund, pays a consultant fee to Wilshire.
Based upon the information provided, the Board concluded that the Funds’ advisory fees and expense ratios are not unreasonable, and determined that there was no evidence that the Manager’s level of profitability from its relationship with the Funds was excessive.
(4) and (5) The extent to which economies of scale would be realized as the Funds grow, and whether fee levels reflect these economies of scale. The Board noted that the advisory fee schedules for the Funds do not contain breakpoints that reduce the fee rate on assets above specified levels. The Board recognized that breakpoints may be an appropriate way for the Manager to share its economies of scale, if any, with Funds that have substantial assets. The Board found there was no uniform methodology for establishing breakpoints that give effect to Fund-specific services provided by the Manager. The Board noted that in the fund industry as a whole, as well as among funds similar to the Funds, there is no uniformity or pattern in the fees and asset levels at which breakpoints (if any) apply. Depending on the age, size, and other characteristics of a particular fund and its manager’s cost structure, different conclusions can be drawn as to whether there are economies of scale to be realized at any particular level of assets, notwithstanding the intuitive conclusion that such economies exist, or will be realized at some level of total assets. Moreover, because different managers have different cost structures and service models, it is difficult to draw meaningful conclusions from the breakpoints that may have been adopted by other funds. The Board also noted that the advisory agreements for many funds do not have breakpoints at all, or if breakpoints exist, they may be at asset levels significantly greater than those of the individual Funds. The Board also noted that the total assets in all of the Funds, as of June 30, 2017, were approximately $10.8 billion and that the largest Fund, the AZL MVP Growth Index Strategy Fund, had assets of approximately $2.4 billion.
The Board noted that the Manager has agreed to temporarily limit Fund expenses under the Expense Limitation Agreement, which has the effect of reducing expenses as would the implementation of advisory fee breakpoints. The Manager has committed to continue to consider the continuation of expense limits and/or advisory fee breakpoints as the Funds grow larger. The Board receives quarterly reports on the level of Fund assets. The Board expects to continue to consider: (a) the extent to which economies of scale have been realized, and (b) whether the advisory fee should be modified, either in connection with the next renewal of the Agreements or by modifying the Expense Limitation Agreement, to reflect such economies of scale, if any.
Having taken these factors into account, the Board concluded that the absence of breakpoints in the Funds’ advisory fee rate schedules was acceptable under each Fund’s circumstances.
41
Information about the Board of Trustees and Officers (Unaudited)
The Trust is managed by the Trustees in accordance with the laws of the state of Delaware governing business trusts. There are currently eight Trustees, one of whom is an “interested person” of the Trust within the meaning of that term under the 1940 Act. The Trustees and Officers of the Trust, and their addresses, ages, positions held with the Trust, terms of office with the Trust and length of time served, principal occupation(s) during the past five years, the number of portfolios in the Trust they oversee, and other directorships held during the past five years are as follows:
Non-Interested Trustees(1)
| Name, Address, and Year of Birth | Positions Held with Allianz VIP and VIP FOF Trust | Term of Office(2)/ Length of Time Served | Principal Occupation(s) During Past 5 Years | Number of Portfolios Overseen for Allianz VIP and VIP FOF Trust | Other AZL Fund Complex | |||||
| Peter R. Burnim (1947) 5701 Golden Hills Drive Minneapolis, MN 55416 | Trustee | Since 2/07 | Consultant/Chair, various companies: Chairman, Emrys Analytics and subsidiaries, July 2015 to present; Chairman, Argus Investment Strategies Fund Ltd., February 2013 to 2017; Managing Director, iQ Venture Advisors, LLC, 2005 to present; Chairman, Northstar Group Holdings Ltd. Bermuda, 2011 to present; Chairman Sterling Bank & Trust (Bahamas) Ltd., 2016 to present, and Expert Witness, Massachusetts Department of Revenue, 2011 to 2016. | 35 | Argus Group Holdings and Subsidiaries; Northstar Group Holdings; Sterling Trust (Cayman) Ltd.; Sterling Bank & Trust Limited (Bahamas); Emrys Analytics; EGB Insurance. | |||||
| Peggy L. Ettestad (1957) 5701 Golden Hills Drive Minneapolis, MN 55416 | Lead Independent Trustee | Since 10/14 (Trustee since 2/07) | Managing Director, Red Canoe Management Consulting LLC, 2008 to present | 35 | Luther College | |||||
| Tamara Lynn Fagely (1958) 5701 Golden Hills Drive Minneapolis, MN 55416 | Trustee | Since 12/17 | Retired; Chief Operations Officer, Hartford Funds, March 2012 to December 2013 | 35 | Diamond Hill Funds (13 funds) | |||||
| Richard H. Forde (1953) 5701 Golden Hills Drive Minneapolis, MN 55416 | Trustee | Since 12/17 | Member of the Board and Chairman of the Finance and Investment Committee, Connecticut Water Service, Inc., October 2013 to present; Senior Vice President and Chief Investment Officer, CIGNA, 2004 to 2012 | 35 | Connecticut Water Service, Inc. | |||||
| Claire R. Leonardi (1955) 5701 Golden Hills Drive Minneapolis, MN 55416 | Trustee | Since 2/04 | Chief Executive Officer, Health eSense Inc., 2015 to Present; CEO, Connecticut Innovations, Inc., 2012 to 2015; General Partner, Fairview Capital, L.P., 1994 to 2012 | 35 | reSet Social Enterprise Investment Fund | |||||
| Dickson W. Lewis (1948) 5701 Golden Hills Drive Minneapolis, MN 55416 | Trustee | Since 2/04 | Retired; Vice President/General Manager, Yearbooks & Canada-Lifetouch National School Studios, 2006 to 2014; Vice President/General Manager of Jostens, Inc., 2002 to 2006; Senior Vice President of Fortis Group, 1997 to 2002 | 35 | None | |||||
| Arthur C. Reeds, III (1944) 5701 Golden Hills Drive Minneapolis, MN 55416 | Trustee | Since 10/99 | Retired; Senior Investment Officer, Hartford Foundation for Public Giving, 2000 to 2003; Chairman, Chief Executive and President of Conning Corp., 1999 to 2000 | 35 | Connecticut Water Service, Inc. |
Interested Trustees(3)
| Name, Address, and Year of Birth | Positions Held with Allianz VIP and VIP FOF Trust | Term of Office(2)/ Length of Time Served | Principal Occupation(s) During Past 5 Years | Number of Portfolios Overseen for Allianz VIP and VIP FOF Trust | Other AZL Fund Complex | |||||
| Brian Muench (1970) 5701 Golden Hills Drive Minneapolis, MN 55416 | Trustee | Since 6/11 | President, Allianz Investment Management LLC, November 2010 to present; Vice President, Allianz Life, April 2011 to present | 35 | None |
42
Officers
| Name, Address, and Age | Positions Held with Allianz VIP and VIP FOF Trust | Term of Office(2)/ Length of Time Served | Principal Occupation(s) During Past 5 Years | |||
Brian Muench (1970) 5701 Golden Hills Drive Minneapolis, MN 55416 | President | Since 11/10 | President, Allianz Investment Management LLC, November 2010 to present; Vice President, Allianz Life, April 2011 to present. | |||
Michael Radmer (1945) Dorsey & Whitney LLP, Suite 1500 50 South Sixth Street Minneapolis, MN 55402-1498 | Secretary | Since 02/02 | Senior Counsel (previously, Partner), Dorsey and Whitney LLP since 1976. | |||
Bashir C. Asad (1963) Citi Fund Services Ohio, Inc. 4400 Easton Commons, Suite 200 Columbus, OH 43219 | Treasurer, Principal Accounting Officer and Principal Financial Officer | Since 06/16 | Senior Vice President, Citi Fund Services Ohio, Inc. | |||
Chris R. Pheiffer (1968) 5701 Golden Hills Drive Minneapolis, MN 55416 | Chief Compliance Officer(4) and Anti-MoneyLaundering Compliance Officer | Since 02/14 | Chief Compliance Officer of the VIP Trust and the FOF Trust, February 2014 to present; Deputy Chief Compliance Officer of the VIP Trust and the FOF Trust and Compliance Director, Allianz Life, February 2007 to February 2014. |
| (1) | Member of the Audit Committee. |
| (2) | Indefinite. |
| (3) | Is an “interested person”, as defined by the 1940 Act, due to employment by Allianz. |
| (4) | The Manager and the Trust are parties to a Chief Compliance Officer Agreement under which the Manager is compensated by the Trust for providing an employee of the Manager or one of its affiliates to act as the Trust’s Chief Compliance Officer. The Chief Compliance Officer and Anti-Money Laundering Compliance Officer is not considered a corporate officer or executive employee of the Trust. |
43
The Allianz VIP Fund of Funds are distributed by Allianz Life Financial Services, LLC. These Funds are not FDIC Insured. | ANNRPT1217 2/18 |
AZL® MVP DFA Multi-Strategy Fund
Annual Report
December 31, 2017
Management Discussion and Analysis
Page 1
Expense Examples and Portfolio Composition
Page 3
Schedule of Portfolio Investments
Page 4
Statement of Assets and Liabilities
Page 5
Page 5
Statements of Changes in Net Assets
Page 6
Page 7
Notes to the Financial Statements
Page 8
Report of Independent Registered Public Accounting Firm
Page 13
Other Federal Income Tax Information
Page 14
Page 15
Approval of Investment Advisory Agreement
Page 16
Information about the Board of Trustees and Officers
Page 18
This report is submitted for the general information of the shareholder of the Fund. The report is not authorized for distribution to prospective investors in the Fund unless preceded or accompanied by an effective prospectus, which contains details concerning the sales charges and other pertinent information.
AZL® MVP DFA Multi-Strategy Fund Review (Unaudited)
Allianz Investment Management LLC
serves as the Manager for the AZL®
MVP DFA Multi-Strategy Fund.
What factors affected the Fund’s performance for year ended December 31, 2017?
For the year ended December 31, 2017, the AZL® MVP DFA Multi-Strategy Fund (the “Fund”) returned 12.55%. That compared to a 21.83%, 3.54% and a 14.26% total return for its benchmarks, the S&P 500 Index1, the Bloomberg Barclays U.S. Aggregate Bond Index1, and the Multi-Strategy Composite Index1, respectively.
The Fund is a fund of funds that pursues broad diversification across four equity sub-portfolios and one fixed income sub-portfolio. The five underlying portfolios are managed by Dimensional Fund Advisors. Generally, the Fund allocates 50% to 70% of its assets to the underlying equity funds and between 30% and 50% to the underlying fixed-income fund. The Fund also employs the MVP (Managed Volatility Portfolio) risk management process, which is intended to adjust the risk of the portfolio based on quantitative indicators of market risk, such as the current level of fund and market volatility.*
Global economic expansion led major stock indexes to new all-time highs during the 12-month period under review. The S&P 500 Index gained 21.83% during the period, supported by a positive economic environment marked by solid jobs growth, low unemployment, increased business investment, strong consumer confidence and a low-volatility environment. Mid- and small-cap stocks also performed well during the period: The S&P MidCap 400 Index2 generated a 16.24% return and the SmallCap 600 Index3 returned 13.23%. Growth stocks were also heavily favored during the year and significantly outperformed value stocks.
International developed markets, as measured by the MSCI EAFE Index4, fared even better, and posted a 25.62% return for the period. Emerging markets equities, as measured by the MSCI Emerging Markets Equity Index5, posted an impressive return of 37.75% and thereby ended years of underperformance versus domestic and developed international markets.
The U.S. bond market was generally positive, as the market rewarded investors who took on interest rate and spread risk. The Bloomberg Barclays U.S. Aggregate Bond Index gained 3.54%. Bond investors generally tolerated risk in their quest for more attractive yields. Credit spreads on corporate bonds ended the year tighter than when the year began, with high-yield bond spreads tightening markedly. Meanwhile, the yield curve flattened sharply, as three rate hikes by the Federal Reserve sent short-term yields higher, while investor demand for attractive yield pushed long-term yields lower.
The Fund underperformed its composite benchmark during the period. Its domestic equity holdings were negatively impacted by a bias toward value stocks, which generally underperformed growth stocks. The Fund’s greater-than-benchmark exposure to small- and mid-cap stocks also detracted from relative results, as those stocks underperformed their large-cap counterparts. The Fund’s exposure to developed and emerging international equities contributed to returns relative to the composite benchmark, which has no non-U.S. equity exposure.*
Within its fixed-income portfolio, the Fund’s duration exposure was shorter than that of the Bloomberg Barclays U.S. Aggregate Bond Index. That positioning detracted from relative returns as the yield curve flattened during the year. The Fund’s high-credit-quality portfolio also negatively affected performance as spreads tightened during the year, leading to outperformance among lower-rated bonds.*
The MVP risk management process, which includes the use of derivatives, worked as intended during the period under review. Given that the period was marked by low volatility, the MVP maintained a neutral equity allocation for the year relative to its target. The MVP process detracted slightly due to mismatches between the hedging instruments used and the target equity and fixed income exposure.*
Past performance does not guarantee future results.
| * | The Fund’s portfolio composition is subject to change. There is no guarantee that any sectors mentioned will continue to perform well or that securities in such sectors will be held by the Fund in the future. The information contained in this commentary is for informational purposes only and should not be construed as a recommendation to purchase or sell securities in the sector mentioned. The Fund’s holdings and weightings are as of December 31, 2017. |
| 1 | For a complete description of the Fund’s performance benchmarks please refer to page 2 of this report. |
| 2 | The Standard & Poor’s MidCap 400 Index (“S&P 400”) is the most widely used index for mid-sized companies. The S&P 400 covers 7% of the U.S. equities market, and is part of a series of S&P U.S. indices that can be used as building blocks for portfolio composition. |
| 3 | The Standard & Poor’s SmallCap 600 Index (“S&P 600”) covers approximately 3% of the domestic equities market. Measuring the small-cap segment of the market that is typically renowned for poor trading liquidity and financial instability, the index is designed to be an efficient portfolio of companies that meet specific inclusion criteria to ensure that they are investable and financially viable. |
| 4 | The Morgan Stanley Capital International, Europe, Australasia and Far East (“MSCI EAFE”) Index is a free float-adjusted market capitalization-weighted index that is designed to measure the equity market performance of developed markets, excluding the U.S. & Canada. |
| 5 | The MSCI Emerging Markets Index (“MSCI EM”) is a free float-adjusted market capitalization index that is designed to measure equity performance of emerging markets. |
| Investors cannot invest directly in an index. |
1
AZL® MVP DFA Multi-Strategy Fund Review (Unaudited)
Fund Objective
The Fund’s investment objective is to seek long-term capital appreciation. This objective may be changed by the Trustees of the Fund without shareholder approval. The Fund seeks to achieve its objective by investing in a combination of DFA Strategy Underlying Funds that represent different classes in the Fund’s asset allocation.
Investment Concerns
The Fund invests in an underlying fund, so its investment performance is directly related to the performance of that underlying fund. Before investing, investors should assess the risks associated with and types of investments made by of the underlying fund in which the Fund invests.
Stocks are more volatile and carry more risk and return potential than other forms of investments.
Emerging market investing may be subject to additional economic, political, liquidity, and currency risks not associated with more developed countries.
International investing may involve risk of capital loss from unfavorable fluctuations in currency values, from differences in generally accepted accounting principles or from economic or political instability in other nations.
Value-based investments are subject to the risk that the broad market may not recognize their intrinsic value.
Small- to mid-capitalization companies typically have a higher risk of failure and historically have experienced a greater degree of volatility.
Debt securities held by the Fund may decline in value due to rising interest rates. Interest rates in the U.S. are at, or near, historic lows, which may increase the Fund’s exposure to risks related to rising rates.
Investing in derivatives instruments involves risks that may be different from or greater than the risk associated with investing directly in securities or other traditional instruments.
For a complete description of these and other risks associated with investing in a mutual Fund, please refer to the Fund’s prospectus.
Growth of $10,000 Investment
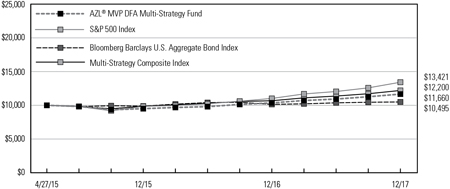
The chart above represents a comparison of a hypothetical investment in the Fund versus a similar investment in the Fund’s benchmark as well as the two component indices of the Fund’s benchmark, and represents the reinvestment of dividends and capital gains in the Fund.
Average Annual Total Returns as of December 31, 2017
| 1 Year | Since Inception (4/27/15) | |||||||
AZL® MVP DFA Multi-Strategy Fund | 12.55 | % | 5.88 | % | ||||
S&P 500 Index | 21.83 | % | 11.60 | % | ||||
Bloomberg Barclays U.S. Aggregate Bond Index | 3.54 | % | 1.82 | % | ||||
Multi-Strategy Composite Index | 14.26 | % | 7.70 | % | ||||
Past performance does not guarantee future results. The performance data quoted represents past performance and current returns may be lower or higher. The investment return and principal value will fluctuate so that an investor’s shares, when redeemed may be worth more or less than the original cost. To obtain performance information current to the most recent month end, please visit www.Allianzlife.com.
Expense Ratio | Gross | |||
AZL® MVP DFA Multi-Strategy Fund | 1.21 | % | ||
The above expense ratio is based on the current Fund prospectus dated May 1, 2017. The Manager voluntarily reduced the management fee to 0.10% on all assets. The Manager and the Fund have entered into a written contract limiting operating expenses, excluding certain expenses (such as interest expense and acquired fund fees and expenses), to 0.15% through April 30, 2019. Additional information pertaining to the December 31, 2017 expense ratios can be found in the financial highlights.
Acquired fund fees and expenses are incurred indirectly by the Fund through the valuation of the Fund’s investments in the other investment companies. Accordingly, acquired fund fees and expenses affect the Fund’s total returns. Because these fees and expenses are not included in the Fund’s financial highlights, the Fund’s total annual fund operating expenses, as shown in the current prospectus, do not correlate to the ratios of expenses to average net assets shown in the financial highlights table. Without acquired fund fees and expenses the Fund’s gross expense ratio would be 0.36%.
The total return of the Fund does not reflect the effect of any insurance charges, the annual maintenance fee or the deduction of taxes that a shareholder would pay on Fund distributions or the redemption of Fund shares. Such charges, fees and tax payments would reduce the performance quoted.
The Fund’s performance is measured against the Standard & Poor’s 500 Index (“S&P 500”), the Bloomberg Barclays U.S. Aggregate Bond Fund and the Multi-Strategy Composite Index (“Composite”). The S&P 500 is representative of 500 selected common stocks, most of which are listed on the New York Stock Exchange, and is a measure of the U.S. Stock market as a whole. The Bloomberg Barclays U.S. Aggregate Bond Index is a market value-weighted performance benchmark for investment-grade fixed-rate debt issues, including government, corporate, asset-backed, and mortgage-backed securities, with maturities of at least one year. The Composite is a blended index comprised of (60%) S&P 500 and (40%) Bloomberg Barclays U.S. Aggregate Bond Index. These indexes are unmanaged and do not reflect the deduction of fees associated with a mutual fund, such as investment management and fund accounting fees. The Fund’s performance reflects the deduction of fees for services provided to the Fund. Investors cannot invest directly in an index.
2
AZL MVP DFA Multi-Strategy Fund
Expense Examples
(Unaudited)
As a shareholder of the AZL MVP DFA Multi-Strategy Fund (the “Fund”), you incur ongoing costs, including management fees, distribution fees, and other Fund expenses. These examples are intended to help you understand your ongoing costs (in dollars) of investing in the Fund and to compare these costs with the ongoing costs of investing in other mutual funds. Please note that the expenses shown in each table do not reflect expenses that apply to the subaccount or the insurance contract. If the expenses that apply to the subaccount of the insurance contract were included, your costs would have been higher.
These examples are based on an investment of $1,000 invested at the beginning of the period and held for the periods presented below.
The Actual Expense table below provides information about actual account values and actual expenses. You may use the information below, together with the amount you invested, to estimate the expenses that you paid over the period. Simply divide your account value by $1,000 (for example, an $8,600 account value divided by $1,000 = 8.6), then multiply the result by the number in the table under the heading entitled “Expenses Paid During Period” to estimate the expenses you paid on your account during this period.
| Beginning Account Value 7/1/17 | Ending Account Value 12/31/17 | Expenses Paid During Period 7/1/17 - 12/31/17* | Annualized Expense Ratio During Period 7/1/17 - 12/31/17 | |||||||||||||||||
AZL MVP DFA Multi-Strategy Fund | $ | 1,000.00 | $ | 1,066.80 | $ | 0.78 | 0.15 | % | ||||||||||||
The Hypothetical Expense table below provides information about hypothetical account values and hypothetical expenses based on the Fund’s actual expense ratio and an assumed rate of return of 5% per year before expenses, which is not the Fund’s actual return. The hypothetical account values and expenses may not be used to estimate the actual ending account balance or expenses you paid for the period. You may use this information to compare this 5% hypothetical example with the 5% hypothetical examples that appear in the shareholder reports of other funds.
| Beginning Account Value 7/1/17 | Ending Account Value 12/31/17 | Expenses Paid During Period 7/1/17 - 12/31/17* | Annualized Expense Ratio During Period 7/1/17 - 12/31/17 | |||||||||||||||||
AZL MVP DFA Multi-Strategy Fund | $ | 1,000.00 | $ | 1,024.45 | $ | 0.77 | 0.15 | % | ||||||||||||
| * | Expenses are equal to the average account value over the period, multiplied by the Fund’s annualized expense ratio, multiplied by 184/365 (to reflect the one half year period). |
Portfolio Composition
(Unaudited)
| Investments | Percent of Net Assets | ||||
Domestic Equities | 44.7 | ||||
Fixed Income | 38.1 | ||||
International Equities | 12.0 | ||||
|
| ||||
Total Investment Securities | 94.8 | ||||
Net other assets (liabilities) | 5.2 | ||||
|
| ||||
Net Assets | 100.0 | % | |||
|
| ||||
3
AZL MVP DFA Multi-Strategy Fund
Schedule of Portfolio Investments
December 31, 2017
| Shares | Fair Value | |||||||
| Affiliated Investment Companies (94.8%): | ||||||||
| 348,926 | AZL DFA Emerging Markets Core Equity Fund | $ | 3,914,946 | |||||
| 2,951,666 | AZL DFA Five-Year Global Fixed Income Fund | 29,516,665 | ||||||
| 475,812 | AZL DFA International Core Equity Fund | 5,452,804 | ||||||
| 2,122,228 | AZL DFA U.S. Core Equity Fund | 27,079,624 | ||||||
| 622,862 | AZL DFA U.S. Small Cap Fund | 7,729,721 | ||||||
|
| |||||||
Total Affiliated Investment Companies (Cost $65,279,881) | 73,693,760 | |||||||
|
| |||||||
Total Investment Securities (Cost $65,279,881)(a) — 94.8% | 73,693,760 | |||||||
Net other assets (liabilities) — 5.2% | 4,062,809 | |||||||
|
| |||||||
Net Assets — 100.0% | $ | 77,756,569 | ||||||
|
| |||||||
Percentages indicated are based on net assets as of December 31, 2017.
| (a) | See Federal Tax Information listed in the Notes to the Financial Statements. |
Futures Contracts
Cash of $3,876,383 has been segregated to cover margin requirements for the following open contracts as of December 31, 2017:
Long Futures
| Description | Expiration Date | Number of Contracts | Notional Amount | Unrealized Appreciation/ (Depreciation) | ||||||||||||
S&P 500 Index E-Mini March Futures (U.S. Dollar) | 3/19/18 | 17 | $ | 2,274,600 | $ | 37,463 | ||||||||||
U.S. Treasury 10-Year Note March Futures (U.S. Dollar) | 3/21/18 | 12 | 1,488,563 | (8,265 | ) | |||||||||||
|
| |||||||||||||||
| $ | 29,198 | |||||||||||||||
|
| |||||||||||||||
See accompanying notes to the financial statements.
4
AZL MVP DFA Multi-Strategy Fund
Statement of Assets and Liabilities
December 31, 2017
Assets: | |||||
Investments in affiliates, at cost | $ | 65,279,881 | |||
|
| ||||
Investments in affiliates, at value | $ | 73,693,760 | |||
Segregated cash for collateral | 3,876,383 | ||||
Interest and dividends receivable | 3,610 | ||||
Receivable for capital shares issued | 195,454 | ||||
Receivable for affiliated investments sold | 53,948 | ||||
Prepaid expenses | 437 | ||||
|
| ||||
Total Assets | 77,823,592 | ||||
|
| ||||
Liabilities: | |||||
Cash overdraft | 53,948 | ||||
Manager fees payable | 5,935 | ||||
Administration fees payable | 3,518 | ||||
Custodian fees payable | 352 | ||||
Administrative and compliance services fees payable | 186 | ||||
Transfer agent fees payable | 682 | ||||
Trustee fees payable | 120 | ||||
Other accrued liabilities | 2,282 | ||||
|
| ||||
Total Liabilities | 67,023 | ||||
|
| ||||
Net Assets | $ | 77,756,569 | |||
|
| ||||
Net Assets Consist of: | |||||
Capital | $ | 67,666,311 | |||
Accumulated net investment income/(loss) | 670,948 | ||||
Accumulated net realized gains/(losses) from investment transactions | 976,233 | ||||
Net unrealized appreciation/(depreciation) on investments | 8,443,077 | ||||
|
| ||||
Net Assets | $ | 77,756,569 | |||
|
| ||||
Shares of beneficial interest (unlimited number of shares authorized, no par value) | 6,704,698 | ||||
Net Asset Value (offering and redemption price per share) | $ | 11.60 | |||
|
|
For the Year Ended December 31, 2017
Investment Income: | |||||
Dividends from affiliates | $ | 696,766 | |||
Interest | 28,922 | ||||
Dividends | 737 | ||||
Other income | 130 | ||||
|
| ||||
Total Investment Income | 726,555 | ||||
|
| ||||
Expenses: | |||||
Manager fees | 131,324 | ||||
Administration fees | 47,352 | ||||
Custodian fees | 2,112 | ||||
Administrative and compliance services fees | 808 | ||||
Transfer agent fees | 4,635 | ||||
Trustee fees | 2,766 | ||||
Professional fees | 3,122 | ||||
Shareholder reports | 1,952 | ||||
Other expenses | 718 | ||||
|
| ||||
Total expenses before reductions | 194,789 | ||||
Less expenses voluntarily waived/reimbursed by the Manager | (65,661 | ) | |||
Less expense contractually waived/reimbursed by the Manager | (30,855 | ) | |||
|
| ||||
Net expenses | 98,273 | ||||
|
| ||||
Net Investment Income/(Loss) | 628,282 | ||||
|
| ||||
Realized and Unrealized Gains/(Losses) on Investments: | |||||
Net realized gains/(losses) on securities transactions from affiliates | 761,545 | ||||
Net realized gains distributions from affiliated underlying funds | 155,576 | ||||
Net realized gains/(losses) on futures contracts | 334,873 | ||||
Change in net unrealized appreciation/depreciation on affiliated transactions | 5,859,903 | ||||
Change in net unrealized appreciation/depreciation on futures contracts | 32,625 | ||||
|
| ||||
Net Realized/Unrealized Gains/(Losses) on Investments | 7,144,522 | ||||
|
| ||||
Change in Net Assets Resulting From Operations | $ | 7,772,804 | |||
|
|
See accompanying notes to the financial statements.
5
AZL MVP DFA Multi-Strategy Fund
Statements of Changes in Net Assets
| For the Year Ended December 31, 2017 | For the Year Ended December 31, 2016 | |||||||||
Change In Net Assets: | ||||||||||
Operations: | ||||||||||
Net investment income/(loss) | $ | 628,282 | $ | 270,935 | ||||||
Net realized gains/(losses) on investment transactions | 1,251,994 | (97,307 | ) | |||||||
Change in unrealized appreciation/depreciation on investments | 5,892,528 | 3,344,944 | ||||||||
|
|
|
| |||||||
Change in net assets resulting from operations | 7,772,804 | 3,518,572 | ||||||||
|
|
|
| |||||||
Distributions to Shareholders: | ||||||||||
From net investment income | (277,996 | ) | — | |||||||
From net realized gains | (69,214 | ) | — | |||||||
|
|
|
| |||||||
Change in net assets resulting from distributions to shareholders | (347,210 | ) | — | |||||||
|
|
|
| |||||||
Capital Transactions: | ||||||||||
Proceeds from shares issued | 26,450,692 | 29,807,859 | ||||||||
Proceeds from dividends reinvested | 347,210 | — | ||||||||
Value of shares redeemed | (9,792,574 | ) | (6,088,076 | ) | ||||||
|
|
|
| |||||||
Change in net assets resulting from capital transactions | 17,005,328 | 23,719,783 | ||||||||
|
|
|
| |||||||
Change in net assets | 24,430,922 | 27,238,355 | ||||||||
Net Assets: | ||||||||||
Beginning of period | 53,325,647 | 26,087,292 | ||||||||
|
|
|
| |||||||
End of period | $ | 77,756,569 | $ | 53,325,647 | ||||||
|
|
|
| |||||||
Accumulated net investment income/(loss) | $ | 670,948 | $ | 277,991 | ||||||
|
|
|
| |||||||
Share Transactions: | ||||||||||
Shares issued | 2,416,058 | 3,032,018 | ||||||||
Dividends reinvested | 31,168 | — | ||||||||
Shares redeemed | (891,700 | ) | (628,886 | ) | ||||||
|
|
|
| |||||||
Change in shares | 1,555,526 | 2,403,132 | ||||||||
|
|
|
| |||||||
See accompanying notes to the financial statements.
6
AZL MVP DFA Multi-Strategy Fund
(Selected data for a share of beneficial interest outstanding throughout the periods indicated)
| Year Ended December 31, 2017 | Year Ended December 31, 2016 | April 27, 2015 to December 31, 2015(a) | |||||||||||||
Net Asset Value, Beginning of Period | $ | 10.36 | $ | 9.50 | $ | 10.00 | |||||||||
|
|
|
|
|
| ||||||||||
Investment Activities: | |||||||||||||||
Net Investment Income/(Loss) | 0.09 | 0.05 | (0.01 | ) | |||||||||||
Net Realized and Unrealized Gains/(Losses) on Investments | 1.21 | 0.81 | (0.49 | ) | |||||||||||
|
|
|
|
|
| ||||||||||
Total from Investment Activities | 1.30 | 0.86 | (0.50 | ) | |||||||||||
|
|
|
|
|
| ||||||||||
Dividends to Shareholders From: | |||||||||||||||
Net Investment Income | (0.05 | ) | — | — | |||||||||||
Net Realized Gains | (0.01 | ) | — | — | |||||||||||
|
|
|
|
|
| ||||||||||
Total Dividends | (0.06 | ) | — | — | |||||||||||
|
|
|
|
|
| ||||||||||
Net Asset Value, End of Period | $ | 11.60 | $ | 10.36 | $ | 9.50 | |||||||||
|
|
|
|
|
| ||||||||||
Total Return(b) | 12.55 | % | 9.05 | % | (5.00 | )%(c) | |||||||||
Ratios to Average Net Assets/Supplemental Data: | |||||||||||||||
Net Assets, End of Period (000’s) | $ | 77,757 | $ | 53,326 | $ | 26,087 | |||||||||
Net Investment Income/(Loss)(d) | 0.96 | % | 0.71 | % | (0.14 | )% | |||||||||
Expenses Before Reductions*(d)(e) | 0.30 | % | 0.36 | % | 0.52 | % | |||||||||
Expenses Net of Reductions*(d) | 0.15 | % | 0.15 | % | 0.14 | % | |||||||||
Portfolio Turnover Rate | 15 | % | 15 | % | 2 | %(c) | |||||||||
| * | The expense ratios exclude the impact of fees/expenses paid by each underlying fund. |
| (a) | For the period April 27, 2015 (commencement of operations) to December 31, 2015. |
| (b) | The returns include reinvested dividends and fund level expenses, but exclude insurance contract charges. If these charges were included, the returns would have been lower. |
| (c) | Not annualized for periods less than one year. |
| (d) | Annualized for periods less than one year. |
| (e) | Excludes fee reductions. If such fee reductions had not occurred, the ratios would have been as indicated. |
See accompanying notes to the financial statements.
7
AZL MVP DFA Multi-Strategy Fund
Notes to the Financial Statements
December 31, 2017
1. Organization
The Allianz Variable Insurance Products Fund of Funds Trust (the “Trust”) was organized as a Delaware statutory trust on June 16, 2004. The Trust is a diversified open-end management investment company registered under the Investment Company Act of 1940, as amended, (the “1940 Act”) and thus is determined to be an investment company for accounting purposes. The Trust consists of 12 separate investment portfolios (collectively, the “Funds”), of which one is included in this report, the AZL MVP DFA Multi-Strategy Fund (the “Fund”), and 11 are presented in separate reports.
The Fund is a “fund of funds,” which means that the Fund invests primarily in other mutual funds. Underlying Funds invest in stock, bonds, and other securities and reflect varying amounts of potential investment risk and reward. The Underlying Funds record their investments at fair value. Periodically, the Fund will adjust its asset allocation as it seeks to achieve its investment objective.
The Trust is authorized to issue an unlimited number of shares of the Fund without par value. Shares of the Fund are available through the variable annuity contracts offered through the separate accounts of participating insurance companies. Currently, the Fund only offers its shares to separate accounts of Allianz Life Insurance Company of North America and Allianz Life Insurance Company of New York, affiliates of the Trust and the Manager, as defined below.
Under the Trust’s organizational documents, its officers and trustees are indemnified against certain liabilities arising out of the performance of their duties to the Fund. In addition, in the normal course of business, the Fund may enter into contracts with its vendors and others that provide for general indemnifications. The Fund’s maximum exposure under these arrangements is unknown, as this would involve future claims that may be made against the Fund. However, based on experience, the Fund expects that risk of loss to be remote.
2. Significant Accounting Policies
The following is a summary of significant accounting policies followed by the Fund in the preparation of its financial statements. The policies conform with U.S. generally accepted accounting principles (“U.S. GAAP”). The preparation of financial statements requires management to make certain estimates and assumptions that affect the reported amounts of assets and liabilities and disclosure of contingent assets and liabilities at the date of the financial statements and the reported amounts of increases and decreases in net assets from operations during the reporting period. Actual results could differ from those estimates.
Security Valuation
The Fund records its investments at fair value. Fair value is defined as the price that would be received to sell an asset or paid to transfer a liability in an orderly transaction between willing market participants at the measurement date. The valuation techniques used to determine fair value are further described in Note 4 below.
Investment Transactions and Investment Income
Investment transactions are accounted for on trade date. Net realized gains and losses on investments sold and on foreign currency transactions are recorded on the basis of identified cost. Interest income is recorded on the accrual basis and includes, where applicable, the amortization of premiums or accretion of discounts.
Dividends to Shareholders
Dividends to shareholders are recorded on the ex-dividend date. The Fund distributes its dividends from net investment income and net realized capital gains, if any, on an annual basis. The amount of dividends from net investment income and from net realized gains is determined in accordance with federal income tax regulations, which may differ from U.S. GAAP. These “book/tax” differences are either temporary or permanent in nature. To the extent these differences are permanent in nature (e.g., miscellaneous adjustments on return of capital), such amounts are reclassified within the composition of net assets based on their federal tax-basis treatment; temporary differences (e.g., wash sales and differing treatment on certain investments) do not require reclassification. Dividends to shareholders that exceed net investment income and net realized gains for tax purposes are reported as distributions of capital.
Expense Allocation
Expenses directly attributable to the Fund are charged directly to the Fund, while expenses attributable to more than one Fund are allocated among the respective Funds based upon relative net assets or some other reasonable method. Expenses which are attributable to more than one Trust are allocated across the Allianz Variable Insurance Products and Allianz Variable Insurance Products Fund of Funds Trusts based upon relative net assets or another reasonable basis. Allianz Investment Management LLC (the “Manager”), serves as the investment manager for the Trust and the Allianz Variable Insurance Products Trust.
Derivative Instruments
All open derivative positions at period end are reflected on the Fund’s Schedule of Portfolio Investments. The following is a description of the derivative instruments utilized by the Fund, including the primary underlying risk exposures related to each instrument type. The Fund’s allocation to the MVP (Managed Volatility Portfolio) risk management process may include (a) derivatives such as index futures, other futures contracts, options, and other similar securities and (b) cash, money market equivalents, short-term debt instruments, money market funds, and short-term debt funds to satisfy all applicable margin requirements and to provide additional portfolio liquidity to satisfy large redemptions and any margin calls. Due to the leverage provided by derivatives, the notional value of the Fund’s derivative positions could exceed 20% of the Fund’s value. The Fund may also use futures to gain equity exposure and may hold cash as a buffer in the event of market shocks.
Futures Contracts
During the year ended December 31, 2017, the Fund invested in futures contracts to reduce volatility and limit the need to decrease or increase allocations to underlying funds. Upon entering into a futures contract, the Fund is required to segregate liquid assets in accordance with the initial margin requirements of the broker or exchange. Futures contracts
8
AZL MVP DFA Multi-Strategy Fund
Notes to the Financial Statements
December 31, 2017
are marked to market daily and a payable or receivable for the change in value (“variation margin”) is recorded by the Fund. Gains or losses are recognized but not considered realized until the contracts expire or are closed. Futures contracts involve, to varying degrees, elements of market risk (generally equity price risk related to stock futures, interest rate risk related to bond futures, and foreign currency risk related to currency futures) and exposure to loss in excess of the variation margin disclosed in the Statement of Assets and Liabilities. The primary risks associated with the use of futures contracts are the imperfect correlation between the change in fair value of the underlying securities and the prices of futures contracts, the possibility of an illiquid market, and the inability of the counterparty to meet the terms of the contract. For the year ended December 31, 2017, the monthly average notional amount for long contracts was $3.4 million. Realized gains and losses are reported as “Net realized gains/(losses) on futures contracts” on the Statement of Operations.
Summary of Derivative Instruments
The following is a summary of the fair values of derivative instruments on the Fund’s Statement of Assets and Liabilities, categorized by risk exposure, as of December 31, 2017:
Asset Derivative | Liability Derivative | |||||||||||
| Primary Risk Exposure | Statement of Assets and Liabilities Location | Total Fair Value* | Statement of Assets and Liabilities Location | Total Fair Value* | ||||||||
Equity Risk | ||||||||||||
| Equity Contracts | Receivable for variation margin on futures contracts | $ | 37,463 | Payable for variation margin on futures contracts | $ | — | ||||||
Interest Rate Risk | ||||||||||||
| Interest Rate Contracts | — | 8,265 | ||||||||||
| * | For futures contracts, the amounts represent the cumulative appreciation/depreciation of these futures contracts as reported in the Schedule of Portfolio Investments. Only current day’s variation margin is reported within the Statement of Assets and Liabilities as variation margin on futures contracts. |
The following is a summary of the effect of derivative instruments on the Statement of Operations, categorized by risk exposure, for the year ended December 31, 2017:
| Primary Risk Exposure | Location of Gains/(Losses) on Derivatives Recognized | Realized Gains/(Losses) on Derivatives Recognized | Change in Net Unrealized Appreciation/Depreciation on Derivatives Recognized | |||||||
Equity Risk | ||||||||||
| Equity Contracts | Net Realized gains/(losses) on futures contracts/Change in net unrealized appreciation/depreciation on futures contracts | $ | 324,859 | $ | 35,036 | |||||
Interest Rate Risk | ||||||||||
| Interest Rate Contracts | 10,014 | (2,411 | ) | |||||||
3. Fees and Transactions with Affiliates and Other Parties
The Manager provides investment advisory and management services for the Fund. The Manager has contractually agreed to waive fees and reimburse the Fund to limit the annual expenses, excluding interest expense (e.g., cash overdraft fees), taxes, brokerage commissions, acquired fund fees and expenses, other expenditures that are capitalized in accordance with U.S. GAAP and other extraordinary expenses not incurred in the ordinary course of the Fund’s business, based on the daily net assets of the Fund, through April 30, 2019. Expenses incurred for investment advisory and management services are reflected on the Statement of Operations as “Manager fees.”
For the year ended December 31, 2017, the annual rate paid to the Manager and the annual expense limit were as follows:
| Annual Rate* | Annual Expense Limit | |||||||||
AZL MVP DFA Multi-Strategy Fund | 0.20 | % | 0.15 | % | ||||||
| * | The Manager voluntarily reduced the management fee to 0.10% on all assets. The manager reserves the right to increase the management fee to the amount shown in the table at any time after April 30, 2019. |
Any amounts contractually waived or reimbursed by the Manager in a particular fiscal year will be subject to repayment by the Fund to the Manager to the extent that from time to time through the next three fiscal years the repayment will not cause the Fund’s expenses to exceed the lesser of the stated limit at the time of the waiver or the current stated limit. Any amounts recouped by the Manager during the year are reflected on the Statement of Operations as “Recoupment of prior expenses reimbursed by the Manager.”
At December 31, 2017, the contractual reimbursements subject to repayment by the Fund in subsequent years were as follows:
Expires 12/31/2018 | Expires 12/31/2019 | Expires 12/31/2020 | Total | |||||||||||||||||
AZL MVP DFA Multi-Strategy Fund | $ | 32,620 | $ | 31,356 | $ | 30,855 | $ | 94,831 | ||||||||||||
In addition, the Manager may voluntarily waive or reimburse additional fees in order to maintain more competitive expense ratios. Any voluntary waivers or reimbursements are not subject to repayment in subsequent years. Information on the total amount waived/reimbursed by the Manager or repaid to the Manager by the Fund during the period can be found on the Statement of Operations.
9
AZL MVP DFA Multi-Strategy Fund
Notes to the Financial Statements
December 31, 2017
The Manager or an affiliate of the Manager serves as the investment adviser of certain underlying funds in which the Fund invests. At December 31, 2017, these underlying funds are noted as Affiliated Investment Companies in the Fund’s Schedule of Portfolio Investments. Additional information, including financial statements, about these Funds is available at www.allianzlife.com. The Manager or an affiliate of the Manager is paid a separate fee from the underlying funds for such services. A summary of the Fund’s investments in affiliated investment companies for the year ended December 31, 2017 is as follows:
Fair Value 12/31/16 | Purchases at Cost | Proceeds from Sales | Net Gains/(Losses) | Net Change in Appreciation/ | Fair Value 12/31/17 | Shares as of 12/31/2017 | Dividend Income | Net realized gains distributions from affiliated underlying funds | |||||||||||||||||||||||||||||||||||||
AZL DFA Emerging Markets Core Equity Fund | $ | 2,696,219 | $ | 961,947 | $ | (677,430 | ) | $ | 60,630 | $ | 873,580 | $ | 3,914,946 | 348,926 | $ | 35,061 | $ | (378 | ) | ||||||||||||||||||||||||||
AZL DFA Five-Year Global Fixed Income Fund | 20,281,404 | 12,144,516 | (2,965,225 | ) | (25,581 | ) | 81,551 | 29,516,665 | 2,951,666 | 292,300 | 3,834 | ||||||||||||||||||||||||||||||||||
AZL DFA International Core Equity Fund | 3,733,344 | 1,472,783 | (743,343 | ) | 42,800 | 947,220 | 5,452,804 | 475,812 | 60,844 | — | |||||||||||||||||||||||||||||||||||
AZL DFA U.S. Core Equity Fund | 18,526,385 | 7,844,408 | (3,327,987 | ) | 449,322 | 3,587,496 | 27,079,624 | 2,122,228 | 270,241 | 49,796 | |||||||||||||||||||||||||||||||||||
AZL DFA U.S. Small Cap Fund | 5,264,616 | 3,459,575 | (1,598,900 | ) | 234,374 | 370,056 | 7,729,721 | 622,862 | 38,320 | 102,324 | |||||||||||||||||||||||||||||||||||
|
|
|
|
|
|
|
|
|
|
|
|
|
|
|
|
|
| ||||||||||||||||||||||||||||
| $ | 50,501,968 | $ | 25,883,229 | $ | (9,312,885 | ) | $ | 761,545 | $ | 5,859,903 | $ | 73,693,760 | 6,521,494 | $ | 696,766 | $ | 155,576 | ||||||||||||||||||||||||||||
|
|
|
|
|
|
|
|
|
|
|
|
|
|
|
|
|
| ||||||||||||||||||||||||||||
Pursuant to separate agreements between the Funds and the Manager, the Manager provides a Chief Compliance Officer (“CCO”) and certain compliance oversight and regulatory filing services to the Trust. Under these agreements the Manager is entitled to an amount equal to a portion of the compensation and certain other expenses related to the individuals performing the CCO and compliance oversight services, as well as $100 per hour for time incurred in connection with the preparation and filing of certain documents with the Securities and Exchange Commission (“SEC” or the “Commission”). The fees are paid to the Manager on a quarterly basis. The total expenses incurred by the Fund for these services are reflected on the Statement of Operations as “Administrative and compliance services fees.”
Citi Fund Services Ohio, Inc. (“Citi” or the “Administrator”), a wholly owned subsidiary of Citigroup, Inc., with which an officer of the Trust is affiliated, serves as the Trust’s administrator and fund accountant, and assists the Trust in all aspects of its administration and operation. The Administrator is entitled to a fee, accrued daily and paid monthly. The Administrator is entitled to an annual fee for each additional class of shares of any Fund, certain annual fees in supporting fair values services, and a Trust-wide annual fee for providing infrastructure and support in implementing the written policies and procedures comprising the Fund’s compliance program. The Administrator is also reimbursed for certain expenses incurred. The total expenses incurred by the Fund for these services are reflected on the Statement of Operations as “Administration fees.”
FIS Investor Services LLC (“FIS”) serves as the Fund’s transfer agent. Under the Transfer Agent Agreement, the Trust pays FIS a fee for its services and reimburses FIS for all of their reasonable out-of-pocket expenses incurred in providing these services.
The Bank of New York Mellon (“BNY Mellon” or the “Custodian”) serves as the Trust’s custodian and securities lending agent. For these services as custodian, the Funds pay BNY Mellon a fee based on a percentage of assets held on behalf of the Funds, plus certain out-of-pocket charges.
Allianz Life Financial Services, LLC (“ALFS”), an affiliate of the Manager, serves as distributor of the Fund. ALFS receives an annual Trust-wide annual fee of $7,500, paid by the Manager from its profits and not by the Trust, for recordkeeping and reporting services.
In addition, certain legal fees and expenses are paid to a law firm, Dorsey & Whitney LLP, of which the Secretary of the Fund is Senior Counsel. During the year ended December 31, 2017, $655 was paid from the Fund relating to these fees and expenses.
Certain Officers and Trustees of the Trust are affiliated with the Manager or the Administrator. Such Officers (except for the Trust’s CCO as noted above) and Trustees receive no compensation from the Trust for serving in their respective roles. For their service to the Trust and to the Allianz Variable Insurance Products Trust, each non-interested Trustee receives a $170,000 annual Board retainer, the Lead Director receives an additional $42,500 annually and the Chair of the Nominating and Corporate Governance Committee receives an additional $25,500 annually. In addition, the Trustees are reimbursed for certain expenses associated with attending Board meetings. Compensation to the Trustees is allocated between the Trust and the Allianz Variable Insurance Products Trust in proportion to the assets under management of each trust. During the year ended December 31, 2017, actual Trustee compensation was $1,116,333 in total for both trusts.
4. Investment Valuation Summary
The valuation techniques employed by the Fund, as described below, maximize the use of observable inputs and minimize the use of unobservable inputs in determining fair value. The inputs used for valuing the Fund’s investments are summarized in the three broad levels listed below:
| ● | Level 1 — quoted prices in active markets for identical assets |
| ● | Level 2 — other significant observable inputs (including quoted prices for similar securities, interest rates, prepayments speeds, credit risk, etc.) |
| ● | Level 3 — significant unobservable inputs (including the Fund’s own assumptions in determining the fair value of investments) |
Changes in valuation techniques may result in transfers in or out of an assigned level within the disclosure hierarchy. The Fund determines transfers between fair value hierarchy levels at the reporting period end. The inputs or methodology used for valuing investments is not necessarily an indication of the risk associated with investing in those investments.
Investments in other investment companies are valued at their published net asset value (“NAV”). Security prices are generally provided by an independent third party pricing service approved by the Trust’s Board of Trustees (the “Board” or “Trustees”) as of the close of the New York Stock Exchange (“NYSE”) (generally 4:00 pm Eastern Time). The
10
AZL MVP DFA Multi-Strategy Fund
Notes to the Financial Statements
December 31, 2017
investments utilizing Level 1 valuations represent investments in open-end investment companies. Futures contracts are valued at the last sales price as of the close of the primary exchange and are typically categorized as Level 1 in the fair value hierarchy.
For the year ended December 31, 2017, there were no Level 3 investments for which significant unobservable inputs were used to determine fair value. There were no significant transfers between Levels 1 and 2 as of December 31, 2017, based on levels assigned to securities on December 31, 2016.
The following is a summary of the valuation inputs used as of December 31, 2017 in valuing the Fund’s investments based upon the three levels defined above:
| Investment Securities: | Level 1 | Level 2 | Level 3 | Total | ||||||||||||||||
Affiliated Investment Companies | $ | 73,693,760 | $ | — | $ | — | $ | 73,693,760 | ||||||||||||
|
|
|
|
|
|
|
| |||||||||||||
Total Investment Securities | 73,693,760 | — | — | 73,693,760 | ||||||||||||||||
|
|
|
|
|
|
|
| |||||||||||||
Other Financial Instruments:* | ||||||||||||||||||||
Futures Contracts | 29,198 | — | — | 29,198 | ||||||||||||||||
|
|
|
|
|
|
|
| |||||||||||||
Total Investments | $ | 73,722,958 | $ | — | $ | — | $ | 73,722,958 | ||||||||||||
|
|
|
|
|
|
|
| |||||||||||||
| * | Other Financial Instruments would include any derivative instruments, such as futures contracts. These investments are generally presented in the financial statements at variation margin. |
5. Security Purchases and Sales
For the year ended December 31, 2017, cost of purchases and proceeds from sales of securities (excluding securities maturing less than one year from acquisition) were as follows:
| Purchases | Sales | |||||||||
AZL MVP DFA Multi-Strategy Fund | $ | 25,883,229 | $ | 9,312,885 | ||||||
6. Investment Risks
Derivatives Risk: The Fund may invest directly or through affiliated or unaffiliated mutual funds or unregistered investment pools in derivative instruments such as futures, options, and options on futures. A derivative is a financial contract whose value depends on, or is derived from, the value of an underlying asset, reference rate, or risk. Use of derivative instruments involves risks different from, or possibly greater than, the risks associated with investing directly in securities and other traditional investments. Derivatives are subject to a number of other risks, such as liquidity risk, interest rate risk, market risk, credit risk, and selection risk. Derivatives also involve the risk of mispricing or improper valuation and the risk that changes in the value may not correlate perfectly with the underlying asset, rate, or index. Using derivatives may result in losses, possibly in excess of the principal amount invested. Also, suitable derivative transactions may not be available in all circumstances. The other party to a derivatives contract could default.
Fund of Funds Risk: The Fund, as a shareholder of the underlying funds, indirectly bears its proportionate share of any investment management fees and other expenses of the underlying funds. Further due to the fees and expenses paid by the Fund, as well as small variations in the Fund’s actual allocations to the underlying funds and any futures and cash held in the Fund’s portfolio, the performance and income distributions of the Fund will not be the same as the performance and income distributions of the underlying funds.
7. Federal Tax Information
It is the policy of the Fund to continue to qualify as a regulated investment company by complying with the provisions available to certain investment companies, as defined under Subchapter M of the Internal Revenue Code, and to make distributions of net investment income and net realized gains sufficient to relieve it from all, or substantially all, federal income taxes. Accordingly, no provisions for federal income taxes are required in the financial statements.
Management of the Fund has reviewed tax positions taken in tax years that remain subject to examination by all major tax jurisdictions, including federal (i.e., the last four tax year ends and the interim tax period since then, as applicable). Management believes that there is no tax liability resulting from unrecognized tax benefits related to uncertain tax positions taken.
Cost of securities, including derivatives and short positions as applicable, for federal income tax purposes at December 31, 2017 is $65,535,426. The gross unrealized appreciation/(depreciation) on a tax basis is as follows:
Unrealized appreciation | $ | 8,193,501 | ||
Unrealized (depreciation) | (35,167 | ) | ||
|
| |||
Net unrealized appreciation/(depreciation) | $ | 8,158,334 | ||
|
|
The tax character of dividends paid to shareholders during the year ended December 31, 2017 were as follows:
| Ordinary Income | Net Long-Term | Total Distributions(a) | |||||||||||||
AZL MVP DFA Multi-Strategy Fund | $ | 307,441 | $ | 39,769 | $ | 347,210 | |||||||||
| (a) | Total distributions paid may differ from the Statements of Changes in Net Assets because dividends are recognized when actually paid for tax purposes. |
11
AZL MVP DFA Multi-Strategy Fund
Notes to the Financial Statements
December 31, 2017
At December 31, 2017, the components of accumulated earnings on a tax basis were as follows:
| Undistributed Ordinary Income | Undistributed Long-Term Capital Gains | Accumulated Capital and Other Losses | Unrealized Appreciation/ Depreciation(a) | Total Accumulated Earnings/ (Deficit) | |||||||||||||||||||||
AZL MVP DFA Multi-Strategy Fund | $ | 817,564 | $ | 1,114,360 | $ | — | $ | 8,158,334 | $ | 10,090,258 | |||||||||||||||
| (a) | The difference between book-basis and tax-basis unrealized appreciation/depreciation is attributable primarily to tax deferral of losses on wash sales. |
8. Ownership and Principal Holders
The beneficial ownership, either directly or indirectly, of more than 25% of the voting securities of a fund creates presumptions of control of the fund, under section 2 (a)(9) of the 1940 Act. As of December 31, 2017, the Fund had an individual shareholder account which is affiliated with the Investment Adviser representing ownership in excess of 90% of the Fund.
9. Investment Company Reporting Modernization
In October 2016, the SEC released its Final Rule on Investment Company Reporting Modernization (the “Rules”). The Rules which introduce two new regulatory reporting forms for investment companies — Form N-PORT and Form N-CEN — also contain amendments to Regulation S-X which require standardized, enhanced disclosures about derivatives in investment company financial statements, as well as other amendments. The amendments to Regulation S-X became effective for filings made with the SEC after August 1, 2017. The compliance date for form N- PORT and Form N-CEN will vary based on the reporting entity’s size and, in the case of the Fund, is expected to be April 30, 2019. The Fund’s adoption of these amendments, as applicable for the financial statements prepared as of December 31, 2017, had no effect on the Fund’s net assets or results of operations.
10. Subsequent Events
Management of the Fund has evaluated the need for additional disclosures or adjustments resulting from events through the date the financial statements were issued. Based on this evaluation, there were no subsequent events to report that would have material impact on the Fund’s financial statements.
12
REPORT OF INDEPENDENT REGISTERED PUBLIC ACCOUNTING FIRM
To Shareholders and Board of Trustees of
Allianz Variable Insurance Products Fund of Funds Trust:
Opinion on the Financial Statements
We have audited the accompanying statement of assets and liabilities of AZL MVP DFA Multi-Strategy Fund (the “Fund”) of the Allianz Variable Insurance Products Fund of Funds Trust, including the schedule of portfolio investments, as of December 31, 2017, and the related statement of operations for the year then ended, the statements of changes in net assets for each of the years in the two-year period then ended, and the related notes (collectively, the “financial statements”) and the financial highlights for each of the years in the two-year period then ended and the from period April 27, 2015 (commencement of operations) to December 31, 2015. In our opinion, the financial statements present fairly, in all material respects, the financial position of the Fund as of December 31, 2017, the results of its operations for the year then ended, the changes in its net assets for each of the years in the two-year period then ended, and the financial highlights for each of the years in the two-year period then ended and the period from April 27, 2015 to December 31, 2015, in conformity with U.S. generally accepted accounting principles.
Basis for Opinion
These financial statements and financial highlights are the responsibility of the Fund’s management. Our responsibility is to express an opinion on these financial statements and financial highlights based on our audits. We are a public accounting firm registered with the Public Company Accounting Oversight Board (United States) (“PCAOB”) and are required to be independent with respect to the Fund in accordance with the U.S. federal securities laws and the applicable rules and regulations of the Securities and Exchange Commission and the PCAOB.
We conducted our audits in accordance with the standards of the PCAOB. Those standards require that we plan and perform the audit to obtain reasonable assurance about whether the financial statements and financial highlights are free of material misstatement, whether due to error or fraud. Our audits included performing procedures to assess the risks of material misstatement of the financial statements and financial highlights, whether due to error or fraud, and performing procedures that respond to those risks. Such procedures included examining, on a test basis, evidence regarding the amounts and disclosures in the financial statements and financial highlights. Such procedures also included confirmation of securities owned as of December 31, 2017, by correspondence with brokers and transfer agents of the underlying funds. Our audits also included evaluating the accounting principles used and significant estimates made by management, as well as evaluating the overall presentation of the financial statements and financial highlights. We believe that our audits provide a reasonable basis for our opinion.
/s/ KPMG LLP
We have served as the auditor of one or more Allianz Variable Insurance Products investment companies since 1999.
Columbus, Ohio
February 23, 2018
13
Other Federal Income Tax Information (Unaudited)
For the year ended December 31, 2017, 51.92% of the total ordinary income dividends paid by the Fund qualify for the corporate dividends received deduction available to corporate shareholders.
During the year ended December 31, 2017, the Fund declared net short-term capital gain distributions of $29,444.
During the year ended December 31, 2017, the Fund declared net long-term capital gain distributions of $39,769
14
A description of the policies and procedures that the Fund uses to determine how to vote proxies relating to portfolio securities is available, without charge, upon request, by visiting the Securities and Exchange Commission’s (“Commission”) website at www.sec.gov, or by calling 800-624-0197.
Information regarding how the Fund voted proxies relating to portfolio securities during the most recent 12-month period ended June 30th is available (i) without charge, upon request, by calling 800-624-0197; (ii) on the Allianz Variable Insurance Products Trust’s website at https://www.allianzlife.com; and (iii) on the Commission’s website at http://www.sec.gov.
The Fund files complete Schedules of Portfolio Holdings with the Commission for the first and third quarters of each fiscal year on Form N-Q. Schedules of Portfolio Holdings for the Fund in this report are available without charge on the Commission’s website at http://www.sec.gov, or may be reviewed and copied at the Commission’s Public Reference Room in Washington, D.C. Information on the operation of the Public Reference Room may be obtained by calling 800-SEC-0330.
15
Approval of Investment Advisory Agreement (Unaudited)
Subject to the general supervision of the Board of Trustees (the “Board”) and in accordance with the investment objectives and restrictions of each separate series (together, the “Funds”) of the Allianz Variable Insurance Products Fund of Funds Trust (the “Trust”), investment advisory services are provided to the Funds by Allianz Investment Management LLC (the “Manager”). As used in this section, “Fund” refers to any of the Funds. The Manager manages each Fund pursuant to an investment management agreement (the “Management Agreement”) with the Trust in respect of each such Fund. The Management Agreement provides that the Manager, subject to the supervision and approval of the Board, is responsible for the management of each Fund. For management services, each Fund pays the Manager an investment advisory fee based upon each Fund’s average daily net assets. The Manager has contractually agreed to limit the expenses of each Fund by reimbursing the Fund if and when total Fund operating expenses exceed certain amounts until at least May 1, 2019 (the “Expense Limitation Agreement”).
In reviewing the services provided by the Manager and the terms of the Management Agreement, the Board receives and reviews information related to the Manager’s experience and expertise in the variable insurance marketplace. Currently, the Funds are offered only through variable annuities and variable life insurance policies, and not in the retail fund market. In addition, the Board receives information regarding the Manager’s expertise with regard to portfolio diversification and asset allocation requirements within variable insurance products issued by Allianz Life Insurance Company of North America (“Allianz Life”) and its subsidiary, Allianz Life Insurance Company of New York (“Allianz of New York”). Currently, the Funds are offered only through Allianz Life and Allianz of New York variable products.
As required by the Investment Company Act of 1940 (the “1940 Act”), the Board has reviewed and approved the Management Agreement with the Manager. The Board’s decision to approve this contract reflects the exercise of its business judgment on whether to approve new arrangements and continue the existing arrangements. During its review of the contract, the Board considered many factors, among the most material of which are: the Fund’s investment objectives and long-term performance; the Manager’s management philosophy, personnel, processes and investment performance, including its compliance history and the adequacy of its compliance processes; the preferences and expectations of Fund shareholders (and underlying contract owners) and their relative sophistication; the continuing state of competition in the mutual fund industry; and comparable fees in the mutual fund industry.
The Board also considered the compensation and benefits received by the Manager. This includes fees received for services provided to a Fund by employees of the Manager or of affiliates of the Manager and research services received by the Manager from brokers that execute Fund trades, as well as advisory fees. The Board considered the fact that: (1) the Manager and the Trust are parties to an Administrative Services Agreement and a Compliance Services Agreement, under which the Manager is compensated by the Trust for performing certain administrative and compliance services including providing an employee of the Manager or one of its affiliates to act as the Trust’s Chief Compliance Officer; and (2) Allianz Life Financial Services, LLC, an affiliated person of the Manager, is a registered securities broker-dealer and received (along with its affiliated persons) payments made by the underlying funds pursuant to Rule 12b-1.
The Board is aware that various courts have interpreted provisions of the 1940 Act and have indicated in their decisions that the following factors may be relevant to an adviser’s compensation: the nature and quality of the services provided by the adviser, including the performance of the fund; the adviser’s cost of providing the services; the extent to which the adviser may realize “economies of scale” as the fund grows larger; any indirect benefits that may accrue to the adviser and its affiliates as a result of the adviser’s relationship with the fund; performance and expenses of comparable funds; the profitability of acting as adviser to the fund; and the extent to which the independent Board members, who are not “interested persons” of a fund as defined by the 1940 Act, are fully informed about all facts bearing on the adviser’s services and fees. The Board is aware of these factors and takes them into account in its review of the Management Agreement for the Funds.
The Board considered and weighed these circumstances in light of its experience in governing the Trust, and is assisted in its deliberations by the advice of independent legal counsel to the independent Trustees. In this regard, the Board requests and receives a significant amount of information about the Funds and the Manager. Some of this information is provided at each regular meeting of the Board; additional information is provided in connection with the particular meeting or meetings at which the Board’s formal review of an advisory contract occurs. In between regularly scheduled meetings, the Board may receive information on particular matters as the need arises. Thus, the Board’s evaluation of the Management Agreement is informed by reports covering such matters as: the Manager’s investment philosophy, personnel and processes, and the Fund’s investment performance (in absolute terms as well as in relationship to its benchmark). In connection with comparing the performance of each Fund versus its benchmark, the Board receives reports on the extent to which the Fund’s performance may be attributed to various applicable factors, such as asset class allocation decisions and volatility management strategies, the performance of the underlying funds, rebalancing decisions, and the impact of cash positions and Fund fees and expenses. The Board also receives reports on the Funds’ expenses (including the advisory fee itself and the overall expense structure of the Funds, both in absolute terms and relative to similar and/or competing funds, with due regard for the Expense Limitation Agreement and additional voluntary expense limitations); the nature and extent of the advisory and other services provided to the Fund by the Manager and its affiliates; compliance and audit reports concerning the Funds and the companies that service them; and relevant developments in the mutual fund industry and how the Funds and/or the Manager are responding to them.
The Board also receives financial information about the Manager, including reports on the compensation and benefits the Manager derives from its relationships with the Funds. These reports cover not only the fees under the Management Agreement, but also fees, if any, received for providing other services to the Funds. The reports also discuss any indirect or “fall out” benefits the Manager or its affiliates may derive from its relationship with the Funds.
The Management Agreement was most recently considered at Board meetings held in the fall of 2017. Information relevant to the approval of the Management Agreement was considered at a telephonic Board meeting on October 18, 2017, and at an “in person” Board meeting held October 23, 2017. The Management Agreement was approved at the Board meeting of October 23, 2017. At such meeting the Board also approved the Expense Limitation Agreement between the Manager and the Trust for the period ending April 30, 2019. In connection with such meetings, the Trustees requested and evaluated extensive materials from the Manager, including performance and expense information for other investment companies with similar investment objectives derived from data compiled by an independent third party provider and other sources believed to be reliable by the Manager. Prior to voting, the Trustees reviewed the proposed approval/continuance of the Agreement with management and with experienced counsel who are independent of the Manager and received a memorandum from such counsel discussing the legal standards for their consideration of the proposed approvals/continuances. The independent Trustees also discussed the proposed approvals/continuances in a private session with such counsel at which no representatives of the Manager were present. In reaching their determinations relating to the approval and/or continuance of the Agreement, in respect of each Fund, the Board considered all factors it believed relevant. The Board based its decision to approve the Management Agreement on the totality of the circumstances and relevant factors, and with a view to past and future long-term considerations. Not all of the factors and considerations discussed above and below are necessarily relevant to every Fund, and the Board did not assign relative weights to factors discussed herein or deem any one or group of them to be controlling in and of themselves.
An SEC rule requires that shareholder reports include a discussion of certain factors relating to the selection of the investment adviser and the approval of the advisory fee. The “factors” enumerated by the SEC are set forth below in italics, as well as the Board’s conclusions regarding such factors:
(1) The nature, extent and quality of services provided by the Manager. The Trustees noted that the Manager, subject to the control of the Board, administers each Fund’s business and other affairs. The Trustees noted that the Manager also provides the Trust and each Fund with such administrative and other services (exclusive of, and in addition to, any such services provided by any others retained by the Trust on behalf of the Funds) and executive and other personnel as are necessary for the operation of the Trust and the Funds. Except for the Trust’s Chief Compliance Officer and certain compliance staff, the Manager pays all of the compensation of Trustees and officers of the Trust who are employees of the Manager or its affiliates.
16
The Board considered the scope and quality of services provided by the Manager and noted that the scope of such services provided had expanded as a result of recent regulatory and other developments. The Board noted that, for example, the Manager is responsible for maintaining and monitoring its own compliance program, and this compliance program has been continuously refined and enhanced in light of new regulatory requirements. The Board considered the capabilities and resources which the Manager has dedicated to performing services on behalf of the Trust and its Funds. The quality of administrative and other services, including the Manager’s role in coordinating the activities of the Trust’s other service providers, also were considered. The Board concluded that, overall, they were satisfied with the nature, extent and quality of services provided (and expected to be provided) to the Trust and to each of the Funds under the Management Agreement.
(2) The investment performance of the Funds and the Manager. In connection with every in-person quarterly Board meeting and the fall 2017 contract review process, Trustees received extensive information on the performance results of each Fund. This included, for example, performance information on absolute total return, performance versus the appropriate benchmark(s), the contribution to performance of the Manager’s asset class allocation decisions and volatility management strategies, the performance of the underlying funds, and the impact on performance of rebalancing decisions, cash and Fund fees. This included Lipper performance information on the Funds for the previous quarter, year-to-date, and previous one-, three- and five-year periods, to the extent the Funds were in existence for such periods. (For Funds which have been in existence for less than five years, the Board received performance information on shorter time periods to the extent available.) For example, in connection with the Board meeting held October 23, 2017, the Manager reported that for the five Funds for which performance information for the five year period ended June 30, 2017 was available, two were in the top 40%, two were in the middle 20%, and one was in the bottom 40%. None of these Funds was in the bottom 40% for the three- or one-year periods. The Manager reported that for the three-year period ended June 30, 2017, for the six Funds for which three year performance information was available, four Funds were in the top 40% and two Funds were in the middle 20%. For the eight Funds for which one-year performance information was available, for the one-year period ended June 30, 2017, four Funds were in the top 40%, two Funds were in the middle 20%, and two Funds were in the bottom 40%.
At the Board meeting held October 23, 2017, the Manager also reported upon the performance of the MVP Funds compared to custom managed-volatility peer groups. For the seven Funds for which three-year performance information was available, for the three-year period ended June 30, 2017, five Funds were in the top 40%, one Fund was in the middle 20%, and one was in the bottom 40%. For the eight Funds for which one year performance was available, for the one-year period ended June 30, 2017, four Funds were in the top 40% and four Funds were in the middle 20%. All six Funds for which five-year performance information was available were in the top 40%.
At the Board meeting held October 23, 2017, the Trustees determined that the investment performance of the Funds was acceptable.
(3) The costs of services to be provided and profits to be realized by the Manager and its affiliates from the relationship with the Funds. The Board considered that the Manager receives an advisory fee from each of the Funds. The Manager reported that for the three MVP Fusion Dynamic Funds the advisory fee paid put these Funds in the 44th percentile of the customized peer group. The Manager reported that for three MVP Index Strategy Funds the advisory fee paid put them in the 27th percentile of the customized peer group, and for the two non-MVP Index Strategy Funds, as well as the AZL DFA Multi-Strategy Fund, the advisory fee paid put them in the 13th percentile of the customized peer group. The Manager reported that for the AZL MVP BlackRock Global Strategy Plus, AZL MVP DFA Multi-Strategy, AZL MVP Pyramis Multi-Strategy, and AZL MVP T. Rowe Price Capital Appreciation Plus Funds, the advisory fee paid was in the 9th percentile. (A lower percentile reflects lower fund fees and is better for fund shareholders.) Trustees were provided with information on the total expense ratios of the Funds and other funds in the customized peer groups, and the Manager reported upon the challenges in making peer group comparisons for the Funds.
The Manager provided information concerning the profitability of the Manager’s investment advisory activities for the period from 2014 through June 30, 2017. The Board recognized that it is difficult to make comparisons of profitability from investment company advisory agreements because comparative information is not generally publicly available and is affected by numerous factors, including the structure of the particular adviser, the types of funds it manages, its business mix, numerous assumptions regarding allocation of expenses and the adviser’s capital structure and cost of capital. In considering profitability information, the Board considered the possible effect of certain fall-out benefits to the Manager and its affiliates. The Board focused on profitability of the Manager’s relationships with the Funds before taxes and distribution expenses. The Board recognized that the Manager should earn a reasonable level of profits for the services it provides to each Fund.
The Board also considered that Wilshire Funds Management (“Wilshire”) serves as a consultant to the Manager in preparing statistical and other factual information for use in the creation and maintenance of the asset allocation models for the Fusion Funds (the AZL MVP Fusion Dynamic Conservative, Balanced, and Moderate Funds), pursuant to an agreement between the Manager and Wilshire. Wilshire serves as a consultant to the Manager with respect to selecting the Fusion Funds’ underlying funds and the asset allocations among the underlying funds. The Manager, not any Fund, pays a consultant fee to Wilshire.
Based upon the information provided, the Board concluded that the Funds’ advisory fees and expense ratios are not unreasonable, and determined that there was no evidence that the Manager’s level of profitability from its relationship with the Funds was excessive.
(4) and (5) The extent to which economies of scale would be realized as the Funds grow, and whether fee levels reflect these economies of scale. The Board noted that the advisory fee schedules for the Funds do not contain breakpoints that reduce the fee rate on assets above specified levels. The Board recognized that breakpoints may be an appropriate way for the Manager to share its economies of scale, if any, with Funds that have substantial assets. The Board found there was no uniform methodology for establishing breakpoints that give effect to Fund-specific services provided by the Manager. The Board noted that in the fund industry as a whole, as well as among funds similar to the Funds, there is no uniformity or pattern in the fees and asset levels at which breakpoints (if any) apply. Depending on the age, size, and other characteristics of a particular fund and its manager’s cost structure, different conclusions can be drawn as to whether there are economies of scale to be realized at any particular level of assets, notwithstanding the intuitive conclusion that such economies exist, or will be realized at some level of total assets. Moreover, because different managers have different cost structures and service models, it is difficult to draw meaningful conclusions from the breakpoints that may have been adopted by other funds. The Board also noted that the advisory agreements for many funds do not have breakpoints at all, or if breakpoints exist, they may be at asset levels significantly greater than those of the individual Funds. The Board also noted that the total assets in all of the Funds, as of June 30, 2017, were approximately $10.8 billion and that the largest Fund, the AZL MVP Growth Index Strategy Fund, had assets of approximately $2.4 billion.
The Board noted that the Manager has agreed to temporarily limit Fund expenses under the Expense Limitation Agreement, which has the effect of reducing expenses as would the implementation of advisory fee breakpoints. The Manager has committed to continue to consider the continuation of expense limits and/or advisory fee breakpoints as the Funds grow larger. The Board receives quarterly reports on the level of Fund assets. The Board expects to continue to consider: (a) the extent to which economies of scale have been realized, and (b) whether the advisory fee should be modified, either in connection with the next renewal of the Agreements or by modifying the Expense Limitation Agreement, to reflect such economies of scale, if any.
Having taken these factors into account, the Board concluded that the absence of breakpoints in the Funds’ advisory fee rate schedules was acceptable under each Fund’s circumstances.
17
Information about the Board of Trustees and Officers (Unaudited)
The Trust is managed by the Trustees in accordance with the laws of the state of Delaware governing business trusts. There are currently eight Trustees, one of whom is an “interested person” of the Trust within the meaning of that term under the 1940 Act. The Trustees and Officers of the Trust, and their addresses, ages, positions held with the Trust, terms of office with the Trust and length of time served, principal occupation(s) during the past five years, the number of portfolios in the Trust they oversee, and other directorships held during the past five years are as follows:
Non-Interested Trustees(1)
| Name, Address, and Year of Birth | Positions Held with Allianz VIP and VIP FOF Trust | Term of Office(2)/Length of Time Served | Principal Occupation(s) During Past 5 Years | Number of Portfolios Overseen for Allianz VIP and VIP FOF Trust | Other AZL Fund Complex | |||||
| Peter R. Burnim (1947) 5701 Golden Hills Drive Minneapolis, MN 55416 | Trustee | Since 2/07 | Consultant/Chair, various companies: Chairman, Emrys Analytics and subsidiaries, July 2015 to present; Chairman, Argus Investment Strategies Fund Ltd., February 2013 to 2017; Managing Director, iQ Venture Advisors, LLC, 2005 to present; Chairman, Northstar Group Holdings Ltd. Bermuda, 2011 to present; Chairman Sterling Bank & Trust (Bahamas) Ltd., 2016 to present, and Expert Witness, Massachusetts Department of Revenue, 2011 to 2016. | 35 | Argus Group Holdings and Subsidiaries; Northstar Group Holdings; Sterling Trust (Cayman) Ltd.; Sterling Bank & Trust Limited (Bahamas); Emrys Analytics; EGB Insurance. | |||||
| Peggy L. Ettestad (1957) 5701 Golden Hills Drive Minneapolis, MN 55416 | Lead Independent Trustee | Since 10/14 (Trustee since 2/07) | Managing Director, Red Canoe Management Consulting LLC, 2008 to present | 35 | Luther College | |||||
| Tamara Lynn Fagely (1958) 5701 Golden Hills Drive Minneapolis, MN 55416 | Trustee | Since 12/17 | Retired; Chief Operations Officer, Hartford Funds, March 2012 to December 2013 | 35 | Diamond Hill Funds (13 funds) | |||||
| Richard H. Forde (1953) 5701 Golden Hills Drive Minneapolis, MN 55416 | Trustee | Since 12/17 | Member of the Board and Chairman of the Finance and Investment Committee, Connecticut Water Service, Inc., October 2013 to present; Senior Vice President and Chief Investment Officer, CIGNA, 2004 to 2012 | 35 | Connecticut Water Service, Inc. | |||||
| Claire R. Leonardi (1955) 5701 Golden Hills Drive Minneapolis, MN 55416 | Trustee | Since 2/04 | Chief Executive Officer, Health eSense Inc., 2015 to Present; CEO, Connecticut Innovations, Inc., 2012 to 2015; General Partner, Fairview Capital, L.P., 1994 to 2012 | 35 | reSet Social Enterprise Investment Fund | |||||
| Dickson W. Lewis (1948) 5701 Golden Hills Drive Minneapolis, MN 55416 | Trustee | Since 2/04 | Retired; Vice President/General Manager, Yearbooks & Canada-Lifetouch National School Studios, 2006 to 2014; Vice President/General Manager of Jostens, Inc., 2002 to 2006; Senior Vice President of Fortis Group, 1997 to 2002 | 35 | None | |||||
| Arthur C. Reeds, III (1944) 5701 Golden Hills Drive Minneapolis, MN 55416 | Trustee | Since 10/99 | Retired; Senior Investment Officer, Hartford Foundation for Public Giving, 2000 to 2003; Chairman, Chief Executive and President of Conning Corp., 1999 to 2000 | 35 | Connecticut Water Service, Inc. |
Interested Trustees(3)
| Name, Address, and Year of Birth | Positions Held with Allianz VIP and VIP FOF Trust | Term of Office(2)/Length of Time Served | Principal Occupation(s) During Past 5 Years | Number of Portfolios Overseen for Allianz VIP and VIP FOF Trust | Other AZL Fund Complex | |||||
Brian Muench (1970) 5701 Golden Hills Drive | Trustee | Since 6/11 | President, Allianz Investment Management LLC, November 2010 to present; Vice President, Allianz Life, April 2011 to present | 35 | None |
18
Officers
| Name, Address, and Age | Positions Held with Allianz VIP and VIP FOF Trust | Term of Office(2)/Length of Time Served | Principal Occupation(s) During Past 5 Years | |||
Brian Muench (1970) 5701 Golden Hills Drive | President | Since 11/10 | President, Allianz Investment Management LLC, November 2010 to present; Vice President, Allianz Life, April 2011 to present. | |||
| Michael Radmer (1945) Dorsey & Whitney LLP, Suite 1500 50 South Sixth Street Minneapolis, MN 55402-1498 | Secretary | Since 02/02 | Senior Counsel (previously, Partner), Dorsey and Whitney LLP since 1976. | |||
| Bashir C. Asad (1963) Citi Fund Services Ohio, Inc. 4400 Easton Commons, Suite 200 Columbus, OH 43219 | Treasurer, Principal Accounting Officer and Principal Financial Officer | Since 06/16 | Senior Vice President, Citi Fund Services Ohio, Inc. | |||
| Chris R. Pheiffer (1968) 5701 Golden Hills Drive Minneapolis, MN 55416 | Chief Compliance Officer(4) and Anti-MoneyLaundering Compliance Officer | Since 02/14 | Chief Compliance Officer of the VIP Trust and the FOF Trust, February 2014 to present; Deputy Chief Compliance Officer of the VIP Trust and the FOF Trust and Compliance Director, Allianz Life, February 2007 to February 2014. |
| (1) | Member of the Audit Committee. |
| (2) | Indefinite. |
| (3) | Is an “interested person”, as defined by the 1940 Act, due to employment by Allianz. |
| (4) | The Manager and the Trust are parties to a Chief Compliance Officer Agreement under which the Manager is compensated by the Trust for providing an employee of the Manager or one of its affiliates to act as the Trust’s Chief Compliance Officer. The Chief Compliance Officer and Anti-Money Laundering Compliance Officer is not considered a corporate officer or executive employee of the Trust. |
19
The Allianz VIP Fund of Funds are distributed by Allianz Life Financial Services, LLC. These Funds are not FDIC Insured. | ANNRPT1217 2/18 |
AZL MVP FusionSM Dynamic Balanced Fund
Annual Report
December 31, 2017
Table of Contents
Management Discussion and Analysis
Page 1
Expense Examples and Portfolio Composition
Page 3
Schedule of Portfolio Investments
Page 4
Statement of Assets and Liabilities
Page 5
Page 5
Statements of Changes in Net Assets
Page 6
Page 7
Notes to the Financial Statements
Page 8
Report of Independent Registered Public Accounting Firm
Page 13
Other Federal Income Tax Information
Page 14
Page 15
Approval of Investment Advisory Agreement
Page 16
Information about the Board of Trustees and Officers
Page 18
This report is submitted for the general information of the shareholder of the Fund. The report is not authorized for distribution to prospective investors in the Fund unless preceded or accompanied by an effective prospectus, which contains details concerning the sales charges and other pertinent information.
AZL MVP FusionSM Dynamic Balanced Fund Review (Unaudited)
Allianz Investment Management LLC
serves as the Manager for the AZL
MVP FusionSM Dynamic Balanced Fund.
What factors affected the Fund’s performance for the year ended December 31, 2017?
For the year ended December 31, 2017, the AZL MVP FusionSM Dynamic Balanced Fund (the “Fund”) returned 12.23%. That compared to a 21.83%, 3.54% and 12.42% total return for its benchmarks, the S&P 500 Index1, the Bloomberg Barclays U.S. Aggregate Bond Index1, and the Balanced Composite Index1, respectively.
The Fund is a fund of funds that achieves broad diversification by investing in underlying funds. The Fund typically holds between 40% and 60% of its assets in equity funds and 40% to 60% of its assets in fixed-income funds. The Fund also employs the MVP (Managed Volatility Portfolio) risk management process, which is intended to adjust the risk of the portfolio based on quantitative indicators of market risk, such as the current level of fund and market volatility.*
Global economic expansion led major stock indexes to new all-time highs during the 12-month period under review. The S&P 500 Index gained 21.83% during the period, supported by a positive economic environment marked by solid jobs growth, low unemployment, increased business investment, strong consumer confidence and a low-volatility environment. Mid- and small-cap stocks also performed well during the period: The S&P MidCap 400 Index2 generated a 16.24% return and the SmallCap 600 Index3 returned 13.23%. Growth stocks were also heavily favored during the year and significantly outperformed value stocks.
International developed markets, as measured by the MSCI EAFE Index4, fared even better than U.S. equities, posting a 25.62% return for the year. Emerging markets equities, as measured by the MSCI Emerging Markets Equity Index5, posted a return of 37.75%. The strong return ended years of underperformance versus domestic and international developed markets.
The U.S. bond market was generally positive, as the market rewarded investors who took on interest rate and spread risk. The Bloomberg Barclays U.S. Aggregate Bond Index gained 3.54%. Bond investors generally tolerated risk in their quest for more attractive yields. Credit spreads on corporate bonds ended the year tighter than when the year began, with high-yield bond spreads tightening markedly. Meanwhile, the yield curve flattened sharply, as three rate hikes by the Federal Reserve sent short-term yields higher, while investor demand for attractive yield pushed long-term yields lower.
The Fund, which invests in both U.S. and international markets, modestly underperformed its composite benchmark in 2017. Above-benchmark allocations to mid- and small-cap U.S. equity detracted from the Fund’s performance relative to the S&P 500 Index, as smaller stocks generally lagged their large-cap counterparts. An allocation to hedged equity also hindered returns as higher beta6 (more volatile) strategies were better rewarded during the period*
The Fund’s off-benchmark allocation to shorter-term bonds also detracted modestly from relative returns as longer-term bonds outperformed.*
The Fund’s relative performance benefited from its strategic, off-benchmark allocations to international developed and emerging markets equities along with a dynamic tilt toward those indexes. These non-U.S. equity markets broadly outperformed their domestic counterparts during the period. Overall, the positive impact of allocations to international equities largely offset the negative impact from other allocation decisions.*
Stock selection within the Fund’s holdings had an overall modest positive impact on relative results. The negative effects of stock choice within the Fund’s equity holdings were more than offset by the benefits of security selection with its fixed income holdings.*
The MVP risk management process, which includes the use of derivatives, worked as intended during the period under review. Given that the period was marked by low volatility, the MVP maintained a neutral equity allocation for the year relative to its target.*
Past performance does not guarantee future results.
| * | The Fund’s portfolio composition is subject to change. There is no guarantee that any sectors mentioned will continue to perform well or that securities in such sectors will be held by the Fund in the future. The information contained in this commentary is for informational purposes only and should not be construed as a recommendation to purchase or sell securities in the sector mentioned. The Fund’s holdings and weightings are as of December 31, 2017. |
| 1 | For a complete description of the Fund’s performance benchmarks please refer to page 2 of this report. |
| 2 | The Standard & Poor’s MidCap 400 Index (“S&P 400”) is the most widely used index for mid-sized companies. The S&P 400 covers 7% of the U.S. equities market, and is part of a series of S&P U.S. indices that can be used as building blocks for portfolio composition. |
| 3 | The Standard & Poor’s SmallCap 600 Index (“S&P 600”) covers approximately 3% of the domestic equities market. Measuring the small-cap segment of the market that is typically renowned for poor trading liquidity and financial instability, the index is designed to be an efficient portfolio of companies that meet specific inclusion criteria to ensure that they are investable and financially viable. |
| 4 | The Morgan Stanley Capital International, Europe, Australasia and Far East (“MSCI EAFE”) Index is a free float-adjusted market capitalization-weighted index that is designed to measure the equity market performance of developed markets, excluding the U.S. & Canada. |
| 5 | The MSCI Emerging Markets Index (“MSCI EM”) is a free float-adjusted market capitalization index that is designed to measure equity performance of emerging markets. |
| 6 | Beta is a measure of the volatility, or systematic risk, of a security or a portfolio in comparison to the market as a whole. Beta is used in the capital asset pricing model, which calculates the expected return of an asset based on its beta and expected market returns. |
| Investors cannot invest directly in an index. |
1
AZL MVP FusionSM Dynamic Balanced Fund Review (Unaudited)
Fund Objective
The Fund’s investment objective is to seek long-term capital appreciation with preservation of capital as an important consideration. This objective may be changed by the Trustees of the Fund without shareholder approval. The Fund seeks to achieve its objective by investing in a combination of Permitted Underlying Funds that represent different classes in the Fund’s asset allocation.
Investment Concerns
The Fund invests in underlying funds, so its investment performance is directly related to the performance of those underlying funds. Before investing, investors should assess the risks associated with and types of investments made by each of the underlying funds in which the Fund invests.
Returns on growth stocks may not move in tandem with returns on other categories of stocks or the market as a whole. Growth stocks may be susceptible to rapid price savings or to adverse developments in certain sectors of the market.
Emerging market investing may be subject to additional economic, political, liquidity, and currency risks not associated with more developed countries.
International investing may involve risk of capital loss from unfavorable fluctuations in currency values, from differences in generally accepted accounting principles or from economic or political instability in other nations.
Small- to mid-capitalization companies typically have a higher risk of failure and historically have experienced a greater degree of volatility.
The performance of the Fund is expected to be lower than that of the Indices because of Fund fees and expenses. Securities in which the Fund will invest may involve substantial risk and may be subject to sudden severe price declines.
Bonds offer a relatively stable level of income, although bond prices will fluctuate, providing the potential for principal gain or loss.
Debt securities held by the Fund may decline in value due to rising interest rates. Interest rates in the U.S. are at, or near, historic lows, which may increase the Fund’s exposure to risks related to rising rates.
Investing in derivatives instruments involves risks that may be different from or greater than the risk associated with investing directly in securities or other traditional instruments.
For a complete description of these and other risks associated with investing in a mutual Fund, please refer to the Fund’s prospectus.
Growth of $10,000 Investment
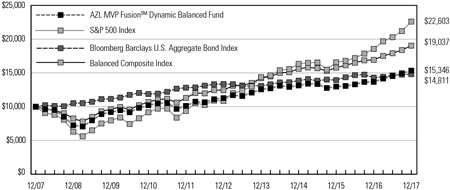
The chart above represents a comparison of a hypothetical investment in the Fund versus a similar investment in the Fund’s benchmark as well as the two component indices of the Fund’s benchmark, and represents the reinvestment of dividends and capital gains in the Fund.
Average Annual Total Returns as of December 31, 2017
| 1 Year | 3 Year | 5 Year | 10 Year | |||||||||||||
AZL MVP FusionSM Dynamic Balanced Fund | 12.23 | % | 5.31 | % | 6.36 | % | 4.38 | % | ||||||||
S&P 500 Index | 21.83 | % | 11.41 | % | 15.79 | % | 8.50 | % | ||||||||
Bloomberg Barclays U.S. Aggregate Bond Index | 3.54 | % | 2.24 | % | 2.10 | % | 4.01 | % | ||||||||
Balanced Composite Index | 12.42 | % | 6.84 | % | 8.87 | % | 6.65 | % | ||||||||
Past performance does not guarantee future results. The performance data quoted represents past performance and current returns may be lower or higher. The investment return and principal value will fluctuate so that an investor’s shares, when redeemed may be worth more or less than the original cost. To obtain performance information current to the most recent month end, please visit www.Allianzlife.com.
Expense Ratio | Gross | |||
AZL MVP FusionSM Dynamic Balanced Fund | 0.96 | % | ||
The above expense ratio is based on the current Fund prospectus dated May 1, 2017. The Manager and the Fund have entered into a written contract limiting operating expenses, excluding certain expenses (such as interest expense and acquired fund fees and expenses), to 0.30% through April 30, 2019. Additional information pertaining to the December 31, 2017 expense ratios can be found in the financial highlights.
Acquired fund fees and expenses are incurred indirectly by the Fund through the valuation of the Fund’s investments in the Permitted Underlying Funds. Accordingly, acquired fund fees and expenses affect the Fund’s total returns. Because these fees and expenses are not included in the Fund’s financial highlights, the Fund’s total annual fund operating expenses, as shown in the current prospectus, do not correlate to the ratios of expenses to average net assets shown in the financial highlights table. Without acquired fund fees and expenses the Fund’s gross expense ratio would be 0.22%.
The total return of the Fund does not reflect the effect of any insurance charges, the annual maintenance fee or the deduction of taxes that a shareholder would pay on Fund distributions or the redemption of Fund shares. Such charges, fees and tax payments would reduce the performance quoted.
The Fund’s performance is measured against the Standard & Poor’s 500 Index (“S&P 500”), the Bloomberg Barclays U.S. Aggregate Bond Index and the Balanced Composite Index (“Composite”). The S&P 500 is representative of 500 selected common stocks, most of which are listed on the New York Stock Exchange, and is a measure of the U.S. Stock market as a whole. The Bloomberg Barclays U.S. Aggregate Bond Index is a market value-weighted performance benchmark for investment-grade fixed-rate debt issues, including government, corporate, asset-backed, and mortgage-backed securities, with maturities of at least one year. The Composite is a blended index comprised of (50%) S&P 500 and (50%) Bloomberg Barclays U.S. Aggregate Bond Index. These indexes are unmanaged and do not reflect the deduction of fees associated with a mutual fund, such as investment management and fund accounting fees. The Fund’s performance reflects the deduction of fees for services provided to the Fund. Investors cannot invest directly in an index.
2
AZL MVP Fusion Dynamic Balanced Fund
(Unaudited)
As a shareholder of the AZL MVP Fusion Dynamic Balanced Fund (the “Fund”), you incur ongoing costs, including management fees, distribution fees, and other Fund expenses. These examples are intended to help you understand your ongoing costs (in dollars) of investing in the Fund and to compare these costs with the ongoing costs of investing in other mutual funds. Please note that the expenses shown in each table do not reflect expenses that apply to the subaccount or the insurance contract. If the expenses that apply to the subaccount of the insurance contract were included, your costs would have been higher.
These examples are based on an investment of $1,000 invested at the beginning of the period and held for the periods presented below.
The Actual Expense table below provides information about actual account values and actual expenses. You may use the information below, together with the amount you invested, to estimate the expenses that you paid over the period. Simply divide your account value by $1,000 (for example, an $8,600 account value divided by $1,000 = 8.6), then multiply the result by the number in the table under the heading entitled “Expenses Paid During Period” to estimate the expenses you paid on your account during this period.
| Beginning Account Value 7/1/17 | Ending Account Value 12/31/17 | Expenses Paid During Period 7/1/17 - 12/31/17* | Annualized Expense Ratio During Period 7/1/17 - 12/31/17 | |||||||||||||||||
AZL MVP Fusion Dynamic Balanced Fund | $ | 1,000.00 | $ | 1,056.50 | $ | 1.09 | 0.21 | % | ||||||||||||
The Hypothetical Expense table below provides information about hypothetical account values and hypothetical expenses based on the Fund’s actual expense ratio and an assumed rate of return of 5% per year before expenses, which is not the Fund’s actual return. The hypothetical account values and expenses may not be used to estimate the actual ending account balance or expenses you paid for the period. You may use this information to compare this 5% hypothetical example with the 5% hypothetical examples that appear in the shareholder reports of other funds.
| Beginning Account Value 7/1/17 | Ending Account Value 12/31/17 | Expenses Paid During Period 7/1/17 - 12/31/17* | Annualized Expense Ratio During Period 7/1/17 - 12/31/17 | |||||||||||||||||
AZL MVP Fusion Dynamic Balanced Fund | $ | 1,000.00 | $ | 1,024.15 | $ | 1.07 | 0.21 | % | ||||||||||||
| * | Expenses are equal to the average account value over the period, multiplied by the Fund’s annualized expense ratio, multiplied by 184/365 (to reflect the one half year period). |
Portfolio Composition
(Unaudited)
| Investments | Percent of Net Assets | ||||
Fixed Income | 47.0 | ||||
Domestic Equities | 28.5 | ||||
International Equities | 19.6 | ||||
|
| ||||
Total Investment Securities | 95.1 | ||||
Net other assets (liabilities) | 4.9 | ||||
|
| ||||
Net Assets | 100.0 | % | |||
|
| ||||
3
AZL MVP Fusion Dynamic Balanced Fund
Schedule of Portfolio Investments
December 31, 2017
| Shares | Fair Value | |||||||
| Affiliated Investment Companies (95.1%): | ||||||||
| 3,424,828 | AZL DFA International Core Equity Fund | $ | 39,248,531 | |||||
| 2,630,052 | AZL DFA U.S. Core Equity Fund | 33,559,467 | ||||||
| 1,378,322 | AZL DFA U.S. Small Cap Fund | 17,104,974 | ||||||
| 2,531,991 | AZL Enhanced Bond Index Fund | 27,573,381 | ||||||
| 2,524,083 | AZL Gateway Fund | 33,620,784 | ||||||
| 7,204,944 | AZL International Index Fund, Class 2 | 124,645,530 | ||||||
| 10,820,944 | AZL MetWest Total Return Bond Fund | 110,373,633 | ||||||
| 1,430,410 | AZL Mid Cap Index Fund, Class 2 | 33,557,418 | ||||||
| 6,065,372 | AZL MSCI Emerging Markets Equity Index Fund, Class 2 | 53,193,311 | ||||||
| 10,822,473 | AZL Pyramis® Total Bond Fund, Class 2 | 110,713,901 | ||||||
| 5,987,198 | AZL Russell 1000 Growth Index Fund, Class 2 | 91,065,279 | ||||||
| 6,716,357 | AZL Russell 1000 Value Index Fund, Class 2 | 91,073,802 | ||||||
| 763,444 | AZL Small Cap Stock Index Fund, Class 2 | 11,360,051 | ||||||
| 4,515,555 | PIMCO VIT Income Portfolio | 48,497,065 | ||||||
| 10,726,544 | PIMCO VIT Low Duration Portfolio | 109,839,812 | ||||||
| 10,060,961 | PIMCO VIT Total Return Portfolio | 110,066,916 | ||||||
|
| |||||||
Total Affiliated Investment Companies (Cost $951,871,525) | 1,045,493,855 | |||||||
|
| |||||||
Total Investment Securities (Cost $951,871,525)(a) — 95.1% | 1,045,493,855 | |||||||
Net other assets (liabilities) — 4.9% | 54,000,530 | |||||||
|
| |||||||
Net Assets — 100.0% | $ | 1,099,494,385 | ||||||
|
| |||||||
Percentages indicated are based on net assets as of December 31, 2017.
| (a) | See Federal Tax Information listed in the Notes to the Financial Statements. |
Futures Contracts
Cash of $54,865,300 has been segregated to cover margin requirements for the following open contracts as of December 31, 2017:
Long Futures
| Description | Expiration Date | Number of Contracts | Notional Amount | Unrealized Appreciation/ (Depreciation) | ||||||||||||
S&P 500 Index E-Mini March Futures (U.S. Dollar) | 3/19/18 | 203 | $ | 27,161,400 | $ | 447,353 | ||||||||||
U.S. Treasury 10-Year Note March Futures (U.S. Dollar) | 3/21/18 | 221 | 27,414,359 | (148,341 | ) | |||||||||||
|
| |||||||||||||||
| $ | 299,012 | |||||||||||||||
|
| |||||||||||||||
See accompanying notes to the financial statements.
4
AZL MVP Fusion Dynamic Balanced Fund
Statement of Assets and Liabilities
December 31, 2017
Assets: | |||||
Investments in affiliates, at cost | $ | 951,871,525 | |||
|
| ||||
Investments in affiliates, at value | $ | 1,045,493,855 | |||
Segregated cash for collateral | 54,865,300 | ||||
Interest and dividends receivable | 454,850 | ||||
Receivable for investments sold | 639,818 | ||||
Receivable for variation margin on futures contracts | 661 | ||||
Prepaid expenses | 6,387 | ||||
|
| ||||
Total Assets | 1,101,460,871 | ||||
|
| ||||
Liabilities: | |||||
Cash overdraft | 639,818 | ||||
Payable for investments purchased | 404,186 | ||||
Payable for capital shares redeemed | 696,897 | ||||
Manager fees payable | 186,959 | ||||
Administration fees payable | 3,926 | ||||
Custodian fees payable | 465 | ||||
Administrative and compliance services fees payable | 2,511 | ||||
Transfer agent fees payable | 750 | ||||
Trustee fees payable | 1,618 | ||||
Other accrued liabilities | 29,356 | ||||
|
| ||||
Total Liabilities | 1,966,486 | ||||
|
| ||||
Net Assets | $ | 1,099,494,385 | |||
|
| ||||
Net Assets Consist of: | |||||
Capital | $ | 936,171,779 | |||
Accumulated net investment income/(loss) | 12,529,638 | ||||
Accumulated net realized gains/(losses) from investment transactions | 56,871,626 | ||||
Net unrealized appreciation/(depreciation) on investments | 93,921,342 | ||||
|
| ||||
Net Assets | $ | 1,099,494,385 | |||
|
| ||||
Shares of beneficial interest (unlimited number of shares authorized, no par value) | 92,339,836 | ||||
Net Asset Value (offering and redemption price per share) | $ | 11.91 | |||
|
|
For the Year Ended December 31, 2017
Investment Income: | |||||
Dividends from affiliates | $ | 13,013,453 | |||
Interest | 491,835 | ||||
Dividends | 380 | ||||
Other income | 2,224 | ||||
|
| ||||
Total Investment Income | 13,507,892 | ||||
|
| ||||
Expenses: | |||||
Manager fees | 2,213,010 | ||||
Administration fees | 53,408 | ||||
Custodian fees | 2,685 | ||||
Administrative and compliance services fees | 13,211 | ||||
Transfer agent fees | 5,451 | ||||
Trustee fees | 47,134 | ||||
Professional fees | 47,632 | ||||
Shareholder reports | 25,454 | ||||
Other expenses | 14,789 | ||||
|
| ||||
Total expenses | 2,422,774 | ||||
|
| ||||
Net Investment Income/(Loss) | 11,085,118 | ||||
|
| ||||
Realized and Unrealized Gains/(Losses) on Investments: | |||||
Net realized gains/(losses) on securities transactions from affiliates | 33,646,760 | ||||
Net realized gains distributions from affiliated underlying funds | 23,162,736 | ||||
Net realized gains/(losses) on futures contracts | 5,014,226 | ||||
Change in net unrealized appreciation/depreciation on affiliated transactions | 53,674,263 | ||||
Change in net unrealized appreciation/depreciation on futures contracts | 416,108 | ||||
|
| ||||
Net Realized/Unrealized Gains/(Losses) on Investments | 115,914,093 | ||||
|
| ||||
Change in Net Assets Resulting From Operations | $ | 126,999,211 | |||
|
|
See accompanying notes to the financial statements.
5
AZL MVP Fusion Dynamic Balanced Fund
Statements of Changes in Net Assets
| For the Year Ended December 31, 2017 | For the Year Ended December 31, 2016 | |||||||||
Change In Net Assets: | ||||||||||
Operations: | ||||||||||
Net investment income/(loss) | $ | 11,085,118 | $ | 16,768,863 | ||||||
Net realized gains/(losses) on investment transactions | 61,823,722 | 111,861,582 | ||||||||
Change in unrealized appreciation/depreciation on investments | 54,090,371 | (69,648,231 | ) | |||||||
|
|
|
| |||||||
Change in net assets resulting from operations | 126,999,211 | 58,982,214 | ||||||||
|
|
|
| |||||||
Distributions to Shareholders: | ||||||||||
From net investment income | (18,503,054 | ) | (25,843,598 | ) | ||||||
From net realized gains | (99,533,664 | ) | (55,908,893 | ) | ||||||
|
|
|
| |||||||
Change in net assets resulting from distributions to shareholders | (118,036,718 | ) | (81,752,491 | ) | ||||||
|
|
|
| |||||||
Capital Transactions: | ||||||||||
Proceeds from shares issued | 8,943,045 | 17,580,463 | ||||||||
Proceeds from dividends reinvested | 118,036,718 | 81,752,491 | ||||||||
Value of shares redeemed | (138,571,442 | ) | (145,808,871 | ) | ||||||
|
|
|
| |||||||
Change in net assets resulting from capital transactions | (11,591,679 | ) | (46,475,917 | ) | ||||||
|
|
|
| |||||||
Change in net assets | (2,629,186 | ) | (69,246,194 | ) | ||||||
Net Assets: | ||||||||||
Beginning of period | 1,102,123,571 | 1,171,369,765 | ||||||||
|
|
|
| |||||||
End of period | $ | 1,099,494,385 | $ | 1,102,123,571 | ||||||
|
|
|
| |||||||
Accumulated net investment income/(loss) | $ | 12,529,638 | $ | 18,502,976 | ||||||
|
|
|
| |||||||
Share Transactions: | ||||||||||
Shares issued | 713,387 | 1,451,088 | ||||||||
Dividends reinvested | 10,210,789 | 6,975,468 | ||||||||
Shares redeemed | (11,323,719 | ) | (12,086,797 | ) | ||||||
|
|
|
| |||||||
Change in shares | (399,543 | ) | (3,660,241 | ) | ||||||
|
|
|
| |||||||
See accompanying notes to the financial statements.
6
AZL MVP Fusion Dynamic Balanced Fund
(Selected data for a share of beneficial interest outstanding throughout the periods indicated)
| Year Ended December 31, | |||||||||||||||||||||||||
| 2017 | 2016 | 2015 | 2014 | 2013 | |||||||||||||||||||||
Net Asset Value, Beginning of Period | $ | 11.88 | $ | 12.15 | $ | 13.03 | $ | 12.62 | $ | 11.52 | |||||||||||||||
|
|
|
|
|
|
|
|
|
| ||||||||||||||||
Investment Activities: | |||||||||||||||||||||||||
Net Investment Income/(Loss) | 0.14 | 0.20 | 0.24 | 0.15 | 0.12 | ||||||||||||||||||||
Net Realized and Unrealized Gains/(Losses) on Investments | 1.27 | 0.44 | (0.42 | ) | 0.44 | 1.19 | |||||||||||||||||||
|
|
|
|
|
|
|
|
|
| ||||||||||||||||
Total from Investment Activities | 1.41 | 0.64 | (0.18 | ) | 0.59 | 1.31 | |||||||||||||||||||
|
|
|
|
|
|
|
|
|
| ||||||||||||||||
Dividends to Shareholders From: | |||||||||||||||||||||||||
Net Investment Income | (0.22 | ) | (0.29 | ) | (0.17 | ) | (0.18 | ) | (0.21 | ) | |||||||||||||||
Net Realized Gains | (1.16 | ) | (0.62 | ) | (0.53 | ) | — | — | |||||||||||||||||
|
|
|
|
|
|
|
|
|
| ||||||||||||||||
Total Dividends | (1.38 | ) | (0.91 | ) | (0.70 | ) | (0.18 | ) | (0.21 | ) | |||||||||||||||
|
|
|
|
|
|
|
|
|
| ||||||||||||||||
Net Asset Value, End of Period | $ | 11.91 | $ | 11.88 | $ | 12.15 | $ | 13.03 | $ | 12.62 | |||||||||||||||
|
|
|
|
|
|
|
|
|
| ||||||||||||||||
Total Return(a) | 12.23 | % | 5.40 | % | (1.27 | )% | 4.59 | % | 11.46 | % | |||||||||||||||
Ratios to Average Net Assets/Supplemental Data: | |||||||||||||||||||||||||
Net Assets, End of Period (000’s) | $ | 1,099,494 | $ | 1,102,124 | $ | 1,171,370 | $ | 1,280,573 | $ | 1,282,663 | |||||||||||||||
Net Investment Income/(Loss) | 1.00 | % | 1.48 | % | 1.80 | % | 1.13 | % | 1.27 | % | |||||||||||||||
Expenses Before Reductions*(b) | 0.22 | % | 0.22 | % | 0.22 | % | 0.22 | % | 0.22 | % | |||||||||||||||
Expenses Net of Reductions* | 0.22 | % | 0.22 | % | 0.22 | % | 0.22 | % | 0.21 | % | |||||||||||||||
Portfolio Turnover Rate(c) | 17 | % | 52 | % | 11 | % | 23 | % | 6 | % | |||||||||||||||
| * | The expense ratios exclude the impact of fees/expenses paid by each underlying fund. |
| (a) | The returns include reinvested dividends and fund level expenses, but exclude insurance contract charges. If these charges were included, the returns would have been lower. |
| (b) | Excludes fee reductions. If such fee reductions had not occurred, the ratios would have been as indicated. |
| (c) | The portfolio turnover rate can be volatile due to the amount and timing of purchases and sales of fund shares during the period. |
See accompanying notes to the financial statements.
7
AZL MVP Fusion Dynamic Balanced Fund
Notes to the Financial Statements
December 31, 2017
1. Organization
The Allianz Variable Insurance Products Fund of Funds Trust (the “Trust”) was organized as a Delaware statutory trust on June 16, 2004. The Trust is a diversified open-end management investment company registered under the Investment Company Act of 1940, as amended, (the “1940 Act”) and thus is determined to be an investment company for accounting purposes. The Trust consists of 12 separate investment portfolios (collectively, the “Funds”), of which one is included in this report, the AZL MVP Fusion Dynamic Balanced Fund (the “Fund”), and 11 are presented in separate reports.
The Fund is a “fund of funds,” which means that the Fund invests primarily in other mutual funds. Underlying Funds invest in stock, bonds, and other securities and reflect varying amounts of potential investment risk and reward. The Underlying Funds record their investments at fair value. Periodically, the Fund will adjust its asset allocation as it seeks to achieve its investment objective.
The Trust is authorized to issue an unlimited number of shares of the Fund without par value. Shares of the Fund are available through the variable annuity contracts offered through the separate accounts of participating insurance companies. Currently, the Fund only offers its shares to separate accounts of Allianz Life Insurance Company of North America and Allianz Life Insurance Company of New York, affiliates of the Trust and the Manager, as defined below.
Under the Trust’s organizational documents, its officers and trustees are indemnified against certain liabilities arising out of the performance of their duties to the Fund. In addition, in the normal course of business, the Fund may enter into contracts with its vendors and others that provide for general indemnifications. The Fund’s maximum exposure under these arrangements is unknown, as this would involve future claims that may be made against the Fund. However, based on experience, the Fund expects that risk of loss to be remote.
2. Significant Accounting Policies
The following is a summary of significant accounting policies followed by the Fund in the preparation of its financial statements. The policies conform with U.S. generally accepted accounting principles (“U.S. GAAP”). The preparation of financial statements requires management to make certain estimates and assumptions that affect the reported amounts of assets and liabilities and disclosure of contingent assets and liabilities at the date of the financial statements and the reported amounts of increases and decreases in net assets from operations during the reporting period. Actual results could differ from those estimates.
Security Valuation
The Fund records its investments at fair value. Fair value is defined as the price that would be received to sell an asset or paid to transfer a liability in an orderly transaction between willing market participants at the measurement date. The valuation techniques used to determine fair value are further described in Note 4 below.
Investment Transactions and Investment Income
Investment transactions are accounted for on trade date. Net realized gains and losses on investments sold and on foreign currency transactions are recorded on the basis of identified cost. Interest income is recorded on the accrual basis and includes, where applicable, the amortization of premiums or accretion of discounts.
Dividends to Shareholders
Dividends to shareholders are recorded on the ex-dividend date. The Fund distributes its dividends from net investment income and net realized capital gains, if any, on an annual basis. The amount of dividends from net investment income and from net realized gains is determined in accordance with federal income tax regulations, which may differ from U.S. GAAP. These “book/tax” differences are either temporary or permanent in nature. To the extent these differences are permanent in nature (e.g., miscellaneous adjustments on return of capital), such amounts are reclassified within the composition of net assets based on their federal tax-basis treatment; temporary differences (e.g., wash sales and differing treatment on certain investments) do not require reclassification. Dividends to shareholders that exceed net investment income and net realized gains for tax purposes are reported as distributions of capital.
Expense Allocation
Expenses directly attributable to the Fund are charged directly to the Fund, while expenses attributable to more than one Fund are allocated among the respective Funds based upon relative net assets or some other reasonable method. Expenses which are attributable to more than one Trust are allocated across the Allianz Variable Insurance Products and Allianz Variable Insurance Products Fund of Funds Trusts based upon relative net assets or another reasonable basis. Allianz Investment Management LLC (the “Manager”), serves as the investment manager for the Trust and the Allianz Variable Insurance Products Trust.
Derivative Instruments
All open derivative positions at period end are reflected on the Fund’s Schedule of Portfolio Investments. The following is a description of the derivative instruments utilized by the Fund, including the primary underlying risk exposures related to each instrument type. The Fund’s allocation to the MVP (Managed Volatility Portfolio) risk management process may include (a) derivatives such as index futures, other futures contracts, options, and other similar securities and (b) cash, money market equivalents, short-term debt instruments, money market funds, and short-term debt funds to satisfy all applicable margin requirements and to provide additional portfolio liquidity to satisfy large redemptions and any margin calls. Due to the leverage provided by derivatives, the notional value of the Fund’s derivative positions could exceed 20% of the Fund’s value. The Fund may also use futures to gain equity exposure and may hold cash as a buffer in the event of market shocks.
Futures Contracts
During the year ended December 31, 2017, the Fund invested in futures contracts to reduce volatility and limit the need to decrease or increase allocations to underlying funds. Futures contracts are valued based upon their quoted daily settlement prices. Upon entering into a futures contract, the Fund is required to segregate liquid assets in accordance
8
AZL MVP Fusion Dynamic Balanced Fund
Notes to the Financial Statements
December 31, 2017
with the initial margin requirements of the broker or exchange. Futures contracts are marked to market daily and a payable or receivable for the change in value (“variation margin”) is recorded by the Fund. Gains or losses are recognized but not considered realized until the contracts expire or are closed. Futures contracts involve, to varying degrees, elements of market risk (generally equity price risk related to stock futures, interest rate risk related to bond futures, and foreign currency risk related to currency futures) and exposure to loss in excess of the variation margin disclosed in the Statement of Assets and Liabilities. The primary risks associated with the use of futures contracts are the imperfect correlation between the change in fair value of the underlying securities and the prices of futures contracts, the possibility of an illiquid market, and the inability of the counterparty to meet the terms of the contract. For the year ended December 31, 2017, the monthly average notional amount for long contracts was $55.3 million. Realized gains and losses are reported as “Net realized gains/(losses) on futures contracts” on the Statement of Operations.
Summary of Derivative Instruments
The following is a summary of the fair values of derivative instruments on the Fund’s Statement of Assets and Liabilities, categorized by risk exposure, as of December 31, 2017:
Asset Derivative | Liability Derivative | |||||||||||
| Primary Risk Exposure | Statement of Assets and Liabilities Location | Total Fair Value* | Statement of Assets and Liabilities Location | Total Fair Value* | ||||||||
Equity Risk | ||||||||||||
| Equity Contracts | Receivable for variation margin on futures contracts | $ | 447,353 | Payable for variation margin on futures contracts | $ | — | ||||||
Interest Rate Risk | ||||||||||||
| Interest Rate Contracts | — | 148,341 | ||||||||||
| * | For futures contracts, the amounts represent the cumulative appreciation/depreciation of these futures contracts as reported in the Schedule of Portfolio Investments. Only current day’s variation margin is reported within the Statement of Assets and Liabilities as variation margin on futures contracts. |
The following is a summary of the effect of derivative instruments on the Statement of Operations, categorized by risk exposure, for the year ended December 31, 2017:
| Primary Risk Exposure | Location of Gains/(Losses) on Derivatives Recognized | Realized Gains/(Losses) on Derivatives Recognized | Change in Net Unrealized Appreciation/Depreciation on Derivatives Recognized | |||||||
Equity Risk | ||||||||||
| Equity Contracts | Net Realized gains/(losses) on futures contracts/Change in net unrealized appreciation/depreciation on futures contracts | $ | 4,793,003 | $ | 390,950 | |||||
Interest Rate Risk | ||||||||||
| Interest Rate Contracts | 221,223 | 25,158 | ||||||||
3. Fees and Transactions with Affiliates and Other Parties
The Manager provides investment advisory and management services for the Fund. The Manager has contractually agreed to waive fees and reimburse the Fund to limit the annual expenses, excluding interest expense (e.g., cash overdraft fees), taxes, brokerage commissions, acquired fund fees and expenses, other expenditures that are capitalized in accordance with U.S. GAAP and other extraordinary expenses not incurred in the ordinary course of the Fund’s business, based on the daily net assets of the Fund, through April 30, 2019. Expenses incurred for investment advisory and management services are reflected on the Statement of Operations as “Manager fees.”
For the year ended December 31, 2017, the annual rate paid to the Manager and the annual expense limit were as follows:
| Annual Rate | Annual Expense Limit | |||||||||
AZL MVP Fusion Dynamic Balanced Fund | 0.20 | % | 0.30 | % | ||||||
Any amounts contractually waived or reimbursed by the Manager in a particular fiscal year will be subject to repayment by the Fund to the Manager to the extent that from time to time through the next three fiscal years the repayment will not cause the Fund’s expenses to exceed the lesser of the stated limit at the time of the waiver or the current stated limit. Any amounts recouped by the Manager during the year are reflected on the Statement of Operations as “Recoupment of prior expenses reimbursed by the Manager.” At December 31, 2017, there were no remaining contractual reimbursements that are subject to repayment by the Fund in subsequent years.
In addition, the Manager may voluntarily waive or reimburse additional fees in order to maintain more competitive expense ratios. Any voluntary waivers or reimbursements are not subject to repayment in subsequent years. Information on the total amount waived/reimbursed by the Manager or repaid to the Manager by the Fund during the period can be found on the Statement of Operations. During the year ended December 31, 2017, there were no voluntary waivers.
9
AZL MVP Fusion Dynamic Balanced Fund
Notes to the Financial Statements
December 31, 2017
The Manager or an affiliate of the Manager serves as the investment adviser of certain underlying funds in which the Fund invests. At December 31, 2017, these underlying funds are noted as Affiliated Investment Companies in the Fund’s Schedule of Portfolio Investments. Additional information, including financial statements, about these Funds is available at www.allianzlife.com. The Manager or an affiliate of the Manager is paid a separate fee from the underlying funds for such services. A summary of the Fund’s investments in affiliated investment companies for the year ended December 31, 2017 is as follows:
Fair Value 12/31/16 | Purchases at Cost | Proceeds from Sales | Net Realized Gains/(Losses) | Net Change in Appreciation/ | Fair Value 12/31/17 | Shares as of 12/31/2017 | Dividend Income | Net realized gains distributions from affiliated underlying funds | |||||||||||||||||||||||||||||||||||||
AZL DFA International Core Equity Fund | $ | 39,543,825 | $ | 510,916 | $ | (9,425,148 | ) | $ | 268,950 | $ | 8,349,988 | $ | 39,248,531 | 3,424,828 | $ | 510,917 | $ | — | |||||||||||||||||||||||||||
AZL DFA U.S. Core Equity Fund | 33,830,315 | 468,290 | (6,571,857 | ) | 976,134 | 4,856,585 | 33,559,467 | 2,630,052 | 387,413 | 71,387 | |||||||||||||||||||||||||||||||||||
AZL DFA U.S. Small Cap Fund | 17,397,011 | 625,625 | (2,345,413 | ) | 357,771 | 1,069,980 | 17,104,974 | 1,378,322 | 96,141 | 256,712 | |||||||||||||||||||||||||||||||||||
AZL Enhanced Bond Index Fund | 80,864,521 | 340,182 | (54,948,896 | ) | (907,671 | ) | 2,225,245 | 27,573,381 | 2,531,991 | 253,157 | — | ||||||||||||||||||||||||||||||||||
AZL Gateway Fund | 22,771,561 | 11,414,638 | (2,890,824 | ) | 381,319 | 1,944,090 | 33,620,784 | 2,524,083 | 329,305 | — | |||||||||||||||||||||||||||||||||||
AZL International Index Fund, Class 2 | 94,928,827 | 32,201,819 | (24,106,451 | ) | 6,537,155 | 15,084,180 | 124,645,530 | 7,204,944 | 1,098,467 | 958,085 | |||||||||||||||||||||||||||||||||||
AZL MetWest Total Return Bond Fund | 108,689,445 | 3,108,686 | (2,854,467 | ) | 71,390 | 1,358,579 | 110,373,633 | 10,820,944 | 1,677,749 | 294,162 | |||||||||||||||||||||||||||||||||||
AZL Mid Cap Index Fund, Class 2 | 44,835,598 | 17,325,883 | (32,214,632 | ) | 6,903,580 | (3,293,011 | ) | 33,557,418 | 1,430,410 | 79,418 | 870,159 | ||||||||||||||||||||||||||||||||||
AZL MSCI Emerging Markets Equity Fund, Class 2 | 32,163,373 | 20,679,498 | (11,807,760 | ) | 1,225,461 | 10,932,739 | 53,193,311 | 6,065,372 | 201,647 | 1,214,751 | |||||||||||||||||||||||||||||||||||
AZL Pyramis® Total Bond Fund, Class 2 | 108,691,698 | 3,978,231 | (3,941,116 | ) | 119,498 | 1,865,590 | 110,713,901 | 10,822,473 | 2,631,759 | — | |||||||||||||||||||||||||||||||||||
AZL Russell 1000 Growth Index Fund, Class 2 | 112,766,586 | 10,128,659 | (50,008,166 | ) | 9,048,891 | 9,129,309 | 91,065,279 | 5,987,198 | 263,931 | 9,078,772 | |||||||||||||||||||||||||||||||||||
AZL Russell 1000 Value Index Fund, Class 2 | 112,980,337 | 13,106,798 | (37,171,429 | ) | 6,434,532 | (4,276,436 | ) | 91,073,802 | 6,716,357 | 690,893 | 10,028,092 | ||||||||||||||||||||||||||||||||||
AZL Small Cap Stock Index Fund, Class 2 | 17,436,434 | 5,616,052 | (12,337,333 | ) | 1,647,741 | (1,002,843 | ) | 11,360,051 | 763,444 | 28,137 | 390,616 | ||||||||||||||||||||||||||||||||||
PIMCO VIT Income Portfolio | 56,097,198 | 1,608,007 | (12,133,624 | ) | 653,412 | 2,272,072 | 48,497,065 | 4,515,555 | 1,322,715 | — | |||||||||||||||||||||||||||||||||||
PIMCO VIT Low Duration Portfolio | 55,631,939 | 57,210,042 | (3,005,074 | ) | (137,279 | ) | 140,184 | 109,839,812 | 10,726,544 | 1,215,337 | — | ||||||||||||||||||||||||||||||||||
PIMCO VIT Total Return Portfolio | 109,124,850 | 2,747,813 | (4,889,635 | ) | 65,876 | 3,018,012 | 110,066,916 | 10,060,961 | 2,226,467 | — | |||||||||||||||||||||||||||||||||||
|
|
|
|
|
|
|
|
|
|
|
|
|
|
|
|
|
| ||||||||||||||||||||||||||||
| $ | 1,047,753,518 | $ | 181,071,139 | $ | (270,651,825 | ) | $ | 33,646,760 | $ | 53,674,263 | $ | 1,045,493,855 | 87,603,478 | $ | 13,013,453 | $ | 23,162,736 | ||||||||||||||||||||||||||||
|
|
|
|
|
|
|
|
|
|
|
|
|
|
|
|
|
| ||||||||||||||||||||||||||||
Pursuant to separate agreements between the Funds and the Manager, the Manager provides a Chief Compliance Officer (“CCO”) and certain compliance oversight and regulatory filing services to the Trust. Under these agreements the Manager is entitled to an amount equal to a portion of the compensation and certain other expenses related to the individuals performing the CCO and compliance oversight services, as well as $100 per hour for time incurred in connection with the preparation and filing of certain documents with the Securities and Exchange Commission (“SEC” or the “Commission”). The fees are paid to the Manager on a quarterly basis. The total expenses incurred by the Fund for these services are reflected on the Statement of Operations as “Administrative and compliance services fees.”
Citi Fund Services Ohio, Inc. (“Citi” or the “Administrator”), a wholly owned subsidiary of Citigroup, Inc., with which an officer of the Trust is affiliated, serves as the Trust’s administrator and fund accountant, and assists the Trust in all aspects of its administration and operation. The Administrator is entitled to a fee, accrued daily and paid monthly. The Administrator is entitled to an annual fee for each additional class of shares of any Fund, certain annual fees in supporting fair values services, and a Trust-wide annual fee for providing infrastructure and support in implementing the written policies and procedures comprising the Fund’s compliance program. The Administrator is also reimbursed for certain expenses incurred. The total expenses incurred by the Fund for these services are reflected on the Statement of Operations as “Administration fees.”
FIS Investor Services LLC (“FIS”) serves as the Fund’s transfer agent. Under the Transfer Agent Agreement, the Trust pays FIS a fee for its services and reimburses FIS for all of their reasonable out-of-pocket expenses incurred in providing these services.
The Bank of New York Mellon (“BNY Mellon” or the “Custodian”) serves as the Trust’s custodian and securities lending agent. For these services as custodian, the Funds pay BNY Mellon a fee based on a percentage of assets held on behalf of the Funds, plus certain out-of-pocket charges.
Allianz Life Financial Services, LLC (“ALFS”), an affiliate of the Manager, serves as distributor of the Fund. ALFS receives an annual Trust-wide annual fee of $7,500, paid by the Manager from its profits and not by the Trust, for recordkeeping and reporting services.
In addition, certain legal fees and expenses are paid to a law firm, Dorsey & Whitney LLP, of which the Secretary of the Fund is Senior Counsel. During the year ended December 31, 2017, $11,393 was paid from the Fund relating to these fees and expenses.
Certain Officers and Trustees of the Trust are affiliated with the Manager or the Administrator. Such Officers (except for the Trust’s CCO as noted above) and Trustees receive no compensation from the Trust for serving in their respective roles. For their service to the Trust and to the Allianz Variable Insurance Products Trust, each non-interested Trustee receives a $170,000 annual Board retainer, the Lead Director receives an additional $42,500 annually and the Chair of the Nominating and Corporate Governance Committee receives an additional $25,500 annually. In addition, the Trustees are reimbursed for certain expenses associated with attending Board meetings. Compensation to the Trustees is allocated between the Trust and the Allianz Variable Insurance Products Fund of Funds Trust in proportion to the assets under management of each trust. During the year ended December 31, 2017, actual Trustee compensation was $1,116,333 in total for both trusts.
10
AZL MVP Fusion Dynamic Balanced Fund
Notes to the Financial Statements
December 31, 2017
4. Investment Valuation Summary
The valuation techniques employed by the Fund, as described below, maximize the use of observable inputs and minimize the use of unobservable inputs in determining fair value. The inputs used for valuing the Fund’s investments are summarized in the three broad levels listed below:
| ● | Level 1 — quoted prices in active markets for identical assets |
| ● | Level 2 — other significant observable inputs (including quoted prices for similar securities, interest rates, prepayments speeds, credit risk, etc.) |
| ● | Level 3 — significant unobservable inputs (including the Fund’s own assumptions in determining the fair value of investments) |
Changes in valuation techniques may result in transfers in or out of an assigned level within the disclosure hierarchy. The Fund determines transfers between fair value hierarchy levels at the reporting period end. The inputs or methodology used for valuing investments is not necessarily an indication of the risk associated with investing in those investments.
Investments in other investment companies are valued at their published net asset value (“NAV”). Security prices are generally provided by an independent third party pricing service approved by the Trust’s Board of Trustees (the “Board” or “Trustees”) as of the close of the New York Stock Exchange (“NYSE”) (generally 4:00 pm Eastern Time). The investments utilizing Level 1 valuations represent investments in open-end investment companies. Futures contracts are valued at the last sales price as of the close of the primary exchange and are typically categorized as Level 1 in the fair value hierarchy.
For the year ended December 31, 2017, there were no Level 3 investments for which significant unobservable inputs were used to determine fair value. There were no significant transfers between Levels 1 and 2 as of December 31, 2017, based on levels assigned to securities on December 31, 2016.
The following is a summary of the valuation inputs used as of December 31, 2017 in valuing the Fund’s investments based upon the three levels defined above:
| Investment Securities: | Level 1 | Level 2 | Level 3 | Total | ||||||||||||||||
Affiliated Investment Companies | $ | 1,045,493,855 | $ | — | $ | — | $ | 1,045,493,855 | ||||||||||||
|
|
|
|
|
|
|
| |||||||||||||
Total Investment Securities | 1,045,493,855 | — | — | 1,045,493,855 | ||||||||||||||||
|
|
|
|
|
|
|
| |||||||||||||
Other Financial Instruments:* | ||||||||||||||||||||
Futures Contracts | 299,012 | — | — | 299,012 | ||||||||||||||||
|
|
|
|
|
|
|
| |||||||||||||
Total Investments | $ | 1,045,792,867 | $ | — | $ | — | $ | 1,045,792,867 | ||||||||||||
|
|
|
|
|
|
|
| |||||||||||||
Other Financial Instruments would include any derivative instruments, such as futures contracts. These investments are generally presented in the financial statements at variation margin.
5. Security Purchases and Sales
For the year ended December 31, 2017, cost of purchases and proceeds from sales of securities (excluding securities maturing less than one year from acquisition) were as follows:
| Purchases | Sales | |||||||||
AZL MVP Fusion Dynamic Balanced Fund | $ | 181,071,139 | $ | 270,651,825 | ||||||
6. Investment Risks
Derivatives Risk: The Fund may invest directly or through affiliated or unaffiliated mutual funds or unregistered investment pools in derivative instruments such as futures, options, and options on futures. A derivative is a financial contract whose value depends on, or is derived from, the value of an underlying asset, reference rate, or risk. Use of derivative instruments involves risks different from, or possibly greater than, the risks associated with investing directly in securities and other traditional investments. Derivatives are subject to a number of other risks, such as liquidity risk, interest rate risk, market risk, credit risk, and selection risk. Derivatives also involve the risk of mispricing or improper valuation and the risk that changes in the value may not correlate perfectly with the underlying asset, rate, or index. Using derivatives may result in losses, possibly in excess of the principal amount invested. Also, suitable derivative transactions may not be available in all circumstances. The other party to a derivatives contract could default.
Fund of Funds Risk: The Fund, as a shareholder of the underlying funds, indirectly bears its proportionate share of any investment management fees and other expenses of the underlying funds. Further due to the fees and expenses paid by the Fund, as well as small variations in the Fund’s actual allocations to the underlying funds and any futures and cash held in the Fund’s portfolio, the performance and income distributions of the Fund will not be the same as the performance and income distributions of the underlying funds.
7. Federal Tax Information
It is the policy of the Fund to continue to qualify as a regulated investment company by complying with the provisions available to certain investment companies, as defined under Subchapter M of the Internal Revenue Code, and to make distributions of net investment income and net realized gains sufficient to relieve it from all, or substantially all, federal income taxes. Accordingly, no provisions for federal income taxes are required in the financial statements.
Management of the Fund has reviewed tax positions taken in tax years that remain subject to examination by all major tax jurisdictions, including federal (i.e., the last four tax year ends and the interim tax period since then, as applicable). Management believes that there is no tax liability resulting from unrecognized tax benefits related to uncertain tax positions taken.
Cost of securities, including derivatives and short positions as applicable, for federal income tax purposes at December 31, 2017 is $954,466,346. The gross unrealized appreciation/(depreciation) on a tax basis is as follows:
Unrealized appreciation | $ | 93,372,228 | ||
Unrealized (depreciation) | (2,344,718 | ) | ||
|
| |||
Net unrealized appreciation/(depreciation) | $ | 91,027,510 | ||
|
|
11
AZL MVP Fusion Dynamic Balanced Fund
Notes to the Financial Statements
December 31, 2017
The tax character of dividends paid to shareholders during the year ended December 31, 2017 were as follows:
Ordinary Income | Net Long-Term Capital Gains | Total Distributions(a) | |||||||||||||
AZL MVP Fusion Dynamic Balanced Fund | $ | 18,503,054 | $ | 99,533,664 | $ | 118,036,718 | |||||||||
| (a) | Total distributions paid may differ from the Statements of Changes in Net Assets because dividends are recognized when actually paid for tax purposes. |
The tax character of dividends paid to shareholders during the year ended December 31, 2016 were as follows:
Ordinary Income | Net Long-Term Capital Gains | Total Distributions(a) | |||||||||||||
AZL MVP Fusion Dynamic Balanced Fund | $ | 25,843,598 | $ | 55,908,893 | $ | 81,752,491 | |||||||||
| (a) | Total distributions paid may differ from the Statements of Changes in Net Assets because dividends are recognized when actually paid for tax purposes. |
At December 31, 2017, the components of accumulated earnings on a tax basis were as follows:
Undistributed Ordinary Income | Undistributed Long-Term Capital Gains | Accumulated Capital and Other Losses | Unrealized Appreciation/ Depreciation(a) | Total Accumulated Earnings/ (Deficit) | |||||||||||||||||||||
AZL MVP Fusion Dynamic Balanced Fund | $ | 21,121,862 | $ | 51,173,234 | $ | — | $ | 91,027,510 | $ | 163,322,606 | |||||||||||||||
| (a) | The difference between book-basis and tax-basis unrealized appreciation/depreciation is attributable primarily to tax deferral of losses on wash sales. |
8. Ownership and Principal Holders
The beneficial ownership, either directly or indirectly, of more than 25% of the voting securities of a fund creates presumptions of control of the fund, under section 2 (a)(9) of the 1940 Act. As of December 31, 2017, the Fund had an individual shareholder account which is affiliated with the Investment Adviser representing ownership in excess of 90% of the Fund.
9. Investment Company Reporting Modernization
In October 2016, the SEC released its Final Rule on Investment Company Reporting Modernization (the “Rules”). The Rules which introduce two new regulatory reporting forms for investment companies — Form N-PORT and Form N-CEN — also contain amendments to Regulation S-X which require standardized, enhanced disclosures about derivatives in investment company financial statements, as well as other amendments. The amendments to Regulation S-X became effective for filings made with the SEC after August 1, 2017. The compliance date for form N-PORT and Form N-CEN will vary based on the reporting entity’s size and, in the case of the Fund, is expected to be April 30, 2019. The Fund’s adoption of these amendments, as applicable for the financial statements prepared as of December 31, 2017, had no effect on the Fund’s net assets or results of operations.
10. Subsequent Events
Management of the Fund has evaluated the need for additional disclosures or adjustments resulting from events through the date the financial statements were issued. Based on this evaluation, there were no subsequent events to report that would have material impact on the Fund’s financial statements.
12
REPORT OF INDEPENDENT REGISTERED PUBLIC ACCOUNTING FIRM
To the Shareholders and Board of Trustees of
Allianz Variable Insurance Products Fund of Funds Trust:
Opinion on the Financial Statements
We have audited the accompanying statement of assets and liabilities of AZL MVP Fusion Dynamic Balanced Fund (the “Fund”) of the Allianz Variable Insurance Products Fund of Funds Trust, including the schedule of portfolio investments, as of December 31, 2017, and the related statement of operations for the year then ended, the statements of changes in net assets for each of the years in the two-year period then ended, and the related notes (collectively, the “financial statements”) and the financial highlights for each of the years in the five-year period then ended. In our opinion, the financial statements present fairly, in all material respects, the financial position of the Fund as of December 31, 2017, the results of its operations for the year then ended, the changes in its net assets for each of the years in the two-year period then ended and the financial highlights for each of the years in the five-year period then ended, in conformity with U.S. generally accepted accounting principles.
Basis for Opinion
These financial statements and financial highlights are the responsibility of the Fund’s management. Our responsibility is to express an opinion on these financial statements and financial highlights based on our audits. We are a public accounting firm registered with the Public Company Accounting Oversight Board (United States) (“PCAOB”) and are required to be independent with respect to the Fund in accordance with the U.S. federal securities laws and the applicable rules and regulations of the Securities and Exchange Commission and the PCAOB.
We conducted our audits in accordance with the standards of the PCAOB. Those standards require that we plan and perform the audit to obtain reasonable assurance about whether the financial statements and financial highlights are free of material misstatement, whether due to error or fraud. Our audits included performing procedures to assess the risks of material misstatement of the financial statements and financial highlights, whether due to error or fraud, and performing procedures that respond to those risks. Such procedures included examining, on a test basis, evidence regarding the amounts and disclosures in the financial statements and financial highlights. Such procedures also included confirmation of securities owned as of December 31, 2017, by correspondence with the investees, brokers, and transfer agents of the underlying funds. Our audits also included evaluating the accounting principles used and significant estimates made by management, as well as evaluating the overall presentation of the financial statements and financial highlights. We believe that our audits provide a reasonable basis for our opinion.
/s/ KPMG LLP
We have served as the auditor of one or more Allianz Variable Insurance Products investment companies since 1999.
Columbus, Ohio
February 23, 2018
13
Other Federal Income Tax Information (Unaudited)
For the year ended December 31, 2017, 21.02% of the total ordinary income dividends paid by the Fund qualify for the corporate dividends received deduction available to corporate shareholders.
During the year ended December 31, 2017, the Fund declared net long-term capital gain distributions of $99,533,664.
14
A description of the policies and procedures that the Fund uses to determine how to vote proxies relating to portfolio securities is available, without charge, upon request, by visiting the Securities and Exchange Commission’s (“Commission”) website at www.sec.gov, or by calling 800-624-0197.
Information regarding how the Fund voted proxies relating to portfolio securities during the most recent 12-month period ended June 30th is available (i) without charge, upon request, by calling 800-624-0197; (ii) on the Allianz Variable Insurance Products Trust’s website at https://www.allianzlife.com; and (iii) on the Commission’s website at http://www.sec.gov.
The Fund files complete Schedules of Portfolio Holdings with the Commission for the first and third quarters of each fiscal year on Form N-Q. Schedules of Portfolio Holdings for the Fund in this report are available without charge on the Commission’s website at http://www.sec.gov, or may be reviewed and copied at the Commission’s Public Reference Room in Washington, D.C. Information on the operation of the Public Reference Room may be obtained by calling 800-SEC-0330.
15
Approval of Investment Advisory Agreement (Unaudited)
Subject to the general supervision of the Board of Trustees (the “Board”) and in accordance with the investment objectives and restrictions of each separate series (together, the “Funds”) of the Allianz Variable Insurance Products Fund of Funds Trust (the “Trust”), investment advisory services are provided to the Funds by Allianz Investment Management LLC (the “Manager”). As used in this section, “Fund” refers to any of the Funds. The Manager manages each Fund pursuant to an investment management agreement (the “Management Agreement”) with the Trust in respect of each such Fund. The Management Agreement provides that the Manager, subject to the supervision and approval of the Board, is responsible for the management of each Fund. For management services, each Fund pays the Manager an investment advisory fee based upon each Fund’s average daily net assets. The Manager has contractually agreed to limit the expenses of each Fund by reimbursing the Fund if and when total Fund operating expenses exceed certain amounts until at least May 1, 2019 (the “Expense Limitation Agreement”).
In reviewing the services provided by the Manager and the terms of the Management Agreement, the Board receives and reviews information related to the Manager’s experience and expertise in the variable insurance marketplace. Currently, the Funds are offered only through variable annuities and variable life insurance policies, and not in the retail fund market. In addition, the Board receives information regarding the Manager’s expertise with regard to portfolio diversification and asset allocation requirements within variable insurance products issued by Allianz Life Insurance Company of North America (“Allianz Life”) and its subsidiary, Allianz Life Insurance Company of New York (“Allianz of New York”). Currently, the Funds are offered only through Allianz Life and Allianz of New York variable products.
As required by the Investment Company Act of 1940 (the “1940 Act”), the Board has reviewed and approved the Management Agreement with the Manager. The Board’s decision to approve this contract reflects the exercise of its business judgment on whether to approve new arrangements and continue the existing arrangements. During its review of the contract, the Board considered many factors, among the most material of which are: the Fund’s investment objectives and long-term performance; the Manager’s management philosophy, personnel, processes and investment performance, including its compliance history and the adequacy of its compliance processes; the preferences and expectations of Fund shareholders (and underlying contract owners) and their relative sophistication; the continuing state of competition in the mutual fund industry; and comparable fees in the mutual fund industry.
The Board also considered the compensation and benefits received by the Manager. This includes fees received for services provided to a Fund by employees of the Manager or of affiliates of the Manager and research services received by the Manager from brokers that execute Fund trades, as well as advisory fees. The Board considered the fact that: (1) the Manager and the Trust are parties to an Administrative Services Agreement and a Compliance Services Agreement, under which the Manager is compensated by the Trust for performing certain administrative and compliance services including providing an employee of the Manager or one of its affiliates to act as the Trust’s Chief Compliance Officer; and (2) Allianz Life Financial Services, LLC, an affiliated person of the Manager, is a registered securities broker-dealer and received (along with its affiliated persons) payments made by the underlying funds pursuant to Rule 12b-1.
The Board is aware that various courts have interpreted provisions of the 1940 Act and have indicated in their decisions that the following factors may be relevant to an adviser’s compensation: the nature and quality of the services provided by the adviser, including the performance of the fund; the adviser’s cost of providing the services; the extent to which the adviser may realize “economies of scale” as the fund grows larger; any indirect benefits that may accrue to the adviser and its affiliates as a result of the adviser’s relationship with the fund; performance and expenses of comparable funds; the profitability of acting as adviser to the fund; and the extent to which the independent Board members, who are not “interested persons” of a fund as defined by the 1940 Act, are fully informed about all facts bearing on the adviser’s services and fees. The Board is aware of these factors and takes them into account in its review of the Management Agreement for the Funds.
The Board considered and weighed these circumstances in light of its experience in governing the Trust, and is assisted in its deliberations by the advice of independent legal counsel to the independent Trustees. In this regard, the Board requests and receives a significant amount of information about the Funds and the Manager. Some of this information is provided at each regular meeting of the Board; additional information is provided in connection with the particular meeting or meetings at which the Board’s formal review of an advisory contract occurs. In between regularly scheduled meetings, the Board may receive information on particular matters as the need arises. Thus, the Board’s evaluation of the Management Agreement is informed by reports covering such matters as: the Manager’s investment philosophy, personnel and processes, and the Fund’s investment performance (in absolute terms as well as in relationship to its benchmark). In connection with comparing the performance of each Fund versus its benchmark, the Board receives reports on the extent to which the Fund’s performance may be attributed to various applicable factors, such as asset class allocation decisions and volatility management strategies, the performance of the underlying funds, rebalancing decisions, and the impact of cash positions and Fund fees and expenses. The Board also receives reports on the Funds’ expenses (including the advisory fee itself and the overall expense structure of the Funds, both in absolute terms and relative to similar and/or competing funds, with due regard for the Expense Limitation Agreement and additional voluntary expense limitations); the nature and extent of the advisory and other services provided to the Fund by the Manager and its affiliates; compliance and audit reports concerning the Funds and the companies that service them; and relevant developments in the mutual fund industry and how the Funds and/or the Manager are responding to them.
The Board also receives financial information about the Manager, including reports on the compensation and benefits the Manager derives from its relationships with the Funds. These reports cover not only the fees under the Management Agreement, but also fees, if any, received for providing other services to the Funds. The reports also discuss any indirect or “fall out” benefits the Manager or its affiliates may derive from its relationship with the Funds.
The Management Agreement was most recently considered at Board meetings held in the fall of 2017. Information relevant to the approval of the Management Agreement was considered at a telephonic Board meeting on October 18, 2017, and at an “in person” Board meeting held October 23, 2017. The Management Agreement was approved at the Board meeting of October 23, 2017. At such meeting the Board also approved the Expense Limitation Agreement between the Manager and the Trust for the period ending April 30, 2019. In connection with such meetings, the Trustees requested and evaluated extensive materials from the Manager, including performance and expense information for other investment companies with similar investment objectives derived from data compiled by an independent third party provider and other sources believed to be reliable by the Manager. Prior to voting, the Trustees reviewed the proposed approval/continuance of the Agreement with management and with experienced counsel who are independent of the Manager and received a memorandum from such counsel discussing the legal standards for their consideration of the proposed approvals/continuances. The independent Trustees also discussed the proposed approvals/continuances in a private session with such counsel at which no representatives of the Manager were present. In reaching their determinations relating to the approval and/or continuance of the Agreement, in respect of each Fund, the Board considered all factors it believed relevant. The Board based its decision to approve the Management Agreement on the totality of the circumstances and relevant factors, and with a view to past and future long-term considerations. Not all of the factors and considerations discussed above and below are necessarily relevant to every Fund, and the Board did not assign relative weights to factors discussed herein or deem any one or group of them to be controlling in and of themselves.
An SEC rule requires that shareholder reports include a discussion of certain factors relating to the selection of the investment adviser and the approval of the advisory fee. The “factors” enumerated by the SEC are set forth below in italics, as well as the Board’s conclusions regarding such factors:
(1) The nature, extent and quality of services provided by the Manager. The Trustees noted that the Manager, subject to the control of the Board, administers each Fund’s business and other affairs. The Trustees noted that the Manager also provides the Trust and each Fund with such administrative and other services (exclusive of, and in addition to, any such services provided by any others retained by the Trust on behalf of the Funds) and executive and other personnel as are necessary for the operation of the Trust and the Funds. Except for the Trust’s Chief Compliance Officer and certain compliance staff, the Manager pays all of the compensation of Trustees and officers of the Trust who are employees of the Manager or its affiliates.
16
The Board considered the scope and quality of services provided by the Manager and noted that the scope of such services provided had expanded as a result of recent regulatory and other developments. The Board noted that, for example, the Manager is responsible for maintaining and monitoring its own compliance program, and this compliance program has been continuously refined and enhanced in light of new regulatory requirements. The Board considered the capabilities and resources which the Manager has dedicated to performing services on behalf of the Trust and its Funds. The quality of administrative and other services, including the Manager’s role in coordinating the activities of the Trust’s other service providers, also were considered. The Board concluded that, overall, they were satisfied with the nature, extent and quality of services provided (and expected to be provided) to the Trust and to each of the Funds under the Management Agreement.
(2) The investment performance of the Funds and the Manager. In connection with every in-person quarterly Board meeting and the fall 2017 contract review process, Trustees received extensive information on the performance results of each Fund. This included, for example, performance information on absolute total return, performance versus the appropriate benchmark(s), the contribution to performance of the Manager’s asset class allocation decisions and volatility management strategies, the performance of the underlying funds, and the impact on performance of rebalancing decisions, cash and Fund fees. This included Lipper performance information on the Funds for the previous quarter, year-to-date, and previous one-, three- and five-year periods, to the extent the Funds were in existence for such periods. (For Funds which have been in existence for less than five years, the Board received performance information on shorter time periods to the extent available.) For example, in connection with the Board meeting held October 23, 2017, the Manager reported that for the five Funds for which performance information for the five year period ended June 30, 2017 was available, two were in the top 40%, two were in the middle 20%, and one was in the bottom 40%. None of these Funds was in the bottom 40% for the three- or one-year periods. The Manager reported that for the three-year period ended June 30, 2017, for the six Funds for which three year performance information was available, four Funds were in the top 40% and two Funds were in the middle 20%. For the eight Funds for which one-year performance information was available, for the one-year period ended June 30, 2017, four Funds were in the top 40%, two Funds were in the middle 20%, and two Funds were in the bottom 40%.
At the Board meeting held October 23, 2017, the Manager also reported upon the performance of the MVP Funds compared to custom managed-volatility peer groups. For the seven Funds for which three-year performance information was available, for the three-year period ended June 30, 2017, five Funds were in the top 40%, one Fund was in the middle 20%, and one was in the bottom 40%. For the eight Funds for which one year performance was available, for the one-year period ended June 30, 2017, four Funds were in the top 40% and four Funds were in the middle 20%. All six Funds for which five-year performance information was available were in the top 40%.
At the Board meeting held October 23, 2017, the Trustees determined that the investment performance of the Funds was acceptable.
(3) The costs of services to be provided and profits to be realized by the Manager and its affiliates from the relationship with the Funds. The Board considered that the Manager receives an advisory fee from each of the Funds. The Manager reported that for the three MVP Fusion Dynamic Funds the advisory fee paid put these Funds in the 44th percentile of the customized peer group. The Manager reported that for three MVP Index Strategy Funds the advisory fee paid put them in the 27th percentile of the customized peer group, and for the two non-MVP Index Strategy Funds, as well as the AZL DFA Multi-Strategy Fund, the advisory fee paid put them in the 13th percentile of the customized peer group. The Manager reported that for the AZL MVP BlackRock Global Strategy Plus, AZL MVP DFA Multi-Strategy, AZL MVP Pyramis Multi-Strategy, and AZL MVP T. Rowe Price Capital Appreciation Plus Funds, the advisory fee paid was in the 9th percentile. (A lower percentile reflects lower fund fees and is better for fund shareholders.) Trustees were provided with information on the total expense ratios of the Funds and other funds in the customized peer groups, and the Manager reported upon the challenges in making peer group comparisons for the Funds.
The Manager provided information concerning the profitability of the Manager’s investment advisory activities for the period from 2014 through June 30, 2017. The Board recognized that it is difficult to make comparisons of profitability from investment company advisory agreements because comparative information is not generally publicly available and is affected by numerous factors, including the structure of the particular adviser, the types of funds it manages, its business mix, numerous assumptions regarding allocation of expenses and the adviser’s capital structure and cost of capital. In considering profitability information, the Board considered the possible effect of certain fall-out benefits to the Manager and its affiliates. The Board focused on profitability of the Manager’s relationships with the Funds before taxes and distribution expenses. The Board recognized that the Manager should earn a reasonable level of profits for the services it provides to each Fund.
The Board also considered that Wilshire Funds Management (“Wilshire”) serves as a consultant to the Manager in preparing statistical and other factual information for use in the creation and maintenance of the asset allocation models for the Fusion Funds (the AZL MVP Fusion Dynamic Conservative, Balanced, and Moderate Funds), pursuant to an agreement between the Manager and Wilshire. Wilshire serves as a consultant to the Manager with respect to selecting the Fusion Funds’ underlying funds and the asset allocations among the underlying funds. The Manager, not any Fund, pays a consultant fee to Wilshire.
Based upon the information provided, the Board concluded that the Funds’ advisory fees and expense ratios are not unreasonable, and determined that there was no evidence that the Manager’s level of profitability from its relationship with the Funds was excessive.
(4) and (5) The extent to which economies of scale would be realized as the Funds grow, and whether fee levels reflect these economies of scale. The Board noted that the advisory fee schedules for the Funds do not contain breakpoints that reduce the fee rate on assets above specified levels. The Board recognized that breakpoints may be an appropriate way for the Manager to share its economies of scale, if any, with Funds that have substantial assets. The Board found there was no uniform methodology for establishing breakpoints that give effect to Fund-specific services provided by the Manager. The Board noted that in the fund industry as a whole, as well as among funds similar to the Funds, there is no uniformity or pattern in the fees and asset levels at which breakpoints (if any) apply. Depending on the age, size, and other characteristics of a particular fund and its manager’s cost structure, different conclusions can be drawn as to whether there are economies of scale to be realized at any particular level of assets, notwithstanding the intuitive conclusion that such economies exist, or will be realized at some level of total assets. Moreover, because different managers have different cost structures and service models, it is difficult to draw meaningful conclusions from the breakpoints that may have been adopted by other funds. The Board also noted that the advisory agreements for many funds do not have breakpoints at all, or if breakpoints exist, they may be at asset levels significantly greater than those of the individual Funds. The Board also noted that the total assets in all of the Funds, as of June 30, 2017, were approximately $10.8 billion and that the largest Fund, the AZL MVP Growth Index Strategy Fund, had assets of approximately $2.4 billion.
The Board noted that the Manager has agreed to temporarily limit Fund expenses under the Expense Limitation Agreement, which has the effect of reducing expenses as would the implementation of advisory fee breakpoints. The Manager has committed to continue to consider the continuation of expense limits and/or advisory fee breakpoints as the Funds grow larger. The Board receives quarterly reports on the level of Fund assets. The Board expects to continue to consider: (a) the extent to which economies of scale have been realized, and (b) whether the advisory fee should be modified, either in connection with the next renewal of the Agreements or by modifying the Expense Limitation Agreement, to reflect such economies of scale, if any.
Having taken these factors into account, the Board concluded that the absence of breakpoints in the Funds’ advisory fee rate schedules was acceptable under each Fund’s circumstances.
17
Information about the Board of Trustees and Officers (Unaudited)
The Trust is managed by the Trustees in accordance with the laws of the state of Delaware governing business trusts. There are currently eight Trustees, one of whom is an “interested person” of the Trust within the meaning of that term under the 1940 Act. The Trustees and Officers of the Trust, and their addresses, ages, positions held with the Trust, terms of office with the Trust and length of time served, principal occupation(s) during the past five years, the number of portfolios in the Trust they oversee, and other directorships held during the past five years are as follows:
Non-Interested Trustees(1)
| Name, Address, and Year of Birth | Positions Held with Allianz VIP and VIP FOF Trust | Term of Office(2)/Length of Time Served | Principal Occupation(s) During Past 5 Years | Number of Portfolios Overseen for Allianz VIP and VIP FOF Trust | Other AZL Fund Complex | |||||
| Peter R. Burnim (1947) 5701 Golden Hills Drive Minneapolis, MN 55416 | Trustee | Since 2/07 | Consultant/Chair, various companies: Chairman, Emrys Analytics and subsidiaries, July 2015 to present; Chairman, Argus Investment Strategies Fund Ltd., February 2013 to 2017; Managing Director, iQ Venture Advisors, LLC, 2005 to present; Chairman, Northstar Group Holdings Ltd. Bermuda, 2011 to present; Chairman Sterling Bank & Trust (Bahamas) Ltd., 2016 to present, and Expert Witness, Massachusetts Department of Revenue, 2011 to 2016. | 35 | Argus Group Holdings and Subsidiaries; Northstar Group Holdings; Sterling Trust (Cayman) Ltd.; Sterling Bank & Trust Limited (Bahamas); Emrys Analytics; EGB Insurance. | |||||
| Peggy L. Ettestad (1957) 5701 Golden Hills Drive Minneapolis, MN 55416 | Lead Independent Trustee | Since 10/14 (Trustee since 2/07) | Managing Director, Red Canoe Management Consulting LLC, 2008 to present | 35 | Luther College | |||||
| Tamara Lynn Fagely (1958) 5701 Golden Hills Drive Minneapolis, MN 55416 | Trustee | Since 12/17 | Retired; Chief Operations Officer, Hartford Funds, March 2012 to December 2013 | 35 | Diamond Hill Funds (13 funds) | |||||
| Richard H. Forde (1953) 5701 Golden Hills Drive Minneapolis, MN 55416 | Trustee | Since 12/17 | Member of the Board and Chairman of the Finance and Investment Committee, Connecticut Water Service, Inc., October 2013 to present; Senior Vice President and Chief Investment Officer, CIGNA, 2004 to 2012 | 35 | Connecticut Water Service, Inc. | |||||
| Claire R. Leonardi (1955) 5701 Golden Hills Drive Minneapolis, MN 55416 | Trustee | Since 2/04 | Chief Executive Officer, Health eSense Inc., 2015 to Present; CEO, Connecticut Innovations, Inc., 2012 to 2015; General Partner, Fairview Capital, L.P., 1994 to 2012 | 35 | reSet Social Enterprise Investment Fund | |||||
| Dickson W. Lewis (1948) 5701 Golden Hills Drive Minneapolis, MN 55416 | Trustee | Since 2/04 | Retired; Vice President/General Manager, Yearbooks & Canada-Lifetouch National School Studios, 2006 to 2014; Vice President/General Manager of Jostens, Inc., 2002 to 2006; Senior Vice President of Fortis Group, 1997 to 2002 | 35 | None | |||||
| Arthur C. Reeds, III (1944) 5701 Golden Hills Drive Minneapolis, MN 55416 | Trustee | Since 10/99 | Retired; Senior Investment Officer, Hartford Foundation for Public Giving, 2000 to 2003; Chairman, Chief Executive and President of Conning Corp., 1999 to 2000 | 35 | Connecticut Water Service, Inc. |
Interested Trustees(3)
| Name, Address, and Year of Birth | Positions Held with Allianz VIP and VIP FOF Trust | Term of Office(2)/Length of Time Served | Principal Occupation(s) During Past 5 Years | Number of Portfolios Overseen for Allianz VIP and VIP FOF Trust | Other AZL Fund Complex | |||||
Brian Muench (1970) 5701 Golden Hills Drive | Trustee | Since 6/11 | President, Allianz Investment Management LLC, November 2010 to present; Vice President, Allianz Life, April 2011 to present | 35 | None |
18
Officers
| Name, Address, and Age | Positions Held with Allianz VIP and VIP FOF Trust | Term of Office(2)/Length of Time Served | Principal Occupation(s) During Past 5 Years | |||
Brian Muench (1970) 5701 Golden Hills Drive | President | Since 11/10 | President, Allianz Investment Management LLC, November 2010 to present; Vice President, Allianz Life, April 2011 to present. | |||
| Michael Radmer (1945) Dorsey & Whitney LLP, Suite 1500 50 South Sixth Street Minneapolis, MN 55402-1498 | Secretary | Since 02/02 | Senior Counsel (previously, Partner), Dorsey and Whitney LLP since 1976. | |||
| Bashir C. Asad (1963) Citi Fund Services Ohio, Inc. 4400 Easton Commons, Suite 200 Columbus, OH 43219 | Treasurer, Principal Accounting Officer and Principal Financial Officer | Since 06/16 | Senior Vice President, Citi Fund Services Ohio, Inc. | |||
| Chris R. Pheiffer (1968) 5701 Golden Hills Drive Minneapolis, MN 55416 | Chief Compliance Officer(4) and Anti-MoneyLaundering Compliance Officer | Since 02/14 | Chief Compliance Officer of the VIP Trust and the FOF Trust, February 2014 to present; Deputy Chief Compliance Officer of the VIP Trust and the FOF Trust and Compliance Director, Allianz Life, February 2007 to February 2014. |
| (1) | Member of the Audit Committee. |
| (2) | Indefinite. |
| (3) | Is an “interested person”, as defined by the 1940 Act, due to employment by Allianz. |
| (4) | The Manager and the Trust are parties to a Chief Compliance Officer Agreement under which the Manager is compensated by the Trust for providing an employee of the Manager or one of its affiliates to act as the Trust’s Chief Compliance Officer. The Chief Compliance Officer and Anti-Money Laundering Compliance Officer is not considered a corporate officer or executive employee of the Trust. |
19
The Allianz VIP Fund of Funds are distributed by Allianz Life Financial Services, LLC. These Funds are not FDIC Insured. | ANNRPT1217 2/18 |
AZL MVP FusionSM Dynamic Conservative Fund
Annual Report
December 31, 2017
Table of Contents
Management Discussion and Analysis
Page 1
Expense Examples and Portfolio Composition
Page 3
Schedule of Portfolio Investments
Page 4
Statement of Assets and Liabilities
Page 5
Page 5
Statements of Changes in Net Assets
Page 6
Page 7
Notes to the Financial Statements
Page 8
Report of Independent Registered Public Accounting Firm
Page 13
Other Federal Income Tax Information
Page 14
Page 15
Approval of Investment Advisory Agreement
Page 16
Information about the Board of Trustees and Officers
Page 18
This report is submitted for the general information of the shareholder of the Fund. The report is not authorized for distribution to prospective investors in the Fund unless preceded or accompanied by an effective prospectus, which contains details concerning the sales charges and other pertinent information.
AZL MVP FusionSM Dynamic Conservative Fund Review (Unaudited)
Allianz Investment Management LLC
serves as Manager for the AZL MVP
FusionSM Dynamic Conservative Fund.
What factors affected the Fund’s performance during the year ended December 31, 2017?
For the year ended December 31, 2017, the AZL MVP FusionSM Dynamic Conservative Fund (the “Fund”) returned 9.31%. That compared to a 21.83%, 3.54% and a 9.70% total return for its benchmarks, the S&P 500 Index1, the Bloomberg Barclays U.S. Aggregate Bond Index1, and the Conservative Composite Index1, respectively.
The Fund is a fund of funds that achieves broad diversification by investing in underlying funds. The Fund typically holds between 25% and 45% of its assets in equity funds and 55% to 75% of its assets in fixed-income funds. The Fund also employs the MVP (Managed Volatility Portfolio) risk management process, which is intended to adjust the risk of the portfolio based on quantitative indicators of market risk, such as the current level of fund and market volatility.*
Global economic expansion led major stock indexes to new all-time highs during the period under review. The S&P 500 Index gained 21.83% during the period, supported by a positive economic environment marked by solid jobs growth, low unemployment, increased business investment, strong consumer confidence and a low volatility environment. Mid- and small-cap stocks also performed well during the period. The S&P MidCap 400 Index2 generated a 16.24% return and the SmallCap 600 Index3 returned 13.23%. Growth stocks were also heavily favored during the year and significantly outperformed value stocks.
International developed markets, as measured by the MSCI EAFE Index4, fared even better than U.S. equities, posting a 25.62% return for the period. Emerging markets equities, as measured by the MSCI Emerging Markets Equity Index5, posted a return of 37.75% and thereby ended years of underperformance versus domestic and developed international markets.
The U.S. bond market was generally positive, as the market rewarded investors who took on interest rate and spread risk. The Bloomberg Barclays U.S. Aggregate Bond Index gained 3.54%. Bond investors generally tolerated risks in a hunt for yield. Spreads ended the year tighter than when the year began, and high yield spreads tightened markedly. Meanwhile, the yield curve flattened sharply, as three Fed rate hikes sent short-term yields higher while investor demand for yield pushed long-term yields lower.
The Fund, which invests in both U.S. and international markets, modestly underperformed its composite benchmark in 2017. Above-benchmark allocations to mid- and small-cap U.S. equity detracted from the Fund’s performance relative to the S&P 500 Index, as smaller stocks generally lagged their large-cap counterparts. An allocation to hedged equity also hindered returns, as higher beta6 (more volatile) strategies were better rewarded during the period.*
The Fund’s off-benchmark allocation to shorter-term bonds also detracted modestly from relative returns as longer-term bonds outperformed.*
These negative impacts were partly offset by the Fund’s exposure to overseas markets. Off-benchmark allocations to international developed and emerging markets equity along with a dynamic tilt toward those indexes supported relative returns, as non-U.S. equity markets broadly outperformed their domestic counterparts during the period.*
Stock selection within the Fund’s holdings had a net positive impact on relative results. The negative effects of stock choice within the Fund’s equity holdings were more than offset by the benefits of security selection with its fixed income holdings.*
The MVP risk management process, which includes the use of derivatives, worked as intended during the period under review. Given that the period was marked by low volatility, the MVP maintained a neutral equity allocation for the year relative to its target.*
Past performance does not guarantee future results.
| * | The Fund’s portfolio composition is subject to change. There is no guarantee that any sectors mentioned will continue to perform well or that securities in such sectors will be held by the Fund in the future. The information contained in this commentary is for informational purposes only and should not be construed as a recommendation to purchase or sell securities in the sector mentioned. The Fund’s holdings and weightings are as of December 31, 2017. |
| 1 | For a complete description of the Fund’s performance benchmarks please refer to page 2 of this report. |
| 2 | The Standard & Poor’s MidCap 400 Index (“S&P 400”) is the most widely used index for mid-sized companies. The S&P 400 covers 7% of the U.S. equities market, and is part of a series of S&P U.S. indices that can be used as building blocks for portfolio composition. |
| 3 | The Standard & Poor’s SmallCap 600 Index (“S&P 600”) covers approximately 3% of the domestic equities market. Measuring the small-cap segment of the market that is typically renowned for poor trading liquidity and financial instability, the index is designed to be an efficient portfolio of companies that meet specific inclusion criteria to ensure that they are investable and financially viable. |
| 4 | The Morgan Stanley Capital International, Europe, Australasia and Far East (“MSCI EAFE”) Index is a free float-adjusted market capitalization-weighted index that is designed to measure the equity market performance of developed markets, excluding the U.S. & Canada. |
| 5 | The MSCI Emerging Markets Index (“MSCI EM”) is a free float-adjusted market capitalization index that is designed to measure equity performance of emerging markets. |
| 6 | Beta is a measure of the volatility, or systematic risk, of a security or a portfolio in comparison to the market as a whole. Beta is used in the capital asset pricing model, which calculates the expected return of an asset based on its beta and expected market returns. |
| Investors cannot invest directly in an index. |
1
AZL MVP FusionSM Dynamic Conservative Fund Review (Unaudited)
Fund Objective
The Fund’s investment objective is to seek long-term capital appreciation with preservation of capital as an important consideration. This objective may be changed by the Trustees of the Fund without shareholder approval. The Fund seeks to achieve its objective by investing in a combination of Permitted Underlying Funds that represent different classes in the Fund’s asset allocation.
Investment Concerns
The Fund invests in underlying funds, so its investment performance is directly related to the performance of those underlying funds. Before investing, investors should assess the risks associated with and types of investments made by each of the underlying funds in which the Fund invests.
Stocks are more volatile and carry more risk and return potential than other forms of investments.
Emerging market investing may be subject to additional economic, political, liquidity, and currency risks not associated with more developed countries.
International investing may involve risk of capital loss from unfavorable fluctuations in currency values, from differences in generally accepted accounting principles or from economic or political instability in other nations.
Small- to mid-capitalization companies typically have a higher risk of failure and historically have experienced a greater degree of volatility.
The performance of the Fund is expected to be lower than that of the Indices because of Fund fees and expenses. Securities in which the Fund will invest may involve substantial risk and may be subject to sudden severe price declines.
Bonds offer a relatively stable level of income, although bond prices will fluctuate, providing the potential for principal gain or loss.
Investing in derivatives instruments involves risks that may be different from or greater than the risk associated with investing directly in securities or other traditional instruments.
For a complete description of these and other risks associated with investing in a mutual Fund, please refer to the Fund’s prospectus.
Growth of $10,000 Investment
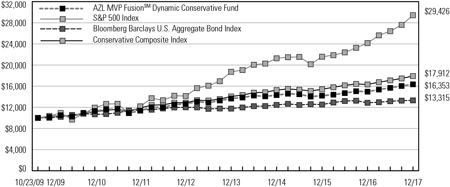
The chart above represents a comparison of a hypothetical investment in the Fund versus a similar investment in the Fund’s benchmark, as well as the two component indices of the Fund’s benchmark, and represents the reinvestment of dividends and capital gains in the Fund.
Average Annual Total Returns as of December 31, 2017
| 1 Year | 3 Year | 5 Year | Since Inception (10/23/09) | |||||||||||||
AZL MVP FusionSM Dynamic Conservative Fund | 9.31 | % | 4.53 | % | 5.27 | % | 6.19 | % | ||||||||
S&P 500 Index | 21.83 | % | 11.41 | % | 15.79 | % | �� | 14.09 | % | |||||||
Bloomberg Barclays U.S. Aggregate Bond Index | 3.54 | % | 2.24 | % | 2.10 | % | 3.56 | % | ||||||||
Conservative Composite Index | 9.70 | % | 5.46 | % | 6.83 | % | 7.38 | % | ||||||||
Past performance does not guarantee future results. The performance data quoted represents past performance and current returns may be lower or higher. The investment return and principal value will fluctuate so that an investor’s shares, when redeemed may be worth more or less than the original cost. To obtain performance information current to the most recent month end, please visit www.Allianzlife.com.
Expense Ratio | Gross | |||
AZL MVP FusionSM Dynamic Conservative Fund | 0.97 | % | ||
The above expense ratio is based on the current Fund prospectus dated May 1, 2017. The Manager and the Fund have entered into a written contract limiting operating expenses, excluding certain expenses (such as interest expense and acquired fund fees and expenses), to 0.35% through April 30, 2019. Additional information pertaining to the December 31, 2017 expense ratios can be found in the financial highlights.
Acquired fund fees and expenses are incurred indirectly by the Fund through the valuation of the Fund’s investments in the Permitted Underlying Funds. Accordingly, acquired fees and expenses affect the Fund’s total returns. Because these fees and expenses are not included in the Fund’s financial highlights, the Fund’s total annual fund operating expenses, as shown in the current prospectus, do not correlate to the ratios of expenses to average net assets shown in the financial highlights table. Without acquired fund fees and expenses the Fund’s gross expense ratio would be 0.24%.
The total return of the Fund does not reflect the effect of any insurance charges, the annual maintenance fee or the deduction of taxes that a shareholder would pay on Fund distributions or the redemption of Fund shares. Such charges, fees and tax payments would reduce the performance quoted.
The Fund’s performance is measured against the Standard & Poor’s 500 Index (“S&P 500”), the Bloomberg Barclays U.S. Aggregate Bond Index and the Conservative Composite Index (“Composite”). The S&P 500 is representative of 500 selected common stocks, most of which are listed on the New York Stock Exchange, and is a measure of the U.S. Stock market as a whole. The Bloomberg Barclays U.S. Aggregate Bond Index is a market value-weighted performance benchmark for investment-grade fixed-rate debt issues, including government, corporate, asset-backed, and mortgage-backed securities, with maturities of at least one year. The Composite is a blended index comprised of (35%) S&P 500 and (65%) Bloomberg Barclays U.S. Aggregate Bond Index. These indexes are unmanaged and do not reflect the deduction of fees associated with a mutual fund, such as investment management and fund accounting fees. The Fund’s performance reflects the deduction of fees for services provided to the Fund. Investors cannot invest directly in an index.
2
AZL MVP Fusion Dynamic Conservative Fund
(Unaudited)
As a shareholder of the AZL MVP Fusion Dynamic Conservative Fund (the “Fund”), you incur ongoing costs, including management fees, distribution fees, and other Fund expenses. These examples are intended to help you understand your ongoing costs (in dollars) of investing in the Fund and to compare these costs with the ongoing costs of investing in other mutual funds. Please note that the expenses shown in each table do not reflect expenses that apply to the subaccount or the insurance contract. If the expenses that apply to the subaccount of the insurance contract were included, your costs would have been higher.
These examples are based on an investment of $1,000 invested at the beginning of the period and held for the periods presented below.
The Actual Expense table below provides information about actual account values and actual expenses. You may use the information below, together with the amount you invested, to estimate the expenses that you paid over the period. Simply divide your account value by $1,000 (for example, an $8,600 account value divided by $1,000 = 8.6), then multiply the result by the number in the table under the heading entitled “Expenses Paid During Period” to estimate the expenses you paid on your account during this period.
| Beginning Account Value 7/1/17 | Ending Account Value 12/31/17 | Expenses Paid During Period 7/1/17 - 12/31/17* | Annualized Expense Ratio During Period 7/1/17 - 12/31/17 | |||||||||||||||||
AZL MVP Fusion Dynamic Conservative Fund | $ | 1,000.00 | $ | 1,042.20 | $ | 1.18 | 0.23 | % | ||||||||||||
The Hypothetical Expense table below provides information about hypothetical account values and hypothetical expenses based on the Fund’s actual expense ratio and an assumed rate of return of 5% per year before expenses, which is not the Fund’s actual return. The hypothetical account values and expenses may not be used to estimate the actual ending account balance or expenses you paid for the period. You may use this information to compare this 5% hypothetical example with the 5% hypothetical examples that appear in the shareholder reports of other funds.
| Beginning Account Value 7/1/17 | Ending Account Value 12/31/17 | Expenses Paid During Period 7/1/17 - 12/31/17* | Annualized Expense Ratio During Period 7/1/17 - 12/31/17 | |||||||||||||||||
AZL MVP Fusion Dynamic Conservative Fund | $ | 1,000.00 | $ | 1,024.05 | $ | 1.17 | 0.23 | % | ||||||||||||
| * | Expenses are equal to the average account value over the period, multiplied by the Fund’s annualized expense ratio, multiplied by 184/365 (to reflect the one half year period). |
Portfolio Composition
(Unaudited)
| Investments | Percent of Net Assets | ||||
Fixed Income | 60.3 | ||||
Domestic Equities | 21.8 | ||||
International Equities | 13.0 | ||||
Money Market | 0.1 | ||||
|
| ||||
Total Investment Securities | 95.2 | ||||
Net other assets (liabilities) | 4.8 | ||||
|
| ||||
Net Assets | 100.0 | % | |||
|
| ||||
3
AZL MVP Fusion Dynamic Conservative Fund
Schedule of Portfolio Investments
December 31, 2017
| Shares | Fair Value | |||||||
| Affiliated Investment Companies (95.1%): | ||||||||
| 610,665 | AZL DFA International Core Equity Fund | $ | 6,998,217 | |||||
| 337,510 | AZL DFA U.S. Core Equity Fund | 4,306,633 | ||||||
| 225,921 | AZL DFA U.S. Small Cap Fund | 2,803,677 | ||||||
| 1,189,103 | AZL Enhanced Bond Index Fund | 12,949,335 | ||||||
| 518,585 | AZL Gateway Fund | 6,907,550 | ||||||
| 1,205,741 | AZL International Index Fund, Class 2 | 20,859,328 | ||||||
| 3,451,650 | AZL MetWest Total Return Bond Fund | 35,206,826 | ||||||
| 299,174 | AZL Mid Cap Index Fund, Class 2 | 7,018,616 | ||||||
| 798,213 | AZL MSCI Emerging Markets Equity Index Fund, Class 2 | 7,000,327 | ||||||
| 3,068,502 | AZL Pyramis® Total Bond Fund, Class 2 | 31,390,779 | ||||||
| 1,139,623 | AZL Russell 1000 Growth Index Fund, Class 2 | 17,333,662 | ||||||
| 1,281,707 | AZL Russell 1000 Value Index Fund, Class 2 | 17,379,950 | ||||||
| 187,047 | AZL Small Cap Stock Index Fund, Class 2 | 2,783,265 | ||||||
| 1,597,112 | PIMCO VIT Income Portfolio | 17,152,980 | ||||||
| 2,868,307 | PIMCO VIT Low Duration Portfolio | 29,371,462 | ||||||
| 3,289,109 | PIMCO VIT Total Return Portfolio | 35,982,856 | ||||||
|
| |||||||
Total Affiliated Investment Companies (Cost $239,770,101) | 255,445,463 | |||||||
|
| |||||||
| Shares | Fair Value | |||||||
| Unaffiliated Investment Company (0.1%): | ||||||||
| 259,642 | Dreyfus Treasury Prime Cash Management Fund, Institutional Shares, 1.11%(a) | $ | 259,642 | |||||
|
| |||||||
Total Unaffiliated Investment Company (Cost $259,642) | 259,642 | |||||||
|
| |||||||
Total Investment Securities (Cost $240,029,743)(b) — 95.2% | 255,705,105 | |||||||
Net other assets (liabilities) — 4.8% | 12,866,436 | |||||||
|
| |||||||
Net Assets — 100.0% | $ | 268,571,541 | ||||||
|
| |||||||
Percentages indicated are based on net assets as of December 31, 2017.
| (a) | The rate represents the effective yield at December 31, 2017. |
| (b) | See Federal Tax Information listed in the Notes to the Financial Statements. |
Futures Contracts
Cash of $13,440,344 has been segregated to cover margin requirements for the following open contracts as of December 31, 2017:
Long Futures
| Description | Expiration Date | Number of Contracts | Notional Amount | Unrealized Appreciation/ (Depreciation) | ||||||||||||
S&P 500 Index E-Mini March Futures (U.S. Dollar) | 3/19/18 | 34 | $ | 4,549,200 | $ | 74,926 | ||||||||||
U.S. Treasury 10-Year Note March Futures (U.S. Dollar) | 3/21/18 | 70 | 8,683,281 | (46,713 | ) | |||||||||||
|
| |||||||||||||||
| $ | 28,213 | |||||||||||||||
|
| |||||||||||||||
See accompanying notes to the financial statements.
4
AZL MVP Fusion Dynamic Conservative Fund
Statement of Assets and Liabilities
December 31, 2017
Assets: | |||||
Investment in non-affiliates, at cost | $ | 259,642 | |||
Investments in affiliates, at cost | 239,770,101 | ||||
|
| ||||
Total Investment securities, at cost | $ | 240,029,743 | |||
|
| ||||
Investment in non-affiliates, at value | $ | 259,642 | |||
Investments in affiliates, at value | 255,445,463 | ||||
|
| ||||
Total Investment securities, at value | 255,705,105 | ||||
Segregated cash for collateral | 13,440,344 | ||||
Interest and dividends receivable | 141,402 | ||||
Receivable for capital shares issued | 38,011 | ||||
Prepaid expenses | 1,561 | ||||
|
| ||||
Total Assets | 269,326,423 | ||||
|
| ||||
Liabilities: | |||||
Payable for investments purchased | 388,654 | ||||
Payable for capital shares redeemed | 307,685 | ||||
Manager fees payable | 45,563 | ||||
Administration fees payable | 3,467 | ||||
Custodian fees payable | 405 | ||||
Administrative and compliance services fees payable | 624 | ||||
Transfer agent fees payable | 673 | ||||
Trustee fees payable | 402 | ||||
Other accrued liabilities | 7,409 | ||||
|
| ||||
Total Liabilities | 754,882 | ||||
|
| ||||
Net Assets | $ | 268,571,541 | |||
|
| ||||
Net Assets Consist of: | |||||
Capital | $ | 241,586,502 | |||
Accumulated net investment income/(loss) | 3,424,477 | ||||
Accumulated net realized gains/(losses) from investment transactions | 7,856,987 | ||||
Net unrealized appreciation/(depreciation) on investments | 15,703,575 | ||||
|
| ||||
Net Assets | $ | 268,571,541 | |||
|
| ||||
Shares of beneficial interest (unlimited number of shares authorized, no par value) | 21,955,868 | ||||
Net Asset Value (offering and redemption price per share) | $ | 12.23 | |||
|
|
For the Year Ended December 31, 2017
Investment Income: | |||||
Dividends from affiliates | $ | 3,644,530 | |||
Interest | 122,771 | ||||
Dividends | 249 | ||||
Other income | 553 | ||||
|
| ||||
Total Investment Income | 3,768,103 | ||||
|
| ||||
Expenses: | |||||
Manager fees | 549,804 | ||||
Administration fees | 48,468 | ||||
Custodian fees | 2,435 | ||||
Administrative and compliance services fees | 3,326 | ||||
Transfer agent fees | 4,807 | ||||
Trustee fees | 11,911 | ||||
Professional fees | 11,887 | ||||
Shareholder reports | 6,581 | ||||
Other expenses | 3,378 | ||||
|
| ||||
Total expenses | 642,597 | ||||
|
| ||||
Net Investment Income/(Loss) | 3,125,506 | ||||
|
| ||||
Realized and Unrealized Gains/(Losses) on Investments: | |||||
Net realized gains/(losses) on securities transactions from affiliates | 4,650,240 | ||||
Net realized gains distributions from affiliated underlying funds | 4,333,779 | ||||
Net realized gains/(losses) on futures contracts | 896,187 | ||||
Change in net unrealized appreciation/depreciation on affiliated transactions | 11,455,008 | ||||
Change in net unrealized appreciation/depreciation on futures contracts | 76,729 | ||||
|
| ||||
Net Realized/Unrealized Gains/(Losses) on Investments | 21,411,943 | ||||
|
| ||||
Change in Net Assets Resulting From Operations | $ | 24,537,449 | |||
|
|
See accompanying notes to the financial statements.
5
AZL MVP Fusion Dynamic Conservative Fund
Statements of Changes in Net Assets
| For the Year Ended December 31, 2017 | For the Year Ended December 31, 2016 | |||||||||
Change In Net Assets: | ||||||||||
Operations: | ||||||||||
Net investment income/(loss) | $ | 3,125,506 | $ | 4,534,126 | ||||||
Net realized gains/(losses) on investment transactions | 9,880,206 | 11,967,901 | ||||||||
Change in unrealized appreciation/depreciation on investments | 11,531,737 | (2,100,279 | ) | |||||||
|
|
|
| |||||||
Change in net assets resulting from operations | 24,537,449 | 14,401,748 | ||||||||
|
|
|
| |||||||
Distributions to Shareholders: | ||||||||||
From net investment income | (4,942,273 | ) | (6,400,135 | ) | ||||||
From net realized gains | (11,231,674 | ) | (8,746,642 | ) | ||||||
|
|
|
| |||||||
Change in net assets resulting from distributions to shareholders | (16,173,947 | ) | (15,146,777 | ) | ||||||
|
|
|
| |||||||
Capital Transactions: | ||||||||||
Proceeds from shares issued | 11,558,632 | 54,291,335 | ||||||||
Proceeds from dividends reinvested | 16,173,947 | 15,146,777 | ||||||||
Value of shares redeemed | (45,413,236 | ) | (59,139,549 | ) | ||||||
|
|
|
| |||||||
Change in net assets resulting from capital transactions | (17,680,657 | ) | 10,298,563 | |||||||
|
|
|
| |||||||
Change in net assets | (9,317,155 | ) | 9,553,534 | |||||||
Net Assets: | ||||||||||
Beginning of period | 277,888,696 | 268,335,162 | ||||||||
|
|
|
| |||||||
End of period | $ | 268,571,541 | $ | 277,888,696 | ||||||
|
|
|
| |||||||
Accumulated net investment income/(loss) | $ | 3,424,477 | $ | 4,942,255 | ||||||
|
|
|
| |||||||
Share Transactions: | ||||||||||
Shares issued | 937,909 | 4,563,032 | ||||||||
Dividends reinvested | 1,348,953 | 1,281,453 | ||||||||
Shares redeemed | (3,701,038 | ) | (4,973,216 | ) | ||||||
|
|
|
| |||||||
Change in shares | (1,414,176 | ) | 871,269 | |||||||
|
|
|
| |||||||
See accompanying notes to the financial statements.
6
AZL MVP Fusion Dynamic Conservative Fund
(Selected data for a share of beneficial interest outstanding throughout the periods indicated)
| Year Ended December 31, | |||||||||||||||||||||||||
| 2017 | 2016 | 2015 | 2014 | 2013 | |||||||||||||||||||||
Net Asset Value, Beginning of Period | $ | 11.89 | $ | 11.93 | $ | 12.63 | $ | 12.53 | $ | 11.99 | |||||||||||||||
|
|
|
|
|
|
|
|
|
| ||||||||||||||||
Investment Activities: | |||||||||||||||||||||||||
Net Investment Income/(Loss) | 0.16 | 0.19 | 0.25 | 0.16 | 0.16 | ||||||||||||||||||||
Net Realized and Unrealized Gains/(Losses) on Investments | 0.93 | 0.44 | (0.35 | ) | 0.44 | 0.78 | |||||||||||||||||||
|
|
|
|
|
|
|
|
|
| ||||||||||||||||
Total from Investment Activities | 1.09 | 0.63 | (0.10 | ) | 0.60 | 0.94 | |||||||||||||||||||
|
|
|
|
|
|
|
|
|
| ||||||||||||||||
Dividends to Shareholders From: | |||||||||||||||||||||||||
Net Investment Income | (0.23 | ) | (0.28 | ) | (0.17 | ) | (0.19 | ) | (0.27 | ) | |||||||||||||||
Net Realized Gains | (0.52 | ) | (0.39 | ) | (0.43 | ) | (0.31 | ) | (0.13 | ) | |||||||||||||||
|
|
|
|
|
|
|
|
|
| ||||||||||||||||
Total Dividends | (0.75 | ) | (0.67 | ) | (0.60 | ) | (0.50 | ) | (0.40 | ) | |||||||||||||||
|
|
|
|
|
|
|
|
|
| ||||||||||||||||
Net Asset Value, End of Period | $ | 12.23 | $ | 11.89 | $ | 11.93 | $ | 12.63 | $ | 12.53 | |||||||||||||||
|
|
|
|
|
|
|
|
|
| ||||||||||||||||
Total Return(a) | 9.31 | % | 5.32 | % | (0.77 | )% | 4.81 | % | 7.96 | % | |||||||||||||||
Ratios to Average Net Assets/Supplemental Data: | |||||||||||||||||||||||||
Net Assets, End of Period (000’s) | $ | 268,572 | $ | 277,889 | $ | 268,335 | $ | 271,443 | $ | 265,232 | |||||||||||||||
Net Investment Income/(Loss) | 1.14 | % | 1.63 | % | 2.09 | % | 1.25 | % | 1.29 | % | |||||||||||||||
Expenses Before Reductions*(b) | 0.23 | % | 0.24 | % | 0.24 | % | 0.24 | % | 0.24 | % | |||||||||||||||
Expenses Net of Reductions* | 0.23 | % | 0.24 | % | 0.24 | % | 0.24 | % | 0.22 | % | |||||||||||||||
Portfolio Turnover Rate(c) | 18 | % | 62 | % | 16 | % | 36 | % | 15 | % | |||||||||||||||
| * | The expense ratios exclude the impact of fees/expenses paid by each underlying fund. |
| (a) | The returns include reinvested dividends and fund level expenses, but exclude insurance contract charges. If these charges were included, the returns would have been lower. |
| (b) | Excludes fee reductions. If such fee reductions had not occurred, the ratios would have been as indicated. |
| (c) | The portfolio turnover rate can be volatile due to the amount and timing of purchases and sales of fund shares during the period. |
See accompanying notes to the financial statements.
7
AZL MVP Fusion Dynamic Conservative Fund
Notes to the Financial Statements
December 31, 2017
1. Organization
The Allianz Variable Insurance Products Fund of Funds Trust (the “Trust”) was organized as a Delaware statutory trust on June 16, 2004. The Trust is a diversified open-end management investment company registered under the Investment Company Act of 1940, as amended, (the “1940 Act”) and thus is determined to be an investment company for accounting purposes. The Trust consists of 12 separate investment portfolios (collectively, the “Funds”), of which one is included in this report, the AZL MVP Fusion Dynamic Conservative Fund (the “Fund”), and 11 are presented in separate reports.
The Fund is a “fund of funds,” which means that the Fund invests primarily in other mutual funds. Underlying Funds invest in stock, bonds, and other securities and reflect varying amounts of potential investment risk and reward. The Underlying Funds record their investments at fair value. Periodically, the Fund will adjust its asset allocation as it seeks to achieve its investment objective.
The Trust is authorized to issue an unlimited number of shares of the Fund without par value. Shares of the Fund are available through the variable annuity contracts offered through the separate accounts of participating insurance companies. Currently, the Fund only offers its shares to separate accounts of Allianz Life Insurance Company of North America and Allianz Life Insurance Company of New York, affiliates of the Trust and the Manager, as defined below.
Under the Trust’s organizational documents, its officers and trustees are indemnified against certain liabilities arising out of the performance of their duties to the Fund. In addition, in the normal course of business, the Fund may enter into contracts with its vendors and others that provide for general indemnifications. The Fund’s maximum exposure under these arrangements is unknown, as this would involve future claims that may be made against the Fund. However, based on experience, the Fund expects that risk of loss to be remote.
2. Significant Accounting Policies
The following is a summary of significant accounting policies followed by the Fund in the preparation of its financial statements. The policies conform with U.S. generally accepted accounting principles (“U.S. GAAP”). The preparation of financial statements requires management to make certain estimates and assumptions that affect the reported amounts of assets and liabilities and disclosure of contingent assets and liabilities at the date of the financial statements and the reported amounts of increases and decreases in net assets from operations during the reporting period. Actual results could differ from those estimates.
Security Valuation
The Fund records its investments at fair value. Fair value is defined as the price that would be received to sell an asset or paid to transfer a liability in an orderly transaction between willing market participants at the measurement date. The valuation techniques used to determine fair value are further described in Note 4 below.
Investment Transactions and Investment Income
Investment transactions are accounted for on trade date. Net realized gains and losses on investments sold and on foreign currency transactions are recorded on the basis of identified cost. Interest income is recorded on the accrual basis and includes, where applicable, the amortization of premiums or accretion of discounts.
Dividends to Shareholders
Dividends to shareholders are recorded on the ex-dividend date. The Fund distributes its dividends from net investment income and net realized capital gains, if any, on an annual basis. The amount of dividends from net investment income and from net realized gains is determined in accordance with federal income tax regulations, which may differ from U.S. GAAP. These “book/tax” differences are either temporary or permanent in nature. To the extent these differences are permanent in nature (e.g., miscellaneous adjustments on return of capital), such amounts are reclassified within the composition of net assets based on their federal tax-basis treatment; temporary differences (e.g., wash sales and differing treatment on certain investments) do not require reclassification. Dividends to shareholders that exceed net investment income and net realized gains for tax purposes are reported as distributions of capital.
Expense Allocation
Expenses directly attributable to the Fund are charged directly to the Fund, while expenses attributable to more than one Fund are allocated among the respective Funds based upon relative net assets or some other reasonable method. Expenses which are attributable to more than one Trust are allocated across the Allianz Variable Insurance Products and Allianz Variable Insurance Products Fund of Funds Trusts based upon relative net assets or another reasonable basis. Allianz Investment Management LLC (the “Manager”), serves as the investment manager for the Trust and the Allianz Variable Insurance Products Trust.
Derivative Instruments
All open derivative positions at period end are reflected on the Fund’s Schedule of Portfolio Investments. The following is a description of the derivative instruments utilized by the Fund, including the primary underlying risk exposures related to each instrument type. The Fund’s allocation to the MVP (Managed Volatility Portfolio) risk management process may include (a) derivatives such as index futures, other futures contracts, options, and other similar securities and (b) cash, money market equivalents, short-term debt instruments, money market funds, and short-term debt funds to satisfy all applicable margin requirements and to provide additional portfolio liquidity to satisfy large redemptions and any margin calls. Due to the leverage provided by derivatives, the notional value of the Fund’s derivative positions could exceed 20% of the Fund’s value. The Fund may also use futures to gain equity exposure and may hold cash as a buffer in the event of market shocks.
Futures Contracts
During the year ended December 31, 2017, the Fund invested in futures contracts to reduce volatility and limit the need to decrease or increase allocations to underlying funds. Futures contracts are valued based upon their quoted daily settlement prices. Upon entering into a futures contract, the Fund is required to segregate liquid assets in accordance
8
AZL MVP Fusion Dynamic Conservative Fund
Notes to the Financial Statements
December 31, 2017
with the initial margin requirements of the broker or exchange. Futures contracts are marked to market daily and a payable or receivable for the change in value (“variation margin”) is recorded by the Fund. Gains or losses are recognized but not considered realized until the contracts expire or are closed. Futures contracts involve, to varying degrees, elements of market risk (generally equity price risk related to stock futures, interest rate risk related to bond futures, and foreign currency risk related to currency futures) and exposure to loss in excess of the variation margin disclosed in the Statement of Assets and Liabilities. The primary risks associated with the use of futures contracts are the imperfect correlation between the change in fair value of the underlying securities and the prices of futures contracts, the possibility of an illiquid market, and the inability of the counterparty to meet the terms of the contract. For the year ended December 31, 2017, the monthly average notional amount for long contracts was $13.6 million. Realized gains and losses are reported as “Net realized gains/(losses) on futures contracts” on the Statement of Operations.
Summary of Derivative Instruments
The following is a summary of the fair values of derivative instruments on the Fund’s Statement of Assets and Liabilities, categorized by risk exposure, as of December 31, 2017:
Asset Derivative | Liability Derivative | |||||||||||
| Primary Risk Exposure | Statement of Assets and Liabilities Location | Total Fair Value* | Statement of Assets and Liabilities Location | Total Fair Value* | ||||||||
Equity Risk | ||||||||||||
| Equity Contracts | Receivable for variation margin on futures contracts | $ | 74,926 | Payable for variation margin on futures contracts | $ | — | ||||||
Interest Rate Risk | ||||||||||||
| Interest Rate Contracts | — | 46,713 | ||||||||||
| * | For futures contracts, the amounts represent the cumulative appreciation/depreciation of these futures contracts as reported in the Schedule of Portfolio Investments. Only current day’s variation margin is reported within the Statement of Assets and Liabilities as variation margin on futures contracts. |
The following is a summary of the effect of derivative instruments on the Statement of Operations, categorized by risk exposure, for the year ended December 31, 2017:
| Primary Risk Exposure | Location of Gains/(Losses) on Derivatives Recognized | Realized Gains/(Losses) on Derivatives Recognized | Change in Net Unrealized Appreciation/Depreciation on Derivatives Recognized | |||||||
Equity Risk | ||||||||||
| Equity Contracts | Net Realized gains/(losses) on futures contracts/Change in net unrealized appreciation/depreciation on futures contracts | $ | 825,578 | $ | 65,507 | |||||
Interest Rate Risk | ||||||||||
| Interest Rate Contracts | 70,609 | 11,222 | ||||||||
3. Fees and Transactions with Affiliates and Other Parties
The Manager provides investment advisory and management services for the Fund. The Manager has contractually agreed to waive fees and reimburse the Fund to limit the annual expenses, excluding interest expense (e.g., cash overdraft fees), taxes, brokerage commissions, acquired fund fees and expenses, other expenditures that are capitalized in accordance with U.S. GAAP and other extraordinary expenses not incurred in the ordinary course of the Fund’s business, based on the daily net assets of the Fund, through April 30, 2019. Expenses incurred for investment advisory and management services are reflected on the Statement of Operations as “Manager fees.”
For the year ended December 31, 2017, the annual rate paid to the Manager and the annual expense limit were as follows:
| Annual Rate | Annual Expense Limit | |||||||||
AZL MVP Fusion Dynamic Conservative Fund | 0.20 | % | 0.35 | % | ||||||
Any amounts contractually waived or reimbursed by the Manager in a particular fiscal year will be subject to repayment by the Fund to the Manager to the extent that from time to time through the next three fiscal years the repayment will not cause the Fund’s expenses to exceed the lesser of the stated limit at the time of the waiver or the current stated limit. Any amounts recouped by the Manager during the year are reflected on the Statement of Operations as “Recoupment of prior expenses reimbursed by the Manager.” At December 31, 2017, there were no remaining contractual reimbursements that are subject to repayment by the Fund in subsequent years.
In addition, the Manager may voluntarily waive or reimburse additional fees in order to maintain more competitive expense ratios. Any voluntary waivers or reimbursements are not subject to repayment in subsequent years. Information on the total amount waived/reimbursed by the Manager or repaid to the Manager by the Fund during the period can be found on the Statement of Operations. During the year ended December 31, 2017, there were no voluntary waivers.
9
AZL MVP Fusion Dynamic Conservative Fund
Notes to the Financial Statements
December 31, 2017
The Manager or an affiliate of the Manager serves as the investment adviser of certain underlying funds in which the Fund invests. At December 31, 2017, these underlying funds are noted as Affiliated Investment Companies in the Fund’s Schedule of Portfolio Investments. Additional information, including financial statements, about these Funds is available at www.allianzlife.com. The Manager or an affiliate of the Manager is paid a separate fee from the underlying funds for such services. A summary of the Fund’s investments in affiliated investment companies for the year ended December 31, 2017 is as follows:
| Fair Value 12/31/16 | Purchases at Cost | Proceeds from Sales | Net Realized Gains/(Losses) | Net Change in Unrealized Appreciation/ Depreciation | Fair Value 12/31/17 | Shares as of 12/31/2017 | Dividend Income | Net realized gains distributions from affiliated underlying funds | |||||||||||||||||||||||||||||||||||||
AZL DFA International Core Equity Fund | $ | 6,991,694 | $ | 196,703 | $ | (1,717,028 | ) | $ | 173,630 | $ | 1,353,218 | $ | 6,998,217 | 610,665 | $ | 89,866 | $ | — | |||||||||||||||||||||||||||
AZL DFA U.S. Core Equity Fund | 4,129,311 | 134,441 | (679,320 | ) | 93,775 | 628,426 | 4,306,633 | 337,510 | 47,676 | 8,785 | |||||||||||||||||||||||||||||||||||
AZL DFA U.S. Small Cap Fund | 2,752,679 | 260,119 | (446,464 | ) | 35,605 | 201,738 | 2,803,677 | 225,921 | 15,682 | 41,874 | |||||||||||||||||||||||||||||||||||
AZL Enhanced Bond Index Fund | 27,227,225 | 248,800 | (14,990,502 | ) | (251,244 | ) | 715,056 | 12,949,335 | 1,189,103 | 119,748 | — | ||||||||||||||||||||||||||||||||||
AZL Gateway Fund | 4,114,793 | 2,863,722 | (534,804 | ) | 53,475 | 410,364 | 6,907,550 | 518,585 | 67,700 | — | |||||||||||||||||||||||||||||||||||
AZL International Index Fund, Class 2 | 15,347,118 | 6,440,319 | (4,420,875 | ) | 815,514 | 2,677,252 | 20,859,328 | 1,205,741 | 181,327 | 158,154 | |||||||||||||||||||||||||||||||||||
AZL MetWest Total Return Bond Fund | 36,249,988 | 1,127,747 | (2,642,948 | ) | (25,815 | ) | 497,854 | 35,206,826 | 3,451,650 | 543,580 | 95,307 | ||||||||||||||||||||||||||||||||||
AZL Mid Cap Index Fund, Class 2 | 8,263,574 | 4,312,762 | (6,281,563 | ) | 1,047,208 | (323,365 | ) | 7,018,616 | 299,174 | 12,968 | 142,090 | ||||||||||||||||||||||||||||||||||
AZL MSCI Emerging Markets Equity Fund, Class 2 | 4,077,330 | 3,157,103 | (1,810,024 | ) | 77,170 | 1,498,748 | 7,000,327 | 798,213 | 26,154 | 157,557 | |||||||||||||||||||||||||||||||||||
AZL Pyramis® Total Bond Fund, Class 2 | 36,250,115 | 1,758,738 | (7,268,406 | ) | 37,135 | 613,197 | 31,390,779 | 3,068,502 | 850,894 | — | |||||||||||||||||||||||||||||||||||
AZL Russell 1000 Growth Index Fund, Class 2 | 20,935,518 | 2,941,088 | (9,901,388 | ) | 1,136,976 | 2,221,468 | 17,333,662 | 1,139,623 | 50,227 | 1,727,722 | |||||||||||||||||||||||||||||||||||
AZL Russell 1000 Value Index Fund, Class 2 | 20,974,784 | 3,821,050 | (7,786,252 | ) | 1,255,287 | (884,919 | ) | 17,379,950 | 1,281,707 | 131,402 | 1,907,260 | ||||||||||||||||||||||||||||||||||
AZL Small Cap Stock Index Fund, Class 2 | 4,129,057 | 1,563,769 | (3,071,572 | ) | 391,605 | (229,594 | ) | 2,783,265 | 187,047 | 6,845 | 95,030 | ||||||||||||||||||||||||||||||||||
PIMCO VIT Income Portfolio | 16,764,247 | 1,509,551 | (1,991,407 | ) | 87,731 | 782,858 | 17,152,980 | 1,597,112 | 403,625 | — | |||||||||||||||||||||||||||||||||||
PIMCO VIT Low Duration Portfolio | 19,555,728 | 14,634,799 | (4,826,059 | ) | (218,765 | ) | 225,759 | 29,371,462 | 2,868,307 | 371,041 | — | ||||||||||||||||||||||||||||||||||
PIMCO VIT Total Return Portfolio | 36,306,623 | 2,219,888 | (3,551,556 | ) | (59,047 | ) | 1,066,948 | 35,982,856 | 3,289,109 | 725,795 | — | ||||||||||||||||||||||||||||||||||
|
|
|
|
|
|
|
|
|
|
|
|
|
|
|
|
|
| ||||||||||||||||||||||||||||
| $ | 264,069,784 | $ | 47,190,599 | $ | (71,920,168 | ) | $ | 4,650,240 | $ | 11,455,008 | $ | 255,445,463 | 22,067,969 | $ | 3,644,530 | $ | 4,333,779 | ||||||||||||||||||||||||||||
|
|
|
|
|
|
|
|
|
|
|
|
|
|
|
|
|
| ||||||||||||||||||||||||||||
Pursuant to separate agreements between the Funds and the Manager, the Manager provides a Chief Compliance Officer (“CCO”) and certain compliance oversight and regulatory filing services to the Trust. Under these agreements the Manager is entitled to an amount equal to a portion of the compensation and certain other expenses related to the individuals performing the CCO and compliance oversight services, as well as $100 per hour for time incurred in connection with the preparation and filing of certain documents with the Securities and Exchange Commission (“SEC” or the “Commission”). The fees are paid to the Manager on a quarterly basis. The total expenses incurred by the Fund for these services are reflected on the Statement of Operations as “Administrative and compliance services fees.”
Citi Fund Services Ohio, Inc. (“Citi” or the “Administrator”), a wholly owned subsidiary of Citigroup, Inc., with which an officer of the Trust is affiliated, serves as the Trust’s administrator and fund accountant, and assists the Trust in all aspects of its administration and operation. The Administrator is entitled to a fee, accrued daily and paid monthly. The Administrator is entitled to an annual fee for each additional class of shares of any Fund, certain annual fees in supporting fair values services, and a Trust-wide annual fee for providing infrastructure and support in implementing the written policies and procedures comprising the Fund’s compliance program. The Administrator is also reimbursed for certain expenses incurred. The total expenses incurred by the Fund for these services are reflected on the Statement of Operations as “Administration fees.”
FIS Investor Services LLC (“FIS”) serves as the Fund’s transfer agent. Under the Transfer Agent Agreement, the Trust pays FIS a fee for its services and reimburses FIS for all of their reasonable out-of-pocket expenses incurred in providing these services.
The Bank of New York Mellon (“BNY Mellon” or the “Custodian”) serves as the Trust’s custodian and securities lending agent. For these services as custodian, the Funds pay BNY Mellon a fee based on a percentage of assets held on behalf of the Funds, plus certain out-of-pocket charges.
Allianz Life Financial Services, LLC (“ALFS”), an affiliate of the Manager, serves as distributor of the Fund. ALFS receives an annual Trust-wide annual fee of $7,500, paid by the Manager from its profits and not by the Trust, for recordkeeping and reporting services.
In addition, certain legal fees and expenses are paid to a law firm, Dorsey & Whitney LLP, of which the Secretary of the Fund is Senior Counsel. During the year ended December 31, 2017, $2,839 was paid from the Fund relating to these fees and expenses.
Certain Officers and Trustees of the Trust are affiliated with the Manager or the Administrator. Such Officers (except for the Trust’s CCO as noted above) and Trustees receive no compensation from the Trust for serving in their respective roles. For their service to the Trust and to the Allianz Variable Insurance Products Trust, each non-interested Trustee receives a $170,000 annual Board retainer, the Lead Director receives an additional $42,500 annually and the Chair of the Nominating and Corporate Governance Committee receives an additional $25,500 annually. In addition, the Trustees are reimbursed for certain expenses associated with attending Board meetings. Compensation to the Trustees is allocated between the Trust and the Allianz Variable Insurance Products Fund of Funds Trust in proportion to the assets under management of each trust. During the year ended December 31, 2017, actual Trustee compensation was $1,116,333 in total for both trusts.
10
AZL MVP Fusion Dynamic Conservative Fund
Notes to the Financial Statements
December 31, 2017
4. Investment Valuation Summary
The valuation techniques employed by the Fund, as described below, maximize the use of observable inputs and minimize the use of unobservable inputs in determining fair value. The inputs used for valuing the Fund’s investments are summarized in the three broad levels listed below:
| ● | Level 1 — quoted prices in active markets for identical assets |
| ● | Level 2 — other significant observable inputs (including quoted prices for similar securities, interest rates, prepayments speeds, credit risk, etc.) |
| ● | Level 3 — significant unobservable inputs (including the Fund’s own assumptions in determining the fair value of investments) |
Changes in valuation techniques may result in transfers in or out of an assigned level within the disclosure hierarchy. The Fund determines transfers between fair value hierarchy levels at the reporting period end. The inputs or methodology used for valuing investments is not necessarily an indication of the risk associated with investing in those investments.
Investments in other investment companies are valued at their published net asset value (“NAV”). Security prices are generally provided by an independent third party pricing service approved by the Trust’s Board of Trustees (the “Board” or “Trustees”) as of the close of the New York Stock Exchange (“NYSE”) (generally 4:00 pm Eastern Time). The investments utilizing Level 1 valuations represent investments in open-end investment companies. Futures contracts are valued at the last sales price as of the close of the primary exchange and are typically categorized as Level 1 in the fair value hierarchy.
For the year ended December 31, 2017, there were no Level 3 investments for which significant unobservable inputs were used to determine fair value. There were no significant transfers between Levels 1 and 2 as of December 31, 2017, based on levels assigned to securities on December 31, 2016.
The following is a summary of the valuation inputs used as of December 31, 2017 in valuing the Fund’s investments based upon the three levels defined above:
| Investment Securities: | Level 1 | Level 2 | Level 3 | Total | ||||||||||||||||
Affiliated Investment Companies | $ | 255,445,463 | $ | — | $ | — | $ | 255,445,463 | ||||||||||||
Unaffiliated Investment Company | 259,642 | — | — | 259,642 | ||||||||||||||||
|
|
|
|
|
|
|
| |||||||||||||
Total Investment Securities | 255,705,105 | — | — | 255,705,105 | ||||||||||||||||
|
|
|
|
|
|
|
| |||||||||||||
Other Financial Instruments:* | ||||||||||||||||||||
Futures Contracts | 28,213 | — | — | 28,213 | ||||||||||||||||
|
|
|
|
|
|
|
| |||||||||||||
Total Investments | $ | 255,733,318 | $ | — | $ | — | $ | 255,733,318 | ||||||||||||
|
|
|
|
|
|
|
| |||||||||||||
| * | Other Financial Instruments would include any derivative instruments, such as futures contracts. These investments are generally presented in the financial statements at variation margin. |
5. Security Purchases and Sales
For the year ended December 31, 2017, cost of purchases and proceeds from sales of securities (excluding securities maturing less than one year from acquisition) were as follows:
| Purchases | Sales | |||||||||
AZL MVP Fusion Dynamic Conservative Fund | $ | 47,190,599 | $ | 71,920,168 | ||||||
6. Investment Risks
Derivatives Risk: The Fund may invest directly or through affiliated or unaffiliated mutual funds or unregistered investment pools in derivative instruments such as futures, options, and options on futures. A derivative is a financial contract whose value depends on, or is derived from, the value of an underlying asset, reference rate, or risk. Use of derivative instruments involves risks different from, or possibly greater than, the risks associated with investing directly in securities and other traditional investments. Derivatives are subject to a number of other risks, such as liquidity risk, interest rate risk, market risk, credit risk, and selection risk. Derivatives also involve the risk of mispricing or improper valuation and the risk that changes in the value may not correlate perfectly with the underlying asset, rate, or index. Using derivatives may result in losses, possibly in excess of the principal amount invested. Also, suitable derivative transactions may not be available in all circumstances. The other party to a derivatives contract could default.
Fund of Funds Risk: The Fund, as a shareholder of the underlying funds, indirectly bears its proportionate share of any investment management fees and other expenses of the underlying funds. Further due to the fees and expenses paid by the Fund, as well as small variations in the Fund’s actual allocations to the underlying funds and any futures and cash held in the Fund’s portfolio, the performance and income distributions of the Fund will not be the same as the performance and income distributions of the underlying funds.
7. Federal Tax Information
It is the policy of the Fund to continue to qualify as a regulated investment company by complying with the provisions available to certain investment companies, as defined under Subchapter M of the Internal Revenue Code, and to make distributions of net investment income and net realized gains sufficient to relieve it from all, or substantially all, federal income taxes. Accordingly, no provisions for federal income taxes are required in the financial statements.
Management of the Fund has reviewed tax positions taken in tax years that remain subject to examination by all major tax jurisdictions, including federal (i.e., the last four tax year ends and the interim tax period since then, as applicable). Management believes that there is no tax liability resulting from unrecognized tax benefits related to uncertain tax positions taken.
11
AZL MVP Fusion Dynamic Conservative Fund
Notes to the Financial Statements
December 31, 2017
Cost of securities, including derivatives and short positions as applicable, for federal income tax purposes at December 31, 2017 is $241,547,003. The gross unrealized appreciation/(depreciation) on a tax basis is as follows:
Unrealized appreciation | $ | 14,617,178 | ||
Unrealized (depreciation) | (459,076 | ) | ||
|
| |||
Net unrealized appreciation/(depreciation) | $ | 14,158,102 | ||
|
|
The tax character of dividends paid to shareholders during the year ended December 31, 2017 were as follows:
| Ordinary Income | Net Long-Term | Total Distributions(a) | |||||||||||||
AZL MVP Fusion Dynamic Conservative Fund | $ | 5,491,981 | $ | 10,681,966 | $ | 16,173,947 | |||||||||
| (a) | Total distributions paid may differ from the Statements of Changes in Net Assets because dividends are recognized when actually paid for tax purposes. |
The tax character of dividends paid to shareholders during the year ended December 31, 2016 were as follows:
| Ordinary Income | Net Long-Term | Total Distributions(a) | |||||||||||||
AZL MVP Fusion Dynamic Conservative Fund | $ | 6,400,135 | $ | 8,746,642 | $ | 15,146,777 | |||||||||
| (a) | Total distributions paid may differ from the Statements of Changes in Net Assets because dividends are recognized when actually paid for tax purposes. |
At December 31, 2017, the components of accumulated earnings on a tax basis were as follows:
| Undistributed Ordinary Income | Undistributed Long-Term | Accumulated Capital and Other Losses | Unrealized Appreciation/ Depreciation(a) | Total Accumulated Earnings/ (Deficit) | |||||||||||||||||||||
AZL MVP Fusion Dynamic Conservative Fund | $ | 5,442,598 | $ | 7,384,339 | $ | — | $ | 14,158,102 | $ | 26,985,039 | |||||||||||||||
| (a) | The difference between book-basis and tax-basis unrealized appreciation/depreciation is attributable primarily to tax deferral of losses on wash sales. |
8. Ownership and Principal Holders
The beneficial ownership, either directly or indirectly, of more than 25% of the voting securities of a fund creates presumptions of control of the fund, under section 2 (a)(9) of the 1940 Act. As of December 31, 2017, the Fund had an individual shareholder account which is affiliated with the Investment Adviser representing ownership in excess of 70% of the Fund.
9. Investment Company Reporting Modernization
In October 2016, the SEC released its Final Rule on Investment Company Reporting Modernization (the “Rules”). The Rules which introduce two new regulatory reporting forms for investment companies — Form N-PORT and Form N-CEN — also contain amendments to Regulation S-X which require standardized, enhanced disclosures about derivatives in investment company financial statements, as well as other amendments. The amendments to Regulation S-X became effective for filings made with the SEC after August 1, 2017. The compliance date for form N-PORT and Form N-CEN will vary based on the reporting entity’s size and, in the case of the Fund, is expected to be April 30, 2019. The Fund’s adoption of these amendments, as applicable for the financial statements prepared as of December 31, 2017, had no effect on the Fund’s net assets or results of operations.
10. Subsequent Events
Management of the Fund has evaluated the need for additional disclosures or adjustments resulting from events through the date the financial statements were issued. Based on this evaluation, there were no subsequent events to report that would have material impact on the Fund’s financial statements.
12
REPORT OF INDEPENDENT REGISTERED PUBLIC ACCOUNTING FIRM
To the Shareholders and Board of Trustees of
Allianz Variable Insurance Products Fund of Funds Trust:
Opinion on the Financial Statements
We have audited the accompanying statement of assets and liabilities of AZL MVP Fusion Dynamic Conservative Fund (the “Fund”) of the Allianz Variable Insurance Products Fund of Funds Trust, including the schedule of portfolio investments, as of December 31, 2017, and the related statement of operations for the year then ended, the statements of changes in net assets for each of the years in the two-year period then ended, and the related notes (collectively, the “financial statements”) and the financial highlights for each of the years in the five-year period then ended. In our opinion, the financial statements present fairly, in all material respects, the financial position of the Fund as of December 31, 2017, the results of its operations for the year then ended, the changes in its net assets for each of the years in the two-year period then ended, and the financial highlights for each of the years in the five-year period then ended, in conformity with U.S. generally accepted accounting principles.
Basis for Opinion
These financial statements and financial highlights are the responsibility of the Fund’s management. Our responsibility is to express an opinion on these financial statements and financial highlights based on our audits. We are a public accounting firm registered with the Public Company Accounting Oversight Board (United States) (“PCAOB”) and are required to be independent with respect to the Fund in accordance with the U.S. federal securities laws and the applicable rules and regulations of the Securities and Exchange Commission and the PCAOB.
We conducted our audits in accordance with the standards of the PCAOB. Those standards require that we plan and perform the audit to obtain reasonable assurance about whether the financial statements and financial highlights are free of material misstatement, whether due to error or fraud. Our audits included performing procedures to assess the risks of material misstatement of the financial statements and financial highlights, whether due to error or fraud, and performing procedures that respond to those risks. Such procedures included examining, on a test basis, evidence regarding the amounts and disclosures in the financial statements and financial highlights. Such procedures also included confirmation of securities owned as of December 31, 2017, by correspondence with the custodian, investees, brokers and transfer agents of the underlying funds. Our audits also included evaluating the accounting principles used and significant estimates made by management, as well as evaluating the overall presentation of the financial statements and financial highlights. We believe that our audits provide a reasonable basis for our opinion.
/s/ KPMG LLP
We have served as the auditor of one or more Allianz Variable Insurance Products investment companies since 1999.
Columbus, Ohio
February 23, 2018
13
Other Federal Income Tax Information (Unaudited)
For the year ended December 31, 2017, 14.22% of the total ordinary income dividends paid by the Fund qualify for the corporate dividends received deduction available to corporate shareholders.
During the year ended December 31, 2017, the Fund declared net short-term capital gain distributions of $549,708.
During the year ended December 31, 2017, the Fund declared net long-term capital gain distributions of $10,681,966.
14
A description of the policies and procedures that the Fund uses to determine how to vote proxies relating to portfolio securities is available, without charge, upon request, by visiting the Securities and Exchange Commission’s (“Commission”) website at www.sec.gov, or by calling 800-624-0197.
Information regarding how the Fund voted proxies relating to portfolio securities during the most recent 12-month period ended June 30th is available (i) without charge, upon request, by calling 800-624-0197; (ii) on the Allianz Variable Insurance Products Trust’s website at https://www.allianzlife.com; and (iii) on the Commission’s website at http://www.sec.gov.
The Fund files complete Schedules of Portfolio Holdings with the Commission for the first and third quarters of each fiscal year on Form N-Q. Schedules of Portfolio Holdings for the Fund in this report are available without charge on the Commission’s website at http://www.sec.gov, or may be reviewed and copied at the Commission’s Public Reference Room in Washington, D.C. Information on the operation of the Public Reference Room may be obtained by calling 800-SEC-0330.
15
Approval of Investment Advisory Agreement (Unaudited)
Subject to the general supervision of the Board of Trustees (the “Board”) and in accordance with the investment objectives and restrictions of each separate series (together, the “Funds”) of the Allianz Variable Insurance Products Fund of Funds Trust (the “Trust”), investment advisory services are provided to the Funds by Allianz Investment Management LLC (the “Manager”). As used in this section, “Fund” refers to any of the Funds. The Manager manages each Fund pursuant to an investment management agreement (the “Management Agreement”) with the Trust in respect of each such Fund. The Management Agreement provides that the Manager, subject to the supervision and approval of the Board, is responsible for the management of each Fund. For management services, each Fund pays the Manager an investment advisory fee based upon each Fund’s average daily net assets. The Manager has contractually agreed to limit the expenses of each Fund by reimbursing the Fund if and when total Fund operating expenses exceed certain amounts until at least May 1, 2019 (the “Expense Limitation Agreement”).
In reviewing the services provided by the Manager and the terms of the Management Agreement, the Board receives and reviews information related to the Manager’s experience and expertise in the variable insurance marketplace. Currently, the Funds are offered only through variable annuities and variable life insurance policies, and not in the retail fund market. In addition, the Board receives information regarding the Manager’s expertise with regard to portfolio diversification and asset allocation requirements within variable insurance products issued by Allianz Life Insurance Company of North America (“Allianz Life”) and its subsidiary, Allianz Life Insurance Company of New York (“Allianz of New York”). Currently, the Funds are offered only through Allianz Life and Allianz of New York variable products.
As required by the Investment Company Act of 1940 (the “1940 Act”), the Board has reviewed and approved the Management Agreement with the Manager. The Board’s decision to approve this contract reflects the exercise of its business judgment on whether to approve new arrangements and continue the existing arrangements. During its review of the contract, the Board considered many factors, among the most material of which are: the Fund’s investment objectives and long-term performance; the Manager’s management philosophy, personnel, processes and investment performance, including its compliance history and the adequacy of its compliance processes; the preferences and expectations of Fund shareholders (and underlying contract owners) and their relative sophistication; the continuing state of competition in the mutual fund industry; and comparable fees in the mutual fund industry.
The Board also considered the compensation and benefits received by the Manager. This includes fees received for services provided to a Fund by employees of the Manager or of affiliates of the Manager and research services received by the Manager from brokers that execute Fund trades, as well as advisory fees. The Board considered the fact that: (1) the Manager and the Trust are parties to an Administrative Services Agreement and a Compliance Services Agreement, under which the Manager is compensated by the Trust for performing certain administrative and compliance services including providing an employee of the Manager or one of its affiliates to act as the Trust’s Chief Compliance Officer; and (2) Allianz Life Financial Services, LLC, an affiliated person of the Manager, is a registered securities broker-dealer and received (along with its affiliated persons) payments made by the underlying funds pursuant to Rule 12b-1.
The Board is aware that various courts have interpreted provisions of the 1940 Act and have indicated in their decisions that the following factors may be relevant to an adviser’s compensation: the nature and quality of the services provided by the adviser, including the performance of the fund; the adviser’s cost of providing the services; the extent to which the adviser may realize “economies of scale” as the fund grows larger; any indirect benefits that may accrue to the adviser and its affiliates as a result of the adviser’s relationship with the fund; performance and expenses of comparable funds; the profitability of acting as adviser to the fund; and the extent to which the independent Board members, who are not “interested persons” of a fund as defined by the 1940 Act, are fully informed about all facts bearing on the adviser’s services and fees. The Board is aware of these factors and takes them into account in its review of the Management Agreement for the Funds.
The Board considered and weighed these circumstances in light of its experience in governing the Trust, and is assisted in its deliberations by the advice of independent legal counsel to the independent Trustees. In this regard, the Board requests and receives a significant amount of information about the Funds and the Manager. Some of this information is provided at each regular meeting of the Board; additional information is provided in connection with the particular meeting or meetings at which the Board’s formal review of an advisory contract occurs. In between regularly scheduled meetings, the Board may receive information on particular matters as the need arises. Thus, the Board’s evaluation of the Management Agreement is informed by reports covering such matters as: the Manager’s investment philosophy, personnel and processes, and the Fund’s investment performance (in absolute terms as well as in relationship to its benchmark). In connection with comparing the performance of each Fund versus its benchmark, the Board receives reports on the extent to which the Fund’s performance may be attributed to various applicable factors, such as asset class allocation decisions and volatility management strategies, the performance of the underlying funds, rebalancing decisions, and the impact of cash positions and Fund fees and expenses. The Board also receives reports on the Funds’ expenses (including the advisory fee itself and the overall expense structure of the Funds, both in absolute terms and relative to similar and/or competing funds, with due regard for the Expense Limitation Agreement and additional voluntary expense limitations); the nature and extent of the advisory and other services provided to the Fund by the Manager and its affiliates; compliance and audit reports concerning the Funds and the companies that service them; and relevant developments in the mutual fund industry and how the Funds and/or the Manager are responding to them.
The Board also receives financial information about the Manager, including reports on the compensation and benefits the Manager derives from its relationships with the Funds. These reports cover not only the fees under the Management Agreement, but also fees, if any, received for providing other services to the Funds. The reports also discuss any indirect or “fall out” benefits the Manager or its affiliates may derive from its relationship with the Funds.
The Management Agreement was most recently considered at Board meetings held in the fall of 2017. Information relevant to the approval of the Management Agreement was considered at a telephonic Board meeting on October 18, 2017, and at an “in person” Board meeting held October 23, 2017. The Management Agreement was approved at the Board meeting of October 23, 2017. At such meeting the Board also approved the Expense Limitation Agreement between the Manager and the Trust for the period ending April 30, 2019. In connection with such meetings, the Trustees requested and evaluated extensive materials from the Manager, including performance and expense information for other investment companies with similar investment objectives derived from data compiled by an independent third party provider and other sources believed to be reliable by the Manager. Prior to voting, the Trustees reviewed the proposed approval/continuance of the Agreement with management and with experienced counsel who are independent of the Manager and received a memorandum from such counsel discussing the legal standards for their consideration of the proposed approvals/continuances. The independent Trustees also discussed the proposed approvals/continuances in a private session with such counsel at which no representatives of the Manager were present. In reaching their determinations relating to the approval and/or continuance of the Agreement, in respect of each Fund, the Board considered all factors it believed relevant. The Board based its decision to approve the Management Agreement on the totality of the circumstances and relevant factors, and with a view to past and future long-term considerations. Not all of the factors and considerations discussed above and below are necessarily relevant to every Fund, and the Board did not assign relative weights to factors discussed herein or deem any one or group of them to be controlling in and of themselves.
An SEC rule requires that shareholder reports include a discussion of certain factors relating to the selection of the investment adviser and the approval of the advisory fee. The “factors” enumerated by the SEC are set forth below in italics, as well as the Board’s conclusions regarding such factors:
(1) The nature, extent and quality of services provided by the Manager. The Trustees noted that the Manager, subject to the control of the Board, administers each Fund’s business and other affairs. The Trustees noted that the Manager also provides the Trust and each Fund with such administrative and other services (exclusive of, and in addition to, any such services provided by any others retained by the Trust on behalf of the Funds) and executive and other personnel as are necessary for the operation of the Trust and the Funds. Except for the Trust’s Chief Compliance Officer and certain compliance staff, the Manager pays all of the compensation of Trustees and officers of the Trust who are employees of the Manager or its affiliates.
16
The Board considered the scope and quality of services provided by the Manager and noted that the scope of such services provided had expanded as a result of recent regulatory and other developments. The Board noted that, for example, the Manager is responsible for maintaining and monitoring its own compliance program, and this compliance program has been continuously refined and enhanced in light of new regulatory requirements. The Board considered the capabilities and resources which the Manager has dedicated to performing services on behalf of the Trust and its Funds. The quality of administrative and other services, including the Manager’s role in coordinating the activities of the Trust’s other service providers, also were considered. The Board concluded that, overall, they were satisfied with the nature, extent and quality of services provided (and expected to be provided) to the Trust and to each of the Funds under the Management Agreement.
(2) The investment performance of the Funds and the Manager. In connection with every in-person quarterly Board meeting and the fall 2017 contract review process, Trustees received extensive information on the performance results of each Fund. This included, for example, performance information on absolute total return, performance versus the appropriate benchmark(s), the contribution to performance of the Manager’s asset class allocation decisions and volatility management strategies, the performance of the underlying funds, and the impact on performance of rebalancing decisions, cash and Fund fees. This included Lipper performance information on the Funds for the previous quarter, year-to-date, and previous one-, three- and five-year periods, to the extent the Funds were in existence for such periods. (For Funds which have been in existence for less than five years, the Board received performance information on shorter time periods to the extent available.) For example, in connection with the Board meeting held October 23, 2017, the Manager reported that for the five Funds for which performance information for the five year period ended June 30, 2017 was available, two were in the top 40%, two were in the middle 20%, and one was in the bottom 40%. None of these Funds was in the bottom 40% for the three- or one-year periods. The Manager reported that for the three-year period ended June 30, 2017, for the six Funds for which three year performance information was available, four Funds were in the top 40% and two Funds were in the middle 20%. For the eight Funds for which one-year performance information was available, for the one-year period ended June 30, 2017, four Funds were in the top 40%, two Funds were in the middle 20%, and two Funds were in the bottom 40%.
At the Board meeting held October 23, 2017, the Manager also reported upon the performance of the MVP Funds compared to custom managed-volatility peer groups. For the seven Funds for which three-year performance information was available, for the three-year period ended June 30, 2017, five Funds were in the top 40%, one Fund was in the middle 20%, and one was in the bottom 40%. For the eight Funds for which one year performance was available, for the one-year period ended June 30, 2017, four Funds were in the top 40% and four Funds were in the middle 20%. All six Funds for which five-year performance information was available were in the top 40%.
At the Board meeting held October 23, 2017, the Trustees determined that the investment performance of the Funds was acceptable.
(3) The costs of services to be provided and profits to be realized by the Manager and its affiliates from the relationship with the Funds. The Board considered that the Manager receives an advisory fee from each of the Funds. The Manager reported that for the three MVP Fusion Dynamic Funds the advisory fee paid put these Funds in the 44th percentile of the customized peer group. The Manager reported that for three MVP Index Strategy Funds the advisory fee paid put them in the 27th percentile of the customized peer group, and for the two non-MVP Index Strategy Funds, as well as the AZL DFA Multi-Strategy Fund, the advisory fee paid put them in the 13th percentile of the customized peer group. The Manager reported that for the AZL MVP BlackRock Global Strategy Plus, AZL MVP DFA Multi-Strategy, AZL MVP Pyramis Multi-Strategy, and AZL MVP T. Rowe Price Capital Appreciation Plus Funds, the advisory fee paid was in the 9th percentile. (A lower percentile reflects lower fund fees and is better for fund shareholders.) Trustees were provided with information on the total expense ratios of the Funds and other funds in the customized peer groups, and the Manager reported upon the challenges in making peer group comparisons for the Funds.
The Manager provided information concerning the profitability of the Manager’s investment advisory activities for the period from 2014 through June 30, 2017. The Board recognized that it is difficult to make comparisons of profitability from investment company advisory agreements because comparative information is not generally publicly available and is affected by numerous factors, including the structure of the particular adviser, the types of funds it manages, its business mix, numerous assumptions regarding allocation of expenses and the adviser’s capital structure and cost of capital. In considering profitability information, the Board considered the possible effect of certain fall-out benefits to the Manager and its affiliates. The Board focused on profitability of the Manager’s relationships with the Funds before taxes and distribution expenses. The Board recognized that the Manager should earn a reasonable level of profits for the services it provides to each Fund.
The Board also considered that Wilshire Funds Management (“Wilshire”) serves as a consultant to the Manager in preparing statistical and other factual information for use in the creation and maintenance of the asset allocation models for the Fusion Funds (the AZL MVP Fusion Dynamic Conservative, Balanced, and Moderate Funds), pursuant to an agreement between the Manager and Wilshire. Wilshire serves as a consultant to the Manager with respect to selecting the Fusion Funds’ underlying funds and the asset allocations among the underlying funds. The Manager, not any Fund, pays a consultant fee to Wilshire.
Based upon the information provided, the Board concluded that the Funds’ advisory fees and expense ratios are not unreasonable, and determined that there was no evidence that the Manager’s level of profitability from its relationship with the Funds was excessive.
(4) and (5) The extent to which economies of scale would be realized as the Funds grow, and whether fee levels reflect these economies of scale. The Board noted that the advisory fee schedules for the Funds do not contain breakpoints that reduce the fee rate on assets above specified levels. The Board recognized that breakpoints may be an appropriate way for the Manager to share its economies of scale, if any, with Funds that have substantial assets. The Board found there was no uniform methodology for establishing breakpoints that give effect to Fund-specific services provided by the Manager. The Board noted that in the fund industry as a whole, as well as among funds similar to the Funds, there is no uniformity or pattern in the fees and asset levels at which breakpoints (if any) apply. Depending on the age, size, and other characteristics of a particular fund and its manager’s cost structure, different conclusions can be drawn as to whether there are economies of scale to be realized at any particular level of assets, notwithstanding the intuitive conclusion that such economies exist, or will be realized at some level of total assets. Moreover, because different managers have different cost structures and service models, it is difficult to draw meaningful conclusions from the breakpoints that may have been adopted by other funds. The Board also noted that the advisory agreements for many funds do not have breakpoints at all, or if breakpoints exist, they may be at asset levels significantly greater than those of the individual Funds. The Board also noted that the total assets in all of the Funds, as of June 30, 2017, were approximately $10.8 billion and that the largest Fund, the AZL MVP Growth Index Strategy Fund, had assets of approximately $2.4 billion.
The Board noted that the Manager has agreed to temporarily limit Fund expenses under the Expense Limitation Agreement, which has the effect of reducing expenses as would the implementation of advisory fee breakpoints. The Manager has committed to continue to consider the continuation of expense limits and/or advisory fee breakpoints as the Funds grow larger. The Board receives quarterly reports on the level of Fund assets. The Board expects to continue to consider: (a) the extent to which economies of scale have been realized, and (b) whether the advisory fee should be modified, either in connection with the next renewal of the Agreements or by modifying the Expense Limitation Agreement, to reflect such economies of scale, if any.
Having taken these factors into account, the Board concluded that the absence of breakpoints in the Funds’ advisory fee rate schedules was acceptable under each Fund’s circumstances.
17
Information about the Board of Trustees and Officers (Unaudited)
The Trust is managed by the Trustees in accordance with the laws of the state of Delaware governing business trusts. There are currently eight Trustees, one of whom is an “interested person” of the Trust within the meaning of that term under the 1940 Act. The Trustees and Officers of the Trust, and their addresses, ages, positions held with the Trust, terms of office with the Trust and length of time served, principal occupation(s) during the past five years, the number of portfolios in the Trust they oversee, and other directorships held during the past five years are as follows:
Non-Interested Trustees(1)
| Name, Address, and Year of Birth | Positions Held with Allianz VIP and VIP FOF Trust | Term of Office(2)/Length of Time Served | Principal Occupation(s) During Past 5 Years | Number of Portfolios Overseen for Allianz VIP and VIP FOF Trust | Other AZL Fund Complex | |||||
| Peter R. Burnim (1947) 5701 Golden Hills Drive Minneapolis, MN 55416 | Trustee | Since 2/07 | Consultant/Chair, various companies: Chairman, Emrys Analytics and subsidiaries, July 2015 to present; Chairman, Argus Investment Strategies Fund Ltd., February 2013 to 2017; Managing Director, iQ Venture Advisors, LLC, 2005 to present; Chairman, Northstar Group Holdings Ltd. Bermuda, 2011 to present; Chairman Sterling Bank & Trust (Bahamas) Ltd., 2016 to present, and Expert Witness, Massachusetts Department of Revenue, 2011 to 2016. | 35 | Argus Group Holdings and Subsidiaries; Northstar Group Holdings; Sterling Trust (Cayman) Ltd.; Sterling Bank & Trust Limited (Bahamas); Emrys Analytics; EGB Insurance. | |||||
| Peggy L. Ettestad (1957) 5701 Golden Hills Drive Minneapolis, MN 55416 | Lead Independent Trustee | Since 10/14 (Trustee since 2/07) | Managing Director, Red Canoe Management Consulting LLC, 2008 to present | 35 | Luther College | |||||
| Tamara Lynn Fagely (1958) 5701 Golden Hills Drive Minneapolis, MN 55416 | Trustee | Since 12/17 | Retired; Chief Operations Officer, Hartford Funds, March 2012 to December 2013 | 35 | Diamond Hill Funds (13 funds) | |||||
| Richard H. Forde (1953) 5701 Golden Hills Drive Minneapolis, MN 55416 | Trustee | Since 12/17 | Member of the Board and Chairman of the Finance and Investment Committee, Connecticut Water Service, Inc., October 2013 to present; Senior Vice President and Chief Investment Officer, CIGNA, 2004 to 2012 | 35 | Connecticut Water Service, Inc. | |||||
| Claire R. Leonardi (1955) 5701 Golden Hills Drive Minneapolis, MN 55416 | Trustee | Since 2/04 | Chief Executive Officer, Health eSense Inc., 2015 to Present; CEO, Connecticut Innovations, Inc., 2012 to 2015; General Partner, Fairview Capital, L.P., 1994 to 2012 | 35 | reSet Social Enterprise Investment Fund | |||||
| Dickson W. Lewis (1948) 5701 Golden Hills Drive Minneapolis, MN 55416 | Trustee | Since 2/04 | Retired; Vice President/General Manager, Yearbooks & Canada-Lifetouch National School Studios, 2006 to 2014; Vice President/General Manager of Jostens, Inc., 2002 to 2006; Senior Vice President of Fortis Group, 1997 to 2002 | 35 | None | |||||
| Arthur C. Reeds, III (1944) 5701 Golden Hills Drive Minneapolis, MN 55416 | Trustee | Since 10/99 | Retired; Senior Investment Officer, Hartford Foundation for Public Giving, 2000 to 2003; Chairman, Chief Executive and President of Conning Corp., 1999 to 2000 | 35 | Connecticut Water Service, Inc. |
Interested Trustees(3)
| Name, Address, and Year of Birth | Positions Held with Allianz VIP and VIP FOF Trust | Term of Office(2)/Length of Time Served | Principal Occupation(s) During Past 5 Years | Number of Portfolios Overseen for Allianz VIP and VIP FOF Trust | Other AZL Fund Complex | |||||
Brian Muench (1970) 5701 Golden Hills Drive | Trustee | Since 6/11 | President, Allianz Investment Management LLC, November 2010 to present; Vice President, Allianz Life, April 2011 to present | 35 | None |
18
Officers
| Name, Address, and Age | Positions Held with Allianz VIP and VIP FOF Trust | Term of Office(2)/Length of Time Served | Principal Occupation(s) During Past 5 Years | |||
Brian Muench (1970) 5701 Golden Hills Drive | President | Since 11/10 | President, Allianz Investment Management LLC, November 2010 to present; Vice President, Allianz Life, April 2011 to present. | |||
| Michael Radmer (1945) Dorsey & Whitney LLP, Suite 1500 50 South Sixth Street Minneapolis, MN 55402-1498 | Secretary | Since 02/02 | Senior Counsel (previously, Partner), Dorsey and Whitney LLP since 1976. | |||
| Bashir C. Asad (1963) Citi Fund Services Ohio, Inc. 4400 Easton Commons, Suite 200 Columbus, OH 43219 | Treasurer, Principal Accounting Officer and Principal Financial Officer | Since 06/16 | Senior Vice President, Citi Fund Services Ohio, Inc. | |||
| Chris R. Pheiffer (1968) 5701 Golden Hills Drive Minneapolis, MN 55416 | Chief Compliance Officer(4) and Anti-MoneyLaundering Compliance Officer | Since 02/14 | Chief Compliance Officer of the VIP Trust and the FOF Trust, February 2014 to present; Deputy Chief Compliance Officer of the VIP Trust and the FOF Trust and Compliance Director, Allianz Life, February 2007 to February 2014. |
| (1) | Member of the Audit Committee. |
| (2) | Indefinite. |
| (3) | Is an “interested person”, as defined by the 1940 Act, due to employment by Allianz. |
| (4) | The Manager and the Trust are parties to a Chief Compliance Officer Agreement under which the Manager is compensated by the Trust for providing an employee of the Manager or one of its affiliates to act as the Trust’s Chief Compliance Officer. The Chief Compliance Officer and Anti-Money Laundering Compliance Officer is not considered a corporate officer or executive employee of the Trust. |
19
The Allianz VIP Fund of Funds are distributed by Allianz Life Financial Services, LLC. These Funds are not FDIC Insured. | ANNRPT1217 2/18 |
AZL MVP FusionSM Dynamic Moderate Fund
Annual Report
December 31, 2017
Table of Contents
Management Discussion and Analysis
Page 1
Expense Examples and Portfolio Composition
Page 3
Schedule of Portfolio Investments
Page 4
Statement of Assets and Liabilities
Page 5
Page 5
Statements of Changes in Net Assets
Page 6
Page 7
Notes to the Financial Statements
Page 8
Report of Independent Registered Public Accounting Firm
Page 13
Other Federal Income Tax Information
Page 14
Page 15
Approval of Investment Advisory Agreement
Page 16
Information about the Board of Trustees and Officers
Page 18
This report is submitted for the general information of the shareholder of the Fund. The report is not authorized for distribution to prospective investors in the Fund unless preceded or accompanied by an effective prospectus, which contains details concerning the sales charges and other pertinent information.
AZL MVP FusionSM Dynamic Moderate Fund Review (Unaudited)
Allianz Investment Management LLC
serves as the Manager for the MVP
FusionSM Dynamic Moderate Fund.
What factors affected the Fund’s performance during the year ended December 31, 2017?
For the year ended December 31, 2017, the AZL MVP FusionSM Dynamic Moderate Fund (the “Fund”) returned 13.98%. That compared to a 21.83%, 3.54% and a 14.26% total return for its benchmarks, the S&P 500 Index1, the Bloomberg Barclays U.S. Aggregate Bond Index1, and the Moderate Composite Index1, respectively.
The Fund is a fund of funds that achieves broad diversification by investing in underlying funds. The Fund typically holds between 50% and 70% of its assets in equity funds and 30% to 50% of its assets in fixed-income funds. The Fund also employs the MVP (Managed Volatility Portfolio) risk management process, which is intended to adjust the risk of the portfolio based on quantitative indicators of market risk, such as the current level of fund and market volatility.*
Global economic expansion led major stock indexes to new all-time highs during the 12-month period under review. The S&P 500 Index gained 21.83% during the period, supported by a positive economic environment marked by solid jobs growth, low unemployment, increased business investment, strong consumer confidence and a low-volatility environment. Mid- and small-cap stocks also performed well during the period: The S&P MidCap 400 Index2 generated a 16.24% return and the SmallCap 600 Index3 returned 13.23%. Growth stocks were also heavily favored during the year, and significantly outperformed value stocks.
International developed markets, as measured by the MSCI EAFE Index4, fared even better than U.S. equities, posting a 25.62% return for the year. Emerging markets equities, as measured by the MSCI Emerging Markets Equity Index5, posted a return of 37.75%. The strong return ended years of underperformance versus domestic and international developed markets.
The U.S. bond market was generally positive, as the market rewarded investors who took on interest rate and spread risk. The Bloomberg Barclays U.S. Aggregate Bond Index gained 3.54%. Bond investors generally tolerated risk in their quest for more attractive yields. Credit spreads on corporate bonds ended the year tighter than when the year began, with high-yield bond spreads tightening markedly. Meanwhile, the yield curve flattened sharply, as three rate hikes by the Federal Reserve sent short-term yields higher, while investor demand for attractive yield pushed long-term yields lower.
The Fund, which invests in both U.S. and international markets, modestly underperformed its composite benchmark in 2017. Above-benchmark allocations to mid- and small-cap U.S. equity detracted from the Fund’s performance relative to the S&P 500 Index, as smaller stocks generally lagged their large-cap counterparts. An allocation to hedged equity also hindered returns, as higher beta6 (more volatile) strategies were better rewarded during the period.*
The Fund’s off-benchmark allocation to shorter-term bonds also detracted modestly from relative returns as longer-term bonds outperformed.*
These negative impacts were partly offset by the Fund’s exposure to overseas markets. Off-benchmark allocations to international developed and emerging markets equity, along with a dynamic tilt toward those indexes, supported the Fund’s returns relative to its benchmark, as non-U.S. equity markets broadly outperformed their domestic counterparts during the period.*
Security selection within the underlying funds also supported relative performance on an overall basis, with security selection among fixed income holdings adding, and stock selection within the equity allocation detracting modestly.*
Stock selection within the Fund’s holdings had an overall modestly negative impact on relative results. The negative effects of stock choice within the Fund’s equity holdings were only partly offset by the benefits of security selection with its fixed income holdings.*
The MVP risk management process, which includes the use of derivatives, worked as intended during the period under review. Given that the period was marked by low volatility, the MVP maintained a neutral equity allocation for the year relative to its target.*
Past performance does not guarantee future results.
| * | The Fund’s portfolio composition is subject to change. There is no guarantee that any sectors mentioned will continue to perform well or that securities in such sectors will be held by the Fund in the future. The information contained in this commentary is for informational purposes only and should not be construed as a recommendation to purchase or sell securities in the sector mentioned. The Fund’s holdings and weightings are as of December 31, 2017. |
| 1 | For a complete description of the Fund’s performance benchmarks please refer to page 2 of this report. |
| 2 | The Standard & Poor’s MidCap 400 Index (“S&P 400”) is the most widely used index for mid-sized companies. The S&P 400 covers 7% of the U.S. equities market, and is part of a series of S&P U.S. indices that can be used as building blocks for portfolio composition. |
| 3 | The Standard & Poor’s SmallCap 600 Index (“S&P 600”) covers approximately 3% of the domestic equities market. Measuring the small-cap segment of the market that is typically renowned for poor trading liquidity and financial instability, the index is designed to be an efficient portfolio of companies that meet specific inclusion criteria to ensure that they are investable and financially viable. |
| 4 | The Morgan Stanley Capital International, Europe, Australasia and Far East (“MSCI EAFE”) Index is a free float-adjusted market capitalization-weighted index that is designed to measure the equity market performance of developed markets, excluding the U.S. & Canada. |
| 5 | The MSCI Emerging Markets Index (“MSCI EM”) is a free float-adjusted market capitalization index that is designed to measure equity performance of emerging markets. |
| 6 | Beta is a measure of the volatility, or systematic risk, of a security or a portfolio in comparison to the market as a whole. Beta is used in the capital asset pricing model, which calculates the expected return of an asset based on its beta and expected market returns. |
| Investors cannot invest directly in an index. |
1
AZL MVP FusionSM Dynamic Moderate Fund Review (Unaudited)
Fund Objective
The Fund’s investment objective is to seek long-term capital appreciation. This objective may be changed by the Trustees of the Fund without shareholder approval. The Fund seeks to achieve its objective by investing in a combination of Permitted Underlying Funds that represent different classes in the Fund’s asset allocation.
Investment Concerns
The Fund invests in underlying funds, so its investment performance is directly related to the performance of those underlying funds. Before investing, investors should assess the risks associated with and types of investments made by each of the underlying funds in which the Fund invests.
Emerging market investing may be subject to additional economic, political, liquidity, and currency risks not associated with more developed countries.
International investing may involve risk of capital loss from unfavorable fluctuations in currency values, from differences in generally accepted accounting principles or from economic or political instability in other nations.
Returns on growth stocks may not move in tandem with returns on other categories of stocks or the market as a whole. Growth stocks may be susceptible to rapid price savings or to adverse developments in certain sectors of the market.
Small- to mid-capitalization companies typically have a higher risk of failure and historically have experienced a greater degree of volatility.
The performance of the Fund is expected to be lower than that of the Indices because of Fund fees and expenses. Securities in which the Fund will invest may involve substantial risk and may be subject to sudden severe price declines.
Debt securities held by the Fund may decline in value due to rising interest rates. Interest rates in the U.S. are at, or near, historic lows, which may increase the Fund’s exposure to risks related to rising rates.
Bonds offer a relatively stable level of income, although bond prices will fluctuate, providing the potential for principal gain or loss.
Investing in derivatives instruments involves risks that may be different from or greater than the risk associated with investing directly in securities or other traditional instruments.
For a complete description of these and other risks associated with investing in a mutual Fund, please refer to the Fund’s prospectus.
Growth of $10,000 Investment
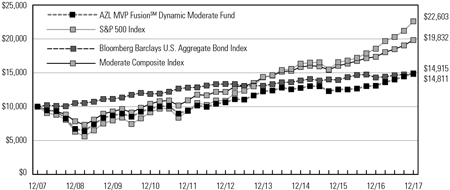
The chart above represents a comparison of a hypothetical investment in the Fund versus a similar investment in the Fund’s benchmark, as well as the two component indices of the Fund’s benchmark, and represents the reinvestment of dividends and capital gains in the Fund.
Average Annual Total Returns as of December 31, 2017
| 1 Year | 3 Year | 5 Year | 10 Year | |||||||||||||
AZL MVP FusionSM Dynamic Moderate Fund | 13.98 | % | 5.32 | % | 7.00 | % | 4.08 | % | ||||||||
S&P 500 Index | 21.83 | % | 11.41 | % | 15.79 | % | 8.50 | % | ||||||||
Bloomberg Barclays U.S. Aggregate Bond Index | 3.54 | % | 2.24 | % | 2.10 | % | 4.01 | % | ||||||||
Moderate Composite Index | 14.26 | % | 7.76 | % | 10.25 | % | 7.09 | % | ||||||||
Past performance does not guarantee future results. The performance data quoted represents past performance and current returns may be lower or higher. The investment return and principal value will fluctuate so that an investor’s shares, when redeemed may be worth more or less than the original cost. To obtain performance information current to the most recent month end, please visit www.Allianzlife.com.
Expense Ratio | Gross | |||
AZL MVP FusionSM Dynamic Moderate Fund | 0.98 | % | ||
The above expense ratio is based on the current Fund prospectus dated May 1, 2017. The Manager and the Fund have entered into a written contract limiting operating expenses, excluding certain expenses (such as interest expense and acquired fund fees and expenses), to 0.30% through April 30, 2019. Additional information pertaining to the December 31, 2017 expense ratios can be found in the financial highlights.
Acquired fund fees and expenses are incurred indirectly by the Fund through the valuation of the Fund’s investments in the Permitted Underlying Funds. Accordingly, acquired fees and expenses affect the Fund’s total returns. Because these fees and expenses are not included in the Fund’s financial highlights, the Fund’s total annual fund operating expenses, as shown in the current prospectus, do not correlate to the ratios of expenses to average net assets shown in the financial highlights table. Without acquired fund fees and expenses the Fund’s gross expense ratio would be 0.22%.
The total return of the Fund does not reflect the effect of any insurance charges, the annual maintenance fee or the deduction of taxes that a shareholder would pay on Fund distributions or the redemption of Fund shares. Such charges, fees and tax payments would reduce the performance quoted.
The Fund’s performance is measured against the Standard & Poor’s 500 Index (“S&P 500”), the Bloomberg Barclays U.S. Aggregate Bond Index and the Moderate Composite Index (“Composite”). The S&P 500 is representative of 500 selected common stocks, most of which are listed on the New York Stock Exchange, and is a measure of the U.S. Stock market as a whole. The Bloomberg Barclays U.S. Aggregate Bond Index is a market value-weighted performance benchmark for investment-grade fixed-rate debt issues, including government, corporate, asset-backed, and mortgage-backed securities, with maturities of at least one year. The Composite is a blended index comprised of (60%) S&P 500 and (40%) Bloomberg Barclays U.S. Aggregate Bond Index. These indexes are unmanaged and do not reflect the deduction of fees associated with a mutual fund, such as investment management and fund accounting fees. The Fund’s performance reflects the deduction of fees for services provided to the Fund. Investors cannot invest directly in an index.
2
AZL MVP Fusion Dynamic Moderate Fund
(Unaudited)
As a shareholder of the AZL MVP Fusion Dynamic Moderate Fund (the “Fund”), you incur ongoing costs, including management fees, distribution fees, and other Fund expenses. These examples are intended to help you understand your ongoing costs (in dollars) of investing in the Fund and to compare these costs with the ongoing costs of investing in other mutual funds. Please note that the expenses shown in each table do not reflect expenses that apply to the subaccount or the insurance contract. If the expenses that apply to the subaccount of the insurance contract were included, your costs would have been higher.
These examples are based on an investment of $1,000 invested at the beginning of the period and held for the periods presented below.
The Actual Expense table below provides information about actual account values and actual expenses. You may use the information below, together with the amount you invested, to estimate the expenses that you paid over the period. Simply divide your account value by $1,000 (for example, an $8,600 account value divided by $1,000 = 8.6), then multiply the result by the number in the table under the heading entitled “Expenses Paid During Period” to estimate the expenses you paid on your account during this period.
| Beginning Account Value 7/1/17 | Ending Account Value 12/31/17 | Expenses Paid During Period 7/1/17 - 12/31/17* | Annualized Expense Ratio During Period 7/1/17 - 12/31/17 | |||||||||||||||||
AZL MVP Fusion Dynamic Moderate Fund | $ | 1,000.00 | $ | 1,065.40 | $ | 1.09 | 0.21 | % | ||||||||||||
The Hypothetical Expense table below provides information about hypothetical account values and hypothetical expenses based on the Fund’s actual expense ratio and an assumed rate of return of 5% per year before expenses, which is not the Fund’s actual return. The hypothetical account values and expenses may not be used to estimate the actual ending account balance or expenses you paid for the period. You may use this information to compare this 5% hypothetical example with the 5% hypothetical examples that appear in the shareholder reports of other funds.
| Beginning Account Value 7/1/17 | Ending Account Value 12/31/17 | Expenses Paid During Period 7/1/17 - 12/31/17* | Annualized Expense Ratio During Period 7/1/17 - 12/31/17 | |||||||||||||||||
AZL MVP Fusion Dynamic Moderate Fund | $ | 1,000.00 | $ | 1,024.15 | $ | 1.07 | 0.21 | % | ||||||||||||
| * | Expenses are equal to the average account value over the period, multiplied by the Fund’s annualized expense ratio, multiplied by 184/365 (to reflect the one half year period). |
Portfolio Composition
(Unaudited)
| Investments | Percent of Net Assets | ||||
Fixed Income | 37.8 | ||||
Domestic Equities | 33.3 | ||||
International Equities | 24.4 | ||||
|
| ||||
Total Investment Securities | 95.5 | ||||
Net other assets (liabilities) | 4.5 | ||||
|
| ||||
Net Assets | 100.0 | % | |||
|
| ||||
3
AZL MVP Fusion Dynamic Moderate Fund
Schedule of Portfolio Investments
December 31, 2017
| Shares | Fair Value | |||||||
| Affiliated Investment Companies (95.5%): | ||||||||
| 10,468,588 | AZL DFA International Core Equity Fund | $ | 119,970,024 | |||||
| 4,721,595 | AZL DFA U.S. Core Equity Fund | 60,247,547 | ||||||
| 3,895,921 | AZL DFA U.S. Small Cap Fund | 48,348,380 | ||||||
| 5,448,718 | AZL Enhanced Bond Index Fund | 59,336,541 | ||||||
| 6,292,976 | AZL Gateway Fund | 83,822,440 | ||||||
| 17,930,767 | AZL International Index Fund, Class 2 | 310,202,260 | ||||||
| 19,053,557 | AZL MetWest Total Return Bond Fund | 194,346,284 | ||||||
| 4,078,519 | AZL Mid Cap Index Fund, Class 2 | 95,682,061 | ||||||
| 16,384,232 | AZL MSCI Emerging Markets Equity Index Fund, Class 2 | 143,689,713 | ||||||
| 19,070,646 | AZL Pyramis® Total Bond Fund, Class 2 | 195,092,711 | ||||||
| Shares | Fair Value | |||||||
| Affiliated Investment Companies, continued | ||||||||
| 15,189,923 | AZL Russell 1000 Growth Index Fund, Class 2 | $ | 231,038,729 | |||||
| 17,080,924 | AZL Russell 1000 Value Index Fund, Class 2 | 231,617,334 | ||||||
| 2,456,426 | AZL Small Cap Stock Index Fund, Class 2 | 36,551,620 | ||||||
| 8,897,783 | PIMCO VIT Income Portfolio | 95,562,194 | ||||||
| 15,166,280 | PIMCO VIT Low Duration Portfolio | 155,302,712 | ||||||
| 17,760,222 | PIMCO VIT Total Return Portfolio | 194,296,831 | ||||||
|
| |||||||
Total Affiliated Investment Companies (Cost $2,021,723,761) | 2,255,107,381 | |||||||
|
| |||||||
Total Investment Securities (Cost $2,021,723,761)(a) — 95.5% | 2,255,107,381 | |||||||
Net other assets (liabilities) — 4.5% | 106,378,995 | |||||||
|
| |||||||
Net Assets — 100.0% | $ | 2,361,486,376 | ||||||
|
| |||||||
Percentages indicated are based on net assets as of December 31, 2017.
| (a) | See Federal Tax Information listed in the Notes to the Financial Statements. |
Futures Contracts
Cash of $107,947,885 has been segregated to cover margin requirements for the following open contracts as of December 31, 2017:
Long Futures
| Description | Expiration Date | Number of Contracts | Notional Amount | Unrealized Appreciation/ (Depreciation) | ||||||||||||
S&P 500 Index E-Mini March Futures (U.S. Dollar) | 3/19/18 | 481 | $ | 64,357,800 | $ | 1,059,985 | ||||||||||
U.S. Treasury 10-Year Note March Futures (U.S. Dollar) | 3/21/18 | 349 | 43,292,359 | (232,862 | ) | |||||||||||
|
| |||||||||||||||
| $ | 827,123 | |||||||||||||||
|
| |||||||||||||||
See accompanying notes to the financial statements.
4
AZL MVP Fusion Dynamic Moderate Fund
Statement of Assets and Liabilities
December 31, 2017
Assets: | |||||
Investments in affiliates, at cost | $ | 2,021,723,761 | |||
|
| ||||
Investments in affiliates, at value | $ | 2,255,107,381 | |||
Segregated cash for collateral | 107,947,885 | ||||
Interest and dividends receivable | 796,500 | ||||
Receivable for investments sold | 1,167,424 | ||||
Receivable for variation margin on futures contracts | 661 | ||||
Prepaid expenses | 13,594 | ||||
|
| ||||
Total Assets | 2,365,033,445 | ||||
|
| ||||
Liabilities: | |||||
Cash overdraft | 1,167,425 | ||||
Payable for investments purchased | 697,185 | ||||
Payable for capital shares redeemed | 1,206,635 | ||||
Manager fees payable | 400,445 | ||||
Administration fees payable | 4,671 | ||||
Custodian fees payable | 937 | ||||
Administrative and compliance services fees payable | 5,322 | ||||
Transfer agent fees payable | 876 | ||||
Trustee fees payable | 3,429 | ||||
Other accrued liabilities | 60,144 | ||||
|
| ||||
Total Liabilities | 3,547,069 | ||||
|
| ||||
Net Assets | $ | 2,361,486,376 | |||
|
| ||||
Net Assets Consist of: | |||||
Capital | $ | 1,963,913,698 | |||
Accumulated net investment income/(loss) | 24,824,295 | ||||
Accumulated net realized gains/(losses) from investment transactions | 138,537,640 | ||||
Net unrealized appreciation/(depreciation) on investments | 234,210,743 | ||||
|
| ||||
Net Assets | $ | 2,361,486,376 | |||
|
| ||||
Shares of beneficial interest (unlimited number of shares authorized, no par value) | 197,248,294 | ||||
Net Asset Value (offering and redemption price per share) | $ | 11.97 | |||
|
|
For the Year Ended December 31, 2017
Investment Income: | |||||
Dividends from affiliates | $ | 25,448,448 | |||
Interest | 876,556 | ||||
Dividends | 152 | ||||
Other income | 4,754 | ||||
|
| ||||
Total Investment Income | 26,329,910 | ||||
|
| ||||
Expenses: | |||||
Manager fees | 4,715,944 | ||||
Administration fees | 62,346 | ||||
Custodian fees | 4,684 | ||||
Administrative and compliance services fees | 28,420 | ||||
Transfer agent fees | 6,574 | ||||
Trustee fees | 101,212 | ||||
Professional fees | 102,532 | ||||
Shareholder reports | 47,975 | ||||
Other expenses | 31,537 | ||||
|
| ||||
Total expenses | 5,101,224 | ||||
|
| ||||
Net Investment Income/(Loss) | 21,228,686 | ||||
|
| ||||
Realized and Unrealized Gains/(Losses) on Investments: | |||||
Net realized gains/(losses) on securities transactions from affiliates | 77,931,872 | ||||
Net realized gains distributions from affiliated underlying funds | 59,879,405 | ||||
Net realized gains/(losses) on futures contracts | 10,479,861 | ||||
Change in net unrealized appreciation/depreciation on affiliated transactions | 139,264,956 | ||||
Change in net unrealized appreciation/depreciation on futures contracts | 938,585 | ||||
|
| ||||
Net Realized/Unrealized Gains/(Losses) on Investments | 288,494,679 | ||||
|
| ||||
Change in Net Assets Resulting From Operations | $ | 309,723,365 | |||
|
|
See accompanying notes to the financial statements.
5
AZL MVP Fusion Dynamic Moderate Fund
Statements of Changes in Net Assets
| For the Year Ended December 31, 2017 | For the Year Ended December 31, 2016 | |||||||||
Change In Net Assets: | ||||||||||
Operations: | ||||||||||
Net investment income/(loss) | $ | 21,228,686 | $ | 32,590,785 | ||||||
Net realized gains/(losses) on investment transactions | 148,291,138 | 221,780,541 | ||||||||
Change in unrealized appreciation/depreciation on investments | 140,203,541 | (156,827,299 | ) | |||||||
|
|
|
| |||||||
Change in net assets resulting from operations | 309,723,365 | 97,544,027 | ||||||||
|
|
|
| |||||||
Distributions to Shareholders: | ||||||||||
From net investment income | (36,719,006 | ) | (50,970,662 | ) | ||||||
From net realized gains | (185,608,214 | ) | (148,289,923 | ) | ||||||
|
|
|
| |||||||
Change in net assets resulting from distributions to shareholders | (222,327,220 | ) | (199,260,585 | ) | ||||||
|
|
|
| |||||||
Capital Transactions: | ||||||||||
Proceeds from shares issued | 8,791,608 | 18,219,768 | ||||||||
Proceeds from dividends reinvested | 222,327,220 | 199,260,585 | ||||||||
Value of shares redeemed | (293,361,499 | ) | (245,864,524 | ) | ||||||
|
|
|
| |||||||
Change in net assets resulting from capital transactions | (62,242,671 | ) | (28,384,171 | ) | ||||||
|
|
|
| |||||||
Change in net assets | 25,153,474 | (130,100,729 | ) | |||||||
Net Assets: | ||||||||||
Beginning of period | 2,336,332,902 | 2,466,433,631 | ||||||||
|
|
|
| |||||||
End of period | $ | 2,361,486,376 | $ | 2,336,332,902 | ||||||
|
|
|
| |||||||
Accumulated net investment income/(loss) | $ | 24,824,295 | $ | 36,718,833 | ||||||
|
|
|
| |||||||
Share Transactions: | ||||||||||
Shares issued | 727,313 | 1,563,579 | ||||||||
Dividends reinvested | 19,249,110 | 17,509,717 | ||||||||
Shares redeemed | (24,205,850 | ) | (20,672,967 | ) | ||||||
|
|
|
| |||||||
Change in shares | (4,229,427 | ) | (1,599,671 | ) | ||||||
|
|
|
| |||||||
See accompanying notes to the financial statements.
6
AZL MVP Fusion Dynamic Moderate Fund
(Selected data for a share of beneficial interest outstanding throughout the periods indicated)
| Year Ended December 31, | |||||||||||||||||||||||||
| 2017 | 2016 | 2015 | 2014 | 2013 | |||||||||||||||||||||
Net Asset Value, Beginning of Period | $ | 11.60 | $ | 12.15 | $ | 13.05 | $ | 12.68 | $ | 11.17 | |||||||||||||||
|
|
|
|
|
|
|
|
|
| ||||||||||||||||
Investment Activities: | |||||||||||||||||||||||||
Net Investment Income/(Loss) | 0.12 | 0.18 | 0.22 | 0.14 | 0.11 | ||||||||||||||||||||
Net Realized and Unrealized Gains/(Losses) on Investments | 1.46 | 0.32 | (0.45 | ) | 0.40 | 1.57 | |||||||||||||||||||
|
|
|
|
|
|
|
|
|
| ||||||||||||||||
Total from Investment Activities | 1.58 | 0.50 | (0.23 | ) | 0.54 | 1.68 | |||||||||||||||||||
|
|
|
|
|
|
|
|
|
| ||||||||||||||||
Dividends to Shareholders From: | |||||||||||||||||||||||||
Net Investment Income | (0.20 | ) | (0.27 | ) | (0.17 | ) | (0.17 | ) | (0.17 | ) | |||||||||||||||
Net Realized Gains | (1.01 | ) | (0.78 | ) | (0.50 | ) | — | — | |||||||||||||||||
|
|
|
|
|
|
|
|
|
| ||||||||||||||||
Total Dividends | (1.21 | ) | (1.05 | ) | (0.67 | ) | (0.17 | ) | (0.17 | ) | |||||||||||||||
|
|
|
|
|
|
|
|
|
| ||||||||||||||||
Net Asset Value, End of Period | $ | 11.97 | $ | 11.60 | $ | 12.15 | $ | 13.05 | $ | 12.68 | |||||||||||||||
|
|
|
|
|
|
|
|
|
| ||||||||||||||||
Total Return(a) | 13.98 | % | 4.29 | % | (1.71 | )% | 4.24 | % | 15.17 | % | |||||||||||||||
Ratios to Average Net Assets/Supplemental Data: | |||||||||||||||||||||||||
Net Assets, End of Period (000’s) | $ | 2,361,486 | $ | 2,336,333 | $ | 2,466,434 | $ | 2,724,412 | $ | 2,753,188 | |||||||||||||||
Net Investment Income/(Loss) | 0.90 | % | 1.38 | % | 1.61 | % | 1.04 | % | 1.22 | % | |||||||||||||||
Expenses Before Reductions*(b) | 0.22 | % | 0.22 | % | 0.22 | % | 0.22 | % | 0.22 | % | |||||||||||||||
Expenses Net of Reductions* | 0.22 | % | 0.22 | % | 0.22 | % | 0.22 | % | 0.21 | % | |||||||||||||||
Portfolio Turnover Rate(c) | 17 | % | 58 | % | 13 | % | 20 | % | 5 | % | |||||||||||||||
| * | The expense ratios exclude the impact of fees/expenses paid by each underlying fund. |
| (a) | The returns include reinvested dividends and fund level expenses, but exclude insurance contract charges. If these charges were included, the returns would have been lower. |
| (b) | Excludes fee reductions. If such fee reductions had not occurred, the ratios would have been as indicated. |
| (c) | The portfolio turnover rate can be volatile due to the amount and timing of purchases and sales of fund shares during the period. |
See accompanying notes to the financial statements.
7
AZL MVP Fusion Dynamic Moderate Fund
Notes to the Financial Statements
December 31, 2017
1. Organization
The Allianz Variable Insurance Products Fund of Funds Trust (the “Trust”) was organized as a Delaware statutory trust on June 16, 2004. The Trust is a diversified open-end management investment company registered under the Investment Company Act of 1940, as amended, (the “1940 Act”) and thus is determined to be an investment company for accounting purposes. The Trust consists of 12 separate investment portfolios (collectively, the “Funds”), of which one is included in this report, the AZL MVP Fusion Dynamic Moderate Fund (the “Fund”), and 11 are presented in separate reports.
The Fund is a “fund of funds,” which means that the Fund invests primarily in other mutual funds. Underlying Funds invest in stock, bonds, and other securities and reflect varying amounts of potential investment risk and reward. The Underlying Funds record their investments at fair value. Periodically, the Fund will adjust its asset allocation as it seeks to achieve its investment objective.
The Trust is authorized to issue an unlimited number of shares of the Fund without par value. Shares of the Fund are available through the variable annuity contracts offered through the separate accounts of participating insurance companies. Currently, the Fund only offers its shares to separate accounts of Allianz Life Insurance Company of North America and Allianz Life Insurance Company of New York, affiliates of the Trust and the Manager, as defined below.
Under the Trust’s organizational documents, its officers and trustees are indemnified against certain liabilities arising out of the performance of their duties to the Fund. In addition, in the normal course of business, the Fund may enter into contracts with its vendors and others that provide for general indemnifications. The Fund’s maximum exposure under these arrangements is unknown, as this would involve future claims that may be made against the Fund. However, based on experience, the Fund expects that risk of loss to be remote.
2. Significant Accounting Policies
The following is a summary of significant accounting policies followed by the Fund in the preparation of its financial statements. The policies conform with U.S. generally accepted accounting principles (“U.S. GAAP”). The preparation of financial statements requires management to make certain estimates and assumptions that affect the reported amounts of assets and liabilities and disclosure of contingent assets and liabilities at the date of the financial statements and the reported amounts of increases and decreases in net assets from operations during the reporting period. Actual results could differ from those estimates.
Security Valuation
The Fund records its investments at fair value. Fair value is defined as the price that would be received to sell an asset or paid to transfer a liability in an orderly transaction between willing market participants at the measurement date. The valuation techniques used to determine fair value are further described in Note 4 below.
Investment Transactions and Investment Income
Investment transactions are accounted for on trade date. Net realized gains and losses on investments sold and on foreign currency transactions are recorded on the basis of identified cost. Interest income is recorded on the accrual basis and includes, where applicable, the amortization of premiums or accretion of discounts.
Dividends to Shareholders
Dividends to shareholders are recorded on the ex-dividend date. The Fund distributes its dividends from net investment income and net realized capital gains, if any, on an annual basis. The amount of dividends from net investment income and from net realized gains is determined in accordance with federal income tax regulations, which may differ from U.S. GAAP. These “book/tax” differences are either temporary or permanent in nature. To the extent these differences are permanent in nature (e.g., miscellaneous adjustments on return of capital), such amounts are reclassified within the composition of net assets based on their federal tax-basis treatment; temporary differences (e.g., wash sales and differing treatment on certain investments) do not require reclassification. Dividends to shareholders that exceed net investment income and net realized gains for tax purposes are reported as distributions of capital.
Expense Allocation
Expenses directly attributable to the Fund are charged directly to the Fund, while expenses attributable to more than one Fund are allocated among the respective Funds based upon relative net assets or some other reasonable method. Expenses which are attributable to more than one Trust are allocated across the Allianz Variable Insurance Products and Allianz Variable Insurance Products Fund of Funds Trusts based upon relative net assets or another reasonable basis. Allianz Investment Management LLC (the “Manager”), serves as the investment manager for the Trust and the Allianz Variable Insurance Products Trust.
Derivative Instruments
All open derivative positions at period end are reflected on the Fund’s Schedule of Portfolio Investments. The following is a description of the derivative instruments utilized by the Fund, including the primary underlying risk exposures related to each instrument type. The Fund’s allocation to the MVP (Managed Volatility Portfolio) risk management process may include (a) derivatives such as index futures, other futures contracts, options, and other similar securities and (b) cash, money market equivalents, short-term debt instruments, money market funds, and short-term debt funds to satisfy all applicable margin requirements and to provide additional portfolio liquidity to satisfy large redemptions and any margin calls. Due to the leverage provided by derivatives, the notional value of the Fund’s derivative positions could exceed 20% of the Fund’s value. The Fund may also use futures to gain equity exposure and may hold cash as a buffer in the event of market shocks.
Futures Contracts
During the year ended December 31, 2017, the Fund invested in futures contracts to reduce volatility and limit the need to decrease or increase allocations to underlying funds. Futures contracts are valued based upon their quoted daily settlement prices. Upon entering into a futures contract, the Fund is required to segregate liquid assets in accordance
8
AZL MVP Fusion Dynamic Moderate Fund
Notes to the Financial Statements
December 31, 2017
with the initial margin requirements of the broker or exchange. Futures contracts are marked to market daily and a payable or receivable for the change in value (“variation margin”) is recorded by the Fund. Gains or losses are recognized but not considered realized until the contracts expire or are closed. Futures contracts involve, to varying degrees, elements of market risk (generally equity price risk related to stock futures, interest rate risk related to bond futures, and foreign currency risk related to currency futures) and exposure to loss in excess of the variation margin disclosed in the Statement of Assets and Liabilities. The primary risks associated with the use of futures contracts are the imperfect correlation between the change in fair value of the underlying securities and the prices of futures contracts, the possibility of an illiquid market, and the inability of the counterparty to meet the terms of the contract. For the year ended December 31, 2017, the monthly average notional amount for long contracts was $99.6 million. Realized gains and losses are reported as “Net realized gains/(losses) on futures contracts” on the Statement of Operations.
Summary of Derivative Instruments
The following is a summary of the fair values of derivative instruments on the Fund’s Statement of Assets and Liabilities, categorized by risk exposure, as of December 31, 2017:
Asset Derivative | Liability Derivative | |||||||||||
| Primary Risk Exposure | Statement of Assets and Liabilities Location | Total Fair Value* | Statement of Assets and Liabilities Location | Total Fair Value* | ||||||||
Equity Risk | ||||||||||||
| Equity Contracts | Receivable for variation margin on futures contracts | $ | 1,059,985 | Payable for variation margin on futures contracts | $ | — | ||||||
Interest Rate Risk | ||||||||||||
| Interest Rate Contracts | — | 232,862 | ||||||||||
| * | For futures contracts, the amounts represent the cumulative appreciation/depreciation of these futures contracts as reported in the Schedule of Portfolio Investments. Only current day’s variation margin is reported within the Statement of Assets and Liabilities as variation margin on futures contracts. |
The following is a summary of the effect of derivative instruments on the Statement of Operations, categorized by risk exposure, for the year ended December 31, 2017:
| Primary Risk Exposure | Location of Gains/(Losses) on Derivatives Recognized | Realized Gains/(Losses) on Derivatives Recognized | Change in Net Unrealized Appreciation/Depreciation on Derivatives Recognized | |||||||
Equity Risk | ||||||||||
| Equity Contracts | Net Realized gains/(losses) on futures contracts/Change in net unrealized appreciation/depreciation on futures contracts | $ | 10,172,662 | $ | 950,481 | |||||
Interest Rate Risk | ||||||||||
| Interest Rate Contracts | 307,199 | (11,896 | ) | |||||||
3. Fees and Transactions with Affiliates and Other Parties
The Manager provides investment advisory and management services for the Fund. The Manager has contractually agreed to waive fees and reimburse the Fund to limit the annual expenses, excluding interest expense (e.g., cash overdraft fees), taxes, brokerage commissions, acquired fund fees and expenses, other expenditures that are capitalized in accordance with U.S. GAAP and other extraordinary expenses not incurred in the ordinary course of the Fund’s business, based on the daily net assets of the Fund, through April 30, 2019. Expenses incurred for investment advisory and management services are reflected on the Statement of Operations as “Manager fees.” At December 31, 2017, there were no contractual reimbursements that are subject to repayment by the Fund in subsequent years.
For the year ended December 31, 2017, the annual rate paid to the Manager and the annual expense limit were as follows:
| Annual Rate | Annual Expense Limit | |||||||||
AZL MVP Fusion Dynamic Moderate Fund | 0.20 | % | 0.30 | % | ||||||
Any amounts contractually waived or reimbursed by the Manager in a particular fiscal year will be subject to repayment by the Fund to the Manager to the extent that from time to time through the next three fiscal years the repayment will not cause the Fund’s expenses to exceed the lesser of the stated limit at the time of the waiver or the current stated limit. Any amounts recouped by the Manager during the year are reflected on the Statement of Operations as “Recoupment of prior expenses reimbursed by the Manager.”
In addition, the Manager may voluntarily waive or reimburse additional fees in order to maintain more competitive expense ratios. Any voluntary waivers or reimbursements are not subject to repayment in subsequent years. Information on the total amount waived/reimbursed by the Manager or repaid to the Manager by the Fund during the period can be found on the Statement of Operations. During the year ended December 31, 2017, there were no voluntary waivers.
9
AZL MVP Fusion Dynamic Moderate Fund
Notes to the Financial Statements
December 31, 2017
The Manager or an affiliate of the Manager serves as the investment adviser of certain underlying funds in which the Fund invests. At December 31, 2017, these underlying funds are noted as Affiliated Investment Companies in the Fund’s Schedule of Portfolio Investments. Additional information, including financial statements, about these Funds is available at www.allianzlife.com. The Manager or an affiliate of the Manager is paid a separate fee from the underlying funds for such services. A summary of the Fund’s investments in affiliated investment companies for the year ended December 31, 2017 is as follows:
| Fair Value 12/31/16 | Purchases at Cost | Proceeds from Sales | Net Realized Gains/(Losses) | Net Change in Unrealized Appreciation/ Depreciation | Fair Value 12/31/17 | Shares as of 12/31/2017 | Dividend Income | Net realized gains distributions from affiliated underlying funds | |||||||||||||||||||||||||||||||||||||
AZL DFA International Core Equity Fund | $ | 119,449,559 | $ | 1,556,004 | $ | (27,506,289 | ) | $ | 1,069,143 | $ | 25,401,607 | $ | 119,970,024 | 10,468,588 | $ | 1,556,004 | $ | — | |||||||||||||||||||||||||||
AZL DFA U.S. Core Equity Fund | 63,025,952 | 816,947 | (14,080,005 | ) | 1,919,758 | 8,564,895 | 60,247,547 | 4,721,595 | 689,836 | 127,113 | |||||||||||||||||||||||||||||||||||
AZL DFA U.S. Small Cap Fund | 51,945,519 | 999,082 | (8,652,275 | ) | 1,270,738 | 2,785,316 | 48,348,380 | 3,895,921 | 272,217 | 726,865 | |||||||||||||||||||||||||||||||||||
AZL Enhanced Bond Index Fund | 141,928,054 | 544,780 | (85,546,185 | ) | (1,243,669 | ) | 3,653,561 | 59,336,541 | 5,448,718 | 544,781 | — | ||||||||||||||||||||||||||||||||||
AZL Gateway Fund | 59,933,815 | 22,709,139 | (4,770,521 | ) | 625,101 | 5,324,906 | 83,822,440 | 6,292,976 | 821,239 | — | |||||||||||||||||||||||||||||||||||
AZL International Index Fund, Class 2 | 236,276,569 | 68,721,027 | (49,390,961 | ) | 9,055,340 | 45,540,285 | 310,202,260 | 17,930,767 | 2,714,091 | 2,367,236 | |||||||||||||||||||||||||||||||||||
AZL MetWest Total Return Bond Fund | 189,923,737 | 4,146,168 | (2,196,891 | ) | 54,310 | 2,418,960 | 194,346,284 | 19,053,557 | 2,968,243 | 520,427 | |||||||||||||||||||||||||||||||||||
AZL Mid Cap Index Fund, Class 2 | 122,811,070 | 48,791,267 | (86,122,577 | ) | 17,964,613 | (7,762,312 | ) | 95,682,061 | 4,078,519 | 223,814 | 2,452,253 | ||||||||||||||||||||||||||||||||||
AZL MSCI Emerging Markets Equity Fund, Class 2 | 90,560,225 | 47,013,457 | (27,810,207 | ) | 3,694,558 | 30,231,680 | 143,689,713 | 16,384,232 | 542,735 | 3,269,520 | |||||||||||||||||||||||||||||||||||
AZL Pyramis® Total Bond Fund, Class 2 | 188,174,316 | 5,759,109 | (2,256,767 | ) | 65,697 | 3,350,356 | 195,092,711 | 19,070,646 | 4,642,790 | — | |||||||||||||||||||||||||||||||||||
AZL Russell 1000 Growth Index Fund, Class 2 | 286,156,605 | 25,665,889 | (126,672,267 | ) | 23,447,247 | 22,441,255 | 231,038,729 | 15,189,923 | 684,183 | 23,534,705 | |||||||||||||||||||||||||||||||||||
AZL Russell 1000 Value Index Fund, Class 2 | 286,698,914 | 33,493,948 | (93,453,236 | ) | 14,430,706 | (9,552,998 | ) | 231,617,334 | 17,080,924 | 1,793,968 | 26,038,880 | ||||||||||||||||||||||||||||||||||
AZL Small Cap Stock Index Fund, Class 2 | 52,063,304 | 23,960,687 | (41,487,240 | ) | 5,518,586 | (3,503,717 | ) | 36,551,620 | 2,456,426 | 60,680 | 842,406 | ||||||||||||||||||||||||||||||||||
PIMCO VIT Income Portfolio | 95,770,673 | 2,314,649 | (7,556,845 | ) | 284,340 | 4,749,377 | 95,562,194 | 8,897,783 | 2,314,648 | — | |||||||||||||||||||||||||||||||||||
PIMCO VIT Low Duration Portfolio | 70,381,649 | 89,152,924 | (4,232,293 | ) | (171,223 | ) | 171,655 | 155,302,712 | 15,166,280 | 1,700,724 | — | ||||||||||||||||||||||||||||||||||
PIMCO VIT Total Return Portfolio | 190,678,846 | 3,918,495 | (5,697,267 | ) | (53,373 | ) | 5,450,130 | 194,296,831 | 17,760,222 | 3,918,495 | — | ||||||||||||||||||||||||||||||||||
|
|
|
|
|
|
|
|
|
|
|
|
|
|
|
|
|
| ||||||||||||||||||||||||||||
| $ | 2,245,778,807 | $ | 379,563,572 | $ | (587,431,826 | ) | $ | 77,931,872 | $ | 139,264,956 | $ | 2,255,107,381 | 183,897,077 | $ | 25,448,448 | $ | 59,879,405 | ||||||||||||||||||||||||||||
|
|
|
|
|
|
|
|
|
|
|
|
|
|
|
|
|
| ||||||||||||||||||||||||||||
Pursuant to separate agreements between the Funds and the Manager, the Manager provides a Chief Compliance Officer (“CCO”) and certain compliance oversight and regulatory filing services to the Trust. Under these agreements the Manager is entitled to an amount equal to a portion of the compensation and certain other expenses related to the individuals performing the CCO and compliance oversight services, as well as $100 per hour for time incurred in connection with the preparation and filing of certain documents with the Securities and Exchange Commission (“SEC” or the “Commission”). The fees are paid to the Manager on a quarterly basis. The total expenses incurred by the Fund for these services are reflected on the Statement of Operations as “Administrative and compliance services fees.”
Citi Fund Services Ohio, Inc. (“Citi” or the “Administrator”), a wholly owned subsidiary of Citigroup, Inc., with which an officer of the Trust is affiliated, serves as the Trust’s administrator and fund accountant, and assists the Trust in all aspects of its administration and operation. The Administrator is entitled to a fee, accrued daily and paid monthly. The Administrator is entitled to an annual fee for each additional class of shares of any Fund, certain annual fees in supporting fair values services, and a Trust-wide annual fee for providing infrastructure and support in implementing the written policies and procedures comprising the Fund’s compliance program. The Administrator is also reimbursed for certain expenses incurred. The total expenses incurred by the Fund for these services are reflected on the Statement of Operations as “Administration fees.”
FIS Investor Services LLC (“FIS”) serves as the Fund’s transfer agent. Under the Transfer Agent Agreement, the Trust pays FIS a fee for its services and reimburses FIS for all of their reasonable out-of-pocket expenses incurred in providing these services.
The Bank of New York Mellon (“BNY Mellon” or the “Custodian”) serves as the Trust’s custodian and securities lending agent. For these services as custodian, the Funds pay BNY Mellon a fee based on a percentage of assets held on behalf of the Funds, plus certain out-of-pocket charges.
Allianz Life Financial Services, LLC (“ALFS”), an affiliate of the Manager, serves as distributor of the Fund. ALFS receives an annual Trust-wide annual fee of $7,500, paid by the Manager from its profits and not by the Trust, for recordkeeping and reporting services.
In addition, certain legal fees and expenses are paid to a law firm, Dorsey & Whitney LLP, of which the Secretary of the Fund is Senior Counsel. During the year ended December 31, 2017, $24,234 was paid from the Fund relating to these fees and expenses.
Certain Officers and Trustees of the Trust are affiliated with the Manager or the Administrator. Such Officers (except for the Trust’s CCO as noted above) and Trustees receive no compensation from the Trust for serving in their respective roles. For their service to the Trust and to the Allianz Variable Insurance Products Trust, each non-interested Trustee receives a $170,000 annual Board retainer, the Lead Director receives an additional $42,500 annually and the Chair of the Nominating and Corporate Governance Committee receives an additional $25,500 annually. In addition, the Trustees are reimbursed for certain expenses associated with attending Board meetings. Compensation to the Trustees is allocated between the Trust and the Allianz Variable Insurance Products Fund of Funds Trust in proportion to the assets under management of each trust. During the year ended December 31, 2017, actual Trustee compensation was $1,116,333 in total for both trusts.
10
AZL MVP Fusion Dynamic Moderate Fund
Notes to the Financial Statements
December 31, 2017
4. Investment Valuation Summary
The valuation techniques employed by the Fund, as described below, maximize the use of observable inputs and minimize the use of unobservable inputs in determining fair value. The inputs used for valuing the Fund’s investments are summarized in the three broad levels listed below:
| ● | Level 1 — quoted prices in active markets for identical assets |
| ● | Level 2 — other significant observable inputs (including quoted prices for similar securities, interest rates, prepayments speeds, credit risk, etc.) |
| ● | Level 3 — significant unobservable inputs (including the Fund’s own assumptions in determining the fair value of investments) |
Changes in valuation techniques may result in transfers in or out of an assigned level within the disclosure hierarchy. The Fund determines transfers between fair value hierarchy levels at the reporting period end. The inputs or methodology used for valuing investments is not necessarily an indication of the risk associated with investing in those investments.
Investments in other investment companies are valued at their published net asset value (“NAV”). Security prices are generally provided by an independent third party pricing service approved by the Trust’s Board of Trustees (the “Board” or “Trustees”) as of the close of the New York Stock Exchange (“NYSE”) (generally 4:00 pm Eastern Time). The investments utilizing Level 1 valuations represent investments in open-end investment companies. Futures contracts are valued at the last sales price as of the close of the primary exchange and are typically categorized as Level 1 in the fair value hierarchy.
For the year ended December 31, 2017, there were no Level 3 investments for which significant unobservable inputs were used to determine fair value. There were no significant transfers between Levels 1 and 2 as of December 31, 2017, based on levels assigned to securities on December 31, 2016.
The following is a summary of the valuation inputs used as of December 31, 2017 in valuing the Fund’s investments based upon the three levels defined above:
| Investment Securities: | Level 1 | Level 2 | Level 3 | Total | ||||||||||||||||
Affiliated Investment Companies | $ | 2,255,107,381 | $ | — | $ | — | $ | 2,255,107,381 | ||||||||||||
|
|
|
|
|
|
|
| |||||||||||||
Total Investment Securities | 2,255,107,381 | — | — | 2,255,107,381 | ||||||||||||||||
|
|
|
|
|
|
|
| |||||||||||||
Other Financial Instruments:* | ||||||||||||||||||||
Futures Contracts | 827,123 | — | — | 827,123 | ||||||||||||||||
|
|
|
|
|
|
|
| |||||||||||||
Total Investments | $ | 2,255,934,504 | $ | — | $ | — | $ | 2,255,934,504 | ||||||||||||
|
|
|
|
|
|
|
| |||||||||||||
Other Financial Instruments would include any derivative instruments, such as futures contracts. These investments are generally presented in the financial statements at variation margin.
5. Security Purchases and Sales
For the year ended December 31, 2017, cost of purchases and proceeds from sales of securities (excluding securities maturing less than one year from acquisition) were as follows:
| Purchases | Sales | |||||||||
AZL MVP Fusion Dynamic Moderate Fund | $ | 379,563,572 | $ | 587,431,826 | ||||||
6. Investment Risks
Derivatives Risk: The Fund may invest directly or through affiliated or unaffiliated mutual funds or unregistered investment pools in derivative instruments such as futures, options, and options on futures. A derivative is a financial contract whose value depends on, or is derived from, the value of an underlying asset, reference rate, or risk. Use of derivative instruments involves risks different from, or possibly greater than, the risks associated with investing directly in securities and other traditional investments. Derivatives are subject to a number of other risks, such as liquidity risk, interest rate risk, market risk, credit risk, and selection risk. Derivatives also involve the risk of mispricing or improper valuation and the risk that changes in the value may not correlate perfectly with the underlying asset, rate, or index. Using derivatives may result in losses, possibly in excess of the principal amount invested. Also, suitable derivative transactions may not be available in all circumstances. The other party to a derivatives contract could default.
Fund of Funds Risk: The Fund, as a shareholder of the underlying funds, indirectly bears its proportionate share of any investment management fees and other expenses of the underlying funds. Further due to the fees and expenses paid by the Fund, as well as small variations in the Fund’s actual allocations to the underlying funds and any futures and cash held in the Fund’s portfolio, the performance and income distributions of the Fund will not be the same as the performance and income distributions of the underlying funds.
7. Federal Tax Information
It is the policy of the Fund to continue to qualify as a regulated investment company by complying with the provisions available to certain investment companies, as defined under Subchapter M of the Internal Revenue Code, and to make distributions of net investment income and net realized gains sufficient to relieve it from all, or substantially all, federal income taxes. Accordingly, no provisions for federal income taxes are required in the financial statements.
Management of the Fund has reviewed tax positions taken in tax years that remain subject to examination by all major tax jurisdictions, including federal (i.e., the last four tax year ends and the interim tax period since then, as applicable). Management believes that there is no tax liability resulting from unrecognized tax benefits related to uncertain tax positions taken.
Cost of securities, including derivatives and short positions as applicable, for federal income tax purposes at December 31, 2017 is $2,025,371,361. The gross unrealized appreciation/(depreciation) on a tax basis is as follows:
Unrealized appreciation | $ | 232,548,362 | ||
Unrealized (depreciation) | (2,812,342 | ) | ||
|
| |||
Net unrealized appreciation/(depreciation) | $ | 229,736,020 | ||
|
|
11
AZL MVP Fusion Dynamic Moderate Fund
Notes to the Financial Statements
December 31, 2017
The tax character of dividends paid to shareholders during the year ended December 31, 2017 were as follows:
| Ordinary Income | Net Long-Term | Total Distributions(a) | |||||||||||||
AZL MVP Fusion Dynamic Moderate Fund | $ | 36,719,006 | $ | 185,608,214 | $ | 222,327,220 | |||||||||
| (a) | Total distributions paid may differ from the Statements of Changes in Net Assets because dividends are recognized when actually paid for tax purposes. |
The tax character of dividends paid to shareholders during the year ended December 31, 2016 were as follows:
| Ordinary Income | Net Long-Term | Total Distributions(a) | |||||||||||||
AZL MVP Fusion Dynamic Moderate Fund | $ | 50,970,662 | $ | 148,289,923 | $ | 199,260,585 | |||||||||
| (a) | Total distributions paid may differ from the Statements of Changes in Net Assets because dividends are recognized when actually paid for tax purposes. |
At December 31, 2017, the components of accumulated earnings on a tax basis were as follows:
| Undistributed Ordinary Income | Undistributed Long-Term Capital Gains | Accumulated Capital and Other Losses | Unrealized Appreciation/ Depreciation(a) | Total Accumulated Earnings/ (Deficit) | |||||||||||||||||||||
AZL MVP Fusion Dynamic Moderate Fund | $ | 47,347,648 | $ | 120,489,010 | $ | — | $ | 229,736,020 | $ | 397,572,678 | |||||||||||||||
| (a) | The difference between book-basis and tax-basis unrealized appreciation/depreciation is attributable primarily to tax deferral of losses on wash sales. |
8. Ownership and Principal Holders
The beneficial ownership, either directly or indirectly, of more than 25% of the voting securities of a fund creates presumptions of control of the fund, under section 2 (a)(9) of the 1940 Act. As of December 31, 2017, the Fund had an individual shareholder account which is affiliated with the Investment Adviser representing ownership of 90% of the Fund. As of December 31, 2017, the Fund had a controlling interest (in excess of 50%) in the AZL MetWest Total Return Bond Fund, which is affiliated with the Investment Adviser.
9. Investment Company Reporting Modernization
In October 2016, the SEC released its Final Rule on Investment Company Reporting Modernization (the “Rules”). The Rules which introduce two new regulatory reporting forms for investment companies — Form N-PORT and Form N-CEN — also contain amendments to Regulation S-X which require standardized, enhanced disclosures about derivatives in investment company financial statements, as well as other amendments. The amendments to Regulation S-X became effective for filings made with the SEC after August 1, 2017. The compliance date for form N-PORT and Form N-CEN will vary based on the reporting entity’s size and, in the case of the Fund, is expected to be April 30, 2019. The Fund’s adoption of these amendments, as applicable for the financial statements prepared as of December 31, 2017, had no effect on the Fund’s net assets or results of operations.
10. Subsequent Events
Management of the Fund has evaluated the need for additional disclosures or adjustments resulting from events through the date the financial statements were issued. Based on this evaluation, there were no subsequent events to report that would have material impact on the Fund’s financial statements.
12
REPORT OF INDEPENDENT REGISTERED PUBLIC ACCOUNTING FIRM
To the Shareholders and Board of Trustees of
Allianz Variable Insurance Products Fund of Funds Trust:
Opinion on the Financial Statements
We have audited the accompanying statement of assets and liabilities of AZL MVP Fusion Dynamic Moderate Fund (the “Fund”) of the Allianz Variable Insurance Products Fund of Funds Trust, including the schedule of portfolio investments, as of December 31, 2017, and the related statement of operations for the year then ended, the statements of changes in net assets for each of the years in the two-year period then ended, and the related notes (collectively, the “financial statements”) and the financial highlights for each of the years in the five-year period then ended. In our opinion, the financial statements present fairly, in all material respects, the financial position of the Fund as of December 31, 2017, the results of its operations for the year then ended, the changes in its net assets for each of the years in the two-year period then ended and the financial highlights for each of the years in the five-year period then ended, in conformity with U.S. generally accepted accounting principles.
Basis for Opinion
These financial statements and financial highlights are the responsibility of the Fund’s management. Our responsibility is to express an opinion on these financial statements and financial highlights based on our audits. We are a public accounting firm registered with the Public Company Accounting Oversight Board (United States) (“PCAOB”) and are required to be independent with respect to the Fund in accordance with the U.S. federal securities laws and the applicable rules and regulations of the Securities and Exchange Commission and the PCAOB.
We conducted our audits in accordance with the standards of the PCAOB. Those standards require that we plan and perform the audit to obtain reasonable assurance about whether the financial statements and financial highlights are free of material misstatement whether due to error or fraud. Our audits included performing procedures to assess the risks of material misstatement of the financial statements and financial highlights, whether due to error or fraud, and performing procedures that respond to those risks. Such procedures included examining, on a test basis, evidence regarding the amounts and disclosures in the financial statements and financial highlights. Such procedures also included confirmation of securities owned as of December 31, 2017, by correspondence with the investees, brokers, and transfer agents of the underlying funds. Our audits also included evaluating the accounting principles used and significant estimates made by management, as well as evaluating the overall presentation of the financial statements and financial highlights. We believe that our audits provide a reasonable basis for our opinion.
/s/ KPMG LLP
We have served as the auditor of one or more Allianz Variable Insurance Products investment companies since 1999.
Columbus, Ohio
February 23, 2018
13
Other Federal Income Tax Information (Unaudited)
For the year ended December 31, 2017, 25.77% of the total ordinary income dividends paid by the Fund qualify for the corporate dividends received deduction available to corporate shareholders.
During the year ended December 31, 2017, the Fund declared net long-term capital gain distributions of $185,608,214.
14
A description of the policies and procedures that the Fund uses to determine how to vote proxies relating to portfolio securities is available, without charge, upon request, by visiting the Securities and Exchange Commission’s (“Commission”) website at www.sec.gov, or by calling 800-624-0197.
Information regarding how the Fund voted proxies relating to portfolio securities during the most recent 12-month period ended June 30th is available (i) without charge, upon request, by calling 800-624-0197; (ii) on the Allianz Variable Insurance Products Trust’s website at https://www.allianzlife.com; and (iii) on the Commission’s website at http://www.sec.gov.
The Fund files complete Schedules of Portfolio Holdings with the Commission for the first and third quarters of each fiscal year on Form N-Q. Schedules of Portfolio Holdings for the Fund in this report are available without charge on the Commission’s website at http://www.sec.gov, or may be reviewed and copied at the Commission’s Public Reference Room in Washington, D.C. Information on the operation of the Public Reference Room may be obtained by calling 800-SEC-0330.
15
Approval of Investment Advisory Agreement (Unaudited)
Subject to the general supervision of the Board of Trustees (the “Board”) and in accordance with the investment objectives and restrictions of each separate series (together, the “Funds”) of the Allianz Variable Insurance Products Fund of Funds Trust (the “Trust”), investment advisory services are provided to the Funds by Allianz Investment Management LLC (the “Manager”). As used in this section, “Fund” refers to any of the Funds. The Manager manages each Fund pursuant to an investment management agreement (the “Management Agreement”) with the Trust in respect of each such Fund. The Management Agreement provides that the Manager, subject to the supervision and approval of the Board, is responsible for the management of each Fund. For management services, each Fund pays the Manager an investment advisory fee based upon each Fund’s average daily net assets. The Manager has contractually agreed to limit the expenses of each Fund by reimbursing the Fund if and when total Fund operating expenses exceed certain amounts until at least May 1, 2019 (the “Expense Limitation Agreement”).
In reviewing the services provided by the Manager and the terms of the Management Agreement, the Board receives and reviews information related to the Manager’s experience and expertise in the variable insurance marketplace. Currently, the Funds are offered only through variable annuities and variable life insurance policies, and not in the retail fund market. In addition, the Board receives information regarding the Manager’s expertise with regard to portfolio diversification and asset allocation requirements within variable insurance products issued by Allianz Life Insurance Company of North America (“Allianz Life”) and its subsidiary, Allianz Life Insurance Company of New York (“Allianz of New York”). Currently, the Funds are offered only through Allianz Life and Allianz of New York variable products.
As required by the Investment Company Act of 1940 (the “1940 Act”), the Board has reviewed and approved the Management Agreement with the Manager. The Board’s decision to approve this contract reflects the exercise of its business judgment on whether to approve new arrangements and continue the existing arrangements. During its review of the contract, the Board considered many factors, among the most material of which are: the Fund’s investment objectives and long-term performance; the Manager’s management philosophy, personnel, processes and investment performance, including its compliance history and the adequacy of its compliance processes; the preferences and expectations of Fund shareholders (and underlying contract owners) and their relative sophistication; the continuing state of competition in the mutual fund industry; and comparable fees in the mutual fund industry.
The Board also considered the compensation and benefits received by the Manager. This includes fees received for services provided to a Fund by employees of the Manager or of affiliates of the Manager and research services received by the Manager from brokers that execute Fund trades, as well as advisory fees. The Board considered the fact that: (1) the Manager and the Trust are parties to an Administrative Services Agreement and a Compliance Services Agreement, under which the Manager is compensated by the Trust for performing certain administrative and compliance services including providing an employee of the Manager or one of its affiliates to act as the Trust’s Chief Compliance Officer; and (2) Allianz Life Financial Services, LLC, an affiliated person of the Manager, is a registered securities broker-dealer and received (along with its affiliated persons) payments made by the underlying funds pursuant to Rule 12b-1.
The Board is aware that various courts have interpreted provisions of the 1940 Act and have indicated in their decisions that the following factors may be relevant to an adviser’s compensation: the nature and quality of the services provided by the adviser, including the performance of the fund; the adviser’s cost of providing the services; the extent to which the adviser may realize “economies of scale” as the fund grows larger; any indirect benefits that may accrue to the adviser and its affiliates as a result of the adviser’s relationship with the fund; performance and expenses of comparable funds; the profitability of acting as adviser to the fund; and the extent to which the independent Board members, who are not “interested persons” of a fund as defined by the 1940 Act, are fully informed about all facts bearing on the adviser’s services and fees. The Board is aware of these factors and takes them into account in its review of the Management Agreement for the Funds.
The Board considered and weighed these circumstances in light of its experience in governing the Trust, and is assisted in its deliberations by the advice of independent legal counsel to the independent Trustees. In this regard, the Board requests and receives a significant amount of information about the Funds and the Manager. Some of this information is provided at each regular meeting of the Board; additional information is provided in connection with the particular meeting or meetings at which the Board’s formal review of an advisory contract occurs. In between regularly scheduled meetings, the Board may receive information on particular matters as the need arises. Thus, the Board’s evaluation of the Management Agreement is informed by reports covering such matters as: the Manager’s investment philosophy, personnel and processes, and the Fund’s investment performance (in absolute terms as well as in relationship to its benchmark). In connection with comparing the performance of each Fund versus its benchmark, the Board receives reports on the extent to which the Fund’s performance may be attributed to various applicable factors, such as asset class allocation decisions and volatility management strategies, the performance of the underlying funds, rebalancing decisions, and the impact of cash positions and Fund fees and expenses. The Board also receives reports on the Funds’ expenses (including the advisory fee itself and the overall expense structure of the Funds, both in absolute terms and relative to similar and/or competing funds, with due regard for the Expense Limitation Agreement and additional voluntary expense limitations); the nature and extent of the advisory and other services provided to the Fund by the Manager and its affiliates; compliance and audit reports concerning the Funds and the companies that service them; and relevant developments in the mutual fund industry and how the Funds and/or the Manager are responding to them.
The Board also receives financial information about the Manager, including reports on the compensation and benefits the Manager derives from its relationships with the Funds. These reports cover not only the fees under the Management Agreement, but also fees, if any, received for providing other services to the Funds. The reports also discuss any indirect or “fall out” benefits the Manager or its affiliates may derive from its relationship with the Funds.
The Management Agreement was most recently considered at Board meetings held in the fall of 2017. Information relevant to the approval of the Management Agreement was considered at a telephonic Board meeting on October 18, 2017, and at an “in person” Board meeting held October 23, 2017. The Management Agreement was approved at the Board meeting of October 23, 2017. At such meeting the Board also approved the Expense Limitation Agreement between the Manager and the Trust for the period ending April 30, 2019. In connection with such meetings, the Trustees requested and evaluated extensive materials from the Manager, including performance and expense information for other investment companies with similar investment objectives derived from data compiled by an independent third party provider and other sources believed to be reliable by the Manager. Prior to voting, the Trustees reviewed the proposed approval/continuance of the Agreement with management and with experienced counsel who are independent of the Manager and received a memorandum from such counsel discussing the legal standards for their consideration of the proposed approvals/continuances. The independent Trustees also discussed the proposed approvals/continuances in a private session with such counsel at which no representatives of the Manager were present. In reaching their determinations relating to the approval and/or continuance of the Agreement, in respect of each Fund, the Board considered all factors it believed relevant. The Board based its decision to approve the Management Agreement on the totality of the circumstances and relevant factors, and with a view to past and future long-term considerations. Not all of the factors and considerations discussed above and below are necessarily relevant to every Fund, and the Board did not assign relative weights to factors discussed herein or deem any one or group of them to be controlling in and of themselves.
An SEC rule requires that shareholder reports include a discussion of certain factors relating to the selection of the investment adviser and the approval of the advisory fee. The “factors” enumerated by the SEC are set forth below in italics, as well as the Board’s conclusions regarding such factors:
(1) The nature, extent and quality of services provided by the Manager. The Trustees noted that the Manager, subject to the control of the Board, administers each Fund’s business and other affairs. The Trustees noted that the Manager also provides the Trust and each Fund with such administrative and other services (exclusive of, and in addition to, any such services provided by any others retained by the Trust on behalf of the Funds) and executive and other personnel as are necessary for the operation of the Trust and the Funds. Except for the Trust’s Chief Compliance Officer and certain compliance staff, the Manager pays all of the compensation of Trustees and officers of the Trust who are employees of the Manager or its affiliates.
16
The Board considered the scope and quality of services provided by the Manager and noted that the scope of such services provided had expanded as a result of recent regulatory and other developments. The Board noted that, for example, the Manager is responsible for maintaining and monitoring its own compliance program, and this compliance program has been continuously refined and enhanced in light of new regulatory requirements. The Board considered the capabilities and resources which the Manager has dedicated to performing services on behalf of the Trust and its Funds. The quality of administrative and other services, including the Manager’s role in coordinating the activities of the Trust’s other service providers, also were considered. The Board concluded that, overall, they were satisfied with the nature, extent and quality of services provided (and expected to be provided) to the Trust and to each of the Funds under the Management Agreement.
(2) The investment performance of the Funds and the Manager. In connection with every in-person quarterly Board meeting and the fall 2017 contract review process, Trustees received extensive information on the performance results of each Fund. This included, for example, performance information on absolute total return, performance versus the appropriate benchmark(s), the contribution to performance of the Manager’s asset class allocation decisions and volatility management strategies, the performance of the underlying funds, and the impact on performance of rebalancing decisions, cash and Fund fees. This included Lipper performance information on the Funds for the previous quarter, year-to-date, and previous one-, three- and five-year periods, to the extent the Funds were in existence for such periods. (For Funds which have been in existence for less than five years, the Board received performance information on shorter time periods to the extent available.) For example, in connection with the Board meeting held October 23, 2017, the Manager reported that for the five Funds for which performance information for the five year period ended June 30, 2017 was available, two were in the top 40%, two were in the middle 20%, and one was in the bottom 40%. None of these Funds was in the bottom 40% for the three- or one-year periods. The Manager reported that for the three-year period ended June 30, 2017, for the six Funds for which three year performance information was available, four Funds were in the top 40% and two Funds were in the middle 20%. For the eight Funds for which one-year performance information was available, for the one-year period ended June 30, 2017, four Funds were in the top 40%, two Funds were in the middle 20%, and two Funds were in the bottom 40%.
At the Board meeting held October 23, 2017, the Manager also reported upon the performance of the MVP Funds compared to custom managed-volatility peer groups. For the seven Funds for which three-year performance information was available, for the three-year period ended June 30, 2017, five Funds were in the top 40%, one Fund was in the middle 20%, and one was in the bottom 40%. For the eight Funds for which one year performance was available, for the one-year period ended June 30, 2017, four Funds were in the top 40% and four Funds were in the middle 20%. All six Funds for which five-year performance information was available were in the top 40%.
At the Board meeting held October 23, 2017, the Trustees determined that the investment performance of the Funds was acceptable.
(3) The costs of services to be provided and profits to be realized by the Manager and its affiliates from the relationship with the Funds. The Board considered that the Manager receives an advisory fee from each of the Funds. The Manager reported that for the three MVP Fusion Dynamic Funds the advisory fee paid put these Funds in the 44th percentile of the customized peer group. The Manager reported that for three MVP Index Strategy Funds the advisory fee paid put them in the 27th percentile of the customized peer group, and for the two non-MVP Index Strategy Funds, as well as the AZL DFA Multi-Strategy Fund, the advisory fee paid put them in the 13th percentile of the customized peer group. The Manager reported that for the AZL MVP BlackRock Global Strategy Plus, AZL MVP DFA Multi-Strategy, AZL MVP Pyramis Multi-Strategy, and AZL MVP T. Rowe Price Capital Appreciation Plus Funds, the advisory fee paid was in the 9th percentile. (A lower percentile reflects lower fund fees and is better for fund shareholders.) Trustees were provided with information on the total expense ratios of the Funds and other funds in the customized peer groups, and the Manager reported upon the challenges in making peer group comparisons for the Funds.
The Manager provided information concerning the profitability of the Manager’s investment advisory activities for the period from 2014 through June 30, 2017. The Board recognized that it is difficult to make comparisons of profitability from investment company advisory agreements because comparative information is not generally publicly available and is affected by numerous factors, including the structure of the particular adviser, the types of funds it manages, its business mix, numerous assumptions regarding allocation of expenses and the adviser’s capital structure and cost of capital. In considering profitability information, the Board considered the possible effect of certain fall-out benefits to the Manager and its affiliates. The Board focused on profitability of the Manager’s relationships with the Funds before taxes and distribution expenses. The Board recognized that the Manager should earn a reasonable level of profits for the services it provides to each Fund.
The Board also considered that Wilshire Funds Management (“Wilshire”) serves as a consultant to the Manager in preparing statistical and other factual information for use in the creation and maintenance of the asset allocation models for the Fusion Funds (the AZL MVP Fusion Dynamic Conservative, Balanced, and Moderate Funds), pursuant to an agreement between the Manager and Wilshire. Wilshire serves as a consultant to the Manager with respect to selecting the Fusion Funds’ underlying funds and the asset allocations among the underlying funds. The Manager, not any Fund, pays a consultant fee to Wilshire.
Based upon the information provided, the Board concluded that the Funds’ advisory fees and expense ratios are not unreasonable, and determined that there was no evidence that the Manager’s level of profitability from its relationship with the Funds was excessive.
(4) and (5) The extent to which economies of scale would be realized as the Funds grow, and whether fee levels reflect these economies of scale. The Board noted that the advisory fee schedules for the Funds do not contain breakpoints that reduce the fee rate on assets above specified levels. The Board recognized that breakpoints may be an appropriate way for the Manager to share its economies of scale, if any, with Funds that have substantial assets. The Board found there was no uniform methodology for establishing breakpoints that give effect to Fund-specific services provided by the Manager. The Board noted that in the fund industry as a whole, as well as among funds similar to the Funds, there is no uniformity or pattern in the fees and asset levels at which breakpoints (if any) apply. Depending on the age, size, and other characteristics of a particular fund and its manager’s cost structure, different conclusions can be drawn as to whether there are economies of scale to be realized at any particular level of assets, notwithstanding the intuitive conclusion that such economies exist, or will be realized at some level of total assets. Moreover, because different managers have different cost structures and service models, it is difficult to draw meaningful conclusions from the breakpoints that may have been adopted by other funds. The Board also noted that the advisory agreements for many funds do not have breakpoints at all, or if breakpoints exist, they may be at asset levels significantly greater than those of the individual Funds. The Board also noted that the total assets in all of the Funds, as of June 30, 2017, were approximately $10.8 billion and that the largest Fund, the AZL MVP Growth Index Strategy Fund, had assets of approximately $2.4 billion.
The Board noted that the Manager has agreed to temporarily limit Fund expenses under the Expense Limitation Agreement, which has the effect of reducing expenses as would the implementation of advisory fee breakpoints. The Manager has committed to continue to consider the continuation of expense limits and/or advisory fee breakpoints as the Funds grow larger. The Board receives quarterly reports on the level of Fund assets. The Board expects to continue to consider: (a) the extent to which economies of scale have been realized, and (b) whether the advisory fee should be modified, either in connection with the next renewal of the Agreements or by modifying the Expense Limitation Agreement, to reflect such economies of scale, if any.
Having taken these factors into account, the Board concluded that the absence of breakpoints in the Funds’ advisory fee rate schedules was acceptable under each Fund’s circumstances.
17
Information about the Board of Trustees and Officers (Unaudited)
The Trust is managed by the Trustees in accordance with the laws of the state of Delaware governing business trusts. There are currently eight Trustees, one of whom is an “interested person” of the Trust within the meaning of that term under the 1940 Act. The Trustees and Officers of the Trust, and their addresses, ages, positions held with the Trust, terms of office with the Trust and length of time served, principal occupation(s) during the past five years, the number of portfolios in the Trust they oversee, and other directorships held during the past five years are as follows:
Non-Interested Trustees(1)
| Name, Address, and Year of Birth | Positions Held with Allianz VIP and VIP FOF Trust | Term of Office(2)/Length of Time Served | Principal Occupation(s) During Past 5 Years | Number of Portfolios Overseen for Allianz VIP and VIP FOF Trust | Other AZL Fund Complex | |||||
| Peter R. Burnim (1947) 5701 Golden Hills Drive Minneapolis, MN 55416 | Trustee | Since 2/07 | Consultant/Chair, various companies: Chairman, Emrys Analytics and subsidiaries, July 2015 to present; Chairman, Argus Investment Strategies Fund Ltd., February 2013 to 2017; Managing Director, iQ Venture Advisors, LLC, 2005 to present; Chairman, Northstar Group Holdings Ltd. Bermuda, 2011 to present; Chairman Sterling Bank & Trust (Bahamas) Ltd., 2016 to present, and Expert Witness, Massachusetts Department of Revenue, 2011 to 2016. | 35 | Argus Group Holdings and Subsidiaries; Northstar Group Holdings; Sterling Trust (Cayman) Ltd.; Sterling Bank & Trust Limited (Bahamas); Emrys Analytics; EGB Insurance. | |||||
| Peggy L. Ettestad (1957) 5701 Golden Hills Drive Minneapolis, MN 55416 | Lead Independent Trustee | Since 10/14 (Trustee since 2/07) | Managing Director, Red Canoe Management Consulting LLC, 2008 to present | 35 | Luther College | |||||
| Tamara Lynn Fagely (1958) 5701 Golden Hills Drive Minneapolis, MN 55416 | Trustee | Since 12/17 | Retired; Chief Operations Officer, Hartford Funds, March 2012 to December 2013 | 35 | Diamond Hill Funds (13 funds) | |||||
| Richard H. Forde (1953) 5701 Golden Hills Drive Minneapolis, MN 55416 | Trustee | Since 12/17 | Member of the Board and Chairman of the Finance and Investment Committee, Connecticut Water Service, Inc., October 2013 to present; Senior Vice President and Chief Investment Officer, CIGNA, 2004 to 2012 | 35 | Connecticut Water Service, Inc. | |||||
| Claire R. Leonardi (1955) 5701 Golden Hills Drive Minneapolis, MN 55416 | Trustee | Since 2/04 | Chief Executive Officer, Health eSense Inc., 2015 to Present; CEO, Connecticut Innovations, Inc., 2012 to 2015; General Partner, Fairview Capital, L.P., 1994 to 2012 | 35 | reSet Social Enterprise Investment Fund | |||||
| Dickson W. Lewis (1948) 5701 Golden Hills Drive Minneapolis, MN 55416 | Trustee | Since 2/04 | Retired; Vice President/General Manager, Yearbooks & Canada-Lifetouch National School Studios, 2006 to 2014; Vice President/General Manager of Jostens, Inc., 2002 to 2006; Senior Vice President of Fortis Group, 1997 to 2002 | 35 | None | |||||
| Arthur C. Reeds, III (1944) 5701 Golden Hills Drive Minneapolis, MN 55416 | Trustee | Since 10/99 | Retired; Senior Investment Officer, Hartford Foundation for Public Giving, 2000 to 2003; Chairman, Chief Executive and President of Conning Corp., 1999 to 2000 | 35 | Connecticut Water Service, Inc. |
Interested Trustees(3)
| Name, Address, and Year of Birth | Positions Held with Allianz VIP and VIP FOF Trust | Term of Office(2)/Length of Time Served | Principal Occupation(s) During Past 5 Years | Number of Portfolios Overseen for Allianz VIP and VIP FOF Trust | Other AZL Fund Complex | |||||
Brian Muench (1970) 5701 Golden Hills Drive | Trustee | Since 6/11 | President, Allianz Investment Management LLC, November 2010 to present; Vice President, Allianz Life, April 2011 to present | 35 | None |
18
Officers
| Name, Address, and Age | Positions Held with Allianz VIP and VIP FOF Trust | Term of Office(2)/Length of Time Served | Principal Occupation(s) During Past 5 Years | |||
Brian Muench (1970) 5701 Golden Hills Drive | President | Since 11/10 | President, Allianz Investment Management LLC, November 2010 to present; Vice President, Allianz Life, April 2011 to present. | |||
| Michael Radmer (1945) Dorsey & Whitney LLP, Suite 1500 50 South Sixth Street Minneapolis, MN 55402-1498 | Secretary | Since 02/02 | Senior Counsel (previously, Partner), Dorsey and Whitney LLP since 1976. | |||
| Bashir C. Asad (1963) Citi Fund Services Ohio, Inc. 4400 Easton Commons, Suite 200 Columbus, OH 43219 | Treasurer, Principal Accounting Officer and Principal Financial Officer | Since 06/16 | Senior Vice President, Citi Fund Services Ohio, Inc. | |||
| Chris R. Pheiffer (1968) 5701 Golden Hills Drive Minneapolis, MN 55416 | Chief Compliance Officer(4) and Anti-MoneyLaundering Compliance Officer | Since 02/14 | Chief Compliance Officer of the VIP Trust and the FOF Trust, February 2014 to present; Deputy Chief Compliance Officer of the VIP Trust and the FOF Trust and Compliance Director, Allianz Life, February 2007 to February 2014. |
| (1) | Member of the Audit Committee. |
| (2) | Indefinite. |
| (3) | Is an “interested person”, as defined by the 1940 Act, due to employment by Allianz. |
| (4) | The Manager and the Trust are parties to a Chief Compliance Officer Agreement under which the Manager is compensated by the Trust for providing an employee of the Manager or one of its affiliates to act as the Trust’s Chief Compliance Officer. The Chief Compliance Officer and Anti-Money Laundering Compliance Officer is not considered a corporate officer or executive employee of the Trust. |
19
The Allianz VIP Fund of Funds are distributed by Allianz Life Financial Services, LLC. These Funds are not FDIC Insured. | ANNRPT1217 2/18 |
AZL® MVP Growth Index Strategy Fund
Annual Report
December 31, 2017
Table of Contents
Management Discussion and Analysis
Page 1
Expense Examples and Portfolio Composition
Page 3
Schedule of Portfolio Investments
Page 4
Statement of Assets and Liabilities
Page 5
Page 5
Statements of Changes in Net Assets
Page 6
Page 7
Notes to the Financial Statements
Page 8
Report of Independent Registered Public Accounting Firm
Page 13
Other Federal Income Tax Information
Page 14
Page 15
Approval of Investment Advisory Agreement
Page 16
Information about the Board of Trustees and Officers
Page 18
This report is submitted for the general information of the shareholder of the Fund. The report is not authorized for distribution to prospective investors in the Fund unless preceded or accompanied by an effective prospectus, which contains details concerning the sales charges and other pertinent information.
AZL® MVP Growth Index Strategy Fund Review (Unaudited)
Allianz Investment Management LLC
serves as the Manager for the AZL®
MVP Growth Index Strategy Fund.
What factors affected the Fund’s performance for the year ended December 31, 2017?
For the year ended December 31, 2017, the AZL® MVP Growth Index Strategy Fund (the “Fund”) returned 15.96%. That compared to a 21.83%, 3.54% and a 17.06% total return for its benchmarks, the S&P 500 Index1, the Bloomberg Barclays U.S. Aggregate Bond Index1, and the Growth Composite Index1, respectively.
The Fund is a fund of funds that pursues broad diversification across four equity sub-portfolios and one fixed-income sub-portfolio. The four equity sub-portfolios pursue passive strategies that aim to achieve, before fees, returns similar to the S&P 500 Index, the S&P 400 Index2, the S&P 600 Index3 and the MSCI EAFE Index4, which represents shares of large companies in developed foreign markets. The fixed-income sub-portfolio is an enhanced bond index strategy that seeks to achieve a return that exceeds that of the Bloomberg Barclays Capital U.S. Aggregate Bond Index. Generally, the Fund allocates 65% to 85% of its assets to the underlying equity index funds and between 15% and 35% to the underlying bond index fund.*
The Fund also employs the MVP (Managed Volatility Portfolio) risk management process, which is intended to adjust the risk of the portfolio based on quantitative indicators of market risk, such as the current level of fund and market volatility.
Global economic expansion led major stock indexes to new all-time highs during the 12-month period under review. The S&P 500 Index gained 21.83% during the period, supported by a positive economic environment marked by solid jobs growth, low unemployment, increased business investment, strong consumer confidence and a low-volatility environment. Mid- and small-cap stocks also performed well during the period: The S&P MidCap 400 Index2 generated a 16.24% return and the SmallCap 600 Index3 returned 13.23%. Growth stocks were also heavily favored during the year and significantly outperformed value stocks.
International developed markets, as measured by the MSCI EAFE Index4, fared even better than U.S. equities, posting a 25.62% return for the year. Emerging markets equities, as measured by the MSCI Emerging Markets Equity Index5, posted a return of 37.75%. The strong return ended years of underperformance versus domestic and international developed markets.
The U.S. bond market was generally positive, as the market rewarded investors who took on interest rate and spread risk. The Bloomberg Barclays U.S. Aggregate Bond Index gained 3.54%. Bond investors generally tolerated risk in their quest for more attractive yields. Credit spreads on corporate bonds ended the year tighter than when the year began, with high-yield bond spreads tightening markedly. Meanwhile, the yield curve flattened sharply, as three rate hikes by the Federal Reserve sent short-term yields higher, while investor demand for attractive yield pushed long-term yields lower.
The Fund, which invests in both U.S. and international markets, underperformed its composite benchmark in 2017. The underperformance was primarily driven by the Fund’s strategic, above-benchmark allocation to U.S. mid- and small-cap equities as U.S. large-cap companies
outperformed during the period. By comparison, an overweight allocation to international equities contributed to the Fund’s returns relative to its benchmark, as international stocks outperformed their U.S. counterparts.*
Within the Fund’s fixed income holdings, an underweight allocation to corporate bonds weighed on relative results, as those outperformed during the period. An overweight allocation to 30-year bonds added to relative performance, however.*
The MVP risk management process, which includes the use of derivatives, worked as intended during the period under review. Given that the period was marked by low volatility, the MVP maintained a neutral equity allocation for the year relative to its target.*
Past performance does not guarantee future results.
| * | The Fund’s portfolio composition is subject to change. There is no guarantee that any sectors mentioned will continue to perform well or that securities in such sectors will be held by the Fund in the future. The information contained in this commentary is for informational purposes only and should not be construed as a recommendation to purchase or sell securities in the sector mentioned. The Fund’s holdings and weightings are as of December 31, 2017. |
| 1 | For a complete description of the Fund’s performance benchmarks please refer to page 2 of this report. |
| 2 | The Standard & Poor’s MidCap 400 Index (“S&P 400”) is the most widely used index for mid-sized companies. The S&P 400 covers 7% of the U.S. equities market, and is part of a series of S&P U.S. indices that can be used as building blocks for portfolio composition. |
| 3 | The Standard & Poor’s SmallCap 600 Index (“S&P 600”) covers approximately 3% of the domestic equities market. Measuring the small-cap segment of the market that is typically renowned for poor trading liquidity and financial instability, the index is designed to be an efficient portfolio of companies that meet specific inclusion criteria to ensure that they are investable and financially viable. |
| 4 | The Morgan Stanley Capital International, Europe, Australasia and Far East (“MSCI EAFE”) Index is a free float-adjusted market capitalization-weighted index that is designed to measure the equity market performance of developed markets, excluding the U.S. & Canada. |
| 5 | The MSCI Emerging Markets Index (“MSCI EM”) is a free float-adjusted market capitalization index that is designed to measure equity performance of emerging markets. |
| Investors cannot invest directly in an index. |
1
AZL® MVP Growth Index Strategy Fund Review (Unaudited)
Fund Objective
The Fund’s investment objective is to seek long-term capital appreciation. This objective may be changed by the Trustees of the Fund without shareholder approval. The Fund seeks to achieve its objective by investing in a combination of Index Strategy Underlying Funds that represent different classes in the Fund’s asset allocation.
Investment Concerns
The Fund invests in underlying funds, so its investment performance is directly related to the performance of those underlying funds. Before investing, investors should assess the risks associated with and types of investments made by each of the underlying funds in which the Fund invests.
International investing may involve risk of capital loss from unfavorable fluctuations in currency values, from differences in generally accepted accounting principles or from economic or political instability in other nations.
Small- to mid-capitalization companies typically have a higher risk of failure and historically have experienced a greater degree of volatility.
The performance of the Fund is expected to be lower than that of the Indices because of Fund fees and expenses. Securities in which the Fund will invest may involve substantial risk and may be subject to sudden severe price declines.
Bonds offer a relatively stable level of income, although bond prices will fluctuate, providing the potential for principal gain or loss.
Investing in derivatives instruments involves risks that may be different from or greater than the risk associated with investing directly in securities or other traditional instruments.
For a complete description of these and other risks associated with investing in a mutual Fund, please refer to the Fund’s prospectus.
Growth of $10,000 Investment
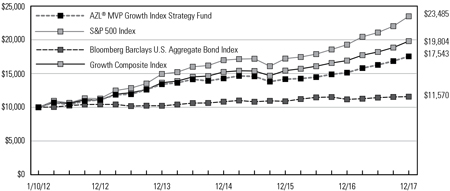
The chart above represents a comparison of a hypothetical investment in the Fund versus a similar investment in the Fund’s benchmark as well as the two component indices of the Fund’s benchmark, and represents the reinvestment of dividends and capital gains in the Fund.
Average Annual Total Returns as of December 31, 2017
| 1 Year | 3 Year | 5 Year | Since Inception (1/10/12) | |||||||||||||
AZL® MVP Growth Index Strategy Fund | 15.96 | % | 7.10 | % | 9.59 | % | 9.86 | % | ||||||||
S&P 500 Index | 21.83 | % | 11.41 | % | 15.79 | % | 15.36 | % | ||||||||
Bloomberg Barclays U.S. Aggregate Bond Index | 3.54 | % | 2.24 | % | 2.10 | % | 2.47 | % | ||||||||
Growth Composite Index | 17.06 | % | 9.13 | % | 12.32 | % | 12.12 | % | ||||||||
Past performance does not guarantee future results. The performance data quoted represents past performance and current returns may be lower or higher. The investment return and principal value will fluctuate so that an investor’s shares, when redeemed may be worth more or less than the original cost. To obtain performance information current to the most recent month end, please visit www.Allianzlife.com.
Expense Ratio | Gross | |||
AZL® MVP Growth Index Strategy Fund | 0.69 | % | ||
The above expense ratio is based on the current Fund prospectus dated May 1, 2017. The Manager and the Fund have entered into a written contract limiting operating expenses, excluding certain expenses (such as interest expense and acquired fund fees and expenses), to 0.20% through April 30, 2019. Additional information pertaining to the December 31, 2017 expense ratios can be found in the financial highlights.
Acquired fund fees and expenses are incurred indirectly by the Fund through the valuation of the Fund’s investments in the Permitted Underlying Funds. Accordingly, acquired fund fees and expenses affect the Fund’s total returns. Because these fees and expenses are not included in the Fund’s financial highlights, the Fund’s total annual fund operating expenses, as shown in the current prospectus, do not correlate to the ratios of expenses to average net assets shown in the financial highlights table. Without acquired fund fees and expenses the Fund’s gross expense ratio would be 0.12%.
The total return of the Fund does not reflect the effect of any insurance charges, the annual maintenance fee or the deduction of taxes that a shareholder would pay on Fund distributions or the redemption of Fund shares. Such charges, fees and tax payments would reduce the performance quoted.
The Fund’s performance is measured against the Standard & Poor’s 500 Index (“S&P 500”), the Bloomberg Barclays U.S. Aggregate Bond Index and the Growth Composite Index (“Composite”). The S&P 500 is representative of 500 selected common stocks, most of which are listed on the New York Stock Exchange, and is a measure of the U.S. Stock market as a whole. The Bloomberg Barclays U.S. Aggregate Bond Index is a market value-weighted performance benchmark for investment-grade fixed-rate debt issues, including government, corporate, asset-backed, and mortgage-backed securities, with maturities of at least one year. The Composite is a blended index comprised of (75%) S&P 500 and (25%) Bloomberg Barclays U.S. Aggregate Bond Index. These indexes are unmanaged and do not reflect the deduction of fees associated with a mutual fund, such as investment management and fund accounting fees. The Fund’s performance reflects the deduction of fees for services provided to the Fund. Investors cannot invest directly in an index.
2
AZL MVP Growth Index Strategy Fund
(Unaudited)
As a shareholder of the AZL MVP Growth Index Strategy Fund (the “Fund”), you incur ongoing costs, including management fees, distribution fees, and other Fund expenses. These examples are intended to help you understand your ongoing costs (in dollars) of investing in the Fund and to compare these costs with the ongoing costs of investing in other mutual funds. Please note that the expenses shown in each table do not reflect expenses that apply to the subaccount or the insurance contract. If the expenses that apply to the subaccount of the insurance contract were included, your costs would have been higher.
These examples are based on an investment of $1,000 invested at the beginning of the period and held for the periods presented below.
The Actual Expense table below provides information about actual account values and actual expenses. You may use the information below, together with the amount you invested, to estimate the expenses that you paid over the period. Simply divide your account value by $1,000 (for example, an $8,600 account value divided by $1,000 = 8.6), then multiply the result by the number in the table under the heading entitled “Expenses Paid During Period” to estimate the expenses you paid on your account during this period.
| Beginning Account Value 7/1/17 | Ending Account Value 12/31/17 | Expenses Paid During Period 7/1/17 - 12/31/17* | Annualized Expense Ratio During Period 7/1/17 - 12/31/17 | |||||||||||||||||
AZL MVP Growth Index Strategy Fund | $ | 1,000.00 | $ | 1,077.70 | $ | 0.52 | 0.10 | % | ||||||||||||
The Hypothetical Expense table below provides information about hypothetical account values and hypothetical expenses based on the Fund’s actual expense ratio and an assumed rate of return of 5% per year before expenses, which is not the Fund’s actual return. The hypothetical account values and expenses may not be used to estimate the actual ending account balance or expenses you paid for the period. You may use this information to compare this 5% hypothetical example with the 5% hypothetical examples that appear in the shareholder reports of other funds.
| Beginning Account Value 7/1/17 | Ending Account Value 12/31/17 | Expenses Paid During Period 7/1/17 - 12/31/17* | Annualized Expense Ratio During Period 7/1/17 - 12/31/17 | |||||||||||||||||
AZL MVP Growth Index Strategy Fund | $ | 1,000.00 | $ | 1,024.70 | $ | 0.51 | 0.10 | % | ||||||||||||
| * | Expenses are equal to the average account value over the period, multiplied by the Fund’s annualized expense ratio, multiplied by 184/365 (to reflect the one half year period). |
Portfolio Composition
(Unaudited)
| Investments | Percent of Net Assets | ||||
Domestic Equities | 52.5 | ||||
Fixed Income | 23.5 | ||||
International Equities | 19.0 | ||||
|
| ||||
Total Investment Securities | 95.0 | ||||
Net other assets (liabilities) | 5.0 | ||||
|
| ||||
Net Assets | 100.0 | % | |||
|
| ||||
3
AZL MVP Growth Index Strategy Fund
Schedule of Portfolio Investments
December 31, 2017
| Shares | Fair Value | |||||||
| Affiliated Investment Companies (95.0%): | ||||||||
| 56,943,573 | AZL Enhanced Bond Index Fund | $ | 620,115,513 | |||||
| 28,919,362 | AZL International Index Fund, Class 2 | 500,304,956 | ||||||
| 12,491,183 | AZL Mid Cap Index Fund, Class 2 | 293,043,151 | ||||||
| 58,515,822 | AZL S&P 500 Index Fund, Class 2 | 943,860,209 | ||||||
| 9,809,725 | AZL Small Cap Stock Index Fund, Class 2 | 145,968,711 | ||||||
|
| |||||||
Total Affiliated Investment Companies (Cost $2,152,991,434) | 2,503,292,540 | |||||||
|
| |||||||
Total Investment Securities (Cost $2,152,991,434)(a) — 95.0% | 2,503,292,540 | |||||||
Net other assets (liabilities) — 5.0% | 131,262,443 | |||||||
|
| |||||||
Net Assets — 100.0% | $ | 2,634,554,983 | ||||||
|
| |||||||
Percentages indicated are based on net assets as of December 31, 2017.
| (a) | See Federal Tax Information listed in the Notes to the Financial Statements. |
Futures Contracts
Cash of $131,413,610 has been segregated to cover margin requirements for the following open contracts as of December 31, 2017:
Long Futures
| Description | Expiration Date | Number of Contracts | Notional Amount | Unrealized Appreciation/ (Depreciation) | ||||||||||||
S&P 500 Index E-Mini March Futures (U.S. Dollar) | 3/19/18 | 733 | $ | 98,075,400 | $ | 1,609,759 | ||||||||||
U.S. Treasury 10-Year Note March Futures (U.S. Dollar) | 3/21/18 | 265 | 32,872,422 | (175,084 | ) | |||||||||||
|
| |||||||||||||||
| $ | 1,434,675 | |||||||||||||||
|
| |||||||||||||||
See accompanying notes to the financial statements.
4
AZL MVP Growth Index Strategy Fund
Statement of Assets and Liabilities
December 31, 2017
Assets: | |||||
Investments in affiliates, at cost | $ | 2,152,991,434 | |||
|
| ||||
Investments in affiliates, at value | $ | 2,503,292,540 | |||
Segregated cash for collateral | 131,413,610 | ||||
Interest and dividends receivable | 121,249 | ||||
Receivable for capital shares issued | 111,119 | ||||
Receivable for affiliated investments sold | 794,465 | ||||
Receivable for variation margin on futures contracts | 1,322 | ||||
Prepaid expenses | 14,955 | ||||
|
| ||||
Total Assets | 2,635,749,260 | ||||
|
| ||||
Liabilities: | |||||
Cash overdraft | 794,465 | ||||
Payable for capital shares redeemed | 94,650 | ||||
Manager fees payable | 223,066 | ||||
Administration fees payable | 4,859 | ||||
Administrative and compliance services fees payable | 5,907 | ||||
Transfer agent fees payable | 893 | ||||
Trustee fees payable | 3,806 | ||||
Other accrued liabilities | 66,631 | ||||
|
| ||||
Total Liabilities | 1,194,277 | ||||
|
| ||||
Net Assets | $ | 2,634,554,983 | |||
|
| ||||
Net Assets Consist of: | |||||
Capital | $ | 2,203,571,274 | |||
Accumulated net investment income/(loss) | 21,745,154 | ||||
Accumulated net realized gains/(losses) from investment transactions | 57,502,774 | ||||
Net unrealized appreciation/(depreciation) on investments | 351,735,781 | ||||
|
| ||||
Net Assets | $ | 2,634,554,983 | |||
|
| ||||
Shares of beneficial interest (unlimited number of shares authorized, no par value) | 169,292,686 | ||||
Net Asset Value (offering and redemption price per share) | $ | 15.56 | |||
|
|
For the Year Ended December 31, 2017
Investment Income: | |||||
Dividends from affiliates | $ | 19,609,174 | |||
Interest | 1,067,885 | ||||
Other income | 4,436 | ||||
|
| ||||
Total Investment Income | 20,681,495 | ||||
|
| ||||
Expenses: | |||||
Manager fees | 2,426,953 | ||||
Administration fees | 50,886 | ||||
Administrative and compliance services fees | 23,818 | ||||
Transfer agent fees | 5,351 | ||||
Trustee fees | 83,842 | ||||
Professional fees | 88,669 | ||||
Shareholder reports | 41,959 | ||||
Other expenses | 26,187 | ||||
|
| ||||
Total expenses | 2,747,665 | ||||
|
| ||||
Net Investment Income/(Loss) | 17,933,830 | ||||
|
| ||||
Realized and Unrealized Gains/(Losses) on Investments: | |||||
Net realized gains/(losses) on securities transactions from affiliates | (178,270 | ) | |||
Net realized gains distributions from affiliated underlying funds | 66,922,015 | ||||
Net realized gains/(losses) on futures contracts | 15,838,684 | ||||
Change in net unrealized appreciation/depreciation on affiliated transactions | 256,820,952 | ||||
Change in net unrealized appreciation/depreciation on futures contracts | 1,430,371 | ||||
|
| ||||
Net Realized/Unrealized Gains/(Losses) on Investments | 340,833,752 | ||||
|
| ||||
Change in Net Assets Resulting From Operations | $ | 358,767,582 | |||
|
|
See accompanying notes to the financial statements.
5
AZL MVP Growth Index Strategy Fund
Statements of Changes in Net Assets
| For the Year Ended December 31, 2017 | For the Year Ended December 31, 2016 | |||||||||
Change In Net Assets: | ||||||||||
Operations: | ||||||||||
Net investment income/(loss) | $ | 17,933,830 | $ | 24,756,764 | ||||||
Net realized gains/(losses) on investment transactions | 82,582,429 | 70,835,093 | ||||||||
Change in unrealized appreciation/depreciation on investments | 258,251,323 | 24,123,149 | ||||||||
|
|
|
| |||||||
Change in net assets resulting from operations | 358,767,582 | 119,715,006 | ||||||||
|
|
|
| |||||||
Distributions to Shareholders: | ||||||||||
From net investment income | (28,019,405 | ) | (31,942,925 | ) | ||||||
From net realized gains | (88,021,945 | ) | (8,888,678 | ) | ||||||
|
|
|
| |||||||
Change in net assets resulting from distributions to shareholders | (116,041,350 | ) | (40,831,603 | ) | ||||||
|
|
|
| |||||||
Capital Transactions: | ||||||||||
Proceeds from shares issued | 137,649,163 | 151,231,938 | ||||||||
Proceeds from shares issued in merger | — | 642,975,499 | ||||||||
Proceeds from dividends reinvested | 116,041,350 | 40,831,603 | ||||||||
Value of shares redeemed | (105,234,549 | ) | (63,010,102 | ) | ||||||
|
|
|
| |||||||
Change in net assets resulting from capital transactions | 148,455,964 | 772,028,938 | ||||||||
|
|
|
| |||||||
Change in net assets | 391,182,196 | 850,912,341 | ||||||||
Net Assets: | ||||||||||
Beginning of period | 2,243,372,787 | 1,392,460,446 | ||||||||
|
|
|
| |||||||
End of period | $ | 2,634,554,983 | $ | 2,243,372,787 | ||||||
|
|
|
| |||||||
Accumulated net investment income/(loss) | $ | 21,745,154 | $ | 28,019,266 | ||||||
|
|
|
| |||||||
Share Transactions: | ||||||||||
Shares issued | 9,175,322 | 11,127,802 | ||||||||
Shares issued in merger | — | 47,001,133 | ||||||||
Dividends reinvested | 7,824,771 | 3,000,118 | ||||||||
Shares redeemed | (7,008,917 | ) | (4,601,086 | ) | ||||||
|
|
|
| |||||||
Change in shares | 9,991,176 | 56,527,967 | ||||||||
|
|
|
| |||||||
See accompanying notes to the financial statements.
6
AZL MVP Growth Index Strategy Fund
(Selected data for a share of beneficial interest outstanding throughout the periods indicated)
| Year Ended December 31, | |||||||||||||||||||||||||
| 2017 | 2016 | 2015 | 2014 | 2013 | |||||||||||||||||||||
Net Asset Value, Beginning of Period | $ | 14.08 | $ | 13.55 | $ | 13.90 | $ | 13.23 | $ | 10.95 | |||||||||||||||
|
|
|
|
|
|
|
|
|
| ||||||||||||||||
Investment Activities: | |||||||||||||||||||||||||
Net Investment Income/(Loss) | 0.11 | 0.14 | 0.25 | 0.10 | 0.10 | ||||||||||||||||||||
Net Realized and Unrealized Gains/(Losses) on Investments | 2.10 | 0.77 | (0.36 | ) | 0.75 | 2.18 | |||||||||||||||||||
|
|
|
|
|
|
|
|
|
| ||||||||||||||||
Total from Investment Activities | 2.21 | 0.91 | (0.11 | ) | 0.85 | 2.28 | |||||||||||||||||||
|
|
|
|
|
|
|
|
|
| ||||||||||||||||
Dividends to Shareholders From: | |||||||||||||||||||||||||
Net Investment Income | (0.18 | ) | (0.30 | ) | (0.12 | ) | (0.10 | ) | — | ||||||||||||||||
Net Realized Gains | (0.55 | ) | (0.08 | ) | (0.12 | ) | (0.08 | ) | — | (a) | |||||||||||||||
|
|
|
|
|
|
|
|
|
| ||||||||||||||||
Total Dividends | (0.73 | ) | (0.38 | ) | (0.24 | ) | (0.18 | ) | — | (a) | |||||||||||||||
|
|
|
|
|
|
|
|
|
| ||||||||||||||||
Net Asset Value, End of Period | $ | 15.56 | $ | 14.08 | $ | 13.55 | $ | 13.90 | $ | 13.23 | |||||||||||||||
|
|
|
|
|
|
|
|
|
| ||||||||||||||||
Total Return(b) | 15.96 | % | 6.80 | % | (0.80 | )% | 6.47 | % | 20.85 | % | |||||||||||||||
Ratios to Average Net Assets/Supplemental Data: | |||||||||||||||||||||||||
Net Assets, End of Period (000’s) | $ | 2,634,555 | $ | 2,243,373 | $ | 1,392,460 | $ | 1,118,257 | $ | 768,606 | |||||||||||||||
Net Investment Income/(Loss) | 0.74 | % | 1.55 | % | 2.17 | % | 1.05 | % | 1.25 | % | |||||||||||||||
Expenses Before Reductions*(c) | 0.11 | % | 0.12 | % | 0.12 | % | 0.12 | % | 0.13 | % | |||||||||||||||
Expenses Net of Reductions* | 0.11 | % | 0.12 | % | 0.12 | % | 0.12 | % | 0.13 | % | |||||||||||||||
Portfolio Turnover Rate | 4 | % | 4 | %(d) | 1 | % | 1 | % | — | (e) | |||||||||||||||
| * | The expense ratios exclude the impact of fees/expenses paid by each underlying fund. |
| (a) | Represents less than $0.005. |
| (b) | The returns include reinvested dividends and fund level expenses, but exclude insurance contract charges. If these charges were included, the returns would have been lower. |
| (c) | Excludes fee reductions. If such fee reductions had not occurred, the ratios would have been as indicated. |
| (d) | Cost of purchases and proceeds from sales of portfolio securities incurred to realign the Fund’s portfolio after the fund merger are excluded from the portfolio turnover rate. If such amounts had not been excluded, the portfolio turnover rate would have been 4%. |
| (e) | Represents less than 0.5%. |
See accompanying notes to the financial statements.
7
AZL MVP Growth Index Strategy Fund
Notes to the Financial Statements
December 31, 2017
1. Organization
The Allianz Variable Insurance Products Fund of Funds Trust (the “Trust”) was organized as a Delaware statutory trust on June 16, 2004. The Trust is a diversified open-end management investment company registered under the Investment Company Act of 1940, as amended, (the “1940 Act”) and thus is determined to be an investment company for accounting purposes. The Trust consists of 12 separate investment portfolios (collectively, the “Funds”), of which one is included in this report, the AZL MVP Growth Index Strategy Fund (the “Fund”), and 11 are presented in separate reports.
The Fund is a “fund of funds,” which means that the Fund invests primarily in other mutual funds. Underlying Funds invest in stock, bonds, and other securities and reflect varying amounts of potential investment risk and reward. The Underlying Funds record their investments at fair value. Periodically, the Fund will adjust its asset allocation as it seeks to achieve its investment objective.
The Trust is authorized to issue an unlimited number of shares of the Fund without par value. Shares of the Fund are available through the variable annuity contracts offered through the separate accounts of participating insurance companies. Currently, the Fund only offers its shares to separate accounts of Allianz Life Insurance Company of North America and Allianz Life Insurance Company of New York, affiliates of the Trust and the Manager, as defined below.
Under the Trust’s organizational documents, its officers and trustees are indemnified against certain liabilities arising out of the performance of their duties to the Fund. In addition, in the normal course of business, the Fund may enter into contracts with its vendors and others that provide for general indemnifications. The Fund’s maximum exposure under these arrangements is unknown, as this would involve future claims that may be made against the Fund. However, based on experience, the Fund expects that risk of loss to be remote.
2. Significant Accounting Policies
The following is a summary of significant accounting policies followed by the Fund in the preparation of its financial statements. The policies conform with U.S. generally accepted accounting principles (“U.S. GAAP”). The preparation of financial statements requires management to make certain estimates and assumptions that affect the reported amounts of assets and liabilities and disclosure of contingent assets and liabilities at the date of the financial statements and the reported amounts of increases and decreases in net assets from operations during the reporting period. Actual results could differ from those estimates.
Security Valuation
The Fund records its investments at fair value. Fair value is defined as the price that would be received to sell an asset or paid to transfer a liability in an orderly transaction between willing market participants at the measurement date. The valuation techniques used to determine fair value are further described in Note 4 below.
Investment Transactions and Investment Income
Investment transactions are accounted for on trade date. Net realized gains and losses on investments sold and on foreign currency transactions are recorded on the basis of identified cost. Interest income is recorded on the accrual basis and includes, where applicable, the amortization of premiums or accretion of discounts.
Dividends to Shareholders
Dividends to shareholders are recorded on the ex-dividend date. The Fund distributes its dividends from net investment income and net realized capital gains, if any, on an annual basis. The amount of dividends from net investment income and from net realized gains is determined in accordance with federal income tax regulations, which may differ from U.S. GAAP. These “book/tax” differences are either temporary or permanent in nature. To the extent these differences are permanent in nature (e.g., reclassification of distributions, miscellaneous adjustments on return of capital, and other permanent adjustments), such amounts are reclassified within the composition of net assets based on their federal tax-basis treatment; temporary differences (e.g., wash sales and differing treatment on certain investments) do not require reclassification. Dividends to shareholders that exceed net investment income and net realized gains for tax purposes are reported as distributions of capital.
Expense Allocation
Expenses directly attributable to the Fund are charged directly to the Fund, while expenses attributable to more than one Fund are allocated among the respective Funds based upon relative net assets or some other reasonable method. Expenses which are attributable to more than one Trust are allocated across the Allianz Variable Insurance Products and Allianz Variable Insurance Products Fund of Funds Trusts based upon relative net assets or another reasonable basis. Allianz Investment Management LLC (the “Manager”), serves as the investment manager for the Trust and the Allianz Variable Insurance Products Trust.
Derivative Instruments
All open derivative positions at period end are reflected on the Fund’s Schedule of Portfolio Investments. The following is a description of the derivative instruments utilized by the Fund, including the primary underlying risk exposures related to each instrument type. The Fund’s allocation to the MVP (Managed Volatility Portfolio) risk management process may include (a) derivatives such as index futures, other futures contracts, options, and other similar securities and (b) cash, money market equivalents, short-term debt instruments, money market funds, and short-term debt funds to satisfy all applicable margin requirements and to provide additional portfolio liquidity to satisfy large redemptions and any margin calls. Due to the leverage provided by derivatives, the notional value of the Fund’s derivative positions could exceed 20% of the Fund’s value. The Fund may also use futures to gain equity exposure and may hold cash as a buffer in the event of market shocks.
8
AZL MVP Growth Index Strategy Fund
Notes to the Financial Statements
December 31, 2017
Futures Contracts
During the year ended December 31, 2017, the Fund invested in futures contracts to reduce volatility and limit the need to decrease or increase allocations to underlying funds. Futures contracts are valued based upon their quoted daily settlement prices. Upon entering into a futures contract, the Fund is required to segregate liquid assets in accordance with the initial margin requirements of the broker or exchange. Futures contracts are marked to market daily and a payable or receivable for the change in value (“variation margin”) is recorded by the Fund. Gains or losses are recognized but not considered realized until the contracts expire or are closed. Futures contracts involve, to varying degrees, elements of market risk (generally equity price risk related to stock futures, interest rate risk related to bond futures, and foreign currency risk related to currency futures) and exposure to loss in excess of the variation margin disclosed in the Statement of Assets and Liabilities. The primary risks associated with the use of futures contracts are the imperfect correlation between the change in fair value of the underlying securities and the prices of futures contracts, the possibility of an illiquid market, and the inability of the counterparty to meet the terms of the contract. For the year ended December 31, 2017, the monthly average notional amount for long contracts was $122.1 million. Realized gains and losses are reported as “Net realized gains/(losses) on futures contracts” on the Statement of Operations.
Summary of Derivative Instruments
The following is a summary of the fair values of derivative instruments on the Fund’s Statement of Assets and Liabilities, categorized by risk exposure, as of December 31, 2017:
Asset Derivative | Liability Derivative | |||||||||||
| Primary Risk Exposure | Statement of Assets and Liabilities Location | Total Fair Value* | Statement of Assets and Liabilities Location | Total Fair Value* | ||||||||
Equity Risk | ||||||||||||
| Equity Contracts | Receivable for variation margin on futures contracts | $ | 1,609,759 | Payable for variation margin on futures contracts | $ | — | ||||||
Interest Rate Risk | ||||||||||||
| Interest Rate Contracts | — | 175,084 | ||||||||||
| * | For futures contracts, the amounts represent the cumulative appreciation/depreciation of these futures contracts as reported in the Schedule of Portfolio Investments. Only current day’s variation margin is reported within the Statement of Assets and Liabilities as variation margin on futures contracts. |
The following is a summary of the effect of derivative instruments on the Statement of Operations, categorized by risk exposure, for the year ended December 31, 2017:
| Primary Risk Exposure | Location of Gains/(Losses) on Derivatives Recognized | Realized Gains/(Losses) on Derivatives Recognized | Change in Net Unrealized Appreciation/Depreciation on Derivatives Recognized | |||||||
Equity Risk | ||||||||||
| Equity Contracts | Net Realized gains/(losses) on futures contracts/Change in net unrealized appreciation/depreciation on futures contracts | $ | 15,598,443 | $ | 1,436,203 | |||||
Interest Rate Risk | ||||||||||
| Interest Rate Contracts | 240,241 | (5,832 | ) | |||||||
3. Fees and Transactions with Affiliates and Other Parties
The Manager provides investment advisory and management services for the Fund. The Manager has contractually agreed to waive fees and reimburse the Fund to limit the annual expenses, excluding interest expense (e.g., cash overdraft fees), taxes, brokerage commissions, acquired fund fees and expenses, other expenditures that are capitalized in accordance with U.S. GAAP and other extraordinary expenses not incurred in the ordinary course of the Fund’s business, based on the daily net assets of the Fund, through April 30, 2019. Expenses incurred for investment advisory and management services are reflected on the Statement of Operations as “Manager fees.”
For the year ended December 31, 2017, the annual rate paid to the Manager and the annual expense limit were as follows:
| Annual Rate | Annual Expense Limit | |||||||||
AZL MVP Growth Index Strategy Fund | 0.10 | % | 0.20 | % | ||||||
Any amounts contractually waived or reimbursed by the Manager in a particular fiscal year will be subject to repayment by the Fund to the Manager to the extent that from time to time through the next three fiscal years the repayment will not cause the Fund’s expenses to exceed the lesser of the stated limit at the time of the waiver or the current stated limit. Any amounts recouped by the Manager during the year are reflected on the Statement of Operations as “Recoupment of prior expenses reimbursed by the Manager.” At December 31, 2017, there were no remaining contractual reimbursements that are subject to repayment by the Fund in subsequent years.
In addition, the Manager may voluntarily waive or reimburse additional fees in order to maintain more competitive expense ratios. Any voluntary waivers or reimbursements are not subject to repayment in subsequent years. Information on the total amount waived/reimbursed by the Manager or repaid to the Manager by the Fund during the period can be found on the Statement of Operations. During the year ended December 31, 2017, there were no voluntary waivers.
9
AZL MVP Growth Index Strategy Fund
Notes to the Financial Statements
December 31, 2017
The Manager or an affiliate of the Manager serves as the investment adviser of certain underlying funds in which the Fund invests. At December 31, 2017, these underlying funds are noted as Affiliated Investment Companies in the Fund’s Schedule of Portfolio Investments. Additional information, including financial statements, about these Funds is available at www.allianzlife.com. The Manager or an affiliate of the Manager is paid a separate fee from the underlying funds for such services. A summary of the Fund’s investments in affiliated investment companies for the year ended December 31, 2017 is as follows:
| Fair Value 12/31/16 | Purchases at Cost | Proceeds from Sales | Net Realized Gains/(Losses) | Net Change in Unrealized Appreciation/ Depreciation | Fair Value 12/31/17 | Shares as of 12/31/2017 | Dividend Income | Net realized gains distributions from affiliated underlying funds | |||||||||||||||||||||||||||||||||||||
AZL Enhanced Bond Index Fund | $ | 518,310,753 | $ | 92,454,043 | $ | (1,795,901 | ) | $ | (64,162 | ) | $ | 11,210,780 | $ | 620,115,513 | 56,943,573 | $ | 5,350,819 | $ | 64 | ||||||||||||||||||||||||||
AZL International Index Fund, Class 2 | 412,415,467 | 19,056,036 | (23,980,743 | ) | (795,387 | ) | 93,609,583 | 500,304,956 | 28,919,362 | 4,141,708 | 3,612,407 | ||||||||||||||||||||||||||||||||||
AZL Mid Cap Index Fund, Class 2 | 254,988,987 | 18,806,079 | (5,667,733 | ) | (531,340 | ) | 25,447,158 | 293,043,151 | 12,491,183 | 1,272,889 | 13,946,624 | ||||||||||||||||||||||||||||||||||
AZL S&P 500 Index Fund, Class 2 | 814,319,154 | 57,014,632 | (48,610,266 | ) | 1,614,269 | 119,522,420 | 943,860,209 | 58,515,822 | 8,170,612 | 40,017,866 | |||||||||||||||||||||||||||||||||||
AZL Small Cap Stock Index Fund, Class 2 | 132,754,720 | 11,287,029 | (4,702,399 | ) | (401,650 | ) | 7,031,011 | 145,968,711 | 9,809,725 | 673,146 | 9,345,054 | ||||||||||||||||||||||||||||||||||
|
|
|
|
|
|
|
|
|
|
|
|
|
|
|
|
|
| ||||||||||||||||||||||||||||
| $ | 2,132,789,081 | $ | 198,617,819 | $ | (84,757,042 | ) | $ | (178,270 | ) | $ | 256,820,952 | $ | 2,503,292,540 | 166,679,665 | $ | 19,609,174 | $ | 66,922,015 | |||||||||||||||||||||||||||
|
|
|
|
|
|
|
|
|
|
|
|
|
|
|
|
|
| ||||||||||||||||||||||||||||
Pursuant to separate agreements between the Funds and the Manager, the Manager provides a Chief Compliance Officer (“CCO”) and certain compliance oversight and regulatory filing services to the Trust. Under these agreements the Manager is entitled to an amount equal to a portion of the compensation and certain other expenses related to the individuals performing the CCO and compliance oversight services, as well as $100 per hour for time incurred in connection with the preparation and filing of certain documents with the Securities and Exchange Commission (“SEC” or the “Commission”). The fees are paid to the Manager on a quarterly basis. The total expenses incurred by the Fund for these services are reflected on the Statement of Operations as “Administrative and compliance services fees.”
Citi Fund Services Ohio, Inc. (“Citi” or the “Administrator”), a wholly owned subsidiary of Citigroup, Inc., with which an officer of the Trust is affiliated, serves as the Trust’s administrator and fund accountant, and assists the Trust in all aspects of its administration and operation. The Administrator is entitled to a fee, accrued daily and paid monthly. The Administrator is entitled to an annual fee for each additional class of shares of any Fund, certain annual fees in supporting fair values services, and a Trust-wide annual fee for providing infrastructure and support in implementing the written policies and procedures comprising the Fund’s compliance program. The Administrator is also reimbursed for certain expenses incurred. The total expenses incurred by the Fund for these services are reflected on the Statement of Operations as “Administration fees.”
FIS Investor Services LLC (“FIS”) serves as the Fund’s transfer agent. Under the Transfer Agent Agreement, the Trust pays FIS a fee for its services and reimburses FIS for all of their reasonable out-of-pocket expenses incurred in providing these services.
The Bank of New York Mellon (“BNY Mellon” or the “Custodian”) serves as the Trust’s custodian and securities lending agent. For these services as custodian, the Funds pay BNY Mellon a fee based on a percentage of assets held on behalf of the Funds, plus certain out-of-pocket charges.
Allianz Life Financial Services, LLC (“ALFS”), an affiliate of the Manager, serves as distributor of the Fund. ALFS receives an annual Trust-wide annual fee of $7,500, paid by the Manager from its profits and not by the Trust, for recordkeeping and reporting services.
In addition, certain legal fees and expenses are paid to a law firm, Dorsey & Whitney LLP, of which the Secretary of the Fund is Senior Counsel. During the year ended December 31, 2017, $24,677 was paid from the Fund relating to these fees and expenses.
Certain Officers and Trustees of the Trust are affiliated with the Manager or the Administrator. Such Officers (except for the Trust’s CCO as noted above) and Trustees receive no compensation from the Trust for serving in their respective roles. For their service to the Trust and to the Allianz Variable Insurance Products Trust, each non-interested Trustee receives a $170,000 annual Board retainer, the Lead Director receives an additional $42,500 annually and the Chair of the Nominating and Corporate Governance Committee receives an additional $25,500 annually. In addition, the Trustees are reimbursed for certain expenses associated with attending Board meetings. Compensation to the Trustees is allocated between the Trust and the Allianz Variable Insurance Products Trust in proportion to the assets under management of each trust. During the year ended December 31, 2017, actual Trustee compensation was $1,116,333 in total for both trusts.
4. Investment Valuation Summary
The valuation techniques employed by the Fund, as described below, maximize the use of observable inputs and minimize the use of unobservable inputs in determining fair value. The inputs used for valuing the Fund’s investments are summarized in the three broad levels listed below:
| ● | Level 1 — quoted prices in active markets for identical assets |
| ● | Level 2 — other significant observable inputs (including quoted prices for similar securities, interest rates, prepayments speeds, credit risk, etc.) |
| ● | Level 3 — significant unobservable inputs (including the Fund’s own assumptions in determining the fair value of investments) |
Changes in valuation techniques may result in transfers in or out of an assigned level within the disclosure hierarchy. The Fund determines transfers between fair value hierarchy levels at the reporting period end. The inputs or methodology used for valuing investments is not necessarily an indication of the risk associated with investing in those investments.
Investments in other investment companies are valued at their published net asset value (“NAV”). Security prices are generally provided by an independent third party pricing service approved by the Trust’s Board of Trustees (the “Board” or “Trustees”) as of the close of the New York Stock Exchange (“NYSE”) (generally 4:00 pm Eastern Time). The investments utilizing Level 1 valuations represent investments in open-end investment companies. Futures contracts are valued at the last sales price as of the close of the primary exchange and are typically categorized as Level 1 in the fair value hierarchy.
10
AZL MVP Growth Index Strategy Fund
Notes to the Financial Statements
December 31, 2017
For the year ended December 31, 2017, there were no Level 3 investments for which significant unobservable inputs were used to determine fair value. There were no significant transfers between Levels 1 and 2 as of December 31, 2017, based on levels assigned to securities on December 31, 2016.
The following is a summary of the valuation inputs used as of December 31, 2017 in valuing the Fund’s investments based upon the three levels defined above:
| Investment Securities: | Level 1 | Level 2 | Level 3 | Total | ||||||||||||||||
Affiliated Investment Companies | $ | 2,503,292,540 | $ | — | $ | — | $ | 2,503,292,540 | ||||||||||||
|
|
|
|
|
|
|
| |||||||||||||
Total Investment Securities | 2,503,292,540 | — | — | 2,503,292,540 | ||||||||||||||||
|
|
|
|
|
|
|
| |||||||||||||
Other Financial Instruments:* | ||||||||||||||||||||
Futures Contracts | 1,434,675 | — | — | 1,434,675 | ||||||||||||||||
|
|
|
|
|
|
|
| |||||||||||||
Total Investments | $ | 2,504,727,215 | $ | — | $ | — | $ | 2,504,727,215 | ||||||||||||
|
|
|
|
|
|
|
| |||||||||||||
| * | Other Financial Instruments would include any derivative instruments, such as futures contracts. These investments are generally presented in the financial statements at variation margin. |
5. Security Purchases and Sales
For the year ended December 31, 2017, cost of purchases and proceeds from sales of securities (excluding securities maturing less than one year from acquisition) were as follows:
| Purchases | Sales | |||||||||
AZL MVP Growth Index Strategy Fund | $ | 198,617,819 | $ | 84,757,042 | ||||||
6. Investment Risks
Derivatives Risk: The Fund may invest directly or through affiliated or unaffiliated mutual funds or unregistered investment pools in derivative instruments such as futures, options, and options on futures. A derivative is a financial contract whose value depends on, or is derived from, the value of an underlying asset, reference rate, or risk. Use of derivative instruments involves risks different from, or possibly greater than, the risks associated with investing directly in securities and other traditional investments. Derivatives are subject to a number of other risks, such as liquidity risk, interest rate risk, market risk, credit risk, and selection risk. Derivatives also involve the risk of mispricing or improper valuation and the risk that changes in the value may not correlate perfectly with the underlying asset, rate, or index. Using derivatives may result in losses, possibly in excess of the principal amount invested. Also, suitable derivative transactions may not be available in all circumstances. The other party to a derivatives contract could default.
Fund of Funds Risk: The Fund, as a shareholder of the underlying funds, indirectly bears its proportionate share of any investment management fees and other expenses of the underlying funds. Further due to the fees and expenses paid by the Fund, as well as small variations in the Fund’s actual allocations to the underlying funds and any futures and cash held in the Fund’s portfolio, the performance and income distributions of the Fund will not be the same as the performance and income distributions of the underlying funds.
7. Federal Tax Information
It is the policy of the Fund to continue to qualify as a regulated investment company by complying with the provisions available to certain investment companies, as defined under Subchapter M of the Internal Revenue Code, and to make distributions of net investment income and net realized gains sufficient to relieve it from all, or substantially all, federal income taxes. Accordingly, no provisions for federal income taxes are required in the financial statements.
Management of the Fund has reviewed tax positions taken in tax years that remain subject to examination by all major tax jurisdictions, including federal (i.e., the last four tax year ends and the interim tax period since then, as applicable). Management believes that there is no tax liability resulting from unrecognized tax benefits related to uncertain tax positions taken.
Cost of securities, including derivatives and short positions as applicable, for federal income tax purposes at December 31, 2017 is $2,158,306,838. The gross unrealized appreciation/(depreciation) on a tax basis is as follows:
Unrealized appreciation | $ | 348,137,289 | ||
Unrealized (depreciation) | (3,151,587 | ) | ||
|
| |||
Net unrealized appreciation/(depreciation) | $ | 344,985,702 | ||
|
|
The tax character of dividends paid to shareholders during the year ended December 31, 2017 were as follows:
| Ordinary Income | Net Long-Term | Total Distributions(a) | |||||||||||||
AZL MVP Growth Index Strategy Fund | $ | 28,362,008 | $ | 87,679,342 | $ | 116,041,350 | |||||||||
| (a) | Total distributions paid may differ from the Statements of Changes in Net Assets because dividends are recognized when actually paid for tax purposes. |
11
AZL MVP Growth Index Strategy Fund
Notes to the Financial Statements
December 31, 2017
The tax character of dividends paid to shareholders during the year ended December 31, 2016 were as follows:
| Ordinary Income | Net Long-Term | Total Distributions(a) | |||||||||||||
AZL MVP Growth Index Strategy Fund | $ | 31,942,925 | $ | 8,888,678 | $ | 40,831,603 | |||||||||
| (a) | Total distributions paid may differ from the Statements of Changes in Net Assets because dividends are recognized when actually paid for tax purposes. |
At December 31, 2017, the components of accumulated earnings on a tax basis were as follows:
| Undistributed Ordinary Income | Undistributed Long-Term Capital Gains | Accumulated Capital and Other Losses | Unrealized Appreciation/ Depreciation(a) | Total Accumulated Earnings/ (Deficit) | |||||||||||||||||||||
AZL MVP Growth Index Strategy Fund | $ | 28,652,840 | $ | 73,631,546 | $ | — | $ | 344,985,702 | $ | 447,270,088 | |||||||||||||||
| (a) | The difference between book-basis and tax-basis unrealized appreciation/depreciation is attributable primarily to tax deferral of losses on wash sales and straddles. |
8. Ownership and Principal Holders
The beneficial ownership, either directly or indirectly, of more than 25% of the voting securities of a fund creates presumptions of control of the fund, under section 2 (a)(9) of the 1940 Act. As of December 31, 2017, the Fund had an individual shareholder account which is affiliated with the Investment Adviser representing ownership in excess of 90% of the Fund.
9. Investment Company Reporting Modernization
In October 2016, the SEC released its Final Rule on Investment Company Reporting Modernization (the “Rules”). The Rules which introduce two new regulatory reporting forms for investment companies — Form N-PORT and Form N-CEN — also contain amendments to Regulation S-X which require standardized, enhanced disclosures about derivatives in investment company financial statements, as well as other amendments. The amendments to Regulation S-X became effective for filings made with the SEC after August 1, 2017. The compliance date for form N-PORT and Form N-CEN will vary based on the reporting entity’s size and, in the case of the Fund, is expected to be April 30, 2019. The Fund’s adoption of these amendments, as applicable for the financial statements prepared as of December 31, 2017, had no effect on the Fund’s net assets or results of operations.
10. Subsequent Events
Management of the Fund has evaluated the need for additional disclosures or adjustments resulting from events through the date the financial statements were issued. Based on this evaluation, there were no subsequent events to report that would have material impact on the Fund’s financial statements
12
REPORT OF INDEPENDENT REGISTERED PUBLIC ACCOUNTING FIRM
To the Shareholders and Board of Trustees of
Allianz Variable Insurance Products Fund of Funds Trust:
Opinion on the Financial Statements
We have audited the accompanying statement of assets and liabilities of AZL MVP Growth Index Strategy Fund (the “Fund”) of the Allianz Variable Insurance Products Fund of Funds Trust, including the schedule of portfolio investments, as of December 31, 2017, and the related statement of operations for the year then ended, the statements of changes in net assets for each of the years in the two-year period then ended, and the related notes (collectively, the “financial statements”) and the financial highlights for each of the years in the five-year period then ended. In our opinion, the financial statements present fairly, in all material respects, the financial position of the Fund as of December 31, 2017, the results of its operations for the year then ended, the changes in its net assets for each of the years in the two-year period then ended, and the financial highlights for each of the years in the five-year period then ended, in conformity with U.S. generally accepted accounting principles.
Basis for Opinion
These financial statements and financial highlights are the responsibility of the Fund’s management. Our responsibility is to express an opinion on these financial statements and financial highlights based on our audits. We are a public accounting firm registered with the Public Company Accounting Oversight Board (United States) (“PCAOB”) and are required to be independent with respect to the Fund in accordance with the U.S. federal securities laws and the applicable rules and regulations of the Securities and Exchange Commission and the PCAOB.
We conducted our audits in accordance with the standards of the PCAOB. Those standards require that we plan and perform the audit to obtain reasonable assurance about whether the financial statements and financial highlights are free of material misstatement, whether due to error or fraud. Our audits included performing procedures to assess the risks of material misstatement of the financial statements and financial highlights, whether due to error or fraud, and performing procedures that respond to those risks. Such procedures included examining, on a test basis, evidence regarding the amounts and disclosures in the financial statements and financial highlights. Such procedures also included confirmation of securities owned as of December 31, 2017, by correspondence with brokers and transfer agents of the underlying funds. Our audits also included evaluating the accounting principles used and significant estimates made by management, as well as evaluating the overall presentation of the financial statements and financial highlights. We believe that our audits provide a reasonable basis for our opinion.
/s/ KPMG LLP
We have served as the auditor of one or more Allianz Variable Insurance Products investment companies since 1999.
Columbus, Ohio
February 23, 2018
13
Other Federal Income Tax Information (Unaudited)
For the year ended December 31, 2017, 41.00% of the total ordinary income dividends paid by the Fund qualify for the corporate dividends received deduction available to corporate shareholders.
During the year ended December 31, 2017, the Fund declared net short-term capital gain distributions of $342,468.
During the year ended December 31, 2017, the Fund declared net long-term capital gain distributions of $87,679,342.
14
A description of the policies and procedures that the Fund uses to determine how to vote proxies relating to portfolio securities is available, without charge, upon request, by visiting the Securities and Exchange Commission’s (“Commission”) website at www.sec.gov, or by calling 800-624-0197.
Information regarding how the Fund voted proxies relating to portfolio securities during the most recent 12-month period ended June 30th is available (i) without charge, upon request, by calling 800-624-0197; (ii) on the Allianz Variable Insurance Products Fund of Funds Trust’s website at https://www.allianzlife.com; and (iii) on the Commission’s website at http://www.sec.gov.
The Fund files complete Schedules of Portfolio Holdings with the Commission for the first and third quarters of each fiscal year on Form N-Q. Schedules of Portfolio Holdings for the Fund in this report are available without charge on the Commission’s website at http://www.sec.gov, or may be reviewed and copied at the Commission’s Public Reference Room in Washington, D.C. Information on the operation of the Public Reference Room may be obtained by calling 800-SEC-0330.
15
Approval of Investment Advisory Agreement (Unaudited)
Subject to the general supervision of the Board of Trustees (the “Board”) and in accordance with the investment objectives and restrictions of each separate series (together, the “Funds”) of the Allianz Variable Insurance Products Fund of Funds Trust (the “Trust”), investment advisory services are provided to the Funds by Allianz Investment Management LLC (the “Manager”). As used in this section, “Fund” refers to any of the Funds. The Manager manages each Fund pursuant to an investment management agreement (the “Management Agreement”) with the Trust in respect of each such Fund. The Management Agreement provides that the Manager, subject to the supervision and approval of the Board, is responsible for the management of each Fund. For management services, each Fund pays the Manager an investment advisory fee based upon each Fund’s average daily net assets. The Manager has contractually agreed to limit the expenses of each Fund by reimbursing the Fund if and when total Fund operating expenses exceed certain amounts until at least May 1, 2019 (the “Expense Limitation Agreement”).
In reviewing the services provided by the Manager and the terms of the Management Agreement, the Board receives and reviews information related to the Manager’s experience and expertise in the variable insurance marketplace. Currently, the Funds are offered only through variable annuities and variable life insurance policies, and not in the retail fund market. In addition, the Board receives information regarding the Manager’s expertise with regard to portfolio diversification and asset allocation requirements within variable insurance products issued by Allianz Life Insurance Company of North America (“Allianz Life”) and its subsidiary, Allianz Life Insurance Company of New York (“Allianz of New York”). Currently, the Funds are offered only through Allianz Life and Allianz of New York variable products.
As required by the Investment Company Act of 1940 (the “1940 Act”), the Board has reviewed and approved the Management Agreement with the Manager. The Board’s decision to approve this contract reflects the exercise of its business judgment on whether to approve new arrangements and continue the existing arrangements. During its review of the contract, the Board considered many factors, among the most material of which are: the Fund’s investment objectives and long-term performance; the Manager’s management philosophy, personnel, processes and investment performance, including its compliance history and the adequacy of its compliance processes; the preferences and expectations of Fund shareholders (and underlying contract owners) and their relative sophistication; the continuing state of competition in the mutual fund industry; and comparable fees in the mutual fund industry.
The Board also considered the compensation and benefits received by the Manager. This includes fees received for services provided to a Fund by employees of the Manager or of affiliates of the Manager and research services received by the Manager from brokers that execute Fund trades, as well as advisory fees. The Board considered the fact that: (1) the Manager and the Trust are parties to an Administrative Services Agreement and a Compliance Services Agreement, under which the Manager is compensated by the Trust for performing certain administrative and compliance services including providing an employee of the Manager or one of its affiliates to act as the Trust’s Chief Compliance Officer; and (2) Allianz Life Financial Services, LLC, an affiliated person of the Manager, is a registered securities broker-dealer and received (along with its affiliated persons) payments made by the underlying funds pursuant to Rule 12b-1.
The Board is aware that various courts have interpreted provisions of the 1940 Act and have indicated in their decisions that the following factors may be relevant to an adviser’s compensation: the nature and quality of the services provided by the adviser, including the performance of the fund; the adviser’s cost of providing the services; the extent to which the adviser may realize “economies of scale” as the fund grows larger; any indirect benefits that may accrue to the adviser and its affiliates as a result of the adviser’s relationship with the fund; performance and expenses of comparable funds; the profitability of acting as adviser to the fund; and the extent to which the independent Board members, who are not “interested persons” of a fund as defined by the 1940 Act, are fully informed about all facts bearing on the adviser’s services and fees. The Board is aware of these factors and takes them into account in its review of the Management Agreement for the Funds.
The Board considered and weighed these circumstances in light of its experience in governing the Trust, and is assisted in its deliberations by the advice of independent legal counsel to the independent Trustees. In this regard, the Board requests and receives a significant amount of information about the Funds and the Manager. Some of this information is provided at each regular meeting of the Board; additional information is provided in connection with the particular meeting or meetings at which the Board’s formal review of an advisory contract occurs. In between regularly scheduled meetings, the Board may receive information on particular matters as the need arises. Thus, the Board’s evaluation of the Management Agreement is informed by reports covering such matters as: the Manager’s investment philosophy, personnel and processes, and the Fund’s investment performance (in absolute terms as well as in relationship to its benchmark). In connection with comparing the performance of each Fund versus its benchmark, the Board receives reports on the extent to which the Fund’s performance may be attributed to various applicable factors, such as asset class allocation decisions and volatility management strategies, the performance of the underlying funds, rebalancing decisions, and the impact of cash positions and Fund fees and expenses. The Board also receives reports on the Funds’ expenses (including the advisory fee itself and the overall expense structure of the Funds, both in absolute terms and relative to similar and/or competing funds, with due regard for the Expense Limitation Agreement and additional voluntary expense limitations); the nature and extent of the advisory and other services provided to the Fund by the Manager and its affiliates; compliance and audit reports concerning the Funds and the companies that service them; and relevant developments in the mutual fund industry and how the Funds and/or the Manager are responding to them.
The Board also receives financial information about the Manager, including reports on the compensation and benefits the Manager derives from its relationships with the Funds. These reports cover not only the fees under the Management Agreement, but also fees, if any, received for providing other services to the Funds. The reports also discuss any indirect or “fall out” benefits the Manager or its affiliates may derive from its relationship with the Funds.
The Management Agreement was most recently considered at Board meetings held in the fall of 2017. Information relevant to the approval of the Management Agreement was considered at a telephonic Board meeting on October 18, 2017, and at an “in person” Board meeting held October 23, 2017. The Management Agreement was approved at the Board meeting of October 23, 2017. At such meeting the Board also approved the Expense Limitation Agreement between the Manager and the Trust for the period ending April 30, 2019. In connection with such meetings, the Trustees requested and evaluated extensive materials from the Manager, including performance and expense information for other investment companies with similar investment objectives derived from data compiled by an independent third party provider and other sources believed to be reliable by the Manager. Prior to voting, the Trustees reviewed the proposed approval/continuance of the Agreement with management and with experienced counsel who are independent of the Manager and received a memorandum from such counsel discussing the legal standards for their consideration of the proposed approvals/continuances. The independent Trustees also discussed the proposed approvals/continuances in a private session with such counsel at which no representatives of the Manager were present. In reaching their determinations relating to the approval and/or continuance of the Agreement, in respect of each Fund, the Board considered all factors it believed relevant. The Board based its decision to approve the Management Agreement on the totality of the circumstances and relevant factors, and with a view to past and future long-term considerations. Not all of the factors and considerations discussed above and below are necessarily relevant to every Fund, and the Board did not assign relative weights to factors discussed herein or deem any one or group of them to be controlling in and of themselves.
An SEC rule requires that shareholder reports include a discussion of certain factors relating to the selection of the investment adviser and the approval of the advisory fee. The “factors” enumerated by the SEC are set forth below in italics, as well as the Board’s conclusions regarding such factors:
(1) The nature, extent and quality of services provided by the Manager. The Trustees noted that the Manager, subject to the control of the Board, administers each Fund’s business and other affairs. The Trustees noted that the Manager also provides the Trust and each Fund with such administrative and other services (exclusive of, and in addition to, any such services provided by any others retained by the Trust on behalf of the Funds) and executive and other personnel as are necessary for the operation of the Trust and the Funds. Except for the Trust’s Chief Compliance Officer and certain compliance staff, the Manager pays all of the compensation of Trustees and officers of the Trust who are employees of the Manager or its affiliates.
16
The Board considered the scope and quality of services provided by the Manager and noted that the scope of such services provided had expanded as a result of recent regulatory and other developments. The Board noted that, for example, the Manager is responsible for maintaining and monitoring its own compliance program, and this compliance program has been continuously refined and enhanced in light of new regulatory requirements. The Board considered the capabilities and resources which the Manager has dedicated to performing services on behalf of the Trust and its Funds. The quality of administrative and other services, including the Manager’s role in coordinating the activities of the Trust’s other service providers, also were considered. The Board concluded that, overall, they were satisfied with the nature, extent and quality of services provided (and expected to be provided) to the Trust and to each of the Funds under the Management Agreement.
(2) The investment performance of the Funds and the Manager. In connection with every in-person quarterly Board meeting and the fall 2017 contract review process, Trustees received extensive information on the performance results of each Fund. This included, for example, performance information on absolute total return, performance versus the appropriate benchmark(s), the contribution to performance of the Manager’s asset class allocation decisions and volatility management strategies, the performance of the underlying funds, and the impact on performance of rebalancing decisions, cash and Fund fees. This included Lipper performance information on the Funds for the previous quarter, year-to-date, and previous one-, three- and five-year periods, to the extent the Funds were in existence for such periods. (For Funds which have been in existence for less than five years, the Board received performance information on shorter time periods to the extent available.) For example, in connection with the Board meeting held October 23, 2017, the Manager reported that for the five Funds for which performance information for the five year period ended June 30, 2017 was available, two were in the top 40%, two were in the middle 20%, and one was in the bottom 40%. None of these Funds was in the bottom 40% for the three- or one-year periods. The Manager reported that for the three-year period ended June 30, 2017, for the six Funds for which three year performance information was available, four Funds were in the top 40% and two Funds were in the middle 20%. For the eight Funds for which one-year performance information was available, for the one-year period ended June 30, 2017, four Funds were in the top 40%, two Funds were in the middle 20%, and two Funds were in the bottom 40%.
At the Board meeting held October 23, 2017, the Manager also reported upon the performance of the MVP Funds compared to custom managed-volatility peer groups. For the seven Funds for which three-year performance information was available, for the three-year period ended June 30, 2017, five Funds were in the top 40%, one Fund was in the middle 20%, and one was in the bottom 40%. For the eight Funds for which one year performance was available, for the one-year period ended June 30, 2017, four Funds were in the top 40% and four Funds were in the middle 20%. All six Funds for which five-year performance information was available were in the top 40%.
At the Board meeting held October 23, 2017, the Trustees determined that the investment performance of the Funds was acceptable.
(3) The costs of services to be provided and profits to be realized by the Manager and its affiliates from the relationship with the Funds. The Board considered that the Manager receives an advisory fee from each of the Funds. The Manager reported that for the three MVP Fusion Dynamic Funds the advisory fee paid put these Funds in the 44th percentile of the customized peer group. The Manager reported that for three MVP Index Strategy Funds the advisory fee paid put them in the 27th percentile of the customized peer group, and for the two non-MVP Index Strategy Funds, as well as the AZL DFA Multi-Strategy Fund, the advisory fee paid put them in the 13th percentile of the customized peer group. The Manager reported that for the AZL MVP BlackRock Global Strategy Plus, AZL MVP DFA Multi-Strategy, AZL MVP Pyramis Multi-Strategy, and AZL MVP T. Rowe Price Capital Appreciation Plus Funds, the advisory fee paid was in the 9th percentile. (A lower percentile reflects lower fund fees and is better for fund shareholders.) Trustees were provided with information on the total expense ratios of the Funds and other funds in the customized peer groups, and the Manager reported upon the challenges in making peer group comparisons for the Funds.
The Manager provided information concerning the profitability of the Manager’s investment advisory activities for the period from 2014 through June 30, 2017. The Board recognized that it is difficult to make comparisons of profitability from investment company advisory agreements because comparative information is not generally publicly available and is affected by numerous factors, including the structure of the particular adviser, the types of funds it manages, its business mix, numerous assumptions regarding allocation of expenses and the adviser’s capital structure and cost of capital. In considering profitability information, the Board considered the possible effect of certain fall-out benefits to the Manager and its affiliates. The Board focused on profitability of the Manager’s relationships with the Funds before taxes and distribution expenses. The Board recognized that the Manager should earn a reasonable level of profits for the services it provides to each Fund.
The Board also considered that Wilshire Funds Management (“Wilshire”) serves as a consultant to the Manager in preparing statistical and other factual information for use in the creation and maintenance of the asset allocation models for the Fusion Funds (the AZL MVP Fusion Dynamic Conservative, Balanced, and Moderate Funds), pursuant to an agreement between the Manager and Wilshire. Wilshire serves as a consultant to the Manager with respect to selecting the Fusion Funds’ underlying funds and the asset allocations among the underlying funds. The Manager, not any Fund, pays a consultant fee to Wilshire.
Based upon the information provided, the Board concluded that the Funds’ advisory fees and expense ratios are not unreasonable, and determined that there was no evidence that the Manager’s level of profitability from its relationship with the Funds was excessive.
(4) and (5) The extent to which economies of scale would be realized as the Funds grow, and whether fee levels reflect these economies of scale. The Board noted that the advisory fee schedules for the Funds do not contain breakpoints that reduce the fee rate on assets above specified levels. The Board recognized that breakpoints may be an appropriate way for the Manager to share its economies of scale, if any, with Funds that have substantial assets. The Board found there was no uniform methodology for establishing breakpoints that give effect to Fund-specific services provided by the Manager. The Board noted that in the fund industry as a whole, as well as among funds similar to the Funds, there is no uniformity or pattern in the fees and asset levels at which breakpoints (if any) apply. Depending on the age, size, and other characteristics of a particular fund and its manager’s cost structure, different conclusions can be drawn as to whether there are economies of scale to be realized at any particular level of assets, notwithstanding the intuitive conclusion that such economies exist, or will be realized at some level of total assets. Moreover, because different managers have different cost structures and service models, it is difficult to draw meaningful conclusions from the breakpoints that may have been adopted by other funds. The Board also noted that the advisory agreements for many funds do not have breakpoints at all, or if breakpoints exist, they may be at asset levels significantly greater than those of the individual Funds. The Board also noted that the total assets in all of the Funds, as of June 30, 2017, were approximately $10.8 billion and that the largest Fund, the AZL MVP Growth Index Strategy Fund, had assets of approximately $2.4 billion.
The Board noted that the Manager has agreed to temporarily limit Fund expenses under the Expense Limitation Agreement, which has the effect of reducing expenses as would the implementation of advisory fee breakpoints. The Manager has committed to continue to consider the continuation of expense limits and/or advisory fee breakpoints as the Funds grow larger. The Board receives quarterly reports on the level of Fund assets. The Board expects to continue to consider: (a) the extent to which economies of scale have been realized, and (b) whether the advisory fee should be modified, either in connection with the next renewal of the Agreements or by modifying the Expense Limitation Agreement, to reflect such economies of scale, if any.
Having taken these factors into account, the Board concluded that the absence of breakpoints in the Funds’ advisory fee rate schedules was acceptable under each Fund’s circumstances.
17
Information about the Board of Trustees and Officers (Unaudited)
The Trust is managed by the Trustees in accordance with the laws of the state of Delaware governing business trusts. There are currently eight Trustees, one of whom is an “interested person” of the Trust within the meaning of that term under the 1940 Act. The Trustees and Officers of the Trust, and their addresses, ages, positions held with the Trust, terms of office with the Trust and length of time served, principal occupation(s) during the past five years, the number of portfolios in the Trust they oversee, and other directorships held during the past five years are as follows:
Non-Interested Trustees(1)
| Name, Address, and Year of Birth | Positions Held with Allianz VIP and VIP FOF Trust | Term of Office(2)/Length of Time Served | Principal Occupation(s) During Past 5 Years | Number of Portfolios Overseen for Allianz VIP and VIP FOF Trust | Other AZL Fund Complex | |||||
| Peter R. Burnim (1947) 5701 Golden Hills Drive Minneapolis, MN 55416 | Trustee | Since 2/07 | Consultant/Chair, various companies: Chairman, Emrys Analytics and subsidiaries, July 2015 to present; Chairman, Argus Investment Strategies Fund Ltd., February 2013 to 2017; Managing Director, iQ Venture Advisors, LLC, 2005 to present; Chairman, Northstar Group Holdings Ltd. Bermuda, 2011 to present; Chairman Sterling Bank & Trust (Bahamas) Ltd., 2016 to present, and Expert Witness, Massachusetts Department of Revenue, 2011 to 2016. | 35 | Argus Group Holdings and Subsidiaries; Northstar Group Holdings; Sterling Trust (Cayman) Ltd.; Sterling Bank & Trust Limited (Bahamas); Emrys Analytics; EGB Insurance. | |||||
| Peggy L. Ettestad (1957) 5701 Golden Hills Drive Minneapolis, MN 55416 | Lead Independent Trustee | Since 10/14 (Trustee since 2/07) | Managing Director, Red Canoe Management Consulting LLC, 2008 to present | 35 | Luther College | |||||
| Tamara Lynn Fagely (1958) 5701 Golden Hills Drive Minneapolis, MN 55416 | Trustee | Since 12/17 | Retired; Chief Operations Officer, Hartford Funds, March 2012 to December 2013 | 35 | Diamond Hill Funds (13 funds) | |||||
| Richard H. Forde (1953) 5701 Golden Hills Drive Minneapolis, MN 55416 | Trustee | Since 12/17 | Member of the Board and Chairman of the Finance and Investment Committee, Connecticut Water Service, Inc., October 2013 to present; Senior Vice President and Chief Investment Officer, CIGNA, 2004 to 2012 | 35 | Connecticut Water Service, Inc. | |||||
| Claire R. Leonardi (1955) 5701 Golden Hills Drive Minneapolis, MN 55416 | Trustee | Since 2/04 | Chief Executive Officer, Health eSense Inc., 2015 to Present; CEO, Connecticut Innovations, Inc., 2012 to 2015; General Partner, Fairview Capital, L.P., 1994 to 2012 | 35 | reSet Social Enterprise Investment Fund | |||||
| Dickson W. Lewis (1948) 5701 Golden Hills Drive Minneapolis, MN 55416 | Trustee | Since 2/04 | Retired; Vice President/General Manager, Yearbooks & Canada-Lifetouch National School Studios, 2006 to 2014; Vice President/General Manager of Jostens, Inc., 2002 to 2006; Senior Vice President of Fortis Group, 1997 to 2002 | 35 | None | |||||
| Arthur C. Reeds, III (1944) 5701 Golden Hills Drive Minneapolis, MN 55416 | Trustee | Since 10/99 | Retired; Senior Investment Officer, Hartford Foundation for Public Giving, 2000 to 2003; Chairman, Chief Executive and President of Conning Corp., 1999 to 2000 | 35 | Connecticut Water Service, Inc. |
Interested Trustees(3)
| Name, Address, and Year of Birth | Positions Held with Allianz VIP and VIP FOF Trust | Term of Office(2)/Length of Time Served | Principal Occupation(s) During Past 5 Years | Number of Portfolios Overseen for Allianz VIP and VIP FOF Trust | Other AZL Fund Complex | |||||
Brian Muench (1970) 5701 Golden Hills Drive | Trustee | Since 6/11 | President, Allianz Investment Management LLC, November 2010 to present; Vice President, Allianz Life, April 2011 to present | 35 | None |
18
Officers
| Name, Address, and Age | Positions Held with Allianz VIP and VIP FOF Trust | Term of Office(2)/Length of Time Served | Principal Occupation(s) During Past 5 Years | |||
Brian Muench (1970) 5701 Golden Hills Drive | President | Since 11/10 | President, Allianz Investment Management LLC, November 2010 to present; Vice President, Allianz Life, April 2011 to present. | |||
| Michael Radmer (1945) Dorsey & Whitney LLP, Suite 1500 50 South Sixth Street Minneapolis, MN 55402-1498 | Secretary | Since 02/02 | Senior Counsel (previously, Partner), Dorsey and Whitney LLP since 1976. | |||
| Bashir C. Asad (1963) Citi Fund Services Ohio, Inc. 4400 Easton Commons, Suite 200 Columbus, OH 43219 | Treasurer, Principal Accounting Officer and Principal Financial Officer | Since 06/16 | Senior Vice President, Citi Fund Services Ohio, Inc. | |||
| Chris R. Pheiffer (1968) 5701 Golden Hills Drive Minneapolis, MN 55416 | Chief Compliance Officer(4) and Anti-MoneyLaundering Compliance Officer | Since 02/14 | Chief Compliance Officer of the VIP Trust and the FOF Trust, February 2014 to present; Deputy Chief Compliance Officer of the VIP Trust and the FOF Trust and Compliance Director, Allianz Life, February 2007 to February 2014. |
| (1) | Member of the Audit Committee. |
| (2) | Indefinite. |
| (3) | Is an “interested person”, as defined by the 1940 Act, due to employment by Allianz. |
| (4) | The Manager and the Trust are parties to a Chief Compliance Officer Agreement under which the Manager is compensated by the Trust for providing an employee of the Manager or one of its affiliates to act as the Trust’s Chief Compliance Officer. The Chief Compliance Officer and Anti-Money Laundering Compliance Officer is not considered a corporate officer or executive employee of the Trust. |
19
The Allianz VIP Fund of Funds are distributed by Allianz Life Financial Services, LLC. These Funds are not FDIC Insured. | ANNRPT1217 2/18 |
AZL® MVP Moderate Index Strategy Fund
Annual Report
December 31, 2017
Table of Contents
Management Discussion and Analysis
Page 1
Expense Examples and Portfolio Composition
Page 3
Schedule of Portfolio Investments
Page 4
Statement of Assets and Liabilities
Page 5
Page 5
Statements of Changes in Net Assets
Page 6
Page 7
Notes to the Financial Statements
Page 8
Report of Independent Registered Public Accounting Firm
Page 13
Other Federal Income Tax Information
Page 14
Page 15
Approval of Investment Advisory Agreement
Page 16
Information about the Board of Trustees and Officers
Page 18
This report is submitted for the general information of the shareholder of the Fund. The report is not authorized for distribution to prospective investors in the Fund unless preceded or accompanied by an effective prospectus, which contains details concerning the sales charges and other pertinent information.
AZL® MVP Moderate Index Strategy Fund Review (Unaudited)
Allianz Investment Management LLC
serves as the Manager for the AZL®
MVP Moderate Index Strategy Fund.
What factors affected the Fund’s performance for the year ended December 31, 2017?
For the year ended December 31, 2017, the AZL® MVP Moderate Index Strategy Fund (the “Fund”) returned 13.21%. That compared to a 21.83%, 3.54% and a 14.26% total return for its benchmarks, the S&P 500 Index1, the Bloomberg Barclays U.S. Aggregate Bond Index1, and the Balanced Composite Index1, respectively.
The Fund is designed to provide a diversified portfolio consisting of index funds in equity and fixed income asset classes, combined with the MVP (Managed Volatility Portfolio) risk management process intended to adjust the risk of the portfolio based on quantitative indicators of market risk, such as the current level of fund and market volatility.
Global economic expansion supported equities during 2017 and led major stock indexes to all-time highs. U.S. large-cap equities, as measured by the S&P 500 Index, gained amid solid jobs growth, low unemployment, increased business investment, strong consumer confidence, and a low volatility environment. Mid- and small-cap stocks also performed well during the period, but could not keep pace with large-cap stocks. Growth stocks were heavily favored by investors during the year and significantly outperformed value stocks.
International developed markets outperformed U.S. domestic markets, returning 25.62% as measured by the MSCI EAFE Index2 for the period. Emerging markets equities, as measured by the MSCI Emerging Markets Equity Index3, posted impressive returns of 37.75%, ending years of underperformance relative to domestic and international developed markets.
The U.S. bond market was generally positive, and the market rewarded investors who took on interest rate and spread risk. Although spread movement was variable, spreads tightened over the year, particularly in the high-yield space. Meanwhile, the yield curve flattened sharply, as three rate hikes by the U.S. Federal Reserve sent short-term yields higher while investor demand for yield pushed long-term yields lower.
The Fund underperformed its blended benchmark for the 12-month period under review. This underperformance was due largely to an overweight allocation to mid- and small-cap stocks, which lagged large-cap equities during the period. The Fund’s allocation to international equities boosted relative results as they outperformed their U.S. counterparts. An overweight allocation to 30-year bonds boosted relative performance of the underlying fixed-income portfolio. However, that benefit was offset by an underweight allocation to corporate bonds, which detracted from relative performance and caused the Fund to modestly lag its fixed-income benchmark for the period.*
The MVP risk management process, which includes the use of derivatives, worked as intended during the period under review. Given that the period was marked by low volatility, the MVP maintained a neutral equity allocation for the year relative to its target.*
Past performance does not guarantee future results.
| * | The Fund’s portfolio composition is subject to change. There is no guarantee that any sectors mentioned will continue to perform well or that securities in such sectors will be held by the Fund in the future. The information contained in this commentary is for informational purposes only and should not be construed as a recommendation to purchase or sell securities in the sector mentioned. The Fund’s holdings and weightings are as of December 31, 2017. |
| 1 | For a complete description of the Fund’s performance benchmarks please refer to page 2 of this report. |
| 2 | The Morgan Stanley Capital International, Europe, Australasia and Far East (“MSCI EAFE”) Index is a free float-adjusted market capitalization-weighted index that is designed to measure the equity market performance of developed markets, excluding the U.S. & Canada. |
| 3 | The MSCI Emerging Markets Index (“MSCI EM”) is a free float-adjusted market capitalization index that is designed to measure equity performance of emerging markets. |
| Investors cannot invest directly in an index. |
1
AZL® MVP Moderate Index Strategy Fund Review (Unaudited)
Fund Objective
The Fund’s investment objective is to seek long-term capital appreciation. This objective may be changed by the Trustees of the Fund without shareholder approval. The Fund seeks to achieve its objective by investing in a combination of Index Strategy Underlying Funds that represent different classes in the Fund’s asset allocation.
Investment Concerns
The Fund invests in underlying funds, so its investment performance is directly related to the performance of those underlying funds. Before investing, investors should assess the risks associated with and types of investments made by each of the underlying funds in which the Fund invests.
International investing may involve risk of capital loss from unfavorable fluctuations in currency values, from differences in generally accepted accounting principles or from economic or political instability in other nations.
Small- to mid-capitalization companies typically have a higher risk of failure and historically have experienced a greater degree of volatility.
The performance of the Fund is expected to be lower than that of the Indices because of Fund fees and expenses. Securities in which the Fund will invest may involve substantial risk and may be subject to sudden severe price declines.
Bonds offer a relatively stable level of income, although bond prices will fluctuate, providing the potential for principal gain or loss.
Investing in derivatives instruments involves risks that may be different from or greater than the risk associated with investing directly in securities or other traditional instruments.
For a complete description of these and other risks associated with investing in a mutual Fund, please refer to the Fund’s prospectus.
Growth of $10,000 Investment
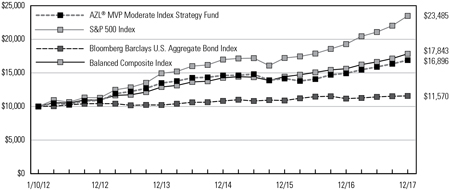
The chart above represents a comparison of a hypothetical investment in the Fund versus a similar investment in the Fund’s benchmark as well as the two component indices of the Fund’s benchmark, and represents the reinvestment of dividends and capital gains in the Fund.
Average Annual Total Returns as of December 31, 2017
| 1 Year | 3 Year | 5 Year | Since Inception (1/10/12) | |||||||||||||
AZL® MVP Moderate Index Strategy Fund | 13.21 | % | 4.93 | % | 9.19 | % | 9.17 | % | ||||||||
S&P 500 Index | 21.83 | % | 11.41 | % | 15.79 | % | 15.36 | % | ||||||||
Bloomberg Barclays U.S. Aggregate Bond Index | 3.54 | % | 2.24 | % | 2.10 | % | 2.47 | % | ||||||||
Balanced Composite Index | 14.26 | % | 7.76 | % | 10.25 | % | 10.18 | % | ||||||||
Past performance does not guarantee future results. The performance data quoted represents past performance and current returns may be lower or higher. The investment return and principal value will fluctuate so that an investor’s shares, when redeemed may be worth more or less than the original cost. To obtain performance information current to the most recent month end, please visit www.Allianzlife.com.
Expense Ratio | Gross | |||
AZL® MVP Moderate Index Strategy Fund | 0.71 | % | ||
The above expense ratio is based on the current Fund prospectus dated May 1, 2017. The Manager and the Fund have entered into a written contract limiting operating expenses, excluding certain expenses (such as interest expense and acquired fund fees and expenses), to 0.15% through April 30, 2019. Additional information pertaining to the December 31, 2017 expense ratios can be found in the financial highlights.
Acquired fund fees and expenses are incurred indirectly by the Fund through the valuation of the Fund’s investments in the other investment companies. Accordingly, acquired fund fees and expenses affect the Fund’s total returns. Because these fees and expenses are not included in the Fund’s financial highlights, the Fund’s total annual fund operating expenses, as shown in the current prospectus, do not correlate to the ratios of expenses to average net assets shown in the financial highlights table. Without acquired fund fees and expenses the Fund’s gross expense ratio would be 0.13%.
The total return of the Fund does not reflect the effect of any insurance charges, the annual maintenance fee or the deduction of taxes that a shareholder would pay on Fund distributions or the redemption of Fund shares. Such charges, fees and tax payments would reduce the performance quoted.
The Fund’s performance is measured against the Standard & Poor’s 500 Index (“S&P 500”), the Bloomberg Barclays U.S. Aggregate Bond Index and the Balanced Composite Index (“Composite”). The S&P 500 is representative of 500 selected common stocks, most of which are listed on the New York Stock Exchange, and is a measure of the U.S. Stock market as a whole. The Bloomberg Barclays U.S. Aggregate Bond Index is a market value-weighted performance benchmark for investment-grade fixed-rate debt issues, including government, corporate, asset-backed, and mortgage-backed securities, with maturities of at least one year. The Composite is a blended index comprised of (60%) S&P 500 and (40%) Bloomberg Barclays U.S. Aggregate Bond Index. These indexes are unmanaged and do not reflect the deduction of fees associated with a mutual fund, such as investment management and fund accounting fees. The Fund’s performance reflects the deduction of fees for services provided to the Fund. Investors cannot invest directly in an index.
2
AZL MVP Moderate Index Strategy Fund
(Unaudited)
As a shareholder of the AZL MVP Moderate Index Strategy Fund (the “Fund”), you incur ongoing costs, including management fees, distribution fees, and other Fund expenses. These examples are intended to help you understand your ongoing costs (in dollars) of investing in the Fund and to compare these costs with the ongoing costs of investing in other mutual funds. Please note that the expenses shown in each table do not reflect expenses that apply to the subaccount or the insurance contract. If the expenses that apply to the subaccount of the insurance contract were included, your costs would have been higher.
These examples are based on an investment of $1,000 invested at the beginning of the period and held for the periods presented below.
The Actual Expense table below provides information about actual account values and actual expenses. You may use the information below, together with the amount you invested, to estimate the expenses that you paid over the period. Simply divide your account value by $1,000 (for example, an $8,600 account value divided by $1,000 = 8.6), then multiply the result by the number in the table under the heading entitled “Expenses Paid During Period” to estimate the expenses you paid on your account during this period.
| Beginning Account Value 7/1/17 | Ending Account Value 12/31/17 | Expenses Paid During Period 7/1/17 - 12/31/17* | Annualized Expense Ratio During Period 7/1/17 - 12/31/17 | |||||||||||||||||
AZL MVP Moderate Index Strategy Fund | $ | 1,000.00 | $ | 1,063.60 | $ | 0.62 | 0.12 | % | ||||||||||||
The Hypothetical Expense table below provides information about hypothetical account values and hypothetical expenses based on the Fund’s actual expense ratio and an assumed rate of return of 5% per year before expenses, which is not the Fund’s actual return. The hypothetical account values and expenses may not be used to estimate the actual ending account balance or expenses you paid for the period. You may use this information to compare this 5% hypothetical example with the 5% hypothetical examples that appear in the shareholder reports of other funds.
| Beginning Account Value 7/1/17 | Ending Account Value 12/31/17 | Expenses Paid During Period 7/1/17 - 12/31/17* | Annualized Expense Ratio During Period 7/1/17 - 12/31/17 | |||||||||||||||||
AZL MVP Moderate Index Strategy Fund | $ | 1,000.00 | $ | 1,024.60 | $ | 0.61 | 0.12 | % | ||||||||||||
| * | Expenses are equal to the average account value over the period, multiplied by the Fund’s annualized expense ratio, multiplied by 184/365 (to reflect the one half year period). |
Portfolio Composition
(Unaudited)
| Investments | Percent of Net Assets | ||||
Domestic Equities | 42.5 | ||||
Fixed Income | 37.3 | ||||
International Equities | 15.2 | ||||
|
| ||||
Total Investment Securities | 95.0 | ||||
Net other assets (liabilities) | 5.0 | ||||
|
| ||||
Net Assets | 100.0 | % | |||
|
| ||||
3
AZL MVP Moderate Index Strategy Fund
Schedule of Portfolio Investments
December 31, 2017
| Shares | Fair Value | |||||||
| Affiliated Investment Companies (95.0%): | ||||||||
| 18,911,829 | AZL Enhanced Bond Index Fund | $ | 205,949,814 | |||||
| 4,861,439 | AZL International Index Fund, Class 2 | 84,102,886 | ||||||
| 2,156,849 | AZL Mid Cap Index Fund, Class 2 | 50,599,678 | ||||||
| 9,792,028 | AZL S&P 500 Index Fund, Class 2 | 157,945,419 | ||||||
| 1,733,963 | AZL Small Cap Stock Index Fund, Class 2 | 25,801,367 | ||||||
|
| |||||||
Total Affiliated Investment Companies (Cost $469,108,280) | 524,399,164 | |||||||
|
| |||||||
Total Investment Securities (Cost $469,108,280)(a) — 95.0% | 524,399,164 | |||||||
Net other assets (liabilities) — 5.0% | 27,468,475 | |||||||
|
| |||||||
Net Assets — 100.0% | $ | 551,867,639 | ||||||
|
| |||||||
Percentages indicated are based on net assets as of December 31, 2017.
| (a) | See Federal Tax Information listed in the Notes to the Financial Statements. |
Futures Contracts
Cash of $27,551,389 has been segregated to cover margin requirements for the following open contracts as of December 31, 2017:
Long Futures
| Description | Expiration Date | Number of Contracts | Notional Amount | Unrealized Appreciation/ (Depreciation) | ||||||||||||
S&P 500 Index E-Mini March Futures (U.S. Dollar) | 3/19/18 | 122 | $ | 16,323,600 | $ | 268,852 | ||||||||||
U.S. Treasury 10-Year Note March Futures (U.S. Dollar) | 3/21/18 | 89 | 11,040,172 | (59,643 | ) | |||||||||||
|
| |||||||||||||||
| $ | 209,209 | |||||||||||||||
|
| |||||||||||||||
See accompanying notes to the financial statements.
4
AZL MVP Moderate Index Strategy Fund
Statement of Assets and Liabilities
December 31, 2017
Assets: | |||||
Investments in affiliates, at cost | $ | 469,108,280 | |||
|
| ||||
Investments in affiliates, at value | $ | 524,399,164 | |||
Segregated cash for collateral | 27,551,389 | ||||
Interest and dividends receivable | 25,412 | ||||
Receivable for capital shares issued | 3,655 | ||||
Receivable for investments sold | 142,277 | ||||
Receivable for variation margin on futures contracts | 661 | ||||
Prepaid expenses | 3,198 | ||||
|
| ||||
Total Assets | 552,125,756 | ||||
|
| ||||
Liabilities: | |||||
Cash overdraft | 142,277 | ||||
Payable for capital shares redeemed | 45,529 | ||||
Manager fees payable | 46,834 | ||||
Administration fees payable | 3,706 | ||||
Custodian fees payable | 212 | ||||
Administrative and compliance services fees payable | 1,293 | ||||
Transfer agent fees payable | 711 | ||||
Trustee fees payable | 833 | ||||
Other accrued liabilities | 16,722 | ||||
|
| ||||
Total Liabilities | 258,117 | ||||
|
| ||||
Net Assets | $ | 551,867,639 | |||
|
| ||||
Net Assets Consist of: | |||||
Capital | $ | 473,064,778 | |||
Accumulated net investment income/(loss) | 4,602,884 | ||||
Accumulated net realized gains/(losses) from investment transactions | 18,699,884 | ||||
Net unrealized appreciation/(depreciation) on investments | 55,500,093 | ||||
|
| ||||
Net Assets | $ | 551,867,639 | |||
|
| ||||
Shares of beneficial interest (unlimited number of shares authorized, no par value) | 37,587,622 | ||||
Net Asset Value (offering and redemption price per share) | $ | 14.68 | |||
|
|
For the Year Ended December 31, 2017
Investment Income: | |||||
Dividends from affiliates | $ | 4,355,913 | |||
Interest | 237,138 | ||||
Dividends | 231 | ||||
Other income | 1,067 | ||||
|
| ||||
Total Investment Income | 4,594,349 | ||||
|
| ||||
Expenses: | |||||
Manager fees | 534,488 | ||||
Administration fees | 50,060 | ||||
Custodian fees | 1,891 | ||||
Administrative and compliance services fees | 6,447 | ||||
Transfer agent fees | 4,992 | ||||
Trustee fees | 22,918 | ||||
Professional fees | 23,592 | ||||
Shareholder reports | 15,609 | ||||
Other expenses | 7,090 | ||||
|
| ||||
Total expenses | 667,087 | ||||
|
| ||||
Net Investment Income/(Loss) | 3,927,262 | ||||
|
| ||||
Realized and Unrealized Gains/(Losses) on Investments: | |||||
Net realized gains/(losses) on securities transactions from affiliates | 4,703,592 | ||||
Net realized gains distributions from affiliated underlying funds | 11,790,250 | ||||
Net realized gains/(losses) on futures contracts | 2,850,437 | ||||
Change in net unrealized appreciation/depreciation on affiliated transactions | 43,088,326 | ||||
Change in net unrealized appreciation/depreciation on futures contracts | 240,496 | ||||
|
| ||||
Net Realized/Unrealized Gains/(Losses) on Investments | 62,673,101 | ||||
|
| ||||
Change in Net Assets Resulting From Operations | $ | 66,600,363 | |||
|
|
See accompanying notes to the financial statements.
5
AZL MVP Moderate Index Strategy Fund
Statements of Changes in Net Assets
| For the Year Ended December 31, 2017 | For the Year Ended December 31, 2016 | |||||||||
Change In Net Assets: | ||||||||||
Operations: | ||||||||||
Net investment income/(loss) | $ | 3,927,262 | $ | 8,896,990 | ||||||
Net realized gains/(losses) on investment transactions | 19,344,279 | 12,438,093 | ||||||||
Change in unrealized appreciation/depreciation on investments | 43,328,822 | 6,603,332 | ||||||||
|
|
|
| |||||||
Change in net assets resulting from operations | 66,600,363 | 27,938,415 | ||||||||
|
|
|
| |||||||
Distributions to Shareholders: | ||||||||||
From net investment income | (8,896,990 | ) | (11,530,345 | ) | ||||||
From net realized gains | (12,388,171 | ) | (15,559,033 | ) | ||||||
|
|
|
| |||||||
Change in net assets resulting from distributions to shareholders | (21,285,161 | ) | (27,089,378 | ) | ||||||
|
|
|
| |||||||
Capital Transactions: | ||||||||||
Proceeds from shares issued | 12,154,646 | 26,814,181 | ||||||||
Proceeds from dividends reinvested | 21,285,161 | 27,089,378 | ||||||||
Value of shares redeemed | (46,999,547 | ) | (55,484,626 | ) | ||||||
|
|
|
| |||||||
Change in net assets resulting from capital transactions | (13,559,740 | ) | (1,581,067 | ) | ||||||
|
|
|
| |||||||
Change in net assets | 31,755,462 | (732,030 | ) | |||||||
Net Assets: | ||||||||||
Beginning of period | 520,112,177 | 520,844,207 | ||||||||
|
|
|
| |||||||
End of period | $ | 551,867,639 | $ | 520,112,177 | ||||||
|
|
|
| |||||||
Accumulated net investment income/(loss) | $ | 4,602,884 | $ | 8,896,980 | ||||||
|
|
|
| |||||||
Share Transactions: | ||||||||||
Shares issued | 848,360 | 2,047,099 | ||||||||
Dividends reinvested | 1,506,381 | 2,071,053 | ||||||||
Shares redeemed | (3,305,040 | ) | (4,178,626 | ) | ||||||
|
|
|
| |||||||
Change in shares | (950,299 | ) | (60,474 | ) | ||||||
|
|
|
| |||||||
See accompanying notes to the financial statements.
6
AZL MVP Moderate Index Strategy Fund
(Selected data for a share of beneficial interest outstanding throughout the periods indicated)
| Year Ended December 31, | |||||||||||||||||||||||||
| 2017 | 2016 | 2015 | 2014 | 2013 | |||||||||||||||||||||
Net Asset Value, Beginning of Period | $ | 13.50 | $ | 13.49 | $ | 14.37 | $ | 13.34 | $ | 10.77 | |||||||||||||||
|
|
|
|
|
|
|
|
|
| ||||||||||||||||
Investment Activities: | |||||||||||||||||||||||||
Net Investment Income/(Loss) | 0.12 | 0.23 | 0.25 | 0.06 | 0.07 | ||||||||||||||||||||
Net Realized and Unrealized Gains/(Losses) on Investments | 1.64 | 0.48 | (0.71 | ) | 1.06 | 2.50 | |||||||||||||||||||
|
|
|
|
|
|
|
|
|
| ||||||||||||||||
Total from Investment Activities | 1.76 | 0.71 | (0.46 | ) | 1.12 | 2.57 | |||||||||||||||||||
|
|
|
|
|
|
|
|
|
| ||||||||||||||||
Dividends to Shareholders From: | |||||||||||||||||||||||||
Net Investment Income | (0.24 | ) | (0.30 | ) | (0.07 | ) | (0.05 | ) | — | ||||||||||||||||
Net Realized Gains | (0.34 | ) | (0.40 | ) | (0.35 | ) | (0.04 | ) | — | (a) | |||||||||||||||
|
|
|
|
|
|
|
|
|
| ||||||||||||||||
Total Dividends | (0.58 | ) | (0.70 | ) | (0.42 | ) | (0.09 | ) | — | (a) | |||||||||||||||
|
|
|
|
|
|
|
|
|
| ||||||||||||||||
Net Asset Value, End of Period | $ | 14.68 | $ | 13.50 | $ | 13.49 | $ | 14.37 | $ | 13.34 | |||||||||||||||
|
|
|
|
|
|
|
|
|
| ||||||||||||||||
Total Return(b) | 13.21 | % | 5.43 | % | (3.21 | )% | 8.42 | % | 23.88 | % | |||||||||||||||
Ratios to Average Net Assets/Supplemental Data: | |||||||||||||||||||||||||
Net Assets, End of Period (000’s) | $ | 551,868 | $ | 520,112 | $ | 520,844 | $ | 467,457 | $ | 298,836 | |||||||||||||||
Net Investment Income/(Loss) | 0.73 | % | 1.71 | % | 1.97 | % | 0.65 | % | 0.89 | % | |||||||||||||||
Expenses Before Reductions*(c) | 0.12 | % | 0.13 | % | 0.13 | % | 0.14 | % | 0.16 | % | |||||||||||||||
Expenses Net of Reductions* | 0.12 | % | 0.13 | % | 0.13 | % | 0.14 | % | 0.15 | % | |||||||||||||||
Portfolio Turnover Rate | 5 | % | 108 | %(d) | 2 | % | 1 | % | — | (e) | |||||||||||||||
| * | The expense ratios exclude the impact of fees/expenses paid by each underlying fund. |
| (a) | Represents less than $0.005. |
| (b) | The returns include reinvested dividends and fund level expenses, but exclude insurance contract charges. If these charges were included, the returns would have been lower. |
| (c) | Excludes fee reductions. If such fee reductions had not occurred, the ratios would have been as indicated. |
| (d) | Effective October 14, 2016, the investment strategy of the Fund changed. Costs of purchases and proceeds from sales of portfolio securities associated with the changes in investment strategy contributed to higher portfolio turnover rate for the period ended December 31, 2016 as compared to prior years. |
| (e) | Represents less than 0.5%. |
See accompanying notes to the financial statements.
7
AZL MVP Moderate Index Strategy Fund
Notes to the Financial Statements
December 31, 2017
1. Organization
The Allianz Variable Insurance Products Fund of Funds Trust (the “Trust”) was organized as a Delaware statutory trust on June 16, 2004. The Trust is a diversified open-end management investment company registered under the Investment Company Act of 1940, as amended, (the “1940 Act”) and thus is determined to be an investment company for accounting purposes. The Trust consists of 12 separate investment portfolios (collectively, the “Funds”), of which one is included in this report, the AZL MVP Moderate Index Strategy Fund (the “Fund”), and 11 are presented in separate reports.
The Fund is a “fund of funds,” which means that the Fund invests primarily in other mutual funds. Underlying Funds invest in stock, bonds, and other securities and reflect varying amounts of potential investment risk and reward. The Underlying Funds record their investments at fair value. Periodically, the Fund will adjust its asset allocation as it seeks to achieve its investment objective.
The Trust is authorized to issue an unlimited number of shares of the Fund without par value. Shares of the Fund are available through the variable annuity contracts offered through the separate accounts of participating insurance companies. Currently, the Fund only offers its shares to separate accounts of Allianz Life Insurance Company of North America and Allianz Life Insurance Company of New York, affiliates of the Trust and the Manager, as defined below.
Under the Trust’s organizational documents, its officers and trustees are indemnified against certain liabilities arising out of the performance of their duties to the Fund. In addition, in the normal course of business, the Fund may enter into contracts with its vendors and others that provide for general indemnifications. The Fund’s maximum exposure under these arrangements is unknown, as this would involve future claims that may be made against the Fund. However, based on experience, the Fund expects that risk of loss to be remote.
2. Significant Accounting Policies
The following is a summary of significant accounting policies followed by the Fund in the preparation of its financial statements. The policies conform with U.S. generally accepted accounting principles (“U.S. GAAP”). The preparation of financial statements requires management to make certain estimates and assumptions that affect the reported amounts of assets and liabilities and disclosure of contingent assets and liabilities at the date of the financial statements and the reported amounts of increases and decreases in net assets from operations during the reporting period. Actual results could differ from those estimates.
Security Valuation
The Fund records its investments at fair value. Fair value is defined as the price that would be received to sell an asset or paid to transfer a liability in an orderly transaction between willing market participants at the measurement date. The valuation techniques used to determine fair value are further described in Note 4 below.
Investment Transactions and Investment Income
Investment transactions are accounted for on trade date. Net realized gains and losses on investments sold and on foreign currency transactions are recorded on the basis of identified cost. Interest income is recorded on the accrual basis and includes, where applicable, the amortization of premiums or accretion of discounts.
Dividends to Shareholders
Dividends to shareholders are recorded on the ex-dividend date. The Fund distributes its dividends from net investment income and net realized capital gains, if any, on an annual basis. The amount of dividends from net investment income and from net realized gains is determined in accordance with federal income tax regulations, which may differ from U.S. GAAP. These “book/tax” differences are either temporary or permanent in nature. To the extent these differences are permanent in nature (e.g., miscellaneous adjustments on return of capital), such amounts are reclassified within the composition of net assets based on their federal tax-basis treatment; temporary differences (e.g., differing treatment on certain investments) do not require reclassification. Dividends to shareholders that exceed net investment income and net realized gains for tax purposes are reported as distributions of capital.
Expense Allocation
Expenses directly attributable to the Fund are charged directly to the Fund, while expenses attributable to more than one Fund are allocated among the respective Funds based upon relative net assets or some other reasonable method. Expenses which are attributable to more than one Trust are allocated across the Allianz Variable Insurance Products and Allianz Variable Insurance Products Fund of Funds Trusts based upon relative net assets or another reasonable basis. Allianz Investment Management LLC (the “Manager”), serves as the investment manager for the Trust and the Allianz Variable Insurance Products Trust.
Derivative Instruments
All open derivative positions at period end are reflected on the Fund’s Schedule of Portfolio Investments. The following is a description of the derivative instruments utilized by the Fund, including the primary underlying risk exposures related to each instrument type. The Fund’s allocation to the MVP (Managed Volatility Portfolio) risk management process may include (a) derivatives such as index futures, other futures contracts, options, and other similar securities and (b) cash, money market equivalents, short-term debt instruments, money market funds, and short-term debt funds to satisfy all applicable margin requirements and to provide additional portfolio liquidity to satisfy large redemptions and any margin calls. Due to the leverage provided by derivatives, the notional value of the Fund’s derivative positions could exceed 20% of the Fund’s value. The Fund may also use futures to gain equity exposure and may hold cash as a buffer in the event of market shocks.
Futures Contracts
During the year ended December 31, 2017, the Fund invested in futures contracts to reduce volatility and limit the need to decrease or increase allocations to underlying funds. Futures contracts are valued based upon their quoted daily settlement prices. Upon entering into a futures contract, the Fund is required to segregate liquid assets in accordance with the initial margin requirements of the broker or exchange. Futures contracts are
8
AZL MVP Moderate Index Strategy Fund
Notes to the Financial Statements
December 31, 2017
marked to market daily and a payable or receivable for the change in value (“variation margin”) is recorded by the Fund. Gains or losses are recognized but not considered realized until the contracts expire or are closed. Futures contracts involve, to varying degrees, elements of market risk (generally equity price risk related to stock futures, interest rate risk related to bond futures, and foreign currency risk related to currency futures) and exposure to loss in excess of the variation margin disclosed in the Statement of Assets and Liabilities. The primary risks associated with the use of futures contracts are the imperfect correlation between the change in fair value of the underlying securities and the prices of futures contracts, the possibility of an illiquid market, and the inability of the counterparty to meet the terms of the contract. For the year ended December 31, 2017, the monthly average notional amount for long contracts was $26.7 million. Realized gains and losses are reported as “Net realized gains/(losses) on futures contracts” on the Statement of Operations.
Summary of Derivative Instruments
The following is a summary of the fair values of derivative instruments on the Fund’s Statement of Assets and Liabilities, categorized by risk exposure, as of December 31, 2017:
Asset Derivative | Liability Derivative | |||||||||||
| Primary Risk Exposure | Statement of Assets and Liabilities Location | Total Fair Value* | Statement of Assets and Liabilities Location | Total Fair Value* | ||||||||
Equity Risk | ||||||||||||
| Equity Contracts | Receivable for variation margin on futures contracts | $ | 268,852 | Payable for variation margin on futures contracts | $ | — | ||||||
Interest Rate Risk | ||||||||||||
| Interest Rate Contracts | — | 59,643 | ||||||||||
| * | For futures contracts, the amounts represent the cumulative appreciation/depreciation of these futures contracts as reported in the Schedule of Portfolio Investments. Only current day’s variation margin is reported within the Statement of Assets and Liabilities as variation margin on futures contracts. |
The following is a summary of the effect of derivative instruments on the Statement of Operations, categorized by risk exposure, for the year ended December 31, 2017:
| Primary Risk Exposure | Location of Gains/(Losses) on Derivatives Recognized | Realized Gains/(Losses) on Derivatives Recognized | Change in Net Unrealized Appreciation/Depreciation on Derivatives Recognized | |||||||
Equity Risk | ||||||||||
| Equity Contracts | Net Realized gains/(losses) on futures contracts/Change in net unrealized appreciation/depreciation on futures contracts | $ | 2,765,341 | $ | 236,752 | |||||
Interest Rate Risk | ||||||||||
| Interest Rate Contracts | 85,096 | 3,744 | ||||||||
3. Fees and Transactions with Affiliates and Other Parties
The Manager provides investment advisory and management services for the Fund. The Manager has contractually agreed to waive fees and reimburse the Fund to limit the annual expenses, excluding interest expense (e.g., cash overdraft fees), taxes, brokerage commissions, acquired fund fees and expenses, other expenditures that are capitalized in accordance with U.S. GAAP and other extraordinary expenses not incurred in the ordinary course of the Fund’s business, based on the daily net assets of the Fund, through April 30, 2019. Expenses incurred for investment advisory and management services are reflected on the Statement of Operations as “Manager fees.”
For the year ended December 31, 2017, the annual rate paid to the Manager and the annual expense limit were as follows:
| Annual Rate | Annual Expense Limit | |||||||||
AZL MVP Moderate Index Strategy Fund | 0.10 | % | 0.15 | % | ||||||
Any amounts contractually waived or reimbursed by the Manager in a particular fiscal year will be subject to repayment by the Fund to the Manager to the extent that from time to time through the next three fiscal years the repayment will not cause the Fund’s expenses to exceed the lesser of the stated limit at the time of the waiver or the current stated limit. Any amounts recouped by the Manager during the year are reflected on the Statement of Operations as “Recoupment of prior expenses reimbursed by the Manager.” At December 31, 2017, there were no remaining contractual reimbursements that are subject to repayment by the Fund in subsequent years.
In addition, the Manager may voluntarily waive or reimburse additional fees in order to maintain more competitive expense ratios. Any voluntary waivers or reimbursements are not subject to repayment in subsequent years. Information on the total amount waived/reimbursed by the Manager or repaid to the Manager by the Fund during the period can be found on the Statement of Operations. During the year ended December 31, 2017, there were no voluntary waivers.
9
AZL MVP Moderate Index Strategy Fund
Notes to the Financial Statements
December 31, 2017
The Manager or an affiliate of the Manager serves as the investment adviser of certain underlying funds in which the Fund invests. At December 31, 2017, these underlying funds are noted as Affiliated Investment Companies in the Fund’s Schedule of Portfolio Investments. Additional information, including financial statements, about these Funds is available at www.allianzlife.com. The Manager or an affiliate of the Manager is paid a separate fee from the underlying funds for such services. A summary of the Fund’s investments in affiliated investment companies for the year ended December 31, 2017 is as follows:
| Fair Value 12/31/16 | Purchases at Cost | Proceeds from Sales | Net Realized Gains/(Losses) | Net Change in Unrealized Appreciation/ Depreciation | Fair Value 12/31/17 | Shares as of 12/31/2017 | Dividend Income | Net realized gains distributions from affiliated underlying funds | |||||||||||||||||||||||||||||||||||||
AZL Enhanced Bond Index Fund | $ | 193,101,645 | $ | 9,555,589 | $ | (707,006 | ) | $ | 2,511 | $ | 3,997,075 | $ | 205,949,814 | 18,911,829 | $ | 1,868,402 | $ | — | |||||||||||||||||||||||||||
AZL International Index Fund, Class 2 | 79,204,077 | 1,337,680 | (13,078,827 | ) | 1,310,968 | 15,328,988 | 84,102,886 | 4,861,439 | 714,496 | 623,185 | |||||||||||||||||||||||||||||||||||
AZL Mid Cap Index Fund, Class 2 | 48,078,403 | 2,901,315 | (4,900,984 | ) | 595,304 | 3,925,640 | 50,599,678 | 2,156,849 | 229,754 | 2,517,334 | |||||||||||||||||||||||||||||||||||
AZL S&P 500 Index Fund, Class 2 | 149,086,758 | 8,793,047 | (21,355,102 | ) | 2,527,490 | 18,893,226 | 157,945,419 | 9,792,028 | 1,421,816 | 6,963,743 | |||||||||||||||||||||||||||||||||||
AZL Small Cap Stock Index Fund, Class 2 | 24,769,929 | 1,807,434 | (1,986,712 | ) | 267,319 | 943,397 | 25,801,367 | 1,733,963 | 121,445 | 1,685,988 | |||||||||||||||||||||||||||||||||||
|
|
|
|
|
|
|
|
|
|
|
|
|
|
|
|
|
| ||||||||||||||||||||||||||||
| $ | 494,240,812 | $ | 24,395,065 | $ | (42,028,631 | ) | $ | 4,703,592 | $ | 43,088,326 | $ | 524,399,164 | 37,456,108 | $ | 4,355,913 | $ | 11,790,250 | ||||||||||||||||||||||||||||
|
|
|
|
|
|
|
|
|
|
|
|
|
|
|
|
|
| ||||||||||||||||||||||||||||
Pursuant to separate agreements between the Funds and the Manager, the Manager provides a Chief Compliance Officer (“CCO”) and certain compliance oversight and regulatory filing services to the Trust. Under these agreements the Manager is entitled to an amount equal to a portion of the compensation and certain other expenses related to the individuals performing the CCO and compliance oversight services, as well as $100 per hour for time incurred in connection with the preparation and filing of certain documents with the Securities and Exchange Commission (“SEC” or the “Commission”). The fees are paid to the Manager on a quarterly basis. The total expenses incurred by the Fund for these services are reflected on the Statement of Operations as “Administrative and compliance services fees.”
Citi Fund Services Ohio, Inc. (“Citi” or the “Administrator”), a wholly owned subsidiary of Citigroup, Inc., with which an officer of the Trust is affiliated, serves as the Trust’s administrator and fund accountant, and assists the Trust in all aspects of its administration and operation. The Administrator is entitled to a fee, accrued daily and paid monthly. The Administrator is entitled to an annual fee for each additional class of shares of any Fund, certain annual fees in supporting fair values services, and a Trust-wide annual fee for providing infrastructure and support in implementing the written policies and procedures comprising the Fund’s compliance program. The Administrator is also reimbursed for certain expenses incurred. The total expenses incurred by the Fund for these services are reflected on the Statement of Operations as “Administration fees.”
FIS Investor Services LLC (“FIS”) serves as the Fund’s transfer agent. Under the Transfer Agent Agreement, the Trust pays FIS a fee for its services and reimburses FIS for all of their reasonable out-of-pocket expenses incurred in providing these services.
The Bank of New York Mellon (“BNY Mellon” or the “Custodian”) serves as the Trust’s custodian and securities lending agent. For these services as custodian, the Funds pay BNY Mellon a fee based on a percentage of assets held on behalf of the Funds, plus certain out-of-pocket charges.
Allianz Life Financial Services, LLC (“ALFS”), an affiliate of the Manager, serves as distributor of the Fund. ALFS receives an annual Trust-wide annual fee of $7,500, paid by the Manager from its profits and not by the Trust, for recordkeeping and reporting services.
In addition, certain legal fees and expenses are paid to a law firm, Dorsey & Whitney LLP, of which the Secretary of the Fund is Senior Counsel. During the year ended December 31, 2017, $5,482 was paid from the Fund relating to these fees and expenses.
Certain Officers and Trustees of the Trust are affiliated with the Manager or the Administrator. Such Officers (except for the Trust’s CCO as noted above) and Trustees receive no compensation from the Trust for serving in their respective roles. For their service to the Trust and to the Allianz Variable Insurance Products Trust, each non-interested Trustee receives a $170,000 annual Board retainer, the Lead Director receives an additional $42,500 annually and the Chair of the Nominating and Corporate Governance Committee receives an additional $25,500 annually. In addition, the Trustees are reimbursed for certain expenses associated with attending Board meetings. Compensation to the Trustees is allocated between the Trust and the Allianz Variable Insurance Products Fund of Funds Trust in proportion to the assets under management of each trust. During the year ended December 31, 2017, actual Trustee compensation was $1,116,333 in total for both trusts.
4. Investment Valuation Summary
The valuation techniques employed by the Fund, as described below, maximize the use of observable inputs and minimize the use of unobservable inputs in determining fair value. The inputs used for valuing the Fund’s investments are summarized in the three broad levels listed below:
| ● | Level 1 — quoted prices in active markets for identical assets |
| ● | Level 2 — other significant observable inputs (including quoted prices for similar securities, interest rates, prepayments speeds, credit risk, etc.) |
| ● | Level 3 — significant unobservable inputs (including the Fund’s own assumptions in determining the fair value of investments) |
Changes in valuation techniques may result in transfers in or out of an assigned level within the disclosure hierarchy. The Fund determines transfers between fair value hierarchy levels at the reporting period end. The inputs or methodology used for valuing investments is not necessarily an indication of the risk associated with investing in those investments.
Investments in other investment companies are valued at their published net asset value (“NAV”). Security prices are generally provided by an independent third party pricing service approved by the Trust’s Board of Trustees (the “Board” or “Trustees”) as of the close of the New York Stock Exchange (“NYSE”) (generally 4:00 pm Eastern Time). The investments utilizing Level 1 valuations represent investments in open-end investment companies. Futures contracts are valued at the last sales price as of the close of the primary exchange and are typically categorized as Level 1 in the fair value hierarchy.
10
AZL MVP Moderate Index Strategy Fund
Notes to the Financial Statements
December 31, 2017
For the year ended December 31, 2017, there were no Level 3 investments for which significant unobservable inputs were used to determine fair value. There were no significant transfers between Levels 1 and 2 as of December 31, 2017, based on levels assigned to securities on December 31, 2016.
The following is a summary of the valuation inputs used as of December 31, 2017 in valuing the Fund’s investments based upon the three levels defined above:
| Investment Securities: | Level 1 | Level 2 | Level 3 | Total | ||||||||||||||||
Affiliated Investment Companies | $ | 524,399,164 | $ | — | $ | — | $ | 524,399,164 | ||||||||||||
|
|
|
|
|
|
|
| |||||||||||||
Total Investment Securities | 524,399,164 | — | — | 524,399,164 | ||||||||||||||||
|
|
|
|
|
|
|
| |||||||||||||
Other Financial Instruments:* | ||||||||||||||||||||
Futures Contracts | 209,209 | — | — | 209,209 | ||||||||||||||||
|
|
|
|
|
|
|
| |||||||||||||
Total Investments | $ | 524,608,373 | $ | — | $ | — | $ | 524,608,373 | ||||||||||||
|
|
|
|
|
|
|
| |||||||||||||
| * | Other Financial Instruments would include any derivative instruments, such as futures contracts. These investments are generally presented in the financial statements at variation margin. |
5. Security Purchases and Sales
For the year ended December 31, 2017, cost of purchases and proceeds from sales of securities (excluding securities maturing less than one year from acquisition) were as follows:
| Purchases | Sales | |||||||||
AZL MVP Moderate Index Strategy Fund | $ | 24,395,065 | $ | 42,028,631 | ||||||
6. Investment Risks
Derivatives Risk: The Fund may invest directly or through affiliated or unaffiliated mutual funds or unregistered investment pools in derivative instruments such as futures, options, and options on futures. A derivative is a financial contract whose value depends on, or is derived from, the value of an underlying asset, reference rate, or risk. Use of derivative instruments involves risks different from, or possibly greater than, the risks associated with investing directly in securities and other traditional investments. Derivatives are subject to a number of other risks, such as liquidity risk, interest rate risk, market risk, credit risk, and selection risk. Derivatives also involve the risk of mispricing or improper valuation and the risk that changes in the value may not correlate perfectly with the underlying asset, rate, or index. Using derivatives may result in losses, possibly in excess of the principal amount invested. Also, suitable derivative transactions may not be available in all circumstances. The other party to a derivatives contract could default.
Fund of Funds Risk: The Fund, as a shareholder of the underlying funds, indirectly bears its proportionate share of any investment management fees and other expenses of the underlying funds. Further due to the fees and expenses paid by the Fund, as well as small variations in the Fund’s actual allocations to the underlying funds and any futures and cash held in the Fund’s portfolio, the performance and income distributions of the Fund will not be the same as the performance and income distributions of the underlying funds.
7. Federal Tax Information
It is the policy of the Fund to continue to qualify as a regulated investment company by complying with the provisions available to certain investment companies, as defined under Subchapter M of the Internal Revenue Code, and to make distributions of net investment income and net realized gains sufficient to relieve it from all, or substantially all, federal income taxes. Accordingly, no provisions for federal income taxes are required in the financial statements.
Management of the Fund has reviewed tax positions taken in tax years that remain subject to examination by all major tax jurisdictions, including federal (i.e., the last four tax year ends and the interim tax period since then, as applicable). Management believes that there is no tax liability resulting from unrecognized tax benefits related to uncertain tax positions taken.
Cost of securities, including derivatives and short positions as applicable, for federal income tax purposes at December 31, 2017 is $469,108,280. The gross unrealized appreciation/(depreciation) on a tax basis is as follows:
Unrealized appreciation | $ | 55,607,338 | ||
Unrealized (depreciation) | (316,454 | ) | ||
|
| |||
Net unrealized appreciation/(depreciation) | $ | 55,290,884 | ||
|
|
The tax character of dividends paid to shareholders during the year ended December 31, 2017 were as follows:
| Ordinary Income | Net Long-Term | Total Distributions(a) | |||||||||||||
AZL MVP Moderate Index Strategy Fund | $ | 8,896,990 | $ | 12,388,171 | $ | 21,285,161 | |||||||||
| (a) | Total distributions paid may differ from the Statements of Changes in Net Assets because dividends are recognized when actually paid for tax purposes. |
11
AZL MVP Moderate Index Strategy Fund
Notes to the Financial Statements
December 31, 2017
The tax character of dividends paid to shareholders during the year ended December 31, 2016 were as follows:
| Ordinary Income | Net Long-Term | Total Distributions(a) | |||||||||||||
AZL MVP Moderate Index Strategy Fund | $ | 11,530,345 | $ | 15,559,033 | $ | 27,089,378 | |||||||||
| (a) | Total distributions paid may differ from the Statements of Changes in Net Assets because dividends are recognized when actually paid for tax purposes. |
At December 31, 2017, the components of accumulated earnings on a tax basis were as follows:
| Undistributed Ordinary Income | Undistributed Long-Term Capital Gains | Accumulated Capital and Other Losses | Unrealized Appreciation/ Depreciation(a) | Total Accumulated Earnings/ (Deficit) | |||||||||||||||||||||
AZL MVP Moderate Index Strategy Fund | $ | 9,436,216 | $ | 14,075,761 | $ | — | $ | 55,290,884 | $ | 78,802,861 | |||||||||||||||
| (a) | The difference between book-basis and tax-basis unrealized appreciation/depreciation is attributable primarily to tax deferral of losses on wash sales. |
8. Ownership and Principal Holders
The beneficial ownership, either directly or indirectly, of more than 25% of the voting securities of a fund creates presumptions of control of the fund, under section 2 (a)(9) of the 1940 Act. As of December 31, 2017, the Fund had an individual shareholder account which is affiliated with the Investment Adviser representing ownership in excess of 85% of the Fund.
9. Investment Company Reporting Modernization
In October 2016, the SEC released its Final Rule on Investment Company Reporting Modernization (the “Rules”). The Rules which introduce two new regulatory reporting forms for investment companies — Form N-PORT and Form N-CEN — also contain amendments to Regulation S-X which require standardized, enhanced disclosures about derivatives in investment company financial statements, as well as other amendments. The amendments to Regulation S-X became effective for filings made with the SEC after August 1, 2017. The compliance date for form N-PORT and Form N-CEN will vary based on the reporting entity’s size and, in the case of the Fund, is expected to be April 30, 2019. The Fund’s adoption of these amendments, as applicable for the financial statements prepared as of December 31, 2017, had no effect on the Fund’s net assets or results of operations.
10. Subsequent Events
Management of the Fund has evaluated the need for additional disclosures or adjustments resulting from events through the date the financial statements were issued. Based on this evaluation, there were no subsequent events to report that would have material impact on the Fund’s financial statements.
12
REPORT OF INDEPENDENT REGISTERED PUBLIC ACCOUNTING FIRM
To the Shareholders and Board of Trustees of
Allianz Variable Insurance Products Fund of Funds Trust:
Opinion on the Financial Statements
We have audited the accompanying statement of assets and liabilities of AZL MVP Moderate Index Strategy Fund (the “Fund”) of the Allianz Variable Insurance Products Fund of Funds Trust, including the schedule of portfolio investments, as of December 31, 2017, and the related statement of operations for the year then ended, the statements of changes in net assets for each of the years in the two-year period then ended, and the related notes (collectively, the “financial statements”) and the financial highlights for each of the years in the five-year period then ended. In our opinion, the financial statements present fairly, in all material respects, the financial position of the Fund as of December 31, 2017, the results of its operations for the year then ended, the changes in its net assets for each of the years in the two-year period then ended, and the financial highlights for each of the years in the five-year period then ended, in conformity with U.S. generally accepted accounting principles.
Basis for Opinion
These financial statements and financial highlights are the responsibility of the Fund’s management. Our responsibility is to express an opinion on these financial statements and financial highlights based on our audits. We are a public accounting firm registered with the Public Company Accounting Oversight Board (United States) (“PCAOB”) and are required to be independent with respect to the Fund in accordance with the U.S. federal securities laws and the applicable rules and regulations of the Securities and Exchange Commission and the PCAOB.
We conducted our audits in accordance with the standards of the PCAOB. Those standards require that we plan and perform the audit to obtain reasonable assurance about whether the financial statements and financial highlights are free of material misstatement, whether due to error or fraud. Our audits included performing procedures to assess the risks of material misstatement of the financial statements and financial highlights, whether due to error or fraud, and performing procedures that respond to those risks. Such procedures included examining, on a test basis, evidence regarding the amounts and disclosures in the financial statements and financial highlights. Such procedures also included confirmation of securities owned as of December 31, 2017, by correspondence with brokers and transfer agents of the underlying funds. Our audits also included evaluating the accounting principles used and significant estimates made by management, as well as evaluating the overall presentation of the financial statements and financial highlights. We believe that our audits provide a reasonable basis for our opinion.
/s/ KPMG LLP
We have served as the auditor of one or more Allianz Variable Insurance Products investment companies since 1999.
Columbus, Ohio
February 23, 2018
13
Other Federal Income Tax Information (Unaudited)
For the year ended December 31, 2017, 59.12% of the total ordinary income dividends paid by the Fund qualify for the corporate dividends received deduction available to corporate shareholders.
During the year ended December 31, 2017, the Fund declared net long-term capital gain distributions of $12,388,171.
14
A description of the policies and procedures that the Fund uses to determine how to vote proxies relating to portfolio securities is available, without charge, upon request, by visiting the Securities and Exchange Commission’s (“Commission”) website at www.sec.gov, or by calling 800-624-0197.
Information regarding how the Fund voted proxies relating to portfolio securities during the most recent 12-month period ended June 30th is available (i) without charge, upon request, by calling 800-624-0197; (ii) on the Allianz Variable Insurance Products Trust’s website at https://www.allianzlife.com; and (iii) on the Commission’s website at http://www.sec.gov.
The Fund files complete Schedules of Portfolio Holdings with the Commission for the first and third quarters of each fiscal year on Form N-Q. Schedules of Portfolio Holdings for the Fund in this report are available without charge on the Commission’s website at http://www.sec.gov, or may be reviewed and copied at the Commission’s Public Reference Room in Washington, D.C. Information on the operation of the Public Reference Room may be obtained by calling 800-SEC-0330.
15
Approval of Investment Advisory Agreement (Unaudited)
Subject to the general supervision of the Board of Trustees (the “Board”) and in accordance with the investment objectives and restrictions of each separate series (together, the “Funds”) of the Allianz Variable Insurance Products Fund of Funds Trust (the “Trust”), investment advisory services are provided to the Funds by Allianz Investment Management LLC (the “Manager”). As used in this section, “Fund” refers to any of the Funds. The Manager manages each Fund pursuant to an investment management agreement (the “Management Agreement”) with the Trust in respect of each such Fund. The Management Agreement provides that the Manager, subject to the supervision and approval of the Board, is responsible for the management of each Fund. For management services, each Fund pays the Manager an investment advisory fee based upon each Fund’s average daily net assets. The Manager has contractually agreed to limit the expenses of each Fund by reimbursing the Fund if and when total Fund operating expenses exceed certain amounts until at least May 1, 2019 (the “Expense Limitation Agreement”).
In reviewing the services provided by the Manager and the terms of the Management Agreement, the Board receives and reviews information related to the Manager’s experience and expertise in the variable insurance marketplace. Currently, the Funds are offered only through variable annuities and variable life insurance policies, and not in the retail fund market. In addition, the Board receives information regarding the Manager’s expertise with regard to portfolio diversification and asset allocation requirements within variable insurance products issued by Allianz Life Insurance Company of North America (“Allianz Life”) and its subsidiary, Allianz Life Insurance Company of New York (“Allianz of New York”). Currently, the Funds are offered only through Allianz Life and Allianz of New York variable products.
As required by the Investment Company Act of 1940 (the “1940 Act”), the Board has reviewed and approved the Management Agreement with the Manager. The Board’s decision to approve this contract reflects the exercise of its business judgment on whether to approve new arrangements and continue the existing arrangements. During its review of the contract, the Board considered many factors, among the most material of which are: the Fund’s investment objectives and long-term performance; the Manager’s management philosophy, personnel, processes and investment performance, including its compliance history and the adequacy of its compliance processes; the preferences and expectations of Fund shareholders (and underlying contract owners) and their relative sophistication; the continuing state of competition in the mutual fund industry; and comparable fees in the mutual fund industry.
The Board also considered the compensation and benefits received by the Manager. This includes fees received for services provided to a Fund by employees of the Manager or of affiliates of the Manager and research services received by the Manager from brokers that execute Fund trades, as well as advisory fees. The Board considered the fact that: (1) the Manager and the Trust are parties to an Administrative Services Agreement and a Compliance Services Agreement, under which the Manager is compensated by the Trust for performing certain administrative and compliance services including providing an employee of the Manager or one of its affiliates to act as the Trust’s Chief Compliance Officer; and (2) Allianz Life Financial Services, LLC, an affiliated person of the Manager, is a registered securities broker-dealer and received (along with its affiliated persons) payments made by the underlying funds pursuant to Rule 12b-1.
The Board is aware that various courts have interpreted provisions of the 1940 Act and have indicated in their decisions that the following factors may be relevant to an adviser’s compensation: the nature and quality of the services provided by the adviser, including the performance of the fund; the adviser’s cost of providing the services; the extent to which the adviser may realize “economies of scale” as the fund grows larger; any indirect benefits that may accrue to the adviser and its affiliates as a result of the adviser’s relationship with the fund; performance and expenses of comparable funds; the profitability of acting as adviser to the fund; and the extent to which the independent Board members, who are not “interested persons” of a fund as defined by the 1940 Act, are fully informed about all facts bearing on the adviser’s services and fees. The Board is aware of these factors and takes them into account in its review of the Management Agreement for the Funds.
The Board considered and weighed these circumstances in light of its experience in governing the Trust, and is assisted in its deliberations by the advice of independent legal counsel to the independent Trustees. In this regard, the Board requests and receives a significant amount of information about the Funds and the Manager. Some of this information is provided at each regular meeting of the Board; additional information is provided in connection with the particular meeting or meetings at which the Board’s formal review of an advisory contract occurs. In between regularly scheduled meetings, the Board may receive information on particular matters as the need arises. Thus, the Board’s evaluation of the Management Agreement is informed by reports covering such matters as: the Manager’s investment philosophy, personnel and processes, and the Fund’s investment performance (in absolute terms as well as in relationship to its benchmark). In connection with comparing the performance of each Fund versus its benchmark, the Board receives reports on the extent to which the Fund’s performance may be attributed to various applicable factors, such as asset class allocation decisions and volatility management strategies, the performance of the underlying funds, rebalancing decisions, and the impact of cash positions and Fund fees and expenses. The Board also receives reports on the Funds’ expenses (including the advisory fee itself and the overall expense structure of the Funds, both in absolute terms and relative to similar and/or competing funds, with due regard for the Expense Limitation Agreement and additional voluntary expense limitations); the nature and extent of the advisory and other services provided to the Fund by the Manager and its affiliates; compliance and audit reports concerning the Funds and the companies that service them; and relevant developments in the mutual fund industry and how the Funds and/or the Manager are responding to them.
The Board also receives financial information about the Manager, including reports on the compensation and benefits the Manager derives from its relationships with the Funds. These reports cover not only the fees under the Management Agreement, but also fees, if any, received for providing other services to the Funds. The reports also discuss any indirect or “fall out” benefits the Manager or its affiliates may derive from its relationship with the Funds.
The Management Agreement was most recently considered at Board meetings held in the fall of 2017. Information relevant to the approval of the Management Agreement was considered at a telephonic Board meeting on October 18, 2017, and at an “in person” Board meeting held October 23, 2017. The Management Agreement was approved at the Board meeting of October 23, 2017. At such meeting the Board also approved the Expense Limitation Agreement between the Manager and the Trust for the period ending April 30, 2019. In connection with such meetings, the Trustees requested and evaluated extensive materials from the Manager, including performance and expense information for other investment companies with similar investment objectives derived from data compiled by an independent third party provider and other sources believed to be reliable by the Manager. Prior to voting, the Trustees reviewed the proposed approval/continuance of the Agreement with management and with experienced counsel who are independent of the Manager and received a memorandum from such counsel discussing the legal standards for their consideration of the proposed approvals/continuances. The independent Trustees also discussed the proposed approvals/continuances in a private session with such counsel at which no representatives of the Manager were present. In reaching their determinations relating to the approval and/or continuance of the Agreement, in respect of each Fund, the Board considered all factors it believed relevant. The Board based its decision to approve the Management Agreement on the totality of the circumstances and relevant factors, and with a view to past and future long-term considerations. Not all of the factors and considerations discussed above and below are necessarily relevant to every Fund, and the Board did not assign relative weights to factors discussed herein or deem any one or group of them to be controlling in and of themselves.
An SEC rule requires that shareholder reports include a discussion of certain factors relating to the selection of the investment adviser and the approval of the advisory fee. The “factors” enumerated by the SEC are set forth below in italics, as well as the Board’s conclusions regarding such factors:
(1) The nature, extent and quality of services provided by the Manager. The Trustees noted that the Manager, subject to the control of the Board, administers each Fund’s business and other affairs. The Trustees noted that the Manager also provides the Trust and each Fund with such administrative and other services (exclusive of, and in addition to, any such services provided by any others retained by the Trust on behalf of the Funds) and executive and other personnel as are necessary for the operation of the Trust and the Funds. Except for the Trust’s Chief Compliance Officer and certain compliance staff, the Manager pays all of the compensation of Trustees and officers of the Trust who are employees of the Manager or its affiliates.
16
The Board considered the scope and quality of services provided by the Manager and noted that the scope of such services provided had expanded as a result of recent regulatory and other developments. The Board noted that, for example, the Manager is responsible for maintaining and monitoring its own compliance program, and this compliance program has been continuously refined and enhanced in light of new regulatory requirements. The Board considered the capabilities and resources which the Manager has dedicated to performing services on behalf of the Trust and its Funds. The quality of administrative and other services, including the Manager’s role in coordinating the activities of the Trust’s other service providers, also were considered. The Board concluded that, overall, they were satisfied with the nature, extent and quality of services provided (and expected to be provided) to the Trust and to each of the Funds under the Management Agreement.
(2) The investment performance of the Funds and the Manager. In connection with every in-person quarterly Board meeting and the fall 2017 contract review process, Trustees received extensive information on the performance results of each Fund. This included, for example, performance information on absolute total return, performance versus the appropriate benchmark(s), the contribution to performance of the Manager’s asset class allocation decisions and volatility management strategies, the performance of the underlying funds, and the impact on performance of rebalancing decisions, cash and Fund fees. This included Lipper performance information on the Funds for the previous quarter, year-to-date, and previous one-, three- and five-year periods, to the extent the Funds were in existence for such periods. (For Funds which have been in existence for less than five years, the Board received performance information on shorter time periods to the extent available.) For example, in connection with the Board meeting held October 23, 2017, the Manager reported that for the five Funds for which performance information for the five year period ended June 30, 2017 was available, two were in the top 40%, two were in the middle 20%, and one was in the bottom 40%. None of these Funds was in the bottom 40% for the three- or one-year periods. The Manager reported that for the three-year period ended June 30, 2017, for the six Funds for which three year performance information was available, four Funds were in the top 40% and two Funds were in the middle 20%. For the eight Funds for which one-year performance information was available, for the one-year period ended June 30, 2017, four Funds were in the top 40%, two Funds were in the middle 20%, and two Funds were in the bottom 40%.
At the Board meeting held October 23, 2017, the Manager also reported upon the performance of the MVP Funds compared to custom managed-volatility peer groups. For the seven Funds for which three-year performance information was available, for the three-year period ended June 30, 2017, five Funds were in the top 40%, one Fund was in the middle 20%, and one was in the bottom 40%. For the eight Funds for which one year performance was available, for the one-year period ended June 30, 2017, four Funds were in the top 40% and four Funds were in the middle 20%. All six Funds for which five-year performance information was available were in the top 40%.
At the Board meeting held October 23, 2017, the Trustees determined that the investment performance of the Funds was acceptable.
(3) The costs of services to be provided and profits to be realized by the Manager and its affiliates from the relationship with the Funds. The Board considered that the Manager receives an advisory fee from each of the Funds. The Manager reported that for the three MVP Fusion Dynamic Funds the advisory fee paid put these Funds in the 44th percentile of the customized peer group. The Manager reported that for three MVP Index Strategy Funds the advisory fee paid put them in the 27th percentile of the customized peer group, and for the two non-MVP Index Strategy Funds, as well as the AZL DFA Multi-Strategy Fund, the advisory fee paid put them in the 13th percentile of the customized peer group. The Manager reported that for the AZL MVP BlackRock Global Strategy Plus, AZL MVP DFA Multi-Strategy, AZL MVP Pyramis Multi-Strategy, and AZL MVP T. Rowe Price Capital Appreciation Plus Funds, the advisory fee paid was in the 9th percentile. (A lower percentile reflects lower fund fees and is better for fund shareholders.) Trustees were provided with information on the total expense ratios of the Funds and other funds in the customized peer groups, and the Manager reported upon the challenges in making peer group comparisons for the Funds.
The Manager provided information concerning the profitability of the Manager’s investment advisory activities for the period from 2014 through June 30, 2017. The Board recognized that it is difficult to make comparisons of profitability from investment company advisory agreements because comparative information is not generally publicly available and is affected by numerous factors, including the structure of the particular adviser, the types of funds it manages, its business mix, numerous assumptions regarding allocation of expenses and the adviser’s capital structure and cost of capital. In considering profitability information, the Board considered the possible effect of certain fall-out benefits to the Manager and its affiliates. The Board focused on profitability of the Manager’s relationships with the Funds before taxes and distribution expenses. The Board recognized that the Manager should earn a reasonable level of profits for the services it provides to each Fund.
The Board also considered that Wilshire Funds Management (“Wilshire”) serves as a consultant to the Manager in preparing statistical and other factual information for use in the creation and maintenance of the asset allocation models for the Fusion Funds (the AZL MVP Fusion Dynamic Conservative, Balanced, and Moderate Funds), pursuant to an agreement between the Manager and Wilshire. Wilshire serves as a consultant to the Manager with respect to selecting the Fusion Funds’ underlying funds and the asset allocations among the underlying funds. The Manager, not any Fund, pays a consultant fee to Wilshire.
Based upon the information provided, the Board concluded that the Funds’ advisory fees and expense ratios are not unreasonable, and determined that there was no evidence that the Manager’s level of profitability from its relationship with the Funds was excessive.
(4) and (5) The extent to which economies of scale would be realized as the Funds grow, and whether fee levels reflect these economies of scale. The Board noted that the advisory fee schedules for the Funds do not contain breakpoints that reduce the fee rate on assets above specified levels. The Board recognized that breakpoints may be an appropriate way for the Manager to share its economies of scale, if any, with Funds that have substantial assets. The Board found there was no uniform methodology for establishing breakpoints that give effect to Fund-specific services provided by the Manager. The Board noted that in the fund industry as a whole, as well as among funds similar to the Funds, there is no uniformity or pattern in the fees and asset levels at which breakpoints (if any) apply. Depending on the age, size, and other characteristics of a particular fund and its manager’s cost structure, different conclusions can be drawn as to whether there are economies of scale to be realized at any particular level of assets, notwithstanding the intuitive conclusion that such economies exist, or will be realized at some level of total assets. Moreover, because different managers have different cost structures and service models, it is difficult to draw meaningful conclusions from the breakpoints that may have been adopted by other funds. The Board also noted that the advisory agreements for many funds do not have breakpoints at all, or if breakpoints exist, they may be at asset levels significantly greater than those of the individual Funds. The Board also noted that the total assets in all of the Funds, as of June 30, 2017, were approximately $10.8 billion and that the largest Fund, the AZL MVP Growth Index Strategy Fund, had assets of approximately $2.4 billion.
The Board noted that the Manager has agreed to temporarily limit Fund expenses under the Expense Limitation Agreement, which has the effect of reducing expenses as would the implementation of advisory fee breakpoints. The Manager has committed to continue to consider the continuation of expense limits and/or advisory fee breakpoints as the Funds grow larger. The Board receives quarterly reports on the level of Fund assets. The Board expects to continue to consider: (a) the extent to which economies of scale have been realized, and (b) whether the advisory fee should be modified, either in connection with the next renewal of the Agreements or by modifying the Expense Limitation Agreement, to reflect such economies of scale, if any.
Having taken these factors into account, the Board concluded that the absence of breakpoints in the Funds’ advisory fee rate schedules was acceptable under each Fund’s circumstances.
17
Information about the Board of Trustees and Officers (Unaudited)
The Trust is managed by the Trustees in accordance with the laws of the state of Delaware governing business trusts. There are currently eight Trustees, one of whom is an “interested person” of the Trust within the meaning of that term under the 1940 Act. The Trustees and Officers of the Trust, and their addresses, ages, positions held with the Trust, terms of office with the Trust and length of time served, principal occupation(s) during the past five years, the number of portfolios in the Trust they oversee, and other directorships held during the past five years are as follows:
Non-Interested Trustees(1)
| Name, Address, and Year of Birth | Positions Held with Allianz VIP and VIP FOF Trust | Term of Office(2)/Length of Time Served | Principal Occupation(s) During Past 5 Years | Number of Portfolios Overseen for Allianz VIP and VIP FOF Trust | Other AZL Fund Complex | |||||
| Peter R. Burnim (1947) 5701 Golden Hills Drive Minneapolis, MN 55416 | Trustee | Since 2/07 | Consultant/Chair, various companies: Chairman, Emrys Analytics and subsidiaries, July 2015 to present; Chairman, Argus Investment Strategies Fund Ltd., February 2013 to 2017; Managing Director, iQ Venture Advisors, LLC, 2005 to present; Chairman, Northstar Group Holdings Ltd. Bermuda, 2011 to present; Chairman Sterling Bank & Trust (Bahamas) Ltd., 2016 to present, and Expert Witness, Massachusetts Department of Revenue, 2011 to 2016. | 35 | Argus Group Holdings and Subsidiaries; Northstar Group Holdings; Sterling Trust (Cayman) Ltd.; Sterling Bank & Trust Limited (Bahamas); Emrys Analytics; EGB Insurance. | |||||
| Peggy L. Ettestad (1957) 5701 Golden Hills Drive Minneapolis, MN 55416 | Lead Independent Trustee | Since 10/14 (Trustee since 2/07) | Managing Director, Red Canoe Management Consulting LLC, 2008 to present | 35 | Luther College | |||||
| Tamara Lynn Fagely (1958) 5701 Golden Hills Drive Minneapolis, MN 55416 | Trustee | Since 12/17 | Retired; Chief Operations Officer, Hartford Funds, March 2012 to December 2013 | 35 | Diamond Hill Funds (13 funds) | |||||
| Richard H. Forde (1953) 5701 Golden Hills Drive Minneapolis, MN 55416 | Trustee | Since 12/17 | Member of the Board and Chairman of the Finance and Investment Committee, Connecticut Water Service, Inc., October 2013 to present; Senior Vice President and Chief Investment Officer, CIGNA, 2004 to 2012 | 35 | Connecticut Water Service, Inc. | |||||
| Claire R. Leonardi (1955) 5701 Golden Hills Drive Minneapolis, MN 55416 | Trustee | Since 2/04 | Chief Executive Officer, Health eSense Inc., 2015 to Present; CEO, Connecticut Innovations, Inc., 2012 to 2015; General Partner, Fairview Capital, L.P., 1994 to 2012 | 35 | reSet Social Enterprise Investment Fund | |||||
| Dickson W. Lewis (1948) 5701 Golden Hills Drive Minneapolis, MN 55416 | Trustee | Since 2/04 | Retired; Vice President/General Manager, Yearbooks & Canada-Lifetouch National School Studios, 2006 to 2014; Vice President/General Manager of Jostens, Inc., 2002 to 2006; Senior Vice President of Fortis Group, 1997 to 2002 | 35 | None | |||||
| Arthur C. Reeds, III (1944) 5701 Golden Hills Drive Minneapolis, MN 55416 | Trustee | Since 10/99 | Retired; Senior Investment Officer, Hartford Foundation for Public Giving, 2000 to 2003; Chairman, Chief Executive and President of Conning Corp., 1999 to 2000 | 35 | Connecticut Water Service, Inc. |
Interested Trustees(3)
| Name, Address, and Year of Birth | Positions Held with Allianz VIP and VIP FOF Trust | Term of Office(2)/Length of Time Served | Principal Occupation(s) During Past 5 Years | Number of Portfolios Overseen for Allianz VIP and VIP FOF Trust | Other AZL Fund Complex | |||||
Brian Muench (1970) 5701 Golden Hills Drive | Trustee | Since 6/11 | President, Allianz Investment Management LLC, November 2010 to present; Vice President, Allianz Life, April 2011 to present | 35 | None |
18
Officers
| Name, Address, and Age | Positions Held with Allianz VIP and VIP FOF Trust | Term of Office(2)/Length of Time Served | Principal Occupation(s) During Past 5 Years | |||
Brian Muench (1970) 5701 Golden Hills Drive | President | Since 11/10 | President, Allianz Investment Management LLC, November 2010 to present; Vice President, Allianz Life, April 2011 to present. | |||
| Michael Radmer (1945) Dorsey & Whitney LLP, Suite 1500 50 South Sixth Street Minneapolis, MN 55402-1498 | Secretary | Since 02/02 | Senior Counsel (previously, Partner), Dorsey and Whitney LLP since 1976. | |||
| Bashir C. Asad (1963) Citi Fund Services Ohio, Inc. 4400 Easton Commons, Suite 200 Columbus, OH 43219 | Treasurer, Principal Accounting Officer and Principal Financial Officer | Since 06/16 | Senior Vice President, Citi Fund Services Ohio, Inc. | |||
| Chris R. Pheiffer (1968) 5701 Golden Hills Drive Minneapolis, MN 55416 | Chief Compliance Officer(4) and Anti-MoneyLaundering Compliance Officer | Since 02/14 | Chief Compliance Officer of the VIP Trust and the FOF Trust, February 2014 to present; Deputy Chief Compliance Officer of the VIP Trust and the FOF Trust and Compliance Director, Allianz Life, February 2007 to February 2014. |
| (1) | Member of the Audit Committee. |
| (2) | Indefinite. |
| (3) | Is an “interested person”, as defined by the 1940 Act, due to employment by Allianz. |
| (4) | The Manager and the Trust are parties to a Chief Compliance Officer Agreement under which the Manager is compensated by the Trust for providing an employee of the Manager or one of its affiliates to act as the Trust’s Chief Compliance Officer. The Chief Compliance Officer and Anti-Money Laundering Compliance Officer is not considered a corporate officer or executive employee of the Trust. |
19
The Allianz VIP Fund of Funds are distributed by Allianz Life Financial Services, LLC. These Funds are not FDIC Insured. | ANNRPT1217 2/18 |
AZL® MVP Pyramis® Multi-Strategy Fund
Annual Report
December 31, 2017
Table of Contents
Management Discussion and Analysis
Page 1
Expense Examples and Portfolio Composition
Page 3
Schedule of Portfolio Investments
Page 4
Statement of Assets and Liabilities
Page 5
Page 5
Statements of Changes in Net Assets
Page 6
Page 7
Notes to the Financial Statements
Page 8
Report of Independent Registered Public Accounting Firm
Page 13
Other Federal Income Tax Information
Page 14
Page 15
Approval of Investment Advisory Agreement
Page 16
Information about the Board of Trustees and Officers
Page 18
This report is submitted for the general information of the shareholder of the Fund. The report is not authorized for distribution to prospective investors in the Fund unless preceded or accompanied by an effective prospectus, which contains details concerning the sales charges and other pertinent information.
AZL® MVP Pyramis® Multi-Strategy Fund Review (Unaudited)
Allianz Investment Management LLC
serves as the Manager for the AZL®
MVP Pyramis® Multi-Strategy Fund.
What factors affected the Fund’s performance for year ended December 31, 2017?
For the year ended December 31, 2017, the AZL® MVP Pyramis® Multi-Strategy Fund (the “Fund”) returned 10.93%. That compared to a 21.83%, 3.54% and a 10.61% total return for its benchmarks, the S&P 500 Index1, the Bloomberg Barclays U.S. Aggregate Bond Index1, and the Balanced Composite Index1, respectively.
The Fund currently invests in one underlying fund, the AZL® Pyramis® Multi-Strategy Fund. Approximately 60% of the underlying fund’s assets are managed by its subadviser, FIAM LLC, investing primarily in investment-grade fixed-income securities, and approximately 40% of the underlying fund’s assets are managed by its sub-subadviser, Geode Capital Management, LLC, investing in primarily in large-cap common stocks. The Fund also employs the MVP (Managed Volatility Portfolio) risk management process, which is intended to adjust the risk of the portfolio based on quantitative indicators of market risk, such as the current level of fund and market volatility.*
Global economic expansion led major stock indexes to new all-time highs during the 12-month period under review. The S&P 500 Index gained 21.83% during the period, supported by a positive economic environment marked by solid jobs growth, low unemployment, increased business investment, strong consumer confidence and a low-volatility environment. Mid- and small-cap stocks also performed well during the period: The S&P MidCap 400 Index2 generated a 16.24% return and the SmallCap 600 Index3 returned 13.23%. Growth stocks were also heavily favored during the year and significantly outperformed value stocks.
The U.S. bond market was generally positive, as the market rewarded investors who took on interest rate and spread risk. The Bloomberg Barclays U.S. Aggregate Bond Index gained 3.54%. Bond investors generally tolerated risk in their quest for more attractive yields. Credit spreads on corporate bonds ended the year tighter than when the year began, with high-yield bond spreads tightening markedly. Meanwhile, the yield curve flattened sharply, as three rate hikes by the Federal Reserve sent short-term yields higher, while investor demand for attractive yield pushed long-term yields lower.
The Fund outperformed its composite benchmark during the period under review, due mostly to strong performance within the fixed income component.
Strategic allocation decisions added to the Fund’s relative performance, including an overweight position in information technology and an underweight position in energy. Stock selection within the industrials and energy sectors also added to relative results, even as security selection, overall, detracted from relative performance within the equity component.*
Stock selection in the information technology and consumer discretionary sectors weighed on relative results. The Fund’s value-oriented investment style also acted as a headwind for relative performance during most of 2017, as value stocks generally underperformed their growth counterparts.*
The Fund’s fixed income component performed well in 2017 relative to its benchmark, benefiting from strong security selection as well as sector selection. An overweight position in high-yield and investment-grade corporate bonds helped boost relative performance as those assets outperformed as spreads tightened. The Fund’s overweight positions in emerging markets bonds and taxable municipal bonds also contributed to performance. The Fund’s underweight position in investment grade industrial bonds detracted from the Fund’s performance relative to its benchmark.*
The Fund held futures to equitize its cash positions during the period. The exposure to this form of derivatives did not materially impact the Fund’s performance.*
The MVP risk management process, which includes the use of derivatives, worked as intended during the period under review. Given that the period was marked by low volatility, the MVP maintained a neutral equity allocation for the year relative to its target. The MVP process detracted slightly due to mismatches between the hedging instruments used and the target equity and fixed income exposure.*
Past performance does not guarantee future results.
| * | The Fund’s portfolio composition is subject to change. There is no guarantee that any sectors mentioned will continue to perform well or that securities in such sectors will be held by the Fund in the future. The information contained in this commentary is for informational purposes only and should not be construed as a recommendation to purchase or sell securities in the sector mentioned. The Fund’s holdings and weightings are as of December 31, 2017. |
| 1 | For a complete description of the Fund’s performance benchmarks please refer to page 2 of this report. |
| 2 | The Standard & Poor’s MidCap 400 Index (“S&P 400”) is the most widely used index for mid-sized companies. The S&P 400 covers 7% of the U.S. equities market, and is part of a series of S&P U.S. indices that can be used as building blocks for portfolio composition. |
| 3 | The Standard & Poor’s SmallCap 600 Index (“S&P 600”) covers approximately 3% of the domestic equities market. Measuring the small-cap segment of the market that is typically renowned for poor trading liquidity and financial instability, the index is designed to be an efficient portfolio of companies that meet specific inclusion criteria to ensure that they are investable and financially viable. |
1
AZL® MVP Pyramis® Multi-Strategy Fund Review (Unaudited)
Fund Objective
The Fund’s investment objective is to seek a high level of current income while maintaining prospects for capital appreciation. This objective may be changed by the Trustees of the Fund without shareholder approval. The Fund seeks to achieve its objective by investing primarily in shares of another mutual fund managed by the manager, the AZL® Pyramis® Multi-Strategy Fund, combined with the MVP risk management process.
Investment Concerns
The Fund invests in an underlying fund, so its investment performance is directly related to the performance of that underlying fund. Before investing, investors should assess the risks associated with and types of investments made by of the underlying fund in which the Fund invests.
Emerging market investing may be subject to additional economic, political, liquidity, and currency risks not associated with more developed countries.
Mortgage-backed investments involve risk of loss due to prepayments and, like any bond, due to default. Because of the sensitivity of mortgage-related securities to changes in interest rates, the Fund’s performance may be more volatile than if it did not hold these securities.
International investing may involve risk of capital loss from unfavorable fluctuations in currency values, from differences in generally accepted accounting principles or from economic or political instability in other nations.
Bonds offer a relatively stable level of income, although bond prices will fluctuate, providing the potential for principal gain or loss.
Debt securities held by the Fund may decline in value due to rising interest rates. Interest rates in the U.S. are at, or near, historic lows, which may increase the Fund’s exposure to risks related to rising rates.
Investing in derivatives instruments involves risks that may be different from or greater than the risk associated with investing directly in securities or other traditional instruments.
For a complete description of these and other risks associated with investing in a mutual Fund, please refer to the Fund’s prospectus.
Growth of $10,000 Investment

The chart above represents a comparison of a hypothetical investment in the Fund versus a similar investment in the Fund’s benchmark as well as the two component indices of the Fund’s benchmark, and represents the reinvestment of dividends and capital gains in the Fund.
Average Annual Total Returns as of December 31, 2017
| 1 Year | 3 Year | 5 Year | Since Inception (4/30/12) | |||||||||||||
AZL® MVP Pyramis® Multi-Strategy Fund | 10.93 | % | 1.60 | % | 4.80 | % | 5.44 | % | ||||||||
S&P 500 Index | 21.83 | % | 11.41 | % | 15.79 | % | 14.53 | % | ||||||||
Bloomberg Barclays U.S. Aggregate Bond Index | 3.54 | % | 2.24 | % | 2.10 | % | 2.34 | % | ||||||||
Balanced Composite Index | 10.61 | % | 5.92 | % | 7.51 | % | 7.18 | % | ||||||||
Past performance does not guarantee future results. The performance data quoted represents past performance and current returns may be lower or higher. The investment return and principal value will fluctuate so that an investor’s shares, when redeemed may be worth more or less than the original cost. To obtain performance information current to the most recent month end, please visit www.Allianzlife.com.
Expense Ratio | Gross | |||
AZL® MVP Pyramis Multi-Strategy Fund | 0.81 | % | ||
The above expense ratio is based on the current Fund prospectus dated May 1, 2017. The Manager and the Fund have entered into a written contract limiting operating expenses, excluding certain expenses (such as interest expense and acquired fund fees and expenses), to 0.15% through April 30, 2019. Additional information pertaining to the December 31, 2017 expense ratios can be found in the financial highlights.
Acquired fund fees and expenses are incurred indirectly by the Fund through the valuation of the Fund’s investments in the other investment companies. Accordingly, acquired fund fees and expenses affect the Fund’s total returns. Because these fees and expenses are not included in the Fund’s financial highlights, the Fund’s total annual fund operating expenses, as shown in the current prospectus, do not correlate to the ratios of expenses to average net assets shown in the financial highlights table. Without acquired fund fees and expenses the Fund’s gross expense ratio would be 0.13%.
The total return of the Fund does not reflect the effect of any insurance charges, the annual maintenance fee or the deduction of taxes that a shareholder would pay on Fund distributions or the redemption of Fund shares. Such charges, fees and tax payments would reduce the performance quoted.
The Fund’s performance is measured against the Standard & Poor’s 500 Index (“S&P 500”), the Bloomberg Barclays U.S. Aggregate Bond Index and the Balanced Composite Index (“Composite”). The S&P 500 is representative of 500 selected common stocks, most of which are listed on the New York Stock Exchange, and is a measure of the U.S. Stock market as a whole. The Bloomberg Barclays U.S. Aggregate Bond Index is a market value-weighted performance benchmark for investment-grade fixed-rate debt issues, including government, corporate, asset-backed, and mortgage-backed securities, with maturities of at least one year. The Composite is a blended index comprised of (40%) S&P 500 and (60%) Bloomberg Barclays U.S. Aggregate Bond Index. These indexes are unmanaged and do not reflect the deduction of fees associated with a mutual fund, such as investment management and fund accounting fees. The Fund’s performance reflects the deduction of fees for services provided to the Fund. Investors cannot invest directly in an index.
2
AZL MVP Pyramis® Multi-Strategy Fund
(Unaudited)
As a shareholder of the AZL MVP Pyramis® Multi-Strategy Fund (the “Fund”), you incur ongoing costs, including management fees, distribution fees, and other Fund expenses. These examples are intended to help you understand your ongoing costs (in dollars) of investing in the Fund and to compare these costs with the ongoing costs of investing in other mutual funds. Please note that the expenses shown in each table do not reflect expenses that apply to the subaccount or the insurance contract. If the expenses that apply to the subaccount of the insurance contract were included, your costs would have been higher.
These examples are based on an investment of $1,000 invested at the beginning of the period and held for the periods presented below.
The Actual Expense table below provides information about actual account values and actual expenses. You may use the information below, together with the amount you invested, to estimate the expenses that you paid over the period. Simply divide your account value by $1,000 (for example, an $8,600 account value divided by $1,000 = 8.6), then multiply the result by the number in the table under the heading entitled “Expenses Paid During Period” to estimate the expenses you paid on your account during this period.
| Beginning Account Value 7/1/17 | Ending Account Value 12/31/17 | Expenses Paid During Period 7/1/17 - 12/31/17* | Annualized Expense Ratio During Period 7/1/17 - 12/31/17 | |||||||||||||||||
AZL MVP Pyramis® Multi-Strategy Fund | $ | 1,000.00 | $ | 1,061.10 | $ | 0.68 | 0.13 | % | ||||||||||||
The Hypothetical Expense table below provides information about hypothetical account values and hypothetical expenses based on the Fund’s actual expense ratio and an assumed rate of return of 5% per year before expenses, which is not the Fund’s actual return. The hypothetical account values and expenses may not be used to estimate the actual ending account balance or expenses you paid for the period. You may use this information to compare this 5% hypothetical example with the 5% hypothetical examples that appear in the shareholder reports of other funds.
| Beginning Account Value 7/1/17 | Ending Account Value 12/31/17 | Expenses Paid During Period 7/1/17 - 12/31/17* | Annualized Expense Ratio During Period 7/1/17 - 12/31/17 | |||||||||||||||||
AZL MVP Pyramis® Multi-Strategy Fund | $ | 1,000.00 | $ | 1,024.55 | $ | 0.66 | 0.13 | % | ||||||||||||
| * | Expenses are equal to the average account value over the period, multiplied by the Fund’s annualized expense ratio, multiplied by 184/365 (to reflect the one half year period). |
Portfolio Composition
(Unaudited)
| Investments | Percent of Net Assets | ||||
Balanced | 94.9 | ||||
|
| ||||
Total Investment Securities | 94.9 | ||||
Net other assets (liabilities) | 5.1 | ||||
|
| ||||
Net Assets | 100.0 | % | |||
|
| ||||
3
AZL MVP Pyramis® Multi-Strategy Fund
Schedule of Portfolio Investments
December 31, 2017
| Shares | Fair Value | |||||||
| Affiliated Investment Company (94.9%): | ||||||||
| 19,539,935 | AZL Pyramis® Multi-Strategy Fund | $ | 260,858,132 | |||||
|
| |||||||
Total Affiliated Investment Company (Cost $248,304,827) | 260,858,132 | |||||||
|
| |||||||
Total Investment Securities (Cost $248,304,827)(a) — 94.9% | 260,858,132 | |||||||
Net other assets (liabilities) — 5.1% | 13,984,919 | |||||||
|
| |||||||
Net Assets — 100.0% | $ | 274,843,051 | ||||||
|
| |||||||
Percentages indicated are based on net assets as of December 31, 2017.
| (a) | See Federal Tax Information listed in the Notes to the Financial Statements. |
Futures Contracts
Cash of $13,738,482 has been segregated to cover margin requirements for the following open contracts as of December 31, 2017:
Long Futures
| Description | Expiration Date | Number of Contracts | Notional Amount | Unrealized Appreciation/ (Depreciation) | ||||||||||||
S&P 500 Index E-Mini March Futures (U.S. Dollar) | 3/19/18 | 40 | $ | 5,352,000 | $ | 88,148 | ||||||||||
U.S. Treasury 10-Year Note March Futures (U.S. Dollar) | 3/21/18 | 66 | 8,187,094 | (44,927 | ) | |||||||||||
|
| |||||||||||||||
| $ | 43,221 | |||||||||||||||
|
| |||||||||||||||
See accompanying notes to the financial statements.
4
AZL MVP Pyramis® Multi-Strategy Fund
Statement of Assets and Liabilities
December 31, 2017
Assets: | |||||
Investments in affiliates, at cost | $ | 248,304,827 | |||
|
| ||||
Investments in affiliates, at value | $ | 260,858,132 | |||
Segregated cash for collateral | 13,738,482 | ||||
Interest and dividends receivable | 12,656 | ||||
Receivable for capital shares issued | 287,213 | ||||
Receivable for investments sold | 60,967 | ||||
Prepaid expenses | 1,561 | ||||
|
| ||||
Total Assets | 274,959,011 | ||||
|
| ||||
Liabilities: | |||||
Cash overdraft | 60,967 | ||||
Payable for capital shares redeemed | 16,895 | ||||
Manager fees payable | 23,338 | ||||
Administration fees payable | 3,566 | ||||
Custodian fees payable | 421 | ||||
Administrative and compliance services fees payable | 651 | ||||
Transfer agent fees payable | 690 | ||||
Trustee fees payable | 420 | ||||
Other accrued liabilities | 9,012 | ||||
|
| ||||
Total Liabilities | 115,960 | ||||
|
| ||||
Net Assets | $ | 274,843,051 | |||
|
| ||||
Net Assets Consist of: | |||||
Capital | $ | 273,221,278 | |||
Accumulated net investment income/(loss) | 8,614,083 | ||||
Accumulated net realized gains/(losses) from investment transactions | (19,588,836 | ) | |||
Net unrealized appreciation/(depreciation) on investments | 12,596,526 | ||||
|
| ||||
Net Assets | $ | 274,843,051 | |||
|
| ||||
Shares of beneficial interest (unlimited number of shares authorized, no par value) | 23,271,449 | ||||
Net Asset Value (offering and redemption price per share) | $ | 11.81 | |||
|
|
For the Year Ended December 31, 2017
Investment Income: | |||||
Interest | $ | 125,026 | |||
Dividends | 51 | ||||
Other income | 564 | ||||
|
| ||||
Total Investment Income | 125,641 | ||||
|
| ||||
Expenses: | |||||
Manager fees | 280,678 | ||||
Administration fees | 48,479 | ||||
Custodian fees | 2,362 | ||||
Administrative and compliance services fees | 3,389 | ||||
Transfer agent fees | 4,789 | ||||
Trustee fees | 12,138 | ||||
Professional fees | 12,100 | ||||
Shareholder reports | 9,074 | ||||
Other expenses | 3,496 | ||||
|
| ||||
Total expenses | 376,505 | ||||
|
| ||||
Net Investment Income/(Loss) | (250,864 | ) | |||
|
| ||||
Realized and Unrealized Gains/(Losses) on Investments: | |||||
Net realized gains/(losses) on securities transactions from affiliates | (3,211,802 | ) | |||
Net realized gains distributions from affiliated underlying funds | 8,864,966 | ||||
Net realized gains/(losses) on futures contracts | 1,037,481 | ||||
Change in net unrealized appreciation/depreciation on affiliated transactions | 22,484,796 | ||||
Change in net unrealized appreciation/depreciation on futures contracts | 83,890 | ||||
|
| ||||
Net Realized/Unrealized Gains/(Losses) on Investments | 29,259,331 | ||||
|
| ||||
Change in Net Assets Resulting From Operations | $ | 29,008,467 | |||
|
|
See accompanying notes to the financial statements.
5
AZL MVP Pyramis® Multi-Strategy Fund
Statements of Changes in Net Assets
| For the Year Ended December 31, 2017 | For the Year Ended December 31, 2016 | |||||||||
Change In Net Assets: | ||||||||||
Operations: | ||||||||||
Net investment income/(loss) | $ | (250,864 | ) | $ | 3,716,490 | |||||
Net realized gains/(losses) on investment transactions | 6,690,645 | (16,768,984 | ) | |||||||
Change in unrealized appreciation/depreciation on investments | 22,568,686 | 15,404,491 | ||||||||
|
|
|
| |||||||
Change in net assets resulting from operations | 29,008,467 | 2,351,997 | ||||||||
|
|
|
| |||||||
Distributions to Shareholders: | ||||||||||
From net investment income | (3,716,488 | ) | (11,849,955 | ) | ||||||
From net realized gains | — | (4,637,599 | ) | |||||||
|
|
|
| |||||||
Change in net assets resulting from distributions to shareholders | (3,716,488 | ) | (16,487,554 | ) | ||||||
|
|
|
| |||||||
Capital Transactions: | ||||||||||
Proceeds from shares issued | 2,016,003 | 11,951,865 | ||||||||
Proceeds from dividends reinvested | 3,716,488 | 16,487,554 | ||||||||
Value of shares redeemed | (43,337,091 | ) | (34,816,037 | ) | ||||||
|
|
|
| |||||||
Change in net assets resulting from capital transactions | (37,604,600 | ) | (6,376,618 | ) | ||||||
|
|
|
| |||||||
Change in net assets | (12,312,621 | ) | (20,512,175 | ) | ||||||
Net Assets: | ||||||||||
Beginning of period | 287,155,672 | 307,667,847 | ||||||||
|
|
|
| |||||||
End of period | $ | 274,843,051 | $ | 287,155,672 | ||||||
|
|
|
| |||||||
Accumulated net investment income/(loss) | $ | 8,614,083 | $ | 3,716,470 | ||||||
|
|
|
| |||||||
Share Transactions: | ||||||||||
Shares issued | 175,168 | 1,091,028 | ||||||||
Dividends reinvested | 325,722 | 1,551,040 | ||||||||
Shares redeemed | (3,831,782 | ) | (3,194,431 | ) | ||||||
|
|
|
| |||||||
Change in shares | (3,330,892 | ) | (552,363 | ) | ||||||
|
|
|
| |||||||
See accompanying notes to the financial statements.
6
AZL MVP Pyramis® Multi-Strategy Fund
(Selected data for a share of beneficial interest outstanding throughout the periods indicated)
| Year Ended December 31, | |||||||||||||||||||||||||
| 2017 | 2016 | 2015 | 2014 | 2013 | |||||||||||||||||||||
Net Asset Value, Beginning of Period | $ | 10.79 | $ | 11.33 | $ | 12.49 | $ | 12.39 | $ | 10.52 | |||||||||||||||
|
|
|
|
|
|
|
|
|
| ||||||||||||||||
Investment Activities: | |||||||||||||||||||||||||
Net Investment Income/(Loss) | — | (a) | 0.15 | 0.43 | 0.12 | 0.12 | |||||||||||||||||||
Net Realized and Unrealized Gains/(Losses) on Investments | 1.17 | (0.07 | ) | (1.20 | ) | 0.17 | 1.75 | ||||||||||||||||||
|
|
|
|
|
|
|
|
|
| ||||||||||||||||
Total from Investment Activities | 1.17 | 0.08 | (0.77 | ) | 0.29 | 1.87 | |||||||||||||||||||
|
|
|
|
|
|
|
|
|
| ||||||||||||||||
Dividends to Shareholders From: | |||||||||||||||||||||||||
Net Investment Income | (0.15 | ) | (0.45 | ) | (0.18 | ) | (0.11 | ) | — | ||||||||||||||||
Net Realized Gains | — | (0.17 | ) | (0.21 | ) | (0.08 | ) | — | (a) | ||||||||||||||||
|
|
|
|
|
|
|
|
|
| ||||||||||||||||
Total Dividends | (0.15 | ) | (0.62 | ) | (0.39 | ) | (0.19 | ) | — | (a) | |||||||||||||||
|
|
|
|
|
|
|
|
|
| ||||||||||||||||
Net Asset Value, End of Period | $ | 11.81 | $ | 10.79 | $ | 11.33 | $ | 12.49 | $ | 12.39 | |||||||||||||||
|
|
|
|
|
|
|
|
|
| ||||||||||||||||
Total Return(b) | 10.93 | % | 0.82 | % | (6.21 | )% | 2.33 | % | 17.79 | % | |||||||||||||||
Ratios to Average Net Assets/Supplemental Data: | |||||||||||||||||||||||||
Net Assets, End of Period (000’s) | $ | 274,843 | $ | 287,156 | $ | 307,668 | $ | 297,191 | $ | 204,518 | |||||||||||||||
Net Investment Income/(Loss) | (0.09 | )% | 1.25 | % | 3.85 | % | 1.42 | % | 1.75 | % | |||||||||||||||
Expenses Before Reductions*(c) | 0.13 | % | 0.13 | % | 0.15 | % | 0.15 | % | 0.17 | % | |||||||||||||||
Expenses Net of Reductions* | 0.13 | % | 0.13 | % | 0.15 | % | 0.15 | % | 0.15 | % | |||||||||||||||
Portfolio Turnover Rate | 4 | % | 4 | % | 4 | % | 4 | % | 9 | % | |||||||||||||||
| * | The expense ratios exclude the impact of fees/expenses paid by each underlying fund. |
| (a) | Represents less than $0.005. |
| (b) | The returns include reinvested dividends and fund level expenses, but exclude insurance contract charges. If these charges were included, the returns would have been lower. |
| (c) | Excludes fee reductions. If such fee reductions had not occurred, the ratios would have been as indicated. |
See accompanying notes to the financial statements.
7
AZL MVP Pyramis Multi-Strategy Fund
Notes to the Financial Statements
December 31, 2017
1. Organization
The Allianz Variable Insurance Products Fund of Funds Trust (the “Trust”) was organized as a Delaware statutory trust on June 16, 2004. The Trust is a diversified open-end management investment company registered under the Investment Company Act of 1940, as amended, (the “1940 Act”) and thus is determined to be an investment company for accounting purposes. The Trust consists of 12 separate investment portfolios (collectively, the “Funds”), of which one is included in this report, the AZL MVP Pyramis® Multi-Strategy Fund (the “Fund”), and 11 are presented in separate reports.
The Fund is a “fund of funds,” which means that the Fund invests primarily in other mutual funds. Underlying Funds invest in stock, bonds, and other securities and reflect varying amounts of potential investment risk and reward. The Underlying Funds record their investments at fair value. Periodically, the Fund will adjust its asset allocation as it seeks to achieve its investment objective.
The Trust is authorized to issue an unlimited number of shares of the Fund without par value. Shares of the Fund are available through the variable annuity contracts offered through the separate accounts of participating insurance companies. Currently, the Fund only offers its shares to separate accounts of Allianz Life Insurance Company of North America and Allianz Life Insurance Company of New York, affiliates of the Trust and the Manager, as defined below.
Under the Trust’s organizational documents, its officers and trustees are indemnified against certain liabilities arising out of the performance of their duties to the Fund. In addition, in the normal course of business, the Fund may enter into contracts with its vendors and others that provide for general indemnifications. The Fund’s maximum exposure under these arrangements is unknown, as this would involve future claims that may be made against the Fund. However, based on experience, the Fund expects that risk of loss to be remote.
2. Significant Accounting Policies
The following is a summary of significant accounting policies followed by the Fund in the preparation of its financial statements. The policies conform with U.S. generally accepted accounting principles (“U.S. GAAP”). The preparation of financial statements requires management to make certain estimates and assumptions that affect the reported amounts of assets and liabilities and disclosure of contingent assets and liabilities at the date of the financial statements and the reported amounts of increases and decreases in net assets from operations during the reporting period. Actual results could differ from those estimates.
Security Valuation
The Fund records its investments at fair value. Fair value is defined as the price that would be received to sell an asset or paid to transfer a liability in an orderly transaction between willing market participants at the measurement date. The valuation techniques used to determine fair value are further described in Note 4 below.
Investment Transactions and Investment Income
Investment transactions are accounted for on trade date. Net realized gains and losses on investments sold and on foreign currency transactions are recorded on the basis of identified cost. Interest income is recorded on the accrual basis and includes, where applicable, the amortization of premiums or accretion of discounts.
Dividends to Shareholders
Dividends to shareholders are recorded on the ex-dividend date. The Fund distributes its dividends from net investment income and net realized capital gains, if any, on an annual basis. The amount of dividends from net investment income and from net realized gains is determined in accordance with federal income tax regulations, which may differ from U.S. GAAP. These “book/tax” differences are either temporary or permanent in nature. To the extent these differences are permanent in nature (e.g., miscellaneous adjustments on return of capital), such amounts are reclassified within the composition of net assets based on their federal tax-basis treatment; temporary differences (e.g., wash sales, CLCF not subject to expiration, and differing treatment on certain investments) do not require reclassification. Dividends to shareholders that exceed net investment income and net realized gains for tax purposes are reported as distributions of capital.
Expense Allocation
Expenses directly attributable to the Fund are charged directly to the Fund, while expenses attributable to more than one Fund are allocated among the respective Funds based upon relative net assets or some other reasonable method. Expenses which are attributable to more than one Trust are allocated across the Allianz Variable Insurance Products and Allianz Variable Insurance Products Fund of Funds Trusts based upon relative net assets or another reasonable basis. Allianz Investment Management LLC (the “Manager”), serves as the investment manager for the Trust and the Allianz Variable Insurance Products Trust.
Derivative Instruments
All open derivative positions at period end are reflected on the Fund’s Schedule of Portfolio Investments. The following is a description of the derivative instruments utilized by the Fund, including the primary underlying risk exposures related to each instrument type. The Fund’s allocation to the MVP (Managed Volatility Portfolio) risk management process may include (a) derivatives such as index futures, other futures contracts, options, and other similar securities and (b) cash, money market equivalents, short-term debt instruments, money market funds, and short-term debt funds to satisfy all applicable margin requirements and to provide additional portfolio liquidity to satisfy large redemptions and any margin calls. Due to the leverage provided by derivatives, the notional value of the Fund’s derivative positions could exceed 20% of the Fund’s value. The Fund may also use futures to gain equity exposure and may hold cash as a buffer in the event of market shocks.
Futures Contracts
During the year ended December 31, 2017, the Fund invested in futures contracts to reduce volatility and limit the need to decrease or increase allocations to underlying funds. Futures contracts are valued based upon their quoted daily settlement prices. Upon entering into a futures contract, the Fund is required to segregate liquid assets in accordance with the initial margin requirements of the broker or exchange. Futures contracts are marked to market daily and a payable or receivable for the change in value (“variation margin”)
8
AZL MVP Pyramis Multi-Strategy Fund
Notes to the Financial Statements
December 31, 2017
is recorded by the Fund. Gains or losses are recognized but not considered realized until the contracts expire or are closed. Futures contracts involve, to varying degrees, elements of market risk (generally equity price risk related to stock futures, interest rate risk related to bond futures, and foreign currency risk related to currency futures) and exposure to loss in excess of the variation margin disclosed in the Statement of Assets and Liabilities. The primary risks associated with the use of futures contracts are the imperfect correlation between the change in fair value of the underlying securities and the prices of futures contracts, the possibility of an illiquid market, and the inability of the counterparty to meet the terms of the contract. For the year ended December 31, 2017, the monthly average notional amount for long contracts was $13.9 million. Realized gains and losses are reported as “Net realized gains/(losses) on futures contracts” on the Statement of Operations.
Summary of Derivative Instruments
The following is a summary of the fair values of derivative instruments on the Fund’s Statement of Assets and Liabilities, categorized by risk exposure, as of December 31, 2017:
Asset Derivative | Liability Derivative | |||||||||||
| Primary Risk Exposure | Statement of Assets and Liabilities Location | Total Fair Value* | Statement of Assets and Liabilities Location | Total Fair Value* | ||||||||
Equity Risk | ||||||||||||
| Equity Contracts | Receivable for variation margin on futures contracts | $ | 88,148 | Payable for variation margin on futures contracts | $ | — | ||||||
Interest Rate Risk | ||||||||||||
| Interest Rate Contracts | — | 44,927 | ||||||||||
| * | For futures contracts, the amounts represent the cumulative appreciation/depreciation of these futures contracts as reported in the Schedule of Portfolio Investments. Only current day’s variation margin is reported within the Statement of Assets and Liabilities as variation margin on futures contracts. |
The following is a summary of the effect of derivative instruments on the Statement of Operations, categorized by risk exposure, for the year ended December 31, 2017:
| Primary Risk Exposure | Location of Gains/(Losses) on Derivatives Recognized | Realized Gains/(Losses) on Derivatives Recognized | Change in Net Unrealized Appreciation/Depreciation on Derivatives Recognized | |||||||
Equity Risk | ||||||||||
| Equity Contracts | Net Realized gains/(losses) on futures contracts/Change in net unrealized appreciation/depreciation on futures contracts | $ | 968,486 | $ | 76,839 | |||||
Interest Rate Risk | ||||||||||
| Interest Rate Contracts | 68,995 | 7,051 | ||||||||
3. Fees and Transactions with Affiliates and Other Parties
The Manager provides investment advisory and management services for the Fund. The Manager has contractually agreed to waive fees and reimburse the Fund to limit the annual expenses, excluding interest expense (e.g., cash overdraft fees), taxes, brokerage commissions, acquired fund fees and expenses, other expenditures that are capitalized in accordance with U.S. GAAP and other extraordinary expenses not incurred in the ordinary course of the Fund’s business, based on the daily net assets of the Fund, through April 30, 2019. Expenses incurred for investment advisory and management services are reflected on the Statement of Operations as “Manager fees.”
For the year ended December 31, 2017, the annual rate paid to the Manager and the annual expense limit were as follows:
| Annual Rate | Annual Expense Limit | |||||||||
AZL MVP Pyramis Multi-Strategy Fund | 0.10 | % | 0.15 | % | ||||||
Any amounts contractually waived or reimbursed by the Manager in a particular fiscal year will be subject to repayment by the Fund to the Manager to the extent that from time to time through the next three fiscal years the repayment will not cause the Fund’s expenses to exceed the lesser of the stated limit at the time of the waiver or the current stated limit. Any amounts recouped by the Manager during the year are reflected on the Statement of Operations as “Recoupment of prior expenses reimbursed by the Manager.” At December 31, 2017, there were no remaining contractual reimbursements that are subject to repayment by the Fund in subsequent years.
In addition, the Manager may voluntarily waive or reimburse additional fees in order to maintain more competitive expense ratios. Any voluntary waivers or reimbursements are not subject to repayment in subsequent years. Information on the total amount waived/reimbursed by the Manager or repaid to the Manager by the Fund during the period can be found on the Statement of Operations. During the year ended December 31, 2017, there were no voluntary waivers.
9
AZL MVP Pyramis Multi-Strategy Fund
Notes to the Financial Statements
December 31, 2017
The Manager or an affiliate of the Manager serves as the investment adviser of certain underlying fund in which the Fund invests. At December 31, 2017, this underlying fund is noted as Affiliated Investment Company in the Fund’s Schedule of Portfolio Investments. Additional information, including financial statements, about this Fund is available at www.allianzlife.com. The Manager or an affiliate of the Manager is paid a separate fee from the underlying fund for such services. A summary of the Fund’s investments in affiliated investment company for the year ended December 31, 2017 is as follows:
| Fair Value 12/31/16 | Purchases at Cost | Proceeds from Sales | Net Realized Gains/(Losses) | Net Change in Unrealized | Fair Value 12/31/17 | Shares as of 12/31/2017 | Dividend Income | Net realized gains distributions from affiliated underlying funds | |||||||||||||||||||||||||||||||||||||
AZL Pyramis Multi-Strategy Fund | $ | 272,986,136 | $ | 9,795,061 | $ | (41,196,059 | ) | $ | (3,211,802 | ) | $ | 22,484,796 | $ | 260,858,132 | 19,539,935 | $ | — | $ | 8,864,966 | ||||||||||||||||||||||||||
|
|
|
|
|
|
|
|
|
|
|
|
|
|
|
|
|
| ||||||||||||||||||||||||||||
| $ | 272,986,136 | $ | 9,795,061 | $ | (41,196,059 | ) | $ | (3,211,802 | ) | $ | 22,484,796 | $ | 260,858,132 | 19,539,935 | $ | — | $ | 8,864,966 | |||||||||||||||||||||||||||
|
|
|
|
|
|
|
|
|
|
|
|
|
|
|
|
|
| ||||||||||||||||||||||||||||
Pursuant to separate agreements between the Funds and the Manager, the Manager provides a Chief Compliance Officer (“CCO”) and certain compliance oversight and regulatory filing services to the Trust. Under these agreements the Manager is entitled to an amount equal to a portion of the compensation and certain other expenses related to the individuals performing the CCO and compliance oversight services, as well as $100 per hour for time incurred in connection with the preparation and filing of certain documents with the Securities and Exchange Commission (“SEC” or the “Commission”). The fees are paid to the Manager on a quarterly basis. The total expenses incurred by the Fund for these services are reflected on the Statement of Operations as “Administrative and compliance services fees.”
Citi Fund Services Ohio, Inc. (“Citi” or the “Administrator”), a wholly owned subsidiary of Citigroup, Inc., with which an officer of the Trust is affiliated, serves as the Trust’s administrator and fund accountant, and assists the Trust in all aspects of its administration and operation. The Administrator is entitled to a fee, accrued daily and paid monthly. The Administrator is entitled to an annual fee for each additional class of shares of any Fund, certain annual fees in supporting fair values services, and a Trust-wide annual fee for providing infrastructure and support in implementing the written policies and procedures comprising the Fund’s compliance program. The Administrator is also reimbursed for certain expenses incurred. The total expenses incurred by the Fund for these services are reflected on the Statement of Operations as “Administration fees.”
FIS Investor Services LLC (“FIS”) serves as the Fund’s transfer agent. Under the Transfer Agent Agreement, the Trust pays FIS a fee for its services and reimburses FIS for all of their reasonable out-of-pocket expenses incurred in providing these services.
The Bank of New York Mellon (“BNY Mellon” or the “Custodian”) serves as the Trust’s custodian and securities lending agent. For these services as custodian, the Funds pay BNY Mellon a fee based on a percentage of assets held on behalf of the Funds, plus certain out-of-pocket charges.
Allianz Life Financial Services, LLC (“ALFS”), an affiliate of the Manager, serves as distributor of the Fund. ALFS receives an annual Trust-wide annual fee of $7,500, paid by the Manager from its profits and not by the Trust, for recordkeeping and reporting services.
In addition, certain legal fees and expenses are paid to a law firm, Dorsey & Whitney LLP, of which the Secretary of the Fund is Senior Counsel. During the year ended December 31, 2017, $2,902 was paid from the Fund relating to these fees and expenses.
Certain Officers and Trustees of the Trust are affiliated with the Manager or the Administrator. Such Officers (except for the Trust’s CCO as noted above) and Trustees receive no compensation from the Trust for serving in their respective roles. For their service to the Trust and to the Allianz Variable Insurance Products Trust, each non-interested Trustee receives a $170,000 annual Board retainer, the Lead Director receives an additional $42,500 annually and the Chair of the Nominating and Corporate Governance Committee receives an additional $25,500 annually. In addition, the Trustees are reimbursed for certain expenses associated with attending Board meetings. Compensation to the Trustees is allocated between the Trust and the Allianz Variable Insurance Products Fund of Funds Trust in proportion to the assets under management of each trust. During the year ended December 31, 2017, actual Trustee compensation was $1,116,333 in total for both trusts.
4. Investment Valuation Summary
The valuation techniques employed by the Fund, as described below, maximize the use of observable inputs and minimize the use of unobservable inputs in determining fair value. The inputs used for valuing the Fund’s investments are summarized in the three broad levels listed below:
| ● | Level 1 — quoted prices in active markets for identical assets |
| ● | Level 2 — other significant observable inputs (including quoted prices for similar securities, interest rates, prepayments speeds, credit risk, etc.) |
| ● | Level 3 — significant unobservable inputs (including the Fund’s own assumptions in determining the fair value of investments) |
Changes in valuation techniques may result in transfers in or out of an assigned level within the disclosure hierarchy. The Fund determines transfers between fair value hierarchy levels at the reporting period end. The inputs or methodology used for valuing investments is not necessarily an indication of the risk associated with investing in those investments.
Investments in other investment companies are valued at their published net asset value (“NAV”). Security prices are generally provided by an independent third party pricing service approved by the Trust’s Board of Trustees (the “Board” or “Trustees”) as of the close of the New York Stock Exchange (“NYSE”) (generally 4:00 pm Eastern Time). The investments utilizing Level 1 valuations represent investments in open-end investment companies. Futures contracts are valued at the last sales price as of the close of the primary exchange and are typically categorized as Level 1 in the fair value hierarchy.
For the year ended December 31, 2017, there were no Level 3 investments for which significant unobservable inputs were used to determine fair value. There were no significant transfers between Levels 1 and 2 as of December 31, 2017, based on levels assigned to securities on December 31, 2016.
10
AZL MVP Pyramis Multi-Strategy Fund
Notes to the Financial Statements
December 31, 2017
The following is a summary of the valuation inputs used as of December 31, 2017 in valuing the Fund’s investments based upon the three levels defined above:
| Investment Securities: | Level 1 | Level 2 | Level 3 | Total | ||||||||||||||||
Affiliated Investment Company | $ | 260,858,132 | $ | — | $ | — | $ | 260,858,132 | ||||||||||||
|
|
|
|
|
|
|
| |||||||||||||
Total Investment Securities | 260,858,132 | — | — | 260,858,132 | ||||||||||||||||
|
|
|
|
|
|
|
| |||||||||||||
Other Financial Instruments:* | ||||||||||||||||||||
Futures Contracts | 43,221 | — | — | 43,221 | ||||||||||||||||
|
|
|
|
|
|
|
| |||||||||||||
Total Investments | $ | 260,901,353 | $ | — | $ | — | $ | 260,901,353 | ||||||||||||
|
|
|
|
|
|
|
| |||||||||||||
| * | Other Financial Instruments would include any derivative instruments, such as futures contracts. These investments are generally presented in the financial statements at variation margin. |
5. Security Purchases and Sales
For the year ended December 31, 2017, cost of purchases and proceeds from sales of securities (excluding securities maturing less than one year from acquisition) were as follows:
| Purchases | Sales | |||||||||
AZL MVP Pyramis Multi-Strategy Fund | $ | 9,795,061 | $ | 41,196,059 | ||||||
6. Investment Risks
Derivatives Risk: The Fund may invest directly or through affiliated or unaffiliated mutual funds or unregistered investment pools in derivative instruments such as futures, options, and options on futures. A derivative is a financial contract whose value depends on, or is derived from, the value of an underlying asset, reference rate, or risk. Use of derivative instruments involves risks different from, or possibly greater than, the risks associated with investing directly in securities and other traditional investments. Derivatives are subject to a number of other risks, such as liquidity risk, interest rate risk, market risk, credit risk, and selection risk. Derivatives also involve the risk of mispricing or improper valuation and the risk that changes in the value may not correlate perfectly with the underlying asset, rate, or index. Using derivatives may result in losses, possibly in excess of the principal amount invested. Also, suitable derivative transactions may not be available in all circumstances. The other party to a derivatives contract could default.
Fund of Funds Risk: The Fund, as a shareholder of the underlying funds, indirectly bears its proportionate share of any investment management fees and other expenses of the underlying funds. Further due to the fees and expenses paid by the Fund, as well as small variations in the Fund’s actual allocations to the underlying funds and any futures and cash held in the Fund’s portfolio, the performance and income distributions of the Fund will not be the same as the performance and income distributions of the underlying funds.
7. Federal Tax Information
It is the policy of the Fund to continue to qualify as a regulated investment company by complying with the provisions available to certain investment companies, as defined under Subchapter M of the Internal Revenue Code, and to make distributions of net investment income and net realized gains sufficient to relieve it from all, or substantially all, federal income taxes. Accordingly, no provisions for federal income taxes are required in the financial statements.
Management of the Fund has reviewed tax positions taken in tax years that remain subject to examination by all major tax jurisdictions, including federal (i.e., the last four tax year ends and the interim tax period since then, as applicable). Management believes that there is no tax liability resulting from unrecognized tax benefits related to uncertain tax positions taken.
Cost of securities, including derivatives and short positions as applicable, for federal income tax purposes at December 31, 2017 is $251,083,199. The gross unrealized appreciation/(depreciation) on a tax basis is as follows:
Unrealized appreciation | $ | 9,774,932 | ||
Unrealized (depreciation) | — | |||
|
| |||
Net unrealized appreciation/(depreciation) | $ | 9,774,932 | ||
|
|
As of the end of its tax year ended December 31, 2017, the Fund has capital loss carry forwards (“CLCFs”).
CLCFs subject to expiration are applied as short-term capital loss regardless of whether the originating capital loss was short-term or long-term. CLCFs that are not subject to expiration must be utilized before those that are subject to expiration. The Board does not intend to authorize a distribution of any realized gain for the Fund until any applicable CLCF has been offset or expires.
CLCFs not subject to expiration:
| Short Term Amount | Long Term Amount | Total Amount | |||||||||||||
AZL MVP Pyramis Multi-Strategy Fund | $ | 5,681,446 | $ | 11,085,796 | $ | 16,767,242 | |||||||||
11
AZL MVP Pyramis Multi-Strategy Fund
Notes to the Financial Statements
December 31, 2017
The tax character of dividends paid to shareholders during the year ended December 31, 2017 were as follows:
| Ordinary Income | Net Long-Term | Total Distributions(a) | |||||||||||||
AZL MVP Pyramis Multi-Strategy Fund | $ | 3,716,488 | $ | — | $ | 3,716,488 | |||||||||
| (a) | Total distributions paid may differ from the Statements of Changes in Net Assets because dividends are recognized when actually paid for tax purposes. |
The tax character of dividends paid to shareholders during the year ended December 31, 2016 were as follows:
| Ordinary Income | Net Long-Term | Total Distributions(a) | |||||||||||||
AZL MVP Pyramis Multi-Strategy Fund | $ | 11,849,968 | $ | 4,637,586 | $ | 16,487,554 | |||||||||
(a) Total distributions paid may differ from the Statements of Changes in Net Assets because dividends are recognized when actually paid for tax purposes.
At December 31, 2017, the components of accumulated earnings on a tax basis were as follows:
| Undistributed Ordinary Income | Undistributed Long-Term Capital Gains | Accumulated Capital and Other Losses | Unrealized Depreciation(a) | Total Accumulated Earnings/ (Deficit) | |||||||||||||||||||||
AZL MVP Pyramis Multi-Strategy Fund | $ | 8,614,083 | $ | — | $ | (16,767,242 | ) | $ | 9,774,932 | $ | 1,621,773 | ||||||||||||||
| (a) | The difference between book-basis and tax-basis unrealized appreciation/depreciation is attributable primarily to tax deferral of losses on wash sales. |
8. Ownership and Principal Holders
The beneficial ownership, either directly or indirectly, of more than 25% of the voting securities of a fund creates presumptions of control of the fund, under section 2 (a)(9) of the 1940 Act. As of December 31, 2017, the Fund had an individual shareholder account which is affiliated with the Investment Adviser representing ownership in excess of 85% of the Fund.
9. Investment Company Reporting Modernization
In October 2016, the SEC released its Final Rule on Investment Company Reporting Modernization (the “Rules”). The Rules which introduce two new regulatory reporting forms for investment companies — Form N-PORT and Form N-CEN — also contain amendments to Regulation S-X which require standardized, enhanced disclosures about derivatives in investment company financial statements, as well as other amendments. The amendments to Regulation S-X became effective for filings made with the SEC after August 1, 2017. The compliance date for form N-PORT and Form N-CEN will vary based on the reporting entity’s size and, in the case of the Fund, is expected to be April 30, 2019. The Fund’s adoption of these amendments, as applicable for the financial statements prepared as of December 31, 2017, had no effect on the Fund’s net assets or results of operations.
10. Subsequent Events
Management of the Fund has evaluated the need for additional disclosures or adjustments resulting from events through the date the financial statements were issued. Based on this evaluation, there were no subsequent events to report that would have material impact on the Fund’s financial statements
12
REPORT OF INDEPENDENT REGISTERED PUBLIC ACCOUNTING FIRM
To the Shareholders and Board of Trustees of
Allianz Variable Insurance Products Fund of Funds Trust:
Opinion on the Financial Statements
We have audited the accompanying statement of assets and liabilities of AZL MVP Pyramis Multi-Strategy Fund (the “Fund”) of the Allianz Variable Insurance Products Fund of Funds Trust, including the schedule of portfolio investments, as of December 31, 2017, and the related statement of operations for the year then ended, the statements of changes in net assets for each of the years in the two-year period then ended, and the related notes (collectively, the “financial statements”) and the financial highlights for each of the years in the five-year period then ended. In our opinion, the financial statements present fairly, in all material respects, the financial position of the Fund as of December 31, 2017, the results of its operations for the year then ended, the changes in its net assets for each of the years in the two-year period then ended, and the financial highlights for each of the years in the five-year period then ended, in conformity with U.S. generally accepted accounting principles.
Basis for Opinion
These financial statements and financial highlights are the responsibility of the Fund’s management. Our responsibility is to express an opinion on these financial statements and financial highlights based on our audits. We are a public accounting firm registered with the Public Company Accounting Oversight Board (United States) (“PCAOB”) and are required to be independent with respect to the Fund in accordance with the U.S. federal securities laws and the applicable rules and regulations of the Securities and Exchange Commission and the PCAOB.
We conducted our audits in accordance with the standards of the PCAOB. Those standards require that we plan and perform the audit to obtain reasonable assurance about whether the financial statements and financial highlights are free of material misstatement, whether due to error or fraud. Our audits included performing procedures to assess the risks of material misstatement of the financial statements and financial highlights, whether due to error or fraud, and performing procedures that respond to those risks. Such procedures included examining, on a test basis, evidence regarding the amounts and disclosures in the financial statements and financial highlights. Such procedures also included confirmation of securities owned as of December 31, 2017, by correspondence with brokers and the transfer agent of the underlying fund. Our audits also included evaluating the accounting principles used and significant estimates made by management, as well as evaluating the overall presentation of the financial statements and financial highlights. We believe that our audits provide a reasonable basis for our opinion.
/s/ KPMG LLP
We have served as the auditor of one or more Allianz Variable Insurance Products investment companies since 1999.
Columbus, Ohio
February 23, 2018
13
Other Federal Income Tax Information (Unaudited)
For the year ended December 31, 2017, 69.03% of the total ordinary income dividends paid by the Fund qualify for the corporate dividends received deduction available to corporate shareholders.
14
A description of the policies and procedures that the Fund uses to determine how to vote proxies relating to portfolio securities is available, without charge, upon request, by visiting the Securities and Exchange Commission’s (“Commission”) website at www.sec.gov, or by calling 800-624-0197.
Information regarding how the Fund voted proxies relating to portfolio securities during the most recent 12-month period ended June 30th is available (i) without charge, upon request, by calling 800-624-0197; (ii) on the Allianz Variable Insurance Products Trust’s website at https://www.allianzlife.com; and (iii) on the Commission’s website at http://www.sec.gov.
The Fund files complete Schedules of Portfolio Holdings with the Commission for the first and third quarters of each fiscal year on Form N-Q. Schedules of Portfolio Holdings for the Fund in this report are available without charge on the Commission’s website at http://www.sec.gov, or may be reviewed and copied at the Commission’s Public Reference Room in Washington, D.C. Information on the operation of the Public Reference Room may be obtained by calling 800-SEC-0330.
15
Approval of Investment Advisory Agreement (Unaudited)
Subject to the general supervision of the Board of Trustees (the “Board”) and in accordance with the investment objectives and restrictions of each separate series (together, the “Funds”) of the Allianz Variable Insurance Products Fund of Funds Trust (the “Trust”), investment advisory services are provided to the Funds by Allianz Investment Management LLC (the “Manager”). As used in this section, “Fund” refers to any of the Funds. The Manager manages each Fund pursuant to an investment management agreement (the “Management Agreement”) with the Trust in respect of each such Fund. The Management Agreement provides that the Manager, subject to the supervision and approval of the Board, is responsible for the management of each Fund. For management services, each Fund pays the Manager an investment advisory fee based upon each Fund’s average daily net assets. The Manager has contractually agreed to limit the expenses of each Fund by reimbursing the Fund if and when total Fund operating expenses exceed certain amounts until at least May 1, 2019 (the “Expense Limitation Agreement”).
In reviewing the services provided by the Manager and the terms of the Management Agreement, the Board receives and reviews information related to the Manager’s experience and expertise in the variable insurance marketplace. Currently, the Funds are offered only through variable annuities and variable life insurance policies, and not in the retail fund market. In addition, the Board receives information regarding the Manager’s expertise with regard to portfolio diversification and asset allocation requirements within variable insurance products issued by Allianz Life Insurance Company of North America (“Allianz Life”) and its subsidiary, Allianz Life Insurance Company of New York (“Allianz of New York”). Currently, the Funds are offered only through Allianz Life and Allianz of New York variable products.
As required by the Investment Company Act of 1940 (the “1940 Act”), the Board has reviewed and approved the Management Agreement with the Manager. The Board’s decision to approve this contract reflects the exercise of its business judgment on whether to approve new arrangements and continue the existing arrangements. During its review of the contract, the Board considered many factors, among the most material of which are: the Fund’s investment objectives and long-term performance; the Manager’s management philosophy, personnel, processes and investment performance, including its compliance history and the adequacy of its compliance processes; the preferences and expectations of Fund shareholders (and underlying contract owners) and their relative sophistication; the continuing state of competition in the mutual fund industry; and comparable fees in the mutual fund industry.
The Board also considered the compensation and benefits received by the Manager. This includes fees received for services provided to a Fund by employees of the Manager or of affiliates of the Manager and research services received by the Manager from brokers that execute Fund trades, as well as advisory fees. The Board considered the fact that: (1) the Manager and the Trust are parties to an Administrative Services Agreement and a Compliance Services Agreement, under which the Manager is compensated by the Trust for performing certain administrative and compliance services including providing an employee of the Manager or one of its affiliates to act as the Trust’s Chief Compliance Officer; and (2) Allianz Life Financial Services, LLC, an affiliated person of the Manager, is a registered securities broker-dealer and received (along with its affiliated persons) payments made by the underlying funds pursuant to Rule 12b-1.
The Board is aware that various courts have interpreted provisions of the 1940 Act and have indicated in their decisions that the following factors may be relevant to an adviser’s compensation: the nature and quality of the services provided by the adviser, including the performance of the fund; the adviser’s cost of providing the services; the extent to which the adviser may realize “economies of scale” as the fund grows larger; any indirect benefits that may accrue to the adviser and its affiliates as a result of the adviser’s relationship with the fund; performance and expenses of comparable funds; the profitability of acting as adviser to the fund; and the extent to which the independent Board members, who are not “interested persons” of a fund as defined by the 1940 Act, are fully informed about all facts bearing on the adviser’s services and fees. The Board is aware of these factors and takes them into account in its review of the Management Agreement for the Funds.
The Board considered and weighed these circumstances in light of its experience in governing the Trust, and is assisted in its deliberations by the advice of independent legal counsel to the independent Trustees. In this regard, the Board requests and receives a significant amount of information about the Funds and the Manager. Some of this information is provided at each regular meeting of the Board; additional information is provided in connection with the particular meeting or meetings at which the Board’s formal review of an advisory contract occurs. In between regularly scheduled meetings, the Board may receive information on particular matters as the need arises. Thus, the Board’s evaluation of the Management Agreement is informed by reports covering such matters as: the Manager’s investment philosophy, personnel and processes, and the Fund’s investment performance (in absolute terms as well as in relationship to its benchmark). In connection with comparing the performance of each Fund versus its benchmark, the Board receives reports on the extent to which the Fund’s performance may be attributed to various applicable factors, such as asset class allocation decisions and volatility management strategies, the performance of the underlying funds, rebalancing decisions, and the impact of cash positions and Fund fees and expenses. The Board also receives reports on the Funds’ expenses (including the advisory fee itself and the overall expense structure of the Funds, both in absolute terms and relative to similar and/or competing funds, with due regard for the Expense Limitation Agreement and additional voluntary expense limitations); the nature and extent of the advisory and other services provided to the Fund by the Manager and its affiliates; compliance and audit reports concerning the Funds and the companies that service them; and relevant developments in the mutual fund industry and how the Funds and/or the Manager are responding to them.
The Board also receives financial information about the Manager, including reports on the compensation and benefits the Manager derives from its relationships with the Funds. These reports cover not only the fees under the Management Agreement, but also fees, if any, received for providing other services to the Funds. The reports also discuss any indirect or “fall out” benefits the Manager or its affiliates may derive from its relationship with the Funds.
The Management Agreement was most recently considered at Board meetings held in the fall of 2017. Information relevant to the approval of the Management Agreement was considered at a telephonic Board meeting on October 18, 2017, and at an “in person” Board meeting held October 23, 2017. The Management Agreement was approved at the Board meeting of October 23, 2017. At such meeting the Board also approved the Expense Limitation Agreement between the Manager and the Trust for the period ending April 30, 2019. In connection with such meetings, the Trustees requested and evaluated extensive materials from the Manager, including performance and expense information for other investment companies with similar investment objectives derived from data compiled by an independent third party provider and other sources believed to be reliable by the Manager. Prior to voting, the Trustees reviewed the proposed approval/continuance of the Agreement with management and with experienced counsel who are independent of the Manager and received a memorandum from such counsel discussing the legal standards for their consideration of the proposed approvals/continuances. The independent Trustees also discussed the proposed approvals/continuances in a private session with such counsel at which no representatives of the Manager were present. In reaching their determinations relating to the approval and/or continuance of the Agreement, in respect of each Fund, the Board considered all factors it believed relevant. The Board based its decision to approve the Management Agreement on the totality of the circumstances and relevant factors, and with a view to past and future long-term considerations. Not all of the factors and considerations discussed above and below are necessarily relevant to every Fund, and the Board did not assign relative weights to factors discussed herein or deem any one or group of them to be controlling in and of themselves.
An SEC rule requires that shareholder reports include a discussion of certain factors relating to the selection of the investment adviser and the approval of the advisory fee. The “factors” enumerated by the SEC are set forth below in italics, as well as the Board’s conclusions regarding such factors:
(1) The nature, extent and quality of services provided by the Manager. The Trustees noted that the Manager, subject to the control of the Board, administers each Fund’s business and other affairs. The Trustees noted that the Manager also provides the Trust and each Fund with such administrative and other services (exclusive of, and in addition to, any such services provided by any others retained by the Trust on behalf of the Funds) and executive and other personnel as are necessary for the operation of the Trust and the Funds. Except for the Trust’s Chief Compliance Officer and certain compliance staff, the Manager pays all of the compensation of Trustees and officers of the Trust who are employees of the Manager or its affiliates.
16
The Board considered the scope and quality of services provided by the Manager and noted that the scope of such services provided had expanded as a result of recent regulatory and other developments. The Board noted that, for example, the Manager is responsible for maintaining and monitoring its own compliance program, and this compliance program has been continuously refined and enhanced in light of new regulatory requirements. The Board considered the capabilities and resources which the Manager has dedicated to performing services on behalf of the Trust and its Funds. The quality of administrative and other services, including the Manager’s role in coordinating the activities of the Trust’s other service providers, also were considered. The Board concluded that, overall, they were satisfied with the nature, extent and quality of services provided (and expected to be provided) to the Trust and to each of the Funds under the Management Agreement.
(2) The investment performance of the Funds and the Manager. In connection with every in-person quarterly Board meeting and the fall 2017 contract review process, Trustees received extensive information on the performance results of each Fund. This included, for example, performance information on absolute total return, performance versus the appropriate benchmark(s), the contribution to performance of the Manager’s asset class allocation decisions and volatility management strategies, the performance of the underlying funds, and the impact on performance of rebalancing decisions, cash and Fund fees. This included Lipper performance information on the Funds for the previous quarter, year-to-date, and previous one-, three- and five-year periods, to the extent the Funds were in existence for such periods. (For Funds which have been in existence for less than five years, the Board received performance information on shorter time periods to the extent available.) For example, in connection with the Board meeting held October 23, 2017, the Manager reported that for the five Funds for which performance information for the five year period ended June 30, 2017 was available, two were in the top 40%, two were in the middle 20%, and one was in the bottom 40%. None of these Funds was in the bottom 40% for the three- or one-year periods. The Manager reported that for the three-year period ended June 30, 2017, for the six Funds for which three year performance information was available, four Funds were in the top 40% and two Funds were in the middle 20%. For the eight Funds for which one-year performance information was available, for the one-year period ended June 30, 2017, four Funds were in the top 40%, two Funds were in the middle 20%, and two Funds were in the bottom 40%.
At the Board meeting held October 23, 2017, the Manager also reported upon the performance of the MVP Funds compared to custom managed-volatility peer groups. For the seven Funds for which three-year performance information was available, for the three-year period ended June 30, 2017, five Funds were in the top 40%, one Fund was in the middle 20%, and one was in the bottom 40%. For the eight Funds for which one year performance was available, for the one-year period ended June 30, 2017, four Funds were in the top 40% and four Funds were in the middle 20%. All six Funds for which five-year performance information was available were in the top 40%.
At the Board meeting held October 23, 2017, the Trustees determined that the investment performance of the Funds was acceptable.
(3) The costs of services to be provided and profits to be realized by the Manager and its affiliates from the relationship with the Funds. The Board considered that the Manager receives an advisory fee from each of the Funds. The Manager reported that for the three MVP Fusion Dynamic Funds the advisory fee paid put these Funds in the 44th percentile of the customized peer group. The Manager reported that for three MVP Index Strategy Funds the advisory fee paid put them in the 27th percentile of the customized peer group, and for the two non-MVP Index Strategy Funds, as well as the AZL DFA Multi-Strategy Fund, the advisory fee paid put them in the 13th percentile of the customized peer group. The Manager reported that for the AZL MVP BlackRock Global Strategy Plus, AZL MVP DFA Multi-Strategy, AZL MVP Pyramis Multi-Strategy, and AZL MVP T. Rowe Price Capital Appreciation Plus Funds, the advisory fee paid was in the 9th percentile. (A lower percentile reflects lower fund fees and is better for fund shareholders.) Trustees were provided with information on the total expense ratios of the Funds and other funds in the customized peer groups, and the Manager reported upon the challenges in making peer group comparisons for the Funds.
The Manager provided information concerning the profitability of the Manager’s investment advisory activities for the period from 2014 through June 30, 2017. The Board recognized that it is difficult to make comparisons of profitability from investment company advisory agreements because comparative information is not generally publicly available and is affected by numerous factors, including the structure of the particular adviser, the types of funds it manages, its business mix, numerous assumptions regarding allocation of expenses and the adviser’s capital structure and cost of capital. In considering profitability information, the Board considered the possible effect of certain fall-out benefits to the Manager and its affiliates. The Board focused on profitability of the Manager’s relationships with the Funds before taxes and distribution expenses. The Board recognized that the Manager should earn a reasonable level of profits for the services it provides to each Fund.
The Board also considered that Wilshire Funds Management (“Wilshire”) serves as a consultant to the Manager in preparing statistical and other factual information for use in the creation and maintenance of the asset allocation models for the Fusion Funds (the AZL MVP Fusion Dynamic Conservative, Balanced, and Moderate Funds), pursuant to an agreement between the Manager and Wilshire. Wilshire serves as a consultant to the Manager with respect to selecting the Fusion Funds’ underlying funds and the asset allocations among the underlying funds. The Manager, not any Fund, pays a consultant fee to Wilshire.
Based upon the information provided, the Board concluded that the Funds’ advisory fees and expense ratios are not unreasonable, and determined that there was no evidence that the Manager’s level of profitability from its relationship with the Funds was excessive.
(4) and (5) The extent to which economies of scale would be realized as the Funds grow, and whether fee levels reflect these economies of scale. The Board noted that the advisory fee schedules for the Funds do not contain breakpoints that reduce the fee rate on assets above specified levels. The Board recognized that breakpoints may be an appropriate way for the Manager to share its economies of scale, if any, with Funds that have substantial assets. The Board found there was no uniform methodology for establishing breakpoints that give effect to Fund-specific services provided by the Manager. The Board noted that in the fund industry as a whole, as well as among funds similar to the Funds, there is no uniformity or pattern in the fees and asset levels at which breakpoints (if any) apply. Depending on the age, size, and other characteristics of a particular fund and its manager’s cost structure, different conclusions can be drawn as to whether there are economies of scale to be realized at any particular level of assets, notwithstanding the intuitive conclusion that such economies exist, or will be realized at some level of total assets. Moreover, because different managers have different cost structures and service models, it is difficult to draw meaningful conclusions from the breakpoints that may have been adopted by other funds. The Board also noted that the advisory agreements for many funds do not have breakpoints at all, or if breakpoints exist, they may be at asset levels significantly greater than those of the individual Funds. The Board also noted that the total assets in all of the Funds, as of June 30, 2017, were approximately $10.8 billion and that the largest Fund, the AZL MVP Growth Index Strategy Fund, had assets of approximately $2.4 billion.
The Board noted that the Manager has agreed to temporarily limit Fund expenses under the Expense Limitation Agreement, which has the effect of reducing expenses as would the implementation of advisory fee breakpoints. The Manager has committed to continue to consider the continuation of expense limits and/or advisory fee breakpoints as the Funds grow larger. The Board receives quarterly reports on the level of Fund assets. The Board expects to continue to consider: (a) the extent to which economies of scale have been realized, and (b) whether the advisory fee should be modified, either in connection with the next renewal of the Agreements or by modifying the Expense Limitation Agreement, to reflect such economies of scale, if any.
Having taken these factors into account, the Board concluded that the absence of breakpoints in the Funds’ advisory fee rate schedules was acceptable under each Fund’s circumstances.
17
Information about the Board of Trustees and Officers (Unaudited)
The Trust is managed by the Trustees in accordance with the laws of the state of Delaware governing business trusts. There are currently eight Trustees, one of whom is an “interested person” of the Trust within the meaning of that term under the 1940 Act. The Trustees and Officers of the Trust, and their addresses, ages, positions held with the Trust, terms of office with the Trust and length of time served, principal occupation(s) during the past five years, the number of portfolios in the Trust they oversee, and other directorships held during the past five years are as follows:
Non-Interested Trustees(1)
| Name, Address, and Year of Birth | Positions Held with Allianz VIP and VIP FOF Trust | Term of Office(2)/Length of Time Served | Principal Occupation(s) During Past 5 Years | Number of Portfolios Overseen for Allianz VIP and VIP FOF Trust | Other AZL Fund Complex | |||||
| Peter R. Burnim (1947) 5701 Golden Hills Drive Minneapolis, MN 55416 | Trustee | Since 2/07 | Consultant/Chair, various companies: Chairman, Emrys Analytics and subsidiaries, July 2015 to present; Chairman, Argus Investment Strategies Fund Ltd., February 2013 to 2017; Managing Director, iQ Venture Advisors, LLC, 2005 to present; Chairman, Northstar Group Holdings Ltd. Bermuda, 2011 to present; Chairman Sterling Bank & Trust (Bahamas) Ltd., 2016 to present, and Expert Witness, Massachusetts Department of Revenue, 2011 to 2016. | 35 | Argus Group Holdings and Subsidiaries; Northstar Group Holdings; Sterling Trust (Cayman) Ltd.; Sterling Bank & Trust Limited (Bahamas); Emrys Analytics; EGB Insurance. | |||||
| Peggy L. Ettestad (1957) 5701 Golden Hills Drive Minneapolis, MN 55416 | Lead Independent Trustee | Since 10/14 (Trustee since 2/07) | Managing Director, Red Canoe Management Consulting LLC, 2008 to present | 35 | Luther College | |||||
| Tamara Lynn Fagely (1958) 5701 Golden Hills Drive Minneapolis, MN 55416 | Trustee | Since 12/17 | Retired; Chief Operations Officer, Hartford Funds, March 2012 to December 2013 | 35 | Diamond Hill Funds (13 funds) | |||||
| Richard H. Forde (1953) 5701 Golden Hills Drive Minneapolis, MN 55416 | Trustee | Since 12/17 | Member of the Board and Chairman of the Finance and Investment Committee, Connecticut Water Service, Inc., October 2013 to present; Senior Vice President and Chief Investment Officer, CIGNA, 2004 to 2012 | 35 | Connecticut Water Service, Inc. | |||||
| Claire R. Leonardi (1955) 5701 Golden Hills Drive Minneapolis, MN 55416 | Trustee | Since 2/04 | Chief Executive Officer, Health eSense Inc., 2015 to Present; CEO, Connecticut Innovations, Inc., 2012 to 2015; General Partner, Fairview Capital, L.P., 1994 to 2012 | 35 | reSet Social Enterprise Investment Fund | |||||
| Dickson W. Lewis (1948) 5701 Golden Hills Drive Minneapolis, MN 55416 | Trustee | Since 2/04 | Retired; Vice President/General Manager, Yearbooks & Canada-Lifetouch National School Studios, 2006 to 2014; Vice President/General Manager of Jostens, Inc., 2002 to 2006; Senior Vice President of Fortis Group, 1997 to 2002 | 35 | None | |||||
| Arthur C. Reeds, III (1944) 5701 Golden Hills Drive Minneapolis, MN 55416 | Trustee | Since 10/99 | Retired; Senior Investment Officer, Hartford Foundation for Public Giving, 2000 to 2003; Chairman, Chief Executive and President of Conning Corp., 1999 to 2000 | 35 | Connecticut Water Service, Inc. |
Interested Trustees(3)
| Name, Address, and Year of Birth | Positions Held with Allianz VIP and VIP FOF Trust | Term of Office(2)/Length of Time Served | Principal Occupation(s) During Past 5 Years | Number of Portfolios Overseen for Allianz VIP and VIP FOF Trust | Other AZL Fund Complex | |||||
Brian Muench (1970) 5701 Golden Hills Drive | Trustee | Since 6/11 | President, Allianz Investment Management LLC, November 2010 to present; Vice President, Allianz Life, April 2011 to present | 35 | None |
18
Officers
| Name, Address, and Age | Positions Held with Allianz VIP and VIP FOF Trust | Term of Office(2)/Length of Time Served | Principal Occupation(s) During Past 5 Years | |||
Brian Muench (1970) 5701 Golden Hills Drive | President | Since 11/10 | President, Allianz Investment Management LLC, November 2010 to present; Vice President, Allianz Life, April 2011 to present. | |||
| Michael Radmer (1945) Dorsey & Whitney LLP, Suite 1500 50 South Sixth Street Minneapolis, MN 55402-1498 | Secretary | Since 02/02 | Senior Counsel (previously, Partner), Dorsey and Whitney LLP since 1976. | |||
| Bashir C. Asad (1963) Citi Fund Services Ohio, Inc. 4400 Easton Commons, Suite 200 Columbus, OH 43219 | Treasurer, Principal Accounting Officer and Principal Financial Officer | Since 06/16 | Senior Vice President, Citi Fund Services Ohio, Inc. | |||
| Chris R. Pheiffer (1968) 5701 Golden Hills Drive Minneapolis, MN 55416 | Chief Compliance Officer(4) and Anti-MoneyLaundering Compliance Officer | Since 02/14 | Chief Compliance Officer of the VIP Trust and the FOF Trust, February 2014 to present; Deputy Chief Compliance Officer of the VIP Trust and the FOF Trust and Compliance Director, Allianz Life, February 2007 to February 2014. |
| (1) | Member of the Audit Committee. |
| (2) | Indefinite. |
| (3) | Is an “interested person”, as defined by the 1940 Act, due to employment by Allianz. |
| (4) | The Manager and the Trust are parties to a Chief Compliance Officer Agreement under which the Manager is compensated by the Trust for providing an employee of the Manager or one of its affiliates to act as the Trust’s Chief Compliance Officer. The Chief Compliance Officer and Anti-Money Laundering Compliance Officer is not considered a corporate officer or executive employee of the Trust. |
19
The Allianz VIP Fund of Funds are distributed by Allianz Life Financial Services, LLC. These Funds are not FDIC Insured. | ANNRPT1217 2/18 |
AZL® MVP T. Rowe Price Capital Appreciation Plus Fund
Annual Report
December 31, 2017
Table of Contents
Management Discussion and Analysis
Page 1
Expense Examples and Portfolio Composition
Page 3
Schedule of Portfolio Investments
Page 4
Statement of Assets and Liabilities
Page 5
Page 5
Statements of Changes in Net Assets
Page 6
Page 7
Notes to the Financial Statements
Page 8
Report of Independent Registered Public Accounting Firm
Page 13
Other Federal Income Tax Information
Page 14
Page 15
Approval of Investment Advisory Agreement
Page 16
Information about the Board of Trustees and Officers
Page 18
This report is submitted for the general information of the shareholder of the Fund. The report is not authorized for distribution to prospective investors in the Fund unless preceded or accompanied by an effective prospectus, which contains details concerning the sales charges and other pertinent information.
AZL® MVP T. Rowe Price Capital Appreciation Plus Fund (unaudited)
Allianz Investment Management LLC
serves as the Manager for the AZL®
MVP T. Rowe Price Capital
Appreciation Plus Fund.
What factors affected the Fund’s performance during the year ended December 31, 2017?
For the year ended December 31, 2017, the AZL® MVP T. Rowe Price Capital Appreciation Plus Fund (the “Fund”) returned 14.21%. That compared to a 21.83%, 3.54% and a 14.26% total return for its benchmarks, the S&P 500 Index1, the Bloomberg Barclays U.S. Aggregate Bond Index1, and the Balanced Composite Index1, respectively.
The Fund is a fund of funds that invests primarily in a combination of three underlying mutual funds (the “Underlying Funds”), which are managed by the Manager. The Fund is designed to provide a diversified portfolio consisting of Underlying Funds in equity and fixed income asset classes, combined with the MVP (Managed Volatility Portfolio) risk management process intended to adjust the risk of the portfolio based on quantitative indicators of market risk, such as the current level of fund and market volatility.*
Lifted in part by favorable corporate earnings and economic growth, U.S. stocks posted excellent returns for the 12-month period under review. Throughout the year, U.S. equities were buoyed by hopes for the new administration’s promise of lower tax rates, reduced regulation and increased infrastructure spending. The Federal Reserve raised short-term interest rates three times in 2017, but the central bank’s moves were widely expected and did not disrupt equity markets.
In the closing weeks of the year, the administration signed tax legislation that reduced tax rates for corporations and closely held businesses, reduced marginal tax rates for individuals at most income levels, and changed the limits for various individual tax deductions. Most major U.S. stock indexes finished the year near record levels amid expectations that the new tax law would accelerate gross domestic product2 growth in 2018.
The Fund’s exposure to passive strategies through the AZL S&P 500 Index Fund and the AZL Enhanced Bond Index Fund dragged on absolute returns, as those portions underperformed the active equity and fixed income portions of the AZL T. Rowe Price Capital Appreciation Fund.*
The Fund’s equity holdings outperformed the S&P 500 Index for the period. Within equities, stock selection in the health care sector contributed to relative outperformance. An underweight position and stock selection in energy also benefited on a relative basis. By comparison, stock selection and a below-benchmark exposure to information technology stocks detracted, as that sector outperformed.
The portfolio’s fixed income holdings also posted a positive return during the one-year period, although AZL Enhanced Bond Index Fund underperformed the Fund’s active fixed income component.*
The Fund’s above-benchmark exposure to high-yield securities within its fixed income holdings added to relative performance. An underweight exposure to U.S. Treasuries also benefited, as the 10-year Treasury yield ended the year relatively unchanged.*
The Fund maintained exposure to covered call options—a type of derivative that provided downside protection for the portfolio while offering the benefits of owning a stock, such as dividends and capital appreciation, so long as the stock remains below the option strike price. The Fund’s exposure to equity options detracted from returns, as the Fund wrote call options on some stocks that increased significantly. The Fund held rights at various points during the period to buy stocks at a predetermined price in the future, generating minimal exposure.*
The MVP risk management process, which includes the use of derivatives, worked as intended during the period under review. Given that the period was marked by low volatility, the MVP process maintained a neutral equity allocation for the year relative to its target. The MVP process detracted slightly from relative results due to mismatches between the hedging instruments used and the target equity and fixed income exposure.*
Past performance does not guarantee future results.
| * | The Fund’s portfolio composition is subject to change. There is no guarantee that any sectors mentioned will continue to perform well or that securities in such sectors will be held by the Fund in the future. The information contained in this commentary is for informational purposes only and should not be construed as a recommendation to purchase or sell securities in the sector mentioned. The Fund’s holdings and weightings are as of December 31, 2017. |
| 1 | For a complete description of the Fund’s performance benchmarks please refer to page 2 of this report. |
| 2 | Gross Domestic Product (GDP) is the measure of the market value of the goods and services produced in a period of time. |
1
AZL® MVP T. Rowe Price Capital Appreciation Plus Fund (unaudited)
Fund Objective
The Fund’s investment objective is to seek long-term capital appreciation with preservation of capital as an important intermediate-term objective. This objective may be changed by the Trustees of the Fund without shareholder approval. The Fund seeks to achieve its objective by investing in a combination of Index Strategy Underlying Funds that represent different classes in the Fund’s asset allocation.
Investment Concerns
The Fund invests in underlying funds, so its investment performance is directly related to the performance of those underlying funds. Before investing, investors should assess the risks associated with and types of investments made by each of the underlying funds in which the Fund invests.
Emerging market investing may be subject to additional economic, political, liquidity, and currency risks not associated with more developed countries.
International investing may involve risk of capital loss from unfavorable fluctuations in currency values, from differences in generally accepted accounting principles or from economic or political instability in other nations.
The performance of the Fund is expected to be lower than that of the Indices because of Fund fees and expenses. Securities in which the Fund will invest may involve substantial risk and may be subject to sudden severe price declines.
Value-based investments are subject to the risk that the broad market may not recognize their intrinsic value.
Small- to mid-capitalization companies typically have a higher risk of failure and historically have experienced a greater degree of volatility.
Investing in a single industry or sector, or concentrating investments in a limited number of industries or sectors, tends to increase the risk that economic, political, or regulatory developments affecting certain industries or sectors will have a large impact on the value of the portfolio.
High-yield bonds have a higher risk of default or other adverse credit events, but have the potential to pay higher earnings over investment-grade bonds. The higher risk of default, or the inability of the creditor to repay its debt, is the primary reason for the higher interest rates on high-yield bonds.
Debt securities held by the Fund may decline in value due to rising interest rates. Interest rates in the U.S. are at, or near, historic lows, which may increase the Fund’s exposure to risks related to rising rates.
Investing in derivatives instruments involves risks that may be different from or greater than the risk associated with investing directly in securities or other traditional instruments.
For a complete description of these and other risks associated with investing in a mutual Fund, please refer to the Fund’s
Growth of $10,000 Investment
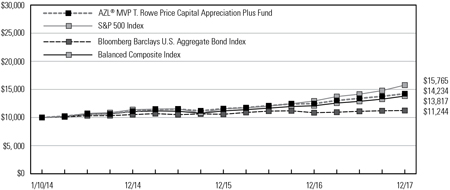
The chart above represents a comparison of a hypothetical investment in the Fund versus a similar investment in the Fund’s benchmarks as well as the component indices of the Fund’s benchmark, and represents the reinvestment of dividends and capital gains in the Fund.
Average Annual Total Returns as of December 31, 2017
| 1 Year | 3 Year | Since Inception (1/10/14) | ||||||||||
AZL® MVP T. Rowe Price Capital Appreciation Plus Fund | 14.21 | % | 8.58 | % | 9.29 | % | ||||||
S&P 500 Index | 21.83 | % | 11.41 | % | 12.14 | % | ||||||
Bloomberg Barclays U.S. Aggregate Bond Index | 3.54 | % | 2.24 | % | 2.99 | % | ||||||
Balanced Composite Index | 14.26 | % | 7.76 | % | 8.48 | % | ||||||
Past performance does not guarantee future results. The performance data quoted represents past performance and current returns may be lower or higher. The investment return and principal value will fluctuate so that an investor’s shares, when redeemed may be worth more or less than the original cost. To obtain performance information current to the most recent month end, please visit www.Allianzlife.com.
Expense Ratio | Gross | |||
AZL® MVP T. Rowe Price Capital Appreciation Plus Fund | 0.87 | % | ||
The above expense ratio is based on the current Fund prospectus dated May 1, 2017. The Manager and the Fund have entered into a written contract limiting operating expenses, excluding certain expenses (such as interest expense and acquired fund fees and expenses), to 0.15% through April 30, 2019. Additional information pertaining to the December 31, 2017 expense ratios can be found in the financial highlights.
Acquired fund fees and expenses are incurred indirectly by the Fund through the valuation of the Fund’s investments in the other investment companies. Accordingly, acquired fees and expenses affect the Fund’s total returns. Because these fees and expenses are not included in the Fund’s financial highlights, the Fund’s total annual fund operating expenses, as shown in the current prospectus, do not correlate to the ratios of expenses to average net assets shown in the financial highlights table. Without acquired fund fees and expenses the Fund’s gross expense ratio would be 0.12%.
The total return of the Fund does not reflect the effect of any insurance charges, the annual maintenance fee or the deduction of taxes that a shareholder would pay on Fund distributions or the redemption of Fund shares. Such charges, fees and tax payments would reduce the performance quoted.
The Fund’s performance is measured against the Standard and Poor’s 500 Index (“S&P 500”), the Bloomberg Barclays U.S. Aggregate Bond Index and the Balanced Composite Index (“Composite”). The S&P 500 is representative of 500 selected common stocks, most of which are listed on the New York Stock Exchange, and is a measure of the U.S. Stock market as a whole. The Bloomberg Barclays U.S. Aggregate Bond Index is a market value-weighted performance benchmark for investment-grade fixed-rate debt issues, including government, corporate, asset-backed, and mortgage-backed securities, with maturities of at least one year. The Composite is a blended index comprised of (60%) of the S&P 500 and (40%) of the Bloomberg Barclays U.S. Aggregate Bond Index. These indexes are unmanaged and do not reflect the deduction of fees associated with a mutual fund, such as investment management and fund accounting fees. The Fund’s performance reflects the deduction of fees for services provided to the Fund. Investors cannot invest directly in an index.
2
AZL MVP T. Rowe Price Capital Appreciation Plus Fund
(Unaudited)
As a shareholder of the AZL MVP T. Rowe Price Capital Appreciation Plus Fund (the “Fund”), you incur ongoing costs, including management fees, distribution fees, and other Fund expenses. These examples are intended to help you understand your ongoing costs (in dollars) of investing in the Fund and to compare these costs with the ongoing costs of investing in other mutual funds. Please note that the expenses shown in each table do not reflect expenses that apply to the subaccount or the insurance contract. If the expenses that apply to the subaccount of the insurance contract were included, your costs would have been higher.
These examples are based on an investment of $1,000 invested at the beginning of the period and held for the periods presented below.
The Actual Expense table below provides information about actual account values and actual expenses. You may use the information below, together with the amount you invested, to estimate the expenses that you paid over the period. Simply divide your account value by $1,000 (for example, an $8,600 account value divided by $1,000 = 8.6), then multiply the result by the number in the table under the heading entitled “Expenses Paid During Period” to estimate the expenses you paid on your account during this period.
| Beginning Account Value 7/1/17 | Ending Account Value 12/31/17 | Expenses Paid During Period 7/1/17 - 12/31/17* | Annualized Expense Ratio During Period 7/1/17 - 12/31/17 | |||||||||||||||||
AZL MVP T. Rowe Price Capital Appreciation Plus Fund | $ | 1,000.00 | $ | 1,061.60 | $ | 0.57 | 0.11 | % | ||||||||||||
The Hypothetical Expense table below provides information about hypothetical account values and hypothetical expenses based on the Fund’s actual expense ratio and an assumed rate of return of 5% per year before expenses, which is not the Fund’s actual return. The hypothetical account values and expenses may not be used to estimate the actual ending account balance or expenses you paid for the period. You may use this information to compare this 5% hypothetical example with the 5% hypothetical examples that appear in the shareholder reports of other funds.
| Beginning Account Value 7/1/17 | Ending Account Value 12/31/17 | Expenses Paid During Period 7/1/17 - 12/31/17* | Annualized Expense Ratio During Period 7/1/17 - 12/31/17 | |||||||||||||||||
AZL MVP T. Rowe Price Capital Appreciation Plus Fund | $ | 1,000.00 | $ | 1,024.65 | $ | 0.56 | 0.11 | % | ||||||||||||
| * | Expenses are equal to the average account value over the period, multiplied by the Fund’s annualized expense ratio, multiplied by 184/365 (to reflect the one half year period). |
Portfolio Composition
(Unaudited)
| Investments | Percent of Net Assets | ||||
Domestic Equities | 77.0 | ||||
Fixed Income | 18.0 | ||||
Money Market | — | NM | |||
|
| ||||
Total Investment Securities | 95.0 | ||||
Net other assets (liabilities) | 5.0 | ||||
|
| ||||
Net Assets | 100.0 | % | |||
|
| ||||
| NM | Represents less than 0.05% |
3
AZL MVP T. Rowe Price Capital Appreciation Plus Fund
Schedule of Portfolio Investments
December 31, 2017
| Shares | Fair Value | |||||||
| Affiliated Investment Companies (95.0%): | ||||||||
| 18,070,528 | AZL Enhanced Bond Index Fund | $ | 196,788,055 | |||||
| 18,467,863 | AZL S&P 500 Index Fund, Class 2 | 297,886,624 | ||||||
| 30,302,669 | AZL T. Rowe Price Capital Appreciation Fund | 546,357,130 | ||||||
|
| |||||||
Total Affiliated Investment Companies (Cost $933,916,360) | 1,041,031,809 | |||||||
|
| |||||||
| Unaffiliated Investment Company (0.0%): | ||||||||
| 57,682 | Dreyfus Treasury Prime Cash Management Fund, Institutional Shares , 1.11%(a) | 57,682 | ||||||
|
| |||||||
Total Unaffiliated Investment Company (Cost $57,682) | 57,682 | |||||||
|
| |||||||
Total Investment Securities (Cost $933,974,042)(b) — 95.0% | 1,041,089,491 | |||||||
Net other assets (liabilities) — 5.0% | 55,003,695 | |||||||
|
| |||||||
Net Assets — 100.0% | $ | 1,096,093,186 | ||||||
|
| |||||||
Percentages indicated are based on net assets as of December 31, 2017.
| (a) | The rate represents the effective yield at December 31, 2017. |
| (b) | See Federal Tax Information listed in the Notes to the Financial Statements. |
Futures Contracts
Cash of $54,765,387 has been segregated to cover margin requirements for the following open contracts as of December 31, 2017:
Long Futures
| Description | Expiration Date | Number of Contracts | Notional Amount | Unrealized Appreciation/ (Depreciation) | ||||||||||||
S&P 500 Index E-Mini March Futures (U.S. Dollars) | 3/19/18 | 244 | $ | 32,647,200 | $ | 537,705 | ||||||||||
U.S. Treasury 10-Year Note March Futures (U.S. Dollars) | 3/21/18 | 176 | 21,832,250 | (116,581 | ) | |||||||||||
|
| |||||||||||||||
| $ | 421,124 | |||||||||||||||
|
| |||||||||||||||
See accompanying notes to the financial statements.
4
AZL MVP T. Rowe Price Capital Appreciation Plus Fund
Statement of Assets and Liabilities
December 31, 2017
Assets: | |||||
Investment in non-affiliates, at cost | $ | 57,682 | |||
Investments in affiliates, at cost | 933,916,360 | ||||
|
| ||||
Total Investment securities, at cost | $ | 933,974,042 | |||
|
| ||||
Investment in non-affiliates, at value | $ | 57,682 | |||
Investments in affiliates, at value | 1,041,031,809 | ||||
|
| ||||
Total Investment securities, at value | 1,041,089,491 | ||||
Segregated cash for collateral | 54,765,387 | ||||
Interest and dividends receivable | 50,563 | ||||
Receivable for capital shares issued | 368,681 | ||||
Prepaid expenses | 6,354 | ||||
|
| ||||
Total Assets | 1,096,280,476 | ||||
|
| ||||
Liabilities: | |||||
Payable for investments purchased | 57,682 | ||||
Manager fees payable | 92,897 | ||||
Administration fees payable | 3,949 | ||||
Administrative and compliance services fees payable | 2,479 | ||||
Transfer agent fees payable | 747 | ||||
Trustee fees payable | 1,597 | ||||
Other accrued liabilities | 27,939 | ||||
|
| ||||
Total Liabilities | 187,290 | ||||
|
| ||||
Net Assets | $ | 1,096,093,186 | |||
|
| ||||
Net Assets Consist of: | |||||
Capital | $ | 940,932,224 | |||
Accumulated net investment income/(loss) | 10,982,539 | ||||
Accumulated net realized gains/(losses) from investment transactions | 36,641,850 | ||||
Net unrealized appreciation/(depreciation) on investments | 107,536,573 | ||||
|
| ||||
Net Assets | $ | 1,096,093,186 | |||
|
| ||||
Shares of beneficial interest (unlimited number of shares authorized, no par value) | 86,222,376 | ||||
Net Asset Value (offering and redemption price per share) | $ | 12.71 | |||
|
|
For the Year Ended December 31, 2017
Investment Income: | |||||
Dividends from affiliates | $ | 11,129,173 | |||
Interest | 445,148 | ||||
Dividends | 2,568 | ||||
Other income | 2,005 | ||||
|
| ||||
Total Investment Income | 11,578,894 | ||||
|
| ||||
Expenses: | |||||
Manager fees | 1,004,169 | ||||
Administration fees | 52,705 | ||||
Administrative and compliance services fees | 12,061 | ||||
Transfer agent fees | 5,341 | ||||
Trustee fees | 42,270 | ||||
Professional fees | 44,902 | ||||
Shareholder reports | 22,413 | ||||
Other expenses | 11,443 | ||||
|
| ||||
Total expenses | 1,195,304 | ||||
|
| ||||
Net Investment Income/(Loss) | 10,383,590 | ||||
|
| ||||
Realized and Unrealized Gains/(Losses) on Investments: | |||||
Net realized gains/(losses) on securities transactions from affiliates | 1,333,041 | ||||
Net realized gains distributions from affiliated underlying funds | 31,289,697 | ||||
Net realized gains/(losses) on futures contracts | 5,300,132 | ||||
Change in net unrealized appreciation/depreciation on affiliated transactions | 83,484,924 | ||||
Change in net unrealized appreciation/depreciation on futures contracts | 475,304 | ||||
|
| ||||
Net Realized/Unrealized Gains/(Losses) on Investments | 121,883,098 | ||||
|
| ||||
Change in Net Assets Resulting From Operations | $ | 132,266,688 | |||
|
|
See accompanying notes to the financial statements.
5
AZL MVP T. Rowe Price Capital Appreciation Plus Fund
Statements of Changes in Net Assets
| For the Year Ended December 31, 2017 | For the Year Ended December 31, 2016 | |||||||||
Change In Net Assets: | ||||||||||
Operations: | ||||||||||
Net investment income/(loss) | $ | 10,383,590 | $ | 4,770,834 | ||||||
Net realized gains/(losses) on investment transactions | 37,922,870 | 25,557,189 | ||||||||
Change in unrealized appreciation/depreciation on investments | 83,960,228 | 28,194,103 | ||||||||
|
|
|
| |||||||
Change in net assets resulting from operations | 132,266,688 | 58,522,126 | ||||||||
|
|
|
| |||||||
Distributions to Shareholders: | ||||||||||
From net investment income | (12,492,263 | ) | (12,329,148 | ) | ||||||
From net realized gains | (18,428,483 | ) | (4,719,453 | ) | ||||||
|
|
|
| |||||||
Change in net assets resulting from distributions to shareholders | (30,920,746 | ) | (17,048,601 | ) | ||||||
|
|
|
| |||||||
Capital Transactions: | ||||||||||
Proceeds from shares issued | 107,423,431 | 194,423,422 | ||||||||
Proceeds from dividends reinvested | 30,920,746 | 17,048,601 | ||||||||
Value of shares redeemed | (43,312,937 | ) | (17,628,201 | ) | ||||||
|
|
|
| |||||||
Change in net assets resulting from capital transactions | 95,031,240 | 193,843,822 | ||||||||
|
|
|
| |||||||
Change in net assets | 196,377,182 | 235,317,347 | ||||||||
Net Assets: | ||||||||||
Beginning of period | 899,716,004 | 664,398,657 | ||||||||
|
|
|
| |||||||
End of period | $ | 1,096,093,186 | $ | 899,716,004 | ||||||
|
|
|
| |||||||
Accumulated net investment income/(loss) | $ | 10,982,539 | $ | 12,492,263 | ||||||
|
|
|
| |||||||
Share Transactions: | ||||||||||
Shares issued | 8,806,847 | 17,453,257 | ||||||||
Dividends reinvested | 2,526,205 | 1,516,780 | ||||||||
Shares redeemed | (3,545,096 | ) | (1,590,113 | ) | ||||||
|
|
|
| |||||||
Change in shares | 7,787,956 | 17,379,924 | ||||||||
|
|
|
| |||||||
See accompanying notes to the financial statements.
6
AZL MVP T. Rowe Price Capital Appreciation Plus Fund
(Selected data for a share of beneficial interest outstanding throughout the periods indicated)
| Year Ended December 31, | January 10, 2014 to December 31, 2014(a) | |||||||||||||||||||
| 2017 | 2016 | 2015 | ||||||||||||||||||
Net Asset Value, Beginning of Period | $ | 11.47 | $ | 10.88 | $ | 10.45 | $ | 10.00 | ||||||||||||
|
|
|
|
|
|
|
| |||||||||||||
Investment Activities: | ||||||||||||||||||||
Net Investment Income/(Loss) | 0.11 | 0.03 | 0.04 | 0.01 | ||||||||||||||||
Net Realized and Unrealized Gains/(Losses) on Investments | 1.50 | 0.79 | 0.39 | 1.11 | ||||||||||||||||
|
|
|
|
|
|
|
| |||||||||||||
Total from Investment Activities | 1.61 | 0.82 | 0.43 | 1.12 | ||||||||||||||||
|
|
|
|
|
|
|
| |||||||||||||
Dividends to Shareholders From: | ||||||||||||||||||||
Net Investment Income | (0.15 | ) | (0.17 | ) | — | (0.01 | ) | |||||||||||||
Net Realized Gains | (0.22 | ) | (0.06 | ) | — | (b) | (0.66 | ) | ||||||||||||
|
|
|
|
|
|
|
| |||||||||||||
Total Dividends | (0.37 | ) | (0.23 | ) | — | (b) | (0.67 | ) | ||||||||||||
|
|
|
|
|
|
|
| |||||||||||||
Net Asset Value, End of Period | $ | 12.71 | $ | 11.47 | $ | 10.88 | $ | 10.45 | ||||||||||||
|
|
|
|
|
|
|
| |||||||||||||
Total Return(c) | 14.21 | % | 7.62 | % | 4.15 | % | 11.19 | %(d) | ||||||||||||
Ratios to Average Net Assets/Supplemental Data: | ||||||||||||||||||||
Net Assets, End of Period (000’s) | $ | 1,096,093 | $ | 899,716 | $ | 664,399 | $ | 288,843 | ||||||||||||
Net Investment Income/(Loss)(e) | 1.03 | % | 0.61 | % | 0.49 | % | 0.26 | % | ||||||||||||
Expenses Before Reductions*(e)(f) | 0.12 | % | 0.12 | % | 0.13 | % | 0.14 | % | ||||||||||||
Expenses Net of Reductions*(e) | 0.12 | % | 0.12 | % | 0.13 | % | 0.14 | % | ||||||||||||
Portfolio Turnover Rate | 3 | % | 52 | %(g) | 1 | % | 1 | %(d) | ||||||||||||
| * | The expense ratios exclude the impact of fees/expenses paid by each underlying fund. |
| (a) | Period from commencement of operations. |
| (b) | Represents less than $0.005. |
| (c) | The returns include reinvested dividends and fund level expenses, but exclude insurance contract charges. If these charges were included, the returns would have been lower. |
| (d) | Not annualized for periods less than one year. |
| (e) | Annualized for periods less than one year. |
| (f) | Excludes fee reductions. If such fee reductions had not occurred, the ratios would have been as indicated. |
| (g) | Effective October 14, 2016, the investment strategy of the Fund changed. Costs of purchases and proceeds from sales of portfolio securities associated with the changes in investment strategy contributed to higher portfolio turnover rate for the period ended December 31, 2016 as compared to prior years. |
See accompanying notes to the financial statements.
7
AZL MVP T. Rowe Price Capital Appreciation Plus Fund
Notes to the Financial Statements
December 31, 2017
1. Organization
The Allianz Variable Insurance Products Fund of Funds Trust (the “Trust”) was organized as a Delaware statutory trust on June 16, 2004. The Trust is a diversified open-end management investment company registered under the Investment Company Act of 1940, as amended, (the “1940 Act”) and thus is determined to be an investment company for accounting purposes. The Trust consists of 12 separate investment portfolios (collectively, the “Funds”), of which one is included in this report, the AZL MVP T. Rowe Price Capital Appreciation Plus Fund (the “Fund”), and 11 are presented in separate reports.
The Fund is a “fund of funds,” which means that the Fund invests primarily in other mutual funds. Underlying Funds invest in stock, bonds, and other securities and reflect varying amounts of potential investment risk and reward. The Underlying Funds record their investments at fair value. Periodically, the Fund will adjust its asset allocation as it seeks to achieve its investment objective.
The Trust is authorized to issue an unlimited number of shares of the Fund without par value. Shares of the Fund are available through the variable annuity contracts offered through the separate accounts of participating insurance companies. Currently, the Fund only offers its shares to separate accounts of Allianz Life Insurance Company of North America and Allianz Life Insurance Company of New York, affiliates of the Trust and the Manager, as defined below.
Under the Trust’s organizational documents, its officers and trustees are indemnified against certain liabilities arising out of the performance of their duties to the Fund. In addition, in the normal course of business, the Fund may enter into contracts with its vendors and others that provide for general indemnifications. The Fund’s maximum exposure under these arrangements is unknown, as this would involve future claims that may be made against the Fund. However, based on experience, the Fund expects that risk of loss to be remote.
2. Significant Accounting Policies
The following is a summary of significant accounting policies followed by the Fund in the preparation of its financial statements. The policies conform with U.S. generally accepted accounting principles (“U.S. GAAP”). The preparation of financial statements requires management to make certain estimates and assumptions that affect the reported amounts of assets and liabilities and disclosure of contingent assets and liabilities at the date of the financial statements and the reported amounts of increases and decreases in net assets from operations during the reporting period. Actual results could differ from those estimates.
Security Valuation
The Fund records its investments at fair value. Fair value is defined as the price that would be received to sell an asset or paid to transfer a liability in an orderly transaction between willing market participants at the measurement date. The valuation techniques used to determine fair value are further described in Note 4 below.
Investment Transactions and Investment Income
Investment transactions are accounted for on trade date. Net realized gains and losses on investments sold and on foreign currency transactions are recorded on the basis of identified cost. Interest income is recorded on the accrual basis and includes, where applicable, the amortization of premiums or accretion of discounts.
Dividends to Shareholders
Dividends to shareholders are recorded on the ex-dividend date. The Fund distributes its dividends from net investment income and net realized capital gains, if any, on an annual basis. The amount of dividends from net investment income and from net realized gains is determined in accordance with federal income tax regulations, which may differ from U.S. GAAP. These “book/tax” differences are either temporary or permanent in nature. To the extent these differences are permanent in nature (e.g., miscellaneous adjustments on return of capital), such amounts are reclassified within the composition of net assets based on their federal tax-basis treatment; temporary differences (e.g., wash sales and differing treatment on certain investments) do not require reclassification. Dividends to shareholders that exceed net investment income and net realized gains for tax purposes are reported as distributions of capital.
Expense Allocation
Expenses directly attributable to the Fund are charged directly to the Fund, while expenses attributable to more than one Fund are allocated among the respective Funds based upon relative net assets or some other reasonable method. Expenses which are attributable to more than one Trust are allocated across the Allianz Variable Insurance Products and Allianz Variable Insurance Products Fund of Funds Trusts based upon relative net assets or another reasonable basis. Allianz Investment Management LLC (the “Manager”), serves as the investment manager for the Trust and the Allianz Variable Insurance Products Trust.
Derivative Instruments
All open derivative positions at period end are reflected on the Fund’s Schedule of Portfolio Investments. The following is a description of the derivative instruments utilized by the Fund, including the primary underlying risk exposures related to each instrument type. The Fund’s allocation to the MVP (Managed Volatility Portfolio) risk management process may include (a) derivatives such as index futures, other futures contracts, options, and other similar securities and (b) cash, money market equivalents, short-term debt instruments, money market funds, and short-term debt funds to satisfy all applicable margin requirements and to provide additional portfolio liquidity to satisfy large redemptions and any margin calls. Due to the leverage provided by derivatives, the notional value of the Fund’s derivative positions could exceed 20% of the Fund’s value. The Fund may also use futures to gain equity exposure and may hold cash as a buffer in the event of market shocks.
Futures Contracts
During the year ended December 31, 2017, the Fund invested in futures contracts to reduce volatility and limit the need to decrease or increase allocations to underlying funds. Futures contracts are valued based upon their quoted daily settlement prices. Upon entering into a futures contract, the Fund is required to segregate liquid assets in accordance
8
AZL MVP T. Rowe Price Capital Appreciation Plus Fund
Notes to the Financial Statements
December 31, 2017
with the initial margin requirements of the broker or exchange. Futures contracts are marked to market daily and a payable or receivable for the change in value (“variation margin”) is recorded by the Fund. Gains or losses are recognized but not considered realized until the contracts expire or are closed. Futures contracts involve, to varying degrees, elements of market risk (generally equity price risk related to stock futures, interest rate risk related to bond futures, and foreign currency risk related to currency futures) and exposure to loss in excess of the variation margin disclosed in the Statement of Assets and Liabilities. The primary risks associated with the use of futures contracts are the imperfect correlation between the change in fair value of the underlying securities and the prices of futures contracts, the possibility of an illiquid market, and the inability of the counterparty to meet the terms of the contract. For the year ended December 31, 2017, the monthly average notional amount for long contracts was $50.5 million. Realized gains and losses are reported as “Net realized gains/(losses) on futures contracts” on the Statement of Operations.
Summary of Derivative Instruments
The following is a summary of the fair values of derivative instruments on the Fund’s Statement of Assets and Liabilities, categorized by risk exposure, as of December 31, 2017:
Asset Derivative | Liability Derivative | |||||||||||
| Primary Risk Exposure | Statement of Assets and Liabilities Location | Total Fair Value* | Statement of Assets and Liabilities Location | Total Fair Value* | ||||||||
Equity Risk | ||||||||||||
| Equity Contracts | Receivable for variation margin on futures contracts | $ | 537,705 | Payable for variation margin on futures contracts | $ | — | ||||||
Interest Rate Risk | ||||||||||||
| Interest Rate Contracts | — | 116,581 | ||||||||||
| * | For futures contracts, the amounts represent the cumulative appreciation/depreciation of these futures contracts as reported in the Schedule of Portfolio Investments. Only current day’s variation margin is reported within the Statement of Assets and Liabilities as variation margin on futures contracts. |
The following is a summary of the effect of derivative instruments on the Statement of Operations, categorized by risk exposure, for the year ended December 31, 2017:
| Primary Risk Exposure | Location of Gains/(Losses) on Derivatives Recognized | Realized Gains/(Losses) on Derivatives Recognized | Change in Net Unrealized Appreciation/Depreciation on Derivatives Recognized | |||||||
Equity Risk | ||||||||||
| Equity Contracts | Net Realized gains/(losses) on futures contracts/Change in net unrealized appreciation/depreciation on futures contracts | $ | 5,143,812 | $ | 485,077 | |||||
Interest Rate Risk | ||||||||||
| Interest Rate Contracts | 156,320 | (9,773 | ) | |||||||
3. Fees and Transactions with Affiliates and Other Parties
The Manager provides investment advisory and management services for the Fund. The Manager has contractually agreed to waive fees and reimburse the Fund to limit the annual expenses, excluding interest expense (e.g., cash overdraft fees), taxes, brokerage commissions, acquired fund fees and expenses, other expenditures that are capitalized in accordance with U.S. GAAP and other extraordinary expenses not incurred in the ordinary course of the Fund’s business, based on the daily net assets of the Fund, through April 30, 2019. Expenses incurred for investment advisory and management services are reflected on the Statement of Operations as “Manager fees.”
For the year ended December 31, 2017, the annual rate paid to the Manager and the annual expense limit were as follows:
| Annual Rate | Annual Expense Limit | |||||||||
AZL MVP T. Rowe Price Capital Appreciation Plus Fund | 0.10 | % | 0.15 | % | ||||||
Any amounts contractually waived or reimbursed by the Manager in a particular fiscal year will be subject to repayment by the Fund to the Manager to the extent that from time to time through the next three fiscal years the repayment will not cause the Fund’s expenses to exceed the lesser of the stated limit at the time of the waiver or the current stated limit. Any amounts recouped by the Manager during the year are reflected on the Statement of Operations as “Recoupment of prior expenses reimbursed by the Manager.” At December 31, 2017, there were no remaining contractual reimbursements that are subject to repayment by the Fund in subsequent years.
In addition, the Manager may voluntarily waive or reimburse additional fees in order to maintain more competitive expense ratios. Any voluntary waivers or reimbursements are not subject to repayment in subsequent years. Information on the total amount waived/reimbursed by the Manager or repaid to the Manager by the Fund during the period can be found on the Statement of Operations. During the year ended December 31, 2017, there were no voluntary waivers.
9
AZL MVP T. Rowe Price Capital Appreciation Plus Fund
Notes to the Financial Statements
December 31, 2017
The Manager or an affiliate of the Manager serves as the investment adviser of certain underlying funds in which the Fund invests. At December 31, 2017, these underlying funds are noted as Affiliated Investment Companies in the Fund’s Schedule of Portfolio Investments. Additional information, including financial statements, about these Funds is available at www.allianzlife.com. The Manager or an affiliate of the Manager is paid a separate fee from the underlying funds for such services. A summary of the Fund’s investments in affiliated investment companies for the year ended December 31, 2017 is as follows:
| Fair Value 12/31/16 | Purchases at Cost | Proceeds from Sales | Net Realized | Net Change in Unrealized Appreciation/ Depreciation | Fair Value 12/31/17 | Shares as of 12/31/2017 | Dividend Income | Net realized gains distributions from affiliated underlying funds | |||||||||||||||||||||||||||||||||||||
AZL Enhanced Bond Index Fund | $ | 161,598,910 | $ | 38,841,447 | $ | (7,235,812 | ) | $ | (63,476 | ) | $ | 3,646,986 | $ | 196,788,055 | 18,070,528 | $ | 1,709,685 | $ | — | ||||||||||||||||||||||||||
AZL S&P 500 Index Fund, Class 2 | 245,130,882 | 32,534,284 | (17,201,642 | ) | 1,039,651 | 36,383,449 | 297,886,624 | 18,467,863 | 2,601,447 | 12,741,317 | |||||||||||||||||||||||||||||||||||
AZL T. Rowe Price Capital Appreciation Fund | 447,921,695 | 62,614,592 | (7,990,512 | ) | 356,866 | 43,454,489 | 546,357,130 | 30,302,669 | 6,818,041 | 18,548,380 | |||||||||||||||||||||||||||||||||||
|
|
|
|
|
|
|
|
|
|
|
|
|
|
|
|
|
| ||||||||||||||||||||||||||||
| $ | 854,651,487 | $ | 133,990,323 | $ | (32,427,966 | ) | $ | 1,333,041 | $ | 83,484,924 | $ | 1,041,031,809 | 66,841,060 | $ | 11,129,173 | $ | 31,289,697 | ||||||||||||||||||||||||||||
|
|
|
|
|
|
|
|
|
|
|
|
|
|
|
|
|
| ||||||||||||||||||||||||||||
Pursuant to separate agreements between the Funds and the Manager, the Manager provides a Chief Compliance Officer (“CCO”) and certain compliance oversight and regulatory filing services to the Trust. Under these agreements the Manager is entitled to an amount equal to a portion of the compensation and certain other expenses related to the individuals performing the CCO and compliance oversight services, as well as $100 per hour for time incurred in connection with the preparation and filing of certain documents with the Securities and Exchange Commission (“SEC” or the “Commission”). The fees are paid to the Manager on a quarterly basis. The total expenses incurred by the Fund for these services are reflected on the Statement of Operations as “Administrative and compliance services fees.”
Citi Fund Services Ohio, Inc. (“Citi” or the “Administrator”), a wholly owned subsidiary of Citigroup, Inc., with which an officer of the Trust is affiliated, serves as the Trust’s administrator and fund accountant, and assists the Trust in all aspects of its administration and operation. The Administrator is entitled to a fee, accrued daily and paid monthly. The Administrator is entitled to an annual fee for each additional class of shares of any Fund, certain annual fees in supporting fair values services, and a Trust-wide annual fee for providing infrastructure and support in implementing the written policies and procedures comprising the Fund’s compliance program. The Administrator is also reimbursed for certain expenses incurred. The total expenses incurred by the Fund for these services are reflected on the Statement of Operations as “Administration fees.”
FIS Investor Services LLC (“FIS”) serves as the Fund’s transfer agent. Under the Transfer Agent Agreement, the Trust pays FIS a fee for its services and reimburses FIS for all of their reasonable out-of-pocket expenses incurred in providing these services.
The Bank of New York Mellon (“BNY Mellon” or the “Custodian”) serves as the Trust’s custodian and securities lending agent. For these services as custodian, the Funds pay BNY Mellon a fee based on a percentage of assets held on behalf of the Funds, plus certain out-of-pocket charges.
Allianz Life Financial Services, LLC (“ALFS”), an affiliate of the Manager, serves as distributor of the Fund. ALFS receives an annual Trust-wide annual fee of $7,500, paid by the Manager from its profits and not by the Trust, for recordkeeping and reporting services.
In addition, certain legal fees and expenses are paid to a law firm, Dorsey & Whitney LLP, of which the Secretary of the Fund is Senior Counsel. During the year ended December 31, 2017, $10,168 was paid from the Fund relating to these fees and expenses.
Certain Officers and Trustees of the Trust are affiliated with the Manager or the Administrator. Such Officers (except for the Trust’s CCO as noted above) and Trustees receive no compensation from the Trust for serving in their respective roles. For their service to the Trust and to the Allianz Variable Insurance Products Trust, each non-interested Trustee receives a $170,000 annual Board retainer, the Lead Director receives an additional $42,500 annually and the Chair of the Nominating and Corporate Governance Committee receives an additional $25,500 annually. In addition, the Trustees are reimbursed for certain expenses associated with attending Board meetings. Compensation to the Trustees is allocated between the Trust and the Allianz Variable Insurance Products Fund of Funds Trust in proportion to the assets under management of each trust. During the year ended December 31, 2017, actual Trustee compensation was $1,116,333 in total for both trusts.
4. Investment Valuation Summary
The valuation techniques employed by the Fund, as described below, maximize the use of observable inputs and minimize the use of unobservable inputs in determining fair value. The inputs used for valuing the Fund’s investments are summarized in the three broad levels listed below:
| ● | Level 1 — quoted prices in active markets for identical assets |
| ● | Level 2 — other significant observable inputs (including quoted prices for similar securities, interest rates, prepayments speeds, credit risk, etc.) |
| ● | Level 3 — significant unobservable inputs (including the Fund’s own assumptions in determining the fair value of investments) |
Changes in valuation techniques may result in transfers in or out of an assigned level within the disclosure hierarchy. The Fund determines transfers between fair value hierarchy levels at the reporting period end. The inputs or methodology used for valuing investments is not necessarily an indication of the risk associated with investing in those investments.
Investments in other investment companies are valued at their published net asset value (“NAV”). Security prices are generally provided by an independent third party pricing service approved by the Trust’s Board of Trustees (the “Board” or “Trustees”) as of the close of the New York Stock Exchange (“NYSE”) (generally 4:00 pm Eastern Time). The investments utilizing Level 1 valuations represent investments in open-end investment companies. Futures contracts are valued at the last sales price as of the close of the primary exchange and are typically categorized as Level 1 in the fair value hierarchy.
For the year ended December 31, 2017, there were no Level 3 investments for which significant unobservable inputs were used to determine fair value. There were no significant transfers between Levels 1 and 2 as of December 31, 2017, based on levels assigned to securities on December 31, 2016.
10
AZL MVP T. Rowe Price Capital Appreciation Plus Fund
Notes to the Financial Statements
December 31, 2017
The following is a summary of the valuation inputs used as of December 31, 2017 in valuing the Fund’s investments based upon the three levels defined above:
| Investment Securities: | Level 1 | Level 2 | Level 3 | Total | ||||||||||||||||
Affiliated Investment Companies | $ | 1,041,031,809 | $ | — | $ | — | $ | 1,041,031,809 | ||||||||||||
Unaffiliated Investment Company | 57,682 | — | — | 57,682 | ||||||||||||||||
|
|
|
|
|
|
|
| |||||||||||||
Total Investment Securities | 1,041,089,491 | — | — | 1,041,089,491 | ||||||||||||||||
|
|
|
|
|
|
|
| |||||||||||||
Other Financial Instruments:* | ||||||||||||||||||||
Futures Contracts | 421,124 | — | — | 421,124 | ||||||||||||||||
|
|
|
|
|
|
|
| |||||||||||||
Total Investments | $ | 1,041,510,615 | $ | — | $ | — | $ | 1,041,510,615 | ||||||||||||
|
|
|
|
|
|
|
| |||||||||||||
| * | Other Financial Instruments would include any derivative instruments, such as futures contracts. These investments are generally presented in the financial statements at variation margin. |
5. Security Purchases and Sales
For the year ended December 31, 2017, cost of purchases and proceeds from sales of securities (excluding securities maturing less than one year from acquisition) were as follows:
| Purchases | Sales | |||||||||
AZL MVP T. Rowe Price Capital Appreciation Plus Fund | $ | 133,990,323 | $ | 32,427,966 | ||||||
6. Investment Risks
Derivatives Risk: The Fund may invest directly or through affiliated or unaffiliated mutual funds or unregistered investment pools in derivative instruments such as futures, options, and options on futures. A derivative is a financial contract whose value depends on, or is derived from, the value of an underlying asset, reference rate, or risk. Use of derivative instruments involves risks different from, or possibly greater than, the risks associated with investing directly in securities and other traditional investments. Derivatives are subject to a number of other risks, such as liquidity risk, interest rate risk, market risk, credit risk, and selection risk. Derivatives also involve the risk of mispricing or improper valuation and the risk that changes in the value may not correlate perfectly with the underlying asset, rate, or index. Using derivatives may result in losses, possibly in excess of the principal amount invested. Also, suitable derivative transactions may not be available in all circumstances. The other party to a derivatives contract could default.
Fund of Funds Risk: The Fund, as a shareholder of the underlying funds, indirectly bears its proportionate share of any investment management fees and other expenses of the underlying funds. Further due to the fees and expenses paid by the Fund, as well as small variations in the Fund’s actual allocations to the underlying funds and any futures and cash held in the Fund’s portfolio, the performance and income distributions of the Fund will not be the same as the performance and income distributions of the underlying funds.
7. Federal Tax Information
It is the policy of the Fund to continue to qualify as a regulated investment company by complying with the provisions available to certain investment companies, as defined under Subchapter M of the Internal Revenue Code, and to make distributions of net investment income and net realized gains sufficient to relieve it from all, or substantially all, federal income taxes. Accordingly, no provisions for federal income taxes are required in the financial statements.
Management of the Fund has reviewed tax positions taken in tax years that remain subject to examination by all major tax jurisdictions, including federal (i.e., the last four tax year ends and the interim tax period since then, as applicable). Management believes that there is no tax liability resulting from unrecognized tax benefits related to uncertain tax positions taken.
Cost of securities, including derivatives and short positions as applicable, for federal income tax purposes at December 31, 2017 is $934,772,280. The gross unrealized appreciation/(depreciation) on a tax basis is as follows:
Unrealized appreciation | $ | 106,317,211 | ||
Unrealized (depreciation) | — | |||
|
| |||
Net unrealized appreciation/(depreciation) | $ | 106,317,211 | ||
|
|
The tax character of dividends paid to shareholders during the year ended December 31, 2017 were as follows:
| Ordinary Income | Net Long-Term | Total Distributions(a) | |||||||||||||
AZL MVP T. Rowe Price Capital Appreciation Plus Fund | $ | 12,552,270 | $ | 18,368,476 | $ | 30,920,746 | |||||||||
| (a) | Total distributions paid may differ from the Statements of Changes in Net Assets because dividends are recognized when actually paid for tax purposes. |
11
AZL MVP T. Rowe Price Capital Appreciation Plus Fund
Notes to the Financial Statements
December 31, 2017
The tax character of dividends paid to shareholders during the year ended December 31, 2016 were as follows:
| Ordinary Income | Net Long-Term | Total Distributions(a) | |||||||||||||
AZL MVP T. Rowe Price Capital Appreciation Plus Fund | $ | 12,329,149 | $ | 4,719,452 | $ | 17,048,601 | |||||||||
| (a) | Total distributions paid may differ from the Statements of Changes in Net Assets because dividends are recognized when actually paid for tax purposes. |
At December 31, 2017, the components of accumulated earnings on a tax basis were as follows:
| Undistributed Ordinary Income | Undistributed Long-Term Capital Gains | Accumulated Capital and Other Losses | Unrealized Appreciation/ Depreciation(a) | Total Accumulated Earnings/ (Deficit) | |||||||||||||||||||||
AZL MVP T. Rowe Price Capital Appreciation Plus Fund | $ | 13,580,122 | $ | 35,263,629 | $ | — | $ | 106,317,211 | $ | 155,160,962 | |||||||||||||||
| (a) | The difference between book-basis and tax-basis unrealized appreciation/depreciation is attributable primarily to tax deferral of losses on wash sales. |
8. Ownership and Principal Holders
The beneficial ownership, either directly or indirectly, of more than 25% of the voting securities of a fund creates presumptions of control of the fund, under section 2 (a)(9) of the 1940 Act. As of December 31, 2017, the Fund had an individual shareholder account which is affiliated with the Investment Adviser representing ownership in excess of 85% of the Fund.
9. Investment Company Reporting Modernization
In October 2016, the SEC released its Final Rule on Investment Company Reporting Modernization (the “Rules”). The Rules which introduce two new regulatory reporting forms for investment companies — Form N-PORT and Form N-CEN — also contain amendments to Regulation S-X which require standardized, enhanced disclosures about derivatives in investment company financial statements, as well as other amendments. The amendments to Regulation S-X became effective for filings made with the SEC after August 1, 2017. The compliance date for form N-PORT and Form N-CEN will vary based on the reporting entity’s size and, in the case of the Fund, is expected to be April 30, 2019. The Fund’s adoption of these amendments, as applicable for the financial statements prepared as of December 31, 2017, had no effect on the Fund’s net assets or results of operations.
10. Subsequent Events
Management of the Fund has evaluated the need for additional disclosures or adjustments resulting from events through the date the financial statements were issued. Based on this evaluation, there were no subsequent events to report that would have material impact on the Fund’s financial statements
12
REPORT OF INDEPENDENT REGISTERED PUBLIC ACCOUNTING FIRM
To the Shareholders and Board of Trustees of
Allianz Variable Insurance Products Fund of Funds Trust:
Opinion on the Financial Statements
We have audited the accompanying statement of assets and liabilities of AZL MVP T. Rowe Price Capital Appreciation Plus Fund (the “Fund”) of the Allianz Variable Insurance Products Fund of Funds Trust, including the schedule of portfolio investments, as of December 31, 2017, and the related statement of operations for the year then ended, the statements of changes in net assets for each of the years in the two-year period then ended, and the related notes (collectively, the “financial statements”) and the financial highlights for each of the years in the three-year period then ended and the period from January 10, 2014 (commencement of operations) to December 31, 2014. In our opinion, the financial statements present fairly, in all material respects, the financial position of the Fund as of December 31, 2017, the results of its operations for the year then ended, the changes in its net assets for each of the years in the two-year period then ended, and the financial highlights for each of the years in the three-year period then ended and the period from January 10, 2014 to December 31, 2014, in conformity with U.S. generally accepted accounting principles.
Basis for Opinion
These financial statements and financial highlights are the responsibility of the Fund’s management. Our responsibility is to express an opinion on these financial statements and financial highlights based on our audits. We are a public accounting firm registered with the Public Company Accounting Oversight Board (United States) (“PCAOB”) and are required to be independent with respect to the Fund in accordance with the U.S. federal securities laws and the applicable rules and regulations of the Securities and Exchange Commission and the PCAOB.
We conducted our audits in accordance with the standards of the PCAOB. Those standards require that we plan and perform the audit to obtain reasonable assurance about whether the financial statements and financial highlights are free of material misstatement, whether due to error or fraud. Our audits included performing procedures to assess the risks of material misstatement of the financial statements and financial highlights, whether due to error or fraud, and performing procedures that respond to those risks. Such procedures included examining, on a test basis, evidence regarding the amounts and disclosures in the financial statements and financial highlights. Such procedures also included confirmation of securities owned as of December 31, 2017, by correspondence with the custodian, brokers and transfer agents of the underlying funds. Our audits also included evaluating the accounting principles used and significant estimates made by management, as well as evaluating the overall presentation of the financial statements and financial highlights. We believe that our audits provide a reasonable basis for our opinion.
/s/ KPMG LLP
We have served as the auditor of one or more Allianz Variable Insurance Products investment companies since 1999.
Columbus, Ohio
February 23, 2018
13
Other Federal Income Tax Information (Unaudited)
For the year ended December 31, 2017, 16.24% of the total ordinary income dividends paid by the Fund qualify for the corporate dividends received deduction available to corporate shareholders.
During the year ended December 31, 2017, the Fund declared net short-term capital gain distributions of $60,007.
During the year ended December 31, 2017, the Fund declared net long-term capital gain distributions of $18,368,477.
14
A description of the policies and procedures that the Fund uses to determine how to vote proxies relating to portfolio securities is available, without charge, upon request, by visiting the Securities and Exchange Commission’s (“Commission”) website at www.sec.gov, or by calling 800-624-0197.
Information regarding how the Fund voted proxies relating to portfolio securities during the most recent 12-month period ended June 30th is available (i) without charge, upon request, by calling 800-624-0197; (ii) on the Allianz Variable Insurance Products Trust’s website at https://www.allianzlife.com; and (iii) on the Commission’s website at http://www.sec.gov.
The Fund files complete Schedules of Portfolio Holdings with the Commission for the first and third quarters of each fiscal year on Form N-Q. Schedules of Portfolio Holdings for the Fund in this report are available without charge on the Commission’s website at http://www.sec.gov, or may be reviewed and copied at the Commission’s Public Reference Room in Washington, D.C. Information on the operation of the Public Reference Room may be obtained by calling 800-SEC-0330.
15
Approval of Investment Advisory Agreement (Unaudited)
Subject to the general supervision of the Board of Trustees (the “Board”) and in accordance with the investment objectives and restrictions of each separate series (together, the “Funds”) of the Allianz Variable Insurance Products Fund of Funds Trust (the “Trust”), investment advisory services are provided to the Funds by Allianz Investment Management LLC (the “Manager”). As used in this section, “Fund” refers to any of the Funds. The Manager manages each Fund pursuant to an investment management agreement (the “Management Agreement”) with the Trust in respect of each such Fund. The Management Agreement provides that the Manager, subject to the supervision and approval of the Board, is responsible for the management of each Fund. For management services, each Fund pays the Manager an investment advisory fee based upon each Fund’s average daily net assets. The Manager has contractually agreed to limit the expenses of each Fund by reimbursing the Fund if and when total Fund operating expenses exceed certain amounts until at least May 1, 2019 (the “Expense Limitation Agreement”).
In reviewing the services provided by the Manager and the terms of the Management Agreement, the Board receives and reviews information related to the Manager’s experience and expertise in the variable insurance marketplace. Currently, the Funds are offered only through variable annuities and variable life insurance policies, and not in the retail fund market. In addition, the Board receives information regarding the Manager’s expertise with regard to portfolio diversification and asset allocation requirements within variable insurance products issued by Allianz Life Insurance Company of North America (“Allianz Life”) and its subsidiary, Allianz Life Insurance Company of New York (“Allianz of New York”). Currently, the Funds are offered only through Allianz Life and Allianz of New York variable products.
As required by the Investment Company Act of 1940 (the “1940 Act”), the Board has reviewed and approved the Management Agreement with the Manager. The Board’s decision to approve this contract reflects the exercise of its business judgment on whether to approve new arrangements and continue the existing arrangements. During its review of the contract, the Board considered many factors, among the most material of which are: the Fund’s investment objectives and long-term performance; the Manager’s management philosophy, personnel, processes and investment performance, including its compliance history and the adequacy of its compliance processes; the preferences and expectations of Fund shareholders (and underlying contract owners) and their relative sophistication; the continuing state of competition in the mutual fund industry; and comparable fees in the mutual fund industry.
The Board also considered the compensation and benefits received by the Manager. This includes fees received for services provided to a Fund by employees of the Manager or of affiliates of the Manager and research services received by the Manager from brokers that execute Fund trades, as well as advisory fees. The Board considered the fact that: (1) the Manager and the Trust are parties to an Administrative Services Agreement and a Compliance Services Agreement, under which the Manager is compensated by the Trust for performing certain administrative and compliance services including providing an employee of the Manager or one of its affiliates to act as the Trust’s Chief Compliance Officer; and (2) Allianz Life Financial Services, LLC, an affiliated person of the Manager, is a registered securities broker-dealer and received (along with its affiliated persons) payments made by the underlying funds pursuant to Rule 12b-1.
The Board is aware that various courts have interpreted provisions of the 1940 Act and have indicated in their decisions that the following factors may be relevant to an adviser’s compensation: the nature and quality of the services provided by the adviser, including the performance of the fund; the adviser’s cost of providing the services; the extent to which the adviser may realize “economies of scale” as the fund grows larger; any indirect benefits that may accrue to the adviser and its affiliates as a result of the adviser’s relationship with the fund; performance and expenses of comparable funds; the profitability of acting as adviser to the fund; and the extent to which the independent Board members, who are not “interested persons” of a fund as defined by the 1940 Act, are fully informed about all facts bearing on the adviser’s services and fees. The Board is aware of these factors and takes them into account in its review of the Management Agreement for the Funds.
The Board considered and weighed these circumstances in light of its experience in governing the Trust, and is assisted in its deliberations by the advice of independent legal counsel to the independent Trustees. In this regard, the Board requests and receives a significant amount of information about the Funds and the Manager. Some of this information is provided at each regular meeting of the Board; additional information is provided in connection with the particular meeting or meetings at which the Board’s formal review of an advisory contract occurs. In between regularly scheduled meetings, the Board may receive information on particular matters as the need arises. Thus, the Board’s evaluation of the Management Agreement is informed by reports covering such matters as: the Manager’s investment philosophy, personnel and processes, and the Fund’s investment performance (in absolute terms as well as in relationship to its benchmark). In connection with comparing the performance of each Fund versus its benchmark, the Board receives reports on the extent to which the Fund’s performance may be attributed to various applicable factors, such as asset class allocation decisions and volatility management strategies, the performance of the underlying funds, rebalancing decisions, and the impact of cash positions and Fund fees and expenses. The Board also receives reports on the Funds’ expenses (including the advisory fee itself and the overall expense structure of the Funds, both in absolute terms and relative to similar and/or competing funds, with due regard for the Expense Limitation Agreement and additional voluntary expense limitations); the nature and extent of the advisory and other services provided to the Fund by the Manager and its affiliates; compliance and audit reports concerning the Funds and the companies that service them; and relevant developments in the mutual fund industry and how the Funds and/or the Manager are responding to them.
The Board also receives financial information about the Manager, including reports on the compensation and benefits the Manager derives from its relationships with the Funds. These reports cover not only the fees under the Management Agreement, but also fees, if any, received for providing other services to the Funds. The reports also discuss any indirect or “fall out” benefits the Manager or its affiliates may derive from its relationship with the Funds.
The Management Agreement was most recently considered at Board meetings held in the fall of 2017. Information relevant to the approval of the Management Agreement was considered at a telephonic Board meeting on October 18, 2017, and at an “in person” Board meeting held October 23, 2017. The Management Agreement was approved at the Board meeting of October 23, 2017. At such meeting the Board also approved the Expense Limitation Agreement between the Manager and the Trust for the period ending April 30, 2019. In connection with such meetings, the Trustees requested and evaluated extensive materials from the Manager, including performance and expense information for other investment companies with similar investment objectives derived from data compiled by an independent third party provider and other sources believed to be reliable by the Manager. Prior to voting, the Trustees reviewed the proposed approval/continuance of the Agreement with management and with experienced counsel who are independent of the Manager and received a memorandum from such counsel discussing the legal standards for their consideration of the proposed approvals/continuances. The independent Trustees also discussed the proposed approvals/continuances in a private session with such counsel at which no representatives of the Manager were present. In reaching their determinations relating to the approval and/or continuance of the Agreement, in respect of each Fund, the Board considered all factors it believed relevant. The Board based its decision to approve the Management Agreement on the totality of the circumstances and relevant factors, and with a view to past and future long-term considerations. Not all of the factors and considerations discussed above and below are necessarily relevant to every Fund, and the Board did not assign relative weights to factors discussed herein or deem any one or group of them to be controlling in and of themselves.
An SEC rule requires that shareholder reports include a discussion of certain factors relating to the selection of the investment adviser and the approval of the advisory fee. The “factors” enumerated by the SEC are set forth below in italics, as well as the Board’s conclusions regarding such factors:
(1) The nature, extent and quality of services provided by the Manager. The Trustees noted that the Manager, subject to the control of the Board, administers each Fund’s business and other affairs. The Trustees noted that the Manager also provides the Trust and each Fund with such administrative and other services (exclusive of, and in addition to, any such services provided by any others retained by the Trust on behalf of the Funds) and executive and other personnel as are necessary for the operation of the Trust and the Funds. Except for the Trust’s Chief Compliance Officer and certain compliance staff, the Manager pays all of the compensation of Trustees and officers of the Trust who are employees of the Manager or its affiliates.
16
The Board considered the scope and quality of services provided by the Manager and noted that the scope of such services provided had expanded as a result of recent regulatory and other developments. The Board noted that, for example, the Manager is responsible for maintaining and monitoring its own compliance program, and this compliance program has been continuously refined and enhanced in light of new regulatory requirements. The Board considered the capabilities and resources which the Manager has dedicated to performing services on behalf of the Trust and its Funds. The quality of administrative and other services, including the Manager’s role in coordinating the activities of the Trust’s other service providers, also were considered. The Board concluded that, overall, they were satisfied with the nature, extent and quality of services provided (and expected to be provided) to the Trust and to each of the Funds under the Management Agreement.
(2) The investment performance of the Funds and the Manager. In connection with every in-person quarterly Board meeting and the fall 2017 contract review process, Trustees received extensive information on the performance results of each Fund. This included, for example, performance information on absolute total return, performance versus the appropriate benchmark(s), the contribution to performance of the Manager’s asset class allocation decisions and volatility management strategies, the performance of the underlying funds, and the impact on performance of rebalancing decisions, cash and Fund fees. This included Lipper performance information on the Funds for the previous quarter, year-to-date, and previous one-, three- and five-year periods, to the extent the Funds were in existence for such periods. (For Funds which have been in existence for less than five years, the Board received performance information on shorter time periods to the extent available.) For example, in connection with the Board meeting held October 23, 2017, the Manager reported that for the five Funds for which performance information for the five year period ended June 30, 2017 was available, two were in the top 40%, two were in the middle 20%, and one was in the bottom 40%. None of these Funds was in the bottom 40% for the three- or one-year periods. The Manager reported that for the three-year period ended June 30, 2017, for the six Funds for which three year performance information was available, four Funds were in the top 40% and two Funds were in the middle 20%. For the eight Funds for which one-year performance information was available, for the one-year period ended June 30, 2017, four Funds were in the top 40%, two Funds were in the middle 20%, and two Funds were in the bottom 40%.
At the Board meeting held October 23, 2017, the Manager also reported upon the performance of the MVP Funds compared to custom managed-volatility peer groups. For the seven Funds for which three-year performance information was available, for the three-year period ended June 30, 2017, five Funds were in the top 40%, one Fund was in the middle 20%, and one was in the bottom 40%. For the eight Funds for which one year performance was available, for the one-year period ended June 30, 2017, four Funds were in the top 40% and four Funds were in the middle 20%. All six Funds for which five-year performance information was available were in the top 40%.
At the Board meeting held October 23, 2017, the Trustees determined that the investment performance of the Funds was acceptable.
(3) The costs of services to be provided and profits to be realized by the Manager and its affiliates from the relationship with the Funds. The Board considered that the Manager receives an advisory fee from each of the Funds. The Manager reported that for the three MVP Fusion Dynamic Funds the advisory fee paid put these Funds in the 44th percentile of the customized peer group. The Manager reported that for three MVP Index Strategy Funds the advisory fee paid put them in the 27th percentile of the customized peer group, and for the two non-MVP Index Strategy Funds, as well as the AZL DFA Multi-Strategy Fund, the advisory fee paid put them in the 13th percentile of the customized peer group. The Manager reported that for the AZL MVP BlackRock Global Strategy Plus, AZL MVP DFA Multi-Strategy, AZL MVP Pyramis Multi-Strategy, and AZL MVP T. Rowe Price Capital Appreciation Plus Funds, the advisory fee paid was in the 9th percentile. (A lower percentile reflects lower fund fees and is better for fund shareholders.) Trustees were provided with information on the total expense ratios of the Funds and other funds in the customized peer groups, and the Manager reported upon the challenges in making peer group comparisons for the Funds.
The Manager provided information concerning the profitability of the Manager’s investment advisory activities for the period from 2014 through June 30, 2017. The Board recognized that it is difficult to make comparisons of profitability from investment company advisory agreements because comparative information is not generally publicly available and is affected by numerous factors, including the structure of the particular adviser, the types of funds it manages, its business mix, numerous assumptions regarding allocation of expenses and the adviser’s capital structure and cost of capital. In considering profitability information, the Board considered the possible effect of certain fall-out benefits to the Manager and its affiliates. The Board focused on profitability of the Manager’s relationships with the Funds before taxes and distribution expenses. The Board recognized that the Manager should earn a reasonable level of profits for the services it provides to each Fund.
The Board also considered that Wilshire Funds Management (“Wilshire”) serves as a consultant to the Manager in preparing statistical and other factual information for use in the creation and maintenance of the asset allocation models for the Fusion Funds (the AZL MVP Fusion Dynamic Conservative, Balanced, and Moderate Funds), pursuant to an agreement between the Manager and Wilshire. Wilshire serves as a consultant to the Manager with respect to selecting the Fusion Funds’ underlying funds and the asset allocations among the underlying funds. The Manager, not any Fund, pays a consultant fee to Wilshire.
Based upon the information provided, the Board concluded that the Funds’ advisory fees and expense ratios are not unreasonable, and determined that there was no evidence that the Manager’s level of profitability from its relationship with the Funds was excessive.
(4) and (5) The extent to which economies of scale would be realized as the Funds grow, and whether fee levels reflect these economies of scale. The Board noted that the advisory fee schedules for the Funds do not contain breakpoints that reduce the fee rate on assets above specified levels. The Board recognized that breakpoints may be an appropriate way for the Manager to share its economies of scale, if any, with Funds that have substantial assets. The Board found there was no uniform methodology for establishing breakpoints that give effect to Fund-specific services provided by the Manager. The Board noted that in the fund industry as a whole, as well as among funds similar to the Funds, there is no uniformity or pattern in the fees and asset levels at which breakpoints (if any) apply. Depending on the age, size, and other characteristics of a particular fund and its manager’s cost structure, different conclusions can be drawn as to whether there are economies of scale to be realized at any particular level of assets, notwithstanding the intuitive conclusion that such economies exist, or will be realized at some level of total assets. Moreover, because different managers have different cost structures and service models, it is difficult to draw meaningful conclusions from the breakpoints that may have been adopted by other funds. The Board also noted that the advisory agreements for many funds do not have breakpoints at all, or if breakpoints exist, they may be at asset levels significantly greater than those of the individual Funds. The Board also noted that the total assets in all of the Funds, as of June 30, 2017, were approximately $10.8 billion and that the largest Fund, the AZL MVP Growth Index Strategy Fund, had assets of approximately $2.4 billion.
The Board noted that the Manager has agreed to temporarily limit Fund expenses under the Expense Limitation Agreement, which has the effect of reducing expenses as would the implementation of advisory fee breakpoints. The Manager has committed to continue to consider the continuation of expense limits and/or advisory fee breakpoints as the Funds grow larger. The Board receives quarterly reports on the level of Fund assets. The Board expects to continue to consider: (a) the extent to which economies of scale have been realized, and (b) whether the advisory fee should be modified, either in connection with the next renewal of the Agreements or by modifying the Expense Limitation Agreement, to reflect such economies of scale, if any.
Having taken these factors into account, the Board concluded that the absence of breakpoints in the Funds’ advisory fee rate schedules was acceptable under each Fund’s circumstances.
17
Information about the Board of Trustees and Officers (Unaudited)
The Trust is managed by the Trustees in accordance with the laws of the state of Delaware governing business trusts. There are currently eight Trustees, one of whom is an “interested person” of the Trust within the meaning of that term under the 1940 Act. The Trustees and Officers of the Trust, and their addresses, ages, positions held with the Trust, terms of office with the Trust and length of time served, principal occupation(s) during the past five years, the number of portfolios in the Trust they oversee, and other directorships held during the past five years are as follows:
Non-Interested Trustees(1)
| Name, Address, and Year of Birth | Positions Held with Allianz VIP and VIP FOF Trust | Term of Office(2)/Length of Time Served | Principal Occupation(s) During Past 5 Years | Number of Portfolios Overseen for Allianz VIP and VIP FOF Trust | Other AZL Fund Complex | |||||
| Peter R. Burnim (1947) 5701 Golden Hills Drive Minneapolis, MN 55416 | Trustee | Since 2/07 | Consultant/Chair, various companies: Chairman, Emrys Analytics and subsidiaries, July 2015 to present; Chairman, Argus Investment Strategies Fund Ltd., February 2013 to 2017; Managing Director, iQ Venture Advisors, LLC, 2005 to present; Chairman, Northstar Group Holdings Ltd. Bermuda, 2011 to present; Chairman Sterling Bank & Trust (Bahamas) Ltd., 2016 to present, and Expert Witness, Massachusetts Department of Revenue, 2011 to 2016. | 35 | Argus Group Holdings and Subsidiaries; Northstar Group Holdings; Sterling Trust (Cayman) Ltd.; Sterling Bank & Trust Limited (Bahamas); Emrys Analytics; EGB Insurance. | |||||
| Peggy L. Ettestad (1957) 5701 Golden Hills Drive Minneapolis, MN 55416 | Lead Independent Trustee | Since 10/14 (Trustee since 2/07) | Managing Director, Red Canoe Management Consulting LLC, 2008 to present | 35 | Luther College | |||||
| Tamara Lynn Fagely (1958) 5701 Golden Hills Drive Minneapolis, MN 55416 | Trustee | Since 12/17 | Retired; Chief Operations Officer, Hartford Funds, March 2012 to December 2013 | 35 | Diamond Hill Funds (13 funds) | |||||
| Richard H. Forde (1953) 5701 Golden Hills Drive Minneapolis, MN 55416 | Trustee | Since 12/17 | Member of the Board and Chairman of the Finance and Investment Committee, Connecticut Water Service, Inc., October 2013 to present; Senior Vice President and Chief Investment Officer, CIGNA, 2004 to 2012 | 35 | Connecticut Water Service, Inc. | |||||
| Claire R. Leonardi (1955) 5701 Golden Hills Drive Minneapolis, MN 55416 | Trustee | Since 2/04 | Chief Executive Officer, Health eSense Inc., 2015 to Present; CEO, Connecticut Innovations, Inc., 2012 to 2015; General Partner, Fairview Capital, L.P., 1994 to 2012 | 35 | reSet Social Enterprise Investment Fund | |||||
| Dickson W. Lewis (1948) 5701 Golden Hills Drive Minneapolis, MN 55416 | Trustee | Since 2/04 | Retired; Vice President/General Manager, Yearbooks & Canada-Lifetouch National School Studios, 2006 to 2014; Vice President/General Manager of Jostens, Inc., 2002 to 2006; Senior Vice President of Fortis Group, 1997 to 2002 | 35 | None | |||||
| Arthur C. Reeds, III (1944) 5701 Golden Hills Drive Minneapolis, MN 55416 | Trustee | Since 10/99 | Retired; Senior Investment Officer, Hartford Foundation for Public Giving, 2000 to 2003; Chairman, Chief Executive and President of Conning Corp., 1999 to 2000 | 35 | Connecticut Water Service, Inc. |
Interested Trustees(3)
| Name, Address, and Year of Birth | Positions Held with Allianz VIP and VIP FOF Trust | Term of Office(2)/Length of Time Served | Principal Occupation(s) During Past 5 Years | Number of Portfolios Overseen for Allianz VIP and VIP FOF Trust | Other AZL Fund Complex | |||||
Brian Muench (1970) 5701 Golden Hills Drive | Trustee | Since 6/11 | President, Allianz Investment Management LLC, November 2010 to present; Vice President, Allianz Life, April 2011 to present | 35 | None |
18
Officers
| Name, Address, and Age | Positions Held with Allianz VIP and VIP FOF Trust | Term of Office(2)/Length of Time Served | Principal Occupation(s) During Past 5 Years | |||
Brian Muench (1970) 5701 Golden Hills Drive | President | Since 11/10 | President, Allianz Investment Management LLC, November 2010 to present; Vice President, Allianz Life, April 2011 to present. | |||
| Michael Radmer (1945) Dorsey & Whitney LLP, Suite 1500 50 South Sixth Street Minneapolis, MN 55402-1498 | Secretary | Since 02/02 | Senior Counsel (previously, Partner), Dorsey and Whitney LLP since 1976. | |||
| Bashir C. Asad (1963) Citi Fund Services Ohio, Inc. 4400 Easton Commons, Suite 200 Columbus, OH 43219 | Treasurer, Principal Accounting Officer and Principal Financial Officer | Since 06/16 | Senior Vice President, Citi Fund Services Ohio, Inc. | |||
| Chris R. Pheiffer (1968) 5701 Golden Hills Drive Minneapolis, MN 55416 | Chief Compliance Officer(4) and Anti-MoneyLaundering Compliance Officer | Since 02/14 | Chief Compliance Officer of the VIP Trust and the FOF Trust, February 2014 to present; Deputy Chief Compliance Officer of the VIP Trust and the FOF Trust and Compliance Director, Allianz Life, February 2007 to February 2014. |
| (1) | Member of the Audit Committee. |
| (2) | Indefinite. |
| (3) | Is an “interested person”, as defined by the 1940 Act, due to employment by Allianz. |
| (4) | The Manager and the Trust are parties to a Chief Compliance Officer Agreement under which the Manager is compensated by the Trust for providing an employee of the Manager or one of its affiliates to act as the Trust’s Chief Compliance Officer. The Chief Compliance Officer and Anti-Money Laundering Compliance Officer is not considered a corporate officer or executive employee of the Trust. |
19
The Allianz VIP Funds are distributed by Allianz Life Financial Services, LLC. These Funds are not FDIC Insured. | ANNRPT1217 2/18 |
| Item 2. | Code of Ethics. |
| (a) | The registrant has adopted a code of ethics that applies to the registrant’s principal executive officer, principal financial officer, principal accounting officer or controller, or persons performing similar functions. This code of ethics is included as an Exhibit. |
| (b) | During the period covered by the report, with respect to the registrant’s code of ethics that applies to its principal executive officer, principal financial officer, principal accounting officer or controller, or persons performing similar functions; there have been no amendments to, nor any waivers granted from, a provision that relates to any element of the code of ethics definition enumerated in paragraph (b) of this Item 2. |
| Item 3. | Audit Committee Financial Expert. |
| (a)(1) | The registrant’s board of directors has determined that the registrant has at least one audit committee financial expert serving on its audit committee. |
| (a)(2) | The audit committee financial expert is Arthur C. Reeds III, who is “independent” for purposes of this Item 3 of Form N-CSR. |
| Item 4. | Principal Accountant Fees and Services. |
| 2017 | 2016 | |||||||||
| (a) | Audit Fees | $ | 162,600 | $ | 161,000 | |||||
| (b) | Audit-Related Fees | $ | 6,000 | $ | 10,000 | |||||
| 2017 | 2016 | |||||||||
| (c) | Tax Fees | $ | 39,240 | $ | 46,900 | |||||
| 2017 | 2016 | |||||||||
| (d) | All Other Fees | $ | 0 | $ | 0 | |||||
| 4(e)(1) | The Audit Committee (“Committee”) of the Registrant is responsible for pre-approving all audit and non-audit services performed by the independent auditor in order to assure that the provision of such services does not impair the auditor’s independence. Before the Registrant engages the independent auditor to render a service, the engagement must be either specifically approved by the Committee or entered into pursuant to the pre-approval policy. The Committee may delegate preapproval authority to one or more of its members. The member or members to whom such authority is delegated shall report any pre-approval decisions to the Committee at its next scheduled meeting. The Committee may not delegate to management the Committee’s responsibilities to pre-approve services performed by the independent auditor. The Committee has delegated pre-approval authority to its Chairman for any services not exceeding $10,000. |
| 4(e)(2) | During the previous two fiscal years, the Registrant did not receive any non-audit services pursuant to a waiver from the audit committee approval or pre-approval requirement under paragraph (c)(7)(i)(C) of Rule 2-01 of Regulation S-X. |
| 4(f) | Not applicable |
| 4(g) |
| 2017 | 2016 | |||||||
| $ | 45,240 | $ | 56,900 | |||||
| 4(h) | Not applicable |
| Item 5. | Audit Committee of Listed Registrants. |
| Not applicable. |
| Item 6. | Investments. |
| (a) | The Schedule of Investments as of the close of the reporting period are included as part of the report to shareholders filed under Item 1 of the Form N-CSR. |
| (b) | Not applicable. |
| Item 7. | Disclosure of Proxy Voting Policies and Procedures for Closed-End Management Investment Companies. |
Not applicable.
| Item 8. | Portfolio Managers of Closed-End Management Investment Companies. |
Not applicable.
| Item 9. | Purchases of Equity Securities by Closed-End Management Investment Company and Affiliated Purchasers. |
Not applicable.
| Item 10. | Submission of Matters to a Vote of Security Holders. |
Not applicable.
| Item 11. | Controls and Procedures. |
| (a) | The registrant’s principal executive officer and principal financial officer have concluded, based on their evaluation of the registrant’s disclosure controls and procedures as conducted within 90 days of the filing date of this report, that these disclosure controls and procedures are adequately designed and are operating effectively to ensure that information required to be disclosed by the registrant on Form N-CSR is recorded, processed, summarized and reported within the time periods specified in the Securities and Exchange Commission’s rules and forms. |
| (b) | There were no changes in the registrant’s internal control over financial reporting (as defined in Rule 30a-3(d) under the Act (17 CFR 270.30a-3(d)) that occurred during the period covered by this report that have materially affected or are reasonably likely to materially affect, the registrant’s internal control over financial reporting. |
| Item 12. | Disclosure of Securities Lending Activities for Closed-End Management Investment Companies. |
| (a)(1) | Not applicable. |
| (a)(2) | Not applicable. |
| (a)(3) | Not applicable. |
| (a)(4) | Not applicable. |
| (b) | Not applicable |
| Item 13. | Exhibits. |
| (a)(1) | The code of ethics that is the subject of the disclosure required by Item 2 is attached hereto. |
| (a)(2) | Certifications pursuant to Rule 30a-2(a) are attached hereto. |
| (a)(3) | Not applicable. |
| (a)(4) | Not applicable. |
| (b) | Certifications pursuant to Rule 30a-2(b) are furnished herewith. |
SIGNATURES
Pursuant to the requirements of the Securities Exchange Act of 1934 and the Investment Company Act of 1940, the registrant has duly caused this report to be signed on its behalf by the undersigned, thereunto duly authorized.
(Registrant) Allianz Variable Insurance Products Fund of Funds Trust
| By (Signature and Title) | /s/ Brian Muench | |
| Brian Muench, Principal Executive Officer |
Date February 23, 2018
Pursuant to the requirements of the Securities Exchange Act of 1934 and the Investment Company Act of 1940, this report has been signed below by the following persons on behalf of the registrant and in the capacities and on the dates indicated.
| By (Signature and Title) | /s/ Brian Muench | |
| Brian Muench, Principal Executive Officer |
Date February 23, 2018
| By (Signature and Title) | /s/ Bashir C. Asad | |
| Bashir C. Asad, Principal Financial Officer & Principal Accounting Officer |
Date February 23, 2018